
Validation of Clinical Trial–Related Systems in Smaller Enterprises ...
80
The Official Magazine of ISPE September-October 2020 | Volume 40, Number 5 Validation of Clinical Trial–Related Systems in Smaller Enterprises Quality and Regulatory Solutions for PAT in Continuous Manufacturing SPECIAL SECTION: 2020 ISPE Annual Meeting & Expo ispe.org/pharmaceutical-engineering The Transition to Digitalization
-
Upload
khangminh22 -
Category
Documents
-
view
1 -
download
0
Transcript of Validation of Clinical Trial–Related Systems in Smaller Enterprises ...

The O� cial Magazine of ISPESeptember-October 2020 | Volume 40, Number 5
Validation of Clinical Trial–Related Systems in Smaller Enterprises
Quality and Regulatory Solutions for PAT in Continuous Manufacturing
SPECIAL SECTION: 2020 ISPE Annual Meeting & Expo ispe.org/pharmaceutical-engineering
The Transition to Digitalization

CRB Services Ad (8.125x10.75).indd 1CRB Services Ad (8.125x10.75).indd 1 1/22/2020 2:50:11 PM1/22/2020 2:50:11 PM
© 2020 Fluor Corporation. All rights reserved. Fluor is a registered service mark of Fluor Corporation.
ADGV193520C
www.fluor.com
FLUOR DESIGNS.
Delivering certainty to function, cost, and schedule. EPIC3 reimagines front-end design, through engineering, planning, innovation, and certainty.
By including a diverse network of skilled staff from a broad range of cultural backgrounds and experiences, our Advanced Technologies & Life Sciences business line continues to help our clients build a better world during the COVID-19 pandemic. Utilizing our reimagined design process – EPIC3 – to bring certainty to function, cost, and schedule, our clients are able to deliver life-saving products to patients around the world with predictable results.

CRB Services Ad (8.125x10.75).indd 1CRB Services Ad (8.125x10.75).indd 1 1/22/2020 2:50:11 PM1/22/2020 2:50:11 PM

2 P h a r m a c e u t i c a l E n g i n e e r i n g
ON THE COVER An artist’s rendering illustrates the complexities and possibilities inherent in the pharmaceutical industry’s transition to digitalization.
14TECHNOLOGY TRENDS: THE TRANSITION TO DIGITALIZATIONIn the pharmaceutical industry, digitalization involves developing and implementing digital technologies at all levels of pharmaceutical operations. The aim is to transform the industry by capturing, analyzing, and using vast amounts of data collected from a wide range of sources to support research and development, clinical development, drug manufacturing, supply chain management, patient engagement, quality assurance and quality control, product safety monitoring, and other objectives.
Despite the transformational potential of digitalization, the pharma industry has historically been slower than other sectors to adopt digital tools, such as cloud storage, arti� cial intelligence, machine learning, blockchain, and remote communication technologies, and make associated changes in workplace culture and strategic priorities. Now, however, the COVID-19 pandemic may be accelerating the pace of change.
September / October 2020
FEATURES
20 Validation of Clinical Trial–Related Systems in Smaller Enterprises Existing risk-based approaches to computerized system compliance and validation as outlined in GAMP® 5 are applicable to a variety of life sciences organizations supporting or performing GxP-relevant activities. However, specifi c guidance on how to implement all the necessary measures and what to prioritize in small- and medium-sized enterprises is scarce.
32 ISPE France A� liate: Long–Time A� liate Continues to ShineThe ISPE France Affi liate is fortunate in many ways. The pharmaceutical industry in France is world class, employing close to 100,000 people and generating €55.9 billion in annual revenue. The Affi liate’s membership runs the gamut from students and Young Professionals to industry veterans with expertise in research and development, engineering, manufacturing, and regulatory guidelines.
CORRECTION: In the July-August Pharmaceutical Engineering article “Case Study: FacilitatingEffi cient Life-Cycle Management Via ICH Q12,” information was incorrectly stated on page 51 in Table 1. Under the European Union fi ling category, the fi rst piece of information for “critical” should be Type II, not Type I.

We help our clients solve their most important challenges - from designing a facility to manufacture transformative therapies to accelerating the delivery of life-saving products. We give the best minds of today the platform to create the cures of tomorrow.
The Biggest QuestionsSpark Our Curious Minds.
Contact us to build a better tomorrow.www.jacobs.com
We dream big. We deliver with excellence.And we always find a way, however ‘impossible’ the challenge.

SPECIAL SECTION: 2020 ISPE ANNUAL MEETING & EXPO
DEPARTMENTS
6 MESSAGE FROM THE CHAIRPandemic Problem or Solution Opportunity?
10 WOMEN IN PHARMA® EDITORIAL
Pandemic Coping Strategies
12 YP EDITORIAL Times Are Changing
PEOPLE + EVENTS48 ISPE Briefs 48 INTRODUCING THE ISPE EURASIAN
ECONOMIC UNION AFFILIATE 49 MEET THE ISPE STAFF
50 New ISPE Good PracticeGuide on Critical Utilities
75 AD INDEX AND CLASSIFIED ADS
76 END NOTEWhat Were You Reading 10 Years Ago in Pharmaceutical Engineering®?
September / October 2020
4 P h a r m a c e u t i c a l E n g i n e e r i n g
Senior Director, Editorial: Susan Sandler, [email protected]
ISPE Headquarters 6110 Executive Blvd., Suite 600North Bethesda, MD 20852 USTel: +1 301-364-9201Fax: +1 240-204-6024
ISPE Operations600 N. Westshore Blvd., Suite 900 Tampa, FL 33609 USTel: +1 813-960-2105Fax: +1 813-264-2816
ISSN 0273-8139
Pharmaceutical Engineering is published six times a year by ISPE and is online at ISPE.org/Pharmaceutical-Engineering
Advertising and SalesBrad Ettinger, VP Marketing Communications & Business Development [email protected]
Alisa Pachella, Sales Account Manager+1 813-739-2274 [email protected]
Doug Whittemore, Sales Account Manager+1 813-739-2300 [email protected]
Stock Photography and Illustration iStockArt Direction and Graphic DesignTHOR Design, Inc., www.thor.designPrintingRoyle PrintingLetters to the EditorLetters must include the writer’s full name, address, and organization. Letters may be edited for length and clarity. Send correspondence to [email protected] of LiabilityIn no event shall ISPE or any of its affi liates, or the offi cers, directors, employees, members, or agents of each of them, or the authors, be liable for any damages of any kind, including without limitation any special, incidental, indirect, or consequential damages, whether or not advised of the possibility of such damages, and on any theory of liability whatsoever, arising out of or in connection with the use of this information.
© 2020 ISPE. All rights reserved. No part of this publication may be reproduced or copied in any form or by any means—graphic, electronic, or mechanical, including photocopying, taping, or information storage and retrieval systems—without written permission of ISPE.
Opinions expressed in Pharmaceutical Engineering do not necessarily refl ect the views of ISPE.
Article reprints can be ordered through Sheridan Content Solutions at [email protected].
US PostmasterSend change of address to:Pharmaceutical Engineering Magazine600 N. Westshore Blvd., Suite 900Tampa, FL 33609 US
Periodicals postage paid at North Bethesda, Maryland, US, and additional post o� ces
Canada PostmasterSend change of address and undeliverable copies to:Pharmaceutical Engineering MagazinePO Box 122Niagara Falls, ON L2E 6S8 Canada
Canada Post mail agreement #40012899
Volume 40, Number 5Published since 1980
52 CONTINUOUS MANUFACTURINGQuality and Regulatory Solutions for PAT in Continuous ManufacturingThis article discusses quality and regulatory hurdles in the life cycle of a process analytical technology application—including model life-cycle management—in combination with continuous manufacturing for small and large molecules, with the goal of proposing strategies to resolve each challenge.
62 PROCESS TECHNOLOGY Using CFD Multiphase Modeling to Predict Bioreactor PerformanceComputational fl uid dynamics (CFD) can reduce or eliminate the need to perform bioreactor scale-up studies because full-scale manufacturing bioreactors can be simulated to predict performance. This article discusses the use of computational fl uid dynamics to predict the performance of a manufacturing-scale bioreactor under various operating conditions.
69 STERILIZATION EQUIPMENT Self-Calibrating Thermometers for Use in Medical Autoclaves This article describes a case study using a self-calibrating sensor that automatically verifi es its accuracy during each sterilization batch in a steam sterilizer and presents corresponding risk and benefi t considerations for possible routine use of this type of sensor in pharmaceutical applications.
TECHNICAL
36 2020 ISPE Annual Meeting & Expo: Driving the Future of Pharma The 2020 ISPE Annual Meeting & Expo will be ISPE’s fi rst completely virtual Annual Meeting. As always, there will be
great learning and networking opportunities—in fact, the digital format o� ers greater fl exibility for attendees. The 2020 ISPE Annual Meeting & Expo will focus on steering the future of pharmaceutical science and manufacturing toward a more global, synchronized, and quality-driven industry. This signature event draws pharmaceutical and biopharmaceutical professionals at all levels of the industry, from Young Professionals to the most senior executives in drug manufacturing, supply chain, devices and equipment and services, and global regulatory agencies.
40 FOYA Category Winners and Honorable Mentions for 2020: Examples of Excellence
Each year, ISPE celebrates innovations and advances in pharmaceutical manufacturing technology with its Facility of the Year Awards (FOYA) program. This year, we added a new category, Social Impact, to recognize companies that developed new standards and practices to prevent drug shortages and increase patients’ access to medicine, designed new tools or techniques that reduced the cost of drug products, or accelerated a shift to sustainable facility design that has signifi cantly reduced environmental impact.

The Spirax Sarco BT6-B is a high specifi cation sanitary balanced pressure thermostatic steam trap that minimises contamination when steam is in direct contact with pharmaceutical product. Its unique design with certifi cations and approvals, ensures the BT6-B is economical and exceeds the capabilities of other models currently available on the market.
The only one in the market fully certifi ed
Contact your local Spirax Sarco representative to learn more about the BT6-B.
The Spirax Sarco BT6-B is a high specifi cation sanitary balanced pressure thermostatic steam trap that minimises contamination when steam is in direct contact with pharmaceutical product. Its unique design
Pharmaceutical steam trap from Spirax SarcoFDA compliant, fully certifi ed
• ‘Gold Standard’ EN10204 3.1 Certifi cation, across all wetted parts.
• FDA and USP compliant.
• Full material traceability 3.1, including all wetted parts.
• Surface fi nish certifi cate available.
• Assembled and packed in ISO Class 7 clean room.

6 P h a r m a c e u t i c a l E n g i n e e r i n g
PHARMACEUTICAL ENGINEERING COMMITTEE Chair: Dr. Ferdinando Aspesi, Bridge Associates InternationalPeter Werner Christensen, DrizzleNissan Cohen, Biopharmaceutical Water DocRobert Dream, HDR Company, LLCMichelle Gonzalez, Biopharm Consulting Matthew Gorton, AST, LLCWendy Haines, PharmEng TechnologyTse Siang Kang, Pfi zerWillem Kools, MilliporeSigmaAnthony Margetts, PhD, Factorytalk Co. Ltd.Tom McDermott, CAIMaurice Parlane, New Wayz ConsultingPietro Perrone, Cytiva, formerly GE Healthcare Life ScienceChris Smalley, ValSource, Inc.Charles Tong, Suzhou Ribo Life Science Co. Ltd.Anders Vidstrup, NNIT A/SSteven Wisniewski, CAIChristian Wölbeling, Werum IT SolutionsJörg Zimmermann, Vetter Pharma Fertigung GmbH
PHARMACEUTICAL ENGINEERING REVIEWERSChristopher Ames, Sanofi /Akebia TherapeuticsJoanne R. Barrick, Eli Lilly and Company Brian Beck, Zoetis, Inc.Malik Belattar, Pharma Biot’ExpertTheodore Bradley, Pfi zer, Inc.Rory Budihandojo, Boehringer IngelheimMagali Busquet, Sanofi Jose A. Caraballo, Bayer HealthcareChris Clark, Ten Ten ConsultingJohn T. ConnorMel Crichton Nick Davies, Verta Life SciencesRobert Del CielloMartin A. Dueblin, 11 Eleven GmbHPaul S. Egee, IMA North AmericaSteven Ensign, Eli Lilly and CompanyMichael Faia, Jazz Pharmaceuticals, Inc.Petter Gallon, Gallon Partners ABAndrew Gee, Boehringer IngelhemCharles Gentile, Sanofi Norman A. Goldschmidt, Genesis Engineers, Inc.Adam S. Goldstein, Genentech, Inc.Sean Goudy, Regeneron PharmaceuticalsJohn T. Hannon, CPIP, CAINicholas R. Haycocks, AmgenZuwei Jin, PhD, Emerson Process ManagementNigel D. Lenegan, Energy & Carbon Reduction Solutions Ltd.John V. Lepore, PhD, Merck & Co., Inc.Sarah E. Mancini, Zoetis, Inc.Joseph J. Manfredi, GMP Systems, Inc.Peter J. Marshall, AstraZenecaJames W. McGlade, Longfellow Real Estate Partners, LLCDonald Moore, DRMoore Consulting, LLC Lars Olsen, Sigma Quality & Compliance ApS Marianne P. Oth, Eli Lilly and CompanyAndre J. Petric, Kraemer US LLCBrian Pochini, Sanofi James T. RobinsonGregory M. Ruklic Judith SamardelisTerry Seanard, New England Controls, Inc.Stephen J. Sirabian, Glatt Air Techniques, Inc.Alan M. Solomon, Baxter Healthcare Corp.Oliver Stauff er, PTI USADavid Stokes, Convalido Consulting Ltd.Robert Sussman, PhD, SafeBridge Consultants, Inc.Andrzej J. Szarmanski, GMDP ServicesZam Shabeer Thahir, Thermo Fisher Scientifi cMatthew VonEsch, United Therapeutics Jenn Walsh, Maia PharmaceuticalsTerrence Walsh, TransCelerate BioPharma, Inc.Bruce R. Williams, Williams Process Ltd.Siôn Wyn, Conformity, Ltd.Zen-Zen Yen, Bayer
PE VOICEMESSAGE FROM THE CHAIR By Frances M. Zipp
Frances M. Zipp
Pandemic Problem or Solution Opportunity?How many times have you heard phrases like these over the last several months:
unprecedented marketplace disruptions, staggering economic conditions, or maybe insurmountable business challenges? If you’re like me, probably more than you can count.
Their endless repetition can be depressing and disheartening. But despite all the current harbingers of doom, there are agile, visionary, forward-leaning compa-nies that not only survive and thrive under these conditions, they see them as opportunities to create and innovate while helping society. Solving the problems
currently at hand and a� ecting positive change within their respective organizations and across our industry are motivational forces to them, not obstacles.
As part of my industry-related role at Lachman Consultants, I am part of a team that tracks trends and closely monitors shifts in the economic and regulatory landscape to provide real-time guidance and insights to clients across the various sectors of the life sciences. Today, I am spotlighting the medical device industry and share some exam-ples with you. And, by the way, a nod of appreciation to Ricki Chase, a senior member of our team and former FDA Medical Device Specialist and Director of Investigations, for her greatly appreciated contributions to this month’s column; we all support ISPE as we support our industry.
NEW TECHNOLOGIESHere are highlights of some of the newest, most exciting technologies on the forefront of modern therapies that are actively seeking to keep pace with the rapidly changing ecosystem.
In Vitro Diagnostics (IVD). The COVID-19 emergency has driven fast develop-ment of new IVD for the diagnosis of COVID-19 as well as IVD to detect the presence of antibodies. The development of IVDs has been growing in recent years and the FDA Center for Devices and Radiological Health has released guidance on the new expecta-tions for dual 510(k)/Clinical Laboratory Improvement Amendments (CLIA) clearance [1]. Currently, some of the most exciting growth is being seen in the form of total genome sequencing technologies that strive to quickly sequence the total genome within hours as opposed to days, identifying any mutations or nuances not known by a genus-species identification made through standard diagnostic procedures. This allows healthcare providers to almost immediately choose the most e� ective therapies available and more rapidly defeat the infection.
Clustered Regularly Interspaced Short Palindromic Repeats (CRISPR). This technology seeks to cut or remove the defective or mutated genomic sequence associat-ed with certain disease states from the patient’s cells to defeat the disorder. CRISPR technology is being developed for use as a diagnostic tool, where CRISPR proteins can be used to hunt matching sequences of diseased cell DNA/RNA sequences and provide a signal for detection. This presents a potentially powerful tool to aid in very speci� c disease diagnosis.
Arti� cial Intelligence. We have also noted a recent increase in the growth and development of Arti� cal Intelligence (AI). The most promising and closest to approval use of AI is in diagnostics and its role in detecting diseased tissue early, before symp-toms manifest or disease spreads. In this regard, AI is the device. It is Software as a

bwt-pharma.com
OSMOTRON WFI and LOOPO WFI are the ultimative combination for the alternative mem-brane-based processes alongside distillation for generating Water for Injection from drin-king water, storing and distributing it – all according to Ph. Eur. 0169 and USP <1231>. BWT‘s unique triple membrane barrier technology in the OSMOTRON WFI ensures best quality and effi ciency in production. Extensively tested with an independent university of applied sciences. The LOOPO WFI continuously ozonates your storage tank and monitors the WFI quality. Sanitization options include comfortable ozonization of the complete storage and distribution system or hot water sanitization. Maximum reliability and security.
BW T L O O P O W F I
Pretty cool Water for InjectionM E M B R A N E - B A S E D G E N E R AT I O N , A M B I E N T S T O R A G E , D I S T R I B U T I O N , A N D M O N I T O R I N G O F W F I .
BW T O S M O T R O N W F I
2006_Pharmaceutical_Engineering_cm (002).indd 1 17.07.2020 15:17:31

8 P h a r m a c e u t i c a l E n g i n e e r i n g
PE VOICEMESSAGE FROM THE CHAIR
SAVE THE DATE
Learn more about• Pharma 4.0 Vision: Imagine how Pharma 4.0 could look like, enabling
visionary prototypes, and how a fully digital holistic control strategy could look like.
• Pharma 4.0 Case Studies: The tangible value of applying Pharma 4.0 enabling technologies in term of; strategic fit, ROI, impact on quality, and ultimately for the benefit of the patients.
• Pharma 4.0 and Regulations: How Pharma 4.0. operating model supports regulations.
2020 ISPE
Europe Pharma 4.0TM
Virtual Conference17–18 November
Register Today at ISPE.org/Pharma40
Medical Device (SaMD) and serves to analyze images produced by mammography to assist in early detection of breast cancer. Specif-ically, the software can learn to recognize previously undetectable patterns and nuances in the diagnostic image, allowing opportu-nities for greater accuracy in the diagnosis.
3D Printing. Also pushing the envelope is production of 3D-printed whole organs for transplant using compatible tissues and ensuring vascular structures are in place to support blood � ow and viability upon transplantation. Microrobots are being de-signed to target cell specific delivery of chemotherapies to dis-eased cells using natural magnetic � elds along the body’s blood vessels. Fully dissolvable devices, such as wireless brain sensors, are now possible, allowing physicians to see inside the patient’s brain and understand the disease state without having to perform additional surgeries for retrieval.
Bionic Eye. Amazingly, ophthalmic devices are being designed to create an eye to restore not just vision, but vision with a wider range of wavelength detection than the “natural” human eye, using nanowires that mimic the function of the retina.
With these examples, I am sure you know that we are just scratching the surface, metaphorically speaking, of the amazing
advancements that are here today or just over the horizon. From my perspective, there appears to be no limit to the rapid development of these and many other pioneering technologies. Opportunities and challenges abound. For the biopharmaceutical industry, the new device technologies present even more prospects for combination products, such as AI-integrated inhalers that help teach patients to e� ectively administer a historically di� cult to use treatment.
This is truly an exciting time to be part of the life sciences industry bringing creative new solutions to some of the world’s greatest medical challenges. I encourage you to remain strong. To be positive and optimistic. And most of all, look for solution oppor-tunities whenever and wherever you can.
Reference1. US FDA. Recommendations for Dual 510(k) and CLIA Waiver by Application Studies. February
2020. https://www.fda.gov/regulatory-information/search-fda-guidance-documents/recommendations-dual-510k-and-clia-waiver-application-studies
Frances M. Zipp is the 2020 ISPE International Board of Directors Chair and President and CEO of Lachman Consultant Services, Inc.

[email protected] www.valsteam.com +351 236 959 060
Zona Ind. da Guia, Pav. 14 - Brejo 3105-467PRODUCTS MANUFACTURED IN PORTUGAL
Guia PBL PORTUGAL
HIGH PURITY. HIGH DEMANDS.
High purity equipment for clean steam
AV 001 AP E 01.20
Special equipment
Pipeline ancillaries
Control valves
Pressure regulators
Steam trapsSafety valves

10 P h a r m a c e u t i c a l E n g i n e e r i n g
Women in Pharma® Editorial By Vivianne Arencibia
PANDEMIC COPING STRATEGIES
I challenge you to do one thing for you today that does not involve work, your phone, or your computer.
Because of the global pandemic, we have experienced unexpected joys, learned new skills, adjusted to long days of video conferencing, and dealt with drops in income and potential job losses. At the same time, we have also experienced an increased sense of urgency, collaboration, and pride because we are a part of the industry that has been tapped to heal all our nations from this unexpected virus.
I f you are like me, you are not getting a break from the in� ux of work meetings, family stressors, feelings of isolation, and the media outlets. Quarantine fatigue a� ects us all and can distract us from what we need to accomplish. In order to bring some
sense of normalcy into your routine, there are a few things to remember.
GIVE YOURSELF A BREAK It is ok to set boundaries. Make sure you know when it is time to shut o� the phone or computer and stop taking phone calls. Also, if a child, adult, or pet interrupts a meeting or distracts you, it is ok. It is happening to all of us around the world. Just mute or turn your video o� , and text or chat your team that you will return shortly but need to tend to your family for a moment.
TAKE YOUR TEMPERATURE AT HOMENot just your physical temperature, but the pulse of your family before you leave the house. If you are going into work, you are likely feeling like you have unsettled household duties as well as unsettled tasks at the site or o� ce. That is ok. Again, we are all in the same situation. Do your best to make a list to get the unresolved tasks o� your mind and then set your plan for what you can realis-tically accomplish today and for the rest of the week.
Our new normal is to have our temperature checked at the door, be quizzed on how we are feeling, put on our mask, and live under a constant fear that we may contract, or transmit, coronavirus to
someone else. We know that this is a temporary situation and we are a part of the solution.
TURN OFF THE NEWS STREAMWe live in a world where we are always tuned in to the media, the news; it is a constant stream of communication. In order to not drive yourself crazy, it is ok to limit your news time. Make a com-mitment to yourself that you will not check email until you have had your � rst cup of co� ee, or at the very least until your feet have hit the � oor!
My family is blessed with a talent for music. We take time to enjoy those talents and listen to each other sing, play an instru-ment, showcase the latest video, or rehearse for virtual auditions. This situation has brought us closer and taught me to appreciate the time we spend together.
I also like to sit outside and enjoy the sunshine on my deck. I enjoy nature and taking a moment away from a busy schedule to re� ect on my workday and disconnect—this helps me maintain my best self.
I challenge you to do one thing for you today that does not involve work, your phone, or your computer. I cannot guarantee it will make you feel better, but I know stepping away from the new normal even for 10 minutes a day gives me the energy and breather that I need to be the best I can be for my family and my colleagues.
Vivianne Arencibia
Vivianne Arencibia is President of Arencibia Quality and Compliance Associates, LLC, and a member of the ISPE International Board of Directors. She has been an ISPE member since 1991.

10 P h a r m a c e u t i c a l E n g i n e e r i n g
Women in Pharma® Editorial By Vivianne Arencibia
PANDEMIC COPING STRATEGIES
I challenge you to do one thing for you today that does not involve work, your phone, or your computer.
Because of the global pandemic, we have experienced unexpected joys, learned new skills, adjusted to long days of video conferencing, and dealt with drops in income and potential job losses. At the same time, we have also experienced an increased sense of urgency, collaboration, and pride because we are a part of the industry that has been tapped to heal all our nations from this unexpected virus.
I f you are like me, you are not getting a break from the in� ux of work meetings, family stressors, feelings of isolation, and the media outlets. Quarantine fatigue a� ects us all and can distract us from what we need to accomplish. In order to bring some
sense of normalcy into your routine, there are a few things to remember.
GIVE YOURSELF A BREAK It is ok to set boundaries. Make sure you know when it is time to shut o� the phone or computer and stop taking phone calls. Also, if a child, adult, or pet interrupts a meeting or distracts you, it is ok. It is happening to all of us around the world. Just mute or turn your video o� , and text or chat your team that you will return shortly but need to tend to your family for a moment.
TAKE YOUR TEMPERATURE AT HOMENot just your physical temperature, but the pulse of your family before you leave the house. If you are going into work, you are likely feeling like you have unsettled household duties as well as unsettled tasks at the site or o� ce. That is ok. Again, we are all in the same situation. Do your best to make a list to get the unresolved tasks o� your mind and then set your plan for what you can realis-tically accomplish today and for the rest of the week.
Our new normal is to have our temperature checked at the door, be quizzed on how we are feeling, put on our mask, and live under a constant fear that we may contract, or transmit, coronavirus to
someone else. We know that this is a temporary situation and we are a part of the solution.
TURN OFF THE NEWS STREAMWe live in a world where we are always tuned in to the media, the news; it is a constant stream of communication. In order to not drive yourself crazy, it is ok to limit your news time. Make a com-mitment to yourself that you will not check email until you have had your � rst cup of co� ee, or at the very least until your feet have hit the � oor!
My family is blessed with a talent for music. We take time to enjoy those talents and listen to each other sing, play an instru-ment, showcase the latest video, or rehearse for virtual auditions. This situation has brought us closer and taught me to appreciate the time we spend together.
I also like to sit outside and enjoy the sunshine on my deck. I enjoy nature and taking a moment away from a busy schedule to re� ect on my workday and disconnect—this helps me maintain my best self.
I challenge you to do one thing for you today that does not involve work, your phone, or your computer. I cannot guarantee it will make you feel better, but I know stepping away from the new normal even for 10 minutes a day gives me the energy and breather that I need to be the best I can be for my family and my colleagues.
Vivianne Arencibia
Vivianne Arencibia is President of Arencibia Quality and Compliance Associates, LLC, and a member of the ISPE International Board of Directors. She has been an ISPE member since 1991. www.copadata.com/pharmaceutical
` Connect your existing machines and manufacturing lines
` User Access Control, audit trail, time synchronization
` Automatically record GMP-critical process parameters
` Detect deviations in real time
` Generate reports that support batch review by exception
When GMP compliance meets transparency and flexibility:
Endgame for Data Integrity Warning Letters!

12 P h a r m a c e u t i c a l E n g i n e e r i n g
YP EDITORIAL By LeAnna Pearson Marcum
TIMES ARE CHANGING
LeAnna Pearson Marcum
As many of you read this, I am sure your social and work life have been turned upside down, fl ipped around, and now are possibly settling into “the new normal.” I personally cringed when I wrote that—I was so tired of hearing that phrase about three weeks into the pandemic.
I am sure you all have calendars that are now packed with meet-ings, calls, and video chats; honestly, I think my calendar has never been this full!
I realized this about a month in and have worked with my team to ensure they are still carving out time for professional development and personal time. Both are super important and should not be overlooked, even when we are in a virtual working world. The biggest mistake we can all make is putting this o� until “things resume” because you have missed out on months of devel-opment and opportunities!
VIRTUAL PROFESSIONAL DEVELOPMENTThe obvious one is sign up for a webinar. They are all over now, and most have some great breakout sessions!
Schedule some time with your mentor or someone in your company. This could be to have a virtual lunch, cup of co� ee, or even a glass of wine. Ask them what they are doing to stay up to date on professional training, and have a relaxed conversation with them.
Now is the time for online training. There is a plethora of online training, and now more than ever, it is easier to work into a schedule.
Attend a virtual conference. Have you ever gotten pushback on attending a conference due to the high cost of travel? That is not an issue with virtual conferences!
I love to listen to an audio book when I walk at lunch. This was once something I did on my commute. Now with working from home, I make sure to step away at lunch and give myself some work/life balance by taking walk with my audio book.
Many are participating in virtual hackathons. These are ses-sions scheduled on weekends or after work hours to help “hack” or
solve a problem pressing on the industr y. The ISPE Young Professionals of North America recently hosted the � rst virtual Hackathon with a problem statement provided by AveXis. It took place over three weeks and combined teams from the East Coast and West Coast to battle it out for the overall winner.
LeAnna Pearson Marcum is a Senior Project Manager at PharmEng Technology and the 2019–2020 ISPE International Young Professionals Chair. She has been an ISPE member since 2009.
YP Opportunities to Connect and LearnNow that you are inspired to recommit to professional development, here are some options to consider:
u ISPE Young Professionals (ispe.org/membership/young-professionals): Explore news, events, and resources for YP members.
u ISPE Community Connection (cop.ispe.org/home; access from ispe.org/membership/communities-practice): Use this enhanced networking platform to participate in discussion threads for Communities of Practice (CoPs), Chapters, A� liates, and Special Interest Groups. Check out the YP CoP page!
u ISPE Conferences (ispe.org/conferences) and Webinars (ispe.org/webinars): Broaden your knowledge and get to know your colleagues by attending upcoming virtual conferences and webinars.
u ISPE Training (ispe.org/training): Looking to expand your skills? Consider enrolling in an upcoming training course.

Do you want to learn more?www.endress.com/life-sciences
INNOVATE+ ACCELERATE
You are enabled to achieve faster time to market, improve plant productivity and reduce risk.
We understand how leading-edge products andprocess improvements are critical in your business.
Improve your processes with our comprehensive portfolio of measuring instruments:
Promass P 100:Flow measurement specialist with an ultra-compact transmitter is designed for sterile processes.
Cerabar PMP51:The digital pressure transmitter simplifi es life in high pressure hygiene applications.
Micropilot FMR62:80GHz radar with all certifi cates runs clear, reliable signals evenin small tanks with baffl es.

1 4 P h a r m a c e u t i c a l E n g i n e e r i n g
In the pharmaceutical industry, digitalization involves developing and implementing digital technologies at all levels of pharmaceutical operations. The aim is to transform the industry by capturing, analyzing, and using vast amounts of data collected from a wide range of sources to support research and development (R&D), clinical development, drug manufacturing, supply chain management, patient engagement, quality assurance (QA) and quality control (QC), product safety monitoring, and other objectives.
Despite the transformational potential of digitalization, the pharma industry has historically been slower than other sectors to adopt digital tools, such as cloud storage, arti� cial intelligence (AI), machine learning (ML), blockchain, and
remote communication technologies, and make associated changes in workplace culture and strategic priorities. Now, how-ever, the COVID-19 pandemic may be accelerating the pace of change.
What are the digitalization trends in the industry? What is the business case to develop and implement digital tools and digitali-zation strategies? And how can organizations introduce and use them? Pharmaceutical Engineering® spoke with industry experts with a wide range of experience in these areas to explore these questions and related topics.
DIGITAL MATURITYAccording to Christian Wölbeling, Senior Director, Global Accounts at Werum IT Solutions GmbH, when the Pharma 4.0™ Special Interest Group (SIG) surveyed industry representatives
about digital maturity in late 2019, only 16% of respondents said that their organization was involved in systematic, ongoing action to digitalize operations. Another 28% of organizations were engaged in pilot projects. These data suggest that more than half of organizations had either not yet started or were just starting to digitalize operations. This aligns with � ndings from an earlier (2018) survey report from Deloitte Insights, which found that only 20% of companies consider that they are matur-ing digitally [1].
“The Pharma 4.0™ operating model is interconnected, mean-ing that the digital tools allow for a fully connected network to allow direct communication between all levels in an organiza-tion,” said Wölbeling. When the operating model is deployed, dig-italization provides connection and results in full transparency, with data used for improved decision-making.
Wölbeling noted that the digitalization adoption rate depends on the industry segment. Large pharmaceutical manufacturers tend to have greater digital maturity than companies in the gener-ics sector because the larger operations (e.g., Merck, Pfizer, and Johnson & Johnson) have more � nancial resources, superior data storage and collection assets, and greater access to digitalization experts. In contrast, he explained, generics companies are lagging, in part because budget constraints limit their ability to adopt digi-tal innovations.
Advanced therapy medicinal product and cell and gene ther-apy manufacturers are the frontrunners in digitalization, Wölbeling said. “They have been highly digitalized from the beginning with all their processes, including a holistic control strategy for the end-to-end process that collects a patient’s blood, modi� es cells, and reintroduces them to the patient. Everything is still done manually but uses high-tech equipment and, in the end, the data are captured and analyzed by highly sophisticated machinery. The technology guides the operator through the man-ufacturing process.”
COVER STORY TECHNOLOGY TRENDS
Technology Trends:
THE TRANSITION TO DIGITALIZATIONBy Scott Fotheringham, PhD

S E P T E M B E R / O C T O B E R 2 0 2 0 15
AI- AND ML-DRIVEN INNOVATIONS“AI and machine learning are being used in two distinct ways by biopharma,” said Eric Staib, Vice President, PVAI QA/Compliance, at Genpact. They can serve to automate heavily resource-burdened or repetitive activities and as decision-support systems to acceler-ate the handling of vast amounts of data.
Virtual clinical trials are a potential application of AI/ML to overcome some weaknesses of traditional clinical trials, which tend to be slow, costly, and ine� cient. Virtual trials can harness the power of digital health technologies—such as mobile apps and remote health tracking devices—to collect patient data regardless of location, thus increasing the potential for wider recruitment and participation [2].
“AI and machine learning can help analyze data to determine the best, most e� ective and e� cient ways to virtualize clinical tri-als for a given target population,” said Staib. Such systems can help industry stakeholders understand the relevant data in a much more comprehensive and extensive way than was previously possible.
In addition, “many companies are using these technologies to enhance the efficiency of processing, analyzing, and reporting adverse events (AEs),” he said. “With the vast growth in AE case volumes, the expanding number of reporting sources, and the complexity of therapies, such pharmacovigilance systems are sure to be game-changers—and a necessity—within the industry over the next few years.”
FACILITY DESIGN“Digitalization will change how facilities are designed and built,” said Robert Guenard, Senior Director, Product and Technology Development, at Biogen. “There is a movement toward building digital twins to virtually model how the operation will function even before plant construction begins.” (A digital twin is a digital replica of physical object/entity that can be used to run scenarios and simulate or predict outcomes [3].)
“In the digital world, we’ll have a better understanding of what the need is and the likelihood of the need,” Guenard said. “Often, we’re building plants based on some level of risk and we don’t know exactly what’s going to happen with them, which leads to costly retro� ts. The ability to predict the actual need using simula-tion will be better and will help inform the design speci� cations of the plant.”
Successful facility design thoroughly anticipates needs related to automation levels and optimal data f low across the product life cycle, including how data from plants, labs, products, and supply chains � t together. “We have to think about how this [the facility and its network] meshes with vertical and horizontal integration using standards such as ISA-88 [4] and ISA-95 [5],” Guenard said.
This focus on increased digital integration should stretch “from the physical layer of the plant to how the sensing, controls, and automation work, all the way up to enterprise management and the supply chain,” he emphasized.
Using Data for Predictive Drug ProcessingChristian Wölbeling sees the opportunity to use a combination of methods to transition from continuous manufacturing to Pharma 4.0™ intelligent manufacturing.“In continuous manufacturing, we have data capture, but now we can use it in the manufacturing process in a predictive way,” he explained. “You’re not just learning about the past and reacting to it, you’re using it for decision-making and preventive actions in the present. This uses analytics and predictive algorithms. AI and machine learning can add on to this but aren’t necessary.“The huge data sets that used to be captured on paper and have been digitized over the past 5 to 10 years were stored but not leveraged to make predictions,” Wölbeling continued. Those data are now accessible, and there are aff ordable tools to capture and distribute them. “You can dig into data pools, structure the data, distribute them, and use them to predict.“An excellent business case for using digital tools during drug processing is the popular current application of these data to predict the optimal harvesting point of a bioreaction. We take data from batches, create algorithms that can use data from a running batch to predict how that batch will develop, and then predict the harvesting time that optimizes titer. Even a small improvement (1%) in harvesting point calculation can lead to a huge increase in profi t—as much as $100,000. There’s a huge amount of money sleeping there. An electronic system makes this accurate and repeatable.”
—Scott Fotheringham

16 P h a r m a c e u t i c a l E n g i n e e r i n g
BLOCKCHAINBlockchain can be used for data security—and more. “Decentralized ledger technologies such as blockchain record data in a time series (i.e., the order of transactions),” explained James Canterbury, Principal at Ernst & Young LLP.
“The combination of the transactions (the events) and the time between transactions creates a pattern that is prime training mate-rial for machine learning and predictive analytics. This in turn can be used by arti� cial intelligence algorithms to suggest optimized business decisions. For example, we can use a blockchain to track the movement of drugs through various distribution channels.
“We are moving from centralized systems that require trust to decentralized systems that generate proof,” Canterbury contin-ued. “At the same time, we are shifting from process-oriented data structures to product-oriented data structures. In a decentralized system, the data can follow the product as it moves through its life cycle without needing to integrate all of the systems that govern it along its way. Cryptography plays a really important role in all of this, being able to provide proof that you know something, without actually revealing what you know. It opens up a whole new realm of information exchange. This will change the way we rely on sys-tems, which in turn will change the way we manufacture drugs and devices.”
QA AND QC“We have the opportunity to evolve from a culture of compliance to a culture of quality,” said Georg Singewald, PhD, Vice President for Global Quality Control at Roche/Genentech. Improved QA and QC can be accelerated by the ability to analyze data made available from sensors and connected networks. This a� ords “a degree of freedom within the tightly regulated environment to allow good decision-making and can be used over time to change processes and control systems,” he explained. “We can eventually to under-stand root causes and analyze them. Digitalization helps identify and even predict clusters that we might not be able to see today,” and will help us be more accurate.
Another bene� t of digitalization is the ability to make accurate predictions. “Before these technologies were available, the quality team was looking at historical deviations that happened in a batch,” Singewald said. “What we want to achieve for QA and QC is to use data for predictive models. This allows us to have more in-line technologies on the floor to provide analytical readouts, faster methods that can pick up trends in real time, and having elements that identify those trends and feed them into the quality system to compare with previous experience. In this way, the quality team moves away from being focused on records of batches that have already been produced to becoming a business partner to improve processes, as is seen in other industries.”
He added, “These technologies need not interfere with the regulatory compliance requirements for release testing. We can bring in these new methodologies running in parallel and learn to use them as preventive measures, even if they are not giving us the � nal readout of a lot release.”
Singewald foresees additional changes from digital technolo-gies. “Once a company has reached a certain level of automation, including computer system validation, then the need for oversight can be reduced. Then you have a culture of quality that truly builds quality into the process. This will enable an organization that makes informed and consistent decisions at the lowest level possi-ble, further fostering accountability and quality culture.”
WORKFORCE EFFECTS“New product modalities and manufacturing technologies require the existing workforce to settle into a mode of lifelong learning,” said John Balchunas, Workforce Director at the National Institute for Innovation in Manufacturing Biopharmaceuticals. Workers will need to constantly advance their subject matter expertise and awareness of technologies.
“This is critical because companies are going to be hiring an increasingly diverse workforce to meet needs and grow into new areas such as continuous manufacturing, digitization, big data, and automation, as well as new product modalities like gene and cell-based therapies,” Balchunas said.
“Employees need to take professional development into their own hands and think creatively about where to � nd opportunities to continue their lifelong learning,” he said, noting that there is tremendous capacity for online and hands-on training available through universities, community and technical colleges, profes-sional societies, and specialized industry training centers. In addition, because technological innovation often starts with sup-pliers and vendors, pharmaceutical manufacturing employees should view them not just as not just transactional partners but also as knowledge resources.
“From senior leadership down to technicians and operators, the fundamental need will be the same,” Balchunas said. Everyone will need to learn how to collaborate with colleagues across a complex multidisciplinary workforce. “While everyone does not need to become a subject matter expert, they will need foundational aware-ness of new technologies to communicate e� ectively.”
COVER STORY TECHNOLOGY TRENDS
“ We have the opportunity to evolve from a culture of compliance to a culture of quality.”

S E P T E M B E R / O C T O B E R 2 0 2 0 1 7
Singewald agreed. “Competition for skilled IT and data special-ists will be strong,” he said. “We need to think about the mindset and skills that will build a robust operating model of continuous embedded change to processes within an organization.”
COVID-19 IMPACTThe COVID-19 pandemic is shaping the industry’s transition to digitalization in multiple ways. Notably, social distancing meas-ures have prompted substantial changes to how and where work is done. “Companies are being forced to be more � exible and consider remote options, including having a quali� ed person working from home,” Wölbeling said. “Having workers who are essential for business continuity unable to be onsite brings a business case to digitalization.”
Speed to market for essential medicines is another driver of change. “Digital technologies will be ‘must haves’ for companies that want to bring new medicines to market quicker and safer,” Staib said. “As a result of COVID-19, we can no longer rely on tradi-tional means of conducting clinical trials and gathering pharma-covigilance data. We must know much quicker whether a given drug or therapy is a viable option. This can only be done through a mix of scienti� c disciplines, all of which involve, and rely heavily upon, technology, data, and best practices.”
The pandemic is making it clear that “organizations can delay digitalization no longer,” Canterbury declared. “Supply chains need to be more agile to account for better business continuity. Relevant data must be available—and trusted—so manufacturers can switch suppliers easily. In some cases, we cannot a� ord the time to do traditional, manually exhaustive, supplier qualifica-tions. Even some of the most basic processes, like physically sign-ing a document that requires people to be co-located, will need to change.”
Singewald noted speci� c examples of digital technologies that have been key to e� ective operations during the pandemic, includ-ing digital signature systems and remote access to chromatograms or batch protocols; the latter allows offsite personnel to assess deviations and maintain supply and quality metrics. However, he said that “as long as we are in a hybrid state, where some parts of a process are electronic and some are not, or a whole work� ow of a batch is not covered in an electronic way, you will have this chal-lenge of needing to be onsite for some processes.”
WHAT’S NEXT?“The future is here now—it’s just not evenly distributed or fully embedded in our industry,” Guenard said. “Since I joined the pharma industry in 2003, I’ve wondered why this transformation
Discover why Kneat is trusted by Engineers, Directors and CIO's leading digitalization in Life Sciences.
kneat.com
Trust-worthy, Paper-less.The trusted name in paperless validation

18 P h a r m a c e u t i c a l E n g i n e e r i n g
[i.e., digitalization] is not happening more quickly. There are many reasons for this. Yes, this is a conservative industry in many ways, but we do incredible things in medical science, so innovation is really happening.” Although he said innovative digitalization e� orts in manufacturing are making progress, he also observed that companies often do not consider these e� orts to have strategic value, which means they tend to be lower priorities than other work to run or improve the business.
Additional challenges, Guenard said, include perceived regu-latory and quality barriers. However, “the regulators I’ve talked to want to see these digital innovations implemented because of the large opportunity to improve patient outcomes and ensure supply continuity.”
Guenard noted that the pace of digitalization in the pharma industry relative to other industries may be slower because the incentives are not the same. “We don’t talk about margins and cost of goods to the extent that it pushes us to innovate. In the chemical industry, a very small improvement in e� ciency can determine whether you remain competitive. Contrast this to our industry, in which the competitive advantage is in efficacy, safety, product performance, and the experience of the customer, and generally not in manufacturing.”
According to Guenard, the complexity of the pharma manu-facturing industry also makes digitalization especially challeng-ing. “We’ve seen studies about how other industries are more advanced, but some of our processes are highly complex and the way we manage those plants should be commensurate with the complexity of the process. There’s a step change that we have to go through to be able to deliver products in a low-cost, reliable, highly agile manner. There’s a significant opportunity here.” Efficient digitalization, he emphasized, “is best done by designing it in and being strategic.”
Wölbeling pointed out that AI and ML are not new to the indus-try. “The key trend is how to make a business case and apply them. The main challenges to implementing digitalization are having the right people choosing where and how to use it, developing the sys-tems, analyzing the data, and, of course, the cost.” Large pharma-ceutical companies have large amounts of data, he said. “Now we have good data in a format that can be fed into AI, as well as interop-erability of data sources across geographies and technologies.”
However, Wölbeling believes that simply developing and implementing technology is insu� cient. “You have to transform the culture,” he said. A culture of digital maturity will encourage the mindset to accept, use, and benefit from these technologies and not see them as a burden.
“Decentralized systems are a team sport, and nearly all of the really good development work is being done on public, open-source networks,” he said. It’s important to play a role in those communities now, and to invest the time to understand the foun-dations of these technologies and how they will impact your busi-ness, he added. “For example, blockchains were originally intended as public utilities and if they’re going to reach their full potential, they need to be thought of as such.”
Canterbury suggested that industry stakeholders reach out to colleagues as they explore new options. “When you design an experiment or participate in a pilot, you need to consider the eco-system and account for the right level of privacy versus transpar-ency,” he said. “The best way to get started is to talk about it with your business partners and industry groups, such as the ISPE GAMP® Blockchain or AI/ML Special Interest Groups.”
Trust in data science is key to moving forward as an industry, Staib said. He also noted that stakeholders need trust in “the rigor-ous IT controls framework that ensures the quality of such technol-ogies, and the integrity of data they rely upon.” In addition, “the successful application of these digital innovations requires invest-ment in the appropriate technology as well as collaboration with tech companies. The pharma and biotech industries need to invest heavily in the understanding and processing of data that are already available to them, both within their organizations and external to their companies, including publicly available information. They also need to embrace partnerships with large and small tech entities to create mutually rewarding codevelopment scenarios.”
COVER STORY TECHNOLOGY TRENDS
“ The best way to get started is to talk with your business partners and industry groups.”
References1. Deloitte Insights. “Survey Finds Biopharma Companies Lag in Digital Transformation.” 2018. https://www2.deloitte.com/cn/en/pages/life-sciences-and-healthcare/articles/survey-fi nds-biopharma-companies-lag-in-digital-transformation.html2. Shore, C., E. Khandekar, and J. Alper, eds. Virtual Clinical Trials: Challenges and Opportunities: Proceedings of a Workshop. National Academies of Sciences, Engineering, and Medicine; Health and Medicine Division; Board on Health Sciences Policy; Forum on Drug Discovery, Development, and Translation. Washington, DC: National Academies Press, 2019. doi:10.17226/255023. Whytock, A. “The Digital Twin: Creating Effi ciencies in a Virtual World.” Pharmaceutical Engineering 39, no. 4 (2019): 21–22.4. International Society of Automation. ISA-88: Batch Control. Research Triangle Park, NC: International Society of Automation, 2001–2010.5. International Society of Automation. ANSI/ISA-95: Enterprise-Control System Integration. Research Triangle Park, NC: International Society of Automation, 2010–2018.
About the authorScott Fotheringham, PhD, is a freelance medical writer with interests that span fi elds as diverse as medical cannabis, pharmaceuticals, biotechnology, and molecular genetics. Most recently, he was Senior Medical Writer at Spectrum Therapeutics.

Intelligen Suite®
The Market-Leading Engineering Suite for Modeling, Evaluation,Scheduling, and Debottlenecking of Multi-Product Facilities
SuperPro® SchedulePro®
Use SuperPro Designer to model, evaluate, andoptimize batch and continuous processes
Migrate to SchedulePro to model, schedule,and debottleneck multi-product facilities
Easy production tracking, conflictresolution and rescheduling
Tracking demand for resources(e.g., labor, materials, utilities, etc.)
Managing inventories for input,intermediate, and output materials
SuperPro Designer is a comprehensive process simulator that facilitates modeling, cost analysis, debottlenecking, cycletime reduction, and environmental impact assessment of integrated biochemical, bio-fuel, fine chemical, pharmaceutical(bulk & fine), food, consumer product, mineral processing, water purification, wastewater treatment, and related processes.Its development was initiated at the Massachusetts Institute of Technology (MIT). SuperPro is already in use at more than500 companies and 900 universities around the globe (including 18 of the top 20 pharmaceutical companies and 9 of the top10 biopharmaceutical companies).
SchedulePro is a versatile production planning, scheduling, and resource management tool. It generates feasibleproduction schedules for multi-product facilities that do not violate constraints related to the limited availability of equipment,labor, utilities, and inventories of materials. It can be used in conjunction with SuperPro (by importing its recipes) orindependently (by creating recipes directly in SchedulePro). Any industry that manufactures multiple products by sharingproduction lines and resources can benefit from the use of SchedulePro. Engineering companies use it as a modeling tool tosize shared utilities, determine equipment requirements, reduce cycle times, and debottleneck facilities.
Visit our website to download detailed product literature and
functional evaluation versions of our tools
INTELLIGEN, INC. ● 2326 Morse Avenue ● Scotch Plains, NJ 07076 ● USATel: (908) 654-0088 ● Fax: (908) 654-3866
Email: [email protected] ● Website: www.intelligen.comIntelligen also has offices in Europe and representatives in countries around the world

2 0 P h a r m a c e u t i c a l E n g i n e e r i n g
FEATURE PROCESS VALIDATION
Existing risk-based approaches to computerized system compliance and validation as outlined in GAMP® 5 [1] are applicable to a variety of life sciences organizations supporting or performing GxP-relevant activities. However, specifi c guidance on how to implement all the necessary measures and what to prioritize in small- and medium-sized enterprises is scarce.
The need for such guidance is signi� cant. For example, there are approximately 26,000 medical technology companies in Europe, and 95% of them are small- or medium-sized compa-nies, meaning each of these companies employs fewer than 250
persons and has an annual turnover not exceeding €50 million [2].Despite the importance of these companies to the pharma
industry, the adoption or use of tailored validation approaches in small- and medium-sized enterprises is currently not addressed or described in any guidance or literature. As a result, small- and medium-sized enterprises continue to face the challenge of select-ing and applying a suitable process for computerized system com-pliance and validation [3].
The need for robust computerized system validation as the basis for the integrity, reliability, and robustness of data generated in clinical trials has recently been highlighted in the “Notice to Sponsors on Validation and Qualification of Computerised Systems Used in Clinical Trials” issued by the EMA in April 2020 [4]. This notice speci� cally states:
Failure to document and therefore demonstrate the validated state of a computerised system is likely to pose a risk to data integrity, reliability and robustness, which depending on the criticality of the a� ected data may result in a recommendation from the GCP [good clinical practices] inspectors to the CHMP [Committee for Medicinal Products for Human Use] not to use the data within the context of an MAA [marketing authoriza-tion application].
Therefore, small- and medium-sized enterprises supporting GCP-relevant activities by providing services and/or technology need to be ready to support their clients with documentation and evidence generated by a robust, reliable, but also right-sized quality man-agement system (QMS).
POTENTIAL QMS IMPLEMENTATION CHALLENGESAs Welsh and White have observed, “A small business is not a little big business” [5]. In the pharma industry, this quote is especially true with regard to quality and validation. This becomes obvious in the resourcing of quality and IT departments. Whereas large organizations may have hundreds of people working on some-times very specialized tasks and a dedicated sizable budget for quality and IT, small- and medium-sized enterprises often have less than a handful of experts, whose efforts may be limited by � nancial constraints. In the context of quality and validation, this may lead to issues a rou nd sepa rat ion of dut ies i n some organizations.
At the same time, small- and medium-sized enterprises often provide a single or very few specialized services or software and therefore may not need the entire set of processes, checks, and balances that are often implemented and seen as “the standard” in larger organizations. Larger companies often must develop and maintain an extensive QMS that covers all GxP areas to ensure appropriate standards are applied across the entire organization. It may start with high-level quality policies that are then detailed in underlying standard operating procedures (SOPs), work instruc-tions, manuals, and other documentation for the various aspects and areas to be covered. In contrast, small- and medium-sized enterprises should be able to develop and maintain a much smaller QMS that is focused on and tailored to the business and regulatory compliance aspects that are relevant to the services they provide. This QMS may not require as many levels as a large enterprise’s QMS.
ICH E6(R2), Guideline for Good Clinical Practice, [6] states that “the sponsor should implement a system to manage quality throughout all stages of the trial process.” Although “a sponsor
VALIDATION OF CLINICAL TRIAL–RELATED SYSTEMS in Smaller EnterprisesBy Frank Henrichmann and Oliver Herrmann

S e p t e m b e r / o c t o b e r 2 0 2 0 2 1
may transfer any or all of the sponsor’s trial-related duties and functions to a CRO [contract research organization],” the sponsor needs to ensure oversight of “trial-related duties and functions that are subcontracted to another party.” Furthermore, “the ulti-mate responsibility for the quality and integrity of the trial data always resides with the sponsor.”
The 2020 EMA notice mentioned previously [2] provides further clarification, stating “sponsors shall be able to provide the GCP inspectors of the EU/EEA authorities with access to the requested documentation regarding the quali� cation and validation of com-puterised systems irrespective of who performed these activities.” If a small- or medium-sized enterprise (or even a larger company) cannot support the sponsors by providing, for example, system requirement speci� cations or documentation and system access for GCP inspectors, “systems from such a vendor shall not be used in clinical trials” [2]. This is often interpreted to mean that service and technology providers need to implement a QMS similar to that of sponsor organizations, which are often large pharma companies. Figure 1 illustrates the QMS expectations for detailed processes.
At the same time, the quality approach should avoid unneces-sary complexity, procedures, and data collection and follow the application of science- and risk-based methodologies. But how can one determine what is required? And how can enterprises
implement the quality approach in an e� cient, cost-e� ective, and justi� able way?
QUALITYAmong the biggest advantages of small- and medium-sized enter-prises are the personalized management and � at hierarchies that make them agile and nimble in the market and allow them to address their clients’ needs quickly. This advantage should also be re� ected in the enterprise’s basic quality approach.
This basic quality approach should ideally be documented in a single document that describes the following: u The basic roles and responsibilities as they are required for
the services provided: Even though auditors are very familiar with roles like “process owner” or “system owner” that are distinct from job titles, it may be more suitable in small organ-izations to use job titles and job descriptions to document the roles and responsibilities and reference those in the quality process descriptions. It should also be understood that the often-granular roles used by large organizations are not feasi-ble for small- and medium-sized enterprises. The adequate separation of duties should be the guiding principle for the design of roles and responsibilities. Even though the GAMP® 5 Guide [1] suggests a number of roles including, but not limited
Quality
Assurance
Control
CAPA (Corrective Action and
Protective Action)
SOP Management
Risk
Identification
Evaluation
Control
Communication
Review
Reporting
Validation & Qualification
Planning
Specification
Configuration and/or Coding
Qualification (Verification)
Reporting
Data Collection and Handling
Operating & Maintenance
Security Measures & Access Control
Change Control
Data Backup & Recovery
Contingency Planning
Decommissioning
Training
Planning
Conduct
Documentation
Supporting Documents
Job Descriptions
Curricula vitae
Figure 1: QMS expectations for detailed processes.

2 2 P h a r m a c e u t i c a l E n g i n e e r i n g
to, process owner, system owner, quality unit, corporate quality, operational quality, and subject matter experts, this does not mean that these roles cannot be combined and cov-ered by very few individuals (in the extreme, by one individual covering process/system owner and subject matter expert and another individual covering all quality roles).
u The overall process for generating and maintaining the QMS, including versioning and document control: Many companies use electronic document management systems to establish access control and versioning, but small companies can be compliant by maintaining a master SOP binder or storing the � nal documents in a protected area to which most employees are restricted to read-only access. Regardless of the approach chosen, the superseded or retired processes need to be retained. The process for generating and maintaining the QMS can be quite short and lean, focusing on:
u Steps to request a new process or update to an existing process
u Approval of processes before they become e� ective u Communication and training of new or changed processes u Maintenance and storage of all processes that ever became
e� ective Larger organizations often require detailed reviews by a signi� -cant number of stakeholders to maintain the internal integrity of their QMS. Small- and medium-size enterprises—with their � at hierarchies, smaller number of SOP authors, and smaller business focus—may be able to reduce or even eliminate these reviews.
u The internal and (if needed) external audit approach, plan-ning, and documentation: This information can be recorded in a document or spreadsheet. Controls similar to those used for SOPs need to be in place to prevent manipulation. This is especially important if the small- or medium-sized enterprise outsources some aspects of the provided services (e.g., to cloud service providers).
u An approach for continuous improvement and corrective/preventive actions: This information may also be stored in a document or spreadsheet; however, most technology provid-ers have systems in place for service desk activities. This sys-tem can potentially be con� gured to support corrective action and protective action (CAPA) activities as well. The overall number of incidents and CAPAs should drive the approach to management review and key performance indicators (KPIs). Smaller companies may not have a need to implement detailed processes for this if there are only few CAPAs and every CAPA is discussed within the entire management team. Whichever methodology is used should be documented as such in the process description.
RISK MANAGEMENTRisk management activities are fundamental to all attempts to build an e� cient, cost-e� ective, and defensible QMS and valida-tion framework. Protecting patient safety, data integrity, and reg-ulatory compliance needs to be at the heart of all risk evaluations.
A similar approach to the one outlined previously for the con-tinuous improvement and corrective/preventive actions may be utilized for risk assessment and management. Risk may be assessed and managed for each individual project or product; however, an extensive approach to aggregate the risks and have them reviewed by management may not be necessary in small organizations.
Key questions to be addressed in risk assessment activities are: u What parts of the provided services can directly or indirectly
impact patient safety or data integrity? u Do the services contribute to or directly perform drug safety
activities (e.g., collection or processing of serious adverse events)?
u Do the services contribute to the collection or processing of clinical trial data that support a clinical end point?
u Do the services contribute to the storage or distribution of investigational products?
u Do the services contribute to the protection of patient rights (e.g., informed consent)?
u What parts of the provided services contribute to a regulatory submission?
The detailed answers to questions such as those outlined here allow the small- or medium-sized enterprise to focus on critical areas in all aspects of quality. It is critically important that experts in the organization have in-depth knowledge of the process and the system and a robust understanding of the regulatory frame-work and data integrity expectations. This knowledge enables the risk management activities to � nd and document the appropriate validation approach. Also, it is important to carefully align the risk assessment with the needs of clients. Understanding how the customer intendeds to use the product or service is important for the small- or medium-sized enterprise’s risk evaluation. The risk mitigation activities may be included in quality agreements or service-level agreements.
For example, an electronic data capture (EDC) provider will signi� cantly contribute to the collection and processing of clinical trial data that support a clinical end point. Depending on the trial design and the data to be collected, system downtimes of one or even more days may be acceptable. However, if the EDC system is also used by the customer to collect serious adverse events that need to be processed and reported within tight regulatory time-lines, such downtimes may not be acceptable.
Small- and medium-sized enterprises may need to invest sig-ni� cant resources in risk management activities because they are crucial for reducing effort in a justified and compliant manner. The risk management methodology itself should be scaled for purpose; for example, it may not be necessary to document risks and corresponding mitigation actions or acceptance for every individual user requirement associated with a computerized sys-tem. Instead, a clear, structured, and detailed description of the intended use, the associated system functions, relevant proce-dural and technical controls, and the associated risks may be su� -cient in a number of cases.
FEATURE PROCESS VALIDATION

ELETTRACQUApure water technologies
DESIGN AND CONSTRUCTION OF PURIFIED WATER PACKAGES DOUBLE PASS REVERSE
OSMOSIS R.O. + ELECTRODEIONIZATION HOT WATER SANITIZABLE ULTRAFILTRATION
MULTIPLE - EFFECT DISTILLATION UNITS PURE STEAM GENERATORS STORAGE AND
DISTRIBUTION LOOP COMPLETE TURNKEY PROJECTS VALIDATIONS IQ, OQ
SINCE 1966
PHARMACEUTICAL WATER SYSTEMS
w w w . e l e t t r a c q u a . c o m
multiple effects distillation unit 12m
3 h
ELETTRACQUApure water technologies
DESIGN AND CONSTRUCTION OF PURIFIED WATER PACKAGES DOUBLE PASS REVERSE
OSMOSIS R.O. + ELECTRODEIONIZATION HOT WATER SANITIZABLE ULTRAFILTRATION
MULTIPLE - EFFECT DISTILLATION UNITS PURE STEAM GENERATORS STORAGE AND
DISTRIBUTION LOOP COMPLETE TURNKEY PROJECTS VALIDATIONS IQ, OQ
SINCE 1966
PHARMACEUTICAL WATER SYSTEMS
w w w . e l e t t r a c q u a . c o m
mult
iple
eff
ects
dis
till
atio
n u
nit
12
m3h
ELETTRACQUApure water technologies
DESIGN AND CONSTRUCTION OF PURIFIED WATER PACKAGES DOUBLE PASS REVERSE
OSMOSIS R.O. + ELECTRODEIONIZATION HOT WATER SANITIZABLE ULTRAFILTRATION
MULTIPLE - EFFECT DISTILLATION UNITS PURE STEAM GENERATORS STORAGE AND
DISTRIBUTION LOOP COMPLETE TURNKEY PROJECTS VALIDATIONS IQ, OQ
SINCE 1966
PHARMACEUTICAL WATER SYSTEMS
w w w . e l e t t r a c q u a . c o m
m
u
l
t
i
p
l
e
e
f
f
e
c
t
s
d
i
s
t
i
l
l
a
t
i
o
n
u
n
i
t
1
2
m
3
h

2 4 P h a r m a c e u t i c a l E n g i n e e r i n g
VALIDATIONThe validation of GCP systems and data has been described in the GA M P ® Good P ract ice Guide: Validat ion and Compliance of Computerized GCP Systems and Data [7]. In particular, the guide’s validation layer model (Figure 2) and the risk assessment and vali-dation guidance for tools that support GCP processes support a lean, e� cient validation approach for small- and medium-sized enterprises.
Layer ILayer I (quali� ed IT infrastructure, software, and services) estab-lishes the foundation for the validation of computerized systems. The small- or medium-sized enterprise needs to establish a lean set of processes that focuses on quali� cation of the relevant IT infra-structure, security and data protection, software development, and IT support services.
Qualifi cation of the relevant IT infrastructureQuali� cation of the IT infrastructure may include: u Servers for relevant software and data storage: Quali� cation
can be achieved by a set of templates that capture the relevant
data for hardware and the steps required to install operating systems and other software components (e.g., drivers, view-ers, frameworks).
u Systems that support the core business but do not hold or pro-cess clinical data: Examples include help desk systems, inci-dent management systems, and o� ce applications. Capturing the installation and con� guration details as well as the ver-sion(s) and release dates of the installed system is critical.
Generally, the need for IT infrastructure quali� cation is higher if the small- or medium-sized enterprise directly hosts systems that process or store regulated data. Enterprises that develop software that is implemented and operated on the customer’s premises may not need to qualify all of their infrastructure. In such organiza-tions, the qualification activities should focus on systems that directly support software development and testing of regulated software or important support services (e.g., a support hotline).
Security and data protectionThe following aspects of security and data protection need to be considered:
Figure 2: The validation layer model. (Reprinted from reference 7.)
FEATURE PROCESS VALIDATION

S e p t e m b e r / o c t o b e r 2 0 2 0 2 5
u Patch management (operating system, browser, applications) u Classi� cation of data (e.g., sensitive, con� dential, public, per-
sonal identi� able information) u Physical and logical security (e.g., virus protection, hardening
of systems, intrusion detection)
Obviously, some of these items (e.g., virus protection) are essential to protect the core business of the small- or medium-sized enter-prise as well as the client. The relevance of other items may depend on the type of services o� ered. For example, a software as a service (SaaS) provider typically needs to have an intrusion detection sys-tem and process in place, whereas a software provider whose soft-ware is installed and operated on the client’s premises often does not require this.
Software developmentAt minimum, software development validation concerns include: u Speci� cation u Development and testing u Deployment and release
For small- and medium-sized enterprises that develop software, this is an area of critical (quality) activities. First, validation is required to ensure that the software is working as designed and has no critical bugs. Second, documentation is essential to enable teams to organize their work during development. Third, a robust approach to software development and documen-tation enables the small- or medium-sized enterprise’s customers to build on that documentation and limit their validation efforts to verifying that the system is fit for the intended use and supports the business process, rather than verifying that a l l re qu i re d i nd iv idu a l f u nc t ion a l it ies a re work i n g a s designed. For this reason, a robust sof tware development approach and documentation can be a market di� erentiator for the vendor.
Table 1 describes the most important aspects to keep under control. These aspects need to be covered regardless of the devel-opment methodology and organizational setup (waterfall, agile, DevOps, etc.). Small- and medium-sized enterprises should try to build a robust end-to-end solution that is suitably integrated to allow team members to answer the key questions. A strong, doc-umented connection between requirements and testing is espe-cially important. To achieve this, the quality requirements and aspects should be considered—along with programing, develop-ment, and business needs—when a software development plat-form is selected and implemented.
IT support servicesGenerally, the following scenarios are relevant to layer I validation: u Service/help desk u Incident management u Disaster recovery/business continuity
These are very important concerns if the technology provider o� ers software products in infrastructure as a service (IaaS), plat-form as a service (PaaS), or SaaS. This type of offering often requires signi� cant investments in hardware, software, services, processes, and people to establish: u Service/help desk coverage u Backup and restore services u Incident management process and Incident tracking u Disaster recovery sites, plans, and exercises u Business continuity plans and exercises
For small- and medium-sized enterprises, it may be more cost-e� ective to outsource some of these activities to specialized third parties such as cloud service providers. However, the adequacy of these specialized third parties needs to be veri� ed via quali� cation activities such as audits or questionnaires.
Layer IILayer II (study reference architecture) of the validation layer model addresses the validation of computerized systems that sup-por t the processes to conduct a clinical trial. Small- and medium-sized enterprises that o� er services to support clinical trials need to establish a lean set of processes focused on imple-menting compliant systems that outline the generation of the required documentation and evidence and can also be easily adapted to each customer’s requirements. Customers often expect that the small- or medium-sized enterprise will follow the custom-er’s processes in the implementation and integration e� ort.
Generally, the following scenarios are of concern: u Systems that support clinical trials directly or as a central,
cross-study application: For example, clinical trial manage-ment systems (CTMS) that manage all trials in a central data-base often require signi� cant validation e� orts during their implementation because con� guration/customization and testing activities on a study-by-study basis are not done or are very limited. An analysis of the supported business process that considers business intent, patient safety, and data
Table 1: Aspects of software development to control.
Aspect Key Questions to Address
Requirements management Which requirement was implemented/released in which version?
Version management Which versions of the software are in development, released, and in use with support?
Test management How and when was the functionality tested?How can this be traced back to the requirements?
Release management When was a version of the software released/implemented?
Bug fi xing How and when have bugs been fi xed? How is bug fi xing integrated into the overall development and release processes?

2 6 P h a r m a c e u t i c a l E n g i n e e r i n g
integrity will reveal the critical steps, actions, and data. This analysis needs to be the nucleus of the risk-based validation focused on the identi� ed critical aspects. Small- and medium-sized enterprises that provide such technology solutions should have robust software development documentation that allows the elimination of functional testing on the cus-tomer side in this phase. The validation should focus on veri-fying that the con� guration of the system is supporting the business process of the customer as expected.
u Systems that provide a platform and need to be signi� cantly con� gured/customized to support individual clinical trials (e.g., EDC systems): Typically, such systems require a very limited validation approach focused on functionalities used across all clinical trials, and a significant risk (as outlined previously) is associated with these systems. In an EDC sys-tem, the functionality could be the general query functional-ity. See layer III for more details.
Layer IIIThe validated systems and platforms are then con� gured or cus-tomized in layer III to build the trial-speci� c solutions required. The small- and medium-sized enterprise needs to establish a lean set of processes that focus on e� ciently building these solutions, often based on customer requirements, in a compliant way.
Generally, the following scenarios are of concern: u Con� guration of systems for speci� c trials: As outlined previ-
ously, the con� guration e� orts may vary greatly depending on the type of system and/or the complexity of the study. Whereas a CTMS system may simply require a setup of the study through the user interface, an activity that, of course, does not require validation, the setup of an EDC system is signi� cantly more complex and requires programming-like skills. Additionally, data collected via the EDC systems are often directly related to the safety of the participants and the end points of the clinical trial. Most of the validation activi-ties need to be performed on a study-by-study basis to ensure the trial-speci� c needs—such as electronic case report form (eCRF) design and edit checks—are met. An analysis of the study processes and study protocol focused on patient safety and data integrity is required. Generally, it is advisable to organize such validations to enable a potential reuse of vali-dated elements, if possible. For example, eCRFs capturing demographic data tend to be very similar across studies, so it may be possible to reuse an existing, already validated eCRF. Small- and medium-sized enterprises that provide services to set up technology solutions for individual clinical trials should focus on identifying the critical data points for the study and ensuring thorough testing of con� gured function-alities that capture and/or process these data.
u Development of interfaces, reports, or data analysis programs based on existing platforms (e.g., business intelligence solu-tions or specialized development platforms): These items usually require fewer validation efforts because they are
based on quali� ed standard platforms. However, depending on the data that are processed or reported and the potential decisions that are made based on these data, a robust and signi� cant validation e� ort may be required. For example, interfaces and reports for EDC or safety data are often critical in nature and should be validated. Small- and medium-sized enterprises should achieve an in-depth understanding of the data, data � ows, and data usages. This will enable the enter-prise to focus the validation e� ort to the data elements that matter most.
u Building secure and robust data exchange platforms with clients and third parties: Data integrity can also be at risk when data are transmitted between multiple parties. Based on agreements reached between these parties, a secure plat-form should be established to exchange data. Any required validation activities must focus on access control and secu-rity. Small- and medium-sized enterprises that offer such platforms as technology solutions need to focus their e� ort in these areas.
Layer IVLayer IV (individual clinical study process) emphasizes that vali-dated systems must be used according to the applicable business processes for the execution of the clinical trial. The high-level processes are usually applicable for all clinical trials; however, the details may di� er greatly from one trial to another as study proto-cols di� er with regard to indication, trial design, end points, target populations, and inclusion criteria. Established systems and plat-forms continue to evolve and improve, but new technologies may be needed to meet individual trial requirements.
The relationship between the business process and the sup-porting technology is often ignored or underestimated in its importance. Small- and medium-sized enterprises should proac-tively reach out to clients and gain a robust understanding of their business processes. The better the processes are understood, the better they can be supported by an agile and nimble small- or medium-sized enterprise.
TRAININGTraining has the following objectives: u Sta� are aware of the relevant processes and can follow them. u Required competencies and skills are developed for the com-
pletion of tasks.The second objective may be achieved via external training or through hiring already fully qualified personnel, but the first objective always requires an internal training program.
All training must be planned for the relevant roles, and the applicable syllabus/training plans should be documented. The training assignments for processes should be in line with the scope or audience descriptions in the process documentation. Also, after training has taken place, documentation must be com-pleted and � led. To demonstrate compliance, organizations should be able to show:
FEATURE PROCESS VALIDATION

3800 Camp Creek Parkway • Building 2600 • Suite 120 Atlanta, GA 30331 • [email protected] • Tel: 678-553-3400
www.gemu.com
GEMÜ 567 BioStar®
Control Valve Designed to precisely control low flow rates of high purity fluids or gaseous media required in the pharmaceutical, biotech, health care, and food and beverage industries. • Manual,Pneumatic,and Electric actuation• Sizes1⁄2”- 1”• Linearorequal%flowcharacteristics• Cvrange.09to14.6gpm• Operatingpressures0-150psig, temperatures14°-320°F• FDAandUSPClassVIcompliance• 3ACertificationavailable
PhrmEng202009_gemu.indd 1 7/23/2020 5:22:54 PM

2 8 P h a r m a c e u t i c a l E n g i n e e r i n g
u Training transcripts for individuals (e.g., individual training logs)
u Who has completed speci� c training (e.g., attendance lists for training sessions)
Organizations need to able to demonstrate that all sta� have been trained in time for the roles they are to perform. This sounds sim-ple, but the details can be quite challenging as circumstances change. For example:
u Sta� may change roles or take on new responsibilities. u Sta� need to be retrained as processes evolve. u Enterprises de� ne new roles that require new training plans.
Very small enterprises may be able to manage training documen-tation with spreadsheets, but growing organizations may need a system to track trainings and processes. This system should describe: u Training plan creation, review, and maintenance
Table 2: Validation and quality approaches in larger and smaller enterprises.
Aspect Larger Enterprises Small- and Medium-Sized Enterprises
QMSExtensive QMS is required to cover all multiple GxP areas and a wide range of services and activities. The QMS is often implemented as a multilayer document hierarchy with complex relationships and references.
QMS focuses on the services and activities performed. It may be single-layered with a limited number of SOPs focused on the business at hand (e.g., software development, system operation). Stakeholder reviews are shortened or eliminated. A master SOP binder may be maintained, or fi nal documents may be stored in a protected area to which most employees have read-only access.
The bare minimum to be covered by the QMS includes:• QMS maintenance• CAPA• Audits• Training and qualifi cation (could include job descriptions)• Qualifi cation and validation of computerized systems
Management reviewManagement review is often described in an SOP with details on frequency, participants, data to be reviewed, and documentation requirements.
Management review can be informal in small companies with few employees/managers; it requires appropriate documentation such as meeting minutes.
Roles and responsibilities Problems with the segregation of duties are seldom encountered. Teams are often large, with very detailed division of responsibilities.
Maintaining the segregation of duties may be challenging because teams/departments may be very small. Segregation may be achieved by combining roles and responsibilities and very careful planning of resources and/or by outsourcing of certain tasks.
Job descriptionsDescriptions are often for very specialized roles but without details for specifi c products. These details are often included in project documentation.
Descriptions could be very detailed and eliminate the need for further specifi cation in project documentation. However, roles may be combined (e.g., the software developer may also have support responsibilities).
Risk management Risk management is often implemented hierarchically (e.g., moving from team/project risks to department risks, regional risks, and global risks).
A documented risk assessment and management approach on the team/project level may be su� cient.
Critical thinking Critical thinking needs to be continuously promoted and reinforced as employees of large companies may tend to just follow the rules.
Critical thinking is more predominant in smaller enterprises because every employee is more directly contributing to the success (or lack of success) of the company.
ToolsExtensive tool sets that are interfaced and provide quality metrics are often used. Typically, larger enterprises can a� ord “best of breed” system implementations.
It is recommended that smaller enterprises carefully select tools that support the business purpose as well as the quality aspects. Quality aspects should be part of the requirements (e.g., in software development tools). However, clever usage of functionalities provided by o� ce software utilizing automated exports of relevant data out of the business tool set can establish robust quality documentation.
Project management Large teams, which may be distributed globally, often require extensive planning and management. Typically, teams follow the QMS strictly.
Smaller teams are often self-managed and use agile approaches. Unless they are well trained, these teams may value working services and products over quality documentation.
Change controlChange control needs to focus on the implemented changes to the computerized system (infrastructure, software and confi guration, processes, training).
Change control needs to focus on version control and release of the software, including its validation/qualifi cation documentation.
Documentation approach Documentation is mostly electronic, in databases or electronic document management systems.
Documentation can be paper based or electronic. The paper-based approach may be more cost e� cient when teams are small and in a single location.
FEATURE PROCESS VALIDATION

S e p t e m b e r / o c t o b e r 2 0 2 0 2 9
u Assignment of training to individuals and control of timely training completion
u Documentation of training u Training of new hires (“onboarding”)
Whereas larger organizations may aim to become paperless in training documentation, small- and medium-sized enterprises may find it more cost effective to maintain paper records. Especially if the entire organization is in one location, generating paper records like sign-in sheets is easy and e� cient.
SUPPORTING DOCUMENTSThe creation and maintenance of curricula vitae (CVs) and job descriptions is important to support training as well as various human resources and business development activities.
From a quality and compliance perspective, an accurate CV is evidence of staff qualification to perform a regulated activity. Additionally, clients typically request CVs of important staff working on their projects.
Job descriptions help identify the right resource for a speci� c role or position. Job descriptions should include an explanation of the responsibilities and tasks, the minimum qualifications, required levels of education and experience, and the organizational details. The CV of the person performing a role should demonstrate
that they meet the job description requirements, or a justi� cation for the assigned individual should be documented. If the justi� ca-tion entails improving the competencies and skills of the assigned individual through training, a detailed training plan with timelines should be included.
CONCLUSIONThe regulatory expectations for computerized system validation do not di� erentiate between larger and smaller organizations. All organizations that support GxP-relevant processes have a respon-sibility to protect patient safety and data integrity. However, small- and medium-sized enterprises often have the advantage of � at hierarchies and personalized management, and the special-ized services that these enterprises provide should be considered in the design and evaluation of their QMS.
Small- and medium-sized enterprises need to have a clear understanding of the services they provide, the GxP-relevance of these services, and the applicable regulatory framework. This knowledge is essential for risk assessments focusing on data integrity and patient safety, the determination of appropriate controls and validation approaches, and the creation of proper documentation that can be used in audits and inspections. There is no regulatory expectation that small- and medium-sized enter-prises implement expensive tools and systems for quality-related

3 0 P h a r m a c e u t i c a l E n g i n e e r i n g
tasks, but all enterprises must follow validated processes and have adequate documentation to prove that the necessary controls are in place. In many cases, standard office software suites and/or trustworthy and reasonably priced cloud services can establish a robust QMS, if they are used correctly and embedded in the rele-vant processes. We cannot overstate the importance of risk assess-ment that is based on critical thinking, focuses on the business purpose, considers the organizational structure, and leads to e� ective controls.
Table 2 compares typical validation and quality approaches for larger and smaller enterprises but does not o� er one-size-� ts-all recommendations. Every organization needs to determine the appropriate approach by considering the nature or their services and products, the size and structure of their organization, the existing infrastructure and tool sets, and other factors. In some areas, potential customers will expect vendors to have QMS certi-� cation (e.g., ISO 9001). Such certi� cation may require the enter-prise to implement additional activities and controls.
There is a clear regulatory expectation that the sponsor can make evidence supporting validation available to inspectors. Given this expectation, the enterprise providing services may need to hand over copies of key validation documents to the spon-sor during the initial system implementation or during later updates/upgrades. Depending on the nature of the outsourced services, robust contractual agreements with well-de� ned roles and responsibilities, a robust supplier assessment, and a quality agreement may suffice to establish regulatory compliance. However, if signi� cant parts of the system implementation and validation are executed by the supplier, the contracts and quality agreements should include aspects of inspection support as required to provide additional supplier-generated documentation or explanation of the supplier’s QMS that generated evidence and documents. Sponsors may not get approval of marketing authori-zation applications if the supporting data originate from a system that has not been adequately validated; therefore, a robust QMS that generates reliable validation evidence must be considered business critical.
FEATURE
References
1. International Society for Pharmaceutical Engineering. GAMP® 5 Guide: A Risk-Based Approach to Compliant GxP Computerized Systems. North Bethesda, MD: International Society for Pharmaceutical Engineering, 2008.
2. Medtech Europe. “The European Medical Technology Industry—in Figures.” 2017. https://www.medtecheurope.org/wp-content/uploads/2017/01/MedTech_FactsFigures2016_20160105.pdf
3. Schönberger, M., and T. Vasiljeva. “Towards Computer System Validation: An Overview and Evaluation of Existing Procedures.” Journal of Innovation Management in Small and Medium Enterprises 2018 (2018): 512744. doi:10.5171/2018.512744
4. European Medicines Agency. “Notice to Sponsors on Validation and Qualifi cation of Computerised Systems Used in Clinical Trials” 7 April 2020. https://www.ema.europa.eu/en/documents/regulatory-procedural-guideline/notice-sponsors-validation-qualifi cation-computerised-systems-used-clinical-trials_en.pdf
5. Welsh, J. A., and J. F. White. “A Small Business Is Not a Little Big Business.” Harvard Business Review 59, no. 4 (1981): 18–27. https://hbr.org/1981/07/a-small-business-is-not-a-little-big-business
6. European Medicines Agency, Committee on Human Medicinal Products. “Guideline for Good Clinical Practice E6(R2) Step 5.” 1 December 2016. https://www.ema.europa.eu/en/ich-e6-r2-good-clinical-practice
7. International Society for Pharmaceutical Engineering. GAMP® Good Practice Guide: Validation and Compliance of Computerized GCP Systems and Data (Good eClinical Practice). North Bethesda, MD: International Society for Pharmaceutical Engineering, 2007.
About the authors
Frank Henrichmann, Senior Executive Consultant at Q-FINITY Quality Management, is an expert in quality management, computer system validation, and compliance, especially in the context of clinical trials and pharmacovigilance. Over the last 20 years, he has gained extensive experience in strategies, projects, and measures for GxP-regulated environments at a CRO as well as a major pharmaceutical company. In his current position, he helps life sciences companies and supports technology providers to fi nd innovative answers to quality and validation challenges. Frank
has been a member of the Clinical Systems Special Interest Group (SIG) and is a coauthor of the GAMP® Good Practice Guide: Validation and Compliance of Computerized GCP Systems and Data. A member of the GAMP® Editorial Board, he has been an ISPE member since 2001.
Oliver Herrmann, Founder, CEO, and Senior Executive Consultant at Q-FINITY Quality Management, is an expert in quality management, computer system validation, data integrity, and compliance. In 2004, Oliver founded Q-FINITY to combine process management with the requirements for validation of computerized systems. Over the last 16 years he has gained extensive experience in planning, development, execution, documentation, and auditing of strategies, projects, and measures for GxP-regulated environments. He has supported projects with the focus on chromatography LIMS, PCS, and MES through ERP, pharmacovigilance, EDC, effi cacy, DMS,
and more. Oliver has been a Co-lead of the GAMP® SIG for the validation of clinical systems and is a coauthor of the GAMP® Good Practice Guide on Clinical Systems. Oliver is Co-chair of the GAMP® D/A/CH Steering Committee as well as a member of the ISPE GAMP® EU and Global Steering Committee. He has been an ISPE member since 2005.
Small- and medium-sized enterprises often have the advantage of fl at hierarchies and personalized management.
PROCESS VALIDATION

Single Use Transfer Solutions Providing purity & performance for your products
Transfer powder ingredients economically, with a single use solution that delivers outstanding containment and sterility assurance performance.
www.thechargepoint.com

3 2 P h a r m a c e u t i c a l E n g i n e e r i n g
FEATURE AFFIL IATE PROFILE
ISPE France Affi liate:
LONG-TIME AFFILIATE CONTINUES TO SHINEBy Mike McGrath
The ISPE France Affi liate is fortunate in many ways. The pharmaceutical industry in France is world class, employing close to 100,000 people and generating €55.9 billion in annual revenue [1]. The Affi liate’s membership runs the gamut from students and Young Professionals (YPs) to industry veterans with expertise in research and development, engineering, manufacturing, and regulatory guidelines. Additionally, the France Affi liate has a strong, dedicated leadership team and a well-established President, Jean-François Duliere.
Since he � rst joined the France A� liate in 2002, Duliere has been an active member of ISPE, serving on multiple local and international committees. During his long career as a produc-tion manager in pharmaceutical manufacturing, he worked
in quality control, oral solid dosage form manufacturing, packag-ing, raw materials production from bacteria growth, industrial development, and dual-compartment syringe aseptic � lling and as a consultant for an engineering company involved in many phar-maceutical projects around the world. Now 68, Duliere recently retired from his day-to-day job, but he continues to serve as the France A� liate President, a position he has held since 2012. In April 2020, he was appointed ISPE’s European Regulatory Advisor.
KNOWLEDGE SHARING AND NETWORKINGCreated in 1992 and established as a legal association in 2001, the France A� liate is one of ISPE’s older European A� liates. It pri-marily communicates with members in French and counts several French-speaking participants from neighboring Belgium and Switzerland among its 220 members.
“We try to hold our events in French,” said Duliere. “But when we have speakers from outside of France, our materials and pres-entations are in English. And while our work group meetings are in French, the groups produce written materials in English for publications such as Pharmaceutical Engineering®.”
Most A� liate members work and reside close to France’s larg-est cities, Paris and Lyon. The A� liate’s events are therefore cen-tered around those two cities.
Duliere said the A� liate strives to hold at least four events per year, typically in March, June, September, and November. The September event, he explained, is organized with Lyon University and held on the � rst day of the school year. Around 150 students come to see 30 industry professionals present on topics relevant to student interests, he said.
The other three events cover speci� c topics, such as GAMP®, computer systems, or serialization, and typically attract 30 to 40 attendees. “Through these events we try to grow the membership, but the main objectives are to share knowledge and have network-ing opportunities,” said Duliere. These one-day events include presentations on the topic of the day followed by a workshop ses-sion where attendees are divided into groups to discuss the topic and share their experiences.
Given the ongoing COVID-19 pandemic con� nement and physi-cal distancing measures, the France A� liate, like others around the world, has had to adjust its 2020 event calendar. The A� liate post-poned some 2020 events and converted others to virtual meetings. Fortunately, the Affiliate already had experience with virtual meetings, as many of its committee meetings are held that way.
COMMITTEESIn 2006, the A� liate initiated the GAMP® Francophone Community of Practice (CoP), a group working on subjects related to IT systems and guidance. “Our GAMP® CoP is made up of a mix of experts and

From R & D to process development and scale-up, analytics and process control play a critical role in pharmaceuti-cal yield and quality.
This new guide from METTLER TOLEDO covers critical bioreactor analytics, and how to implement them in tradition-al bioreactors, and single-use bioreactors and bags.
The guide covers the key analytical parameters of:• pH & ORP• Dissolved Oxygen• Dissolved Carbon Dioxide• Optical Density
The Benchmark in Process AnalyticsFor Traditional & Single-Use Bioreactors
Download your free copy today www.mt.com/bioreactor-guide-ISPE
Advertisment_Full Page_Pharmaceutical Engineering Magazine_Bioreactor_Competence_8.125 x 10.75 inch_2020_LR_.indd 2 22.07.20 15:57

3 4 P h a r m a c e u t i c a l E n g i n e e r i n g
others with less experience who have come to be trained. In the last few years, they have been discussing topics like economic concerns, data centers, and agile methods,” said Duliere.
The GAMP® CoP meets virtually every two months and usually holds two or three in-person workshops per year on current topics of interest.
In 2017, the A� liate created a committee to address the impact of serialization on the organization of the supply chain and information systems. “For three years, the group published articles on best practices for serialization,” said Duliere. “However, following trends in European regulations and FDA documentation, this group shifted last year to focus on the consequences of the implementation of unique device identifiers (UDIs) for medical devices.”
The UDI committee meets virtually each month and face to face once or twice annually. “They hope to publish an article in Pharmaceutical Engineering® when they have � nished their work,” Duliere said. The plan was to complete the UDI project in 2021, but Duliere now anticipates that the work will wrap up in 2022.
CHALLENGES AND OPPORTUNITIESAlthough the France Affiliate is running smoothly, Duliere acknowledges it faces some challenges, including member partici-pation. “Members are not always involved in the life of the A� liate, so we push to get them to attend our events,” he said. “More and more facilities in France belong to contract manufacturing organ-izations, and this is a challenge because, in many of these compa-nies, the people are often not allowed to travel to go to such events.”
With that and other challenges in mind, Duliere welcomes opportunities to partner with other A� liates. He participates in virtual meetings with other European A� liates every two months, and the Affiliates get together in person each year at the ISPE Europe Conference and ISPE Annual Meeting. “We are sharing best practices, what is working in each of our Affiliates, which topics to address at conferences, and developing a strategy for Europe for the future.”
Duliere also pointed out the A� liate’s commitment to students and YPs. In addition to the annual event at Lyon University, A� liate board members participate in training sessions at pharmaceutical universities in Dijon, Lyon, and Paris, and the A� liate has board members designated to the needs and activities of YPs.
Quick facts about the ISPE France A� liateFounded: 1992 | Region: France | Membership: 220 O� cers u President: Jean-François Duliere u Vice President: Philippe Lenglet , Servier
Laboratories u Treasurer: Philippe Robin u Vice Treasurer: Cedric Lambert, Lourd’Innov u Secretary: Michel Raschas, PROGMP SAS u Vice Secretary: Marick Paris-Cadet, TechnipFMC u Young Professionals Chair: Alexandra Yath,
TechnipFMC u Young Professionals Secretary: Ernstley Derisma,
Curium Pharma u Communication: Olivier Mary, COLCA Medical and
Scientifi c u Membership: Véronique Manigaut, Ekium, and
Jean-Michel Blanc, Actemium Saint-Etienne u Directors: Alain Cruset; Philippe Lenglet, Servier
Monde; Jean-Pierre Jacquemier; Jérôme Keldenich, Immunic AG; Yves Samson, Kereon AG; Agnes Trouchaud, GSK
Call forArticles
Pharmaceutical Engineering® magazine presents valuable
information on scientific and technical developments, practical-application articles, case studies, and the global
regulatory landscape.
We are always looking for quality articles, and welcome new
submissions. Our editorial team will work with you to refine your draft.
For more information and instructions, please consult https://ispe.org/pharmaceutical-engineering/about/submit-article.
Reference1. LEEM. “French Pharmaceutical Industry—Key Data 2019.” Accessed 9 July 2020. https://
www.leem.org/sites/default/fi les/2019-09/BilanEco-GB-V2_7.pdf
About the authorMike McGrath is a freelance writer and corporate communications consultant. For the past 15 years, he has helped organizations in the aerospace, transportation, telecommunications, and pharmaceutical industries develop their digital and print communications strategies. He has been a regular contributor to Pharmaceutical Engineering since 2015.
FEATURE AFFIL IATE PROFILE

2020ANNUAL MEETING & EXPODriving the Future of Pharma
Take A Front Row Seat For This Reimagined Virtual Conference
Join us for a virtual experience that delivers all of the comprehensive learning opportunities of our in-person Annual Meeting to you anywhere in the world with access to 40+ technical sessions and discussions including:
Global Regulatory Town Hall• ICH Q12 and the Impact of a
Pandemic on Harmonization and Convergence
Innovation Forum• Digital Twin: End-To-End
Performance and Compliance
Supply Chain, Operations, and Packaging
• Improving Vaccine Delivery to the Developing World
• Time is of the Essence: Rapid Biological Facility Development to High Speed Vaccine Fill Finish
Information Systems• Truth and Lies of Innovative
Technologies and Pharma 4.0
Process Development and Manufacturing
• Roads for CAR-T: Strategies for Cell Based ATMPs
• Manufacture of High Potent Products in Shared Facilities
Facilities and Equipment• Designing for the Future: Using
Technology for Broad Spectrum Compliance and Functionality
• Electronic Validation Implementation
Quality Systems and Regulatory• Worldwide State of Quality: Findings
from Assessing 1000+ Sites
Register Today at ISPE.org/AM20 for 12-month access to all presentations!
Virtual Conference 2-6 November

3 6 P h a r m a c e u t i c a l E n g i n e e r i n g
The 2020 ISPE Annual Meeting & Expo will be ISPE’s fi rst completely virtual Annual Meeting. As always, there will be great learning and networking opportunities—in fact, the digital format off ers greater fl exibility for attendees.
The 2020 ISPE Annual Meeting & Expo will focus on steering the future of pharmaceutical science and manufacturing toward a more global, synchronized, and quality-driven industry. This signature event draws pharmaceutical and
biopharmaceutical professionals at all levels of the industry, from Young Professionals to the most senior executives in drug manu-facturing, supply chain, devices and equipment and services, and global regulatory agencies.
The theme for the Annual Meeting, “Driving the Future of Pharma,” is especially appropriate in these times of tremendous challenge and change to the industry. The conference will take place over � ve days, from 2 to 6 November, maximizing partici-pants’ opportunities to attend the 41 education sessions featuring over 160 speakers in six tracks. In addition, the Annual Meeting will feature one plenary session, one global regulatory town hall, two FOYA sessions, and � ve postconference workshops, for a total of more than 75 hours of content.
The Annual Meeting will also include the new ISPE Partner Showcase, a platform providing access to a virtual exhibitor mar-ketplace so you can � lter, search, and browse the vendors serving the industry. You will be able to note your favorites among the exhibitors, and can reach out through the platform for appoint-ment scheduling and live chats to learn more information.
Pharmaceutical Engineering® spoke with Jennifer Lauria Clark, Executive Director, Strategic Development, CAI, and 2020 ISPE Annual Meeting & Expo Conference Committee Chair, to hear her insights about the sessions and other conference experiences that you will not want to miss, and how this year’s Annual Meeting will be di� erent—and yet the same—as past meetings.
The theme of the 2020 ISPE Annual Meeting & Expo is “Driving the Future of Pharma.” Why is this theme of such great importance right now? What knowledge will attendees take away related to this theme that will help them in their day to day work? The Annual Meeting Planning Committee along with the ISPE sta� was thoughtful in choosing our theme for the 2020 ISPE Annual Meeting & Expo. We discussed the importance of speed to market, cell and gene therapy, Pharma 4.0™, supply chain challenges, and the evolution of medications—all while maintaining compliance and meeting all global regulatory guidances. Little did we know the world would be literally laser-focused on many of our companies today due to the pandemic that has swept the globe! The time is now to participate in the 2020 ISPE Annual Meeting & Expo to learn more about what is happening around us, so you do not get left behind as we evolve together—quickly—in our current climate.
Educational topics will focus on subjects including advanced technologies, which we need now more than ever before to help us work together in delivering what may be the most important vac-cine to reach the market. Decisions made by ISPE members who are leaders in the industry today will literally impact global eco-nomic and health for many years to come.
The focus on “Driving the Future of Pharma” allows attendees to participate in education and open discussions around:
SPECIAL SECTION 2020 ISPE ANNUAL MEETING & E XPO
2020 ISPE Annual Meeting & Expo:
DRIVING THE FUTURE OF PHARMABy Susan Sandler

S e p t e m b e r / O C T O B E R 2 0 2 0 3 7
u Implications to current supply chain issues
u Fast-tracking molecules and medications to get patients the help they need faster
u The drive to modernize and transform our global industry
u Young Professionals u Women in Pharma®
Alongside all the current challenges facing our industry, ISPE is leading the way to drive change and transform the way industry thinks about diversity, Women in Pharma®, Young Professionals, and this is truly shaping the next workforce of the future. The Annual Meeting is ISPE’s largest event of the year, with more than 40 educational sessions and many oppor-tunities for attendees to interact with global industry and regulatory experts and opinion leaders. It’s a chance to learn about the current industry, technology, and regulatory trends and best practices so attendees can apply those learnings in their own companies. It’s also a chance to interact with a wide variety of vendors and build a network of industry contacts and colleagues.
By going to a virtual platform for this year’s Annual Meeting & Expo, we are a� orded a bit more time to absorb the networking and educational aspects of the meeting.
The 2020 Annual Meeting will be virtual. Why will this be a great experience for attendees?Evolution is essential in our business. Whether it is adapting to our new virtual technology by attending an education dis-cussion of significant drivers of change related to supply chain, regulatory, or manufacturing issues, or learning how to video conference for the first time, the 2020 ISPE Annual Meeting & Expo has you covered.
By moving to a virtual platform, we have opened many new ways for more of our members to engage with and have access to fellow members and new ideas. All sessions are open to all attendees and will be recorded. We have also scheduled all committee meetings outside of the education sessions. In this way, you will not face competing sessions and committee meetings in the same time slots.
This schedule design gives each of us the f lexibility to hear the relevant and timely information from all the ses-sions, on our own time. If you have a meeting come up half-way through a session, you will not have to miss any valuable content. Each attendee will be able to build their own itiner-ary and be alerted when their sessions are coming up in their tracks that best suit their current role and future desires, without having to run across a conference center to grab a seat for the next session.
www.tecninox.it | Tecninox Group
WITH PASSIONWe Listen We Design We Create
Customer-oriented turn-key solutions for process and treatment of pure fluids
systems.
C
M
Y
CM
MY
CY
CMY
K
ADV_PE_edSeptember.pdf 1 16/07/2020 10:42:47
Jennifer Lauria Clark

3 8 P h a r m a c e u t i c a l E n g i n e e r i n g
We have over 160 speakers this year presenting on topics that include supply chain issues, facilities and workforce of the future, quality, and regulatory deep dives.
The ISPE Annual Meeting brings together both new members and more seasoned industry experts. How can both new and expert members make the most of the opportunity to interact at the Annual Meeting? Having a blend of seasoned and new members is always a great way for new ideas and relationships to � ourish. This year will be a little different with the virtual platform, but there are still plenty of ways to virtually network. There will be 24 hours of Women in Pharma® activities the week before the educational sessions. Communities of Practice (CoPs) and international committees that help the Society grow will also be meeting at times scheduled out-side of educational sessions. This provides the opportunity to attend and participate, and also gives you the time to attend as many educational meetings as you would like.
If you have not joined a CoP yet, this is a great time to network and learn something new. If you are an expert, it is our responsibil-ity to give back to the industry and help those who are interested in our � elds to become stronger than us. Please join a CoP and help respond to questions and challenges our members are facing.
If you are interested in volunteering, this is an excellent time to get involved in ISPE. You will become familiar with a group of people who not only will appreciate your technical talents but also will get to know you and network with you. Growing our member-ship and maintaining strong ties is more important now than it ever has been with the current economic and remote working cli-mate for many of us.
There are also networking events tied to the educational ses-sions themselves. There will be time to ask questions, meet the speakers, and enjoy a drink (at your home) with fellow colleagues after a great day of training.
By having a blend of entry-level, college-level, and seasoned folks, the conference is more diverse, stronger in its messaging, and can be thoughtfully discussed with the group.
I challenge each attendee to participate in at least one net-working event associated with the 2020 ISPE Annual Meeting. Join the Virtual 5K hosted by the ISPE Foundation, a CoP meeting, or one of the Women in Pharma® events.
You never know whose life you are going to in� uence when you take a few minutes to meet someone new and share something about your career or your life. My husband and I were at an ISPE
CaSA networking event almost 10 years ago and one conversation with a fellow member whom we had just met empowered us to say yes to a new job in a new location for my husband. It was scary to think about moving away from our family to a new state alone, but because of a single veteran ISPE member sharing their story with us, we took the leap. We were very grateful for the advice and time this person took to speak with us, and we had no idea we would get a call the next day with this great job opportunity.
What are you most looking forward to hearing about/learning more about at the Annual Meeting?The keynotes and plenary session are always my favorite parts of the Annual Meeting. I love people and reconnecting with them just before the plenary, and feeling all the energy in the room always sets the stage for a great meeting.
This year will be a little di� erent as we have gone virtual, but if you get online, text a few friends who are watching with you, and listen to the speakers, you will be able to feel some of the same energy we feel in person.
By listening to the plenary session, we get a chance to re� ect on a year of discovery, challenges, and successes with our colleagues. We get to hear fresh perspectives from industry experts leading the way for better patient care.
Everyone has a speci� c reason to attend the 2020 ISPE Annual Meeting & Expo. Please take the time to custom-build your itiner-ary in the virtual platform. You will be able to set your schedule and note which items you will want to come back to at a later time and listen to after the conference. The � exibility of a virtual con-ference allows you to access content anytime during the confer-ence and for 12 months after.
While some of our traditional events are not able to happen this year, we are creating new traditions with a virtual platform and anticipate global engagement and access for all members. I look forward to sharing a new experience with you in November.
What else do members need to know about the Annual Meeting?Over the last three decades in our industry, over 100 companies have consolidated to about 30. Through mergers, acquisitions, leadership changes, and evolution, someone was driving the changes to make a better future for patients.
This year, ISPE is giving you the chance to participate in more educational sessions and net working than ever. We encourage everyone to visit the Exhibit Hall, now renamed the
SPECIAL SECTION 2020 ISPE ANNUAL MEETING & E XPO
The program, registration information, and more are at ispe.org/conferences/2020-annual-meeting-expo
Learn more at ISPE.org/FOYA
Does your facility have what it takes to be a 2021 FOYA Category Winner? 2021 Submissions are due 20 November 2020.
For the First Time Ever!You’re invited to in us at the complimentary Facility of the Year Awards (FOYA) Education Sessions and Virtual Banquet taking place online on Tuesday, 3 November 2020 during the 2020 ISPE Annual Meeting & Expo.
Don’t miss this opportunity to hear from the Category Winners themselves as they are recognized for their innovation and creativity in pharma and biotech facility design, construction, and operation.
Find out the latest information on the 2020 ISPE Annual Meeting & Expo:

Partner Showcase, and see the new ideas and technology from our top-notch exhibitors or just stop in to say hello. I know we are all in much need of one-to-one contact with familiar faces these days, so be sure to add some of these conference events to your itinerary.
As the 2020 ISPE Annual Meeting & Expo Chair, I want to thank each and every one of the people who are attending and helping produce this conference. Moving to virtual while main-taining the integrity of the conference is the best solution for our membership. We welcome your feedback during and after the conference; we are all learning how to navigate our new normal, and your feedback is crucial to make sure we are meeting the needs of our members through content, networking, and access to the latest technologies and information.
As ISPE members, it is a benefit to lead change through our organizational involvement. As members of our industry, it is our responsibility every day to help drive the future of pharma.
Vital Statistics: 2020 ISPE Annual Meeting & ExpoWhen: 2—6 November
Where: Virtual conference
Number of education sessions: 41
Number of speakers: Over 160
Number of postconference workshops: 5
Other highlights: Plenary Session, Global Regulatory Town Hall, 2 FOYA Sessions
Education tracks: u Facilities & Equipment u Information Systems u Innovation Forum u Process Development & Manufacturing u Quality Systems & Regulatory u Supply Chain, Operations, & Packaging
For more information: ispe.org/conferences/2020-annual-meeting-expo
Learn more at ISPE.org/FOYA
Does your facility have what it takes to be a 2021 FOYA Category Winner? 2021 Submissions are due 20 November 2020.
For the First Time Ever!You’re invited to in us at the complimentary Facility of the Year Awards (FOYA) Education Sessions and Virtual Banquet taking place online on Tuesday, 3 November 2020 during the 2020 ISPE Annual Meeting & Expo.
Don’t miss this opportunity to hear from the Category Winners themselves as they are recognized for their innovation and creativity in pharma and biotech facility design, construction, and operation.
About the authorSusan Sandler is the Senior Director, Editorial, for ISPE.

4 0 P h a r m a c e u t i c a l E n g i n e e r i n g
SPECIAL SECTION 2020 ISPE ANNUAL MEETING & E XPO
FOYA Category Winners and Honorable Mentions for 2020:
EXAMPLES OF EXCELLENCE By Marcy Sanford
Each year, ISPE celebrates innovations and advances in pharmaceutical manufacturing technology with its Facility of the Year Awards (FOYA) program. This year, we added a new category, Social Impact, to recognize companies that developed new standards and practices to prevent drug shortages and increase patients’ access to medicine, designed new tools or techniques that reduced the cost of drug products, or accelerated a shift to sustainable facility design that has signifi cantly reduced environmental impact.
The 2020 FOYA winners include well-known names in the pharmaceutical world as well as a relatively new company. All award recipients and honorable mentions share the same dedication to serving patients worldwide.
EQUIPMENT INNOVATION: F. HOFFMAN-LA ROCHE LTD.A Researcher’s Dream Come TrueIn most countries, it is a legal requirement that any new human medication be tested on animals. However, animal facilities are usually housed in the basement and not typically talked about or lauded. With their new in vivo facility in Basel, Switzerland, F. Hoffmann-La Roche has successfully reinvented animal research laboratories. Thanks to a team dedicated to exploring new ways to improve the status quo, Roche was able to discover clever and unorthodox solutions to common issues found at in vivo facilities and created a technological masterpiece that sets a gold standard for future laboratories.
To build a new facility, Roche had to demolish an existing building on their site and extend the pit. Before the new facility, Building (B098), was constructed, animal husbandry was split over various buildings of the Basel site, some of the infrastructure was outdated, and productivity and e� ciency were not optimal. Roche found a way to allow natural light into the laboratory with-out a� ecting animals’ physiological rhythm. Intelligent ventila-tion and fully automated cage handling outside the barrier zones reduce researchers’ exposure to allergens and physical strain. All
You can learn more about this year’s winners at the FOYA Virtual Education Sessions on Tuesday, 3 November, during the 2020 ISPE Annual Meeting & Expo. Each company will give a 15-minute presentation about the challenges and successes of their project. For more information or to register, visit ispe.org/foya

28 September–1 October 2020Pharmaceutical Water
Systems (T35)
29 September–1 October 2020Process Validation (T46)
1–2 October 2020Auditing for GMPs (G07)
5–6 October 2020Science and Risk-Based
Commissioning & Qualification (T40)
12–13 October 2020GAMP Data Integrity (T50)
13, 15, 20, 22 October 2020Combination Products (T47)
13–16 October 2020Aseptic Processing (T63)
19–20 October 2020GAMP Data Integrity (T50)
20–23 October 2020Clean in Place Fundamentals (T03)
26–27 October 2020First Principles (T60)
28–29 October 2020Basic GAMP® 5 Annex 11/
Part 11 (T45)
29–30 October 2020Science and Risk-Based
Commissioning & Qualification (T40)
9–10 November 2020Water Generation (T04)
10–11 November 2020Basic GAMP® 5 Annex 11/
Part 11 (T45)
16–17 November 2020Water Storage (T23)
18–19 November 2020GAMP® 5 Process Control
Systems (T21)
19–20 November 2020Biopharmaceutical Overview (T24)
23–24 November 2020Cross Contamination
(Risk-MaPP) (T41)
1–4 December 2020Clean in Place Fundamentals (T03)
1–2 December 2020Project Management (T26)
3–4 December 2020Auditing for GMPs (G07)
Explore all of ISPE’s Training options at ISPE.org/training
Get Real-Time, Instructor-Led, Interactive Training From Anywhere!ISPE Online Live Training: Powerful. Interactive. Convenient.
ConnectingPharmaceuticalKnowledge
Focused Pharma Training With First-Hand Guidancefrom the industry’s trusted
source of knowledge
Email us at: [email protected]

4 2 P h a r m a c e u t i c a l E n g i n e e r i n g
study and animal housing rooms have a modular structure and can be recon� gured from a small study room with anteroom into a large animal housing unit (or any type of room in between); these recon� gurations can be achieved within just two to three weeks, almost silently, and without disturbing adjacent areas. Roche completely redesigned automation and robotics for the building and merged third-party IT products with Roche-speci� c IT solu-tions to develop the Roche In Vivo Building IT System—setting new pioneering technological standards.
“The project demanded intensive collaboration and problem-solving skills from everyone involved,” said Christof Specht, Roche Project Manager “Our employees have told us that B098 is an in vivo researcher’s dream come true, even beyond imagina-tion. Roche is proud to be leading a new era of novel therapeutic modalities.”
FACILITY INTEGRATION: PFIZER INC.New Standard for Physical, Operational, and Intellectual IntegrationThanks to careful planning and astute attention to detail, P� zer’s new Andover Clinical Manufacturing Facility (ACMF), built on their master-planned 70-acre Andover, Massachusetts, campus, looks as if was always meant to be there. P� zer relocated existing manufacturing capabilities from Chesterfield, Missouri, to the new facility, which allowed them to integrate research and devel-opment (R&D) and expand biological products from 14 campaigns to a future maximum capacity of 21.
P� zer was able to add the 175,000-square-foot clinical manu-facturing facility to their Andover site without growing their car-bon footprint. They did not have to add any new core utilities, support systems, or amenities to bring the facility online. The � ve-story building houses � ve independent manufacturing suites dedicated to the development of new biotherapeutics and vaccines to support trials in disease areas such as oncology, rare diseases, infectious diseases, hemophilia, and rheumatoid arthritis. Each suite operates completely independently of the others, and all � ve can operate simultaneously.
The ACMF runs both microbial and mammalian processes and deploys both single-use plastic and stainless steel technologies. Each suite can be reconfigured to handle complex steps such as
refold reactions and homogenization. Technology innovations include wireless tracking for equipment. Additionally, P� zer has developed a space where R&D, clinical manufacturing, and com-mercial manufacturing professionals work together to share their knowledge and expertise.
“A project like this is really months of preparation for the day you will go live—the day you become a productive contributor to human health and wellness, and to P� zer’s mission,” said Lauren Gomes, Director, Clinical Manufacturing, P� zer. “As of June 2020, all suites within the facility are fully operational. The � exibility of the facility and the ensuing relationships with collaborating teams have enabled us to complete technology transfer of complex processes within two months. One of our upcoming projects will be producing a drug substance for pandemic supply of the COVID-19 mRNA vaccine.”
FACILITY OF THE FUTURE: SANOFIFacility Flexibility Reaps RewardsSano� is a pioneer in continuous biologics processing and has sev-eral rare-disease enzyme replacement therapies that are produced using large-scale perfusion reactors and novel cell separation tech-nologies. For its digitally enabled integrated continuous biomanu-facturing facility in Framingham, Massachusetts, Sanofi used a wide range of cutting-edge manufacturing technologies to develop an e� cient, � exible, and sustainable manufacturing platform. One of the most significant aspects of their design is the commercial implementation of integrated continuous biomanufacturing (ICB),
“ The project demanded intensive collaboration and problem-solving skills.”
SPECIAL SECTION 2020 ISPE ANNUAL MEETING & E XPO

S e p t e m b e r / O C T O B E R 2 0 2 0 4 3
which made it possible for them to adopt a modernized perfusion-based cell culture process where smaller, single-use technologies replace traditional large-scale stainless steel reactors and capture equipment.
Ultimately, the ICB process results in improved product quality and consistency, increased process robustness, the generation of massive process data analytics with 770 million data points sam-pled each day, and reductions in the facility’s processing footprint, raw material usage, and energy consumption. Sano� developed new and innovative ways to use single-use technologies, many of which had never been commercially implemented. The facility was designed for f lexible operations, rapid changeovers, and multiproduct operations. Sanofi created a digitally integrated, paperless ecosystem, and the facility is equipped with large touch-screen displays that help maintenance and operations sta� accom-plish their daily activities.
“The facility includes many of the traditional concepts of � exi-ble facility design, including single-use technology and � exible ‘ballroom’ designs, accommodating a wide variety of equipment design and scale. Utilizing digital technologies enhances the � ex-ibility of the facility, enables reconfiguration in response to changes in produce demand, and creates a shop � oor experience that is intuitive to the operator. We believe that we have pushed these concepts to new levels with our novel processes, deployment of technology, and digital integration,” said Navin Tiwari, Head of Digital Shop Floor and Automation for Sano� .
OPERATIONAL EXCELLENCE: ELI LILLY AND COMPANYImproving the Drug Discovery ProcessAs a global healthcare leader, Eli Lilly and Company strives to dis-cover and bring life-changing medicines to those who need them. In support of this mission, Lilly spent several years examining the traditional, industry-accepted belief that drug development is a drawn-out, time-consuming process characterized by complex challenges and long delays, and set out to determine what facility factors could help improve the pharmaceutical development process. They analyzed many of the basic assumptions of the development process and, as a result, implemented leading-edge improvements throughout their new facility, the Innovation Development Center.
Located at the center of Lilly’s Indianapolis, Indiana, campus, the new center brings modeling, analytical, and formulation scientists together with organic chemists and engineers in a collaboration-centric workspace and enables Lilly to e� ectively accelerate traditional time scales—reducing the development time from years to mere months. One of the most common delays development teams face is the need to recon� gure a laboratory to support a new approach. Sometimes, the progress of the candidate compound is put on hold while the team works to design a new lab, which then has to be constructed before the development process can continue. Lilly’s Innovation Center was designed to allow researchers to transform their laboratory to support new or revised processes in a matter of days. As with the laboratories, the work spaces were designed to be � exible and easy to con� gure based on the users and their needs. There are no assigned work spaces at the Innovation Center; employees can work wherever is best suited for their current activities. Teams are able to organically formulate project groups on a day-to-day basis in areas that match and sup-port what is happening in the lab.
“Since we moved to the Innovation Center, we have seen time and time again how it has allowed colleagues across multiple functions to co-locate and interact directly with each other, ulti-mately helping to further accelerate development of our new medicines. It truly is a very special place to work,’’ said Sarah O’Keeffe, Lilly’s Vice President of Small Molecule Design and Development.
PROCESS INNOVATION: JANSSEN PHARMACEUTICALS, BELGIUM CAMPUSChanging Strategy to Change the Future of Drug DeliveryUntil recently, Janssen Pharmaceuticals developed and manufac-tured all tablet formulations in a multipurpose batch facility. However, as the company formulated a mission that focused on making the patient the center of all decisions, improving quality, reliability, and control, and reducing development and scale-up cycle times, they found that the batch platform did not support their vision. Janssen decided they had to completely change strat-egy to support their new mission and embarked upon an end-to-end (E2E) strateg y that included investing in continuous

4 4 P h a r m a c e u t i c a l E n g i n e e r i n g
manufacturing (CM) as their preferred technology platform for all future oral solid dosage formulations. To support their new E2E strategy and commitment to CM, Janssen designed, installed, and quali� ed a new CM line, Mirror 1, at their drug product pilot plant in Beerse, Belgium.
Mirror-1 will be used to support all development and clinical manufacturing activities, and an identical CM line, Mirror-2, is under construction at Janssen’s commercial site in Latina, Italy. Since Janssen planned from the beginning to build an exact copy of Mirror-1 at a different location, they had to consider the requirements and limitations of both facilities when developing the line. Together, the two identical lines will enable seamless one-to-one tech transfers, without additional scale-up efforts, resulting in overall benefits such as shorter timelines and reduced active pharmaceutical ingredient (API) consumption. Janssen not only developed a new CM line but also set up cross-functional initiatives to make sure the company was ready to start developing new compounds once the Mirror-1 line was complete. Janssen collaborated with academics, partnered with other pharmaceutical companies, and established connections with health authorities worldwide to help them formulate renewed development strategies and best practices and establish new methodologies.
“We strongly believe that our unique strategy will accelerate the development of new medicines, with a signi� cant increased level of process understanding and controls, providing more robust processes and delivering better and safer products,” said Luca Russo, Global Head, Clinical Supply Chain, Janssen.
PROJECT EXECUTION: BRISTOL MYERS SQUIBBBillion Dollar Commitment to BiologicsThe biopharmaceutical industry is thriving in Ireland, and Bristol Myers Squibb’s Cruiserath Biologics is at its forefront. In 2014, BMS closed their Dublin-based API site and announced a $1 billion commitment to building a new, world-class biologics manufactur-ing facility in its place. The investment helped BMS increase their biologics manufacturing capacity and played a central role in the company’s global manufacturing network. At the time, the project
was the largest single investment by BMS outside of the United States and the second largest life sciences sector investment in the history of the Irish state.
The result of this $1 billion investment is a new biopharma-ceutical campus where immuno-oncology medicines are manu-factured for patients worldwide. The large-scale site (with six 15,000-liter bioreactors) will produce multiple biologic medicines annually on a rapid-turnover, campaign basis for high e� ciency and throughput. It is designed for future expansion into a concurrent-campaign multiproduct facility. Innovative concepts were applied to the facility design to facilitate higher throughput and rapid product changeover while minimizing equipment redundancies and maintenance shutdowns. The manufacturing execution system design integrates with the production automa-tion system and collectively utilizes f lexible and lean recipes. This allows for easy and quick con� guration of the system for the next product to be produced.
“The Cruiserath campus represents the largest ever capital investment for the company and is the first Bristol Myers Squibb biologics manufacturing facility in Europe. We set out with a vision to build a world-class biopharma campus and state-of-the-art facil-ity; to receive this highly coveted award and industry recognition indeed signi� es we are well on our way in this endeavor,” said Noel Heaney, General Manager, Cruiserath Biologics, and Executive Director, EU Biologics.
SOCIAL IMPACT: GSK—GLAXOSMITHKLINEAccelerated Delivery to Meet Critical NeedGSK has a broad portfolio of innovative and established medicines. When they partnered with ViiV Healthcare to develop a newly acquired investigational HIV product, fostemsavir, one of the � rst things they needed to do was develop a new facility to handle pro-duction of the first-in-class HIV treatment. Because the drug is typically used by patients with previous viral failures who have limited or no treatment options remaining, time was of the essence. GSK met the challenge, and in just 15 months, the project team constructed and commissioned a green� eld NPI facility for high containment in Parma, Italy.
SPECIAL SECTION 2020 ISPE ANNUAL MEETING & E XPO

S e p t e m b e r / O C T O B E R 2 0 2 0 4 5
Meeting the accelerated schedule required a highly integrated program includ-ing concurrent design, construction, and commissioning. For the � rst time in the Italian industry, an integrated project delivery approach was used. Designers, con-tractors, and suppliers from diverse backgrounds and experiences worked together to capitalize on the talents and insights of everyone on the team. The GSK team reduced the overall design time by overlapping the design, procurement, and con-struction phases, thus changing the inherently iterative nature of the design pro-cess. Interactive and decision-making workshops were held to evaluate di� erent layout, facility, and process manufacturing options. The team also used three-di-mensional building information modeling from the early stages of design, devel-oped a strategy to develop user requirement speci� cations so that equipment could be ordered at the end of concept design, and divided the building into three separate construction zones, each operating simultaneously.
“In December 2019, we � led for FDA approval for fostemsavir, after our fastest-ever project build,” said Mike Mungall, Vice President, Global Capital Projects, GSK. “The project team, the Parma site, and everyone who had a part in making this happen is proud to be involved in developing a new treatment that could help people living with HIV who are not able to suppress their virus with other medicines and who could be left with few or no treatments available.”
SOCIAL IMPACT: UNITED THERAPEUTICSA Company Built from LoveIn 1994, Dr. Martine Rothblatt learned that her seven-year-old daughter had pulmonary arterial hypertension, a life-threatening orphan disease, with no viable medicine on the market. Because orphan diseases a� ect a small percentage of the population, cures are not typically a research priority—so Rothblatt took matters into her own hands and made it her life’s mission to find a lifesaving treatment. She and her team at United Therapeutics were successful, and several years later, they expanded their focus to include the development and commercialization of unique products to address more unmet medical needs, including those of children with chronic and rare life-threatening conditions. One of those products is Unituxin (dinutuximab), which has proven e� ec-tive in treating and reversing high-risk neuroblastoma, a rare form of cancer that typi-cally forms on immature nerve cells in children under the age of 5 years and a� ects approximately 800 children a year. The company’s manufacturing and research capa-bility was limited due to their existing biologics manufacturing capacity. To treat more pediatric patients, conduct research on other life-threatening illnesses, and bring hope to more families, United Therapeutics knew they had to expand their operation, and so they decided to build a new facility, the Dinutuximab-Dedicated Oncology Medical and Analytical Laboratory (DDOMAL) in Silver Spring, Maryland.
CONTINUOUS MANUFACTURINGOF ORAL SOLID DOSAGES BY GERICKE
Regensdorf (Zurich) - Switzerland:T +41 44 871 36 [email protected]
gerickegroup.com
The Gericke Formulation Skid GFS supplies mixtures of API and up to 5 excipients within the capacity range of 1-1000 kg/h to:
• Direct compression• Dry or Wet Granulation• Hot Melt Extrusion• Sachet or Capsule Filling
Gericke's Continuous & Mini Batch BlendingManufacturing Modules combine high precision loss in weight feeders with scientifically designed compact mixers and integrated PAT solutions.

4 6 P h a r m a c e u t i c a l E n g i n e e r i n g
Space was the first obstacle, so the company partnered with local government to pass legislation that exempted the � oor area housing mechanical, engineering, and plumbing equipment required to support the drug manufacturing process from the total gross-square-feet calculation. This legislation not only made the project feasible but also will promote the future development of the l ife sciences industr y in Montgomer y Count y, Mar yland. Additionally, United Therapeutics stayed connected to the local community during construction. Throughout the project, the team went above and beyond to create a positive experience for those around them by installing covered walkways; organizing social events for the local community to discuss the project; installing a project signboard to inform neighbors of what they should expect to see, hear, and smell; and providing noise-cancelling headphones to residents of a nearby nonpro� t organization.
“DDOMAL was born of a mission to improve the lives of patients,” said Patrick Poisson, Executive Vice President, Technical Operations, United Therapeutics. “Against all odds, the DDOMAL team showed an unparalleled commitment to getting Unituxin into production and to market, building strong local relationships, and executing the project to an outstanding level. It is an excep-tional example of how a valiant team e� ort across the board can lead to an innovative and well-functioning pharma manufactur-ing facility that respects all stakeholders and quickly produces medicine that saves children’s lives.”
HONORABLE MENTION: BOEHRINGER INGELHEIM BIOPHARMACEUTICALS CHINA LTD.Boehringer Ingelheim’s commitment to bringing lifesaving medi-cation to China to meet increasing needs included not just building a new facility but also working with local government to change regulations. In 2013, Boehringer Ingelheim began supporting e� orts by the China National Medical Products Administration to revise relevant regulations. After years of hard work and diplo-macy, China’s Standing Committee of the National People’s Congress approved in 2019 a significant revision of the Drug Administration Law pertaining to the Marketing Authorization Holder (MAH) system. The new system makes it easier for drug developers to bring new drugs to market, while increasing their responsibility to ensure the safety of those drugs. In addition to its
e� orts to reform Chinese regulations, Boehringer Ingelheim built in Shanghai a modern facility that incorporates environmentally friendly systems and can be expanded to meet patient, business, and market needs.
The OASIS GMP facility, which is located directly in the heart of Zhangjiang Hi-Tech Park, is set up in a modular approach: module 1 covers � rst bioreactors, including an auto-isolator � ll-and-� nish line, and module 2 has an expansion option. The entire production is based on single-use equipment to be put together following a toolbox concept, which allows for various combina-tions and can cope with the requirements of di� erent processes. The bioreactors and vessels are connected through a � exible tube system, instead of pipes, offering options for putting together equipment independent of hardware installations. Additionally, the site is the only biopharmaceutical site of a multinational com-pany on the Chinese market to o� er contract manufacturing that meets global standards.
“We were very proud to become the � rst company starting com-mercial biopharmaceutical manufacturing under the MAH model in China,” said Jiali Luo, General Manager and Site Head of Boehringer Ingelheim Biopharmaceuticals China. “The trial project was smoothly conducted and has now proven successful. The newly established model can be of great bene� t for the Chinese health-care system and can provide Chinese patients broader access to more innovative medicines.”
HONORABLE MENTION: JANSSEN PHARMACEUTICAL COMPANIES OF JOHNSON & JOHNSON AND LEGEND BIOTECH, USA INC.Advancing a Next-Generation Cell Therapy for Blood CancerWith the current treatment options on the market, the � ve-year survival rate for patients with multiple myeloma is approxi-mately 50%. Although treatment may result in remission, most patients will relapse and there is currently no cure for the blood cancer. However, an innovative chimeric antigen receptor T-cell (CAR-T) therapy targeting B-cell maturation antigen, currently in global clinical development by Janssen Pharmaceutical Companies and Legend Biotech USA, is o� ering hope to patients with multiple myeloma.
SPECIAL SECTION 2020 ISPE ANNUAL MEETING & E XPO

CAR-T therapy uses the patient’s own immune system to identify and attack tumor cells. After collecting the patient’s white blood cells, the T-cells are genetically engineered to produce chimeric antigen receptors on their surface, which enables the T-cells to recognize tumor cells. The reengineered CAR-T cells are expanded and formulated in a cleanroom environment before being returned to the patient for infusion. The CAR-T cells attack the cancer and stimulate the immune system to recog-nize the cancer cells if they return.
Speed of implementation was the driver for the project to establish a CAR-T clinical manufacturing facility in Raritan, New Jersey, as Janssen and Legend Biotech wanted to provide this innovative therapy to patients as soon as possible with no compromise to the companies’ standards for quality. Two project design teams, one to design the cleanroom PODs and the other to design the stick-built modular facility, worked closely together to ensure both elements came together seamlessly. They used hybrid construction and a unique combination of on- and off-site modular construction to help them meet their timeline and were able to achieve mechanical completion in just nine months. At the conclusion of the project, a “hope bell” was installed within the open meeting space. Each week, employees ring it for each dose of CAR-T therapy being provided to a patient.
“Initially, the sound of the bell was rare. As a result of tireless e� orts to develop personalized treatments for more patients, this bell ringing has become a weekly ritu-alized event where it is rung numerous times, and each time with deep, personal meaning for everyone involved,” said Eric Niebling, Vice President, Advanced Therapies, for Jannsen. “The sound of the hope bell is a celebration for every patient and for every employee who has worked passionately to develop each treatment.”
To learn more about these innova-tion projects, visit ispe.org/foya
About the authorMarcy Sanford is an Editorial Assistant for Guidance Documents at ISPE.

4 8 P h a r m a c e u t i c a l E n g i n e e r i n g
PEOPLE + EVENTS
ISPE Briefs In 2005, representatives of the Russian pharmaceutical engineer-ing industry showed interest in bringing an ISPE A� liate to the Eurasian region and started working toward this goal. At that time, a group of ISPE members from the pharmaceutical industry
met in Moscow and decided to pursue development of an a� liate. However, it was not until 2017 that these efforts were con-
nected to the increasing number of ISPE active members in the E A E U c ou nt r ie s , i nc lu d i n g Ru s s i a , B e l a r u s , A r me n i a , Kazakhstan, and Kyrgyzstan. In 2018, a new team of members started work with ISPE to create a Eurasian A� liate. This was a logical step because the current intensive technological develop-ment of the region’s industry depends on having a single, compe-tent platform for global exchanges about current science and industrial leadership.
The new A� liate has planned activities to achieve these key goals: u Creating an inf luential industry platform in the EAEU for
testing and promoting new ideas and implementing innova-tive ideas in pharmaceutical production
u Involving a wide range of industry stakeholders, including pharmaceutical production specialists, employees of archi-tectural, engineering, and construction � rms, and represent-atives from government agencies, universities, pharma and medical device manufacturers, and equipment suppliers
Introducing the ISPE Eurasian Economic Union A� liateIn March 2020, the ISPE Eurasian Economic Union (EAEU) Affi liate was offi cially established. This event was a signifi cant step along the journey to integrate members from EAEU nations into the international pharmaceutical community, as well as another sign of progress in the development of a harmonized scientifi c, technological, and regulatory framework among countries and regions in the fi eld of pharmaceutical manufacturing.
The ISPE EAEU A� liate Board (left to right): Oxana Pryanichnikova, EAEU A� liate Vice Chair and Development Director, Urb.ax; Polina Bobyleva, EAEU A� liate Secre-tary and Deputy Head of the International Division Russian State Institute of Drugs & Good Practices; Svetlana Minchenkova, EAEU A� liate Treasurer and Accountant ,FSI “SID & GP”; and Vladimir Orlov, EAEU A� liate Chair and Division Lead, Department of International Cooperation and Foreign A� airs Russian State Institute of Drugs & Good Practices.

S E P T E M B E R / O C T O B E R 2 0 2 0 4 9
Share Your SIG, CoP, Chapter or A� liate News!We’d like to feature your Chapter, Affi liate, CoP, SIG, or other ISPE group in upcoming ISPE Briefs. Share highlights from training programs, conferences, social events, or other activities in an article of 250 to 400 words. We welcome photos (at least 300 dpi or >1 MB). Email submissions to Susan Sandler, Senior Director, Editorial, at [email protected]
u Organizing events to be held in the EAEU and neighboring countries to support the development of the pharmaceutical industry in accordance with global industry trends
u Creating and updating Russian-language resources for techni-cal literature that has practical applications for pharmaceutical production at all stages of the life cycle of a medicinal product
In April 2019, ISPE global leaders approved the strategic plan for the proposed new A� liate. A roadmap that included legal, mar-keting, and communication activities with a horizon of two years was used to direct progress toward a� liate status, and a team of volunteer industry professionals and contractors was formed to organize tasks within the EAEU.
The new A� liate has created a website and a Facebook page, formed a public relations strategy, and interacted with other pro-fessional communities to strengthen relationships. The group is also working on developing a Eurasian ISPE conference. The Affiliate is participating in dialogue and partnership with ISPE members worldwide through regular global teleconferences with the leaders of other A� liates. Finally, the A� liate has started to develop key initiatives including ISPE Young Professionals, Women in Pharma®, and Pharma 4.0™.
—EAEU A� liate Board
Welcome to a new Pharmaceutical Engineering® feature: Meet the ISPE Sta� . In each issue, we introduce a member of the ISPE sta� who provide ISPE members with key information and services. In this issue, we introduce Dawn Arbetello, Brand and Creative Services Manager in ISPE’s Marketing Commun-ications group.
Tell us about your role at ISPE: what do you do each day?I’m a passionate creative professional with nearly 30 years of experience in print and digital design and marketing. As the Creative Services Manager at ISPE, I wear many hats. As a Brand Manager, I make sure that all creative assets, both print and digital, adhere to the overall look and feel of the ISPE brand. In addition, I am part of a team that consults with all ISPE business units about marketing strategy and creative assets in support of our international membership.
As Creative Director, I also oversee the work of my colleague, Jeffrey Link, in the
creation of all marketing and conference assets, including direct mail promotions like postcards and brochures, internal and external digital advertising such as web ads and email banners, conference venue brand-ing such as the ISPE booth and signage at the Annual Meeting, and FOYA with the annual Spotlight on Excellence booklet. Je� rey, a seasoned design and layout professional who has been a contractor with ISPE for nearly a year, is an invaluable part of the MarCom team.
What do you love about your job?I love working with the small but talented staff who are passionate about making a di� erence in people’s lives.
What do you like to do when you are not at work?When I’m not at work, I love traveling with my husband and attending concerts, espe-cially to see my favorite band, the Avett Brothers.
Meet the ISPE STAFF
DAWN ARBETELLO

5 0 P h a r m a c e u t i c a l E n g i n e e r i n g
New ISPE Good Practice Guide on Critical UtilitiesBy Marcy Sanford
equipment, you can’t formulate product. Problems in the critical utilities can lead to immediate downstream problems in product quality related to microbial control.
Rod Freeman: One common misconception people have about critical utilities is that they think a critical utility is just a utility, when, in fact, it’s both a raw material and a cleaning agent used in almost all pharmaceutical processes—it a� ects every product at the plant.
That is one of the reasons why regulators have such a keen interest in critical utilities, because they a� ect the patient’s health on a broad scale. If those utilities aren’t correct and working well, it compromises a lot.
What is the purpose of the guide?RF: The team felt it needed to be published because ISPE has a lot of material on the technical side of things but nothing to really coach younger companies or associates in the industry on how to interact with inspectors and how to readily have the data needed available for them.
I’ve been in multiple FDA inspections. I’ve seen some go well, I’ve seen some go bad. And when I look at industry literature, there
PEOPLE + EVENTS
ISPE has published a new Good Practice Guide: Critical Utilities GMP Compliance—How to Be Compliant and Ready to Prove It. Written and reviewed by a team of experts from around the world, the guide is the fi rst of its kind in the industry. Team co-leads Nik Krpan and Rod Freeman talked with Pharmaceutical Engineering® about the importance of critical utilities and the benefi ts of the new guide.
What are critical utilities? Why are they important? Nik Krpan: Critical utilities are utilities that have the identi� ed potential to impact product quality or performance in a signi� cant way.
For example, water systems in a plant are much like the circu-latory system in your body and the heart—if your heart stops beating, you stop functioning very quickly. In a pharmaceutical manufacturing plant, water is used extensively in the plant for cleaning and formulation of product, and if you can’t clean your

S E P T E M B E R / O C T O B E R 2 0 2 0 5 1
8 Ridgedale Avenue, Cedar Knolls, NJ 07927 ph.:973-775-7777
Contact: [email protected] – ext. 378
www.eiassociates.com
FFrroomm BBeenncchhttoopp ttoo DDiissttrriibbuuttiioonn…… WWee UUnnddeerrssttaanndd YYoouurr GGxxPP FFaacciilliittiieess
• Research • Laboratories • Process Scale-Up • Finishing • Pilot Plants • Process Manufacturing:
Batch / Continuous • Sterile & Non-Sterile
Manufacturing • Clean Rooms • Packaging Suites • Warehouse Facilities • Support Areas • Plant Utility Systems • API
really isn’t anything out there about how to host an inspection. Learning how to host an inspection is all taught on the job; there’s nothing for a younger company or associate to read and learn the best way to handle an inspection and how to best meet the needs of the inspectors.
NK: The idea for the guide came from people who had worked for small manufacturers where they struggle to achieve compliance because they aren’t always deploying their resources on the actions that are going to achieve the most compliant results.
The guide covers the steps that are necessary to achieve a con-tinuous state of GMP compliance through correct operating prac-tices, as well as the correct documentation practices and the cor-rect practices to demonstrate compliance. The overall intended result is to provide a more e� cient audit so that the auditor can get through their job as e� ciently as possible, making better use of limited regulatory resources and improving patient safety.
RF: During an inspection, there is one inspector and they may not have expertise in your area, your plant, or product. Because of that, they don’t always know what they’re asking for, so it is important that as the host, you are able to work through it with them and get them the information they need quickly.
I’ve worked at some plants that shipped up to 400 products at any given time. When you have that many batch records, that many design history � les, that many engineering drawings, a big part of your e� ort in preparation for an inspection is making sure your documentation is ready and easily accessible so when an inspector makes a request, you can get it to them within 20 min-utes or an hour. If it’s a day or two later, it doesn’t present a good impression.
Who do you think will benefi t from the guide? RF: One of the biggest challenges that critical utility professionals have with regulatory agencies is presenting the data in a way that the regulators can understand and easily absorb quickly. I think that this guide will help with that communication between critical utility professionals and regulators.
NK: I also think this guide will be a big bene� t to smaller manufac-turing facilities where they don’t have as much bench depth in
“I wish I’d had this guide previously in my career.”
their compliance departments. This guide will really help them identify the critical areas they should be focusing on to achieve compliance for their critical utilities.
RF: I wish I’d had this guide previously in my career. It would have helped me in numerous situations to better understand the needs of inspectors and auditors and meet them more quickly.
I hope this guide helps people who don’t have as much time working in quality or as much exposure to it better understand the purpose of the inspection: the FDA is there to help protect the public health and safety.
And this guide is intended to help bridge a gap between engi-neering and the quality area so that you don’t have that tug of war between quality and operations and so they work together to meet the needs of the agencies, which will ultimately benefit the patients.
About the authorMarcy Sanford is an Editorial Assistant for Guidance Documents at ISPE.

5 2 P h a r m a c e u t i c a l E n g i n e e r i n g
TECHNICAL CONTINUOUS MANUFACTURING
QUALITY AND REGULATORY SOLUTIONS for PAT in Continuous ManufacturingBy Gabriella M. Dahlgren, PhD, Kevin A. Macias, RPh, PhD, Antonio Moreira, PhD, Duncan R. Thompson, Christoph Herwig, PhD, and Robert Dream, PhD
Process analytical technology (PAT) is perceived as the main enabler for a robust control strategy with continuous manufacturing (CM) because PAT can aid in implementing CM throughout the entire life cycle. This article discusses quality and regulatory hurdles in the life cycle of a PAT application—including model life-cycle management—in combination with CM for small and large molecules, with the goal of proposing strategies to resolve each challenge.
Continuous manufacturing represents the next generation of pharmaceutical manufacturing processes for both large and small molecules. It is recognized by regulatory authorities as a key emerging technology. The US FDA has approved
various small molecule products and recently issued draft guid-ance for industry on CM [1, 2]. In this article, we do not focus on the capabilities of specific PAT technologies, which have been reviewed in other recent publications [3–6]. Instead, we address how companies can add � exibility and maximize the value of PAT for CM. As we discuss general issues, we focus on how they apply to all or most PAT tools and we use some common PAT tools as aids to describe example scenarios.
Important regulatory guidance on PAT includes ICH Q8 (R2) [7] and the FDA’s “Guidance for Industry” from 2004 [8]. The FDA PAT guidance considers PAT to be,
A system for designing, analyzing, and controlling manufacturing through timely measurements (i.e., during processing) of critical quality and performance attributes of raw and in-process materials and processes, with the goal of ensuring � nal product quality. It is important to note that the term analytical in PAT is viewed broadly to include chemical, physical, microbiological, mathematical, and risk analysis conducted in an integrated manner.”
For CM, analytics must move closer to the process. PAT can there-fore add signi� cant value in design, analysis, and control of the CM process. Because PAT does not involve pooling or holding of the process, decisions can be made in real time. For example, when designing equipment or modeling unit operation behavior, PAT measurements used to determine residence time distribution (RTD) are critical. During process development, PAT may be used to con� rm satisfactory process operation, verify models, inform on divert to waste (DTW) situations, or perform feedback control. The control strategy for a continuous process may also benefit from the use of PAT. Furthermore, PAT can be used for � nal critical quality attribute (CQA) determination directly or as input to a more complex model that includes process parameters and mate-rial attributes.
When developing and implementing a commercial CM line, PAT is recommended, even more strongly than it is for batch manufac-turing, for all three phases (design, analysis, and control). However, the extent of PAT use is company- and product-dependent, re� ecting the perceived return on investment.
On the continuum from simplest to most complex applica-tions, the optimum level of PAT deployment in various stages of the CM life cycle, from design to routine operation, is a company decision that may be based on perceived risks associated with regulatory and quality considerations. The validation of PAT applications must evolve during their life cycle to ensure they remain � t for purpose. Lack of clarity on regulatory expectations at different points in the life cycle can derail PAT early in the process.
Figure 1 shows how the number of PAT applications tends to decline as we move from process understanding to real-time release testing (RTRT) (left triangle), whereas validation require-ments (right triangle) increase as we move from low-impact to high-impact applications. Because successful implementation of PAT can add benefits to a CM process, we suggest in this article ways to increase the utilization of PAT within all stages of the left triangle.

S e p t e m b e r / o c t o b e r 2 0 2 0 5 3
PAT IN DEVELOPMENTDuring early process development, having the tools in place for rapid analysis and visualization helps turn PAT data into immedi-ately actionable knowledge. At this stage, companies often seek to enhance understanding to e� ectively implement a CM platform, and it might be easy to install a preliminary PAT system for this purpose. Notably, these early data could form the basis of di� eren-tiation between good and bad product that determines quality decisions. For this reason, a close-to-GMP-ready system to manage the PAT may be needed earlier in the development process than would be required for a batch process; also, a plan on how to lever-age the preliminary system may be required if a permanent system is needed for commercial use. However, in most scenarios, compa-nies do not need to install a commercial release–ready GMP system for initial process development.
Data capture with a PAT system should meet process-speci� c criteria that are based on the targeted CQAs according to quality by design (QbD) principles. A potential strategy would be to start by using PAT tools, such as semiquantitative or � ngerprint meth-ods, to detect relative changes [9]. These are easier methods to qualify or validate, which would then allow organizations to use PAT data for quality decisions and help companies leverage the data for future, more advanced controls or decisions. This approach could also streamline the requirements around robust-ness and system suitability, which may require significant resources in early development. It would be bene� cial if a company established a process for quali� ed versus validated methods simi-lar to what has been done for traditional testing.
To clarify the relationship between RTD and PAT, the FDA published the initial PAT framework [8], which supports the move from static batch processing to more-dynamic approaches that mitigate the risk of producing poor-quality product. ICH imple-mented a trio of quality guidance: Q8(R2), Q9, and Q10 [7, 10, 11].
C ontinuous systems with automation and process control fre-quently result in high-quality (low-variability) products, whereas traditional batch processing can be less understood, resulting in less-predictable product quality [12].
Using high-frequency PAT sensors can ensure adequate sens-ing to determine the approximate RTD shape. Aided by a simple peak detection algorithm, analysts can easily detect the most sig-nificant spikes. It is logical to assume that detecting the down-stream response is easier than detecting the pulse disturbance itself. If a plug � ow process were expected, the perturbation would be largely unchanged as it traveled along the system, meaning pulse into the system would result in a pulse response, although this would be di� cult to detect without a very rapid measurement. RTD plays an important role in material traceability because it characterizes the spreading of the materials through the system. Thus, a disturbance could be predictively tracked through the entire continuous system, enabling downstream control or even removal of the a� ected material.
The determination of RTDs is one of the primary areas in which PAT is used in development. RTD aids in the traceability of raw materials in the manufacturing process, which is critical when material is continuously fed into and removed from a process. Once the RTD has been determined for each unit opera-tion, as well as the integrated line, it can be used to facilitate material traceability and help determine sensor placement and measurement frequency to ensure that any unacceptable mate-rial variations can be detected, recorded, and addressed.
AUTOMATION AND RTDContinuous systems with automation and process control result in high-quality, low-variability products. A properly designed con-tinuous system with appropriate sensors to record and display process parameters, such as critical process parameters (CPPs) and
Figure 1: Conceptual representation of the number of pharmaceutical industry–deployed PAT applications in use contrasted with the resources required to develop, validate, support, and maintain the methods and enable defi ned fi t-for-purpose testing.
Low Impact—No validation
Medium Impact—Limited validation if
other quality controls are present
High Impact—Full validation as per regulatory guidance
Process Understanding, Process Design and RTD Derivation
Process Validation, Product Traceability, and
Continued Process Verification
Diversion of Nonconforming
Material and RTRT
Figure 1

5 4 P h a r m a c e u t i c a l E n g i n e e r i n g
� nalized process controls. Additional emphasis on process con-trols should be considered in cases where products cannot be well characterized or quality attributes might not be readily measura-ble due to limitations of testing or detectability (e.g., microbial load/sterility, low drug load).
PAT VALIDATION AND LIFE-CYCLE MANAGEMENTAs noted previously, PAT benefits a CM line by helping answer technical and quality-related questions about product and process performance, and by providing the direct answer to product qual-ity requirements. As mentioned, the main hurdles of validation strategy of the PAT and the accompanying methods arise during development. The quali� cation and validation of PAT applications have significant overlap with traditional analytical equipment qualification and validation and should be conducted in accor-dance with ICH Q2 (R1) [13], where the capabilities of the equipment must align with the type of test that the technology will address (ID, qualitative, or quantitative measure). When PAT is incorpo-rated into the manufacturing process as inline or online tools, additional issues such as probe fouling and complexity of CM cleaning validation should be addressed. Some examples of how to incorporate these aspects into the line risk analysis are described in detail in ASTM standard E2898-14 [14]. Figure 4 shows the life cycle for method development and validation of analytical meth-ods for PAT applications that is aligned with E2898-14.
E2898-14 includes paths for PAT method validation, including how a risk assessment can document a risk-based approach that identi� es what parameters to address based on the use of the PAT
Figure 2: A conceptual integrated small molecule CM process.
Figure 3: A conceptual integrated large molecule CM process.
non-CPPs, handles small portions of material at any given moment, increasing material monitoring scrutiny. When CM uses product and process knowledge with properly implemented online PAT, it can meet the criteria required to enable RTRT, leading to rapid and reliable batch release of high-quality product (see Figures 2 and 3 for CM processes for small and large molecules, respectively). Despite these vast advantages, CM also has signi� cant challenges, and continued focus by industry and regulators is required to resolve them.
In the chemical processing � eld, the RTD is used to describe how a material travels inside the unit operations of a continuous process system. RTD is a critical tool in pharmaceutical process understanding, quality assurance, and equipment and sensing design, but it is underutilized due to a lack of acceptance of RTD as an alternative to testing, especially if an automated RTD control system is available as part of the line.
As mentioned, PAT can be a useful tool as part of the control strategy, which is generally developed and initially implemented for production of clinical trial materials. The control strategy is usually re� ned for use in commercial manufacture as new knowl-edge is gained. Changes could involve acceptance criteria, analyti-cal methodology (including switching from traditional lab testing to PAT or model-based methods), or the points of control (e.g., introduction of RTRT). Stakeholders across an organization must agree whether the documentation and equipment quali� cation of any PAT tool done during development activities are su� cient to permit the leveraging of the development data into a � nal RTRT method that incorporates increased process knowledge and
TECHNICAL CONTINUOUS MANUFACTURING
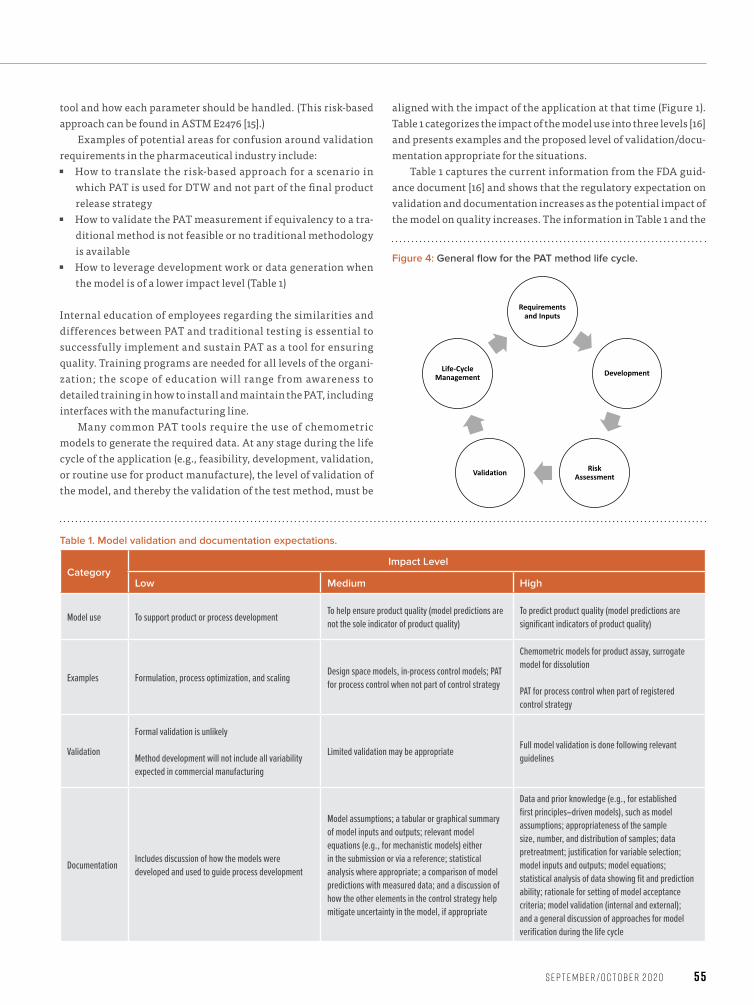
S e p t e m b e r / o c t o b e r 2 0 2 0 5 5
tool and how each parameter should be handled. (This risk-based approach can be found in ASTM E2476 [15].)
Examples of potential areas for confusion around validation requirements in the pharmaceutical industry include: u How to translate the risk-based approach for a scenario in
which PAT is used for DTW and not part of the � nal product release strategy
u How to validate the PAT measurement if equivalency to a tra-ditional method is not feasible or no traditional methodology is available
u How to leverage development work or data generation when the model is of a lower impact level (Table 1)
Internal education of employees regarding the similarities and differences between PAT and traditional testing is essential to successfully implement and sustain PAT as a tool for ensuring quality. Training programs are needed for all levels of the organi-zation; the scope of education will range from awareness to detailed training in how to install and maintain the PAT, including interfaces with the manufacturing line.
Many common PAT tools require the use of chemometric models to generate the required data. At any stage during the life cycle of the application (e.g., feasibility, development, validation, or routine use for product manufacture), the level of validation of the model, and thereby the validation of the test method, must be
Figure 4: General fl ow for the PAT method life cycle.
Table 1. Model validation and documentation expectations.
Category Impact Level
Low Medium High
Model use To support product or process development To help ensure product quality (model predictions are not the sole indicator of product quality)
To predict product quality (model predictions are signifi cant indicators of product quality)
Examples Formulation, process optimization, and scaling Design space models, in-process control models; PAT for process control when not part of control strategy
Chemometric models for product assay, surrogate model for dissolution
PAT for process control when part of registered control strategy
Validation
Formal validation is unlikely
Method development will not include all variability expected in commercial manufacturing
Limited validation may be appropriate Full model validation is done following relevant guidelines
Documentation Includes discussion of how the models were developed and used to guide process development
Model assumptions; a tabular or graphical summary of model inputs and outputs; relevant model equations (e.g., for mechanistic models) either in the submission or via a reference; statistical analysis where appropriate; a comparison of model predictions with measured data; and a discussion of how the other elements in the control strategy help mitigate uncertainty in the model, if appropriate
Data and prior knowledge (e.g., for established fi rst principles–driven models), such as model assumptions; appropriateness of the sample size, number, and distribution of samples; data pretreatment; justifi cation for variable selection; model inputs and outputs; model equations; statistical analysis of data showing fi t and prediction ability; rationale for setting of model acceptance criteria; model validation (internal and external); and a general discussion of approaches for model verifi cation during the life cycle
aligned with the impact of the application at that time (Figure 1). Table 1 categorizes the impact of the model use into three levels [16] and presents examples and the proposed level of validation/docu-mentation appropriate for the situations.
Table 1 captures the current information from the FDA guid-ance document [16] and shows that the regulatory expectation on validation and documentation increases as the potential impact of the model on quality increases. The information in Table 1 and the

5 6 P h a r m a c e u t i c a l E n g i n e e r i n g
FDA guidance [16] can be leveraged to create appropriate internal requirements depending on the intended use of a model at any phase of the PAT life cycle. It should be noted that based on long-term intent of a model, a company can decide to increase the vali-dation and documentation requirements at an earlier phase of application development to facilitate the end use. In a similar manner, qualification activities may be performed earlier for chemical manufacturing control (CMC) deliverables.
Regulatory guidance documents for near-infrared spectroscopy (NIRS) cover what is in or out of scope. For example, European Medicines Agency (EMA) NIRS guidance [17] states that “NIRS for non-regulatory purposes, such as generating process knowledge, is out of scope of this guideline.” FDA guidance on NIRS [18] applies to applications used “during the manufacture and analysis of pharmaceuticals (including raw materials, in-process materials and intermediates, and � nished products).” It is generally assumed that this FDA guidance applies to applications that will be included in regulatory submissions aligned with EMA NIRS guidance, although that is not speci� cally stated. The FDA and EMA NIRS guidance can be applied to similar PAT technologies.
According to current guidance documents, organizations must obtain additional regulatory approval during the life cycle of the PAT application. This is a challenge, and it is compounded by the di� erences in the requirements of various regulatory bodies. Certain changes to the scope of the NIRS method (EMA guidance) require regulatory notification and acceptance before a model update can be implemented [19]. FDA guidance also requires a prior approval supplement when there are major changes to the application or a change-being-e� ected in 30 days (CBE-30) � ling for a moderate change. If the PAT application were required to manufacture using continuous processing, manufacture would have to cease during this time period unless an alternative control strategy that did not rely on the PAT application were accepted by regulatory authorities.
The following are two potential solutions to mitigate this challenge in EMA guidance and general expectations of approval of model changes:
u The use of performance-based established conditions (ECs) for PAT methods versus parameter-based ECs: This option would require a clear description of model outputs that must be met, such as accuracy, precision, linearity, and so on, instead of just the software version, spectral pretreatment, and equip-ment model. If performance-based ECs were used, a range of changes to the PAT method would not require a � ling because those changes would be veri� ed through the con� rmation of the output and tracked within the pharmaceutical quality system (PQS).
u The use of postapproval change management protocol (PACMP): This is a two-step process. First, the organization submits a written protocol that describes the proposed change, its rationale, and risk management, as well as pro-posed studies and acceptance criteria to assess the impact of the change(s). Regulatory authorities must approve this pro-tocol in advance of the implementation of the proposed change(s). Second, the organization submits the actual results/data based on the protocol approved by the regulatory authorities and according to the agreed categorization (classi-fication). In certain cases (e.g., noncritical or repetitive changes), regulatory approval of the second step may not be required because that step will be managed within the appli-cant’s PQS.
The second approach can result in the downgrade of noti� cation requirements (e.g., 1B to 1AIN), which could obviate the need to halt CM while awaiting regulatory approval. Overall, this is an area of ongoing conversation between industry and regulators.
The goal of PAT model validation is to have a � t-for-purpose validation and documentation approach for model use. In general, industry stakeholders agree on health authority expectations for low- and high-impact models. The requirements for medium-impact models are less clear.
Consider the following example, in which two reagents (A and B) are reacted together in a single-stage � ow process to form an intermediate (C) of a multistage synthetic process (Figure 5). A PAT
Figure 5: Illustration of a medium-impact PAT application applied to fl ow chemistry. Demonstration of the concept of PAT measurement prior to a DTW valve (left) is not directly linked in scale to the graph (right).
TECHNICAL CONTINUOUS MANUFACTURING

S e p t e m b e r / o c t o b e r 2 0 2 0 5 7
measurement is made at the exit of the reactor, which is capable of quantifying an impurity in solution that is di� cult to purge and can impact API quality downstream. Intermediate (C) is collected in a batch vessel, sampled for analysis, and tested against a speci� -cation, irrespective of the PAT measurement. This o� ine analysis forms the basis for ensuring control of the impurity. However, using PAT to DTW at the appropriate times can reduce the level of impurity in the intermediate or potentially prevent a batch failure. (With enhanced confidence in the PAT method and RTDs, the extended DTW time shown in Figure 5 may be reduced to match the point where the impurity is below the action limit.)
In this case, the application should be considered medium impact. The level of assurance required for this PAT measurement is less than if the impurity were not controlled by subsequent downstream analysis, and the process can run without the PAT measurement. Fit-for-purpose application validation is required, as this is a business risk and presents no risk to the patient.
Similarly, consider a PAT measurement performed on a mix-ture or blend for an oral solid dose formulation used to ensure proper composition to determine when to DTW. If the � nal product has another PAT or traditional test with appropriate sampling fre-quency, this initial PAT method is considered medium impact, and limited validation and model maintenance requirements are required.
INDIRECT PAT APPROACHES: SOFT SENSORS AND DIGITAL TWINSThe previous sections focused on direct PAT approaches; however, many products are too complex to measure all CQAs in real time. In many cases, a process variable or a CQA is considered hardly measurable because the measurement is not speci� c enough, the resolution does not su� ce, or the variable is intracellular (in the case of biologics). In these situations, indirect measurement and correlation techniques are needed, and soft sensors, which use a combination of other measurements and mathematical calibra-tion algorithms to accurately predict potentially di� cult to mea-sure variables, can be used.
There are multiple approaches for the generation of soft sen-sors [20]. The most desirable soft sensors are fully mechanistic ones, which use � rst-principle approaches, such as energy, mass, and elemental balances [21]. When complexity must increase to accurately predict the target variable, mechanistic modeling approaches are appended with data-driven correlations (also called hybrid models) [22].
Mechanistic or hybrid kinetic models can be implemented in a real-time environment and thereby mimic the process as a digital twin. Digital twins can be used to estimate the current state of process variables by using observed algorithms, such as Kalman or pa r t icle f i lters. Fur t her more, t hey a l low pred ict ion a nd
ROOM1-10Pa
ROOM215Pa
ROOM330Pa
ROOM425Pa
ROOM55Pa
Exhaust Air
Supply Air
Referencepressure
PEC-X1 PEC-X1 PEC-X1 PEC-X1 PEC-X1
Control Differential pressure in each clean room.Restore pressure at fluctuation in short time.
For secure Pressure …OKAYA SEIRITSU ENGINEERING CO.,LTD.http://www.okaya-seiritsu.co.jp/1-18-1,Senjumidori-cho,Adachiku,TOKYO,JAPANTEL:+81-3-6812-0202
Corridor0Pa

5 8 P h a r m a c e u t i c a l E n g i n e e r i n g
(model-predictive) process control, a key requirement for continu-ous bioprocessing [23]. Because digital twins derive variables that cannot be easily measured, they can even be used as tools for con-trolling on variables that are normally not measurable. Hence, together with work� ows known as “good modeling practice,” digi-tal twins provide means to measure less and allow new opportuni-ties for extended experimental design and enhanced process characterization [24]. Although these techniques are good to pre-dict performance, they have limited use for establishing release criteria.
METHOD AND MODEL UPDATESPAT methods focused on product life-cycle management (ICH Q12) require routine verification of performance beyond what is required for traditional test methods. Enhanced attention must be given to the validation of the models, as well as the continued ver-ification that the model is operating in its validated space. Therefore, computational model life-cycle management, which includes routines for model diagnosis and drift detection, must be established [25]. This will enable identification of a transition point where models are allowed to self-learn on additional data sets, or where the model needs to be maintained by process experts. More research is required on the following questions: What would be necessary to allow a self-tuning model? What would preclude a self-tuning model and would require a process expert’s intervention? How would life-cycle management be performed?
Q12 is proposed as the update mechanism for changes to all models, such as addition of spectra to a model or providing proof of being able to use a model for RTRT. Many strategies for self-learning algorithms have been in place for many years and will be enhanced by machine learning and arti� cial intelligence strategies in the future. However, the changes to a digital twin and soft sensor must remain traceable in a GxP environment. Moreover, the validated space of the method/model must be declared, and data integrity must be ensured, which can be a challenging task for data-driven approaches and will be a research � eld in the near future. We need to address questions such as the following: Do su� cient criteria exist to declare the validated space and ensure data integrity? If the validated space changes from a previously approved model but
is irrelevant for the operating space, is this a model change? In many cases, mechanistic approaches are encouraged because model parameters have a mechanistic meaning. Their value can be compared to literature values, which allows easier validation, and can therefore be easier to interpret and judge for model validity during unforeseen perturbations.
Another potential solution is to allow for the use of “or equiva-lent” with PAT methods, similar to what is done with traditional analytical methods, and only the spectra that were part of the original validation would be used for these equivalency assess-ments. To make this approach possible, updates to current regula-tory guidance documents would be required, as described in the PAT validation section. If updates to guidance documents to allow for “or equivalent” can be realized, certain activities, such as the addition of a second software and the addition of a second analyzer of the exact same model with no change in original acceptance criteria, could be captured within the quality system. This would simplify reporting because changes could be submitted as part of the annual report instead of in a regulatory � ling.
OTHER POTENTIAL HURDLESWhen PAT is used in a CM process, the number of data points or measurements will be signi� cantly higher than with a traditional batch process. This greater amount of data allows for the use of alternative statistical methodologies to show product quality, but it also requires additional discussions and strategies around sam-pling plans, as discussed in detail by De Los Santos and colleagues [26]. Overall, the quality requirements—and, thereby, the quality systems—are not changed by the implementation of CM. However, timing and responsibilities for activities such as batch review, release strategy, stability strategy, rejection strategy, and contin-gency plans for PAT may change.
As discussed previously, in CM, some activities may shift to an earlier phase in the manufacturing process development, espe-cially because the process may be developed at scale. Similarly, process validation may also be done sooner because a CM line is more integrated than traditional batch processes (as discussed by the FDA in new draft guidance for CM [2]). The combination of PAT with CM may enable continuous process verification because it allows for immediate feedback of process performance and the use of a QbD approach if used throughout development.
CONTINGENCY PLAN FOR PATAs described in guidance documents [17, 18], regulators expect that organizations will include a contingency plan as part of the strat-egy when implementing PAT. A range of potential approaches can be taken with respect to the contingency plan, and each has its own advantages and disadvantages.
Multiple PATOne option for contingency planning involves creating a line with multiple equivalent PAT tools for a speci� c measurement. This can be done by ensuring available backup PAT tools to insert into the
TECHNICAL
Overall, the quality requirements—and, thereby, the quality systems—are not changed by the implementation of continuous manufacturing.
CONTINUOUS MANUFACTURING

S e p t e m b e r / o c t o b e r 2 0 2 0 5 9
line when the “primary” tool goes down, or the organization can have multiple tools built into the line at equivalent points to meas-ure the same parameter.
It is critical that organizations have a predetermined, scienti� c and risk-based strategy around hierarchy of the multiple values/PAT outputs during routine operation to eliminate confusion. The backup PAT tool can also be offline equipment not intended for direct connection to the line.
Alternative Test MethodsIf PAT is unavailable, or does not function as expected (i.e., does not pass suitability tests), alternative or traditional test methods can be employed. It should be noted that this statement only applies to scenarios where the testing method has been appropri-ately documented through the control strategy and overall prod-uct risk. One drawback to this approach is the organization may need to collect a high volume of samples to show process control. Also, the traditional test usually takes longer than the PAT test and can delay product release, especially if RTRT is employed.
ShutdownIf an organization uses PAT but does not use multiple PAT tools or an alternative test method as the contingency plan, it may need to shut down the line if the PAT is unavailable. In this scenario, no product is manufactured until the PAT tool is again available. This will require the organization to maintain higher inventory vol-umes to minimize the risk for potential out-of-stock events, which can be cost prohibitive. The benefits, although minor, of this approach are that the organization will not require additional PAT tools or analytical equipment as part of its upfront investment and long-term maintenance costs may be lower.
I f a company is not willing to invest in backup PAT, they are also less likely to implement PAT from the start due to the high risk of not being able to run the standard planned commercial process or meet the demand plan. This can then lead to drug shortages, as noted previously, which is otherwise a problem that CM can alleviate.
CONCLUSIONThroughout this article, we have shown how PAT can aid in the implementation of CM throughout the life cycle and have high-lighted areas of concern for PAT implementation. Based on the product and company strategy, PAT can be used for process devel-opment, control, monitoring, and product release. Guidance docu-ments are clear on the requirements and expectations for PAT when used for real-time release or to make � nal quality decisions. However, there are major hurdles for increased implementation of PAT within CM, for which we have proposed some solutions: u Validation requirements for medium-impact models. u Model maintenance and updates: Guidance documents from
various health authorities offer differing requirements regarding the expectations for model maintenance. Our rec-ommendation is to continue harmonization discussions as
Q13 and Q14 are being drafted to clearly capture what is expected and to align expectations with requirements for traditional test methods. Also, by shifting to a performance- versus-parameter-based description of methods, more changes can be managed through the PQS instead of in regu-latory � lings. This would decrease the time requirement for implementation of a change and allow for increased use of PAT.
u Processes and system for traceability: The use of PAT requires models, which need to be adjusted throughout the product life cycle. Therefore, it is critical to have tools to trace the need to adapt the models in a GxP environment. Workflows and decision trees must be available as data science solutions.
u Skills, knowledge, and mindset within the organization: It is important to share knowledge and develop the skill set of the entire organization from the introduction of PAT and CM to allow for better understanding and sustainability of these initiatives.
u Business case requirements: Companies need to think holisti-cally about how they develop the business requirements for and bene� ts of PAT. The � rst application will always be rela-tively costly and time consuming; however, once the tool and the skills are in place, companies can realize signi� cant bene-� ts at signi� cantly lower costs. Through the use of PAT, com-panies may also increase overall knowledge of the process, which supports the holistic approach to the business case.
u Options when unable to measure all CQAs with PAT: Companies should acknowledge these issues and develop appropriate pro-cesses for modeling if PAT tools are unavailable.
u Software solutions: Workflows for digital twins are in place; however, a digital twin needs a suitable real-time environment, and standardization is key in this respect; therefore, the indus-try needs software as a service (SaaS) solutions.
R eferences1. Su, Q., S. Ganesh, M. Moreno, Y. Bommireddy, M. Gonzalez, G. Reklaitis, and Z. Nagy. “A
Perspective on Quality-by-Control (QbC) in Pharmaceutical Continuous Manufacturing.” Computers and Chemical Engineering 125 (June 2019): 216–231. doi:10.1016/j.compchemeng.2019.03.001
2. US Food and Drug Administration, Center for Drug Evaluation and Research. “Quality Considerations for Continuous Manufacturing: Guidance for Industry—Draft Guidance.” February 2019. https://www.fda.gov/regulatory-information/search-fda-guidance-documents/quality-considerations-continuous-manufacturing
3. Fonteyne, M., J. Vercruysse, F. De Leersnyder, B. Van Snick, C. Vervaet, J. P. Remon, and T. De Beer. “Process Analytical Technology for Continuous Manufacturing of Solid-Dosage Forms.” TrAC Trends in Analytical Chemistry 67 (2015): 159–166. doi:10.1016/j.trac.2015.01.011
4. Laske, S., A. Paudel, O. Scheibelhofer, et al. “A Review of PAT Strategies in Secondary Solid Oral Dosage Manufacturing of Small Molecules.” Journal of P harmaceutical Sciences 106, no. 3 (2017): 667–712. doi:10.1016/j.xphs.2016.11.011
5. Holzberg, T., V. Watson, S. Brown, A. Andar, X. Ge, Y. Kostov, L. Tolosa, and G. Rao. “Sensors for Biomanufacturing Process Development: Facilitating the Shift from Batch to Continuous Manufacturing.” Current Opinion in Chemical Engineering 22 (December 2018): 115–127. doi:10.1016/j.coche.2018.09.008
6. Jiang, M., K. Severson, J. Love, H. Madden, P. Swann, L. Zang, and R. Braatz. “Opportunities and Challenges of Real-Time Release Testing in Biopharmaceutical Manufacturing.” Biotechnology and Bioengineering 114, no. 11 (July 2017): 2445–2456. doi:10.1002/bit.26383

6 0 P h a r m a c e u t i c a l E n g i n e e r i n g
7. International Conference on Harmonisation of Technical Requirements for Registration of Pharmaceuticals for Human Use. “ICH Guideline Q8(R2) on Pharmaceutical Development.” European Medicines Agency website. August 2009. https://www.ema.europa.eu/en/ich-q8-r2-pharmaceutical-development
8. US Food and Drug Administration. “Guidance for Industry. PAT—A Framework for Innovative Pharmaceutical Development, Manufacturing, and Quality Assurance.” September 2004. https://www.fda.gov/media/71012/download
9. Rajamanickam, V. S. P., O. Spadiut, and C. Herwig, “Impurity Monitoring as Novel PAT Tool for Continuous Biopharmaceutical Processes.” In Continuous Bioprocessing—Industry Best Practices by Repligen, edited by J. Bonham-Carter, 89–101. Waltham, MA: Repligen, 2018. https://www.repligen.com/applications/perfusion
10. International Conference on Harmonisation of Technical Requirements for Registration of Pharmaceuticals for Human Use. “ICH Guideline Q9 on Quality Risk Management.” European Medicines Agency website. November 2005. https://www.ema.europa.eu/en/documents/scientifi c-guideline/international-conference-harmonisation-technical-requirements-registration-pharmaceuticals-human-use_en-3.pdf
11. International Conference on Harmonisation of Technical Requirements for Registration of Pharmaceuticals for Human Use. “ICH Q10 Pharmaceutical Quality System.” European Medicines Agency website. June 2008. https://www.ema.europa.eu/en/ich-q10-pharmaceutical-quality-system
12. Plumb, K. “Continuous Processing in the Pharmaceutical Industry: Changing the Mind Set.” Chemical Engineering Research and Design 83, no. 6 (June 2005): 730–738. doi:10.1205/cherd.04359
13. International Conference on Harmonisation of Technical Requirements for Registration of Pharmaceuticals for Human Use. “ICH Harmonised Tripartite Guideline. Validation of Analytical Procedures: Text and Methodology Q2(R1).” European Medicines Agency website. October 1994. https://www.ema.europa.eu/en/documents/scientifi c-guideline/ich-q-2-r1-validation-analytical-procedures-text-methodology-step-5_en.pdf
14. ASTM International. ASTM Standard E2898-14: Standard Guide for Risk-Based Validation of Analytical Methods for PAT Applications. West Conshohocken, PA: ASTM International, 2014.
15. ASTM International. ASTM Standard E2476-16: Standard Guide for Risk Assessment and Risk Control as It Impacts the Design, Development, and Operation of PAT Processes for Pharmaceutical Manufacture. West Conshohocken, PA: ASTM International, 2016.
16. US Food and Drug Administration. “Guidance for Industry. Q8, Q9, and Q10: Questions and Answers (R4). ICH Revision 1.” November 2011. https://www.fda.gov/downloads/Drugs/Guidances/UCM210822.pdf
17. European Medicines Agency, Committee for Human Medicinal Products. “Guideline on the Use of Near Infrared Spectroscopy by the Pharmaceutical Industry and the Data Requirements for New Submissions and Variations.” June 2014. https://www.ema.europa.eu/en/use-near-infrared-spectroscopy-nirs-pharmaceutical-industry-data-requirements-new-submissions
18. US Food and Drug Administration, Center for Drug Evaluation and Research. “Development and Submission of Near Infrared Analytical Procedures: Guidance for Industry—Draft Guidance.” March 2015. https://www.fda.gov/media/91343/download
19. European Medicines Agency, Committee for Human Medicinal Products. “Addendum to EMA/CHMP/CVMP/QWP/17760/2009 Rev 2: Defi ning the Scope of an NIRS Procedure.” https://www.ema.europa.eu/en/documents/scientifi c-guideline/addendum-ema/chmp/cvmp/qwp/17760/2009-rev-2-defi ning-scope-nirs-procedure_en.pdf
20. Luttmann, R., D. G. Bracewell, G. Cornelissen, et al. “Soft Sensors In Bioprocessing: A Status Report and Recommendations.” Biotechnology Journal 7, no. 8 (2012): 1040–1048. doi:10.1002/biot.201100506
21. Herwig, C., I. Marison, and U. Von Stockar. “On-line Stoichiometry and Identifi cation of Metabolic State Under Dynamic Process Conditions.” Biotechnology and Bioengineering 75, no. 3 (2001): 345–354. doi:10.1002/bit.10058
22. Solle, D., B. Hitzmann, C. Herwig, et al. “Between the Poles of Data-Driven and Mechanistic Modeling for Process Operation.” Chemie Ingenieur Technik 89, no. 5 (April 2017): 542–561. doi:10.1002/cite.201600175
23. Kroll, P., A. Hofer, S. Ulonska, J. Kager, and C. Herwig. “Model-Based Methods in the Biopharmaceutical Process Lifecycle.” Pharmaceutical Research 34, no. 12 (December 2017): 2596–2613. doi:10.1007/s11095-017-2308-y
24. Golabgir, A., T. Hoch, M. Zhariy, and C. Herwig. “Observability Analysis of Biochemical Process Models as a Valuable Tool for the Development of Mechanistic Soft Sensors.” Biotechnology Progress 31, no. 6 (2015): 1703–1715. doi:10.1002/btpr.2176
25. Chiang, L., B. Jiang, X. Zhu, D. Huang, and R. D. Braatz. “Diagnosis of Multiple and Unknown Faults Using the Causal Map and Multivariate Statistics.” Journal of Process Control 28 (2015): 27–39. doi:10.1016/j.jprocont.2015.02.004
26. De Los Santos, P.A., J. Hofer, E. Jayjock, T. T. Kramer, K. R. Lief, and M. Otava. “Sampling Considerations in Continuous Manufacturing.” Pharmaceutical Engineering 39, no. 3 (May–June 2019): 55–63.
About the authorsGabriella M. Dahlgren, PhD, has a doctorate in chemistry from the University of Michigan. She has been part of the Janssen Product Quality organization since 2015, focusing on implementation of new technologies such as PAT, real-time release, and continuous manufacturing. She is currently Co-lead of the ISPE Product Quality Lifecycle Implementation (PQLI)® subteam on continuous manufacturing. Prior to joining Janssen, Gabriella’s experiences included more than 10 years as an Analytical Chemist in various functions focused on the creation of processes for method development end to end, development and validation of test methods, evaluation of new technology to speed up release testing, and implementation of hydrophilic coatings on new medical devices. She has also served as the cross-functional subject matter expert for vendor changes and resolution of production issues as they relate to testing and chemical characterization. Gabriella has been an ISPE member since 2017.
Kevin A. Macias, RPh, PhD, obtained a BS in pharmacy from St. Louis College of Pharmacy and a PhD in industrial and physical pharmacy from Purdue University. Kevin is currently a Principal Scientist in Drug Product Development within Global Product Development & Supply at Bristol Myers Squibb. In his role, Kevin merges analytics, spectroscopy, pharmaceutical materials science, and drug product processing fundamentals to develop real-time analytical techniques that enable effi cient drug product development and manufacture. In addition to spectroscopic applications for process control, his research interests include powder fl ow characterization, roller compaction, and novel small molecule drug delivery systems.
Antonio Moreira, PhD, is Vice Provost for Academic Aff airs and Professor of Chemical, Biochemical, and Environmental Engineering at University of Maryland, Baltimore County (UMBC). He was previously Chair of the Chemical and Biochemical Engineering Department, Associate Dean of Engineering, and Associate Provost for Academic Aff airs. Prior to his appointment to UMBC, Antonio spent nearly 10 years in the private sector, with senior management positions both in the food industry with International Flavors and Fragrances, Inc., and in the pharmaceutical/biotechnology area with Schering-Plough Corporation (now Merck & Co.). He has signifi cant experience with R&D, scale-up, and introduction to commercialization of biotechnology products, such as alpha interferon, granulocyte-macrophage colony-stimulating factor (GM-CSF), and monoclonal antibodies. Antonio holds a BS in chemical engineering from the University of Porto, Portugal, and has an MS and PhD in chemical and biochemical engineering from the University of Pennsylvania. He has been an ISPE member since 1992.
Duncan R. Thompson has 25 years of experience in analytical chemistry and PAT, leading a team at GSK that developed and implemented many PAT applications in both batch and continuous processes covering API and DP. He has expertise in PAT supporting process development and the validation and registration of applications for control strategies. He represented GSK on a European Federation of Pharmaceutical Industries and Associations team for regulatory advocacy with EMA. More recently, he joined CatSci as Analytical Team Leader, where he is expanding analytical capabilities, including PAT, to deliver innovative process research and development.
Christoph Herwig, PhD, Bioprocess Engineer from RWTH Aachen, worked in industry in the design and commissioning of large chemical facilities prior to entering his interdisciplinary PhD studies at EPFL, Switzerland, in bioprocess identifi cation. Subsequently, he positioned himself at the interface between bioprocess development and facility design in the biopharmaceutical industry. Since 2008, he has been a Professor of Biochemical Engineering at the Vienna University of Technology. His research focuses on the development of data science methods for integrated and effi cient bioprocess development along PAT and QbD principles. His product fi elds of expertise are circular economy and biopharmaceuticals within industry-driven projects. In 2013 he founded the company Exputec, which addresses data science solutions for the biopharma life cycle. Christoph has been an ISPE member since 2002.
Robert Dream, PhD, is an accomplished industry leader with broad experience in the biopharmaceutical industry from early process development to commercial manufacturing. He has been working in depth in the biopharmaceutical industry for 30 years and has been involved in all aspects of manufacturing, regulatory, process validation, fi nancial planning, development of drug substance and drug products, and program and project management globally. Robert has assisted companies to expand their operations and businesses worldwide, contributing to planning, audits, gap analyses, and BLA/NDA preparations and submittals. His work has been published in numerous industry textbooks and technical journals, and he has participated in numerous seminars and technical conferences. A registered professional engineer, Robert has been a member of ISPE since 1990.
TECHNICAL CONTINUOUS MANUFACTURING

Questions About Critical Utilities? Introducing ISPE’s Newest Guidance Publication
Learn more at www.ISPE.org/Publications/Guidance-Documents
Because of their hidden nature, critical utility systems are vulnerable to non-compliance. With their potential to impact product quality or performance in a significant way, critical utilities consistently receive close scrutiny by regulatory inspectors.
This Guide will help your company achieve and maintain critical utility systems in a state of control and efficiently demonstrate the systems’ Good Manufacturing Practice (GMP) compliance to regulatory inspectors and auditors.
Written and reviewed by industry experts, this comprehensive Guide provides best practices for GMP compliance of critical utility systems and includes critical utility inspection and audit preparation activities.
Available Bound or Digital.
Member: $295/€268 Non-Member: $595/€541
NEWRelease
NEWRelease
NEWRelease
ISPE GOOD PRACTICE GUIDE: Critical Utilities GMP Compliance—
How to Be Compliant and Ready to Prove It
You’ve Got Questions, We’ve Got Answers

6 2 P h a r m a c e u t i c a l E n g i n e e r i n g
TECHNICAL PROCESS TECHNOLOGY
USING CFD MULTIPHASE MODELING to Predict Bioreactor PerformanceBy Elijio Prado and Albert Dyrness
Computational fl uid dynamics (CFD) can reduce or eliminate the need to perform bioreactor scale-up studies because full-scale manufacturing bioreactors can be simulated to predict performance. This article discusses the use of CFD for that purpose, to predict the performance of a manufacturing-scale bioreactor under various operating conditions.
Parametric studies on process conditions provide valuable insight for early-stage bioreactor design and process devel-opment. The advantage of CFD is that it enables rapid and cost-e� ective simulation of various conditions and provides
detailed visual data that can complement or exceed experimental methods. Furthermore, individual parameters within CFD simula-tions can be varied with precision to facilitate design optimization with results interpreted at a level that is often masked by natural variation in physical testing.
The goal of this article is to provide a method for simulating and analyzing impeller mixing and gas sparging in a bioreactor using multiphase CFD modeling. In particular, the oxygen trans-fer rate, kLa, is the primary performance parameter of interest, and to ensure the validity of the solutions, a mesh-independent CFD model is benchmarked against an experimentally determined kLa. Operating parameters (i.e., impeller speed, gas sparge rate) for the mesh-independent and benchmarked CFD models are then changed, and a comparison is made between the CFD model pre-diction and experimental data. One bioreactor CFD model is cre-ated and solved to simulate three di� erent operating conditions. The model can then be used for further parametric studies for the purpose of design optimization, speci� cally for changing operat-ing conditions such as sparge gas flow rate and impeller speed. These simulations were performed with ANSYS CFX version 2019R3. The method presented here is not limited to oxygen trans-fer and may also be used for other species (e.g., CO2 stripping) undergoing liquid and gas mass transfer.
METHODOLOGYOur modeling approach incorporated the homogeneous multi-ple size group (MUSIG) model to account for multiple sizes of bubbles, bubble breakup, and bubble coalescence. This model assigns the same velocity to the di� erent bubble size groups in the bioreactor. This essentially means that small bubbles will have the same velocity as large bubbles even though, in reality, di� erent sizes of bubbles have di� erent terminal rise velocities. For air bubbles in a water-type liquid environment, the MUSIG model is appropriate for bubble sizes in the approximately 1 mm to 17 mm range.
Using the formulas from Talaia [1] and liquid and gas densities of 993.5 kg/m3 and 1.65 kg/m3, respectively, the terminal rise velocity for air bubbles ranging from 1 mm to 17 mm is 0.15 m/s (1 mm) to 0.61 m/s (17 mm). The terminal velocity of the largest bubble can be approximately four times that of the smallest bub-ble. In practice, for these gas-sparged vessel mixing setups, most bubbles cluster within a tighter size range than the size range in which the MUSIG model applies. In addition, other studies have compared the inhomogeneous and homogeneous MUSIG models for vessel mixing with the homogeneous model, providing good results against experimental data [2].
We made four sets of simulations, with each set containing three di� erent operating conditions, for a total of 12 simulations. Different setups were used to determine which options predict better results. The different setups used are summarized as follows: u Setup 1: Compressible � uid for gas phase, second-order Rhie-
Chow option for pressure-velocity coupling u Setup 2: Incompressible f luid for gas phase, second-order
Rhie-Chow option for pressure-velocity coupling u Setup 3: Incompressible f luid for gas phase, fourth-order
Rhie-Chow option for pressure-velocity coupling u Setup 4: Incompressible f luid for gas phase, fourth-order
Rhie-Chow option for pressure-velocity coupling, virtual mass, and enhanced turbulence using the Sato-enhanced eddy viscosity model

S e p t e m b e r / o c t o b e r 2 0 2 0 6 3
This article illustrates which setup provides better agreement with experimental data.
Oxygen Mass Transfer RateThere are several theories for calculating the oxygen mass transfer coefficient, kL. Sarkar and coauthors [3] used the following equation:
different terminal rise velocities. For air bubbles in a water-type liquid environment, the MUSIG model is appropriate for bubble sizes in the approximately 1 mm to 17 mm range.
Using the formulas from Talaia [1] and liquid and gas densities of 993.5 kg/m3 and 1.65 kg/m3, respectively, the terminal rise velocity for air bubbles ranging from 1 mm to 17 mm is 0.15 m/s (1 mm) to 0.61 m/s (17 mm). The terminal velocity of the largest bubble can be approximately four times that of the smallest bubble. In practice, for these gas-sparged vessel mixing setups, most bubbles cluster within a tighter size range than the size range in which the MUSIG model applies. In addition, other studies have compared the inhomogeneous and homogeneous MUSIG models for vessel mixing with the homogeneous model, providing good results against experimental data [2].
We made four sets of simulations, with each set containing three different operating conditions, for a total of 12 simulations. Different setups were used to determine which options predict the better results. The different setups used are summarized as follows:
• Setup 1: Compressible fluid for gas phase, second-order Rhie-Chow option for pressure-velocity coupling
• Setup 2: Incompressible fluid for gas phase, second-order Rhie-Chow option for pressure-velocity coupling
• Setup 3: Incompressible fluid for gas phase, fourth-order Rhie-Chow option for pressure-velocity coupling
• Setup 4: Incompressible fluid for gas phase, fourth-order Rhie-Chow option for pressure-velocity coupling, virtual mass, and enhanced turbulence using the Sato-enhanced eddy viscosity model
This article illustrates which setup provides better agreement with experimental data.
Oxygen Mass Transfer Rate
There are several theories for calculating the oxygen mass transfer coefficient, kL. Sarkar and coauthors [3] used the following equation:
𝑘𝑘! ="##𝐷𝐷$ %
%!'!(!&)/+
Equation 1
where D0 is the oxygen diffusivity in water, m2/s; 𝜀𝜀! is the liquid turbulent eddy dissipation, m2/s3; 𝜇𝜇! is the liquid viscosity, Pa⋅s; and 𝜌𝜌! is the liquid density, kg/m3.
Others have used different mass transfer formulas, as shown in Equations 2, 3, and 4:
𝑘𝑘! ="√##𝐷𝐷$ %
%!'!(!
&)/+
Equation 2 [2]
𝑘𝑘! = 0.4#𝐷𝐷$ %%!'!(!
&)/+
Equation 3 [2]
where D0 is the oxygen di� usivity in water, m2/s;
different terminal rise velocities. For air bubbles in a water-type liquid environment, the MUSIG model is appropriate for bubble sizes in the approximately 1 mm to 17 mm range.
Using the formulas from Talaia [1] and liquid and gas densities of 993.5 kg/m3 and 1.65 kg/m3, respectively, the terminal rise velocity for air bubbles ranging from 1 mm to 17 mm is 0.15 m/s (1 mm) to 0.61 m/s (17 mm). The terminal velocity of the largest bubble can be approximately four times that of the smallest bubble. In practice, for these gas-sparged vessel mixing setups, most bubbles cluster within a tighter size range than the size range in which the MUSIG model applies. In addition, other studies have compared the inhomogeneous and homogeneous MUSIG models for vessel mixing with the homogeneous model, providing good results against experimental data [2].
We made four sets of simulations, with each set containing three different operating conditions, for a total of 12 simulations. Different setups were used to determine which options predict the better results. The different setups used are summarized as follows:
• Setup 1: Compressible fluid for gas phase, second-order Rhie-Chow option for pressure-velocity coupling
• Setup 2: Incompressible fluid for gas phase, second-order Rhie-Chow option for pressure-velocity coupling
• Setup 3: Incompressible fluid for gas phase, fourth-order Rhie-Chow option for pressure-velocity coupling
• Setup 4: Incompressible fluid for gas phase, fourth-order Rhie-Chow option for pressure-velocity coupling, virtual mass, and enhanced turbulence using the Sato-enhanced eddy viscosity model
This article illustrates which setup provides better agreement with experimental data.
Oxygen Mass Transfer Rate
There are several theories for calculating the oxygen mass transfer coefficient, kL. Sarkar and coauthors [3] used the following equation:
𝑘𝑘! ="##𝐷𝐷$ %
%!'!(!&)/+
Equation 1
where D0 is the oxygen diffusivity in water, m2/s; 𝜀𝜀! is the liquid turbulent eddy dissipation, m2/s3; 𝜇𝜇! is the liquid viscosity, Pa⋅s; and 𝜌𝜌! is the liquid density, kg/m3.
Others have used different mass transfer formulas, as shown in Equations 2, 3, and 4:
𝑘𝑘! ="√##𝐷𝐷$ %
%!'!(!
&)/+
Equation 2 [2]
𝑘𝑘! = 0.4#𝐷𝐷$ %%!'!(!
&)/+
Equation 3 [2]
is the liquid turbulent eddy dissipation, m2/s3;
different terminal rise velocities. For air bubbles in a water-type liquid environment, the MUSIG model is appropriate for bubble sizes in the approximately 1 mm to 17 mm range.
Using the formulas from Talaia [1] and liquid and gas densities of 993.5 kg/m3 and 1.65 kg/m3, respectively, the terminal rise velocity for air bubbles ranging from 1 mm to 17 mm is 0.15 m/s (1 mm) to 0.61 m/s (17 mm). The terminal velocity of the largest bubble can be approximately four times that of the smallest bubble. In practice, for these gas-sparged vessel mixing setups, most bubbles cluster within a tighter size range than the size range in which the MUSIG model applies. In addition, other studies have compared the inhomogeneous and homogeneous MUSIG models for vessel mixing with the homogeneous model, providing good results against experimental data [2].
We made four sets of simulations, with each set containing three different operating conditions, for a total of 12 simulations. Different setups were used to determine which options predict the better results. The different setups used are summarized as follows:
• Setup 1: Compressible fluid for gas phase, second-order Rhie-Chow option for pressure-velocity coupling
• Setup 2: Incompressible fluid for gas phase, second-order Rhie-Chow option for pressure-velocity coupling
• Setup 3: Incompressible fluid for gas phase, fourth-order Rhie-Chow option for pressure-velocity coupling
• Setup 4: Incompressible fluid for gas phase, fourth-order Rhie-Chow option for pressure-velocity coupling, virtual mass, and enhanced turbulence using the Sato-enhanced eddy viscosity model
This article illustrates which setup provides better agreement with experimental data.
Oxygen Mass Transfer Rate
There are several theories for calculating the oxygen mass transfer coefficient, kL. Sarkar and coauthors [3] used the following equation:
𝑘𝑘! ="##𝐷𝐷$ %
%!'!(!&)/+
Equation 1
where D0 is the oxygen diffusivity in water, m2/s; 𝜀𝜀! is the liquid turbulent eddy dissipation, m2/s3; 𝜇𝜇! is the liquid viscosity, Pa⋅s; and 𝜌𝜌! is the liquid density, kg/m3.
Others have used different mass transfer formulas, as shown in Equations 2, 3, and 4:
𝑘𝑘! ="√##𝐷𝐷$ %
%!'!(!
&)/+
Equation 2 [2]
𝑘𝑘! = 0.4#𝐷𝐷$ %%!'!(!
&)/+
Equation 3 [2]
is the liquid viscosity, Pa⋅s; and
different terminal rise velocities. For air bubbles in a water-type liquid environment, the MUSIG model is appropriate for bubble sizes in the approximately 1 mm to 17 mm range.
Using the formulas from Talaia [1] and liquid and gas densities of 993.5 kg/m3 and 1.65 kg/m3, respectively, the terminal rise velocity for air bubbles ranging from 1 mm to 17 mm is 0.15 m/s (1 mm) to 0.61 m/s (17 mm). The terminal velocity of the largest bubble can be approximately four times that of the smallest bubble. In practice, for these gas-sparged vessel mixing setups, most bubbles cluster within a tighter size range than the size range in which the MUSIG model applies. In addition, other studies have compared the inhomogeneous and homogeneous MUSIG models for vessel mixing with the homogeneous model, providing good results against experimental data [2].
We made four sets of simulations, with each set containing three different operating conditions, for a total of 12 simulations. Different setups were used to determine which options predict the better results. The different setups used are summarized as follows:
• Setup 1: Compressible fluid for gas phase, second-order Rhie-Chow option for pressure-velocity coupling
• Setup 2: Incompressible fluid for gas phase, second-order Rhie-Chow option for pressure-velocity coupling
• Setup 3: Incompressible fluid for gas phase, fourth-order Rhie-Chow option for pressure-velocity coupling
• Setup 4: Incompressible fluid for gas phase, fourth-order Rhie-Chow option for pressure-velocity coupling, virtual mass, and enhanced turbulence using the Sato-enhanced eddy viscosity model
This article illustrates which setup provides better agreement with experimental data.
Oxygen Mass Transfer Rate
There are several theories for calculating the oxygen mass transfer coefficient, kL. Sarkar and coauthors [3] used the following equation:
𝑘𝑘! ="##𝐷𝐷$ %
%!'!(!&)/+
Equation 1
where D0 is the oxygen diffusivity in water, m2/s; 𝜀𝜀! is the liquid turbulent eddy dissipation, m2/s3; 𝜇𝜇! is the liquid viscosity, Pa⋅s; and 𝜌𝜌! is the liquid density, kg/m3.
Others have used different mass transfer formulas, as shown in Equations 2, 3, and 4:
𝑘𝑘! ="√##𝐷𝐷$ %
%!'!(!
&)/+
Equation 2 [2]
𝑘𝑘! = 0.4#𝐷𝐷$ %%!'!(!
&)/+
Equation 3 [2]
is the liquid density, kg/m3.Others have used di� erent mass transfer formulas, as shown
in Equations 2, 3, and 4:
different terminal rise velocities. For air bubbles in a water-type liquid environment, the MUSIG model is appropriate for bubble sizes in the approximately 1 mm to 17 mm range.
Using the formulas from Talaia [1] and liquid and gas densities of 993.5 kg/m3 and 1.65 kg/m3, respectively, the terminal rise velocity for air bubbles ranging from 1 mm to 17 mm is 0.15 m/s (1 mm) to 0.61 m/s (17 mm). The terminal velocity of the largest bubble can be approximately four times that of the smallest bubble. In practice, for these gas-sparged vessel mixing setups, most bubbles cluster within a tighter size range than the size range in which the MUSIG model applies. In addition, other studies have compared the inhomogeneous and homogeneous MUSIG models for vessel mixing with the homogeneous model, providing good results against experimental data [2].
We made four sets of simulations, with each set containing three different operating conditions, for a total of 12 simulations. Different setups were used to determine which options predict the better results. The different setups used are summarized as follows:
• Setup 1: Compressible fluid for gas phase, second-order Rhie-Chow option for pressure-velocity coupling
• Setup 2: Incompressible fluid for gas phase, second-order Rhie-Chow option for pressure-velocity coupling
• Setup 3: Incompressible fluid for gas phase, fourth-order Rhie-Chow option for pressure-velocity coupling
• Setup 4: Incompressible fluid for gas phase, fourth-order Rhie-Chow option for pressure-velocity coupling, virtual mass, and enhanced turbulence using the Sato-enhanced eddy viscosity model
This article illustrates which setup provides better agreement with experimental data.
Oxygen Mass Transfer Rate
There are several theories for calculating the oxygen mass transfer coefficient, kL. Sarkar and coauthors [3] used the following equation:
𝑘𝑘! ="##𝐷𝐷$ %
%!'!(!&)/+
Equation 1
where D0 is the oxygen diffusivity in water, m2/s; 𝜀𝜀! is the liquid turbulent eddy dissipation, m2/s3; 𝜇𝜇! is the liquid viscosity, Pa⋅s; and 𝜌𝜌! is the liquid density, kg/m3.
Others have used different mass transfer formulas, as shown in Equations 2, 3, and 4:
𝑘𝑘! ="√##𝐷𝐷$ %
%!'!(!
&)/+
Equation 2 [2]
𝑘𝑘! = 0.4#𝐷𝐷$ %%!'!(!
&)/+
Equation 3 [2]
𝑘𝑘! = 0.5#𝐷𝐷$ %%!'!(!
&)/+
Equation 4 [4]
Petitti and colleagues [5] state that the constant in front of #𝐷𝐷$ %%!'!(!&)/+
is sometimes replaced with
one that is tuned with experiments; this was the approach taken in our study. In Table 3 of Ranganathan and Sivaraman [2], it is the eddy cell theory, with a constant of 0.4, that provided the best kL estimate against experimental data. We initially used this same 0.4 constant in our study to solve the models; then, the constant was adjusted so CFD kLa (see equation 5) matched experimental data for the benchmarking case (for each of the four different setups). The kLa constant for the other two simulations was then updated to that of the benchmarked kLa constant, and the percent different between CFD and experimental kLa was determined.
The volume-averaged mass transfer coefficient is the product of kL and the interfacial area, a, 3, as shown in equation 5:
𝑘𝑘!𝑎𝑎 = 𝑘𝑘!-∝"/#$
Equation 5 [3]
where ∝0 is the gas volume fraction; and d32 is the Sauter diameter, m.
Modeling Approach
The technique we used to model the rotating impellers is a frozen rotor method. The frozen rotor method keeps the impeller static and changes the frame of reference to capture the rotating impeller physics. This technique requires that the fluid volume within the vessel be divided in the following way:
1. A fluid volume that is assigned a rotation speed and encompasses the impeller (typically, a cylindrical volume). For multiple impellers, a single rotating volume can encompass all the impellers or several rotating volumes can be used, one for each impeller (see Figure 1).
2. A static volume for the vessel, which encompasses the vessel wall, free surface, air sparger, part of the impeller shaft, and baffles.
Assumptions
The following assumptions were made in our study:
1. The liquid was assumed to be water and exhibit water-like properties at 37°C (98.6°F), actual bioreactor temperature.
2. The air was assumed to be injected at a temperature of 26.7°C (80°F) and was modeled as an ideal gas (varying density) for one set of simulations and as an incompressible gas (constant density) for the other set of simulations.
3. As is common practice with these types of simulations, small components such as bolts and side ports were not modeled because these components were assumed to only affect the flow locally
Petitti and colleagues [5] state that the constant in front of
𝑘𝑘! = 0.5#𝐷𝐷$ %%!'!(!
&)/+
Equation 4 [4]
Petitti and colleagues [5] state that the constant in front of #𝐷𝐷$ %%!'!(!&)/+
is sometimes replaced with
one that is tuned with experiments; this was the approach taken in our study. In Table 3 of Ranganathan and Sivaraman [2], it is the eddy cell theory, with a constant of 0.4, that provided the best kL estimate against experimental data. We initially used this same 0.4 constant in our study to solve the models; then, the constant was adjusted so CFD kLa (see equation 5) matched experimental data for the benchmarking case (for each of the four different setups). The kLa constant for the other two simulations was then updated to that of the benchmarked kLa constant, and the percent different between CFD and experimental kLa was determined.
The volume-averaged mass transfer coefficient is the product of kL and the interfacial area, a, 3, as shown in equation 5:
𝑘𝑘!𝑎𝑎 = 𝑘𝑘!-∝"/#$
Equation 5 [3]
where ∝0 is the gas volume fraction; and d32 is the Sauter diameter, m.
Modeling Approach
The technique we used to model the rotating impellers is a frozen rotor method. The frozen rotor method keeps the impeller static and changes the frame of reference to capture the rotating impeller physics. This technique requires that the fluid volume within the vessel be divided in the following way:
1. A fluid volume that is assigned a rotation speed and encompasses the impeller (typically, a cylindrical volume). For multiple impellers, a single rotating volume can encompass all the impellers or several rotating volumes can be used, one for each impeller (see Figure 1).
2. A static volume for the vessel, which encompasses the vessel wall, free surface, air sparger, part of the impeller shaft, and baffles.
Assumptions
The following assumptions were made in our study:
1. The liquid was assumed to be water and exhibit water-like properties at 37°C (98.6°F), actual bioreactor temperature.
2. The air was assumed to be injected at a temperature of 26.7°C (80°F) and was modeled as an ideal gas (varying density) for one set of simulations and as an incompressible gas (constant density) for the other set of simulations.
3. As is common practice with these types of simulations, small components such as bolts and side ports were not modeled because these components were assumed to only affect the flow locally
is sometimes replaced with one that is tuned with experiments; this was the approach taken in our study. In Table 3 of Ranganathan and Sivaraman [2], it is the eddy cell theory, with a constant of 0.4, that provided the best kL estimate against experi-mental data. We initially used this same 0.4 constant in our study to solve the models; then, the constant was adjusted so CFD kLa (see equation 5) matched experimental data for the benchmarking case (for each of the four di� erent setups). The kLa constant for the other two simulations was then updated to that of the benchmarked kLa constant, and the percent di� erence between CFD and experimen-tal kLa was determined.
The volume-averaged mass transfer coe� cient is the product of kL and the interfacial area, a, as shown in equation 5:
𝑘𝑘! = 0.5#𝐷𝐷$ %%!'!(!
&)/+
Equation 4 [4]
Petitti and colleagues [5] state that the constant in front of #𝐷𝐷$ %%!'!(!&)/+
is sometimes replaced with
one that is tuned with experiments; this was the approach taken in our study. In Table 3 of Ranganathan and Sivaraman [2], it is the eddy cell theory, with a constant of 0.4, that provided the best kL estimate against experimental data. We initially used this same 0.4 constant in our study to solve the models; then, the constant was adjusted so CFD kLa (see equation 5) matched experimental data for the benchmarking case (for each of the four different setups). The kLa constant for the other two simulations was then updated to that of the benchmarked kLa constant, and the percent different between CFD and experimental kLa was determined.
The volume-averaged mass transfer coefficient is the product of kL and the interfacial area, a, 3, as shown in equation 5:
𝑘𝑘!𝑎𝑎 = 𝑘𝑘!-∝"/#$
Equation 5 [3]
where ∝0 is the gas volume fraction; and d32 is the Sauter diameter, m.
Modeling Approach
The technique we used to model the rotating impellers is a frozen rotor method. The frozen rotor method keeps the impeller static and changes the frame of reference to capture the rotating impeller physics. This technique requires that the fluid volume within the vessel be divided in the following way:
1. A fluid volume that is assigned a rotation speed and encompasses the impeller (typically, a cylindrical volume). For multiple impellers, a single rotating volume can encompass all the impellers or several rotating volumes can be used, one for each impeller (see Figure 1).
2. A static volume for the vessel, which encompasses the vessel wall, free surface, air sparger, part of the impeller shaft, and baffles.
Assumptions
The following assumptions were made in our study:
1. The liquid was assumed to be water and exhibit water-like properties at 37°C (98.6°F), actual bioreactor temperature.
2. The air was assumed to be injected at a temperature of 26.7°C (80°F) and was modeled as an ideal gas (varying density) for one set of simulations and as an incompressible gas (constant density) for the other set of simulations.
3. As is common practice with these types of simulations, small components such as bolts and side ports were not modeled because these components were assumed to only affect the flow locally
where
𝑘𝑘! = 0.5#𝐷𝐷$ %%!'!(!
&)/+
Equation 4 [4]
Petitti and colleagues [5] state that the constant in front of #𝐷𝐷$ %%!'!(!&)/+
is sometimes replaced with
one that is tuned with experiments; this was the approach taken in our study. In Table 3 of Ranganathan and Sivaraman [2], it is the eddy cell theory, with a constant of 0.4, that provided the best kL estimate against experimental data. We initially used this same 0.4 constant in our study to solve the models; then, the constant was adjusted so CFD kLa (see equation 5) matched experimental data for the benchmarking case (for each of the four different setups). The kLa constant for the other two simulations was then updated to that of the benchmarked kLa constant, and the percent different between CFD and experimental kLa was determined.
The volume-averaged mass transfer coefficient is the product of kL and the interfacial area, a, 3, as shown in equation 5:
𝑘𝑘!𝑎𝑎 = 𝑘𝑘!-∝"/#$
Equation 5 [3]
where ∝0 is the gas volume fraction; and d32 is the Sauter diameter, m.
Modeling Approach
The technique we used to model the rotating impellers is a frozen rotor method. The frozen rotor method keeps the impeller static and changes the frame of reference to capture the rotating impeller physics. This technique requires that the fluid volume within the vessel be divided in the following way:
1. A fluid volume that is assigned a rotation speed and encompasses the impeller (typically, a cylindrical volume). For multiple impellers, a single rotating volume can encompass all the impellers or several rotating volumes can be used, one for each impeller (see Figure 1).
2. A static volume for the vessel, which encompasses the vessel wall, free surface, air sparger, part of the impeller shaft, and baffles.
Assumptions
The following assumptions were made in our study:
1. The liquid was assumed to be water and exhibit water-like properties at 37°C (98.6°F), actual bioreactor temperature.
2. The air was assumed to be injected at a temperature of 26.7°C (80°F) and was modeled as an ideal gas (varying density) for one set of simulations and as an incompressible gas (constant density) for the other set of simulations.
3. As is common practice with these types of simulations, small components such as bolts and side ports were not modeled because these components were assumed to only affect the flow locally
is the gas volume fraction and d32 is the Sauter diameter, m.
Modeling ApproachThe technique we used to model the rotating impellers is a frozen rotor method. The frozen rotor method keeps the impeller static and changes the frame of reference to capture the rotating impel-ler physics. This technique requires that the � uid volume within the vessel be divided in the following way: 1. A fluid volume that is assigned a rotation speed and encom-
passes the impeller (typically, a cylindrical volume). For multi-ple impellers, a single rotating volume can encompass all the impellers or several rotating volumes can be used, one for each impeller (see Figure 1).
2. A static volume for the vessel, which encompasses the vessel wall, free surface, air sparger, part of the impeller shaft, and ba� es.
AssumptionsThe following assumptions were made in our study:1. The liquid was assumed to be water and exhibit water-like
properties at 37°C (98.6°F), actual bioreactor temperature. 2. The air was assumed to be injected at a temperature of 26.7°C
(80°F) and was modeled as an ideal gas (varying density) for one set of simulations and as an incompressible gas (constant density) for the other set of simulations.
3. As is common practice with these types of simulations, small components such as bolts and side ports were not modeled because these components were assumed to only a� ect the � ow locally and have an insigni� cant in� uence on the overall � ow structure. In addition, modeling of small components requires the mesh density to increase, thereby needlessly increasing the solver time.
4. The free surface was modeled as a horizontal degassing surface; thus, surface ef fects due to gravit y were ignored. This assumption is reasonable when the vessel contains baff les because they eliminate any large rotating vortex structure that may develop at the center of the vessel due to the impeller(s). The degassing surface acts as a free-slip condition for liquid and allows gas to escape the surface.
Selected ConditionsWe used the following conditions for this study:1. The following properties were used:
u A liquid density of 993.5 kg/m3 u A liquid viscosity of 0.0007 Pa⋅s u A liquid surface tension of 0.07 N/m u An air-to-water oxygen di� usion coe� cient
of 3.0 × 10⁻⁵ cm2/s2. A total of 10 bubble size groups were used for the population
balance model based on an equal diameter distribution (i.e., bubbles increase in diameter by an equal amount).
3. Isothermal conditions were used because bioreactor tempera-ture is actively controlled and temperature gradients should be minimal due to mixing.
4. To model turbulence, the two-equation
and have an insignificant influence on the overall flow structure. In addition, modeling of small components requires the mesh density to increase, thereby needlessly increasing the solver time.
4. The free surface was modeled as a horizontal degassing surface; thus, surface effects due to gravity were ignored. This assumption is reasonable when the vessel contains baffles because they eliminate any large rotating vortex structure that may develop at the center of the vessel due to the impeller(s). The degassing surface acts as a free-slip condition for liquid and allows gas to escape the surface.
Selected Conditions
We used the following conditions for this study:
1. The following properties were used:
§ A liquid density of 993.5 kg/m3 § A liquid viscosity of 0.0007 Pa⋅s § A liquid surface tension of 0.07 N/m § An air-to-water oxygen diffusion coefficient of 3.0 × 10⁻⁵ cm2/s
2. A total of 10 bubble size groups were used for the population balance model based on an equal diameter distribution (i.e., bubbles increase in diameter by an equal amount).
3. Isothermal conditions were used because bioreactor temperature is actively controlled and temperature gradients should be minimal due to mixing.
4. To model turbulence, the two-equation k-e model was used because it provides reasonable results for vessel mixing [6] with baffles.
5. All physical walls contained a no-slip condition for the liquid phase. A sensitivity study was performed for the gas-phase slip condition and no significant difference in results was found; for the gas phase, a no-slip condition was also used.
6. The bubble breakup model was based on Luo and Svendsen [7], and the coalescence model was based on Prince and Blanch [8].
7. The Ishii-Zuber drag model [9] was used. This model accounts for bubble distortion and dense particle effects. The drag limits from small spherical bubbles and large spherical cap bubbles were also taken into account.
8. Turbulent dispersion forces were modeled and based on the Favre averaged drag model [10]. Turbulent dispersion allows bubbles to disperse from regions of high concentration to regions of low concentration due to turbulent fluctuations. A turbulent dispersion coefficient of 1.0 was used for the dispersion force because it is appropriate for dispersed fluids that are of low density relative to the continuous phase, as was the case in our study.
model was used because it provides reasonable results for vessel mixing [6] with ba� es.
5. All physical walls contained a no-slip condition for the liquid phase. A sensitivity study was performed for the gas-phase slip condition, and no signi� cant di� erence in results was found; for the gas phase, a no-slip condition was also used.
6. The bubble breakup model was based on Luo and Svendsen [7], and the coalescence model was based on Prince and Blanch [8].
7. The Ishii-Zuber drag model [9] was used. This model accounts for bubble distortion and dense particle e� ects. The drag limits from small spherical bubbles and large spherical cap bubbles were also taken into account.
Equation 2 [2]
Equation 3 [2]
Equation 4 [4]
Equation 1
Equation 5 [3]

6 4 P h a r m a c e u t i c a l E n g i n e e r i n g
8. Turbulent dispersion forces were modeled and based on the Favre averaged drag model [10]. Turbulent dispersion allows bubbles to disperse from regions of high concentration to regions of low concentration due to turbulent � uctuations. A turbulent dispersion coe� cient of 1.0 was used for the disper-sion force because it is appropriate for dispersed � uids that are of low density relative to the continuous phase, as was the case in our study.
9. The high-resolution scheme was used for turbulence and advec-tion. This scheme tries to use second-order numerics as much as possible. A sensitivity study was performed using � rst order for turbulence, and there was a signi� cant di� erence in kLa.
Bubble Diameter Exiting the SpargerThe initial bubble size out of the sparger was taken as uniform (a typical CFD approach for an air-sparged bioreactor) with a size that was calculated from equation 6 [3].
9. The high-resolution scheme was used for turbulence and advection. This scheme tries to use second-order numerics as much as possible. A sensitivity study was performed using first order for turbulence, and there was a significant difference in kLa.
Bubble Diameter Exiting the Sparger
The initial bubble size out of the sparger was taken as uniform (a typical CFD approach for an air-sparged bioreactor) with a size that was calculated from equation 6 [3].
𝑑𝑑1 = % -2/%0('!4'&)
&)/6
Equation 6
where σ is the water surface tension, N/m; 𝑑𝑑7 is the sparger hole size, m; 𝜌𝜌! is the liquid density, kg/m3; and 𝜌𝜌8 is the air density, kg/m3.
Because the bubble diameter is related to the one-third power of the sparger orifice diameter, the sparge orifice diameter would have to reduce by a factor of 8 to cut the exit bubble size by half. For our study, a sparger-exit air bubble diameter of 9.8 mm was calculated, and 10 different bubble size groups were used. The smallest bubble diameter modeled was 1.60 mm (group 1) and the largest was 16.40 mm (group 10). The bubble size between adjacent bubble groups increased in size by an equal amount of 1.64 mm (e.g., the bubble diameter in group 2 was 3.2 mm).
Air Mass Flow Rate and Density at Sparger
A total mass flow rate was specified at the sparger holes. The volumetric airflow rates provided in Table 2, later in this article, were referenced to a temperature of 0°C (32°F) and pressure of 1 atmosphere, representing normal flow conditions (European standard). The appropriate mass flow rate was determined by multiplying the volumetric flow rate by the air density at 0°C and 1 atmosphere of pressure, which is taken to be 1.295 kg/m3. The following is an example of this calculation:
Mass flow rate = 200 L/min × (m3/1,000 L) × 1.295 kg/m3 = 0.259 kg/min
The density at normal conditions was only used to determine the mass flow rate out of the sparger; however, this did not represent the actual density of the air coming out of the sparger. The air density coming out of the sparger was based on an assumed temperature of 26.7°C (80°F) and accounted for vessel pressure along with hydrostatic head. The ideal gas law was used to calculate density, which for air is shown in equation 7:
𝜌𝜌8 =9
":;< Equation 7
where P is the absolute pressure, Pa, and T is the air temperature, K.
For this study, a sparger-exit air density of 1.662 kg/m3 was calculated. This density was used to compute the initial mass of the bubbles exiting the sparger. For the compressible gas model, ANSYS automatically calculates the changing density within the vessel due to pressure variations.
where
9. The high-resolution scheme was used for turbulence and advection. This scheme tries to use second-order numerics as much as possible. A sensitivity study was performed using first order for turbulence, and there was a significant difference in kLa.
Bubble Diameter Exiting the Sparger
The initial bubble size out of the sparger was taken as uniform (a typical CFD approach for an air-sparged bioreactor) with a size that was calculated from equation 6 [3].
𝑑𝑑1 = % -2/%0('!4'&)
&)/6
Equation 6
where σ is the water surface tension, N/m; 𝑑𝑑7 is the sparger hole size, m; 𝜌𝜌! is the liquid density, kg/m3; and 𝜌𝜌8 is the air density, kg/m3.
Because the bubble diameter is related to the one-third power of the sparger orifice diameter, the sparge orifice diameter would have to reduce by a factor of 8 to cut the exit bubble size by half. For our study, a sparger-exit air bubble diameter of 9.8 mm was calculated, and 10 different bubble size groups were used. The smallest bubble diameter modeled was 1.60 mm (group 1) and the largest was 16.40 mm (group 10). The bubble size between adjacent bubble groups increased in size by an equal amount of 1.64 mm (e.g., the bubble diameter in group 2 was 3.2 mm).
Air Mass Flow Rate and Density at Sparger
A total mass flow rate was specified at the sparger holes. The volumetric airflow rates provided in Table 2, later in this article, were referenced to a temperature of 0°C (32°F) and pressure of 1 atmosphere, representing normal flow conditions (European standard). The appropriate mass flow rate was determined by multiplying the volumetric flow rate by the air density at 0°C and 1 atmosphere of pressure, which is taken to be 1.295 kg/m3. The following is an example of this calculation:
Mass flow rate = 200 L/min × (m3/1,000 L) × 1.295 kg/m3 = 0.259 kg/min
The density at normal conditions was only used to determine the mass flow rate out of the sparger; however, this did not represent the actual density of the air coming out of the sparger. The air density coming out of the sparger was based on an assumed temperature of 26.7°C (80°F) and accounted for vessel pressure along with hydrostatic head. The ideal gas law was used to calculate density, which for air is shown in equation 7:
𝜌𝜌8 =9
":;< Equation 7
where P is the absolute pressure, Pa, and T is the air temperature, K.
For this study, a sparger-exit air density of 1.662 kg/m3 was calculated. This density was used to compute the initial mass of the bubbles exiting the sparger. For the compressible gas model, ANSYS automatically calculates the changing density within the vessel due to pressure variations.
is the water surface tension, N/m; dH is the sparger hole size, m;
9. The high-resolution scheme was used for turbulence and advection. This scheme tries to use second-order numerics as much as possible. A sensitivity study was performed using first order for turbulence, and there was a significant difference in kLa.
Bubble Diameter Exiting the Sparger
The initial bubble size out of the sparger was taken as uniform (a typical CFD approach for an air-sparged bioreactor) with a size that was calculated from equation 6 [3].
𝑑𝑑1 = % -2/%0('!4'&)
&)/6
Equation 6
where σ is the water surface tension, N/m; 𝑑𝑑7 is the sparger hole size, m; 𝜌𝜌! is the liquid density, kg/m3; and 𝜌𝜌8 is the air density, kg/m3.
Because the bubble diameter is related to the one-third power of the sparger orifice diameter, the sparge orifice diameter would have to reduce by a factor of 8 to cut the exit bubble size by half. For our study, a sparger-exit air bubble diameter of 9.8 mm was calculated, and 10 different bubble size groups were used. The smallest bubble diameter modeled was 1.60 mm (group 1) and the largest was 16.40 mm (group 10). The bubble size between adjacent bubble groups increased in size by an equal amount of 1.64 mm (e.g., the bubble diameter in group 2 was 3.2 mm).
Air Mass Flow Rate and Density at Sparger
A total mass flow rate was specified at the sparger holes. The volumetric airflow rates provided in Table 2, later in this article, were referenced to a temperature of 0°C (32°F) and pressure of 1 atmosphere, representing normal flow conditions (European standard). The appropriate mass flow rate was determined by multiplying the volumetric flow rate by the air density at 0°C and 1 atmosphere of pressure, which is taken to be 1.295 kg/m3. The following is an example of this calculation:
Mass flow rate = 200 L/min × (m3/1,000 L) × 1.295 kg/m3 = 0.259 kg/min
The density at normal conditions was only used to determine the mass flow rate out of the sparger; however, this did not represent the actual density of the air coming out of the sparger. The air density coming out of the sparger was based on an assumed temperature of 26.7°C (80°F) and accounted for vessel pressure along with hydrostatic head. The ideal gas law was used to calculate density, which for air is shown in equation 7:
𝜌𝜌8 =9
":;< Equation 7
where P is the absolute pressure, Pa, and T is the air temperature, K.
For this study, a sparger-exit air density of 1.662 kg/m3 was calculated. This density was used to compute the initial mass of the bubbles exiting the sparger. For the compressible gas model, ANSYS automatically calculates the changing density within the vessel due to pressure variations.
is the liquid density, kg/m3; and
9. The high-resolution scheme was used for turbulence and advection. This scheme tries to use second-order numerics as much as possible. A sensitivity study was performed using first order for turbulence, and there was a significant difference in kLa.
Bubble Diameter Exiting the Sparger
The initial bubble size out of the sparger was taken as uniform (a typical CFD approach for an air-sparged bioreactor) with a size that was calculated from equation 6 [3].
𝑑𝑑1 = % -2/%0('!4'&)
&)/6
Equation 6
where σ is the water surface tension, N/m; 𝑑𝑑7 is the sparger hole size, m; 𝜌𝜌! is the liquid density, kg/m3; and 𝜌𝜌8 is the air density, kg/m3.
Because the bubble diameter is related to the one-third power of the sparger orifice diameter, the sparge orifice diameter would have to reduce by a factor of 8 to cut the exit bubble size by half. For our study, a sparger-exit air bubble diameter of 9.8 mm was calculated, and 10 different bubble size groups were used. The smallest bubble diameter modeled was 1.60 mm (group 1) and the largest was 16.40 mm (group 10). The bubble size between adjacent bubble groups increased in size by an equal amount of 1.64 mm (e.g., the bubble diameter in group 2 was 3.2 mm).
Air Mass Flow Rate and Density at Sparger
A total mass flow rate was specified at the sparger holes. The volumetric airflow rates provided in Table 2, later in this article, were referenced to a temperature of 0°C (32°F) and pressure of 1 atmosphere, representing normal flow conditions (European standard). The appropriate mass flow rate was determined by multiplying the volumetric flow rate by the air density at 0°C and 1 atmosphere of pressure, which is taken to be 1.295 kg/m3. The following is an example of this calculation:
Mass flow rate = 200 L/min × (m3/1,000 L) × 1.295 kg/m3 = 0.259 kg/min
The density at normal conditions was only used to determine the mass flow rate out of the sparger; however, this did not represent the actual density of the air coming out of the sparger. The air density coming out of the sparger was based on an assumed temperature of 26.7°C (80°F) and accounted for vessel pressure along with hydrostatic head. The ideal gas law was used to calculate density, which for air is shown in equation 7:
𝜌𝜌8 =9
":;< Equation 7
where P is the absolute pressure, Pa, and T is the air temperature, K.
For this study, a sparger-exit air density of 1.662 kg/m3 was calculated. This density was used to compute the initial mass of the bubbles exiting the sparger. For the compressible gas model, ANSYS automatically calculates the changing density within the vessel due to pressure variations.
is the air density, kg/m3.Because the bubble diameter is related to the one-third power
of the sparger ori� ce diameter, the sparge ori� ce diameter would have to reduce by a factor of 8 to cut the exit bubble size by half. For our study, a sparger-exit air bubble diameter of 9.8 mm was calcu-lated, and 10 di� erent bubble size groups were used. The smallest bubble diameter modeled was 1.60 mm (group 1) and the largest was 16.40 mm (group 10). The bubble size between adjacent bubble groups increased in size by an equal amount of 1.64 mm (e.g., the bubble diameter in group 2 was 3.2 mm).
Air Mass Flow Rate and Density at SpargerA total mass � ow rate was speci� ed at the sparger holes. The volu-metric air� ow rates provided in Table 2, later in this article, were referenced to a temperature of 0°C (32°F) and pressure of 1 atmos-phere, representing normal � ow conditions (European standard). The appropriate mass � ow rate was determined by multiplying the volumetric � ow rate by the air density at 0°C and 1 atmosphere of pressure, which is taken to be 1.295 kg/m3. The following is an example of this calculation:
Mass � ow rate = 200 L/min × (m3/1,000 L) × 1.295 kg/m3 = 0.259 kg/min
The density at normal conditions was only used to determine the mass � ow rate out of the sparger; however, this did not repre-sent the actual density of the air coming out of the sparger. The air density coming out of the sparger was based on an assumed tem-perature of 26.7°C (80°F) and accounted for vessel pressure along with hydrostatic head. The ideal gas law was used to calculate density, which for air is shown in equation 7:
9. The high-resolution scheme was used for turbulence and advection. This scheme tries to use second-order numerics as much as possible. A sensitivity study was performed using first order for turbulence, and there was a significant difference in kLa.
Bubble Diameter Exiting the Sparger
The initial bubble size out of the sparger was taken as uniform (a typical CFD approach for an air-sparged bioreactor) with a size that was calculated from equation 6 [3].
𝑑𝑑1 = % -2/%0('!4'&)
&)/6
Equation 6
where σ is the water surface tension, N/m; 𝑑𝑑7 is the sparger hole size, m; 𝜌𝜌! is the liquid density, kg/m3; and 𝜌𝜌8 is the air density, kg/m3.
Because the bubble diameter is related to the one-third power of the sparger orifice diameter, the sparge orifice diameter would have to reduce by a factor of 8 to cut the exit bubble size by half. For our study, a sparger-exit air bubble diameter of 9.8 mm was calculated, and 10 different bubble size groups were used. The smallest bubble diameter modeled was 1.60 mm (group 1) and the largest was 16.40 mm (group 10). The bubble size between adjacent bubble groups increased in size by an equal amount of 1.64 mm (e.g., the bubble diameter in group 2 was 3.2 mm).
Air Mass Flow Rate and Density at Sparger
A total mass flow rate was specified at the sparger holes. The volumetric airflow rates provided in Table 2, later in this article, were referenced to a temperature of 0°C (32°F) and pressure of 1 atmosphere, representing normal flow conditions (European standard). The appropriate mass flow rate was determined by multiplying the volumetric flow rate by the air density at 0°C and 1 atmosphere of pressure, which is taken to be 1.295 kg/m3. The following is an example of this calculation:
Mass flow rate = 200 L/min × (m3/1,000 L) × 1.295 kg/m3 = 0.259 kg/min
The density at normal conditions was only used to determine the mass flow rate out of the sparger; however, this did not represent the actual density of the air coming out of the sparger. The air density coming out of the sparger was based on an assumed temperature of 26.7°C (80°F) and accounted for vessel pressure along with hydrostatic head. The ideal gas law was used to calculate density, which for air is shown in equation 7:
𝜌𝜌8 =9
":;< Equation 7
where P is the absolute pressure, Pa, and T is the air temperature, K.
For this study, a sparger-exit air density of 1.662 kg/m3 was calculated. This density was used to compute the initial mass of the bubbles exiting the sparger. For the compressible gas model, ANSYS automatically calculates the changing density within the vessel due to pressure variations.
Mesh Independence SolutionAn unstructured mesh using tetrahedral elements was used with mesh in� ation. The � nal mesh parameters were set by performing a mesh independence study on the volumes surrounding the impellers, and literature available in the public domain was used to set the vessel mesh. Figure 1 illustrates the mesh used for � nal simulations.
The mesh included inflation layers at solid surfaces and was adjusted to provide an area average y+ value of approximately 30. Three in� ation layers were used, with a default growth rate of 1.2 (i.e., successive in� ation layers are 20% thicker). The y+ values were mon-itored individually for the top impeller, bottom impeller, and vessel. The mesh independence study performed by Sarkar and colleagues [3] was leveraged for the nonrotating vessel mesh. This reference achieved mesh independence with 1.24 million elements for a CFD model that contained three impellers. Within our study, the static vessel volume alone was meshed with approximately this number of elements (1.2 million elements), so it was assumed that mesh inde-pendence was achieved for the vessel volume; this approach is considered conservative. If one wished to speed up the solver pro-gress, it might be possible to coarsen the nonrotating vessel mesh and
TECHNICAL
F igure 1: Fluid volume mesh (left) and impeller surface mesh (right).
PROCESS TECHNOLOGY
Equation 6
Equation 7
Vessel wall
Upper rotating volume
Ba� e
Impeller system
Lower rotating volume

S e p t e m b e r / o c t o b e r 2 0 2 0 6 5
still get accurate results. Although we did not perform a mesh inde-pendence study on the static vessel volume, a mesh sensitivity study was performed on the rotating impeller volumes using setup 2 (incompressible gas model with second-order pressure-velocity cou-pling) for simulation 3 (see Table 2, later in the article, for operating parameters). Table 1 shows the results of this study.
Three mesh sensitivity runs were performed, which included increasing the mesh density of the individual impellers by approx-imately 70% when going from run 1 to run 2 and again when going from run 2 to run 3. From the various outputs (e.g., kLa, torque) shown in Table 1, it seemed that mesh independence was achieved with the mesh of run 2, although the torque seemed to move up with each run. In reality, the torque, as well as many other param-eters, � uctuated in a tight range, and there was no signi� cant dif-ference in torque when the � uctuations were considered.
The kLa values for the individual (impeller and vessel) volumes and for the overall volumes were tracked throughout the solver run. The overall kLa shifted higher from run 1 to run 2, but it remained approximately the same from run 2 to run 3. The kLa displayed evidence of monotonic convergence, where the di� er-ence in kLa between runs 2 and 3 was negligible and much smaller than the di� erence between runs 1 and 2. It is unlikely that further mesh re� nement would change the kLa value; thus, it was assumed that mesh independence had been reached.
The kLa for the top impeller shifted an insigni� cant amount when going from run 1 to run 2 and remained the same when going from run 2 to run 3. For the bottom impeller, the kLa jumped slightly when going from run 1 to run 2, and again when going from run 2 to run 3; however, the kLa from run 3 trended back down to approximately the same level as run 2.
For conservatism in subsequent simulations: u The bottom impeller mesh from run 3 was used (although the
coarser mesh from run 2 could also have been used); and u The top impeller mesh from run 2 was used—except in
simulation 3, which used the top impeller mesh from run 3. Note that this likely did not impact the results because the kLa was practically unchanged between run/mesh 2 and run/mesh 3.This translated to a total of 2,430,790 mesh elements being
used for the subsequent runs of simulations 1 and 2 and a total of 2,798,712 mesh elements for subsequent runs of simulation 3.
RESULTSFigures 2 and 3 show the air volume fraction and oxygen transfer rate distributions, respectively, for all � nal simulations. The dif-ferences between the noncompressible and compressible second-order pressure-velocity coupling runs are not as signi� cant as the di� erences between the fourth-order and second-order pressure-velocity coupling runs. This is not surprising because fourth-order numerics will capture more detail. The air volume fraction � gures (Figure 2) show evidence that � ooding occurred for simulation 1, which was operating at 25 RPM and 200 NLPM (see Table 2) because the impellers were not properly dispersing the gas phase; regions in blue contained little to no gas.
ConvergenceWe tracked residuals, various outputs (e.g., forces, Sauter diame-ter, kLa), and imbalances during the solver run for insight into convergence. Residual root mean square (RMS) levels typically fell below 5E-3 for all equation classes (e.g., momentum, mass, bub-ble-size fraction), although not all equation classes fell below RMS values 1E-4. Other researchers encountered similar high residual levels for these types of simulations [2, 3, 6]. We also used double precision and found no noticeable improvement for lowering residual values.
We tracked all imbalances, and most equation classes bounced around an imbalance of zero. Typical CFD guidance suggests that all imbalances are less than 1% before a solution can be considered converged; however, for these simulations, this was not possible
T able 1: Mesh study for simulation 3 (incompressible).
Parameter Run 1 Run 2 Run 3
Vessel elements 1,168,768 1,168,768 1,168,768
Top impeller elements 305,292 547,739 915,661
Bottom impeller elements 236,710 413,539 714,283
Total elements 1,710,770 2,130,046 2,798,712
Gas holdup (%) 0.52 0.52 0.51
kLa (hr–1)* 7.7 8.0 8.1
Torque (N/m) 79.6 80.5 82.3
Sauter diameter (mm) 3.6 3.6 3.6
*kLa shown is based on using a 0.4 constant.
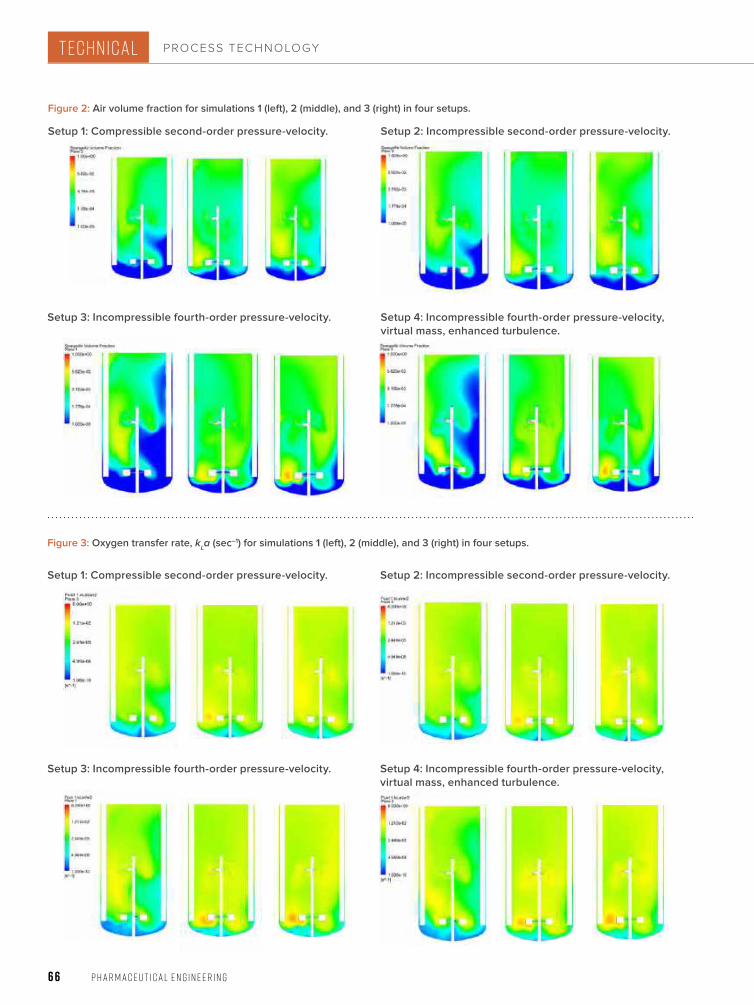
6 6 P h a r m a c e u t i c a l E n g i n e e r i n g
TECHNICAL
Fig ure 2: Air volume fraction for simulations 1 (left), 2 (middle), and 3 (right) in four setups.
Fig ure 3: Oxygen transfer rate, kLa (sec–1) for simulations 1 (left), 2 (middle), and 3 (right) in four setups.
Setup 1: Compressible second-order pressure-velocity. Setup 2: Incompressible second-order pressure-velocity.
Setup 3: Incompressible fourth-order pressure-velocity. Setup 4: Incompressible fourth-order pressure-velocity, virtual mass, enhanced turbulence.
Setup 4: Incompressible fourth-order pressure-velocity, virtual mass, enhanced turbulence.
Setup 3: Incompressible fourth-order pressure-velocity.
Setup 2: Incompressible second-order pressure-velocity.Setup 1: Compressible second-order pressure-velocity.
PROCESS TECHNOLOGY

S e p t e m b e r / o c t o b e r 2 0 2 0 6 7
because it was typical for some equation classes to bounce around at ±5%.
In all the simulations, the steadiness of various output param-eters (e.g., forces, kLa, gas holdup) was tracked for a prediction on convergence. A time-step size no larger than 0.01 seconds was used for all final simulations, although one must initially use a much smaller time step (such as 1E-5 sec) to avoid crashing the linear solver. This time step is then steadily increased up to 0.01 seconds as the solution progresses. The time step acts as a relaxation factor
for steady-state ANSYS CFX simulations, and one may have to experiment with it for each unique model.
DISCUSSIONBecause only kLa experimental results were available, this was the only parameter that was compared between CFD simulations and experimental data. Simulation 3 was used as the benchmarking case to adjust the kLa constant so its kLa matched experimental data. Benchmarking required for the kLa constant to be updated
Tab le 2: CFD versus experimental data for two bioreactors.
Simulation No. Impeller Speed (RPM)
Sparge Air Rate (NLPM)
Experimental kLa (hr–1)
CFD kLa (hr–1) % Di� erence
Setup 1: Compressible second-order pressure-velocity
1** 25 200 4.25 4.10 3.4
2** 38 200 10.33 7.06 31.6
3* 38 400 12.43 12.43 0.0
Setup 2: Incompressible second-order pressure-velocity
1** 25 200 4.25 4.22 0.6
2** 38 200 10.33 7.14 30.8
3* 38 400 12.43 12.43 0.0
Setup 3: Incompressible fourth-order pressure-velocity
1** 25 200 4.25 4.14 2.4
2** 38 200 10.33 8.96 13.2
3* 38 400 12.43 12.43 0.0
Setup 4: Incompressible fourth-order pressure-velocity, virtual mass, enhanced turbulence
1** 25 200 4.25 4.06 4.5
2** 38 200 10.33 9.47 8.3
3* 38 400 12.43 12.43 0.0
New bioreactor using setup 4
1* 41 250 5.76 5.76 0.0
2** 28 158 2.27 2.18 4.0
3** 28 250 4.35 3.68 15.4
4** 28 333 5.90 4.97 15.9
*Benchmarked case**Predicted case

6 8 P h a r m a c e u t i c a l E n g i n e e r i n g
from 0.4 to 0.53 for setup 1, from 0.4 to 0.58 for setup 2, from 0.4 to 0.53 for setup 3, and from 0.4 to 0.50 for setup 4.
After discovering setup 4 (i.e., incompressible, fourth-order pressure-velocity coupling, virtual mass, enhanced turbulence) provided for the most accurate results, we applied this setup to a completely different bioreactor, which had a different working volume, dual-pitched blade impellers, and a di� erent gas sparger design. A mesh independence study for this bioreactor was not performed. Instead, this bioreactor was meshed with a total of 2,548,980 elements using a similar mesh-sizing approach as the previous bioreactor model. The bottom impeller volume was meshed with 563,407 elements, the top impeller volume was meshed with 591,214 elements, and the vessel was meshed with 1,394,359 elements. The predicted results were similar in that kLa was predicted accurately (within 16%), this time using a kLa con-stant of 0.4 from the benchmarked case. Table 2 shows the CFD versus experimental data for both bioreactors.
As can be seen in Table 2, CFD correctly predicted the kLa trend with setup 4, with the best agreement against experimental data (within 16%). Further, CFD visually illustrated the local kLa and gas fractions, providing valuable insight into potential design and process improvements.
CONCLUSIONThe difference between the compressible and incompressible second-order models was minor, with the incompressible model providing slightly better results with experimental data. This result is counterintuitive because the air bubbles change density as they travel toward the free surface. The incompressible fourth-order pressure-velocity coupling models o� ered a better comparison against experimental data, with the virtual mass and enhanced turbulence (Sato) model predicting results within 16% of experimental data, tested on two di� erent bioreactors; however, CFD underpredicted kLa.
Although experimental data were used for benchmarking, applying this method (i.e., setup 4) does not require experimental data if the purpose is to determine what operating conditions (i.e., impeller speed and sparge rate) will maximize mass transfer for a � xed-system geometry. One can just use a kLa constant of 0.4 (or any other reasonable value) to gauge the relative di� erence in per-formance between operating conditions. The method described here shows that good CFD results are achieved even for a � ooding scenario and with high residual values, as long as the various vari-ables of interest have shown a plateau.
The results of this study demonstrate that CFD can be valuable for predicting bioreactor mass transfer performance and for opti-mization purposes, provided the model is setup appropriately.
2. Ranganathan, P., and S. Sivaraman. “Investigations on Hydrodynamics and Mass Transfer in Gas–Liquid Stirred Reactor Using Computational Fluid Dynamics.” Chemical Engineering Science 66, no. 14 (2011): 3108–3124. doi:10.1016/j.ces.2011.03.007
3. Sarkar, J., L. K. Shekhawat, V. Loomba, and A. S. Rathore. “CFD of Mixing of Multi-Phase Flow in a Bioreactor Using Population Balance Model.” Biotechnology Progress 32, no. 3 (2016): 613–628. doi:10.1002/btpr.2242
4. Taniguchi, S., S. Kawaguchi, and A. Kikuchi. “Fluid Flow and Gas-Liquid Mass Transfer in Gas-Injected Vessel.” Presented at the Second International Conference on CFD in the Materials and Process Industries. CSIRO, Melbourne Australia. 6–8 December 1999.
5. Petitti, M., M. Vanni, D. L. Marchisio, A. Buff o, and F. Podenzani. “Simulation of Coalescence, Break-up and Mass Transfer in a Gas–Liquid Stirred Tank with CQMOM.” Chemical Engineering Journal 228 (2013): 1182–1194. doi:10.1016/j.cej.2013.05.047
6. Aubin, J., D. F. Fletcher, and C. Xuereb. “Modeling Turbulent Flow in Stirred Tanks with CFD: The Infl uence of the Modeling Approach, Turbulence Model and Numerical Scheme.” Experimental Thermal and Fluid Science 2, no. 5 (2004): 431–445. doi:10.1016/j.expthermfl usci.2003.04.001
7. Luo, S. M., and H. Svendsen. “Theoretical Model for Drop and Bubble Breakup in Turbulent Dispersions.” AIChE Journal 42, no. 5 (1996): 1225–1233. doi:10.1002/aic.690420505
8. Prince, M., and H. Blanch. “Bubble Coalescence and Break-Up in Air-Sparged Bubble Columns.” AIChE Journal 36, no. 10 (1990): 1485–1499. doi:10.1002/aic.690361004
9. Ishii, M., and N. Zuber. “Drag Coeffi cient and Relative Velocity in Bubbly, Droplet or Particulate Flows.” AIChE Journal 25, no. 5 (1979): 843–855. doi:10.1002/aic.690250513
10. Burns, A. D. B., T. Frank, I. Hamill, and J. M. Shi. “The Favre Averaged Drag Model for Turbulent Dispersion in Eulerian Multi-Phase Flows.” Presented at the 5th International Conference on Multiphase Flow, ICMF-2004, Yokohama, Japan.
AcknowledgmentsSpecial thanks to Dallan Seah and Paresh Gigras for providing support and insight. We would also like to acknowledge and thank Mrudang M. Shah, PhD, PPM, of ADVENT Engineering, for supporting CFD technology. This research did not receive any specifi c grant from funding agencies in the public, commercial, or not-for-profi t sectors.
About the authorsElijio Prado is a Senior Mechanical Engineer for ADVENT Engineering, a Trinity Consultants Company, which is an engineering and compliance solution provider to the life sciences industry. He received his BS in mechanical engineering from California Polytechnic State University and his MS in mechanical and aeronautical engineering from the University of California, Davis. Elijio has 18 years of experience working in the biopharmaceutical and energy industry and is a registered professional mechanical engineer in the states of California and Washington. His background spans biopharmaceutical projects that include validation, commissioning, bioreactor studies, and quality assurance. His mechanical engineering projects include mechanical equipment sizing, analysis, design and testing. Elijio was fi rst introduced to the world of CFD approximately 15 years ago and has used CFD to study various physical processes, including heat transfer, fl uid fl ow, and mass transfer.
Albert Dyrness is the Managing Director of ADVENT Engineering, a Trinity Consultants Company. Albert has more than 20 years of experience in process engineering and consulting. He is a member of the American Society of Mechanical Engineers Bioprocess Equipment (ASME BPE) Standards Committee and the Chairperson for the ASME BPE System Design Subcommittee. Albert received an MS in mechanical engineering from Massachusetts Institute of Technology and holds professional engineering licenses in the state of California for chemical engineering and mechanical engineering. He has been an ISPE member since 1997.
TECHNICAL PROCESS TECHNOLOGY
References1. Talaia, M. A. R. “Terminal Velocity of a Bubble Rise in a Liquid Column.” World Academy of
Science, Engineering and Technology International Journal of Physical and Mathematical Sciences 1, no. 4 (2007): 220–224.

S e p t e m b e r / o c t o b e r 2 0 2 0 6 9
TECHNICAL STERIL IZ ATION EQUIPMENT
SELF-CALIBRATING THERMOMETERS for Use in Medical Autoclaves By Fritz Röder and Dietmar Saecker
A temperature sensor in a medical autoclave is typically calibrated once a year. If the sensor proves to be inaccurate, all batches produced since the last calibration must be evaluated. Endress+Hauser has developed a self-calibrating sensor that automatically verifi es its accuracy during each sterilization batch. This article describes a case study at the Merck Healthcare KGaA sterile facility in Darmstadt, Germany, using the new sensor in a steam sterilizer and corresponding risk and benefi t considerations for possible routine use of this type of sensor in pharmaceutical applications.
Pharmaceuticals intended for injection into the human body or for implantation must be sterile. It is common knowledge that sterility is always a probabilistic attribute, not absolute. Sterility of a product means the theoretical probability of a
nonsterile unit (PNSU) must be less than 10-6. To guarantee this level of sterility assurance, the materials may undergo di� erent types of sterilization processes. According to EMA [1] and US Pharmacopeia [2] guidelines, steam sterilization is the preferred method when the material to be sterilized is capable of withstand-ing these high temperatures.
Typical sterilization processes employ temperatures around 121°C. The steam sterilization process is conducted as follows: Air is removed from the autoclave during consecutive prevacuum stages. A supply of saturated steam is then introduced into the process chamber under pressure to heat the products to approxi-mately 123°C for more than 15 minutes (to always be above the desired 121°C). If temperatures in the sterilization process are not verified to be accurately measured, it cannot be determined whether the autoclave functions as it should. For that reason, cali-bration of temperature sensors is essential.
Mechanical impact on the temperature sensor can signifi-cantly a� ect its measuring accuracy. For example, the thermome-ter could be mechanically damaged when goods are pushed onto the carriage if the products slip during loading or unloading and remain suspended on the slightly protruding temperature sensor. Regular, automatic calibration for each batch (i.e., each time goods are loaded/unloaded) would eliminate the risk of this error remaining undetected for a long period.
SELF-CALIBRATING SENSOR FUNCTIONALITYThe sensor in this study (speci� cally, an iTHERM TrustSens TM371) employs a self-calibration method that uses the Curie temperature (Tc) of a reference material as the built-in temperature reference. The reference material in the sensor is not subject to change due to its properties and because this � xpoint cell is protected inside the sensor itself. Because the Tc of the reference material is a constant, it is used as the calibration reference.
Figure 1: Diagram of the self-calibrating sensor showing the optimal cooling rate for calibration.

7 0 P h a r m a c e u t i c a l E n g i n e e r i n g
Once the reference material reaches the Tc, the material under-goes a phase change associated with a change in its electrical properties (capacity). The self-calibrating sensor’s electronics unit detects this change in properties automatically and compares the temperature measured by a Pt100 sensor—a resistance tempera-ture detector with a resistance (R) of 100 ohms at 0°C—with the known Tc (Figure 1).
Self-calibration is performed automatically when the process temperature (Tp) drops below the nominal Tc of the device. A � ash-ing green LED indicates that the self-calibration process is in pro-gress. Once complete, the thermometer’s electronics unit saves the calibration results.
This in-line self-calibration makes it possible to continuously and repeatedly monitor changes to the properties of the Pt100 sensor and the electronics unit. Because the in-line calibration is performed under real ambient or process conditions (e.g., heating of the electronics unit), the result is more closely aligned with actual function than a sensor calibration performed under labora-tory conditions.
Self-calibration is veri� ed directly in the thermometer’s termi-nal sensor head, which can be accessed from outside of the auto-clave. The sensor’s measuring signals (Tp, number of calibrations completed, and the calibration deviation factor) can be transferred directly to the process control system or to a suitable data manager capable of handling data in accordance with data integrity requirements.
A calibration certi� cate can be automatically created for the self-calibration. The automatically generated calibration certi� -cate can be assigned to every sterilization batch, providing not only documentary proof that the temperature sensor is function-ing correctly at that particular time but also evidence of the
sterility of the batch, given sufficient exposure time. Self-calibration is only completed if the temperature at the sensor also reaches the required sterilization temperature.
CASE STUDY METHODS AND FINDINGSThe study was conducted using the self-calibrating sensor in a steam sterilizer for a period of about four weeks. During this time, about 80 successful calibrations were performed, which means there were nearly two batches and two calibrations performed each day.
To facilitate the most e� cient calibration procedure possible, a slow temperature change in the process is required. As shown in Figure 1, the optimum cooling rate for sensor calibration lies between –0.5 K/min and –16.5 K/min. In the case of the steam sterilizer, the calibration point of the self-calibrating sensor was 118°C, which is very close to the Tp of 123°C (see Figure 2); there-fore, the automatic calibration was performed in the working range of the desired sterilization process parameters. The tem-perature elevated through the calibration point of 118°C before the sterilization period and passed it again during the cooling phase after sterilization. The cooling phase was chosen to per-form calibration because the temperature change is slower dur-ing cooling.
Typically in a steam sterilizer, four to six temperature sensors are installed in di� erent locations and for di� erent purposes. For the study, the self-calibrating sensor was installed at the coldest point in the autoclave, next to an existing sensor to establish a second temperature reference (see Figure 3). During quali� cation of a sterilizer, temperature mapping is usually carried out to determine the worst positioning of the sensor. In the case study, this position was on the chamber � oor near the door.
Figure 2: A typical temperature profi le for two consecutive batches, including calibration.Te
mp
erat
ure
[°C
]
Operation Time [h]
Temp [°C]
Reference Calibration
TECHNICAL STERIL IZ ATION EQUIPMENT

S e p t e m b e r / o c t o b e r 2 0 2 0 7 1
Figure 3: Position of the temperature sensor inside the sterilizer. Reprinted with permission from Merck Healthcare KGaA Darmstadt. T indicates the thermometer; C is carriage.
Figure 4: Calibration results of self-calibration vs. temperature and time related to standard operating procedures (SOPs) and conventional standards.
-1000
-800
-600
-400
-200
0
200
400
600
800
1000
0 50 100 150
Dete
cted
Dev
iatio
n, a
ccep
ted
tole
ranc
es, S
OPs
[mill
ikel
vin]
Temperature [°C]
SOP limit +
+ Standard tolerances of a Pt100 cl. AA incl. electronictransmitter
- Standard tolerances of a Pt100 cl. AA incl.electronic transmitter
- Typical SOP limit
Detected deviations during dynamic self-calibrations at 118°C/244.4°F in the autoclave
Laboratory calibration after the test -1000
-800
-600
-400
-200
0
200
400
600
800
1000
0 100 200 300 400 500 600
Det
ecte
d D
evia
tion,
acc
epte
d to
lera
nces
, SO
Ps [m
illik
elvi
n]
Operation Time [h]

7 2 P h a r m a c e u t i c a l E n g i n e e r i n g
Upon completion of the study, all data were collected and ana-lyzed. In addition, the probe was calibrated in an accredited cali-bration lab before and after the study.
All 80 performed calibrations were successful, and the sensor accuracy was within speci� ed limits (see Figure 4). The 80 calibra-tion results were more accurate than a class AA Pt100 sensor [3], considering that a state-of-the-art digital temperature transmitter adds another uncertainty of ±0.1 K.
Neither the laboratory calibrations before and after the test nor the trendline of the automatic calibrations showed any signi� cant signs of wear or drift. Overall, the study was considered as success-ful and the sensor was found suitable for sterilization processes.
INCREASED PRODUCT SAFETYOur study showed that 80 automatic calibrations can be generated in 600 operation hours. If the critical temperature sensor is work-ing as expected, that would lead to more than 1,100 calibrations per year, not including the manual standard calibration completed periodically (e.g., once a year) according standard operating proce-dures (SOPs).
Calibration automatically performed with every batch ensures that a damaged thermometer is promptly detected. If the sensor veri� es its accuracy and the calibration counter has increased, this indicates that the sterilization was successful. However, if the thermometer gives incorrect results, a warning message is gener-ated by the self-calibrating sensor to immediately indicate a prob-lem, informing the user that the actual product batch might not be fully sterilized and must not be used in further production until a second sterilization cycle has taken place (assuming a second cycle is possible).
In contrast, if normal calibration intervals used in conventional systems (e.g., once a year) are used, a thermometer identified as faulty after a manual calibration cannot be linked to a single batch. Instead, all batches that have been sterilized since the last calibra-tion event have to be incorporated into the deviation investigation. This results in complex root-cause analyzes and, at worst, product recalls, causing considerable expense and damage to the brand.
TRADITIONAL VS. AUTOMATED PROCEDURESNotably, traditional calibration conducts testing at three points, whereas the automated procedure employs one-point calibration. These approaches are discussed in the following sections.
Automatic Detection of Sensor DriftsAt T >0°C, the characteristic relationship between the raw signal (resistance) and the temperature of every Pt100 sensor follows the Callendar–van Dusen equation [3]:
R(T) = R(0) [1 + A × T + B × T2]
where T is measured in °C.
As the name of the Pt100 sensor suggests, the average value R(0) for the sensor is 100 ohm at 0°C; additionally, each self-calibrating thermometer is calibrated during the production
process to individually determine the exact values for A, B, and R(0). This delivery state is recorded electronically.
As long the Pt100 sensor is not broken (wire-cut or short-circuited), it follows this equation. But for a “bad” (already drifted) sensor, the value of at least one parameter—R(0), A, or B—has changed. In every case, this will change not only a single tempera-ture but also the complete characteristic curve.
The principle of the one-point automatic calibration is as fol-lows: If a signi� cant deviation between the Pt100 temperature and a reference temperature (which was not 0°C) is detected, the ther-mometer cannot be accurate at any other temperature, which is also not 0°C. To avoid the risks of undetected drifts, the self-calibrated thermometer will alert operators about the malfunction.
Conversely, the following principle also applies: If the ther-mometer does not show any signi� cant change in the calibration deviation at the reference point, it is extremely unlikely that the parameters of the equation have changed since the previous cali-bration. With unchanged values for R(0), A, and B, the thermome-ter is not only accurate at the calibration point but also measures all other temperatures as accurately as it did previously.
One-Point Self-Calibration Measurement UncertaintyAn analysis conducted by Technische Universität Ilmenau (TU Ilmenau) veri� es how a deviation at 118°C a� ects the entire meas-uring range [4, 5]. Calibration uncertainty at Tc of ±0.35 K was certi-fied by the German technical inspection association TÜV [6]. Additionally, TÜV examined the calibration process as part of a study. In particular, they analyzed more than 24,000 calibrations [7], and none of the results analyzed presented a deviation of more than 0.2 K.
Manual Calibration Measurement UncertaintyTo de� nitively assess the in-process self-calibration procedure, it is advisable to take a closer look at the method commonly used today. To check the accuracy of thermometers for hygienic applica-tions, companies often use dry block calibrators for onsite calibra-tion. Three temperature points are usually used in this process. However, thermometers in this industry usually have quite a short immersion length, as thin pipes or agitators in tanks only offer limited space for installation, and this means that there is often a signi� cant physical distance between the point where a reference thermometer measures the temperature of the calibrator and the position of the sensor to be tested.
To determine the uncertainty of measurement that a calibration of this kind can have, it is advisable to refer to the website of a national accreditation institute, such as Deutsche Akkreditierungsstelle GmbH (DAkkS) in Germany. The directory of accredited bodies also lists numerous companies specialized in performing onsite calibrations.
We suggest the accredited calibration laboratory TEMEKA GmbH (DAkkS D-K-15024-01-00) in Germany as a benchmark. This company does not produce measuring instruments itself but is specialized in performing calibrations onsite at its customers’
TECHNICAL STERIL IZ ATION EQUIPMENT

S e p t e m b e r / o c t o b e r 2 0 2 0 7 3
premises. According to the accreditation certi� cate, the company uses dry block calibrators to check resistance thermometers [8]. These specialists reach ±0.75 K as the accredited best measurement capability in the sterilization temperature range. For the industry user, this raises the following questions: u Can a calibration in the dry block calibrator, which is per-
formed by the user, be more accurate than calibration com-pleted by specialists?
u Was this calibration uncertainty value already included into the SOP limit for the acceptable deviation of a thermometer?
u Would an in-process one-point calibration provide more accu-racy than an o� ine three-point calibration?
A direct comparison reveals the following: Given its far lower uncertainty of measurement, an in-process single-point calibration (±0.35 K) provides a more reliable statement of conformity than a manual check performed at three points using a dry block calibra-tor (±0.75 K), particularly for the critical temperature range around the sterilization temperature; this conclusion is especially true if we consider whether calibration is performed manually once a year or automatically for every cleaning process. Table 1 outlines the advantages, disadvantages, and operating expenses identi� ed when comparing in-process one-point calibration and off line
three-point calibration as well as a third method in which the manual calibration interval is triggered by self-calibration results.
ENHANCED FUNCTIONALITYSelf-calibrating thermometers that are connected to a modern process control system or data manager can provide other data in addition to temperature measurement values. Using the HART protocol, it is also possible to collect “calibration counter” and “last recorded calibration deviation” values.
When these values are continuously queried, an alarm can be generated if the calibration deviation exceeds an established limit. The date and time of the calibration can be checked in a connected system (e.g., process control system or data manager) because the deviation is marked at the moment when the calibration counter increases by 1. With this technology, it is possible to generate an online calibration certi� cate that can be viewed any time on site or in the network.
PROCESS SAFETY AND AUDIT RELIABILITY
SOPs and the Change Management ProcessMany companies have established SOPs that stipulate a three-point calibration for thermometers. Such SOPs re� ect the current
Table 1: Comparison of calibration methods.
O� ine Three-Point Manual Calibration
In-Process One-Point Self-Calibration
Dynamic Control of Manual Calibration Interval, Triggered by Self-Calibration Results
Positives• Well-known and established method.
• No change of SOP documents.
• No deinstallation or process interruptions are required.
• Sensor failures can be detected with every batch.
• After detection of thermometer drift, the number of batches produced with a “bad” sensor = 1 (i.e., the product that was in the autoclave).
• Manual calibration interval can be extended, but an additional calibration will be performed immediately if sensor shows a signifi cant tendency to drift toward a SOP limit or if detected deviation changes suddenly.
• Sensor failures can be detected with every batch.
• After detection of thermometer drift, the number of batches produced with a “bad” sensor = 1 (i.e., the product that was in the autoclave).
• GMP rules do not prescribe specifi c calibration intervals (e.g., 12 months), although length of intervals must be justifi ed.
Negatives
• No chance to identify sensor drift between two manual calibrations.
• Frequent deinstallation with process interruption is required.
• After drift detection, the number of batches produced before is unknown.
• Method is new and must be explained to the inspectors.
• SOP documents must be changed.• Self-calibration method is new and must be explained to the inspectors.
Operating expense • No e� ect. • High cost-saving e� ect. • Medium cost-saving e� ect.

74 P h a r m a c e u t i c a l E n g i n e e r i n g
state-of-the-art method used to obtain the clearest possible tem-perature curves for calibration. This approach aligns with expec-tations of auditors and regulatory authorities because there was no alternative until now.
Notably, the biggest risks for a thermometer in a hygienic system arise from the conventional calibration process itself. Opening the devices, removing the insert, connecting and disconnecting electri-cal contacts, introducing the thermometer into the calibrator, or transporting the thermometer to the laboratory increases the likeli-hood of mechanical damage, such as from impact. Furthermore, it is often unclear what is the best way to return the measurement to the exact same measuring position in the process after removing the insert for calibration purposes. With the in-process single-point calibration temperature sensor, these risks are reduced because the sensor stays in one position while being self-calibrated.
Data integrity risks related to the self-calibrated sensor were assessed prior to starting the study, and no potential data integrity breaches could be identi� ed [9, 10]. All data are stored directly in the sensor, and after each calibration, a PDF calibration report is automatically generated and can be stored in a protected and compliant manner.
Continuous Process Verifi cation In recent years, the life-cycle model has been adopted in regulatory landscapes all over the world. The shift from the traditional process validation approach to continuous process veri� cation (CPV) is evi-dent in the US [11], EU [12], and elsewhere. Because the new calibra-tion technology strongly increases process control, it supports the CPV approach. In-process single-point calibration reduces the risk of a deviation going undetected until the next calibration to the absolute minimum level possible with current technology. This is achieved without compromising calibration accuracy.
In addition, any calibration deviation with the new sensor would only a� ect a single batch (the one inside the sterilizer at the time of deviation), and the equipment can immediately generate an alarm. With the traditional approach, all batches since the last calibration (probably one year ago) would be subject to the investi-gation. In addition, many of the products processed in the compro-mised sterilizer could have already been administered to patients.
The ISPE Pharma 4.0™ Special Interest Group (SIG) launched its Pharma 4.0™ operating model, which describes the digital maturity of a company and the traceability of information. With the addition of self-calibration, traceability and trust of sensor-generated informa-tion about temperature are enhanced. If other process parameters could also self-calibrate, that would provide bene� ts for the process analytical technology concept and real-time release testing.
CONCLUSIONThe study conducted using the sterilizer at Merck Healthcare building PH50 in Darmstadt, showed successful results concern-ing the implementation of a self-calibrating thermometer in steri-lization processes. The overall process control was increased, which should be a main goal for any pharmaceutical company.
Some considerations regarding cost have been assessed. For a typical application, the return on investment should be reached after approximately 1.5 years, assuming all temperature sensors for one sterilizer are replaced with self-calibrating temperature sensors.
Important topics for future discussion include overall risk and the comparison of the batch-wise one -point calibration to the tra-ditional approach. Opinions from regulatory representatives on the future outlook of this new process would be appreciated.
References 1. European Commission. “EudraLex Volume 3: Sterilisation of the Medicinal Product, Active
Substance, Excipient and Primary Container.” 6 March 2019. https://www.ema.europa.eu/en/documents/scientifi c-guideline/guideline-sterilisation-medicinal-product-active-substance-excipient-primary-container_en.pdf
2. United States Pharmacopeia. USP Chapter <71>: Sterility Tests.3. International Electrotechnical Commission. “International Standard: IEC 60751:2008—Industrial
Platinum Resistance Thermometers and Platinum Temperature Sensors.” 17 July 2008. https://webstore.iec.ch/publication/3400
4. Schalles, M. “Kalibrierung von Thermometern in situ im Prozess [Calibration of Thermometers In Situ in the Process].” Technische Universität Ilmenau, Lecture at Dresdner Sensor-Symposium, 4–6 December 2017. http://www.ama-science.org/proceedings/details/2718
5. Vrdoljak, P., and M. Schalles. “In situ Einpunktkalibrierung von Thermometern mittels Fixpunkten [In Situ One-Point Calibration of Thermometers Using Fixed Points].” In Messunsicherheit praxisgerecht bestimmen und Prüfprozesse in der industriellen Praxis [Determine Measurement Uncertainty in a Practical Manner and Test Processes in Industrial Practice]. Düsseldorf, Germany: VDI Verlag GmbH, 2017.
6. TÜV Thüringen. “Measuring Uncertainty of the In-Situ Calibration.” Certifi cate 3610-0013-17-B05. 2017.
7. TÜV Thüringen. “Validation of the In-Situ Calibration Process.” Certifi cate 3610-0013-17-B1. 2017.8. Deutsche Akkreditierungsstelle GmbH. “Anlage zur Akkreditierungsurkunde D-K-15024-01-
00 nach DIN EN ISO/IEC 17025:2005 [Annex to the Accreditation Certifi cation of Calibration Body D-K-15024].” 15 October 2019. https://www.dakks.de/as/ast/d/D-K-15024-01-00.pdf
9. US Food and Drug Administration. “Guidance for Industry. Part 11, Electronic Records; Electronic Signatures—Scope and Application.” August 2003. https://www.fda.gov/downloads/RegulatoryInformation/Guidances/ucm125125.pdf
10. International Society for Pharmaceutical Engineering. GAMP® Good Practice Guide: A Risk-Based Approach to Calibration Management, 2nd ed. North Bethesda, MD: International Society for Pharmaceutical Engineering, 2010.
11. US Food and Drug Administration. “Guidance for Industry. Process Validation: General Principles and Practices.” January 2011. https://www.fda.gov/downloads/drugs/guidances/ucm070336.pdf
12. European Commission. “EudraLex Volume 4: Good Manufacturing Practice (GMP) Guidelines. Annex 15: Qualifi cation and Validation.” March 2015. https://ec.europa.eu/health/sites/health/fi les/fi les/eudralex/vol-4/2015-10_annex15.pdf
About the authorsFritz Röder is a recognized expert in the pharmaceutical industry who is currently employed as Senior QA Manager at Merck Healthcare KGaA, in Darmstadt, Germany. He has experience in pharmaceutical media supply, GMP environments, and the processing of solid, semisolid, and liquid (sterile) dosage forms, and has managed various large projects involving solid, semisolid, and liquid sterile dosage forms. He has also contributed to several audit projects for regulators in the US, Brazil, Germany, Russia, and other nations. Fritz is a member of the European Directorate for the Quality of Medicines & HealthCare Working Group on Water, the ISPE D/A/CH Affi liate Expert Group on Water and Steam, the ISPE Critical Utility CoP Steering Committee, and the Parenteral Drug Association. He has been an ISPE member since 2018.Dietmar Saecker is Senior Application Expert for Industrial Temperature Measurement at Endress + Hauser Temperature + System Products in Germany. In this role, he consults worldwide with users of temperature measurement in process automation to select and design the best-fi tting thermometer to increase accuracy, response time, and safety. Dietmar is also a Lecturer for Measurement Technology at the Kempten University of Applied Science in Kempten, Germany, where he teaches students how to select fl ow, pressure, and temperature measurement devices for specifi c applications.
TECHNICAL STERIL IZ ATION EQUIPMENT

S e p t e m b e r / o c t o b e r 2 0 2 0 7 5
INDEX CLASSIFIEDS
Please see the ads for each of our advertisers in this issue.
Architects, Engineers, and ConstructionCRB1251 NW Briarcliff ParkwaySuite 500Kansas City, MO 64116+1 816-880-9800www.crbusa.com/insights/pharmaceuticals
EI Associates8 Ridgedale AvenueCedar Knolls, NJ 07927+1 973-775-7777www.eiassociates.com
Fluor Corporation100 Fluor Daniel Drive Greenville, SC 29607 +1 864-281-4400www.fluor.com
JacobsThree Tower Bridge 2 Ash StreetConshohocken, PA 19428 +1 610-238-1000www.jacobs.com
Consulting ServicesOkaya Seiritsu Engineering Co., Ltd.1-18-1, Senju-Midori-cho, Adachi-kuTokyo,120-0044, Japan +81 3-6812-0202www.okaya-seiritsu.co.jp/english
ContainmentChargePoint Technology, Ltd.Venture Point Business Park58 Evans RoadLiverpool, L24 9PB, United Kingdom+44 (0) 151 728 4500www.thechargepoint.com
Facility Engineering and MaintenanceValsteam ADCA Engineering, SAZona Industrial da Guia, Lote 14Brejo 3105-457 Guia PBL, Portugal+351 236 959 060www.valsteam.com
Information TechnologyCOPA-DATAKarolingerstrasse 7bSalzburg, Austria 5020+43 662 43 10 02-0www.copadata.com
Kneat SolutionsUnit 7, Castletroy Business ParkPlassey Park RoadLimerick, Limerick, V94 KW28, Ireland+353-61-203826www.kneat.com
InstrumentationEndress & Hauser AGKaegenstrasse 24153 Reinach BL, Switzerland+41 61 715 7700www.endress.com
Machinery Design and ConstructionGericke AGAlthardstrasse 120CH-8105 Regensdorf, Switzerland+41 44 871 36 36www.gerickegroup.com
Processing EquipmentAerre Inox SrlVia Gerola 4Fiesco (CR), 26010, Italy+39 0374 370828www.aerreinox.it
TECNinox SrlVia Emilia 89/ANoceto—Loc. Sanguinaro43015, Parma, Italy+39 0521 [email protected]
Pure Water and Process AnalyticsMettler-Toledo Process Analytics, Inc.900 Middlesex TurnpikeBuilding 8Billerica, MA 01821+1 781-301-8600www.mt.com
Software Simulation and Processing SystemsIntelligen, Inc.2326 Morse AvenueScotch Plains, NJ 07076+1 908-654-0088www.intelligen.com
Validation—ManufacturingValGenesis, Inc.395 Oyster Point BoulevardSuite 228South San Francisco, CA 94080+1 510-445-0505www.valgenesis.com
Validation—ServicesCAI652 N. Girls School Road Indianapolis, IN 46214 +1 317-271-6082www.cagents.com
Ellab303 E 17th Avenue Suite 10Denver, CO 80203 +1 303-425-3370www.ellab.com
Valves/Fittings/Hoses/TubingGEMÜ Vales, Inc.3800 Camp Creek Parkway SWBuilding 2600, Suite 120Atlanta, GA 30331-6247+1 678-553-3400www.gemu-group.com
Water/Steam SystemsBWT Pharma & Biotech GmbH 417-5 South Street Marlborough, MA 01752 +1 508-485-4291www.bwt-pharma.com
SPIRAX SARCOCharlton HouseCheltenhamGloucestershire, GL53 8ER, United Kingdom+44 (0)1242 521361info.spiraxsarco.com/pharmaceutical_steam_trap_management
Water Treatment and PurificationElettracqua SrlVia Adamoli 51316165 Genoa, Italy+39 010 8300014www.elettracqua.com
Aerre Inox Srl 47
BWT Pharma & Biotech GmbH 7
CAI Back Cover
ChargePoint Technology, Ltd. 31
COPA-DATA 11
CRB 1
EI Associates 51
Elettracqua Srl 23
Ellab Inside Back Cover
Endress & Hauser AG 13
Fluor Corporation Inside Front Cover
GEMÜ Vales, Inc. 27
Gericke AG 45
Intelligen, Inc. 19
Jacobs 3
Kneat Solutions 17
Mettler-Toledo Process Analytics, Inc. 33
Okaya Seiritsu Engineering Co., Ltd. 57
SPIRAX SARCO 5
TECNinox Srl 37
ValGenesis, Inc. 29
Valsteam ADCA Engineering, SA 9

7 6 P h a r m a c e u t i c a l E n g i n e e r i n g
END NOTE
FOR MORE PHARMACEUTICAL ENGINEERING ARTICLESYou can access back issues (from 2000 on) at ispe.org/pharmaceutical-engineering/issues
What Were You Reading 10 Years Ago in Pharmaceutical Engineering®?In honor of the 40th birthday of ISPE and Pharmaceutical Engineering, we looked back to 2010 to see what technology-focused articles were published in the magazine. Here are just a few:
January/February 2010 Vol. 30 No. 1“Microreactor Technology: Innovations in Production Processes”
May/June 2010 Vol. 30 No. 3“Simple Strategies to Improve Bioprocess Pure Culture Processing”
March/April 2010 Vol. 30 No. 2“Design and Optimization of a Large Scale Biopharmaceutical Facility Using Process Simulation and Scheduling Tools”
July/August 2010 Vol. 30 No. 4“Virtualization – Compliance and Control”
November/December 2010 Vol. 30 No. 6“Risk-Based MES Implementation Using Hazard Analysis and Critical Control Points (HACCP)”
September/October 2010 Vol. 30 No. 5“Lean Maintenance – A Risk-Based Approach”

Validation & MonitoringSolutions
Electronic Bowie Dick Sensor
VALIDATION • MONITORING • CALIBRATION • ON-SITE SERVICES
For more information contact:[email protected] | 303.425.3370
Electronic Documentation of Tests & Reports
Advanced Sterilization Analysis
CFR 21 Part 11 Compliance with Audit Trails
Clear Pass/Fail Test Report Results
Intuitive Software with Database Integrity
ellab.com
ISO 11140-4Compliant
Demo Systems
Available!
Interchangeable Process Challenge Device for Subsequent Test Cycles
Compact Size with +/- 0.05°C Accuracy
Up to 1,000 Cycles between Calibrations
Critical Parameter Verification of Pre-Vacuum Sterilization Processes

At CAI, we understand the value of digital transformation. Using a no-code platform through our technology partner, Coactive, we can work with your team to identify organizational challenges and then develop customized business applications to transform, simplify, and improve your operational processes.
WHEN YOU NEED TO MEET A HIGHER STANDARD®
cagents.com
MAXIMUM PERFORMANCE.MINIMAL COST.CENTRALIZE AND SIMPLIFY YOUR PROCESSES WITH OUR TECHNOLOGY-ENABLED SOLUTIONS
Increased Profits
Improved Customer Experience
Complex Operations Management
Operational Efficiencies
Reduced Errors
Real-time & Secure Data