Validation of road transport statistics through energy efficiency calculations
25
Energy 26 (2001) 467–491 www.elsevier.com/locate/energy Validation of road transport statistics through energy efficiency calculations Theodoros Zachariadis, Zissis Samaras * Laboratory of Applied Thermodynamics, Department of Mechanical Engineering, Aristotle University, 54006 Thessaloniki, Greece Received 24 February 2000 Abstract The paper presents an approach to validate vehicle-kilometre statistics of motor vehicles by comparing them with official energy consumption data. The comparisons were carried out for the 15 European Union countries by computing the energy efficiency and the fuel economy of individual vehicle categories and comparing them with real-world data and model calculations. The major outcome of the study was that estimates of vehicle-kilometres are often unreliable and yield unrealistic energy efficiency and specific fuel consumption results. Based on these conclusions, some basic guidelines are given for energy and road transport analyses: use fuel economy estimates based on measurements of in-use cars under actual driving conditions, collect as many travel data as possible and check their consistency with the aid of energy balances. 2001 Elsevier Science Ltd. All rights reserved. 1. Introduction Mobility is a major human need that is growing rapidly, boosted by the increasing per capita income in many developing countries and a globalised world economy that enables international contacts and trade and, therefore, transport of passengers and goods. Road transport satisfies a large part of the total mobility and hence is responsible for a significant — and still rising — portion of transport’s energy and environmental impacts. In the 1990s, about 30% of energy consumption and CO 2 emissions in countries in the Organisation for Economic Cooperation and Development (OECD) came from transport, and 80% of this was due to road transport [1]. This explains to a large extent why so many international and national organisations, industrial- ists, consultants and academics need reliable transport data for their studies and, at the same time, * Corresponding author: Tel.: +30-31-996014; fax: +30-310996019. E-mail address: [email protected] (Z. Samaras). 0360-5442/01/$ - see front matter 2001 Elsevier Science Ltd. All rights reserved. PII:S0360-5442(01)00012-3
-
Upload
independent -
Category
Documents
-
view
2 -
download
0
Transcript of Validation of road transport statistics through energy efficiency calculations

Energy 26 (2001) 467–491www.elsevier.com/locate/energy
Validation of road transport statistics through energyefficiency calculations
Theodoros Zachariadis, Zissis Samaras *
Laboratory of Applied Thermodynamics, Department of Mechanical Engineering, Aristotle University, 54006Thessaloniki, Greece
Received 24 February 2000
Abstract
The paper presents an approach to validate vehicle-kilometre statistics of motor vehicles by comparingthem with official energy consumption data. The comparisons were carried out for the 15 European Unioncountries by computing the energy efficiency and the fuel economy of individual vehicle categories andcomparing them with real-world data and model calculations. The major outcome of the study was thatestimates of vehicle-kilometres are often unreliable and yield unrealistic energy efficiency and specific fuelconsumption results. Based on these conclusions, some basic guidelines are given for energy and roadtransport analyses: use fuel economy estimates based on measurements of in-use cars under actual drivingconditions, collect as many travel data as possible and check their consistency with the aid of energybalances. 2001 Elsevier Science Ltd. All rights reserved.
1. Introduction
Mobility is a major human need that is growing rapidly, boosted by the increasing per capitaincome in many developing countries and a globalised world economy that enables internationalcontacts and trade and, therefore, transport of passengers and goods. Road transport satisfies alarge part of the total mobility and hence is responsible for a significant — and still rising —portion of transport’s energy and environmental impacts. In the 1990s, about 30% of energyconsumption and CO2 emissions in countries in the Organisation for Economic Cooperation andDevelopment (OECD) came from transport, and 80% of this was due to road transport [1].
This explains to a large extent why so many international and national organisations, industrial-ists, consultants and academics need reliable transport data for their studies and, at the same time,
* Corresponding author: Tel.: +30-31-996014; fax: +30-310996019.E-mail address: [email protected] (Z. Samaras).
0360-5442/01/$ - see front matter 2001 Elsevier Science Ltd. All rights reserved.PII: S0 360- 544 2(01 )000 12- 3

468 T. Zachariadis, Z. Samaras / Energy 26 (2001) 467–491
why so many of them collect and publish such data. Road transport, however, is an inherentlycomplex sector as it deals with a very large number of individual vehicles. Hence, apart fromvehicle stock data, which are generally of good quality in most OECD countries, other importantparameters such as vehicle-, passenger- and tonne-kilometres have to be approximated by estimat-ing the behaviour of an ‘average’ car or truck or by conducting travel surveys and generalisingtheir findings.
We recently conducted a study for the European Commission, trying to evaluate all road trans-port statistics of European Union (EU) countries, propose the most ‘reliable’ time series of mainparameters from 1970 to 1997, and provide projections of the possible developments up to 2010[2]. We collected data from national statistical services and automobile, truck and motorcycleassociations, as well as from international organisations such as EUROSTAT (the statistical officeof the European Communities), the OECD, the European Conference of Ministers of Transport(ECMT), the International Road Federation (IRF) and the Association of European AutomobileManufacturers (ACEA). Although one would assume that the data are reliable when most of thestatistical sources converge to similar figures, it seems that this is not always the case. Based onthat study and going one step further, we attempted to examine whether vehicle-kilometre stat-istics, when combined with energy statistics, yield reasonable results of energy efficiency andspecific fuel consumption (expressed in litres per 100 km). It was striking that in some countriesthis analysis led to unrealistic figures, thus indicating that vehicle-kilometre statistics most prob-ably need significant revisions. This paper describes the analysis we carried out, discusses theresults and provides some basic directions for achieving reliable traffic volume estimates.
2. The basic traffic–fuel relationship
Fuel consumption of road transport can be calculated with the following formula:
FCi��j
�k
CRijk·VPijk·VMijk, (1)
whereFCi estimated total consumption of fuel i (gasoline, diesel or liquified petroleum gas (LPG))
in a given year (grams or kilotonnes per year)CRijk consumption rate of vehicles using fuel i that belong to type j (passenger cars, light trucks,
heavy trucks or powered two-wheelers) and technology k (grams per kilometre driven)VPijk number of vehicles using fuel i that belong to type j and technology k in a given year
(vehicles per year)VMijk average distance driven annually by each vehicle using fuel i of type j and technology k
(kilometres per vehicle and year).
The four variables of Eq. (1) form what Schipper et al. [3] called the ‘vicious circle of fueluse’, meaning that the estimation of any one of these variables with the aid of the other three is

469T. Zachariadis, Z. Samaras / Energy 26 (2001) 467–491
often unreliable, because the three ‘independent variables’ are not estimated really independentlyand also contain a number of unresolved uncertainties. The quality of the calculations can beimproved if fuel consumption is allocated correctly among the different vehicle types, if theconsumption rates are based on real-world measurements and not on standardised test data, if thenumber of vehicles is known accurately, and if average mileage is estimated reliably.
3. Fuel balances
Traffic volume (i.e., vehicle-kilometres per year) is the product of vehicle population timesaverage mileage. Despite some problems in vehicle registrations and deregistrations in a fewcountries, which may lead to an overestimation of the number of in-use vehicles by about 5–10%[3,4], vehicle stock is generally a reliable statistical data set, provided also that one differentiatespassenger cars from light trucks and vans. Hence, the main difficulty associated with the calcu-lation of traffic volume lies in the estimation of the average distance driven by each vehicle(average mileage).
Vehicle mileage data are often collected in different ways: travel surveys, traffic counts andquestionnaires to drivers are some of these methods. While it is useful to gather information indifferent ways in order to obtain a more representative picture, it is also necessary to conductconsistency checks in order to ensure that the different approaches lead to reasonable results.Such checks may include the calculation of several indices like vehicle-kilometres per capita orper gross domestic product (GDP) unit. However, these are rather qualitative in nature and hencehave only a relative importance. The most reliable consistency checks, which ensure quantitativecomparisons, are those related with energy considerations.
One such consideration is associated with energy consumption: according to Eq. (1), estimatedvehicle-kilometres, combined with experimentally derived fuel consumption rates for each vehiclecategory, result in a total (calculated) fuel consumption that can be compared with fuel sales ineach country. This check presupposes that the amount of fuel sold in a country is equal to theamount that was actually consumed there; the assumption is generally valid as long as:
1. the country examined is not very small (e.g., Luxembourg);2. there is no great difference in fuel prices between that country and neighbouring regions —
in Hungary, for example, about 5% of fuel consumed in 1990 was estimated to have beenbought from neighbouring countries with considerably lower fuel prices [5]; and
3. international transit traffic, particularly freight traffic, is correctly accounted for; this is dis-cussed further in Section 4.
We have carried out such consistency checks before, notably in the frame of the MEET [6] study.MEET (Methodologies for the Estimation of Emissions from Transport) was an EU-financedproject that has provided a basic, Europe-wide procedure for evaluating the impact of transporton air pollution. It brought together the most comprehensive and up-to-date information on trans-port vehicle emission rates and activity statistics which, together, make it possible to estimate theemissions resulting from almost any transport operation. The results of this work have givenEuropean decision-makers the information necessary to test alternative transport options.
470 T. Zachariadis, Z. Samaras / Energy 26 (2001) 467–491
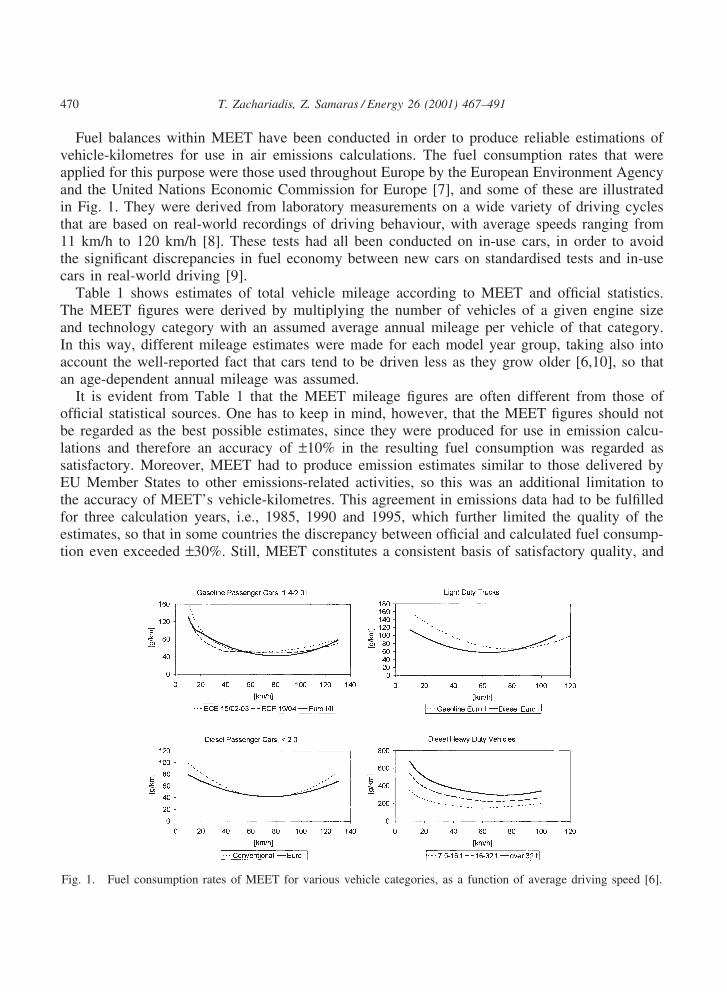
Fuel balances within MEET have been conducted in order to produce reliable estimations ofvehicle-kilometres for use in air emissions calculations. The fuel consumption rates that wereapplied for this purpose were those used throughout Europe by the European Environment Agencyand the United Nations Economic Commission for Europe [7], and some of these are illustratedin Fig. 1. They were derived from laboratory measurements on a wide variety of driving cyclesthat are based on real-world recordings of driving behaviour, with average speeds ranging from11 km/h to 120 km/h [8]. These tests had all been conducted on in-use cars, in order to avoidthe significant discrepancies in fuel economy between new cars on standardised tests and in-usecars in real-world driving [9].
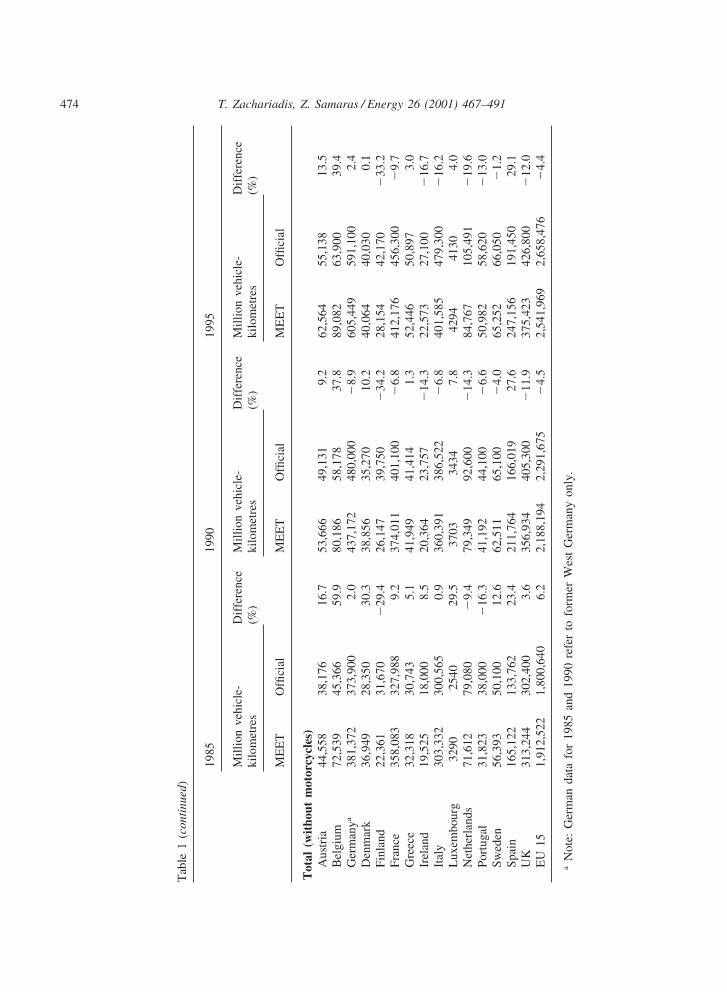
Table 1 shows estimates of total vehicle mileage according to MEET and official statistics.The MEET figures were derived by multiplying the number of vehicles of a given engine sizeand technology category with an assumed average annual mileage per vehicle of that category.In this way, different mileage estimates were made for each model year group, taking also intoaccount the well-reported fact that cars tend to be driven less as they grow older [6,10], so thatan age-dependent annual mileage was assumed.
It is evident from Table 1 that the MEET mileage figures are often different from those ofofficial statistical sources. One has to keep in mind, however, that the MEET figures should notbe regarded as the best possible estimates, since they were produced for use in emission calcu-lations and therefore an accuracy of ±10% in the resulting fuel consumption was regarded assatisfactory. Moreover, MEET had to produce emission estimates similar to those delivered byEU Member States to other emissions-related activities, so this was an additional limitation tothe accuracy of MEET’s vehicle-kilometres. This agreement in emissions data had to be fulfilledfor three calculation years, i.e., 1985, 1990 and 1995, which further limited the quality of theestimates, so that in some countries the discrepancy between official and calculated fuel consump-tion even exceeded ±30%. Still, MEET constitutes a consistent basis of satisfactory quality, and
Fig. 1. Fuel consumption rates of MEET for various vehicle categories, as a function of average driving speed [6].

471T. Zachariadis, Z. Samaras / Energy 26 (2001) 467–491
Tab
le1
Com
pari
son
ofve
hicl
e-ki
lom
etre
sof
offic
ial
tran
spor
tst
atis
tics
with
thos
eof
the
ME
ET
stud
y
1985
1990
1995
Mill
ion
vehi
cle-
Dif
fere
nce
Mill
ion
vehi
cle-
Dif
fere
nce
Mill
ion
vehi
cle-
Dif
fere
nce
kilo
met
res
(%)
kilo
met
res
(%)
kilo
met
res
(%)
ME
ET
Offi
cial
ME
ET
Offi
cial
ME
ET
Offi
cial
Pas
seng
erca
rsA
ustr
ia36
,749
31,9
3715
.144
,540
41,4
997.
351
,864
44,9
3515
.4B
elgi
um58
,137
41,7
6039
.263
,540
54,8
9815
.770
,067
60,0
0016
.8G
erm
anya
317,
158
332,
500
�4.
636
6,89
143
1,50
0�
15.0
508,
529
514,
900
�1.
2D
enm
ark
28,5
5722
,875
24.8
30,4
6628
,484
7.0
31,0
7733
,200
�6.
4Fi
nlan
d17
,149
26,0
00�
34.0
20,0
0433
,430
�40
.221
,009
35,7
60�
41.2
Fran
ce26
5,55
826
7,00
0�
0.5
267,
181
318,
000
�16
.029
2,39
035
9,00
0�
18.6
Gre
ece
19,4
9818
,888
3.2
25,8
2125
,480
1.3
33,5
0831
,857
5.2
Irel
and
15,9
6613
,500
18.3
16,8
6819
,000
�11
.218
,491
22,0
00�
16.0
Ital
y24
1,66
425
6,30
0�
5.7
288,
514
333,
600
�13
.531
9,89
142
0,00
0�
23.8
Lux
embo
urg
2407
2200
9.4
2815
2971
�5.
233
6838
00�
11.4
Net
herl
ands
59,3
6970
,000
�15
.265
,222
80,0
00�
18.5
68,5
6689
,973
�23
.8Po
rtug
al23
,672
22,5
005.
230
,515
26,0
0017
.437
,657
38,4
00�
1.9
Swed
en43
,957
44,5
00�
1.2
47,8
6459
,400
�19
.448
,249
60,0
00�
19.6
Spai
n10
2,33
211
4,03
1�
10.3
132,
835
139,
398
�4.
715
2,82
016
0,00
0�
4.5
UK
252,
536
250,
500
0.8
291,
396
335,
900
�13
.230
4,83
735
3,20
0�
13.7
EU
151,
484,
709
1,51
4,49
1�
2.0
1,69
4,47
11,
929,
560
�12
.21,
962,
325
2,22
7,02
5�
11.9
(con
tinu
edon
next
page
)

472 T. Zachariadis, Z. Samaras / Energy 26 (2001) 467–491
Tab
le1
(con
tinu
ed)
1985
1990
1995
Mill
ion
vehi
cle-
Dif
fere
nce
Mill
ion
vehi
cle-
Dif
fere
nce
Mill
ion
vehi
cle-
Dif
fere
nce
kilo
met
res
(%)
kilo
met
res
(%)
kilo
met
res
(%)
ME
ET
Offi
cial
ME
ET
Offi
cial
ME
ET
Offi
cial
Goo
dsve
hicl
esA
ustr
ia74
4058
8226
.587
3772
8919
.910
,283
9786
5.1
Bel
gium
13,9
9332
1933
4.7
16,2
6128
8046
4.6
18,6
6335
0043
3.2
Ger
man
ya61
,133
38,3
0059
.666
,966
45,2
0048
.292
,418
72,5
0027
.5D
enm
ark
7881
5000
57.6
7796
6300
23.8
8305
6300
31.8
Finl
and
4590
5000
�8.
255
1556
40�
2.2
6507
5790
12.4
Fran
ce89
,758
59,0
0052
.110
3,85
281
,000
28.2
116,
643
95,0
0022
.8G
reec
e12
,491
11,0
0013
.615
,848
15,0
005.
718
,681
18,0
003.
8Ir
elan
d33
8742
00�
19.4
3302
4500
�26
.638
6147
70�
19.0
Ital
y58
,722
40,5
2144
.968
,659
47,8
4243
.578
,308
54,0
0045
.0L
uxem
bour
g84
930
018
2.8
852
421
102.
388
627
522
2.2
Net
herl
ands
11,8
4585
0039
.413
,706
12,0
0014
.215
,752
14,8
745.
9Po
rtug
al78
3215
,000
�47
.810
,309
17,5
00�
41.1
12,9
0819
,500
�33
.8Sw
eden
11,5
9650
0013
1.9
13,8
1350
0017
6.3
16,1
7552
0021
1.1
Spai
n61
,551
18,4
8323
3.0
77,6
4825
,310
206.
893
,021
30,0
0021
0.1
UK
55,9
5248
,200
16.1
60,7
7164
,800
�6.
265
,816
68,9
00�
4.5
EU
1540
9,02
026
7,60
552
.847
4,03
534
0,68
239
.155
8,22
840
8,39
536
.7(c
onti
nued
onne
xtpa
ge)

473T. Zachariadis, Z. Samaras / Energy 26 (2001) 467–491
Tab
le1
(con
tinu
ed)
1985
1990
1995
Mill
ion
vehi
cle-
Dif
fere
nce
Mill
ion
vehi
cle-
Dif
fere
nce
Mill
ion
vehi
cle-
Dif
fere
nce
kilo
met
res
(%)
kilo
met
res
(%)
kilo
met
res
(%)
ME
ET
Offi
cial
ME
ET
Offi
cial
ME
ET
Offi
cial
Bus
esan
dco
ache
sA
ustr
ia36
935
73.
538
934
313
.441
741
70.
0B
elgi
um40
938
75.
638
540
0�
3.9
352
400
�11
.9G
erm
anya
3081
3100
�0.
633
1533
000.
545
0337
0021
.7D
enm
ark
512
475
7.7
594
486
22.1
682
530
28.7
Finl
and
622
670
�7.
162
868
0�
7.7
637
620
2.8
Fran
ce27
6619
8839
.129
7921
0041
.931
4323
0036
.6G
reec
e32
985
4�
61.5
280
934
�70
.025
710
41�
75.3
Irel
and
172
300
�42
.719
525
7�
24.3
221
330
�33
.0It
aly
2946
3744
�21
.332
1850
80�
36.7
3386
5300
�36
.1L
uxem
bour
g34
40�
15.2
3642
�13
.840
55�
27.0
Net
herl
ands
398
580
�31
.442
160
0�
29.8
448
644
�30
.4Po
rtug
al31
950
0�
36.1
367
600
�38
.841
772
0�
42.1
Swed
en84
060
040
.083
470
019
.182
785
0�
2.7
Spai
n12
3812
48�
0.8
1281
1311
�2.
313
1614
50�
9.3
UK
4756
3700
28.5
4766
4600
3.6
4770
4700
1.5
EU
1518
,793
18,5
431.
319
,688
21,4
33�
8.1
21,4
1623
,057
�7.
1(c
onti
nued
onne
xtpa
ge)
474 T. Zachariadis, Z. Samaras / Energy 26 (2001) 467–491
Tab
le1
(con
tinu
ed)
1985
1990
1995
Mill
ion
vehi
cle-
Dif
fere
nce
Mill
ion
vehi
cle-
Dif
fere
nce
Mill
ion
vehi
cle-
Dif
fere
nce
kilo
met
res
(%)
kilo
met
res
(%)
kilo
met
res
(%)
ME
ET
Offi
cial
ME
ET
Offi
cial
ME
ET
Offi
cial
Tot
al(w
itho
utm
otor
cycl
es)
Aus
tria
44,5
5838
,176
16.7
53,6
6649
,131
9.2
62,5
6455
,138
13.5
Bel
gium
72,5
3945
,366
59.9
80,1
8658
,178
37.8
89,0
8263
,900
39.4
Ger
man
ya38
1,37
237
3,90
02.
043
7,17
248
0,00
0�
8.9
605,
449
591,
100
2.4
Den
mar
k36
,949
28,3
5030
.338
,856
35,2
7010
.240
,064
40,0
300.
1Fi
nlan
d22
,361
31,6
70�
29.4
26,1
4739
,750
�34
.228
,154
42,1
70�
33.2
Fran
ce35
8,08
332
7,98
89.
237
4,01
140
1,10
0�
6.8
412,
176
456,
300
�9.
7G
reec
e32
,318
30,7
435.
141
,949
41,4
141.
352
,446
50,8
973.
0Ir
elan
d19
,525
18,0
008.
520
,364
23,7
57�
14.3
22,5
7327
,100
�16
.7It
aly
303,
332
300,
565
0.9
360,
391
386,
522
�6.
840
1,58
547
9,30
0�
16.2
Lux
embo
urg
3290
2540
29.5
3703
3434
7.8
4294
4130
4.0
Net
herl
ands
71,6
1279
,080
�9.
479
,349
92,6
00�
14.3
84,7
6710
5,49
1�
19.6
Port
ugal
31,8
2338
,000
�16
.341
,192
44,1
00�
6.6
50,9
8258
,620
�13
.0Sw
eden
56,3
9350
,100
12.6
62,5
1165
,100
�4.
065
,252
66,0
50�
1.2
Spai
n16
5,12
213
3,76
223
.421
1,76
416
6,01
927
.624
7,15
619
1,45
029
.1U
K31
3,24
430
2,40
03.
635
6,93
440
5,30
0�
11.9
375,
423
426,
800
�12
.0E
U15
1,91
2,52
21,
800,
640
6.2
2,18
8,19
42,
291,
675
�4.
52,
541,
969
2,65
8,47
6�
4.4
aN
ote:
Ger
man
data
for
1985
and
1990
refe
rto
form
erW
est
Ger
man
yon
ly.

475T. Zachariadis, Z. Samaras / Energy 26 (2001) 467–491
in fact it is the most advanced and harmonised database of vehicle data from all EU countries.For these reasons we shall use several MEET data sets for comparisons in this paper.
The differences in estimated vehicle-kilometres observed in Table 1 can help to explain someof the discrepancies described in the following section, where we attempt to derive energyefficiency and specific fuel consumption figures from official statistics and compare them withreal-world efficiency and fuel economy of motor vehicles.
4. Energy efficiency calculations
A second energy-related consistency check has to do with the efficiency of a vehicle engine.By considering the possible losses when driving a car (rolling resistance, wind resistance or drag,and power consumption during vehicle accelerations), and adjusting the relations in order to makeuse of annual vehicle-kilometre figures, the engine efficiency of a vehicle category is describedby the following formula:
h�Total road load energy
Total energy consumption�
(f·m·g+1/2·r·cw·A·u2+m·a)·(vehicle-kilometres/year)(annual fuel consumption)·hu
, (2)
where
h engine efficiencyf friction coefficientm vehicle massg acceleration of gravityr density of aircw drag coefficientA vehicle frontal areau vehicle speeda vehicle accelerationhu lower heating value of a fuel (gasoline, diesel or LPG).
In order to apply Eq. (2) appropriately, one has to account for the different technological categ-ories of vehicles as technology clearly affects fuel economy. Therefore, all vehicle types wereclassified into further categories (model year groups) according to their engine and/or emissioncontrol technologies, as required by national and international emission regulations, mainly thoseof the United Nations Economic Commission for Europe (UN ECE). In total, 58 different techno-logical categories were considered; these are described in Table 2.
Table 3 summarises the average (over all subcategories) values of the coefficients of Eq. (2)that we used for each basic vehicle category. In accordance with literature data [11–13], weapplied different values of f, m, cw and A depending on a vehicle’s model year and size: inautomobiles, for example, f and cw were assumed to decrease from 0.017 and 0.45 respectivelyin 1970 model year cars to 0.014 and 0.38 respectively in 1995 cars. Vehicle mass m was assumed

476 T. Zachariadis, Z. Samaras / Energy 26 (2001) 467–491
Table 2The vehicle subcategories used by MEET and their corresponding approximate model year groups (GVW: GrossVehicle Weight)
Vehicle category Model year Vehicle category Model year
Gasoline passenger cars �1.4 litres LPG passenger carsPRE ECE pre 1972 Conventional pre 1986ECE 15/00-01 1972–1977 EURO I 1986–1997ECE 15/02 1978–1980 EURO II 1997–1999ECE 15/03 1981–1984 Gasoline light duty vehicles �3.5 t GVWECE 15/04 1985–1990 Conventional pre 1995Improved conventional 1986–1990 EURO I (93/59/EEC) 1995–1997Open loop 1986–1990 EURO II (96/69/EC) 1998–EURO I (national — 91/441/EEC) 1986–1995a Diesel light duty vehicles �3.5 t GVWEURO II 1996–1999 Conventional pre 1995
Gasoline passenger cars 1.4–2.0 litres EURO I (93/59/EEC) 1995–1997PRE ECE pre 1972 EURO II (96/69/EC) 1998–ECE 15/00-01 1972–1977 Diesel heavy duty vehicles 3.5–7.5 t GVWECE 15/02 1978–1980 Conventional pre 1995ECE 15/03 1981–1984 EURO I (91/542/EEC Stage 1) 1995–1997ECE 15/04 1985–1990 EURO II (91/542/EEC Stage 2) 1998–Improved conventional 1986–1990 Diesel heavy duty vehicles 7.5–16 t GVWOpen loop 1986–1990 Conventional pre 1995EURO I (national — 91/441/EEC) 1986–1995a EURO I (91/542/EEC Stage 1) 1995–1997EURO II 1996–1999 EURO II (91/542/EEC Stage 2) 1998–
Gasoline passenger cars �2.0 litres Diesel heavy duty vehicles 16–32 t GVWPRE ECE pre 1972 Conventional pre 1995ECE 15/00-01 1972–1977 EURO I (91/542/EEC Stage 1) 1995–1997ECE 15/02 1978–1980 EURO II (91/542/EEC Stage 2) 1998–ECE 15/03 1981–1984 Diesel heavy duty vehicles �32 t GVWECE 15/04 1985–1990 Conventional pre 1995EURO I (national — 91/441/EEC) 1986–1995a EURO I (91/542/EEC Stage 1) 1995–1997EURO II 1996–1999 EURO II (91/542/EEC Stage 2) 1998–
Diesel passenger cars �2.0 litres BusesConventional pre 1986 Conventional pre 1993EURO I (national — 91/441/EEC) 1986–1997a EURO I (91/542/EEC Stage 1) 1993–1996EURO II 1997–1999 EURO II (91/542/EEC Stage 2) 1997–
Diesel passenger cars �2.0 litres CoachesConventional pre 1986 Conventional pre 1993EURO I (national — 91/441/EEC) 1986–1997a EURO I (91/542/EEC Stage 1) 1993–1996EURO II 1997–1999 EURO II (91/542/EEC Stage 2) 1997–
a Introduction of these technologies has come into effect at different years in different European countries, mainlydue to national incentives taken before the implementation date of the common European directive.
to decrease by 10% from 1970 to 1990 model year vehicles, and from 1990 onwards it was keptconstant since further weight reduction, caused by the use of lighter components, was counterbal-anced by increased demand for safety and comfort. A was also reduced slightly (10% in eachvehicle size class between 1970 and 1995 model year vehicles).
As for the work consumed due to accelerations, since it depends on the driving pattern (i.e.,

477T. Zachariadis, Z. Samaras / Energy 26 (2001) 467–491
Table 3The average (over all subcategories) values that were used for the engine efficiency calculations (GVW: GrossVehicle Weight)
Friction Mass (kg) Drag Frontal Average speed (km/h)coefficient coefficient area (m2)
Urban Rural Highway
Passenger carsGasoline �1.4 l 0.015 900 0.4 1.9 25 50 100Gasoline 1.4–2.0 l 0.015 1100 0.4 2.0 25 50 105Gasoline �2.0 l 0.015 1300 0.4 2.1 25 50 110Diesel �2.0 l 0.015 1200 0.4 2.0 25 50 110Diesel �2.0 l 0.015 1400 0.4 2.1 25 50 110LPG 0.015 1200 0.4 2.0 25 50 110
Light duty vehiclesGasoline 0.015 2000 0.5 2.2 20 60 90Diesel 0.015 2000 0.5 2.2 20 60 90
Heavy duty vehiclesDiesel 3.5–7.5 t GVW 0.012 5500 0.8 7 20 60 90Diesel 7.5–16 t GVW 0.012 11,750 0.9 7 20 60 90Diesel 16–32 t GVW 0.012 24,000 1.2 7 20 60 90Diesel �32 t GVW 0.012 36,000 1.2 7 20 60 90Buses and coaches 0.012 10,000 0.6 7 20 60 90
the frequency and magnitude of accelerations encountered when driving a vehicle in differentroad types), we assumed appropriate values for the fraction of total road load power that is due toaccelerations. Taking into account literature data [12], some sample calculations and the relevantexperience from our laboratory’s experimental data from emission tests, we came up with thefigures shown in Table 4. For this, we examined various driving patterns, both legislated (suchas the US Federal Test Procedure and the New European Driving Cycle [11,14]) and non-legis-lated [15] ones. For those driving cycles that we had used in laboratory tests, the measuredinstantaneous power consumption was available for about 100 different passenger cars [16]. We
Table 4Estimated fraction of power consumed for vehicle acceleration over the total road load power, for various vehiclecategories and driving patterns (GVW: Gross Vehicle Weight)
Vehicle category Urban driving Rural driving Highway driving
Passenger cars 40% 30% 20%Heavy duty vehicles
3.5–7.5 t GVW 41% 26% 19%7.5–16 t GVW 45% 34% 26%16–32 t GVW 47% 38% 31%Over 32 t GVW 48% 41% 34%Buses and coaches 39% 36% 29%

478 T. Zachariadis, Z. Samaras / Energy 26 (2001) 467–491
used these data further to calibrate road load calculations for other driving cycles as well as forother vehicle types. We used the figures of Table 4 for all model years: older vehicles wereheavier, but at the same time they also had higher values of f, cw and A, so that the overallacceleration power fraction remained essentially unchanged over the years. Road loads for heavyduty vehicles were calculated on the basis of driving cycles specifically designed for these vehicles(e.g., the Heavy Duty Urban Dynamometer Driving Schedule used in the US), as well as oncycles that such a vehicle can actually drive under real-world conditions.
With the aid of these data it was possible to compute the engine efficiency according to (1)MEET and (2) the official vehicle-kilometre statistics that we considered to be the most reliableand consistent, and to compare the results with expected figures. The average efficiency of theengine of a European in-use gasoline car, a diesel car and a diesel heavy duty truck would nor-mally be in the range of 10–20%, 15–25% and 35–45%, respectively, while the correspondingranges for specific fuel consumption would be 8–11, 5–8 and 25–35 litres per 100 km, respect-ively [17,18].
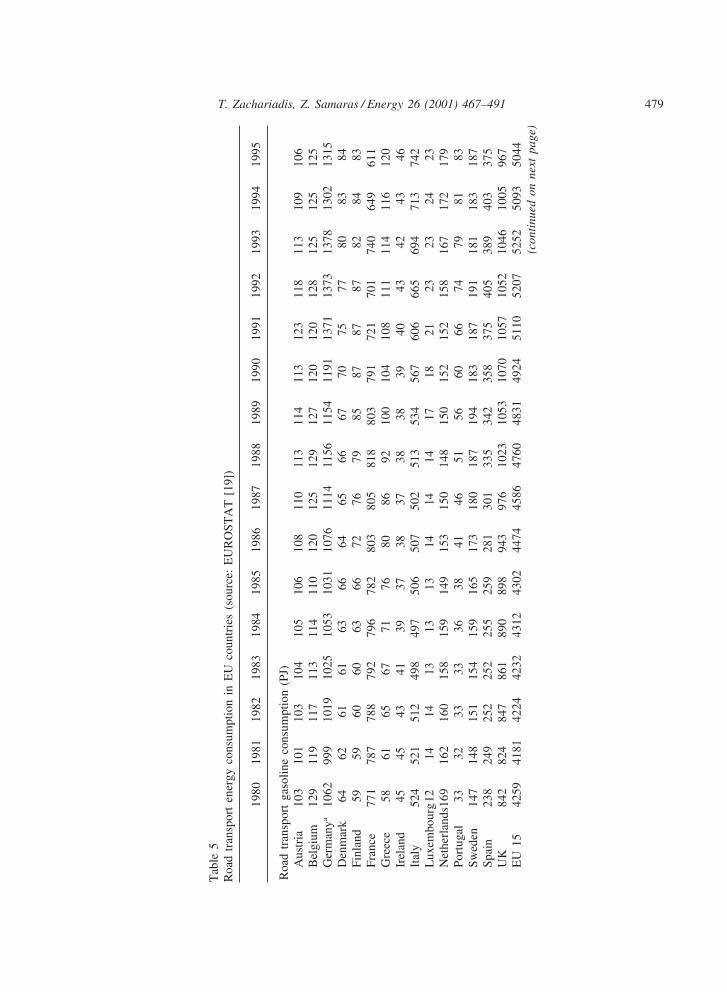
In the former case, both estimated vehicle-kilometres and calculated fuel consumption of MEETwere used, while in the latter case vehicle-kilometres and fuel consumption data came mainlyfrom EUROSTAT [19] (which as a rule puts together the corresponding data from national statisti-cal services) or other official sources [2]. Table 5 displays the EUROSTAT energy consumptionfigures by fuel. Since official statistical data in many countries do not include a breakdown ofvehicles in more detailed categories according to engine type and size, the fuel consumption ofeach one of these vehicle categories was estimated for both cases with the aid of the correspondingMEET ratios, which have been produced by national experts. Note that motorcycles were notincluded in the evaluation, but their share in road gasoline consumption is about 1–2% in mostEU countries and up to 4% in Southern EU countries such as Italy, Spain and Greece [18]. Hence,omitting two-wheeled vehicles from the calculation does not introduce a sizeable error.
The results of computed engine efficiency are shown for the major vehicle categories in Figs.2–4. Additionally, Figs. 5–7 present calculations of specific fuel consumption (expressed in litresper 100 km); this is inversely proportional to energy efficiency, although not by a constant factorbecause of the differing fractions of various vehicle types per country and different specific fuelconsumption of each vehicle type. Note that specific fuel consumption was not calculated with theaid of road load estimates, but just by dividing the fuel consumption of a vehicle type (converted tolitres with the aid of fuel density) with the corresponding vehicle-kilometres.
In general, energy efficiency and specific fuel consumption of each vehicle category are quiteoften found to be out of the expected ranges that were mentioned above. More specifically:
� the picture is mixed in gasoline passenger cars — in theory, countries with a higher share ofold cars (e.g., Italy, Spain, Portugal and Greece) should demonstrate lower efficiency and higherspecific fuel consumption. Keeping this in mind, official data seem to be more realistic thanMEET in the case of Spain, while MEET produces more reasonable efficiency and consumptionfigures for Luxembourg (which has to be attributed to the fuel consumption problem mentionedabove), France, The Netherlands and Portugal. Both data sets seem to give too high figuresfor Ireland. In any case, the high increase in official efficiency figures from 1980 to 1995 inFrance, Italy, The Netherlands, Portugal and Sweden is most probably unjustified, for reasonsthat will be explained in the next section.
479T. Zachariadis, Z. Samaras / Energy 26 (2001) 467–491
Tab
le5
Roa
dtr
ansp
ort
ener
gyco
nsum
ptio
nin
EU
coun
trie
s(s
ourc
e:E
UR
OST
AT
[19]
)
1980
1981
1982
1983
1984
1985
1986
1987
1988
1989
1990
1991
1992
1993
1994
1995
Roa
dtr
ansp
ort
gaso
line
cons
umpt
ion
(PJ)
Aus
tria
103
101
103
104
105
106
108
110
113
114
113
123
118
113
109
106
Bel
gium
129
119
117
113
114
110
120
125
129
127
120
120
128
125
125
125
Ger
man
ya10
6299
910
1910
2510
5310
3110
7611
1411
5611
5411
9113
7113
7313
7813
0213
15D
enm
ark
6462
6161
6366
6465
6667
7075
7780
8384
Finl
and
5959
6060
6366
7276
7985
8787
8782
8483
Fran
ce77
178
778
879
279
678
280
380
581
880
379
172
170
174
064
961
1G
reec
e58
6165
6771
7680
8692
100
104
108
111
114
116
120
Irel
and
4545
4341
3937
3837
3838
3940
4342
4346
Ital
y52
452
151
249
849
750
650
750
251
353
456
760
666
569
471
374
2L
uxem
bour
g12
1414
1313
1314
1414
1718
2123
2324
23N
ethe
rlan
ds16
916
216
015
815
914
915
315
014
815
015
215
215
816
717
217
9Po
rtug
al33
3233
3336
3841
4651
5660
6674
7981
83Sw
eden
147
148
151
154
159
165
173
180
187
194
183
187
191
181
183
187
Spai
n23
824
925
225
225
525
928
130
133
534
235
837
540
538
940
337
5U
K84
282
484
786
189
089
894
397
610
2310
5310
7010
5710
5210
4610
0596
7E
U15
4259
4181
4224
4232
4312
4302
4474
4586
4760
4831
4924
5110
5207
5252
5093
5044
(con
tinu
edon
next
page
)

480 T. Zachariadis, Z. Samaras / Energy 26 (2001) 467–491
Tab
le5
(con
tinu
ed)
1980
1981
1982
1983
1984
1985
1986
1987
1988
1989
1990
1991
1992
1993
1994
1995
Roa
dtr
ansp
ort
dies
elco
nsum
ptio
n(P
J)A
ustr
ia65
6564
6465
6266
6574
7986
9610
110
911
111
9B
elgi
um76
7882
8891
101
114
118
136
146
147
150
153
162
168
169
Ger
man
ya41
842
643
446
547
950
054
256
658
161
866
178
582
688
492
195
1D
enm
ark
2929
3134
4149
4749
5057
6359
5959
6364
Finl
and
4950
5252
5455
5863
6265
6561
6063
6564
Fran
ce38
539
740
541
443
444
548
552
559
365
972
177
382
185
790
194
9G
reec
e37
3638
4649
5155
5556
5758
6666
6768
70Ir
elan
d16
1615
1516
2220
1320
2426
2729
3032
26It
aly
360
386
475
413
447
486
553
571
612
645
635
623
633
629
605
602
Lux
embo
urg
56
66
78
810
1114
1822
2425
2524
Net
herl
ands
8495
8999
104
127
104
115
128
139
143
145
154
155
157
161
Port
ugal
4845
5154
5149
5154
6063
6670
7578
8489
Swed
en57
5758
5960
6067
6673
7471
6571
7785
82Sp
ain
193
190
208
212
219
233
233
237
326
363
380
403
419
422
440
478
UK
248
235
242
268
286
301
333
358
396
428
451
452
469
499
546
569
EU
1520
6821
1022
5122
8124
0325
4627
3428
6631
7834
3135
9237
9639
6041
1742
7244
17R
oad
tran
spor
tL
PGco
nsum
ptio
n(P
J)A
ustr
ia0
00
11
11
11
00
11
11
1B
elgi
um2
33
44
33
32
33
22
22
3G
erm
anya
01
11
11
00
00
00
00
33
Den
mar
k3
34
43
32
11
10
00
00
0Fi
nlan
d0
00
00
00
00
00
00
00
0Fr
ance
12
33
33
33
32
22
22
11
Gre
ece
01
11
11
11
11
12
22
22
Irel
and
11
11
11
10
01
00
00
00
Ital
y34
4045
4544
4446
5556
6162
5955
6064
68L
uxem
bour
g0
00
00
00
00
00
00
00
0N
ethe
rlan
ds32
3439
4140
3739
3839
4342
4140
3836
35Po
rtug
al0
00
00
00
00
00
00
00
0Sw
eden
00
00
00
00
00
00
00
00
Spai
n5
54
44
33
22
11
22
33
3U
K0
00
00
00
00
00
00
00
0E
U15
7790
103
104
101
9798
104
106
113
112
109
104
107
113
116
aG
erm
anda
taup
to19
90re
fer
tofo
rmer
Wes
tG
erm
any
only
.
481T. Zachariadis, Z. Samaras / Energy 26 (2001) 467–491
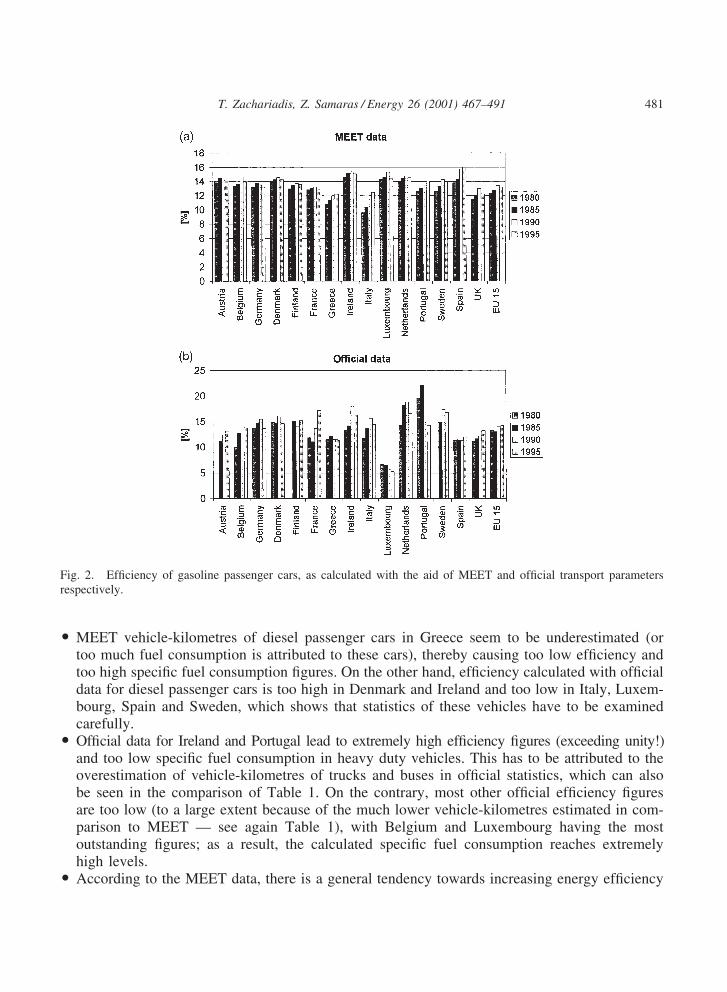
Fig. 2. Efficiency of gasoline passenger cars, as calculated with the aid of MEET and official transport parametersrespectively.
� MEET vehicle-kilometres of diesel passenger cars in Greece seem to be underestimated (ortoo much fuel consumption is attributed to these cars), thereby causing too low efficiency andtoo high specific fuel consumption figures. On the other hand, efficiency calculated with officialdata for diesel passenger cars is too high in Denmark and Ireland and too low in Italy, Luxem-bourg, Spain and Sweden, which shows that statistics of these vehicles have to be examinedcarefully.
� Official data for Ireland and Portugal lead to extremely high efficiency figures (exceeding unity!)and too low specific fuel consumption in heavy duty vehicles. This has to be attributed to theoverestimation of vehicle-kilometres of trucks and buses in official statistics, which can alsobe seen in the comparison of Table 1. On the contrary, most other official efficiency figuresare too low (to a large extent because of the much lower vehicle-kilometres estimated in com-parison to MEET — see again Table 1), with Belgium and Luxembourg having the mostoutstanding figures; as a result, the calculated specific fuel consumption reaches extremelyhigh levels.
� According to the MEET data, there is a general tendency towards increasing energy efficiency

482 T. Zachariadis, Z. Samaras / Energy 26 (2001) 467–491
Fig. 3. Efficiency of diesel passenger cars, as calculated with the aid of MEET and official transport parametersrespectively.
(and therefore declining specific fuel consumption) from 1980 to 1990, which then tends tostabilise or even to decrease slightly, particularly in gasoline cars. This seems to be in linewith other estimations [20,21]. Conversely, the picture is mixed in the official data: sharpincreases or decreases in energy efficiency are observed, which do not seem to be justified andmay have to do with the low reliability of the vehicle-kilometre figures.
5. Discussion
5.1. Uncertainties in the input data of the efficiency calculations
In this study, the most reliable data sets available for all countries are those of total roadgasoline consumption and vehicle population, whereas road diesel consumption statistics have tobe treated with more caution, as will be discussed later in this section. The breakdown of vehiclesinto different types of fuel and engine size (e.g., three-way catalyst gasoline passenger cars of

483T. Zachariadis, Z. Samaras / Energy 26 (2001) 467–491
Fig. 4. Efficiency of diesel heavy duty vehicles (trucks, buses and coaches), as calculated with the aid of MEET andofficial transport parameters respectively.
engine capacity over 2 litres, trucks with gross weight over 32 tonnes, etc.) is performed on thebasis of official estimates or experts’ data; the same applies for vehicle-kilometres as well. Further-more, the allocation of fuel consumption into the vehicle categories shown in Table 2 is effectedthrough these experts’ data and experimentally determined fuel consumption rates that areincluded in the MEET database. All in all, many assumptions are necessary and it is thereforequite difficult to find which statistical parameters are mainly responsible for the inconsistent orunrealistic figures shown in Figs. 2–7.
Still, some observations are apparent: it is clear, for example, that the allocation of dieselconsumption between passenger cars and heavy duty vehicles is not responsible for the too highofficial diesel efficiency figures of Ireland and Portugal, nor would the picture improve if somevehicle-kilometres were attributed to gasoline passenger cars instead of diesel ones. The sameholds true for MEET’s efficiency figures for Spain (gasoline cars) and Greece (diesel cars). More-over, some drastic increases or decreases in official energy efficiency figures cannot be explainedthrough similar changes in fuel sales.
The input data we used for the energy efficiency calculations (vehicle mass, driving speeds,

484 T. Zachariadis, Z. Samaras / Energy 26 (2001) 467–491
Fig. 5. Specific fuel consumption of gasoline passenger cars, as calculated with the aid of MEET and official transportparameters respectively.
drag coefficients, etc.) are adequately precise. In the case of heavy duty vehicles, the averageweight of each class was taken equal to the mean gross weight of that class. Although this assump-tion may not be accurate, we conducted a sensitivity analysis and realised that a 20% error invehicle mass — already an exaggerated error margin — leads to a 8–13% change in total roadload, which would still be in an acceptable range for the calculations presented here. Other poss-ible errors in parameters, such as driving speed or the share of urban or highway driving, havean even smaller impact [22]. Hence the input data are not a serious source of errors in the com-puted energy efficiency values.
In view of these considerations, the most plausible interpretation for the inconsistenciesobserved in Figs. 2–7 seems to lie with the quality of traffic volume data (i.e., vehicle-kilometres).This is the parameter that is usually measured or estimated with various methods of unknownaccuracy. Apparently, official transport figures are not always validated against real energy con-sumption data, thus leading to results such as those shown in Figs. 2–7. Still, vehicle-kilometredata are often used in further studies such as predictions of passenger-kilometres and tonne-kilometres, air pollutant emissions, or the evaluation of traffic-related interventions; their impor-

485T. Zachariadis, Z. Samaras / Energy 26 (2001) 467–491
Fig. 6. Specific fuel consumption of diesel passenger cars, as calculated with the aid of MEET and official transportparameters respectively.
tance is therefore obvious. In other words, the whole analysis of a transportation system maybecome ambiguous as a result of unreliable traffic volume data.
5.2. Evolution of energy efficiency over the years
A basic issue that can help in this evaluation is the evolution of energy efficiency and specificfuel consumption over time. The efficiency of cars and light trucks in OECD countries hasincreased during the period 1980–1990, mainly due to reduced engine friction and improvedengine management. After 1990, however, the improvement seems to have stopped, because therewas a shift towards more powerful cars that are also heavier because of increased safety andcomfort requirements [20]. As for heavy duty vehicles (mainly trucks but also buses and coaches),the picture is mixed because efficiency is also determined by load factors of trucks and passengeroccupancy rates of buses. In general, countries with older vehicle fleets have experienced animprovement in specific fuel consumption because of the penetration of modern, more efficienttrucks and buses, while in other countries the improvements were not remarkable and in somecases specific consumption even increased because of inefficient utilisation of truck capacity [21].

486 T. Zachariadis, Z. Samaras / Energy 26 (2001) 467–491
Fig. 7. Specific fuel consumption of diesel heavy duty vehicles (trucks, buses and coaches), as calculated with theaid of MEET and official transport parameters respectively.
Bearing these in mind, Figs. 2–7 show clearly that there are numerous inconsistent results inthe figures calculated through the official traffic volume statistics. Sharp increases or decreaseswithin five years and mixed trends over the 15-year period under examination indicate that officialvehicle travel data in many cases have not been consistently checked against energy data.
5.3. The special case of heavy duty vehicles
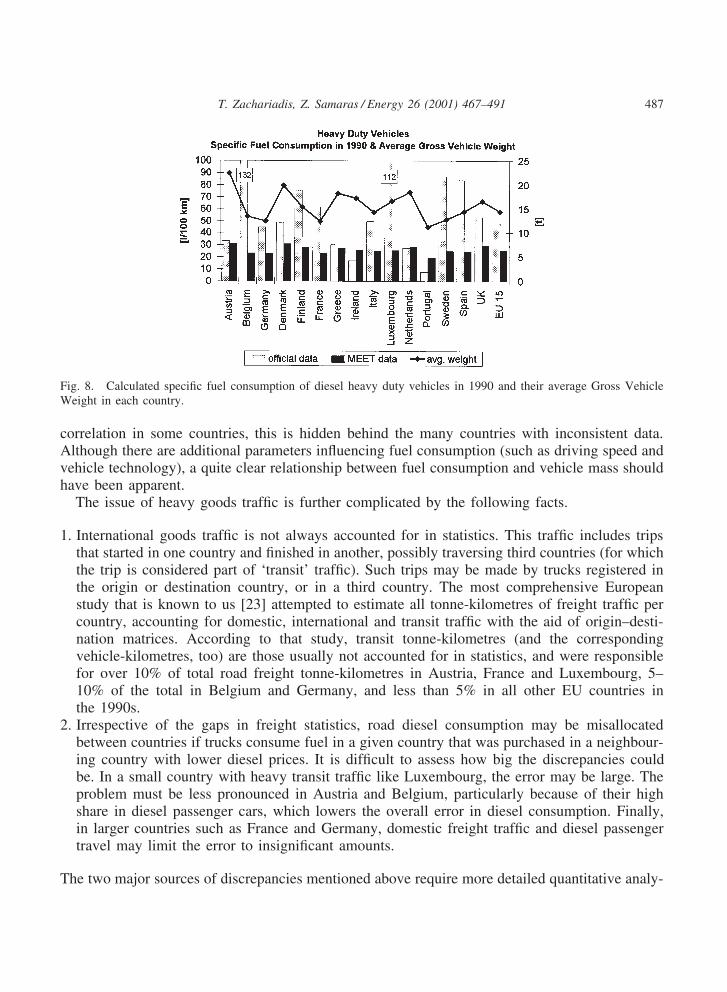
The inconsistency of the official data for heavy duty vehicles is further demonstrated in Fig.8, where the specific fuel consumption of 1990, taken from Fig. 7, is plotted against the averagegross weight of all these vehicles in each country. Although it was already expected that theMEET fuel consumption data would correlate well with vehicle mass because they come from aharmonised database, they are illustrated here in order to show a reasonable picture of these twoparameters. This picture is completely mixed in the case of official data: there is effectively nocorrelation between specific fuel consumption and vehicle mass; or, in other words, if there is a
487T. Zachariadis, Z. Samaras / Energy 26 (2001) 467–491
Fig. 8. Calculated specific fuel consumption of diesel heavy duty vehicles in 1990 and their average Gross VehicleWeight in each country.
correlation in some countries, this is hidden behind the many countries with inconsistent data.Although there are additional parameters influencing fuel consumption (such as driving speed andvehicle technology), a quite clear relationship between fuel consumption and vehicle mass shouldhave been apparent.
The issue of heavy goods traffic is further complicated by the following facts.
1. International goods traffic is not always accounted for in statistics. This traffic includes tripsthat started in one country and finished in another, possibly traversing third countries (for whichthe trip is considered part of ‘transit’ traffic). Such trips may be made by trucks registered inthe origin or destination country, or in a third country. The most comprehensive Europeanstudy that is known to us [23] attempted to estimate all tonne-kilometres of freight traffic percountry, accounting for domestic, international and transit traffic with the aid of origin–desti-nation matrices. According to that study, transit tonne-kilometres (and the correspondingvehicle-kilometres, too) are those usually not accounted for in statistics, and were responsiblefor over 10% of total road freight tonne-kilometres in Austria, France and Luxembourg, 5–10% of the total in Belgium and Germany, and less than 5% in all other EU countries inthe 1990s.
2. Irrespective of the gaps in freight statistics, road diesel consumption may be misallocatedbetween countries if trucks consume fuel in a given country that was purchased in a neighbour-ing country with lower diesel prices. It is difficult to assess how big the discrepancies couldbe. In a small country with heavy transit traffic like Luxembourg, the error may be large. Theproblem must be less pronounced in Austria and Belgium, particularly because of their highshare in diesel passenger cars, which lowers the overall error in diesel consumption. Finally,in larger countries such as France and Germany, domestic freight traffic and diesel passengertravel may limit the error to insignificant amounts.
The two major sources of discrepancies mentioned above require more detailed quantitative analy-

488 T. Zachariadis, Z. Samaras / Energy 26 (2001) 467–491
sis that is beyond the scope of this paper. Still, the results from official data shown in Figs. 4, 7and 8 demonstrate more general problems in heavy duty vehicle-kilometres that require in-depthstudy of the whole sector and not only of the errors outlined in this section.
5.4. Uncertainties in diesel consumption
As mentioned earlier, the reliability of diesel sales data is questionable, especially for the 1980sand in countries with large tax differences between road diesel and heating diesel, such asDenmark, Italy and Greece. Apart from this reason, diesel statistics may be inaccurate because apart of automotive diesel sold is consumed by non-road machinery used in agriculture, industry,forestry and recreation. In an earlier study [24] we had found considerable discrepancies betweenofficial and our own diesel consumption estimates, which had been based on detailed accountingof all non-road vehicles and machines — including railways and inland navigation. Table 6presents a summary of those estimates. Other national data that we had collected for that studyindicated also that non-road diesel consumption is approximately 35–45% of road diesel consump-tion, which means that the error may be large if diesel sales data do not consider correctly thevarious uses of diesel. Conversely, as is clear from Table 6, the problem is negligible in the caseof gasoline.
This finding indicates that, in the case of diesel vehicles, and particularly heavy duty trucksand buses, vehicle-kilometre data are not necessarily responsible for the discrepancies observedin Figs. 4, 7 and 8; fuel use data could be equally inaccurate. As mentioned in previous sections,vehicle population and fuel consumption rates are generally accurate within a ±5–10% margin.When accounting for total gasoline consumption, which has a similar error margin, it is apparentfrom Eq. (1) that larger errors, such as those implied by some results of Figs. 2–7, have to beattributed to the uncertainties in vehicle mileage. When calculating diesel consumption, however,it is both mileage and total consumption that have large error margins, so that both parametershave to be checked more carefully.
Table 6Estimates of gasoline and diesel consumption of transport in the EU for the year 1990, according to EUROSTAT anda detailed study of the authors [24]. All figures are given in kilotonnes
EUROSTAT ‘Off road’ study
Diesel Gasoline Diesel Gasoline
Agriculture 9763 222 15,334 387Forestry 646 584Industry 9620 82 18,660 1796Household 57 427Railways 2151 0 4363 0Inland navigation 5217 387 1179 117Total non-road transport 26,751 691 40,239 3311Road transport 79,656 103,211 79,656 103,211Non-road/road transport 34% 1% 51% 3%
489T. Zachariadis, Z. Samaras / Energy 26 (2001) 467–491
6. Implications for transport–energy analyses
It is clear that reliable real-world data of vehicle travel and fuel use are absolutely necessaryfor policy analysis. The study that we outlined in this paper does not resolve all problems, butprovides useful insight into the topic. We did not have access to detailed fuel sales statistics inorder to correct eventual fuel misallocations or double counting, nor is it possible to have thebackground information necessary to correct statistics of earlier years. It is possible, however, to:
� use representative, real-world fuel consumption rates in order to reflect actual the fuel economyof in-use cars; and
� collect as much information on traffic volumes as possible, and then compare estimated vehicle-kilometres with total fuel consumption through Eq. (1).
The MEET data fulfil these two requirements. Firstly, fuel consumption rates have been exper-imentally determined from measurements of in-use vehicles with accumulated mileage of 3000to 100,000 km in eight different countries (over 800 passenger cars and light trucks tested inabout 3000 driving cycles that reflect actual driving conditions, 36 heavy duty vehicle enginestested on legislated and actual test cycles). Thus it is reasonable to assume that fuel consumptionrates are the appropriate ones for this analysis.
Secondly, mileage per vehicle has been estimated within MEET on the basis of multipleapproaches. Transport authorities and individual experts have provided their best estimates accord-ing to available travel surveys, data from truck and bus companies, taxi drivers, motorcyclists,etc. These estimates were then entered into Eq. (1) and were iteratively adjusted in order to fulfilthe fuel balance. In a few cases it became evident from this procedure that fuel sales data couldnot be correct. We had this experience with Greek road diesel statistics in the 1980s, which wereapparently underestimated, yielded too low mileage figures and, therefore, we had to ignore them.In most cases, however, the fuel balance is an important checkpoint of mileage estimates.
For the reasons we outlined in Section 3, we do not consider the MEET database as the onethat provides the best possible vehicle-kilometre figures. It gives, however, a consistent methodfor resolving the discrepancies between fuel use and vehicle travel estimates. The calculationspresented in Section 4 and Figs. 2–7 have demonstrated the consistency of this method, in contrastto official estimates, which yield unrealistic figures in many cases.
7. Conclusion
The main finding of this study is that European traffic volume statistics are often of questionablequality: when cross-checked against real-world energy data such as specific fuel consumption andtotal fuel consumption figures, they often lead to unrealistic results. As vehicle-kilometre statisticsare frequently used for various important purposes (e.g., transportation planning, calculations ofvehicle emissions and energy consumption, forecasts of passenger- and tonne-kilometres, etc.), itis imperative that authorities and individuals conducting such studies employ transparent andconsistent methods and always validate their figures with the aid of energy balances. Additionalproblems are associated with estimates of freight traffic, where international road goods transport

490 T. Zachariadis, Z. Samaras / Energy 26 (2001) 467–491
and cross-border differences in fuel prices can lead to considerable under- or overestimation ofactual diesel consumption in a country. Diesel sales are also a more general problem, as thedistinction between road and non-road diesel consumption is often unreliable, so that, in the caseof diesel vehicles, traffic volume data are not the sole source of discrepancies and fuel salesstatistics may be erroneous as well.
Data of the MEET study, although not the best possible traffic volume estimates, provide thebasic guidelines for such analyses: use actual fuel economy data from in-use cars, collect asmany independent vehicle mileage data as possible and then check their consistency throughfuel balances.
Acknowledgements
The first considerations related to this paper were initiated during a study that was funded bythe European Commission’s Directorate General for Energy and Transport. The authors expressalso their thanks to Savas Geivanidis and Nicolas Papalazarou for preparing the data and per-forming the calculations.
References
[1] Environmental data compendium 1995. Paris (France): Organisation for Economic Cooperation and Development(OECD), 1995.
[2] Samaras Z, Zachariadis T, Babajimopoulos A, Hassel D, Weber F-J, Sonnborn K-S et al. Study on transport-related parameters of the European road vehicle stock. In: Final Report to the European Commission, StudyContract No. B98-B27040-SIN 6516-ETU. Thessaloniki (Greece): Aristotle University Mechanical EngineeringDepartment, 1999.
[3] Schipper L, Figueroa MJ, Price L, Espey M. Mind the gap: the vicious circle of measuring automobile fuel use.Energy Policy 1993;21(12):1173–90.
[4] Bourdeau B. Modelisation du parc automobile francais entre 1970 et 2020. In: Ph.D. thesis. Chambery (France):Universite de Savoie, 1997.
[5] Meretei T. Personal communication. Budapest (Hungary): KTI Institute of Transport Sciences, 1999.[6] Hickman AJ (editor). MEET — methodology for calculating transport emissions and energy consumption [online].
Available at http://www.inrets.fr/infos/ cost319/index.html. Luxembourg: Office for Official Publications of theEuropean Communities, 1999.
[7] EMEP/CORINAIR atmospheric emissions inventory guidebook, 2nd ed. Technical Report No. 30 [online]. Avalil-able at http://themes.eea.eu.int:80/toc.php/state/air?doc=39186 and l=en. Copenhagen (Denmark): EuropeanEnvironment Agency (EEA), 1999.
[8] Ntziachristos L, Samaras Z. Speed dependent representative emissions factors for catalyst passenger cars andinfluencing parameters. Atmos Environ 2000;34(27):4611–9.
[9] Schipper L, Tax W. New car test and actual fuel economy: yet another gap? Transport Policy 1994;1(4):257–65.[10] Van Wee B, Moll HC, Dirks J. Environmental impact of scrapping old cars. Transport Res Part D
2000;5(2):137–43.[11] Bosch R. Automotive handbook. Warrendale (PA): Society of Automotive Engineers Inc, 1996.[12] Gillespie TD. Fundamentals of vehicle dynamics. Warrendale (PA): Society of Automotive Engineers Inc, 1992.[13] Seiffert U, Walzer P. Automobile technology of the future. Warrendale (PA): Society of Automotive Engineers
Inc, 1991.[14] US EPA. Test procedures and laboratory methods [online]. Available at http://www.epa.gov/OMSWWW/

491T. Zachariadis, Z. Samaras / Energy 26 (2001) 467–491
labmthod.htm. Ann Arbor (MI): US Environmental Protection Agency (US EPA), Office of Transportation andAir Quality, 2000.
[15] US EPA. Supplemental FTP emissions database on CD-ROM. Ann Arbor (MI): US Environmental ProtectionAgency (US EPA), Office of Mobile Sources, 1997.
[16] Samaras Z, Zachariadis T, Joumard R, Vernet I, Hassel D, Weber F-J et al. Alternative short tests for inspectionand maintenance of in-use cars with respect to their emissions performance. Int J Vehicle Design 1998;20(1-4):292–303.
[17] Heywood JB. Internal combustion engine fundamentals. New York: McGraw-Hill Inc, 1988.[18] ECMT. CO2 emissions from transport. Paris (France): European Conference of Ministers of Transport (ECMT),
1998.[19] EUROSTAT. New Cronos database on CD-ROM. Luxembourg: Statistical Office of the European Communities
(EUROSTAT), 1998.[20] Schipper L, Marie-Lilliu C. Carbon dioxide emissions from transport in IEA countries — recent lessons and long-
term challenges. In: KFB — Meddelande 1999:11. Stockholm (Sweden): Swedish Transport and CommunicationsResearch Board (KFB), 1999.
[21] Schipper L, Scholl L, Price L. Energy use and carbon emissions from freight in 10 industrialized countries: ananalysis of trends from 1973 to 1992. Transport Res Part D 1997;2(1):57–76.
[22] Andrias A, Samaras Z, Zachariadis T, Zierock K-H. Assessment of random and systematic errors associated withthe CORINAIR/COPERT methodology for estimating VOCs emitted from road traffic. In: IMW-TNO PublicationP 93/040. Delft (The Netherlands): TNO Institute of Environmental Sciences, 1993.
[23] NEA. Certain freight flows. In: Report No. R9910055. Rijswijk (The Netherlands): NEA Transport Research andTraining, 1999.
[24] Samaras Z, Zierock K-H. Off-road vehicles: a comparison of emissions with those from road traffic. Sci TotalEnviron 1995;169(1-3):249–55.