Facing the Reality: Validation of Energy Saving Mechanisms on a Testbed
12
Research Article Facing the Reality: Validation of Energy Saving Mechanisms on a Testbed Edion Tego, 1 Filip Idzikowski, 2 Luca Chiaraviglio, 3 Angelo Coiro, 3 and Francesco Matera 1 1 Fondazione Ugo Bordoni, Viale del Policlinico 147, 00161 Rome, Italy 2 TKN, Technische Universit¨ at Berlin, Einsteinufer 25, 10587 Berlin, Germany 3 DIET, University of Rome, La Sapienza, Via Eudossiana 18, 00184 Rome, Italy Correspondence should be addressed to Luca Chiaraviglio; [email protected] Received 7 November 2013; Revised 28 January 2014; Accepted 6 February 2014; Published 27 March 2014 Academic Editor: Vincenzo Eramo Copyright © 2014 Edion Tego et al. is is an open access article distributed under the Creative Commons Attribution License, which permits unrestricted use, distribution, and reproduction in any medium, provided the original work is properly cited. Two energy saving approaches, called Fixed Upper Fixed Lower (FUFL) and Dynamic Upper Fixed Lower (DUFL), switching off idle optical Gigabit Ethernet (GbE) interfaces during low traffic periods, have been implemented on a testbed. We show on a simple network scenario that energy can be saved using off-the-shelf equipment not explicitly designed for dynamic on/off operation. No packet loss is experienced in our experiments. We indicate the need for faster access to routers in order to perform the reconfiguration. is is particularly important for the more sophisticated energy saving approaches such as DUFL, since FUFL can be implemented locally. 1. Introduction Variation of traffic over day and night in backbone networks offers the opportunity to save energy by deactivating some network devices (or their parts) in low-demand hours. Various approaches have been proposed in the literature (see [1]) for choosing the devices to be deactivated. However there is little work done on the actual implementation validating the potential problems that energy saving schemes may intro- duce. e challenges (corresponding to steps schematically depicted in Figure 1) include (1) accurate monitoring of traffic data; (2) timely triggering network reconfiguration; (3) fast calculation of the desired (energy-efficient) network config- uration; (4) the reconfiguration itself including signaling and the time needed to activate or deactivate the devices and potentially to reroute traffic. Consequently, issues such as network stability, increased delay, jitter, or even packet loss may occur in the network, which is particularly crucial in the backbone. We validate the feasibility of implementation of two algorithms referred to as FUFL and DUFL [2–4] on a testbed. Our experiments show that it is possible to automatically and remotely switch on and off network interfaces in a dynamic manner using off-the-shelf equipment. e structure of the paper is as follows. We provide an overview of the work related to experimental activities for green core networks in Section 2. e network scenario and methodology with algorithms’ description are presented in Sections 3 and 4, respectively. Results are reported in Section 5. Eventually, Section 6 concludes this work. 2. Related Work ere is limited amount of related work dealing with imple- mentation of energy saving mechanisms through selective on/off switching of network elements during periods of low load. To the best of our knowledge, it is basically limited to the following two activities. 2.1. MiDORi. Extensive work has been performed within the MiDORi (Multi (layer, path, and resources) Dynamically Optimized Routing) Network Technologies project [5]. e focus of the project is set on energy saving in the GbE network Hindawi Publishing Corporation Journal of Electrical and Computer Engineering Volume 2014, Article ID 806960, 11 pages http://dx.doi.org/10.1155/2014/806960
-
Upload
independent -
Category
Documents
-
view
5 -
download
0
Transcript of Facing the Reality: Validation of Energy Saving Mechanisms on a Testbed

Research ArticleFacing the Reality: Validation of Energy SavingMechanisms on a Testbed
Edion Tego,1 Filip Idzikowski,2 Luca Chiaraviglio,3 Angelo Coiro,3
and Francesco Matera1
1 Fondazione Ugo Bordoni, Viale del Policlinico 147, 00161 Rome, Italy2 TKN, Technische Universitat Berlin, Einsteinufer 25, 10587 Berlin, Germany3DIET, University of Rome, La Sapienza, Via Eudossiana 18, 00184 Rome, Italy
Correspondence should be addressed to Luca Chiaraviglio; [email protected]
Received 7 November 2013; Revised 28 January 2014; Accepted 6 February 2014; Published 27 March 2014
Academic Editor: Vincenzo Eramo
Copyright © 2014 Edion Tego et al. This is an open access article distributed under the Creative Commons Attribution License,which permits unrestricted use, distribution, and reproduction in any medium, provided the original work is properly cited.
Two energy saving approaches, called Fixed Upper Fixed Lower (FUFL) and Dynamic Upper Fixed Lower (DUFL), switchingoff idle optical Gigabit Ethernet (GbE) interfaces during low traffic periods, have been implemented on a testbed. We show ona simple network scenario that energy can be saved using off-the-shelf equipment not explicitly designed for dynamic on/offoperation. No packet loss is experienced in our experiments. We indicate the need for faster access to routers in order to performthe reconfiguration.This is particularly important for the more sophisticated energy saving approaches such as DUFL, since FUFLcan be implemented locally.
1. Introduction
Variation of traffic over day and night in backbone networksoffers the opportunity to save energy by deactivating somenetwork devices (or their parts) in low-demand hours.Various approaches have been proposed in the literature (see[1]) for choosing the devices to be deactivated. However thereis little work done on the actual implementation validatingthe potential problems that energy saving schemesmay intro-duce. The challenges (corresponding to steps schematicallydepicted in Figure 1) include (1) accuratemonitoring of trafficdata; (2) timely triggering network reconfiguration; (3) fastcalculation of the desired (energy-efficient) network config-uration; (4) the reconfiguration itself including signaling andthe time needed to activate or deactivate the devices andpotentially to reroute traffic. Consequently, issues such asnetwork stability, increased delay, jitter, or even packet lossmay occur in the network, which is particularly crucial in thebackbone.
We validate the feasibility of implementation of twoalgorithms referred to as FUFL andDUFL [2–4] on a testbed.Our experiments show that it is possible to automatically and
remotely switch on and off network interfaces in a dynamicmanner using off-the-shelf equipment.
The structure of the paper is as follows. We providean overview of the work related to experimental activitiesfor green core networks in Section 2. The network scenarioand methodology with algorithms’ description are presentedin Sections 3 and 4, respectively. Results are reported inSection 5. Eventually, Section 6 concludes this work.
2. Related Work
There is limited amount of related work dealing with imple-mentation of energy saving mechanisms through selectiveon/off switching of network elements during periods of lowload. To the best of our knowledge, it is basically limited tothe following two activities.
2.1. MiDORi. Extensive work has been performed withinthe MiDORi (Multi (layer, path, and resources) DynamicallyOptimized Routing) Network Technologies project [5]. Thefocus of the project is set on energy saving in theGbEnetwork
Hindawi Publishing CorporationJournal of Electrical and Computer EngineeringVolume 2014, Article ID 806960, 11 pageshttp://dx.doi.org/10.1155/2014/806960

2 Journal of Electrical and Computer Engineering
A
0.4
C
0.72 GbE
2 GbE
1 GbE2 GbE
1.41.2
1 GbE
IP routerIP link with its capacity
Traffic demand with its rate and routing
Network management and control
(1) Trafficmonitoring
(3) Calculationof networkconfguration
(2) Validationof triggering
events
B 0.6
0.4
Control information
(4) Networkreconfguration
D
Figure 1: Steps needed for energy saving (traffic rates in Gbps, IP link capacities in number of GbE links).
by selectively powering off network interfaces under hop-limit and bandwidth constraints. Powering on/off the wholetransit routers or their parts is also considered. Starting with[6], the authors propose a solutionwhich effectively creates allon/off combinations of links in the network.The solution thatcan carry the whole traffic and consumes the lowest power(considering moving some virtual routers between networknodes in order to power off also nodes) is selected. Beeler’salgorithm is compared with the proposed any-order patternalgorithm, which additionally guarantees the hop number ofthe path lower than a given maximum and disjoint multi-route link divergence for reliable communications. While thealgorithms are centrally executed by the Path ComputationElement (PCE), the authors consider also link on/off controlprotocols. Extensions to Generalized Multiprotocol LabelSwitching (GMPLS) (related to Open Shortest Path First(OSPF), Resources Reservation Protocol (RSVP), and LinkManagement Protocol (LMP)) are proposed.
Further publications related to MiDORi provide exten-sions of [6]. In particular, a prototype layer 2 (L2) switchis introduced in [7]. A depth-d algorithm is proposed andevaluated in a simulative way in [8]. The algorithm searchesfor the optimal configuration of the logical topology, where ddetermines the maximum number of links that are attemptedto be switched off.
The following contributions are made in [9]. First, clearsteps for the energy saving in the MiDORi architecture aredescribed, that is, (1) traffic monitoring; (2) calculation ofenergy-efficient logical topology by PCE; (3) reconfigurationof the network. Second, experiments on a 6-node 7-linknetwork using the depth-d algorithm are conducted, andresults similar to the ones from [8] are presented togetherwith the calculation times in the range of 0.01–105 s for
networks with 10–100 nodes and d in the range of 1–4. In[9] the authors report also total current of the prototype L2switches (2.765–2.831 A) and mention Ethernet Virtual LocalArea Networks (VLANs) as the way of controlling trafficpaths.
More details of the GbE L2 switch are provided in theblock diagram presented in [10]. The switch can count trafficof each Label Switched Path (LSP) (VLAN) and each GbElink. The power consumption of the switch can be read viaa command and a current meter. The presented switch haseight GbE links and is controlled remotely (power on/offstate of each link and each fabric) using telnet via a Linuxbased control card which is one of the few parts constantlypowered up. The authors demonstrated MiDORi on a fullymeshed 6-node network testbed using the depth-1 algorithmwith generic QoS restrictions. Six traffic generators/receiverswere used; however the traffic assumptions were not detailedexcept for the fact that low traffic to high traffic ratio equals1 : 5. The following steps are distinguished (extension from[9]). Step (1) is reading the traffic counters of each VLAN bythe PCE and calculating average values. Step (2) is executionof the depth-1 algorithm at the PCE to obtain the logicaltopology and VLAN paths. Step (3-1) is powering on/offlinks in all switches (remotely by the PCE) according to thetopology from Step (2). Step (3-2) is reconfiguration of theVLAN network topology according to the path calculationfrom Step (2).
Execution of Steps (1)–(3-2) is repeated every Xminutes;however the authors do not report values assigned to Xin [10]. Parallel and serial control of the switches wereconsidered, with the parallel control taking significantly lesstime during both the traffic increase and traffic decrease(233.7–243.9 s versus 61.8–68.7 s, for serial versus parallel
Journal of Electrical and Computer Engineering 3
control, resp.). The results show that the calculation of thelogical topology (Step 2) takesmarginal time (0.004–0.006 s).Duration of Steps (1), (3-1), and (3-2) takes 23.8–112.7 s in theserial control and 7.2–29.0 s in the parallel control.
The concept of Self-Organized Network (initially men-tioned in [10]) is tackled in [11] using the depth-d algorithmagain. The authors point out that the MiDORi GMPLS sup-ports multiple layers, multiple paths, and multiple resources.They explain again the OSPF extension (relation betweenphysical links and Traffic Engineering (TE) links), LMPextension (power on/off control function using the LMPChannelStatus message with Ack and IP Control Channelalways up), and RSVP extension (power control request inthe Admin Status object for LSP status flag). The authorsmention the 16-port GbE switch, which they developed addi-tionally to the 8-port switch presented in [10]. Demonstrationon a 5-node 7-link network is performed showing that totalswitch power consumption can be reduced from 283.1W to276.1W.The results of the reconfiguration times from [10] arealso summarized in [11]. Additionally, the authors point outthat their prototype switch does not support a “make-before-break” VLAN reconfiguration, and therefore data disruptionoccurs over the 29 s of VLAN reconfiguration. Eventually, theauthors mention a MiDORi GMPLS optical switch, whichthey developed. It is also controlled via telnet by the PCEimplemented on a small Linux box.The optical switch allowsthe authors to demonstrate the multilayer GMPLS signalingbetween a Lambda Switch Capable layer and a Layer 2 SwitchCapable layer.
In [12], the authors show the energy consumption (inWhwithout specifying the considered time period and details ofthe traffic data) on a 4-node full mesh network. The energysaving reaches up to 23.8%.
The experiments with the multilayer network using GbEswitches and the optical switch from [11] are continued in[13] using the extension of the GMPLS. Namely, 4 Eth-ernet switches out of the considered 6 are connected tothe optical switch. The demonstrated power saving (9.4Wcorresponding to 6 ports) is low but shows that the MiDORinetwork technology is potentially feasible in a high speed andpower consuming interface located in a large scale networkenvironment.
Eventually, the results are summarized in [14], whichdirectly extends [6]. It includes Beeler’s algorithm, the any-order pattern algorithm, their simulative evaluation on theNational Science Foundation (NSF) network loaded withuniformly generated internode traffic, the GMPLS extensions(OSPF, RSVP, and LMP), the 8-portGbE switch development,and the same results as in [10] (fully meshed 6-node networktestbed).
The GMPLS extensions developed within the MiDORiproject have been proposed to Internet Engineering TaskForce (IETF) [15].
2.2. Experiments on the CARISMA Testbed. Researchersfrom Alcatel-Lucent Bell Labs and Universitat Politecnica deCatalunya (UPC) proposed the extension of GMPLS in [16]and performed experiments on the CARISMA testbed. More
specifically, the authors of [16] propose to introduce a new bit“S” to the Resource Reservation Protocol-Traffic Engineering(RSVP-TE) Path and Resv messages. The bit “S” used jointlywith the already existing bit “A” differentiates the followingstates of an OptoElectronic (OE) device (such as coloredline card, transponder, or regenerator): up, idle, down, anddamaged (see also [17]).
The proposed extension has been evaluated on theCARISMA testbed available at UPC premises in Barcelona.The testbedwas configured according to a Pan-European net-work composed of 16 nodes and 23 links with 10 bidirectional100Gbps wavelengths per link. 20 add/drop transpondersand 10 regenerators were used at each node. The testbed wasloaded with uniformly distributed lightpath requests accord-ing to the Poisson model with average holding time equal to3 hours. The load was varied between 40 and 80 Erlang.
Differentiated provisioning of connection requests isconsidered in [18] for gold, silver, and best-effort traffic. Inthis case, the “A” and “S” bits of the ADMIN Status objectof the RSVP-TE Path message are used in the followingway: (i) “A” = 0 and “S” = 0 indicate the OE devices in theup state which must be used to allocate gold requests; (ii)“A” = 0 and “S” = 1 indicate the OE devices in idle statewhich are needed to allocate silver requests; (iii) “A” = 1and “S” = 0 indicate the OE devices in down state whichcan be used to allocate best-effort requests. Differently to[16], availability of regenerators and wavelengths on links isdisseminated over the network using the proposed extensionof the GMPLS Open Shortest Path First-Traffic Engineering(OSPF-TE) protocol. A new sub-TLV (Type Length Value)(named TSP Status) is introduced in the OSPF-TE opaqueLink State Advertisements (LSAs) containing the number ofup, down, and idle transponders in a node (a regeneratorcorresponds to two transponders). This sub-TLV is insertedinto a Node Information Top Level TLV (type 5, see Figure1 of [18]). Using the OSPF-TE opaque LSAs, the PCE canpopulate its Traffic Engineering Database with wavelengthand regenerator availability information, which is used forcomputation of end-to-end routes.
The same topology as in [16] is used for the experimentalstudy on the CARISMA testbed [18]. The service classdistribution is 20, 30, and 50% for gold, silver, and best-efforttraffic, respectively. Different shares of resources are reservedfor different classes of traffic. Prereservation of resources isimplemented in the PCE to avoid contention of resourcesamong different lightpaths under establishment. Results onthe blocking ratio, number of OE devices in up/idle/downstates, and power consumption per active LSP are reported.
The experimental activities on a testbed reported in [16,18] were restricted to protocol information exchanges. Dueto unavailability of transponders, the idle-up and down-upstate transition times were assumed and not measured. Theassumed transition times equal 20ms and 60 s, respectively.
2.3. Our Contribution. We extend the related work describedabove in the following way. First, we implement the energy-saving schemes on the off-the-shelf equipment, demonstrat-ing that the energy-saving is possible straightaway, even

4 Journal of Electrical and Computer Engineering
without extending GMPLS, even though FUFL and DUFLcan be used also in the GMPLS environment. Second, weexplicitly consider triggering events for calculation of newnetwork configuration and consequently potential networkreconfiguration for energy saving. Third, we implement dif-ferent energy-saving algorithms (FUFL and DUFL) than theones implemented in the MiDORi and CARISMA testbeds.FUFL is particularly interesting for the network opera-tors [4]. Fourth, we implemented the “make-before-break”mechanism. Eventually, we used different traffic schemesfocusing on evaluation of deactivation of parallel GbE linksconstituting one logical link. While very little informationis provided about traffic assumption in MiDORi studies, thetraffic defined as the number of lightpath requests and not“bps to be transported” is used in [16, 18]. Finally, the work in[16, 18] does not consider routing of IP traffic over the logicaltopology.
3. Network Scenario
Even though the original methods FUFL and DUFL [2, 3]were proposed for IP-over-WavelengthDivisionMultiplexing(WDM) backbone networks, they can be applied also toother types of networks, as pointed out in [19, 20] for FUFL.Differently from [2, 3], optical GbE links are used instead oflightpaths in this work, which is determined by the testbedthat we have access to.
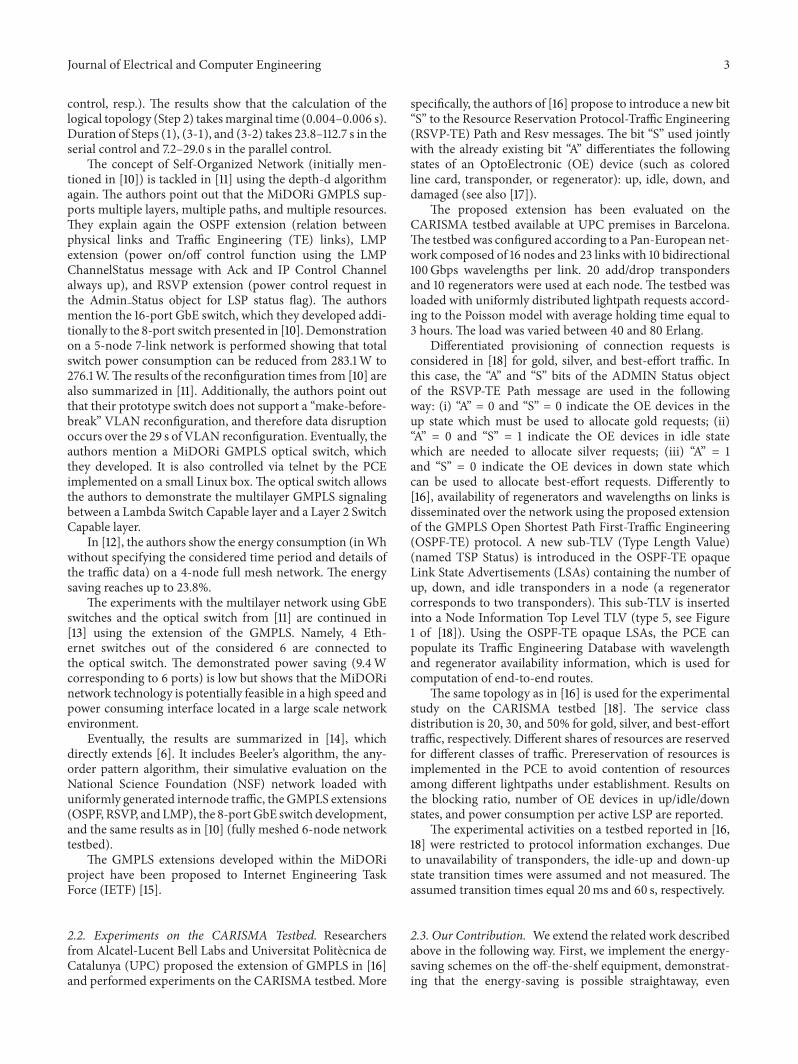
3.1. Testbed. We used the testbed located at the Insti-tute of Communications and Information Technology (Isti-tuto Superiore delle Comunicazioni e delle Tecnologiedell’Informazione ISCOM) of the Italian Ministry of Eco-nomicDevelopment.The testbed scheme is shown in Figure 2[21]. The core part is composed of four Juniper M10/M10irouters (J1–J4) interconnected using 1 Gbps long haul opticallinks connecting Rome to Pomezia (total distance of 50 km).Three Cisco 3845 edge routers (C1–C3) are deployed atthe access part of the network by means of GbE opticallinks. Finally, the testbed is completed with Gigabit PassiveOptical Network (GPON) access networks composed of anOptical LineTerminal (OLT) andup to eightOpticalNetworkTerminals (ONTs), offering a shared bandwidth equal to1.244Gbps. To guarantee an end-to-end minimum band-width in the backbone path, we use the technique describedin [21] that allows us to assign a guaranteed bandwidthbetween two endpoints of the network by means of differenttagging techniques, that is, VLAN and Virtual Private LocalArea Network Service (VPLS).
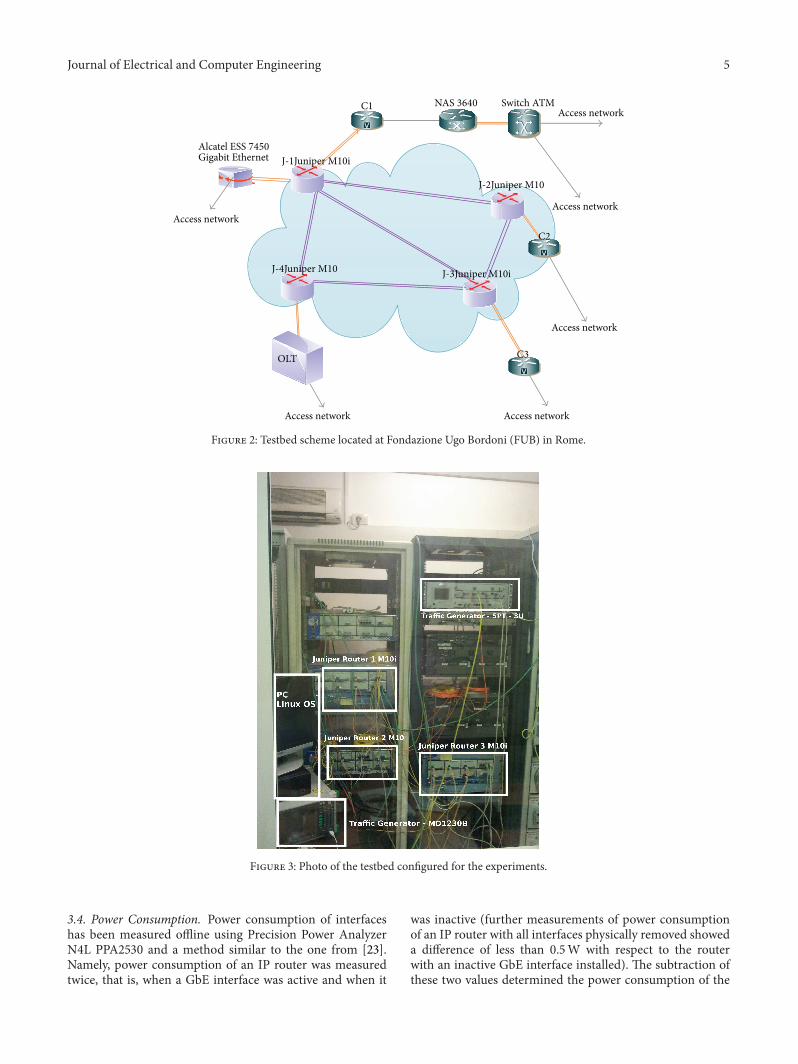
Figure 3 shows the testbed in the configuration used inthis work. A central Personal Computer (PC) is used fornetwork management and control. It is connected directlyover Fast Ethernet (FE) links to the IP router. Trafficmonitoring is communicated by means of Simple NetworkManagement Protocol (SNMP). Triggering of calculation ofa new network configuration based on the monitored trafficas well as the calculation of the new network configurationitself is realized using bash scripting. Eventually, networkreconfiguration is performed by logging via telnet into the IP
Table 1: Traffic demands (bidirectional) in the network.
Trafficdemand
Traffictype
Min(Gbps)
Max(Gbps) Period (s)
A–H Random 0.97 1 —B–I Sine-like 0 0.1 200C–J Sine-like 0 0.1 200D–K Random 0.97 1 —
routers and executing commands to perform rerouting andactivation/deactivation of GbE interfaces.
3.2. Base Logical Topology. We focus on the core partconsisting of one Juniper M10 and two M10i IP routersinterconnected by 50 km of fiber cable into a bidirectionalphysical ring. The logical topology is composed of the IProuters interconnected by GbE optical links. All parallel GbEoptical links between a node pair form a logical link. Thelogical topology is controlled in a centralized way [22].
We configure the testbed in order to obtain a simplescenario that allows demonstration of FUFL and DUFL.The base logical topology together with all traffic demands(source-target) is presented in Figure 4. The nodes A–D andH–K represent traffic generators and sinks attached to nodesE and G. The part representing a core network consists of thenodes E, F, and G interconnected by three logical links, eachformed by two GbE optical links.
3.3. Traffic and Routing. Traffic and its routing over the baselogical topology have been chosen in an artificial manner sothat FUFL and DUFL operation can be demonstrated on theavailable testbed.The Ethernet Testing Platform Spirent SPT-3U, Anritsu MD1230B, and a Linux PC have been used togenerate and terminate traffic. Two types of traffic are used:(i) random traffic with specified minimum and maximumvalues and (ii) sine-like traffic with specified minimum andmaximum values, as well as period length in seconds. Thesine-like traffic consists of halves of sine periods and of idleperiods (as indicated in Figure 5(c)), which is determined bythe traffic generators.
Themaximum value of the sine-like traffic that our trafficgenerators can produce is 100Mbps. Corresponding value forthe random traffic is 1000Mbps. A summary of the trafficinserted into the network is provided in Table 1. Traffic isgenerated in both directions.
The IP routing in the base network indicated in Figure 4has been chosen so that all the logical links carry traffic andthat the load exceeds the capacity of a single GbE optical link.It gives us the opportunity to see what happenswith the trafficon a logical link when the whole logical link or just one outof two parallel GbE links is switched off in the low demandhour.
The inefficient utilization of the logical links is causedby the limitations of the traffic generators. This constitutesno obstacle for showing the operation of energy-savingapproaches, but explicitly provides potential for switching offthe GbE interfaces.
Journal of Electrical and Computer Engineering 5
J-2Juniper M10
J-3Juniper M10i
J-1Juniper M10i
J-4Juniper M10
C2
C3
C1
OLT
Access network
Access network Access network
Access network
Access network
Access network
Alcatel ESS 7450Gigabit Ethernet
NAS 3640 Switch ATM
Figure 2: Testbed scheme located at Fondazione Ugo Bordoni (FUB) in Rome.
Figure 3: Photo of the testbed configured for the experiments.
3.4. Power Consumption. Power consumption of interfaceshas been measured offline using Precision Power AnalyzerN4L PPA2530 and a method similar to the one from [23].Namely, power consumption of an IP router was measuredtwice, that is, when a GbE interface was active and when it
was inactive (further measurements of power consumptionof an IP router with all interfaces physically removed showeda difference of less than 0.5W with respect to the routerwith an inactive GbE interface installed). The subtraction ofthese two values determined the power consumption of the

6 Journal of Electrical and Computer Engineering
B
E 0.1
F
G
1.0
2 GbE
2 GbE
2 GbE1 FE
I
J
1 GbE
1 GbE
1 FE
1 GbE1.0
H
1 FE
C
1 FE
K
A
0.11 GbE
D
Traffic generator/sink
IP routerIP linkTraffic demand and its routingInterface between traffic generator/sink and router
Figure 4: Base logical topology.
GbE interface (11.07W for the M10 router and 8.9W for theM10i router). Power consumption of Juniper’s M10 and M10irouters with all interfaces shutdown equals (according to ourmeasurements) 186.15W and 112.5W, respectively.The powerconsumption values reported above are lower than the onesreported in [23] for Cisco 7507 and in [11] for the MiDORiEthernet switch.
4. Methods
We explain the methods used in each step needed for energysaving according to Figure 1.
4.1. Traffic Monitoring. Themost intuitive approach to trafficmonitoring is to perform the monitoring constantly. Thisapproach is impossible in the simulative approaches per-formed so far, due to unavailability of input traffic datasets originating from measurements and covering trafficbetween all node pairs in the network over sufficiently longperiod of time with sufficient time granularity (IP packetarrival/departure level). Experimental activity overcomes thislimitation. However, there is still some level of freedom insetting the traffic monitoring in a digital system such asa telecommunication network (testbed), namely, the timeperiod 𝑇
𝑀over which the constantly monitored traffic data
is averaged and provided for evaluation triggering calculationof a new network configuration.
4.2. Validation of Triggering Events. The second level offreedom determines the frequency at which the eventstriggering calculation of network configuration are validated.The related time period is denoted as 𝑇
𝐿and should be set
as small as possible in the digital system in order to mimicconstant validation of triggering events. Please note that 𝑇
𝐿is
different than 𝑇𝑀. The latter determines the history which is
taken into account when validating triggering events, whilethe former determines the frequency at which the validationis performed.
With reference to Figure 1, the “traffic monitoring” blockprovides with periodicity𝑇
𝐿input data (measure of the traffic
load experienced on each logical link) for the “validation
of triggering events” block. Thus, starting from the timeinstant 𝑡
1, corresponding to the first validation, the 𝑛th
validation is performed at time 𝑡𝑛= 𝑡1+ (𝑛 − 1)𝑇
𝐿.
Each validation is performed according to the measure ofthe average traffic load experienced during a period 𝑇
𝑀.
Specifically, the measure provided at time 𝑡𝑛corresponds to
the average traffic load during the period (𝑡𝑛−𝑇𝑀, 𝑡𝑛). Notice
that choosing a small value for𝑇𝐿allows a prompt reaction to
changing traffic conditions, which is particularly importantduring increasing traffic trend in order not to experiencecongestionwithin the network.On the other hand, the systemshould be as much stable as possible and not follow all tinyvariations of traffic. For this reason, traffic load measures areprovided as averages over the period 𝑇
𝑀, which should be
chosen sufficiently long so as to hide very high frequencytraffic variations.
Calculation of new network topology is triggered byviolation of thresholds (𝑊
𝐴and 𝑊
𝐷for FUFL and 𝑊
𝐿
and 𝑊𝐻for DUFL) as explained in detail in the following
subsection. This step also takes into account the stabilityissue by including a hysteresis cycle within the thresholdmechanism.
4.3. Calculation of Network Configuration. We focus on twoclasses of approaches to calculation of network configuration[2, 3], namely, FUFL and DUFL.
4.3.1. FUFL. The first class is very simple and attractive fornetwork operators [4]. It is fully distributed and involvesneither changing of IP routing nor changing of the connec-tivity of the logical topology. The load on each GbE linkconstituting the logical link is monitored. A GbE link isswitched offwhen load on the previous parallel GbE link goesdown below𝑊
𝐷. It is switched on again when the load on the
previous parallel GbE link goes above 𝑊𝐴. 𝑊𝐷and 𝑊
𝐴are
defined as utilization of a GbE link. The explanation aboveassumes bin-packing of traffic in parallel links [19, 20]. Wehave not verified the load-balancing mechanisms used in theJuniper routers. If other packing (load-distribution) strategiesare used, traffic on the GbE link to be switched off is shiftedto other active parallel GbE links. According to [24, 25], linkaggregation implementation in Juniper routers uses the sameload-balancing algorithm as that used for per-packet loadbalancing; that is, the router sends successive data packetsover paths without regard to individual hosts or user sessions.It uses the round-robinmethod to determinewhich path eachpacket takes towards its target.
4.3.2. DUFL. The second class DUFL is more complex, as itallows changing of IP routing, which in turn may increasethe number of idle interfaces in the network and lead even toswitching off whole logical links. A logical link nonexistingin the base network cannot be established though. Thereare many algorithms which fall into the class of DUFL (see,e.g., DAISIES [26] and Least Flow Algorithm [27]); howevertheir comparison is out of the scope of this paper. The powersavings in the simple base network topology from Figure 4
Journal of Electrical and Computer Engineering 7
would be basically identical. A simulative comparison on alarger network is available in [1].
For the sake of this work, we assume the followingimplementation of DUFL. The decision about an attempt toreroute traffic with the aim of deactivation or activation of alogical link is triggered by violation of the thresholds𝑊
𝐿and
𝑊𝐻, respectively. Both𝑊
𝐿and𝑊
𝐻are defined as utilization
of a logical link. The traffic demands routed via E-F-G areattempted to be rerouted to link E–G if aggregated demandon the logical links E-F and F-G goes below𝑊
𝐿. Analogical
rerouting attempt is performed when load of the logical linkE–G goes below𝑊
𝐿.
Idle logical links with optical interfaces are switchedoff. The original logical topology and routing (Figure 4) arerestored when𝑊
𝐻is violated on any logical link.
4.4. Network Reconfiguration. The last step concerns theapplication of the newly computed network configurationin network devices. To perform this step, the managementsystem opens a telnet session on routers which need theirconfigurations to be changed and applies the needed changes.Specifically, routing is changed and network interfaces areswitched on/off according to the computed network configu-ration.We ensure that rerouting is performed before a logicallink is released when load decreases and after a logical link isestablished when load increases.
5. Results
We parameterize the methods described in Section 4 in thefollowing way.The thresholds are assigned with the followingvalues: 𝑊
𝐷= 0.977 and 𝑊
𝐴= 0.985 for FUFL and 𝑊
𝐿=
0.4885 and𝑊𝐻= 0.9925 for DUFL. Both𝑇
𝑀and𝑇𝐿are set to
10 s.The chosen values are determined by the generated trafficcharacteristic and for the sake of demonstration of the powersaving approaches. Traffic variations close to the thresholdvalues allow us to verify the methods without waiting long(corresponding to diurnal variation of traffic).
As for the setting of 𝑇𝐿(the time period between two
successive validations of triggering events), we had to mindthe time needed for reconfiguration (Step 4 in Figure 1).Specifically, 𝑇
𝐿should be longer than the time needed for
network reconfiguration, denoted asΔ Step4.The reason is thattwo concurrent attempts to switch on/off a network interfacecould be undertaken otherwise. Due to the nonnegligiblevalues of Δ Step4 experienced in our experiments, we decidedto overcome this problem by not performing the validationof triggering events during network reconfiguration. In thisway, it was possible to keep 𝑇
𝐿lower than Δ Step4 without
experiencing any concurrent attempts to switch on/off aninterface.
Figures 5(a) and 5(b) report the total power consumptionand the power saving for the testbed running FUFL andDUFL on the logical topology, respectively. For clarity, thefirst 600 seconds are reported. The total power consumptioncorresponds to power consumed by all active GbE inter-faces together with the routers according to the data fromSection 3.4. Power consumption varies more frequently with
DUFL than with FUFL, since our implementation of DUFLis more aggressive in turning off the network interfaces—it attempts to switch off the whole logical links. This inturn produces in general higher power saving compared toFUFL. The difference is minor due to the simple 3-node baselogical topology and IP routing schemes that we use for thisdemonstration (see Section 3).
Figures 5(c) and 5(d) report the monitored traffic onlogical links when FUFL and DUFL are applied, respectively.The figures report also the sine-like traffic injected to thenetwork. As expected, all the logical links are always utilizedwith FUFL, and therefore each link has always aggregatedtraffic around 1Gbps. On the contrary, the utilization of thelinks frequently changes with DUFL, since this algorithmreroutes the traffic and powers off the entire logical links.Therefore traffic on each logical link has a strong fluctuationbetween 0 and 2Gbps.
The time Δ𝑆tep3 needed for calculation of network con-
figuration (Step 3 in Figure 1) takes 0.15 s for both FUFLand DUFL. We measured also the time needed for networkreconfiguration (Step 4 in Figure 1). It consists of (i) timeconsumed by telnet (opening a session), Δ telnet: 11.54 s; (ii)time needed to power on a GbE interface, Δ activate: 0.01 s; (iii)time needed to power off a GbE interface, Δ deactivate: 0.01 s.We neglect the time that is needed to perform the reroutingin DUFL.
We point out that the time values that we obtained arecomparable with the ones reported in [10, 11], even thoughthe testbeds differ significantly.
The overall duration of Step 4 for a network consisting ofa set of nodes 𝑉 is calculated according to
Δ Step4 = ∑𝑖∈𝑉
(𝑥𝑖⋅ Δ activate + 𝑦𝑖 ⋅ Δ deactivate) + 𝑧 ⋅ Δ telnet, (1)
where 𝑥𝑖and 𝑦
𝑖denote the number of activated and deacti-
vated interfaces at node 𝑖 ∈ 𝑉, respectively, and 𝑧 denotes thenumber of nodes (routers) that need to be accessed one afteranother.
Clearly, in an operational network, the time Δ Step4required for the reconfiguration should be limited. In ourcase, it takes quite a lot of time to open a telnet sessionin order to reconfigure a router. If telnet authentication isdone manually, the time to open a telnet session decreasesa lot for the routers under consideration, depending onthe complexity of the password. For example, the time thatwe measured with a manual authentication and a simplepassword of 6 characters was only 2.5 seconds. This amountof time depends on the implementation of telnet and onthe operating system of the device. In our case the telnetsessions are opened one after another in order to performthe configuration of the interfaces for each node. In such acase, 𝑧 = ∑
𝑖∈𝑉𝑧𝑖, where 𝑧
𝑖determines the need to access node
𝑖 ∈ 𝑉; namely,
𝑧𝑖= {0, if𝑥
𝑖+ 𝑦𝑖= 0,
1, otherwise.(2)
Note that 𝑧 can be at most reduced to 1 if routers can beaccessed in parallel. We show the time taken by network

8 Journal of Electrical and Computer Engineering
0
100
200
300
400
500
600
700
0 100 200 300 400 500 600 0
10
20
30
40
50To
tal p
ower
(W)
Pow
er sa
ving
(%)
Time (s)
Power consumptionPower saving
(a) FUFL: total power consumption (left y-axis) and power saving(right y-axis)
0
100
200
300
400
500
600
700
0 100 200 300 400 500 600 0
10
20
30
40
50
Tota
l pow
er (W
)
Pow
er sa
ving
(%)
Time (s)
Power consumptionPower saving
(b) DUFL: total power consumption (left y-axis) and power saving(right y-axis)
0
200
400
600
800
1000
1200
1400
0 100 200 300 400 500 600
Traffi
c (M
bps)
Time (s)
Monitored traffic on the logical link E–GSine-like traffic
Monitored traffic on the logical links E–F and F–G
(c) FUFL: monitored traffic
0
500
1000
1500
2000
2500
3000
0 100 200 300 400 500 600
Traffi
c (M
bps)
Time (s)
Sine-like trafficMonitored traffic on the logical link E–GMonitored traffic on the logical links E–F and F–G
(d) DUFL: monitored traffic
Figure 5: FUFL and DUFL results on the testbed (mind different y-scales in (c) and (d)).
reconfiguration Δ Step4 in Figure 6 for FUFL and DUFLand for both the parallel and consecutive access of routers(automatic and manual authentication, resp.). Clearly, therequired time to switch on/off the devices increases, whenthe number of affected interfaces is increased, since morerouters need to be accessed and configured in our scenario.The theoretical time taken to switch on/off interfaces whenmanual authentication is assumed is significantly lower thanthe time measured during our experiments with automaticauthentication. We think that this issue of long automaticauthentication should be easily overcome in the operationalnetwork. Furthermore, local implementation of FUFL onrouters would avoid this problem too.
In Figure 7 we can observe the trends of the total moni-tored traffic and total power consumed by the network overtime. For clarity we limit the timescale to the first 290 s. Wecan clearly see the direct impact of the total monitored trafficon the total power. In particular, the power tends to increasewhen the traffic increases, meaning that the algorithms areable to correctly react to the traffic variation. We can observeagain that with DUFL the power varies more frequently,suggesting that the number of interfaces that are switchedon/off frequently varies.
To give more insight, we have collected the events thatoccur in the network. In particular, every time that one of thethresholds is violated (Step 2 in Figure 1), one of the actions

Journal of Electrical and Computer Engineering 9
Tim
e (s)
Automatic authentication Manual authentication
0
interfaces interfaces interfaces interfaces interfaces interfaces
40302010
Switch on 2 Switch on 4 Switch on 6Switch off 2 Switch off 4 Switch off 6
(a) FUFL
Tim
e (s)
Automatic authentication Manual authentication
0interfaces interfaces interfaces interfaces
40302010
Switch on 4 Switch on 8Switch off 4 Switch off 8
(b) DUFL
Figure 6: Time taken by network reconfiguration (Δ Step4).
Tota
l pow
er (W
)
Tota
l mon
itore
d tr
affic (
Gbp
s)
Time (s)
Total monitored trafficTotal power
440
460
480
500
520
540
3.7
3.8
3.9
4.0
4.1
4.2
0 40 80 120 160 200 240 280
(a) FUFL
Tota
l pow
er (W
)
Tota
l mon
itore
d t
raffi
c (G
bps)
Time (s)
Total monitored trafficTotal power
440
460
480
500
520
540
3.7
3.8
3.9
4.0
4.1
4.2
0 40 80 120 160 200 240 280
(b) DUFL
Figure 7: Total monitored traffic and total power over time (mind different y-scales).
0
Time (s)
Do nothingSwitch on 4 interfaces
Switch on 2 interfaces
Switch off 4 interfaces
Switch on 6 interfacesSwitch off 2 interfaces
Switch off 6 interfaces
20 40 60 80 100 120 140 160 180 200 220 240 260 280
(a) FUFL
Time (s)
Do nothing
Switch on 4 interfacesSwitch off 4 interfacesSwitch on 8 interfacesSwitch off 8 interfaces
0 20 40 60 80 100 120 140 160 180 200 220 240 260 280
(b) DUFL
Figure 8: Occurring action over time.
is taken according to the calculated (with FUFL or DUFL)network configuration (Step 3 in Figure 1). The occurrenceof such events is reported in Figure 8. We show the first290 s on the time axis in correspondence with Figure 7.Interestingly, we can observe that with FUFL (Figure 8(a))most of the events do not require a change in the currentnetwork configuration, while with DUFL (Figure 8(b)) theconfiguration frequently varies over time. Additionally, thenumber of switched off interfaces is higher with DUFL thanwith FUFL (as expected).
Finally, we observedminor increase of end-to-end packetdelay (up to 30ms during reconfiguration) and no packetloss based on the monitored traffic. Thus, we can con-clude that our solutions are able to save energy while notdeteriorating the quality of service for users in this simplescenario.
6. Conclusion
We demonstrated the operation of energy saving approachesFUFL andDUFL on a testbedwith optical GbE interfaces.Weshowed that it was possible to dynamically adapt the networkconfiguration to the changing load without losing trafficand with a minor increase in the packet delay. Moreover,we demonstrated that it was feasible to automatically andremotely activate and deactivate interfaces of commercialdevices available today. We experienced relatively long timeto reconfigure the network, which depends on how routersare accessed.We believe that this issue can be easily overcomein the operational networks using future devices designed forgreen networking. Furthermore, FUFL results can be directlytranslated to bigger networks, because this mechanism islocal. Experimental validation of DUFL approaches is more

10 Journal of Electrical and Computer Engineering
challenging, since no testbed of a large size is available tous. Results of simulative studies on larger networks than ourscenario can be found in [1, 4, 26, 28].
In general, the mesh degree of the network influencespower savings more than the network size [29, 30]. This isdue to the fact that the mesh degree determines the numberof possibilities to reroute traffic. Regarding the differentmethods for calculation of network configuration (Step 3 inFigure 1), our big picture study [1] showed that there is anoticeable difference between the simple local method FUFLand the more complex methods. However, power savingshould be evaluated together with other evaluation criteriasuch as impact on QoS, network knowledge, or protectionconsideration (see Table 2 in [1]).
Conflict of Interests
The authors declare that there is no conflict of interestsregarding the publication of this paper.
Acknowledgment
The research leading to these results has received fundingfrom the European Union Seventh Framework Programme(FP7/2007–2013) under Grant agreement no. 257740 (Net-work of Excellence “TREND”).
References
[1] F. Idzikowski, E. Bonetto, L. Chiaraviglio et al., “TREND inenergy-aware adaptive routing solutions,” IEEE Communica-tions Magazine, vol. 51, no. 11, pp. 94–104, 2013.
[2] F. Idzikowski, S. Orlowski, C. Raack, H. Woesner, and A.Wolisz, “Saving energy in IP-over-WDMnetworks by switchingoff line cards in low-demand scenarios,” in Proceedings of the14th International Conference on Optical Networking Design andModeling (ONDM ’10), Kyoto, Japan, February 2010.
[3] F. Idzikowski, S. Orlowski, C. Raack,H.Woesner, andA.Wolisz,“Dynamic routing at different layers in IP-over-WDMnetworksMaximizing energy savings,”Optical Switching and Networking,vol. 8, no. 3, pp. 181–200, 2011.
[4] F. Idzikowski, L. Chiaraviglio, R. Duque, F. Jimenez, and E.Le Rouzic, “Green horizon: looking at backbone networks in2020 from the perspective of network operators,” in Proceedingsof the International Conference on Communications (ICC ’13),Budapest, Hungary, June 2013.
[5] MiDORi Network Technologies Project (MiDORi), 2009,http://midori.yamanaka.ics.keio.ac.jp.
[6] N. Yamanaka, S. Shimizu, and G. Shan, “Energy efficient net-work design tool for green IP/Ethernet networks,” in Proceed-ings of the 14th International Conference on Optical NetworkingDesign andModeling (ONDM ’10), Kyoto, Japan, February 2010.
[7] N. Yamanaka, H. Takeshita, S. Okamoto, and S. Gao, “[Invited]MiDORi: Energy efficient network based on optimizing net-work design tool, remote protocol and new layer-2 switch,”in Proceedings of the 9th International Conference on OpticalInternet (COIN ’10), Jeju, South Korea, July 2010.
[8] H. Yonezu, S. Gao, S. Shimizu et al., “Network power savingtopology calculation method by powering off links considering
QoS,” in Proceedings of the 15th OptoElectronics and Communi-cations Conference (OECC ’10), pp. 586–587, Sapporo, Japan, July2010.
[9] H. Yonezu, K. Kikuta, D. Ishii, S. Okamoto, E. Oki, andN. Yamanaka, “QoS aware energy optimal network topologydesign and dynamic link power management,” in Proceedingsof the 36th European Conference and Exhibition on OpticalCommunication (ECOC ’10), Torino, Italy, September 2010.
[10] H. Takeshita, Y. Oikawa, H. Yonezu, D. Ishii, S. Okamoto, andN. Yamanaka, “Demonstration of the self organized dynamiclink power management by “MiDORi” energy optimal networktopology design engine,” in Proceedings of the Optical FiberCommunication Conference and Exposition and the NationalFiber Optic Engineers Conference (OFC/NFOEC ’11), Los Ange-les, Calif, USA, March 2011.
[11] S. Okamoto, Y. Nomura, H. Yonezu, H. Takeshita, and N.Yamanaka, “GMPLS-enabled, energy-efficient, self-organizednetwork: MiDoRi,” in Proceedings of the Asia Communicationsand Photonics Conference and Exhibition (ACP’11), Shanghai,China, November 2011.
[12] Y. Nomura, H. Yonezu, D. Ishii, S. Okamoto, and N. Yamanaka,“Dynamic topology recon guration for energy efficient net-work with link power control: MiDORi,” in Proceedings ofthe World Telecommunications Congress (WTC’12), Yokohama,Japan, March 2012.
[13] Y. Nomura, H. Yonezu, and D. Ishii, “Dynamic topologyreconfiguration for energy efficient multi-layer network usingextended GMPLS with link power control,” in Proceedings ofthe Optical Fiber Communication Conference and Exposition(OFC/NFOEC ’12), Los Angeles, Calif, USA, March 2012.
[14] H. Takeshita, N. Yamanaka, S. Okamoto, S. Shimizu, and S. Gao,“Energy efficient network design tool for green IP/Ethernetnetworks,” Optical Switching and Networking, vol. 9, no. 3, pp.264–270, 2012.
[15] S. Okamoto, “Requirements of GMPLS extensions forenergy efficient traffic engineering,” 2013, http://tools.ietf.org/html/draft-okamoto-ccamp-midori-gmpls-extension-reqs-02.
[16] A. Morea, S. Spadaro, O. Rival, J. Perello, F. Agraz, and D.Verchere, “Power management of optoelectronic interfaces fordynamic optical networks,” in Proceedings of the 37th EuropeanConference on Optical Communication and Exhibition (ECOC’11), Geneva, Switzerland, September 2011.
[17] A.Morea, J. Perello, S. Spadaro, D. Verchere, andM. Vigoureux,“Protocol enhancements for “greening” optical networks,” BellLabs Technical Journal, vol. 18, no. 3, pp. 211–230, 2013.
[18] A. Morea, J. Perello, F. Agraz, and S. Spadaro, “Demonstrationof GMPLS-controlled device power management for nextgeneration green optical networks,” in Proceedings of the OpticalFiber Communication, Los Angeles, Calif, USA, March 2012.
[19] L. Liu and B. Ramamurthy, “Rightsizing bundle link capacitiesfor energy savings in the core network,” in Proceedings ofthe 54th Annual IEEE Global Telecommunications, Exhibitionand Industry Forum (GLOBECOM ’11), Houston, Tex, USA,December 2011.
[20] L. Lin and B. Ramamurthy, “A dynamic local method forbandwidth adaptation in bundle links to conserve energy incore networks,” Optical Switching and Networking, vol. 10, no.4, pp. 481–490, 2013.
[21] A. Valenti, A. Rufini, S. Pompei et al., “QoE and QoS compar-ison in an anycast digital television platform operating on pas-sive optical network,” in Proceedings of the Telecommunications

Journal of Electrical and Computer Engineering 11
Network Strategy and Planning Symposium (NETWORKS ’12),Rome, Italy, October 2012.
[22] L. Rea, S. Pompei, A. Valenti, F. Matera, C. Zema, and M.Settembre, “Quality of Service control based on Virtual PrivateNetwork services in a Wide Area Gigabit Ethernet optical testbed,”Fiber and IntegratedOptics, vol. 27, no. 4, pp. 301–307, 2008.
[23] J. Chabarek, J. Sommers, P. Barford, C. Estan, D. Tsiang, and S.Wright, “Power awareness in network design and routing,” inProceedings of the 27th IEEE Communications Society Confer-ence on Computer Communications (INFOCOM ’08), pp. 1130–1138, Phoenix, Arizona, USA, April 2008.
[24] Juniper, “JUNOS Software Interfaces and Routing Configura-tion Guide,” 2010, http://www.juniper.net/techpubs/software/junos-security/junos-security10.2/junos-security-swconfig-interfaces-and-routing/junos-security-swconfig-interfaces-and-routing.pdf.
[25] Cisco, “Per-Packet Load Balancing, IOS Release 12.2(28)SBGuide,” 2006, http://www.cisco.com/en/US/docs/ios/12 0s/feature/guide/pplb.pdf.
[26] A. Coiro, M. Listanti, A. Valenti, and F. Matera, “Energy-awaretraffic engineering: a routing-based distributed solution forconnection-oriented IP networks,” Computer Networks, vol. 57,no. 9, pp. 2004–2020, 2013.
[27] L. Chiaraviglio, M. Mellia, and F. Neri, “Minimizing ISPnetwork energy cost: formulation and solutions,” IEEE/ACMTransactions on Networking, vol. 20, no. 2, pp. 463–476, 2012.
[28] E. Bonetto, L. Chiaraviglio, F. Idzikowski, and E. Le Rouzic,“Algorithms for the multi-period power-aware logical topologydesign with reconfiguration costs,” Journal of Optical Commu-nications and Networking, vol. 5, no. 5, pp. 394–410, 2013.
[29] W. Van Heddeghem, F. Musumeci, F. Idzikowski et al., “Powerconsumption evaluation of circuit-switched versus packet-switched optical backbone networks,” in Proceedings of theOnlineGreenComm, October 2013.
[30] L. Chiaraviglio, D. Ciullo, M. Mellia, and M. Meo, “Modelingsleep mode gains in energy-aware networks,” Computer Net-works, vol. 57, no. 15, pp. 3051–3066, 2013.

International Journal of
AerospaceEngineeringHindawi Publishing Corporationhttp://www.hindawi.com Volume 2014
RoboticsJournal of
Hindawi Publishing Corporationhttp://www.hindawi.com Volume 2014
Hindawi Publishing Corporationhttp://www.hindawi.com Volume 2014
Active and Passive Electronic Components
Control Scienceand Engineering
Journal of
Hindawi Publishing Corporationhttp://www.hindawi.com Volume 2014
International Journal of
RotatingMachinery
Hindawi Publishing Corporationhttp://www.hindawi.com Volume 2014
Hindawi Publishing Corporation http://www.hindawi.com
Journal ofEngineeringVolume 2014
Submit your manuscripts athttp://www.hindawi.com
VLSI Design
Hindawi Publishing Corporationhttp://www.hindawi.com Volume 2014
Hindawi Publishing Corporationhttp://www.hindawi.com Volume 2014
Shock and Vibration
Hindawi Publishing Corporationhttp://www.hindawi.com Volume 2014
Civil EngineeringAdvances in
Acoustics and VibrationAdvances in
Hindawi Publishing Corporationhttp://www.hindawi.com Volume 2014
Hindawi Publishing Corporationhttp://www.hindawi.com Volume 2014
Electrical and Computer Engineering
Journal of
Advances inOptoElectronics
Hindawi Publishing Corporation http://www.hindawi.com
Volume 2014
The Scientific World JournalHindawi Publishing Corporation http://www.hindawi.com Volume 2014
SensorsJournal of
Hindawi Publishing Corporationhttp://www.hindawi.com Volume 2014
Modelling & Simulation in EngineeringHindawi Publishing Corporation http://www.hindawi.com Volume 2014
Hindawi Publishing Corporationhttp://www.hindawi.com Volume 2014
Chemical EngineeringInternational Journal of Antennas and
Propagation
International Journal of
Hindawi Publishing Corporationhttp://www.hindawi.com Volume 2014
Hindawi Publishing Corporationhttp://www.hindawi.com Volume 2014
Navigation and Observation
International Journal of
Hindawi Publishing Corporationhttp://www.hindawi.com Volume 2014
DistributedSensor Networks
International Journal of