Dehydration of natural gas using membranes. Part I: Composite membranes
Upload
independentCategory
view
1download
0
Uncorrected Proof Copy
Uncorrected Proof C
opy
Uncorrected Proof Copy
Job: Dopico Operator: IBHChapter: 18_Conrad Date: 14/02/07Template: MIMB/7x10/Temp/ Revision: Page Proof
18
Using Fluorescence Recovery After Photobleaching to Measure Lipid Diffusion in Membranes
Conrad W. Mullineaux and Helmut Kirchhoff
Summary
The lateral diffusion of lipids is crucial to the biogenesis and function of biological membranes. In this chapter,
approaches for observing the lateral diffusion of lipids using fluorescence recovery after photobleaching are
described. The procedures described can be carried out with a standard laser-scanning confocal microscope. The
membrane of interest is stained with a lipophilic fluorophore or fluorescent lipid analog. The confocal laser spot
is then used to photobleach fluorescence in a small region of the sample. Subsequent spread and recovery of the
bleach, reports on the diffusion of the fluorophore. The results provide a measure of membrane fluidity, and the
extent to which lipid diffusion in the membrane might be constrained. Fluorescence recovery after photobleach-
ing measurements may be carried out in vivo, in systems ranging from bacteria to mammalian cells, or in vitro in
isolated membrane fragments. Procedures for preparing the biological sample, performing the measurement, and
quantitative data analysis are explained.
Key Words: Biological membranes; confocal microscopy; fluorescence recovery after photobleaching; lipid
diffusion; membrane fluidity.
1. Introduction
Fluorescence recovery after photobleaching (FRAP) provides a relatively simple and
direct method for measuring large-scale lateral diffusion of lipids in membranes (1,2). FRAP
reports only on the averaged behavior of many thousands of molecules. More sophisticated
methods are needed to track the diffusion of individual lipid molecules (3,4). Because of the
limited spatial resolution of FRAP, measurements will miss some important aspects of bio-
logical membranes such as microdomains (5). However, advantages of FRAP are: (1) it is
rather straightforward and noninvasive and (2) measurements can readily be carried out in
vivo. FRAP measurements of lipid diffusion give an overview of the fluidity of the mem-
brane; for example, they can be used to show changes in fluidity owing to phase transition
and lipid composition (1,2). Comparison of the diffusion coefficient of a lipophilic fluo-
rophore in different biological membranes reveals considerable variability in lipid diffusion
rates, probably depending mainly on the membrane lipid composition and lipid–protein inter-
action. The information has direct biological relevance, because long-range lipid diffusion is
vital to many membrane processes, including membrane biogenesis, signal transduction, and
electron transport mediated by quinones.
The approaches described in this chapter can all be carried out using a standard laser-scanning
confocal microscope. The principle of the method is that the membrane of choice is stained
From: Methods in Molecular Biology, vol. 400: Methods in Membrane LipidsEdited by: A. M. Dopico © Humana Press Inc., Totowa, NJ
267
AU: Pleaseprovide theinitials forthe authorHelmutKirchhoff.
AU: Pleaseprovide atleast sixwords askey words.
18_Conrad 2/23/07 10:26 PM Page 267

Uncorrected Proof Copy
Uncorrected Proof C
opy
Uncorrected Proof Copy
Job: Dopico Operator: IBHChapter: 18_Conrad Date: 14/02/07Template: MIMB/7x10/Temp/ Revision: Page Proof
with a lipophilic fluorophore or fluorescent lipid analog (1,2). The confocal microscope is
used to image the membrane, visualizing fluorescence from the fluorophore. The laser power
is increased and the confocal spot is scanned over a small, localized region of the membrane,
bleaching the fluorophore in this area. The laser power is then decreased to prevent further
bleaching, and the sample is scanned to acquire a series of images at different time-points
after the bleach (6,7). Diffusion of the fluorophore results in a characteristic “blurring” of the
bleached area (6,7). The bleach is initially deep and very localized: diffusion causes spread
of the bleach and recovery of fluorescence at the center of the bleached area, so the bleach
becomes broader and shallower. Quantitative data can be extracted from the images and ana-
lyzed to obtain the diffusion coefficient of the fluorophore (6,7).
Traditional FRAP measurements were carried out without laser scanning, simply using a sta-
tionary laser spot to bleach and then record fluorescence recovery in one place. Imaging the sam-
ple by laser scanning reduces time resolution but makes the measurement very much more robust
(7). Imaging the sample allows the visualization of diffusion barriers, and makes it easy to spot
experimental problems such as movement of the sample, loss of focus, or the initial bleach being
broader than expected. This chapter describes the use of laser-scanning confocal microscopy for
FRAP measurements of lipid diffusion. Approaches will be described to measuring lipid diffu-
sion in vivo, and in isolated membranes in vitro. In the case of smaller samples, such as bacter-
ial cells and small membrane fragments, a significant task is preventing any movement of the
sample during measurements. This chapter describes approaches for doing this task.
2. Materials
2.1. The Fluorescent Probe
The best choice of lipophilic fluorescent probe depends on the wavelengths available in the
confocal microscope. The favorite is 4,4-difluoro-5,7-dimethyl-4-bora-3a,4a-diaza-s-indacene-
3-dodecanoic acid (BODIPY® FL C12
), which combines a green fluorophore with a 12-carbon
saturated hydrocarbon tail. It can be efficiently excited with the 488-nm line of an argon laser
(Spectra-Physics, Mountain View, CA), and has a peak fluorescence emission at about 512 nm.
It is supplied by the Molecular Probes division of Invitrogen (http://probes.invitrogen.com/).
Molecular Probes also supply the same fluorophore linked to some specific biologically impor-
tant lipids. Prepare a 10 mM stock solution of BODIPY FL C12
in dimethylsulfoxide, and store
at –20°C.
2.2. Immobilizing the Sample—In Vivo Measurements on Bacteria and so on
1. A suitable growth medium for the bacteria being studied.
2. Difco bacto-agar (BD Biosciences, Franklin Lakes, NJ).
3. Glass cover slips (0.1 mm thickness) (VWR International Ltd., West Chester, PA).
4. Cell division inhibitor. For Escherichia coli use cephalexin (Sigma-Aldrich, St. Louis, MO): pre-
pare a 10 mg/mL stock solution in water and filter sterilize.
5. Temperature-controlled microscope sample holder, with well to accommodate a small block of
agar, with a cover slip on top. The author’s is laboratory-built. VWR supply disposable slides
with wells, but these do not have temperature control.
6. Silicone vacuum grease (VWR International Ltd.).
2.3. Immobilizing the Sample—In Vivo Measurements on Cultured Mammalian Cells
1. Suitable growth medium (e.g., Dulbecco’s Modified Eagles Medium) (VWR International Ltd.).
2. Glass cover slips (0.1 mm thickness).
268 Mullineaux and Kirchhoff
AU: Pleaseprovidemanufac-turer detailsforBODIPY®
andInvitrogen.
18_Conrad 2/23/07 10:26 PM Page 268

Uncorrected Proof Copy
Uncorrected Proof C
opy
Uncorrected Proof Copy
Job: Dopico Operator: IBHChapter: 18_Conrad Date: 14/02/07Template: MIMB/7x10/Temp/ Revision: Page Proof
3. Presterilized culture vessel with chambers for cover slips (VWR International Ltd.).
4. Temperature-controlled microscope sample holder as in Subheading 2.2.
5. Silicone vacuum grease (VWR International Ltd.).
2.4. Immobilizing the Sample—In Vitro Measurements on Isolated Membrane Fragments or Vesicles
1. Egg yolk phosphatidyl choline (Sigma-Aldrich) made into a 10-mM solution in 2,2,2-trifluo-
roethanol (TFE) (Sigma-Aldrich).
2. Glucose (Sigma-Aldrich).
3. Glucose oxidase (Sigma-Aldrich).
4. Catalase (Sigma-Aldrich).
5. Glass microscope slides (VWR International Ltd.).
6. Glass cover slips (0.1 mm thickness) (VWR International Ltd.).
2.5. Performing the FRAP Measurement
This requires a laser-scanning confocal microscope. The authors’ use a Nikon PCM2000
(Nikon Instech Co., Kanagawa, Japan) equipped with a 100-mW argon laser (Spectra-
Physics). For BODIPY FL C12
they use the 488-nm line from the argon laser, selected by an
interference band-pass filter. Fluorescence is selected by a 505-nm dichroic mirror and a
band-pass filter transmitting at approx 500–527 nm. The measurements require suitable
acquisition software for switching between XY and X-scanning modes, and recording a
series of images at defined time intervals. The authors’ use the EZ2000 software supplied
with the PCM2000 microscope. It must be possible to rapidly change the light output from
the laser (e.g., with neutral density filters).
2.6. Data Analysis
1. Suitable software for extracting quantitative data from images, for example, Image-Pro Plus 5.1
(MediaCybernetics, Silver Spring, MD).
2. Suitable software for data analysis and curve fitting. SigmaPlot 9.0 (Systat, Point Richmond,
CA) is suitable for most of the applications described here.
3. Methods
3.1. Staining the Sample With a Lipophilic Fluorophore
For BODIPY FL C12
, add enough stock solution to the incubation medium to give a final
concentration of 1–10 μM. Incubate with the cells or membranes for about 30 min and then,
if possible, wash in dye-free growth medium or buffer to remove unincorporated dye (2).
3.2. Immobilizing the Sample—In Vivo Measurements on Bacteria and so on
1. Grow a cell culture in liquid medium. For example, for E. coli grow a culture overnight at 37°C
in Luria–Bertani medium.
2. FRAP measurements are very much easier to perform on bacterial cells that have been elongated
by growth in the presence of cell division inhibitors. In E. coli this can be achieved by growth
for 3 h in the presence of 30 μg/mL cephalexin before the measurement (8).
3. Take the cell suspension and check the cell concentration by measuring apparent absorbance at
750 nm in a spectrophotometer. The optimal cell concentration must be determined by trial and
error. For E. coli an overnight culture diluted 10-fold is about right.
4. Stain with the lipophilic fluorophore as described in Subheading 3.1.
FRAP and Lipid Diffusion in Membranes 269
AU: Pleaseprovidemanufac-turer detailsfor EZ2000software andPCM2000microscope.
18_Conrad 2/23/07 10:26 PM Page 269
Uncorrected Proof Copy
Uncorrected Proof C
opy
Uncorrected Proof Copy
Job: Dopico Operator: IBHChapter: 18_Conrad Date: 14/02/07Template: MIMB/7x10/Temp/ Revision: Page Proof
5. Take a Petri dish with 1.5% bacto-agar made up in growth medium. Put drops of the diluted cell
culture onto the agar surface, and allow to dry down. This can be achieved in about 15 min by
placing the open Petri dish in a laminar flow hood.
6. When all the liquid has been adsorbed, use a scalpel to cut out a small block of agar with cells
adsorbed to the surface. Place in the well of the sample holder.
7. Smear a thin layer of vacuum grease around the rim of the well, and use this to stick down a
glass cover slip, so that the cover slip is gently pressing onto the agar surface.
8. Place on the microscope stage.
3.3. Immobilizing the Sample—In Vivo Measurements on Cultured Mammalian Cells and so on
1. Culture the cells in wells containing cover slips.
2. Rinse cover slip in growth medium to remove unattached cells.
3. Examine in a phase-contrast microscope to check for adhesion of cells to the cover slip.
4. Stain with the lipophilic fluorophore as described in Subheading 3.1.
5. Invert the cover slip and use vacuum grease to seal it over a microscope sample holder, with a
well containing growth medium.
6. Place on the microscope stage.
3.4. Immobilizing the Sample—In Vitro Measurements on Isolated Membrane Fragments or Vesicles
A significant problem with isolated membrane fragments is keeping the membrane frag-
ment immobile while simultaneously minimizing interactions between the membrane and a
solid support, which might perturb the mobility of membrane components. Following proce-
dure is recommended in which the membrane fragments are spread on a glass slide coated
with an artificial phosphatidyl choline bilayer (Fig. 1). The lipids within the phosphatidyl
choline bilayer are fully mobile (as judged from FRAP on lipophilic fluorophores), and thus,
are unlikely to prevent the mobility of the isolated membrane fragment components that rest
on them. Ideally, the phosphatidyl choline support should also be stained with a lipophilic flu-
orophore to allow it to be visualized separately from the biological membrane of interest.
This makes it possible to check whether the membrane fragment of interest is sitting on the
lipid support (Fig. 1). The choice of fluorophore will depend on the excitation and emission
wavelengths available in the confocal microscope.
1. Take 100 μL of phosphatidyl choline (10 mM solution in TFE). Add a lipophilic fluorophore if
desired. Spot 20 μL onto a glass slide. TFE has a very-low surface tension, which allows it to
spread efficiently on glass.
2. Evaporate the TFE and dry the lipid film under a stream of nitrogen for 1 h.
3. Warm the dried lipid film to 40°C for 1 min (the temperature must be more than the phase-tran-
sition temperature of the lipid).
4. Keeping the slide at 40°C, add 30 μL of buffer (the same buffer used to suspend the membrane
fragments). Incubate for 2 min at 40°C. Stacks of phosphatidyl choline bilayer are formed dur-
ing this time (Fig. 1).
5. Take membrane fragments in a suitable buffer, stained with the lipophilic fluorophore as described
in Subheading 3.1.
6. It may help to use anaerobic conditions. Under anaerobic conditions photobleaching is generally
impeded. This makes it easier to image the sample, although it also means that more laser power
must be used to do the bleach. Anaerobic conditions can be achieved by adding to the membrane
fragment suspension glucose (20 mM), glucose oxidase (48 U/mL), and catalase (800 U/mL).
7. Add 30 μL of the membrane suspension to the bilayer stack.
270 Mullineaux and Kirchhoff
Fig. 1.
18_Conrad 2/23/07 10:26 PM Page 270
Uncorrected Proof Copy
Uncorrected Proof C
opy
Uncorrected Proof Copy
Job: Dopico Operator: IBHChapter: 18_Conrad Date: 14/02/07Template: MIMB/7x10/Temp/ Revision: Page Proof
8. Incubate for 15–30 min.
9. Seal the sample with a cover slip.
10. Place on the microscope stage.
3.5. Performing the FRAP Measurement
1. Focus the microscope on the sample. This is usually most easily done in simple transmission or epi-
fluorescence mode. The authors’ use a ×60 oil-immersion objective lens (numerical aperture 1.4).
2. Switch to laser-scanning confocal mode and image fluorescence from the lipophilic fluorophore.
Trial-and-error must be used to establish conditions under which the fluorescence can be imaged
without significantly bleaching the fluorophore (see Notes 1 and 2). Record a series of succes-
sive images, and see whether the fluorescence intensity decreases from image to image. If it
FRAP and Lipid Diffusion in Membranes 271
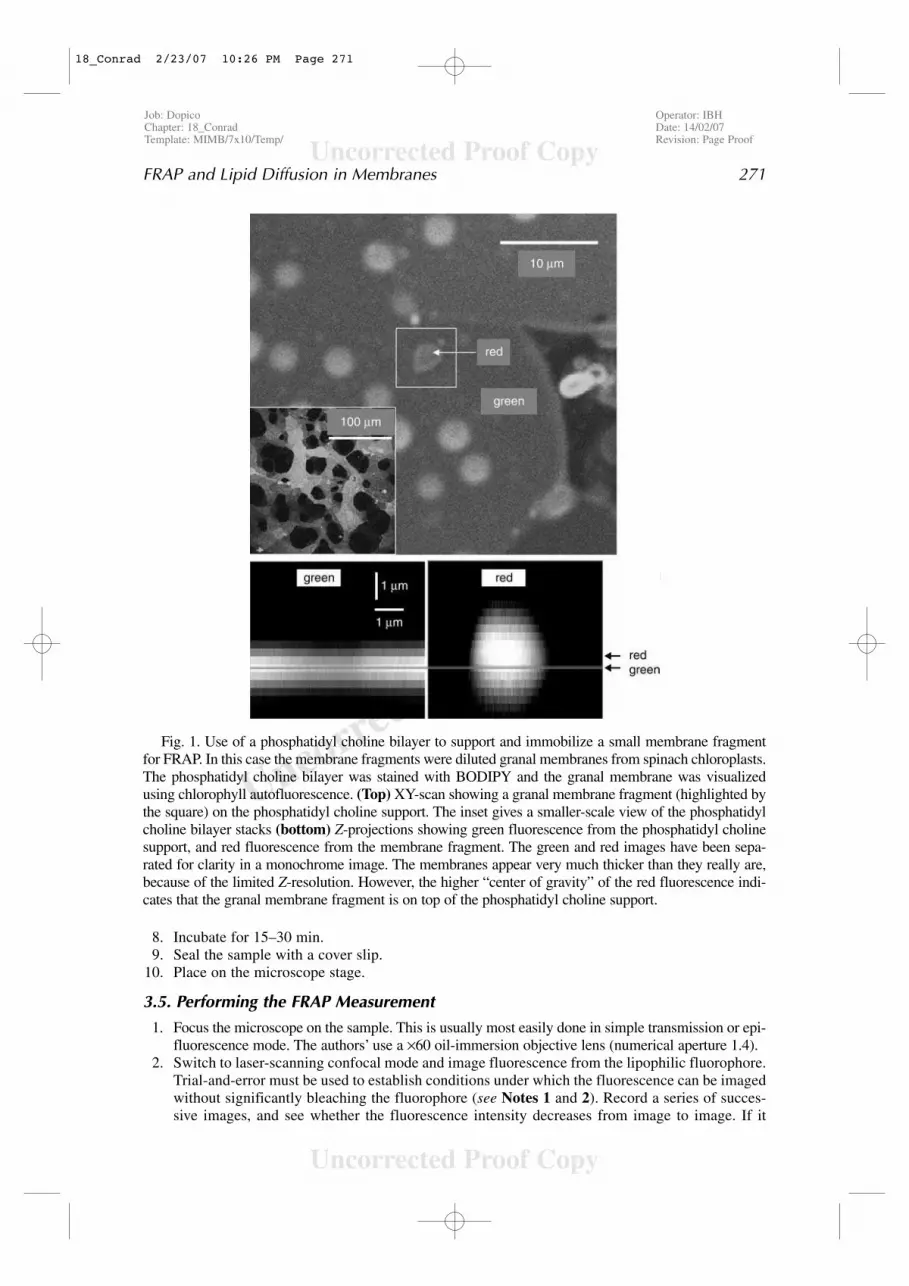
Fig. 1. Use of a phosphatidyl choline bilayer to support and immobilize a small membrane fragment
for FRAP. In this case the membrane fragments were diluted granal membranes from spinach chloroplasts.
The phosphatidyl choline bilayer was stained with BODIPY and the granal membrane was visualized
using chlorophyll autofluorescence. (Top) XY-scan showing a granal membrane fragment (highlighted by
the square) on the phosphatidyl choline support. The inset gives a smaller-scale view of the phosphatidyl
choline bilayer stacks (bottom) Z-projections showing green fluorescence from the phosphatidyl choline
support, and red fluorescence from the membrane fragment. The green and red images have been sepa-
rated for clarity in a monochrome image. The membranes appear very much thicker than they really are,
because of the limited Z-resolution. However, the higher “center of gravity” of the red fluorescence indi-
cates that the granal membrane fragment is on top of the phosphatidyl choline support.
18_Conrad 2/23/07 10:26 PM Page 271

Uncorrected Proof Copy
Uncorrected Proof C
opy
Uncorrected Proof Copy
Job: Dopico Operator: IBHChapter: 18_Conrad Date: 14/02/07Template: MIMB/7x10/Temp/ Revision: Page Proof
does, it will be necessary to decrease the laser intensity. Routinely a 100-mW argon laser with
intensity decreased by a factor of 32 with neutral density filters is used.
3. Select a suitable cell or membrane fragment of interest (see Note 3). In the case of elongated
bacterial cells (2,8–10), select a long cell aligned roughly in the Y-direction (Fig. 2). In the case
of isolated membrane fragments, select a good-sized fragment that is securely superimposed on
the phosphatidyl choline support (Fig. 1).
4. Zoom in so that the cell or membrane fragment chosen fills most of the field of view. Record a
prebleach image of the sample. Check that the sample can still be imaged without bleaching,
because scanning the laser over a smaller area increases the sample exposure.
5. Bleach fluorescence from a small area of the sample. The way the bleach is done depends on
the geometry of the sample, but when possible, the bleach should always be done away from
the edges of the sample, in the center of a homogeneous area of membrane (see Note 4).
Usually, it is much more convenient to bleach a line rather than a spot (see Note 5). To do this,
switch the confocal microscope from XY-scanning mode to X-scanning mode, so that the line
of the X-scan passes through the center of the sample. If possible, start the X-scan increasing
the laser power at the same time. Generally, the laser power by a factor of 32 is increased by
briefly removing neutral density filters. After about a second, the fluorescence signal should be
significantly decreased (see Note 6). It is not necessary or desirable to bleach away all the
fluorescence in the center of the bleached zone. Generally, something between 50 and 90%
bleaching is ideal.
6. Quickly replace the neutral density filters, switch back to XY scanning mode, and record a series
of images at set time intervals. The best time intervals depend on the lipid-diffusion rate and the
size of the sample. In general, it is sufficient to record a series of about 10 images at intervals
of 1–3 s. One longer time-point is useful to check whether recovery is complete (recovery will
be incomplete if there is an immobile population of the fluorophore). In a successful FRAP
measurement the initial bleach will appear as a clearly defined dark zone in the fluorescence
image (see Note 7). With time, the dark zone will spread and fill in, as the bleached fluorophore
diffuses away and unbleached fluorophore diffuses into the bleached area (see Note 8).
272 Mullineaux and Kirchhoff
Fig. 2. FRAP image sequence showing diffusion of BODIPY in the membranes of an elongated
bacterial cell (in this case the cyanobacterium Synechococcus 7942). The arrow indicates where a line
was bleached across the cell. (Data were reproduced with permission from ref. 2.)
Fig. 2.
18_Conrad 2/23/07 10:26 PM Page 272

Uncorrected Proof Copy
Uncorrected Proof C
opy
Uncorrected Proof Copy
Job: Dopico Operator: IBHChapter: 18_Conrad Date: 14/02/07Template: MIMB/7x10/Temp/ Revision: Page Proof
3.6. Data Analysis
A prerequisite for quantitative data analysis is that the topography of the membrane must
be simple and predictable. Examples include elongated bacterial cells, wherein the plasma
membrane can be approximated as a long cylinder (2,8,10); many cultured mammalian cells,
wherein the plasma membrane can be approximated as an extended flat sheet (7); and iso-
lated flat membrane fragments. Quantitative data analysis is invariably based on the assump-
tion that the membrane environment is uniform over the measured area. Wherein the
membrane geometry is simple and the sample size is large relative to the bleach, it is usually
straightforward to use an analytical solution relating the evolution in the bleaching profile to
the diffusion coefficient (see Note 9). The following procedure relates to the estimation of the
diffusion coefficient from an elongated sample, such as the plasma membrane of an elongated
bacterial cell. In this case, a line is bleached across the cell (Fig. 2) and diffusion is observed
in one dimension (1D) along the long axis of the cell (10) (see Note 10).
1. Import the images into Image ProPlus or similar software.
2. Use the software to extract a 1D fluorescence profile along the long axis of the cell, summing
the fluorescence values across the width of the cell. This is done by setting a sampling line width
greater than the width of the cell, then drawing the line down the long axis of the cell, and
extracting the data (Fig. 3).
3. Repeat for each time-point in the sequence, including the prebleach image.
4. Import the fluorescence profiles into SigmaPlot (Systat Software Inc., Richmond, CA) or simi-
lar software. Subtract each postbleach profile from the prebleach profile to generate a series of
difference profiles, which should be approximately Gaussian in shape.
5. Use SigmaPlot to fit the profiles to Gaussian curves, noting the parameters C (the peak height
of the Gaussian curve) and R (the 1/e2 radius of the Gaussian curve) (Fig. 3). If the changes
observed are because of diffusion, then C should decrease with time and R should increase with
time, but the area under the Gaussian curve should remain constant.
6. In this 1D case, C is related to the diffusion coefficient D as follows: C = C0R
0 (R
02 + 8 Dt)−0.5, where
t is time and C0
and R0
are the values for C and R extracted from the first postbleach image (10).
FRAP and Lipid Diffusion in Membranes 273
Fig. 3. 1D fluorescence profiles extracted from images of an elongated bacterial cell before and after
bleaching a line. (A) Prebleach profile (gray line) and postbleach profile (black line). (B) Difference
profile obtained by subtracting the postbleach profile from the prebleach profile. The fitted Gaussian
curve and the parameters C (depth of the bleach) and R (1/e2 radius of the bleach), which are required
for calculation of the diffusion coefficient, are also shown. (Reproduced with permission from ref. 12.)
Fig. 3.
AU: Pleaseprovidemanufac-turerdetails forImageProPlus.
18_Conrad 2/23/07 10:26 PM Page 273

Uncorrected Proof Copy
Uncorrected Proof C
opy
Uncorrected Proof Copy
Job: Dopico Operator: IBHChapter: 18_Conrad Date: 14/02/07Template: MIMB/7x10/Temp/ Revision: Page Proof
D can be obtained by plotting 1/C2 vs time. The plot should give a straight line. The gradient
can be obtained by linear regression and is equal to 8D/C0
2R0
2 (see Note 11). C0
and R0
are
known, so D can be calculated (see Note 12). If t is in seconds and R0
is in micrometers, then
D is in μm2/s.
4. Notes
1. Photobleaching is increased by high laser power, low scanning speeds, and a small scanning area
(field of view). The use of the highest possible scanning speeds is recommended, because
this also increases the time-resolution of the measurement. In general, high Z-resolution is not
required for FRAP measurements, so it is best to use a larger confocal pinhole, which gives a
higher signal-to-noise ratio. This in turn allows images to be obtained at lower laser intensity,
which minimizes the problem of photobleaching during imaging.
2. The use of anaerobic conditions, as described in Subheading 3.4., generally minimizes the prob-
lem of photobleaching during imaging. By the same token, although anaerobiosis makes it
harder to perform the FRAP bleach.
3. The larger the sample, the easier the measurement will be. Data analysis is easier and more
robust if you have a tightly localized bleach in the middle of a large sample (it gets difficult when
the bleach removes a large proportion of the total fluorescence). A larger sample makes it much
easier to follow rapid diffusion. With a small sample and rapid diffusion, the bleach might re-
equilibrate over the whole sample before you have time to record any images (see also Note 7).
4. It is not always possible to the bleach in the center of the sample. When a small sample is used,
it may be necessary to bleach at one edge to prevent the whole sample from being bleached
away. This is feasible, but it makes the data analysis more difficult (11).
5. Some confocal microscopes are not well equipped to bleach spots, because when the laser spot
is stationary it is automatically diverted away from the sample. In any case, a line bleach makes
it easier to hit the sample.
6. The filters are lifted by hand. This can be done very quickly with practice. Shutters would allow
shorter exposure times, but in the authors’ experience very short exposure times do not give suf-
ficient bleaching, in any case. With manual control you can watch the fluorescence signal
decreasing and drop the filters when the bleach is deep enough. It is not necessary to time the
bleach accurately, as long as the postbleach image sequence is timed accurately. The first post-
bleach image provides the first time-point for the data analysis.
7. The minimum diameter of the bleach could theoretically be about half the wavelength of the
laser light. In practice, the width of the bleach is generally increased by light scattering by the
sample and diffusion occurring during the bleach and before the first image is recorded. A com-
mon problem with small samples and rapid diffusion is that the bleach spreads over the whole
sample before the first image can be recorded. Then the first postbleach image shows decreased
fluorescence overall, but a similar fluorescence distribution to the prebleach image. This prob-
lem can be tackled in various ways:
a. Do the bleach more quickly. This may require more laser power.
b. Record the images quicker. This can often be achieved by reducing the pixel resolution of
the images.
c. Try to find a sample with a larger membrane area.
8. It is best to use a simple control to check that fluorescence recovery is because of diffusion,
rather than reversible fluorescence quenching of the fluorophore. Try bleaching out an entire
small cell or membrane fragment, and check that fluorescence does not recover.
9. Analytical solutions depend on simplifying assumptions, and the easiest assumption to make is that
the membrane area is large compared with the bleach. If it is not, then you have to factor in the
exact dimensions of the membrane, and the width, depth, and position of the bleach. Under these
conditions, analytical solutions often are not worthwhile. As a more practical approach, measuring
the fluorescence profile after the bleach is recommended; then, use an iterative computer routine
274 Mullineaux and Kirchhoff
18_Conrad 2/23/07 10:26 PM Page 274
Uncorrected Proof Copy
Uncorrected Proof C
opy
Uncorrected Proof Copy
Job: Dopico Operator: IBHChapter: 18_Conrad Date: 14/02/07Template: MIMB/7x10/Temp/ Revision: Page Proof
to predict how it will evolve with time, assuming simple random diffusion. Comparison of the sim-
ulation with the experimental data allows estimation of the diffusion coefficient.
10. In the case of a spot bleach in the center of a flat membrane, diffusion is observed in 2D. Data
extraction and analysis are somewhat more complicated than in the 1D case described. See ref. 7
for an example.
11. Take care to weigh the linear regression accurately (weigh each point according to the recipro-
cal of the estimated variance). In a plot of 1/C2 vs time the variance increases sharply as C
decreases.
12. Individual measurements of D can be very accurate if obtained with care. But real biological
samples often show variations: every cell or membrane fragment is different. Always do enough
replicates to check that the result is representative.
Acknowledgments
Dr. Mark Tobin and Dr. Mary Sarcina contributed to the development of the methods
described. Work in CWM’s laboratory is supported by the Biotechnology and Biological
Sciences Research Council and the Wellcome Trust. HK is currently supported by a research
fellowship from the Deutsche Forschungsgemeinschaft.
References
1. Fulbright, R. M., Axelrod, D., Dunham, W. R., and Marcelo, C. L. (1997) Fatty acid alteration and
the lateral diffusion of lipids in the plasma membrane of keratinocytes. Exp. Cell Res. 233, 128–134.
2. Sarcina, M., Murata, N., Tobin, M. J., and Mullineaux, C. W. (2003) Lipid diffusion in the thy-
lakoid membranes of the cyanobacterium Synechococcus sp.: effect of fatty acid desaturation.
FEBS Lett. 533, 295–298.
3. Lee, G. M., Ishihara, A., and Jacobson, K. A. (1991) Direct observation of Brownian motion of
lipids in a membrane. Proc. Natl. Acad. Sci. USA 88, 6274–6278.
4. Fujiwara, T., Ritchie, K., Murakoshi, H., Jacobson, K., and Kusumi, A. (2002) Phospholipids
undergo hop diffusion in compartmentalized cell membrane. J. Cell Biol. 157, 1071–1081.
5. Douglass, A. D. and Vale, R. D. (2005) Single-molecule microscopy reveals plasma membrane
microdomains created by protein-protein networks that exclude or trap signaling molecules in T
cells. Cell 121, 937–950.
6. Blonk, J. C. G., van Aalst, D. H., and Birmingham, J. J. (1993) Fluorescence photobleaching
recovery in the confocal scanning light microscope. J. Microsc. 169, 363–374.
7. Kubitscheck, U., Wedekind, P., and Peters, R. (1994) Lateral diffusion measurements at
high spatial resolution by scanning microphotolysis in a confocal microscope. Biophys. J. 67,
948–956.
8. Ray, N., Nenninger, A., Mullineaux, C. W., and Robinson, C. (2005) Location and mobility of
twin-arginine translocase subunits in the Escherichia coli plasma membrane. J. Biol. Chem. 280,
17,961–17,968.
9. Elowitz, M. B., Surette, M. G., Wolf, P. -E., Stock, J. B., and Leibler, S. (1999) Protein mobility
in the cytoplasm of Escherichia coli. J. Bacteriol. 181, 197–203.
10. Mullineaux, C. W., Tobin, M. J., and Jones, G. R. (1997) Mobility of photosynthetic complexes
in thylakoid membranes. Nature 390, 421–424.
11. Cowan, A. E., Koppel, D. E., Setlow, B., and Setlow, P. (2003) A soluble protein is immobile in
dormant spores of Bacillus subtilis but is mobile in germinated spores: implications for spore
dormancy. Proc. Natl. Acad. Sci. USA 100, 4209–4214.
12. Mullineaux, C. W. (2004) FRAP analysis of photosynthetic membranes. J. Exp. Bot. 55, 1207–1211.
FRAP and Lipid Diffusion in Membranes 275
AU: Pleasedefine CWMand HK.
18_Conrad 2/23/07 10:26 PM Page 275

Uncorrected Proof Copy
Uncorrected Proof C
opy
Uncorrected Proof Copy
Job: Dopico Operator: IBHChapter: 18_Conrad Date: 14/02/07Template: MIMB/7x10/Temp/ Revision: Page Proof
18_Conrad 2/23/07 10:26 PM Page 276
Copyright © 2022 FDOKUMEN