Studies in the Characterisation of Magnetic Force Microscope ...

JOURNAL OF COLLOID AND INTERFACE SCIENCE 180, 350–359 (1996)ARTICLE NO. 0313
Atomic Force Microscope Studies of Membranes: Surface PoreStructures of Diaflo Ultrafiltration Membranes
W. RICHARD BOWEN,1 NIDAL HILAL, ROBERT W. LOVITT, AND PETER M. WILLIAMS
Biochemical Engineering Group, Department of Chemical Engineering, University of Wales, Swansea, SA2 8PP, United Kingdom
Received June 6, 1995; accepted December 20, 1995
However, electron microscopy has a number of disadvan-Noncontact atomic force microscopy (AFM) has been used to tages in the examination of porous polymeric structures.
investigate the surface pore structure of eight Diaflo ultrafiltration These include the fact that it is a high vacuum techniquemembranes covering a range of nominal molecular weight cutoff (which results in extensive drying of the sample) , the re-(MWCO) from 3000 to 300,000 and manufactured from three
quirement for extensive preparation such as metal coatingdifferent polymer types. Excellent high resolution images wereor formation of a replica (both of which can produce artifactsobtained. Analysis of the pore images gave quantitative informa-with finely porous materials) , and the possibilty of damagetion on the surface pore structure, in particular the pore size distri-by the electron beam. It is for reasons such as this that thebution and surface roughness. Such data is compared to that ob-use of atomic force microscopy (AFM) is so tantalizing totained by other techniques. Noncontact AFM is a facile and infor-
mative means of studying the surface structure of porous materials membrane technologists. Atomic force microscopy (3) givessuch as synthetic membranes. q 1996 Academic Press, Inc. topographic images by scanning a sharp tip over a surface
Key Words: atomic force microscopy; ultrafiltration; pore size (4) and has been used to produce atomic resolution imagesdistribution. of both conductors and nonconductors (5) including biologi-
cal materials (6) . AFM can image nonconducting surfaceswith nanometer scale resolution in air and even under liquids.
1. INTRODUCTION Consequently, the samples need not be exposed to vacuumand preparation techniques like evaporating a thin metalThe use of membranes to separate components of a pro-coating or taking a replica are unnecessary. Even soft organiccess flow is arguably one of the most important recent devel-surfaces can be successfully imaged with AFM because theopments in chemical engineering. Membrane processes areuse of microfabricated cantilevers (5) allows operation withadvanced filtration processes which utilize the separationtotal forces between 1007 and 1008 N in contact mode andproperties of finely porous polymeric or inorganic films. Ofon the order of 10012 N in noncontact mode.the wide range of membrane processes (1) , the pressure
Atomic force microscopy has been used to investigatedriven process known as ultrafiltration is one of the mostmicrofiltration and ultrafiltration membrane surface structurewidely used. Ultrafiltration is usually defined as being a(7–15). AFM has also been used to elucidate the mecha-process separating materials in the size range 0.1 mm–5 nm.nisms giving rise to inefficiencies (fouling) in membraneThe effectiveness of ultrafiltration as a separation processprocessing (16). However, with one exception (14), mem-will clearly depend on the pore size distribution of the mem-branes have been studied in ‘‘contact mode.’’ In this mode,brane being used. Surface roughness is also a significantalso known as repulsive mode, the tip is very close (inproperty as it has a strong influence on the deposition ofcontact) to the surface being imaged and is responding toprocess stream components on the top surface of the mem-very short range repulsive interactions with the sample. Inbrane. Hence, in developing membrane processes it is im-a second and more recently developed mode of operation,portant to have knowledge of surface pore structures.‘‘noncontact mode,’’ the tip instead responds to attractiveThe techniques which have been most widely used for thevan der Waals interactions with the sample. These are longer
study of membrane morphology and pore characteristics arerange, so the tip is generally at a distance of 5–10 nm away
electron microscopy, mercury intrusion, extended bubblefrom the surface while imaging. This mode of operation is
point, gas adsorption–desorption, thermoporometry, solventespecially suitable for materials which are soft or liable to
permeability, and solute challenge (2). Of these, only elec-mechanical damage as the forces used for imaging are also
tron microscopy can provide direct and detailed informationlower. Polymeric membranes are one such class of material.
on the size distribution, shape, and topography of the pores.Further, it has been reported (14) that use of noncontactmode can in some cases allow imaging of membrane sur-
1 To whom correspondence should be addressed. faces which cannot be imaged in contact mode. However,
3500021-9797/96 $18.00Copyright q 1996 by Academic Press, Inc.All rights of reproduction in any form reserved.
AID JCIS 4187 / 6g10$$$421 05-17-96 10:28:29 coidal AP: Colloid

351AFM STUDIES OF ULTRAFILTRATION MEMBRANES
FIG. 1. AFM image of YM3 Diaflo ultrafiltration membrane (Reproduced by permission of University of Wales Swansea).
FIG. 2. AFM image of YM10 Diaflo ultrafiltration membrane (Reproduced by permission of University of Wales Swansea).
AID JCIS 4187 / 6g10$$4187 05-17-96 10:28:29 coidal AP: Colloid

352 BOWEN ET AL.
FIG. 3. AFM image of YM30 Diaflo ultrafiltration membrane (Reproduced by permission of University of Wales Swansea).
FIG. 4. AFM image of YM100 Diaflo ultrafiltration membrane (Reproduced by permission of University of Wales Swansea).
AID JCIS 4187 / 6g10$$4187 05-17-96 10:28:29 coidal AP: Colloid

353AFM STUDIES OF ULTRAFILTRATION MEMBRANES
FIG. 5. Pore size distributions of YM Diaflo ultrafiltration membranes (a) YM3, (b) YM10, (c) YM30, and (d) YM100.
the systematic use of noncontact AFM for quantifying the of curvature 10 nm. Noncontact AFM measures long rangeattractive van der Waals forces between the tip and thesurface pore structure of membranes has not been reportedsample—the tip is held about 5 to 10 nm above the samplepreviously.surface during the scan. As these forces are much weakerThe present paper reports a study of the use of noncontactthan the repulsive forces measured in contact mode, aAFM to investigate the surface pore structure of Diaflo ultra-highly sensitive modulation technique is used to detectfiltration membranes covering a wide range of molecularthe small force gradients. A stiff cantilever is vibratedweight cutoff (MWCO), and hence likely pore size, andnear its resonance frequency ( typically 100–400 kHz)manufactured from three different polymer materials. Quan-with an amplitude of a few nanometers, and changes intitative measurements of pore size, pore size distribution,the cantilever resonance are detected as the tip is scannedand surface roughness have been obtained. The results showabove the sample surface. While scanning the sharp tipthat noncontact AFM is an excellent means of obtainingabove the surface, the vertical motion of the tip due tosuch information for ultrafiltration membranes.interatomic forces, is detected by sensing, with a two seg-ment photodiode, the deflection of a laser beam reflected2. MATERIALS AND METHODSoff the back of the cantilever. In operation, the sample is
The AFM used in the present study was an Autoprobe moved under the tip while a z-feedback loop operates to(CP-100 ) , a commercial device from Park Scientific In- maintain a constant force on the cantilever tip (a constantstruments (USA) . High magnification images of mem- vibration amplitude) by adjusting the tip-to-sample spac-brane surfaces can be obtained with the use of microfabri- ing. The z voltage applied to the (piezoelectric ) scannercated cantilevers (5 ) . In the present work, Ultralevers to maintain constant attractive force is used to map out(Park Scientific Instruments ) were used. These are silicon the surface topography. A scan rate of 1 Hz was used with
256 1 256 pixel resolution. No distortion of the imagescantilevers with a high aspect ratio tip of typical radius
AID JCIS 4187 / 6g10$$$421 05-17-96 10:28:29 coidal AP: Colloid
354 BOWEN ET AL.
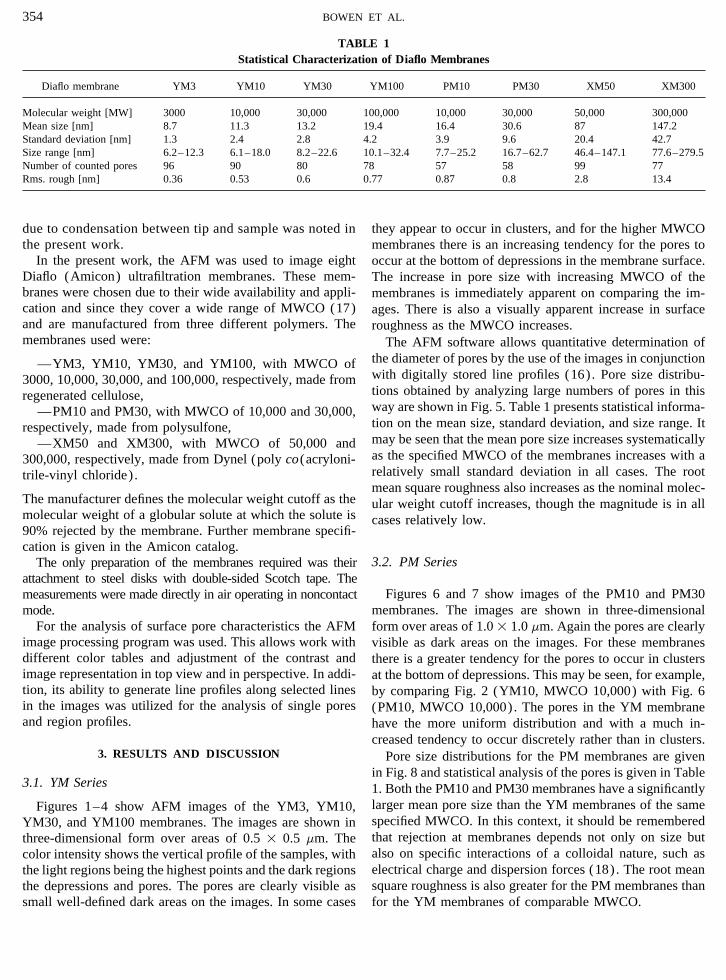
TABLE 1Statistical Characterization of Diaflo Membranes
Diaflo membrane YM3 YM10 YM30 YM100 PM10 PM30 XM50 XM300
Molecular weight [MW] 3000 10,000 30,000 100,000 10,000 30,000 50,000 300,000Mean size [nm] 8.7 11.3 13.2 19.4 16.4 30.6 87 147.2Standard deviation [nm] 1.3 2.4 2.8 4.2 3.9 9.6 20.4 42.7Size range [nm] 6.2–12.3 6.1–18.0 8.2–22.6 10.1–32.4 7.7–25.2 16.7–62.7 46.4–147.1 77.6–279.5Number of counted pores 96 90 80 78 57 58 99 77Rms. rough [nm] 0.36 0.53 0.6 0.77 0.87 0.8 2.8 13.4
due to condensation between tip and sample was noted in they appear to occur in clusters, and for the higher MWCOthe present work. membranes there is an increasing tendency for the pores to
In the present work, the AFM was used to image eight occur at the bottom of depressions in the membrane surface.Diaflo (Amicon) ultrafiltration membranes. These mem- The increase in pore size with increasing MWCO of thebranes were chosen due to their wide availability and appli- membranes is immediately apparent on comparing the im-cation and since they cover a wide range of MWCO (17) ages. There is also a visually apparent increase in surfaceand are manufactured from three different polymers. The roughness as the MWCO increases.membranes used were: The AFM software allows quantitative determination of
the diameter of pores by the use of the images in conjunction—YM3, YM10, YM30, and YM100, with MWCO ofwith digitally stored line profiles (16). Pore size distribu-3000, 10,000, 30,000, and 100,000, respectively, made fromtions obtained by analyzing large numbers of pores in thisregenerated cellulose,way are shown in Fig. 5. Table 1 presents statistical informa-—PM10 and PM30, with MWCO of 10,000 and 30,000,tion on the mean size, standard deviation, and size range. Itrespectively, made from polysulfone,may be seen that the mean pore size increases systematically—XM50 and XM300, with MWCO of 50,000 andas the specified MWCO of the membranes increases with a300,000, respectively, made from Dynel (poly co(acryloni-relatively small standard deviation in all cases. The roottrile-vinyl chloride) .mean square roughness also increases as the nominal molec-
The manufacturer defines the molecular weight cutoff as the ular weight cutoff increases, though the magnitude is in allmolecular weight of a globular solute at which the solute is cases relatively low.90% rejected by the membrane. Further membrane specifi-cation is given in the Amicon catalog.
3.2. PM SeriesThe only preparation of the membranes required was theirattachment to steel disks with double-sided Scotch tape. The
Figures 6 and 7 show images of the PM10 and PM30measurements were made directly in air operating in noncontactmembranes. The images are shown in three-dimensionalmode.
For the analysis of surface pore characteristics the AFM form over areas of 1.0 1 1.0 mm. Again the pores are clearlyimage processing program was used. This allows work with visible as dark areas on the images. For these membranesdifferent color tables and adjustment of the contrast and there is a greater tendency for the pores to occur in clustersimage representation in top view and in perspective. In addi- at the bottom of depressions. This may be seen, for example,tion, its ability to generate line profiles along selected lines by comparing Fig. 2 (YM10, MWCO 10,000) with Fig. 6in the images was utilized for the analysis of single pores (PM10, MWCO 10,000). The pores in the YM membraneand region profiles. have the more uniform distribution and with a much in-
creased tendency to occur discretely rather than in clusters.3. RESULTS AND DISCUSSION Pore size distributions for the PM membranes are given
in Fig. 8 and statistical analysis of the pores is given in Table3.1. YM Series 1. Both the PM10 and PM30 membranes have a significantly
larger mean pore size than the YM membranes of the sameFigures 1–4 show AFM images of the YM3, YM10,specified MWCO. In this context, it should be rememberedYM30, and YM100 membranes. The images are shown inthat rejection at membranes depends not only on size butthree-dimensional form over areas of 0.5 1 0.5 mm. Thealso on specific interactions of a colloidal nature, such ascolor intensity shows the vertical profile of the samples, withelectrical charge and dispersion forces (18). The root meanthe light regions being the highest points and the dark regionssquare roughness is also greater for the PM membranes thanthe depressions and pores. The pores are clearly visible as
small well-defined dark areas on the images. In some cases for the YM membranes of comparable MWCO.
AID JCIS 4187 / 6g10$$$421 05-17-96 10:28:29 coidal AP: Colloid

355AFM STUDIES OF ULTRAFILTRATION MEMBRANES
FIG. 6. AFM image of PM10 Diaflo ultrafiltration membrane (Reproduced by permission of University of Wales Swansea).
FIG. 7. AFM image of PM30 Diaflo ultrafiltration membrane (Reproduced by permission of University of Wales Swansea).
AID JCIS 4187 / 6g10$$4187 05-17-96 10:28:29 coidal AP: Colloid

356 BOWEN ET AL.
distributions determined by contact AFM. The most system-atic previous investigation (10) included data for three mem-branes with specified MWCO 10,000, one with MWCO40,000 (polyethersulfone) and three of MWCO 100,000(one polysulfone and two polyethersulfone). These mem-branes were from different manufacturers to those of thepresent work. For the 10,000 MWCO membranes, meanpore sizes of 14.1, 12.6, and 18.8 nm were reported. Compar-ison with the data for YM10 and PM10 in Table 1 showsthat such results are consistent with the present data. For the40,000 MWCO membrane, a mean pore size of 11.6 nmwas reported which is comparable to the present results forYM30 but smaller than the present results for PM30. Forthe 100,000 MWCO membranes, mean pore sizes of 22.1,25.2, and 26.2 nm were reported, which is comparable tobut greater than the value obtained for YM100 in the presentwork. The width of pore size ranges reported previously arecomparable to those in Table 1.
Other published pore size data from AFM has been sparse,though these include the ranges 15–25 nm and 50–60 nmfor polyethersulfone membranes of MWCO 30,000 and100,000, respectively (11), 7–9 nm for a 10,000 MWCOpolyethersulfone membrane (12), and 12–20 nm for a30,000 MWCO polyacrylonitrile membrane (14). Compari-son with the data of Table 1 again shows that previous AFMstudies are broadly consistent with the present work.
The second important type of comparison which can becarried out is with the results from electron microscopy. Asmentioned in the Introduction, electron microscopy data formembranes can require careful interpretation due to the ex-tensive sample preparation required. One of the most de-
FIG. 8. Pore size distributions of PM Diaflo ultrafiltration membranes tailed and careful studies has used a high resolution field(a) PM10 and (b) PM30. emission scanning electron microscope (FESEM) (19),
which uses a very low accelerating voltage (2–5 kV) thusminimizing damage to the membranes. Some of the YM30,3.3. XM SeriesYM100, PM30, and XM300 membranes used in the present
Figures 9 and 10 show images of the XM50 and XM300 work were also included in the present study. A comparisonmembranes. The images are shown in three-dimensional was also made with data from transmission electron micros-form over areas of 2.0 1 2.0 mm. The range of specified copy (TEM).MWCO is greater for these membranes than for the other Even operating the FESEM with the lowest energy elec-series, and the comparatively large size of the pores is clear. tron beam (2 kV), it was found that the YM membranesThis is confirmed by the pore size distributions given in Fig. were damaged, so no quantitative data could be obtained for11 and the statistical information of Table 1. Indeed, the these membranes (19). Hence, no direct comparison withmean pore size of 0.147 mm determined for XM300 would the data of Table 1 is possible, though the fact that the YMlead to this membrane being classified as a microfiltration membranes could be imaged by noncontact AFM shows themembrane rather than an ultrafiltration membrane. The table utility of the technique. For the PM30 membrane, FESEMshows that the root mean square roughness of these mem- gave a mean pore size of 4.0 nm and a range of 1.5–9.8branes is substantially greater than for either the YM or PM nm, while for the XM300 membrane a mean pore size ofseries. 8.6 nm was found with a range of 2.1–22.3 nm (19). These
values are significantly smaller than those obtained by AFM.3.4. Comparison with Other Data
Reference (19) also tabulates TEM data from those authorsand other workers. There is wide variation in such data.In previous investigations of membranes using AFM,
there have been a few systematic measurements of pore size Hence, the TEM data tabulated for PM30 gives mean poresizes of 5.5 and 11.8 nm with respective ranges 1.1–10.1distribution, though none using noncontact AFM. So the first
point of comparison of the present data is with pore size nm and 6–29 nm. For XM300 means of 7.7, 20.0, or 24.5
AID JCIS 4187 / 6g10$$$421 05-17-96 10:28:29 coidal AP: Colloid

357AFM STUDIES OF ULTRAFILTRATION MEMBRANES
FIG. 9. AFM image of XM50 Diaflo ultrafiltration membrane (Reproduced by permission of University of Wales Swansea).
FIG. 10. AFM image of XM300 Diaflo ultrafiltration membrane (Reproduced by permission of University of Wales Swansea).
AID JCIS 4187 / 6g10$$4187 05-17-96 10:28:29 coidal AP: Colloid

358 BOWEN ET AL.
tion of pore sizes as the measured pore dimensions are aresult of the convolution between tip and pore shape, whichcan become complex if the tip and surface pore sizes arecomparable. However, this effect is expected to be muchless significant for noncontact AFM than contact AFM asin the former case the tip is held at a significant distancefrom the surface and responding to a variation in attractiveforces on scanning. (A detailed theoretical analysis is inprogress.) Nevertheless, there is still a possibilty, especiallyfor rough surfaces or membranes where the pores lie clus-tered in depressions, that for funnel shaped pores AFM ismeasuring a surface pore dimension at a lesser depth in thesurface than the (underestimated) pore dimension deter-mined by EM.
4. CONCLUSIONS
Noncontact atomic force microscopy is an effective meansof examining the surface structure and pore morphology ofporous structures such as ultrafiltration membranes. Samplescan be examined by AFM without preparative proceduresthat might alter the membrane structure. The surface topog-raphy of membranes can then be explored without distortionwhen the membrane is in air. Image analysis can providedetailed information on the surface pore structure and allowsquantitative determination of the pore size distribution.Hence, noncontact AFM can be used to determine surfacepore sizes of membranes made from sensitive materials suchas regenerated cellulose. Such materials may not be imageddirectly by electron microscopy without damage caused byeven very low energy electron beams. Pore size distributions
FIG. 11. Pore size distributions of XM Diaflo ultrafiltration membranesobtained by noncontact AFM are comparable to those ob-(a) XM50 and (b) XM300.tained by contact AFM, but differ significantly from thoseobtained by electron microscopy. Further work is neededto unambiguously resolve these differences. However, thenm are reported with respective ranges 1.9–17.5 nm, 8–47technical benefits of AFM, combined with the ease of usenm, and 13.0–37.5 nm. Despite the spread of these means,of the technique, suggest that it should be considered as onethey are still smaller than those determined by noncontactof the methods of first choice for the determination of theAFM in the present work, though the AFM data agrees bettersurface pore characteristics of ultrafiltration membranes. Inwith TEM data than with FESEM data.particular, imaging in liquids opens the exciting prospect ofThe noncontact AFM data in the present work is internallyvisualization of such membrane surfaces under their condi-consistent and is in good agreement with previous contacttions of use.AFM studies of membranes. The discrepancies between pore
sizes determined by AFM and EM are not easily resolved.ACKNOWLEDGMENTSSEM requires deposition of a conducting coating on the
sample and TEM requires the preparation of a replica. TheWe thank the UK Engineering and Physical Sciences Research Council
lengthy preparation techniques used in both cases can pro- and the UK Biotechnology and Biological Sciences Research Council forduce artifacts. Both coatings and replica formation are likely funding this work.to lead to underestimation of pore sizes. This is confirmedby the finding that hydraulic permeabilities calculated from REFERENCESEM pore dimensions are found to be less than those obtained
1. Bowen, W. R., in ‘‘Coulson and Richardson’s Chemical Engineering,’’by experiment (19). Structural change may also arise dueVol. 2, 4th ed., pp. 868–901. Pergamon, Oxford, 1993.to damage by the electron beam or the requirement to operate
2. Mulder, M., ‘‘Basic Principles of Membrane Technology.’’ Kluwerin high vacuum. Noncontact AFM has the tremendous ad- Academic, Dordrecht, 1991.vantage of operation in air with no sample preparation. Gen- 3. Binnig, G., Quate, C. F., and Gerber, Ch., Phys. Rev. Lett. 56, 930
(1986).erally, care has to be taken in the use of AFM for determina-
AID JCIS 4187 / 6g10$$$421 05-17-96 10:28:29 coidal AP: Colloid
359AFM STUDIES OF ULTRAFILTRATION MEMBRANES
4. Hansma, P. K., Elings, V. B., Marti, O., and Bracker, C. E., Science 12. Fritzsche, A. K., Arevalo, A. R., Moore, M. D., Weber, C. J., Elings,V. B., Kjoller, K., and Wu, C. M., J. Appl. Polym. Sci. 46, 167 (1992).242, 209 (1988).
13. Fritzsche, A. K., Arevalo, A. R., and Moore, M. D., in ‘‘Recent Progres5. Albrecht, T. R., and Quate, C. F., J. Vac. Sci. Technol. A 6, 271 (1988).en Genie des Procedes- Membrane preparation fouling- Emerging pro-6. Morris, V. J., Prog. Biophys. Molec. Biol. 61, 131 (1994).cesses’’ (P. Aimar and P. Aptel, Eds.) , Vol. 6, pp. 59–64. CPIC,7. Chahboun, A., Coratger, R., Ajustron, F., and Beauvillian, J., Ultrami-Nancy, 1992.croscopy 41, 235 (1992).
14. Fritzsche, A. K., Arevalo, A. R., Moore, M. D., and O’Hara, C., J.8. Bessieres, A., Meireles, M., Aimar, P., Sanchez, V., Coratger, R., andMembrane Sci. 81, 109 (1993).
Beauvillain, J., in ‘‘Recent Progres en Genie des Procedes- Membrane15. Bottino, A., Capannelli, G., Grosso, A., Monticelli, O., Cavalleri, O.,
preparation Fouling- Emerging processes’’ (P. Aimar and P. Aptel,Rolandi, R., and Soria, R., J. Membrane Sci. 95, 289 (1994).
Eds.) , Vol. 6, pp. 111–116. CPIC, Nancy, 1992. 16. Bowen, W. R., and Hall, N. J., Biotechnol. Bioeng. 46, 28 (1995).9. Miwa, T., Yamaki, M., Yoshimina, H., Ebina, S., and Nagayama, K., 17. Membrane filtration/chromatography catalog, Amicon Inc., USA,
Jpn. J. Appl. Phys. 31, L1495 (1992). 1993.10. Dietz, P., Hansma, P. K., Inacker, O., Lehmann, H. D., and Herrmann, 18. Bowen, W. R., in ‘‘Membranes in Bioprocessing: Theory and Applica-
K. H., J. Membrane Sci. 65, 101 (1992). tions’’ (J. A. Howell, V. Sanchez, and R. W. Field, Eds.) . Blackie11. Fritzsche, A. K., Arevalo, A. R., Connolly, A. F., Moore, M. D., Elings, Academic and Professional, London, 1993.
V. B., Kjoller, K., and Wu, C. M., J. Appl. Polym. Sci. 45, 1945 19. Kim, K. J., Fane, A. G., Fell, C. J. D., Suzuki, T., and Dickinson,M. R., J. Membr. Sci. 54, 89 (1990).(1992).
AID JCIS 4187 / 6g10$$$421 05-17-96 10:28:29 coidal AP: Colloid
Copyright © 2022 FDOKUMEN