Atomic force microscope studies of membranes: force measurement and imaging in electrolyte solutions
13
journal of MEMBRANE SCIENCE ELSEVIER Journal of Membrane Science 126 (1997) 77-89 I Atomic force microscope studies of membranes: force measureiment and imaging in electrolyte solutions W. Richard Bowen*, Nidal Hilal, Robert W. Lovitt, Adel O. Sharif, Peter M. Williams Bioehemical Engineering Group, Department of Chemical Engineering, Univer.sity of Wales, Swansea SA2 ,~PP, UK Received 30 May 1996; revised 16 September 1996; accepted 17 September 1996 Abstract An atomic force microscope has been used to study the electrical double layer interactions between a silicon tip (with an oxidised surface) and two polymeric membranes, one microfiltration (nominally 0.1 gm) and the other uhrafihratiion (25 000 MWCO), in aqueous NaC1 solutions. Force-distance curves were measured for the two membranes at four ionic strengths. The membranes were also imaged under the same conditions using electrical double layer repulsive forces of differing magnitudes - "'electrical double layer mode" imaging. Image analysis was used to determine surface pore size distributions. The force- distance curves, together with numerically calculated potential profiles at the entrance to a charged pore, allow an explanation and identification of the optimum imaging conditions. The best images were obtained at high ionic strength with the tip close to the membrane surface. Keywords: Atomic force microscopy; Electrical double layer: Surface forces; Pore size distribution; Microfiltration; Ultrafiltration 1. Introduction Atomic force microscopy (AFM) gives topographi- cal images by scanning a sharp tip over a surface. It has become an important means of imaging the sur- face of materials at up to atomic level resolution [1,2]. Key advantages of the technique are its ability to image non-conducting materials directly in air or liquid without special sample preparation. The tech- nique has therefore attracted the interest of a number of researchers interested in the surface properties of membranes [3-8]. *Corresponding author. Tel.: +44 1792 295862; Fax: +44 1792 295862. An atomic force microscope may be used in a number of different modes. The most widely used is "'contact mode" in which the tip is responding to very short range repulsive (Born) forces. A second mode of operation is "non-contact mode" in which the tip responds to attractive van-der-Waals interac- tions with the sample. These have been the most widely used modes and virtually all AFM membrane studies have been carried out in these modes. However, in electrolyte solutions it is possible to image surfaces in "electrical double layer mode" [9] in which the tip responds to the electr!cal double layer interactions between itself and the surface. This mode has been much less used. It may, however, be especially useful for membrane studies as it allows 0376-7388/97/$17.00 Copyright :~: 1997 Elsevier Science B.V. All rights reserved. Pll SI13 76-73 8 8(96)00275-X
Transcript of Atomic force microscope studies of membranes: force measurement and imaging in electrolyte solutions

journal of MEMBRANE
SCIENCE
ELSEVIER Journal of Membrane Science 126 (1997) 77-89 I
Atomic force microscope studies of membranes: force measureiment and imaging in electrolyte solutions
W. R i c h a r d B o w e n * , N i d a l H i l a l , R o b e r t W. L o v i t t , A d e l O. Sha r i f , P e t e r M. W i l l i a m s
Bioehemical Engineering Group, Department of Chemical Engineering, Univer.sity of Wales, Swansea SA2 ,~PP, UK
Received 30 May 1996; revised 16 September 1996; accepted 17 September 1996
Abstract
An atomic force microscope has been used to study the electrical double layer interactions between a silicon tip (with an oxidised surface) and two polymeric membranes, one microfiltration (nominally 0.1 gm) and the other uhrafihratiion (25 000 MWCO), in aqueous NaC1 solutions. Force-distance curves were measured for the two membranes at four ionic strengths. The membranes were also imaged under the same conditions using electrical double layer repulsive forces of differing magnitudes - "'electrical double layer mode" imaging. Image analysis was used to determine surface pore size distributions. The force- distance curves, together with numerically calculated potential profiles at the entrance to a charged pore, allow an explanation and identification of the optimum imaging conditions. The best images were obtained at high ionic strength with the tip close to the membrane surface.
Keywords: Atomic force microscopy; Electrical double layer: Surface forces; Pore size distribution; Microfiltration; Ultrafiltration
1. Introduction
Atomic force microscopy (AFM) gives topographi- cal images by scanning a sharp tip over a surface. It has become an important means of imaging the sur- face of materials at up to atomic level resolution [1,2]. Key advantages of the technique are its ability to image non-conducting materials directly in air or liquid without special sample preparation. The tech- nique has therefore attracted the interest of a number of researchers interested in the surface properties of membranes [3-8].
*Corresponding author. Tel.: +44 1792 295862; Fax: +44 1792 295862.
An atomic force microscope may be used in a number of different modes. The most widely used is "'contact mode" in which the tip is responding to very short range repulsive (Born) forces. A second mode of operation is "non-contact mode" in which the tip responds to attractive van-der-Waals interac- tions with the sample. These have been the most widely used modes and virtually all AFM membrane studies have been carried out in these modes. However, in electrolyte solutions it is possible to image surfaces in "electrical double layer mode" [9] in which the tip responds to the electr!cal double layer interactions between itself and the surface. This mode has been much less used. It may, however, be especially useful for membrane studies as it allows
0376-7388/97/$17.00 Copyright :~: 1997 Elsevier Science B.V. All rights reserved. Pll SI13 76-73 8 8 ( 9 6 ) 0 0 2 7 5 - X
78 W.R. Bowen et al./Journal of Membrane Science 126 (1997) 77-89
imaging under the processing conditions used for aqueous process streams - all membranes used under such conditions acquire a surface charge [10]. It may be that the few AFM studies carried out in aqueous or polar solvent environments [6,7] have, in fact, used this electrical double layer mode of imaging, though the authors have not identified their work as such. There has been no systematic study of this mode of imaging membranes. It is the aim of the present paper to present such a study.
An important prior step to electrical double layer mode imaging is the determination of force-distance curves for the approach of the AFM tip to the sample surface [11-13]. Hence, the present paper begins with a report of such data for the two membranes studied, a nominally 0.1 gm microfiltration membrane and a 25000 MWCO ultrafiltration membrane. AFM images for these membranes are then presented, pro- duced at a range of forces in NaCI solutions at four ionic strengths. Image analysis allows the determina- tion of pore size distributions. The variation in image quality with imaging conditions is discussed in terms of the force-distance curves and numerically calcu- lated potential profiles at the entrance to a charged pore. This allows an explanation and identification of the best conditions for imaging such membranes in electrolyte solutions.
2. Materials and methods
The membranes studied were track etched poly- carbonate microfiltration membranes with a nominal pore size of 0.1 gm (Cyclopore, Whatman Interna- tional) and a 25 000 MWCO ultrafiltration membrane (ES625, PCI Membrane Systems (UK)). We have previously studied these membranes by AFM in air [4,5].
The AFM used was an Autoprobe (CP-100), a commercial device from Park Scientific Instruments (USA). The cantilevers used were Ultralevers 0.6 ~tm (Park Scientific Instruments), with a specified spring constant of 1.9 N m - l and a high aspect ratio silicon tip of nominal radius of curvature 5-10 nm. The manufacturer has specified that the surface of the tip is covered with a silicon oxide layer to a depth of ~ 2 n m [14]. We have confirmed this specified surface chemistry using Energy Dispersive X-ray
Spectroscopy (EDS) in conjunction with an electron microscope. All force and image measurements were made in a closed, unsealed liquid cell. Tubes allowed the exchange of the solution in the cell.
The Autoprobe allows measurement of the force between the tip and a sample as a function of the displacement of the sample, where the sample dis- placement is achieved using a piezoelectric crystal. A laser beam reflected from the back of the cantilever falls onto a split photodiode which detects small changes in the deflection of the cantilever. To convert the deflection vs. sample displacement data to a force vs. tip-sample separation curve, it is necessary to know the spring constant of the cantilever and to define zeros of both force and separation. The spring constant specified by the manufacturer was used. This was in good agreement with that calculated from the dimensions of the cantilever [15]. The zero of force was chosen where the deflection was constant (where the tip and membrane surface were far apart). The zero of distance was chosen as the point at which the cantilever deflection became linear with respect to sample displacement at high force [ 11 ], the beginning of the region of constant compliance. The deflection of the cantilever obtained with the membranes in this region did not depend on the ionic strength of the solution. However, the deflection differed slightly from that obtained with a silicon dioxide surface in solution, indicating that some deformation of the membrane surface may have been taking place. It should be noted that the bending of the cantilever has to be taken into account in calculating the tip- sample distance [11]. This is the state-of-the-art method for determining the zero of separation, but as it depends on an extrapolation it is subject to some uncertainty. Further, specification of a tip-sample distance is only meaningful if the sample surface roughness is small compared to the distances mea- sured. For pore free areas of 16 x 16 nm it was found that the root-mean-square roughness of the 0.1 t.tm Cyclopore membrane in air was 0.077 nm with a maximum peak-to-valley distance of 0.43 rim, and for the ES625 membrane the comparable values were 0.023 nm and 0.16 nm, respectively.
The membranes were imaged in the liquid cell using a constant force in the electrical double layer mode. Before taking any image, a force-distance curve was measured. This allowed conversion of the arbitrary

W.R. Bowen et al./Journal of Membrane Science 126 (1997) 77-89 79
readings of the imaging force slider bar into real force values [16]. The membranes were then imaged at the selected force using a scan rate of 1 Hz with 256 x 256 pixel resolution. For the analysis of surface pore characteristics, the A F M imaging program was used. This allows work with different colour tables and adjustment of the image representation in top view and in perspective. In addition, its ability to generate line profiles along selected lines in the images allows quantitative determination of the diameter of pores [17]. In all cases, 50 pores were measured to determine the size distribution.
All measurements were made in aqueous solutions of sodium chloride at concentrations in the range 10 ~ - I 0 - 4 M at pH 6.5 at room temperature (18.5±1.2 C).
3. Results and discussion
3.1. Force measurements between A F M tip and membrane surface
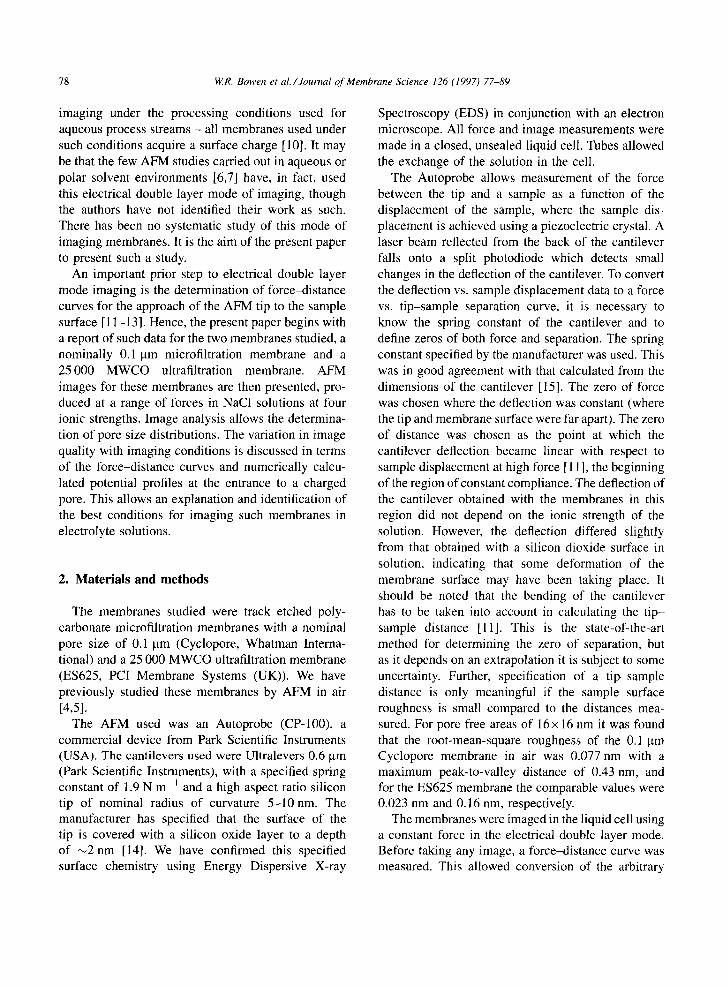
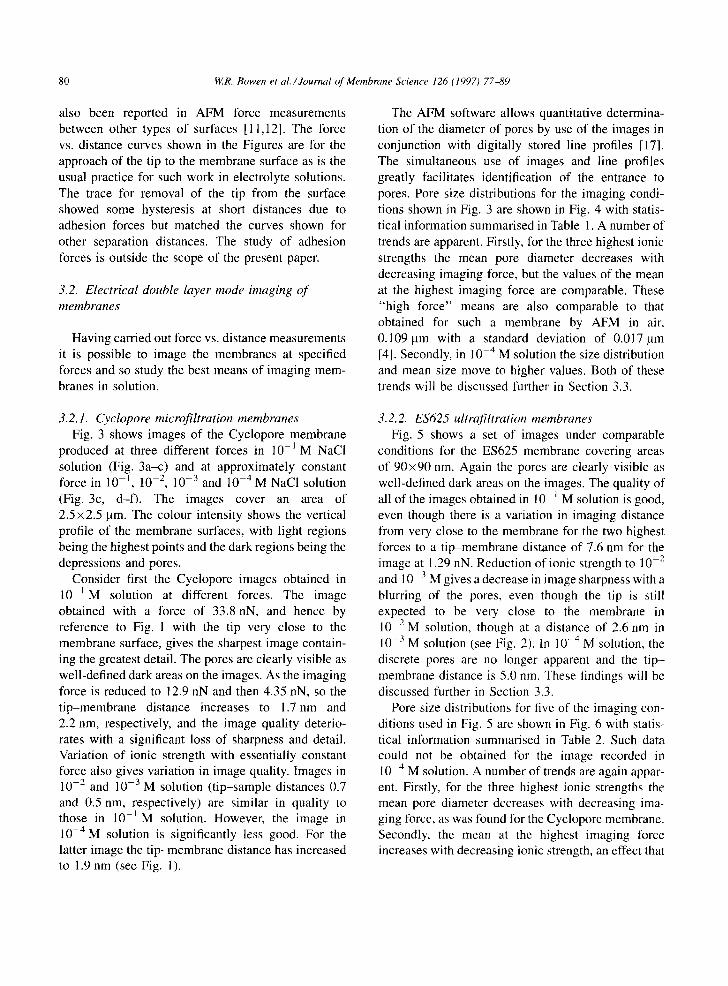
The forces between the cantilever tip and the mem- branes as a function of separation distance in NaC1 solution at four ionic strengths are shown in Fig. 1 for the Cyclopore membrane and in Fig. 2 for the ES625 membrane. The force vs. distance curves were mea-
O NaC110 ~ M 1 i
40 I D NaC1102 M i
30
20
10
C 0 5 10 15 20 25 30 35
Distance[nrn]
Fig. 1. Force vs. distance curve for the approach of an AFM tip to a Cyclopore microfiltration membrane in NaC1 solutions of various ionic strengths at pH 6.5.
50
40
~ 30
8
2O
1 0 ~.,~ ~ ) % ~ ,
0 1~ 20 30 40 50 60
Distance[nm]
Fig. 2. Force vs. distance curve for the approach of an AFM tip to an ES625 ultrafiltration membrane in NaC1 solutions of various ionic strengths at pH 6.5.
sured on pore free areas of the membranes. In each case the force is repulsive at all separations. This shows that the double layer electrostatic interaction between the silicon oxide surface of the tip and the membrane surface is dominant in all cases. Silicon oxide surfaces are known to have a negative potential under such conditions [18] as is also expected for the membranes [19]. At very small distances it may be that the Born repulsion becomes significant. There is no indication of attractive dispersion (van-der-Waals) forces at short distances. Such dominant electrostatic behaviour has also been observed in an AFM for the mutual interaction of silicon oxide surfaces [ 11 ]. The magnitude of the forces measured indicates that the effective area of interaction between the tip and the membrane surface may have been increased by some deformation of the membrane surface. However, a quantitative interpretation of the magnitude of the forces is a task for future work.
For both membranes the range of the measurable interaction increases as the ionic strength decreases, up to a maximum of ~35 nm for the Cyclopore membrane and ,-~60 nm for the ES625 membrane, as is expected from electrical double layer theory [20]. The maximum interaction close to the membrane surface is of comparable magnitude for both mem- branes. The curves showed good reproducibility, including those regions where the curves at differing ionic strengths show some overlap - such overlap has
80 W.R. Bowen et al./Journal of Membrane Science 126 (1997) 7 7 4 9
also been reported in AFM force measurements between other types of surfaces [11,12]. The force vs. distance curves shown in the Figures are for the approach of the tip to the membrane surface as is the usual practice for such work in electrolyte solutions. The trace for removal of the tip from the surface showed some hysteresis at short distances due to adhesion forces but matched the curves shown for other separation distances. The study of adhesion forces is outside the scope of the present paper.
3.2. Electrical double layer mode imaging of membranes
Having carried out force vs. distance measurements it is possible to image the membranes at specified forces and so study the best means of imaging mem- branes in solution.
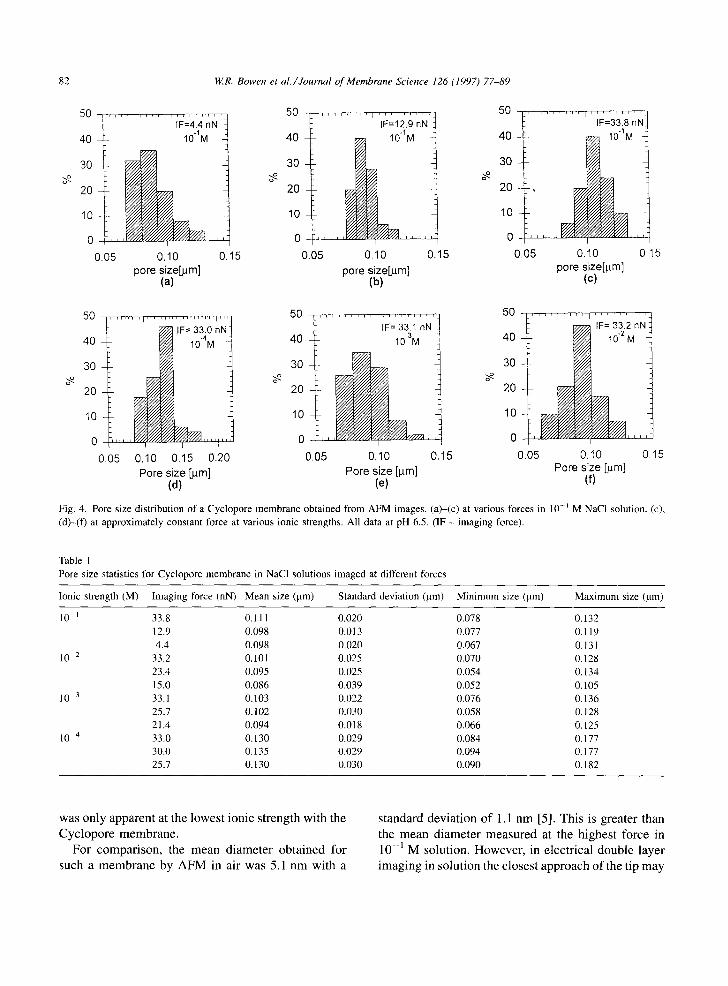
The AFM software allows quantitative determina- tion of the diameter of pores by use of the images in conjunction with digitally stored line profiles [17]. The simultaneous use of images and line profiles greatly facilitates identification of the entrance to pores. Pore size distributions for the imaging condi- tions shown in Fig. 3 are shown in Fig. 4 with statis- tical information summarised in Table 1. A number of trends are apparent. Firstly, for the three highest ionic strengths the mean pore diameter decreases with decreasing imaging force, but the values of the mean at the highest imaging force are comparable. These "high force" means are also comparable to that obtained for such a membrane by AFM in air, 0.109 I.tm with a standard deviation of 0.017 jam [4]. Secondly, in 10 4 M solution the size distribution and mean size move to higher values. Both of these trends will be discussed further in Section 3.3.
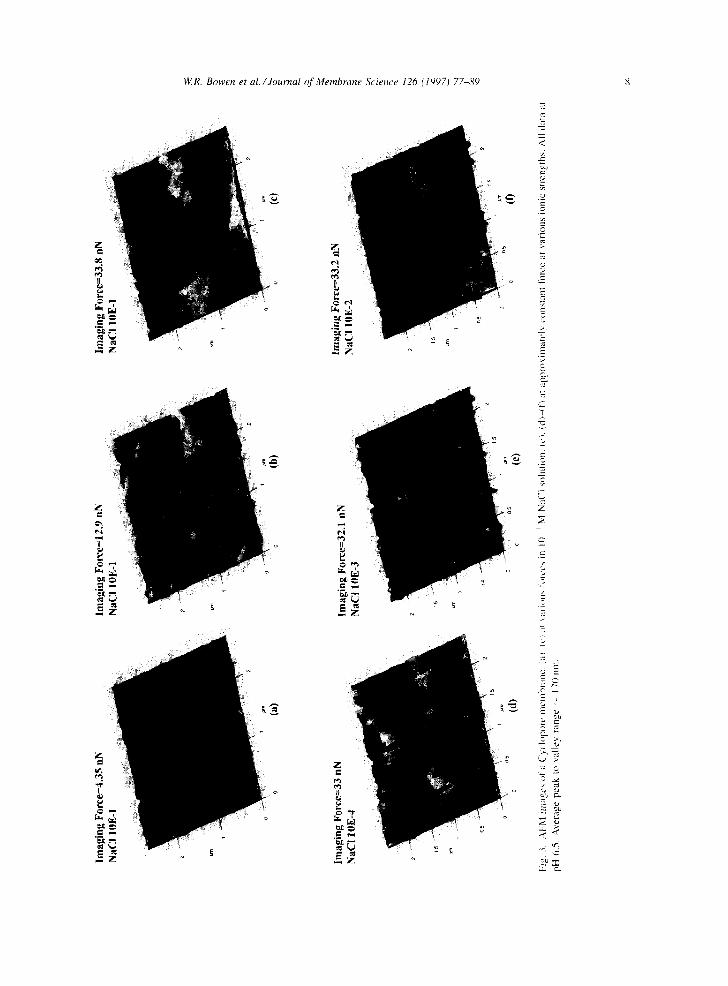
3.2.1. Cyclopore microfiltration membranes Fig. 3 shows images of the Cyclopore membrane
produced at three different forces in 10 -1 M NaC1 solution (Fig. 3a-c) and at approximately constant force in 10 1, 10-2, 10-3 and 10 -4 M NaC1 solution (Fig. 3c, d-f). The images cover an area of 2.5x2.5 pm. The colour intensity shows the vertical profile of the membrane surfaces, with light regions being the highest points and the dark regions being the depressions and pores.
Consider first the Cyclopore images obtained in 10 l M solution at different forces. The image obtained with a force of 33.8 nN, and hence by reference to Fig. 1 with the tip very close to the membrane surface, gives the sharpest image contain- ing the greatest detail. The pores are clearly visible as well-defined dark areas on the images. As the imaging force is reduced to 12.9 nN and then 4.35 nN, so the tip-membrane distance increases to 1.7 nm and 2.2 nm, respectively, and the image quality deterio- rates with a significant loss of sharpness and detail. Variation of ionic strength with essentially constant force also gives variation in image quality. Images in 10 2 and 10-3M solution (tip-sample distances 0.7 and 0.5 nm, respectively) are similar in quality to those in 10-~M solution. However, the image in 10-4M solution is significantly less good. For the latter image the tip-membrane distance has increased to 1.9 nm (see Fig. 1).
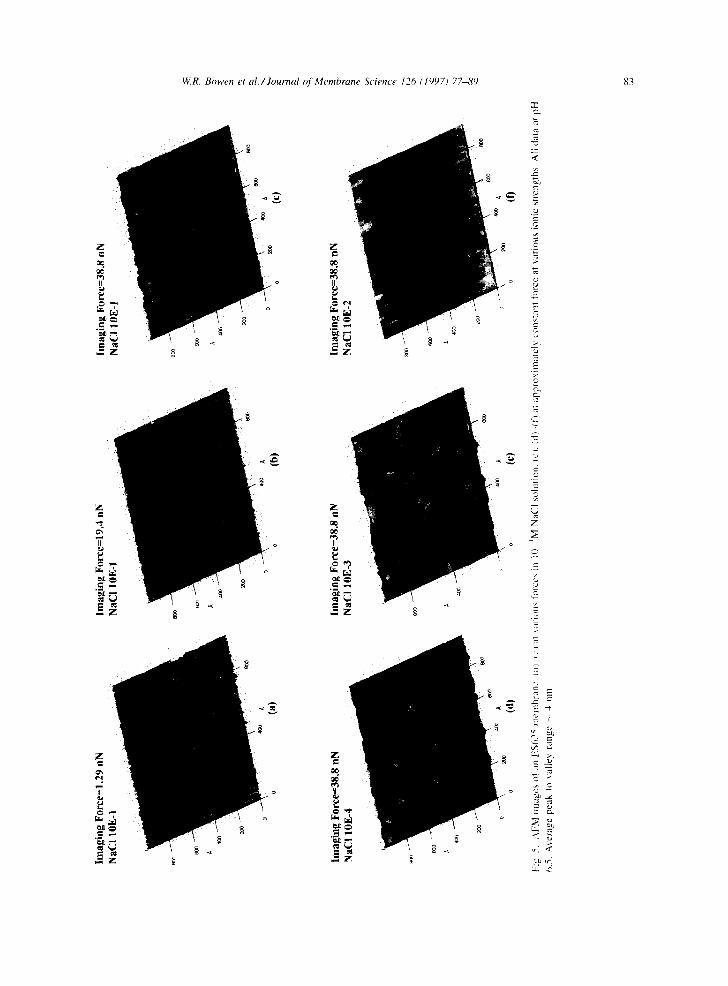
3.2.2. ES625 ultrafiltration membranes Fig. 5 shows a set of images under comparable
conditions for the ES625 membrane covering areas of 90x90 nm. Again the pores are clearly visible as well-defined dark areas on the images. The quality of all of the images obtained in I 0 1 M solution is good, even though there is a variation in imaging distance from very close to the membrane for the two highest forces to a tip-membrane distance of 7.6 nm for the image at 1.29 nN. Reduction of ionic strength to 10 2 and 10 3 M gives a decrease in image sharpness with a blurring of the pores, even though the tip is still expected to be very close to the membrane in 10 2 M solution, though at a distance of 2.6 nm in 10 -3 M solution (see Fig. 2). In ]0 _4 M solution, the discrete pores are no longer apparent and the tip- membrane distance is 5.0 rim. These findings will be discussed further in Section 3.3.
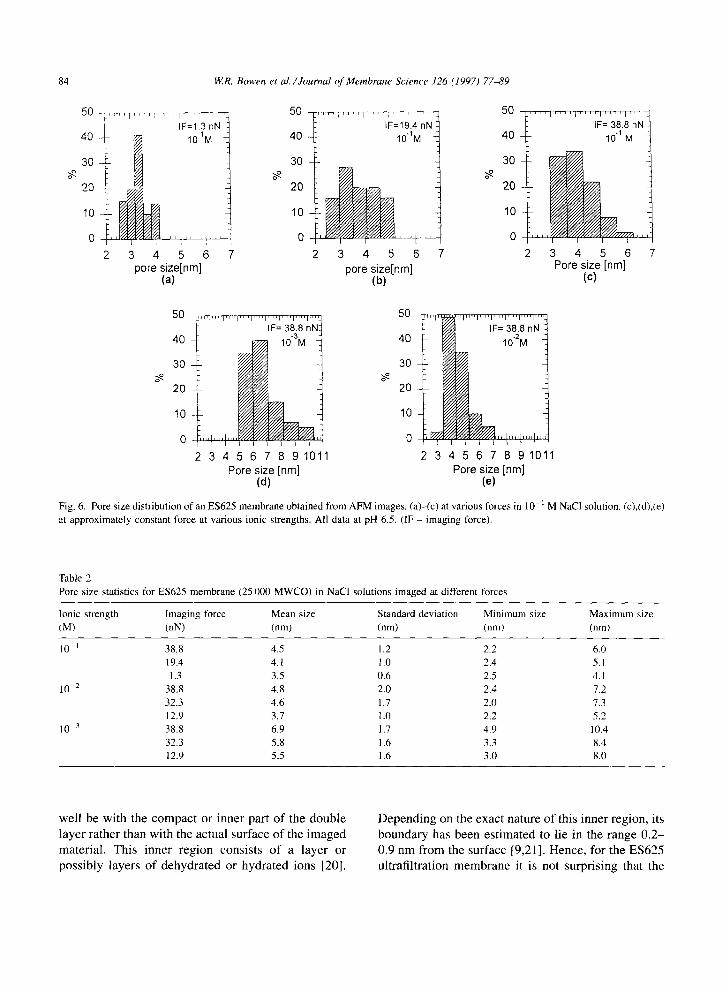
Pore size distributions for five of the imaging con- ditions used in Fig. 5 are shown in Fig. 6 with statis- tical information summarised in Table 2. Such data could not be obtained for the image recorded in 10 a M solution. A number of trends are again appar- ent. Firstly, for the three highest ionic strengths the mean pore diameter decreases with decreasing ima- ging force, as was found for the Cyclopore membrane, Secondly, the mean at the highest imaging force increases with decreasing ionic strength, an effect that
mag
ing
Fo
rce=
4.3
5 n
N
Imag
ing
Fo
rce=
l 2.
9 nN
Im
agin
g F
orc
c=3
3.8
nN
~ -
- N
."
..
..
..
.
N
!
(a)
o {o
) o
mag
ing
Fo
rce=
a3 n
N
I !
mag
ing
For
ce=
a2.1
nN
im
agin
g F
orc
e=a3
.2 n
N
(d)
" '
°~
C
0
:ig.
3.
AF
M i
mag
es o
la C
'ycl
opt~
r¢ m
embr
ane.
(ai
te
l at
xal
ious
l'~
rccs
in
10
i M
Na(
'[ s
olut
ion.
{c!
. {d
)--I
f) a
t ap
prox
imal
el 5
cons
tant
for
ce a
t va
riou
s io
nic
stre
ngth
s. A
ll d
ata
at
~H 6
.S.
Ave
ra,,e
pea
k to
~al
lev
rane
e ~
170
nm.
q D
82 W.R. Bowen et al./Journal of Membrane Science 126 (1997) 77-89
o~
50
40
30
20
10
0 0.05
, , r I T I , , , i , , , , , , , , , IF=4.4 nN
101M
i ~ & l I /
0.10 0.15 pore size[#m]
(a)
5 0 i , , , , ~ , ~ , [ , r , , , , ~
IF=12.9nN 4030 ~ IM
20
10
0.05 0.10 ).15 pore size[#m]
(b)
5 0 - , , , ,m~-, , , , i , , , , , , , , ,
IF=33.8 nN t
40 10-1M 1 30
20
10 ,',
0 I l L
0.05 0.10 0.15 pore size[pm]
(c)
IF= 33.0 nN: 40 ~ ~ 4 M
3O
20
10
0 ~ ~ , , , V / / /U / / / . ' . ~ / /2 ; . " / / / / / /~ . . . . I , L L (
0.05 0.10 0.15 0.20 Pore size [pm]
(d)
o~
50 7 40
30
20
10
0 0.05
, , , , , , , i , i , , , , , ~ , , r ~
IF= 33.1 nN 103M
i , & j I
0.10 0.15 Pore size [pm]
(e)
o~
50
40
30
20
10
0 ).05
IF= 33.2 nN 10 .2 M
0.10 Pore size [pm]
(f)
0.15
Fig. 4. Pore size distribution of a Cyclopore membrane obtained from AFM images. (a)-(c) at various forces in 10 -~ M NaC1 solution. (c), (d)-(f) at approximately constant force at various ionic strengths. All data at pH 6.5. (IF - imaging force).
Table 1 Pore size statistics for Cyclopore membrane in NaCI solutions imaged at different forces
Ionic strength (M) Imaging force (nN) Mean size (jam) Standard deviation (jam) Minimum size (jam) Maximum size (jam)
10 ] 33.8 0.111 0.020 0.078 0.132 12.9 0.098 0.0l 3 0.077 0.119 4.4 0.098 0.020 0.067 0.131
10 2 33.2 0.101 0.025 0.070 0.128 23.4 0.095 0.025 0.054 0.134 15.0 0.086 0.039 0.052 0.105
10 3 33.1 0.103 0.022 0.076 0.136 25.7 0.102 0.030 0.058 0.128 21.4 0.094 0.018 0.066 0.125
10 4 33.0 0.130 0.029 0.084 0.177 30.0 0.135 0.029 0.094 0.177 25.7 0.130 0.030 0.090 0.182
was only apparent at the lowest ionic strength with the Cyclopore membrane.
For comparison, the mean diameter obtained for such a membrane by AFM in air was 5.1 nm with a
standard deviation of 1.1 nm [5]. This is greater than the mean diameter measured at the highest force in 10-1 M solution. However, in electrical double layer imaging in solution the closest approach of the tip may
mag
ing
Fo
rce=
1.2
9 n
N
(a}
mag
ing
Fo
rce=
38
.8 n
N
~ it, g
- t 1
nlZ
_A
o (d
)
:ig.
5.
,\F
M i
mag
es n
f an
ES
625
mem
bran
e, i
a)
I,_'i
~.5.
Ave
rage
pea
k to
val
ley
rang
e ~
4 nm
.
imag
ing
Fo
rce~
19
.4 n
N
mag
ing
F
orc
e=3
8.8
nN
(b)
c}
Imag
ing
Fo
rce=
38
.8 n
N
~aC
I IO
E-3
imag
ing
Fo
rce=
38
.8 n
N
~laf
,t t
ft~
_~,
o (e
) o
(0
l ", a
ri~u
', fo
rce,
, in
l I)
IM
NaC
I so
luti
on.
Ic).
(d
)if)
at
appr
oxi
nate
l', ,
:on,
rant
for
ce a
t va
riou
s io
nic
stre
ngth
s. A
ll d
ata
at p
H
r~
"M 2
84 W.R. Bowen et al./Journal of Membrane Science 126 (1997) 77-89
50 - ~ - r - ~ T ~ - ~ q ~ , , , ~,, ,=: IF=1.3 nN
4030- 2010 ~ 10-IM
o . . . . l " ~ l "
2 3 4 5 6 pore size[nm]
(a)
5O
4° 1 30 -
20
10
0 i l l
7 2 3 4 5 6 pore size[nm]
(b)
r i ~ i i i VT - [ ~ , i i , r ~ l i i , i i ¸
IF=19.4 nN 101M
50 ~_ . . . . q~-,, ~ . . . . F IF= 38.8 nN
10 1M 30
20
10
0 I ' ' ' '
2 3 4 5 6 7 Pore size [nm]
(e)
50
40
30
20
10
0
IF= 38.8 nN - 3 10 M
I I " l ' " ' l I I I I I
2 3 4 5 6 7 8 9 101 Pore size [nml
(d)
o~
50
40
30
20
10
0
IF= 38.8 nN 10"2M
, , , h , , , h , , , h , I 1 I I I I I ~ I
2 3 4 5 6 7 8 9 1011 Pore size [nm]
(e)
Fig. 6. Pore size distribution of an ES625 membrane obtained from AFM images. (a)-(c) at various forces in 10-~ M NaCI solution. (c),(d),(e) at approximately constant force at various ionic strengths. All data at pH 6.5. (IF - imaging force).
Table 2 Pore size statistics for ES625 membrane (25 000 MWCO) in NaC1 solutions imaged at different forces
Ionic strength Imaging force Mean size Standard deviation Minimum size Maximum size (M) (nN) (nm) (nm) (nm) (nm)
10 i 38.8 4.5 1.2 2.2 6.0 19.4 4.1 1.0 2.4 5.1 1.3 3.5 0.6 2.5 4.1
10 2 38.8 4.8 2.0 2.4 7.2
32.3 4.6 1.7 2.0 7.3 12.9 3.7 1.0 2.2 5.2
I0 3 38.8 6.9 1.7 4.9 10.4 32.3 5.8 1.6 3.3 8.4 12.9 5.5 1.6 3.0 8.0
well be wi th the compac t or inner part o f the double
layer rather than with the actual surface o f the imaged
material . This inner region consists o f a layer or
possibly layers o f dehydrated or hydrated ions [20].
Depend ing on the exact nature o f this inner region, its
boundary has been es t imated to lie in the range 0 .2 -
0.9 nm f rom the surface [9,21]. Hence, for the ES625
ultrafiltration membrane it is not surprising that the
W.R. Bowen et al./Journal of Membrane Science 126 (1997) 77~89 85
pore diameter determined in solution differs from that determined in air. The length scale of the inner part of the double layer is not so significant for microfiltration membranes (it is typically <1% of the pore diameter), so such an effect is not important for the Cyclopore membrane.
3,3. Potential distribution at the entrance to a
charged pore
An exact interpretation of the force vs. distance curves measured in electrolyte solutions and of the images obtained in electrical double layer mode requires a calculation of the force of interaction between the tip and the membrane surface at any position of the tip above the surface. Important requirements for such a calculation are a knowledge of the exact shape of the AFM tip, a knowledge of the surface potential or surface charge (or better still the surface chemistry giving rise to the surface electro- static properties) of the tip, a comparable knowledge of the surface properties of the membrane, and a solution of the non-linear Poisson-Boltzmann equa- tion for the appropriate geometry. The force at any distance can then be obtained by integrating the electric tensor on the tip surface. Such a complete calculation is very challenging and beyond the scope of the present work. In particular, the solution of the non-linear Poisson-Boltzmann equation for the tip scanning across and interacting with a pore in a membrane surface requires a full three-dimensional numerical calculation by a technique such as the finile elemenl method.
Fortunately, the main features of electrical double layer imaging of pores can be interpreted using a simpler approach. We have recently used the finite element technique to calculate the electrical potential distribution at the entrance to cylindrical charged pores [22]. This also requires a solution of the non- linear Poisson-Boltzmann equation, but in two dimen- sions rather than three due to the axis of symmetry in the pore. Results of such calculations are presented in the present section.
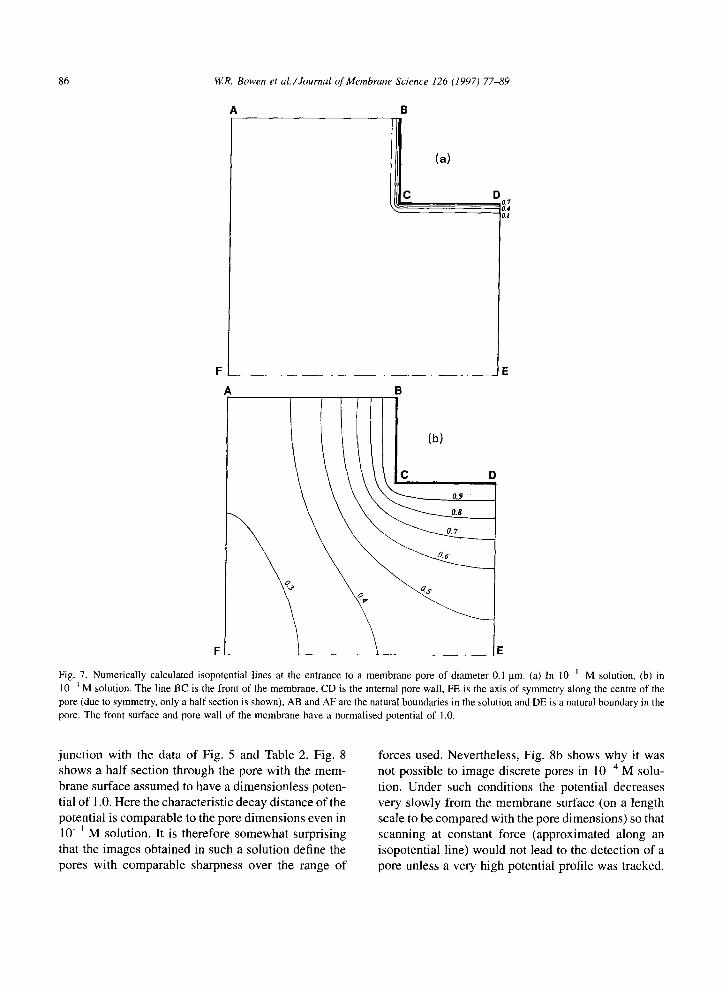
Fig. 7 shows the results of such calculations for a pore of diameter 0.1 prn, which is representative of the Cyclopore membrane under study. Both parts of the Figure show a half section through the pore. In both cases the membrane surface (front surface and pore
wall) is assumed to have a dimensionless potential of 1.0, corresponding to ~25 inV. This is typical of the zeta-potential of polymeric membranes [ I 0,19]. The Figures are for the extremes of ionic strength used in the present work, 10- i M in Fig. 7a and 10 4 M in Fig. 7b. lsopotential lines in the solution are shown. It may be seen that the potential falls off much faster with distance at the higher ionic strength. To a first approximation, and for the purpose of elucidating the experimental results previously presented, a tip scan- ning at constant force in electrical double layer mode may be thought of as moving along one such isopo- tential line. In scanning at high force it could be thought of as moving along a high value isopotential line in solution, and therefore close to the surface. At lower scanning force the tip could be thought of as moving along a lower value isopotential line, and therefore at a greater distance from the surface.
Comparison of Fig. 7a and b helps elucidate a number of the observations and trends apparent in Fig. 3 and Table I. Firstly, it was found tha~ the image obtained in 1(I I M solution gave a sharper definition of the pores than that in l0 a M solution. This may be understood from Fig. 7, for at the high ionic strength the isopotential lines follow the pore entrance more closely than at the low ionic strength. Secondly, it was found that statistical analysis of pore diameters gave a decrease in the measured pore diameter as the imaging force was decreased. In our approximation, imaging at low force corresponds to tracking a low value iso- potential line. These occur some distance from the actual membrane surface and so the lower measured diameter may be understood. Thirdly, not only was the image obtained in 10 a M solution less sharp, but also the mean pore size determined was greater than at the higher ionic strengths and also greater than the value obtained in air. This is most probably an error in measurement induced by the difficulty in identifying the pore entrance when, in our approximation, track- ing an isopotential line, which at this ionic strength will have appreciable curvature, even with the assumption of a sharp right-angle entrance to the pore. The real pore entrance will itself be somewhat rounded, so compounding the difficulty in practice.
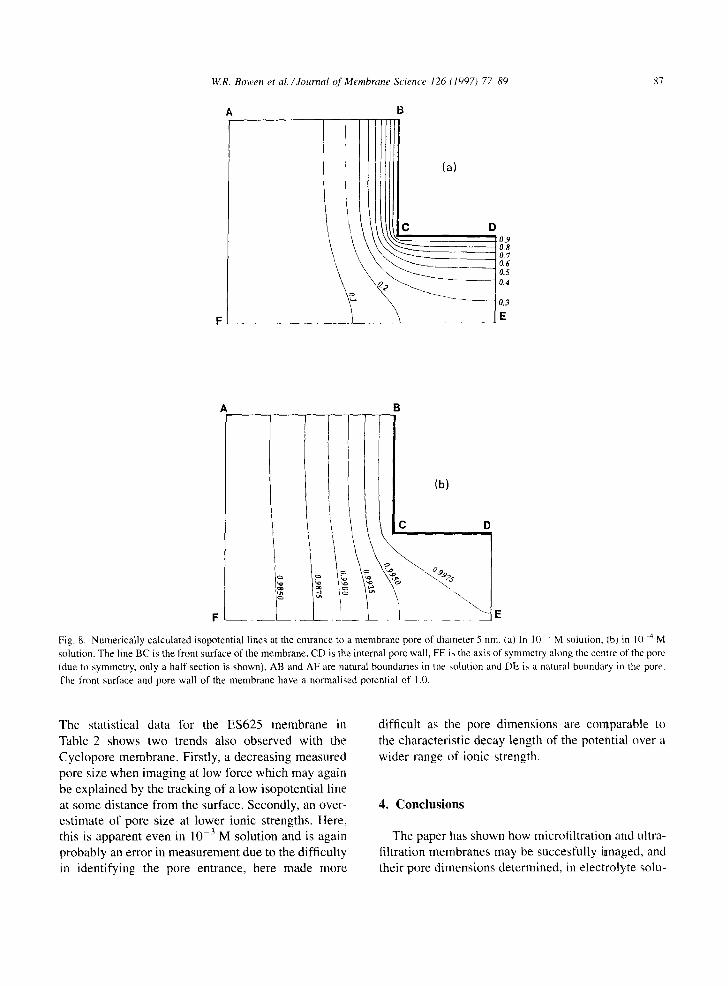
Fig. 8 shows comparable results for the solution of the non-linear Poisson-Boltzmann equation for a pore of diameter 5 nm, which is representative Of the ES625 membrane under study and should be ttsed in con-
86 W.R. Bowen et al./Journal of Membrane Science 126 (1997) 77-89
F
A
i
F J _ _
B
,12 (a) Da., 0.4 !OJ
B
IC (b) t)
Fig. 7. Numerically calculated isopotential lines at the entrance to a membrane pore of diameter 0.1 I.tm. (a) In 10 ~ M solution, (b) in 10 _4 M solution. The line BC is the front of the membrane, CD is the internal pore wall, FE is the axis of symmetry along the centre of the pore (due to symmetry, only a half section is shown), AB and AF are the natural boundaries in the solution and DE is a natural boundary in the pore. The front surface and pore wall of the membrane have a normalised potential of 1.0.
junc t ion with the data o f Fig. 5 and Table 2. Fig. 8
shows a ha l f sect ion through the pore with the m e m -
brane surface assumed to have a d imensionless poten-
tial o f 1 o0. Here the character is t ic decay dis tance o f the
potent ial is comparab le to the pore d imens ions even in 10 -~ M solution. It is therefore somewhat surprising
that the images obtained in such a solution define the
pores with comparab le sharpness over the range o f
forces used. Never theless , Fig. 8b shows why it was
not possible to image discrete pores in 10 -4 M solu-
tion. Under such condi t ions the potent ial decreases
very s lowly f rom the membrane surface (on a length
scale to be compared with the pore d imensions) so that
scanning at constant force (approximated a long an
isopotent ial line) wou ld not lead to the detect ion o f a
pore unless a very high potent ial profile was tracked.
W.R. Bowen et al./Journal q( Membrane Science 126 (I ~)97) 7~89 87
A B
(a)
Z7 A B
_ _ .__ L ~
(b)
D
Fig. 8. Numerically calculated isopotential lines at the entrance to a membrane pore of diameter 5 nm. (a) In 10 ~ M solution, (b) in l0 4 M solution. The line BC is the front surface of the membrane, CD is the internal pore wall, FE is the axis of symmetry along the cen|re of the pore (due to symmetry, only a half section is shown), AB and AF are natural boundaries in the solution and DE is a natural boundary in the pore. The front surface and pore wall of the membrane have a normalised potential of 1.0.
The statistical data for the ES625 membrane in
Table 2 shows two trends also observed with the
Cyc lopo re membrane . Firstly, a decreas ing measured
pore size when imaging at low force which may again
be expla ined by the t racking of a low isopotential l ine
at some dis tance f rom the surface. Secondly, an over-
es t imate of pore size at lower ionic strengths. Here,
this is apparent even in 10 3 M solut ion and is again
probably an error in measu remen t due to the difficulty
in ident i fying the pore entrance, here made more
difficult as the pore d imens ions are comparab le to
the character is t ic decay length of the potential over a
wider range of ionic strength.
4. Conclusions
The paper has shown how microfiltratioin and ultra-
filtration membranes may be succesful ly imaged, and
their pore d imens ions determined, in e lec t ro lyte solu-
88 W.R. Bowen et al./Journal of Membrane Science 126 (1997) 77-89
tions by atomic force microscopy (AFM). Such ima- ging may be carried out due to the long-range elec- trostatic interactions between the tip and membrane surface - the electrical double layer mode of imaging.
An important requirement for the success of this technique is the prior determination of the force vs. distance curve for the interaction between the tip and the membrane surface. Commercial AFM equipment allows the user to specify the imaging force. For successful imaging, it is important that a force suffi- cient to bring the tip quite close to the membrane surface is used. High electrolyte concentrations give the sharpest images with the best definitions of the pores. Use of a force sufficient to bring the tip close to the surface at high electrolyte concentration gives pore sizes and size distributions in good agreement with those obtained by AFM in air. The choice of such optimum conditions is especially important for ultra- filtration membranes where the decay length of the potential from a charged membrane in solution is comparable to the pore dimensions. The interpretation of these experimental findings is aided and confirmed by comparison with numerically calculated potential distributions at pore entrances.
The paper has thus provided an elucidation of the best conditions for AFM imaging of membranes directly in solution. This is an important means for applying AFM to membrane studies because it allows the study of the interaction of individual solutes, such as macromolecules and colloids, with membrane sur- faces.
Acknowledgements
We thank the UK Engineering and Physical Sciences Research Council and the UK Biotechnology and Biological Science Research Council for funding this work. We thank PC! Membrane Systems (UK) (Alan Merry and Martin Peer) for the donation of the ES625 membrane. We are also grateful to Dr W.A. Ducker of the University of Otago for useful advice by e-mail.
References
[1] D. Sarid, Scanning Force Microscopy, Oxford University Press, Oxford, 1994.
[2] G.J. Vansco (Ed.), Atomic Force Microscopy - special issue, Colloids Surfaces A, 87 (1994).
[3] A literature survey is included in reference [4]. [4] W.R. Bowen, N. Hilal, R.W. Lovitt and EM, Williams,
Atomic force microscope studies of membranes: surface pore structures of Cyclopore and Anopore membranes, J. Mem- brane Sci., I l0 (1995) 233-238.
[5] W.R. Bowen, N. Hilal, R.W. Lovitt and EM. Williams, Visualisation of an ultrafiltration membrane by non-contact atomic force microscopy at single pore resolution, J. Membrane Sci., 1 l0 (1996) 229-232.
[6] A.K. Fritzsche, A.R. Arevalo, M.D. Moore, V.B. Elings, K. Kjoller and C.M. Wu, The surface structure and morphology of polyvinylidene fluoride microfiltration membranes by atomic force microscopy, J. Membrane Sci., 68 (1992) 65-78.
17] A. Bessibres, M. Meireles, R. Coratger, J. Beauvillain and V. Sanchez, Investigations of surface properties of polymeric membranes by near field microscopy, J. Membrane Sci., 109 (1996) 271-284.
[8] K.C. Khulbe, B. Kruczek, G. Cbowdhury, S. Gagnr, T, Matsuura and S.E Verma, Characterisation of membranes prepared from PPO by Raman scattering and atomic force microscopy, J. Membrane Sci., 111 (1996) 57-70.
[9] T.J. Senden, C.J. Drummond and E Krkicheff, Atomic force microscopy: imaging with electrical double layer interactions, Langmuir, 10 (1994) 358-362.
[10] W.R. Bowen, Electrochemical aspects of microfiltration and ultrafiltration, in J.A. Howell, V. Sanchez and R.W. Field (Eds.), Membranes in Bioprocessing, Blackie, London, 1993, Chapter 8, pp. 265-291.
[11] W.A. Ducker, T.J. Senden and R.M. Pashley, Measurement of forces in liquids using a force microscope, Langmuir, 8 (1992) 1831-1836.
[12] T.J. Senden and C.J. Drummond, Surface chemistry and tip- sample interactions in atomic fbrce microscopy, Colloids Surfaces A, 94 (1995) 29-51.
[13] H.-J. Butt, M. Jaschke and W. Ducker, Measuring surface forces in aqueous electrolyte solution with an atomic force microscope, Bioelectrochem. Bioenerg. , 38 (1995) 191-201.
[14] Park Scientific Instruments, personal communication. [15] S. Timoshenko, Strength of Materials, Krieger Publishing
Company, Florida, 1958, pp. 137-175. [16] Park Scientific Instruments, Application Notes. [17] W.R. Bowen and N.J. Hall, Properties of microfiltration
membranes: mechanisms of flux loss in the recovery of an enzyme, Biotechnol. Bioeng., 46 (1995) 28-35.
[18] A. Grabbe and R.G. Horn, Double-layer and hydration forces measured between silica sheets subjected to various surface treatments, J. Colloid Interface Sci., 157 (1993) 375-383.
[19] W.R. Bowen and R.J. Cooke, Properties of microfiltration membranes: computer automated determination of the electrokinetic properties of polycarbonate membranes, J. Colloid Interface Sci., 141 (1991) 280-287.
[20] R.J. Hunter, Foundations of Colloid Science, Oxford University Press, Oxford, 1986.
W.R. Bowen et al./Journal of Membrane Science 126 (1997) 77-89 89
21] W.R. Bowen and RM. Williams, Dynamic ultrafiltration model fi~r proteins: a colloidal interaction approach, Bio- technol. Bioeng., 50 (1996) 125-135.
221 W.R. Bowen and A.O. Sharif, The hydrodynamic and electrostatic interactions on the approach and entry of a
charged spherical particle to a charged cylindrical pore in a charged planar surface - with implications for membrane separation processes, Proc. Roy. Soc. Lond, Series A, 452 (1996) 2121-2140.