Determination of Residual Strain by Combining EBSD and DIC Techniques
Upload
khangminh22Category
view
1download
0
728 IEEE TRANSACTIONS ON SYSTEMS, MAN, AND CYBERNETICS—PART B: CYBERNETICS, VOL. 33, NO. 5, OCTOBER 2003
Reconstructing Specimens UsingDIC Microscope ImagesFarhana Kagalwala and Takeo Kanade, Fellow, IEEE
Abstract—Differential interference contrast (DIC) microscopyis a powerful visualization tool used to study live biological cells.Its use, however, has been limited to qualitative observations. Theinherent nonlinear relationship between the object properties andthe image intensity makes quantitative analysis difficult. Towardquantitatively measuring optical properties of objects from DICimages, we develop a method to reconstruct the specimen’s opticalproperties over a three-dimensional (3-D) volume. The method isa nonlinear optimization which uses hierarchical representationsof the specimen and data. As a necessary tool, we have developedand validated a computational model for the DIC image formationprocess. We test our algorithm by reconstructing the optical prop-erties of known specimens.
Index Terms—Differential interference contrast microscopy,hierarchical reconstruction, iterative parameter estimation,nonlinear optimization.
I. INTRODUCTION
T HE NOMARSKI differential interference contrast (DIC)microscope is the preferred method for visualizing live
biological specimens. The DIC microscope is an interferometer,and therefore, the refractive structure of the specimen is madevisible. In biological research, live, transparent cells can be im-aged with this microscope modality. Three-dimensional (3-D)structure can be visualized by optically-sectioning1 throughthe specimen. To date, however, biologists only qualitativelyassess DIC images of cell specimens. Quantitative microscopymethods, such as computational optical sectioning microscopy(COSM), have been restricted to linear microscopy modalities.[5] The inherent nonlinearities in the DIC image formationprocess have hindered past attempts at quantitative analysis.In this paper, we describe a method to reconstruct specimensimaged with DIC microscopy.
DIC microscopy offers several advantages over othercontrast-generating optical systems. In DIC the pupil is unob-structed, and therefore transverse2 and axial resolution exceedsthat in Zernike phase contrast. Consequently, thick specimenswith 3-D features are better resolved. Unlike some fluorescencemethods, no dyes are injected and therefore, live specimensare not adversely affected. Finally, unlike confocal scanningmethods which have slow rates of acquisition, an entire stack of
Manuscript received May 22, 2001; revised January 5, 2003. This paper wasrecommended by Guest Editor N. Bourbakis.
The authors are with the Robotics Institute, Carnegie Mellon University, Pitts-burgh, PA 15213 USA (e-mail: [email protected], [email protected]).
Digital Object Identifier 10.1109/TSMCB.2003.816924
1For each image in an optically sectioned set, the optical elements are con-figured to focus at a particular object distance.
2Transverse planes are perpendicular to the optical axis of the microscope.
Fig. 1. DIC optical components: Regular brightfield microscope componentssuch as a light source, collector, condenser, objective, and eyepiece aresupplemented with a pair of polarizer-prism set. Three light paths are shownto illustrate conjugate planes of reference. Optical elements, spacing, and theincident light angles are not to scale.
optically sectioned images can be acquired within a minute. Inthe case of mobile cells, the short acquisition time minimizesdistortions between optically sectioned slices.
Looking through the eyepiece of the DIC microscope,an observer sees a shadow cast image which deceptivelyindicates 3-D structure. Actually, the image is the differentialof the optical path length introduced by the object into thepropagating light wave. The differential is along a particulardirection, in the transverse plane, called the shear direction.In addition, each image contains both in-focus and out offocus information. Therefore, the challenge in DIC microscopyremains to interpret image features belonging to in-focus objectproperties correctly.
II. DIC M ICROSCOPYBACKGROUND
The DIC microscope, is essentially a brightfield microscopewith a polarizer-analyzer pair and two prisms. [Fig. 1] As instandard brightfield optics, light from a lamp is collimated by acollector and a condenser lens combination. In DIC, however, apolarizer and a Wollaston prism is inserted between the collectorand condenser lens. Moreover, the prism is positioned with re-spect to the back focal plane of the condenser. The describedsetup produces two mutually coherent, polarized beams. Eachelectric field is polarized perpendicularly with respect to theother. In addition, the wavefronts impinging on the object aredifferentially translated with respect to each other. In front ofthe objective lens, an analyzer and Nomarski prism are insertedand aligned with the front focal plane of the objective. The Wol-laston prism behind the condenser introduces a linear phase gra-dient across the two fields emerging from the condenser. The
1083-4419/03$17.00 © 2003 IEEE

KAGALWALA AND KANADE: RECONSTRUCTING SPECIMENS USING DIC MICROSCOPE IMAGES 729
Nomarski prism in front of the objective lens compensates forthis linear phase gradient. Therefore, the combined action ofthe two prisms results in a constant phase bias between the twoperpendicularly polarized fields. This combination produces asteady pattern of interference between the two beams which canthen be detected by a CCD camera or the human eye.
Mathematically, the DIC imaging process can be summarizedby the following set of equations. First, consider a coherent fieldrepresented by
(1)
where are spatial variables in the coordinate spaceof the object with the -axis coincident with the optical axis.
is the phase function. The action of the two prisms can berepresented as an aggregate by and , where
(2)
(3)
In the above equations, is the constant phase bias and isthe shear vector. After a phase transformation, , due tothe object, the wavefronts
(4)
(5)
contain the object information. The field in the image spaceis (shown in equation at the bottom of the page) where
are spatial variables in the coordi-nate space of the image with the -axis coincident with theoptical axis. is the complex amplitudepoint spread function of the imaging system (objective and anyother auxiliary lens) of the microscope. describes thepropagation from the object plane at to the image plane
. The image intensity is
(6)
The nonlinearity in the DIC image has two basic sources.First, since the image is an interference pattern, the detectedintensity is the squared magnitude of the light field’s complexamplitude. Therefore, a convolution of the light intensitywith a lens transfer function does not accurately representthe DIC image, which is a linear superposition of complexamplitude, rather than intensity components, of the light field.In addition, out of focus contributions from the object haveto be considered. Therefore a 3-D amplitude point spread(or transmission) function is needed to accurately model theimage intensity. Second, the object itself aberrates the lightwave as it propagates through. The biological specimens underconsideration, though weakly refractive, are thick and scatter
light significantly. Therefore, aberrations due to the objectcontribute significantly to the image.
Deconvolution methods, such as computational optical sec-tioning microscopy (COSM), are widely used to recover ob-ject information from images acquired by certain optical modal-ities. COSM methods model the image intensity as a convo-lution of the object’s intensity transmittance with a computedpoint-spread function. In modalities such as fluorescence andbrightfield, a linear function of the intensity from the objectprovides an accurate, first order approximation of the image.However, in DIC microscopy, the image cannot be representedby merely considering the intensity from the object. Both phaseand amplitude information have to be modeled.
Initial work in DIC image analysis algorithms used linearmodels. [4] In 1996, Feinegle used a contour finding algorithmto locate edges in each image from an optically sectioned stack.[6] In her work, specimen structure is obtained by axial stackingof contours. The most recent work in the analysis of DIC imagesis by Preza. [12] This work recovers the optical pathlength ateach image point due to the object, and therefore does recoversome quantitative information. The only other attempt to quan-tify information from DIC optics has been made by Cogswell,et al. using optical techniques referred to as geometric phasemethods. [3] Though we are unaware of cases where this methodhas been applied to recover three dimensional object informa-tion. The work by Feinegle produced a 3-D model of the spec-imen, but the object properties were not quantitated and the re-covered specimen model was not validated with ground truthexperiments. Preza’s work recovers optical path-length but doesnot actually reconstruct three dimensional object information.So far, no attempt has been made to quantitatively reconstructthe 3-D properties of the object from DIC images.
In contrast, the reconstruction algorithm that we have devel-oped recovers the whole object information. We address thenonlinearities in the image formation process by a precise com-putational model of DIC microscopy which is used for recon-structing specimens. Using a generalized ray tracing method wehave developed a model of light propagation through the micro-scope and specimen. [8] and [9] The computational model isused to generate simulated images of the current estimated ob-ject as part of the hierarchical reconstruction algorithm.
III. RECONSTRUCTIONPROBLEM DESCRIPTION
Given a set of DIC images, the goal of the reconstructionis to estimate the refractive index distribution throughout thevolume encompassing the object. Due to the nonlinearity ofthe DIC image-formation process, a direct inversion of theimaging equations is not feasible. Therefore, we use an iterativenonlinear optimization algorithm. The optimization starts withan initial estimate of the distribution. Using our computational

730 IEEE TRANSACTIONS ON SYSTEMS, MAN, AND CYBERNETICS—PART B: CYBERNETICS, VOL. 33, NO. 5, OCTOBER 2003
model, we generate simulated images corresponding to thisestimate. The sum of squared differences between the real dataand the simulated images is the error function. The estimateis modified at each iteration such that this error function isminimized. Such a reconstruction process requires a repre-sentation of the refractive index distribution at every pointacross the specimen volume. One possible representation is aweighted combination of basis functions where the weights arethe parameters. The degrees of freedom in the representation,that is, the number of parameters used, play a critical role in theaccuracy with which an object can be represented and the easewith which the optimization converges to the correct answer.
A nonlinear optimization method traverses the parameterspace searching for the point where the error function is min-imized. To avoid converging to incorrect minima, traditionalnonlinear optimization problems require that the initial set ofparameters be close to the actual solution. In order to be ableto converge to the correct solution, despite the initial estimatebeing far, one needs a systematic method of traversing theparameter space such that the estimates approach the neigh-borhood of the global minima without being trapped in localminima. One possible method to achieve this is to first reducethe parameters such that only coarse object properties can berepresented. If the volumetric distribution is approximated bya small number of parameters, the consequent error function isalso of reduced dimension. In the process, local fluctuations(minima) are smoothed over and the error function retainsglobal shape properties. One can then solve the optimizationwith respect to the reduced parameter set. When projected backto the original problem, the solution of the coarse optimizationis closer to the original global minima. Thus the coarse solu-tion serves as an appropriate initial estimate for the originaloptimization problem. Depending on the complexity of theproblem, this parameter reduction can be done in multiplestages.
In our method, we represent the object and image data hi-erarchically and optimize at successive levels of the hierarchyby using a multilevel wavelet-like representation for the object.At each level, the original image data is projected onto a basisspanning a space of possible image features at the given objectresolution level. This projected data is compared with simulatedimages in our nonlinear optimization. Thus, at each level of thehierarchical reconstruction we obtain an object estimate that fitsthe data at that level. This object is used as an initial estimate forthe optimization at the next level of the hierarchy.
IV. COMPUTATIONAL MODEL
Our computational algorithm models the DIC image forma-tion process with sufficient accuracy such that it can be used toreconstruct three dimensional optical properties of specimens.We achieve this by developing a generalized ray tracer with vir-tual models of the optical system and the specimen. We alsomodel the focused and out of focus information present in DICimages by approximating light fields from each point in the ob-ject. We assume the fields have small enough aberration thatthey can be modeled as spherical. For each field, its radius ofcurvature is determined by the object’s refractive structure.
The model consists of a polarized ray tracer and an approxi-mation of the field contributions to the image. We assume thatthe object has negligible absorption and its refractive index vari-ation significantly impacts the resulting image. In our model,light rays contain the cumulative effect of the object and opticsby accumulating phase information. According to laws consis-tent with geometrical optics and energy conservation principles,we propagate light paths through the object. As each ray propa-gates through the specimen volume, the ray is deflected and theray’s phase is modified. We also approximate fields which em-anate from all points in the object and which are diffracted bythe object inhomogeneities. Lastly, we approximate the effectof diffraction by the lens pupil on each of these fields. Thus,we incorporate wavelength-dependent information in additionto the geometrical optics approximations allowing us to modelDIC images more accurately than in past models.
V. RECONSTRUCTIONALGORITHM
The hierarchical reconstruction consists of three processes.In the first step, we represent the object at different resolutions.Second, we decompose the image data in order to identify imagefeatures corresponding to objects at the different resolutions.Third is the nonlinear optimization algorithm which recoversan estimate of the object at each resolution.
A. Hierarchical Object Representation
Since the DIC image captures the directional gradient of thephase introduced by the object into the light path, we representthe object as a volumetric distribution of refractive index values.At present, we assume that the object is transparent, and there-fore the refractive index is a scalar quantity.3 We represent therefractive index by a wavelet-like bases, approximating it at dif-ferent levels of resolution, where at each level only a subset ofspatial frequencies are present. For the purpose of illustration,let us formulate in one dimension. At a particular resolution,
is represented by combining versions of the scaling func-tion, , and wavelet function,
(7)Both and are cubic spline functions, developed byCai and Wang [2]. The scaling function represents the lowestspatial frequencies. The wavelet function represents the detailsat different resolutions. Translated versions of , in additionto, scaled and translated versions of span the domain ofan object. To represent a function at a particular level one needsto find the combination of weights up to that level which bestapproximates the original function. In Fig. 2, at the first level( ), an example function is coarsely approximated by acombination of the translated scaling functions. At each sub-sequent level, the corresponding wavelet functions are addedto the representation and the function is better approximated.To represent a two-dimensional (2-D) distribution, , wehave to use a combination of functions that are outer products of
3This may be generalized to include absorption. The refractive index wouldthen be a vector, or complex number.

KAGALWALA AND KANADE: RECONSTRUCTING SPECIMENS USING DIC MICROSCOPE IMAGES 731
Fig. 2. Object hierarchy. In the right column an original 1-D object is shownsuperimposed with the approximate object at the level of the hierarchy. Theleft column shows the basis functions at each level. Each row shows the basisfunctions that are added to the representation at that level.
Fig. 3. Sample 2-D scaling and wavelet functions. Each corresponds to a termin (8).
the one-dimensional scaling and wavelet functions, (see equa-tion (8) at the bottom of the page). Each tensor product results ina 2-D function that can represent different properties of the ob-ject. [Fig. 3] The extension to three dimensions is similar. Thelevels of the wavelet functions provide a systematic hierarchyfor representing and recovering the object. At each level, of thereconstruction algorithm, the goal is to recover the parameters atthat level. The scaling function coefficients ( ) are recoveredin the very first level ( ). At that level, the distribution is
(9)
The values of are initialized to 0. We then proceed to up-date the parameters iteratively so that the error between thesimulated images and the image data at this level is minimized.The iterations at this level terminate when small changes in theparameter vector do not effect a significant improvement to theerror. The algorithm then proceeds to the next level ( ). Theestimated object from the previous level is transferred as the ini-tial object at this level and we proceed to recover , ,
. Analogous to the previous level, these parameters are ini-tialized to 0 and iteratively updated so that the error betweensimulated images and the image data at level 0 is minimized.Each subsequent level of the reconstruction proceeds similarly.
Fig. 4. Hierarchy of objects and images. The two object dimensions are theaxial (Z) and transverse (X). For each image, the object plane is at the centerof theZ axis. Rows 1–3 show the objects and corresponding images from thecoarsest to finest resolution (J = �1; J = 0; J = 1).
The wavelet-like basis provides a continuous representationfor the refractive index. For computations, we discretize this dis-tribution. In our model, the refractive index is stored at discretelocations of a three-dimensional voxel grid. We typically usegrids with resolution 0.2–1 m perpendicular to the optical axisand 0.03–1 axially. A typical grid size is 100 100 50 inthe , and dimension, respectively.
B. Hierarchical Image Representation
Unlike microscope modalities for which analytical models ofthe 3-D optical transfer function are available [13], object struc-ture and the DIC image is related nonlinearly. Due to this non-linearity, an algorithm using an analytical DIC imaging modelis not practical. If the relationship between the object and imageintensity were linear, then a linear decomposition of the objectwould result in a linear decomposition of the image. Since thisis not possible, we have developed a “matching by synthesis” al-gorithm that identifies image features which result from the rep-resented object frequencies. The original data consists of imagefeatures due to all object frequencies but this data cannot be lin-early decomposed into features at all levels. Therefore, at eachresolution level we have to determine the image features whichare appropriate and match these to the original data. An exampleof an object at different resolutions and the corresponding im-ages simulated by our computational model is depicted in Fig. 4.
The matching by synthesis algorithm extracts features in theoriginal intensity data which correspond to objects at a partic-ular resolution. At a given resolution level, we suppose that
(8)

732 IEEE TRANSACTIONS ON SYSTEMS, MAN, AND CYBERNETICS—PART B: CYBERNETICS, VOL. 33, NO. 5, OCTOBER 2003
the DIC image of the object can be represented in terms of abasis such that
(10)
where { } for is a set of basis functions specificto the resolution . In order to relate the original image data,
, to the images at each resolution level, we needto find the features in the original data that correspond to thefeatures in the basis functions. Before we can proceed to matchfeatures in the original data, we need to find the basis images.We obtain the basis images by perturbing parameters at a partic-ular resolution and synthesizing an image per perturbed object.Functions selected to be in the basis represent the image featuresmost common to the synthesized images. The original imagedata is then projected onto this basis, thereby, giving the imagefeatures that are present in the original data corresponding to anobject at the given resolution. Specifically, our algorithm pro-ceeds in three steps. First, at a particular resolution, we intro-duce a large set of perturbations to the initial object and generatesimulated images of each of the perturbed objects. Second, weselect a basis that best characterizes the images correspondingto the perturbed objects. Third, we project the original imagedata onto the estimated basis.
Object Perturbations:At a given resolution level , theinitial object is perturbed by a large number of random con-figurations. Each perturbation involves adding or subtractinga random amount from all parameters of the level basisfunctions. Therefore, given random parameter vectors ,
and , a perturbed object at levelis
(11)
We use the computational model to generate a simulated image,, for each perturbed object. The set of simu-
lated images contain a wide range of possible image featurescorresponding to objects at this resolution. Though, we haveonly shown perturbations of the wavelet coefficients, the coeffi-cients of the scaling functions are also perturbed at levelto obtain basis images at that level. For a particular resolution,the total degrees of freedom at that resolution is
(12)We have experimentally determined that perturbations (andsimulated images ) suffice.
Basis Selection:Next, we implement a basis selectionmethod from the simulated images, { }for . One simple basis selection method is aKarhunen-Louve decomposition applied to 2-D signals. [10],[14] This method results in a set of “eigenimages,” eachfunctioning as a basis vector. We found that the eigenimagesbased method does not sufficiently abstract image features fromthe set of images. That is, although eachcan be represented by a combination of the eigenimages,each eigenimage doesn’t necessarily represent isolated imagefeatures.
To find basis vectors which explicitly represent imagefeatures, we implemented a basis selection method using the“matching pursuit” algorithm. [11], [1], and [7] This algorithmuses a redundant dictionary of functions, where each functionis a scaled and translated version of an exponentially modu-lated window function. In our implementation, the windowis Gaussian. Using a redundant dictionary of such functionsoffers an advantage over decomposition into a pre-establishedbasis, such as a wavelet basis. In a wavelet basis, scale andfrequency have a fixed relationship so that only features whichhave a particular frequency content can be represented at aparticular scale. In contrast, exponentially modulated functionscan represent several kinds of features at any given scale.
The matching pursuit is an iterative greedy algorithm toidentify functions out of the dictionary that best match animage in the set. Note, the iterations of the matching pur-suit algorithm are embedded within each resolution levelof the reconstruction algorithm. Given an intensity vector
, ( ,in our algorithm), the matching pursuit algorithm
defines a residual, at each iteration , where. An iteration consists of finding,
the best function from candidate functions in thedictionary, such that
(13)where denotes inner product. is then removedfrom the candidate functions in the dictionary. The residual isupdated as
(14)
The algorithm is terminated when the residual’s norm fallsbelow a preset threshold. More details can be found in thereferences.
As a result of matching pursuit, each is decomposedwith respect to a unique matched set, { } for
, selected from the dictionary. Therefore we will havematched sets. Finally, we extract a set of dissimilar func-
tions that are most prevalent across all the matched sets.4 Thisset of functions forms the basis, { } for , for thesubspace of images corresponding to objects at resolution level. [Fig. 5] The number, , is set experimentally to ensure that
{ } spans the entire image.
4Two functions,g (x ) andg (x ), are dissimilar ifhg ; g i=hg ; g iandhg ; g i=hg ; g i is less than an empirically determined threshold.
KAGALWALA AND KANADE: RECONSTRUCTING SPECIMENS USING DIC MICROSCOPE IMAGES 733
Fig. 5. 1-D basis functions at the levels 0 and 1. (From specimen 1reconstruction).
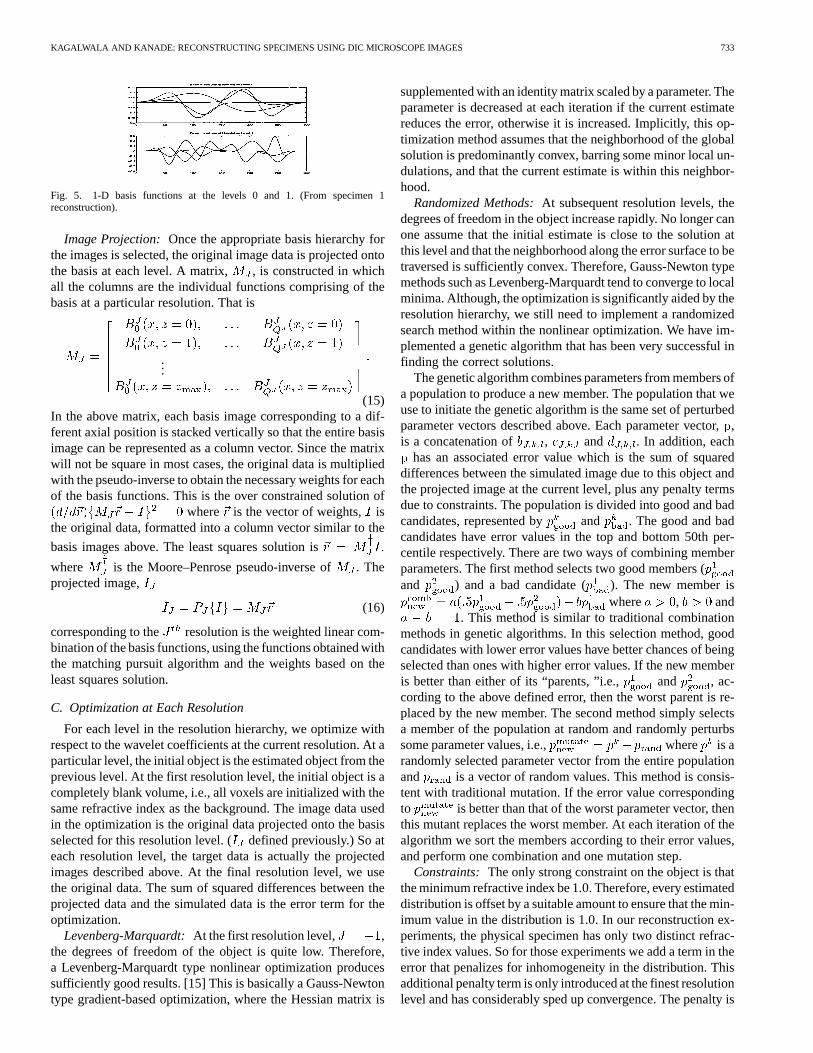
Image Projection: Once the appropriate basis hierarchy forthe images is selected, the original image data is projected ontothe basis at each level. A matrix, , is constructed in whichall the columns are the individual functions comprising of thebasis at a particular resolution. That is
...
(15)In the above matrix, each basis image corresponding to a dif-ferent axial position is stacked vertically so that the entire basisimage can be represented as a column vector. Since the matrixwill not be square in most cases, the original data is multipliedwith the pseudo-inverse to obtain the necessary weights for eachof the basis functions. This is the over constrained solution of
where is the vector of weights, isthe original data, formatted into a column vector similar to the
basis images above. The least squares solution is
where is the Moore–Penrose pseudo-inverse of. Theprojected image,
(16)
corresponding to the resolution is the weighted linear com-bination of the basis functions, using the functions obtained withthe matching pursuit algorithm and the weights based on theleast squares solution.
C. Optimization at Each Resolution
For each level in the resolution hierarchy, we optimize withrespect to the wavelet coefficients at the current resolution. At aparticular level, the initial object is the estimated object from theprevious level. At the first resolution level, the initial object is acompletely blank volume, i.e., all voxels are initialized with thesame refractive index as the background. The image data usedin the optimization is the original data projected onto the basisselected for this resolution level. ( defined previously.) So ateach resolution level, the target data is actually the projectedimages described above. At the final resolution level, we usethe original data. The sum of squared differences between theprojected data and the simulated data is the error term for theoptimization.
Levenberg-Marquardt:At the first resolution level,J ,the degrees of freedom of the object is quite low. Therefore,a Levenberg-Marquardt type nonlinear optimization producessufficiently good results. [15] This is basically a Gauss-Newtontype gradient-based optimization, where the Hessian matrix is
supplemented with an identity matrix scaled by a parameter. Theparameter is decreased at each iteration if the current estimatereduces the error, otherwise it is increased. Implicitly, this op-timization method assumes that the neighborhood of the globalsolution is predominantly convex, barring some minor local un-dulations, and that the current estimate is within this neighbor-hood.
Randomized Methods:At subsequent resolution levels, thedegrees of freedom in the object increase rapidly. No longer canone assume that the initial estimate is close to the solution atthis level and that the neighborhood along the error surface to betraversed is sufficiently convex. Therefore, Gauss-Newton typemethods such as Levenberg-Marquardt tend to converge to localminima. Although, the optimization is significantly aided by theresolution hierarchy, we still need to implement a randomizedsearch method within the nonlinear optimization. We have im-plemented a genetic algorithm that has been very successful infinding the correct solutions.
The genetic algorithm combines parameters from members ofa population to produce a new member. The population that weuse to initiate the genetic algorithm is the same set of perturbedparameter vectors described above. Each parameter vector,,is a concatenation of , and . In addition, each
has an associated error value which is the sum of squareddifferences between the simulated image due to this object andthe projected image at the current level, plus any penalty termsdue to constraints. The population is divided into good and badcandidates, represented by and . The good and badcandidates have error values in the top and bottom 50th per-centile respectively. There are two ways of combining memberparameters. The first method selects two good members (and ) and a bad candidate ( ). The new member is
where , and. This method is similar to traditional combination
methods in genetic algorithms. In this selection method, goodcandidates with lower error values have better chances of beingselected than ones with higher error values. If the new memberis better than either of its “parents, ”i.e., and , ac-cording to the above defined error, then the worst parent is re-placed by the new member. The second method simply selectsa member of the population at random and randomly perturbssome parameter values, i.e., where is arandomly selected parameter vector from the entire populationand is a vector of random values. This method is consis-tent with traditional mutation. If the error value correspondingto is better than that of the worst parameter vector, thenthis mutant replaces the worst member. At each iteration of thealgorithm we sort the members according to their error values,and perform one combination and one mutation step.
Constraints: The only strong constraint on the object is thatthe minimum refractive index be 1.0. Therefore, every estimateddistribution is offset by a suitable amount to ensure that the min-imum value in the distribution is 1.0. In our reconstruction ex-periments, the physical specimen has only two distinct refrac-tive index values. So for those experiments we add a term in theerror that penalizes for inhomogeneity in the distribution. Thisadditional penalty term is only introduced at the finest resolutionlevel and has considerably sped up convergence. The penalty is

734 IEEE TRANSACTIONS ON SYSTEMS, MAN, AND CYBERNETICS—PART B: CYBERNETICS, VOL. 33, NO. 5, OCTOBER 2003
Fig. 6. Physical data of bead specimen.
achieved by segmenting the volume into regions of high and lowrefractive index values and then measuring the variance withinthose regions. The variance terms are scaled by parameters,and and added to the error. Therefore, the modified error is
(17)
where the first term is the sum of squared differences betweenthe intensity values of the projected image and the simulatedimage calculated over the total number of pixels,. In the restof the error, is the total number of voxels, and arethe means of the high and low valued respectively, and
are the sets of discrete voxels which are above and belowthe threshold, respectively.
VI. RESULTS
The first set of reconstruction results we obtain are in two di-mensions. That is, instead of estimating the full 3-D volumetricdistribution, we chose to reconstruct one slice in the volume.To provide a good proof of concept for this reconstruction algo-rithm that would be less computationally expensive than a full3-D reconstruction, we chose an axial slice (rather than a trans-verse slice). Our decision is based on the fact that reconstructingalong the axial dimension presents the greatest challenge. Spa-tial frequencies which have significant components in the axialdirection are attenuated the most in the image formation process.The two transverse dimensions are imaged according to iden-tical principles, thus reconstructing in one of them can serve asa validation for both. We chose two test specimens, each havingsome unique attributes. The first specimen, consisting of a beadin optical cement, is symmetric and the object structure is em-bedded in the volume. The second specimen, consisting of anion-milled wafer, does not have perfect symmetry and the struc-ture extends to the top edge of the volume.
In the first 2-D experiment, we embedded several 10di-ameter beads in optical cement. The homogeneous beads have arefractive index that is .03 less than the cement. We acquired anoptically sectioned data set of this specimen with an axial reso-lution of .2 . A cropped region showing one bead in some ofthe images is shown in Fig. 6. The data used in the reconstruc-tion experiment consisted of a diagonal cut through the croppedregion of 10 images in the set. A cropped specimen is shownin Fig. 7. Some of the intensity plots are shown in Fig. 8. Theimage data projected onto the basis at different object resolu-tions is shown in Fig. 8 as well. Fig. 9 shows the estimated ob-jects at the different resolutions and a comparison between the
Fig. 7. Real data of wafer specimen.
Fig. 8. Intensity plots at different resolutions. Column 1–2: The original dataprojected onto the levels 0–1 respectively. Column 3: The original data.
Fig. 9. Results for Specimen 1. A-C are the estimated answers at levels 0–2.D: Real object. E: Final estimate. F: Error between real and estimated object.
expected object structure and the recovered object. The grid res-olution in this experiment is 1 in both directions. As can beseen from the error image, the object structure is recovered quiteaccurately. The original object has symmetric structure and therecovered shape is symmetric as well.
The specimen used for the second experiment consisted ofan ion-milled glass wafer. Due to error prone multiple millings,the actual milled wafer pattern is defective in that it does nothave symmetric walls even though the specifications havesymmetric structure. The specimen was prepared by filling themilled cavity with oil that had a refractive index 0.08 less thanthe glass. The optically sectioned image set of this specimenhas a 0.2 axial resolution. A subset of the images are shownin Fig. 7. For the reconstruction experiment, we extracted aline of intensity data from each one of ten images in the set.The line (horizontal) was extracted above the midpoint of theshown images at a point such that two of the depressions inthe pattern are captured. The original image data is shownin Fig. 10 along with the results of the image data projectedonto the basis at different object resolutions. Fig. 11 shows

KAGALWALA AND KANADE: RECONSTRUCTING SPECIMENS USING DIC MICROSCOPE IMAGES 735
Fig. 10. Intensity plots of wafer data at different resolutions. Columns 1–3:The projected data at levels 0–2, respectively. Column 4: The original data.
Fig. 11. Results for Specimen 2. A-C are the estimated answers at levels 0–2.D: Real object. E: Final estimate. F: Error between real and estimated object.
the estimated object at different resolutions and a comparisonof the final reconstructed object and the expected object. Thegrid resolution in this experiment is .3 in the-direction and0.03 in the -direction. Since the exact nature of the defectsintroduced by the milling process is not known, the expectedobject shown is merely a hypothesis. As can be seen, barringsome small extraneous patches, the structure of the recoveredobject is very close to that of the expected object. The lack ofsymmetry that is apparent from the DIC images appears in therecovered object as well.
For our final experiments, we tried reconstructing a 3–Dobject. Here we represented the object as a superposition ofthree-dimensional wavelet basis functions and recovered therespective coefficients. The three-dimensional experiment usedthe optically-sectioned data set of bead images. A sampling ofthese images is shown in Fig. 6. We used 25 images from thedata set for this reconstruction experiment. The initial objectwas a blank volume. The estimated objects at resolution level0 is shown in Figs. 12 and 13. A slice in Fig. 12 representsthe volumetric refractive index distribution across a transverseplanes cutting the volume. In Fig. 13 we show an axial slicecutting through the center of the volume so the estimated objectextents can be seen. Figs. 14–15 show the estimated objectat level 1. For visualization purposes, we show the results as
Fig. 12. Bead experiment results: Estimated object at level 0. The object isshown by transverse slices through the volume at a resolution of 5�m.
Fig. 13. Axial slice through object at Level 0. The vertical axis isZ and thehorizontal axis isX .
Fig. 14. Bead experiment results: Estimated object at level 1. As in theprevious figure, the object is shown using transverse slices through the volumeat a resolution of 2.5 mm.
planes through the object. The actual experiment is performedvolumetrically. That is, each basis function is 3-D. In Figs. 13and 15 we show an axial slice cutting through the center ofthe volume so that the estimated object extents can be seen.

736 IEEE TRANSACTIONS ON SYSTEMS, MAN, AND CYBERNETICS—PART B: CYBERNETICS, VOL. 33, NO. 5, OCTOBER 2003
Fig. 15. The object at level 1 is shown as an axial slice through the center ofthe volume. The vertical axis isZ and the horizontal axis isX .
Fig. 16. The error between real object and estimated object at level 1. The errorthrough the volume is shown by transverse slices at a resolution of 2.5 microns.
At level 0, 27 coefficients are estimated which represent allthe translated scaling functions. At level 1, the initial objectis the level 0 object. The total number of coefficients at level1 is 316 out of which we estimate only 26. These coefficientscorrespond to the basis functions spanning the boundary andinternal extents of the initial object at this level. By simplyignoring the basis functions which fall outside of the estimatedinitial object (at this level) we can eliminate the majority of thebasis functions. This assumes that new object will fall withinthe boundary of the old object which is valid since the basisfunctions at the coarser level have larger support.
Comparison of the real object and the estimated object isshown in Fig. 16. It can be seen that the estimated object isslowly converging to the real object shape. At this resolutionlevel, the basis functions have too wide support to produce anobject with sharp boundaries. The comparison does show thatthe optimization estimates a distribution that approaches the realobject. The error is shown axially in Fig. 17. Here it can beseen that the estimated object’s extents do approach the realobject dimensions in the axial direction as well. One can alsonote that the refractive index value of the estimated object doesapproach that of the real object. The centers of both the real
Fig. 17. The error between real object and the estimated object at level 1.The image here shows the error through an axial slice cutting the center of thevolume. The vertical axis isZ and the horizontal axis isX .
object and estimated object also approximately coincide. Theseresults are meant as a proof of concept to show that three-dimen-sional reconstruction is possible with this method. This exper-iment shows that given enough iterations, the estimated objectwill approach the real object shape and recover the object’s op-tical property.
VII. D ISCUSSION ANDCONCLUSION
The analysis of DIC images presents a substantial challengedue to the nonlinearity of the image formation process and theout-of-focus artifacts. We tackle the problem by developing twotools. First, the computational model has been discussed in de-tail in previous publications. The second is the hierarchical re-construction algorithm discussed here. As shown by the results,the nonlinear optimization is powerful enough to recover axialand transverse structure and quantitate the optical propertiesof the object. Even though, we initialize the optimization farfrom the actual solution, we are able to converge very close toit. In order to successfully converge to solutions when facedwith highly nonlinear error surfaces, we developed a hierar-chical method. This method represents the object with respect toa wavelet basis in order to systematically reduce the dimensionof the search space and arrive at a chain of object estimates atfiner and finer resolutions. The intensity data also has to be de-composed in a manner consistent with the object decomposition.Since the imaging process is nonlinear, we developed a methodby which image features present at the different object resolu-tions are explicitly captured in a particular basis at each level.The real data can then be projected onto the basis at each res-olution level to obtain a hierarchical representation of the data.Our results show that such an algorithm is capable of recoveringstructure along all directions. By recovering the structure of twovery different specimens, we illustrate the capabilities of the re-construction algorithm.
REFERENCES
[1] F. Bergeaud and S. Mallat, “Matching pursuit: Adaptive representationsof images and sounds,”Comput. Appl. Math., vol. 15, no. 9, pp. 97–109,1996.

KAGALWALA AND KANADE: RECONSTRUCTING SPECIMENS USING DIC MICROSCOPE IMAGES 737
[2] W. Cai and J. Wang, “Adaptive multiresolution collocation methods forinitial boundary value problems of nonlinear pdes,”SIAM J. Numer.Anal., vol. 33, no. 3, pp. 937–970, 1996.
[3] C. J. Cogswell, N. Smith, K. Larkin, and P. Hariharan, “Quantitative dicmicroscopy using geometrical phase shifter,” inProc. SPIE, vol. 2984,1997, pp. 72–81.
[4] K. Dana, “Three Dimensional Reconstruction of the Tectorial Mem-brane,” M.S. dissertation, Mass. Inst. Technol., Cambridge, 1992.
[5] A. Erhardt, G. Zinser, D. Komitowski, and J. Bille, “Reconstructing 3-Dlight microscopic images by digital image processing,”Appl. Opt., vol.24, no. 2, pp. 194–200, 1985.
[6] P. Feineigle, “Motion Analysis and Visualization of Biological Struc-tures Imaged via Nomarski DIC Light Microscopy,” Ph.D. dissertation,Carnegie Mellon Univ., Pittsburgh, PA, 1996.
[7] S. Jaggiet al., “High resolution pursuit for feature extraction,”Appl.Comput. Harm. Anal., vol. 5, pp. 428–449, 1998.
[8] F. Kagalwala, F. Lanni, and T. Kanade, “Simulating DIC microscope im-ages,”Proc. IEEE Wkshp. Photonics Modeling Computer Vision Graph.,June 1999.
[9] , “Computational Model of DIC Microscopy: From Observations toMeasurements,” CMU-R1 TR, Carnegie Mellon Univ., Pittsburgh, PA,TR-00–10, 2000.
[10] M. Kirby and L. Sirovich, “Applications of the karhunen-louve proce-dure for the characterization of human faces,”IEEE Pattern Anal. Ma-chine Intell., vol. 12, pp. 103–108, Jan. 1990.
[11] S. Mallat and Z. Zhang, “Matching pursuits with time-frequency dic-tionaries,”IEEE Trans. on Signal. Processing, vol. 41, pp. 3397–3410,Dec. 1993.
[12] C. Preza, “Phase Estimation Using Rotational Diversity for DIC Mi-croscopy,” Ph.D. dissertation, Washington Univ., St. Louis, MO, 1998.
[13] N. Streibl, “Three-dimensional imaging by a microscope,”J. Opt. Soc.Amer. A, vol. 2, no. 2, pp. 121–127, 1985.
[14] M. Turk and A. Pentland, “Eigenfaces for recognition,”J. Cog. Neu-rosci., vol. 3, no. 1, pp. 71–86, 1991.
[15] W. Press, S. Teukolsky, W. Vetterling, and B. Flannery,NumericalRecipes in C, 2 ed. Cambridge, U.K.: Cambridge Univ. Press, 1992.
Farhana Kagalwala received the B.S. degree fromUniversity of Michigan, Ann Arbor in 1993, and thePh.D. degree in electrical and computer engineeringfrom Carnegie Mellon University, Pittsburgh, PA, in2001.
Currently, she is working at the Advanced ImageryLab at General Atomics, San Diego, CA. As part ofher thesis, in addition to the present work, she de-veloped a model of the image formation process ina differential interference contrast (DIC) microscopewhich went beyond the first Born approximation. Her
approach to extracting volumetric and shape properties from a set of images usesthe sensor physics as an integral part of the reconstruction process. In general,her research interests are computer vision, graphical models, and heirarchicalmethods.
Takeo Kanade(F’92) received the Ph.D. degree in electrical engineering fromKyoto University, Japan, in 1974.
After being on the Faculty of the Department of Information Science, KyotoUniversity, he joined the Computer Science Department and Robotics Insti-tute at Carnegie Mellon University (CMU), Pittsburgh, PA, in 1980. He be-came an Associate Professor in 1982, a Full Professor in 1985, the U.A. andHelen Whitaker Professor in 1993, and a University Professor in 1998. He wasthe Director of the Robotics Institute from 1992 to Spring 2001. He served asthe founding Chairman from 1989 to 1993 of the Robotics Ph.D. Program atCMU, probably the first of its kind in the world. He has worked in many areasof robotics, including manipulators, sensors, computer vision, multimedia ap-plications, and autonomous robots, with more than 200 papers on these topics.He has been the founding editor of theInternational Journal of Computer Vi-sion. His research interests are in the areas of computer vision, visual and mul-timedia technology, and robotics. Common themes that his students and he em-phasize in performing research are the formulation of sound theories which usethe physical, geometrical, and semantic properties involved in perceptual andcontrol processes in order to create intelligent machines, and the demonstrationof the working systems based on these theories. His current projects includebasic research and system development in computer vision (motion, stereo andobject recognition), recognition of facial expressions, virtual(ized) reality, con-tent-based video and image retrieval, VLSI-based computational sensors, med-ical robotics, and an autonomous helicopter.
Dr. Kanade’s professional honors include: election to the National Academyof Engineering, a Fellow of ACM, a Fellow of American Association of Ar-tificial Intelligence; several awards including C&C Award, the Joseph Engel-berger Award, Yokogawa Prize, JARA Award, Otto Franc Award, and Marr PrizeAward.
Copyright © 2022 FDOKUMEN