Pressureless sintering and mechanical properties of mica ...
Upload
independentCategory
view
2download
0
A
paI(owtwfcm©
K
1
ali
j(p
G
v
0d
Journal of Membrane Science 284 (2006) 198–204
Potentialities of confocal fluorescence for investigating proteinadsorption on mica and in ultrafiltration membranes
Sebastien Balme a,1, Jean-Marc Janot a, Philippe Dejardin b,∗,Elena N. Vasina b,2, Patrick Seta a
a European Membrane Institute, UMR 5635 (CNRS, ENSCM, UM2), IEM–CNRS, 1919 route de Mende, F-34293 Montpellier Cedex 5, Franceb European Membrane Institute, UMR 5635 (CNRS, ENSCM, UM2), IEM–Universite Montpellier 2, CC047,
2 Place Eugene Bataillon, F-34095 Montpellier Cedex 5, France
Received 21 April 2006; received in revised form 10 July 2006; accepted 23 July 2006Available online 31 July 2006
bstract
In conditions of tangential flow, the confocal fluorescence technique is applied to the determination of the concentration profile of a fluorescentrotein in the direction normal to a sheet of mica and to the surface of sulfonated membrane (AN69®; acrylonitrile–methallylsulfonate copolymer) asfunction of time. The penetration of the protein inside the nanoporous membrane with its large area available for adsorption is put into evidence.
n addition, by means of the time resolved fluorescence technique in the confocal configuration, we compared the photophysical propertiesfluorescence lifetime and correlation time) of the adsorbed labelled protein with those of the same protein in solution: (i) the fluorescence lifetimef the labelled protein in solution (4.1 ns) was found to be unchanged (4.0 ns) when adsorbed on the membrane and significantly smaller (3.2 ns)hen adsorbed on mica, suggesting on the latter surface some quenching due to protein–surface or protein–protein interactions; (ii) the correlation
ime determined on both surfaces, mica and membrane, was found very large (>300 ns) with respect to the value in solution (33 ns). As the labellingas performed in such a way that the rotational motion of the label corresponded to that of the protein, these results exhibited the low rotational
reedom of the protein in its adsorbed state. As a summary this technique should be helpful to characterize the membrane functioning underonditions similar to those encountered in applications, by the determination of both concentration profile as a function of time and rotationalobility.2006 Elsevier B.V. All rights reserved.
e; M
acf
eywords: Confocal fluorescence; Protein adsorption; Ultrafiltration; Membran
. Introduction
Protein–protein and protein–surface interactions at interfaces
re important in transfer processes through synthetic and bio-ogical membranes [1], manufacturing biosensors for proteindentification [2,3], health and environmental sciences, e.g. prion∗ Corresponding author. Tel.: +33 467 14 91 21; fax: +33 467 14 91 19.E-mail addresses: [email protected] (S. Balme),
[email protected] (J.-M. Janot), [email protected]. Dejardin), [email protected] (E.N. Vasina),[email protected] (P. Seta).1 Present address: Laboratoire de Spectrometrie de Masse, Universite deeneve, Sciences 1, 16 Boulevard d’Yvoy, 1211 Geneve 4, Switzerland.2 Present address: Department of Chemical Engineering, Loughborough Uni-
ersity, Loughborough, Leicestershire LE11 3TU, UK.
[at[spfIicosn
376-7388/$ – see front matter © 2006 Elsevier B.V. All rights reserved.oi:10.1016/j.memsci.2006.07.034
ica
dsorption in soils [4]. The analysis of such interactions pro-esses requires data on interfacial concentration, protein con-ormation [5–7] and dynamic behaviour of proteins at interfaces8]. Some experimental techniques are particularly adapted fordsorption studies on flat surfaces. Small angle neutron scat-ering (SANS) [9,10], reflectometry [11–14] and ellipsometry15–18] help in characterizing in situ the orientations of ellip-oid proteins at interfaces. Atomic force microscopy (AFM) canrovide the spatial distribution of proteins on a flat smooth sur-ace, the tapping mode being required in liquid medium [19,20].n addition to interfacial concentration of proteins, the totalnternal reflection fluorescence (TIRF) technique with fluores-
ent labels sensitive to electric potential gives some clues aboutrientation of adsorbed proteins. This is possible when Debyecreening length and protein size are of the same order of mag-itude [21–23]. Attenuated total reflection–Fourier transform
bran
imflv
taambbaorogiotupkmiob
mcfutetsbbtwasas
alomtagowmiet
2
2
flOipNetct[1a
tRt
2
FcSmHhf(i
2
T(3mt(ptbt6flooa
S. Balme et al. / Journal of Mem
nfra red absorption (ATR–FTIR) is helpful to characterize inter-olecular interactions and protein conformational changes atat interfaces with respect to their state in solution [5], like theariation of the �-helix and �-sheet contents.
When we consider using one of those techniques for indus-rial application membranes, the choice is very limited. First ofll, such membranes often are not models of flat surfaces. Inddition, experimental conditions required for the techniquesight be very different from conditions required in actual mem-
rane application processes. Our aim is to investigate the mem-rane functioning in conditions as close as possible to theirctual ones in the application, like for instance in the studyf adsorption of radio-labelled proteins detected directly ineduced hollow fibre modules [24–27]. Moreover, radioactiver fluorescent labels are especially useful when one investi-ates adsorption from mixtures of proteins. The fluorescencemaging is largely used in studies on cells to detect the passagef fluorescently labelled molecules from internal compartmento external one or vice-versa through the cell membrane. Theptake of fluorescence-labelled proteins into porous stationaryhases used in chromatography [28–30] is relevant to the sameind of process and was analyzed by confocal scanning lasericroscopy with a horizontal scanning. It would be interest-
ng to perform the same kind of study about protein motionr trapping within industrial membranes used for instance inioseparation.
If we consider filtration with tangential flow along a flatembrane, the question is: how to determine the protein con-
entration profile in solution and inside the membrane as aunction of time? If the membrane is transparent, one way is tose the confocal fluorescence microscopy with scanning normalo the plane of the membrane. We present here the home-builtxperimental set up with short illustrations relative to the sys-em avidin/mica as an example of protein adsorption on a flaturface, on one hand, and to the system avidin/AN69 mem-rane, on the other hand. The choice of avidin was motivatedy its high structural stability, linked to its high �-sheet con-ent [31]. Therefore, avidin can be classified as a “hard” proteinhich should present only minor conformational changes upon
dsorption [32]. Moreover, the protein presents four equivalentpecific biotin sites which may be used for fluorescent labellingnd one single correlation time due to its almost sphericalhape [33].
In addition, the time resolved fluorescence and fluorescencenisotropy studies lead to the determination of fluorescenceifetime, generally sensitive to physico-chemical modificationsf environment, and correlation (rotational) time of the chro-ophore. The latter parameter is particularly useful as it charac-
erizes the degree of rotational freedom of the adsorbed protein,s far as the fluorescent label motion is really an image of thelobular protein motion. This important point was verified previ-usly [33] for the fluorescently labelled avidin used in the presentork. We could perform fluorescence anisotropy and lifetime
easurements in the confocal configuration, and thus comparedn situ the protein rotational mobilities and the chromophorenvironments in solution, on one hand, and when adsorbed onhe membrane or on mica, on the other hand.
9ltb
e Science 284 (2006) 198–204 199
. Experimental
.1. Protein solutions
The labelling of avidin (Fluka, No. 11368) with Alexa-uor-594 (Labelling kit A10239, Molecular Probes, Eugene,R) via biotin-ethylenediamine hydrobromide (Sigma B9181)
s described elsewhere [33]. Protein solutions (75 nM) were pre-ared in 10 mM sodium phosphate buffer pH 7.4 with 0.15 MaCl in de-ionized water (MilliQ system, Millipore). We can
xpect attractive electrostatic interactions between the nega-ively charged membrane or mica and the globally positivelyharged protein (pI = 10.4) [34] at pH 7.4. Avidin is a glycopro-ein [35] with a molecular weight of 66,000 g mol−1, dimensions31] 5.6 nm × 5.0 nm × 4.6 nm, and is composed of 4 identical28 amino-acids subunits [36]. The experiments were performedt T = 19 ◦C.
The radio-labelling of avidin with 125I was carried out viahe technique of Iodobeads® (Pierce) with Na125I (Amersham).emoval of free iodide was performed by dialysis. Details of
he technique can be found elsewhere [37].
.2. Mica and adsorbing membrane
Mica was purchased from Metafix SA (Montdidier,rance) as 8 cm × 1 cm (radioactivity) or 5 cm × 2 cm (fluores-ence) sheets. Mica was freshly cleaved before experiment.ulfonated hemodialysis membrane AN69® (acrylonitrile–ethallylsulfonate copolymer) was kindly provided by Gambro-ospal (Meyzieu, France). The membrane thickness is 20 �m. Itas a large pore size distribution between 2 and 10 nm, and there-ore should be able to adsorb some avidin in its core. Both micaζ = −38 mV in 10−2 M NaCl) [38] and membrane (ζ = −89 mVn 10−2 M NaCl) [39] are highly negatively charged supports.
.3. Optical device
The experimental setup is schematically represented in Fig. 1.he excitation wavelength was provided by a cavity dumped
Spectra Physics 344) rhodamine 6G dye laser (Spectra Physics75) that was synchronously pumped by the 82 MHz output of aode locked argon ion laser (Spectra Physics 2030). The excita-
ion pulse duration is estimated for such a device at about 20 psFull-width half-maximum (FWHM)). The linearly (vertically)olarised excitation light beam is focused on a pinhole of diame-er 25 �m by the lens F1 (focal length f1 = 12 mm) and expandedy F2 (f2 = 152.4 mm) in order to cover the entire aperture ofhe water immersion microscope objective (Olympus UPlanApo0×/1.2w). This type of objective requires to positioning theow cell horizontally and using a mirror: the relative orientationsf cell and beam polarisation are shown in Fig. 2. The emissionf fluorescence collected through the same objective and sep-rated from the excitation light by a dichroic mirror (Omega
3/XF2023) is focused at the diffraction limit by the achromaticens F3 (f3 = 76.4 mm) on the confocal pinhole (15 �m diame-er). The spatially filtered light is then re-collimated in a paralleleam by the lens F4 (f4 = 10 mm) to form a parallel beam pass-
200 S. Balme et al. / Journal of Membrane Science 284 (2006) 198–204
of the
iptofrliIpatse
Ftv
2l
t(isia
Fig. 1. Scheme
ng through a motorised polariser used to select the emissionolarisation and a band pass filter to remove the remaining exci-ation light. Finally the light is focused on the photocathodef a photomultiplier tube (PM) (Hamamatsu H7313) optimizedor photon counting experiments. The energy collected for theeflected beam at the bottom of the cell during normal scanningeads to a peak of width around 1.2 �m (FWHM). The measurednstrument response time is limited by the use of a PM tube.t has been estimated around 160 ps (FWHM). The excitationump profile P(t) has been recorded from the beam reflected bymirror introduced between the dichroic mirror and the objec-
ive. In order to minimize the energy of the excitation pulse ando to avoid photo-bleaching or photo-degradation effects, thexcitation frequency of the laser was set to 4 MHz.
ig. 2. Excitation polarisation is vertical before reflection of the beam towardshe immersion objective, where it becomes horizontal and parallel to the fluidelocity field. The objective is immersed in water above the microscope slide.
2fl
acwcmw�
lmcmo
2
t
optical device.
.4. Method to measure anisotropy decay and fluorescenceifetime
The experimental decays, Im(t), I//(t) and I⊥(t) were sequen-ially collected with the motorised polariser set to magic angle54.73◦), parallel and perpendicular polarisation, respectively,n regard to the polarisation of the excitation. It was not neces-ary in the range of wavelength we used for the experiments, tontroduce a correction factor for the transmission of the parallelnd perpendicularly polarised light through the optical setup.
.5. Method for determination of the surface and solutionuorescence by normal scanning
For the determination of the concentration profiles in solutionnd the fluorescence of the adsorbed proteins, the emission wasollected through the polariser set at the magic angle (54.73◦)ith respect to the excitation polarisation for membrane, and
ollected without polariser for mica. Scanning normal to theembrane or mica surface was performed by moving the cellith a stepping motor. The minimum displacement available isz = 50 nm (one motor step). In these conditions a 50 �m scan
asts approximately 1 min. Obviously this is only an order ofagnitude as it depends on the emission intensity and on the
hosen space discretisation. We usually chose 5.0 �m displace-ent steps far from the adsorbing material down to a few hundred
f nanometers close to the material/solution interface.
.6. Time resolved fluorescence
In order to obtain significant information about protein rota-ional diffusion coefficient we need to determine the fluores-
brane Science 284 (2006) 198–204 201
cpmttato
etrwdca
s
r
wfflch
wia
θ
wp
i
i
o
s
r
wo(
d
I
Fwe
I
I
wp
aeIat[afw
2
fl
tatftaid
3
3
pdam
S. Balme et al. / Journal of Mem
ence lifetime of the fluorescent probe being attached to therotein. As explained previously [33], the labelling was opti-ized to exhibit a high quantum yield with one single correlation
ime linked to protein rotation, and one single fluorescence life-ime linked to its molecular environment. These characteristicsvoid the problems of data interpretation and sensitivity detec-ion arising with the multiple lifetimes and low quantum yieldf the tryptophans intrinsic fluorescence [40].
Lifetimes and correlation times were extracted from thexperimental decay curves by means of a program usinghe Levenberg–Marquardt algorithm [41]. Assuming a linearesponse of the apparatus, the experimental decay curves F(t)ere fitted by convolution [42] of a calculated fluorescenceecay f(t) with the excitation pump profile P(t). The fluores-ence decay law s(t) and the anisotropy decay law r(t) werenalyzed as sums of exponentials [43]:
(t) =n∑
i=1
αi exp
( −t
τFi
)(1)
(t) = r0
m∑j=1
βj exp
( −t
θj
)(2)
here τFi is the fluorescence lifetime, αi the pre-exponentialactor related to the contribution of the compound i to the totaluorescence, r0 the limiting anisotropy and βj is the fractionalontribution to the total depolarisation attributed to species javing a rotational correlation time θj.
For a spherical molecule, r(t) decays mono-exponentiallyith one correlation time θ directly proportional to the viscos-
ty η of the medium and the volume V of the rotating moleculeccording to the Stokes–Einstein [44] relationship:
= ηV
kBT(3)
here kB is the Boltzmann constant and T is the absolute tem-erature.
s(t) and r(t) are related to the emission by the relations:
//(t) = 13 s(t)[1 + 2r(t)] (4)
⊥(t) = 13 s(t)[1 − r(t)] (5)
r,
(t) = im(t) = i//(t) + 2i⊥(t) (6)
(t) = i//(t) − i⊥(t)
i//(t) + 2i⊥(t)(7)
here i//(t), i⊥(t) and im(t) means the intensity of fluorescencef light polarised parallel, perpendicular and at magic angle54.73◦) with respect to the excitation polarisation, respectively.
As depolarisation effects [45] are avoided at magic angle, the
etermination of τFi values in such condition is straightforward.The corresponding experimental decays are expressed as:
//(t) = P(t) ∗{
13 s(t)[1 + 2r(t)]
}(8)
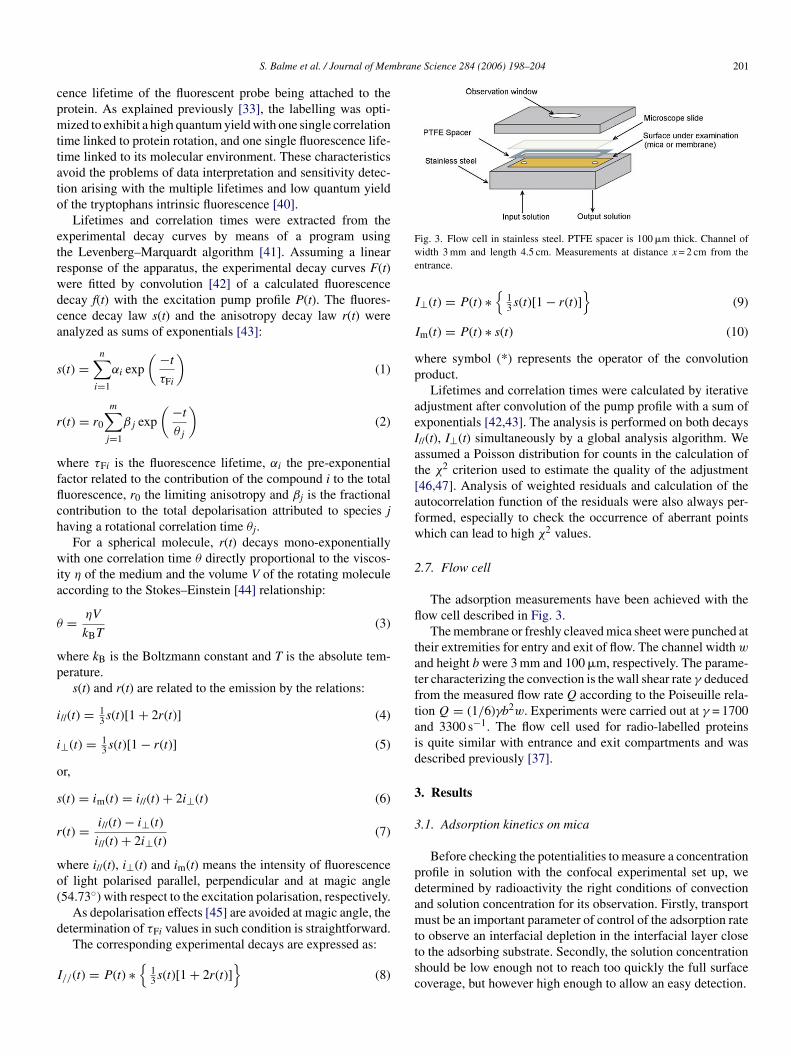
ttsc
ig. 3. Flow cell in stainless steel. PTFE spacer is 100 �m thick. Channel ofidth 3 mm and length 4.5 cm. Measurements at distance x = 2 cm from the
ntrance.
⊥(t) = P(t) ∗{
13 s(t)[1 − r(t)]
}(9)
m(t) = P(t) ∗ s(t) (10)
here symbol (*) represents the operator of the convolutionroduct.
Lifetimes and correlation times were calculated by iterativedjustment after convolution of the pump profile with a sum ofxponentials [42,43]. The analysis is performed on both decays//(t), I⊥(t) simultaneously by a global analysis algorithm. Wessumed a Poisson distribution for counts in the calculation ofhe χ2 criterion used to estimate the quality of the adjustment46,47]. Analysis of weighted residuals and calculation of theutocorrelation function of the residuals were also always per-ormed, especially to check the occurrence of aberrant pointshich can lead to high χ2 values.
.7. Flow cell
The adsorption measurements have been achieved with theow cell described in Fig. 3.
The membrane or freshly cleaved mica sheet were punched atheir extremities for entry and exit of flow. The channel width w
nd height b were 3 mm and 100 �m, respectively. The parame-er characterizing the convection is the wall shear rate γ deducedrom the measured flow rate Q according to the Poiseuille rela-ion Q = (1/6)γb2w. Experiments were carried out at γ = 1700nd 3300 s−1. The flow cell used for radio-labelled proteinss quite similar with entrance and exit compartments and wasescribed previously [37].
. Results
.1. Adsorption kinetics on mica
Before checking the potentialities to measure a concentrationrofile in solution with the confocal experimental set up, weetermined by radioactivity the right conditions of convectionnd solution concentration for its observation. Firstly, transportust be an important parameter of control of the adsorption rate
o observe an interfacial depletion in the interfacial layer closeo the adsorbing substrate. Secondly, the solution concentrationhould be low enough not to reach too quickly the full surfaceoverage, but however high enough to allow an easy detection.
2 brane Science 284 (2006) 198–204
swtataiDsefd1dtiScwtp
Ftoacwtuwf
fweith
Fpγ
t
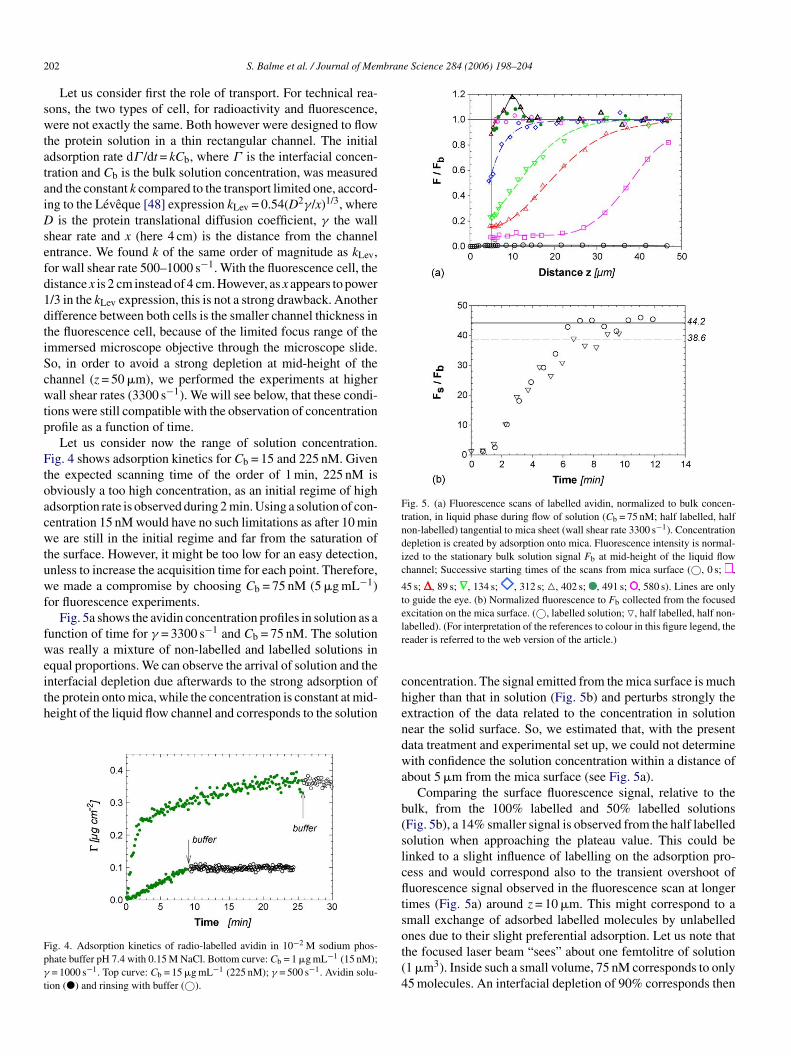
Fig. 5. (a) Fluorescence scans of labelled avidin, normalized to bulk concen-tration, in liquid phase during flow of solution (Cb = 75 nM; half labelled, halfnon-labelled) tangential to mica sheet (wall shear rate 3300 s−1). Concentrationdepletion is created by adsorption onto mica. Fluorescence intensity is normal-ized to the stationary bulk solution signal Fb at mid-height of the liquid flowchannel; Successive starting times of the scans from mica surface (©, 0 s; ,
45 s; , 89 s; , 134 s; , 312 s; �, 402 s; , 491 s; , 580 s). Lines are onlyto guide the eye. (b) Normalized fluorescence to Fb collected from the focusedexcitation on the mica surface. (©, labelled solution; �, half labelled, half non-lr
02 S. Balme et al. / Journal of Mem
Let us consider first the role of transport. For technical rea-ons, the two types of cell, for radioactivity and fluorescence,ere not exactly the same. Both however were designed to flow
he protein solution in a thin rectangular channel. The initialdsorption rate dΓ /dt = kCb, where Γ is the interfacial concen-ration and Cb is the bulk solution concentration, was measurednd the constant k compared to the transport limited one, accord-ng to the Leveque [48] expression kLev = 0.54(D2γ/x)1/3, where
is the protein translational diffusion coefficient, γ the wallhear rate and x (here 4 cm) is the distance from the channelntrance. We found k of the same order of magnitude as kLev,or wall shear rate 500–1000 s−1. With the fluorescence cell, theistance x is 2 cm instead of 4 cm. However, as x appears to power/3 in the kLev expression, this is not a strong drawback. Anotherifference between both cells is the smaller channel thickness inhe fluorescence cell, because of the limited focus range of themmersed microscope objective through the microscope slide.o, in order to avoid a strong depletion at mid-height of thehannel (z = 50 �m), we performed the experiments at higherall shear rates (3300 s−1). We will see below, that these condi-
ions were still compatible with the observation of concentrationrofile as a function of time.
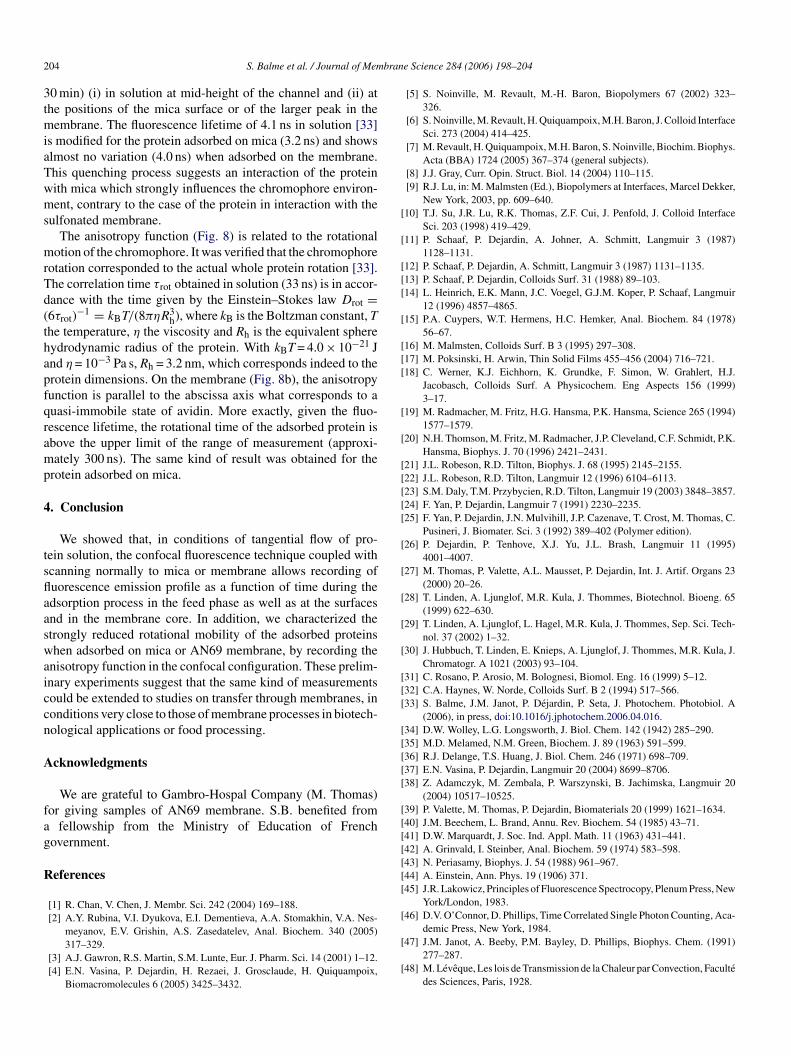
Let us consider now the range of solution concentration.ig. 4 shows adsorption kinetics for Cb = 15 and 225 nM. Given
he expected scanning time of the order of 1 min, 225 nM isbviously a too high concentration, as an initial regime of highdsorption rate is observed during 2 min. Using a solution of con-entration 15 nM would have no such limitations as after 10 mine are still in the initial regime and far from the saturation of
he surface. However, it might be too low for an easy detection,nless to increase the acquisition time for each point. Therefore,e made a compromise by choosing Cb = 75 nM (5 �g mL−1)
or fluorescence experiments.Fig. 5a shows the avidin concentration profiles in solution as a
unction of time for γ = 3300 s−1 and Cb = 75 nM. The solutionas really a mixture of non-labelled and labelled solutions in
qual proportions. We can observe the arrival of solution and the
nterfacial depletion due afterwards to the strong adsorption ofhe protein onto mica, while the concentration is constant at mid-eight of the liquid flow channel and corresponds to the solutionig. 4. Adsorption kinetics of radio-labelled avidin in 10−2 M sodium phos-hate buffer pH 7.4 with 0.15 M NaCl. Bottom curve: Cb = 1 �g mL−1 (15 nM);= 1000 s−1. Top curve: Cb = 15 �g mL−1 (225 nM); γ = 500 s−1. Avidin solu-
ion (�) and rinsing with buffer (©).
chendwa
b(slcfltsot(4
abelled). (For interpretation of the references to colour in this figure legend, theeader is referred to the web version of the article.)
oncentration. The signal emitted from the mica surface is muchigher than that in solution (Fig. 5b) and perturbs strongly thextraction of the data related to the concentration in solutionear the solid surface. So, we estimated that, with the presentata treatment and experimental set up, we could not determineith confidence the solution concentration within a distance of
bout 5 �m from the mica surface (see Fig. 5a).Comparing the surface fluorescence signal, relative to the
ulk, from the 100% labelled and 50% labelled solutionsFig. 5b), a 14% smaller signal is observed from the half labelledolution when approaching the plateau value. This could beinked to a slight influence of labelling on the adsorption pro-ess and would correspond also to the transient overshoot ofuorescence signal observed in the fluorescence scan at longer
imes (Fig. 5a) around z = 10 �m. This might correspond to amall exchange of adsorbed labelled molecules by unlabellednes due to their slight preferential adsorption. Let us note that
he focused laser beam “sees” about one femtolitre of solution1 �m3). Inside such a small volume, 75 nM corresponds to only5 molecules. An interfacial depletion of 90% corresponds then
S. Balme et al. / Journal of Membrane Science 284 (2006) 198–204 203
Fmw
tdic
3
eat2foTbtTmdmcs3
os1ocadflm
3a
a
Fig. 7. Fluorescence signal of labelled avidin as a function of time, frombbt
(correlation) time of the labelled protein at any position in solu-tion, in the transparent membrane or on a flat surface like mica.After the last scan and without flow we measured the fluores-cence lifetime and the correlation time (accumulating data over
ig. 6. Fluorescence scan F(z,t) in solution and inside the sulfonated AN69embrane for adsorption of labelled avidin in 10−2 M sodium phosphate bufferith 0.15 M NaCl. Cb = 75 nM (5 �g mL−1); wall shear rate γ ≈ 1700 s−1.
o 4–5 molecules/�m3, which was about the lowest confidentetection level shown here with an accumulation time compat-ble with the total exploration time of the half thickness of thehannel during the adsorption process.
.2. Adsorption kinetics on AN69 membrane
The previous conditions for adsorption onto mica arexpected to remain valid for the adsorption onto the highly neg-tive AN69 membrane [39]. As the membrane is transparent,he scanning can be performed inside the membrane which is0 �m thick. Fig. 6 shows the fluorescence scans versus timeor γ ≈ 1700 s−1 and Cb = 75 nM. The increasing accumulationf avidin at the membrane/solution interface is put in evidence.he same is unexpectedly observed for the other side of the mem-rane, suggesting that solution might have flown also betweenhe cell bottom and the membrane due to not perfect mounting.he total scanning domain was close to 50 �m, including theembrane thickness of 20 �m, what really corresponds to the
istance between the peaks of interfacial fluorescence. The nor-alization to the bulk solution signal was not possible as in the
ase of mica experiments, the available area for adsorption beingo huge than even after 40 min, the solution was still depleted at0 �m distance from the membrane surface.
We represented in Fig. 7 the variation with time of the flu-rescence signal in solution at 13 �m outside the membraneurface, at the membrane/solution interface (larger peak) and at3 �m inside the membrane. There is penetration and adsorptionf avidin inside the membrane, as the intensity of the fluores-ence signal is much higher than in solution. The continuousdsorption in the membrane maintains solution depletion overelays as long as at least 35 min, contrary to observation withat non-porous mica where the available area for adsorption isuch smaller.
.3. Fluorescence lifetime and rotational mobility of
dsorbed labelled avidinThe time resolved fluorescence confocal experimental setupllows determining the fluorescence lifetime and the rotational
F(
ottom to top: in solution ( ), inside the membrane ( ), at the AN69 mem-rane/solution interface ( ). (For interpretation of the references to colour inhis figure legend, the reader is referred to the web version of the article.)
ig. 8. Depolarisation decay r(t) of the fluorescently labelled avidin in solutiona), and adsorbed in the membrane at the interface with solution (b).
2 bran
3tmiaTwms
mrTd(thapfqramp
4
tsflaaswaiccn
A
fag
R
[
[
[[[
[
[[[
[
[
[[[[[
[
[
[
[
[
[[[
[[[[[
[[[[[[[
[
04 S. Balme et al. / Journal of Mem
0 min) (i) in solution at mid-height of the channel and (ii) athe positions of the mica surface or of the larger peak in the
embrane. The fluorescence lifetime of 4.1 ns in solution [33]s modified for the protein adsorbed on mica (3.2 ns) and showslmost no variation (4.0 ns) when adsorbed on the membrane.his quenching process suggests an interaction of the proteinith mica which strongly influences the chromophore environ-ent, contrary to the case of the protein in interaction with the
ulfonated membrane.The anisotropy function (Fig. 8) is related to the rotational
otion of the chromophore. It was verified that the chromophoreotation corresponded to the actual whole protein rotation [33].he correlation time τrot obtained in solution (33 ns) is in accor-ance with the time given by the Einstein–Stokes law Drot =6τrot)−1 = kBT/(8πηR3
h), where kB is the Boltzman constant, The temperature, η the viscosity and Rh is the equivalent sphereydrodynamic radius of the protein. With kBT = 4.0 × 10⁻²¹ Jnd η = 10−3 Pa s, Rh = 3.2 nm, which corresponds indeed to therotein dimensions. On the membrane (Fig. 8b), the anisotropyunction is parallel to the abscissa axis what corresponds to auasi-immobile state of avidin. More exactly, given the fluo-escence lifetime, the rotational time of the adsorbed protein isbove the upper limit of the range of measurement (approxi-ately 300 ns). The same kind of result was obtained for the
rotein adsorbed on mica.
. Conclusion
We showed that, in conditions of tangential flow of pro-ein solution, the confocal fluorescence technique coupled withcanning normally to mica or membrane allows recording ofuorescence emission profile as a function of time during thedsorption process in the feed phase as well as at the surfacesnd in the membrane core. In addition, we characterized thetrongly reduced rotational mobility of the adsorbed proteinshen adsorbed on mica or AN69 membrane, by recording the
nisotropy function in the confocal configuration. These prelim-nary experiments suggest that the same kind of measurementsould be extended to studies on transfer through membranes, inonditions very close to those of membrane processes in biotech-ological applications or food processing.
cknowledgments
We are grateful to Gambro-Hospal Company (M. Thomas)or giving samples of AN69 membrane. S.B. benefited from
fellowship from the Ministry of Education of Frenchovernment.
eferences
[1] R. Chan, V. Chen, J. Membr. Sci. 242 (2004) 169–188.[2] A.Y. Rubina, V.I. Dyukova, E.I. Dementieva, A.A. Stomakhin, V.A. Nes-
meyanov, E.V. Grishin, A.S. Zasedatelev, Anal. Biochem. 340 (2005)317–329.
[3] A.J. Gawron, R.S. Martin, S.M. Lunte, Eur. J. Pharm. Sci. 14 (2001) 1–12.[4] E.N. Vasina, P. Dejardin, H. Rezaei, J. Grosclaude, H. Quiquampoix,
Biomacromolecules 6 (2005) 3425–3432.
[
[
e Science 284 (2006) 198–204
[5] S. Noinville, M. Revault, M.-H. Baron, Biopolymers 67 (2002) 323–326.
[6] S. Noinville, M. Revault, H. Quiquampoix, M.H. Baron, J. Colloid InterfaceSci. 273 (2004) 414–425.
[7] M. Revault, H. Quiquampoix, M.H. Baron, S. Noinville, Biochim. Biophys.Acta (BBA) 1724 (2005) 367–374 (general subjects).
[8] J.J. Gray, Curr. Opin. Struct. Biol. 14 (2004) 110–115.[9] R.J. Lu, in: M. Malmsten (Ed.), Biopolymers at Interfaces, Marcel Dekker,
New York, 2003, pp. 609–640.10] T.J. Su, J.R. Lu, R.K. Thomas, Z.F. Cui, J. Penfold, J. Colloid Interface
Sci. 203 (1998) 419–429.11] P. Schaaf, P. Dejardin, A. Johner, A. Schmitt, Langmuir 3 (1987)
1128–1131.12] P. Schaaf, P. Dejardin, A. Schmitt, Langmuir 3 (1987) 1131–1135.13] P. Schaaf, P. Dejardin, Colloids Surf. 31 (1988) 89–103.14] L. Heinrich, E.K. Mann, J.C. Voegel, G.J.M. Koper, P. Schaaf, Langmuir
12 (1996) 4857–4865.15] P.A. Cuypers, W.T. Hermens, H.C. Hemker, Anal. Biochem. 84 (1978)
56–67.16] M. Malmsten, Colloids Surf. B 3 (1995) 297–308.17] M. Poksinski, H. Arwin, Thin Solid Films 455–456 (2004) 716–721.18] C. Werner, K.J. Eichhorn, K. Grundke, F. Simon, W. Grahlert, H.J.
Jacobasch, Colloids Surf. A Physicochem. Eng Aspects 156 (1999)3–17.
19] M. Radmacher, M. Fritz, H.G. Hansma, P.K. Hansma, Science 265 (1994)1577–1579.
20] N.H. Thomson, M. Fritz, M. Radmacher, J.P. Cleveland, C.F. Schmidt, P.K.Hansma, Biophys. J. 70 (1996) 2421–2431.
21] J.L. Robeson, R.D. Tilton, Biophys. J. 68 (1995) 2145–2155.22] J.L. Robeson, R.D. Tilton, Langmuir 12 (1996) 6104–6113.23] S.M. Daly, T.M. Przybycien, R.D. Tilton, Langmuir 19 (2003) 3848–3857.24] F. Yan, P. Dejardin, Langmuir 7 (1991) 2230–2235.25] F. Yan, P. Dejardin, J.N. Mulvihill, J.P. Cazenave, T. Crost, M. Thomas, C.
Pusineri, J. Biomater. Sci. 3 (1992) 389–402 (Polymer edition).26] P. Dejardin, P. Tenhove, X.J. Yu, J.L. Brash, Langmuir 11 (1995)
4001–4007.27] M. Thomas, P. Valette, A.L. Mausset, P. Dejardin, Int. J. Artif. Organs 23
(2000) 20–26.28] T. Linden, A. Ljunglof, M.R. Kula, J. Thommes, Biotechnol. Bioeng. 65
(1999) 622–630.29] T. Linden, A. Ljunglof, L. Hagel, M.R. Kula, J. Thommes, Sep. Sci. Tech-
nol. 37 (2002) 1–32.30] J. Hubbuch, T. Linden, E. Knieps, A. Ljunglof, J. Thommes, M.R. Kula, J.
Chromatogr. A 1021 (2003) 93–104.31] C. Rosano, P. Arosio, M. Bolognesi, Biomol. Eng. 16 (1999) 5–12.32] C.A. Haynes, W. Norde, Colloids Surf. B 2 (1994) 517–566.33] S. Balme, J.M. Janot, P. Dejardin, P. Seta, J. Photochem. Photobiol. A
(2006), in press, doi:10.1016/j.jphotochem.2006.04.016.34] D.W. Wolley, L.G. Longsworth, J. Biol. Chem. 142 (1942) 285–290.35] M.D. Melamed, N.M. Green, Biochem. J. 89 (1963) 591–599.36] R.J. Delange, T.S. Huang, J. Biol. Chem. 246 (1971) 698–709.37] E.N. Vasina, P. Dejardin, Langmuir 20 (2004) 8699–8706.38] Z. Adamczyk, M. Zembala, P. Warszynski, B. Jachimska, Langmuir 20
(2004) 10517–10525.39] P. Valette, M. Thomas, P. Dejardin, Biomaterials 20 (1999) 1621–1634.40] J.M. Beechem, L. Brand, Annu. Rev. Biochem. 54 (1985) 43–71.41] D.W. Marquardt, J. Soc. Ind. Appl. Math. 11 (1963) 431–441.42] A. Grinvald, I. Steinber, Anal. Biochem. 59 (1974) 583–598.43] N. Periasamy, Biophys. J. 54 (1988) 961–967.44] A. Einstein, Ann. Phys. 19 (1906) 371.45] J.R. Lakowicz, Principles of Fluorescence Spectrocopy, Plenum Press, New
York/London, 1983.46] D.V. O’Connor, D. Phillips, Time Correlated Single Photon Counting, Aca-
demic Press, New York, 1984.47] J.M. Janot, A. Beeby, P.M. Bayley, D. Phillips, Biophys. Chem. (1991)
277–287.48] M. Leveque, Les lois de Transmission de la Chaleur par Convection, Faculte
des Sciences, Paris, 1928.
Copyright © 2022 FDOKUMEN