A Temporal Agent Communication Language for Dynamic Multi-agent Systems
Upload
khangminh22Category
view
2download
0
Use of surveys and agent-based modelling to assess the management
implications of the behaviours of
specialised recreational boat fishers
Image supplied by my very talented god daughter Trinity Barrett, age 6.
by
Calais Jaye Tink
This thesis is presented for the degree of Doctor of Philosophy of
Murdoch University
2015
B.Sc. (Hons)
Murdoch University, Western Australia


I declare that this thesis is my own account of my research
and contains as its main content work which has not
previously been submitted for a degree at any university.
----------------------
Calais Jaye Tink

Abstract
This PhD study employed two fisheries surveys and an agent-based model to
characterise, in the context of specialisation theory, the behaviours and motivations
of non-avid and avid fishers among a diverse group of recreational boat fishers.
Broadly, specialisation theory, which relates to the field of human dimensions
research, dictates that groups of recreational fishers fit along a continuum of
behaviour or ‘specialisation’, from occasional, novice fishers to avid and highly-
experienced fishing specialists. Furthermore, this theory considers that fishers may
be characterised according to such attributes as frequency of participation, species
targeted, fishing locations and fishing gears, motivations for going fishing,
preferences for resource management, as well as various other attributes.
In one survey, a sample of recreational fishers living near Perth, in Western
Australia, was randomly-selected from a database containing details of recreational
fishing boat licence holders in that state. Selected anglers were interviewed by
phone using the Computer Assisted Telephone Interviewing (CATI) technique.
Fishers were chracterised as either non-avid or avid, based on levels of
participation rates, an approach consistent with many fisheries surveys. The phone
survey demonstrated that Perth boat fishers are typically male, often 45-59 y and
mainly target inshore, easy-to-catch ‘bread and butter’ species, such as whiting
species and Australian herring. Anglers typically use rod and lines for fishing and
often revisit areas in which they have experienced previous fishing success.
Ownership of Global Positioning Satellite (GPS) systems was high among all
surveyed boat fishers. However, compared with non-avid fishers, avid fishers were,
as hypothesised according to specialisation theory, more likely to use these devices
for storing fishing locations (and also for storing a greater number of locations
compared to non-avid fishers). Moreover, as hypothesised, avid fishers were more
likely than non-avid fishers to go fishing on a normal weekday rather than on a
weekend or public holiday, presumably to avoid periods of congestion at boat
ramps.
Unlike most fisheries surveys, those undertaken for this study asked a range
of questions relating to movements of boat fishers when fishing. Surveyed fishers
generally travelled small distances offshore (< 5 km), visited few fishing locations
(≤ 4), and typically moved ≤ 3 km between their first and second fishing location,
usually moving because they were not catching any fish. The hypothesis that avid
fishers would be more likely than non-avid fishers to move more frequently
between fishing locations when catch rates were low was not supported by the
available data, however, as the durations of fishing trips were relatively short (~3.5
h) and fishers only moved a few times during each trip. It was able to be shown,
however, that avid fishers are more likely to move when they receive a low fish
‘bite rate’.
A second survey, in the form of a written questionnaire, was developed to
obtain data with which to characterise fishers who are members of angling clubs
located in the same region as the fishers interviewed by the above phone survey.
Comparisons were made between the data from the two surveys to test the
hypothesis that the club members are more avid and specialised than the general
population of boat fishers interviewed in the phone survey.
The surveyed club members were predominantly male, between the age of
45-59 y and almost all had more than 10 y fishing experience. These fishers were
more likely than the fishers interviewed in the phone survey to own their own boat
and GPS, and generally targeted a ‘mix’ of demersal reef fish species including West
Australian dhufish, Glaucosoma hebraicum, and pink snapper, Chrysophrys auratus.
As hypothesised, compared with non-members, club members were more avid,
tended to travel further to fishing locations, typically fished in deeper waters, made
greater investments in fishing technology and greater use of this (more fishing
locations stored in their GPS systems), and moved more frequently between fishing
locations when not receiving good fish bite rates. These findings were thus
consistent with the hypothesis that club members are more specialised than avid,
non-club affiliated fishers.
In the next phase of the project, an agent-based model (ABM) was
employed to simulate the dynamics of the multi-species demersal, boat-based
recreational fishery near Perth, in Western Australia. The model considered three
fish species, West Australian dhufish and pink snapper, and a non-target species
(with biological characteristics based on those of silver trevally, Pseudocaranx
georgianus), and a ‘fleet’ of avid, recreational boat fishers, with characteristics
similar to those of the fishers surveyed at angling clubs. The model simulated the
fishing activities of this group of boat anglers in a reef fishing area (i.e. an artificial
computer landscape) and subject to an established fisheries management regime
(size and boat limits), and tracked their catches (released and retained) and
impacts of these on fish populations. The characteristics of the individual fishers,
individual fish and certain characteristics of the computer landscape were informed
by a combination of biological information from existing literature and results
obtained from the survey of angling club members.
Several hypotheses were explored in simulations. For example, it was
demonstrated that, in simulations, fishers are able to maintain similar catch rates
despite declining abundances of fish by moving more rapidly between fishing
locations and by finding new locations with relatively high fish abundances. This
ability of fishers to maintain catch rates was also linked to fishers updating their
‘knowledge’ of the quality of their fishing locations (i.e. as stored in a GPS) based
on previous fishing experiences. Thus, it was concluded that, for this recreational
demersal fishery, such ‘learning’ behaviours of fishers, and particularly their ability
to improve their knowledge of good fishing locations, are key to making them
highly specialised, successful fishers. It was also demonstrated that the behaviours
of fishers, in response to a change in abundance of one species, can impact on the
abundances of another fish species, which thus has implications for managing
multi-species fisheries.
Model simulations provided a range of other results across different
scenarios of initial abundance of G. hebraicum and different management
regulations, some of which were not expected (i.e. not immediately intuitive),

which thereby provided some useful insights regarding the dynamics of the system.
For example, as initial fish abundance increased, catch per hour fishing did not
always increase, a result that was attributed to management regulations limiting
the number of fish that anglers may retain, reduced movements by anglers from
fishing locations and reduced time spent searching by anglers. The study results
also suggested that catch per unit of ‘time spent searching’ by anglers could be a
useful indicator of stock abundance. The ability of anglers to maintain their catches
when fish abundances were declining, through searching for new fishing locations
and moving between locations more often, highlights the fact that catch rate data,
as typically obtained in many surveys, do not necessarily provide a reliable index of
fish abundance.
Unlike many studies relating to human dimensions research, this study
focussed on understanding the key characteristics and behaviours of avid and
specialised boat-based anglers in a multi-species fishery. In such an environment,
different anglers are likely to adjust their behaviours in different ways to balance
their fishing skills and the values they place on the mixture of species that they are
likely to catch. That is, in a multi-species fishery, anglers act in a ‘multiple objective
decision making framework’, and individuals respond to their own motivations and
assessments of the values that they accord to the fishing experience. Although it is
unlikely that the knowledge gained in one fishery will be totally applicable to the
next, research methods are, however, likely to be transferable among fisheries. In
this context, this study benefited from the integration of fishery surveys and
simulation modelling, and consideration of the combined results in the context of
specialisation theory.


i
Contents
Acknowledgements........................................................................................... xvii
1. General Introduction................................................................................... 1
Overview ............................................................................................................. 1 1.1.
Recreational fishing ........................................................................................ 4 1.2.
1.2.1. What is recreational fishing? ................................................................ 4
1.2.2. Recreational fishing in Western Australia.......................................... 5
1.2.3. Survey information on recreational fishing in the West
Coast Bioregion ....................................................................................... 6
Survey methods ............................................................................................... 8 1.3.
1.3.1. Mail surveys ........................................................................................... 10
1.3.2. Telephone surveys ............................................................................... 11
The human dimension ................................................................................. 13 1.4.
1.4.1. Recreational fisher specialisation ...................................................... 13
1.4.2. The specialised angler ......................................................................... 14
1.4.3. Research questions arising from human dimensions ................... 15
Assessing the implications of behavioural responses by 1.5.anglers ............................................................................................................... 17
Agent-based modelling ............................................................................... 18 1.6.
1.6.1. Characteristics of agent-based models ............................................ 19
1.6.2. Advantages of using agent-based modelling .................................. 20
1.6.3. Agent-based models in fisheries science ......................................... 21
Objectives and thesis chapter outline................................................... 22 1.7.
2. Comparisons of the motivations, behaviours and movements of non-avid and avid recreational boat anglers in south-western Australia ..................................................................... 25
Introduction ..................................................................................................... 25 2.1.
Methods ............................................................................................................. 29 2.2.
2.2.1. Design of questionnaire ...................................................................... 29
2.2.2. Sampling design ................................................................................... 29
2.2.3. Telephone survey ................................................................................. 30
2.2.4. Data analysis ......................................................................................... 31
Results ............................................................................................................... 36 2.3.
2.3.1. Response profiles.................................................................................. 36
2.3.2. Comparisons between anglers in the RFBL database and interviewed recreational fishers ........................................................ 37
2.3.3. General demographics ......................................................................... 39
2.3.4. Catch preference .................................................................................. 41
2.3.5. Motives for fishing ................................................................................ 51
2.3.6. Gear and methods ................................................................................ 55
2.3.7. Commitment and movements ........................................................... 66
2.3.8. Social Interactions ................................................................................ 81
Discussion ......................................................................................................... 83 2.4.
2.4.1. Response rate........................................................................................ 83
ii
2.4.2. Primary motivations for fishing ......................................................... 84
2.4.3. Characteristics of an avid fisher ....................................................... 86
3. The characteristics, including fish-targeting behaviours, of a group of specialised boat anglers ..................................................... 95
Introduction .................................................................................................... 95 3.1.
Methods ............................................................................................................. 99 3.2.
3.2.1. Sampling Design .................................................................................. 99
3.2.2. Measures .............................................................................................. 100
3.2.3. Data analysis ....................................................................................... 101
Results ............................................................................................................. 103 3.3.
3.3.1. General Demographics ...................................................................... 103
3.3.2. Catch preferences .............................................................................. 107
3.3.3. Gear and methods ............................................................................. 109
3.3.4. Commitment ....................................................................................... 113
3.3.5. Social interactions .............................................................................. 124
3.3.6. West Australian dhufish specialisation .......................................... 124
3.3.7. Pink snapper specialisation .............................................................. 128
Discussion ...................................................................................................... 133 3.4.
3.4.1. Survey participants ............................................................................ 133
3.4.2. Characteristics of fishers who are members of angling clubs ...................................................................................................... 133
4. Exploring angler behaviour in a simulated multi-species fishery ........................................................................................................... 145
Introduction .................................................................................................. 147 4.1.
Methods ........................................................................................................... 151 4.2.
4.2.1. Software platform .............................................................................. 151
4.2.2. Purpose................................................................................................. 151
4.2.3. State variables and scales................................................................ 151
4.2.4. Process overview and scheduling ................................................... 152
4.2.5. Design concepts ................................................................................. 153
4.2.6. Initialisation ......................................................................................... 157
4.2.7. Input ..................................................................................................... 162
4.2.8. Sub models .......................................................................................... 167
4.2.9. Simulations .......................................................................................... 177
Results ............................................................................................................. 181 4.3.
4.3.1. Fisher behaviours/knowledge and catches, and fish abundance ........................................................................................... 181
4.3.2. Effect of increasing fish abundance on fisher behaviours and catches ......................................................................................... 185
4.3.3. Management regulations and fisher behaviours, catches
and fish abundance............................................................................ 191
Discussion ...................................................................................................... 198 4.4.
4.4.1. Fisher behaviours/knowledge and catches, and fish abundance ........................................................................................... 198
4.4.2. Fish abundance on fisher behaviours and catches ..................... 200

iii
4.4.3. Management regulations and fisher behaviours, catches and fish abundance ............................................................................ 205
4.4.4. Other agent-based models for recreational fisheries ................. 206
4.4.5. Summary .............................................................................................. 207
5. General Discussion .................................................................................. 209
Accounting for angler behaviour ........................................................... 209 5.1.
Angler types ................................................................................................... 213 5.2.
The use of agent-based modelling ....................................................... 216 5.3.
Implications for management ................................................................ 218 5.4.
Future inclusion of HD research in fisheries management ........ 220 5.5.
6. References .................................................................................................. 225

iv
v
List of Tables
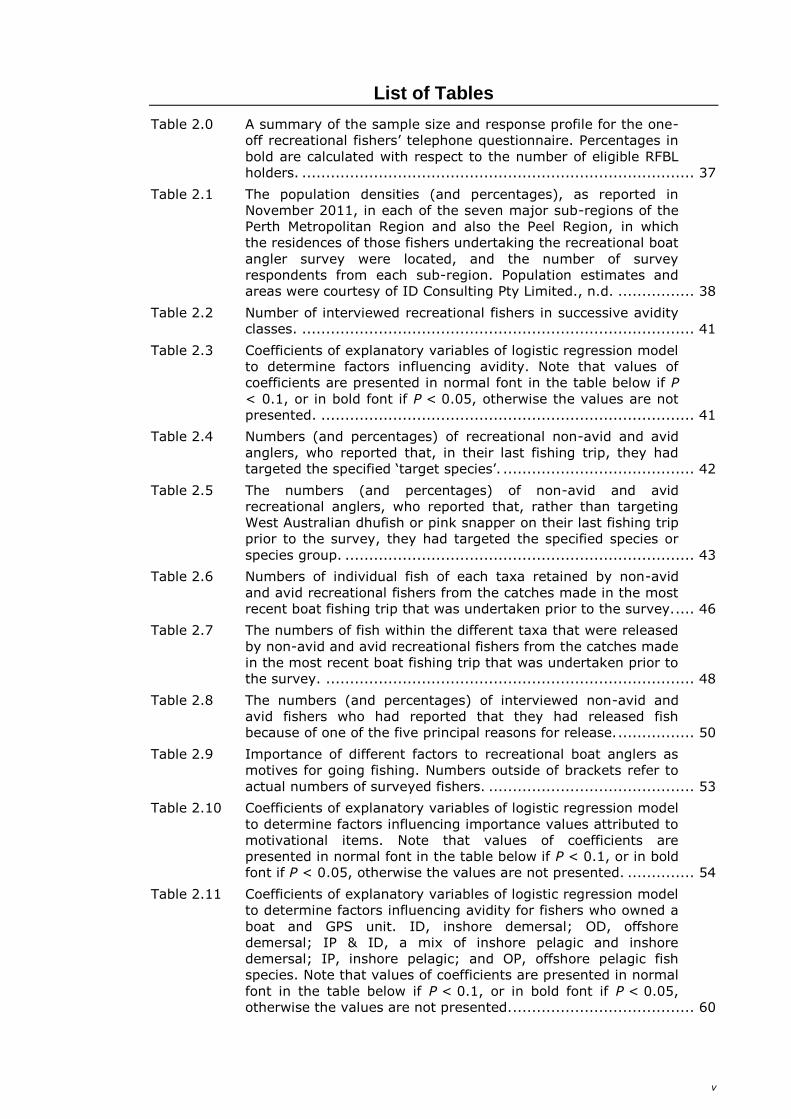
Table 2.0 A summary of the sample size and response profile for the one-
off recreational fishers’ telephone questionnaire. Percentages in
bold are calculated with respect to the number of eligible RFBL
holders. .................................................................................. 37
Table 2.1 The population densities (and percentages), as reported in
November 2011, in each of the seven major sub-regions of the
Perth Metropolitan Region and also the Peel Region, in which
the residences of those fishers undertaking the recreational boat
angler survey were located, and the number of survey
respondents from each sub-region. Population estimates and
areas were courtesy of ID Consulting Pty Limited., n.d. ................ 38
Table 2.2 Number of interviewed recreational fishers in successive avidity
classes. .................................................................................. 41
Table 2.3 Coefficients of explanatory variables of logistic regression model
to determine factors influencing avidity. Note that values of
coefficients are presented in normal font in the table below if P
< 0.1, or in bold font if P < 0.05, otherwise the values are not
presented. .............................................................................. 41
Table 2.4 Numbers (and percentages) of recreational non-avid and avid
anglers, who reported that, in their last fishing trip, they had
targeted the specified ‘target species’. ........................................ 42
Table 2.5 The numbers (and percentages) of non-avid and avid
recreational anglers, who reported that, rather than targeting
West Australian dhufish or pink snapper on their last fishing trip
prior to the survey, they had targeted the specified species or
species group. ......................................................................... 43
Table 2.6 Numbers of individual fish of each taxa retained by non-avid
and avid recreational fishers from the catches made in the most
recent boat fishing trip that was undertaken prior to the survey. .... 46
Table 2.7 The numbers of fish within the different taxa that were released
by non-avid and avid recreational fishers from the catches made
in the most recent boat fishing trip that was undertaken prior to
the survey. ............................................................................. 48
Table 2.8 The numbers (and percentages) of interviewed non-avid and
avid fishers who had reported that they had released fish
because of one of the five principal reasons for release. ................ 50
Table 2.9 Importance of different factors to recreational boat anglers as
motives for going fishing. Numbers outside of brackets refer to
actual numbers of surveyed fishers. ........................................... 53
Table 2.10 Coefficients of explanatory variables of logistic regression model
to determine factors influencing importance values attributed to
motivational items. Note that values of coefficients are
presented in normal font in the table below if P < 0.1, or in bold
font if P < 0.05, otherwise the values are not presented. .............. 54
Table 2.11 Coefficients of explanatory variables of logistic regression model
to determine factors influencing avidity for fishers who owned a
boat and GPS unit. ID, inshore demersal; OD, offshore
demersal; IP & ID, a mix of inshore pelagic and inshore
demersal; IP, inshore pelagic; and OP, offshore pelagic fish
species. Note that values of coefficients are presented in normal
font in the table below if P < 0.1, or in bold font if P < 0.05,
otherwise the values are not presented....................................... 60
vi
Table 2.12 Coefficients of explanatory variables of logistic regression model
to determine factors influencing the depth of fishing for fishers
that owned a boat and GPS unit. ID, inshore demersal; OD,
offshore demersal; IP & ID, a mix of inshore pelagic and inshore
demersal; IP, inshore pelagic; and OP, offshore pelagic fish
species. Note that values of coefficients are presented in normal
font in the table below if P < 0.1, or in bold font if P < 0.05,
otherwise the values are not presented. ...................................... 61
Table 2.13 Numbers and percentages of recreational boat fishers reported
using five specified fishing methods during their last boat fishing
trip. Note that each fisher may have reported the use of one or
more fishing methods. ............................................................... 62
Table 2.14 Coefficients of explanatory variables of logistic regression model
to determine factors influencing depth of fishing. ID, inshore
demersal; OD, offshore demersal; IP & ID, a mix of inshore
pelagic and inshore demersal; IP, inshore pelagic; and OP,
offshore pelagic fish species. Note that values of coefficients are
presented in normal font in the table below if P < 0.1, or in bold
font if P < 0.05, otherwise the values are not presented. ............... 64
Table 2.15 Coefficients of explanatory variables of logistic regression model
to determine factors influencing depth of fishing. ID, inshore
demersal; OD, offshore demersal; IP & ID, a mix of inshore
pelagic and inshore demersal; IP, inshore pelagic; and OP,
offshore pelagic fish species. Note that values of coefficients are
presented in normal font in the table below if P < 0.1, or in bold
font if P < 0.05, otherwise the values are not presented. ............... 65
Table 2.16 Reasons why, during their last boat fishing trip, non-avid and
avid recreational fishers undertook their greatest movement
between successive fishing locations. Numbers outside brackets
refer to actual numbers of surveyed fishers. ................................. 71
Table 2.17 Reasons why non-avid and avid recreational fishers decided to
head home at the end of their last boat fishing trip. Numbers
outside brackets refer to actual numbers of surveyed fishers. ......... 72
Table 2.18 Numbers and percentages of non-avid and avid fishers, who
responded that they would or would not cancel a boat fishing
trip if the weather forecasted was: a moderate wind strength
(11-16 knots or 20-29 km/h), fresh wind strength (17-21 knots
or 30-39 km/h), strong wind strength (22-27 knots or 40-
50 km/h) and near gale wind strength (28-33 knots or 51-
62 km). ................................................................................... 74
Table 2.19 The numbers and percentages of fishers who, when asked their
opinion regarding each of the six listed statements, responded
that they Strongly Disagreed (SD), Disagreed (D), were Neutral
(N), Agreed (A), Strongly Agreed (SA) or were Unsure (U), or
who considered the statement to be Not Applicable (NA) to
them. ...................................................................................... 78
Table 2.20 The numbers and percentages of fishers who, when asked their
opinion with respect to each of the six listed statements,
responded that they Strongly Disagreed (SD), Disagreed (D),
were Neutral (N), Agreed (A), Strongly Agreed (SA) or were
Unsure (U), or who considered the statement to be Not
Applicable (NA) to them. Note that the statements related to
the anglers’ behaviours in the past 12 months and whether
these had changed in the last year from those of previous
years. ..................................................................................... 79
vii
Table 3.0 Numbers of surveyed recreational fishers at angling clubs by
age class and gender. .............................................................. 103
Table 3.1 Numbers of surveyed club members in successive avidity
classes, classified according to frequency of fishing over the
past 12 months. ..................................................................... 106
Table 3.2 Coefficients of explanatory variables of logistic regression model
to determine factors influencing club membership. Note that
values of coefficients are presented in normal font in the table
below if P < 0.1, or in bold font if P < 0.05, otherwise the
values are not presented. ........................................................ 106
Table 3.3 Numbers (and percentages) of avid anglers interviewed in the
phone survey (Chapter 2) and recreational fishers from angling
clubs who reported targeting the different species categories on
their last boat-based fishing trip during the preceding 12 month
period, i.e. August to September 2011, and September 2009 to
December 2010, respectively. .................................................. 108
Table 3.4 Coefficients of explanatory variables of logistic regression model
to determine factors influencing club membership. ID, inshore
demersal; OD, offshore demersal; IP & ID, a mix of inshore
pelagic and inshore demersal; IP, inshore pelagic; and OP,
offshore pelagic fish species. Note that values of coefficients are
presented in normal font in the table below if P < 0.1, or in bold
font if P < 0.05, otherwise the values are not presented. ............. 109
Table 3.5 Average of self-determined scores assigned by club members
for their levels of skill at identifying different habitat types using
an echo sounder (0 = not skilled at all to 10 = extremely
skilled). ................................................................................. 112
Table 3.6 Numbers (and percentages) of surveyed anglers who, during
their last fishing trip prior to the survey, fished at sunrise/early
morning, mid-morning, mid-day, mid-afternoon, late
afternoon/sunset, and at night. Note that fishers were able to
nominate multiple periods in which they fished. .......................... 113
Table 3.7 Coefficients of explanatory variables of logistic regression model
to determine factors influencing club membership. Note that
values of coefficients are presented in normal font in the table
below if P < 0.1, or in bold font if P < 0.05, otherwise the
values are not presented. ........................................................ 120
Table 3.8 The number (and percentage) of club members who chose to:
Strongly Disagree (SD), Disagree (D), are Neutral (N), Agree
(A), or Strongly Agree (SA) with the following six statements.
Note that not all fishers responded to each question. ................... 123
Table 3.9 Number (and percentages) of club members reporting the
different numbers of fishers on-board the boats used by those
members during their last boat fishing trip. ................................ 124
Table 3.10 The number of club members and percentage (of the total
number of interviewed club members) reporting that they
considered the specified times of day or days to be best for
catching West Australian dhufish. Note that club members could
nominate more than one period as the ‘best’. ............................. 127
Table 3.11 The number (and percentage) of club members who perceive
the following habitats to be good for catching West Australian
dhufish. ................................................................................. 128
Table 3.12 The number of club members and percentage (of the total
number of interviewed club members) reporting that they
considered the specified times of day or days to be best for
viii
catching pink snapper. Note that club members could nominate
more than one period as the ‘best’. ........................................... 131
Table 3.13 The percentage of club members who perceive the following
habitats to be good for catching pink snapper. ........................... 132
Table 4.0 Details (within each row) of the agent-based model scenarios
that, independently, were explored for each variable of interest.
The default values for each scenario have been highlighted in
bold red font. (MLL, Minimum Legal Length for retention; BL,
daily allowable Boat Limit for West Australian dhufish (mixed
boat limit set to sum of boat limits for West Australian dhufish
and pink snapper); Abundance, number of West Australian
dhufish; Bite rate for West Australian dhufish, fish per minute;
Knowledge, average perceived value of the habitats of the
fishing locations in fishers’ ‘knowledge bases’; Probability of
initiating a search when moving to a new grid cell, hours; Cells
searched at each new location; Trip duration, hours. Note that
the number of scenarios (alternative values explored) for the
different variables varied. Thirty simulation runs were employed
for each scenario. ................................................................... 180
Table 4.1 Statistics generated by the agent-based model for five
simulations in which only the initial abundance variable for the
West Australian dhufish was altered. ......................................... 183
ix
List of Figures
Figure 1.0 Map of Western Australia showing the bioregional boundaries
into which the Western Australian Department of Fisheries has
divided the state’s marine waters, and the location of the
metropolitan (metro.) zone. (Image from Metcalf et al., 2010). ....... 6
Figure 2.0 The locations of the main regions (Central Metropolitan, East
Metropolitan, North West Metropolitan, South East Metropolitan,
South Metropolitan, and West Metropolitan) within the Perth
Metropolitan Region, and also the Peel Region of Western
Australia. The location of the Perth Metropolitan Region is
marked on the smaller map of Western Australia with a black
dot. The image has been redrawn from (Hejleh, 2014). ................ 34
Figure 2.1 Major habitat groups and depth regions for Western Australian
fisheries (Image from Ryan et al., 2013). .................................... 35
Figure 2.2 Age profiles of fishers from the Perth Metropolitan and Peel
Regions in the RFBL database and interviewed recreational
fishers. ................................................................................... 38
Figure 2.3 Number of interviewed recreational fishers of different age
categories and genders. ............................................................ 39
Figure 2.4 The percentage of those non-avid and avid respondents, who
had reported they were mainly aiming to catch a fish species
‘other’ than West Australian dhufish or pink snapper, who
targeted each of the five principal taxa during the most recent
boat fishing trip undertaken prior to the survey. ‘Mixed – IP &
ID’ represents a mix of inshore pelagic and inshore demersal
fish species, and ‘Mixed IP’ represents a mix of inshore pelagic
species targeted. ..................................................................... 44
Figure 2.5 Percentages of non-avid and avid recreational boat fishers who
reported the following taxa in the retained catches from their
last boat-based fishing trip. ....................................................... 47
Figure 2.6 Percentages of non-avid and avid recreational boat fishers who
reported the following taxa in the released catches from their
last boat-based fishing trip. ....................................................... 47
Figure 2.7 Percentages of non-avid and avid interviewed recreational
fishers, who strongly agreed (SA), agreed (A), were neutral (N),
disagreed (D) or strongly disagreed (SD) that their last boat
fishing trip was successful. ........................................................ 51
Figure 2.8 Percentages of non-avid and avid fishers who owned a boat for
the purpose of fishing. .............................................................. 55
Figure 2.9 Percentages of non-avid and avid fishers who reported that the
boat they owned was < 4, 4-5, 6-7, 8-9 or > 10 m in length ......... 56
Figure 2.10 Percentages of interviewed non-avid and avid recreational boat
anglers, who owned a boat with a GPS, with different numbers
of locations stored on their GPS system. ..................................... 57
Figure 2.11 Percentages of interviewed non-avid and avid recreational boat
anglers, who reported having visited their best/favourite fishing
locations 1, 2, 3-4, 5-9, 10-19, ≥ 20 times during the past 12
months. .................................................................................. 58
Figure 2.12 Percentages of total fishing effort (hours) for non-avid and avid
recreational boat anglers reported to have employed each of six
different fishing methods. ......................................................... 59
Figure 2.13 Percentages of methods reported to have been used by non-
avid and avid anglers during their most recent fishing trip. SA,
x
sand anchor; RA, reef anchor or reef pick; Drift + SA, drift
fishing using a sea anchor; Drift only, drift fishing without using
a sea anchor. ........................................................................... 62
Figure 2.14 Percentages of different depth ranges fished by interviewed
anglers within each avidity class, during their last boat fishing
trip. ........................................................................................ 63
Figure 2.15 Percentage of non-avid and avid fishers, who would stay at their
best/favourite fishing location for < 5, 5-9, 10-14, 15-19, 20-
29, 30-60 min, or never move when not getting any ‘good’ fish
bites. ...................................................................................... 66
Figure 2.16 Percentage of non-avid and avid fishers, who would stay at a
newly discovered fishing location for < 5, 5-9, 10-14, 15-19,
20-29, 30-60 min, or never move when not getting any ‘good’
fish bites. ................................................................................ 67
Figure 2.17 Percentage of non-avid and avid fishers, who travelled < 5, 5-9,
10-14, 14-19, 20-29 or ≥ 30 km to their first fishing location
during their last boat fishing trip. ................................................ 68
Figure 2.18 Percentages of non-avid and avid fishers, who fished 1-2, 3-4,
5-6, 7-8, 9-10 or > 10 fishing locations during their last boat
fishing trip. .............................................................................. 69
Figure 2.19 Percentage of non-avid and avid fishers, who travelled < 1, 1-3,
4-6, 7-9, 10-12 or > 12 km between their first and second
fishing locations, during their last boat fishing trip. ....................... 70
Figure 2.20 Percentage of fishers within each avidity class, for which the
greatest travelled distance between any one fishing location and
the next last during their last boat fishing trip was < 1, 1-3, 4-
6, 7-9, 10-12 or > 12 km. ......................................................... 70
Figure 2.21 Percentage of non-avid and avid anglers, who would travel < 5,
5-9, 10-14, 15-19, 20-29 or ≥ 30 km offshore if the weather
was fine and the water was flat calm. .......................................... 73
Figure 2.22 Percentages of non-avid and avid anglers, who would travel
< 5, 5-9, 10-14, 15-19, 20-29 and ≥ 30 km offshore, if the
forecasted wind strength was moderate (11-16 knots or 20-
29 km/h). ................................................................................ 74
Figure 2.23 Percentages of non-avid and avid anglers, who would, would
not, or were unsure as to whether they would start a boat
fishing trip earlier in the day if the weather forecast predicted a
fresh or strong early afternoon sea breeze. .................................. 75
Figure 2.24 Percentages of non-avid and avid anglers, who fished on a
public holiday, a normal weekday or a weekend during their last
boat fishing trip. ....................................................................... 76
Figure 2.25 Percentages of non-avid and avid fishers who, when asked their
opinion with respect to the statement “You have many fishing
spots on your GPS, but of these, there are a few which you visit
far more frequently than the others, because those few spots
provide exceptional fishing”, strongly agreed (SA), agreed (A),
were neutral (N), disagreed (D) or strongly disagreed (SD), or
who responded that the statement was Not Applicable (NA) to
them. ...................................................................................... 79
Figure 2.26 Percentage of non-avid and avid fishers, who, when asked to
respond to the statement “Your fishing trips tend to be shorter
in duration”, strongly agreed (SA), agreed (A), were neutral
(N), disagreed (D) or strongly disagreed (SD), or who
responded that the statement was Not Applicable (NA) to them. ..... 80
xi
Figure 2.27 Percentages of non-avid and avid fishers who, when asked to
respond to the statement; “You go out fishing more regularly”,
strongly agreed (SA), agreed (A), were neutral (N), disagreed
(D), or strongly disagreed (SD), or who responded that the
statement was not applicable (NA) to them. ................................ 80
Figure 2.28 Percentages of non-avid and avid fishers who, when asked their
opinion of the statement “You now catch a wider range of fish
species”, strongly agreed (SA), agreed (A), were neutral (N),
disagreed (D), or strongly disagreed (SD), or who responded
that the statement was Not Applicable (NA) to them. ................... 81
Figure 2.29 Percentage of non-avid and avid fishers, who reported that 1, 2,
3, 4, > 4 people were actively fishing on the boat that they
fished from during their last fishing trip. ..................................... 82
Figure 3.0 Percentages of surveyed club members who reported that they
had been fishing for 0-2, 3-10 or > 10 y. ................................... 104
Figure 3.1 Percentages of surveyed club members by region of residence
1. North West Metropolitan; 2. South East Metropolitan; 3.
South Metropolitan; 4. South West; 5. West Metropolitan. ........... 105
Figure 3.2 Percentages of avid anglers interviewed in the phone survey
(Chapter 2), who had reported targeting a species, and
recreational fishers from angling clubs, who had reported
targeting the different species categories on their last boat-
based fishing trip within the 12 month periods that preceded the
surveys in which they were interviewed, i.e. August to
September 2011 and September 2009 to December, 2010,
respectively. Note the questionnaire completed by club
members did not include the option, ‘no target’. ......................... 108
Figure 3.3 Percentages of recreational fishers from angling clubs who went
fishing from a boat in the last 12 months. .................................. 110
Figure 3.4 Percentages of fishers with different numbers of locations stored
in their global positioning system (GPS) recorded for the avid
recreational fishers interviewed in the phone survey (Chapter 2)
and the surveyed anglers from angling clubs, who reported in
those surveys that they owned a GPS. ....................................... 111
Figure 3.5 Percentages of club members who reported that they had
actively fished for the various different periods during their last
boat-based fishing trip prior to the survey. ................................. 114
Figure 3.6 Percentages of anglers, who would stay at their best/favourite
fishing location for < 5, 5-9, 10-14, 15-19, 20-29, 30-60 min,
or never move, when not getting any ‘good’ fish bites, as
reported by avid anglers from the phone survey (Chapter 2) and
by recreational fishers from angling clubs, i.e. club members. ...... 115
Figure 3.7 Percentages of anglers, who would stay at a ‘new’ fishing
location for < 5, 5-9, 10-14, 15-19, 20-29, 30-60 min, or never
move when not getting any ‘good’ fish bites, as reported by avid
anglers from the phone survey (Chapter 2) and by recreational
fishers from angling clubs, i.e. club members. ............................ 115
Figure 3.8 Percentages of avid anglers in the phone survey (Chapter 2)
and surveyed club members, who travelled distances of < 5, 5-
9, 10-14, 14-19, 20-29 or ≥ 30 km to their first fishing location
on their last boat-based fishing trip. .......................................... 116
Figure 3.9 Percentages of avid anglers in the phone survey (Chapter 2)
and recreational fishers from angling clubs, i.e. club members,
who would travel < 5, 5-9, 10-14, 15-19, 20-29 or ≥ 30 km
xii
offshore to their first fishing location if the weather was fine and
the water was flat calm. .......................................................... 118
Figure 3.10 Percentages of avid anglers in the phone survey (Chapter 2)
and recreational fishers from angling clubs, i.e. club members,
who would travel < 5, 5-9, 10-14, 15-19, 20-29 or ≥ 30 km
offshore to their first fishing location if moderate weather (11-
16 knots or 20-29 km/h wind strength) was forecasted. .............. 119
Figure 3.11 Percentages of avid anglers in the phone survey (Chapter 2)
and recreational fishers from angling clubs, i.e. club members,
who would travel < 5, 5-9, 10-14, 15-19, 20-29 or ≥ 30 km
offshore to their first fishing location if rough weather
(≥ 17 knots or ≥ 30 km/h wind strength) was forecasted. ........... 119
Figure 3.12 Percentages of surveyed club members who, over the last
12 months, never, sometimes, often, most times or every time,
went fishing on weekends on the occasions that they fished. ........ 121
Figure 3.13 Percentages of surveyed club members, who reported that,
during the last 12 months, they never, sometimes, often, most
times and every time, caught West Australian dhufish when
they went boat fishing. ............................................................ 125
Figure 3.14 Percentages of club members who typically target West
Australian dhufish at different water depth intervals. ................... 126
Figure 3.15 Percentages of surveyed club members who reported that,
during the last 12 months, they never, sometimes, often, most
times or every time, caught pink snapper when they went boat
fishing. .................................................................................. 129
Figure 3.16 Percentages of club members who typically target pink snapper
at different water depth intervals. ............................................. 130
Figure 4.0 The ‘Main’ program interface for displaying the results of
simulations to users. The simulated landscape is located in the
top left-hand corner, with the blue dots representing individual
fish. The interface also displays a number of diagnostic charts
for each fish species. ............................................................... 156
Figure 4.1 Form displaying the values of parameters used by the model to
generate an artificial landscape. ............................................... 158
Figure 4.2 Form displaying values of parameters used by the model, which
describe a range of aspects of the fishers, and their knowledge
and behaviours. ...................................................................... 161
Figure 4.3 Form displaying values of parameters used by the model, which
describe the specified initial fish abundance, and aspects of the
biology and movement parameters of each of the fish species. ..... 164
Figure 4.4 Form displaying values of parameters used by the model,
specifying aspects related to fisher behaviour. ............................ 166
Figure 4.5 Fish agent sub-model describing the possible fates of fish at
each of the three main event types (fish movement event, fish
encounters fisher event and natural mortality event). ................. 173
Figure 4.6 Fisher agent decision pathways. Numbers correspond to the six
fisher decision points of the fisher sub-model. Octagons indicate
a review checkpoint, diamonds represent an immediate
decision, rectangles represent the outcomes of a decision and
ovals represent the actions taken by the fisher. .......................... 174
Figure 4.7 Relationships between the total number of fish retained by
anglers (catch) and fisher behaviours/knowledge and fish
abundance. Only the variables on the x axis have been modified
in this exercise, with data sourced directly from the survey
xiii
highlighted by the red data point. (Note: approximate 95%
confidence intervals, calculated as the mean ± 2 SE, have been
plotted, but are very small). ..................................................... 184
Figure 4.8 Relationships with initial abundance of West Australian dhufish
of the (a) Number of searches, (b) Average time anglers spent
at each fishing location, and the (c) Total number of hours
actively fished and searched by anglers. The initial abundances
of pink snapper and ‘red herring’ (silver trevally) were held
constant. (Note: approximate 95% CIs, calculated as the mean
± 2 SE, have been plotted, but are very small). .......................... 188
Figure 4.9 Relationships with initial abundance of West Australian dhufish
of the (a) Number of individuals released by anglers, and the
(b) Number of individuals retained by anglers. The initial
abundances of pink snapper and ‘red herring’ (silver trevally)
were held constant. (Note: approximate 95% CIs, calculated as
the mean ± 2 SE, have been plotted, they are just very small). .... 189
Figure 4.10 Relationships with initial abundance of West Australian dhufish
of the number of times the boat limit for each species (West
Australian dhufish, pink snapper and ‘red herring’ (silver
trevally)) and also the combined ‘multi-species’ (West
Australian dhufish and pink snapper) limit was attained. (Note:
approximate 95% CIs, calculated as the mean ± 2 SE, have
been plotted, but are very small). ............................................. 190
Figure 4.11 Relationships with initial abundance of West Australian dhufish
of the catch of individuals per hour fishing, catch per hour
searching and catch per hour searching and fishing. .................... 191
Figure 4.12 Relationship between the total number of fish retained by
anglers (catch) and changes to the management regulations of
(a) the allowable boat limit of West Australian dhufish and (b)
the minimum legal length (MLL) of West Australian dhufish.
(Note: approximate 95% CIs, calculated as the mean ± 2 SE,
have been plotted, but are very small). ..................................... 193
Figure 4.13 The age compositions of West Australian dhufish that were
released (a) and retained (b) by anglers when total allowable
boat limits (BLs) were set to 1 or 4 fish. .................................... 194
Figure 4.14 The length compositions of West Australian dhufish that were
released (a) and retained (b) by anglers when total allowable
boat limits (BLs) were set to 1 or 4 fish. .................................... 195
Figure 4.15 The age compositions of West Australian dhufish that were
released (a) and retained (b) by anglers when the minimum
legal length (MLL) was set to 400 or 600 mm. ............................ 196
Figure 4.16 The length compositions of West Australian dhufish that were
released (a) and retained (b) by anglers when the minimum
legal length (MLL) was set to 400 or 600 mm. ............................ 197

xiv
xv
List of Appendices
Appendix A Recreational fisher phone survey. Interview script for computer-
assisted telephone interviewing (CATI) system (provided by
Edith Cowan University (ECU) Survey Research Centre,
Joondalup, W.A.)
Appendix B Edith Cowan University (ECU) Survey Research Centre
certificate of accreditation.
Appendix C Formal approval documentation from the Human Research
Ethics Committee, Murdoch University, W.A. (Project Number
2009/114).
Appendix D Number of anglers who participated in the phone survey and
who aimed to catch each of the various fish species when
targeting species ‘other’ than West Australian dhufish or pink
snapper during their last boat fishing trip. Fishers have been
separated according to avidity class. Note: NA stands for not
applicable. Note also that the table contains a summary of the
raw interview data and that the species or species groups
recorded by the interviewer are reported without editing.
Appendix E Number of anglers who participated in the phone survey and
who targeted each of the various groups of species when aiming
to catch a fish species ‘other’ than West Australian dhufish or
pink snapper during their last boat fishing trip. Fishers have
been separated according to avidity class.
Appendix F Number of individuals of each of the various species and groups
of species caught and retained by anglers, who participated in
the phone survey, during their last boat fishing trip. Retained
catches have been separated according to each angler’s avidity
class, determined according to the frequency of fishing of the
individual fisher over the past 12 months.
Appendix G Number of individuals of each of the various species and groups
of species caught and released by anglers, who participated in
the phone survey, during their last boat fishing trip. Released
catches have been separated according to each angler’s avidity
class, determined according to the frequency of fishing of the
individual fisher over the past 12 months.
Appendix H Number of recreational anglers who participated in the phone
survey and who reported each of the various ‘other’ reasons
why, during their last boat fishing trip, they undertook their
greatest movement between successive fishing locations. Note
that the table contains a summary of the raw interview data as
recorded by the interviewer and reported without editing.
Appendix I Number of recreational anglers who participated in the phone
survey and who reported each of the various ‘other’ reasons
why they decided to head home at the end of their last boat
fishing trip. Note that the table contains a summary of the raw
interview data as recorded by the interviewer and reported
without editing.
Appendix J Consent to participate in the recreational fisher survey form.
Appendix K Questionnaire for angling club survey.
Appendix L Values of parameters used for each fish species in the
simulation runs of the agent based model. Superscripts refer to
the relevant data source for each parameter (listed below the
table).

xvi
xvii
Acknowledgements
I wish to express my upmost gratitude to Professor Norman Hall and Dr Alex Hesp for
the opportunity to undertake my PhD under their supervision. My thanks for their
continued support and encouragement, for our many enthralling discussions, which led
to a much improved understanding of various aspects of the project, and for the large
amount of time spent helping with the editing of my thesis.
I am most grateful for the advice that was offered by Drs David Die, Steve Sutton and
Jeremy Lyle, who examined an earlier version of this thesis, and who offered many
invaluable suggestions as to how it might be improved.
I thank Rowena Burch (Honours student) for her assistance in the initial stages of
creating some of the questions and the designing and trialling of the first recreational
fisher questionnaire at Marmion Angling Club. Rowena was also involved in the early
stages of development of the agent-based model. I am very grateful that she shared
the ride with me in the first year and helped solve some of the early problems
encountered.
I am thankful to RecFishWest for its support, especially Kane Moyle for his assistance
in helping to organise the very first angling survey, and Kane, Richard Stevens and
Felicity Horn (WAFIC), and Brent Wise and Brett Molony (DoF) for their feedback
during the study. I also thank Corey Wakefield (DoF) for providing unpublished data to
estimate the size-selectivity of pink snapper. I am grateful to the Western Australian
Department of Fisheries for providing access to, and drawing a random sample from,
their Recreational Fishing Boat Licence database, for use in the telephone survey that
I conducted.
Thank you to all of the many recreational fishers that took time out of their busy
schedules to participate in the two angler surveys. In particular, I would like to thank
the specialised and enthusiastic anglers at Marmion Angling Club, Ocean Reef Angling
Club and Quinns Rock Angling Club and also fishers from the Bunbury Angling Club
and Naturaliste Game and Sport Fishing Club, for their time in completing our survey
and also for their feedback and sharing their local knowledge and insights.
My sincere thanks to Professor Ken Pollock and Karina Ryan for their interest and
involvement in helping to improve the design of my survey questions and overall
survey structure for the recreational fishers phone survey. I also wish to acknowledge
Dr Steve Sutton (James Cook University, Queensland) for the early advice that he
provided to one of my supervisors (Dr Alex Hesp) on improving the wording of

xviii
questions in the written survey described in Chapter 3. That survey was initially
developed as part of FRDC project 2008/033, undertaken by my supervisors, Ms
Rowena Burch and myself).
My thanks to the Edith Cowan University (ECU) Survey Research Centre staff, and
especially to Theresa Wilkes and Vicki Graham. Their advice and feedback in
formatting the survey questions for the CATI system was invaluable. The research
centre carried out the survey in a completely professional manner, and also did their
very best to maximise the data from the survey through follow-up interviews.
My thanks also go to Dr Eric von Dietze (Murdoch University, Human Ethics
Committee) for his advice and assistance on effective and ethical human survey
research.
I gratefully acknowledge the Australian Fisheries Research Development Corporation
(FRDC) for funding initial research relating to the agent-based modelling component of
my study (FRDC 2008/033). I also thank Murdoch University for providing funds to
enable the recreational fisher phone survey to be undertaken.
I am also very appreciative of my Australian Postgraduate Awards (APA) scholarship
which enabled me to further my education in the field of my choice.
Thanks to many colleagues at the Centre for Fish and Fisheries and Aquatic
Ecosystems for their friendship, and their help. Thanks to Emily Fisher for her
enduring efforts in drinking cheap beer and listening to angler’s fish tales at the
various angling clubs, while helping to collect survey responses from recreational
fishers. Thanks to my awesome lab buddy Lauren Veale for her continued support and
encouragement throughout the entire PhD journey. I couldn’t have done it without
you. Thanks heaps, mate. Let’s have a cider! Thanks also to Amanda Buckland and
Alan Cottingham next door, for their huge support, ideas and inspiration, friendship
and also company on the many coffee trips taken.
Thanks to my family and friends who have supported me throughout my PhD, I don’t
want to name too many names, you know who you are and I am so very grateful to
have you in my life. A PhD truly is an emotional marathon, and having so many
wonderful supportive people around you really is important, so thank you.
Finally, a very special thanks to my Nanna and Pappa for their endless love and
support, and in particular to my Pappa, you were the one who taught me strength,
courage, determination and, most importantly, the value of patience.
1
1. General Introduction
Overview 1.1.
Recreational fishing is today the principal form of exploitation of fishes in most
freshwater habitats and in many coastal waters across the western world (McPhee
et al., 2002; Lewin et al., 2006; Greiner and Gregg, 2010; Fenichel et al., 2013).
Furthermore, participation rates are typically increasing, with estimates of marine
recreational fishing effort having risen by more than 20% in the past couple of
decades (Coleman et al., 2004; Cooke and Cowx, 2006). Consequently, there is a
growing awareness among fisheries managers that recreational fishing can have
major impacts on fish stocks (Henry and Lyle, 2003; Coleman et al., 2004; Granek
et al., 2008; Gao and Hailu, 2012). In 2000, recreational catches amounted to
47.10 billion fish, but many of these were subsequently released, with only 36.3%
(17.09 billion fish) being retained (Cooke and Cowx, 2004). A similar number of fish
(47 billion) was estimated to have been caught by recreational fishers in 2004, with
the number of participants in this activity equating to more than 140 million fishers
(FAO, 2012). Thus, recreational fishing has become an issue of key importance for
fisheries managers (McPhee et al., 2002; Cooke and Cowx, 2004; Granek et al.,
2008), and it is now widely acknowledged that accounting for impacts of
recreational fishing is vital for ensuring the future sustainability of many fishery
resources throughout the world (Henry and Lyle, 2003; Cooke and Cowx, 2004).
The shift in focus from commercial to recreational fishing has been
accompanied by recognition that management objectives are no longer confined to
maximising economic benefit while maintaining ecosystem structure and function.
The broader, more diffuse set of objectives of the recreational fishing sector and
community must now also be considered, noting that these objectives will vary not
only between fishers within different fisheries, but also among fishers within even a
single fishery. If fishery managers are to confront the challenges of addressing the
2
objectives of recreational fishers, while achieving an appropriate balance with
economic and conservation objectives, they will need to identify the various
objectives of the different recreational fishers and obtain an understanding of the
values of those objectives to different groups of recreational fishers. Until recently,
there have been relatively few human dimension studies of recreational fisheries
from which to develop an understanding of the motivations, characteristics, and
behaviours of different recreational fishers and the values that they place on
different aspects of the fishery experience. There has been growing recognition,
however, of the need for such studies (e.g. Hunt et al., 2013). To fill a gap in
human dimensions knowledge for one of the key recreational fisheries in Western
Australia, i.e. the demersal fishery in the West Coast Bioregion, this study has
collected data from anglers such that the characteristics of those fishers, and their
behaviour in response to factors such as changes in abundance of a key species,
can be determined. Such data will assist managers of this fishery to assess how
recreational fishers are likely to respond to different management controls.
As noted by Henry and Lyle (2003), the primary responsibility of
government is to “ensure the long term sustainable utilisation of fisheries resources
for the prosperity and well-being of the community”. However, this is by no means
an easy feat as recreational fisheries worldwide are underpinned by a set of
complex interactions between agents (i.e. fish, fishers, fishery managers) and their
environment, with management often seen as a balancing act between the
competing ecological, economic and social objectives of these components
(Arlinghaus et al., 2002; Cowx, 2002; Little et al., 2009). The need to consider
these holistically in the context of the total system has also been recognised
(Hickley, 1998; Salas and Gaertner, 2004; FAO, 2012). Management is often
hindered by a lack of information regarding fundamental questions about
recreational fishing. For example, how much do recreational fishers catch? How
much is sport fishing worth to the economy? Why do recreational fishers fish?
Before the ecological, economic and social impacts of recreational fisheries can be
evaluated, many questions such as these need to be considered carefully (McPhee
3
et al., 2002; Pitcher and Hollingworth, 2002). Understanding how recreational
fishers operate in a fishery is by no means a new concept, yet it is one that is often
over-looked (Salas and Gaertner, 2004; Arlinghaus, 2006; Johnston et al., 2010;
Hunt et al., 2011). Metcalf et al. (2010) further noted that the behavioural
responses of recreational fishers to changes in fisheries management are rarely
investigated and as a result, often poorly understood.
In general, fisheries management policies and regulations are focussed on
regulating fishing mortality to ensure the long-term sustainability and productivity
of fish stocks which, for recreational fishers, also means maintaining the quality of
the fishing experience (Gentner and Sutton, 2008; Greiner and Gregg, 2010).
Fishers, however, have the ability to modify their behaviours, e.g. travel further to
catch fish, target different species and/or use different gear types, and thereby
potentially maintain catch rates at their previous levels reducing the effectiveness
of changes to fisheries regulations (Salas and Gaertner, 2004; Sutton and Ditton,
2005; Gentner and Sutton, 2008; Metcalf et al., 2010). Furthermore, management
restrictions imposed to protect one species may result in fishing effort being re-
directed towards another species. This, ultimately, may result in a regulatory
domino effect in which harvest restrictions placed on one species lead to increased
exploitation of other species, creating the need for harvest restrictions on the
substitute species, and so on (Thunberg et al., 1995). Thus, fisheries management
would benefit from prior investigations of the likely behavioural responses of
recreational fishers to alternative regulatory changes as these would facilitate
assessment of the potential effectiveness of the various proposed changes (Salas
and Gaertner, 2004; Arlinghaus, 2005; Metcalf et al., 2010). To obtain such
information, researchers and managers typically employ surveys to identify
characteristic behaviours and key motivations of recreational fishers (e.g. Wilde et
al., 1998; Hunt, 2001; Hunt et al., 2002; Arlinghaus and Mehner, 2003; Sutton,
2006; Prior and Beckley, 2007; Arlinghaus et al., 2008).
4
Recreational fishing 1.2.
Recreational fishing is an activity that provides considerable social and economic
benefits to many communities (Weithman, 1999; Sutinen and Johnston, 2003;
Greiner and Gregg, 2010; Fenichel et al., 2013). Recreational fishers fish for a
variety of reasons besides just catching fish, with non-catch motives, including
relaxation, often being more important to anglers than motives associated with
catching fish (Graefe and Fedler, 1986; Fedler and Ditton, 1994; Danylchuk and
Cooke, 2010; Smith et al., 2012).
1.2.1. What is recreational fishing?
Recreational fishing is a very popular pastime and has origins dating back to the
early Egyptians in 2000 BC (Hickley, 1998). Defining recreational fishing, at first
glance, would seem relatively simple and straightforward. However, many nations
with recreational fisheries have developed or are developing their own definitions
for recreational fishing that are socially and culturally defined by participants in the
activity (Ditton, 2008). In this thesis (as adapted from the definitions provided by
McPhee et al. (2002), Cooke and Cowx (2004), Arlinghaus (2005), Ditton (2008)
and FAO (2012)), I define recreational fishing as a leisure-based activity that
involves the capture or attempted capture of aquatic living resources. Recreational
fishing may be conducted by various fishing methods including angling, i.e. line
fishing, using a hooking method, gathering (i.e. the collection of shellfish),
spearing, trapping, netting and using other gears. Note that this definition does not
include the subsistence fishing activities of various indigenous people, such as
Australians living in traditional indigenous communities (Reid, 2008), nor does it
include fishing activity by commercial fishers where some portion of the catch is
retained by those fishers for their own use rather than sold. It does, however,
include catch and release fishing, which has evolved and has also become an
increasingly important component of many recreational fisheries, and which is
practised voluntarily by many recreational fishers all over the world (Sutton and
Ditton, 2001; Polinsky, 2002; Polinsky, 2008).
5
1.2.2. Recreational fishing in Western Australia
Recreational fishing in Western Australia is legislated by the Fish Resources
Management Act 1994 (WA) and managed in accordance with this Act by the
Department of Fisheries, Western Australia (WA). The objectives of the Act reflect
the principles of Ecologically Sustainable Development (ESD), as outlined in
Australia’s National Strategy for Ecologically Sustainable Development (Anonymous,
1992).
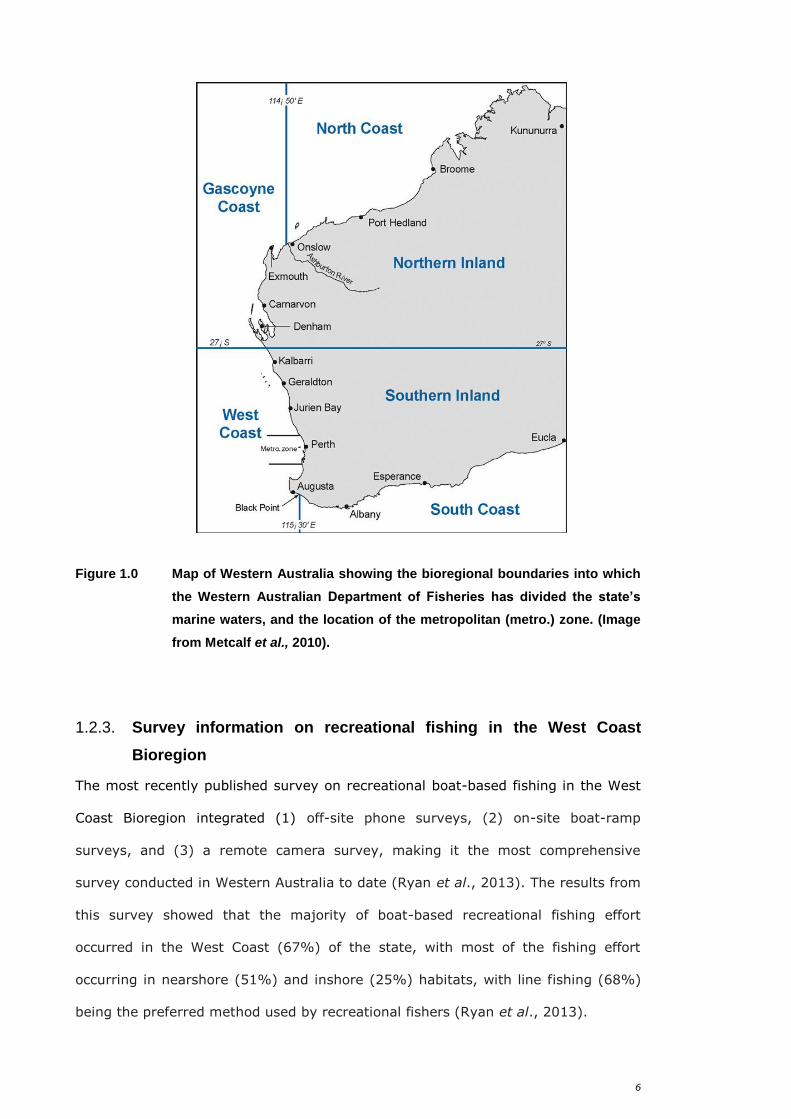
Recreational fishing in Western Australia is concentrated in waters adjacent
to the state’s major population centres of Perth, Bunbury (180 km south of Perth)
and Geraldton (420 km north of Perth), which fall within the area identified by the
Department of Fisheries, Western Australia, as the ‘West Coast Bioregion’
management zone, extending northwards from Augusta to just north of Kalbarri (all
land and waters south of 27° South latitude and west of 115° 30' East longitude)
(Fig. 1.0). This management area accounts for 81% of Western Australia’s
population (Sumner et al., 2008). As such, the West Coast Bioregion is a focal point
for recreational fishing in this State.
The principal method used by recreational fishers in Western Australia is
angling, i.e. use of hook and line. While other fishing methods, such as trapping,
spearing and gathering, are also used by recreational fishers (including some
anglers) in Western Australia, the focus of this study is on recreational angling.
Thus, in the remainder of this thesis, because of the dominance of this method, the
terms ‘angling’ and ‘recreational fishing’ (and ‘anglers’ and ‘recreational fishers’)
have been used interchangeably.
6
Figure 1.0 Map of Western Australia showing the bioregional boundaries into which
the Western Australian Department of Fisheries has divided the state’s
marine waters, and the location of the metropolitan (metro.) zone. (Image
from Metcalf et al., 2010).
1.2.3. Survey information on recreational fishing in the West Coast
Bioregion
The most recently published survey on recreational boat-based fishing in the West
Coast Bioregion integrated (1) off-site phone surveys, (2) on-site boat-ramp
surveys, and (3) a remote camera survey, making it the most comprehensive
survey conducted in Western Australia to date (Ryan et al., 2013). The results from
this survey showed that the majority of boat-based recreational fishing effort
occurred in the West Coast (67%) of the state, with most of the fishing effort
occurring in nearshore (51%) and inshore (25%) habitats, with line fishing (68%)
being the preferred method used by recreational fishers (Ryan et al., 2013).
7
Although the National Recreational and Indigenous Fishing Survey (Henry
and Lyle, 2003) and various creel surveys of the West Coast Bioregion (Sumner and
Williamson, 1999; Sumner et al., 2008; Ryan et al., 2013) provide good
information relating to recreational fishing effort, very few studies have focussed
strongly on behavioural patterns of recreational fishers in Western Australia. One
exception is the study of Prior and Beckley (2007), who conducted a survey to
characterise recreational anglers in the Blackwood River Estuary (34°19′S,
115°11′E), south of Perth. Prior and Beckley (2007) gathered information on the
demographics of anglers, their spatial and temporal patterns of fishing, and their
expenditure and attitudes to conservation and management of fish resources.
Almost half of the angling groups encountered during the survey were tourist
families, visiting the Blackwood River Estuary from cities and towns in south-
western Australia, many originating from Bunbury. Most anglers were also male and
between the ages of 31-45 y old, who stated that their main motivation for angling
was for relaxation. Furthermore, it was found that, on average, boat-based anglers
fished more frequently than shore-based anglers and locals fished more frequently
in the Blackwood River Estuary than tourists, with considerable expenditure on bait,
tackle, and capital equipment (Prior and Beckley, 2007).
A similar survey that also explored behavioural aspects of recreational
fishing was conducted for shore-based anglers on Rottnest Island (32°00'S,
115°30'E), located off the south-west coast of Western Australia (Latitude 32°00'S,
Longitude 115°30'E) (Smallwood et al., 2006). The majority of anglers on Rottnest
Island during the survey were from the Perth Metropolitan Region, with just over
one-third of anglers being children, most of whom were observed fishing from
jetties. The results of the survey also showed that shore-based anglers’ often
targeted Australian herring (Arripis georgiana) with the highest number of anglers
observed coinciding with the autumn/winter migration of Australian herring. Avid
anglers, however, were more likely to target larger and more valued fish species,
such as yellowtail kingfish (Seriola lalandi) and tailor (Pomatomus saltatrix). The
8
study also revealed that 36% of fish caught on Rottnest Island were subsequently
released (Smallwood et al., 2006).
In summary, most surveys of recreational fishing in Western Australia have
focussed on producing estimates of catch and effort, assessing knowledge of fishing
regulations, and obtaining information on attitudes towards management initiatives
and broad demographic data. With the exception of the surveys by Smallwood et al.
(2006) and Prior and Beckley (2007), there has been minimal attention given in
published reports to the motivations and behaviours of anglers in Western
Australia, and their likely responses to factors such as changes in fish abundance or
fishery regulations.
Survey methods 1.3.
Angler surveys are used by fisheries agencies in many parts of the world to obtain a
variety of information for management purposes (Henry and Lyle, 2003;
Dempson et al., 2012). As described by Pollock et al. (1994), there are seven basic
survey methods used to estimate and record angler characteristics and activities.
These are mail, telephone and door-to-door surveys, fishing logbooks or diary
surveys, access point surveys, roving surveys and aerial surveys. All but the last of
these methods allow the collection of data from recreational fishers relating to their
demographic characteristics, motivations, and behaviours. The first four of Pollock
et al.’s (1994) methods are regarded as off-site approaches (surveys conducted
away from fishing sites), with individuals or households selected from a sampling
frame, and these individuals or representatives of selected households then being
contacted and asked to respond to a survey or interview. The other approaches are
regarded as on-site methods (surveys conducted at the fishing site). On-site
surveys employ a ‘spatio-temporal’ sampling frame where certain sites are visited
at selected times, and randomly-selected fishers encountered at those sites are
contacted and asked to respond to a survey or interview (Pollock et al., 1994;
Henry and Lyle, 2003).
9
A common method that is employed to obtain data from recreational fishers
is through use of an on-site creel survey (Pollock et al., 1994). Such surveys
typically focus on collecting information about the fish that are caught (and related
fishing effort) rather than on the fishers themselves. Offsite surveys (telephone,
mail, etc.), in contrast, are primarily used to sample angler opinions and collect
socio-economic data (Pollock et al., 1994) and have often been used to collect
fishery-wide data. Thus, for example, a phone survey is a major component of the
methods used by the National Marine Fisheries Service (NMFS) to collect effort data
for recreational fisheries in the U.S.A., i.e. the Marine Recreational Fisheries
Statistics Survey (MRFSS) and its successor, the Marine Recreational Information
Program (MRIP) (Sullivan et al., 2006). In recent years, there has been an
increased tendency for researchers to use mixed mode surveys, i.e. data collected
by two or more methods for a single survey purpose (Dillman, 1991). For example,
researchers may use telephone-diary surveys in conjunction with on-site creel
surveys or follow-up mail surveys after an on-site creel survey, or online surveys in
conjunction with a telephone follow-up, thus increasing data quality and
overcoming the shortcomings of certain biases inherent in each of the techniques
(Brown, 1991; Ditton and Hunt, 2001; Lyle, 2008; Crosson, 2010). For example,
data from follow up surveys are used when attempting to adjust for non-response.
So which survey method(s) should one use? Answering this question is not
always straightforward, as each method has its own strengths and weaknesses.
Costs and complexities also increase as one moves from diary surveys to mail
surveys and, in turn, to telephone surveys and, finally, to surveys involving direct
contact with anglers (Pollock et al., 1994). The survey methods chosen to collect
recreational fishing data are usually determined by: (1) the type of information
required, (2) the temporal and spatial scale of the study, (3) the characteristics of
the fishery, and ultimately (4) the resources (personal, funds, gear, etc.) available
to the researcher (Henry and Lyle, 2003). Large scale surveys (national or state-
wide level), for example, commonly use off-site techniques because of their lower
associated costs and greater ability to deal with large numbers of fishers dispersed
10
over large geographical areas (Henry and Lyle, 2003). The following sections look
more closely at the use of mail and phone survey techniques in fisheries and their
inherent merits and deficiencies. These techniques were identified as the most
suitable methods for collecting data from recreational fishers in the studies
undertaken for this thesis.
1.3.1. Mail surveys
Mail surveys are the most common survey method used among many fisheries
agencies for angler-related research, due to their relatively low cost and simplicity
of operation (Pollock et al., 1994; Fisher, 1997). These types of surveys are also
highly flexible and able to reach a widely dispersed sample without the problems of
interviewer access (Fisher, 1997). Survey questionnaires may be mailed or handed
directly to potential participants, with completed forms being returned by post (or
other collection system) by those individuals who choose to respond. Mail surveys
are often used for socio-economic studies and for characterising anglers or
communities affected by fisheries according to socio-economics or other attributes
(Pollock et al., 1994).
As described by Pollock et al. (1994), a common weakness of mail surveys is
the adequacy of the sampling frames that are used, i.e. angler licence or permit
databases, which are often incomplete and hence do not provide an accurate
representation of the angler population. Another weakness of mail surveys is
related to variations in response rates among different groups of fishers, with avid
and more specialised angler groups often being more likely to participate in
recreational fishing surveys than other groups, thus biasing the data (Pollock et al.,
1994; Arlinghaus, 2004). It is also important to recognise that mail surveys are
limited in that that they ask anglers to report on past fishing events, and thus the
accuracy of responses is likely to vary depending on how far in the past the fishers
are being asked to recall fishing experiences and how memorable those experiences
were. Therefore, mail surveys typically suffer from ‘memory or recall biases’
(Pollock et al., 1994; Connelly and Brown, 2011). Furthermore, anglers may
11
exaggerate their catches to enhance their image (‘prestige bias’) (Pollock et al.,
1994) with the result that estimates of catch and harvest rates can often be up to
20% higher than those reported from on-site survey methods (Roach et al., 1999).
Several algorithms have been developed to allow ‘adjustments’ for non-
responses by anglers. Achieving a high response rate, however, is the best way to
reduce the effects of non-response bias (Fisher, 1996). Dillman (1978), showed
that non-response rates can be reduced through making a concerted effort towards
minimising the length of individual written surveys to minimise the time required
for the respondent to complete the questionnaire. The effects of other biases, i.e.
recall and prestige, can be minimised through consideration of responses during the
development of the questionnaire and limiting the number and type of questions
(Larkin et al., 2010).
In summary, mail surveys sacrifice quality but benefit by being of lower cost
(Pollock et al., 1994). Maximising the usefulness of mail surveys involves carefully
structuring and designing surveys so that they are ‘respondent-friendly’ (Pollock et
al., 1994; Dillman, 2000) and so that non-response rates (and hence, non-response
biases) are minimised.
1.3.2. Telephone surveys
The use of telephone surveys to gather angler catch and attitudinal data has been
shown to be an effective and consistent means of obtaining reliable information
about the recreational fishing sector (Cockcroft et al., 1999). Telephone surveys are
used by fisheries agencies to determine participation rates and angler profiles, i.e.
profiles are created for each angler segment based on the interview data, their
demographic characteristics, catches and level of fishing effort, expenditure
associated with fishing activities, perceptions of fishery regulations, conflicts
between fishers and understanding of issues relevant to fishers, including the future
of their fisheries (Henry and Lyle, 2003; Beck et al., 2009; Crosson, 2010).
The main advantages of using telephone surveys are that these surveys
often have high response rates and short turn-around times. Of further advantage
12
is that the resultant data can also be entered directly into a computer by the
telephone interviewer and that, in comparison with face-to-face surveys and on-site
surveys, they are relatively inexpensive. The ability for questionnaires and
responses to be computerised, such as through the use of a Computer Assisted
Telephone Interview (CATI) survey method, represents a huge advantage, as it can
facilitate improved quality control and speed up the provision of data for analysis
(Pollock et al., 1994).
While telephone surveys, in comparison with surveys conducted at boat
ramps, enable data to be collected from a larger number of people and, for the
same expense, from a wider area, this sampling technique does not necessarily
cover all ‘types’ of fishers (Pollock et al., 1994; McCluskey and Lewison, 2008). In
some instances, i.e. when anglers are not required to have fishing licences, it is
necessary to sample from a phone directory. Telephone directory sampling frames,
however, only include members of the population who have listed numbers, with
only a proportion of these likely to be fishers (Pollock et al., 1994; Cowx, 2002).
This method also does not account for the fishers who do not have a telephone, or
the increasing number of individuals who use mobile (cell) phones which are not
listed in such directories (Pollock et al., 1994; Kempf and Remington, 2007). Thus,
inherent errors associated with under-coverage and sampling bias can be
introduced. Therefore, a sample drawn from an appropriate sampling frame of
fishers, such as those who hold fishing licences, is better than one drawn from a
phone directory frame alone (Pollock et al., 1994).
Telephone surveys also suffer from many of the same weaknesses as mail
surveys, as they ask anglers to report on past fishing events, thus providing reliable
data only for those experiences that can be easily remembered. In this regard, it
has been pointed out that the ability for people to accurately recall events and
details of fish catches reduces rapidly after about two months, which can lead to
substantial biases, with a general trend towards overestimation of catch (Pollock et
al., 1994; Connelly and Brown, 2011). As long as the potential for overestimates
and biases in the reported catch and effort from participants is recognised,
13
however, this survey method can still provide good angler data (Roach et al.,
1999). In summary, telephone surveys provide reliable data for experiences that
can easily be remembered by an angler, and can thus provide good information on
current attitudes, as well as good demographic and sociological data (Pollock et al.,
1994).
The human dimension 1.4.
One of the shifts in thinking that has emerged within the framework of natural
resource management in recent years is the growing awareness and importance
being placed on the understanding of the behaviours, attitudes and needs of
people, more commonly known as human dimensions (HD) research (Ewert, 1996;
Ditton and Hunt, 2001; Johnston et al., 2010). Human dimensions of recreational
fisheries management is the area of research dedicated to the study of recreational
fishing and anglers (Hunt, 2001). This type of research is about identifying who
anglers are, where they live, how far they travel to go fishing, the fish species they
target and catch, and their experience preferences, together with their views,
values and attitudes towards fisheries resources and management (Hunt, 2001;
Arlinghaus, 2004). Understanding how anglers operate in a fishery can ultimately
assist managers in understanding how that system works, inform stock assessment
models, focus management and conservation priorities and set management
objectives in light of knowledge of the overall ‘public interest’ (Aas and Ditton,
1998; McPhee et al., 2002; Johnston et al., 2010). Human dimensions research can
also provide insight and information to define what constitutes a satisfying fishing
experience. Such information can also be used by governments to provide an
environment that facilitates the delivery of the best possible services, facilities,
fishing opportunities and educational programs for anglers and the general public
(Hunt, 2001; Arlinghaus et al., 2008).
1.4.1. Recreational fisher specialisation
Recreational fishers display wide variation across many fishing-related attributes
including their catch preferences (size, species, and number), levels of avidity (i.e.
14
keen interest or enthusiasm), consumptive orientation (i.e. the degree to which
anglers value the catch-related outcomes of the angling experience), fishing
methods and gear usage and their expectations, commitment, economic
expenditures and social interactions (Sutton and Ditton, 2001; Salz and Loomis,
2005; Kyle et al., 2007).
Bryan (1977) was the first to conceptualise ‘recreation specialisation’ as a
means of identifying particular groups of anglers from within diverse groups of
fishers, according to a single recreational activity, e.g. boat-based, saltwater
anglers (Bryan, 1977; Salz and Loomis, 2005; Oh and Ditton, 2008). Groups of
recreational participants (anglers) are considered to fit along a continuum of
behaviour or specialisation, from the occasional or novice angler at one end of the
spectrum to the technique-setting specialist or highly experienced angler at the
other (Bryan, 1977; Ditton et al., 1992; Calvert, 2002; Salz and Loomis 2005; Oh
and Ditton, 2008). The types and locations of anglers on the continuum are
reflected in such phenomena as their frequency of participation, fishing locations
and technique preferences, choice of equipment, importance of catch, social setting
of activity and preferences for resource management (Bryan, 1977; Ditton et al.,
1992). As the level of angler specialisation increases, there is often a shift in focus
from fish harvest and consumption towards resource conservation, and an
increased emphasis on enjoying the activity itself and the natural environmental
setting (Oh and Ditton, 2006a; 2008), however, this premise doesn’t always hold
true (Dorow et al., 2010).
1.4.2. The specialised angler
In the overall context of recreational fisheries management, specialised anglers are
very important stakeholders (Hilborn, 1985). In terms of management, important
attributes of specialised anglers (i.e. relative to novice anglers) are their higher
levels of activity and involvement, ecological understanding and success in catching
fish (Hilborn, 1985; Dorow et al., 2010). Specialised anglers also often place
greater importance on the size and quality of fish caught than on quantity, and
15
have been found to show greater support for catch and release methods than their
counterparts (Sutton and Ditton, 2001; Salz and Loomis, 2005; Hutt and Bettoli,
2007; Danylchuk and Cooke, 2010). Distributions of overall catch (and effort),
particularly for higher value fish species, are usually skewed, however, with small
numbers of more specialised and avid anglers taking a large proportion of the
overall catch (Hilborn, 1985; Baccante, 1995; Dorow et al., 2010; Johnston et
al., 2010). Specialised anglers are also more likely to be actively involved with local
fishing clubs, participate in fishing tournaments and be members of national fishing
organisations (Salz and Loomis, 2005). They often have large social and financial
investments in fishing and often voice the strongest opinions in response to
management actions (Wilde et al., 1998; Arlinghaus and Mehner, 2003; Margenau
and Petchenik, 2004; Salz and Loomis, 2005).
1.4.3. Research questions arising from human dimensions
Since Bryan’s early work (Bryan, 1977), many researchers have explored the
notion of recreation specialisation in many different types of outdoor leisure-based
activities, e.g. fishing (Ditton et al., 1992), hunting (Kuentzel and Heberlein, 1992),
camping (McIntyre, 1989; McIntyre and Pigram, 1992), canoeing/boating
(Wellman et al.,1982; Donnelly et al., 1986; Kuentzel and McDonald, 1992; Bricker
and Kerstetter, 2000), bird-watching (Lee and Scott, 2004; McFarlane, 1994;
1996), hiking (Virden and Schreyer, 1988), and scuba diving (Thapa et al.,
2005; 2006). In recent years, the concept has also been extended to such activities
as heritage tourism (Kerstetter et al., 2001), golf tourism (Kim et al., 2008) and
indoor recreational activities such as bridge (Scott and Godbey, 1994).
Some key points emerge from an examination of the literature on human
dimensions and the use of specialisation theory in leisure-based systems,
particularly in its application in fisheries science. Firstly, the characteristics of
anglers will differ slightly from fishery to fishery (Schramm et al. 1998; Aterburn et
al., 2001; 2002; Anderson et al., 2007; Zichke et al., 2012). Certainly, there may
be some similarities in the characteristics of recreational anglers in different
16
fisheries, e.g. anglers in a trout fishery and a tuna sport fishery will have a target
species, employ specialised gear types, etc. For anglers within a specific fishery,
however, those characteristics, behaviours, attitudes and needs are likely to be
influenced strongly and ultimately shaped by the nature of the fishery, the
abundance of the stocks, the management context, and the socio-economic
environment in which the fishery operates, thus highlighting the importance of not
generalising findings too broadly from one specialisation study, to the next
(Beardmore et al., 2013).
Secondly, as with the first point, it is likely that the factors that relate to
recreational fishing specialisation will be determined by the biology and abundance
of the targeted species and the management context of the fishery. For example, if
a species is abundant and easily caught, there would be little advantage in angler
specialisation to increase catch success, but the opposite would hold true when the
species is highly prized and difficult to catch, with increased knowledge and skill
giving an angler a considerable advantage (Scott and Godbey 1994; Sutton, 2001;
Salz and Loomis, 2005; Zichke et al., 2012; Beardmore et al., 2013). Further, it
has been noted that a casual (i.e. less specialised and committed) angler is happy
to catch ‘something’ whilst out fishing for the day (Graefe, 1980; Dorow et al.,
2010; Beardmore et al., 2013), usually the bigger the better. A specialist or more
avid angler, however, will likely have a specific target species (Dorow et al., 2010),
and use high-quality species specific fishing tackle and is more likely to select
fishing waters based on their premium fishing quality. These specialist anglers, who
are likely to use many sources of information about fishing and may subscribe to
angling magazines devoted to a certain species or fishing styles, will also have
certain expectations regarding the fishing trip (Beardmore et al., 2013). It should
be noted, however, that these assumptions do not always hold true as several
studies have noted the use of more high quality angling gear by the less specialised
anglers (Beardmore et al., 2013), with some specialised and avid anglers preferring
more traditional and/or challenging fishing methods such as fly fishing (Hutt and
Bettoli, 2007; Wilde et al., 1998; Zichke et al., 2012). It should also be recognised
17
that the defining characteristics of an avid and specialised angler in one fishery may
not be identical to the characteristics of specialised anglers in another.
The recreational fishery for demersal fish in the West Coast Bioregion of
Western Australia is a multispecies fishery with two iconic fish species, each of
which is highly prized by anglers but which, because of its low abundance, is
difficult to catch. Other ‘bread and butter’ fish are more abundant and easier to
catch. This study explores whether, in accordance with human dimensions and
specialisation theory and within the context of the multispecies nature of this
demersal fishery, the characteristics of the boat-based recreational anglers who are
content to catch a mixture of ‘bread and butter’ species differ from those of the
more specialised fishers who seek to catch the two iconic species, and whether the
characteristics of the latter group of fishers reflect specialisation to improve
potential catches of those prized species.
Assessing the implications of behavioural responses by 1.5.
anglers
In addition to the collection of angler data, tools are required to facilitate the
determination of the likely behavioural responses of anglers to environmental
change or changes in fisheries regulations and their implications for management.
For example, qualitative models, such as that of Metcalf et al. (2010), have proven
to be useful for exploring the ways in which the behaviour of fishers might influence
the effectiveness of fisheries regulations (Justus, 2005; Bakus, 2007; Dambacher et
al., 2009). Such models, however, while possibly providing a semi-quantitative
assessment of the consequences of behavioural responses, are largely unable to
quantify the impacts of those responses (Whipple et al., 2000). Quantitative models
that have been used for fishery assessment include those that range from single-to
multi-species models, through to whole-of-ecosystem models. The last of these
model types has proven to be particularly useful for the holistic exploration of
fishery systems, including the ability to explore the interactions between fish,
18
fishers, and managers (Latour et al., 2003; Pikitch et al., 2004; Plagányi, 2007;
FAO, 2008; Koen-Alonso, 2009; Schlüter et al., 2012).
Agent-based models such as OSMOSE (Shin and Cury, 2001; Shin et al.,
2004) and INVITRO (Gray et al., 2006) have provided modelling platforms that are
well suited to exploring the implications of the behavioural responses of fishers to
changes in fish abundance and management regulations. Such approaches have
been shown to be particularly useful in understanding the ‘emergent’ behaviour of
multiple agents, which can adapt to ecological and economic constraints through
learning and negotiation processes (Billari et al., 2006). Moreover, agent-based
modelling techniques are also valuable for explaining how individual agents make
strategic decisions and interact on multiple levels (Kaitala and Munro, 1995;
Dockner et al., 2000; BenDor et al., 2009).
This study employed agent-based modelling (ABM) to explore the
implications, for fisheries management, of a range of recreational fisher behaviours
and also focussed on changes in model output in response to changes in certain
parameters such as the abundance of a key fish species.
Agent-based modelling 1.6.
Agent-based models (ABMs), sometimes referred to as individual-based models
(IBMs), are computer models which simulate the behaviours of, and interactions
between, collections of ‘agents’ (i.e. individuals, such as individual anglers) with
each other and/or their environment (see Lomnicki, 1992; Grimm, 1999; Grimm et
al., 2005; Breckling et al., 2006). Unlike more traditional (state-variable) models,
that are based on differential and difference equations, and classical models such as
the logistic model of population growth, which describe the (mean) dynamics of a
pool of individuals, ABMs focus on the lowest entities of a system, i.e. the individual
(Grimm, 1999). Agent-based models have been used for a wide variety of purposes
across a range of disciplines (Van Dyke Parunak et al., 1998), including fisheries
science (e.g. Rose and Cowan, 1993; Dreyfus-Leon, 1999; Rothschild, 2000; Little
19
et al., 2004; Yu et al., 2009; Hesp et al., 2012; Saul et al., 2012). For example,
Saul et al. (2012) employed an individual-based model to explore the migration
patterns of red grouper (Epinephelus morio) on the West Florida Shelf. Their results
from the biased random walk model used to simulate the directional movement of
fish from inshore nursery habitats to the offshore reef habitat inhabited by adults,
were comparable to empirical results and to observed catches at age.
The rules describing the behaviours of the agents may be based on random
choices among alternative decisions (according to relative probabilities), or may be
modelled in more sophisticated ways. Thus, for example, Dreyfus-León (1999) and
Dreyfus-León and Kleiber (2001) used neural networks (i.e. a computing method
based on the way the human brain performs computations) to model the decision-
making processes and search behaviours of fishers, while Little et al. (2004)
simulated fisher behaviours using Bayesian networks. However, due to the
computational demands of modelling the behaviours of each of the individual
agents that need to be considered in agent-based models, simpler and more easily-
computed rules are frequently used. Coincident with increases in computer
technology, studies employing this computer-intensive simulation approach (i.e.
agent-based modelling) are becoming increasingly reported in the literature (see
Schlüter et al., 2012).
1.6.1. Characteristics of agent-based models
There are several characteristics that distinguish ABMs from other modelling
approaches. In this regard, Grimm and Railsback (2005) provide a set of
characteristics for what they refer to as ‘individual-based ecology’ - the field of
ecology concerned with the use of IBMs (or ABMs). Although specific to ecological
applications, these characteristics can be used to illustrate the key attributes of
ABMs in general.
The purpose of an ABM is to understand system properties and the impacts
of agent behaviour on the emergence of such properties (Lomnicki, 1992;
O'Sullivan, 2008). Agents do not exist in isolation, but interact with other agents of
20
the same and different types and their environment (Bosquet and Le Page, 2004).
Hence, to properly model a system using agent representations of the system’s
actors, it is crucial that the system is modelled as a collection of unique agents
(Breckling et al., 2006).
Unlike traditional modelling approaches, ABMs are not formed from
differential equations, but from concepts derived from complexity science, i.e. the
science of complex, adaptive systems (Railsback, 2001). These concepts include
emergence and adaptability (Railsback, 2001; Grimm and Railsback, 2005).
Emergence refers to the way in which system-level properties arise from the
characteristics of the system’s component parts, namely the agents and the
environment (Railsback, 2001). Adaptability refers to the way in which agents in a
model increase their own ‘fitness’, through ‘making decisions’ by means of
procedural rules in the model (Grimm and Railsback, 2005).
As described above, a key element of agent-based models is that they
involve simulation. Important properties of simulation are that the agents in the
system must be separately accessible and have at least one property that
distinguishes them from each other. For this reason, agent-based modelling lends
itself well to object-oriented programming (Grimm and Railsback, 2005; Grimm et
al., 2010).
As the purpose of an ABM is to explore some aspect of a real world scenario,
it is crucial that the researchers have some knowledge of the agents and system
they are modelling. In this regard, field or laboratory studies can be useful in
constructing models of agent behaviour, and organising and testing the model
(DeAngelis et al., 1980; Grimm and Railsback, 2005; Benenson et al., 2008).
1.6.2. Advantages of using agent-based modelling
Agent-based models can be useful both for developing ecological theory and for
practical management, as they allow researchers to consider aspects usually
ignored in analytical models, such as variability among individuals, local
interactions in the system, differences in how an organism behaves/interacts at
21
different stages in its lifecycle, and how individuals might ‘adapt’ to changes in their
environment (Grimm et al., 2006; Mathews et al., 2007). ABMs are also ideally
suited for scenario-testing, and thereby allow managers and users an opportunity
to investigate the likely consequences of many different management scenarios
before any management decisions are implemented (Hunt et al., 2007; Cabral et
al., 2010). ABMs also have the advantage of being able to incorporate real habitat
(GIS) data (Kennedy et al., 2009).
There are also several key advantages of ABMs compared with other
modelling techniques: (1) the simulation model is able to capture emergent
phenomena (Bonabeau, 2002), (2) the model provides a natural description of a
system and its processes (Van Winkle et al., 1993; Bonabeau, 2002), and (3) this
type of model is flexible in nature (Bonabeau, 2002). ABMs can allow for individuals
(agents) represented in the model to be equipped with the adaptive behaviours of
memory and learning, and thus, throughout a model simulation, an agent can learn
and modify its behaviours to improve its outcomes (McLane et al., 2011). In this
regard, ABMs can more accurately represent reality, e.g. as in real life, fishers are
able to ‘make decisions’ (Dreyfus-Leon and Kleiber, 2001).
1.6.3. Agent-based models in fisheries science
As noted above, agent based models such as OSMOSE (Object-oriented Simulator
of Marine Ecosystem Exploitation) (Shin and Cury, 2001; Shin et al., 2004) and
INVITRO (Gray et al., 2006) have been used in fisheries studies to explore
ecosystem and associated socio-economic processes. Two other key areas in which
ABMs have been applied in fisheries science include investigations into fish
displacement (distribution and migration patterns), and as a tool to explore the
mechanisms responsible for recruitment success or failure in commercially
important marine fish stocks (see Miller, 2007 for a more in depth review)
(Bastardie et al., 2010).
Although there is increasing interest in modelling angler behaviours to
improve management in fisheries (Fenichel et al., 2013), agent-based models have
22
thus far typically been used to model the behaviours of fishers in commercial
fisheries, with the exception of an ABM for a recreational fishery in Ontario, as
briefly described by Hunt et al. (2006) and an ABM to simulate recreational fishing
activities and their interactions with the environment in the Ningaloo Marine Park,
Western Australia (Gao and Hailu, 2010; 2011; 2012; 2013).
With fisheries managers becoming increasingly aware of the growing
impacts of recreational fishing (e.g. McPhee et al., 2002; Cooke and Cowx, 2004;
Granek et al., 2008; Gao and Hailu, 2011), the modelling of the behaviours of
recreational fishers represents an area where future research is likely to be
beneficial. In the context of this thesis, an agent-based model was adopted as the
tool to explore the process through which the behaviour of recreational fishers was
likely to affect the catches that were made by those fishers in response to changes
in fish abundance. Understanding such processes is necessary if fisheries managers
are to assess how fishers might respond to changes in fisheries regulations.
Objectives and thesis chapter outline 1.7.
The overall objective of this project was to explore the research questions identified
above (Section 1.4.3) by describing the characteristics, i.e. motivations, behaviours
and fine-scale movements when boat fishing, of recreational boat fishers in the
Perth Metropolitan Region and testing hypotheses to determine whether survey
results relating to non-avid and avid anglers were consistent with the differences
expected on the basis of published results of other recreational fishing studies. The
characteristics of members of recreational fishing clubs were also compared with
those of more avid fishers from the general population of boat-based, recreational
anglers to assess whether the results of such comparisons were consistent with the
hypothesis that club members represent a group of more specialised anglers who
target the more iconic demersal fish species within the West Coast Bioregion of
Western Australia. A profile of the characteristics of these club members was then
constructed with the ultimate purpose of developing an agent-based model to
23
simulate the targeting behaviours of these fishers for two iconic marine fish
species, West Australian dhufish (Glaucosoma hebraicum) and pink snapper
(Chrysophrys auratus) that occupy the waters off the south-western coast of
Australia. The aim of this latter component of the study was to demonstrate how
fishers’ behaviour, such as, for example, fine scale movements between fishing
locations in response to changes in abundance of a targeted species, would be
likely to affect the catches of not only the target species but also those of other
species.
The specific objectives and/or hypotheses relating to the survey studies and
agent-based modelling study are outlined in the relevant chapters. To facilitate the
presentation of each chapter as an essentially stand-alone unit, some material
contained in this introduction is also presented within the introductory text of these
chapters.
Chapter 2 explores, describes and compares the behaviours and motivations of
non-avid and avid recreational boat fishers near the Western Australian capital city
of Perth. The Recreational Fishing Boat Licence (RFBL) database provided a frame
from which a random sample of licence holders (aged 18 years or older) was
selected and surveyed by telephone in the Perth Metropolitan Region. In order to
gain a better understanding of the characteristics of non-avid and avid anglers in
this region, i.e. differences in anglers’ participation and motives for fishing, the gear
and methods they use, their movements during a fishing trip, and the fish species
that they target and land were examined.
Chapter 3 examines and describes the characteristics, catch preferences,
behaviours, movement patterns, gear and angling methods of members of fishing
clubs in the Perth Metropolitan Region. These recreational fishers represent a group
of highly specialised boat anglers (SBAs), who typically target and catch marine,
demersal fish species (i.e. West Australian dhufish and pink snapper). The
characteristics of these anglers were compared with those obtained from the more

24
avid recreational fishers who participated in the phone survey described in Chapter
2. Club members were also asked to provide data on their targeting methods for
catching the iconic West Australian dhufish and pink snapper in the region, such
that these results might be used to inform an agent-based model of the
recreational fishery for these species.
Chapter 4 describes an agent-based model for simulating the dynamics of the
recreational fishery for West Australian dhufish and pink snapper. Simulations using
this model were undertaken for a range of scenarios of differing fish abundance and
management regulations to explore how certain behavioural responses by fishers to
differences in these factors affect catches of West Australian dhufish and pink
snapper and were thus also likely to affect the sustainability of these species.
Lastly, Chapter 5 discusses the broader perspectives and conclusions of the surveys
and agent-based modelling results. The surveys undertaken in this study have
attempted to provide insight into the characteristics of anglers in the Perth
Metropolitan Region in terms of their catch preferences, behaviours, movement
patterns, gear and angling methods with the hope of aiding human dimensions
(HD) research in the Region. The notion of using specialisation theory to assist in
discerning why different anglers seek different types of fishing opportunities and
experiences was also explored. Further, the identification of such angler segments
represents the first step in understanding the objectives and requirements of those
different groups. It is recognised, however, that on-going research and inclusion of
human dimensions research is required. The integrated-modelling approach
presented in this study could potentially be of benefit in helping to predict how boat
fishers operating in multi-species line fisheries may respond to changes in
management and fish abundance, and the implications of this for the success of
fisheries management.
25
2. Comparisons of the motivations, behaviours and movements of non-avid and avid recreational boat anglers in south-western Australia
Introduction 2.1.
Many major fisheries problems around the world can be attributed to a failure to
understand and manage fishers, rather than a lack of knowledge of fishery
resources (Hilborn, 1985; Hilborn et al., 2003; Beddington et al., 2007; Worm et
al., 2009; Fenichel et al., 2013). Traditionally, most research has focussed on the
collection of ecological and biological data and assessment of the direct effects of
fishing on fish stocks. There is increasing recognition by fisheries managers,
however, of the need to better understand the human component of fisheries and
to allow for this when developing management strategies (Wilde et al., 1996;
Arlinghaus, 2004; Little et al., 2004). This is particularly the case with recreational
fisheries as the fishing-related attributes of anglers vary widely in relation to catch
preferences (size, species, and number), avidity (i.e. frequency of fishing), fishing
behaviours and motivations, gear, economic investment, and social interactions
(Salz and Loomis, 2005). Although an understanding of the behaviours of
recreational anglers is considered important to ensuring sustainability of the fish
stocks targeted by recreational fishers, information regarding their behaviours is
too often under-represented in modern recreational fisheries science and
management (Arlinghaus, 2006; Schlüter et al., 2012).
To better account for the behaviours of recreational anglers in fisheries
management, studies are required to elucidate, in detail, the full diversity of
behaviours and associated attributes of recreational fishers. Such studies fall within
the discipline of human dimensions (HD) research, which, in the context of
fisheries, is the field of science that attempts to describe, predict, understand, and
also affect human thoughts and actions towards fishery resources (Aas and Ditton,
1998).
26
Recreational fishers can be classified broadly as avid and non-avid anglers.
Graefe (1980) first proposed the use of frequency of participation as a useful
measure for characterising anglers as avid or non-avid fishers (Ditton, 1996;
Fisher, 1997; Salz et al., 2001) as, in general, in comparison with non-avid fishers,
avid fishers tend to fish more frequently, invest more in fishing gear and
technology, target particular fish species, possess better fishing skills and
knowledge and are more successful in catching fish (Hahn, 1991; Ditton et al.,
1992; Salz et al., 2001; Johnston et al., 2010). In the case of marine anglers, avid
anglers are likely to own larger boats with specialist fish-finding equipment, e.g.
global positioning system (GPS) systems and echo sounders. They are also likely to
fish further offshore to target larger fish species and/or fish in areas that are less
accessible to other, less avid fishers, which may thus harbour greater fish
abundances due to reduced exploitation pressure. It might also be expected that, in
comparison with non-avid fishers, avid anglers will more readily modify their fish-
targeting behaviours if they encounter a low catch rate at a particular fishing
location, e.g. respond rapidly by moving to a potentially better fishing location to
increase the chances of catching a fish.
Because avid anglers are typically very successful in catching fish, they can
exert major impacts on fishery resources (Hilborn, 1985; Baccante, 1995; Dorow et
al., 2010; Johnston et al., 2010). Moreover, due to their level of interest and
investment in fishing, they are likely to voice strong opinions in response to
proposed management actions. Thus, there is a particular need for fishery
managers to understand the motivations and behaviours of this group of
recreational fishers (Wilde et al., 1998; Salz and Loomis, 2005; Dorow et
al., 2010).
In addition to providing broad support for the above generalisations
regarding non-avid vs avid fishers, analyses of data from fishery surveys have
yielded many insights into HD aspects of certain recreational fisheries. For example,
avid anglers are more likely to be young, unmarried males (Arlinghaus and Mehner,
2003), and be motivated by the sporting aspects of fishing (Frijlink and Lyle,
27
2010b). These more avid anglers are also more likely to be actively involved with
local fishing clubs and national fishing organisations and seek information related to
fishing techniques and locations from media sources such as magazines, internet
sites, and television (Bryan, 1977; Salz and Loomis, 2005).
In recent decades, an increasing number of fisheries and natural resource
management agencies have conducted angler surveys to gather HD information on
recreational fishers (Wilde et al., 1996; Connelly et al., 2000a; Dempson et al.,
2012). Whilst a variety of different survey approaches can be used (e.g. telephone,
mail, internet, aerial and on-site (creel) surveys), telephone surveys have been
recognised for their ability to obtain good demographic and sociological data, i.e. on
angler preferences, trends in participation rates, fisher profiles, values and attitudes
and angler motivations (Pollock et al., 1994; Arlinghaus, 2004). For the above
reasons, and because of their cost-effectiveness, telephone methods have been
used extensively to estimate levels of harvest and effort in recreational fisheries
around the world, as well as to gather HD information (Jennings, 1992; Lyle et al.,
2002; Henry and Lyle, 2003; Lyle et al., 2005; Pollock, 2010).
In Australia, including Western Australia (W.A.), the angler information that
has typically been collected in fisheries surveys consists mainly of catch and fishing
effort data coupled with general demographic data (e.g. age, gender, motivations)
and economic statistics (e.g. Lyle and Smith, 1998; Sumner and Williamson, 1999;
Malseed et al., 2000; Malseed and Sumner, 2001; Sumner et al., 2002; Henry and
Lyle, 2003; Campbell and Murphy, 2005; Coleman, 2004; Williamson et al., 2006;
Sumner et al., 2008). Boat ownership has typically been found to be high (Lyle and
Smith, 1998; Malseed and Sumner, 2001; Henry and Lyle, 2003) with large
percentages of fishers using modern technology, including the use echo sounders
(>70%) (Sumner et al., 2002; Williamson et al., 2006). The main motivations have
been for relaxation and sport or to spend time with family (Henry and Lyle, 2003),
with low percentages of fishers having club memberships (4-10%) (Lyle and Smith,
1998; Henry and Lyle, 2003; Coleman, 2004). Target species have typically been
iconic species within the area, with crabbing popular around estuaries and
28
waterways (Malseed et al., 2000; Malseed and Sumner, 2001). High levels of
fishing and species knowledge coupled with compliance with existing regulations by
anglers were also reported (Williamson et al., 2006).
The aim of this study was to characterise and then compare, using the
results of a phone survey, the behaviours and motivations of non-avid and avid
recreational boat fishers near the Western Australian capital city of Perth (i.e. the
state’s major population centre). Knowledge of the motivations and behaviours that
characterise the different groups of fishers is likely to assist fishery managers in
meeting the diverse needs of those recreational fishers. More specifically, the study
focussed on testing the following hypotheses:
1. The primary motivations of avid boat-based anglers in the Perth
Metropolitan Region for going fishing are to catch fish for sport, food and
competitions, whereas those of less avid fishers in these regions are
recreational, leisure and family interests.
2. Compared with less avid boat fishers, avid fishers in the Perth Metropolitan
and Peel regions are typically younger and more likely to live close to the
coast, fish on weekdays, own larger boats, travel further offshore to fish,
and use specialised fishing gears and technologies.
3. Compared with less avid boat fishers, avid fishers move more frequently
between fishing locations in search of fish when catch rates are low.
29
Methods 2.2.
2.2.1. Design of questionnaire
A questionnaire was developed to obtain information about the characteristics of
boat-based recreational anglers, aged 18 years of age or older, in the ‘Perth
Metropolitan Region’ of Western Australia (Appendix A). Broadly, the data collected
from the questionnaire included details pertaining to each fisher’s frequency of
participation, motivations, value attributed to the fishing experience, gear and
fishing technology used, distance travelled offshore, factors influencing movement
among fishing locations, targeted and retained species and general demographic
information (e.g. gender, age, area of residence).
The questionnaire was designed to be employed in a phone survey carried
out by the experienced and professionally-trained survey team at Edith Cowan
University (ECU) Survey Research Centre, Joondalup W.A., thereby ensuring
interviewer reliability and integrity and avoiding direct contact between the
researcher and the interviewed subjects (Appendix B). Note that the overall final
design and layout of the questionnaire was refined in consultation with Vicki
Graham and Theresa Wilkes at the ECU Survey Research Centre. After finalising the
design, the survey questions were loaded into the Research Centre’s computer-
assisted telephone interviewing (CATI) system for use by the interviewers at the
Centre.
2.2.2. Sampling design
Six hundred fishers, with residences located within the Perth Metropolitan and Peel
Regions (75 km south of Perth), were randomly-selected (using simple random
sampling) for inclusion in the telephone survey for this study by the Department of
Fisheries, Western Australia, from its ‘Recreational Fishing from Boat Licence’
(RFBL) database. Based on its address details, each record within this database had
been assigned by the Department of Fisheries to an associated region, where the
boundaries of the different regions were those described in the Regional
Development Commissions Act (RDCA) of Western Australia. The total number of
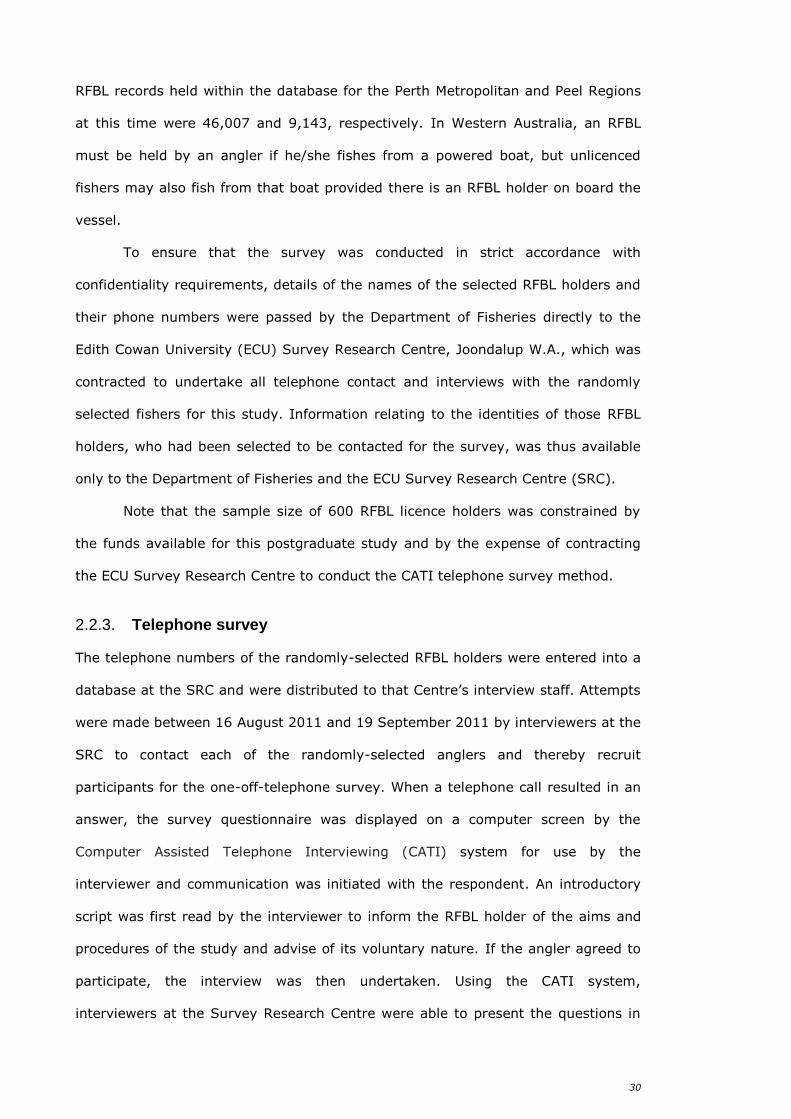
30
RFBL records held within the database for the Perth Metropolitan and Peel Regions
at this time were 46,007 and 9,143, respectively. In Western Australia, an RFBL
must be held by an angler if he/she fishes from a powered boat, but unlicenced
fishers may also fish from that boat provided there is an RFBL holder on board the
vessel.
To ensure that the survey was conducted in strict accordance with
confidentiality requirements, details of the names of the selected RFBL holders and
their phone numbers were passed by the Department of Fisheries directly to the
Edith Cowan University (ECU) Survey Research Centre, Joondalup W.A., which was
contracted to undertake all telephone contact and interviews with the randomly
selected fishers for this study. Information relating to the identities of those RFBL
holders, who had been selected to be contacted for the survey, was thus available
only to the Department of Fisheries and the ECU Survey Research Centre (SRC).
Note that the sample size of 600 RFBL licence holders was constrained by
the funds available for this postgraduate study and by the expense of contracting
the ECU Survey Research Centre to conduct the CATI telephone survey method.
2.2.3. Telephone survey
The telephone numbers of the randomly-selected RFBL holders were entered into a
database at the SRC and were distributed to that Centre’s interview staff. Attempts
were made between 16 August 2011 and 19 September 2011 by interviewers at the
SRC to contact each of the randomly-selected anglers and thereby recruit
participants for the one-off-telephone survey. When a telephone call resulted in an
answer, the survey questionnaire was displayed on a computer screen by the
Computer Assisted Telephone Interviewing (CATI) system for use by the
interviewer and communication was initiated with the respondent. An introductory
script was first read by the interviewer to inform the RFBL holder of the aims and
procedures of the study and advise of its voluntary nature. If the angler agreed to
participate, the interview was then undertaken. Using the CATI system,
interviewers at the Survey Research Centre were able to present the questions in
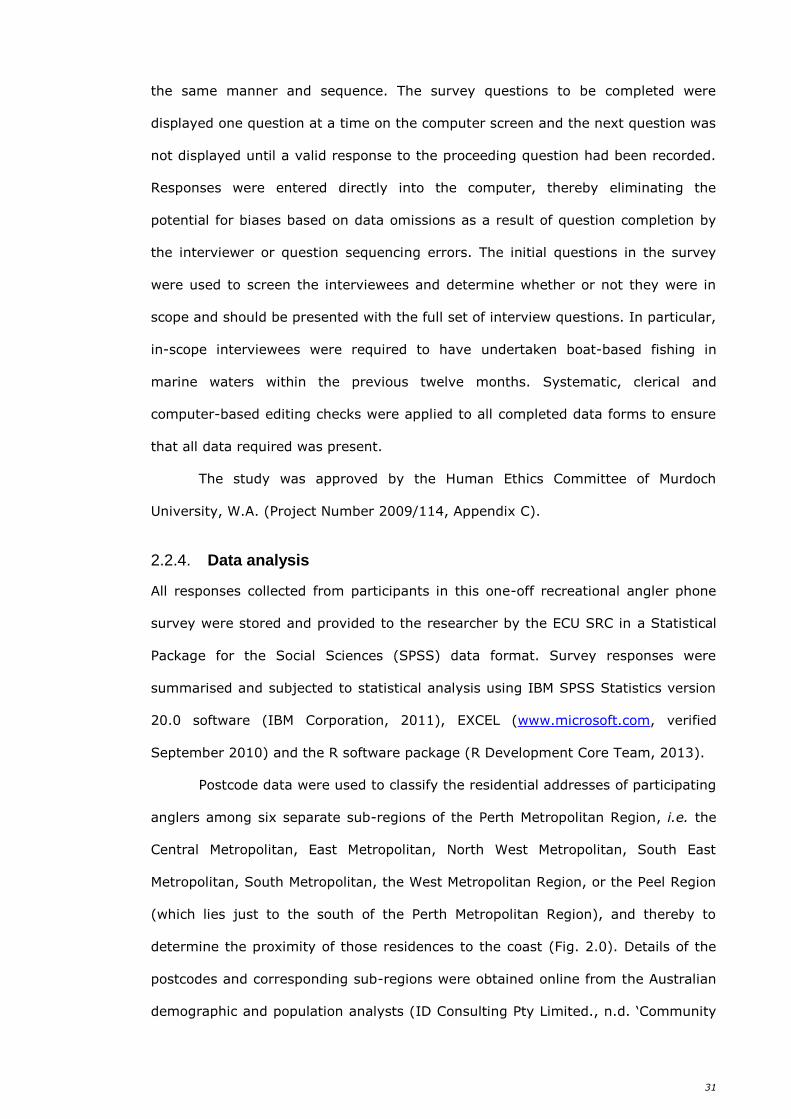
31
the same manner and sequence. The survey questions to be completed were
displayed one question at a time on the computer screen and the next question was
not displayed until a valid response to the proceeding question had been recorded.
Responses were entered directly into the computer, thereby eliminating the
potential for biases based on data omissions as a result of question completion by
the interviewer or question sequencing errors. The initial questions in the survey
were used to screen the interviewees and determine whether or not they were in
scope and should be presented with the full set of interview questions. In particular,
in-scope interviewees were required to have undertaken boat-based fishing in
marine waters within the previous twelve months. Systematic, clerical and
computer-based editing checks were applied to all completed data forms to ensure
that all data required was present.
The study was approved by the Human Ethics Committee of Murdoch
University, W.A. (Project Number 2009/114, Appendix C).
2.2.4. Data analysis
All responses collected from participants in this one-off recreational angler phone
survey were stored and provided to the researcher by the ECU SRC in a Statistical
Package for the Social Sciences (SPSS) data format. Survey responses were
summarised and subjected to statistical analysis using IBM SPSS Statistics version
20.0 software (IBM Corporation, 2011), EXCEL (www.microsoft.com, verified
September 2010) and the R software package (R Development Core Team, 2013).
Postcode data were used to classify the residential addresses of participating
anglers among six separate sub-regions of the Perth Metropolitan Region, i.e. the
Central Metropolitan, East Metropolitan, North West Metropolitan, South East
Metropolitan, South Metropolitan, the West Metropolitan Region, or the Peel Region
(which lies just to the south of the Perth Metropolitan Region), and thereby to
determine the proximity of those residences to the coast (Fig. 2.0). Details of the
postcodes and corresponding sub-regions were obtained online from the Australian
demographic and population analysts (ID Consulting Pty Limited., n.d. ‘Community
32
profiles’). This website uses current Census data to present population and
community statistics to the public, with more than 250 councils across Australia and
New Zealand subscribing to this resource and making the information available via
their own council websites. Information on the population size in each of those sub-
regions was also drawn from the same source. It is important to note that flaws
within the existing database of RFBL holders do exist, as the data collected are not
necessarily scrutinised to the same level of detail that has been performed in this
study. Thus, some (negligible) data have been excluded from figures presented in
the results section if they have fallen out of the re-allocated postcode sub-regions
used for further analyses. Furthermore, any fisher within the existing database of
RFBL holders with an age ≥ 100 y was excluded from analyses.
Based on the Department’s ecosystem based fisheries management (EBFM)
policy, each of the bioregions is also divided into broad ecological depth based
habitats (Department of Fisheries, 2011; Fletcher and Santoro, 2012): pelagic
(across all depths), offshore (demersal greater than 250 m), inshore (demersal 20–
250 m), near shore (to 20 m deep), estuarine (saltwater and ‘brackish’ to river
mouth), and freshwater (river, stream, dams) (Ryan et al., 2013) (Fig. 2.1).
Details of the particular species targeted by the 105 anglers who had
reported they were mainly aiming to catch a fish species other than West Australian
dhufish (Glaucosoma hebraicum) or pink snapper (Chrysophrys auratus) during
their last boat fishing trip (see Appendix D for a full summary of the anglers’
responses) were recorded by interviewers. The responses of anglers, who had
reported that they were targeting more than one species, were placed in a ‘mixed’
category and this category was further separated into ‘inshore’ and ‘offshore’
species and then into ‘pelagic’ and ‘demersal’ species.
The response rate, 𝑅𝑅, in this study was calculated using the equation:
𝑅𝑅 = 𝑁𝑖
𝑁𝑒
where 𝑁𝑖 is the number of completed interviews from fully responding participants
of the survey and 𝑁𝑒 is the number of fishers from the eligible sample, i.e. the
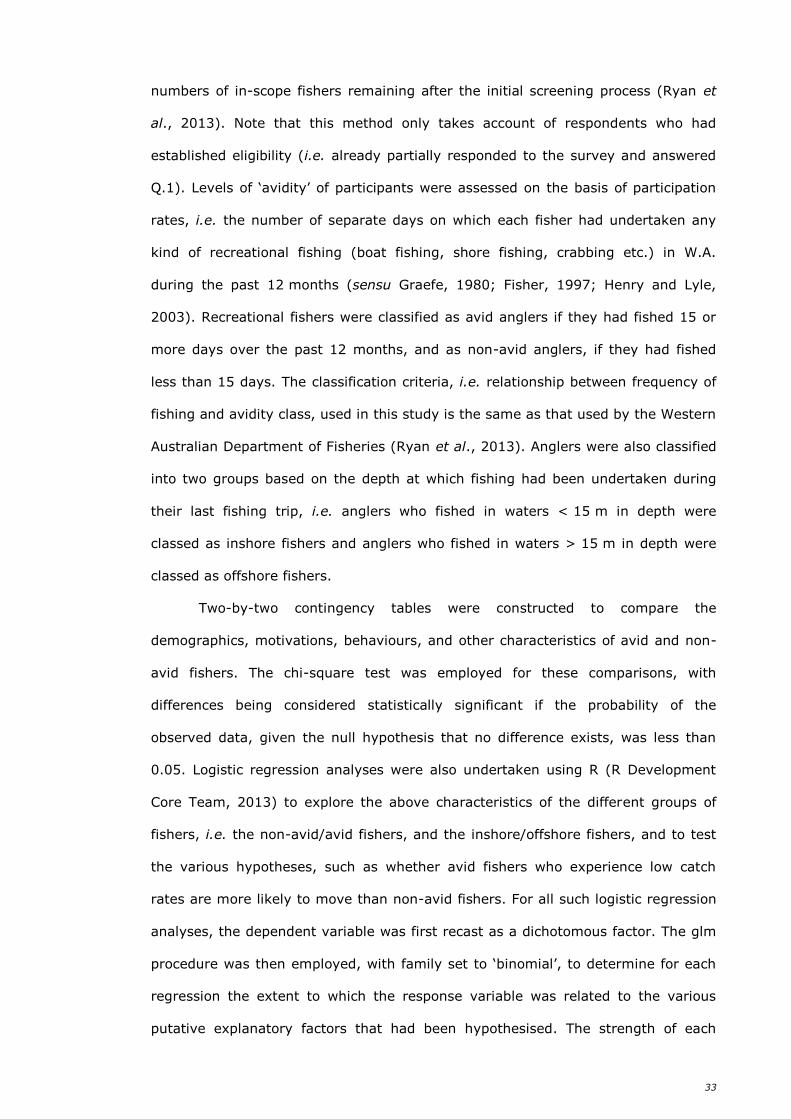
33
numbers of in-scope fishers remaining after the initial screening process (Ryan et
al., 2013). Note that this method only takes account of respondents who had
established eligibility (i.e. already partially responded to the survey and answered
Q.1). Levels of ‘avidity’ of participants were assessed on the basis of participation
rates, i.e. the number of separate days on which each fisher had undertaken any
kind of recreational fishing (boat fishing, shore fishing, crabbing etc.) in W.A.
during the past 12 months (sensu Graefe, 1980; Fisher, 1997; Henry and Lyle,
2003). Recreational fishers were classified as avid anglers if they had fished 15 or
more days over the past 12 months, and as non-avid anglers, if they had fished
less than 15 days. The classification criteria, i.e. relationship between frequency of
fishing and avidity class, used in this study is the same as that used by the Western
Australian Department of Fisheries (Ryan et al., 2013). Anglers were also classified
into two groups based on the depth at which fishing had been undertaken during
their last fishing trip, i.e. anglers who fished in waters < 15 m in depth were
classed as inshore fishers and anglers who fished in waters > 15 m in depth were
classed as offshore fishers.
Two-by-two contingency tables were constructed to compare the
demographics, motivations, behaviours, and other characteristics of avid and non-
avid fishers. The chi-square test was employed for these comparisons, with
differences being considered statistically significant if the probability of the
observed data, given the null hypothesis that no difference exists, was less than
0.05. Logistic regression analyses were also undertaken using R (R Development
Core Team, 2013) to explore the above characteristics of the different groups of
fishers, i.e. the non-avid/avid fishers, and the inshore/offshore fishers, and to test
the various hypotheses, such as whether avid fishers who experience low catch
rates are more likely to move than non-avid fishers. For all such logistic regression
analyses, the dependent variable was first recast as a dichotomous factor. The glm
procedure was then employed, with family set to ‘binomial’, to determine for each
regression the extent to which the response variable was related to the various
putative explanatory factors that had been hypothesised. The strength of each
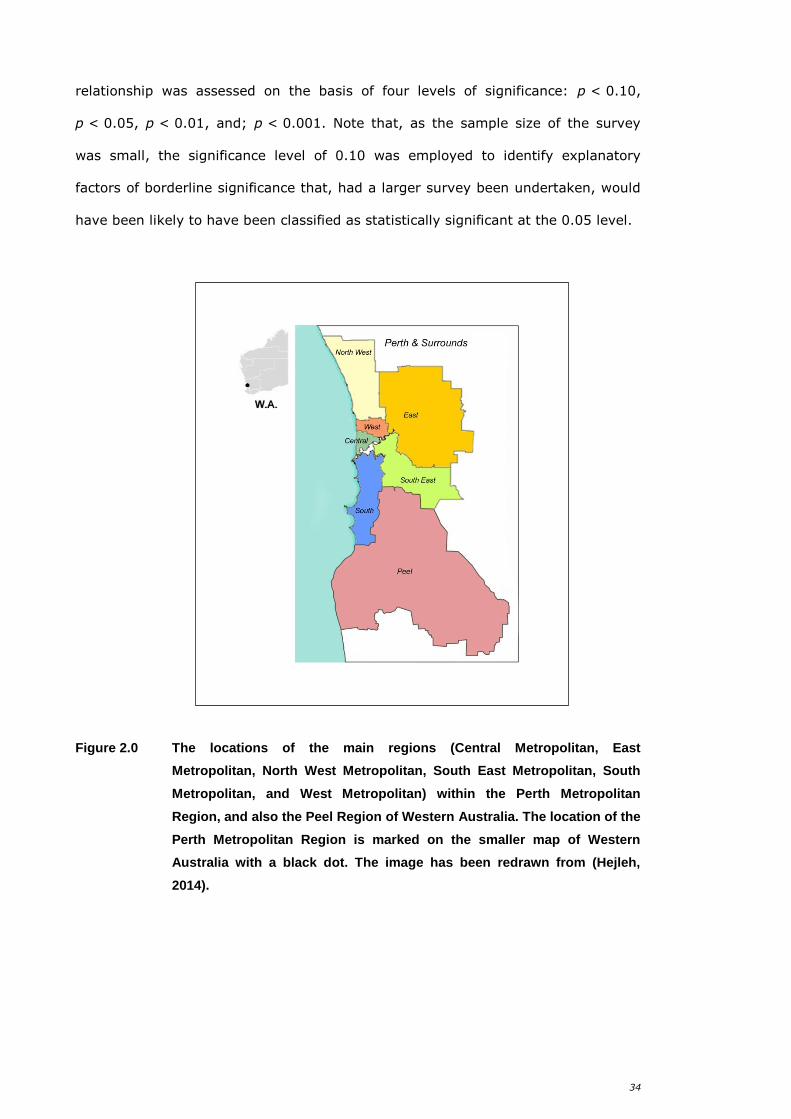
34
relationship was assessed on the basis of four levels of significance: p < 0.10,
p < 0.05, p < 0.01, and; p < 0.001. Note that, as the sample size of the survey
was small, the significance level of 0.10 was employed to identify explanatory
factors of borderline significance that, had a larger survey been undertaken, would
have been likely to have been classified as statistically significant at the 0.05 level.
Figure 2.0 The locations of the main regions (Central Metropolitan, East
Metropolitan, North West Metropolitan, South East Metropolitan, South
Metropolitan, and West Metropolitan) within the Perth Metropolitan
Region, and also the Peel Region of Western Australia. The location of the
Perth Metropolitan Region is marked on the smaller map of Western
Australia with a black dot. The image has been redrawn from (Hejleh,
2014).
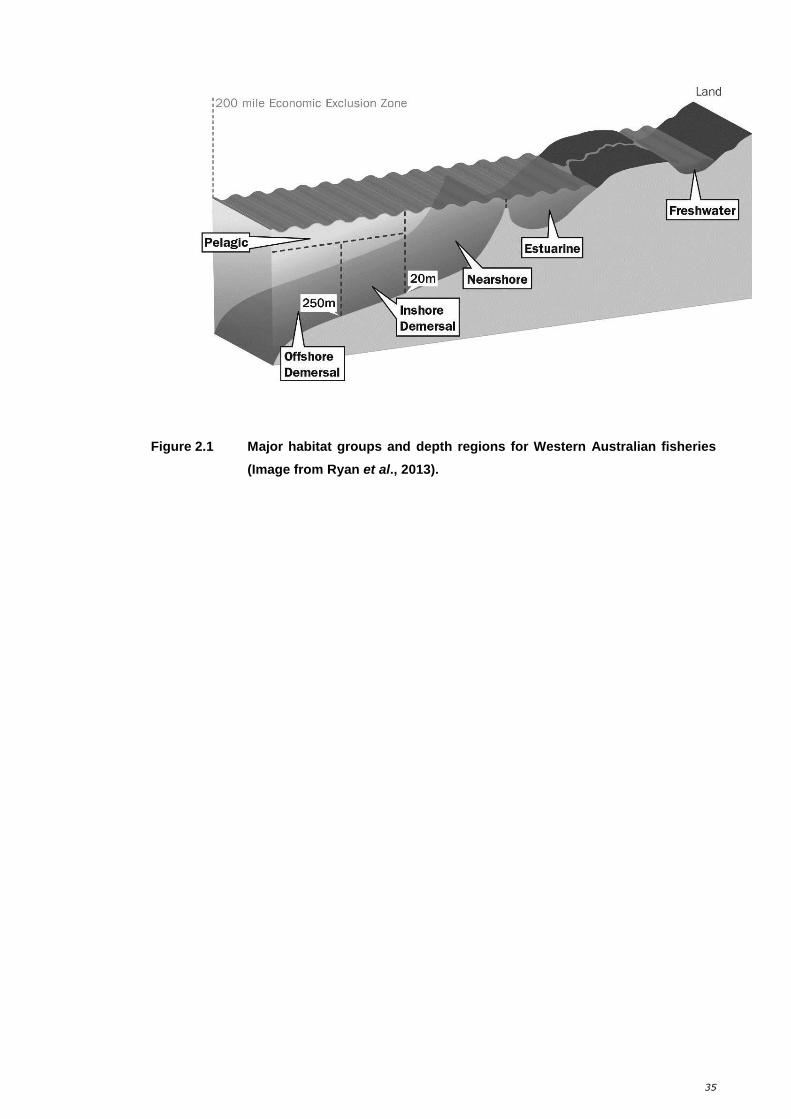
35
Figure 2.1 Major habitat groups and depth regions for Western Australian fisheries
(Image from Ryan et al., 2013).
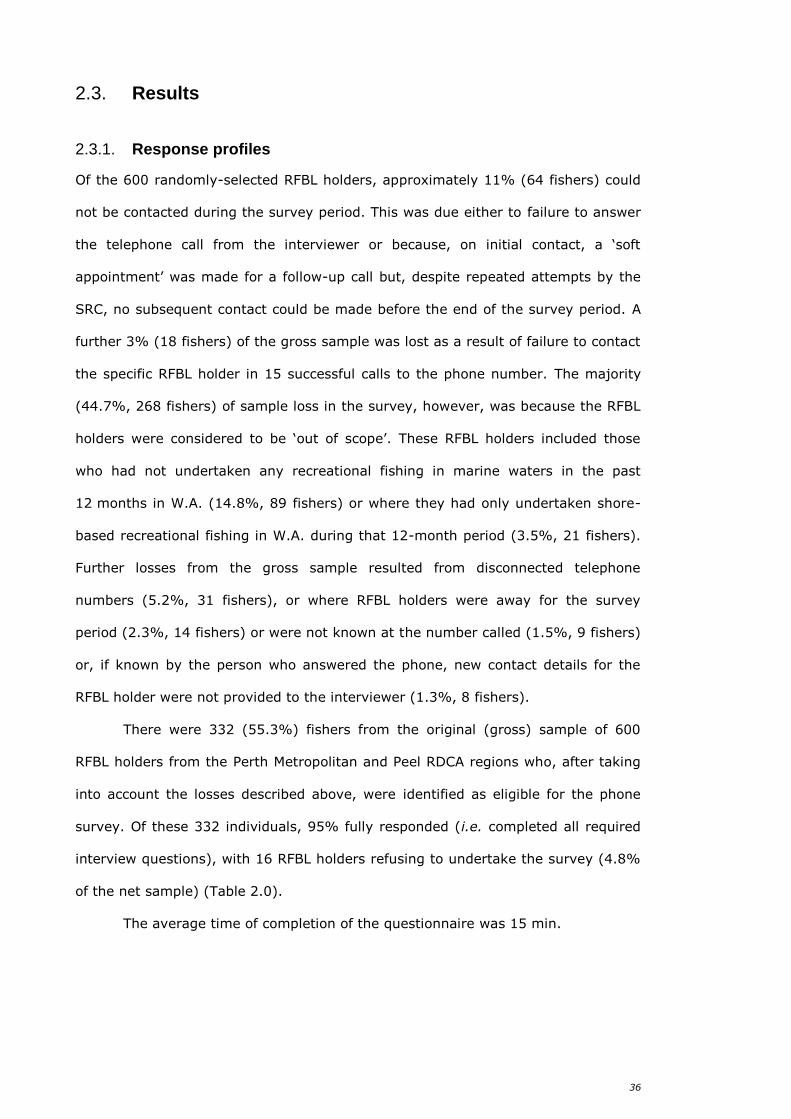
36
Results 2.3.
2.3.1. Response profiles
Of the 600 randomly-selected RFBL holders, approximately 11% (64 fishers) could
not be contacted during the survey period. This was due either to failure to answer
the telephone call from the interviewer or because, on initial contact, a ‘soft
appointment’ was made for a follow-up call but, despite repeated attempts by the
SRC, no subsequent contact could be made before the end of the survey period. A
further 3% (18 fishers) of the gross sample was lost as a result of failure to contact
the specific RFBL holder in 15 successful calls to the phone number. The majority
(44.7%, 268 fishers) of sample loss in the survey, however, was because the RFBL
holders were considered to be ‘out of scope’. These RFBL holders included those
who had not undertaken any recreational fishing in marine waters in the past
12 months in W.A. (14.8%, 89 fishers) or where they had only undertaken shore-
based recreational fishing in W.A. during that 12-month period (3.5%, 21 fishers).
Further losses from the gross sample resulted from disconnected telephone
numbers (5.2%, 31 fishers), or where RFBL holders were away for the survey
period (2.3%, 14 fishers) or were not known at the number called (1.5%, 9 fishers)
or, if known by the person who answered the phone, new contact details for the
RFBL holder were not provided to the interviewer (1.3%, 8 fishers).
There were 332 (55.3%) fishers from the original (gross) sample of 600
RFBL holders from the Perth Metropolitan and Peel RDCA regions who, after taking
into account the losses described above, were identified as eligible for the phone
survey. Of these 332 individuals, 95% fully responded (i.e. completed all required
interview questions), with 16 RFBL holders refusing to undertake the survey (4.8%
of the net sample) (Table 2.0).
The average time of completion of the questionnaire was 15 min.
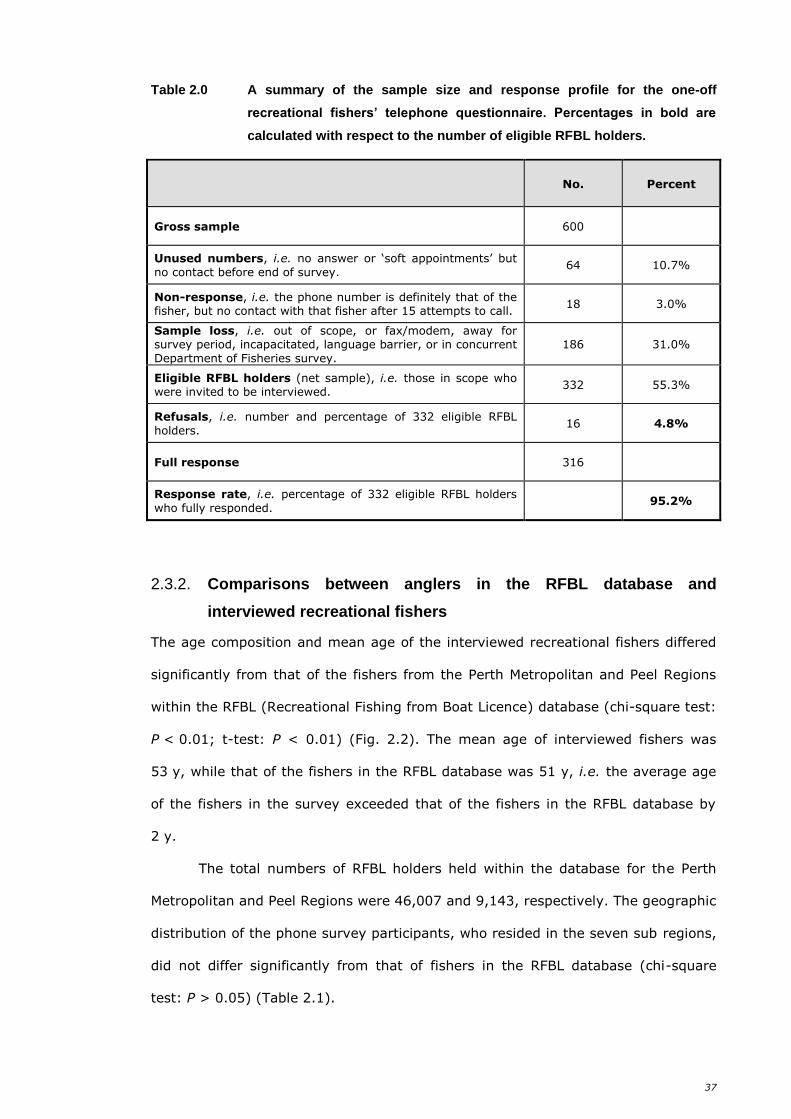
37
Table 2.0 A summary of the sample size and response profile for the one-off
recreational fishers’ telephone questionnaire. Percentages in bold are
calculated with respect to the number of eligible RFBL holders.
No. Percent
Gross sample 600
Unused numbers, i.e. no answer or ‘soft appointments’ but
no contact before end of survey. 64 10.7%
Non-response, i.e. the phone number is definitely that of the fisher, but no contact with that fisher after 15 attempts to call.
18 3.0%
Sample loss, i.e. out of scope, or fax/modem, away for survey period, incapacitated, language barrier, or in concurrent
Department of Fisheries survey.
186 31.0%
Eligible RFBL holders (net sample), i.e. those in scope who were invited to be interviewed.
332 55.3%
Refusals, i.e. number and percentage of 332 eligible RFBL
holders. 16 4.8%
Full response 316
Response rate, i.e. percentage of 332 eligible RFBL holders
who fully responded. 95.2%
2.3.2. Comparisons between anglers in the RFBL database and
interviewed recreational fishers
The age composition and mean age of the interviewed recreational fishers differed
significantly from that of the fishers from the Perth Metropolitan and Peel Regions
within the RFBL (Recreational Fishing from Boat Licence) database (chi-square test:
P < 0.01; t-test: P < 0.01) (Fig. 2.2). The mean age of interviewed fishers was
53 y, while that of the fishers in the RFBL database was 51 y, i.e. the average age
of the fishers in the survey exceeded that of the fishers in the RFBL database by
2 y.
The total numbers of RFBL holders held within the database for the Perth
Metropolitan and Peel Regions were 46,007 and 9,143, respectively. The geographic
distribution of the phone survey participants, who resided in the seven sub regions,
did not differ significantly from that of fishers in the RFBL database (chi-square
test: P > 0.05) (Table 2.1).
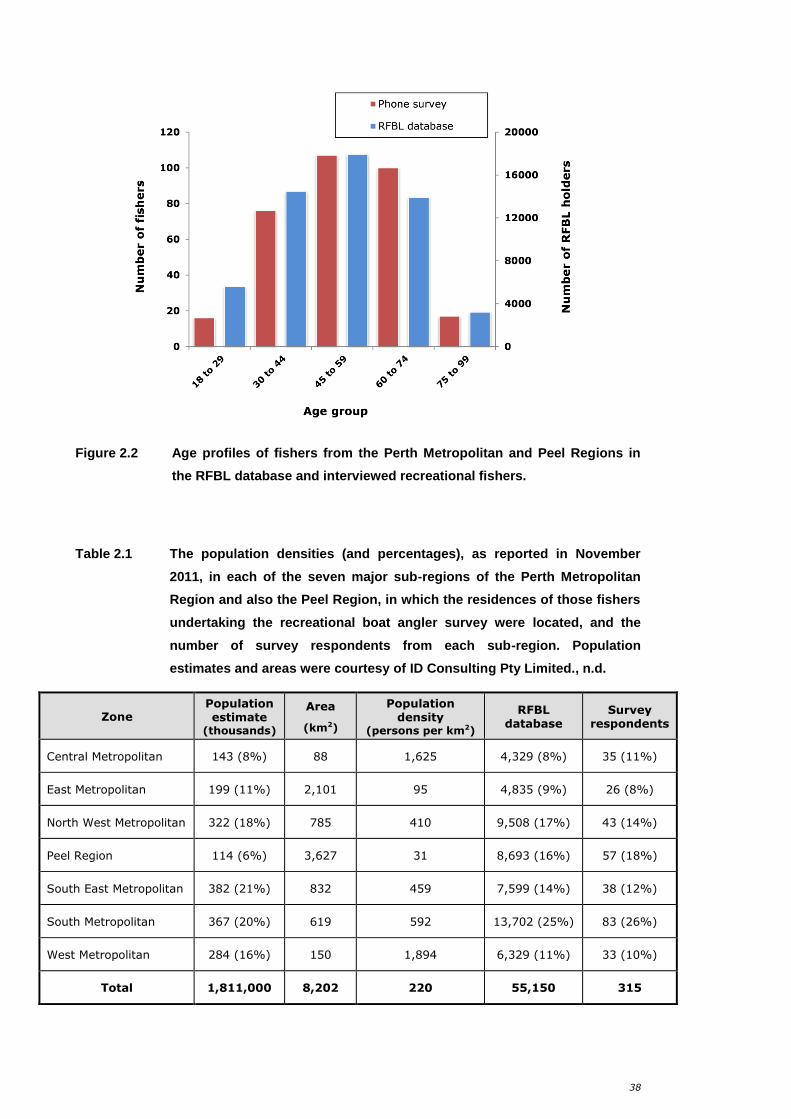
38
Figure 2.2 Age profiles of fishers from the Perth Metropolitan and Peel Regions in
the RFBL database and interviewed recreational fishers.
Table 2.1 The population densities (and percentages), as reported in November
2011, in each of the seven major sub-regions of the Perth Metropolitan
Region and also the Peel Region, in which the residences of those fishers
undertaking the recreational boat angler survey were located, and the
number of survey respondents from each sub-region. Population
estimates and areas were courtesy of ID Consulting Pty Limited., n.d.
Zone Population estimate
(thousands)
Area
(km2)
Population density
(persons per km2)
RFBL database
Survey respondents
Central Metropolitan 143 (8%) 88 1,625 4,329 (8%) 35 (11%)
East Metropolitan 199 (11%) 2,101 95 4,835 (9%) 26 (8%)
North West Metropolitan 322 (18%) 785 410 9,508 (17%) 43 (14%)
Peel Region 114 (6%) 3,627 31 8,693 (16%) 57 (18%)
South East Metropolitan 382 (21%) 832 459 7,599 (14%) 38 (12%)
South Metropolitan 367 (20%) 619 592 13,702 (25%) 83 (26%)
West Metropolitan 284 (16%) 150 1,894 6,329 (11%) 33 (10%)
Total 1,811,000 8,202 220 55,150 315
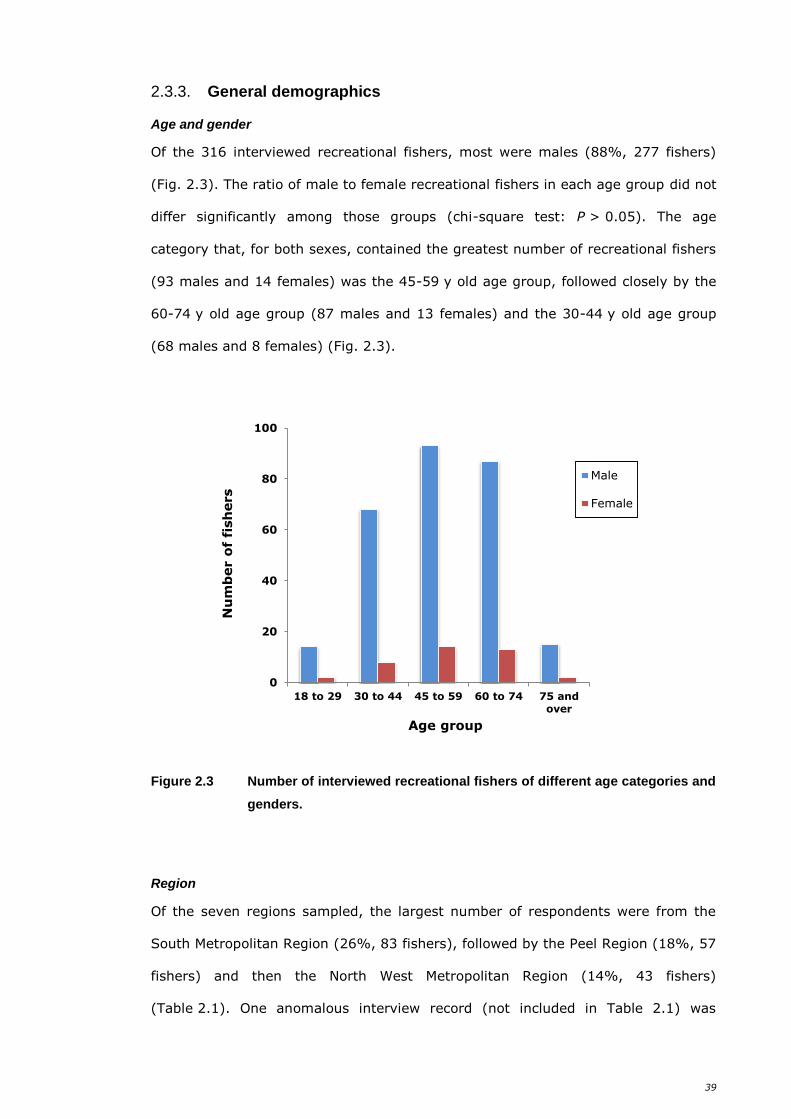
39
2.3.3. General demographics
Age and gender
Of the 316 interviewed recreational fishers, most were males (88%, 277 fishers)
(Fig. 2.3). The ratio of male to female recreational fishers in each age group did not
differ significantly among those groups (chi-square test: P > 0.05). The age
category that, for both sexes, contained the greatest number of recreational fishers
(93 males and 14 females) was the 45-59 y old age group, followed closely by the
60-74 y old age group (87 males and 13 females) and the 30-44 y old age group
(68 males and 8 females) (Fig. 2.3).
Figure 2.3 Number of interviewed recreational fishers of different age categories and
genders.
Region
Of the seven regions sampled, the largest number of respondents were from the
South Metropolitan Region (26%, 83 fishers), followed by the Peel Region (18%, 57
fishers) and then the North West Metropolitan Region (14%, 43 fishers)
(Table 2.1). One anomalous interview record (not included in Table 2.1) was
0
20
40
60
80
100
18 to 29 30 to 44 45 to 59 60 to 74 75 andover
Nu
mb
er o
f fi
sh
ers
Age group
Male
Female
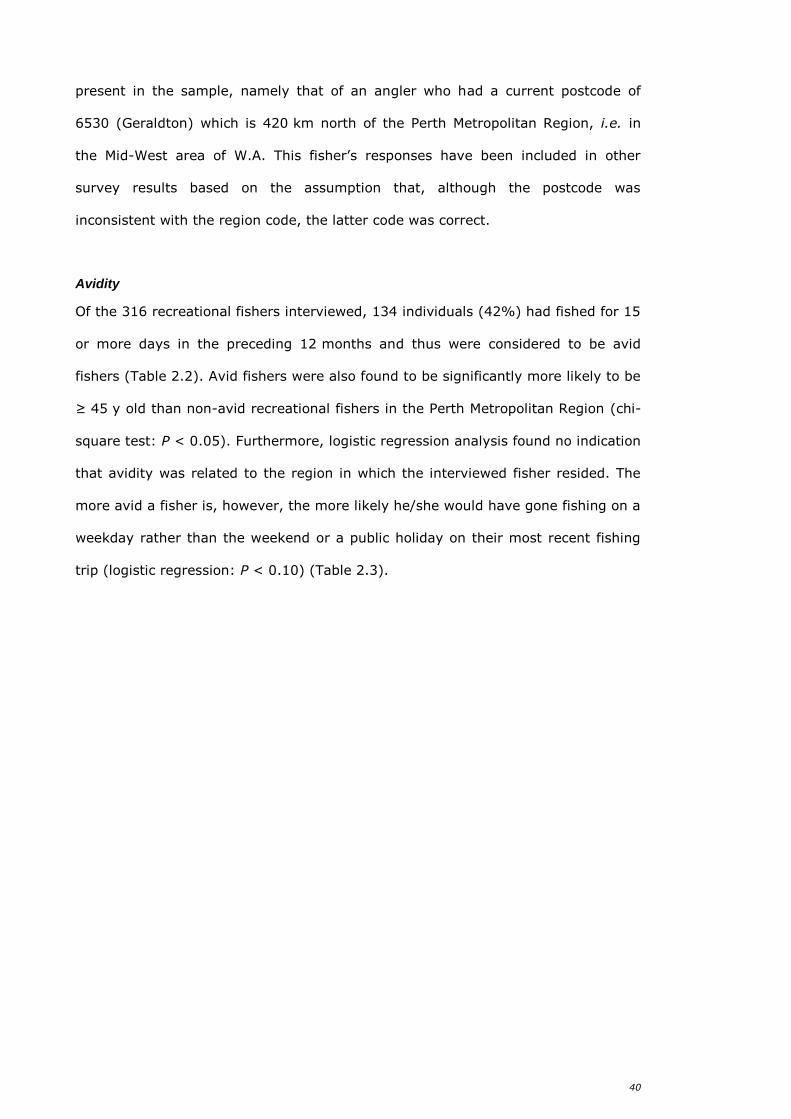
40
present in the sample, namely that of an angler who had a current postcode of
6530 (Geraldton) which is 420 km north of the Perth Metropolitan Region, i.e. in
the Mid-West area of W.A. This fisher’s responses have been included in other
survey results based on the assumption that, although the postcode was
inconsistent with the region code, the latter code was correct.
Avidity
Of the 316 recreational fishers interviewed, 134 individuals (42%) had fished for 15
or more days in the preceding 12 months and thus were considered to be avid
fishers (Table 2.2). Avid fishers were also found to be significantly more likely to be
≥ 45 y old than non-avid recreational fishers in the Perth Metropolitan Region (chi-
square test: P < 0.05). Furthermore, logistic regression analysis found no indication
that avidity was related to the region in which the interviewed fisher resided. The
more avid a fisher is, however, the more likely he/she would have gone fishing on a
weekday rather than the weekend or a public holiday on their most recent fishing
trip (logistic regression: P < 0.10) (Table 2.3).
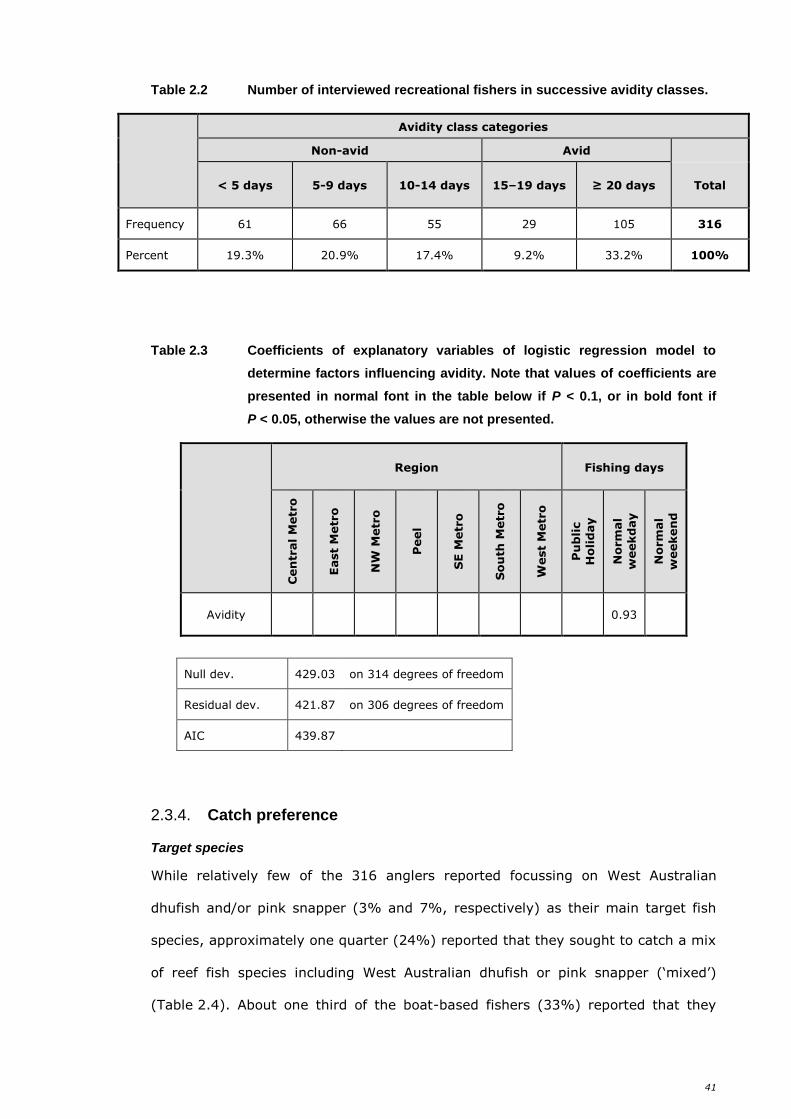
41
Table 2.2 Number of interviewed recreational fishers in successive avidity classes.
Avidity class categories
Non-avid Avid
< 5 days 5-9 days 10-14 days 15–19 days ≥ 20 days Total
Frequency 61 66 55 29 105 316
Percent 19.3% 20.9% 17.4% 9.2% 33.2% 100%
Table 2.3 Coefficients of explanatory variables of logistic regression model to
determine factors influencing avidity. Note that values of coefficients are
presented in normal font in the table below if P < 0.1, or in bold font if
P < 0.05, otherwise the values are not presented.
Region Fishing days
Cen
tral M
etr
o
East
Metr
o
NW
Metr
o
Peel
SE
Metr
o
So
uth
Metr
o
West
Metr
o
Pu
blic
Ho
lid
ay
No
rm
al
weekd
ay
No
rm
al
weeken
d
Avidity 0.93
2.3.4. Catch preference
Target species
While relatively few of the 316 anglers reported focussing on West Australian
dhufish and/or pink snapper (3% and 7%, respectively) as their main target fish
species, approximately one quarter (24%) reported that they sought to catch a mix
of reef fish species including West Australian dhufish or pink snapper (‘mixed’)
(Table 2.4). About one third of the boat-based fishers (33%) reported that they
Null dev. 429.03 on 314 degrees of freedom
Residual dev. 421.87 on 306 degrees of freedom
AIC 439.87
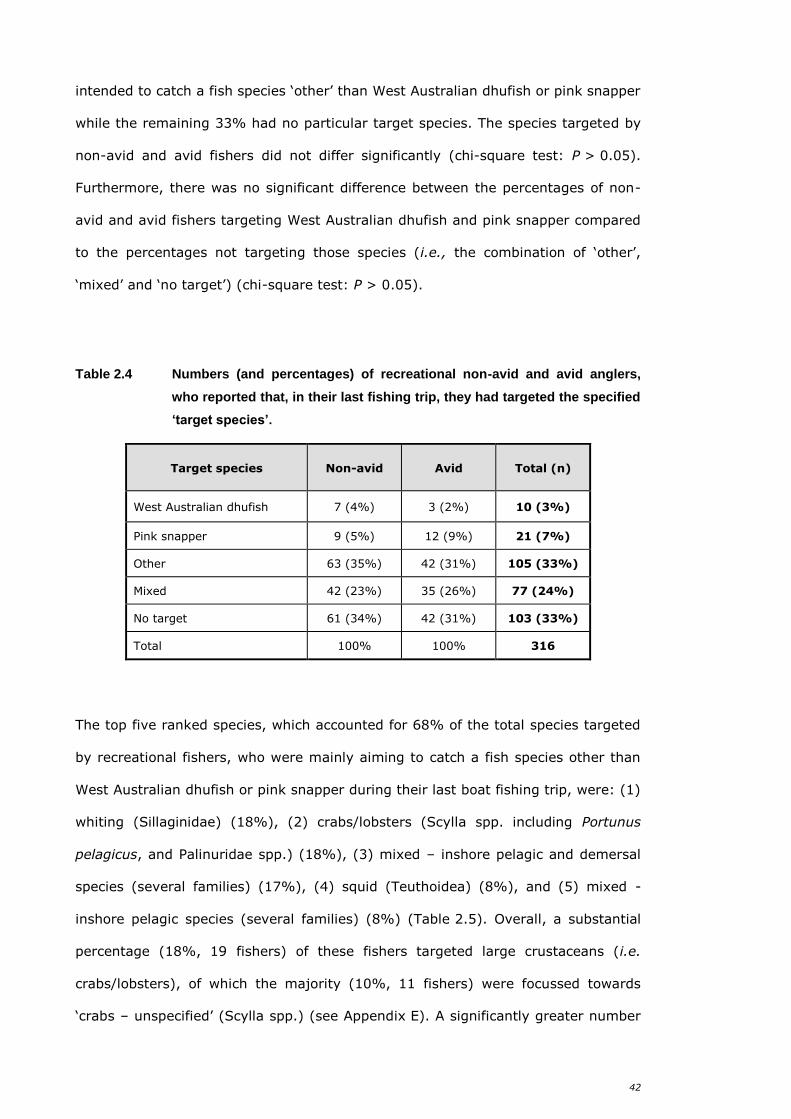
42
intended to catch a fish species ‘other’ than West Australian dhufish or pink snapper
while the remaining 33% had no particular target species. The species targeted by
non-avid and avid fishers did not differ significantly (chi-square test: P > 0.05).
Furthermore, there was no significant difference between the percentages of non-
avid and avid fishers targeting West Australian dhufish and pink snapper compared
to the percentages not targeting those species (i.e., the combination of ‘other’,
‘mixed’ and ‘no target’) (chi-square test: P > 0.05).
Table 2.4 Numbers (and percentages) of recreational non-avid and avid anglers,
who reported that, in their last fishing trip, they had targeted the specified
‘target species’.
Target species Non-avid Avid Total (n)
West Australian dhufish 7 (4%) 3 (2%) 10 (3%)
Pink snapper 9 (5%) 12 (9%) 21 (7%)
Other 63 (35%) 42 (31%) 105 (33%)
Mixed 42 (23%) 35 (26%) 77 (24%)
No target 61 (34%) 42 (31%) 103 (33%)
Total 100% 100% 316
The top five ranked species, which accounted for 68% of the total species targeted
by recreational fishers, who were mainly aiming to catch a fish species other than
West Australian dhufish or pink snapper during their last boat fishing trip, were: (1)
whiting (Sillaginidae) (18%), (2) crabs/lobsters (Scylla spp. including Portunus
pelagicus, and Palinuridae spp.) (18%), (3) mixed – inshore pelagic and demersal
species (several families) (17%), (4) squid (Teuthoidea) (8%), and (5) mixed -
inshore pelagic species (several families) (8%) (Table 2.5). Overall, a substantial
percentage (18%, 19 fishers) of these fishers targeted large crustaceans (i.e.
crabs/lobsters), of which the majority (10%, 11 fishers) were focussed towards
‘crabs – unspecified’ (Scylla spp.) (see Appendix E). A significantly greater number
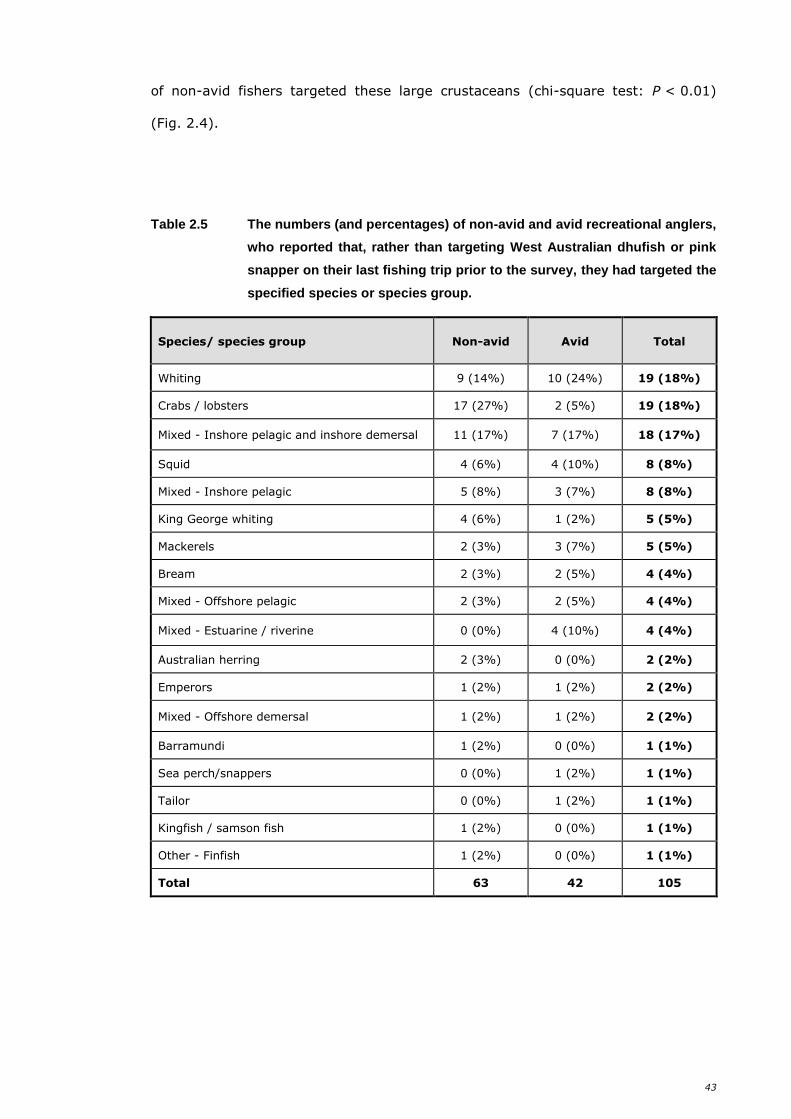
43
of non-avid fishers targeted these large crustaceans (chi-square test: P < 0.01)
(Fig. 2.4).
Table 2.5 The numbers (and percentages) of non-avid and avid recreational anglers,
who reported that, rather than targeting West Australian dhufish or pink
snapper on their last fishing trip prior to the survey, they had targeted the
specified species or species group.
Species/ species group Non-avid Avid Total
Whiting 9 (14%) 10 (24%) 19 (18%)
Crabs / lobsters 17 (27%) 2 (5%) 19 (18%)
Mixed - Inshore pelagic and inshore demersal 11 (17%) 7 (17%) 18 (17%)
Squid 4 (6%) 4 (10%) 8 (8%)
Mixed - Inshore pelagic 5 (8%) 3 (7%) 8 (8%)
King George whiting 4 (6%) 1 (2%) 5 (5%)
Mackerels 2 (3%) 3 (7%) 5 (5%)
Bream 2 (3%) 2 (5%) 4 (4%)
Mixed - Offshore pelagic 2 (3%) 2 (5%) 4 (4%)
Mixed - Estuarine / riverine 0 (0%) 4 (10%) 4 (4%)
Australian herring 2 (3%) 0 (0%) 2 (2%)
Emperors 1 (2%) 1 (2%) 2 (2%)
Mixed - Offshore demersal 1 (2%) 1 (2%) 2 (2%)
Barramundi 1 (2%) 0 (0%) 1 (1%)
Sea perch/snappers 0 (0%) 1 (2%) 1 (1%)
Tailor 0 (0%) 1 (2%) 1 (1%)
Kingfish / samson fish 1 (2%) 0 (0%) 1 (1%)
Other - Finfish 1 (2%) 0 (0%) 1 (1%)
Total 63 42 105
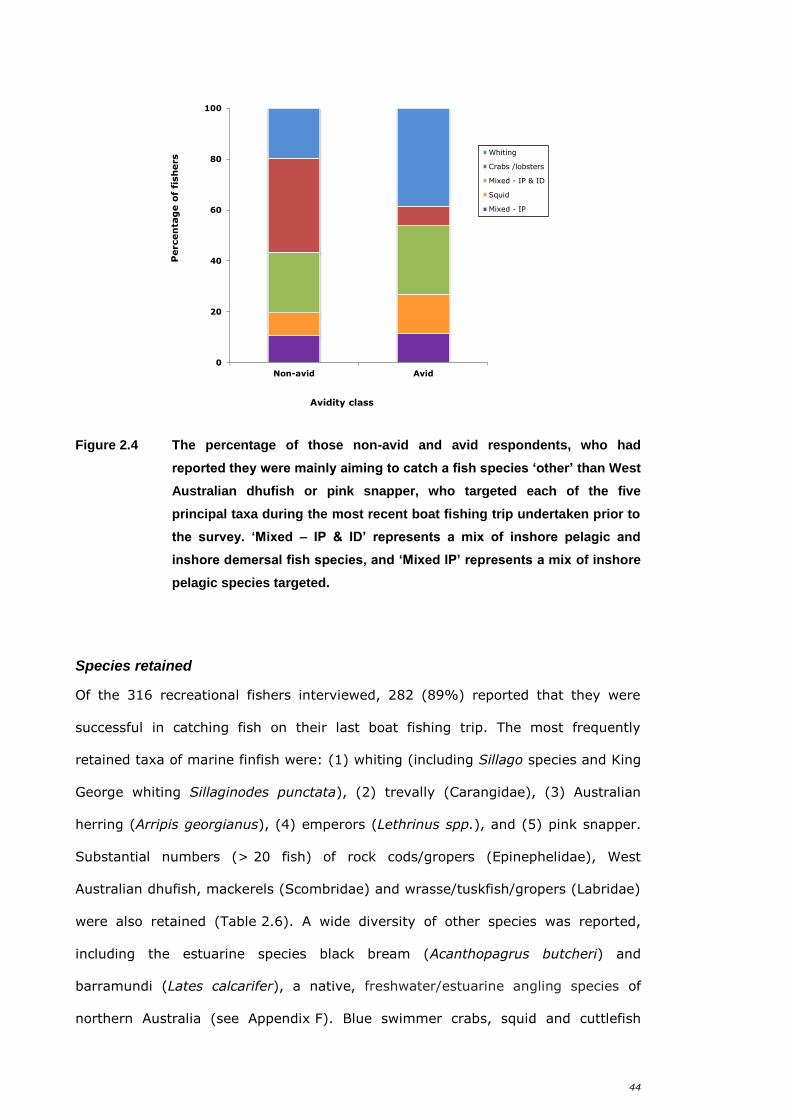
44
Figure 2.4 The percentage of those non-avid and avid respondents, who had
reported they were mainly aiming to catch a fish species ‘other’ than West
Australian dhufish or pink snapper, who targeted each of the five
principal taxa during the most recent boat fishing trip undertaken prior to
the survey. ‘Mixed – IP & ID’ represents a mix of inshore pelagic and
inshore demersal fish species, and ‘Mixed IP’ represents a mix of inshore
pelagic species targeted.
Species retained
Of the 316 recreational fishers interviewed, 282 (89%) reported that they were
successful in catching fish on their last boat fishing trip. The most frequently
retained taxa of marine finfish were: (1) whiting (including Sillago species and King
George whiting Sillaginodes punctata), (2) trevally (Carangidae), (3) Australian
herring (Arripis georgianus), (4) emperors (Lethrinus spp.), and (5) pink snapper.
Substantial numbers (> 20 fish) of rock cods/gropers (Epinephelidae), West
Australian dhufish, mackerels (Scombridae) and wrasse/tuskfish/gropers (Labridae)
were also retained (Table 2.6). A wide diversity of other species was reported,
including the estuarine species black bream (Acanthopagrus butcheri) and
barramundi (Lates calcarifer), a native, freshwater/estuarine angling species of
northern Australia (see Appendix F). Blue swimmer crabs, squid and cuttlefish
0
20
40
60
80
100
Non-avid Avid
Percen
tag
e o
f fi
sh
ers
Avidity class
Whiting
Crabs /lobsters
Mixed - IP & ID
Squid
Mixed - IP
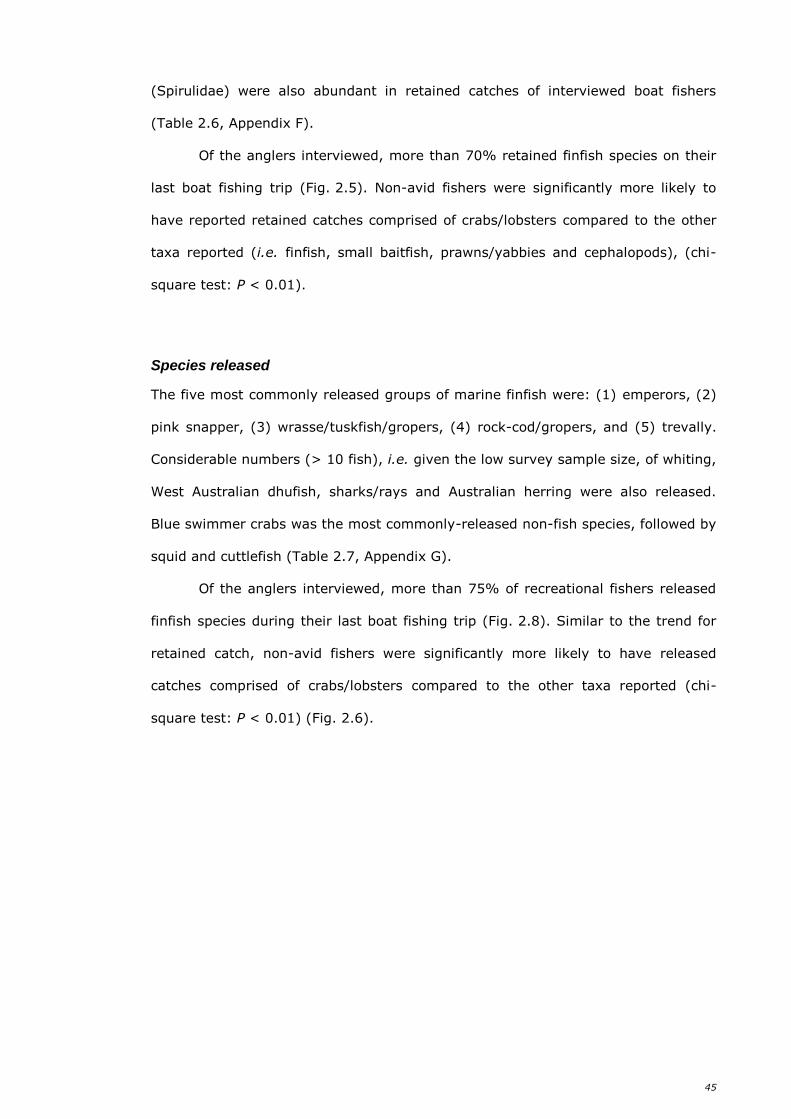
45
(Spirulidae) were also abundant in retained catches of interviewed boat fishers
(Table 2.6, Appendix F).
Of the anglers interviewed, more than 70% retained finfish species on their
last boat fishing trip (Fig. 2.5). Non-avid fishers were significantly more likely to
have reported retained catches comprised of crabs/lobsters compared to the other
taxa reported (i.e. finfish, small baitfish, prawns/yabbies and cephalopods), (chi-
square test: P < 0.01).
Species released
The five most commonly released groups of marine finfish were: (1) emperors, (2)
pink snapper, (3) wrasse/tuskfish/gropers, (4) rock-cod/gropers, and (5) trevally.
Considerable numbers (> 10 fish), i.e. given the low survey sample size, of whiting,
West Australian dhufish, sharks/rays and Australian herring were also released.
Blue swimmer crabs was the most commonly-released non-fish species, followed by
squid and cuttlefish (Table 2.7, Appendix G).
Of the anglers interviewed, more than 75% of recreational fishers released
finfish species during their last boat fishing trip (Fig. 2.8). Similar to the trend for
retained catch, non-avid fishers were significantly more likely to have released
catches comprised of crabs/lobsters compared to the other taxa reported (chi-
square test: P < 0.01) (Fig. 2.6).
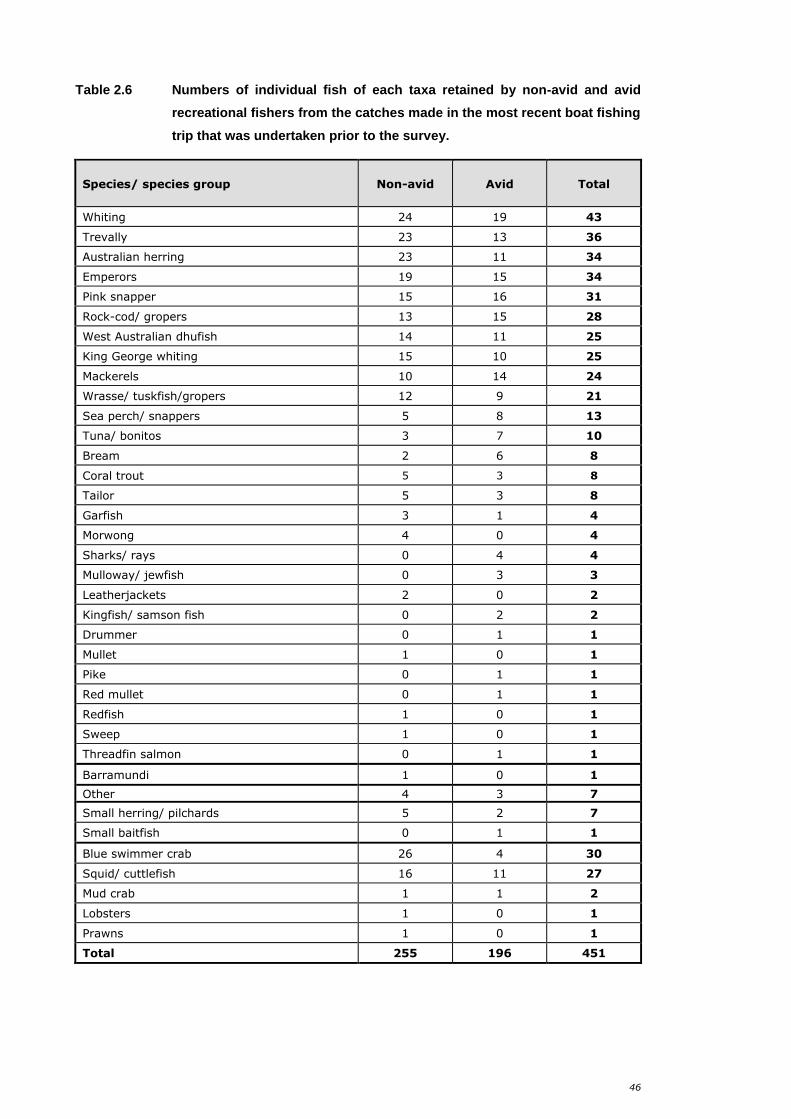
46
Table 2.6 Numbers of individual fish of each taxa retained by non-avid and avid
recreational fishers from the catches made in the most recent boat fishing
trip that was undertaken prior to the survey.
Species/ species group Non-avid Avid Total
Whiting 24 19 43
Trevally 23 13 36
Australian herring 23 11 34
Emperors 19 15 34
Pink snapper 15 16 31
Rock-cod/ gropers 13 15 28
West Australian dhufish 14 11 25
King George whiting 15 10 25
Mackerels 10 14 24
Wrasse/ tuskfish/gropers 12 9 21
Sea perch/ snappers 5 8 13
Tuna/ bonitos 3 7 10
Bream 2 6 8
Coral trout 5 3 8
Tailor 5 3 8
Garfish 3 1 4
Morwong 4 0 4
Sharks/ rays 0 4 4
Mulloway/ jewfish 0 3 3
Leatherjackets 2 0 2
Kingfish/ samson fish 0 2 2
Drummer 0 1 1
Mullet 1 0 1
Pike 0 1 1
Red mullet 0 1 1
Redfish 1 0 1
Sweep 1 0 1
Threadfin salmon 0 1 1
Barramundi 1 0 1
Other 4 3 7
Small herring/ pilchards 5 2 7
Small baitfish 0 1 1
Blue swimmer crab 26 4 30
Squid/ cuttlefish 16 11 27
Mud crab 1 1 2
Lobsters 1 0 1
Prawns 1 0 1
Total 255 196 451
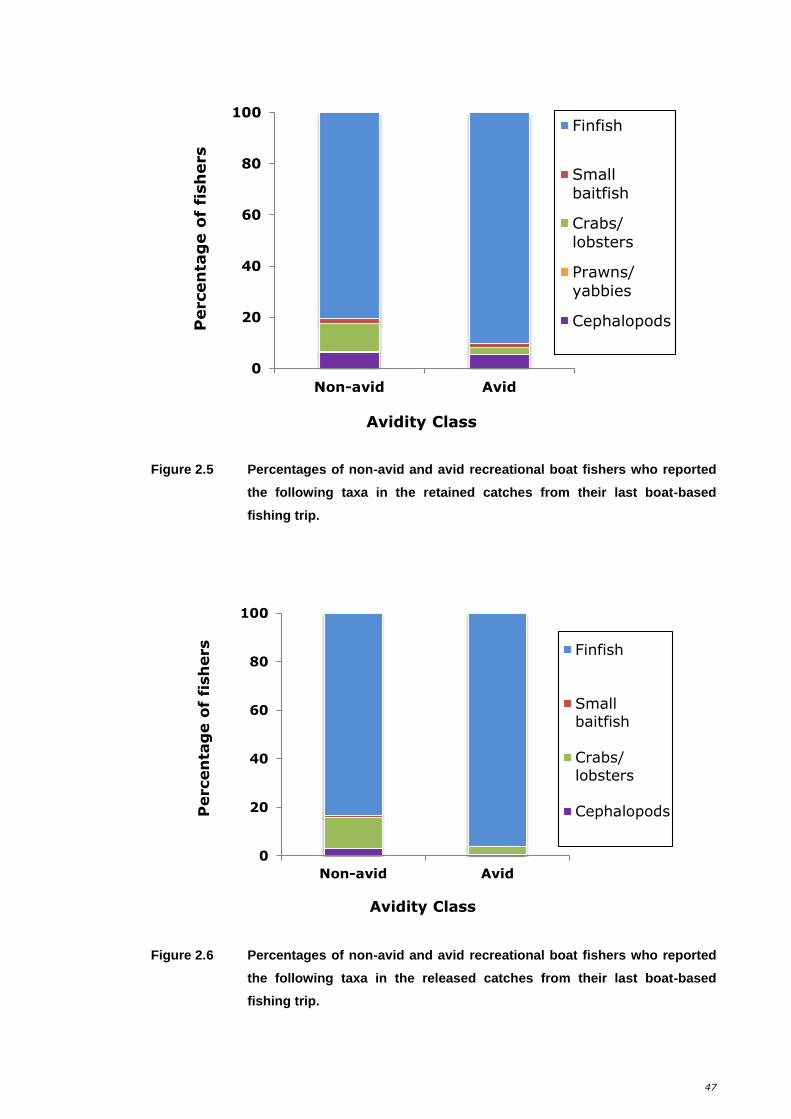
47
Figure 2.5 Percentages of non-avid and avid recreational boat fishers who reported
the following taxa in the retained catches from their last boat-based
fishing trip.
Figure 2.6 Percentages of non-avid and avid recreational boat fishers who reported
the following taxa in the released catches from their last boat-based
fishing trip.
0
20
40
60
80
100
Non-avid Avid
Percen
tag
e o
f fi
sh
ers
Avidity Class
Finfish
Small
baitfish
Crabs/
lobsters
Prawns/
yabbies
Cephalopods
0
20
40
60
80
100
Non-avid Avid
Percen
tag
e o
f fi
sh
ers
Avidity Class
Finfish
Small
baitfish
Crabs/
lobsters
Cephalopods
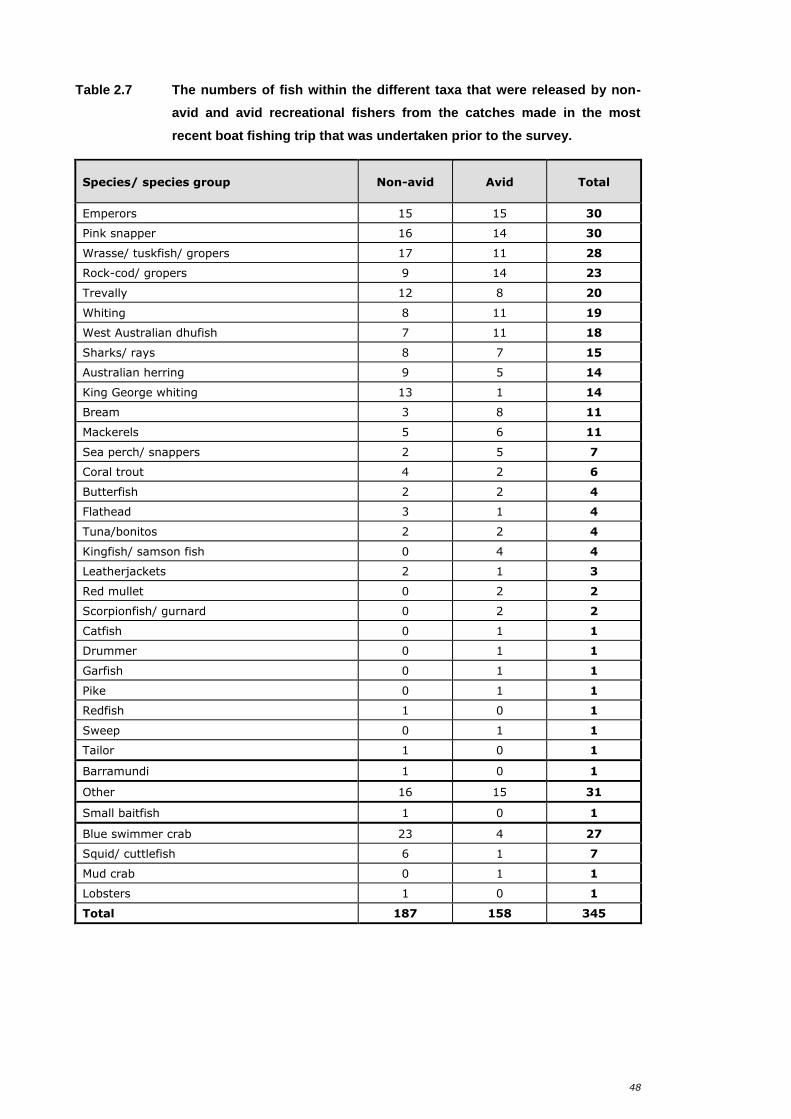
48
Table 2.7 The numbers of fish within the different taxa that were released by non-
avid and avid recreational fishers from the catches made in the most
recent boat fishing trip that was undertaken prior to the survey.
Species/ species group Non-avid Avid Total
Emperors 15 15 30
Pink snapper 16 14 30
Wrasse/ tuskfish/ gropers 17 11 28
Rock-cod/ gropers 9 14 23
Trevally 12 8 20
Whiting 8 11 19
West Australian dhufish 7 11 18
Sharks/ rays 8 7 15
Australian herring 9 5 14
King George whiting 13 1 14
Bream 3 8 11
Mackerels 5 6 11
Sea perch/ snappers 2 5 7
Coral trout 4 2 6
Butterfish 2 2 4
Flathead 3 1 4
Tuna/bonitos 2 2 4
Kingfish/ samson fish 0 4 4
Leatherjackets 2 1 3
Red mullet 0 2 2
Scorpionfish/ gurnard 0 2 2
Catfish 0 1 1
Drummer 0 1 1
Garfish 0 1 1
Pike 0 1 1
Redfish 1 0 1
Sweep 0 1 1
Tailor 1 0 1
Barramundi 1 0 1
Other 16 15 31
Small baitfish 1 0 1
Blue swimmer crab 23 4 27
Squid/ cuttlefish 6 1 7
Mud crab 0 1 1
Lobsters 1 0 1
Total 187 158 345
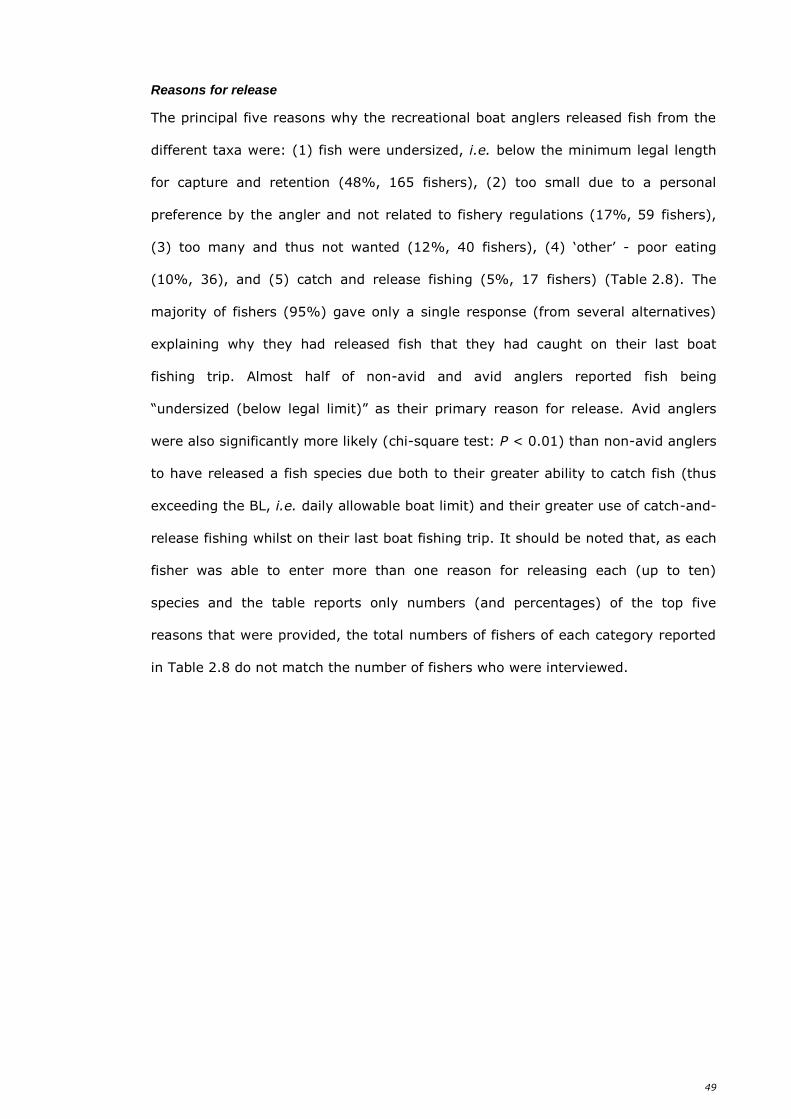
49
Reasons for release
The principal five reasons why the recreational boat anglers released fish from the
different taxa were: (1) fish were undersized, i.e. below the minimum legal length
for capture and retention (48%, 165 fishers), (2) too small due to a personal
preference by the angler and not related to fishery regulations (17%, 59 fishers),
(3) too many and thus not wanted (12%, 40 fishers), (4) ‘other’ - poor eating
(10%, 36), and (5) catch and release fishing (5%, 17 fishers) (Table 2.8). The
majority of fishers (95%) gave only a single response (from several alternatives)
explaining why they had released fish that they had caught on their last boat
fishing trip. Almost half of non-avid and avid anglers reported fish being
“undersized (below legal limit)” as their primary reason for release. Avid anglers
were also significantly more likely (chi-square test: P < 0.01) than non-avid anglers
to have released a fish species due both to their greater ability to catch fish (thus
exceeding the BL, i.e. daily allowable boat limit) and their greater use of catch-and-
release fishing whilst on their last boat fishing trip. It should be noted that, as each
fisher was able to enter more than one reason for releasing each (up to ten)
species and the table reports only numbers (and percentages) of the top five
reasons that were provided, the total numbers of fishers of each category reported
in Table 2.8 do not match the number of fishers who were interviewed.
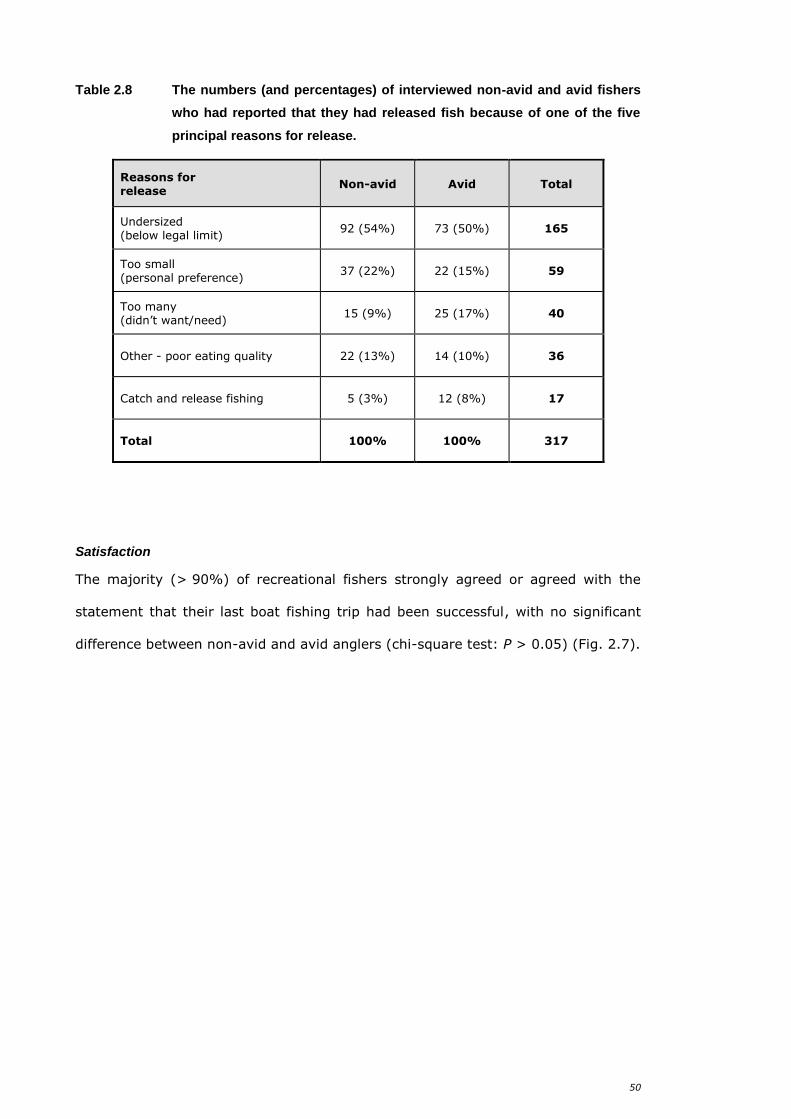
50
Table 2.8 The numbers (and percentages) of interviewed non-avid and avid fishers
who had reported that they had released fish because of one of the five
principal reasons for release.
Reasons for release
Non-avid Avid Total
Undersized (below legal limit)
92 (54%) 73 (50%) 165
Too small (personal preference)
37 (22%) 22 (15%) 59
Too many (didn’t want/need)
15 (9%) 25 (17%) 40
Other - poor eating quality 22 (13%) 14 (10%) 36
Catch and release fishing 5 (3%) 12 (8%) 17
Total 100% 100% 317
Satisfaction
The majority (> 90%) of recreational fishers strongly agreed or agreed with the
statement that their last boat fishing trip had been successful, with no significant
difference between non-avid and avid anglers (chi-square test: P > 0.05) (Fig. 2.7).
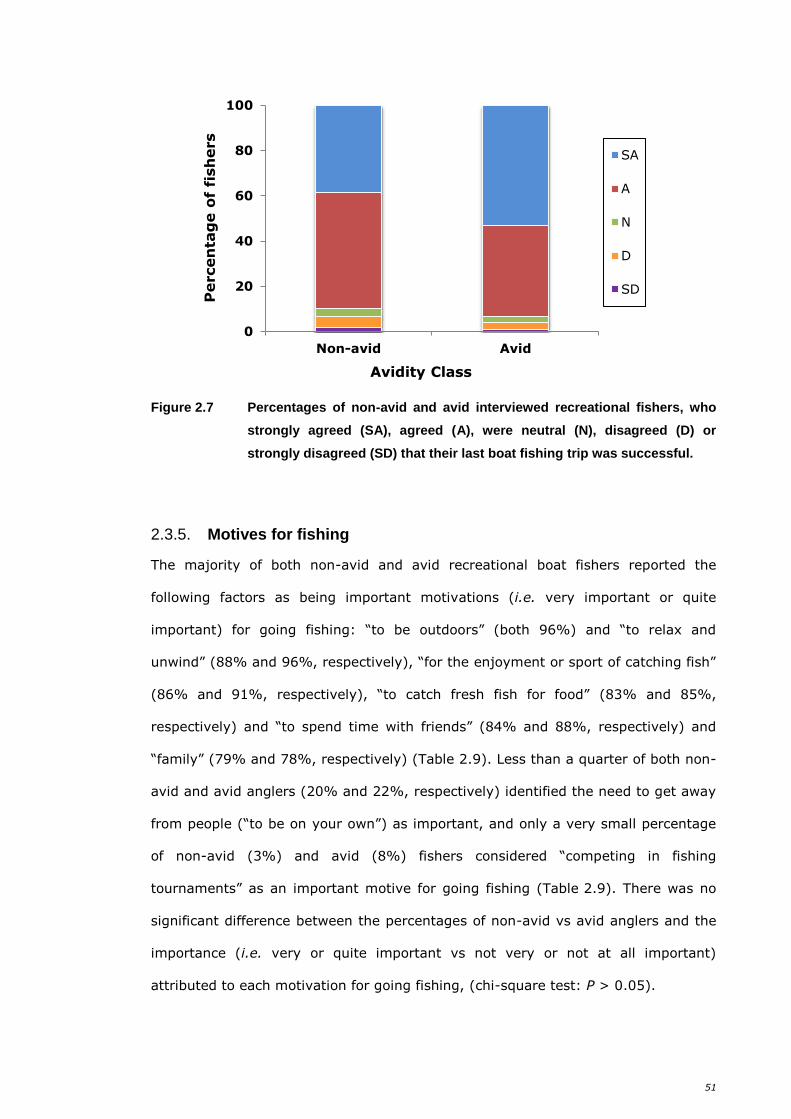
51
Figure 2.7 Percentages of non-avid and avid interviewed recreational fishers, who
strongly agreed (SA), agreed (A), were neutral (N), disagreed (D) or
strongly disagreed (SD) that their last boat fishing trip was successful.
2.3.5. Motives for fishing
The majority of both non-avid and avid recreational boat fishers reported the
following factors as being important motivations (i.e. very important or quite
important) for going fishing: “to be outdoors” (both 96%) and “to relax and
unwind” (88% and 96%, respectively), “for the enjoyment or sport of catching fish”
(86% and 91%, respectively), “to catch fresh fish for food” (83% and 85%,
respectively) and “to spend time with friends” (84% and 88%, respectively) and
“family” (79% and 78%, respectively) (Table 2.9). Less than a quarter of both non-
avid and avid anglers (20% and 22%, respectively) identified the need to get away
from people (“to be on your own”) as important, and only a very small percentage
of non-avid (3%) and avid (8%) fishers considered “competing in fishing
tournaments” as an important motive for going fishing (Table 2.9). There was no
significant difference between the percentages of non-avid vs avid anglers and the
importance (i.e. very or quite important vs not very or not at all important)
attributed to each motivation for going fishing, (chi-square test: P > 0.05).
0
20
40
60
80
100
Non-avid Avid
Percen
tag
e o
f fi
sh
ers
Avidity Class
SA
A
N
D
SD

52
The results of the logistic regression analyses suggest that relaxation and
fishing for the enjoyment and the sport of catching fish were significantly more
important (logistic regression: P < 0.05) for avid fishers than for non-avid fishers
(Table 2.10). Anglers between the ages of 30-59 y were also more likely to go
fishing for relaxation (logistic regression: P < 0.05) and to be outdoors (logistic
regression: P < 0.10). Female anglers were also more likely to be motivated to go
fishing to spend time with family (logistic regression: P < 0.05), whilst male anglers
were more likely to go fishing to catch fresh fish for food (logistic regression:
P < 0.10) (Table 2.10).
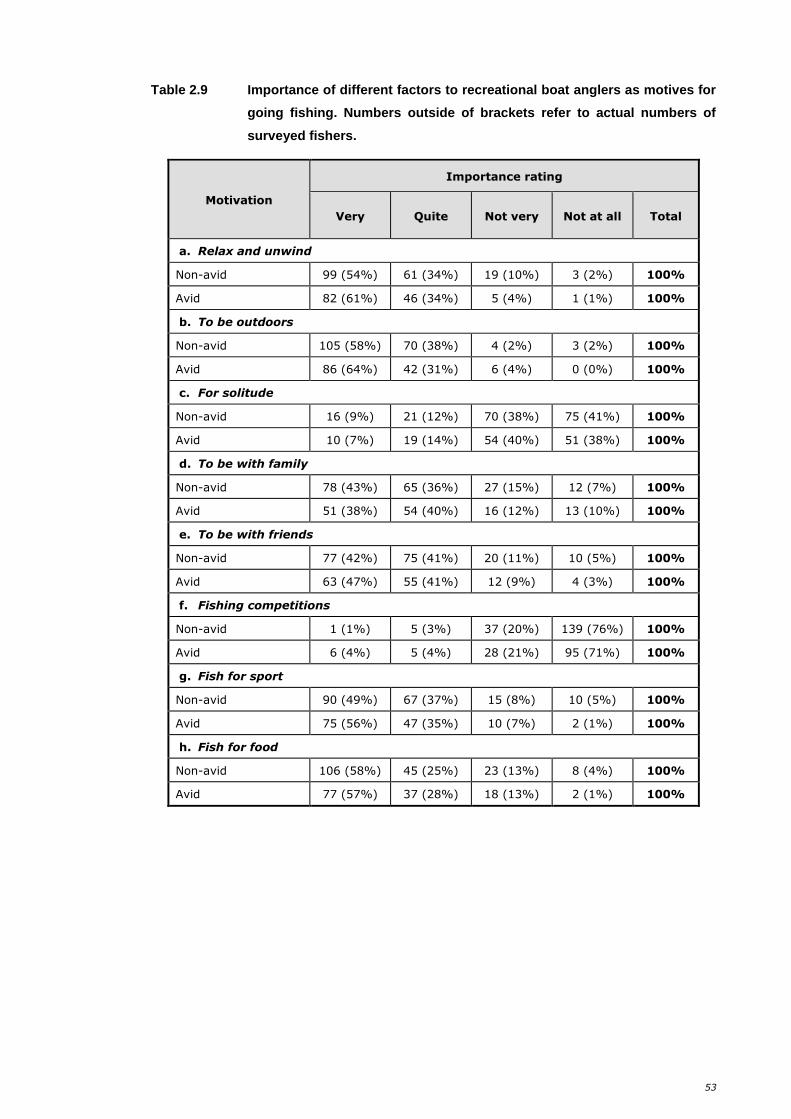
53
Table 2.9 Importance of different factors to recreational boat anglers as motives for
going fishing. Numbers outside of brackets refer to actual numbers of
surveyed fishers.
Motivation
Importance rating
Very Quite Not very Not at all Total
a. Relax and unwind
Non-avid 99 (54%) 61 (34%) 19 (10%) 3 (2%) 100%
Avid 82 (61%) 46 (34%) 5 (4%) 1 (1%) 100%
b. To be outdoors
Non-avid 105 (58%) 70 (38%) 4 (2%) 3 (2%) 100%
Avid 86 (64%) 42 (31%) 6 (4%) 0 (0%) 100%
c. For solitude
Non-avid 16 (9%) 21 (12%) 70 (38%) 75 (41%) 100%
Avid 10 (7%) 19 (14%) 54 (40%) 51 (38%) 100%
d. To be with family
Non-avid 78 (43%) 65 (36%) 27 (15%) 12 (7%) 100%
Avid 51 (38%) 54 (40%) 16 (12%) 13 (10%) 100%
e. To be with friends
Non-avid 77 (42%) 75 (41%) 20 (11%) 10 (5%) 100%
Avid 63 (47%) 55 (41%) 12 (9%) 4 (3%) 100%
f. Fishing competitions
Non-avid 1 (1%) 5 (3%) 37 (20%) 139 (76%) 100%
Avid 6 (4%) 5 (4%) 28 (21%) 95 (71%) 100%
g. Fish for sport
Non-avid 90 (49%) 67 (37%) 15 (8%) 10 (5%) 100%
Avid 75 (56%) 47 (35%) 10 (7%) 2 (1%) 100%
h. Fish for food
Non-avid 106 (58%) 45 (25%) 23 (13%) 8 (4%) 100%
Avid 77 (57%) 37 (28%) 18 (13%) 2 (1%) 100%
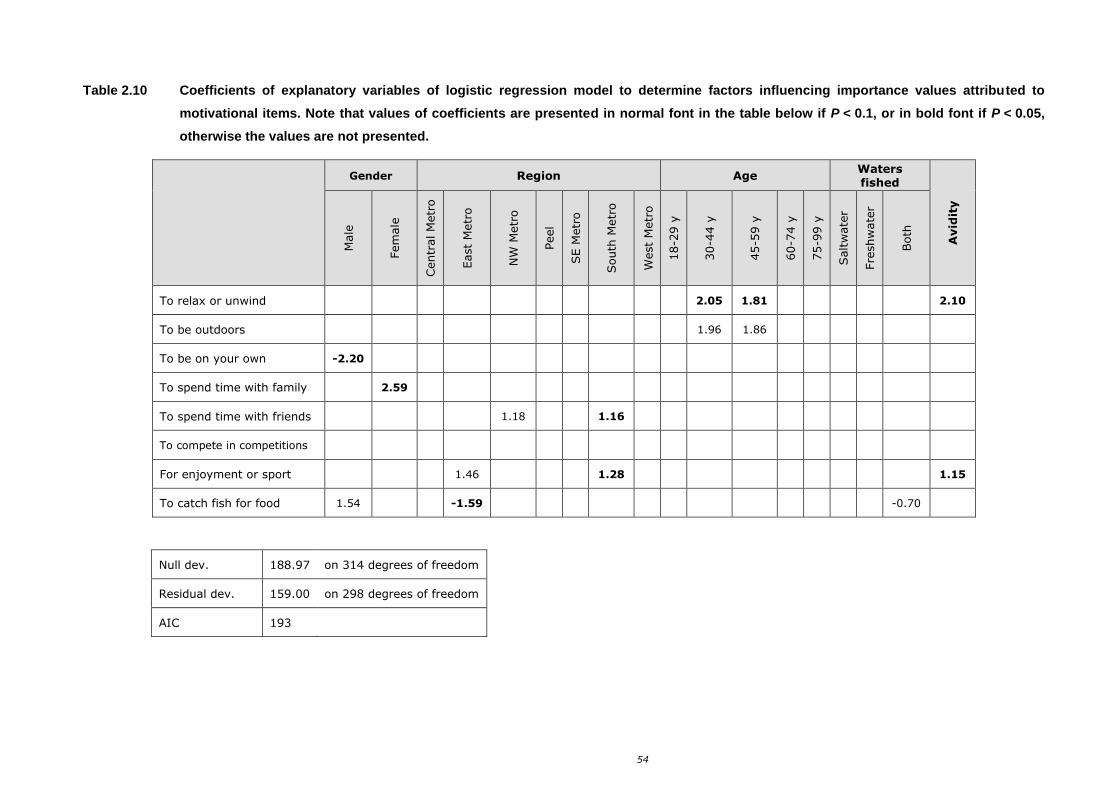
54
Table 2.10 Coefficients of explanatory variables of logistic regression model to determine factors influencing importance values attributed to
motivational items. Note that values of coefficients are presented in normal font in the table below if P < 0.1, or in bold font if P < 0.05,
otherwise the values are not presented.
Gender Region Age
Waters fished
Avid
ity
Male
Fem
ale
Centr
al M
etr
o
East
Metr
o
NW
Metr
o
Peel
SE M
etr
o
South
Metr
o
West
Metr
o
18-2
9 y
30-4
4 y
45-5
9 y
60-7
4 y
75-9
9 y
Saltw
ate
r
Fre
shw
ate
r
Both
To relax or unwind 2.05 1.81 2.10
To be outdoors 1.96 1.86
To be on your own -2.20
To spend time with family 2.59
To spend time with friends 1.18 1.16
To compete in competitions
For enjoyment or sport 1.46 1.28 1.15
To catch fish for food 1.54 -1.59 -0.70
Null dev. 188.97 on 314 degrees of freedom
Residual dev. 159.00 on 298 degrees of freedom
AIC 193
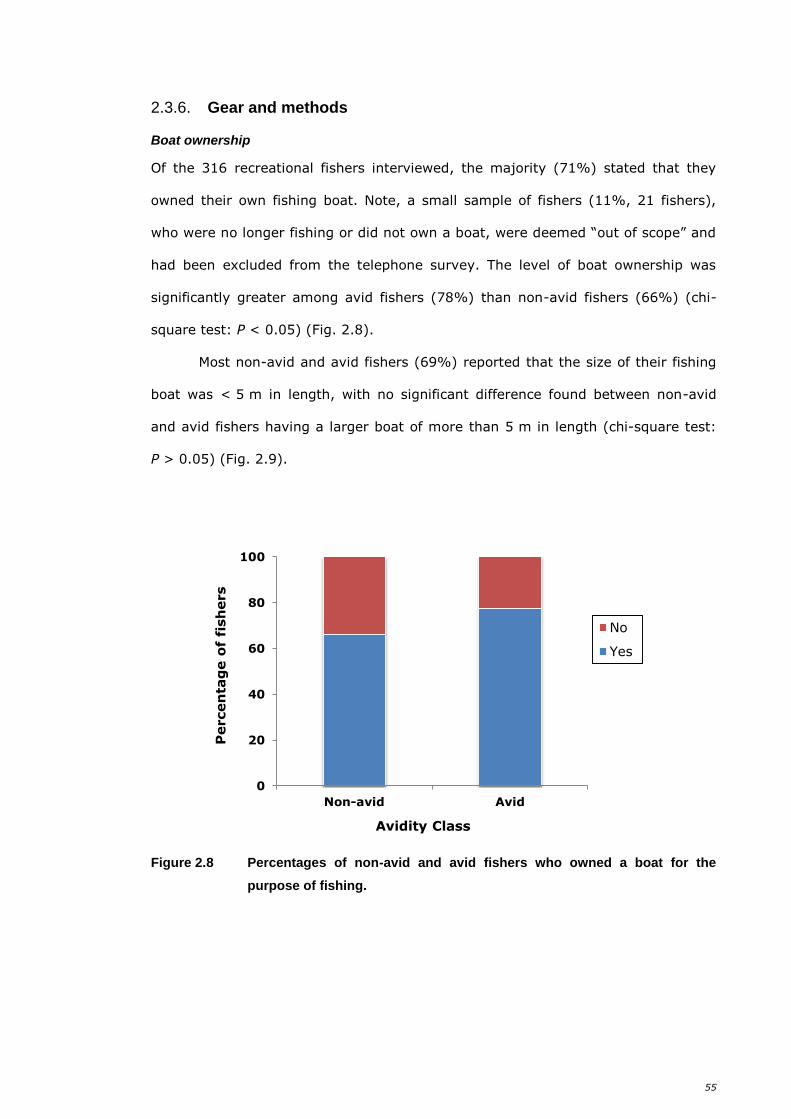
55
2.3.6. Gear and methods
Boat ownership
Of the 316 recreational fishers interviewed, the majority (71%) stated that they
owned their own fishing boat. Note, a small sample of fishers (11%, 21 fishers),
who were no longer fishing or did not own a boat, were deemed “out of scope” and
had been excluded from the telephone survey. The level of boat ownership was
significantly greater among avid fishers (78%) than non-avid fishers (66%) (chi-
square test: P < 0.05) (Fig. 2.8).
Most non-avid and avid fishers (69%) reported that the size of their fishing
boat was < 5 m in length, with no significant difference found between non-avid
and avid fishers having a larger boat of more than 5 m in length (chi-square test:
P > 0.05) (Fig. 2.9).
Figure 2.8 Percentages of non-avid and avid fishers who owned a boat for the
purpose of fishing.
0
20
40
60
80
100
Non-avid Avid
Percen
tag
e o
f fi
sh
ers
Avidity Class
No
Yes
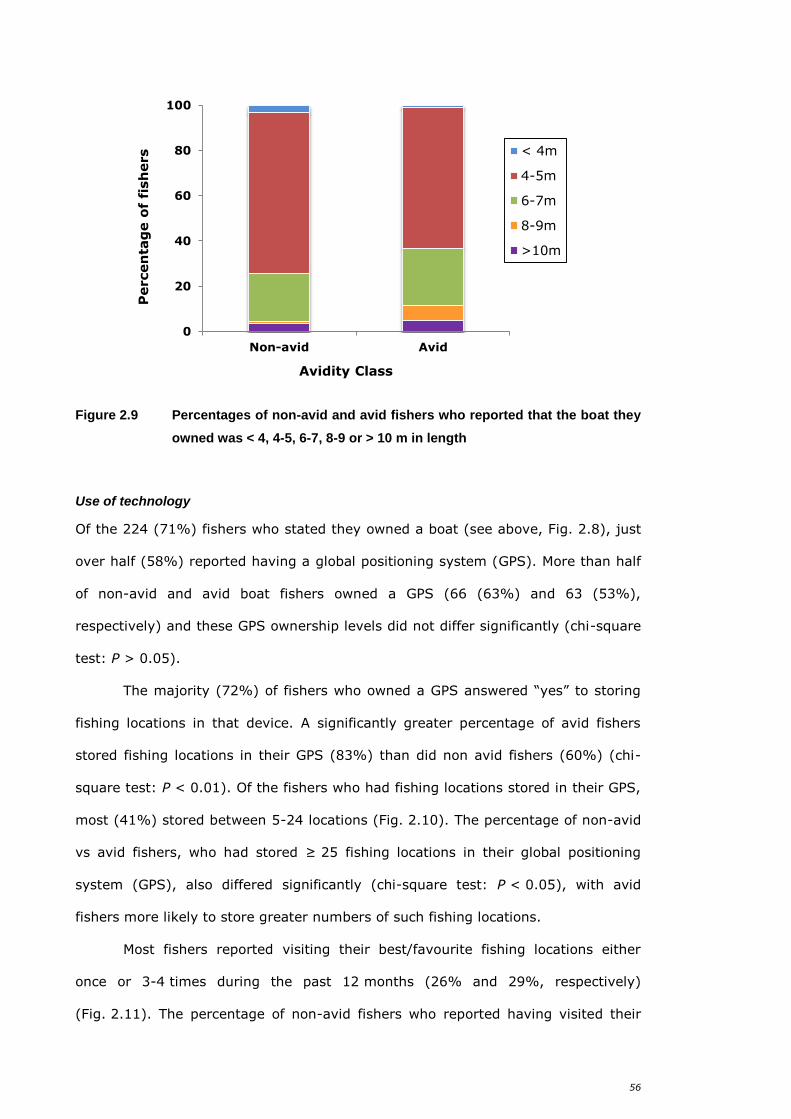
56
Figure 2.9 Percentages of non-avid and avid fishers who reported that the boat they
owned was < 4, 4-5, 6-7, 8-9 or > 10 m in length
Use of technology
Of the 224 (71%) fishers who stated they owned a boat (see above, Fig. 2.8), just
over half (58%) reported having a global positioning system (GPS). More than half
of non-avid and avid boat fishers owned a GPS (66 (63%) and 63 (53%),
respectively) and these GPS ownership levels did not differ significantly (chi-square
test: P > 0.05).
The majority (72%) of fishers who owned a GPS answered “yes” to storing
fishing locations in that device. A significantly greater percentage of avid fishers
stored fishing locations in their GPS (83%) than did non avid fishers (60%) (chi-
square test: P < 0.01). Of the fishers who had fishing locations stored in their GPS,
most (41%) stored between 5-24 locations (Fig. 2.10). The percentage of non-avid
vs avid fishers, who had stored ≥ 25 fishing locations in their global positioning
system (GPS), also differed significantly (chi-square test: P < 0.05), with avid
fishers more likely to store greater numbers of such fishing locations.
Most fishers reported visiting their best/favourite fishing locations either
once or 3-4 times during the past 12 months (26% and 29%, respectively)
(Fig. 2.11). The percentage of non-avid fishers who reported having visited their
0
20
40
60
80
100
Non-avid Avid
Percen
tag
e o
f fi
sh
ers
Avidity Class
< 4m
4-5m
6-7m
8-9m
>10m
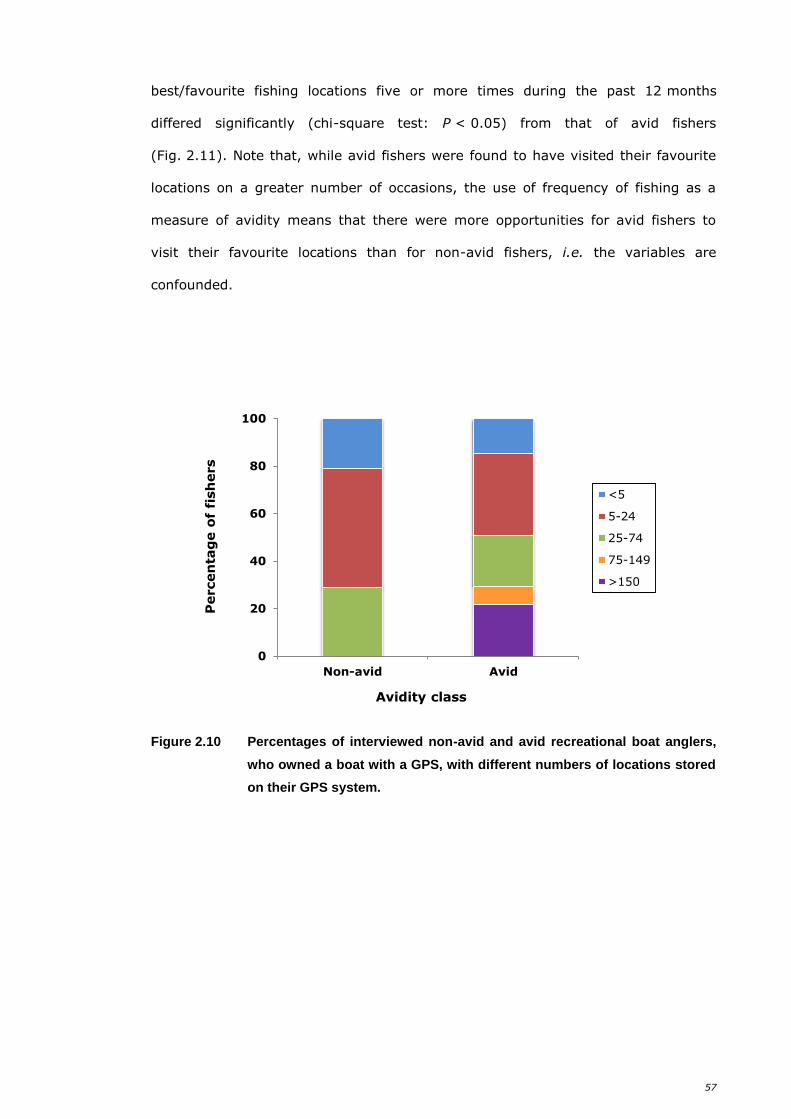
57
best/favourite fishing locations five or more times during the past 12 months
differed significantly (chi-square test: P < 0.05) from that of avid fishers
(Fig. 2.11). Note that, while avid fishers were found to have visited their favourite
locations on a greater number of occasions, the use of frequency of fishing as a
measure of avidity means that there were more opportunities for avid fishers to
visit their favourite locations than for non-avid fishers, i.e. the variables are
confounded.
Figure 2.10 Percentages of interviewed non-avid and avid recreational boat anglers,
who owned a boat with a GPS, with different numbers of locations stored
on their GPS system.
0
20
40
60
80
100
Non-avid Avid
Percen
tag
e o
f fi
sh
ers
Avidity class
<5
5-24
25-74
75-149
>150
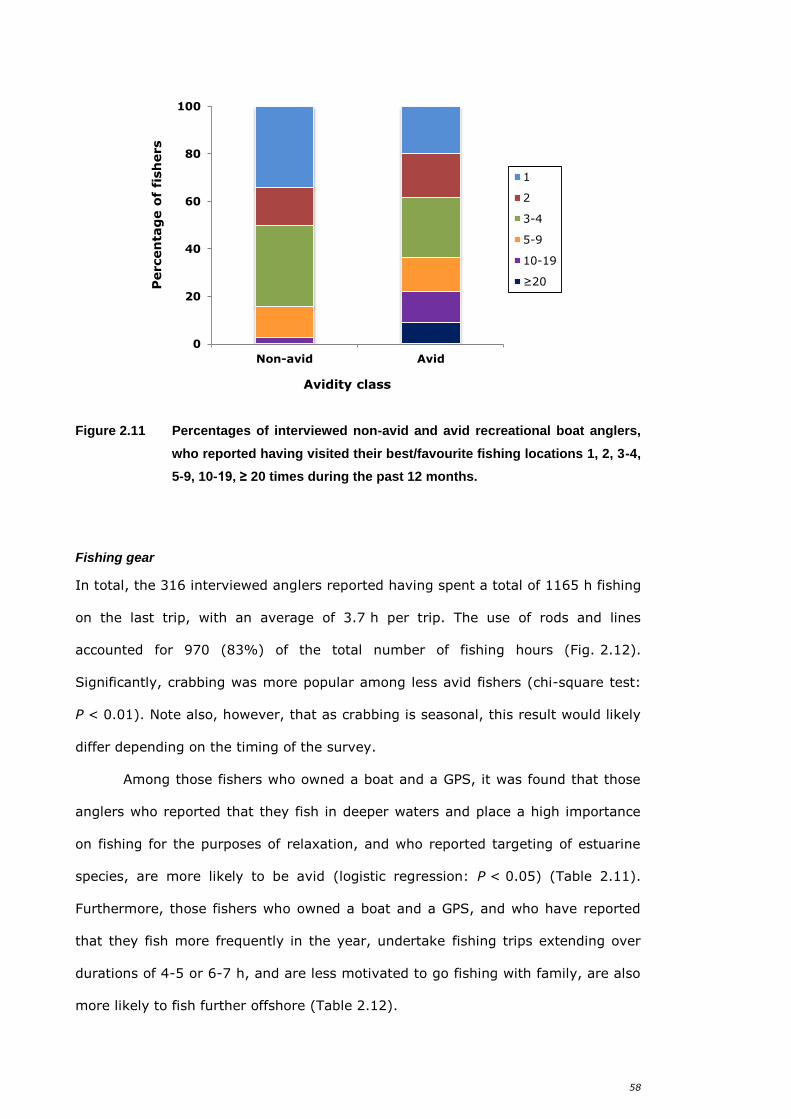
58
Figure 2.11 Percentages of interviewed non-avid and avid recreational boat anglers,
who reported having visited their best/favourite fishing locations 1, 2, 3-4,
5-9, 10-19, ≥ 20 times during the past 12 months.
Fishing gear
In total, the 316 interviewed anglers reported having spent a total of 1165 h fishing
on the last trip, with an average of 3.7 h per trip. The use of rods and lines
accounted for 970 (83%) of the total number of fishing hours (Fig. 2.12).
Significantly, crabbing was more popular among less avid fishers (chi-square test:
P < 0.01). Note also, however, that as crabbing is seasonal, this result would likely
differ depending on the timing of the survey.
Among those fishers who owned a boat and a GPS, it was found that those
anglers who reported that they fish in deeper waters and place a high importance
on fishing for the purposes of relaxation, and who reported targeting of estuarine
species, are more likely to be avid (logistic regression: P < 0.05) (Table 2.11).
Furthermore, those fishers who owned a boat and a GPS, and who have reported
that they fish more frequently in the year, undertake fishing trips extending over
durations of 4-5 or 6-7 h, and are less motivated to go fishing with family, are also
more likely to fish further offshore (Table 2.12).
0
20
40
60
80
100
Non-avid Avid
Percen
tag
e o
f fi
sh
ers
Avidity class
1
2
3-4
5-9
10-19
≥20
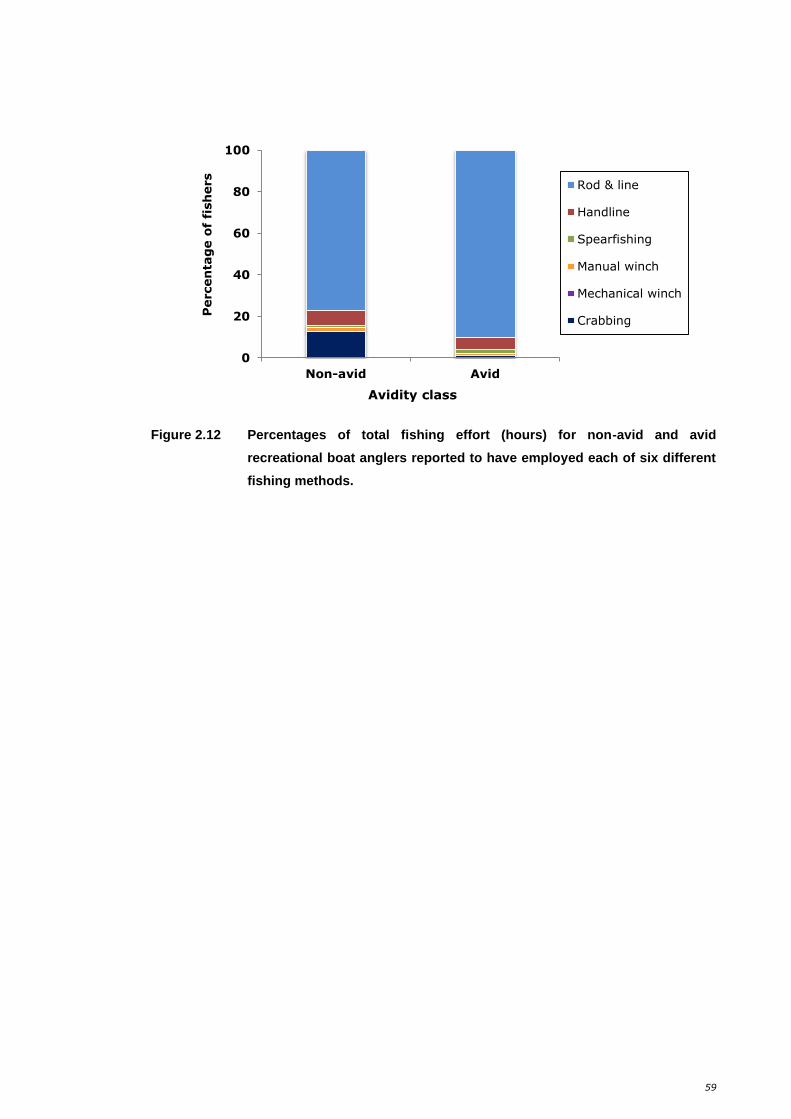
59
Figure 2.12 Percentages of total fishing effort (hours) for non-avid and avid
recreational boat anglers reported to have employed each of six different
fishing methods.
0
20
40
60
80
100
Non-avid Avid
Percen
tag
e o
f fi
sh
ers
Avidity class
Rod & line
Handline
Spearfishing
Manual winch
Mechanical winch
Crabbing
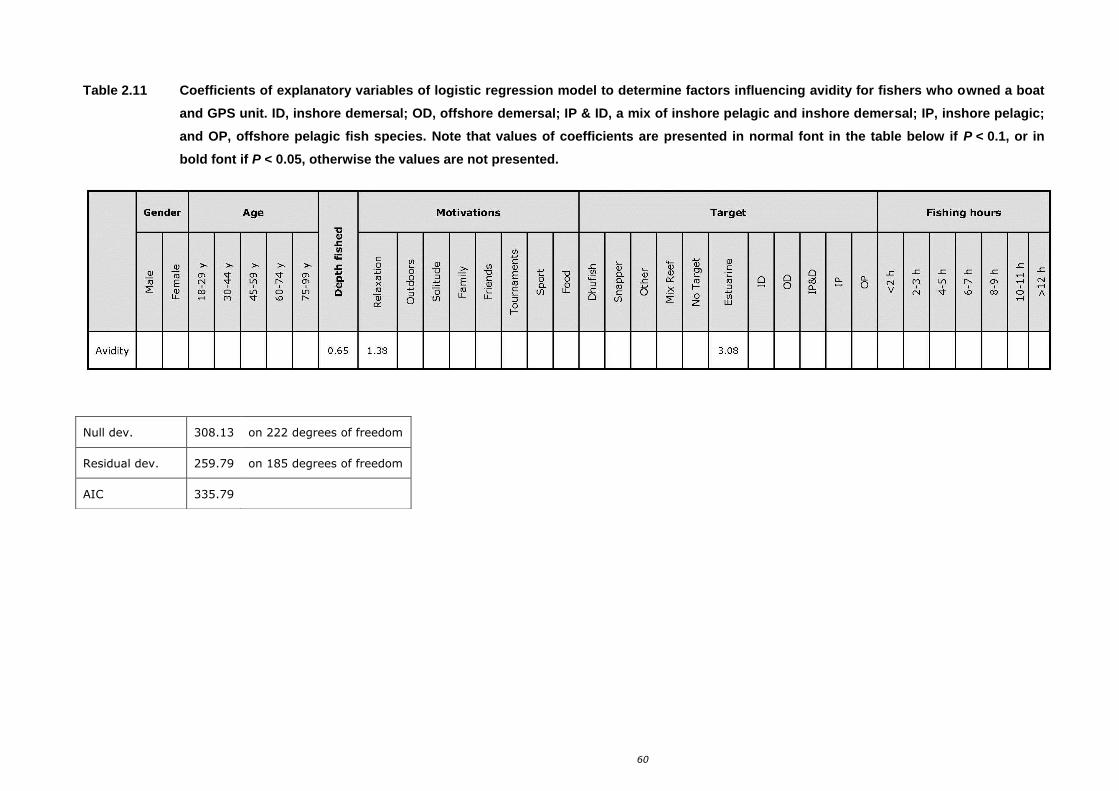
60
Table 2.11 Coefficients of explanatory variables of logistic regression model to determine factors influencing avidity for fishers who owned a boat
and GPS unit. ID, inshore demersal; OD, offshore demersal; IP & ID, a mix of inshore pelagic and inshore demersal; IP, inshore pelagic;
and OP, offshore pelagic fish species. Note that values of coefficients are presented in normal font in the table below if P < 0.1, or in
bold font if P < 0.05, otherwise the values are not presented.
Null dev. 308.13 on 222 degrees of freedom
Residual dev. 259.79 on 185 degrees of freedom
AIC 335.79
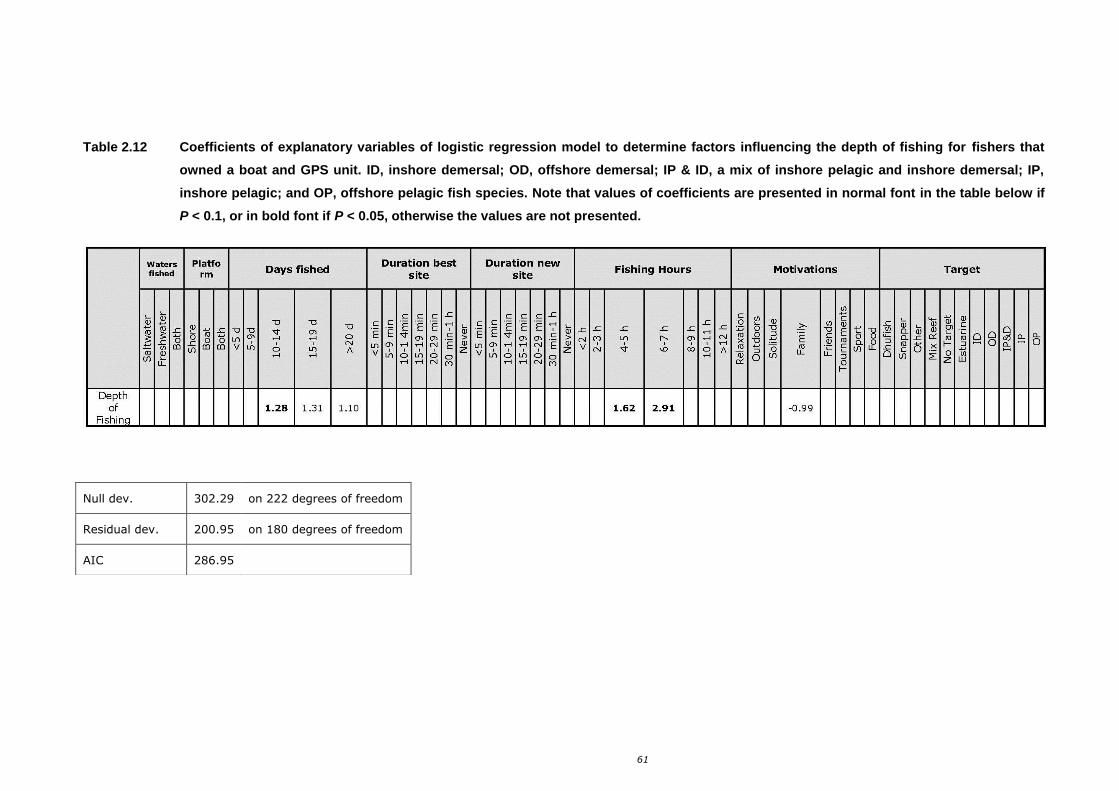
61
Table 2.12 Coefficients of explanatory variables of logistic regression model to determine factors influencing the depth of fishing for fishers that
owned a boat and GPS unit. ID, inshore demersal; OD, offshore demersal; IP & ID, a mix of inshore pelagic and inshore demersal; IP,
inshore pelagic; and OP, offshore pelagic fish species. Note that values of coefficients are presented in normal font in the table below if
P < 0.1, or in bold font if P < 0.05, otherwise the values are not presented.
Null dev. 302.29 on 222 degrees of freedom
Residual dev. 200.95 on 180 degrees of freedom
AIC 286.95
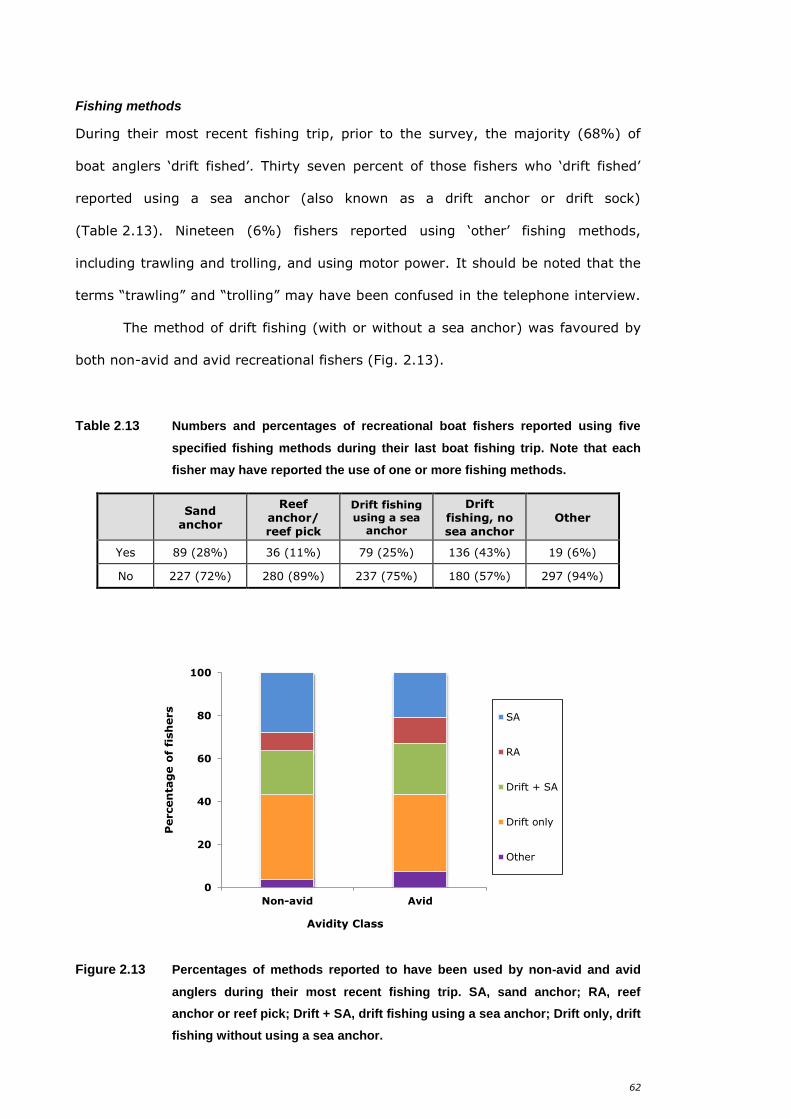
62
Fishing methods
During their most recent fishing trip, prior to the survey, the majority (68%) of
boat anglers ‘drift fished’. Thirty seven percent of those fishers who ‘drift fished’
reported using a sea anchor (also known as a drift anchor or drift sock)
(Table 2.13). Nineteen (6%) fishers reported using ‘other’ fishing methods,
including trawling and trolling, and using motor power. It should be noted that the
terms “trawling” and “trolling” may have been confused in the telephone interview.
The method of drift fishing (with or without a sea anchor) was favoured by
both non-avid and avid recreational fishers (Fig. 2.13).
Table 2.13 Numbers and percentages of recreational boat fishers reported using five
specified fishing methods during their last boat fishing trip. Note that each
fisher may have reported the use of one or more fishing methods.
Sand
anchor
Reef anchor/ reef pick
Drift fishing using a sea
anchor
Drift fishing, no sea anchor
Other
Yes 89 (28%) 36 (11%) 79 (25%) 136 (43%) 19 (6%)
No 227 (72%) 280 (89%) 237 (75%) 180 (57%) 297 (94%)
Figure 2.13 Percentages of methods reported to have been used by non-avid and avid
anglers during their most recent fishing trip. SA, sand anchor; RA, reef
anchor or reef pick; Drift + SA, drift fishing using a sea anchor; Drift only, drift
fishing without using a sea anchor.
0
20
40
60
80
100
Non-avid Avid
Percen
tag
e o
f fi
sh
ers
Avidity Class
SA
RA
Drift + SA
Drift only
Other
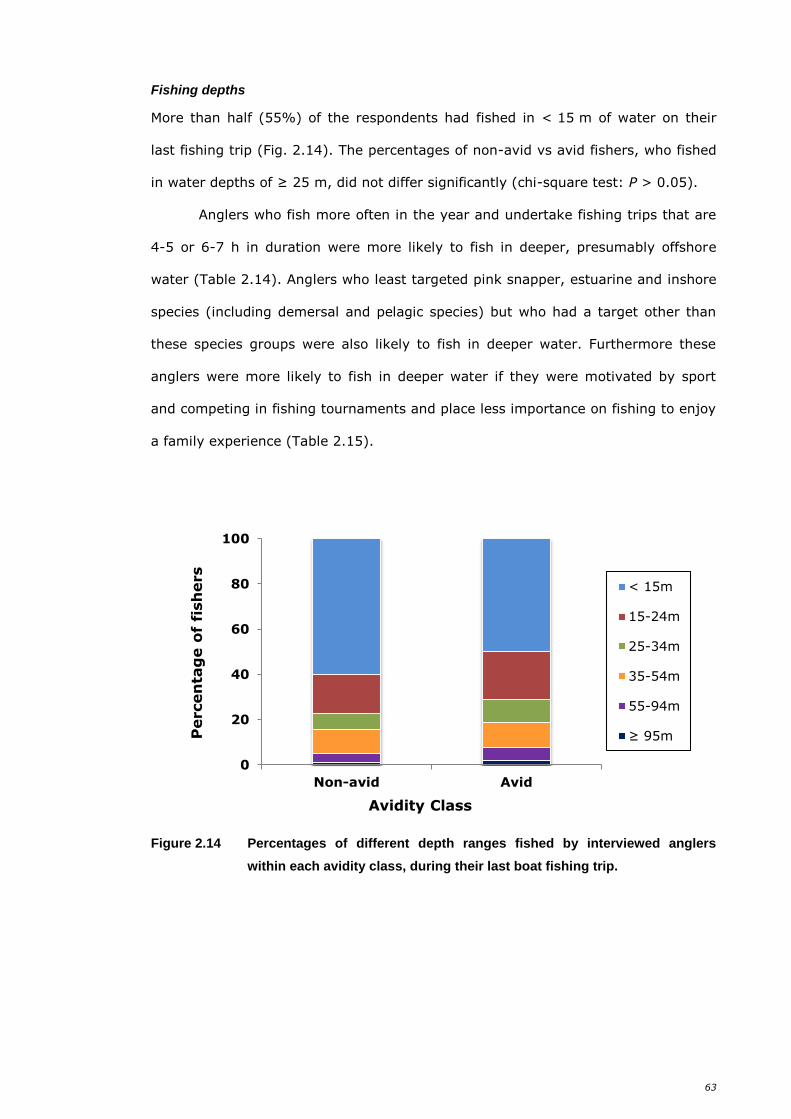
63
Fishing depths
More than half (55%) of the respondents had fished in < 15 m of water on their
last fishing trip (Fig. 2.14). The percentages of non-avid vs avid fishers, who fished
in water depths of ≥ 25 m, did not differ significantly (chi-square test: P > 0.05).
Anglers who fish more often in the year and undertake fishing trips that are
4-5 or 6-7 h in duration were more likely to fish in deeper, presumably offshore
water (Table 2.14). Anglers who least targeted pink snapper, estuarine and inshore
species (including demersal and pelagic species) but who had a target other than
these species groups were also likely to fish in deeper water. Furthermore these
anglers were more likely to fish in deeper water if they were motivated by sport
and competing in fishing tournaments and place less importance on fishing to enjoy
a family experience (Table 2.15).
Figure 2.14 Percentages of different depth ranges fished by interviewed anglers
within each avidity class, during their last boat fishing trip.
0
20
40
60
80
100
Non-avid Avid
Percen
tag
e o
f fi
sh
ers
Avidity Class
< 15m
15-24m
25-34m
35-54m
55-94m
≥ 95m
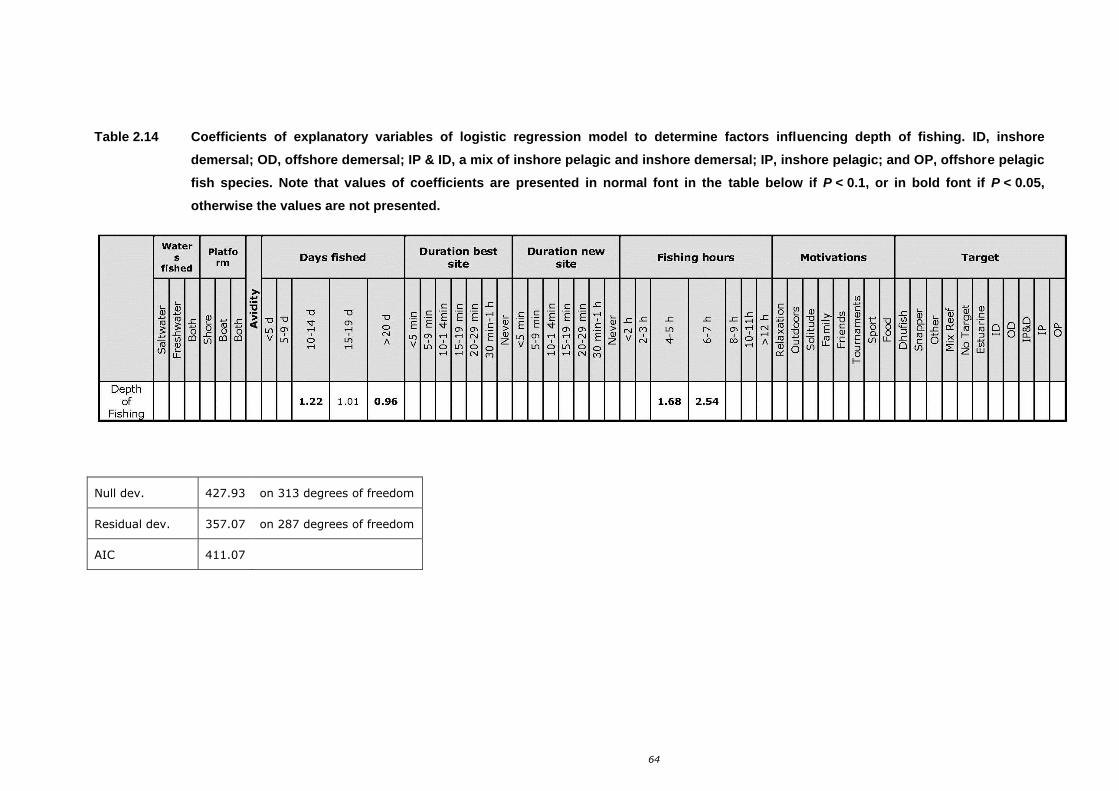
64
Table 2.14 Coefficients of explanatory variables of logistic regression model to determine factors influencing depth of fishing. ID, inshore
demersal; OD, offshore demersal; IP & ID, a mix of inshore pelagic and inshore demersal; IP, inshore pelagic; and OP, offshore pelagic
fish species. Note that values of coefficients are presented in normal font in the table below if P < 0.1, or in bold font if P < 0.05,
otherwise the values are not presented.
Null dev. 427.93 on 313 degrees of freedom
Residual dev. 357.07 on 287 degrees of freedom
AIC 411.07
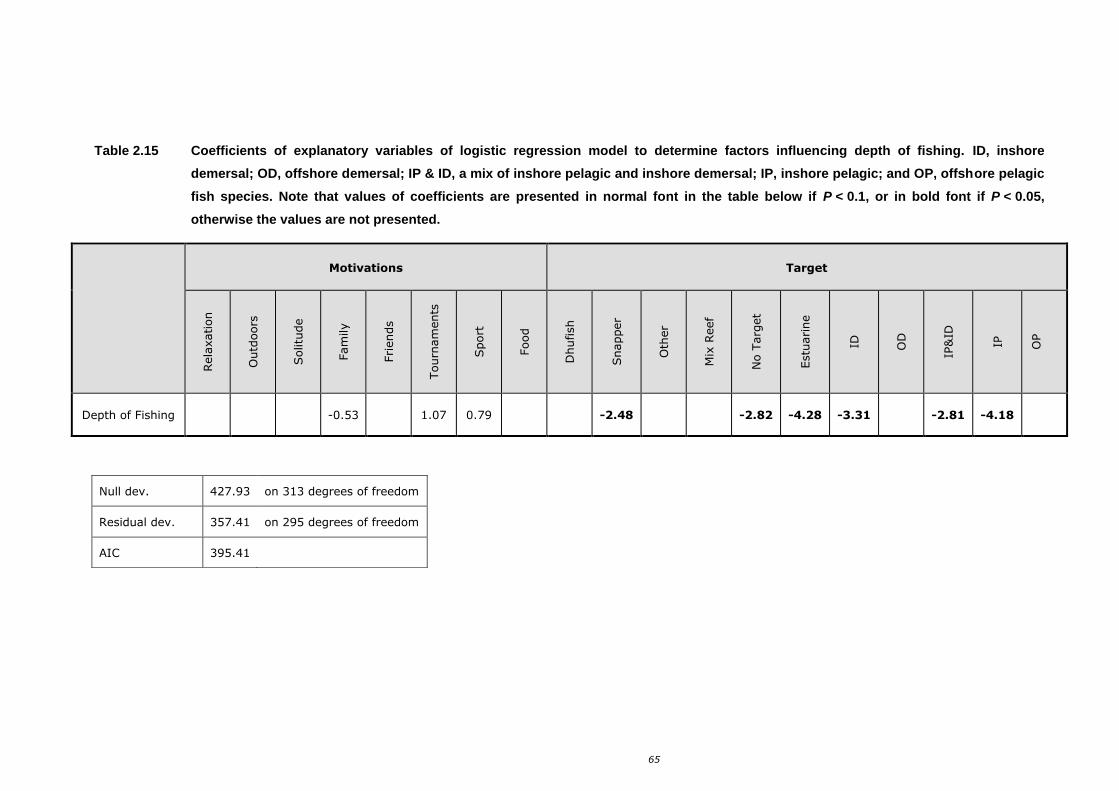
65
Table 2.15 Coefficients of explanatory variables of logistic regression model to determine factors influencing depth of fishing. ID, inshore
demersal; OD, offshore demersal; IP & ID, a mix of inshore pelagic and inshore demersal; IP, inshore pelagic; and OP, offshore pelagic
fish species. Note that values of coefficients are presented in normal font in the table below if P < 0.1, or in bold font if P < 0.05,
otherwise the values are not presented.
Motivations Target
Rela
xation
Outd
oors
Solitu
de
Fam
ily
Fri
ends
Tourn
am
ents
Sport
Food
Dhufish
Snapper
Oth
er
Mix
Reef
No T
arg
et
Estu
arine
ID
OD
IP&
ID
IP
OP
Depth of Fishing -0.53 1.07 0.79 -2.48 -2.82 -4.28 -3.31 -2.81 -4.18
Null dev. 427.93 on 313 degrees of freedom
Residual dev. 357.41 on 295 degrees of freedom
AIC 395.41
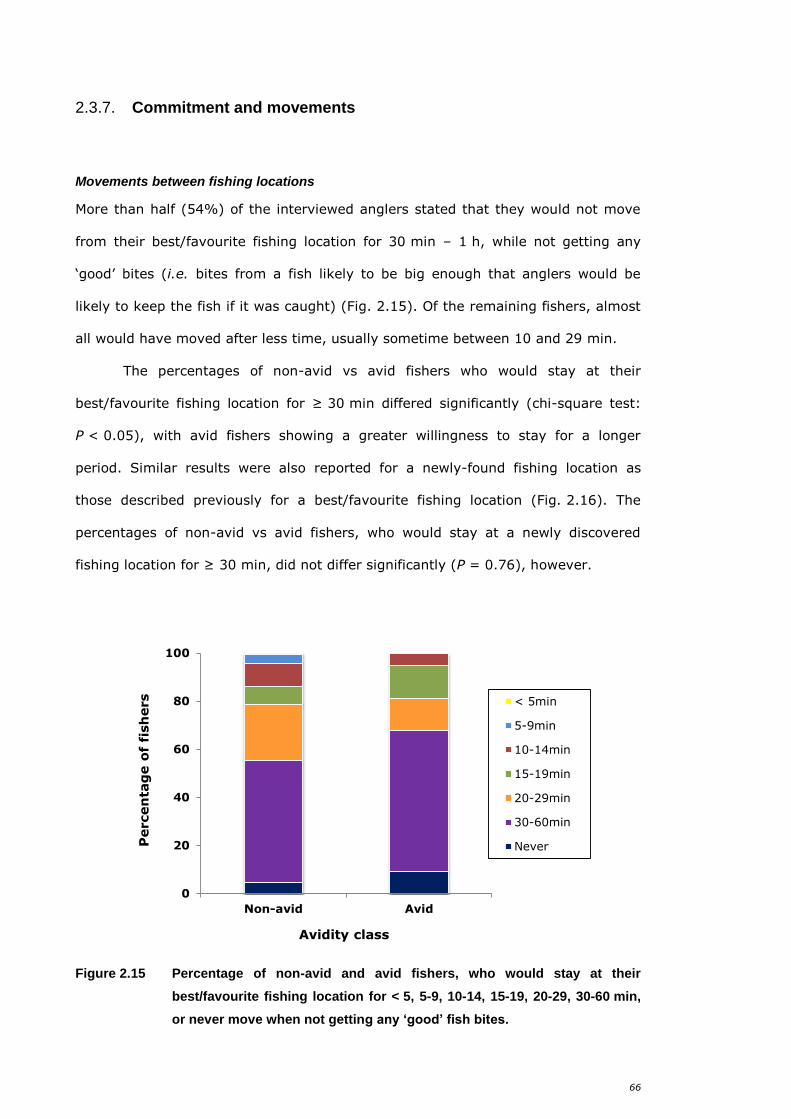
66
2.3.7. Commitment and movements
Movements between fishing locations
More than half (54%) of the interviewed anglers stated that they would not move
from their best/favourite fishing location for 30 min – 1 h, while not getting any
‘good’ bites (i.e. bites from a fish likely to be big enough that anglers would be
likely to keep the fish if it was caught) (Fig. 2.15). Of the remaining fishers, almost
all would have moved after less time, usually sometime between 10 and 29 min.
The percentages of non-avid vs avid fishers who would stay at their
best/favourite fishing location for ≥ 30 min differed significantly (chi-square test:
P < 0.05), with avid fishers showing a greater willingness to stay for a longer
period. Similar results were also reported for a newly-found fishing location as
those described previously for a best/favourite fishing location (Fig. 2.16). The
percentages of non-avid vs avid fishers, who would stay at a newly discovered
fishing location for ≥ 30 min, did not differ significantly (P = 0.76), however.
Figure 2.15 Percentage of non-avid and avid fishers, who would stay at their
best/favourite fishing location for < 5, 5-9, 10-14, 15-19, 20-29, 30-60 min,
or never move when not getting any ‘good’ fish bites.
0
20
40
60
80
100
Non-avid Avid
Percen
tag
e o
f fi
sh
ers
Avidity class
< 5min
5-9min
10-14min
15-19min
20-29min
30-60min
Never
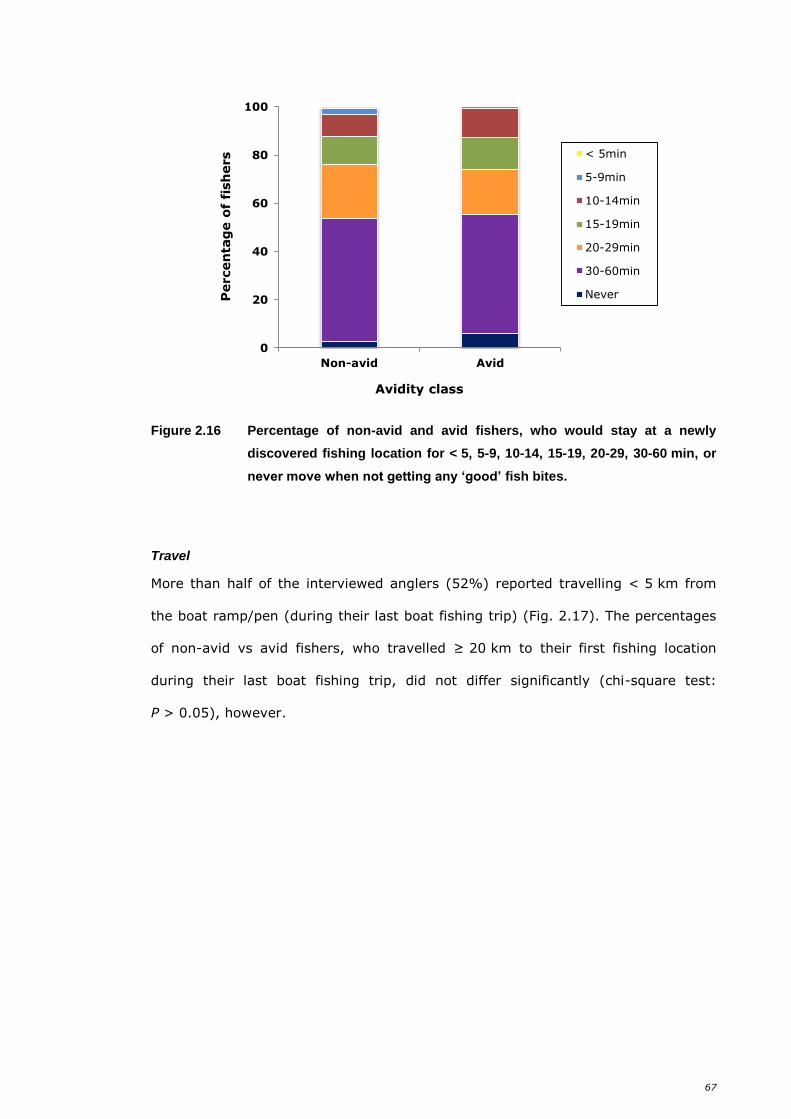
67
Figure 2.16 Percentage of non-avid and avid fishers, who would stay at a newly
discovered fishing location for < 5, 5-9, 10-14, 15-19, 20-29, 30-60 min, or
never move when not getting any ‘good’ fish bites.
Travel
More than half of the interviewed anglers (52%) reported travelling < 5 km from
the boat ramp/pen (during their last boat fishing trip) (Fig. 2.17). The percentages
of non-avid vs avid fishers, who travelled ≥ 20 km to their first fishing location
during their last boat fishing trip, did not differ significantly (chi-square test:
P > 0.05), however.
0
20
40
60
80
100
Non-avid Avid
Percen
tag
e o
f fi
sh
ers
Avidity class
< 5min
5-9min
10-14min
15-19min
20-29min
30-60min
Never
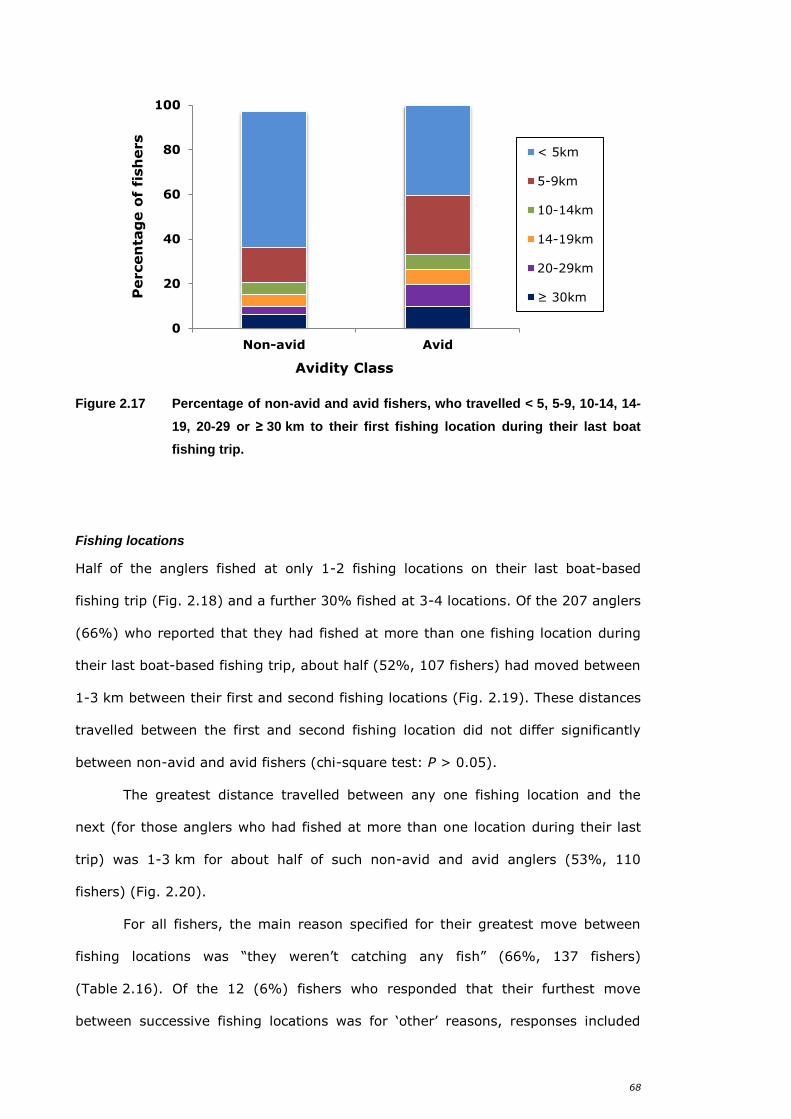
68
Figure 2.17 Percentage of non-avid and avid fishers, who travelled < 5, 5-9, 10-14, 14-
19, 20-29 or ≥ 30 km to their first fishing location during their last boat
fishing trip.
Fishing locations
Half of the anglers fished at only 1-2 fishing locations on their last boat-based
fishing trip (Fig. 2.18) and a further 30% fished at 3-4 locations. Of the 207 anglers
(66%) who reported that they had fished at more than one fishing location during
their last boat-based fishing trip, about half (52%, 107 fishers) had moved between
1-3 km between their first and second fishing locations (Fig. 2.19). These distances
travelled between the first and second fishing location did not differ significantly
between non-avid and avid fishers (chi-square test: P > 0.05).
The greatest distance travelled between any one fishing location and the
next (for those anglers who had fished at more than one location during their last
trip) was 1-3 km for about half of such non-avid and avid anglers (53%, 110
fishers) (Fig. 2.20).
For all fishers, the main reason specified for their greatest move between
fishing locations was “they weren’t catching any fish” (66%, 137 fishers)
(Table 2.16). Of the 12 (6%) fishers who responded that their furthest move
between successive fishing locations was for ‘other’ reasons, responses included
0
20
40
60
80
100
Non-avid Avid
Percen
tag
e o
f fi
sh
ers
Avidity Class
< 5km
5-9km
10-14km
14-19km
20-29km
≥ 30km
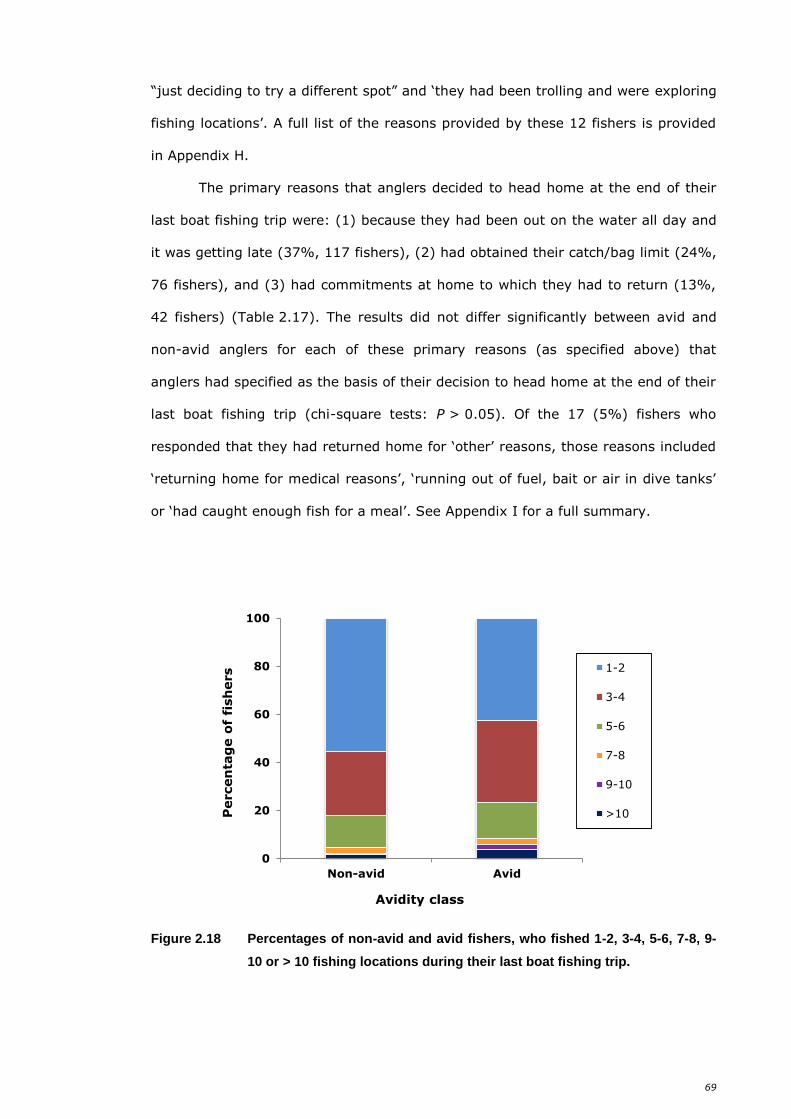
69
“just deciding to try a different spot” and ‘they had been trolling and were exploring
fishing locations’. A full list of the reasons provided by these 12 fishers is provided
in Appendix H.
The primary reasons that anglers decided to head home at the end of their
last boat fishing trip were: (1) because they had been out on the water all day and
it was getting late (37%, 117 fishers), (2) had obtained their catch/bag limit (24%,
76 fishers), and (3) had commitments at home to which they had to return (13%,
42 fishers) (Table 2.17). The results did not differ significantly between avid and
non-avid anglers for each of these primary reasons (as specified above) that
anglers had specified as the basis of their decision to head home at the end of their
last boat fishing trip (chi-square tests: P > 0.05). Of the 17 (5%) fishers who
responded that they had returned home for ‘other’ reasons, those reasons included
‘returning home for medical reasons’, ‘running out of fuel, bait or air in dive tanks’
or ‘had caught enough fish for a meal’. See Appendix I for a full summary.
Figure 2.18 Percentages of non-avid and avid fishers, who fished 1-2, 3-4, 5-6, 7-8, 9-
10 or > 10 fishing locations during their last boat fishing trip.
0
20
40
60
80
100
Non-avid Avid
Percen
tag
e o
f fi
sh
ers
Avidity class
1-2
3-4
5-6
7-8
9-10
>10
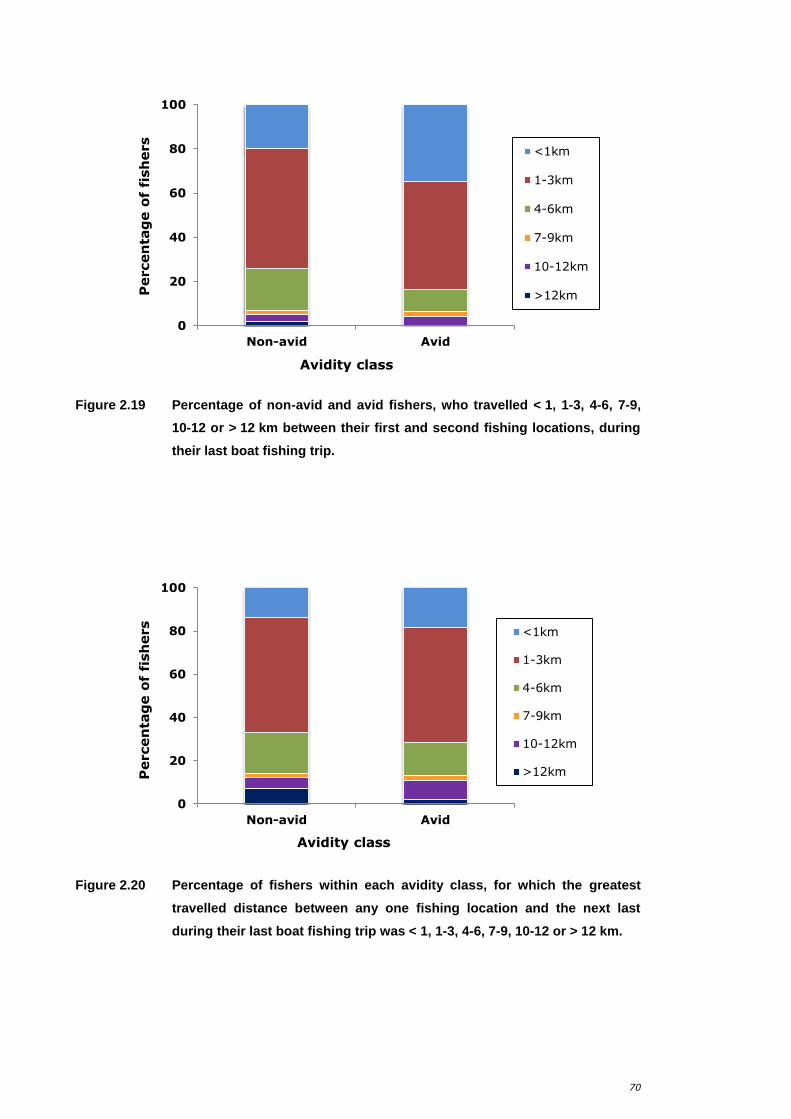
70
Figure 2.19 Percentage of non-avid and avid fishers, who travelled < 1, 1-3, 4-6, 7-9,
10-12 or > 12 km between their first and second fishing locations, during
their last boat fishing trip.
Figure 2.20 Percentage of fishers within each avidity class, for which the greatest
travelled distance between any one fishing location and the next last
during their last boat fishing trip was < 1, 1-3, 4-6, 7-9, 10-12 or > 12 km.
0
20
40
60
80
100
Non-avid Avid
Percen
tag
e o
f fi
sh
ers
Avidity class
<1km
1-3km
4-6km
7-9km
10-12km
>12km
0
20
40
60
80
100
Non-avid Avid
Percen
tag
e o
f fi
sh
ers
Avidity class
<1km
1-3km
4-6km
7-9km
10-12km
>12km
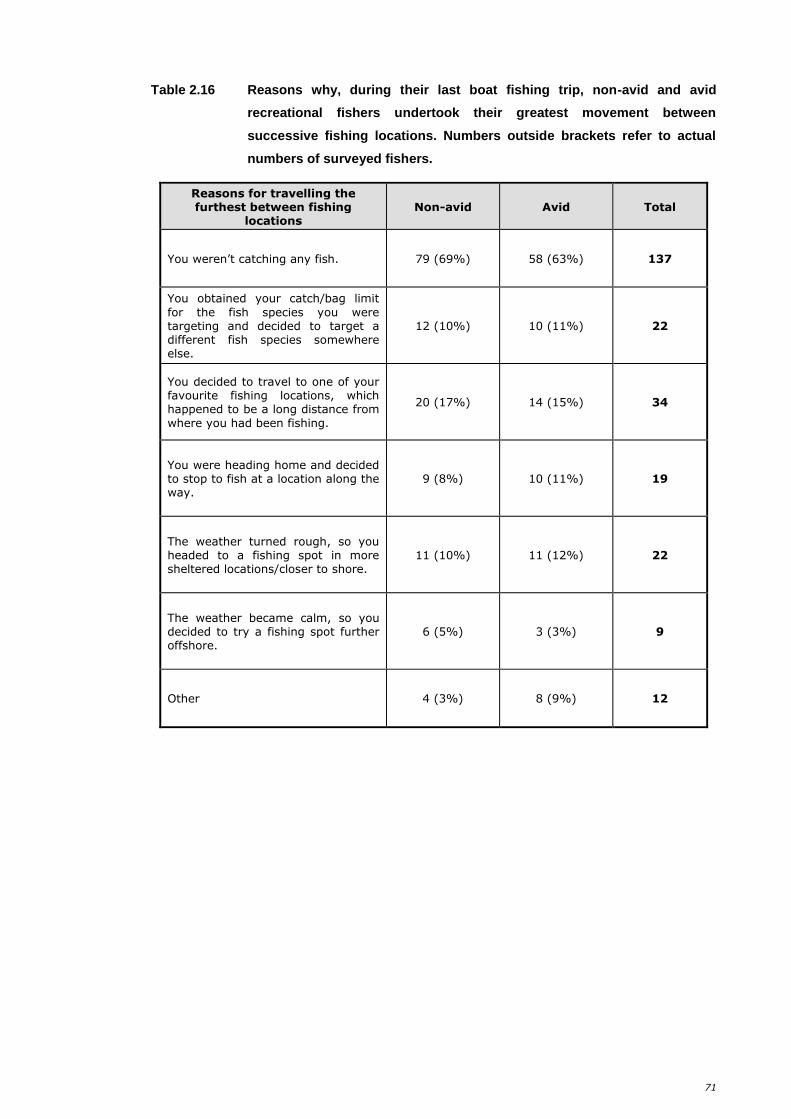
71
Table 2.16 Reasons why, during their last boat fishing trip, non-avid and avid
recreational fishers undertook their greatest movement between
successive fishing locations. Numbers outside brackets refer to actual
numbers of surveyed fishers.
Reasons for travelling the furthest between fishing
locations Non-avid Avid Total
You weren’t catching any fish. 79 (69%) 58 (63%) 137
You obtained your catch/bag limit
for the fish species you were targeting and decided to target a different fish species somewhere else.
12 (10%) 10 (11%) 22
You decided to travel to one of your favourite fishing locations, which happened to be a long distance from
where you had been fishing.
20 (17%) 14 (15%) 34
You were heading home and decided to stop to fish at a location along the way.
9 (8%) 10 (11%) 19
The weather turned rough, so you headed to a fishing spot in more sheltered locations/closer to shore.
11 (10%) 11 (12%) 22
The weather became calm, so you decided to try a fishing spot further offshore.
6 (5%) 3 (3%) 9
Other 4 (3%) 8 (9%) 12
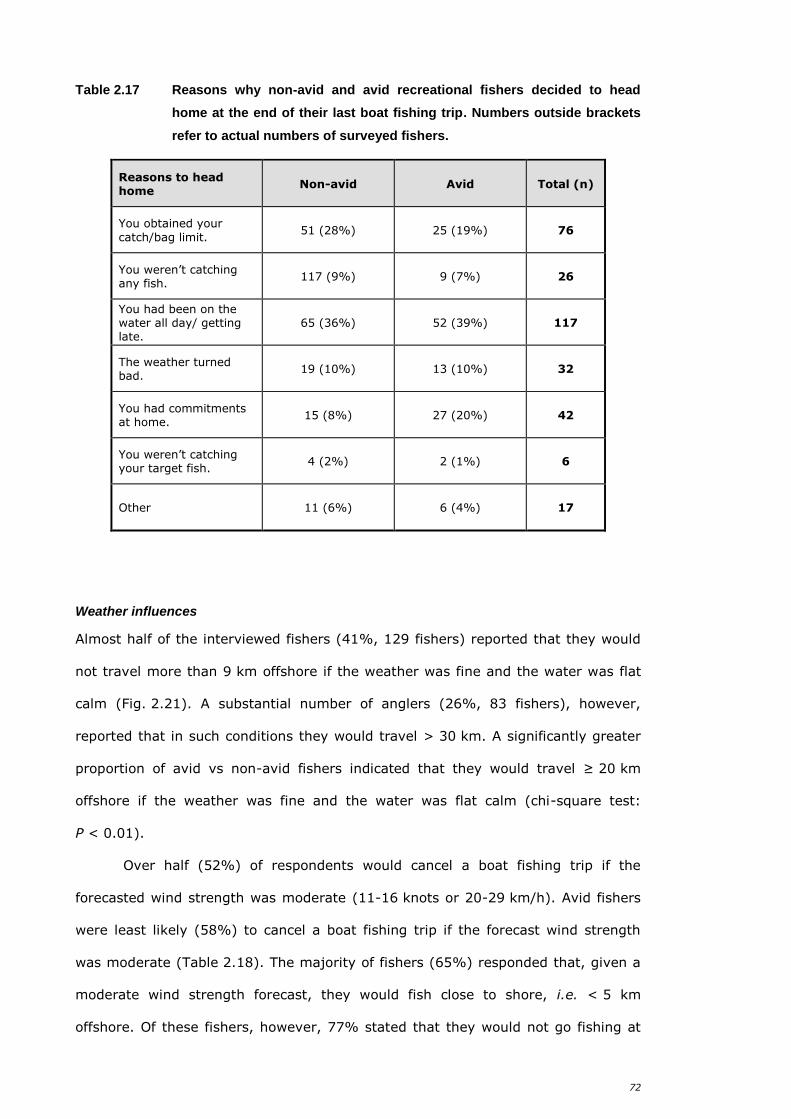
72
Table 2.17 Reasons why non-avid and avid recreational fishers decided to head
home at the end of their last boat fishing trip. Numbers outside brackets
refer to actual numbers of surveyed fishers.
Reasons to head home
Non-avid Avid Total (n)
You obtained your
catch/bag limit. 51 (28%) 25 (19%) 76
You weren’t catching any fish.
117 (9%) 9 (7%) 26
You had been on the water all day/ getting late.
65 (36%) 52 (39%) 117
The weather turned bad.
19 (10%) 13 (10%) 32
You had commitments at home.
15 (8%) 27 (20%) 42
You weren’t catching your target fish.
4 (2%) 2 (1%) 6
Other 11 (6%) 6 (4%) 17
Weather influences
Almost half of the interviewed fishers (41%, 129 fishers) reported that they would
not travel more than 9 km offshore if the weather was fine and the water was flat
calm (Fig. 2.21). A substantial number of anglers (26%, 83 fishers), however,
reported that in such conditions they would travel > 30 km. A significantly greater
proportion of avid vs non-avid fishers indicated that they would travel ≥ 20 km
offshore if the weather was fine and the water was flat calm (chi-square test:
P < 0.01).
Over half (52%) of respondents would cancel a boat fishing trip if the
forecasted wind strength was moderate (11-16 knots or 20-29 km/h). Avid fishers
were least likely (58%) to cancel a boat fishing trip if the forecast wind strength
was moderate (Table 2.18). The majority of fishers (65%) responded that, given a
moderate wind strength forecast, they would fish close to shore, i.e. < 5 km
offshore. Of these fishers, however, 77% stated that they would not go fishing at
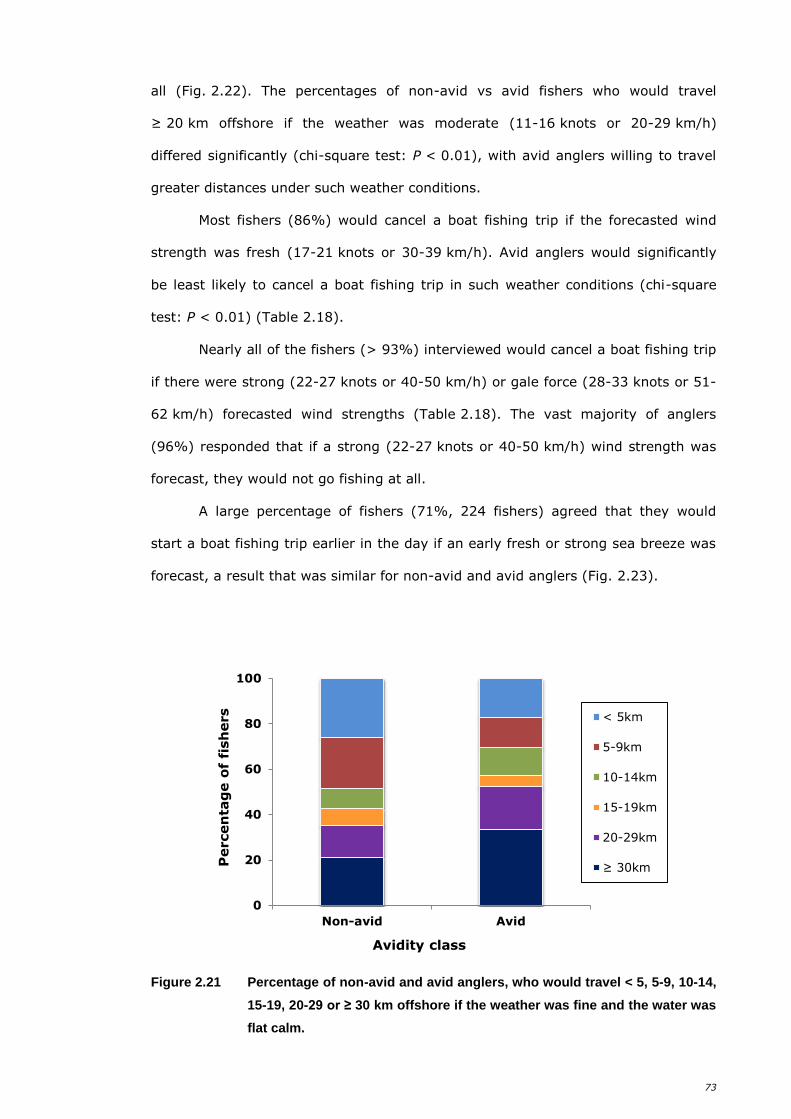
73
all (Fig. 2.22). The percentages of non-avid vs avid fishers who would travel
≥ 20 km offshore if the weather was moderate (11-16 knots or 20-29 km/h)
differed significantly (chi-square test: P < 0.01), with avid anglers willing to travel
greater distances under such weather conditions.
Most fishers (86%) would cancel a boat fishing trip if the forecasted wind
strength was fresh (17-21 knots or 30-39 km/h). Avid anglers would significantly
be least likely to cancel a boat fishing trip in such weather conditions (chi-square
test: P < 0.01) (Table 2.18).
Nearly all of the fishers (> 93%) interviewed would cancel a boat fishing trip
if there were strong (22-27 knots or 40-50 km/h) or gale force (28-33 knots or 51-
62 km/h) forecasted wind strengths (Table 2.18). The vast majority of anglers
(96%) responded that if a strong (22-27 knots or 40-50 km/h) wind strength was
forecast, they would not go fishing at all.
A large percentage of fishers (71%, 224 fishers) agreed that they would
start a boat fishing trip earlier in the day if an early fresh or strong sea breeze was
forecast, a result that was similar for non-avid and avid anglers (Fig. 2.23).
Figure 2.21 Percentage of non-avid and avid anglers, who would travel < 5, 5-9, 10-14,
15-19, 20-29 or ≥ 30 km offshore if the weather was fine and the water was
flat calm.
0
20
40
60
80
100
Non-avid Avid
Percen
tag
e o
f fi
sh
ers
Avidity class
< 5km
5-9km
10-14km
15-19km
20-29km
≥ 30km
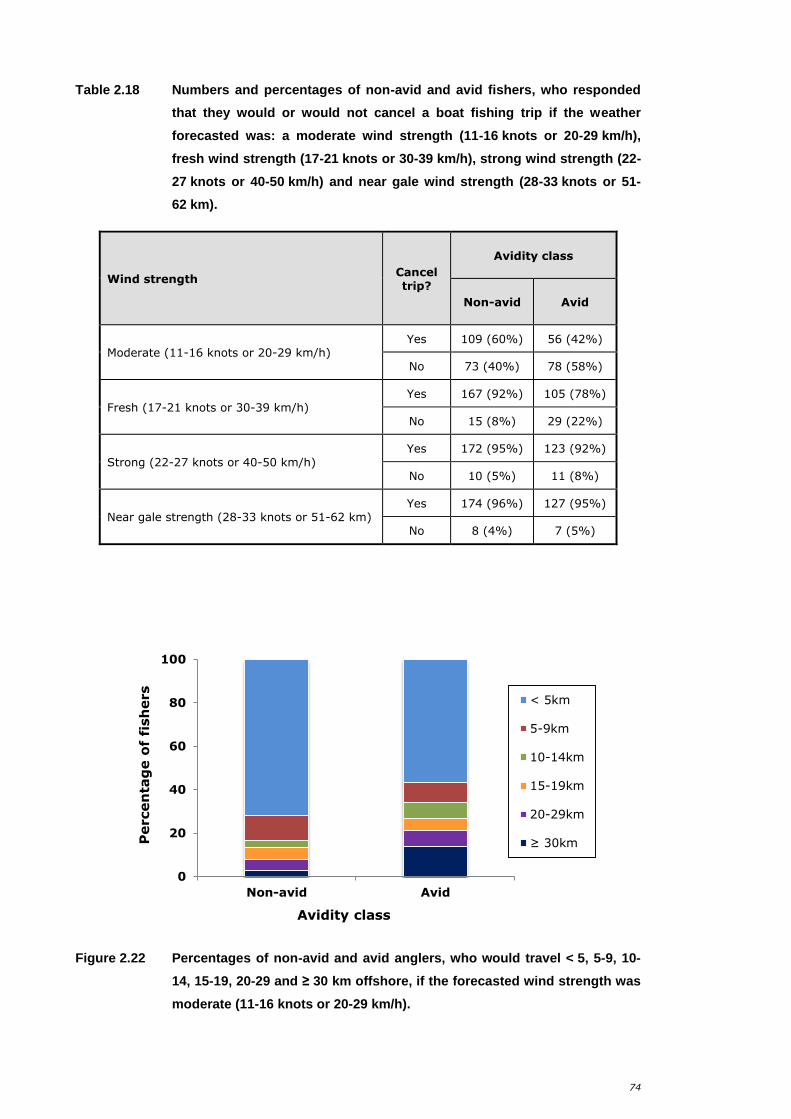
74
Table 2.18 Numbers and percentages of non-avid and avid fishers, who responded
that they would or would not cancel a boat fishing trip if the weather
forecasted was: a moderate wind strength (11-16 knots or 20-29 km/h),
fresh wind strength (17-21 knots or 30-39 km/h), strong wind strength (22-
27 knots or 40-50 km/h) and near gale wind strength (28-33 knots or 51-
62 km).
Wind strength Cancel trip?
Avidity class
Non-avid Avid
Moderate (11-16 knots or 20-29 km/h) Yes 109 (60%) 56 (42%)
No 73 (40%) 78 (58%)
Fresh (17-21 knots or 30-39 km/h) Yes 167 (92%) 105 (78%)
No 15 (8%) 29 (22%)
Strong (22-27 knots or 40-50 km/h) Yes 172 (95%) 123 (92%)
No 10 (5%) 11 (8%)
Near gale strength (28-33 knots or 51-62 km) Yes 174 (96%) 127 (95%)
No 8 (4%) 7 (5%)
Figure 2.22 Percentages of non-avid and avid anglers, who would travel < 5, 5-9, 10-
14, 15-19, 20-29 and ≥ 30 km offshore, if the forecasted wind strength was
moderate (11-16 knots or 20-29 km/h).
0
20
40
60
80
100
Non-avid Avid
Percen
tag
e o
f fi
sh
ers
Avidity class
< 5km
5-9km
10-14km
15-19km
20-29km
≥ 30km
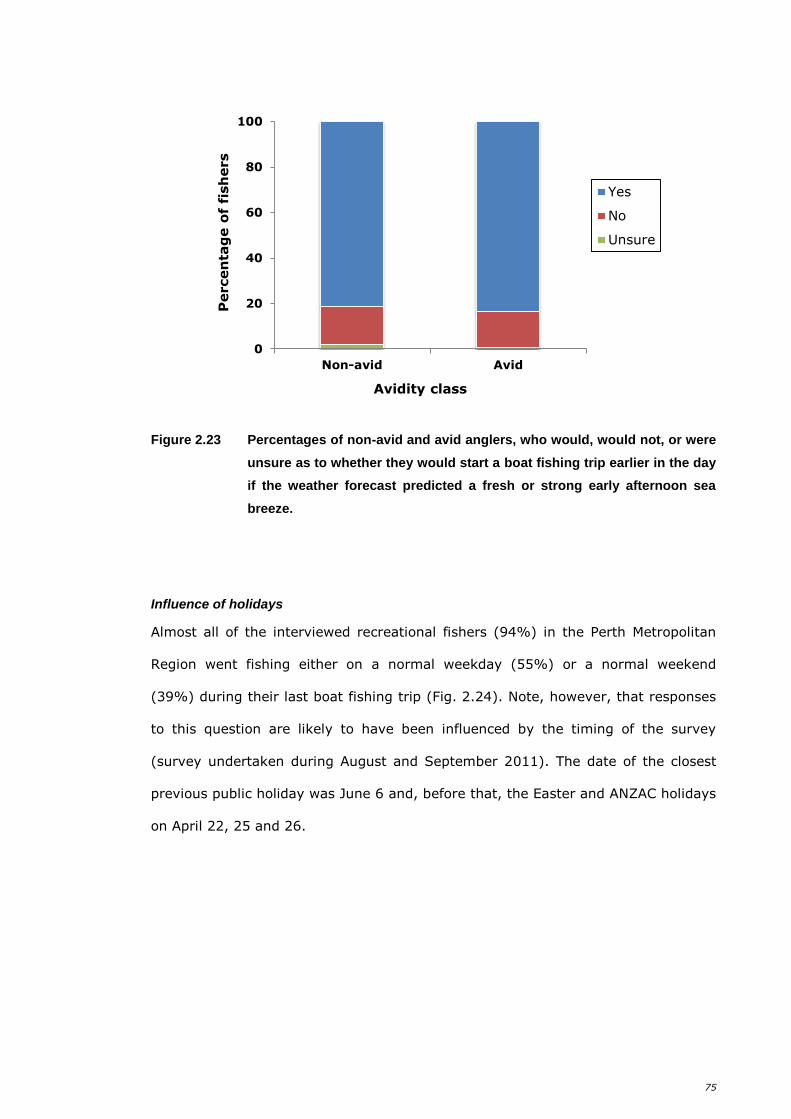
75
Figure 2.23 Percentages of non-avid and avid anglers, who would, would not, or were
unsure as to whether they would start a boat fishing trip earlier in the day
if the weather forecast predicted a fresh or strong early afternoon sea
breeze.
Influence of holidays
Almost all of the interviewed recreational fishers (94%) in the Perth Metropolitan
Region went fishing either on a normal weekday (55%) or a normal weekend
(39%) during their last boat fishing trip (Fig. 2.24). Note, however, that responses
to this question are likely to have been influenced by the timing of the survey
(survey undertaken during August and September 2011). The date of the closest
previous public holiday was June 6 and, before that, the Easter and ANZAC holidays
on April 22, 25 and 26.
0
20
40
60
80
100
Non-avid Avid
Percen
tag
e o
f fi
sh
ers
Avidity class
Yes
No
Unsure
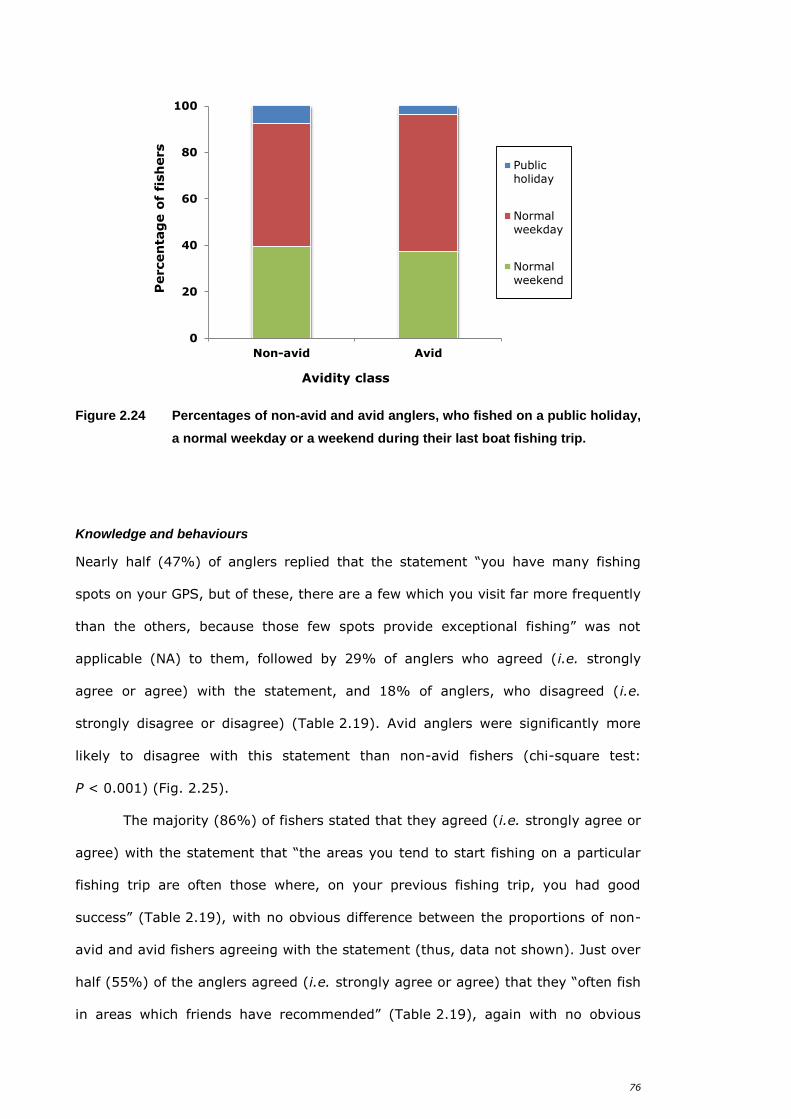
76
Figure 2.24 Percentages of non-avid and avid anglers, who fished on a public holiday,
a normal weekday or a weekend during their last boat fishing trip.
Knowledge and behaviours
Nearly half (47%) of anglers replied that the statement “you have many fishing
spots on your GPS, but of these, there are a few which you visit far more frequently
than the others, because those few spots provide exceptional fishing” was not
applicable (NA) to them, followed by 29% of anglers who agreed (i.e. strongly
agree or agree) with the statement, and 18% of anglers, who disagreed (i.e.
strongly disagree or disagree) (Table 2.19). Avid anglers were significantly more
likely to disagree with this statement than non-avid fishers (chi-square test:
P < 0.001) (Fig. 2.25).
The majority (86%) of fishers stated that they agreed (i.e. strongly agree or
agree) with the statement that “the areas you tend to start fishing on a particular
fishing trip are often those where, on your previous fishing trip, you had good
success” (Table 2.19), with no obvious difference between the proportions of non-
avid and avid fishers agreeing with the statement (thus, data not shown). Just over
half (55%) of the anglers agreed (i.e. strongly agree or agree) that they “often fish
in areas which friends have recommended” (Table 2.19), again with no obvious
0
20
40
60
80
100
Non-avid Avid
Percen
tag
e o
f fi
sh
ers
Avidity class
Publicholiday
Normalweekday
Normalweekend
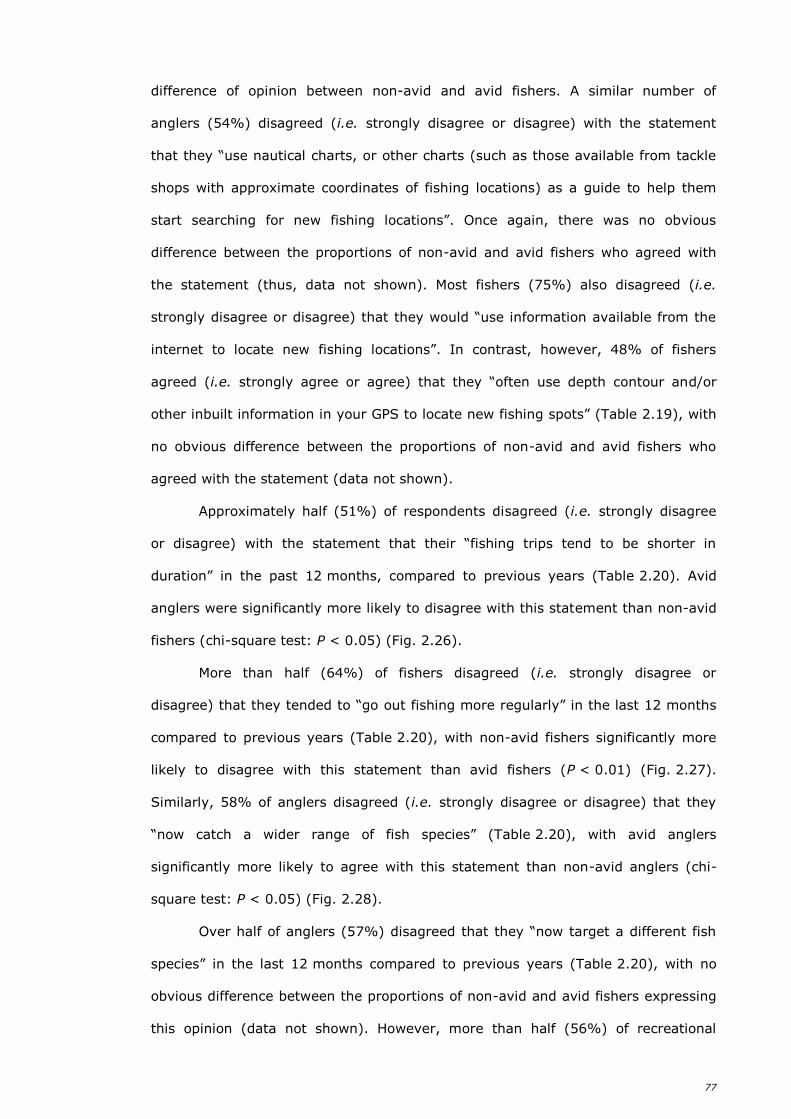
77
difference of opinion between non-avid and avid fishers. A similar number of
anglers (54%) disagreed (i.e. strongly disagree or disagree) with the statement
that they “use nautical charts, or other charts (such as those available from tackle
shops with approximate coordinates of fishing locations) as a guide to help them
start searching for new fishing locations”. Once again, there was no obvious
difference between the proportions of non-avid and avid fishers who agreed with
the statement (thus, data not shown). Most fishers (75%) also disagreed (i.e.
strongly disagree or disagree) that they would “use information available from the
internet to locate new fishing locations”. In contrast, however, 48% of fishers
agreed (i.e. strongly agree or agree) that they “often use depth contour and/or
other inbuilt information in your GPS to locate new fishing spots” (Table 2.19), with
no obvious difference between the proportions of non-avid and avid fishers who
agreed with the statement (data not shown).
Approximately half (51%) of respondents disagreed (i.e. strongly disagree
or disagree) with the statement that their “fishing trips tend to be shorter in
duration” in the past 12 months, compared to previous years (Table 2.20). Avid
anglers were significantly more likely to disagree with this statement than non-avid
fishers (chi-square test: P < 0.05) (Fig. 2.26).
More than half (64%) of fishers disagreed (i.e. strongly disagree or
disagree) that they tended to “go out fishing more regularly” in the last 12 months
compared to previous years (Table 2.20), with non-avid fishers significantly more
likely to disagree with this statement than avid fishers (P < 0.01) (Fig. 2.27).
Similarly, 58% of anglers disagreed (i.e. strongly disagree or disagree) that they
“now catch a wider range of fish species” (Table 2.20), with avid anglers
significantly more likely to agree with this statement than non-avid anglers (chi-
square test: P < 0.05) (Fig. 2.28).
Over half of anglers (57%) disagreed that they “now target a different fish
species” in the last 12 months compared to previous years (Table 2.20), with no
obvious difference between the proportions of non-avid and avid fishers expressing
this opinion (data not shown). However, more than half (56%) of recreational
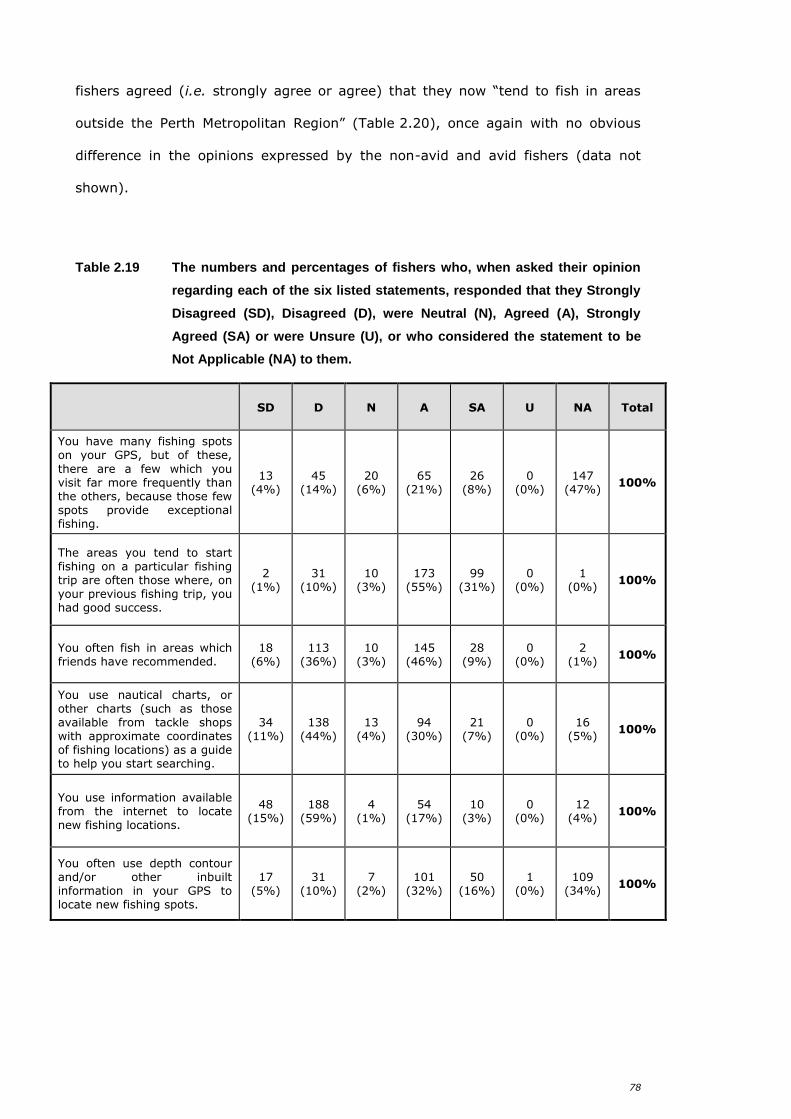
78
fishers agreed (i.e. strongly agree or agree) that they now “tend to fish in areas
outside the Perth Metropolitan Region” (Table 2.20), once again with no obvious
difference in the opinions expressed by the non-avid and avid fishers (data not
shown).
Table 2.19 The numbers and percentages of fishers who, when asked their opinion
regarding each of the six listed statements, responded that they Strongly
Disagreed (SD), Disagreed (D), were Neutral (N), Agreed (A), Strongly
Agreed (SA) or were Unsure (U), or who considered the statement to be
Not Applicable (NA) to them.
SD D N A SA U NA Total
You have many fishing spots on your GPS, but of these,
there are a few which you visit far more frequently than the others, because those few spots provide exceptional fishing.
13 (4%)
45 (14%)
20 (6%)
65 (21%)
26 (8%)
0 (0%)
147 (47%)
100%
The areas you tend to start fishing on a particular fishing trip are often those where, on your previous fishing trip, you had good success.
2 (1%)
31 (10%)
10 (3%)
173 (55%)
99 (31%)
0 (0%)
1 (0%)
100%
You often fish in areas which friends have recommended.
18 (6%)
113 (36%)
10 (3%)
145 (46%)
28 (9%)
0 (0%)
2 (1%)
100%
You use nautical charts, or other charts (such as those available from tackle shops with approximate coordinates of fishing locations) as a guide to help you start searching.
34 (11%)
138 (44%)
13 (4%)
94 (30%)
21 (7%)
0 (0%)
16 (5%)
100%
You use information available from the internet to locate new fishing locations.
48 (15%)
188 (59%)
4 (1%)
54 (17%)
10 (3%)
0 (0%)
12 (4%)
100%
You often use depth contour and/or other inbuilt information in your GPS to locate new fishing spots.
17 (5%)
31 (10%)
7 (2%)
101 (32%)
50 (16%)
1 (0%)
109 (34%)
100%
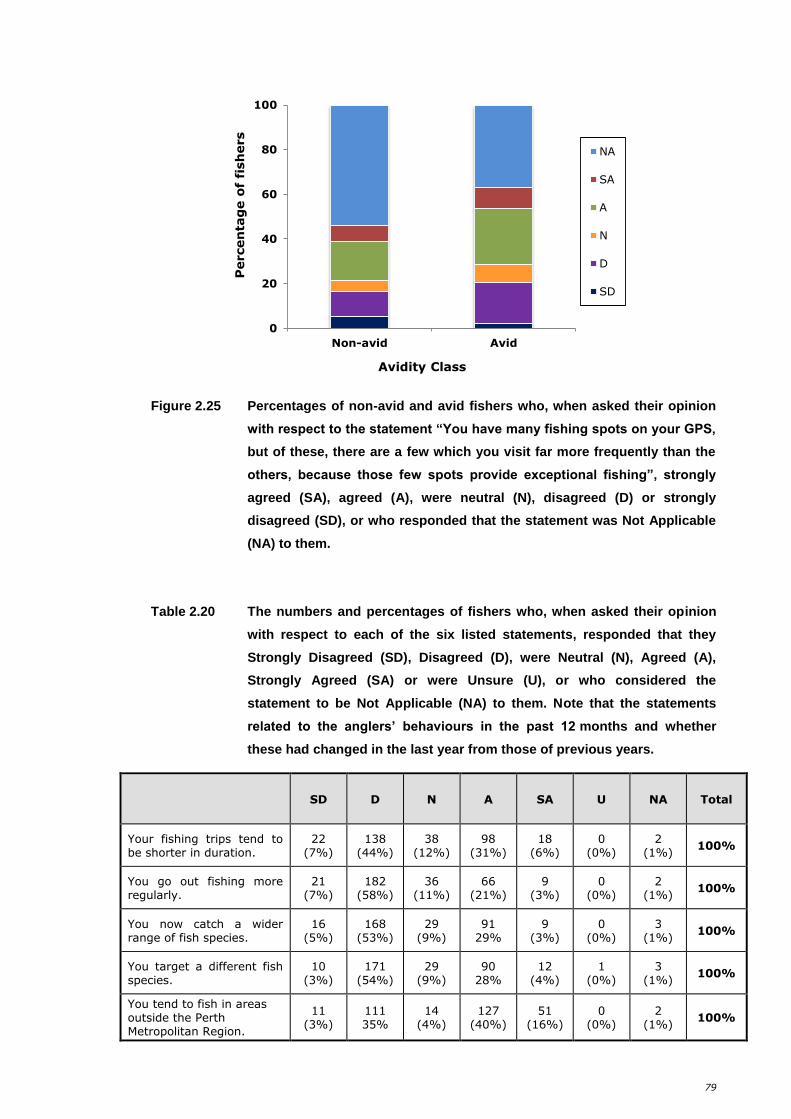
79
Figure 2.25 Percentages of non-avid and avid fishers who, when asked their opinion
with respect to the statement “You have many fishing spots on your GPS,
but of these, there are a few which you visit far more frequently than the
others, because those few spots provide exceptional fishing”, strongly
agreed (SA), agreed (A), were neutral (N), disagreed (D) or strongly
disagreed (SD), or who responded that the statement was Not Applicable
(NA) to them.
Table 2.20 The numbers and percentages of fishers who, when asked their opinion
with respect to each of the six listed statements, responded that they
Strongly Disagreed (SD), Disagreed (D), were Neutral (N), Agreed (A),
Strongly Agreed (SA) or were Unsure (U), or who considered the
statement to be Not Applicable (NA) to them. Note that the statements
related to the anglers’ behaviours in the past 12 months and whether
these had changed in the last year from those of previous years.
SD D N A SA U NA Total
Your fishing trips tend to be shorter in duration.
22 (7%)
138 (44%)
38 (12%)
98 (31%)
18 (6%)
0 (0%)
2 (1%)
100%
You go out fishing more regularly.
21 (7%)
182 (58%)
36 (11%)
66 (21%)
9 (3%)
0 (0%)
2 (1%)
100%
You now catch a wider range of fish species.
16 (5%)
168 (53%)
29 (9%)
91 29%
9 (3%)
0 (0%)
3 (1%)
100%
You target a different fish species.
10 (3%)
171 (54%)
29 (9%)
90 28%
12 (4%)
1 (0%)
3 (1%)
100%
You tend to fish in areas outside the Perth Metropolitan Region.
11 (3%)
111 35%
14 (4%)
127 (40%)
51 (16%)
0 (0%)
2 (1%)
100%
0
20
40
60
80
100
Non-avid Avid
Percen
tag
e o
f fi
sh
ers
Avidity Class
NA
SA
A
N
D
SD
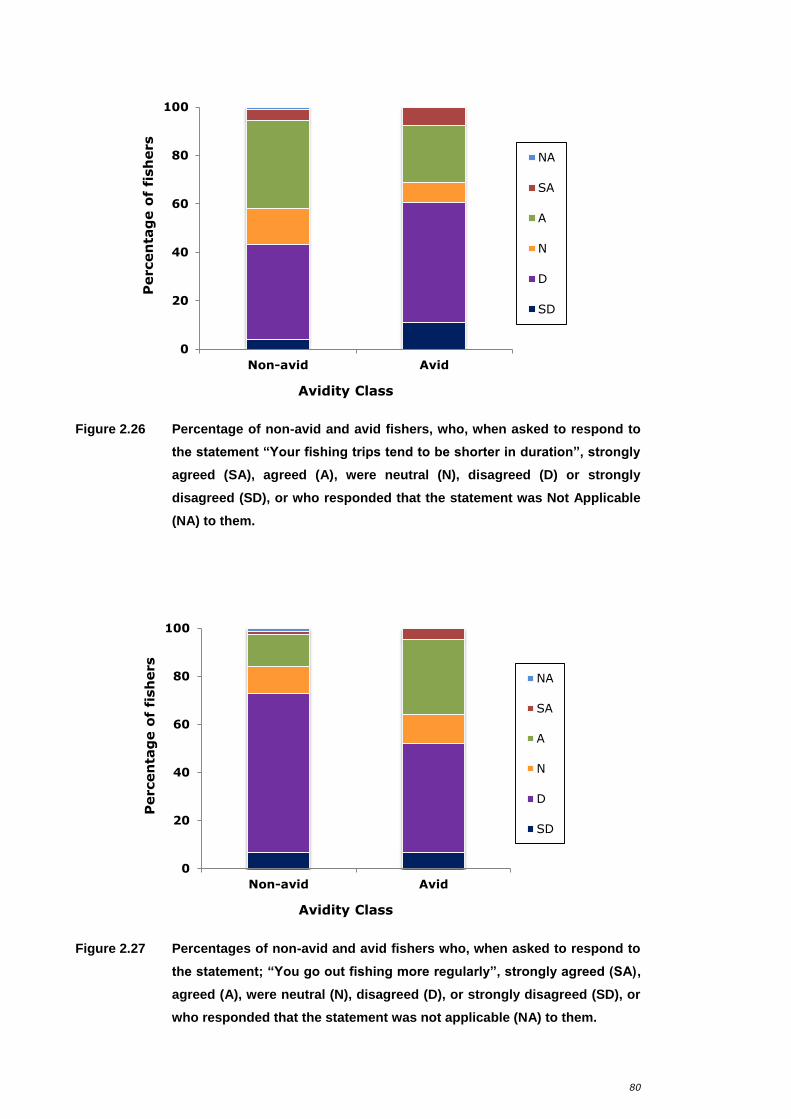
80
Figure 2.26 Percentage of non-avid and avid fishers, who, when asked to respond to
the statement “Your fishing trips tend to be shorter in duration”, strongly
agreed (SA), agreed (A), were neutral (N), disagreed (D) or strongly
disagreed (SD), or who responded that the statement was Not Applicable
(NA) to them.
Figure 2.27 Percentages of non-avid and avid fishers who, when asked to respond to
the statement; “You go out fishing more regularly”, strongly agreed (SA),
agreed (A), were neutral (N), disagreed (D), or strongly disagreed (SD), or
who responded that the statement was not applicable (NA) to them.
0
20
40
60
80
100
Non-avid Avid
Percen
tag
e o
f fi
sh
ers
Avidity Class
NA
SA
A
N
D
SD
0
20
40
60
80
100
Non-avid Avid
Percen
tag
e o
f fi
sh
ers
Avidity Class
NA
SA
A
N
D
SD
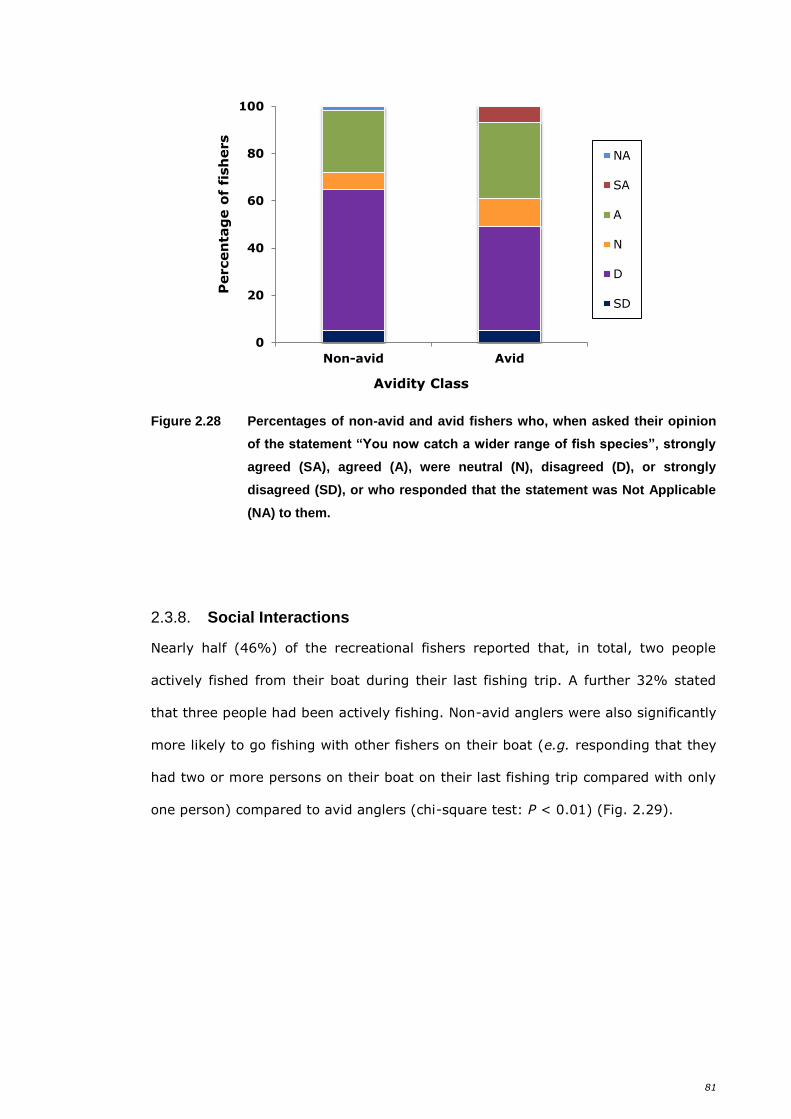
81
Figure 2.28 Percentages of non-avid and avid fishers who, when asked their opinion
of the statement “You now catch a wider range of fish species”, strongly
agreed (SA), agreed (A), were neutral (N), disagreed (D), or strongly
disagreed (SD), or who responded that the statement was Not Applicable
(NA) to them.
2.3.8. Social Interactions
Nearly half (46%) of the recreational fishers reported that, in total, two people
actively fished from their boat during their last fishing trip. A further 32% stated
that three people had been actively fishing. Non-avid anglers were also significantly
more likely to go fishing with other fishers on their boat (e.g. responding that they
had two or more persons on their boat on their last fishing trip compared with only
one person) compared to avid anglers (chi-square test: P < 0.01) (Fig. 2.29).
0
20
40
60
80
100
Non-avid Avid
Percen
tag
e o
f fi
sh
ers
Avidity Class
NA
SA
A
N
D
SD
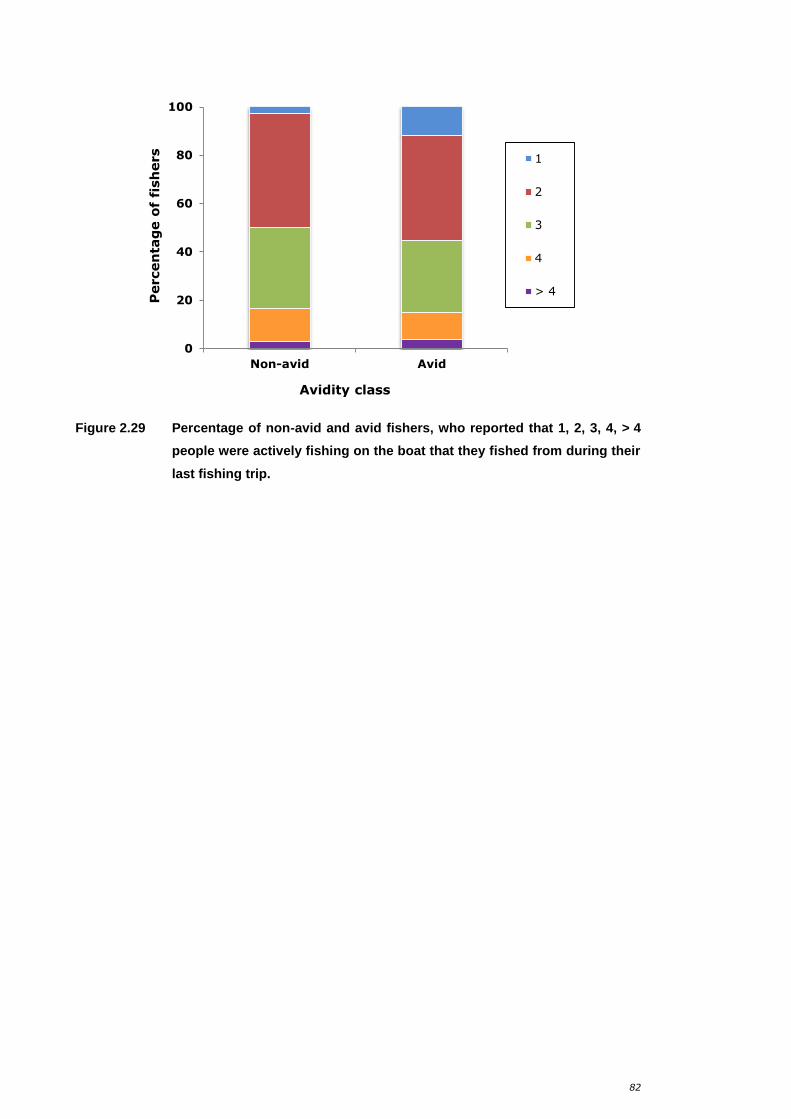
82
Figure 2.29 Percentage of non-avid and avid fishers, who reported that 1, 2, 3, 4, > 4
people were actively fishing on the boat that they fished from during their
last fishing trip.
0
20
40
60
80
100
Non-avid Avid
Percen
tag
e o
f fi
sh
ers
Avidity class
1
2
3
4
> 4
83
Discussion 2.4.
2.4.1. Response rate
As stated by Pollock et al. (1994), off-site methods, such as the CATI telephone
survey method used in this study, may suffer from several sources of non-sample
error, including non-response bias. In this study, however, the response rate
achieved was very high (~95%), and thereby, biases associated due to non-
responses would have been minimal. Similarly high response rates (of 92-97%)
were obtained, for example, by Ryan et al. (2013) in a survey of boat-based fishers
in south-western Australia and by Frijlink and Lyle (2010b) (85%) in a survey of
recreational fishing in Tasmania, Australia. Note, however, that several methods for
calculating the response rate are available to researchers (see: Cochran, 1977),
such that differences in the reported response rates can also be present between
studies based on the method employed by the researcher for calculating such
values.
Sample loss in this study was potentially higher than average as participants
considered to be in-scope were required to have undertaken boat-based fishing
activities in marine waters within the previous twelve months. It is also recognised
that a greater proportion of avid than non-avid fishers may have been self-selected
due to the inclusion of initial screening questions relating to their fishing activities
(e.g. respondents purposely answered so as to be left out of scope of the survey,
“soft refusal”). Thus, it is important to note that, while representative of
interviewed RFBL holders, the high proportion of ‘avid’ anglers present in the
resultant surveyed population may not necessarily be a true overall representation
of all boat fishers within the Perth Metropolitan Region.
The slightly younger age composition seen in the fishers from the Perth
Metropolitan and Peel Regions within the RFBL database compared to the surveyed
recreational fishers in this study raises questions in regards to the possibility for
potential biases created in the survey methods when contacting fishers, i.e. young
people lost during the initial screening of the sample, and who were deemed “out of
84
scope”. For example, it is possible that a greater proportion of younger people are
more difficult to contact during the working day. In future studies it would be worth
comparing the age composition of the original random sample of 600 fishers drawn
from the RFBL database to that of the fully responding fishers to see if biases do
result from the screening of anglers, etc. Note, however, that there were twenty-
seven instances when, based on the birthdate in the RFBL records, fishers were
found to have ages in excess of 100 years. While the dates of birth for records with
such extreme values of age can be classified as erroneous, it is not possible to
determine the validity of ages that appear feasible. Thus, it is important to note
that these fisher’s ages in the RFBL database can only be broadly classified as
representative of the fishers from the Perth Metropolitan Region and Peel Region,
recognising that the dates of birth entered into the database were not subjected to
rigorous validation at the time of data entry. Any fisher over the age of ≥ 100 y
was excluded from the analyses.
The geographic distribution of fishers was comparable in the RFBL database
to that of the phone survey participants, with larger proportions of recreational
fishers reporting to reside in the South Metropolitan, Peel and North West
Metropolitan Regions (more ‘coastal’ regions) of the Perth Metropolitan Region.
2.4.2. Primary motivations for fishing
Similar to the motivations of recreational shore-based and boat-based fishers
reported in an Australian nationwide recreational fishing survey (Henry and Lyle,
2003), the results of the phone survey undertaken in this study revealed that
fishers in the Perth Metropolitan and Peel Regions mainly go fishing for recreational
purposes and for the enjoyment and sport of catching fish. Furthermore, the
findings from this study that female anglers are more motivated to go fishing to
spend time with family and male anglers attribute a greater importance to catching
fresh fish for food is also consistent with those of Frijlink and Lyle (2010b), who
found that males were also more likely to be motivated by the sporting dimensions
of fishing, being outdoors and spending time with friends.
85
Previous studies have reported that only the more avid and highly
specialised fishers are more likely to be affiliated with angling clubs and/or take
part in fishing competitions (Bryan, 1977; Falk et al., 1989; Wilde et al., 1998;
Anderson and Ditton, 2004; Margenau and Petchenik, 2004; Oh et al., 2007). Thus,
the finding in this study that only a small percentage of non-avid fishers (3%)
considered competing in fishing tournaments to be an important motive for fishing
was to be expected. The finding that only 8% of avid fishers considered competing
in fishing tournaments to be an important motive for fishing ran counter to the
hypothesis that had been proposed in the introduction to this Chapter, however,
indicating that, for this fishery, motivations other than competition were more
important in determining frequency of fishing. Note, that no further comparisons or
conclusions regarding fisher involvement, behaviours, characteristics etc. in either
of these activities (i.e. being a member of an angling or taking part in fishing
competitions) can be made due to the design of the questions. However, it
recognised that question relating to e.g. club membership would be valuable for
inclusion in future surveys to further help characterise recreational fishers and
identify specialised angler groups
The finding that fishers reported having several anglers (2-3 people) aboard
their vessel actively fishing on their last fishing trip was not unexpected as many of
the fishers interviewed stated that spending time with friends and family on fishing
trips was important, with very few fishers identifying the need for solitude or to get
away from people as an important motive for fishing. Furthermore, past
recreational fishing surveys have reported similar numbers (e.g. mean of 2.4
persons fishing per boat in the WCB (Sumner and Williamson, 1999), an average of
2 persons per boat in Western Australia (Raguragavan et al., 2010), and a mean of
2.34 anglers per party whilst recreational fishing in the Blackwood Estuary, W.A.
(Prior and Beckley, 2007)). Knowledge on the number of persons fishing on a single
boat on a fishing trip is important, as it not only gives insight into the social
interactions of anglers but also helps researchers quantify effort (McCluskey and
86
Lewison, 2008) and the effectiveness of certain regulations, such as bag and boat
limits (Fisher et al., 2011).
2.4.3. Characteristics of an avid fisher
General demographic information
The predominance of males is not an uncommon finding of angler surveys (Wilde et
al., 1998; Henry and Lyle, 2003; Anderson and Ditton, 2004). However, the modal
age of non-avid and avid fishers in this survey was slightly greater than those found
in other angler surveys in Australia (Henry and Lyle, 2003; Prior and Beckley,
2007; Tracey et al., 2011). This in part, may potentially be due to some younger
anglers being deemed “out of scope”, and therefore lost during the initial screening
of the original random sample of 600 fishers drawn from the RFBL database (see
above). Although in another study, Arlinghaus and Mehner (2003) described
specialised carp anglers, i.e. more avid fishers, as younger than the general fishing
population, in the current survey, more avid anglers were found likely to be older
(i.e. 45 y or more). The iconic West Australian dhufish and pink snapper are highly
prized for consumption. However, anglers who target these species also require
more skill and knowledge, with access to larger boats and specialised gear types.
Accordingly, these species are particularly likely to be targeted by fishers who have
been involved in fishing for many years and have acquired the requisite skill,
knowledge and gear. Further, this could also possibly be in part due to the large
number of fishers interviewed residing in the South Metropolitan and Peel Regions
(see below), areas which are known to be favoured locations for ‘retirees’ in the
Perth Metropolitan Region. Census data for these regions, i.e. City of Mandurah
located in the Peel Region and South Fremantle located in the South Metropolitan
Region, have median ages of 42 y and 44 y, respectively, compared to a median
age of 36 y in Perth, Central Metropolitan region (Australian Bureau of Statistics,
2013).
The largest numbers of survey respondents resided within the South and
North Metropolitan and the Peel Regions, which are considered to contain coastal
87
population “hot spots” (e.g. popular areas to reside and also contain high density
populations), i.e. the cities of Fremantle, Rockingham, Hillarys, and Mandurah,
respectively. Notably, these regions are in close proximity to a number of popular
beaches, boat ramps and pens. As noted by Pradervand and Baird, (2002), the
proximity to large urban areas undoubtedly plays a major role in the popularity of
an angling venue, and estuaries (e.g. the Peel-Harvey and Swan estuaries in south-
western Australia) that are situated closer to such areas generally experience
higher levels of angling effort.
Fishing days
As hypothesised, the survey results demonstrated that the more avid anglers tend
to go fishing more often on normal weekdays. It is also possible that the more avid
fishers tend to avoid fishing on weekends and public holidays when boat ramps are
likely to be busy and more congested, e.g. due to their ‘perceptions of recreational
crowding’ (Vaske et al., 1978; Salz and Loomis, 2005; Tseng et al., 2009; Hunt et
al., 2011). These results differ slightly to those of past angling surveys in which
angling effort for fishers in general has been found to be greater during the
weekend period and also holiday seasons, e.g. Brouwer et al. (1997) and
Pradervand and Baird (2002).
It is also possible that these results reflect ‘work-related’ factors, such as
fishers participating in ‘fly-in fly-out’ work in mining activity in the north of Western
Australia and thus having the ability to go fishing during the week on their ‘time-
off’. Results of a 12-month creel survey undertaken in the West Coast Bioregion,
including the Metropolitan Area, of Western Australia in 2005/06 showed changes in
the level and distribution of recreational fishing effort when compared to the results
of earlier recreational creel surveys conducted in 1996/97 and 2002/03
(Department of Fisheries, 2013). Fishers were travelling greater distances to catch
fish and tended to go fishing further offshore and over a far wider area than in the
earlier periods, a finding possibly relating to the growth in ownership of larger and
faster boats (Department of Fisheries, 2013).
88
Over much of the last two decades, Western Australia has experienced an
economic boom associated largely with an increase in mining activity. This has also
resulted, for example, in a rapid increase in a ‘fly-in fly-out’ (FIFO) labour force, i.e.
workers that commute from major metropolitan centres to relatively remote mining
locations for periods of work, where food and lodging accommodation is provided
for them, but not for their families. Schedules are thus established whereby
employees spend a fixed number of days working at the site, followed by a fixed
number of days at home (Storey, 2001; Joyce et al., 2013). These workers, who
can earn very good incomes (Richardson and Denniss, 2011; Brueckner et
al., 2013), are typically male and aged between 25-44 years (Joyce et al., 2013).
These workers, who have extended periods of time available for recreation, often
engage in fishing and it may thus be expected that the patterns evident in the data
from the two surveys in the early to mid-2000s have continued, with many younger
males now going fishing as well as investing substantially in fishing gear and
technology (large boats) (Joyce et al., 2013). For future surveys in this state, it
would therefore be beneficial to ask questions relating to fishers’ current area of
employment to understand the extent to which fishing patterns are being altered by
changes in employment dynamics. Note also that the low numbers of fishers
reporting that their last boat-based fishing trip occurred on a public holiday, for
example, would have been influenced by the timing of this survey.
Catch preference
The survey results indicated that the majority of surveyed recreational boat fishers
(avid and non-avid) were ‘generalist’ fishers, as they had stated either that they
targeted a ‘mix’ of species or that they had no particular target on their last boat
fishing trip. However, consistent with the findings of Henry and Lyle (2003), many
anglers reported specifically targeting easy-to-catch, inshore ‘bread and butter’
species (i.e. whiting, herring, crabs and squid). It is possible that the low numbers
of fishers reporting that they specifically targeted the iconic West Australian dhufish
or pink snapper, with many also stating that they targeted a ‘mix’ of reef fish
89
species including the West Australian dhufish or pink snapper, reflects current bag
restrictions for these iconic species. That is, in the West Coast Bioregion of Western
Australia, there is a total mixed daily bag limit of only two demersal finfish
(Department of Fisheries, 2013), and thus more avid anglers may elect to target a
range of fish species to get the most out of their fishing journeys.
Species caught
The survey reported many fishers catching whiting (with tailor and herring also
being popular), which parallels the results of Henry and Lyle (2003) and Sumner
and Williamson (1999). Likewise, in the most recent State of Fisheries report
produced by the Western Australian Department of Fisheries, the top three most
commonly-targeted recreational finfish species were Australian herring (Arripis
georgianus), tailor (Pomatomus saltatrix) and southern school whiting (Sillago
bassensis) (Fletcher and Santoro, 2013). Sumner et al. (2008) comment further,
describing the recreational boat-based fishery within the West Coast Bioregion as
primarily a fishery for smaller, predominantly inshore, scalefish species such as
whiting species, Australian herring and skipjack trevally.
As also shown in this study, blue swimmer crabs, another relatively abundant
and easy-to-catch species, were also a very popular species caught by less avid
fishers. The importance of recreational “crabbing” in estuaries and waterways in the
Peel Region has also been documented in past recreational fisher surveys, with
recreational catches often exceeding the commercial catch in both the Leschenault
and Peel-Harvey Estuary (Malseed, 2000; Malseed and Sumner, 2001). Thus, due
to the large number of fishers residing in the South Metropolitan and Peel Regions,
this preference for targeting crabs is to be expected. In contrast, the survey
showed that more avid fishers retained higher percentages of finfish, including
bream, tuna/bonitos and sea perch/snappers, indicating a higher level of
specialisation among these fishers, as these species are considered to be harder–
to-catch, sport fish and some of which are located in deeper waters requiring
accessibility to a boat and potentially more specialist gears. Understanding the
90
catch preferences among recreational fishers is important and can ultimately assist
managers in understanding the diversity and consumptive preferences of anglers
within a fishery (Fisher, 1997). Furthermore, these results highlight the potential
for future studies to group the angler population within the WCB by catch
preference (i.e. crab fishers) and explore the defining characteristics of each
segment.
Species released
The survey reported anglers releasing relatively large numbers of larger, more
offshore finfish species, i.e. species such as emperors (Lethrinus spp.), pink
snapper, wrasse/tuskfish/gropers (Labridae), rock-cod/gropers (Epinephelidae) and
trevally (Carangidae). Such results could be reflective of differences in current
management regulations, i.e. no current minimum size limits for some smaller
‘inshore’ species (e.g. Australian herring, Arripis georgianus or Whiting (excluding
King George) Sillaginidae), compared to restrictive size limits for larger ‘off-shore’
reef species (e.g. G. hebraicum or Western blue groper, Achoerodus gouldii).
Differences in management regulations such as these, however, recognise that the
risk to sustainability posed by fishing is influenced by the different life histories and
biological characteristics of the different species, where, for example, these
biological characteristics make ‘bread and butter’ species less vulnerable to fishing
than is the case for larger offshore reef species. For example, when such species as
A. georgianus become large enough to be caught by the fishing gear, they are
typically already mature and capable of breeding (Ayvazian et al., 2000; Fairclough
et al., 2000a; 2000b).
Even though the exact numbers of fish that were released is unknown,
consideration also needs to be given to the fact that the angling harvest includes a
very broad range of different species, with large numbers of these species being
released. For example, it has been estimated that, in Australia, angling discard
rates are usually 30-40% of the total catch (McGlennon and Lyle, 1999; McPhee et
al., 2002). It is also important to recognise that discard rates and subsequently
91
post-release mortality rates are an important issue for some species, particularly
demersal reef fish species, but far less so for pelagic/semi-pelagic species.
Gitschlag and Renaud (1994) (see also Diggles and Ernst, 1997) described an
inverse relationship between fish survival and depth of capture, as the effect of
decompression (i.e. barotrauma) is considered to be a critical factor influencing
hooking mortality of reef fish (Diggles and Ernst, 1997; St John and Syers, 2005).
For example, G. hebraicum are highly susceptible to post-release mortality effects,
with many G. hebraicum caught from depths > 20 m (St John and Syers, 2005).
Gear and methods
The survey revealed that a large proportion of anglers own their own boat, which is
not a surprising result as anglers were randomly selected from the RFBL database,
with just over half also stating that they owned a global positioning system (GPS).
In the Australian nationwide recreational fishing survey (Henry and Lyle, 2003), the
largest number of boat owning households was recorded for New South Wales,
however, only 52% of these vessels were reportedly used for fishing, compared to
63% in Western Australia. Henry and Lyle (2003) also noted that boat ownership
was higher among households containing recreational fishers, and also the
prevalence of electronic aids (i.e. echo sounders and GPS) increased with vessel
size. Furthermore, as noted above, a growth in ownership of larger and faster boats
in Western Australia’s recreational fishery has also been found in recent years
(Department of Fisheries, 2013). As almost half of recreational fishers in the phone
survey also agreed that they often use depth contour and/or other inbuilt
information in their GPS to locate new fishing spots, this suggests that technology
is an important factor influencing the efficiency of the ‘average’ angler. It has been
recognised that the modern angler has access and the ability to use a large array of
technological improvements, i.e. high quality echo sounders, global positioning
systems (GPS), new types of low diameter high strength fishing lines and
chemically sharpened hooks to name a few, to better locate fish and ideal fishing
locations, and then increase their success in catching fish once hooked (Cowx,
92
2001; Sumner et al., 2002; Williamson et al., 2006). There is also greater
information available to anglers through the media and the internet regarding
prime fishing locations and ‘hot spots’ (McPhee et al., 2002).
The study revealed the more avid a fisher was the more likely they would
store, and store a greater number of fishing locations in their GPS, a finding
consistent with the hypothesis that avid fishers were likely to use specialised fishing
gears and technologies. This result highlights the potential for ‘the number of
fishing locations a fisher has stored’ as another possible measure of avidity, and
could thus be useful for inclusion in future angler surveys.
Note, however, that due to the wording of Q.11 and the structure in the
survey, it not clearly established whether the last fishing trip was on the
respondent’s boat and hence whether the number of fishing locations they have
stored in their GPS device has any relevance to answers relating to this last fishing
trip.
Movements
The use of ‘bite rate’ in the survey represented a novel approach to discerning
angler movements. It was hypothesised that an avid fisher would be more likely
than a less avid fisher to move more frequently between fishing locations in search
of fish when catch rates are low, such as to maintain high catches and fishing
success on fishing trips. While this hypothesis was not supported by the data, avid
anglers were more likely than non-avid fishers to move from a location when bite-
rates (as opposed to catch rates) were low at their best/favourite fishing location.
Although not supported by the bite rate data, it is possible that, based on their
greater experience, patience, and persistence, and perhaps in the hope of catching
larger fish, avid anglers may also not be inclined to move as often, but this would
also be likely to be dependent on the target species. Indeed, although again not
supported by the bite rate data, it is also possible that less avid fishers may move
around more frequently and even “aimlessly” trying to catch something/anything.
Many anglers indicated the main reason for moving between fishing locations was
93
not due to catching any fish (see below), though it is noted that other variables,
e.g. changes in weather, catching ‘undesirable’ fish species, wanting to target a
different fish species, wanting to change gear types etc., can also influence a
fishers’ decision to move (Sampson, 1991; 1994; Wilen et al., 2002). Future
surveys may also benefit from a consideration and inclusion of lower wind
categories (i.e. 6-10 knots) to examine the behaviour and movements of anglers at
even low winds.
Given that the average reported trip duration was ~ 3.5 h, fishers typically
only moved a small number of times during a trip. A similar result was found across
all States and Territories in Australia, with anglers reporting a duration of fishing
trips on average around 3.5 h (Henry and Lyle, 2003). As the results indicated that
half of fishers only travel a small distance (< 5 km) from the boat ramp/pen to
their first fishing location, from a management perspective, this highlights the need
for adequate numbers of access points and the potential for localised areas of
heavy fishing pressure in areas adjacent to boat ramps and launching pens (Stuart-
Smith et al., 2008).
As noted by Abernethy et al. (2007), due to fishers’ not being able to ‘see’
their prey, their movements and foraging decisions are largely based on the
knowledge of prey distribution derived from catches and previous experiences. The
fact that fishers reported moving only very small distances between their first
successive fishing location is consistent with the view that many anglers head
directly to a known fishing location where they have had previous success (noting
that a number of alternative explanations for this finding exist). In terms of
management, such a localised concentration of fishing effort in inshore areas in the
West Coast Bioregion of south-western Australia highlights the large potential for
localised depletion in such areas, as is consistent with information presented in
previous stock assessments (e.g. Wise et al., 2007).
According to specialisation theory, anglers who are least specialised are
more likely to consider that the most important aspect of fishing is to ‘catch fish’,
whereas more specialised anglers tend to view non-catch related objectives as
94
equally important (Ditton et al., 1992). This view is, in part, supported by the
results of the survey, with more avid fishers being more likely to stay out on the
water longer.
The survey showed that anglers are also more likely to fish in areas which
their friends have recommended or use depth contour and/or other inbuilt
information in their GPS, than to use nautical charts or the internet to locate new
fishing locations. This finding is consistent with specialisation theory which suggests
that the more avid the fisher is the greater the investment in the activity there is
likely to be, such that avid and more specialised anglers are likely to seek out
information about the activity from a variety of media sources such as magazines,
internet sites, and television (Salz and Loomis, 2005).
Prior to the survey (2 March 2010), a number of general fishery regulations
in Western Australia and in the West Coast Bioregion came into effect, including the
introduction of a State-wide Recreational Fishing from Boat License (RFBL), which
was used as the sampling frame for this survey, in combination with a two-month
demersal scalefish closure 15 October to 15 December (inclusive), a daily bag limit
of two high risk demersal scalefish and two pelagic fish, i.e. West Australian
dhufish, pink snapper, and a boat limit of two West Australian dhufish (Department
of Fisheries, 2012). Although fisher’s responses to management changes were not
directly addressed in the survey, it is recognised that angling habits over time will
be influenced by management regulations and many other factors (e.g. fish
abundance). No difference in habits or behaviours was reported by participants,
except that more than half of fishers agreed with the statement that they now
“tend to fish in areas outside the Perth Metropolitan Region”. Caution is also
recommended for any future surveys that employ such a question, as the preamble
may confuse survey participants and the question itself may be viewed as a
‘double-barrel question’, i.e. whether fishing behaviour has changed in (within) the
last 12 months and whether this behaviour has changed compared to previous
years.
95
3. The characteristics, including fish-targeting
behaviours, of a group of specialised boat anglers
Introduction 3.1.
Typically, the most avid and specialised fishers achieve greatest catch success and
are more likely to have the greatest impact on fish stocks (Hilborn, 1985; Baccante,
1995; Dorow et al., 2010; Johnston et al., 2010). It is generally these more avid
fishers who have the greatest angling experience and skill and who make the
greatest investment in fishing equipment and activity (Chipman and Helfrich, 1988;
Ditton et al., 1992; Dorow et al., 2010). Moreover, as noted in Chapter 2, as such
specialised anglers have large social and financial investments in fishing, they are
also more likely than other fishers to voice the strongest opinions in response to
management actions (Wilde et al., 1998; Arlinghaus and Mehner, 2003; Margenau
and Petchenik, 2004; Salz and Loomis, 2005). Therefore, it is particularly important
for fishery managers to understand the objectives and motivations of specialised
anglers such that they can better understand the characteristics of those anglers
and can thus employ management strategies that are best suited to the needs of
the fishery.
Studies have shown that specialised anglers are more committed and avid
(Bryan, 1977; Falk et al., 1989; Beardmore et al., 2011), typically younger (Wilde
et al., 1998; Arlinghaus and Mehner, 2003), devote more time each year to fishing
(Graefe, 1980; Ditton et al., 1992; Salz et al., 2001), travel greater distances to
fishing locations (Beardmore et al., 2013; Ward et al., 2013), have the greatest
fishing experience and skill and make the greatest investment in fishing equipment
and activity (Ditton and Holland, 1984; Chipman and Helfrich, 1988; Ditton et al.,
1992; Dorow et al., 2010). They are likely to be supportive of more restrictive
fishing regulations (Salz et al., 2001; Arlinghaus, 2007), and to have a greater
catch success than less specialised fishers (Hilborn, 1985; Baccante, 1995; Dorow
96
et al., 2010; Johnston et al., 2010). In the context of recreational fisheries
elsewhere, it is thus expected that the specialised boat-based anglers, who exploit
the demersal fish stocks of the lower west coast of Australia, are likely to have
similar characteristics to those found in these earlier studies, i.e. they will exhibit
higher fishing frequency, invest more heavily in gear and technology, and fish
further offshore than other, less specialised and avid anglers.
Studies in Europe and North America have found that specialised fishers are
more likely to belong to angling clubs than those who are less specialised (Gigliotti
and Peyton, 1993; Fisher, 1997; Arlinghaus and Mehner, 2003). This is reflected in
the fact that, as clubs are likely to attract a greater proportion of specialised
anglers, members of fishing clubs are likely, on average, to be more motivated and
to fish more frequently, undertake longer fishing trips, have more experience and
greater skill, use more specialised fishing techniques to catch target species and
participate in angling competitions than those fishers who are not members of such
clubs (Graefe, 1980; Ditton and Holland, 1984; Gigliotti and Peyton, 1993; Gartside
et al., 1999).
The recreational fishery in the West Coast Bioregion (WCB) of Western
Australia (see Chapter 1, Fig. 1.0) is dependent on a resource that includes a large
number of demersal fish species, including two iconic species, West Australian
dhufish (Glaucosoma hebraicum) and pink snapper (Chrysophrys auratus), which
are fished over reef habitat by boat-based anglers, and whose abundances, in
recent decades, have become depleted (Wise et al., 2007; Lenanton et al., 2009;
Fairclough et al., 2014). It has also been noted that the spatial distribution of
recreational boat-based fishing effort for these species in the WCB has expanded
considerably in recent years (Wise et al., 2007), i.e. those fishers who target
individuals of these two species now have to travel greater distances and often fish
in locations further offshore to increase their chance of catching individuals of these
highly targeted species (Hesp et al., 2002).
The characteristics that distinguish specialised anglers in any fishery are
likely to reflect the distribution and behavioural characteristics of individuals of the
97
species and the abundances of the stocks that those fishers target, e.g. a trout
fisherman will have a different set of motivations, characteristics and targeting
practices compared with those of an angler fishing for an offshore reef species such
as West Australian dhufish (Bryan, 1977; Fisher, 1997; Arlinghaus, 2006).
Similarly, the characteristics of more specialised anglers (e.g. members of
recreational fishing clubs) would be expected to differ from those of less specialised
anglers in the same fishery, i.e. in terms of the fishing gear, methods of fishing
employed and catch related outcomes etc. (Bryan, 1977; Ditton and Holland, 1984;
Wilde et al., 1998; Dorow et al., 2010; Beardmore et al., 2011). It is also likely,
however, that some characteristics of specialisation in the Western Australian
demersal recreational fishery would be similar to those found elsewhere, e.g.
distance travelled offshore is likely to be related to the distribution of the target
species, weather, size of boat and fishing trip duration.
As noted in the introductory chapter of this thesis, specialised boat-based
anglers (SBAs) are the key agents considered in the agent-based model (ABM) that
was developed for this study, and which is described in the following chapter
(Chapter 4). For this ABM to provide a reliable representation of the behaviours and
decisions made by such anglers, data on the behaviours of a sample of highly-
skilled, boat-based recreational fishers who specifically target demersal finfish
species, i.e. West Australian dhufish and pink snapper, were required. Accordingly,
a survey directed specifically at members of angling clubs in Western Australia was
undertaken to determine the demographic characteristics of those club members
and to characterise aspects of their fishing activities, behaviours, movements, skill
and knowledge, thereby providing data that could be used as input to the agent-
based model (described in Chapter 4). By comparing the data from this angling club
survey with results from the phone survey, data for which had been collected from
randomly-selected boat-based recreational fishers (Chapter 2), the validity of the
hypothesis that angling club members in the West Coast Bioregion of W.A. possess
characteristics typically associated with more specialised fishers was investigated.
In particular, it was hypothesised that, compared with the general boat-based
98
fishers who were the subject of the survey described in Chapter 2, club members
fish more frequently, travel greater distances to fishing locations and fish in deeper
waters, move from a location more rapidly from a fishing location when not
receiving ‘good’ fish bites, are more likely to target and catch West Australian
dhufish and pink snapper, have greater investment in gear and technology, and
make greater use of that technology.
It should be noted that the survey described in this Chapter was undertaken
primarily to provide the necessary data for an agent-based model (described in the
next chapter, Chapter 4). It was subsequently recognised, however, that the
characteristics of these specialised boat-based anglers needed to be considered
within the context of the characteristics and behaviours of typical boat-based
recreational fishers. Accordingly, building on experience gained from the survey of
recreational fishers from angling clubs in the West Coast Bioregion of W.A.
described in this Chapter, funding was obtained from Murdoch University to
undertake the phone survey described in Chapter 2. Thus, the order in which the
surveys are presented in this thesis is not the order in which the two components of
the study were undertaken.
99
Methods 3.2.
3.2.1. Sampling Design
During September 2009 and December 2010, three angling clubs in the Perth
Metropolitan Region, namely the (1) Marmion Angling and Aquatic Club, (2) Quinns
Rock Angling Club, and (3) Ocean Reef Angling Club, were visited to recruit
recreational fishers to participate in a one-off self-administered questionnaire. The
angling clubs chosen were three of the most active clubs in the Perth Metropolitan
Region. Furthermore, these clubs all had members interested in targeting and
catching marine, demersal fish species and, in particular, the iconic West Australian
dhufish and pink snapper.
Fishers were invited to attend a presentation evening, which was organised
and promoted within their club and via their club’s committee. Those fishers who
attended the meeting were given an oral presentation by Dr Alex Hesp (Murdoch
University) on the purpose of the study and fisheries modelling concepts, including
the agent-based model discussed in the next chapter (Chapter 4) of this thesis. The
presentation included a preliminary conceptual diagram detailing the underlying
processes assumed in the model and the ways in which the behaviours of individual
fishers are likely to be reflected by certain types of decisions made during fishing
trips. All participants were informed by the researchers about the aims and
procedures of the study and reminded of its voluntary nature. On completion of the
presentation, fishers were invited to sign a consent form and to complete the
questionnaire (Appendices J and K, respectively). As the majority of anglers
attending these meetings (who still actively fish) completed a questionnaire, the
response rate was high.
Several other angling clubs in south-western Australia were also contacted
in the early stages of the study to ask their members if they would be willing to
participate in the survey. Although these clubs were neither visited nor received a
presentation night, six fishers from the Bunbury Angling Club and the Naturaliste
Game and Sport Fishing Club chose to participate by mail. These fisher responses
100
have been included in the final collation of the survey results. In total, 33 anglers
chose to participate. The average time for completion of the questionnaire was
approximately 15 min.
Note that, as details of fishing club membership are not available in the
records stored within the Recreational Fishing from Boat Licence (RFBL) database,
the selection of a representative sample of such fishing club members from this
database would have required a large sample size and considerable filtering using a
screening survey designed to filter non-club members. Resources for such a survey
were not available for the current study and thus, although sampling was not
probability based, the approach employed, i.e. directly approaching recreational
fishing club members, was considered an appropriate compromise to obtain data
from this specific group of fishers.
The study was approved by the Human Ethics committee of Murdoch
University, W.A. and was carried out in accordance with the conditions of project
number 2009/114 (see also Appendix J for Participant Consent form).
3.2.2. Measures
The questions included in the written questionnaire used for this study were similar
to those included in the phone survey described in the previous chapter
(Chapter 2). Comparisons between the two surveys were restricted to responses
from either identical questions or very similar questions that were considered highly
likely to have produced comparable data. As with the phone survey, all anglers
participating in the survey of club members were aged 18 years of age or older
and, to provide a measure of their avidity ("keen interest or enthusiasm"),
participants were asked the number of separate days they had participated in
recreational fishing from a boat in the past 12 months. It is considered that the
higher the frequency of days fished (effort), the more avid the fisher (Graefe,
1980; Chipman and Helfrich, 1988; Ditton et al., 1992; Fisher, 1997). The
questionnaire, which is presented in Appendix K, requested information on fisher
demographics, participation rates, species preferences, methods of targeting fish,
101
and movement patterns during the last boat-based fishing trip (prior to completing
the survey).
3.2.3. Data analysis
All responses collected from participants in this one-off, self-administered
questionnaire were kept in hard copy data format, and then entered into EXCEL
prior to analysis. Calculations and statistical analyses of these data were performed
using IBM SPSS Statistics version 20.0 software (IBM Corporation, 2011), EXCEL
(www.microsoft.com, verified September 2010) and the R software package (R
Development Core Team, 2013).
Similarly to Chapter 2, postcode data were used to classify the residential
addresses of participating anglers among six separate sub-regions of the Perth
Metropolitan Region, i.e. the Central Metropolitan, East Metropolitan, North West
Metropolitan, South East Metropolitan, South Metropolitan, the West Metropolitan,
or the Peel Region. Note, that the six anglers from the Bunbury Angling Club and
the Naturaliste Game and Sport Fishing Club included in the survey also resided in
the South West Region of Western Australia (a region ~200 km south of the City of
Perth).
Fishers were classified as ‘avid’ if they reported that they had fished for 15
or more days in the previous 12-month period. The assumption in this study that
avidity is related to the frequency of fishing has been employed in other Australian
recreational fishing studies and by the Western Australian Department of Fisheries
(e.g. Ryan et al., 2009; Frijlink and Lyle, 2010a; 2010b; Ryan et al., 2013).
Further, for logistic regression analyses (see below) anglers were also classified into
two groups based on whether or not they were known to be members from angling
clubs, i.e. recreational fishers from the phone survey Chapter 2 were classified as
non-members, whilst participants in the angler survey in Chapter 3 were classified
as club members. Note that some fishers participating in the phone survey in
Chapter 2 may have held club memberships to fishing clubs within the Region,
102
however, these data were not available as no question relating to club membership
was included in that survey.
Where appropriate, two-by-two contingency tables were constructed to (1)
compare results between the more vs less avid fishers in this survey, and (2)
compare results between those for the fishers in this survey and those for the avid
fishers from the phone survey (reported in Chapter 2). The chi-square test was
employed, with differences being considered statistically significant if the probability
of the observed data, given the null hypothesis that no difference exists, was
calculated to be less than 0.05.
Logistic regression analyses of the data from the club members survey and
the full set of data from the phone survey, i.e. both non-avid and avid fishers, were
also undertaken using R (R Development Core Team, 2013) to explore the above
characteristics of the different groups of fishers, i.e. recreational fishers/club
members, and to test the various hypotheses, such as whether club members
travel greater distances to fish and experience greater catch rates. For all such
logistic regression analyses, the dependent variable (club membership) was first
recast as a dichotomous factor. The glm procedure was then employed, with family
set to ‘binomial’, to determine for each regression the extent to which the response
variable was related to the various putative explanatory factors that had been
hypothesised. The strength of each relationship was assessed on the basis of four
levels of significance: P < 0.10; P < 0.05; P < 0.01, and; P < 0.001. Note that, as
the sample size of the survey was small, the significance level of 0.10 was
employed to identify explanatory factors of borderline significance which, had a
larger survey been undertaken, would have been likely to have been classified as
statistically significant at the 0.05 level.
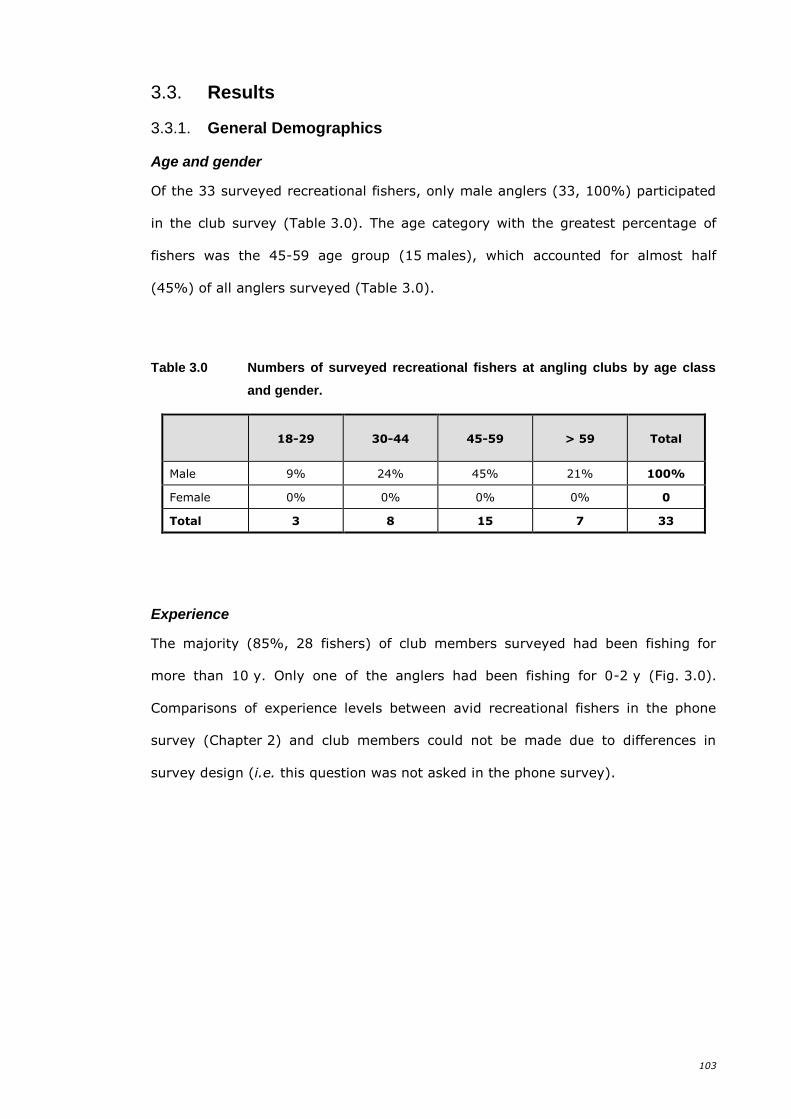
103
Results 3.3.
3.3.1. General Demographics
Age and gender
Of the 33 surveyed recreational fishers, only male anglers (33, 100%) participated
in the club survey (Table 3.0). The age category with the greatest percentage of
fishers was the 45-59 age group (15 males), which accounted for almost half
(45%) of all anglers surveyed (Table 3.0).
Table 3.0 Numbers of surveyed recreational fishers at angling clubs by age class
and gender.
18-29 30-44 45-59 > 59 Total
Male 9% 24% 45% 21% 100%
Female 0% 0% 0% 0% 0
Total 3 8 15 7 33
Experience
The majority (85%, 28 fishers) of club members surveyed had been fishing for
more than 10 y. Only one of the anglers had been fishing for 0-2 y (Fig. 3.0).
Comparisons of experience levels between avid recreational fishers in the phone
survey (Chapter 2) and club members could not be made due to differences in
survey design (i.e. this question was not asked in the phone survey).
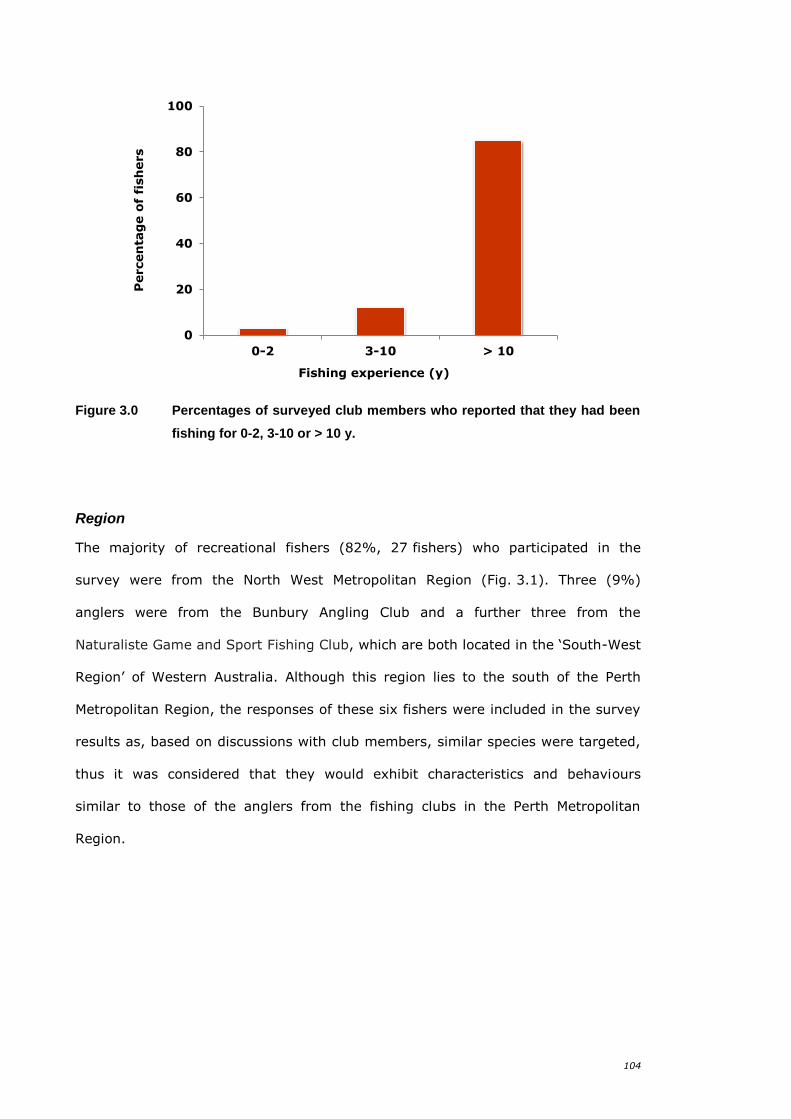
104
Figure 3.0 Percentages of surveyed club members who reported that they had been
fishing for 0-2, 3-10 or > 10 y.
Region
The majority of recreational fishers (82%, 27 fishers) who participated in the
survey were from the North West Metropolitan Region (Fig. 3.1). Three (9%)
anglers were from the Bunbury Angling Club and a further three from the
Naturaliste Game and Sport Fishing Club, which are both located in the ‘South-West
Region’ of Western Australia. Although this region lies to the south of the Perth
Metropolitan Region, the responses of these six fishers were included in the survey
results as, based on discussions with club members, similar species were targeted,
thus it was considered that they would exhibit characteristics and behaviours
similar to those of the anglers from the fishing clubs in the Perth Metropolitan
Region.
0
20
40
60
80
100
0-2 3-10 > 10
Percen
tag
e o
f fi
sh
ers
Fishing experience (y)
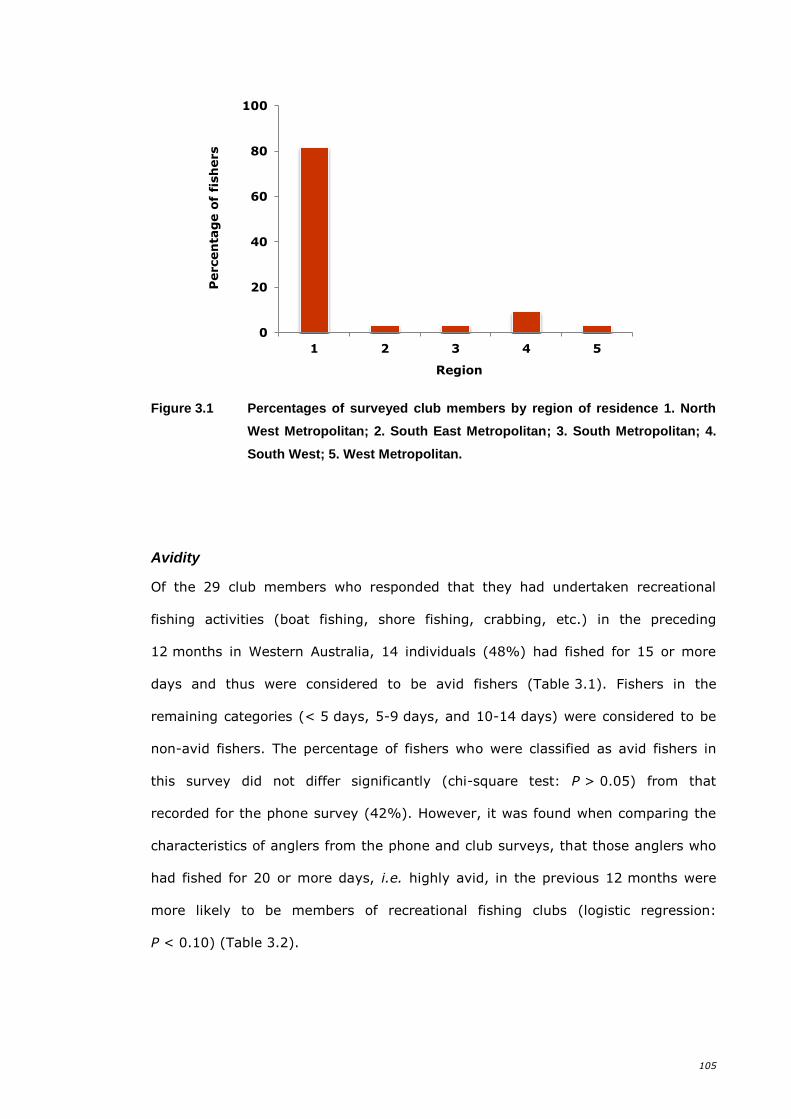
105
Figure 3.1 Percentages of surveyed club members by region of residence 1. North
West Metropolitan; 2. South East Metropolitan; 3. South Metropolitan; 4.
South West; 5. West Metropolitan.
Avidity
Of the 29 club members who responded that they had undertaken recreational
fishing activities (boat fishing, shore fishing, crabbing, etc.) in the preceding
12 months in Western Australia, 14 individuals (48%) had fished for 15 or more
days and thus were considered to be avid fishers (Table 3.1). Fishers in the
remaining categories (< 5 days, 5-9 days, and 10-14 days) were considered to be
non-avid fishers. The percentage of fishers who were classified as avid fishers in
this survey did not differ significantly (chi-square test: P > 0.05) from that
recorded for the phone survey (42%). However, it was found when comparing the
characteristics of anglers from the phone and club surveys, that those anglers who
had fished for 20 or more days, i.e. highly avid, in the previous 12 months were
more likely to be members of recreational fishing clubs (logistic regression:
P < 0.10) (Table 3.2).
0
20
40
60
80
100
1 2 3 4 5
Percen
tag
e o
f fi
sh
ers
Region
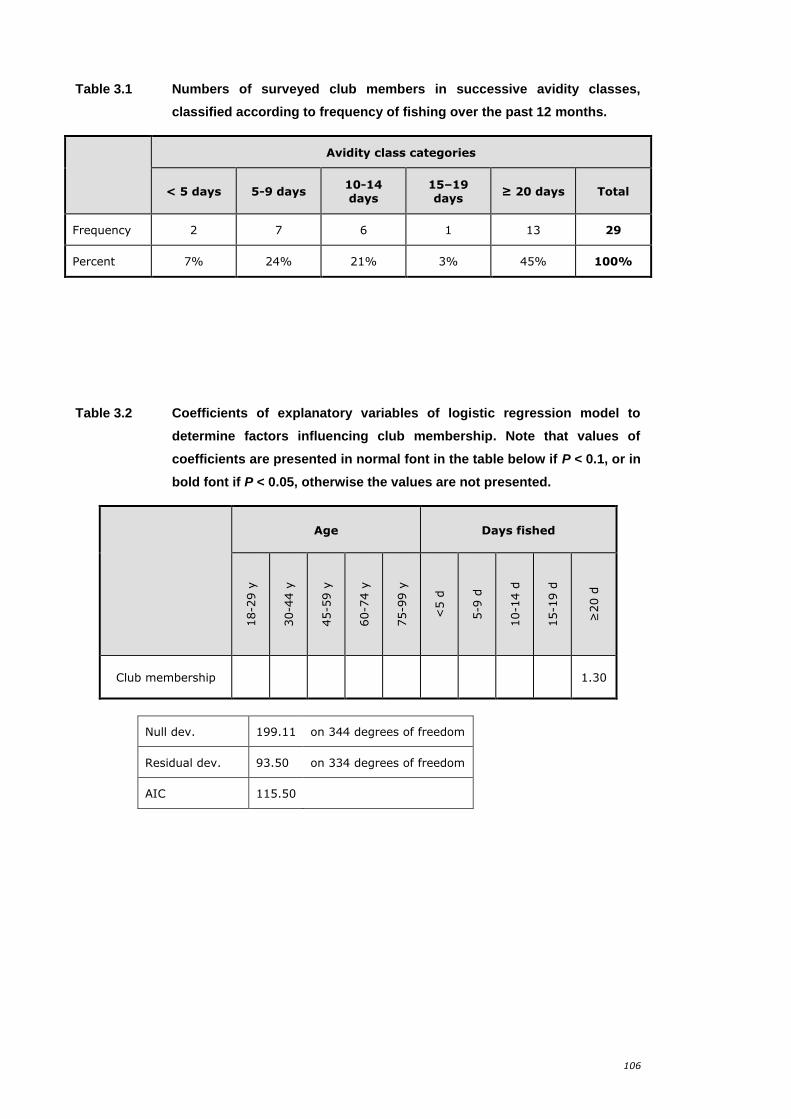
106
Table 3.1 Numbers of surveyed club members in successive avidity classes,
classified according to frequency of fishing over the past 12 months.
Avidity class categories
< 5 days 5-9 days 10-14 days
15–19 days
≥ 20 days Total
Frequency 2 7 6 1 13 29
Percent 7% 24% 21% 3% 45% 100%
Table 3.2 Coefficients of explanatory variables of logistic regression model to
determine factors influencing club membership. Note that values of
coefficients are presented in normal font in the table below if P < 0.1, or in
bold font if P < 0.05, otherwise the values are not presented.
Age Days fished
18-2
9 y
30-4
4 y
45-5
9 y
60-7
4 y
75-9
9 y
<5 d
5-9
d
10-1
4 d
15-1
9 d
≥20 d
Club membership 1.30
Null dev. 199.11 on 344 degrees of freedom
Residual dev. 93.50 on 334 degrees of freedom
AIC 115.50
107
3.3.2. Catch preferences
Target species
The majority (70%, 23 fishers) of the surveyed club members reported that, on
their last fishing trip, they mainly aimed to catch a mix of fish species including
West Australian dhufish or pink snapper (‘mixed’). A further 18% of fishers (6
fishers) reported that West Australian dhufish was their main target fish species
(Fig. 3.2, Table 3.3). Although there were insufficient data to apply a chi-square
test (as the expected frequency was < 5), 21% of club members had targeted West
Australian dhufish and pink snapper, compared with 11% of avid recreational
fishers in the phone survey in Chapter 2 who reported targeting this species. Note,
however, that the questionnaire completed by club members did not include the
option of reporting that they had targeted no particular species (‘no target’) on
their last fishing trip in the preceding 12 months. Of the avid anglers interviewed in
the phone survey who had reported targeting a species, 16% had targeted West
Australian dhufish or pink snapper (Fig. 3.2, Table 3.3). Anglers who caught pink
snapper but who had caught West Australian dhufish on their last boat fishing trip
were also likely to be members of angling clubs (logistic regression: P < 0.05)
(Table 3.4).
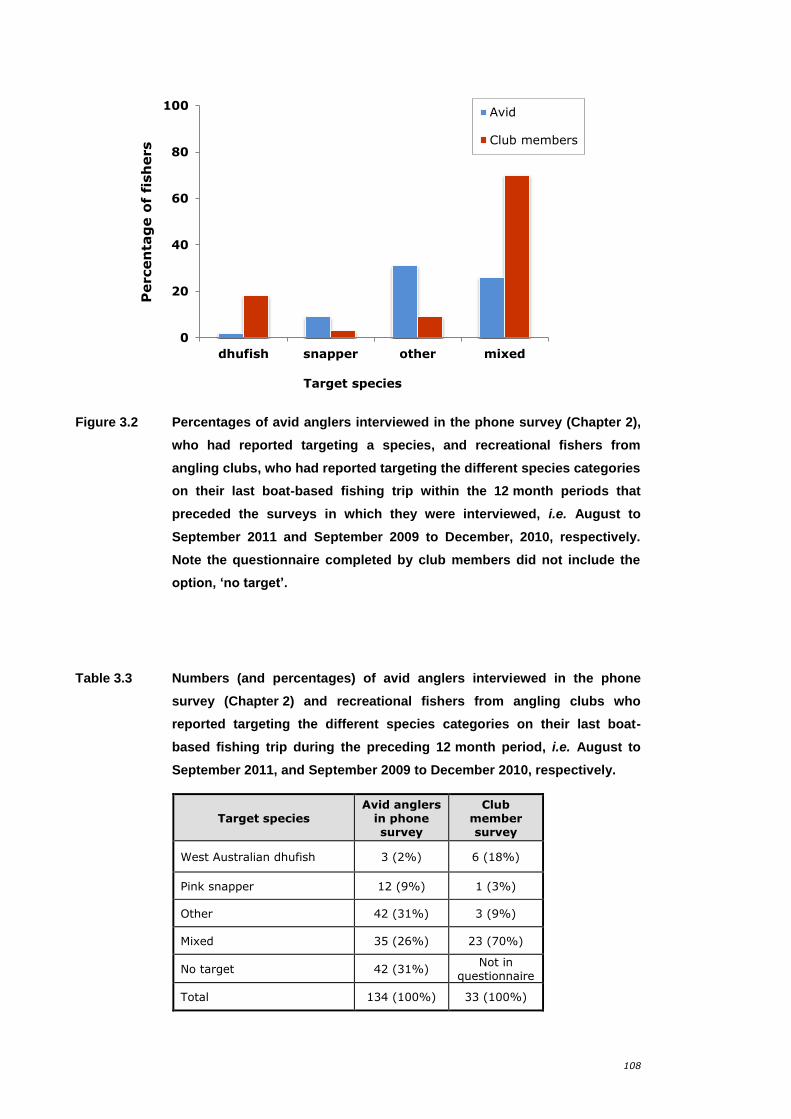
108
Figure 3.2 Percentages of avid anglers interviewed in the phone survey (Chapter 2),
who had reported targeting a species, and recreational fishers from
angling clubs, who had reported targeting the different species categories
on their last boat-based fishing trip within the 12 month periods that
preceded the surveys in which they were interviewed, i.e. August to
September 2011 and September 2009 to December, 2010, respectively.
Note the questionnaire completed by club members did not include the
option, ‘no target’.
Table 3.3 Numbers (and percentages) of avid anglers interviewed in the phone
survey (Chapter 2) and recreational fishers from angling clubs who
reported targeting the different species categories on their last boat-
based fishing trip during the preceding 12 month period, i.e. August to
September 2011, and September 2009 to December 2010, respectively.
Target species Avid anglers
in phone survey
Club member survey
West Australian dhufish 3 (2%) 6 (18%)
Pink snapper 12 (9%) 1 (3%)
Other 42 (31%) 3 (9%)
Mixed 35 (26%) 23 (70%)
No target 42 (31%) Not in
questionnaire
Total 134 (100%) 33 (100%)
0
20
40
60
80
100
dhufish snapper other mixed
Percen
tag
e o
f fi
sh
ers
Target species
Avid
Club members
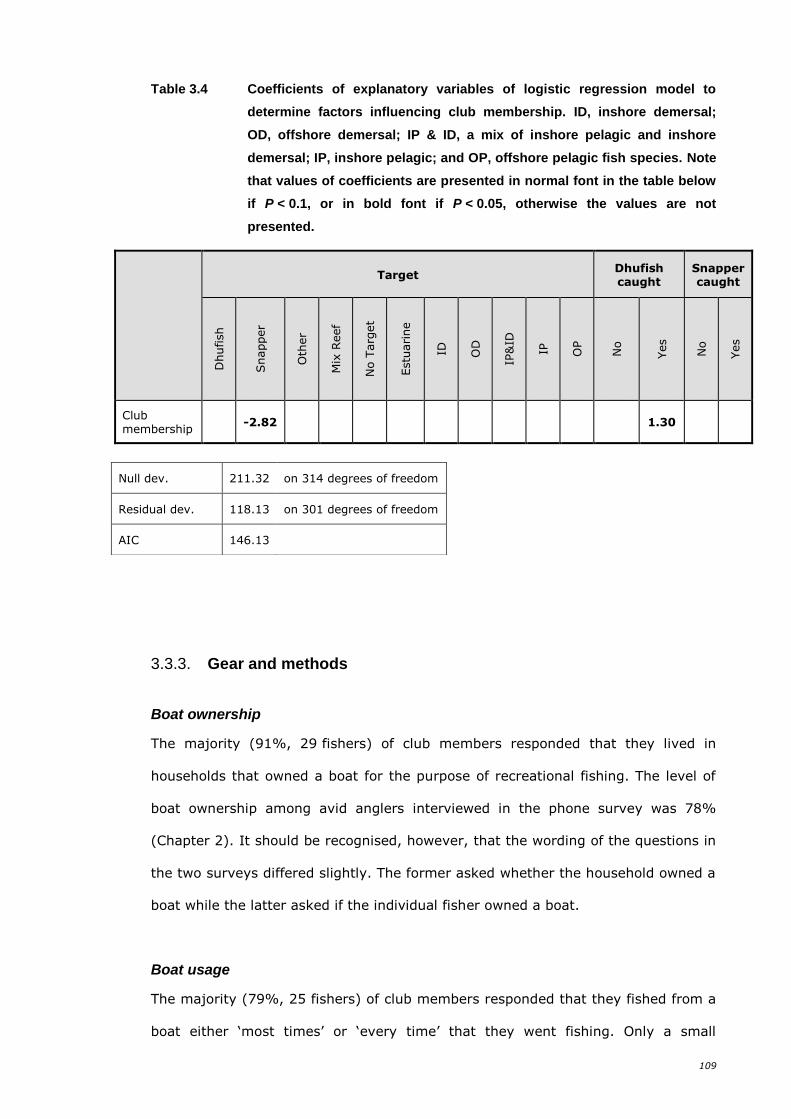
109
Table 3.4 Coefficients of explanatory variables of logistic regression model to
determine factors influencing club membership. ID, inshore demersal;
OD, offshore demersal; IP & ID, a mix of inshore pelagic and inshore
demersal; IP, inshore pelagic; and OP, offshore pelagic fish species. Note
that values of coefficients are presented in normal font in the table below
if P < 0.1, or in bold font if P < 0.05, otherwise the values are not
presented.
Target Dhufish caught
Snapper caught
Dhufish
Snapper
Oth
er
Mix
Reef
No T
arg
et
Estu
arine
ID
OD
IP&
ID
IP
OP
No
Yes
No
Yes
Club membership
-2.82 1.30
3.3.3. Gear and methods
Boat ownership
The majority (91%, 29 fishers) of club members responded that they lived in
households that owned a boat for the purpose of recreational fishing. The level of
boat ownership among avid anglers interviewed in the phone survey was 78%
(Chapter 2). It should be recognised, however, that the wording of the questions in
the two surveys differed slightly. The former asked whether the household owned a
boat while the latter asked if the individual fisher owned a boat.
Boat usage
The majority (79%, 25 fishers) of club members responded that they fished from a
boat either ‘most times’ or ‘every time’ that they went fishing. Only a small
Null dev. 211.32 on 314 degrees of freedom
Residual dev. 118.13 on 301 degrees of freedom
AIC 146.13
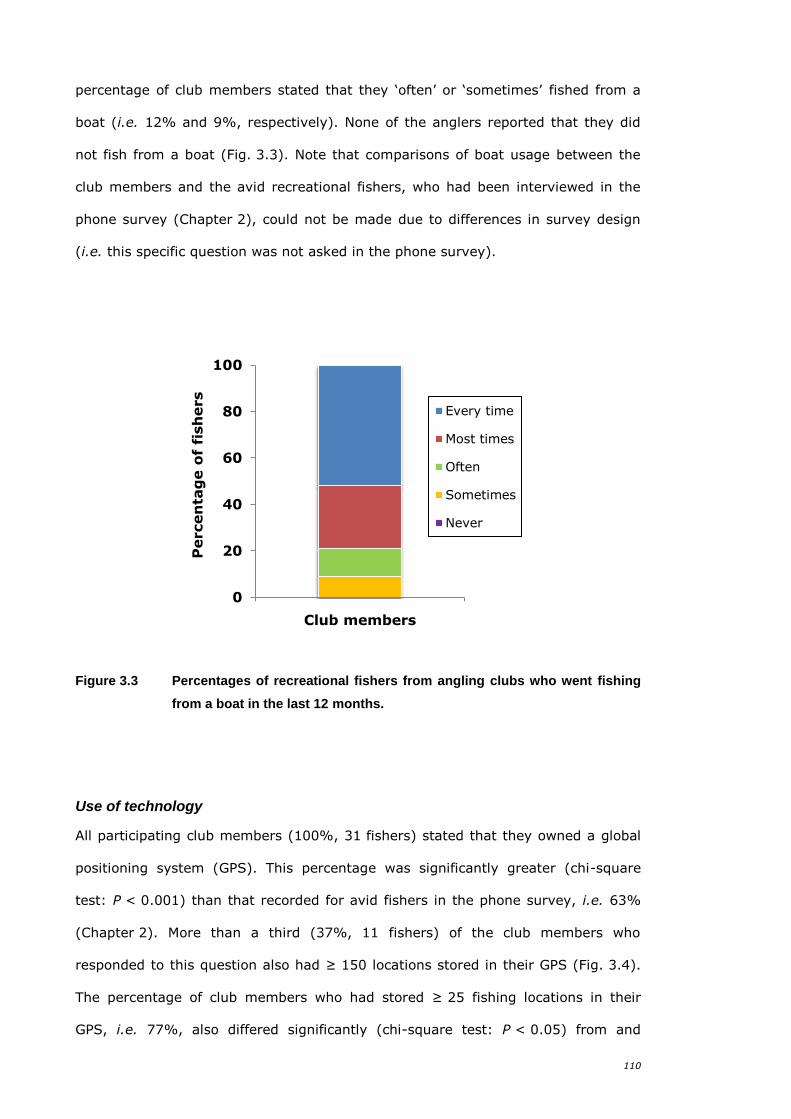
110
percentage of club members stated that they ‘often’ or ‘sometimes’ fished from a
boat (i.e. 12% and 9%, respectively). None of the anglers reported that they did
not fish from a boat (Fig. 3.3). Note that comparisons of boat usage between the
club members and the avid recreational fishers, who had been interviewed in the
phone survey (Chapter 2), could not be made due to differences in survey design
(i.e. this specific question was not asked in the phone survey).
Figure 3.3 Percentages of recreational fishers from angling clubs who went fishing
from a boat in the last 12 months.
Use of technology
All participating club members (100%, 31 fishers) stated that they owned a global
positioning system (GPS). This percentage was significantly greater (chi-square
test: P < 0.001) than that recorded for avid fishers in the phone survey, i.e. 63%
(Chapter 2). More than a third (37%, 11 fishers) of the club members who
responded to this question also had ≥ 150 locations stored in their GPS (Fig. 3.4).
The percentage of club members who had stored ≥ 25 fishing locations in their
GPS, i.e. 77%, also differed significantly (chi-square test: P < 0.05) from and
0
20
40
60
80
100
Percen
tag
e o
f fi
sh
ers
Club members
Every time
Most times
Often
Sometimes
Never
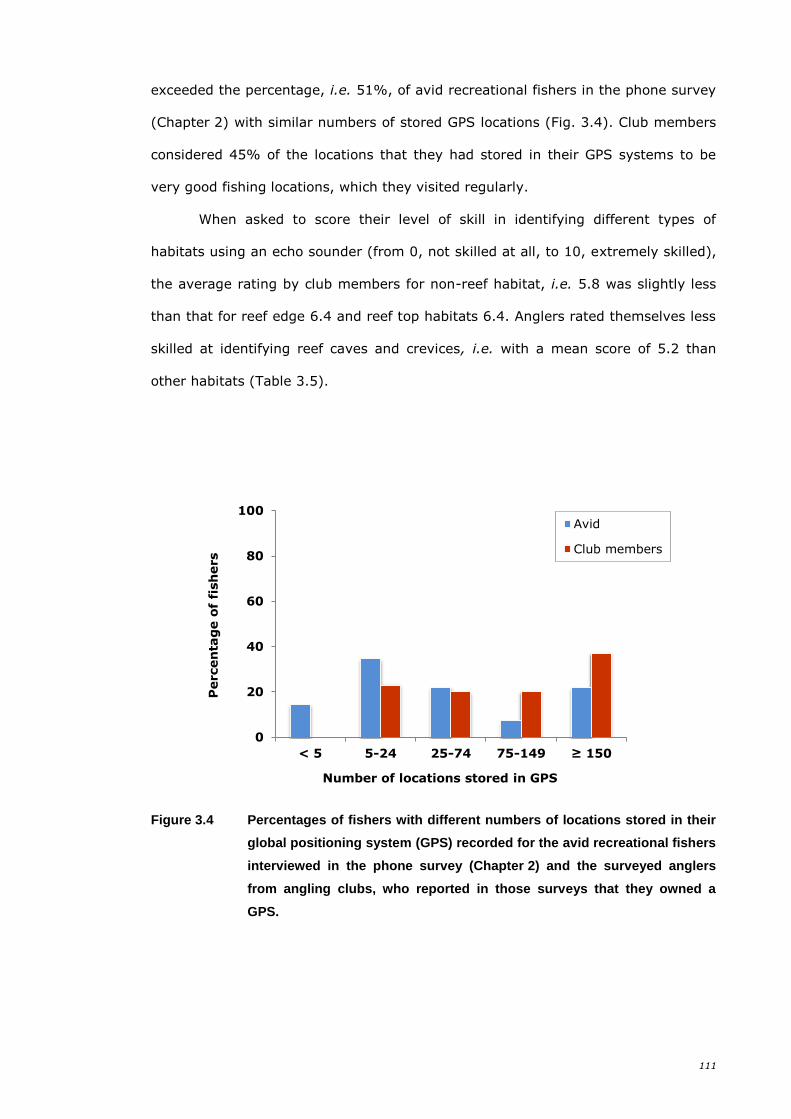
111
exceeded the percentage, i.e. 51%, of avid recreational fishers in the phone survey
(Chapter 2) with similar numbers of stored GPS locations (Fig. 3.4). Club members
considered 45% of the locations that they had stored in their GPS systems to be
very good fishing locations, which they visited regularly.
When asked to score their level of skill in identifying different types of
habitats using an echo sounder (from 0, not skilled at all, to 10, extremely skilled),
the average rating by club members for non-reef habitat, i.e. 5.8 was slightly less
than that for reef edge 6.4 and reef top habitats 6.4. Anglers rated themselves less
skilled at identifying reef caves and crevices, i.e. with a mean score of 5.2 than
other habitats (Table 3.5).
Figure 3.4 Percentages of fishers with different numbers of locations stored in their
global positioning system (GPS) recorded for the avid recreational fishers
interviewed in the phone survey (Chapter 2) and the surveyed anglers
from angling clubs, who reported in those surveys that they owned a
GPS.
0
20
40
60
80
100
< 5 5-24 25-74 75-149 ≥ 150
Percen
tag
e o
f fi
sh
ers
Number of locations stored in GPS
Avid
Club members
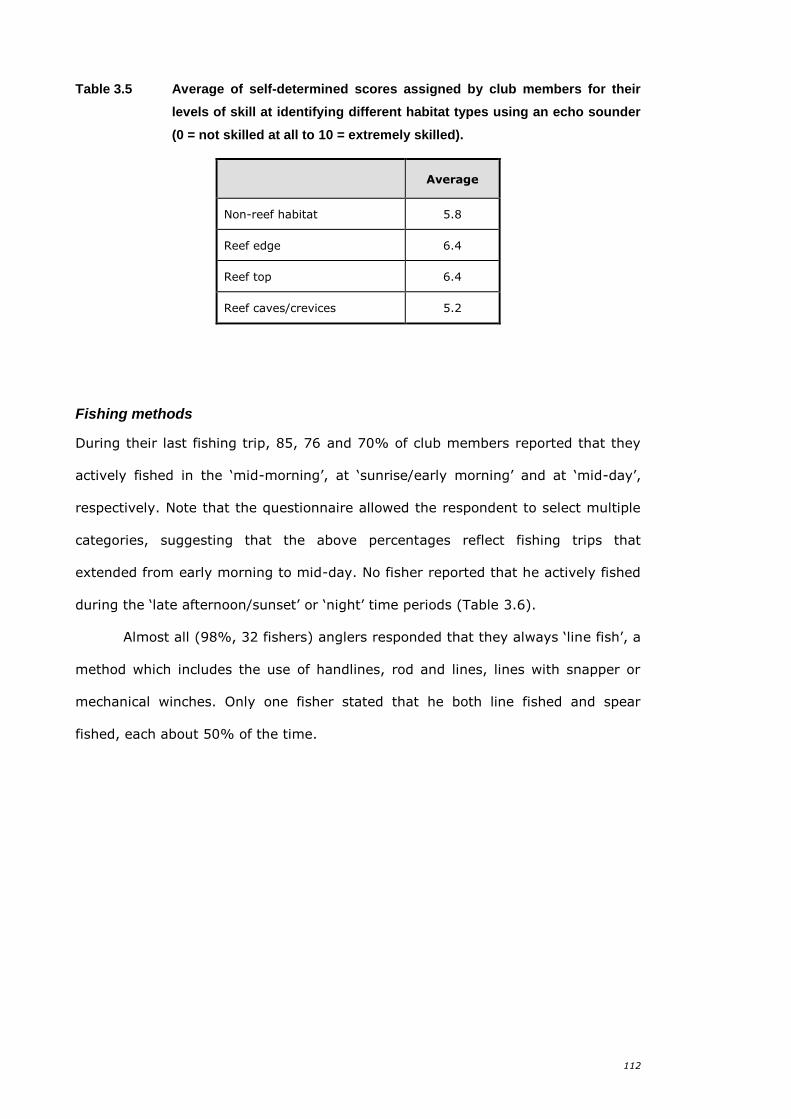
112
Table 3.5 Average of self-determined scores assigned by club members for their
levels of skill at identifying different habitat types using an echo sounder
(0 = not skilled at all to 10 = extremely skilled).
Average
Non-reef habitat 5.8
Reef edge 6.4
Reef top 6.4
Reef caves/crevices 5.2
Fishing methods
During their last fishing trip, 85, 76 and 70% of club members reported that they
actively fished in the ‘mid-morning’, at ‘sunrise/early morning’ and at ‘mid-day’,
respectively. Note that the questionnaire allowed the respondent to select multiple
categories, suggesting that the above percentages reflect fishing trips that
extended from early morning to mid-day. No fisher reported that he actively fished
during the ‘late afternoon/sunset’ or ‘night’ time periods (Table 3.6).
Almost all (98%, 32 fishers) anglers responded that they always ‘line fish’, a
method which includes the use of handlines, rod and lines, lines with snapper or
mechanical winches. Only one fisher stated that he both line fished and spear
fished, each about 50% of the time.
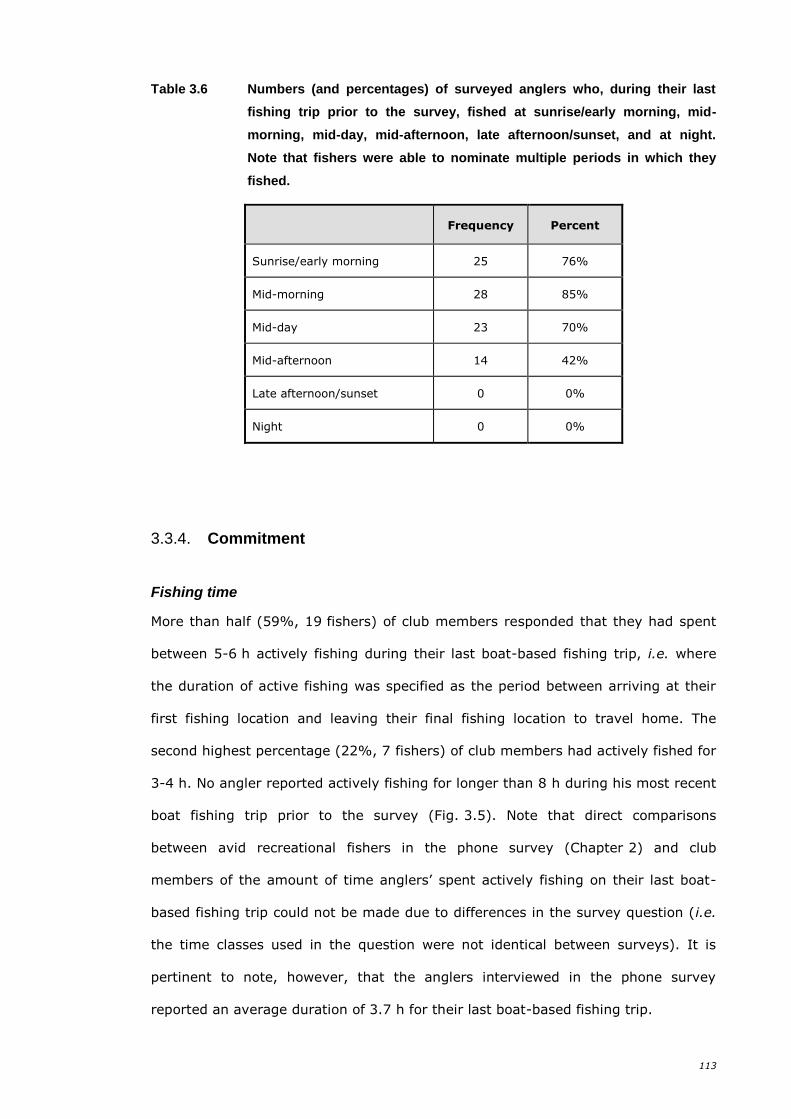
113
Table 3.6 Numbers (and percentages) of surveyed anglers who, during their last
fishing trip prior to the survey, fished at sunrise/early morning, mid-
morning, mid-day, mid-afternoon, late afternoon/sunset, and at night.
Note that fishers were able to nominate multiple periods in which they
fished.
Frequency Percent
Sunrise/early morning 25 76%
Mid-morning 28 85%
Mid-day 23 70%
Mid-afternoon 14 42%
Late afternoon/sunset 0 0%
Night 0 0%
3.3.4. Commitment
Fishing time
More than half (59%, 19 fishers) of club members responded that they had spent
between 5-6 h actively fishing during their last boat-based fishing trip, i.e. where
the duration of active fishing was specified as the period between arriving at their
first fishing location and leaving their final fishing location to travel home. The
second highest percentage (22%, 7 fishers) of club members had actively fished for
3-4 h. No angler reported actively fishing for longer than 8 h during his most recent
boat fishing trip prior to the survey (Fig. 3.5). Note that direct comparisons
between avid recreational fishers in the phone survey (Chapter 2) and club
members of the amount of time anglers’ spent actively fishing on their last boat-
based fishing trip could not be made due to differences in the survey question (i.e.
the time classes used in the question were not identical between surveys). It is
pertinent to note, however, that the anglers interviewed in the phone survey
reported an average duration of 3.7 h for their last boat-based fishing trip.
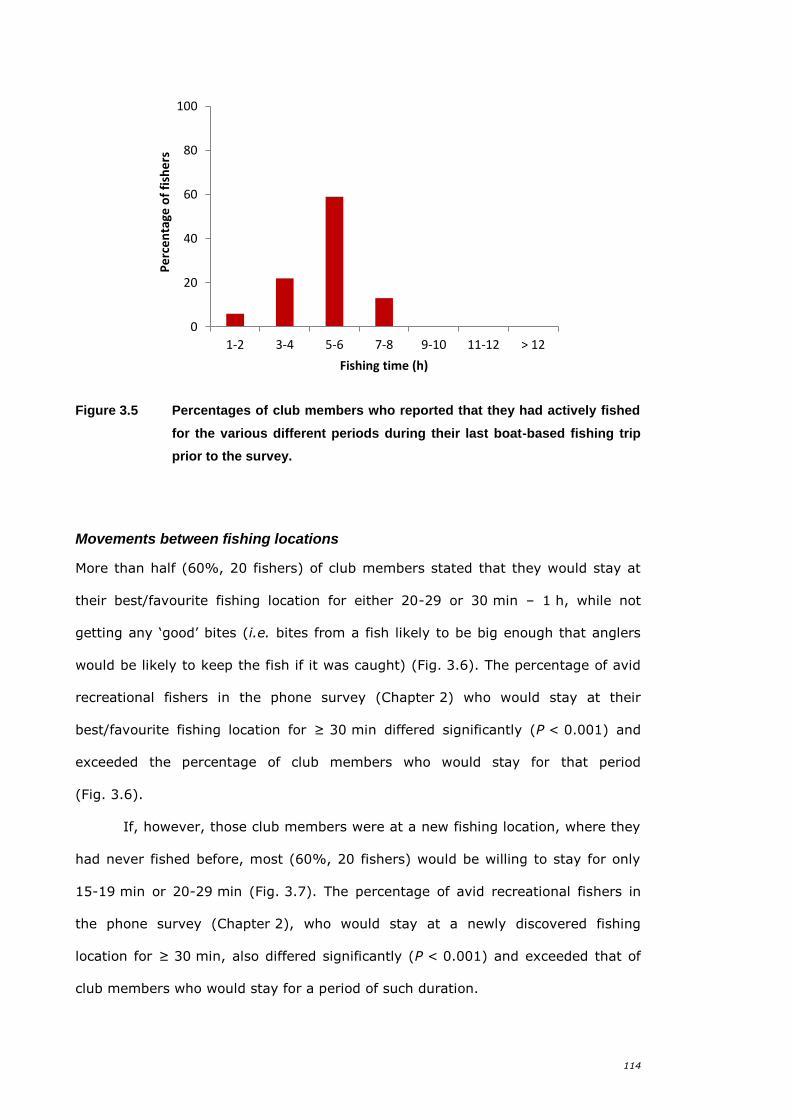
114
Figure 3.5 Percentages of club members who reported that they had actively fished
for the various different periods during their last boat-based fishing trip
prior to the survey.
Movements between fishing locations
More than half (60%, 20 fishers) of club members stated that they would stay at
their best/favourite fishing location for either 20-29 or 30 min – 1 h, while not
getting any ‘good’ bites (i.e. bites from a fish likely to be big enough that anglers
would be likely to keep the fish if it was caught) (Fig. 3.6). The percentage of avid
recreational fishers in the phone survey (Chapter 2) who would stay at their
best/favourite fishing location for ≥ 30 min differed significantly (P < 0.001) and
exceeded the percentage of club members who would stay for that period
(Fig. 3.6).
If, however, those club members were at a new fishing location, where they
had never fished before, most (60%, 20 fishers) would be willing to stay for only
15-19 min or 20-29 min (Fig. 3.7). The percentage of avid recreational fishers in
the phone survey (Chapter 2), who would stay at a newly discovered fishing
location for ≥ 30 min, also differed significantly (P < 0.001) and exceeded that of
club members who would stay for a period of such duration.
0
20
40
60
80
100
1-2 3-4 5-6 7-8 9-10 11-12 > 12
Pe
rce
nta
ge o
f fi
she
rs
Fishing time (h)
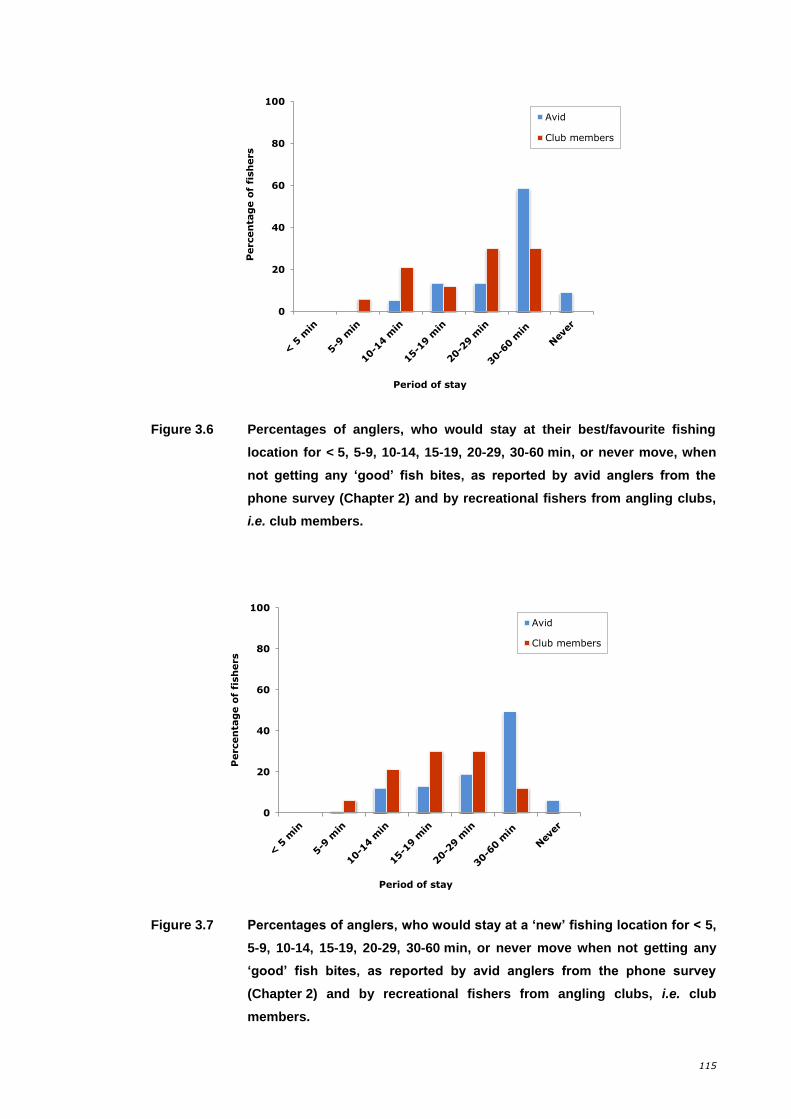
115
Figure 3.6 Percentages of anglers, who would stay at their best/favourite fishing
location for < 5, 5-9, 10-14, 15-19, 20-29, 30-60 min, or never move, when
not getting any ‘good’ fish bites, as reported by avid anglers from the
phone survey (Chapter 2) and by recreational fishers from angling clubs,
i.e. club members.
Figure 3.7 Percentages of anglers, who would stay at a ‘new’ fishing location for < 5,
5-9, 10-14, 15-19, 20-29, 30-60 min, or never move when not getting any
‘good’ fish bites, as reported by avid anglers from the phone survey
(Chapter 2) and by recreational fishers from angling clubs, i.e. club
members.
0
20
40
60
80
100
Percen
tag
e o
f fi
sh
ers
Period of stay
Avid
Club members
0
20
40
60
80
100
Percen
tag
e o
f fi
sh
ers
Period of stay
Avid
Club members
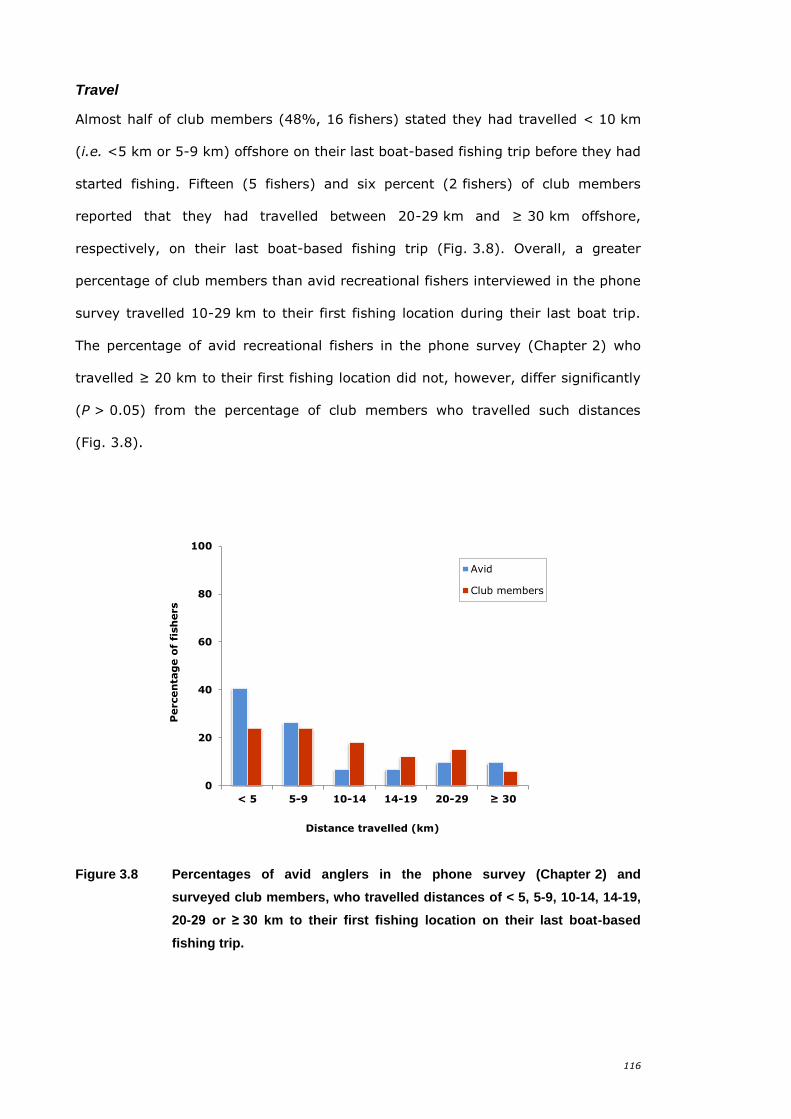
116
Travel
Almost half of club members (48%, 16 fishers) stated they had travelled < 10 km
(i.e. <5 km or 5-9 km) offshore on their last boat-based fishing trip before they had
started fishing. Fifteen (5 fishers) and six percent (2 fishers) of club members
reported that they had travelled between 20-29 km and ≥ 30 km offshore,
respectively, on their last boat-based fishing trip (Fig. 3.8). Overall, a greater
percentage of club members than avid recreational fishers interviewed in the phone
survey travelled 10-29 km to their first fishing location during their last boat trip.
The percentage of avid recreational fishers in the phone survey (Chapter 2) who
travelled ≥ 20 km to their first fishing location did not, however, differ significantly
(P > 0.05) from the percentage of club members who travelled such distances
(Fig. 3.8).
Figure 3.8 Percentages of avid anglers in the phone survey (Chapter 2) and
surveyed club members, who travelled distances of < 5, 5-9, 10-14, 14-19,
20-29 or ≥ 30 km to their first fishing location on their last boat-based
fishing trip.
0
20
40
60
80
100
< 5 5-9 10-14 14-19 20-29 ≥ 30
Percen
tag
e o
f fi
sh
ers
Distance travelled (km)
Avid
Club members
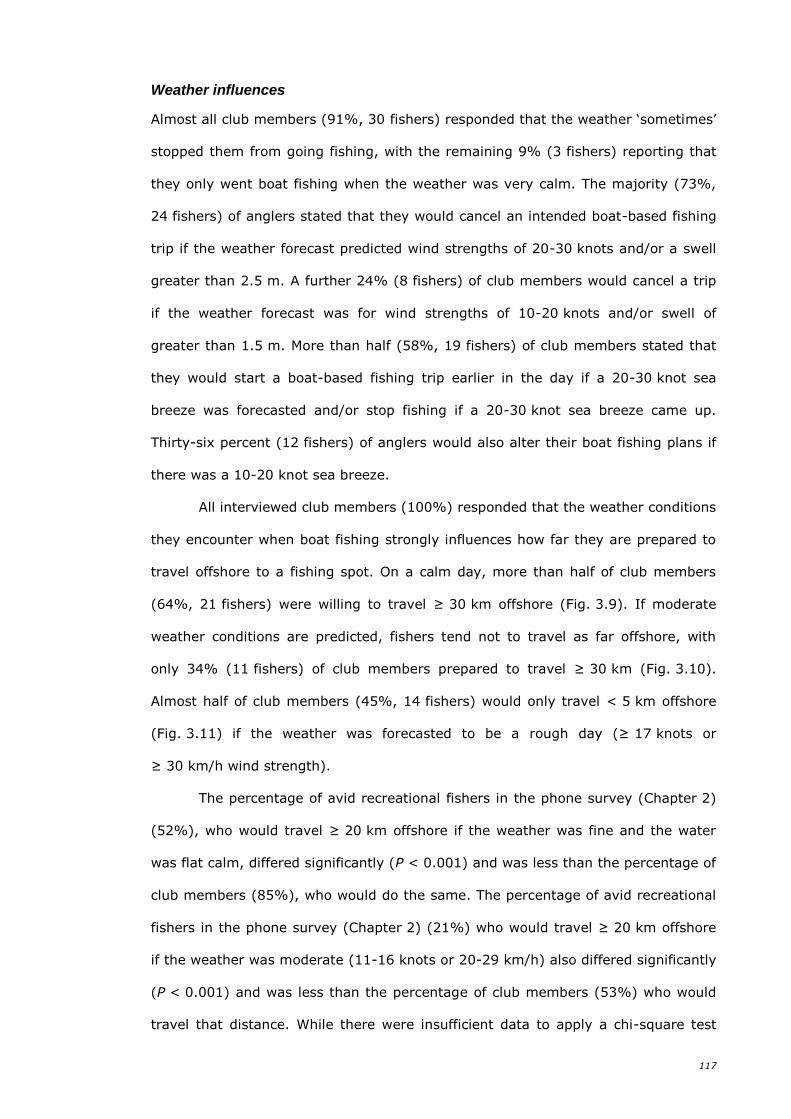
117
Weather influences
Almost all club members (91%, 30 fishers) responded that the weather ‘sometimes’
stopped them from going fishing, with the remaining 9% (3 fishers) reporting that
they only went boat fishing when the weather was very calm. The majority (73%,
24 fishers) of anglers stated that they would cancel an intended boat-based fishing
trip if the weather forecast predicted wind strengths of 20-30 knots and/or a swell
greater than 2.5 m. A further 24% (8 fishers) of club members would cancel a trip
if the weather forecast was for wind strengths of 10-20 knots and/or swell of
greater than 1.5 m. More than half (58%, 19 fishers) of club members stated that
they would start a boat-based fishing trip earlier in the day if a 20-30 knot sea
breeze was forecasted and/or stop fishing if a 20-30 knot sea breeze came up.
Thirty-six percent (12 fishers) of anglers would also alter their boat fishing plans if
there was a 10-20 knot sea breeze.
All interviewed club members (100%) responded that the weather conditions
they encounter when boat fishing strongly influences how far they are prepared to
travel offshore to a fishing spot. On a calm day, more than half of club members
(64%, 21 fishers) were willing to travel ≥ 30 km offshore (Fig. 3.9). If moderate
weather conditions are predicted, fishers tend not to travel as far offshore, with
only 34% (11 fishers) of club members prepared to travel ≥ 30 km (Fig. 3.10).
Almost half of club members (45%, 14 fishers) would only travel < 5 km offshore
(Fig. 3.11) if the weather was forecasted to be a rough day (≥ 17 knots or
≥ 30 km/h wind strength).
The percentage of avid recreational fishers in the phone survey (Chapter 2)
(52%), who would travel ≥ 20 km offshore if the weather was fine and the water
was flat calm, differed significantly (P < 0.001) and was less than the percentage of
club members (85%), who would do the same. The percentage of avid recreational
fishers in the phone survey (Chapter 2) (21%) who would travel ≥ 20 km offshore
if the weather was moderate (11-16 knots or 20-29 km/h) also differed significantly
(P < 0.001) and was less than the percentage of club members (53%) who would
travel that distance. While there were insufficient data to apply a chi-square test
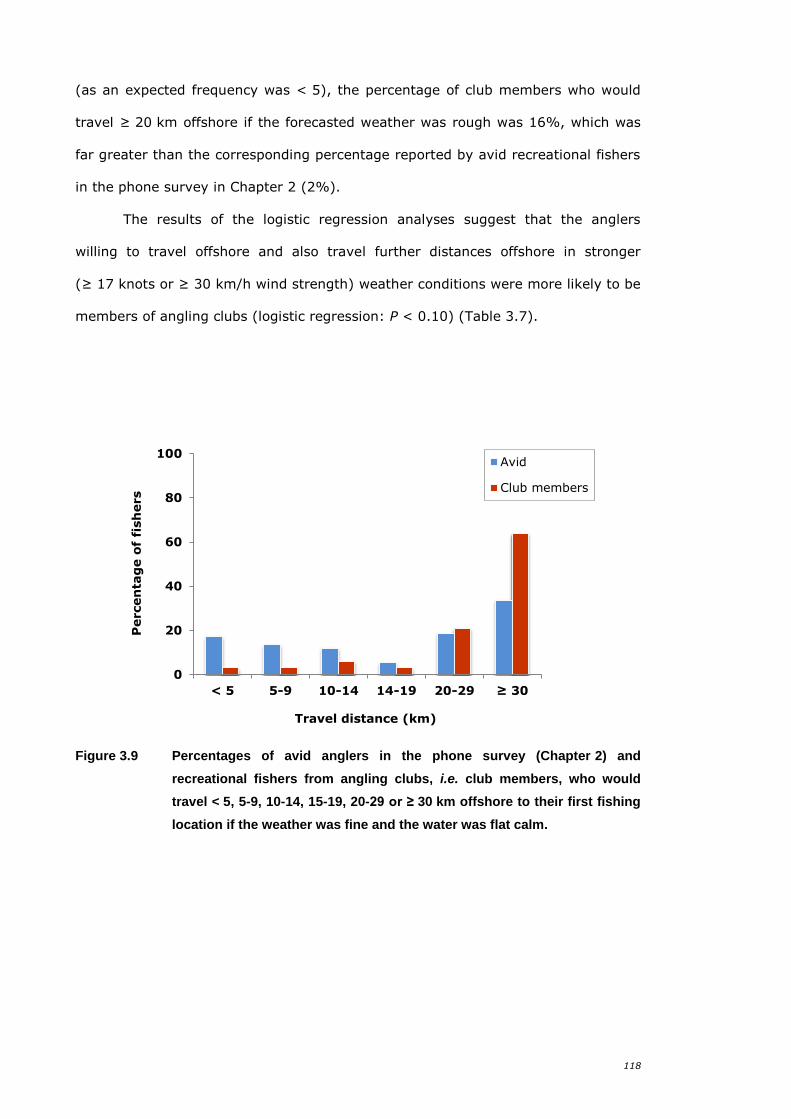
118
(as an expected frequency was < 5), the percentage of club members who would
travel ≥ 20 km offshore if the forecasted weather was rough was 16%, which was
far greater than the corresponding percentage reported by avid recreational fishers
in the phone survey in Chapter 2 (2%).
The results of the logistic regression analyses suggest that the anglers
willing to travel offshore and also travel further distances offshore in stronger
(≥ 17 knots or ≥ 30 km/h wind strength) weather conditions were more likely to be
members of angling clubs (logistic regression: P < 0.10) (Table 3.7).
Figure 3.9 Percentages of avid anglers in the phone survey (Chapter 2) and
recreational fishers from angling clubs, i.e. club members, who would
travel < 5, 5-9, 10-14, 15-19, 20-29 or ≥ 30 km offshore to their first fishing
location if the weather was fine and the water was flat calm.
0
20
40
60
80
100
< 5 5-9 10-14 14-19 20-29 ≥ 30
Percen
tag
e o
f fi
sh
ers
Travel distance (km)
Avid
Club members
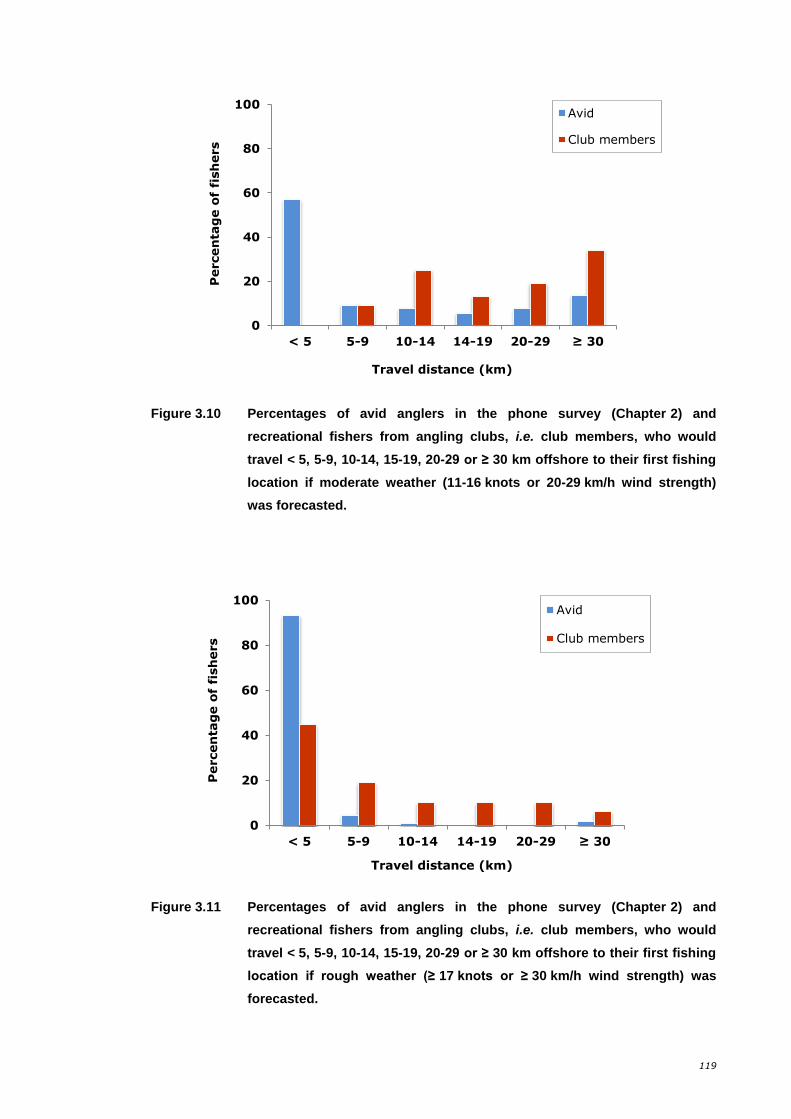
119
Figure 3.10 Percentages of avid anglers in the phone survey (Chapter 2) and
recreational fishers from angling clubs, i.e. club members, who would
travel < 5, 5-9, 10-14, 15-19, 20-29 or ≥ 30 km offshore to their first fishing
location if moderate weather (11-16 knots or 20-29 km/h wind strength)
was forecasted.
Figure 3.11 Percentages of avid anglers in the phone survey (Chapter 2) and
recreational fishers from angling clubs, i.e. club members, who would
travel < 5, 5-9, 10-14, 15-19, 20-29 or ≥ 30 km offshore to their first fishing
location if rough weather (≥ 17 knots or ≥ 30 km/h wind strength) was
forecasted.
0
20
40
60
80
100
< 5 5-9 10-14 14-19 20-29 ≥ 30
Percen
tag
e o
f fi
sh
ers
Travel distance (km)
Avid
Club members
0
20
40
60
80
100
< 5 5-9 10-14 14-19 20-29 ≥ 30
Percen
tag
e o
f fi
sh
ers
Travel distance (km)
Avid
Club members
120
Table 3.7 Coefficients of explanatory variables of logistic regression model to determine factors influencing club membership. Note that values
of coefficients are presented in normal font in the table below if P < 0.1, or in bold font if P < 0.05, otherwise the values are not
presented.
Distance to first site Distance offshore if fine Distance offshore if moderate Distance offshore if strong
<5 k
m
5-9
km
10-1
4 k
m
15-1
9 k
m
20-2
9 k
m
30 k
m o
r m
ore
<5 k
m
5-9
km
10-1
4 k
m
15-1
9 k
m
20-2
9 k
m
30 k
m o
r m
ore
<5 k
m
5-9
km
10-1
4 k
m
15-1
9 k
m
20-2
9 k
m
30 k
m o
r m
ore
<5 k
m
5-9
km
10-1
4 k
m
15-1
9 k
m
20-2
9 k
m
30 k
m o
r m
ore
Club membership 1.78 2.98 3.13 2.73
Null dev. 202.57 on 337 degrees of freedom
Residual dev. 102.14 on 313 degrees of freedom
AIC 152.14
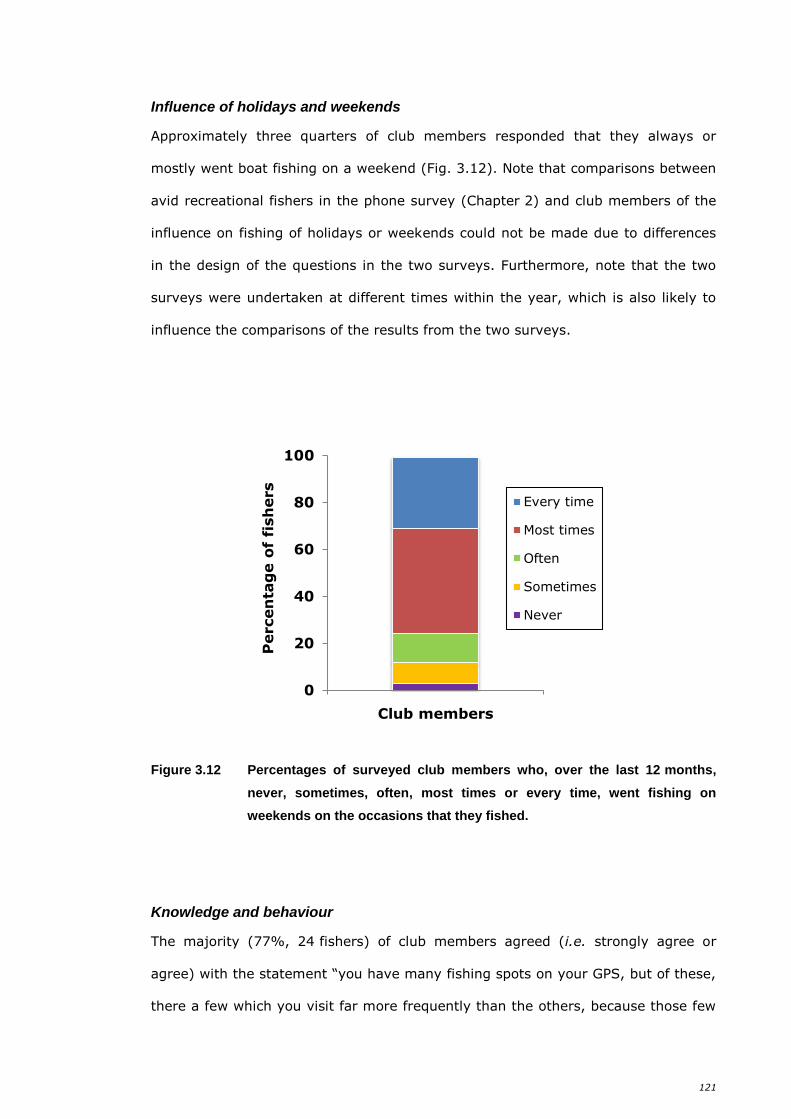
121
Influence of holidays and weekends
Approximately three quarters of club members responded that they always or
mostly went boat fishing on a weekend (Fig. 3.12). Note that comparisons between
avid recreational fishers in the phone survey (Chapter 2) and club members of the
influence on fishing of holidays or weekends could not be made due to differences
in the design of the questions in the two surveys. Furthermore, note that the two
surveys were undertaken at different times within the year, which is also likely to
influence the comparisons of the results from the two surveys.
Figure 3.12 Percentages of surveyed club members who, over the last 12 months,
never, sometimes, often, most times or every time, went fishing on
weekends on the occasions that they fished.
Knowledge and behaviour
The majority (77%, 24 fishers) of club members agreed (i.e. strongly agree or
agree) with the statement “you have many fishing spots on your GPS, but of these,
there a few which you visit far more frequently than the others, because those few
0
20
40
60
80
100
Percen
tag
e o
f fi
sh
ers
Club members
Every time
Most times
Often
Sometimes
Never
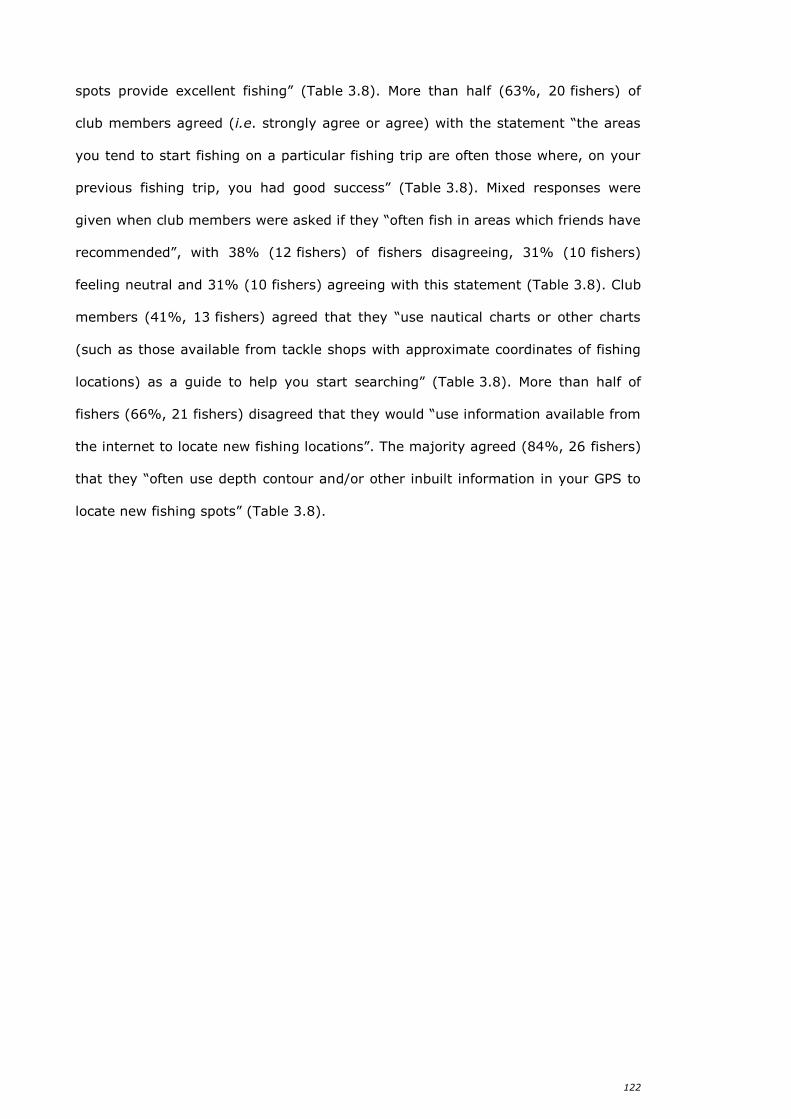
122
spots provide excellent fishing” (Table 3.8). More than half (63%, 20 fishers) of
club members agreed (i.e. strongly agree or agree) with the statement “the areas
you tend to start fishing on a particular fishing trip are often those where, on your
previous fishing trip, you had good success” (Table 3.8). Mixed responses were
given when club members were asked if they “often fish in areas which friends have
recommended”, with 38% (12 fishers) of fishers disagreeing, 31% (10 fishers)
feeling neutral and 31% (10 fishers) agreeing with this statement (Table 3.8). Club
members (41%, 13 fishers) agreed that they “use nautical charts or other charts
(such as those available from tackle shops with approximate coordinates of fishing
locations) as a guide to help you start searching” (Table 3.8). More than half of
fishers (66%, 21 fishers) disagreed that they would “use information available from
the internet to locate new fishing locations”. The majority agreed (84%, 26 fishers)
that they “often use depth contour and/or other inbuilt information in your GPS to
locate new fishing spots” (Table 3.8).
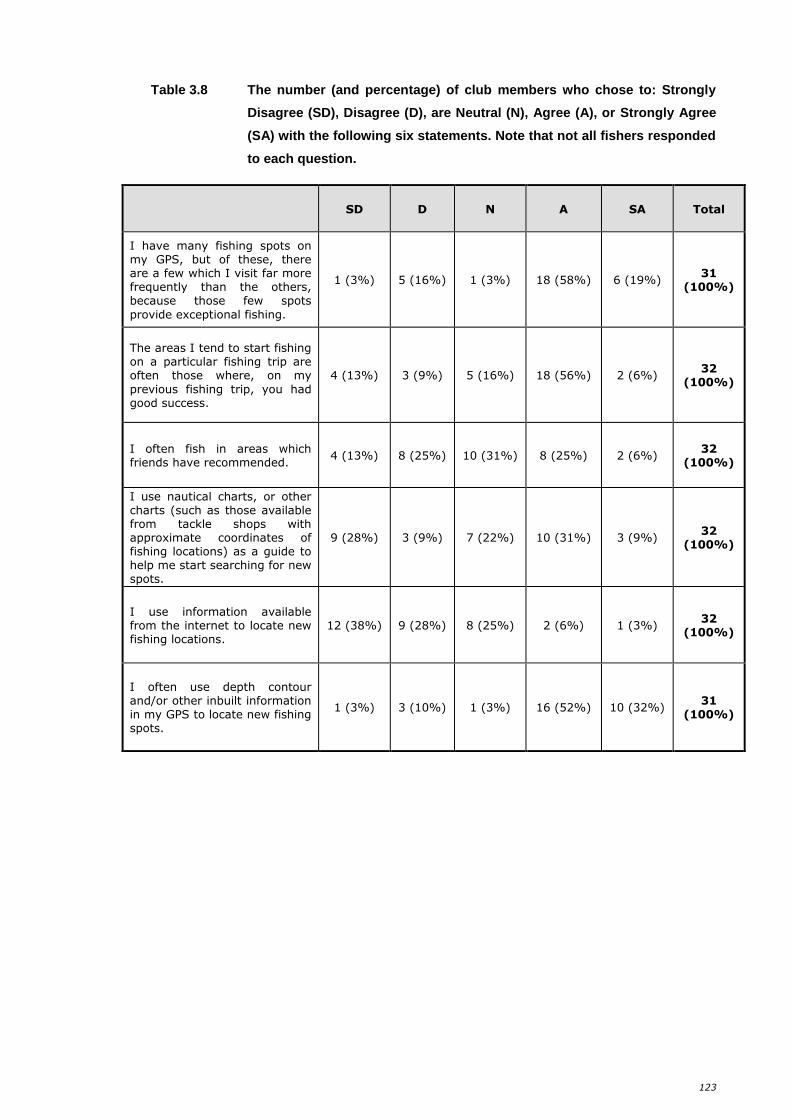
123
Table 3.8 The number (and percentage) of club members who chose to: Strongly
Disagree (SD), Disagree (D), are Neutral (N), Agree (A), or Strongly Agree
(SA) with the following six statements. Note that not all fishers responded
to each question.
SD D N A SA Total
I have many fishing spots on my GPS, but of these, there are a few which I visit far more frequently than the others, because those few spots
provide exceptional fishing.
1 (3%) 5 (16%) 1 (3%) 18 (58%) 6 (19%) 31
(100%)
The areas I tend to start fishing on a particular fishing trip are often those where, on my
previous fishing trip, you had good success.
4 (13%) 3 (9%) 5 (16%) 18 (56%) 2 (6%) 32
(100%)
I often fish in areas which friends have recommended.
4 (13%) 8 (25%) 10 (31%) 8 (25%) 2 (6%) 32
(100%)
I use nautical charts, or other charts (such as those available from tackle shops with approximate coordinates of fishing locations) as a guide to help me start searching for new spots.
9 (28%) 3 (9%) 7 (22%) 10 (31%) 3 (9%) 32
(100%)
I use information available from the internet to locate new fishing locations.
12 (38%) 9 (28%) 8 (25%) 2 (6%) 1 (3%) 32
(100%)
I often use depth contour and/or other inbuilt information in my GPS to locate new fishing spots.
1 (3%) 3 (10%) 1 (3%) 16 (52%) 10 (32%) 31
(100%)
124
3.3.5. Social interactions
The majority of club members reported that either 1-2 people (66%, 21 fishers) or
3-4 people (31%, 10 fishers) actively fished on the boat used during their last boat
fishing trip (Table 3.9). The minimum and maximum numbers reported by anglers
were 1 and 6 people, respectively.
Table 3.9 Number (and percentages) of club members reporting the different
numbers of fishers on-board the boats used by those members during
their last boat fishing trip.
1-2 3-4 5-6 7-9 > 10 Total
Frequency 21 10 1 0 0 32
Percent 66% 31% 3% 0% 0% 100%
3.3.6. West Australian dhufish specialisation
Catch
More than half (61%, 20 fishers) of club members responded that they ‘sometimes’
caught West Australian dhufish when they went boat fishing over the last
12 months. Only 9% (3 fishers) reported that they ‘never’ caught West Australian
dhufish on their fishing trips (Fig. 3.13).
In total, the surveyed anglers reported capturing 58 West Australian dhufish
on their last boat-based fishing trip, with an average of three (SE = 2.71) fish each.
However, 79% (46 fish) of these fish captures were subsequently reported to be
released by anglers. The percentage of club members who had caught West
Australian dhufish during their last trip, i.e. 70%, differed significantly (P < 0.001)
from and exceeded that reported by the avid recreational fishers in the phone
survey i.e. 9% (Chapter 2).
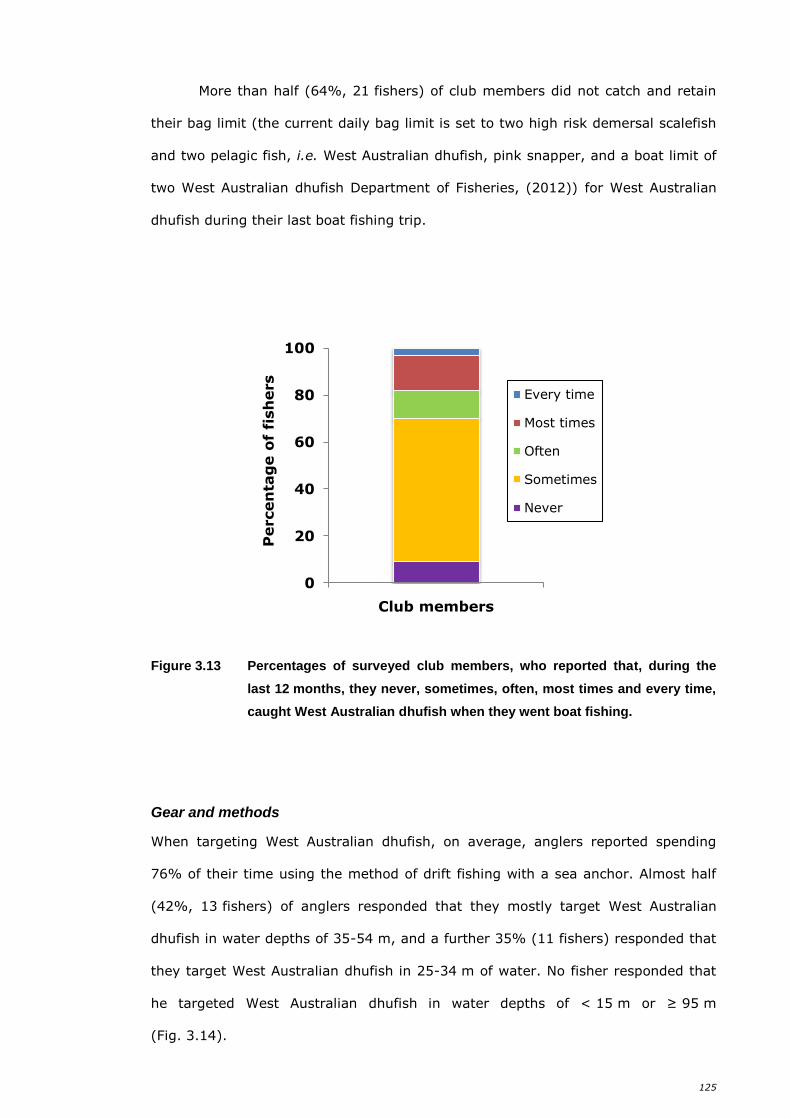
125
More than half (64%, 21 fishers) of club members did not catch and retain
their bag limit (the current daily bag limit is set to two high risk demersal scalefish
and two pelagic fish, i.e. West Australian dhufish, pink snapper, and a boat limit of
two West Australian dhufish Department of Fisheries, (2012)) for West Australian
dhufish during their last boat fishing trip.
Figure 3.13 Percentages of surveyed club members, who reported that, during the
last 12 months, they never, sometimes, often, most times and every time,
caught West Australian dhufish when they went boat fishing.
Gear and methods
When targeting West Australian dhufish, on average, anglers reported spending
76% of their time using the method of drift fishing with a sea anchor. Almost half
(42%, 13 fishers) of anglers responded that they mostly target West Australian
dhufish in water depths of 35-54 m, and a further 35% (11 fishers) responded that
they target West Australian dhufish in 25-34 m of water. No fisher responded that
he targeted West Australian dhufish in water depths of < 15 m or ≥ 95 m
(Fig. 3.14).
0
20
40
60
80
100
Percen
tag
e o
f fi
sh
ers
Club members
Every time
Most times
Often
Sometimes
Never
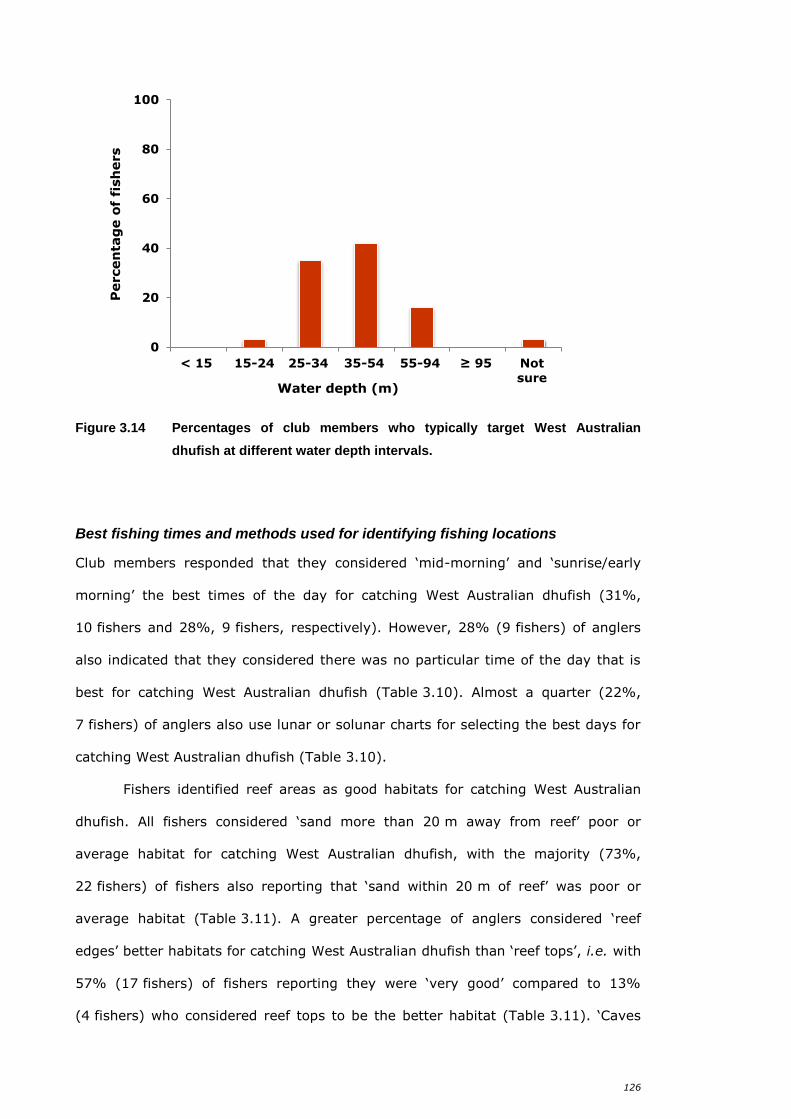
126
Figure 3.14 Percentages of club members who typically target West Australian
dhufish at different water depth intervals.
Best fishing times and methods used for identifying fishing locations
Club members responded that they considered ‘mid-morning’ and ‘sunrise/early
morning’ the best times of the day for catching West Australian dhufish (31%,
10 fishers and 28%, 9 fishers, respectively). However, 28% (9 fishers) of anglers
also indicated that they considered there was no particular time of the day that is
best for catching West Australian dhufish (Table 3.10). Almost a quarter (22%,
7 fishers) of anglers also use lunar or solunar charts for selecting the best days for
catching West Australian dhufish (Table 3.10).
Fishers identified reef areas as good habitats for catching West Australian
dhufish. All fishers considered ‘sand more than 20 m away from reef’ poor or
average habitat for catching West Australian dhufish, with the majority (73%,
22 fishers) of fishers also reporting that ‘sand within 20 m of reef’ was poor or
average habitat (Table 3.11). A greater percentage of anglers considered ‘reef
edges’ better habitats for catching West Australian dhufish than ‘reef tops’, i.e. with
57% (17 fishers) of fishers reporting they were ‘very good’ compared to 13%
(4 fishers) who considered reef tops to be the better habitat (Table 3.11). ‘Caves
0
20
40
60
80
100
< 15 15-24 25-34 35-54 55-94 ≥ 95 Notsure
Percen
tag
e o
f fi
sh
ers
Water depth (m)
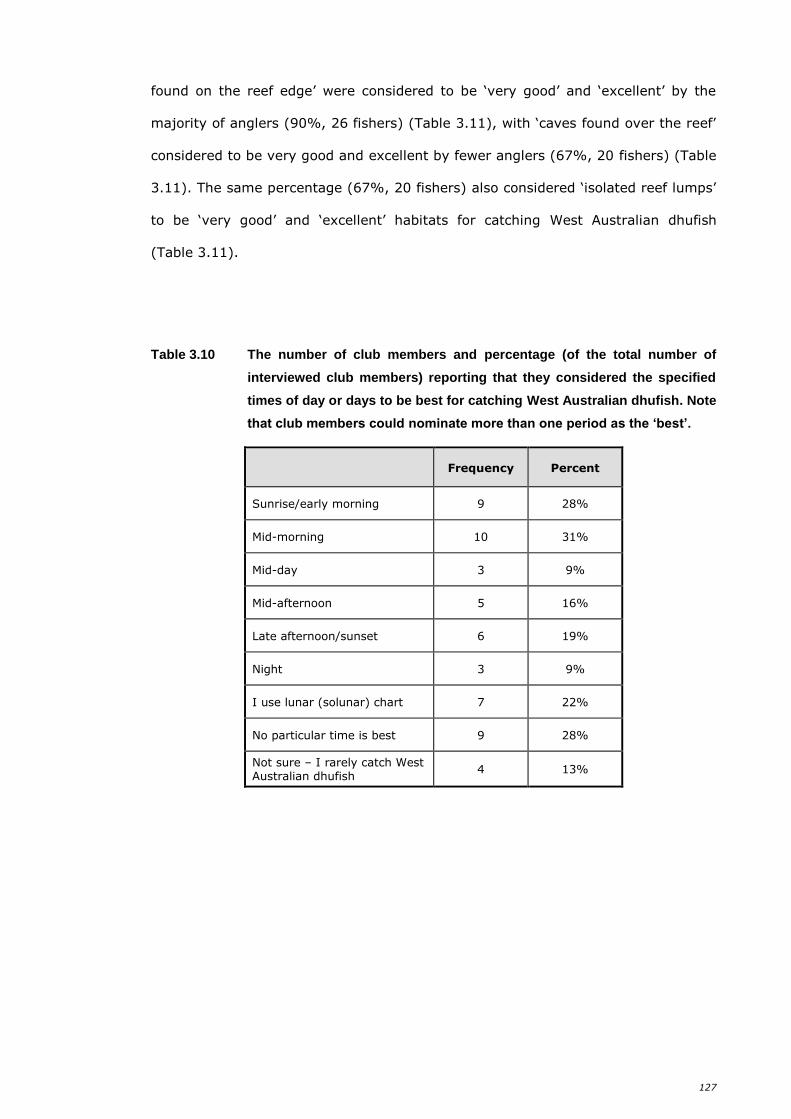
127
found on the reef edge’ were considered to be ‘very good’ and ‘excellent’ by the
majority of anglers (90%, 26 fishers) (Table 3.11), with ‘caves found over the reef’
considered to be very good and excellent by fewer anglers (67%, 20 fishers) (Table
3.11). The same percentage (67%, 20 fishers) also considered ‘isolated reef lumps’
to be ‘very good’ and ‘excellent’ habitats for catching West Australian dhufish
(Table 3.11).
Table 3.10 The number of club members and percentage (of the total number of
interviewed club members) reporting that they considered the specified
times of day or days to be best for catching West Australian dhufish. Note
that club members could nominate more than one period as the ‘best’.
Frequency Percent
Sunrise/early morning 9 28%
Mid-morning 10 31%
Mid-day 3 9%
Mid-afternoon 5 16%
Late afternoon/sunset 6 19%
Night 3 9%
I use lunar (solunar) chart 7 22%
No particular time is best 9 28%
Not sure – I rarely catch West Australian dhufish
4 13%
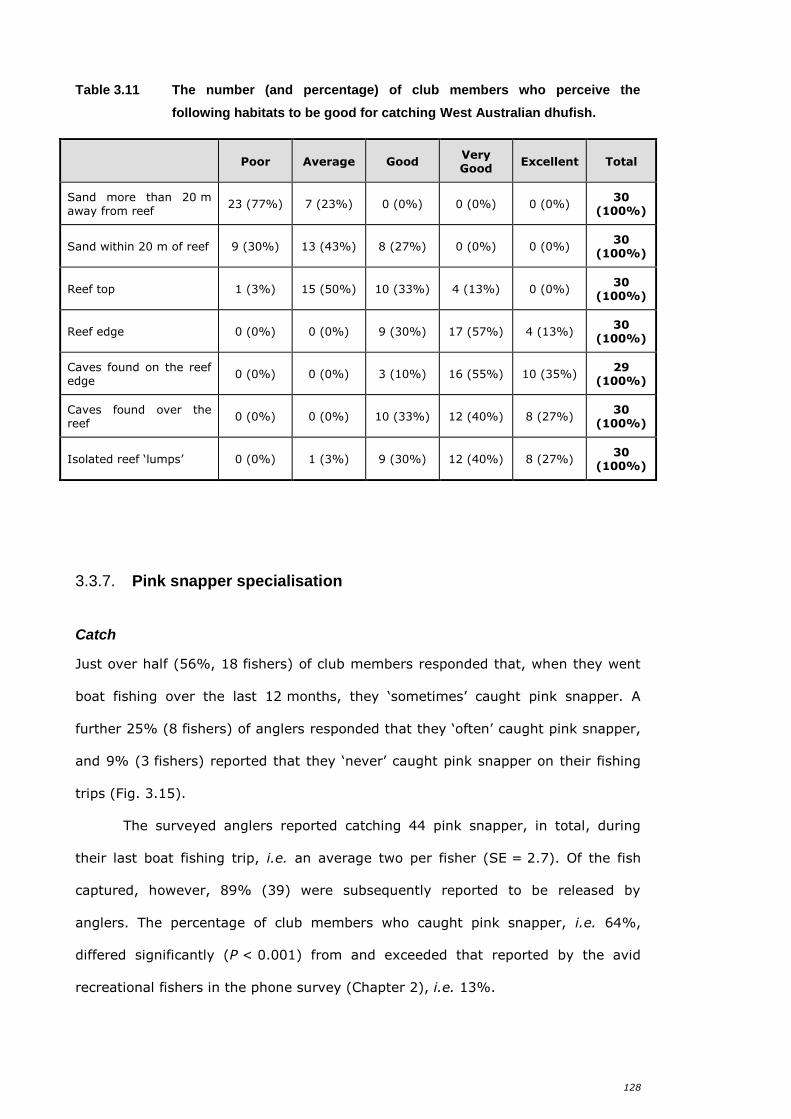
128
Table 3.11 The number (and percentage) of club members who perceive the
following habitats to be good for catching West Australian dhufish.
Poor Average Good Very Good
Excellent Total
Sand more than 20 m away from reef
23 (77%) 7 (23%) 0 (0%) 0 (0%) 0 (0%) 30
(100%)
Sand within 20 m of reef 9 (30%) 13 (43%) 8 (27%) 0 (0%) 0 (0%) 30
(100%)
Reef top 1 (3%) 15 (50%) 10 (33%) 4 (13%) 0 (0%) 30
(100%)
Reef edge 0 (0%) 0 (0%) 9 (30%) 17 (57%) 4 (13%) 30
(100%)
Caves found on the reef edge
0 (0%) 0 (0%) 3 (10%) 16 (55%) 10 (35%) 29
(100%)
Caves found over the reef
0 (0%) 0 (0%) 10 (33%) 12 (40%) 8 (27%) 30
(100%)
Isolated reef ‘lumps’ 0 (0%) 1 (3%) 9 (30%) 12 (40%) 8 (27%) 30
(100%)
3.3.7. Pink snapper specialisation
Catch
Just over half (56%, 18 fishers) of club members responded that, when they went
boat fishing over the last 12 months, they ‘sometimes’ caught pink snapper. A
further 25% (8 fishers) of anglers responded that they ‘often’ caught pink snapper,
and 9% (3 fishers) reported that they ‘never’ caught pink snapper on their fishing
trips (Fig. 3.15).
The surveyed anglers reported catching 44 pink snapper, in total, during
their last boat fishing trip, i.e. an average two per fisher (SE = 2.7). Of the fish
captured, however, 89% (39) were subsequently reported to be released by
anglers. The percentage of club members who caught pink snapper, i.e. 64%,
differed significantly (P < 0.001) from and exceeded that reported by the avid
recreational fishers in the phone survey (Chapter 2), i.e. 13%.
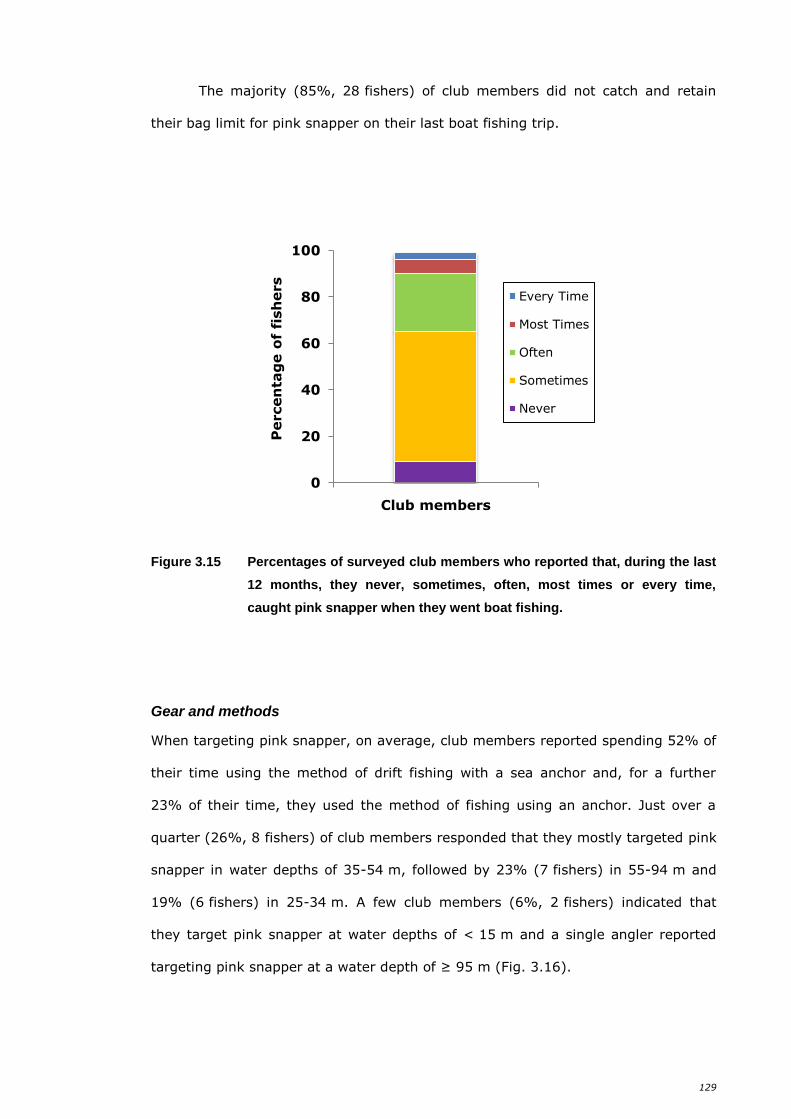
129
The majority (85%, 28 fishers) of club members did not catch and retain
their bag limit for pink snapper on their last boat fishing trip.
Figure 3.15 Percentages of surveyed club members who reported that, during the last
12 months, they never, sometimes, often, most times or every time,
caught pink snapper when they went boat fishing.
Gear and methods
When targeting pink snapper, on average, club members reported spending 52% of
their time using the method of drift fishing with a sea anchor and, for a further
23% of their time, they used the method of fishing using an anchor. Just over a
quarter (26%, 8 fishers) of club members responded that they mostly targeted pink
snapper in water depths of 35-54 m, followed by 23% (7 fishers) in 55-94 m and
19% (6 fishers) in 25-34 m. A few club members (6%, 2 fishers) indicated that
they target pink snapper at water depths of < 15 m and a single angler reported
targeting pink snapper at a water depth of ≥ 95 m (Fig. 3.16).
0
20
40
60
80
100
Percen
tag
e o
f fi
sh
ers
Club members
Every Time
Most Times
Often
Sometimes
Never
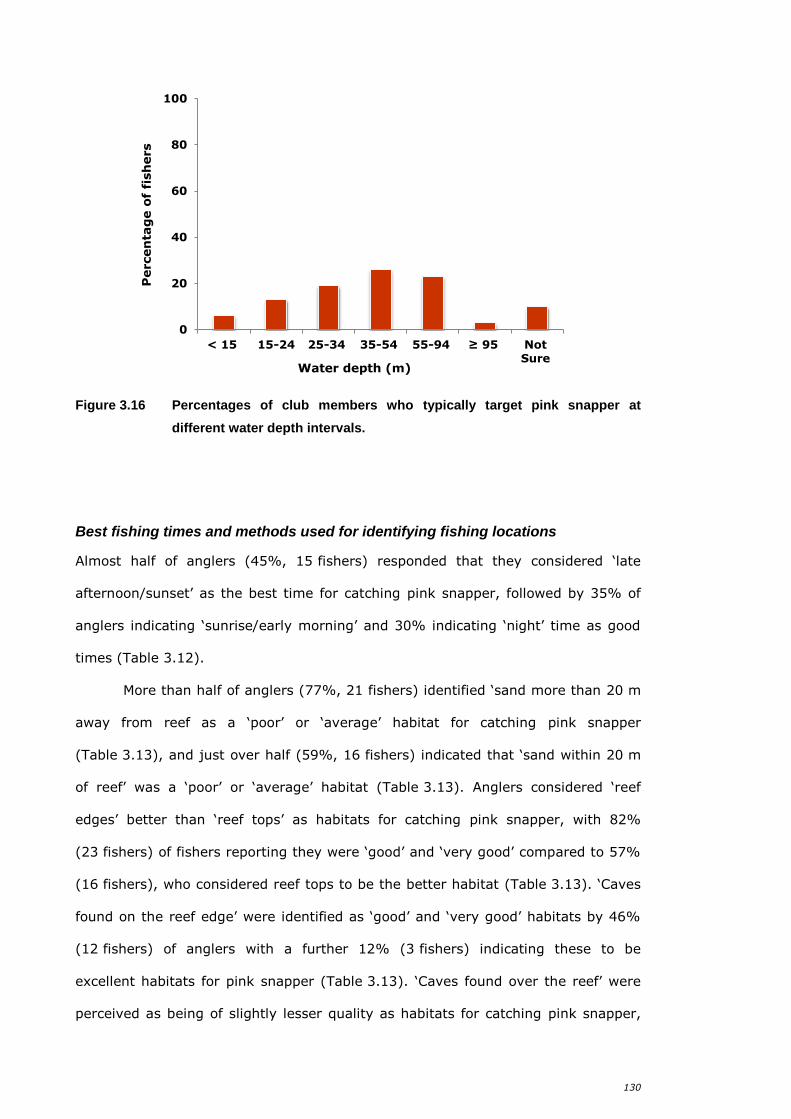
130
Figure 3.16 Percentages of club members who typically target pink snapper at
different water depth intervals.
Best fishing times and methods used for identifying fishing locations
Almost half of anglers (45%, 15 fishers) responded that they considered ‘late
afternoon/sunset’ as the best time for catching pink snapper, followed by 35% of
anglers indicating ‘sunrise/early morning’ and 30% indicating ‘night’ time as good
times (Table 3.12).
More than half of anglers (77%, 21 fishers) identified ‘sand more than 20 m
away from reef as a ‘poor’ or ‘average’ habitat for catching pink snapper
(Table 3.13), and just over half (59%, 16 fishers) indicated that ‘sand within 20 m
of reef’ was a ‘poor’ or ‘average’ habitat (Table 3.13). Anglers considered ‘reef
edges’ better than ‘reef tops’ as habitats for catching pink snapper, with 82%
(23 fishers) of fishers reporting they were ‘good’ and ‘very good’ compared to 57%
(16 fishers), who considered reef tops to be the better habitat (Table 3.13). ‘Caves
found on the reef edge’ were identified as ‘good’ and ‘very good’ habitats by 46%
(12 fishers) of anglers with a further 12% (3 fishers) indicating these to be
excellent habitats for pink snapper (Table 3.13). ‘Caves found over the reef’ were
perceived as being of slightly lesser quality as habitats for catching pink snapper,
0
20
40
60
80
100
< 15 15-24 25-34 35-54 55-94 ≥ 95 NotSure
Percen
tag
e o
f fi
sh
ers
Water depth (m)
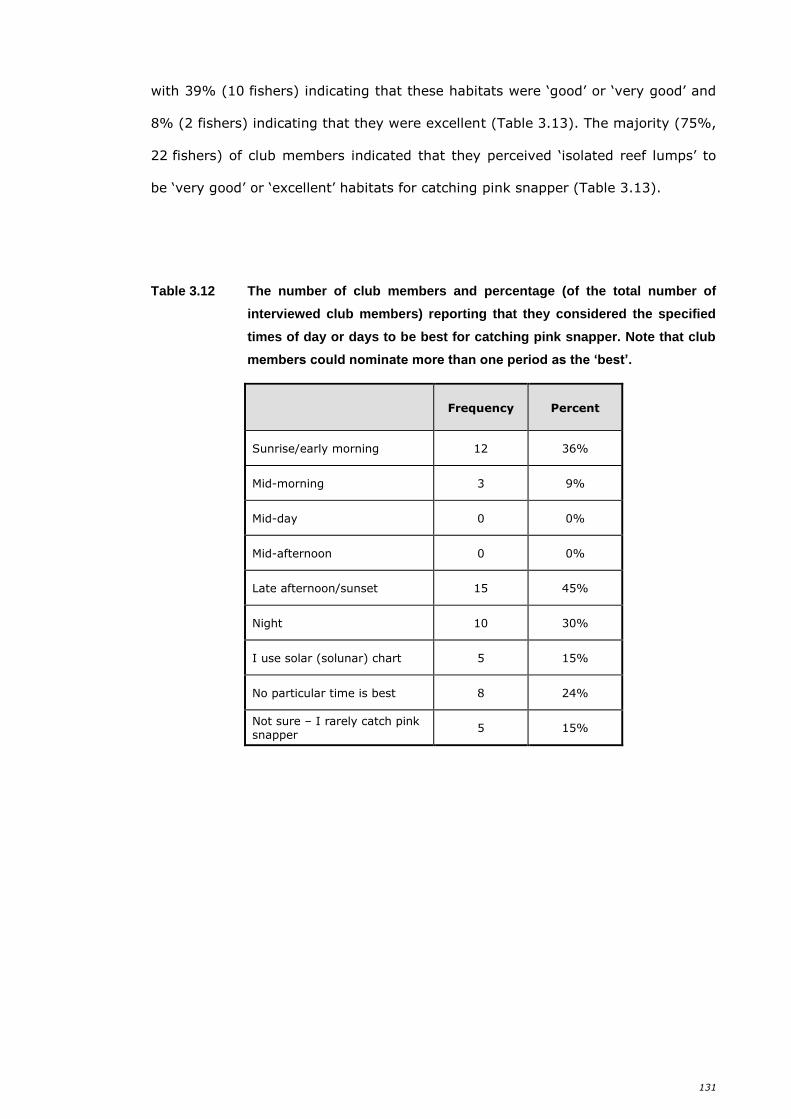
131
with 39% (10 fishers) indicating that these habitats were ‘good’ or ‘very good’ and
8% (2 fishers) indicating that they were excellent (Table 3.13). The majority (75%,
22 fishers) of club members indicated that they perceived ‘isolated reef lumps’ to
be ‘very good’ or ‘excellent’ habitats for catching pink snapper (Table 3.13).
Table 3.12 The number of club members and percentage (of the total number of
interviewed club members) reporting that they considered the specified
times of day or days to be best for catching pink snapper. Note that club
members could nominate more than one period as the ‘best’.
Frequency Percent
Sunrise/early morning 12 36%
Mid-morning 3 9%
Mid-day 0 0%
Mid-afternoon 0 0%
Late afternoon/sunset 15 45%
Night 10 30%
I use solar (solunar) chart 5 15%
No particular time is best 8 24%
Not sure – I rarely catch pink snapper
5 15%
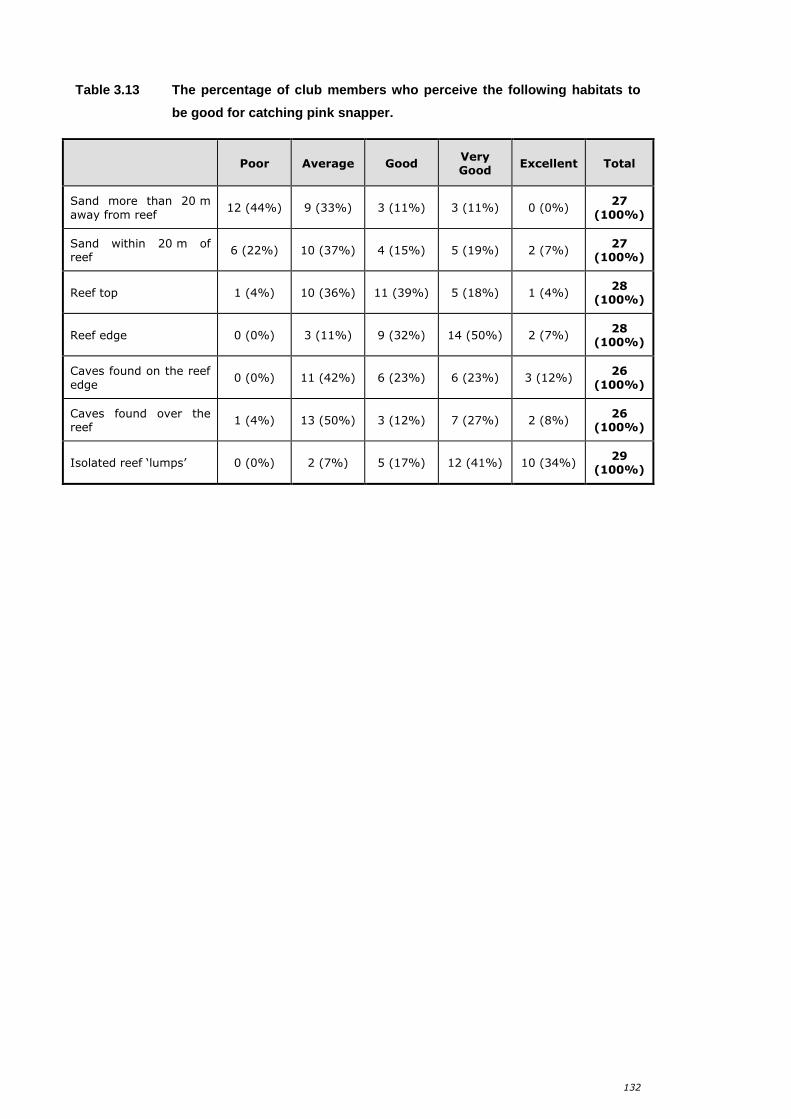
132
Table 3.13 The percentage of club members who perceive the following habitats to
be good for catching pink snapper.
Poor Average Good Very Good
Excellent Total
Sand more than 20 m
away from reef 12 (44%) 9 (33%) 3 (11%) 3 (11%) 0 (0%)
27
(100%)
Sand within 20 m of reef
6 (22%) 10 (37%) 4 (15%) 5 (19%) 2 (7%) 27
(100%)
Reef top 1 (4%) 10 (36%) 11 (39%) 5 (18%) 1 (4%) 28
(100%)
Reef edge 0 (0%) 3 (11%) 9 (32%) 14 (50%) 2 (7%) 28
(100%)
Caves found on the reef
edge 0 (0%) 11 (42%) 6 (23%) 6 (23%) 3 (12%)
26
(100%)
Caves found over the reef
1 (4%) 13 (50%) 3 (12%) 7 (27%) 2 (8%) 26
(100%)
Isolated reef ‘lumps’ 0 (0%) 2 (7%) 5 (17%) 12 (41%) 10 (34%) 29
(100%)
133
Discussion 3.4.
3.4.1. Survey participants
This survey was focussed on a relatively small group (n=33) of anglers from fishing
clubs, who often target certain large demersal species, such West Australian
dhufish and pink snapper. It is thus very likely that the sample data obtained is
biased towards highly-active (e.g. higher participation) and committed recreational
fishers. Therefore, the results obtained in this study are unlikely to be reflective of
the general population of anglers who target demersal species including West
Australian dhufish and pink snapper. It should be noted that angler responses may
have been influenced by the fact that some of the interviews were conducted (in
September 2009) prior to the introduction of the RFBL, in combination with a two-
month demersal scalefish fishery closure and reduced bag limit, and other
interviews were conducted after those changes (December 2010).
3.4.2. Characteristics of fishers who are members of angling clubs
General demographic information
The fact that all survey participants were male and aged predominantly between
45-59 y, with the majority also reporting that they had many years of fishing
experience in the study, is not surprising. Past surveys of fishing club members
elsewhere in the world have also reported a predominance of male anglers
(> 90%), with members often found to be older (average age 45 y) than non-
members (Gigliotti and Peyton, 1993; Schramm and Gerard, 2004; Zischke et al.,
2012). Zischke et al. (2012) proposes that male anglers are more likely to
participate in specialised fishing practices, as they tend to be either more
experienced or fish more frequently. It might be postulated that older males have a
greater income or accumulated wealth than younger males, and are thus more
likely to be able to afford the expensive equipment and large boats required to
travel further distances and catch West Australian dhufish.
134
As hypothesised, it was found that highly avid anglers (i.e. anglers who
fished more than 20 days in the last 12 months) were more likely than the general
population of boat fishers to be members of fishing clubs. These results are also
consistent with a number of other studies (e.g. Gigliotti and Peyton, 1993; Fisher,
1997; Gartside et al., 1999). However, it was also noteworthy that only about half
of the club respondents were classified as avid anglers (fished more than 15 days
over the last 12 months). Thus, clearly, not all club members are avid fishers,
which indicates that there would be a range of other motivations for surveyed
members to have become angling club members. Further, it is noted that the
number of fishing days undertaken by anglers may have also been influenced by
the amount and timing of fishing competitions held within the different angling
clubs. It should also be recognised that the sample of fishers used in this survey
was not selected based on probability, but more in an opportunistic nature and thus
may not be representative (of all club members), however, their behaviour can be
seen as informative, especially for avid and experienced fishers targeting demersal
fish.
In contrast to the results of the current study, Arlinghaus and Mehner
(2003) discovered that, compared with the general angler population, specialised
(carp) anglers in their survey tended to be younger and less experienced. These
differences could possibly be related to the fact that, as carp is a freshwater
species, the larger investment in gear, e.g. a boat capable of fishing in offshore
marine waters for West Australian dhufish, is not required by specialised carp
anglers (García-Berthou, 2001; Penne and Pierce, 2008). It is also possible that
fishing for carp may appeal more to younger fishers because this is a species that is
known to be inherently difficult to catch using fly fishing methods, the most written
about fishing technique (Bryan, 1977), thereby providing these fishers a
competitive ‘sport-fishing’ opportunity. It is also important to note that according to
specialisation theory, there are different types of specialist fishers, i.e. technique
specialists that specialise in a particular method of fishing, technique-setting
specialists who have distinct preferences in methods and water types (physical
135
setting) and also species specialists who target a particular fish species whilst
angling (Bryan, 1977; Ditton et al., 1992; Fisher, 1997; Salz and Loomis, 2005). It
is likely that the fishers described in the study by Arlinghaus and Mehner (2003)
are “species specialists”. Furthermore, the characteristics and behaviours of
specialist anglers, who target a particular species of fish, are likely to differ from
those of a specialist angler with a different set of activity-specific elements, i.e. a
fisher who targets a different species of fish, and among species specialists in
different areas and regions (Graefe, 1980; Fisher, 1997; Salz and Loomis, 2005).
Many of the club members who participated in the survey were from the
northern coastal suburbs of the Perth Metropolitan Region. This, however, is most
probably due to the fact that the three angling clubs visited (Marmion, Quinns Rock
and Ocean Reef) are situated in those northern suburbs.
The demographic characteristics of the angling club members were very
similar to those of the fishers who participated in the phone survey (Chapter 2).
Note, however, that some of the recreational fishers surveyed in Chapter 2 could
have also been affiliated with angling clubs within the region, and it was not
possible to confirm whether this was the case with any of these fishers from the
RFBL database as they were not questioned as to whether they were members of a
fishing club or organisation.
Catch preference
The results of this survey showed that the majority of responding club members
reported that they mainly aimed to catch a ‘mix’ of fish species including West
Australian dhufish or pink snapper. However, a percentage of fishers reported West
Australian dhufish as their main target fish species. In contrast, participants in the
phone survey (see Chapter 2) were more generalist fishers, mainly aiming to catch
a fish species ‘other’ than West Australian dhufish or pink snapper, instead choosing
to target more inshore ‘bread and butter’ species, i.e. whiting, herring, crabs and
squid. Moreover, the results suggest that the responding club members were
almost twice as likely to target West Australian dhufish or pink snapper as boat-
136
based avid anglers selected randomly from the recreational fishing boat licence
database. Therefore, understanding the characteristics of these specialised and
more committed anglers is likely to be essential for the sustainable management of
fish species such as West Australian dhufish and pink snapper, but less so for many
other species, i.e. easy to catch ‘bread and butter’ fish, which are probably caught
in greater numbers by generalist and often less avid fishers. Also, note that the
timing of the phone survey (Chapter 2) and angling clubs survey were different
(between 16 August 2011 and 19 September 2011 and during September 2009 and
December 2010, respectively) and thus may have influenced the responses
received from recreational fishers.
Gear and methods
As hypothesised, fishing club members were more likely to own a global positioning
system (GPS) than avid anglers in the phone survey (Chapter 2). The results are
thus also consistent with specialisation theory, which suggests that high monetary
investment in fishing equipment and use of technology is associated with highly
specialised and committed anglers (Wilde et al., 1998; Hutt and Bettoli, 2007).
Such results could also be related to the fact that key target species (e.g. West
Australian dhufish and pink snapper) are often found offshore, near rocky reefs
(Wise et al., 2007; Lenanton et al., 2009), thus it is expected that such fishing gear
would be required to target them.
The results from the survey also confirmed the hypothesis that club members
made greater use of fishing technologies than the population of boat fishers
surveyed in Chapter 2. Thus, club fishers typically had more fishing locations, and a
larger percentage of ‘good’ locations, stored in their GPS compared to avid fishers
from the phone survey (Chapter 2). The results also showed that whilst fishers tend
to visit their stored GPS locations regularly, club members were less likely to start a
new fishing trip at a location where, during their previous fishing trip, they had
experienced good catches. Thus, club members are more likely to distribute their
fishing activities over a broader range of fishing locations and, rather than basing
137
their choice of fishing location on recent experience, are more likely to explore the
potential of obtaining good catches at other known fishing locations. That is, they
are more willing to apply their broader knowledge of fishing locations stored in their
GPS equipment. Overall, the results highlight the potential for a wider spread of
fishing effort by club members. This storage of large numbers of fishing locations is
also potentially a way of club members ‘hedging their bets’, i.e. as during/between
fishing trips, they can move among a large number of alternative fishing locations
and thereby potentially be rewarded with a good catch at one of those locations.
Club members considered reef habitats best for catching both West Australian
dhufish and pink snapper. “Caves found on the reef edge” and “reef edges” were
considered better for catching West Australian dhufish and pink snapper,
respectively. When club members were asked how skilled they were at identifying
different types of habitats using an echo sounder, they identified themselves as
possessing a level of skill that was just 5 out of a possible 10 when identifying ‘non-
reef’ habitat, and were only slightly more skilled at identifying ‘reef edge’s and ‘reef
tops’. Considering that the majority of anglers also indicated that they use depth
contour and inbuilt information in their GPS to locate new fishing locations, the low
ratings in their skill at identifying habitat types was, perhaps, surprising. However,
this question does not account for the fact that club members were shown to use a
range of methods for locating new fishing locations, such as nautical charts and
maps, which almost half of club members responded that they are likely to use.
Thus, the use of a combination of technologies and methods may, overall, result in
these club members being highly knowledgeable and skilled at identifying the “reef
edge” and “reef top” habitats that they consider to be good habitats for West
Australian dhufish and pink snapper. In a creel survey in the same region (West
Coast Bioregion) with the main species being targeted were West Australia dhufish
by Sumner and Williamson (1999), recreational boat-based fishers had also
adopted modern technology to increase the efficiency of their fishing activity with
36% of boats fitted with an echo-sounder and 12% using a global positioning
system to find fishing locations.
138
In a 12-month survey during 2005/06 of recreational boat-based fishing in
the West Coast Bioregion of Western Australia, the majority of boats reported
undertaking ocean line fishing, with effort also reported to be higher in the more
populated areas such as the Perth Metropolitan Region (Sumner et al., 2008).
Further, Henry and Lyle (2003) also reported a preference for use of line fishing
(bait, lure, jig, fly, setline) methods by fishers across all States and Territories in
the national Australian recreational fishing survey. Thus, the finding from the phone
and club surveys that fishers mostly used line fishing, which includes the use of
handlines, rod and line or, lines with snapper or mechanical winches, for the vast
majority of their fishing time, was not unexpected.
Fishing behaviours, including movements
The fishing times reported by club members, may in part reflect, to some extent,
participation in club competitions although such speculation cannot be supported by
the available data. If this was the case, however, it is pertinent to note that
Gartside et al. (1999) reported that the actual time fished by anglers is usually less
than the total time of the competition, with many anglers taking advantage of the
tides and time of day which are considered favourable rather than fishing for the
full duration of the competition. Furthermore, Zischke et al. (2012) reported that
club members expended a higher percentage of fishing effort and used more
specialised angling methods whilst fishing, with fishing trips of ~5 h in duration,
which was also found to be significantly longer compared to non-fishing club
members in a specialised sport fishery off eastern Australia. Thus, it is not
surprising that just over half of club members spent between 5-6 h actively fishing
on their last boat fishing trip, with anglers predominantly fishing during the
morning period, i.e. sunrise, early morning through to mid–day, possibly avoiding
the local afternoon sea breeze and returning for afternoon club competition weigh-
ins. Monthly club competitions are also predominantly run on the weekends
possibly reflecting the results that three-quarters of club members stated that they
mostly fished on weekends when they had gone boat fishing. Unfortunately, these
139
fishing behaviours of club members were unable to be compared with those of avid
fishers in the phone survey (Chapter 2) due to differences in survey and question
design.
As there was no significant difference between the proportions of club
members vs avid fishers from the phone survey (Chapter 2) who travelled more
than 20 km offshore to their first fishing location on their last boat fishing trip, this
result did not lend support to the hypothesis that anglers who are fishing club
members tend to travel further offshore to fishing locations. However, conversely,
the results did show that club fishers are more likely to travel further offshore in
more varied weather conditions (i.e. stronger winds and greater swells), suggesting
that the club fishers are more motivated than non-club fishers in catching offshore
demersal scalefish species such as dhufish and snapper. Note that travel and
weather are also likely to be influenced as much by boat size as avidity, with this
finding also reflected by the fact that the club members typically own larger boats,
which would enable them to travel further offshore in more varied weather
conditions, i.e. the above highlights their higher monetary and psychological
investments in fishing than less specialised fishers (Salz and Loomis, 2005; Dorow
et al, 2009). In the Perth Metropolitan Region, the reliable afternoon sea breeze,
commonly referred to as the ‘Fremantle Doctor’, is an important factor likely to
influence whether a fisher would decide to start a boat-based fishing trip earlier in
the day or cease boat fishing. Thus, the finding in the survey that more than half of
anglers would start a fishing trip earlier in the day if a 20-30 knot sea breeze was
forecasted was not unexpected. The afternoon sea breeze may also be a
contributing factor for all club members reporting fishing predominantly during the
morning (see above) and also is likely to impact on fishing trip times reported in
the Perth Metropolitan Region. It may also be noteworthy that that fish in deeper
waters are generally less accessible and therefore potentially more protected from
fishing.
Similar responses were reported for the phone survey (Chapter 2) and the
club member questionnaire in regard to the number of anglers present on the boat
140
on the angler’s last boat fishing trip, with results suggesting usually 1-2 or 3-4
people were present and actively fishing. Further, although no questions relating to
fisher motivations for fishing were asked in the club survey, these results (several
anglers aboard) still potentially highlight the importance of non-catch motives for
club members (e.g. to be with family and friends and/or safety reasons) as
potentially important reasons as to why multiple people tend to go boat fishing
together.
The hypothesis that club members were more likely to move from a fishing
location sooner than avid anglers from the phone survey (Chapter 2) when not
receiving any ‘good’ bites from fish was supported by the results of this study. The
results are also consistent with the view that more committed and specialised
fishers display ‘context-specific primary motivations’, i.e. they are strongly focussed
on the catching aspects of fishing (Beardmore et al., 2011). Such movements by
club fishers may also potentially be influenced by time limits for fishing
competitions, encouraging fishers to more rapidly move-on from poor fishing
locations to increase their likelihood of a good catch. Further, the results from the
study also showed that club members are likely to cover more fishing ground in a
single fishing trip (e.g. fish at more fishing locations) by moving on sooner from
‘poor’ fishing locations. Such movements from locations at which fishers are having
low success in catching their target species to locations that potentially have a
greater abundance of individuals of those species are likely to contribute to better
fishing success (Hilborn, 1985; Sampson, 1991), particularly in catching species
like West Australian dhufish because the movements of this demersal fish species
are known to be more restricted (Hesp et al., 2002; St John and Syers, 2005) than
those of many other species, e.g. pelagic ‘bread and butter’ species (Hyndes et al.,
1997; Fairclough et al., 2000a; 200b). Thus, a fisher might not expect a West
Australian dhufish to move to their fishing location, whereas for ‘bread and butter’
species, this might not be the case (particularly if a fisher uses fish attractants,
etc.).
141
West Australian dhufish
West Australian dhufish have experienced periods of overfishing in recent years and
poor recruitment years within the WCB, thus leading to the introduction of recent
management changes and development of strategies to allow for stock recovery
(Wise et al., 2007; Department of Fisheries, 2013). These potentially low
population levels, may in part explain the results of more than half of club members
only ‘sometimes’ being successful in catching West Australian dhufish when they
went boat fishing over the last 12 months. However, in total, club members
reported having caught a substantial number (58) of West Australian dhufish and
averaging three dhufish each on their last fishing trip, although many of these
captured fish were subsequently released due to various reasons (unreported). The
fact that many fish were released may also be related to the poor recruitment years
mentioned above, with fishers catching many juvenile fish (Wise et al., 2007).
Thus, it is not surprising that more than half of the club members did not catch and
retain their bag limit for West Australian dhufish on their last boat fishing trip.
Notably, the average number of West Australian dhufish caught by each club
member was approximately three times greater than that caught by each of the
avid recreational fishers in the phone survey (Chapter 2).
The survey also showed that club members preferred the method of drift
fishing with a sea anchor whilst targeting West Australian dhufish, thereby enabling
those anglers to potentially cover larger fishing areas and at several water depths
when targeting fish. Furthermore, club members reported not utilising reef anchors,
thus potentially causing fewer impacts on reef systems and the surrounding
environment.
The findings of the survey that club members mostly targeted West
Australian dhufish in waters offshore waters of 35-54 m or 25-34 m is to be
expected as dhufish are known to be an offshore demersal reef fish (St John and
Syers, 2005; Hesp et al., 2002) with past studies also stating that fisherman are
now often fishing further offshore to obtain catches of dhufish comparable with
142
those they had previously been able to obtain from nearer to the coast (Hesp et al.,
2002).
Club anglers reported that they considered the early parts of the day “mid-
morning” and “sunrise/early morning” as the best times for catching West
Australian dhufish with almost a quarter of club members also reported using lunar
or solunar charts as important tools for selecting times and days best for catching
West Australian dhufish. As mentioned above, anglers identified reef areas as good
habitats for catching West Australian dhufish, with “caves found on the reef edge”
considered the best habitat by the majority of anglers. “Caves found over the reef”
and “isolated reef lumps” were also highly rated as good habitats perceived for
catching West Australian dhufish. As specialised anglers often possess a good
knowledge of fish habitats, future surveys could potentially benefit from capturing
such information by incorporating questions similar to those used in the current
study. The potential for fisherman to assist and improve fisheries management by
sharing their local knowledge in regards to the ecology, behaviour and abundance
of fish and other aquatic animals in an area has been noted in the fisheries
literature (Silvano and Valbo-Jørgensen, 2008). Sumner and Williamson (1999), for
example, noted that anglers had adopted modern technology to catch West
Australian dhufish, with a high percentage of boats having a GPS and black and
white or colour echo-sounder to locate habitats likely to harbour this species.
Pink snapper
Lenanton et al. (2009) reported that in the Perth Metropolitan Region West
Australian dhufish are the primary target species, whereas near Geraldton (400 km
north of Perth) dhufish and pink snapper form part of a suite of prize species.
The high discard rates (32-48%) associated with the boat-based recreational
fishing catch of pink snapper recorded in this study are consistent with those
reported previously (Wise et al., 2007). As it has also been noted that very few
fishers achieve the daily bag limits specified for demersal scalefish species under
present state wide recreational fishing regulations (Sumner and Williamson, 1999),
143
it is also not surprising that most club members did not catch and retain their bag
limit for pink snapper on their last boat fishing trip. Notably, the average number of
pink snapper caught by each club member was also approximately three times
greater than that of avid recreational fisher in the phone survey (Chapter 2).
Henry and Lyle (2003) reported that pink snapper throughout Australia were
taken almost exclusively by the method of line fishing, with boat-based fishing
accounting for the vast majority (95%) of the recreational harvest in Australia. The
results of this study suggest that just over half of club members preferred the
method, when line fishing, of “drift fishing with a sea anchor” in deeper waters
when targeting pink snapper.
Mixed responses were also reported from the survey for the best times of
day for catching pink snapper, with almost half of anglers (45%) considering “late
afternoon/sunset” as the best time, followed by 35% of anglers indicating
“sunrise/early morning” and 30% indicating “night” time as a good time. These
results are very different from those considered by anglers to be the best times for
catching West Australian dhufish. As many anglers indicate the later afternoon or
night time period best for catching pink snapper, this may explain the lower catches
obtained for pink snapper considering all club members reported going fishing in
the morning. Anglers indicated that reef habitats were good for catching pink
snapper with the majority indicating that they perceived “isolated reef lumps” to be
the best habitats for catching pink snapper. Club members also identified Cockburn
Sound, a large sandy marine embayment, as great habitat for catching pink
snapper. Catches of this species in that embayment are notably seasonal, with pink
snapper known to form large spawning aggregations in early spring each year in
this area (Wise et al., 2007).

144
145
4. Exploring angler behaviour in a simulated multi-
species fishery
This study is an extension of earlier work undertaken for a Fisheries Research and
Development Corporation (FRDC) study, in which I was involved (Project 2008/033;
Hesp et al., 2010). Although the computer code for the agent-based model used in
this study was implemented by my supervisors, I played an important role in the
FRDC study. During the model development phase, I helped test the software by
running preliminary simulations and providing feedback to the programmers. I also
undertook the tasks, for the FRDC study, of running model simulations for the
various scenarios considered by that study, compiling the results, and further
assisting in producing the report.
Following the completion of the FRDC study, I collaborated with my
supervisors to refine and extend the model, and had a major role in running the
simulations and in analysing and interpreting the outputs of those simulations.
Several modifications (the results of which are reported in this Chapter) were made
that dramatically improved the model’s “behaviour and realism”. One important
enhancement made after the FRDC study was to allow fisher-agents to modify their
perceptions regarding the quality of known fishing locations following fishing
experiences. This modification substantially impacted the behaviour of the model,
producing results that lend support to the view that this aspect of fisher behaviour
is important in enabling successful fishers to maintain good catch rates. The main
focus of this study differs from the previous FRDC study. Whilst the previous study
had a focus on understanding implications of recruitment variability in fish, this
study has provided a more detailed exploration of the implications of certain fisher
behaviours and how these may influence catch rates, fish population abundance,
and the effectiveness of fisheries management (in a multi-species fishery).

146
147
Introduction 4.1.
In recent years, it has been realised that fisheries management is as much a
‘people management’ issue as it is a biological and economic one (Clay and
McGoodwin, 1995; Arlinghaus, 2005). Although most research has been directed
towards the latter, an understanding of fisher behaviours is becoming increasingly
important in the ongoing pursuit of sustainable fisheries (Charles, 1995; Weithman,
1999; Little, 2004; Hunt et al., 2011). There are many aspects of fisher behaviour,
such as where and how anglers allocate their effort and how they alter their
behaviours in response to changes in management regulations. An understanding
of such behavioural response is crucial in the determination of appropriate
management strategies (Sampson, 1994; Mathiesen, 2003; Little et al., 2004;
Branch et al., 2006; Metcalf et al., 2010).
Many methods have been used to gain an understanding of fishers’
behaviours and their implications for fisheries management. These methods, which
have mostly been applied to commercial fisheries, include empirical studies (e.g.
Hilborn and Ledbetter, 1979), and use of dynamic programming models (e.g.
Babcock and Pikitch, 2000), random utility models (RUM) (e.g. Eales and Wilen,
1986; Wilen et al., 2002; Hutton et al., 2004), learning models (e.g. Xiao, 2004;
Moustakes et al., 2006), qualitative modelling (e.g. Metcalf et al., 2010) and
individual or agent based models (Dreyfus-Leon, 1999; Little et al., 2004; BenDor
et al., 2009; Bastardie et al., 2010; Cabral et al., 2010; Gao and Hailu, 2010;
2011; 2012; 2013). The last of these types of methods provides an alternative to
traditional modelling approaches such as those based on differential equations (Van
Dyke Parunak et al., 1998). As agent based models (ABMs) constitute a ‘bottom-up’
approach to modelling, they are often used for investigating the emergence of
system-level properties resulting from the behaviours and interactions of ‘agents’
(i.e. individuals) with each other and their environment (Lomnicki, 1992; Grimm,
1999; Breckling et al., 2006). In contrast, more traditional modelling techniques,
i.e. state variable models, differential and difference equations and classical
mathematical models such as logistic models of population growth, describe the
148
(mean) dynamics of a pool of individuals, such as a population (Huston et al.,
1988; Uchmański and Grimm, 1996; Van Dyke Parunak et al., 1998; Grimm, 1999;
DeAngelis and Mooij, 2005; Breckling et al., 2006). By aggregating and averaging
critical system variables over space and time, however, traditional models ignore
variation among entities at the base of the system (Van Dyke Parunak et al.,
1998).
Whilst fishing, anglers continually make decisions in regards to which
species they wish to target, where and how long to fish, and modify their
behaviours and movements accordingly. These decisions, however, are ultimately
influenced by a suite of factors including regulations, technology, weather, and
expectations about costs of fishing, and abundances of fish (Sampson, 1991; 1994;
Wilen et al., 2002). Thus, with fisheries managers becoming increasingly aware of
the growing impacts of recreational fishing (e.g. McPhee et al., 2002; Cooke and
Cowx, 2004; Granek et al., 2008; Gao and Hailu, 2010), modelling of these types
of behaviours of recreational fishers represents an area where research is needed,
as such behaviours are likely to influence the effectiveness of the management
measures that are introduced. It is also important to recognise that, in many
fisheries, only a minority of anglers, i.e. those who are the most avid and
specialised, catch the majority of fish (Hilborn, 1985; Baccante, 1995; Henry and
Lyle, 2003; Dorow et al., 2010; Johnston et al., 2010). As such, it is the behaviours
of these ‘avid’ anglers that may be particularly important to understand.
The west coast demersal scale fishery resource includes highly sought-after
marine fish species such as the West Australian dhufish (Glaucosoma hebraicum)
and pink snapper (Chrysophrys auratus) (Wise et al., 2007; Lenanton et al., 2009;
Crowe et al., 2013; Ryan et al., 2013). In the recent past, the recreational fishery
experienced high exploitation rates, which led to the introduction of a range of
measures to provide increased protection to the stocks of these species, including
more stringent bag and size limits, and the implementation of spatial and temporal
closures (Lenanton et al., 2009; Department of Fisheries, 2012). In fisheries such
as the West Coast Demersal Fishery, it is crucial to account for their multi-species
149
nature when considering alternative management measures (Fowler, 1999;
Lenanton et al., 2009), such as those aimed at ensuring the sustainability of fish
stocks, facilitating commercial fishers in maximising their profits, and/or
maintaining high quality fishing experiences for recreational fishers. For example,
for management to be effective, it is important to understand how recreational
anglers are likely to respond to any new management measures (Fisher, 1997; Aas
et al., 2000; Salz and Loomis, 2005; Branch et al., 2006).
The overall aim of this study was to use an agent-based model to explore
the implications of the fish-targeting behaviours of avid recreational boat fishers
who target these two species. The model was constructed assuming that avid
recreational fishers alter certain behaviours, e.g. the rate at which they move
between fishing locations and search for new fishing locations depending on their
level of fishing success, based on the bite rates that they experience (as a proxy for
the fishers’ perceptions of fish abundance). Model simulations were thus
undertaken to explore the extent to which those behaviours may enable fishers to
maintain their catches, and assess how such behaviours might impact on several
species within a multi-species fishery with an existing management regime. More
specifically, the study focussed on exploring the following hypotheses:
1. As the abundance of a (simulated) key target species decreases, avid
fishers are able to maintain a similar catch rate of that species by (i)
moving more often between fishing locations, and spending more time
during a fishing trip searching and fishing at new fishing locations, and
(ii) updating their perceptions of the quality of known fishing locations
following each fishing experience, and replacing ‘poorer’ locations in their
‘knowledge bank’ with newly-found locations at which they have
experienced ‘good’ catch rates.
2. The catches of a (simulated) key target species will increase with
increased fish abundance but, at high levels of abundance, the catches
are constrained through management regulations (i.e. boat limits).

150
3. The behaviours of fishers in response to the abundance of one
(simulated) key target fish species affect catches and thus abundances of
other fish species.
151
Methods 4.2.
The description of the model broadly follows the ‘Overview, Design concepts and
Details’ protocol (ODD), which was first proposed by Grimm et al. (2006) and then
later updated by Grimm et al. (2010), for describing individual-based models or
agent-based models, such as that used in this study.
4.2.1. Software platform
The model developed during this study was constructed in Visual Basic.Net (version
3.5 SP1) within Microsoft Visual Studio 2008 (version 9.0.2122.8 RTM) (Microsoft,
2007). The data used by the model are read in from text (.txt) files.
4.2.2. Purpose
The model is designed to explore the behaviours of avid recreational anglers and
how certain behaviours can influence catch rates in a demersal finfish fishery. It
can also be used to explore how fishers are likely to respond to changes in certain
recreational fishing regulations, i.e. a minimum legal length (MLL) for capture and
retention, and an allowable daily boat limit for retained catches, and the possible
implications of such responses for the sustainability of the fishery.
4.2.3. State variables and scales
The model consists of two interacting types of agents; fish of different species
(West Australian dhufish, pink snapper and a third, ‘generic’ species of lower
trophic level and less attractiveness to fishers, which has been labelled the ‘red
herring’ and the biological characteristics of which were broadly based on those of
the silver trevally, Pseudocaranx georgianus), and boat-based, recreational fishers.
Note that the latter agent, i.e. the ‘fisher’, is assumed to represent (collectively) the
specialised boat-based angler or anglers fishing from a single boat, where, in the
case of multiple fishers within the boat, the behaviour of those fishers is assumed
to be identical to that of an individual specialised boat-based angler and the
probability of capturing a fish is assumed to be independent of the number of
anglers within a boat. This assumption avoids the need to consider issues relating
152
to shared decision-making and group behaviours of fishing parties, which would
have introduced complexity inappropriate for inclusion within the current study. The
agents interact within a simulated (artificial) marine, reef landscape for a specified
time period (default value = 1 y). Each fish agent represents a single fish belonging
to one of the three species, whilst each fisher agent, i.e. ‘fisher’, represents the
angler(s) within a boat. The state variables characterising each fish are a unique
integer identifying the fish, integer codes associated with the species and sex of
that individual, a value containing details of the age of the fish, and details of the
grid cell in which the fish is located. Each fisher is also identified by a unique
integer.
The model employs an artificial landscape, comprising a 128 x 128 cell grid,
representing a total area of 12.8 km2, i.e. an area considered representative of the
size of a fishing ground common to a group of boat-based fishers operating from
the same boat ramp. The grid assumes ‘wrap-around’, such that a fish or fisher
moving off the edge of the grid at one edge will re-enter the grid at the
corresponding position on the opposite edge. Each grid cell in the landscape
(representing an area of 100 m2) is assigned one of five possible habitat types (see
below).
4.2.4. Process overview and scheduling
The ABM employs a discrete event simulation engine and consists of two sub-
models which guide the behaviours of the fish and fishers. Fish agents may
experience three event types, i.e. (1) a movement, (2) an encounter with a fisher
(which may or may not result in death of the fish), or (3) death through natural
causes. Fishers may also experience three event types, where these events are
determined by the acts of making decisions and the behavioural responses of the
fisher to those decisions, i.e. (1) a decision to leave home and go fishing (2) a
decision to commence fishing, and (3) a decision to continue fishing, move or go
home. Note that a fishing trip is considered to have commenced at the time when a
153
boat has been launched from a boat ramp, and to have finished when the boat has
returned to that ramp.
When the model is initialised, an event is scheduled for each individual fish
and fisher and added to an event queue, together with a ‘termination’ event to end
the simulation at a specified time. The model’s ‘discrete event simulation engine’
then performs the task of processing each event in the queue at the correct time,
scheduling new events as existing events are processed, and eventually terminating
the simulation (e.g. Hampton and Majkowski, 1987).
4.2.5. Design concepts
Emergence
Emergent properties of interest in this ABM are the abundances, sizes and age
compositions of the fish in catches and in the residual population of fish, and
patterns of fisher behaviour in response to differences in fish abundance, the
fishers’ knowledge (of good fishing locations), and management controls (i.e. size
and boat limits).
Agent interactions
Interactions occur between the fish and fisher agents but not between individuals of
the same type, i.e. the model does not take into consideration competitive or other
interactions among fishers or between fish of the same or different species. The
model considers that fishers act independently of other fishers and therefore do not
share knowledge of good fishing locations. The behavioural patterns of the fish and
fisher agents are guided by a set of (stochastic) probabilistic rules.
Adaptability
During a simulation, fishers can adapt by improving their knowledge of ‘good’
fishing locations. For each fisher, a list with a fixed number of fishing locations (i.e.
grid cell locations) is maintained to represent his/her knowledge. This list, or
‘knowledge bank’, corresponds to the list of good fishing locations that a fisher
stores in his/her Global Positioning System (GPS) device. Each grid cell location
154
within the list is initially ranked according to its value as a fishing location, as
perceived by the fisher (i.e. the habitat associated with the grid cell, modified by
observation error). Fishers can also search for new fishing locations. When a new
location is found that is perceived to be better than one or more in his/her current
list, a fishing location in the list with a lower perceived value is replaced. Thereby,
the quality of a fisher’s list of locations can improve over time. The quality of an
angler’s fishing locations is also updated on each occasion when he/she fishes a
known location, or finds and then fishes at a new location. For example, if, because
a fisher is not receiving any bites from fish and he/she decides to move to a new
fishing location within 30 min, then the rank score of that fishing location in the
fishers’ ‘knowledge bank’ is reduced by one. Alternatively, if the fisher decides to
stay at a particular fishing location for longer than 30 min, the rank score for that
location is increased by one. This, therefore, potentially enables the quality of the
fisher’s collection of locations to be maintained even when fish abundances at some
locations in the initial list become depleted. As the fishers are assumed to be highly
specialised, they are initially accorded a high level of knowledge of good fishing
locations.
Model outputs
The model displays a range of diagnostic information on the computer monitor at
run time (Fig. 4.0). These outputs include charts presenting, for each fish species,
(1) the age compositions of female and male fish in the population at the beginning
of the simulation, (2) the age compositions of female and male fish in the
remaining population during the simulation, and (3) age and length compositions of
female and male fish that are released and retained by fishers, (4) the number of
fishers currently fishing, (5) CPUE (catch per unit of effort, measured as the
average number of fish retained per trip), and (6) ‘fisher knowledge’, i.e. average
(perceived, but not actual) value of the habitats of the fishing locations currently
‘stored’ in the ‘knowledge bases’ of the different fishers within the full fishing fleet.
Other data presented by the user interface at run time include (i) the current value

155
of time during the simulation (in days), (ii) the total number of fishing trips, (iii)
total hours ‘actively’ fished, (iv) number of searches for new fishing locations (v)
total hours spent searching, (vi) proportion of fishing time spent searching, (vii)
average number of moves by fishers each trip, (viii) total number of fish bites
received, (ix) number of ‘good’ fish bites, (x) numbers of released and (xi) retained
fish, (xii) the proportion of fish retained, (xiii) the number of times fishers have
attained their boat limits for the individual species, and (xiv) the mixed-species
boat limit.
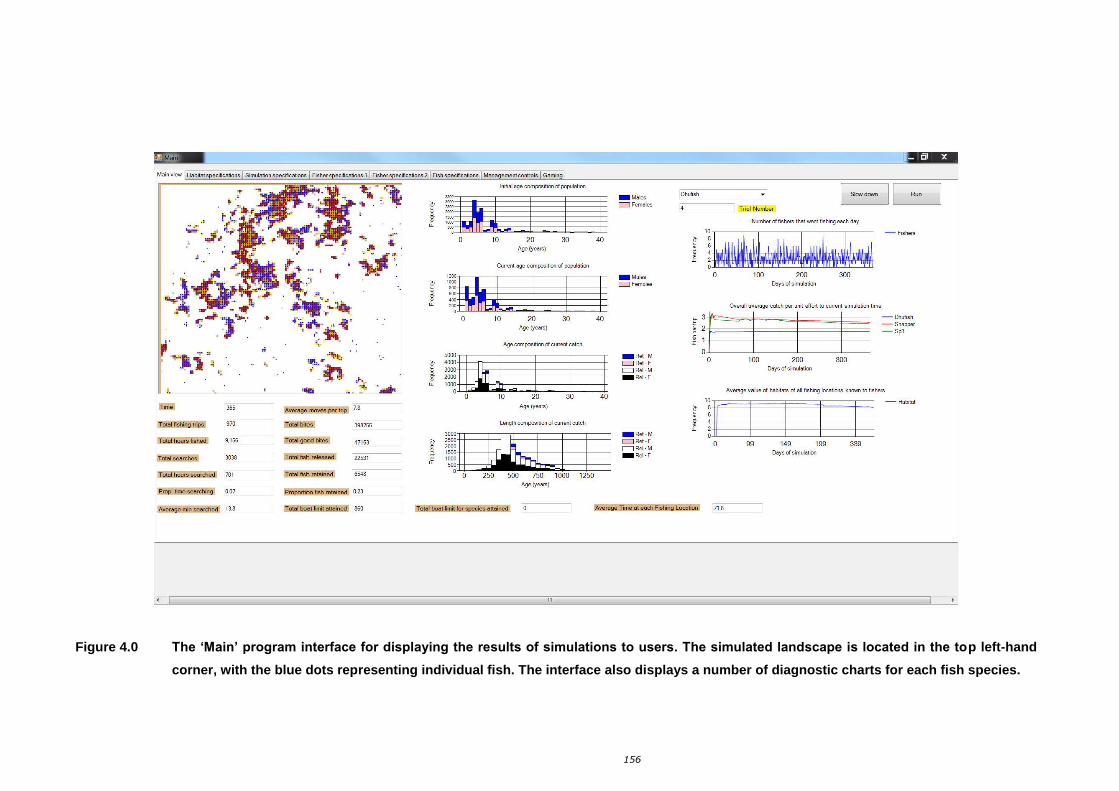
156
Figure 4.0 The ‘Main’ program interface for displaying the results of simulations to users. The simulated landscape is located in the top left-hand
corner, with the blue dots representing individual fish. The interface also displays a number of diagnostic charts for each fish species.
Main view Fish specifications Management controls Gaming
lnilie~l e~ge composition of popule~tion
~til~ J I 0 10 20 30 40
Age(yeors)
Current e~ge composition of population
:~we 1 [ .t
10 20 30 40 Age(yeors)
.. Age cern position of current ce~tch
., , .__.. ~m I I I [ .t
.-g
0 10 20 30 40
365 Age (yeors)
970 398755 length composition of current cotch
9.156 47153
3038 22531
701 6548
i ~t==i~J$1 I I 0 250 500 750 1000 1 250
Age (yeors) O.o7
Okll boat limit for s~ attai
- Moles c:::J Femoles
- Moles c:::J Females
- Ret - M c:::JRet - F c:::JRei - M - Rei - F
- Ret - M c:::JRet - F c:::JRei - M - Rei - F
Dhufish I Sk>wdown II Ruo
Trio l Number
Nt.mbef of fishers th.!lt went fishing e.!!Ch d.!ly
- Fishers
100 200 300 Doys of simule~tion
Ovemll ov~ cotch per unit effort to current s imulation t ime
- Dhufish - Snopper - SpJ ~~r
0 100 200 300 Doysof simule~tion
Avemge value of h.!lbilt~ls of oil fishing loce~tions known to fishers
- Hobitot
99 149 199 339 Doysofsimulotion
71.8
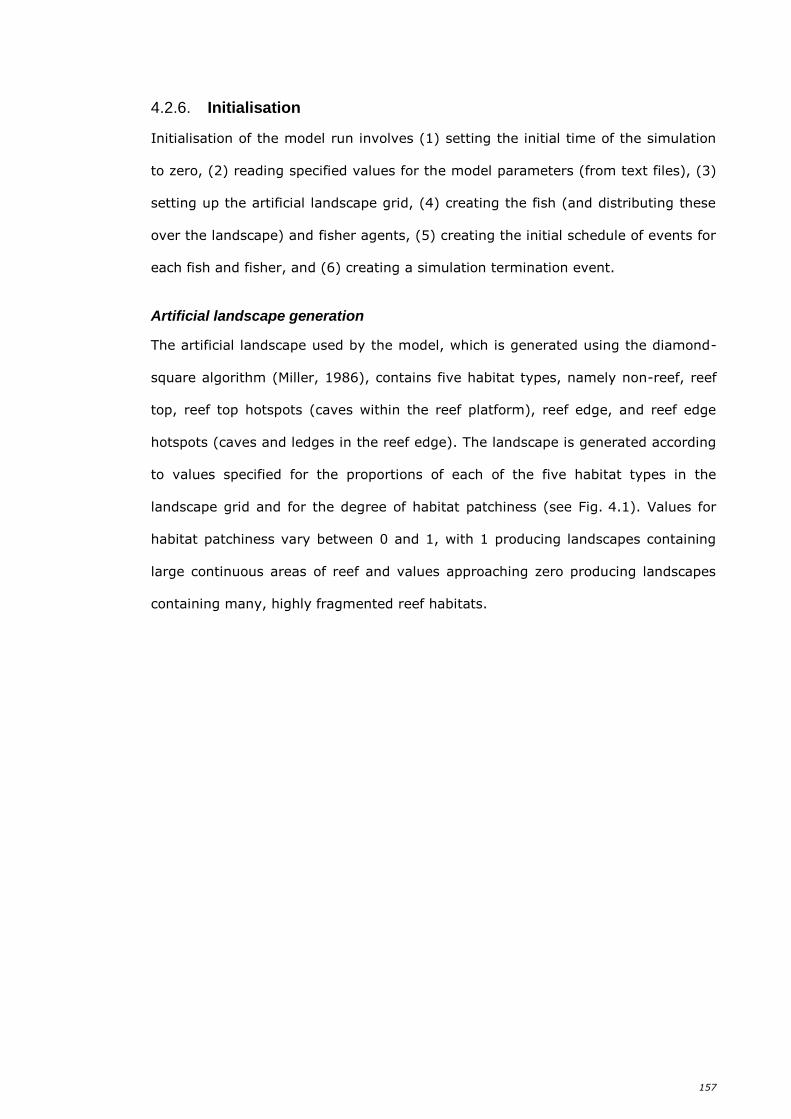
157
4.2.6. Initialisation
Initialisation of the model run involves (1) setting the initial time of the simulation
to zero, (2) reading specified values for the model parameters (from text files), (3)
setting up the artificial landscape grid, (4) creating the fish (and distributing these
over the landscape) and fisher agents, (5) creating the initial schedule of events for
each fish and fisher, and (6) creating a simulation termination event.
Artificial landscape generation
The artificial landscape used by the model, which is generated using the diamond-
square algorithm (Miller, 1986), contains five habitat types, namely non-reef, reef
top, reef top hotspots (caves within the reef platform), reef edge, and reef edge
hotspots (caves and ledges in the reef edge). The landscape is generated according
to values specified for the proportions of each of the five habitat types in the
landscape grid and for the degree of habitat patchiness (see Fig. 4.1). Values for
habitat patchiness vary between 0 and 1, with 1 producing landscapes containing
large continuous areas of reef and values approaching zero producing landscapes
containing many, highly fragmented reef habitats.
158
Figure 4.1 Form displaying the values of parameters used by the model to generate an artificial landscape.
159
Creation of fish agents
The fish are created using the age composition data (for an exploited fish
population) for the females and males of each species. These data were generated
by the operating model of a Management Strategy Evaluation (MSE) framework,
developed by Fisher et al. (2011), and which were read in from an external file and
used to create a random age composition sample for each species, according to the
specified number of individuals for each fish species. The samples of fish used in
the agent-based model are generated using the algorithm genmul, available online
from RANLIB within NETLIB (http://www.netlib.no) (Devroye, 1986), which
generates observed samples from a multinomial distribution (see below regarding
source of input data).
Once fish in the population for each species are created, they are placed
randomly among grid cells on the landscape grid with the same habitat type but
with weighting among grid cells of different types according to their ‘habitat
preferences’ (based on values of parameters that were derived from a recreational
fisher survey, see Chapter 3 and Appendix K). A ‘fish’ event, which may be a
movement, fisher encounter or natural mortality event, is then scheduled for each
individual. Note that, on each occasion that a new event is scheduled for a fish, the
program calculates the time till the next event for each event type, i.e. movement,
fisher encounter or death, and that event which would be the first of the three
events to occur is added to the event queue.
Creation of fisher agents
The ratings representing the fishers’ ability to correctly identify the various habitat
types (derived from the avid fisher survey described in Chapter 3, i.e. Q.20,
Appendix K) were averaged over all fishers for each habitat type and divided by the
maximum score of 10. The resulting value was assumed to represent the
probability that a fisher would correctly identify the true habitat. For each true
habitat type, it was assumed that there was an equal chance of incorrectly
identifying that habitat as one of the other types, and thus the residual probability
160
was spread equally over those other habitat types. Through this process, a table of
the probabilities that fishers would correctly or incorrectly perceive each of the true
habitat types to be a specific habitat type was generated (Fig. 4.2).
Each of the fishers in the fishing fleet is created with a ‘knowledge base’ of a
specified number of ‘GPS fishing locations’, i.e. grid cell locations. Each location in
this knowledge base is assigned a value from 0 (poor) to 10 (excellent) based on
fishers’ perceptions of each habitat’s worth (i.e. the value of the grid cell) for
catching fish (see Chapter 3 and Q.21, Appendix K) (Fig. 4.2). Allocation of each of
the fishing locations known to each fisher prior to the commencement of a
simulation involves (1) randomly selecting a cell, (2) undertaking a ‘random walk’
in the immediate vicinity of that cell for a specified number of steps, and (3)
selecting the cell within that random walk with the highest perceived habitat value
as the fishing location to be allocated to the fisher. This process is then repeated to
allocate a specified number of good fishing locations to each fisher to serve as
his/her initial knowledge base. A fishing location is considered ‘good’ if fishers have
assigned it a value which lies above a specified threshold level.
The final stage in creating the fisher agents is to schedule a decision for
each fisher to determine, at that time, whether to go fishing, or stay at home.
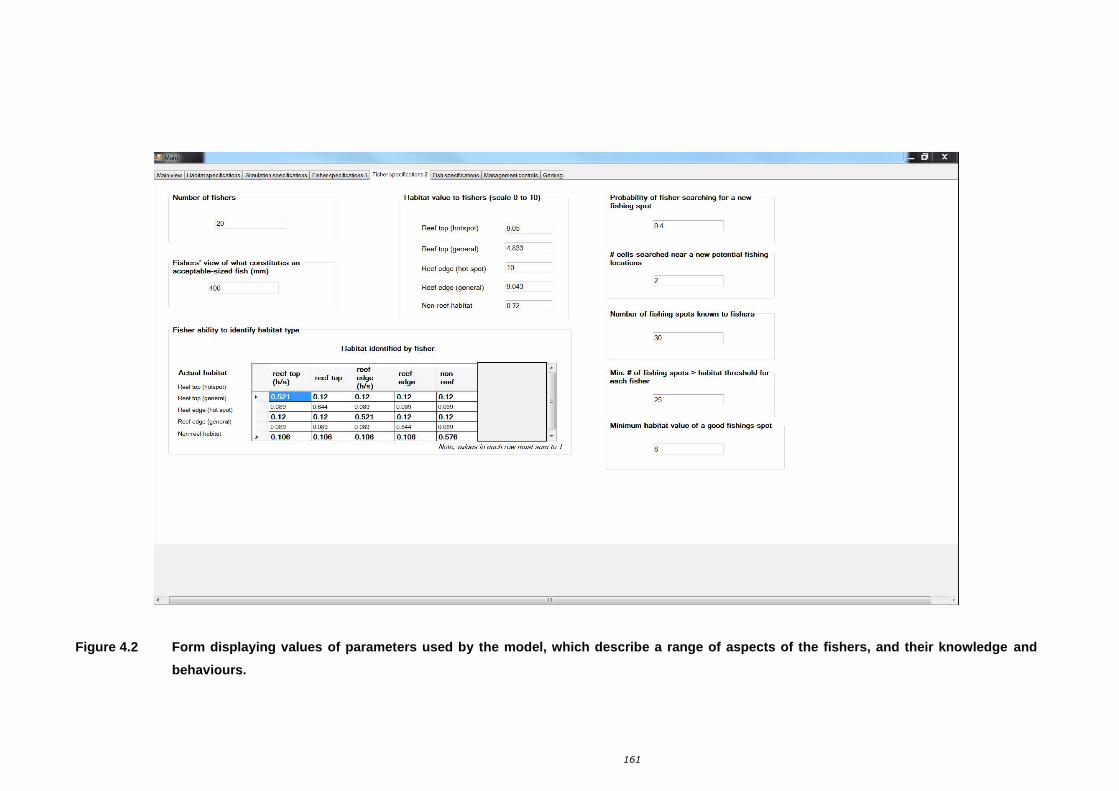
161
Figure 4.2 Form displaying values of parameters used by the model, which describe a range of aspects of the fishers, and their knowledge and
behaviours.
Main view Habitat specifica tions Simulation specifications Fisher specifications 1 Fisherspecificalions2 .._F"-ish'-''"'P"'" "'c"''"'tio"'"'-'' ccMc=' cc"'C<9oc'm='cc"'-'-oo"'""'tro=I' -'-"G'=mcci"'-'-9c_ ______________________________________ 1
Number of fishers
20
Fishers' v iew of what constitutes an acceptable-s ized f ish (mm)
400
Fisher ability to identify habitat type
Ac tual hab i ta t reef top
Reef top (hotspot) (his)
Reef lop (genert~l)
Reef edge (hot spot) 0.089
Reef edge (genercl) 0.12
0.089 Non-reef hcbitct
* 0.106
Habita t value to fishers (scale 0 to 10)
Reef top (hotspot) 9.05
Reef top (genera l) 4833
Reef edge (hot spot) 10
Reef edge (ge neral) 9.043
Non-reef habitat 0.72
Habitat identified by fi sher
reef reef
..-eef top edge (his)
edge non reef
0.12 0.12 0 .12 0 .12 = 0.644 0.089 0.089 0.089
0 .12 0 .521 0 .12 0.12
0.089 0.089 0.644 0.089
0 .106 0 .106 0 .106 0.576 N ote, values in each row must sum to 1
Probability of fisher searching for a new f ish ing spot
0.4
# cells searched near a new potential fishing locations
Number of f ishing spots known to fishers
30
Min. # o f f is hing spots > hab itat th reshold fo r each f isher
25
Minimum h abitat value of a good fish ings spot
162
4.2.7. Input
Input data are required to (1) generate the model landscape, (2) create the fish
and fisher agents, (3) parameterise the decision rules of the agents, and (4)
schedule a simulation termination time.
Input data for generation of a landscape
The data required for generating artificial landscapes include values for the
proportions of each habitat in the landscape grid and a value for habitat patchiness
(see above, Fig. 4.2).
Input data for fish agents
The data required to generate the fish agents include age composition data (for the
three fish populations). As noted above, an (external single species, single area,
length, age and sex-structured) operating model of a Management Strategy
Evaluation (MSE) framework, developed by Fisher et al. (2011), was employed to
determine the expected age composition for each species. For each species, this
expected age composition was read into the agent-based model to provide the
multinomial distribution from which, for each simulation run, a random sample of
the required size was drawn to serve as the initial population of that species. For
each fish species, other input data for the agent-based model included values for
(1) the number of fish to be generated, (2) von Bertalanffy growth parameters and
the standard deviation for the lengths at age, (3) maximum age, (4) (logistic) gear
selectivity parameters, (5) probability of capture if the fish encounters a fisher and
is large enough to be fully-selected into the fishery, (6) probability of death
following capture and release due to fishing-induced mortality (i.e. where the fish
may have been released because it was not of legal size for capture and retention,
or the boat limit for that species had already been attained by the fisher), and (7)
probabilities of movement of fish from each of the five habitat types. The values for
these parameters are displayed for the user on a form and can be modified before
the commencement of a new simulation (Fig. 4.3). Graphs showing the trends in
163
growth and the size-selectivity of the three species are displayed to help users to
visualise the input data. Note that details of the biological data used in this study
for West Australian dhufish, pink snapper, and silver trevally (the basis for the
biology of ‘red herring’), and the scientific papers from which those data were
drawn, have been cited in Hesp et al. (2010) and are provided in Appendix L.
As no data are available on the probabilities of movement of each species
from different habitat types, the probabilities to be used as input data to the model
were derived from the club survey data on fishers’ perceptions of habitat quality. It
was assumed that the probability of fish movement is related directly to the quality
of the habitat that an individual of that species currently occupies. Thus, for
example, species which are known to be strongly associated with reef structures,
such as reef caves and crevices, are far less likely to move from such habitats than
from other habitats such as sand. The perceived quality of each habitat type, i.e.
reef top “hotspot”, reef top “general”, reef edge “hotspot”, reef edge “general” and
non-reef, was recorded by the surveyed club members (Appendix K Q.21 andQ.22).
These perceived categories of habitat quality were scaled from 0 (poor) to 1
(excellent). The probability of movement of each species from each habitat was
then set equal to 1 minus the scaled value of the quality of that habitat for that
species.
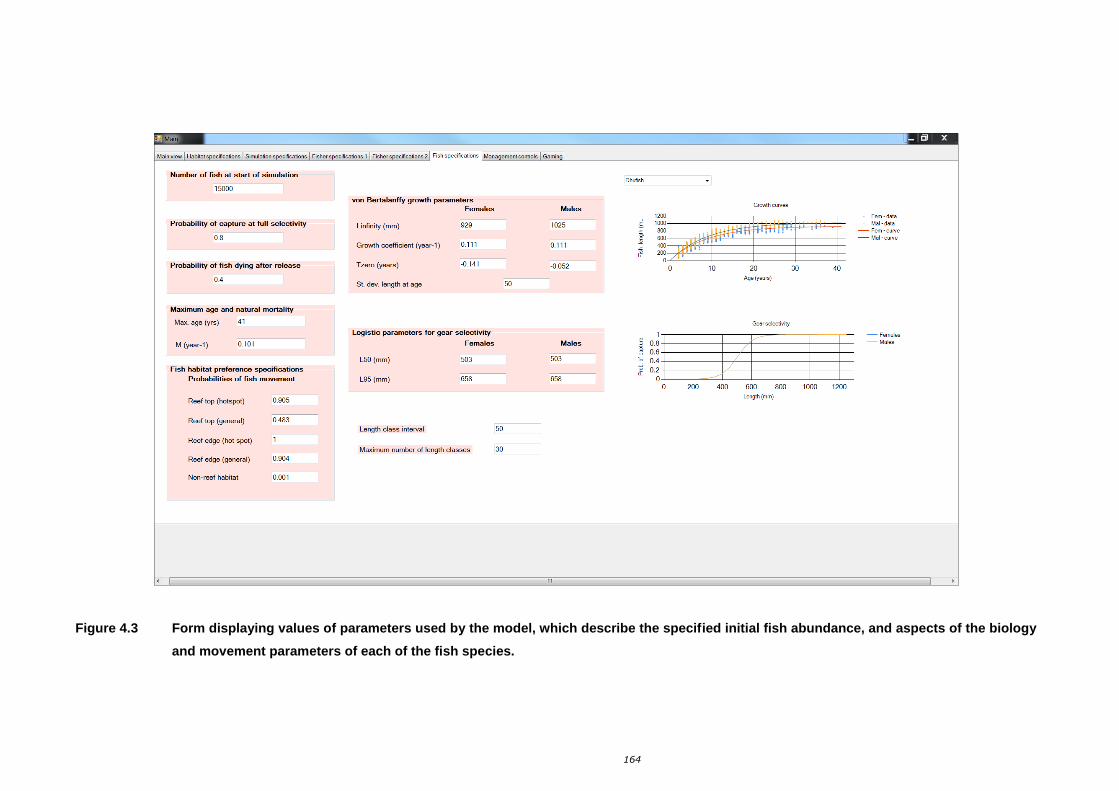
164
Figure 4.3 Form displaying values of parameters used by the model, which describe the specified initial fish abundance, and aspects of the biology
and movement parameters of each of the fish species.
165
Data inputs for fisher agents
Data required for fisher agents included values for (1) the number of fishers in the
recreational fleet, (2) probability of a fisher undertaking a search after moving from
a fishing location, (3) number of fishing locations known to each fisher, (4)
threshold value above which the fisher perceives the habitat type to be a good
fishing spot, (5) perceived value of each habitat type to fishers for catching fish, (6)
the minimum size of a fish that produces ‘good’ bites, (7) for each habitat type, the
probability that fishers correctly identify the habitat type and, if not correctly
identified, the probabilities of each of the remaining habitat types being identified
(incorrectly) as that habitat type, (8) logistic parameters describing the
relationships between the time elapsed since the last fishing trip and the probability
that an angler will go fishing, and (9) logistic parameters describing the relationship
between time elapsed since the commencement of a fishing trip and the probability
that the fisher will go home. As for the parameters for fish, the values for each of
the fisher parameters are displayed to the user on a form and can be modified
before the commencement of a new simulation (Figs 4.2, 4.4). Graphs are provided
to help users to visualise the data for describing the relationships between the (i)
probability, whilst fishing, of staying at the same location and bite rate, (ii)
probability of a fisher deciding to go fishing and the number of days elapsed since
the last fishing trip, and (iii) probability of a fisher deciding to go home and the
number of hours elapsed since the commencement of the fishing trip.
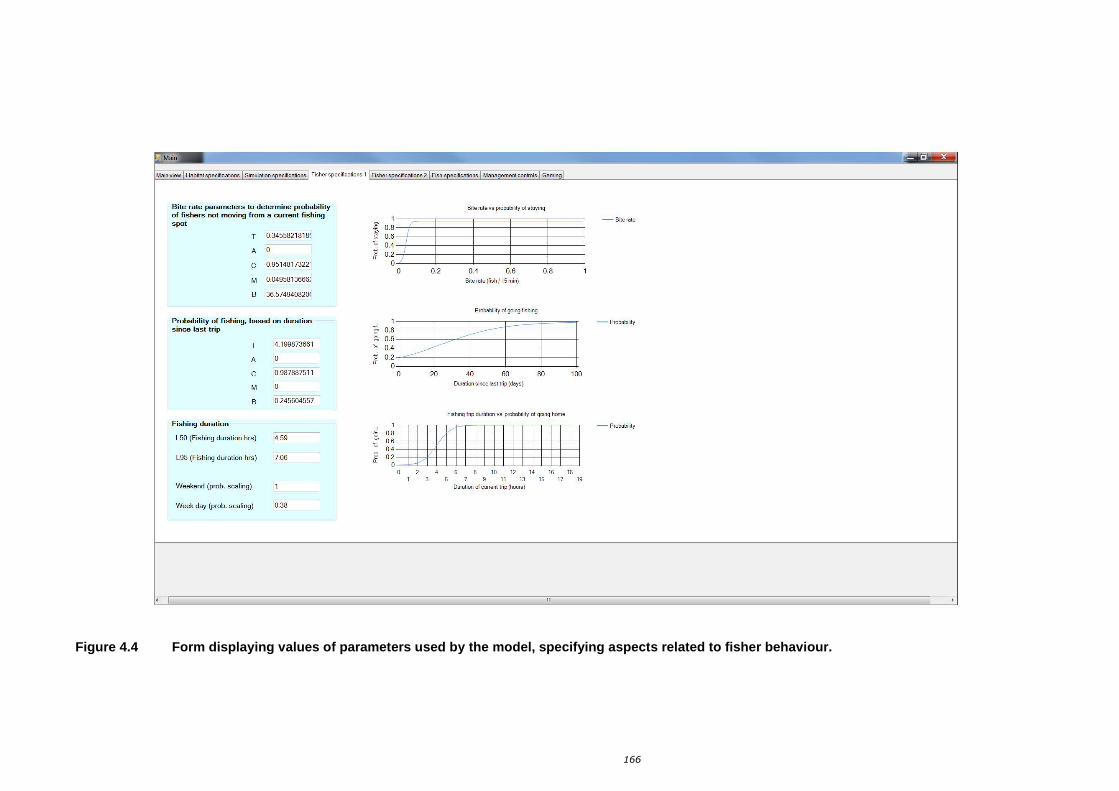
166
Figure 4.4 Form displaying values of parameters used by the model, specifying aspects related to fisher behaviour.
Main.-_
Mainview Habitat specifications Simulation sp ecifications Fisher specifications l .._F"'-i' c.o"' cc" o.cP=c" cc•=" cc' ooc"''-'''-"-Focc' h'-''"-P'=' cc• '=a=tio""''-'-"M'-"ao'-'a"-g•ocmco• co"'=cooc.c"•=o=I' .._G00aocm=i"c..9c_ _____________________________________ -l
Bite rate parame ters to determine p robability o f fi shers not m oving from a curre nt fis h ing spot
T 0.345582181 8!
A 0
c 09514817322
M 0.0495813666:
B 36.5749408201
P robability of fis hing, based on du ration s ince last t rip
T 4.199873661
A 0
c 0.98788751 1
M
B 02 45604557
Fis hing du ration
L50 (Fishing duration hrs ) 4.59
L95 (Fis hing duration hrs) 7.06
Weekend (prob. scaling)
Week day (prob. scaling) 0.38
Bite mte vs probobility of st"ying
- Bite mte
! ~;++-----+-~/ I ===+=I =+==~~I ~ 0 ~:t/t=====-i.:::=====:t. ======-it==jt=====:t======-i. 0 0.2 0.4 0.6 0.8
Bite mte {fish / 15min)
P~bility of going fishing
-P~bility
Dumtion s ince last trip {Mys)
Fishing trip dumtion vs probtlbility of going home
-P~bility
-
~ I g, 0
£ llfnl ll llllllllll 0 8 10 12 14 16 18
11 13 15 17 19 Dumtion of current trip {hours)
167
Fisheries management controls
The model considers several forms of management control, including a minimum
legal length (MLL) of fish of each species for capture and retention, and boat limits
for individual species. Each of the three species has a specific boat limit, i.e.
maximum number of fish of that species that may be retained and landed. Note
that fishers are assumed to cease fishing when they have achieved the bag limits
for the two key target species, West Australian dhufish and pink snapper.
4.2.8. Sub models
Fish sub-model
1. Fish movement event
Scheduling: Dependent on the instantaneous rate of fish movement
The instantaneous rate (day-1) of fish moving from a given habitat type,
𝑅FishMovement, is calculated as:
𝑅FishMovement = −ln (1 − 𝑃FishMovement),
where 𝑃FishMovement is the probability of fish moving from that habitat type, and ln
is the natural logarithm. This probability of movement is determined on the basis of
the fish’s ‘preference’ for the habitat type of the cell it currently occupies (see
above, ‘Input data for fish agents’).
The period of time to the next fish movement, 𝑇TillFishMovement, may be determined
as:
𝑇TillFishMovement = − ln(1 − 𝑟) /𝑅FishMovement,
where r is a uniform random number between 0 and 1, noting that this approach is
based on that described by Hampton and Majkowski (1987).
The scheduled simulation time of the next fish movement, 𝑇FishMovement, is:
𝑇FishMovement = 𝑇SimClock + 𝑇TillFishMovement,

168
where 𝑇SimClock is the current time of the simulation in days. It is assumed that,
when a scheduled fish movement event occurs, the fish has no knowledge of the
attractiveness (i.e. habitat) of the cells adjacent to the current grid cell which it
occupies. Accordingly, the fish is moved to a cell that is selected randomly from the
set of adjacent cells, where each of those cells has an equal probability of being
selected. At the conclusion of the fish movement event, a new event is scheduled
for the fish. Note that, although movement of the fish into the new cell increases
the probability that fishers within that cell might encounter a fish, the current
model does not reschedule events for those fishers as it is assumed that the
increase in probability is likely to be negligible.
2. Fish encounters fisher event
Scheduling: Dependent on the number of fishers currently occupying the same
grid cell as fish
The encounter rate between a fish and a fisher, 𝑅FisherEncounter, which depends on
the number of fishers currently occupying the same grid cell as that fish,
𝑁FishersInCell, is calculated as:
𝑅Encounter = [−ln(1 − 𝑃Encounter)]𝑁FishersInCell,
where 𝑃Encounter is the probability of a fish encountering a fisher in the same cell as
itself over 24 h. Note that, as 𝑅Encounter depends on 𝑁FishersInCell, the events for fish
in a cell are rescheduled every time a fisher enters or leaves that cell.
The time (days) before a ‘fish encounter with a fisher’ event, 𝑇Encounter, is given as:
𝑇Encounter = [-ln(1 − 𝑟)]/𝑅Encounter.
𝑇Encounter is then adjusted to determine the probability of encountering a fisher
within the next 15 min (i.e. a period representing the time interval between
successive occasions on which fishers are likely to ‘consider’ whether they should
stay or move) of the current time of the simulation, 𝑇SimClock, i.e.,
𝑇Encounter = 𝑇SimClock + 𝑇Encounter/(0.25 ∗ 24).
169
When a fish encounters a fisher, it may or may not be caught and, if it is caught, it
may be retained or released. If caught and released, the fish may survive or die
(see Fig. 4.5).
Each encounter between a fish and fisher is considered to be a ‘bite’ that the fisher
detects. If there are multiple fishers in the grid cell, one of those fishers is
randomly selected as the fisher who experiences the bite. A record is maintained
for each fisher of the number of good bites that are recorded by that fisher in the
current grid cell, where determination as to whether a bite is a ‘good’ bite is made
according to the size of the fish (that is biting) (a value specified on the ‘Fisher
specifications 2’ form, see Fig. 4.2).
i) Fish bites and is caught
The probability that a fish is caught once it has encountered a fisher is dependent
on the length at age of the fish and its size-dependent vulnerability to the fishing
gear. For a given species, 𝐿t,s, the length at age 𝑡 for a fish of sex 𝑠, was
determined from the von Bertalanffy growth equation, i.e.,
𝐿t,s = 𝐿∞,s{1 − 𝑒𝑥𝑝[−𝑘𝑠(𝑡 − 𝑡0,s)]} + 𝜀 ,
where for each sex, s, 𝐿∞,s , is the asymptotic length (mm), ks is the growth
coefficient (y-1), 𝑡0,s is the hypothetical age at zero length, and is a randomly-
generated normal observation error with mean of zero and specified standard
deviation for lengths at age. The parameters of these growth curves, and
associated values of the standard deviations, were provided for each sex of each
species as input data to the agent-based model.
For each species, the probability that a fish of length 𝐿 (mm) will be caught by the
fishing gear, 𝑆L, is given as:
𝑠L = 1/{1 + 𝑒𝑥𝑝[− ln(19) (𝐿 − 𝐿50)/(𝐿95 − 𝐿50)]},
170
where ln is the natural logarithm, and 𝐿50 and 𝐿95 are the lengths in mm at which 50
and 95% of fish, respectively, are selected by the fishing gear.
The probability that, on biting, a fully-selected fish will be caught, 𝑃BiteCapture, is
determined as:
𝑃BiteCapture = 𝑆𝐿𝑃Capture,
where 𝑃Capture is a specified constant. To determine whether a fish bites and is
caught when it encounters the fisher’s fishing gear, a uniform random number
between 0 and 1 is drawn, and if this is less than or equal to 𝑃BiteCapture, it is
assumed that the fish is caught, otherwise it escapes capture. Note that, for other
decisions relating to the probability of a specific outcome required within the model,
a similar approach is employed.
ii) Fish is retained or released
If a fish is caught, it will be retained by the fisher if it is as large as or larger than
the minimum legal length for capture and retention specified for the fish species, if
that fisher has not yet attained the boat limit for that species or the mixed boat
limit for the combination of the two iconic species, i.e. West Australian dhufish and
pink snapper. If retained, the fish is removed from the fish collection.
iii) Fish suffers post-release mortality
The probability of a fish dying following capture and release, PReleaseDeath, is specified
as a constant. If a fish is caught and released, a uniform random number between
0 and 1 is drawn, and if this is less than PReleaseDeath then the fish is assumed to die
after release. If the fish dies, it is removed from the fish collection.
171
3. Fish natural mortality event
Scheduling: Random assignment, depending on instantaneous rate of natural
mortality
For a given species, the time at which each individual would be expected to die as a
result of natural mortality, if it does not first experience a movement event or
encounter with a fisher, 𝑇𝑀, is calculated as:
𝑇𝑀 = 𝑇SimClock + [−ln(1 − 𝑟)/(𝑀/365.25)] ,
where 𝑀 is the instantaneous rate of natural mortality (y-1) for that species. This
estimate of 𝑀 was obtained by inserting the maximum recorded age for the species
into Hoenig’s (1983) equation for fish. Note that, if the time till the next movement
or encounter with a fisher is less than the time till expected death, then the first
event to occur is added to the event queue, and the question of natural mortality is
re-visited at the time of scheduling the next event for the fish, if it has not died as
a result of an encounter with a fisher.
Fisher sub-model
1. Fisher decision to fish event
Scheduling: 10 pm daily
The probability that, independent of whether the following day was a week day or
weekend day, a fisher would decide to go fishing on the following day, 𝑃Fishing∗ , was
assumed to be a function of the number of days elapsed since the fisher’s last trip,
𝐷, and was described using Richards’ generalised logistic equation (Richards,
1959), i.e.,
𝑃Fishing∗ = 𝐴 + [𝐶/ (1 + 𝑒𝑥𝑝−𝐵(𝐷−𝑀)1/𝑇
)],
where 𝐴 is the lower asymptote, 𝐴 + 𝐶 is the upper asymptote, 𝐵 is a parameter
that determines the rate at which the probability of going fishing increases with
respect to elapsed time, T determines the shape of the curve, and 𝑀 is the time of
maximum rate of increase (see Fig. 4.6). The values of these parameters were
estimated using data from the survey of club members, i.e. the number of days
172
anglers had gone fishing from a boat in the previous 12 months (see Appendix K
Q.1).
PFishing was then calculated by multiplying 𝑃Fishing∗ by an adjustment factor with a
value related to whether the following day of the simulation was a working day or a
weekend day. These adjustment factors were calculated using club survey data that
recorded, for different days of the week, whether fishers had gone fishing on those
days during the past 12 months (see Appendix K Q.2d) and which were then scaled
to range from 0 to 1, with 1 meaning every time.
2. Fisher commences fishing on day event
Scheduling: Random time between 6 am and 12 noon following a fisher decision to
fish event.
If a decision is made to go fishing, a ‘fisher commences fishing on day’ event is
scheduled for a (uniformly-distributed random) time between 6 am and 12 noon
the following day.
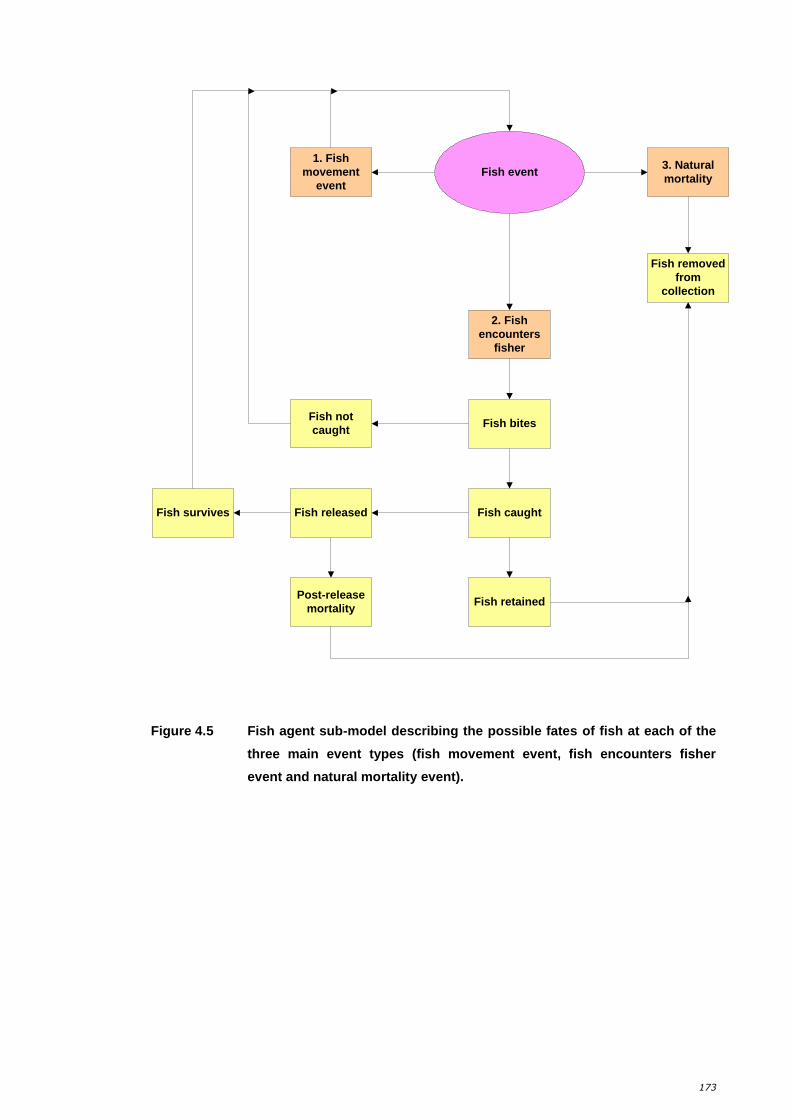
173
Figure 4.5 Fish agent sub-model describing the possible fates of fish at each of the
three main event types (fish movement event, fish encounters fisher
event and natural mortality event).
1. Fish
movement
event
Fish event3. Natural
mortality
Fish removed
from
collection
2. Fish
encounters
fisher
Fish bites
Fish caught
Fish retainedPost-release
mortality
Fish released
Fish not
caught
Fish survives
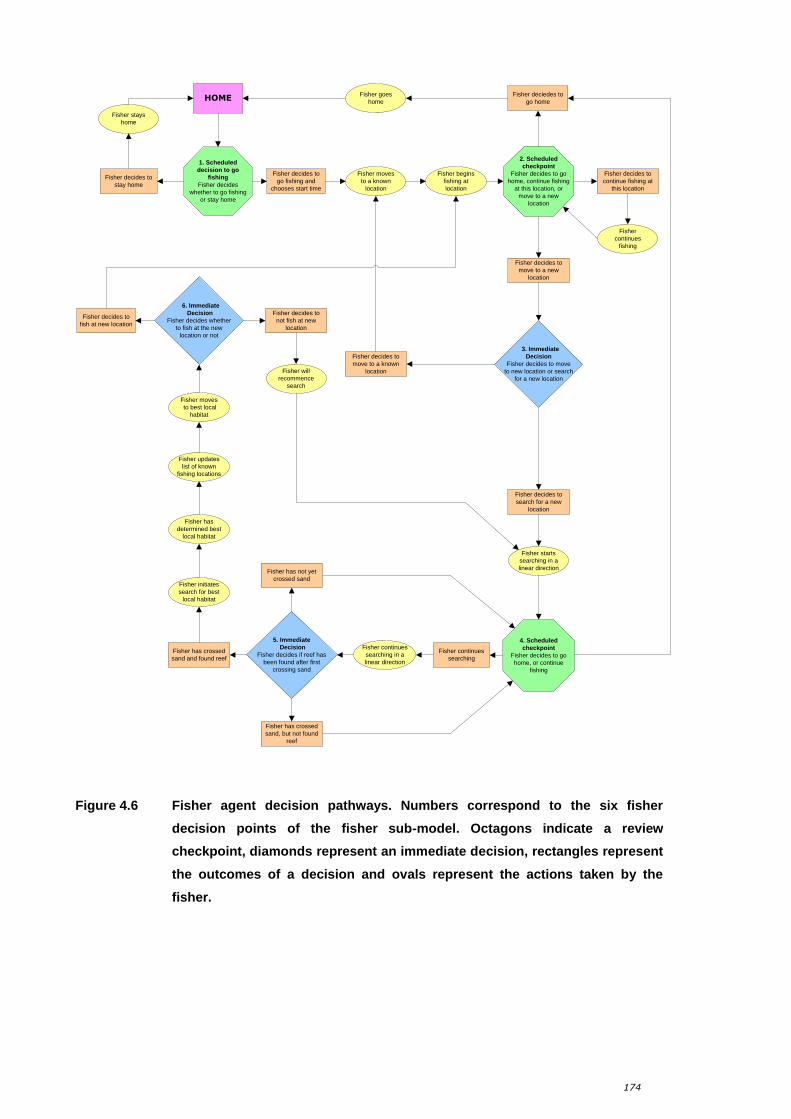
174
Figure 4.6 Fisher agent decision pathways. Numbers correspond to the six fisher
decision points of the fisher sub-model. Octagons indicate a review
checkpoint, diamonds represent an immediate decision, rectangles represent
the outcomes of a decision and ovals represent the actions taken by the
fisher.
HOME
3. Immediate
Decision
Fisher decides to move
to new location or search
for a new location
1. Scheduled
decision to go
fishing
Fisher decides
whether to go fishing
or stay home
2. Scheduled
checkpoint
Fisher decides to go
home, continue fishing
at this location, or
move to a new
location
4. Scheduled
checkpoint
Fisher decides to go
home, or continue
fishing
6. Immediate
Decision
Fisher decides whether
to fish at the new
location or not
5. Immediate
Decision
Fisher decides if reef has
been found after first
crossing sand
Fisher begins
fishing at
location
Fisher stays
home
Fisher goes
home
Fisher decides to
go fishing and
chooses start time
Fisher decides to
continue fishing at
this location
Fisher deciedes to
go home
Fisher decides to
stay home
Fisher moves
to a known
location
Fisher decides to
move to a known
location
Fisher decides to
move to a new
location
Fisher decides to
search for a new
location
Fisher starts
searching in a
linear direction
Fisher decides to
not fish at new
location
Fisher decides to
fish at new location
Fisher has not yet
crossed sand
Fisher has crossed
sand, but not found
reef
Fisher has crossed
sand and found reef
Fisher updates
list of known
fishing locations
Fisher moves
to best local
habitat
Fisher has
determined best
local habitat
Fisher initiates
search for best
local habitat
Fisher will
recommence
search
Fisher continues
searching
Fisher continues
searching in a
linear direction
Fisher
continues
fishing
175
3. Fisher checkpoint event (type I)
Fisher decides to continue fishing, go home or move to a new fishing location.
Scheduling: Random time every 10-20 min whilst fishing.
(i) Decision to continue fishing
The probability of the fisher continuing to fish at the same location, 𝑃StayInCell, as a
function of bite rate (min-1), 𝐵Rate, was calculated as:
𝑃StayInCell = 𝐴 + [𝐶/ (1 + 𝑒𝑥𝑝−𝐵(𝐵Rate−𝐵Rate50)1/𝑇)]
where 𝐵Rate50 is the number of ‘good’ bites (min-1) at which 50% of fishers will
decide to stay at the current fishing location, and A, B, C, and T are parameters of
the generalised logistic equation (noting that these last parameters differ from
those used in the equation used to calculate the probability that a fisher will decide
to go fishing and that, in Fig. 4.4, the parameter 𝐵Rate50 is denoted by the symbol
M). The bite rate, 𝐵Rate, is calculated for the fisher as the number of bites that
he/she has experienced in the cell divided by the time (min) that has been spent in
the cell.
(i) Decision to return home
The probability of a fisher returning home, PReturnHome , is calculated as:
𝑃ReturnHome = 1/{1 + 𝑒𝑥𝑝[−ln(19)(𝑇Trip − 𝑇Trip50)/(𝑇Trip95 − 𝑇Trip50)]},
where 𝑇Trip50 and 𝑇Trip95 are the number of hours after which 50 and 95% of
fishers, respectively, will return home. Alternatively, a fisher will automatically
return home if the ‘mixed species’ boat limit has been attained. The model includes
the two key target species, West Australian dhufish and pink snapper, in the mixed
species boat limit.
(ii) Decision to move to a new fishing location
𝑃𝑀𝑜𝑣𝑒, the probability of a fisher moving to a new fishing location is determined as:
𝑃Move = 1 − 𝑃StayInCell
176
A fisher may move either to a known fishing location, or commence a search to find
a new location. The probability of a fisher deciding to begin searching for a new
fishing location, 𝑃Search , is set as a constant. The decision is made by drawing a
uniform random number between 0 and 1, and if this is less than 𝑃Search, the fisher
will commence searching by moving linearly in a randomly-selected direction to a
new cell.
4. Fisher checkpoint event (search mode)
Scheduling: every 1 min whilst searching.
(i) Decision whether reef has been encountered, after first encountering
sand
A fisher must move sufficiently far from a previous fishing location for the new
location to represent a different fishing spot. The process by which this is assumed
to occur involves fishers moving far enough from their previous fishing location to
encounter a non-reef habitat, before then encountering a new reef (Fig. 4.6). At
each one minute checkpoint whilst a fisher is searching, he/she decides whether
non-reef habitat has been encountered and, if so, whether a new reef habitat has
been found. Note again that if a fisher moves outside the grid, he/she will re-enter
the grid at the corresponding location on the opposite edge of the grid.
Once a fisher encounters a new reef (and thus a potential new fishing location),
that fisher first undertakes a local search, i.e. a random walk, for a specified
number of cells (‘Fisher specification 2’ form, Fig. 4.2), to determine the cell with
the (perceived) best habitat in the local vicinity of the newly-found reef location.
The fisher’s collection of fishing spots may then be updated, with the new location
replacing an existing location, if one exists in the collection with a poorer value as a
fishing spot. After updating the collection, the fisher then decides whether to fish at
the new location, or whether to recommence searching (Fig. 4.6).
177
(ii) Decision to fish new location or a previously-known location
A newly-found location is fished if the fisher’s perceived value of the habitat lies
above the habitat value specified as the minimum for a good fishing location,
otherwise the fisher will commence a new search (Fig. 4.6).
4.2.9. Simulations
The agent-based model described above was used to undertake simulations for a
range of ‘scenarios’. These scenarios explored the movements and behaviours of
recreational fishers and their responses to changes in management regulations, i.e.
in the MLL and boat limits. Thirty simulations were undertaken for each scenario.
For each simulation run, all parameters in the model were kept constant except the
one of interest. A summary of the simulations undertaken during the various
scenarios are presented in Table 4.0.
Baseline data for many of the model parameters were determined either
from (1) the responses of recreational fishers at angling clubs to the survey
described in Chapter 3 (see Appendix K for survey questions), or (2) from the
literature regarding the biological parameters for fish species (summarised in
Appendix L). However, certain model parameters, e.g. the range of initial fish
abundances explored in different simulations, were arbitrary values, over which the
model (i.e. catches by fishers) responded differently, noting that the model
represents simulated fish and fishers interacting over an “artificial” landscape.
These simulated recreational fishers were considered representative of avid and
specialised fishers, i.e. similar to the group of surveyed club anglers. It should be
noted that, while the parameters relating to fishers’ behaviours and characteristics
of fish biology are sound, and thus predictions of the likely responses of fishers and
the relative impact of those behavioural changes on catches and fishing activity are
reliable, fish abundances and their distribution over the landscape are simulated
and are thus not intended to represent the actual fish population and recreational
178
fishery within any specific area of the West Coast Bioregion of south-western
Australia.
The abundance of a species targeted by fishers is likely to be a key factor
that influences the behaviour of fishers, and thereby is also likely to affect the
numbers of both the target and other species that are caught by those fishers. In
turn, the catches that are made of the different species will reduce the residual
abundances of those species. The effect of this factor on catches was assessed by
varying the abundance of West Australian dhufish within the simulated region from
its baseline level of 5,000 fish to 20, 50, 200 and 300% of that level (Table 4.0)
and re-running thirty simulations for each scenario, while maintaining all other
parameters of the model at the values used for the baseline simulation.
The probability that a fisher will move from a fishing spot to a new location
is determined by the bite rate (𝐵Rate), i.e. the number of bites per minute by fish
that are considered by the angler to be likely to have been made by good-sized
fish, and the acceptability of that bite rate to the fisher. While the numbers of fish
that the fisher encounters are determined by the abundances of the individuals of
the different species, the acceptability of the bite rate is determined by the fisher
and affects his decision as to whether to remain at the same fishing location or
move to a new location. The result of the behaviour resulting from such decisions is
likely to be reflected in the numbers of individuals of the different species that are
caught by the fisher. The effect of this factor was assessed by varying the value of
the parameter 𝐵Rate50 over a range from ~20 to 200% of its baseline value, while
maintaining the values of other parameters at their baseline levels.
The simulations explored the extent to which an increased knowledge (of
good fishing locations) would influence catch rates. In the model, an angler’s
knowledge is represented by a value from 0 (none) to 1 (all known fishing locations
of high quality). A baseline value of 0.58 for this variable was calculated from the
club survey data relating to the fishers’ perceptions of their extent of knowledge of
good fishing locations. The effect of this factor was assessed by varying its value
over the full possible range from 0 to 1.
179
The input value for the probability of a fisher deciding to go searching for a
new fishing spot (i.e. probability of searching, 𝑃Search), was a value between 0
(never) and 1, (always, when moving to a fishing location). An arbitrary baseline
value of 0.4 was specified, against which the effect of alternative values, while
maintaining the values of other parameters at their baseline levels, was explored.
In terms of optimising catch success, these simulations explored the trade-off
between the amount of time spent searching for new locations with potentially good
abundances of fish, compared with fishing known locations, where fish have been
caught recently as a consequence, may have become depleted.
The input value for the number of cells searched when potential new fishing
locations were found by anglers varied from 1 to 6, with an arbitrary baseline value
of 2. Simulations based on different values of this parameter, while maintaining the
values of other parameters at their baseline levels, explored the possible trade-off
of increasing catch success by increased search time, that would increase the
likelihood of finding a high quality fishing location, and reducing success as actual
fishing time decreases.
The baseline input value for trip duration (4.59 h) was based on the
reported average number of hours spent fishing by club members on their last boat
fishing trip, i.e. from the club surveys. A range of aspects related to different trip
durations was explored. For example, the longer an angler spends fishing,
potentially the more searches that will be undertaken and fish caught, noting
however that the number of fish that can legally be retained is dependent on the
management regulations in place, e.g. the minimum legal length and boat limit for
each target species, and combined boat limit for a specified set of target species.
The effect of trip duration was assessed by varying the value of the parameter over
a range from 2 to 14 h, while maintaining the values of other parameters at their
baseline levels.
A baseline minimum legal length of 500 mm for West Australian dhufish was
set based on current management regulation in the West Coast Bioregion.
Simulations were undertaken to explore the effects (i.e. on fish population
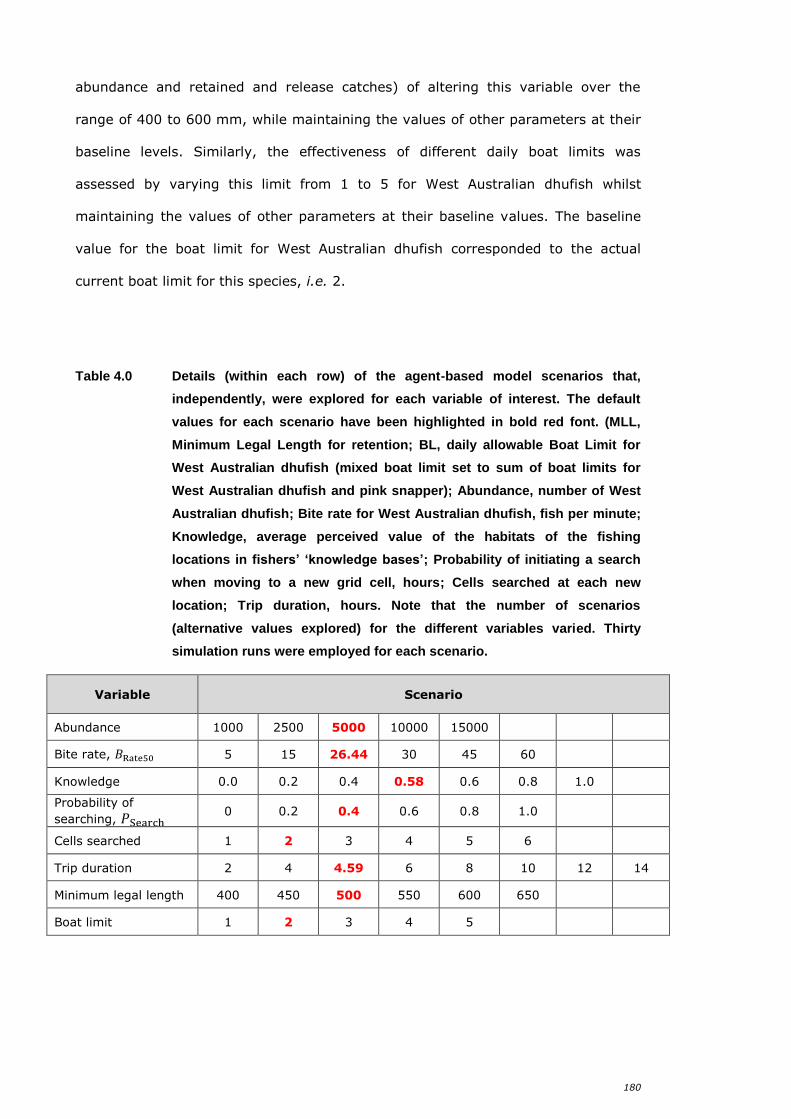
180
abundance and retained and release catches) of altering this variable over the
range of 400 to 600 mm, while maintaining the values of other parameters at their
baseline levels. Similarly, the effectiveness of different daily boat limits was
assessed by varying this limit from 1 to 5 for West Australian dhufish whilst
maintaining the values of other parameters at their baseline values. The baseline
value for the boat limit for West Australian dhufish corresponded to the actual
current boat limit for this species, i.e. 2.
Table 4.0 Details (within each row) of the agent-based model scenarios that,
independently, were explored for each variable of interest. The default
values for each scenario have been highlighted in bold red font. (MLL,
Minimum Legal Length for retention; BL, daily allowable Boat Limit for
West Australian dhufish (mixed boat limit set to sum of boat limits for
West Australian dhufish and pink snapper); Abundance, number of West
Australian dhufish; Bite rate for West Australian dhufish, fish per minute;
Knowledge, average perceived value of the habitats of the fishing
locations in fishers’ ‘knowledge bases’; Probability of initiating a search
when moving to a new grid cell, hours; Cells searched at each new
location; Trip duration, hours. Note that the number of scenarios
(alternative values explored) for the different variables varied. Thirty
simulation runs were employed for each scenario.
Variable Scenario
Abundance 1000 2500 5000 10000 15000
Bite rate, 𝐵Rate50 5 15 26.44 30 45 60
Knowledge 0.0 0.2 0.4 0.58 0.6 0.8 1.0
Probability of
searching, 𝑃Search 0 0.2 0.4 0.6 0.8 1.0
Cells searched 1 2 3 4 5 6
Trip duration 2 4 4.59 6 8 10 12 14
Minimum legal length 400 450 500 550 600 650
Boat limit 1 2 3 4 5
181
Results 4.3.
4.3.1. Fisher behaviours/knowledge and catches, and fish abundance
As the abundance of West Australian dhufish was increased from 1,000 to 5,000
fish, the total catch of all species (i.e. West Australian dhufish, pink snapper and
red herring caught and retained) increased from 5,591 (± 29.64) to 6,451
(± 47.46), and then remained at about the same level as the abundance of West
Australian dhufish was further increased to 15,000 fish (Table 4.1, Fig. 4.7a). Note
that, both here and in the remainder of this chapter, the imprecision of the
estimate of the mean is presented, in parentheses, as ± two standard errors, i.e.
± 2SE, or, when presenting or displaying an estimate of the approximate 95%
confidence interval (CI), the approximate CI is reported as the value of the mean
± 2SE.
The average number of simulated moves an angler made during a single
fishing trip declined slightly from 12.2 (± 0.2) to 10.1 (± 0.2) moves when the
average bite rate at which a fisher would move, 𝐵Rate50, was increased from 5 to
30 bites/15 min. Thereafter, the average number of moves decreased markedly,
from 10.1 (± 0.2) to 3.3 (± 0.2), as this bite rate was increased from 30 to 60
bites/15 min, respectively (Fig. 4.7b). Further, the total catch of all species (i.e.
West Australian dhufish, pink snapper and red herring) decreased marginally from
6,731 (± 29.17) to 6,271 (± 31.94) when 𝐵Rate50 was increased from 5 to
30 bites/15 min. However, the catches decreased markedly, from 6,271 (± 31.94)
to 3,873 (± 52.53), as this bite rate was increased from 30 to 60 bites/15 min,
respectively (data not shown).
When plotted against the average initial ‘GPS knowledge’ of anglers, total
catch (all West Australian dhufish, pink snapper and red herring caught and
retained) remained largely unchanged, with values ranging between 6,412 (± 64.9)
and 6,508 (± 41.7) as the level of knowledge increased from 0 (i.e. no knowledge
of locations of good fishing spots) to 1 (high knowledge of good fishing locations)
(Fig. 4.7c).
182
As the probability of searching rather than moving to an alternative known
location increased (from 0, i.e. always fish known locations, to 1, i.e. always search
when moving to a new location), total catch (all West Australian dhufish, pink
snapper and red herring caught and retained) essentially did not change, i.e.
increased very slightly from 6,446 (± 40.2) to 6,449 (± 176.0), respectively
(Fig. 4.7d). Note, for example, that the initial abundance of West Australian dhufish
was set at the baseline input value of 5,000 for this simulation scenario, and only
the ‘search time’ value was varied.
As the number of cells of the computer landscape searched by anglers was
increased from 1 to 4, total catch (all West Australian dhufish, pink snapper and red
herring caught and retained) increased slightly, i.e. from an average of 6,195
(± 55.7) to 6,598 (± 69.4) fish (Fig. 4.7e).
Total catch of West Australian dhufish, pink snapper and red herring
increased markedly as fishing trip duration increased from 2 to 6 h and then
levelled off as trip duration increased further to 14 h (Fig. 4.7f).
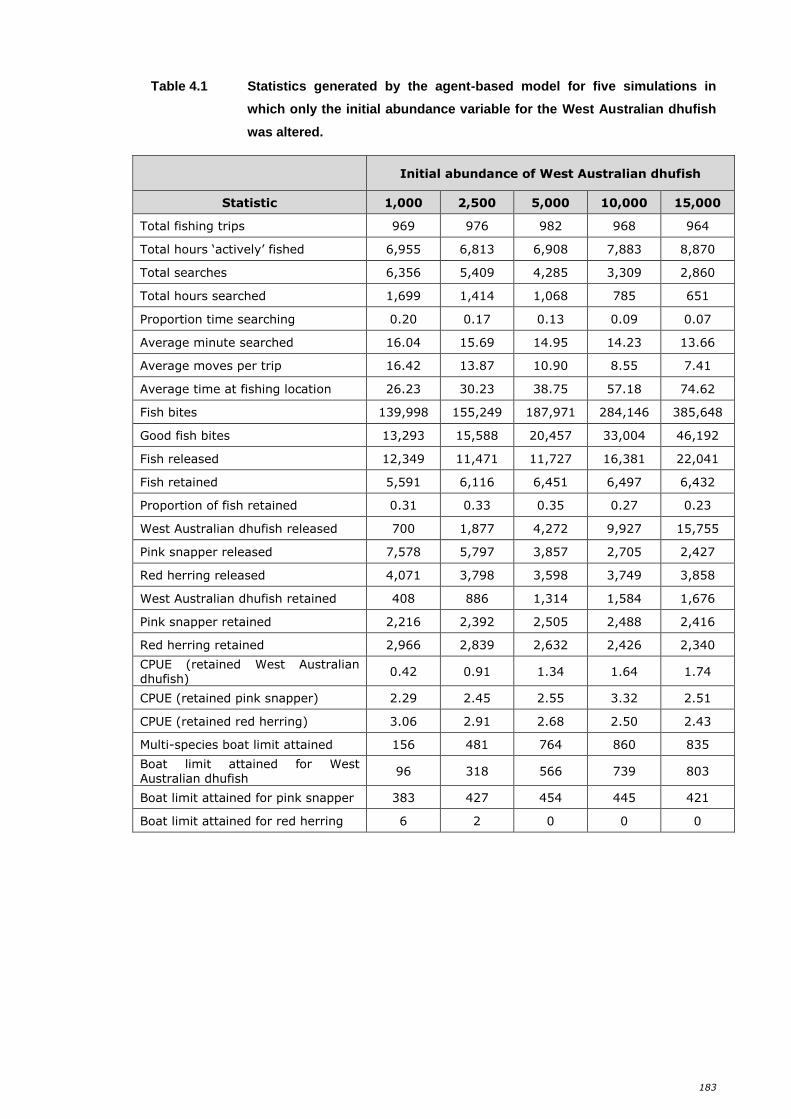
183
Table 4.1 Statistics generated by the agent-based model for five simulations in
which only the initial abundance variable for the West Australian dhufish
was altered.
Initial abundance of West Australian dhufish
Statistic 1,000 2,500 5,000 10,000 15,000
Total fishing trips 969 976 982 968 964
Total hours ‘actively’ fished 6,955 6,813 6,908 7,883 8,870
Total searches 6,356 5,409 4,285 3,309 2,860
Total hours searched 1,699 1,414 1,068 785 651
Proportion time searching 0.20 0.17 0.13 0.09 0.07
Average minute searched 16.04 15.69 14.95 14.23 13.66
Average moves per trip 16.42 13.87 10.90 8.55 7.41
Average time at fishing location 26.23 30.23 38.75 57.18 74.62
Fish bites 139,998 155,249 187,971 284,146 385,648
Good fish bites 13,293 15,588 20,457 33,004 46,192
Fish released 12,349 11,471 11,727 16,381 22,041
Fish retained 5,591 6,116 6,451 6,497 6,432
Proportion of fish retained 0.31 0.33 0.35 0.27 0.23
West Australian dhufish released 700 1,877 4,272 9,927 15,755
Pink snapper released 7,578 5,797 3,857 2,705 2,427
Red herring released 4,071 3,798 3,598 3,749 3,858
West Australian dhufish retained 408 886 1,314 1,584 1,676
Pink snapper retained 2,216 2,392 2,505 2,488 2,416
Red herring retained 2,966 2,839 2,632 2,426 2,340
CPUE (retained West Australian dhufish)
0.42 0.91 1.34 1.64 1.74
CPUE (retained pink snapper) 2.29 2.45 2.55 3.32 2.51
CPUE (retained red herring) 3.06 2.91 2.68 2.50 2.43
Multi-species boat limit attained 156 481 764 860 835
Boat limit attained for West Australian dhufish
96 318 566 739 803
Boat limit attained for pink snapper 383 427 454 445 421
Boat limit attained for red herring 6 2 0 0 0
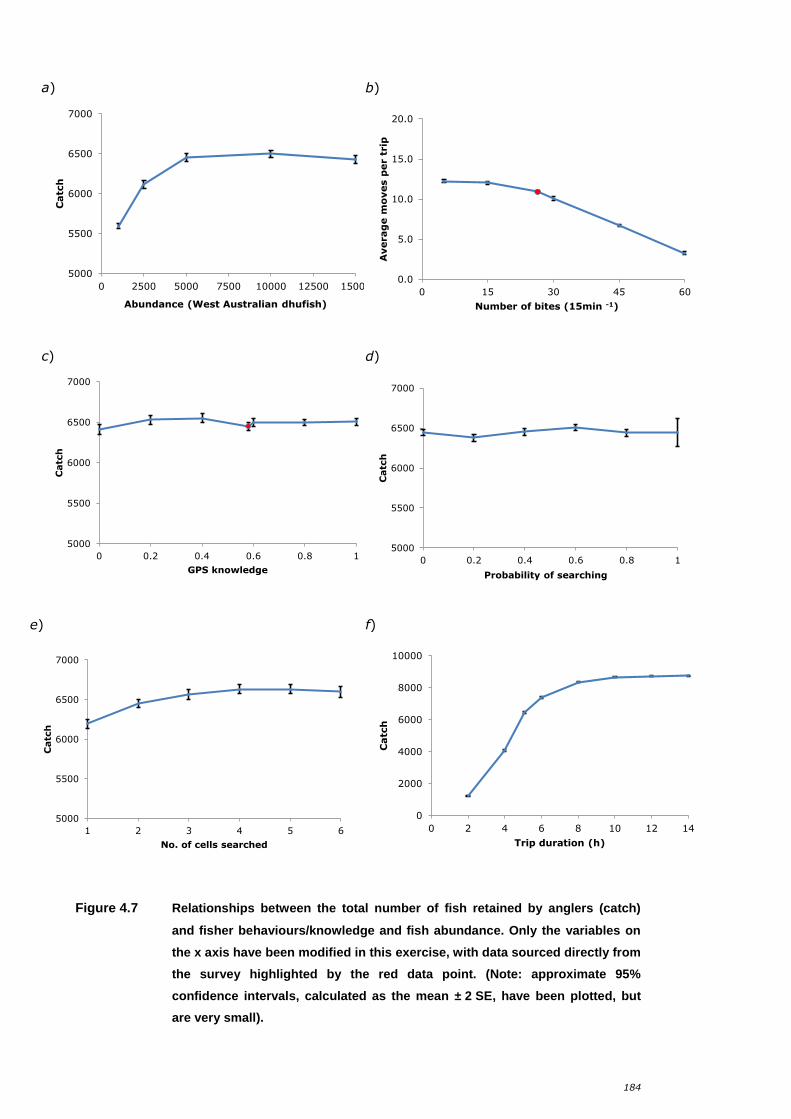
184
a)
b)
c)
d)
e)
f)
Figure 4.7 Relationships between the total number of fish retained by anglers (catch)
and fisher behaviours/knowledge and fish abundance. Only the variables on
the x axis have been modified in this exercise, with data sourced directly from
the survey highlighted by the red data point. (Note: approximate 95%
confidence intervals, calculated as the mean ± 2 SE, have been plotted, but
are very small).
5000
5500
6000
6500
7000
0 2500 5000 7500 10000 12500 15000
Catc
h
Abundance (West Australian dhufish)
0.0
5.0
10.0
15.0
20.0
0 15 30 45 60
Averag
e m
oves p
er t
rip
Number of bites (15min -1)
5000
5500
6000
6500
7000
0 0.2 0.4 0.6 0.8 1
Catc
h
GPS knowledge
5000
5500
6000
6500
7000
0 0.2 0.4 0.6 0.8 1
Catc
h
Probability of searching
5000
5500
6000
6500
7000
1 2 3 4 5 6
Catc
h
No. of cells searched
0
2000
4000
6000
8000
10000
0 2 4 6 8 10 12 14
Catc
h
Trip duration (h)
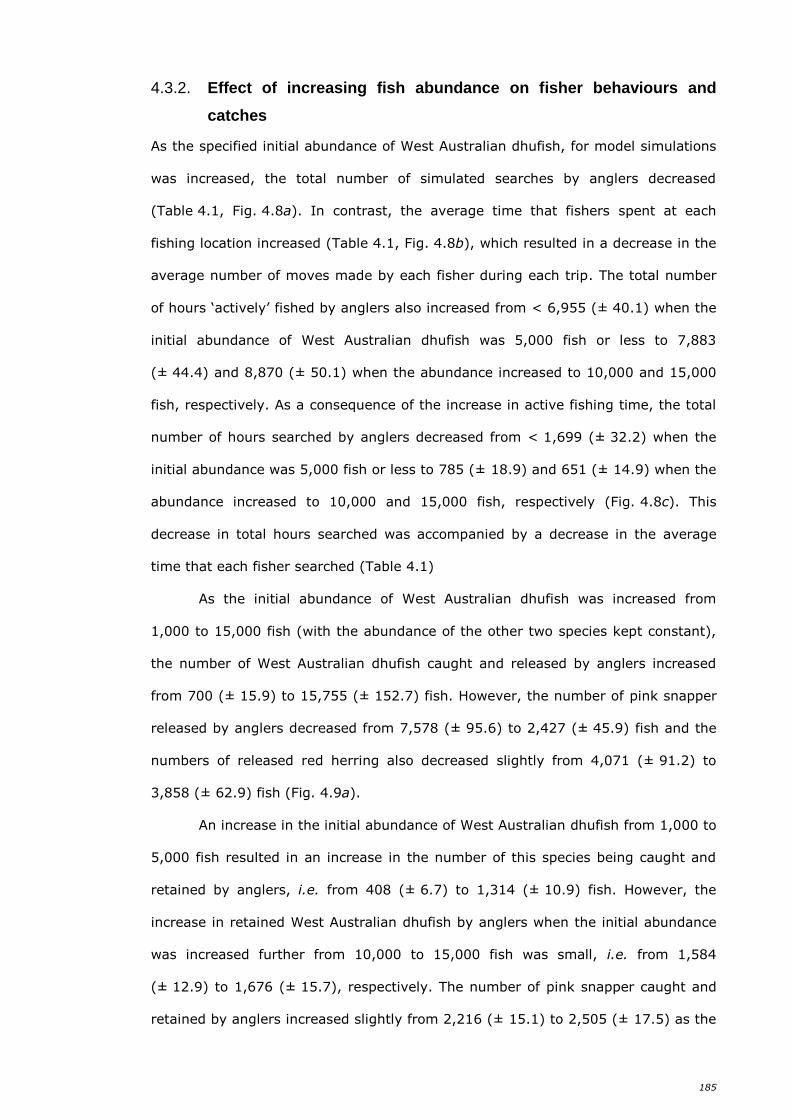
185
4.3.2. Effect of increasing fish abundance on fisher behaviours and
catches
As the specified initial abundance of West Australian dhufish, for model simulations
was increased, the total number of simulated searches by anglers decreased
(Table 4.1, Fig. 4.8a). In contrast, the average time that fishers spent at each
fishing location increased (Table 4.1, Fig. 4.8b), which resulted in a decrease in the
average number of moves made by each fisher during each trip. The total number
of hours ‘actively’ fished by anglers also increased from < 6,955 (± 40.1) when the
initial abundance of West Australian dhufish was 5,000 fish or less to 7,883
(± 44.4) and 8,870 (± 50.1) when the abundance increased to 10,000 and 15,000
fish, respectively. As a consequence of the increase in active fishing time, the total
number of hours searched by anglers decreased from < 1,699 (± 32.2) when the
initial abundance was 5,000 fish or less to 785 (± 18.9) and 651 (± 14.9) when the
abundance increased to 10,000 and 15,000 fish, respectively (Fig. 4.8c). This
decrease in total hours searched was accompanied by a decrease in the average
time that each fisher searched (Table 4.1)
As the initial abundance of West Australian dhufish was increased from
1,000 to 15,000 fish (with the abundance of the other two species kept constant),
the number of West Australian dhufish caught and released by anglers increased
from 700 (± 15.9) to 15,755 (± 152.7) fish. However, the number of pink snapper
released by anglers decreased from 7,578 (± 95.6) to 2,427 (± 45.9) fish and the
numbers of released red herring also decreased slightly from 4,071 (± 91.2) to
3,858 (± 62.9) fish (Fig. 4.9a).
An increase in the initial abundance of West Australian dhufish from 1,000 to
5,000 fish resulted in an increase in the number of this species being caught and
retained by anglers, i.e. from 408 (± 6.7) to 1,314 (± 10.9) fish. However, the
increase in retained West Australian dhufish by anglers when the initial abundance
was increased further from 10,000 to 15,000 fish was small, i.e. from 1,584
(± 12.9) to 1,676 (± 15.7), respectively. The number of pink snapper caught and
retained by anglers increased slightly from 2,216 (± 15.1) to 2,505 (± 17.5) as the
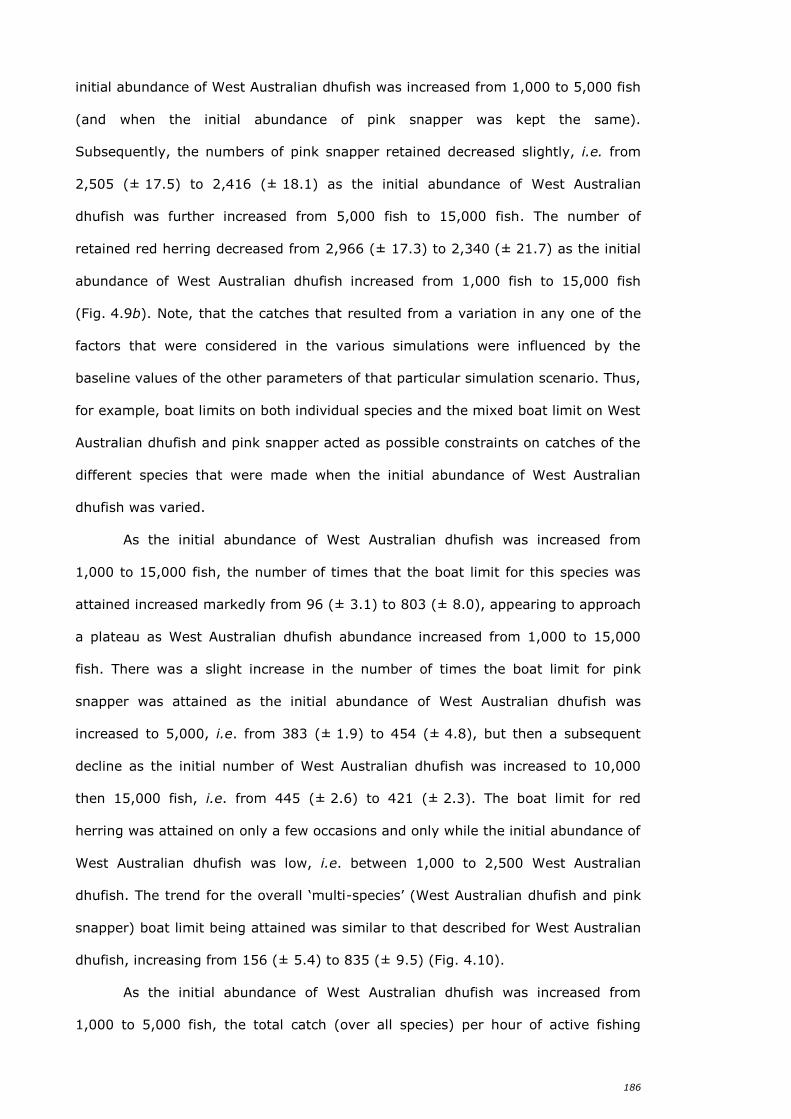
186
initial abundance of West Australian dhufish was increased from 1,000 to 5,000 fish
(and when the initial abundance of pink snapper was kept the same).
Subsequently, the numbers of pink snapper retained decreased slightly, i.e. from
2,505 (± 17.5) to 2,416 (± 18.1) as the initial abundance of West Australian
dhufish was further increased from 5,000 fish to 15,000 fish. The number of
retained red herring decreased from 2,966 (± 17.3) to 2,340 (± 21.7) as the initial
abundance of West Australian dhufish increased from 1,000 fish to 15,000 fish
(Fig. 4.9b). Note, that the catches that resulted from a variation in any one of the
factors that were considered in the various simulations were influenced by the
baseline values of the other parameters of that particular simulation scenario. Thus,
for example, boat limits on both individual species and the mixed boat limit on West
Australian dhufish and pink snapper acted as possible constraints on catches of the
different species that were made when the initial abundance of West Australian
dhufish was varied.
As the initial abundance of West Australian dhufish was increased from
1,000 to 15,000 fish, the number of times that the boat limit for this species was
attained increased markedly from 96 (± 3.1) to 803 (± 8.0), appearing to approach
a plateau as West Australian dhufish abundance increased from 1,000 to 15,000
fish. There was a slight increase in the number of times the boat limit for pink
snapper was attained as the initial abundance of West Australian dhufish was
increased to 5,000, i.e. from 383 (± 1.9) to 454 (± 4.8), but then a subsequent
decline as the initial number of West Australian dhufish was increased to 10,000
then 15,000 fish, i.e. from 445 (± 2.6) to 421 (± 2.3). The boat limit for red
herring was attained on only a few occasions and only while the initial abundance of
West Australian dhufish was low, i.e. between 1,000 to 2,500 West Australian
dhufish. The trend for the overall ‘multi-species’ (West Australian dhufish and pink
snapper) boat limit being attained was similar to that described for West Australian
dhufish, increasing from 156 (± 5.4) to 835 (± 9.5) (Fig. 4.10).
As the initial abundance of West Australian dhufish was increased from
1,000 to 5,000 fish, the total catch (over all species) per hour of active fishing
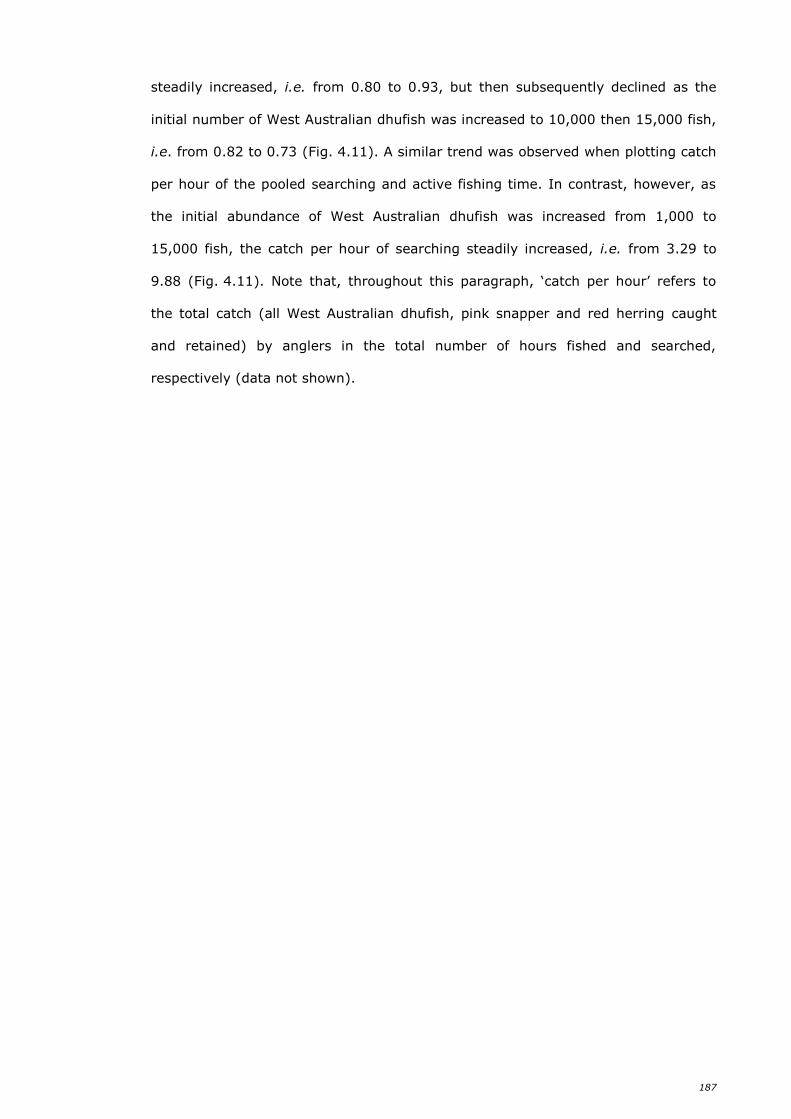
187
steadily increased, i.e. from 0.80 to 0.93, but then subsequently declined as the
initial number of West Australian dhufish was increased to 10,000 then 15,000 fish,
i.e. from 0.82 to 0.73 (Fig. 4.11). A similar trend was observed when plotting catch
per hour of the pooled searching and active fishing time. In contrast, however, as
the initial abundance of West Australian dhufish was increased from 1,000 to
15,000 fish, the catch per hour of searching steadily increased, i.e. from 3.29 to
9.88 (Fig. 4.11). Note that, throughout this paragraph, ‘catch per hour’ refers to
the total catch (all West Australian dhufish, pink snapper and red herring caught
and retained) by anglers in the total number of hours fished and searched,
respectively (data not shown).
188
a)
b)
c)
Figure 4.8 Relationships with initial abundance of West Australian dhufish of the (a)
Number of searches, (b) Average time anglers spent at each fishing location,
and the (c) Total number of hours actively fished and searched by anglers.
The initial abundances of pink snapper and ‘red herring’ (silver trevally) were
held constant. (Note: approximate 95% CIs, calculated as the mean ± 2 SE,
have been plotted, but are very small).
0
2000
4000
6000
8000
0 2500 5000 7500 10000 12500 15000
To
tal
search
es
Abundance (West Australian dhufish)
0
15
30
45
60
75
90
0 2500 5000 7500 10000 12500 15000
Ave.
tim
e a
t fi
sh
ing
locati
on
Abundance (West Australian dhufish)
0
2000
4000
6000
8000
10000
0 2500 5000 7500 10000 12500 15000
To
tal
ho
urs
Abundance (West Australian dhufish)
Total hoursfished
Total hourssearched
189
a)
b)
Figure 4.9 Relationships with initial abundance of West Australian dhufish of the (a)
Number of individuals released by anglers, and the (b) Number of
individuals retained by anglers. The initial abundances of pink snapper
and ‘red herring’ (silver trevally) were held constant. (Note: approximate
95% CIs, calculated as the mean ± 2 SE, have been plotted, they are just
very small).
0
5000
10000
15000
20000
0 2500 5000 7500 10000 12500 15000
Fis
h r
ele
ased
Abundance (West Australian dhufish)
West AustraliandhufishPink snapper
Red Herring
0
1000
2000
3000
4000
5000
0 2500 5000 7500 10000 12500 15000
Fis
h r
eta
ined
Abundance (West Australian dhufish)
West AustraliandhufishPink snapper
Red Herring
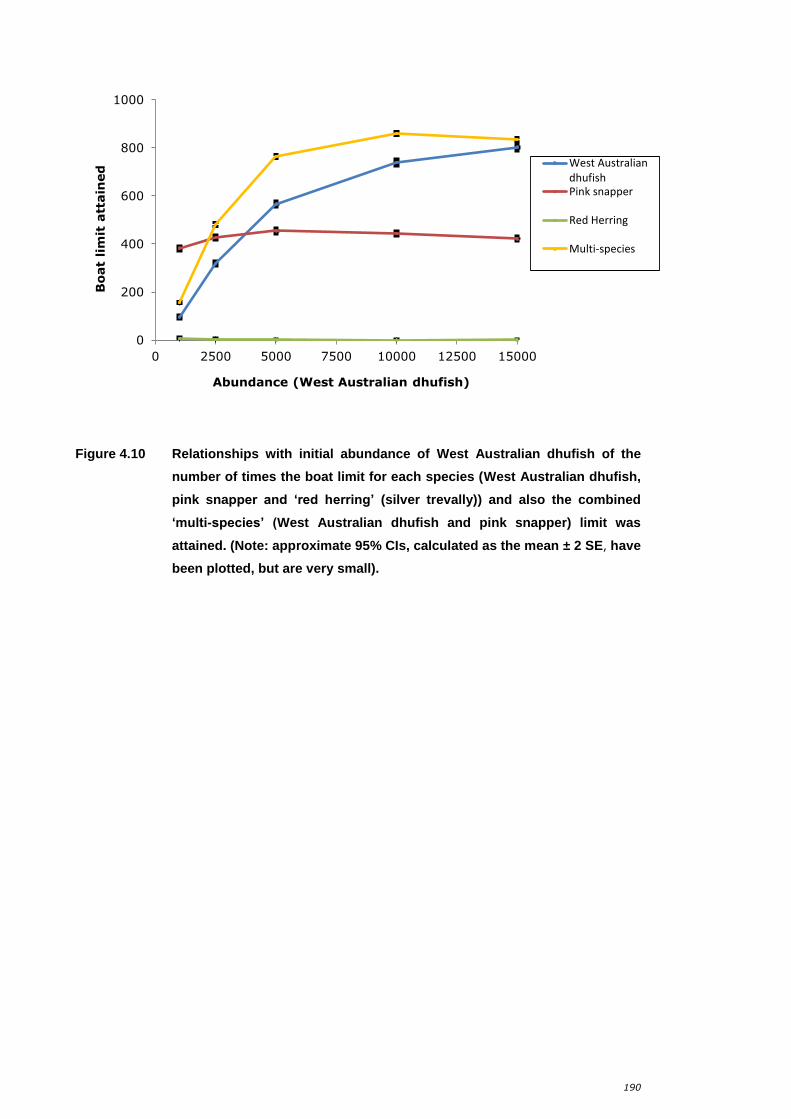
190
Figure 4.10 Relationships with initial abundance of West Australian dhufish of the
number of times the boat limit for each species (West Australian dhufish,
pink snapper and ‘red herring’ (silver trevally)) and also the combined
‘multi-species’ (West Australian dhufish and pink snapper) limit was
attained. (Note: approximate 95% CIs, calculated as the mean ± 2 SE, have
been plotted, but are very small).
0
200
400
600
800
1000
0 2500 5000 7500 10000 12500 15000
Bo
at
lim
it a
ttain
ed
Abundance (West Australian dhufish)
West AustraliandhufishPink snapper
Red Herring
Multi-species
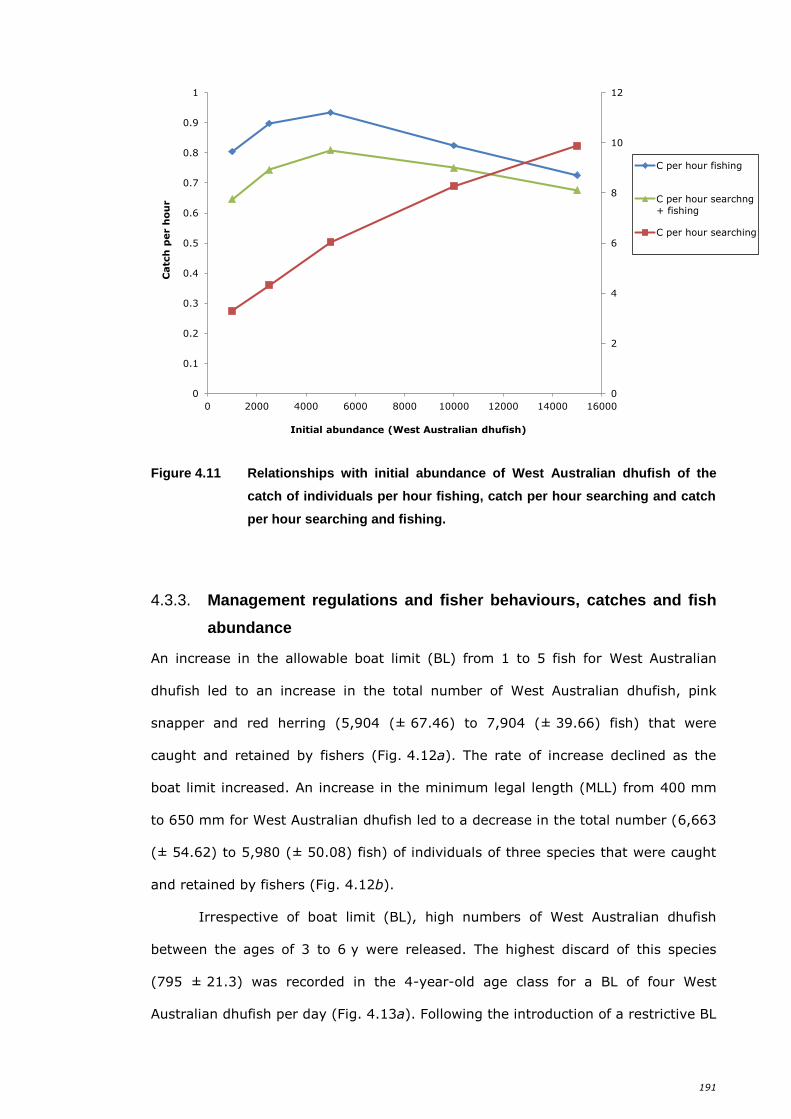
191
Figure 4.11 Relationships with initial abundance of West Australian dhufish of the
catch of individuals per hour fishing, catch per hour searching and catch
per hour searching and fishing.
4.3.3. Management regulations and fisher behaviours, catches and fish
abundance
An increase in the allowable boat limit (BL) from 1 to 5 fish for West Australian
dhufish led to an increase in the total number of West Australian dhufish, pink
snapper and red herring (5,904 (± 67.46) to 7,904 (± 39.66) fish) that were
caught and retained by fishers (Fig. 4.12a). The rate of increase declined as the
boat limit increased. An increase in the minimum legal length (MLL) from 400 mm
to 650 mm for West Australian dhufish led to a decrease in the total number (6,663
(± 54.62) to 5,980 (± 50.08) fish) of individuals of three species that were caught
and retained by fishers (Fig. 4.12b).
Irrespective of boat limit (BL), high numbers of West Australian dhufish
between the ages of 3 to 6 y were released. The highest discard of this species
(795 ± 21.3) was recorded in the 4-year-old age class for a BL of four West
Australian dhufish per day (Fig. 4.13a). Following the introduction of a restrictive BL
0
2
4
6
8
10
12
0
0.1
0.2
0.3
0.4
0.5
0.6
0.7
0.8
0.9
1
0 2000 4000 6000 8000 10000 12000 14000 16000
Catc
h p
er h
ou
r
Initial abundance (West Australian dhufish)
C per hour fishing
C per hour searchng
+ fishing
C per hour searching
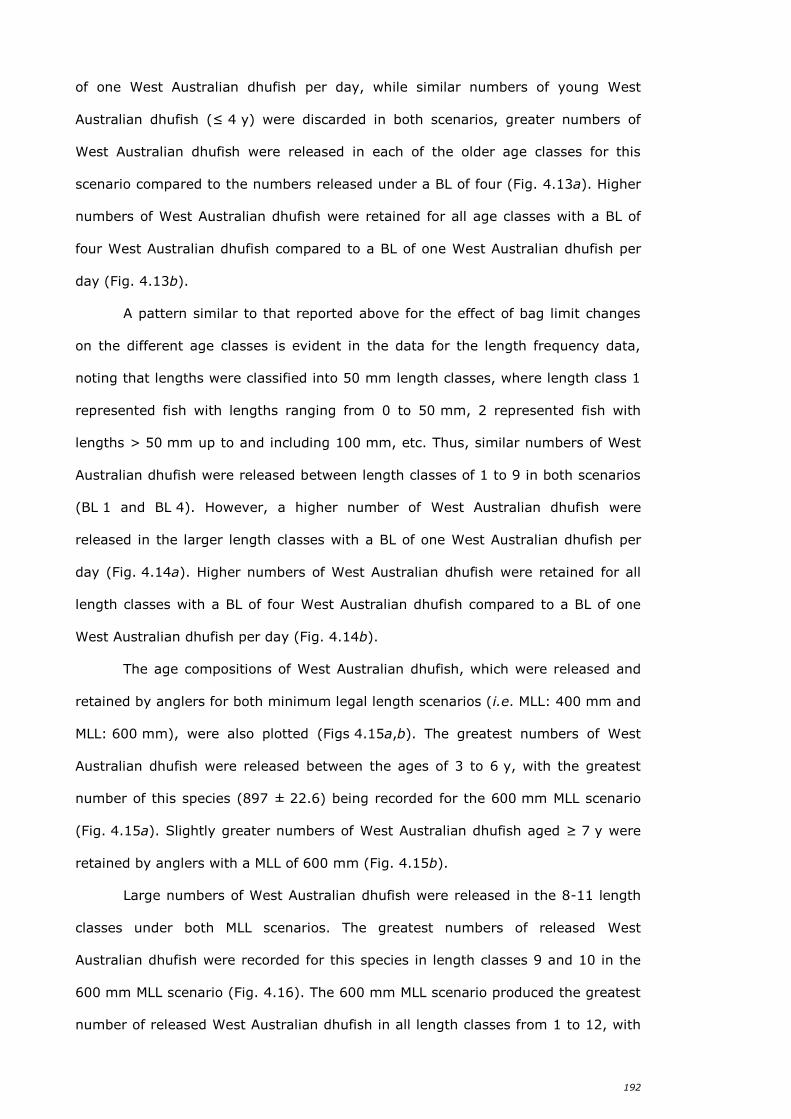
192
of one West Australian dhufish per day, while similar numbers of young West
Australian dhufish (≤ 4 y) were discarded in both scenarios, greater numbers of
West Australian dhufish were released in each of the older age classes for this
scenario compared to the numbers released under a BL of four (Fig. 4.13a). Higher
numbers of West Australian dhufish were retained for all age classes with a BL of
four West Australian dhufish compared to a BL of one West Australian dhufish per
day (Fig. 4.13b).
A pattern similar to that reported above for the effect of bag limit changes
on the different age classes is evident in the data for the length frequency data,
noting that lengths were classified into 50 mm length classes, where length class 1
represented fish with lengths ranging from 0 to 50 mm, 2 represented fish with
lengths > 50 mm up to and including 100 mm, etc. Thus, similar numbers of West
Australian dhufish were released between length classes of 1 to 9 in both scenarios
(BL 1 and BL 4). However, a higher number of West Australian dhufish were
released in the larger length classes with a BL of one West Australian dhufish per
day (Fig. 4.14a). Higher numbers of West Australian dhufish were retained for all
length classes with a BL of four West Australian dhufish compared to a BL of one
West Australian dhufish per day (Fig. 4.14b).
The age compositions of West Australian dhufish, which were released and
retained by anglers for both minimum legal length scenarios (i.e. MLL: 400 mm and
MLL: 600 mm), were also plotted (Figs 4.15a,b). The greatest numbers of West
Australian dhufish were released between the ages of 3 to 6 y, with the greatest
number of this species (897 ± 22.6) being recorded for the 600 mm MLL scenario
(Fig. 4.15a). Slightly greater numbers of West Australian dhufish aged ≥ 7 y were
retained by anglers with a MLL of 600 mm (Fig. 4.15b).
Large numbers of West Australian dhufish were released in the 8-11 length
classes under both MLL scenarios. The greatest numbers of released West
Australian dhufish were recorded for this species in length classes 9 and 10 in the
600 mm MLL scenario (Fig. 4.16). The 600 mm MLL scenario produced the greatest
number of released West Australian dhufish in all length classes from 1 to 12, with
193
the 400 mm MLL scenario resulting in the greatest number of released West
Australian dhufish in the remaining length classes (13 to 22) (Fig. 4.16a). The
400 mm MLL scenario was the only scenario for which this species were recorded as
being retained in length classes 9 and 10, with 141 (± 4.1) and 141 (± 3.8) West
Australian dhufish retained, respectively (Fig. 4.16b).
a)
b)
Figure 4.12 Relationship between the total number of fish retained by anglers (catch) and
changes to the management regulations of (a) the allowable boat limit of West
Australian dhufish and (b) the minimum legal length (MLL) of West Australian
dhufish. (Note: approximate 95% CIs, calculated as the mean ± 2 SE, have
been plotted, but are very small).
5000
5500
6000
6500
7000
7500
1 2 3 4 5
Reta
ined
catc
h
Boat limit
5000
5500
6000
6500
7000
7500
400 450 500 550 600 650
Reta
ined
catc
h
MLL (mm)
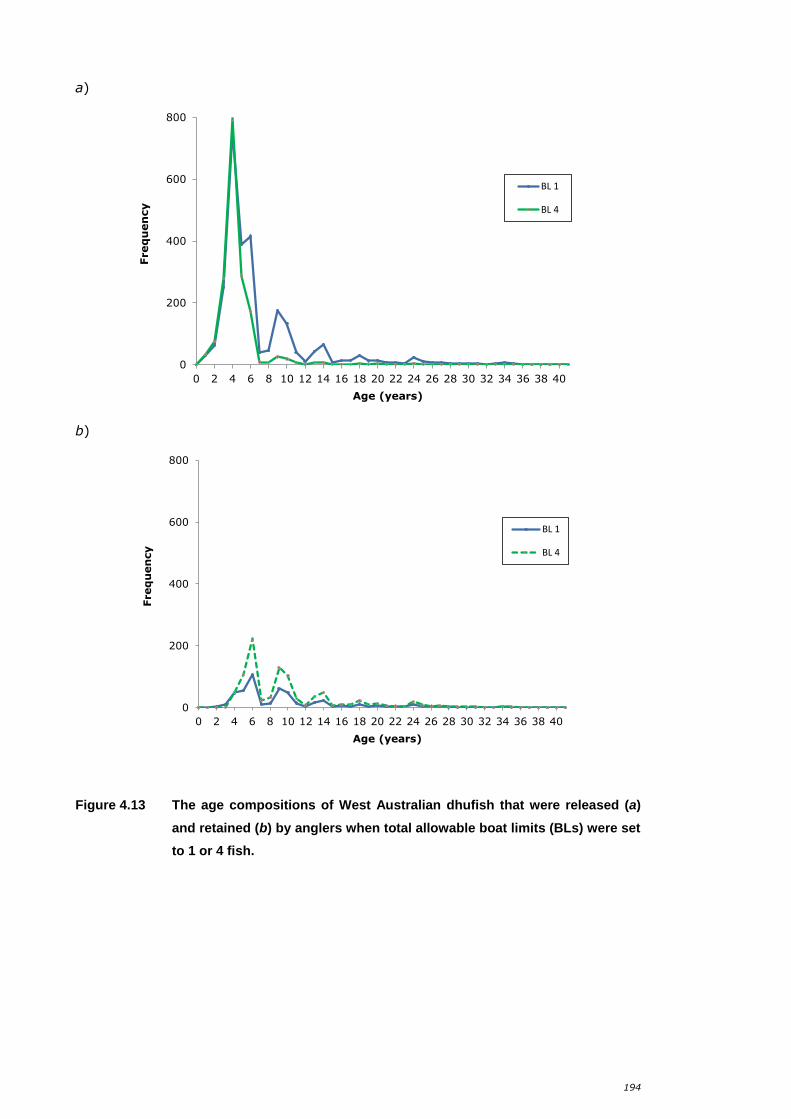
194
a)
b)
Figure 4.13 The age compositions of West Australian dhufish that were released (a)
and retained (b) by anglers when total allowable boat limits (BLs) were set
to 1 or 4 fish.
0
200
400
600
800
0 2 4 6 8 10 12 14 16 18 20 22 24 26 28 30 32 34 36 38 40
Freq
uen
cy
Age (years)
BL 1
BL 4
0
200
400
600
800
0 2 4 6 8 10 12 14 16 18 20 22 24 26 28 30 32 34 36 38 40
Freq
uen
cy
Age (years)
BL 1
BL 4
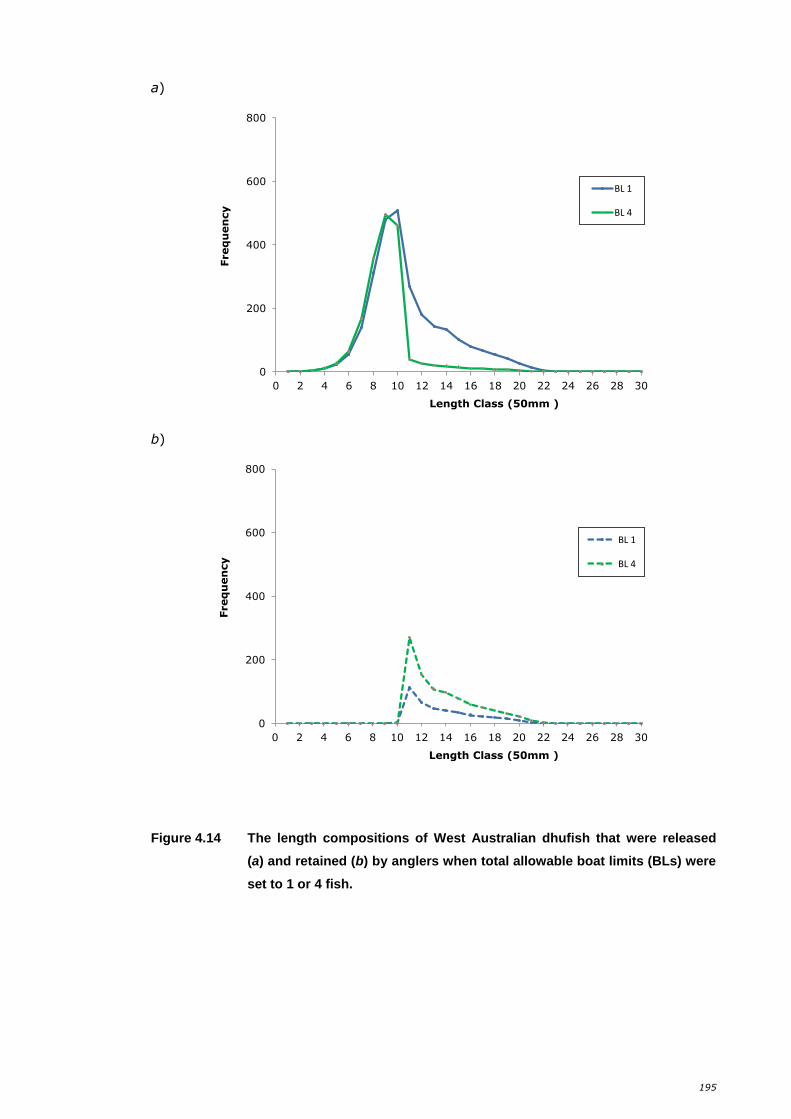
195
a)
b)
Figure 4.14 The length compositions of West Australian dhufish that were released
(a) and retained (b) by anglers when total allowable boat limits (BLs) were
set to 1 or 4 fish.
0
200
400
600
800
0 2 4 6 8 10 12 14 16 18 20 22 24 26 28 30
Freq
uen
cy
Length Class (50mm )
BL 1
BL 4
0
200
400
600
800
0 2 4 6 8 10 12 14 16 18 20 22 24 26 28 30
Freq
uen
cy
Length Class (50mm )
BL 1
BL 4
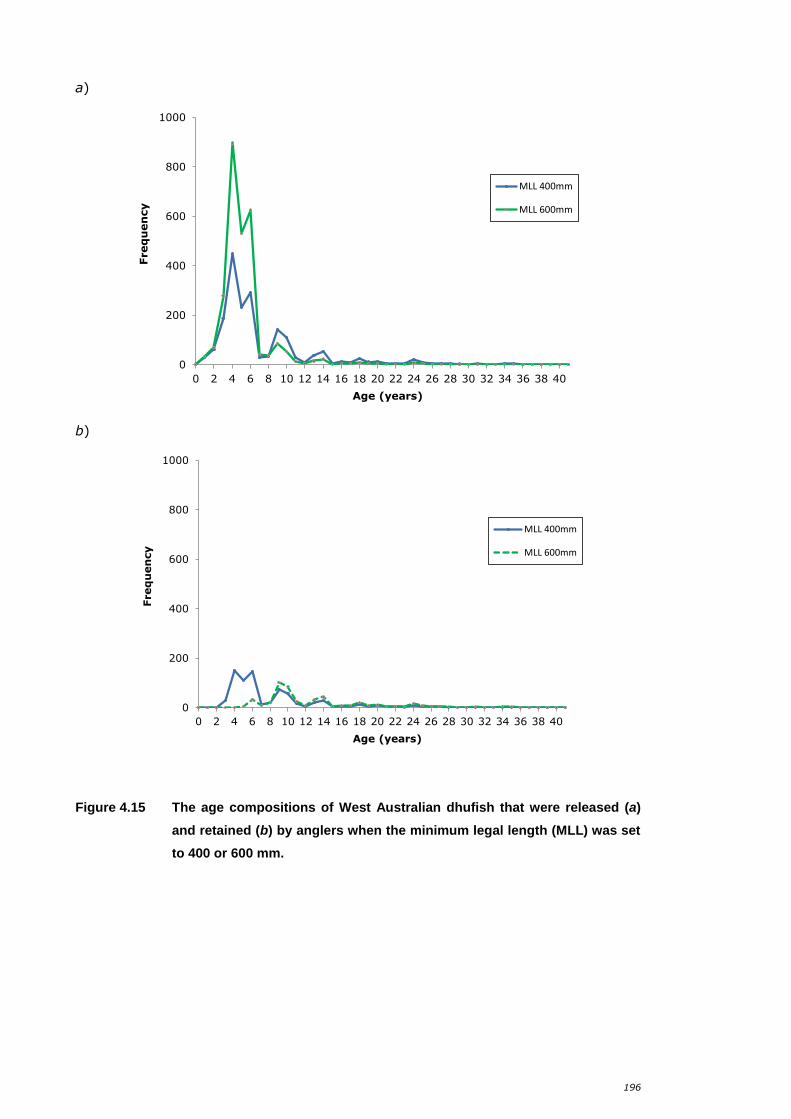
196
a)
b)
Figure 4.15 The age compositions of West Australian dhufish that were released (a)
and retained (b) by anglers when the minimum legal length (MLL) was set
to 400 or 600 mm.
0
200
400
600
800
1000
0 2 4 6 8 10 12 14 16 18 20 22 24 26 28 30 32 34 36 38 40
Freq
uen
cy
Age (years)
MLL 400mm
MLL 600mm
0
200
400
600
800
1000
0 2 4 6 8 10 12 14 16 18 20 22 24 26 28 30 32 34 36 38 40
Freq
uen
cy
Age (years)
MLL 400mm
MLL 600mm
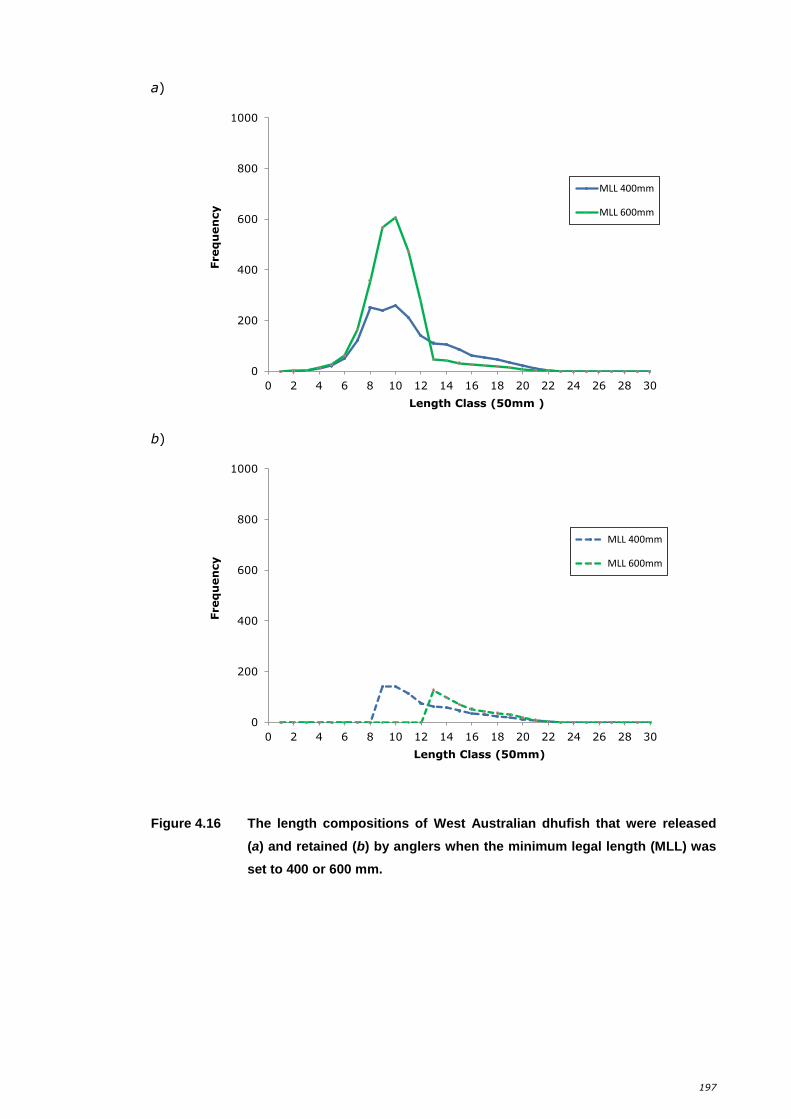
197
a)
b)
Figure 4.16 The length compositions of West Australian dhufish that were released
(a) and retained (b) by anglers when the minimum legal length (MLL) was
set to 400 or 600 mm.
0
200
400
600
800
1000
0 2 4 6 8 10 12 14 16 18 20 22 24 26 28 30
Freq
uen
cy
Length Class (50mm )
MLL 400mm
MLL 600mm
0
200
400
600
800
1000
0 2 4 6 8 10 12 14 16 18 20 22 24 26 28 30
Freq
uen
cy
Length Class (50mm)
MLL 400mm
MLL 600mm
198
Discussion 4.4.
4.4.1. Fisher behaviours/knowledge and catches, and fish abundance
As hypothesised, model simulations demonstrated strong relationships between
West Australian dhufish catch and variables such as initial West Australian dhufish
abundance, bite rate and trip duration. Catch levels tended to ‘level off’ or approach
a plateau once a certain level of initial West Australian dhufish abundance or trip
duration had been reached, i.e. 5,000 initial fish for abundance and an angler’s trip
duration of 8 h or more. These results appear logical given that, in the model (as in
the actual fishery), a daily boat limit of two West Australian dhufish (G. hebraicum)
was imposed. Note also that the model simulations only run for one year, thus, if
the model was extended to enable simulations over multiple years (i.e. with
recruitment of fish each year, according to a stock recruitment relationship), we
may see very different trends appearing. Therefore, although the overall fishing
experience may be diminished or limited in terms of how many fish an angler is
allowed to catch, such that it does not matter whether an angler stays out longer
fishing or whether there are more fish, a fisher still cannot take home any more
West Australian dhufish than the allowable bag or boat limit. However, in terms of
conservation and overall sustainability of the stock, such issues raise concerns that
(a) increases in discard mortality of this iconic species may result if bag limits are
reduced and fishers continue to fish for other species while releasing fish in excess
of the bag limit (Coleman et al., 2004; Stephenson and Jackson, 2005), and (b) the
potential for upsizing (high-grading) of catches is likely to increase if more
restrictive bag limits are imposed (Arlinghaus, 2004; St John and Syers, 2005). In
response to these concerns, it should be noted that results of the angler surveys
(Chapter 2 and 3) suggested that the more avid the fisher is the more likely he is to
catch his bag limit and then head home.
The finding that total catch remained largely unchanged when plotted
against initial ‘GPS knowledge’ reflected the ability of simulated anglers to quickly
learn and adapt by updating their storage of known fishing locations based on
199
finding of new locations and recent fishing experience at different locations. Such
behaviour is typical of agents capable of making independent decisions, essentially
an important characteristic making the agents active rather purely passive within
the model (Jennings, 2000; Macal and North, 2007). Furthermore, specialisation
theory would suggest that the more avid and specialised the fisher is, the more
likely he would have a greater knowledge of the use of technology and skill in
locating good fishing locations and would also be expected to possess knowledge of
a number of high quality fishing locations (Ditton et al., 1992; Wilde et al., 1998).
Thus, these results reflect the likely situation for an avid fisher.
As described by Hunt et al. (2011), experienced and specialised anglers are
very efficient at locating optimum fishing locations, catching target fish and are also
highly adaptable to new fishing areas. Thus, it might be expected, for example, if a
highly experienced fisher went on a fishing holiday in a new area, he/she would be
likely to very quickly determine how to find good fishing locations and catch fish
within that area. This would be less likely to be true for a novice angler, however,
implying that past ‘GPS knowledge’ is more important for the non-avid or novice
fisher. To explore this further, the learning ability of anglers could be changed in
the simulation by simply switching off the learning function for ‘GPS knowledge’,
thus running the simulation with fisher agents who have a reduced ability to ‘learn’.
Such simulations could provide insight regarding how much/what type ‘intelligence’
is required by agents to maintain a good catch rate in a particular type of fishery.
Similar “experiments” have been undertaken with ‘zero-intelligence’ (ZI) agents in
the discipline of economics, with these ZI agents performing well when subjected to
simple budget constraints and rules within the model (see Gode and Sunder,
1993; 1997; Duffy and Ünver, 2006).
The finding that catches approached a plateau as the number of grid cells
searched by anglers was increased supports the concept of ‘optimum fishing tactics’
(sensu Beverton and Holt, 1957; Sampson, 1991) that there is an optimal trade-off
between increasing search time to enhance the chances of finding an excellent
fishing location versus increasing catch rates by maximising the time actually spent
200
fishing (Eales and Wilen, 1986; Sampson, 1991; 1994). Note also that the value of
increasing search time would diminish for anglers who already possess knowledge
of numerous high quality fishing locations, a factor that could be assessed by
modifying the model and undertaking further simulations. In summary, the results
lend support to the conclusion that, at a fine scale, fishers adjust various
behaviours to optimise their fishing efficiency and thereby be able to maintain catch
rates. It is this ability to adapt and ultimately respond to changes in their
environment that ‘makes a good fisher a good fisher’.
4.4.2. Fish abundance on fisher behaviours and catches
In a previous study, Sampson (1994) concluded that the best strategy for an angler
to maximise fishing success during a fishing trip is to fish at their single ‘best’
fishing location, as any move from this location would be likely to result in lower
catch rates. However, this study indicated that when overall fish abundance is low,
fishers are likely to undertake more searches and decrease the amount of time they
spend at a given fishing location, in order to find locations with higher abundances
of fish and thereby improve their catch rates. However, when fish abundances are
higher, fishers are likely to benefit by spending a greater amount of time at each
fishing location. Note also that, as the abundance of the fish population decreases,
catch rates fall and fishers spend more time searching, the quality attribute of a
fishing trip will be reduced (Cameron and Huppert, 1989).
The simulation result of fishers staying longer at fishing locations and thus,
also reducing the number of searches they undertake when fish abundance is high,
is further supported by the notion of Moustakes (2006), who noted that, while
boats are catching fish, they have an incentive to stay where they are, and
ultimately their willingness to move depends on how ready they are to accept the
risk of giving up known catches in their present location for the chance of higher
catches elsewhere. Knowledge of the total number of searches or time spent
searching by anglers can also potentially reveal the extent to which fishers are
maintaining their catch levels through searching to find patches of greater local
abundance and thus address the potential that observed catch rates exhibit hyper-
201
stability. Such data could be used by researchers and managers to assist in drawing
inferences on the population status of the stock. This area of investigation differs
from the more commonly used assumption in stock assessments that there is direct
proportionality between CPUEs and abundance. Issues pertaining to hyper-
depletion for certain species, however, would still need to be considered (Hilborn
and Walters, 1992; Gaertner, 2010). In terms of management, it is also relevant
that, despite the patchy distribution often exhibited by demersal species such as
West Australian dhufish (St John and Syers, 2005), fishers with sufficient
knowledge and fishing technology may still readily exploit fish populations even
when their abundances are low (Post et al., 2002).
The simulations indicated that the numbers of West Australian dhufish
caught and released by anglers in model simulations may be substantial even when
fish population abundances are high, which presumably reflected the impact of
fishing regulations (i.e. the imposed daily boat limit for this species, mixed species
daily boat limit, and minimum size limit). As noted by Gentner and Sutton (2008),
most anglers, particularly those heavily invested in fishing (i.e. the more and avid
and specialised fisher), will not entirely cease fishing but are more likely to switch
to a new target species when more stringent management measures are
introduced. Thus, this type of agent based model is potentially useful for examining
the effects of alternative management actions on levels of bycatch and discarding
of fish in a multi-species fishery. Results from the study suggest that an effort shift
between different fish species is seen when West Australian dhufish abundance is
low, with a greater number of searches undertaken by agents and more numbers of
pink snapper and ‘red herring’ being caught and retained by anglers. Such results
highlight the potential for changes in the exploitation rates of species not directly
affected by the imposed regulatory change. Further, if these effort shifts by anglers
are unknown or unanticipated, they can ultimately undermine management goals
and reduce or negate the expected benefits of fisheries management (Busch et al.,
2003; Sutton and Ditton, 2005; Gentner and Sutton, 2008).
202
The simulation results also indicated that the trade-off between time spent
fishing and time spent searching by the angler is influenced by management, e.g.
boat limits (BL). These results suggest that changes in fisher behaviour, in
response to changing abundance and constraints imposed by boat limits may cause
changes in the level of exploitation of an alternative fish species and, consequently,
a subsequent change in the abundance of that species.
Anglers base their decisions on fishing and allocate their efforts based on
several factors, such as the quality of the fishery and the travel time and costs to
access the fishing opportunity (Post et al., 2008). In model simulations, fishers
responded to a lower abundance of West Australian dhufish by moving to new cells
more frequently, thereby presumably distributing fishing effort over a greater
number of grid cells and a wider range of habitats. The results also indicated that
this change in fishing effort may result in fishers catching a greater abundance of
non-target species (i.e. ‘red herring’) than that which would have been occurred if
the fishers had not increased their frequency of movement (Genter and Sutton,
2004; Sutton and Ditton, 2005). This view is consistent with conclusions from
previous studies, i.e. that anglers, like all natural predators, make decisions and
change their foraging behaviours in response to prey populations (Sampson, 1991),
including switching of target species. As described by Metcalf et al. (2010), such
target switching in commercial fisheries in response to changing economic values or
variation in abundance is a relatively common occurrence but has rarely been
investigated in recreational fisheries.
As the “rules” determining the behaviour of fishers within the agent-based
model of the current study did not include target switching, the increased landings
of pink snapper and ‘red herring’ that resulted from reduced abundance of West
Australian dhufish, however, cannot be attributed directly to ‘target switching’, but
rather reflect changes in movements of fishers. The fact that, for some species in
some fisheries, such an increase in frequency of movement has the potential to
produce an effect on catches similar that which might be expected as a result of
target-switching is interesting, as it suggests that some changes in catches that
203
have previously been attributed to target switching might simply be due to a
changed frequency of movement by fishers. The efficiency of the modern angler
can also not be overlooked as improved technologies, i.e. vessel design, vessel
power fish locating devices etc., have enabled fishers to cover more ground per unit
effort thus allowing fishers to search for, find, and exploit fish populations even
when their abundance is low (Greenstreet et al., 1999; Post et al., 2002).
A lower abundance of West Australian dhufish also resulted in far fewer
fishers attaining their boat limits for that species or the mixed boat limit for West
Australian dhufish and pink snapper, thereby having the potential to increase the
total catch of that latter species. Thus, the simulations indicate that a change in the
abundance of a primary target species can have a major impact on the dynamics of
a fishery, by modifying the behaviours of anglers and ultimately influencing catches
of the target and other species, and thus, in turn, the effectiveness of management
measures for other species. As discussed by Sutton and Ditton (2005), in a
multispecies fishery, anglers may have resource (i.e. fish species) substitution
options that do not require a shift in their fishing location. However, it is important
to note that in a real life scenario, personal characteristics of anglers (including the
emotional attachment they may hold for targeting a specific species) are also
expected to influence their willingness to target a substitute species, as this would
also likely require a shift in expectations of the fishing outcome (Genter and Sutton,
2004; Sutton and Ditton 2005; Johnston et al., 2010). In the context of
specialisation theory, more avid and specialised anglers who, because of their
strong commitment to fishing, have refined their fishing skills and invested in
expensive fishing equipment, are less likely to obtain the same satisfaction from an
alternative type of fishing as that which they enjoy from their preferred type of
fishing (Sutton and Ditton, 2005).
It was expected that, as initial abundances of West Australian dhufish were
increased, the retained catch per hour of active fishing would first increase
approximately linearly with abundance then, as catches became increasingly
constrained by boat limits, the catch rates would approach an asymptote. A similar
204
result had been expected for the catch per hour of combined active fishing and
searching, i.e. total time at sea. In contrast, it had been anticipated that catch per
hour of searching would increase approximately linearly as the initial abundance of
West Australian dhufish was increased. While the last of these expectations was
realised, i.e. catch per hour of searching increased linearly with increasing
abundance, contrary to expectation, the resulting catches per hour of active or total
fishing first increased towards a peak then declined as initial West Australian
dhufish abundance was further increased. This unexpected decline with greater
initial abundance of West Australian dhufish is attributed to the fact that, with
increased abundance of West Australian dhufish coupled with release of fish in
excess of the boat limit, the bite rate at each fishing location remained sufficiently
high to reduce the incentive for fishers to move. This is likely to have resulted in
‘local depletion’, thereby reducing the catch per hour of active or total fishing. As
noted by Post et al. (2008), the spatial dynamics of angler behaviour is an
important feature of recreational fisheries as a more active management of
fisheries distributed over landscapes is adopted in response to increasing pressure
on fish stocks. Thus, these results have important implications for fisheries
scientists as it suggests that, rather than employing retained recreational catch per
unit of active fishing effort as a measure of abundance, there may be benefit in
using recreational catch per unit of searching time as a more reliable index of
abundance for some species.
Although not considered in the current study, it might be useful to use the
ABM to assess the value of using the number of bites per hour of fishing at each
fishing location as a measure of abundance at that location. It is highly likely,
however, that the average number of bites per hour for the region would be biased
by movement of recreational anglers from locations at which the bite rate is low.
The extent to which commercial fishers (presumed to behave similarly) might also
influence the relationship between commercial catch per unit of fishing effort and
abundance, through their behavioural response to observed catch rates, should be
investigated.
205
4.4.3. Management regulations and fisher behaviours, catches and fish
abundance
A common management response to a decline in abundance of a fish stock (and an
associated decline in angling catch rates) to a level that is considered unsustainable
is the imposition of regulations to reduce harvest (Radomski et al., 2001; Post et
al., 2002). As would be expected, a decrease in the daily allowable boat limit (BL)
resulted in a decrease in the retained catch of West Australian dhufish by anglers.
Similarly, an increase in the minimum legal length (MLL) resulted in the retained
catch (of West Australian dhufish) decreasing. These results indicate that both
types of management regulation are effective in reducing retained catches of a
species. It is important to note, however, that an increase in MLL resulted in a
decrease in retained catch numbers, but the decline by weight may be less evident
because the average weights of the retained catch will be greater. Further, as a
consequence of anglers’ responses, changes in both the BL and MLL may have
unintended consequences for the effectiveness of current management measures
for the multispecies recreational fishery. Thus, for example, modified fishery
regulations may produce issues relating to increased discarding with associated
mortality of released fish and possible high-grading of individuals that are retained
(Gillis et al., 1995; Coleman et al., 2004; Branch et al., 2006), or target-
switching/species substitution by anglers (see above), thereby causing effort shifts
and changes in exploitation rates of species not directly affected by the regulatory
change (Sutton and Ditton, 2005). Thus, the implications of anglers’ behavioural
responses to changes in regulations for the effectiveness of those regulations and
their effect on other species may best be understood through explorations using an
agent-based model such as that used in this study.
The results from the study indicating that decreasing the boat limit or
increasing the MLL of West Australian dhufish would result in larger numbers of fish
being caught and ultimately released (due to the number of retained fish being in
excess of the boat limit or fish being undersized, respectively) was expected, as a
fisher seeks to maintain their catch (or maximise their profits), thus increasing the
206
likely occurrence of discarding and high-grading of smaller individuals such that
they can continue fishing (Sampson, 1994; Branch et al., 2006). Given that MLL
restrictions typically are intended for protecting small and young fish, measures of
their effectiveness need to take into account the extent to which undersized fish
suffer post-release mortality (Kirchner et al., 2001). West Australian dhufish have
been shown to be particularly susceptible to mortality after catch-and release
events, with barotrauma the dominant cause of death post-release, and mortality
increasing with depth of capture from 21% at 0-14 m to 86% at 45-59 m (St. John
and Syers, 2005).
4.4.4. Other agent-based models for recreational fisheries
Until recently, the technique of using recreational fisher survey data to inform
agent-based models to study angler movements and behaviours was relatively
unique. However, similar angler behavioural studies have been undertaken in the
Ningaloo Marine Park of Western Australia by Gao and Hailu (2010; 2011; 2012;
and 2013). These studies combined an agent-based model with multiple sources of
information, including survey data from a nationwide recreational fishing survey
(Henry and Lyle, 2003). The Gao and Hailu model is able to predict the number of
fishing trips an angler takes in a year, the choice of recreational site in any one trip,
the timing of a trip in a year, the length or duration of a trip, and the angler’s
expected catch. Within the model, a recreational angler agent has demographic
attributes (such as age, income, education level, employment status, and so on)
and behaviours (such as choosing sites and catching fish). Unlike Gao and Hailu
(2010; 2011; 2012; and 2013), the ABM model used in this study is based on a
temperate reef ecosystem with angler survey data collected directly from the West
Coast Bioregion of Western Australia’s marine waters for the purposes of informing
the ABM. The use of survey data to inform agent behaviours in an ABM is still a
relatively new approach in recreational fisheries. However, examples of studies in
other disciplines can be found, e.g. farming, agriculture and land-use planning
207
(Acosta-Michlik and Espaldon, 2008; Karali et al., 2011; Sun and Müller, 2013),
environmental systems research (Schwarz and Ernst, 2009), to name just a few.
4.4.5. Summary
This study has utilised agent-based modelling techniques to explore, describe and
attempt to understand angler behaviours in a simulated multi-species demersal
fishery. It has provided evidence that it is ultimately the ability of the more avid
and specialised of anglers to adapt and alter their behaviours in response to
changes, e.g. fluctuations in fish abundance or variations to management
regulations, and thereby maintain their catches that make them good and
successful fishers. For example, such behavioural shifts seen in the model included;
the updating of knowledge on ‘GPS systems’ of good fishing locations and increased
movement between cells by agents when abundance of target species was low.
The modelling approach taken represents a useful means for exploring the
importance of understanding human dimensions in fisheries and potentially predicts
unforeseen consequences (e.g. potential for increases in discarding and by-catch
and behavioural shifts such as species substitution of anglers) in a multi-species
system. Such confirmation of management outcomes may potentially reduce the
uncertainty surrounding the angler’s response to management (Sainsbury et al.,
2000; Nagy et al., 2007; Metcalf et al., 2010) and may be useful in the decision-
making process.
It is important to note that, in this study, the results of the angler data
collected from avid recreational fishers were averaged. In future studies, it would
be useful to allow the fisher agents to vary in their levels of avidity, knowledge and
learning ability and to explore the implications of this on simulated scenarios. For
such an exploration to be undertaken it is noted that a much larger data set would
be required, however. It would also be interesting to compare model predictions of
behavioural responses to changes in stock abundance or management change, e.g.
an increased number of fishing trips by anglers in response to more restrictive boat
limits, with survey data. Furthermore, the implications of ‘high-grading’ could also

208
be investigated, to allow for exploration on the influence of such angler behaviours
on the age and size structures of fish populations and ultimately be beneficial for
stock assessments.
209
5. General Discussion
This chapter concentrates on the broader perspectives and conclusions of this
study. Interpretation of the results from the two angler surveys and agent-based
modelling study can be found in the previous chapters.
Accounting for angler behaviour 5.1.
The growing importance being placed on accounting for angler behaviour in
fisheries systems has led to increased efforts to include information from human
dimensions (HD) studies as a basis for improving management policies and
regulations (Ewert, 1996; Ditton and Hunt, 2001; Arlinghaus, 2004; Little et
al., 2004; Johnston et al., 2010). In Australia, including Western Australia (W.A.),
the angler information that has been typically collected in fisheries surveys consists
mainly of catch and effort data coupled with general demographic details (e.g. age,
gender, motivations) and economic statistics (e.g. Ayvazian et al., 1997; Lyle and
Smith, 1998; Sumner and Williamson, 1999; Malseed et al., 2000; Malseed and
Sumner, 2001; Melville-Smith et al., 2001; Sumner et al., 2002; Henry and Lyle,
2003; Coleman, 2004; Campbell and Murphy, 2005; Lyle et al., 2005; Williamson
et al., 2006; Sumner et al., 2008). There are, however, some notable exceptions
that focus on fisher characteristics and behaviours to a greater extent, (e.g.,
Ormsby, 2004; Smallwood et al., 2006; Sutton, 2006; Prior and Beckley, 2007;
Frijlink and Lyle, 2010a; 2010b; Smallwood et al., 2011; Ryan et al., 2013).
The national recreational fishing survey within Australia (Henry and Lyle,
2003) was analysed primarily at the state/territory and national levels and provided
a ‘big picture’ assessment of recreational participation, reporting on the ‘average’
fisher in each state/territory. Furthermore, fisheries models constructed to
investigate the implications of fish-targeting behaviours by recreational fishers in
Western Australia (e.g. Gao and Hailu, 2010; 2011; 2012; 2013) have been based
on broad, regional angler response data (i.e. Henry and Lyle, 2003). However, as
discussed throughout this thesis, anglers exhibit great diversity in terms of their
210
social and economic characteristics, expectations, motivations, perceptions,
participation patterns, and management preferences (Fisher, 1997; Arlinghaus,
2004; Salz and Loomis, 2005). Thus, while representative of the ‘average’ angler,
the broad, aggregated results reported from such regional surveys are unlikely to
reflect the full diversity of participation, experience and opinions of the anglers
involved in the fishery.
As stated by Frédou et al. (2006), the identification and quantification of key
factors influencing the dynamics of angling activities are considered to be important
prerequisites for developing effective management frameworks for recreational
fisheries. The results of the surveys undertaken during this study were used to
facilitate a description of the various groups of boat anglers, in terms of their
motivations, behaviours, fine-scale movements (i.e. movements between fishing
grounds when searching for fish), gear and angling methods. Although previous
creel surveys have been undertaken in the same study regions as considered in this
study (i.e. the Perth Metropolitan and Peel Regions) focusing on boat-based anglers
targeting demersal species (Sumner and Williamson, 1999; Sumner et al., 2008;
Ryan et al., 2013), the types of certain survey questions posed in this study,
e.g. those relating to fine-scale movement patterns of fishers whilst targeting fish,
are uncommon in the literature on fisheries surveys. Gillis (2003) recognised,
however, that studying angler behaviour through the examination of specific
decisions made while fishing is gaining popularity in the field of fleet dynamics
research. More broadly, the importance of understanding where and how anglers
allocate their effort, and how they alter their behaviours in response to changes in
management regulations, has also been recognised as crucial in the determination
of appropriate management strategies (Sampson, 1994; Mathiesen, 2003; Little et
al., 2004; Branch et al., 2006; Metcalf et al., 2010).
The information relating to the behaviours of fishers derived from the boat
survey in Chapter 3 were cruicial for deriving meaningful input data into the agent-
based model described in Chapter 4. Although the sample size for this survey was
small, it was still sufficient to provide preliminary estimates of a number of
211
important parameters required to undertake model-based explorations of fish-
targeting behaviours. Some of these included estimates for trip duration, fishers’
perceptions of the quality of different habitats for certain species of fish
(information which also informed assumptions regarding the movements of fish
among different habitat types), and factors influencing their fish targeting
behaviours, e.g. fish bite rates. Key to the overall modelling approach was the
integration of results of survey based questions designed specifically to inform the
modelling. It should also be recognised, however, that as sample sizes for surveys
of fishing club members were small, the results obtained by the agent-based
modelling do need to be treated with a level of caution.
The surveys used in this PhD study aimed to capture an understanding of
the diversity of boat anglers by relating responses to fishers’ avidities or by
focussing on a specific avidity class. Thus, one survey, i.e. the phone survey
(Chapter 2), was focussed on comparing the characteristics of non-avid and avid
(boat-based) recreational fishers within a region of south-western Western
Australia, i.e. the West Coast Bioregion, where fishers were classed as either non-
avid or avid based on the number of days fished in the 12 months prior to the
survey. A second survey, i.e. the survey described in Chapter 3, was undertaken to
focus on the characteristics of fishers from recreational angling clubs, who were
assumed to be more avid and specialised towards catching certain key target
demersal scalefish species than the general boat fisher population.
This PhD study also explored the validity of the notion that avid and more
specialised anglers achieved greater catch success (Hilborn, 1985; Baccante, 1995;
Dorow et al., 2010; Johnston et al., 2010). The results of the survey suggested
that, for certain highly-prized and harder-to-catch species, fishers who specialised
in catching individuals of these species obtained better catches of those species
than less avid and more generalist fishers (i.e. fishers that target a wider range of
species). In contrast, for some other fish species, i.e. ‘bread and butter’ species,
fishers tended to be more generalist than specialised, and the less avid of this
group of fishers obtained catches that were similar to those that were more avid.
212
Thus, it is concluded that a detailed understanding of the fish-targetting behaviours
of avid and specialised anglers who target iconic, hard-to-catch fish species is likely
to be particularly important for the sustainable management of these species, but
less so for generalist fishers who target ‘bread and butter’ species.
The simulation (agent-based) modelling undertaken during this study
suggested that specialist fishers targeting demersal scalefish species are able to
maintain good catch rates when fish abundances are declining by altering certain
fishing behaviours. These may include undertaking more searches for new fishing
locations, moving more frequently among fishing locations when bite rates are low,
and updating their knowledge and perceptions of the quality of their fishing
locations in response to recent fishing experiences. Thus, potentially, these
behaviours are important attributes of ‘successful’ fishers who target demersal
scalefish species, by enabling them to adapt to a changing environment,
e.g. changes in fish abundance or fisheries management (Sampson, 1991; Bertrand
et al., 2004; Hunt et al., 2011).
This study represents one of few studies that have integrated the results of
a recreational fishers’ survey with a simulation model to explore the likely
effectiveness of alternative management controls for such fisheries under different
scenarios of fish abundance. The model results were informative for providing
indications as to how recreational fishers are likely to respond to management
changes and fish abundance, and for understanding the implications of such
responses for sustaining fish populations. It is thus concluded that this type of
approach to studying fisher behaviours can be useful for informing the development
of management strategies for recreational fisheries. The need for an integrated
modelling approach, which links the results of HD surveys with fisher’s behaviour
and fishery dynamics, has been stressed by several authors (Post et al., 2008;
Johnston et al., 2010; Beardmore et al., 2011; Schlüter et al., 2012). This would
assist in bridging the gap between the scientific disciplines of fisheries science and
human dimensions, and thereby allow the construction of more accurate models of
213
the effects of anglers’ behaviour on exploitation, leading to more reliable
assessment of the likely effectiveness of proposed changes to fisheries regulations.
Angler types 5.2.
The importance of studying the more active (avid) and specialised angler has been
emphasised by numerous authors (Salz and Loomis, 2005; Oh and Ditton, 2008;
Dorow et al., 2010; Johnston et al., 2010), as this group is likely to display a
particular set of skills when compared to more generalist, leisure-seeking fishers.
Previous research has focussed mainly on describing ‘technique-setting’ or
‘advanced species’ specialists (e.g. Bryan, 1977; Wilde et al., 1998; Wilde and
Ditton, 1999; Arlinghaus and Mehner 2003; Dorow et al., 2010), predominantly
within single-species fisheries. This study, however, has focussed more on
understanding the key characteristics and behaviours of the more avid and
specialised boat-based angler in a multi-species fishery environment. In a single-
species fishery, it is possible to adjust different facets of angler behaviour to
optimise the single objective of capturing that species. Thus, in such a fishery, it is
likely to be easier to identify the factors that result in greater ability to catch fish.
In contrast, in a multi-species environment, different anglers are likely to adjust
their behaviours in different ways to balance their fishing skills and the values they
place on the mixture of species that they are likely to catch. That is, in a multi-
species fishery, fishers act in a ‘multiple objective decision making framework’, and
individuals respond to their own motivations and assessments of the values that
they accord to the fishing experience.
Past studies have proposed that specialised anglers are more committed and
avid (Bryan, 1977; Falk et al., 1989; Beardmore et al., 2011), typically younger
(Arlinghaus and Mehner, 2003), devote more time each year to fishing (Graefe,
1980; Ditton et al., 1992; Salz et al., 2001), and travel greater distances to fishing
locations (Ward et al., 2013). Specialised boat anglers are also considered to have
the greatest angling experience and skill and make the greatest investment in
214
fishing equipment and activity (Ditton and Holland, 1984; Chipman and Helfrich,
1988; Ditton et al., 1992; Dorow et al., 2010). They are also considered to be more
supportive of restrictive fishing regulations (Salz et al., 2001; Arlinghaus, 2007), be
more likely to be members of angling clubs (Ditton and Holland, 1984; Gigliotti and
Peyton, 1993; Fisher, 1997), and have greater catch success (Hilborn, 1985;
Baccante, 1995; Dorow et al., 2010; Johnston et al., 2010). The variables
examined in the current study (e.g. fishing frequency, preferred target species,
gear used, distance travelled and movement patterns) were likewise demonstrated
to be important attributes for defining angler sub groups and proved to be strongly
associated with the social characteristics of anglers (e.g. motivations, club
membership etc.).
Statistical analysis of contingency tables were employed in this study to
compare data for (1) the non-avid and avid anglers (Chapter 2), (2) the more vs
less avid club members (Chapter 3), and (3) club members and those for the avid
fishers from the phone survey (reported in Chapter 2). Furthermore, logistic
regression analyses of the data from the surveys were also undertaken to explore
the characteristics of the above different groups of fishers, i.e. recreational
fishers/club members, and to test the various hypotheses. These analyses
contributed to a greater understanding of the defining factors (e.g. motivations for
fishing, target species) of non-avid and avid anglers and how these factors
potentially influence fishing activities. For example, avid anglers were shown to be
more likely go fishing on a normal weekday, fish for relaxation and fish for the
enjoyment and the sport of catching fish and be between the ages of 30-59 y.
Although initial investigations of the survey data also employed recursive
partitioning analysis, cluster analysis (i.e. hierarchical cluster analysis) and MDS
analysis techniques using R (R Development Core Team, 2013), the preliminary
results from these analyses suggested that larger survey sizes than those available
to this study would have been required to produce reliable results from these
methods and the results of these explorations were therefore not reported in this
thesis. The value of such techniques is acknowledged, however, as they have been
215
have been applied to fishery data in other studies to divide heterogeneous
populations of anglers into more homogenous sub groups (e.g. Connelly et
al., 2000b; Pelletier and Ferraris, 2000; Frédou et al., 2006; Oh and Ditton, 2006b;
Arlinghaus et al., 2008). For example, multivariate techniques (e.g.
multidimensional scaling ordination (MDS) plots) can be useful in identifying factors
that characterise angling activities and developing an understanding of how fishers’
techniques are adapted to the biological and ecological characteristics of their
target species (Frédou et al., 2006). Such multivariate approaches as those
identified above can also improve the definition of the different types of fishing
activities in order to define technological categories for fishing statistics (Frédou et
al., 2006). Other studies have also employed multivariate techniques to identify
and group commercial anglers based on their fishing tactics (i.e. the combination of
target species, gear, and fishing location, at a given time of the year), using both
catch and effort data (see Pelletier and Ferraris, 2000). Fishing tactics are thought
to reflect simultaneously the decisions of the fisher (e.g. target species, gear,
location, and time of the year) and the resultant catches, and are thus beneficial for
understanding the dynamics of mixed fisheries (Pelletier and Ferraris, 2000).
In this study, frequency of fishing (i.e. participation rates) was used as a
measure of avidity of anglers, which is not uncommon in recreational fisher surveys
(e.g. Connelly and Brown, 1995; Fisher, 1997; Henry and Lyle, 2003), along with
the use of depth of fishing and club membership used as factors for logistic
regression analyses undertaken in Chapter 2 and 3, respectively. There are,
however, various alternative ways (i.e. grouping by target species or by gender or
age of fisher etc.) by which the angler population could be categorised to better
understand within-group differences, and which could be explored in future studies.
Measures relating to angler attributes such as where they fish, their technique
preferences, choice of equipment, importance of catch to fishers, their social setting
of activity and preferences for resource management, could also be used to
characterise recreational fishers and thereby partition them into more homogenous
groups (Bryan, 1977; Ditton et al., 1992).
216
The use of agent-based modelling 5.3.
The ability to predict and effectively manage the impacts of recreational fishing on
fish species requires an understanding of the complex social and ecological
dynamics in fisheries systems (Johnston et al., 2010). Anglers continually make
decisions whilst fishing. These decisions, however, are ultimately influenced by a
suite of factors including the abundance of fish, management regulations,
technology, weather, and expectations about costs of fishing (Sampson,
1991; 1994; McConnell et al., 1995; Wilen et al., 2002). The agent-based model
presented in this study simulated the ‘interplay’ between fishers and fish and
enabled an exploration of the impacts, on the effectiveness of management, of
behavioural responses by fishers to such regulations. Thus, the insights gained
from this type of integrated-modelling approach could potentially be of benefit to
fisheries managers and assist them in making better informed decisions, i.e. as a
form of ‘management strategy evaluation’ (Smith, 1993; Schnute et al., 2007;
Punt, 2008; Fisher et al., 2011).
A range of opportunities exist to extend the agent-based model presented in
this study. For example, the model could be extended to study the effect of
different movement parameters/assumptions for fish, and monitoring how these
affect the distribution patterns of fish among the different habitat types, and how
this, in turn, influences catches.
Another possibility is to incorporate the schooling behaviours of fish in the
model. For example, pink snapper are a known schooling species that aggregate in
large numbers for spawning, often at specific locations (e.g. Cockburn Sound, along
with the adjacent Warnbro Sound in the West Coast Bioregion) requiring
considerable movement by participating fish (Wakefield, 2006; Mackie et al., 2009).
A number of studies have investigated such schooling behaviour using various
modelling techniques (e.g. Aoki, 1982; Charles et al., 2000; Inada, 2001;
Schönfisch, 2001; Huse et al., 2002; Parrish et al., 2002; Hubbard et al., 2004;
Hemelrijk and Kunz, 2005; Gautrais et al., 2008; González et al., 2009). It is
noted, however, that the addition of such behaviour coupled with environmental
217
factors (temperature gradients, population dynamics, habitat etc.) in a multi-
species model would not be a trivial task, adding further complexity and requiring
data inputs that may not be available, and increasing simulation time.
The agent-based model could also be enhanced by allowing for variability in
behaviours among different fish (e.g. different movement characteristics and
habitat ‘preferences’) and fisher agents, e.g. differences in fish targeting behaviours
among individuals of an identified grouping of fishers and among groupings such as
specialist and generalist fishers. This would be more representative of the ‘real-
world’ situation and could yield more realistic results. As described by Dreyfus-Leon
(2006), agent-based models, due to their flexible nature, have the ability to treat
individuals as discrete entities and thus also offer a way for accounting for
individual variability, interactions among individuals and adaptive behaviours in
complex fishery-related problems.
Analyses of data on the fate of individual fish recorded during simulations
may be useful also for exploring, for example, how many times an individual fish is
caught and released and the associated variation in the rates of post-release
mortality on individuals in the population and its relationship to the spatial pattern
of fishing. Such analyses would also be relevant to exploring, through simulation,
the potential effects of different spatial patterns of fishing on results obtained from
tagging programs.
The results from the angler surveys and discussions with recreational
anglers revealed that weather is an important factor influencing their activities. The
inclusion of data relating to weather, e.g. wind speed and swell, would allow for
exploration of the effect of weather on behaviours of fishers, e.g. when to go fishing
and where to fish, and thus on exploitation. For example, as the weather
encountered was shown to influence how far fishers were willing to travel offshore
in the surveys, it is possible that fish species in deeper waters are generally less
accessible and thus, at least to some extent, more protected from fishing,
potentially leading to a greater level of depletion in inshore waters. Thus, if a
management measure such as a temporal closure over the spring/summer period
218
(e.g. notably better weather months) were to be imposed, fish in deeper waters
would also benefit from decreased fishing effort over these months, but such a
measure might impact substantially on the overall fishing success/experience of
anglers.
The addition to the model of management controls other than just size and
bag and boat limits, e.g. spatial and temporal closures, would enable further
explorations regarding the likely effectiveness of alternative management controls
in this agent-based modelling framework. For example, a recent paper by Gao and
Hailu (2011) used agent-based model simulations to evaluate the effects of area
closures on recreational fishing in the Ningaloo Marine Park in Western Australia.
Furthermore, the addition of ‘different numbers’ of fishers on a boat would increase
realism and enable investigation into the number of fish caught and the implications
for management. As noted above, however, agent-based models are computer
intensive, however, and such extensions to the current model have the potential to
constrain its usefulness (Breckling et al., 2006), due to increased model complexity
(also making interpretation of results more difficult) and slowing down program
speed. Such extensions of the model may also require the collection of more input
data.
Implications for management 5.4.
In the past, conventional survey techniques and group discussions with anglers
have assisted in acquiring a better understanding of the use of fishery resources
(e.g. Henry and Lyle, 2003; Smallwood et al., 2011; Ryan et al., 2013). However,
an in-depth understanding of certain angler characteristics, such as their
motivations, fish-targeting patterns (e.g. movements), and level of ability to make
best use of available fishing gear and technology, are not able to be gained from
standard fishery surveys. Importantly, however, these characteristics are likely to
influence the catch compostion and success of the individual anglers. Thus, if the
data from angler surveys are to produce accurate results, it is likely to become
increasingly necessary to take such characteristics into account, and consider how
219
they might change when the abundances of individual species change or
management regulations are modified. It follows that the additional types of data
that are likely to be needed in the future will need to be collected when angler
surveys are conducted, and that more detailed multivariate statistical analyses will
also need to be undertaken to determine the relationships between fish catches and
fishing effort, and modelling will be required to understand the inter-relationships
between fish and fisher behaviours and dynamics. For example, the more avid and
specialised an angler is the more likely he/she is to spread angling effort over a
wider geographical area compared to the effort distribution of the more generalist
boat-based fisher, which is more likely to be localised and undertaken in close
proximity to boat ramps and access points. The higher reported catches taken by
club members (Chapter 3) than those taken by their counterparts (avid anglers) in
the phone survey (Chapter 2) demonstrate that, in terms of catch objectives, the
former group may be considered to be the more successful in catching fish of the
two groups of recreational fishers. Again, such information is likely to be important
for management.
It is also important to note that this study has collected information on the
characteristics, catch preferences, behaviours, movement patterns, gear and
angling methods of fishing club members, who represent a minority group of highly
specialised boat anglers. The small sample size attained in this study is
acknowledged, however, it is also important to recognise that the data obtained
from fishers, some of whom, despite fishing infrequently, represented those
specialised anglers who mainly target West Australian dhufish and pink snapper.
Furthermore, to obtain a representative sample of such fishers from the
Recreational Fishing from Boat Licence (RFBL) database would have required a
large sample size and considerable filtering in an initial screening survey
(e.g. designed to filter non-club members). Resources for such a survey were not
available for the current study and thus, although sampling was not probability-
based, the approach employed, i.e. directly approaching club members, was
considered the most appropriate method to obtain data from this specific group of
220
fishers. The knowledge of these anglers in catching these iconic fish species is
potentially very valuable because these fishers are likely to spend more time on the
water targeting/catching these species than any other fishers. Thus, it is still
concluded that targeted surveys of this nature can provide useful information for
fishery management.
Future inclusion of HD research in fisheries management 5.5.
Recognition of the social importance of recreational fishing is growing, as are the
demands placed on this (and other) fishing sector(s) for ensuring that they are
fishing in a sustainable manner (McPhee et al., 2002; Cooke and Cowx, 2006;
Lewin et al., 2006; Beard et al., 2011). Too often, HD research is equated with
economic research, with economics only being a single component of the likely
forces that drive human behaviour (Ewert, 1996). The use of specialisation theory
can help explain why different anglers seek different types of fishing opportunities
and experiences, with no one set of management regulations likely to satisfy all
anglers (Fisher, 1997; Margenau and Petchenik, 2004). It is unlikely that the
knowledge gained from one fishery will be totally transferable to the next. Research
methods, however, are likely to be transferrable among fisheries. Identification of
the different angler segments represents the first step in understanding the
objectives and requirements of those different groups (Connelly et al., 2001).
Achieving this understanding will require on-going collaboration between fisheries
scientists, recreational fishers, managers, policy makers and recreational fishing or
advocacy groups (Beard et al., 2011).
Non-consumptive recreational fishing in the future is sure to bring about new
challenges for management as more and more anglers begin to practice catch-and-
release fishing. However, there is a need to better understand the characteristics of
anglers who choose to participate in this type of fishing as there are indeed a whole
new suite of biological, economic, cultural and ethical challenges embedded in this
form of recreational fishing activity (Sutton, 2001; Sutton and Ditton, 2001; Aas,
2002; Arlinghaus, 2007; Arlinghaus et al., 2007).
221
Successful future management of recreational fisheries will involve an
understanding of not only the biological aspects of the system but also of how
people operate in the system and use its resources (Hahn, 1991; Weithman, 1999;
Arlinghaus and Mehner, 2003; Arlinghaus, 2004; Salas and Gaertner, 2004).
Management of recreational fisheries and the regulation of fishing effort will
continue to be a controversial subject in many jurisdictions due to the competing
objectives of management and anglers (Gao and Hailu, 2010; 2011; 2012).
However, innovative approaches such as reviewing current indicators and deriving
new indicators for stock assessment that recognise the effect of anglers’ behaviour
on observed catches and the effectiveness of alternative regulations, and increasing
stakeholder involvement in the development of future management strategies, hold
promise for more effective management processes.

222

223
References

224
225
6. References
Aas, Ø. (2002). The next chapter: multicultural and cross-disciplinary progress in
evaluating recreational fisheries. In ‘Recreational Fisheries: ecological, economic
and social evaluation’. (Eds T.J. Pitcher and C. E. Hollingworth.) pp. 252-263
(Blackwell Science, Oxford.).
Aas, Ø., and Ditton, R. B. (1998). Human dimensions perspective on recreational
fisheries management: implications for Europe. In ‘Recreational fisheries. Social,
economic and management aspects’. (Eds P. Hickley, and H. Tompkins.) pp. 153–
164. (Blackwell Scientific: Oxford, UK.)
Aas, Ø., Haider, W., and Hunt, L. (2000). Angler responses to potential harvest
regulations in a Norwegian sport fishery: a conjoint-based choice modeling
approach. North American Journal of Fisheries Management 20 (4), 940-950.
Abernethy, K. E., Allison, E. H., Molloy, P. P., and Côté, I. M. (2007). Why do
fishers fish where they fish? Using the ideal free distribution to understand the
behaviour of artisanal reef fishers. Canadian Journal of Fisheries and Aquatic
Sciences 64 (11), 1595-1604.
Acosta-Michlik, L., and Espaldon, V. (2008). Assessing vulnerability of selected
farming communities in the Philippines based on a behavioural model of agent's
adaptation to global environmental change. Global Environmental Change 18 (4),
554-563.
Anderson, D. K., and Ditton, R. B. (2004). Demographics, participation, attitudes,
and management preferences of Texas anglers. Human Dimensions of Fisheries
Research Laboratory Technical Document HD-624. Texas A&M University, College
Station.
Anderson, D. K., Ditton, R. B., and Hunt, K. M. (2007). Measuring angler attitudes
toward catch-related aspects of fishing. Human Dimensions of Wildlife 12 (3), 181-
191.
Anonymous (1992). ‘National Strategy for Ecologically Sustainable Development.’
Available at http://www.environment.gov.au/esd/national/nsesd/strategy/index.html
[accessed 6 October, 2009].
226
Aoki, I. (1982). A simulation study on the schooling mechanism in fish. Bulletin of
the Japanese Society of Scientific Fisheries 48 (8), 1081-1088.
Arlinghaus, R. (2004). ‘A Human Dimensions Approach Towards Sustainable
Recreational Fisheries Management.’ (Turnshare Ltd.: London.)
Arlinghaus, R. (2005). A conceptual framework to identify and understand conflicts
in recreational fisheries systems, with implications for sustainable management.
Aquatic Resources, Culture and Development 1, 145–174.
Arlinghaus, R. (2006). Overcoming human obstacles to conservation of recreational
fishery resources, with emphasis on central Europe. Environmental Conservation 33
(1), 46–59.
Arlinghaus, R. (2007). Voluntary catch-and-release can generate conflict within the
recreational angling community: a qualitative case study of specialised carp,
Cyprinus carpio, angling in Germany. Fisheries Management and Ecology 14, 161–
171.
Arlinghaus, R., and Mehner, T. (2003) Socio-economic characterisation of
specialised common carp (Cyprinus carpio L.) anglers in Germany, and implications
for inland fisheries management and eutrophication control. Fisheries Research 61,
19–33.
Arlinghaus, R., Bork, M., and Fladung, E. (2008). Understanding the heterogeneity
of recreational anglers across an urban–rural gradient in a metropolitan area
(Berlin, Germany), with implications for fisheries management. Fisheries Research
92, 53–62.
Arlinghaus, R., Cooke, S. J., Lyman, J., Policansky, D., Schwab, A., Susli, C.,
Sutton, S. G., and Thorstad, E. B. (2007). Understanding the complexity of catch-
and-release in recreational fishing: An integrative synthesis of global knowledge
from historical, ethical, social, and biological perspectives. Reviews in Fisheries
Science 15, 75-167.
Arlinghaus, R., Mehner, T., and Cowx, I. G. (2002). Reconciling traditional inland
fisheries management and sustainability in industrialized countries, with emphasis
on Europe. Fish and Fisheries 3, 261-316.
227
Arterburn, J. E., Kirby, D. J., and Berry, C. R. (2001). Biologist opinions and angler
attitudes concerning catfish and their management in the Mississippi River basin.
Mississippi Interstate Cooperative Resource Association, Final Report, Des Moines,
Iowa.
Arterburn, J. E., Kirby, D. J., and Berry Jr, C. R. (2002). A survey of angler
attitudes and biologist opinions regarding trophy catfish and their management.
Fisheries 27 (5), 10-21.
Australian Bureau of Statistics (2013). ‘QuickStats.’ Available at
http://www.censusdata.abs.gov.au/census_services/getproduct/census/2011/quickstat/
[accessed 28 November, 2014].
Ayvazian, S. G., Jones, G. K., Fairclough, D., Potter, I. C., Wise, B. S., and
Dimmlich, W. F. (2000). Stock assessment of Australian herring. Department of
Fisheries, FRDC Project 96/105, Western Australia.
Babcock, E. A., and Pikitch, E. K. (2000). A dynamic model of fishing strategy
choice in a multispecies trawl fishery with trip limits. Canadian Journal of Fisheries
and Aquatic Sciences 57, 357-370.
Baccante, D. (1995). Assessing catch inequality in walleye angling fisheries. North
American Journal of Fisheries Management 15, 661-665.
Bakus, G. J. (2007). ‘Quantitative Analysis of Marine Biological Communities: Field
Biology and Environment.’ (Wiley-Interscience: New Jersey.)
Bastardie, F., Nielsen, J. R., Andersen, B. S., and Eigaard, O. R. (2010). Effects of
fishing effort allocation scenarios on energy efficiency and profitability: An
individual-based model applied to Danish fisheries. Fisheries Research 106, 501–
516.
Beard, T. D., Arlinghaus, R., and Sutton, S. G. (2011). The Angler in the
Environment: social, economic, biological, and ethical dimensions. American
Fisheries Society. In ‘Proceedings of the 5th World Recreational Fishing Conference,
Florida, USA, 10-12 November 2011’. pp. 1-9. (American Fisheries Society:
Maryland, USA.)
228
Beardmore, B., Haider, W., Hunt, L. M., and Arlinghaus, R. (2011). The importance
of trip context for determining primary angler motivations: are more specialized
anglers more catch-oriented than previously believed? North American Journal of
Fisheries Management 31 (5), 861-879.
Beardmore, B., Haider, W., Hunt, L. M., and Arlinghaus, R. (2013). Evaluating the
ability of specialization indicators to explain fishing preferences. Leisure Sciences
35 (3), 273-292.
Beck, K. H., Yan, A. F., and Wang, M. Q. (2009). A comparison of web-based and
telephone surveys for assessing traffic safety concerns, beliefs, and behaviors.
Journal of Safety Research 40, 377–381.
Beddington, J. R., Agnew, D. J., and Clark, C. W. (2007). Current problems in the
management of marine fisheries. Science 316 (5832), 1713-1716.
BenDor, T., Scheffran, J., and Hannon, B. (2009). Ecological and economic
sustainability in fishery management: A multi-agent model for understanding
competition and cooperation. Ecological Economics 68, 1061-1073.
Benenson, I., Martens, K., and Birfir, S. (2008). PARKAGENT: An agent-based
model of parking in the city. Computers, Environment and Urban Systems 32, 431-
439.
Bertrand, S., Díaz, E., and Ñiquen, M. (2004). Interactions between fish and
fisher's spatial distribution and behaviour: an empirical study of the anchovy
(Engraulis ringens) fishery of Peru. ICES Journal of Marine Science: Journal du
Conseil 61 (7), 1127-1136.
Beverton, R. J. H., and Holt, S. J. (1957). On the dynamics of exploited fish
populations. Fishery Investigations Series 2: Sea Fisheries 19.
Billari F., Fent T., Prskawetz A., and Scheffran, J. (Eds) (2006). ‘Agent-based
Computational Modelling: Applications in Demography, Social, Economic and
Environmental Sciences.’ (Physica-Verlag: Heidelberg.)
Bonabeau, E. (2002). Agent-based modeling: Methods and techniques for
simulating human systems. Proceedings of the National Academy of Sciences 99
(3), 7280–7287.
229
Bosquet, F., and Le Page, C. (2004). Multi-agent simulations and ecosystem
management: a review. Ecological Modelling 176, 313-332.
Branch, T. A., Hilborn, R., Haynie, A. C., Fay, G., Flynn, L., Griffiths, J., Marshall, K.
N., Randall, J. K., Scheuerell, J. M., Ward, E. J., and Young, M. (2006). Fleet
dynamics and fishermen behavior: Lessons for fisheries managers. Canadian
Journal of Fisheries and Aquatic Sciences 63, 1647-1668.
Breckling, B., Middelhoff, U., and Hauke, R. (2006). Individual-based models as
tools for ecological theory and application: Understanding the emergence of
organisational properties in ecological systems. Ecological Modelling 194, 102-113.
Bricker, K. S., and Kerstetter, D. L. (2000). Level of specialization and place
attachment: An exploratory study of whitewater recreationists. Leisure Sciences 22
(4), 233-257.
Brouwer, S. L., Mann, B. Q., Lamberth, S. J., Sauer, W. H. H., and Erasmus, C.
(1997). A survey of the South African shore-angling fishery. South African Journal
of Marine Science 18 (1), 165-177.
Brown, T. L. (1991). Use and abuse of mail surveys in fisheries management.
American Fisheries Society Symposium 12, 255-261.
Brueckner, M., Durey, A., Mayes, R., and Pforr, C. (2013). The mining boom and
Western Australia's changing landscape: Towards sustainability or business as
usual? Rural Society 22 (2), 111-124.
Bryan, H. (1977). Leisure value systems and recreational specialisation: The case
of the trout fisherman. Journal of Leisure Research 9, 174-187.
Busch, W. D. N., Brown, B. L., and Mayer, G. F. (2003). Strategic guidance for
implementing an ecosystem-based approach to fisheries management. US
Department of Commerce, National Oceanic and Atmospheric Administration,
National Marine Fisheries Service, Silver Spring, Maryland, USA.
Cabral, R. B., Geronimo, R. C., Lim, M. T., and Alino, P. M. (2010). Effect of
variable fishing strategy on fisheries under changing effort and pressure: An agent-
based model application. Ecological Modelling 221, 362-369.
230
Calvert, B. (2002). The importance of angler motivations on sport fishery
management. In ‘Recreational Fisheries: Ecological, Economic and Social
Evaluation’. (Eds T. J. Pitcher and C. E. Hollingworth.) pp. 120-129 (Blackwell
Science, Oxford.)
Cameron, T. A., and Huppert, D. D. (1989). OLS versus ML estimation of non-
market resource values with payment card interval data. Journal of Environmental
Economics and Management 17 (3), 230-246.
Campbell, D., and Murphy, J. J. (2005). The 2000-01 national recreational fishing
survey: Economic report. Australian Government Department of Agriculture,
Fisheries and Forestry, FRDC Project No. 99/158, Canberra.
Charles, A. T. (1995). Fishery science: the study of fishery systems. Aquatic Living
Resources 8, 233-239.
Charles, S., Bravo De La Parra, R., Mallet, J. P., Persat, H., and Auger, P. (2000).
Annual spawning migrations in modelling brown trout population dynamics inside
an arborescent river network. Ecological Modelling 133 (1), 15-31.
Chipman, B. D., and Helfrich, L. A. (1988). Recreational specializations and
motivations of Virginia river anglers. North American Journal of Fisheries
Management 8, 390-398.
Clay, P. M., and McGoodwin, J. R. (1995). Utilizing Social Sciences in Fisheries
Management. Aquatic Living Resources 8, 203-7.
Cochran, W.G. (1977). ‘Sampling Techniques.’ 3rd Edn. (Wiley, New York.)
Cockcroft, A. C., Griffiths, M. H., and Tarr, R. J. Q. (1999). Marine recreational
fisheries in South Africa: status and challenges. In ‘Evaluating the Benefits of
Recreational Fisheries’. Fisheries Centre research reports, 7(2) (Eds T. J. Pitcher
and C. E. Hollingworth.) pp. 64-70 (Vancouver BC.)
Coleman, A. P. M. (2004). The national recreational fishing survey: the Northern
Territory. Northern Territory Department of Business, Industry and Resource
Development, Fishery Report 72, Darwin.
231
Coleman, F. C., Figueira, W. F., Ueland, J. S., and Crowder, L. B. (2004). The
impact of United States recreational fisheries on marine fish populations. Science
305, 1958–1960.
Connelly, N. A., and Brown, T. L. (1995). Use of angler diaries to examine biases
associated with 12-month recall on mail questionnaires. Transactions of the
American Fisheries Society 124 (3), 413-422.
Connelly, N. A., and Brown, T. L. (2011). Effect of recall period on annual
freshwater fishing effort estimates in New York. Fisheries Management and Ecology
18, 83–87.
Connelly, N. A., Brown, T. L., and Knuth, B. A. (2000a). Do anglers and fishery
professionals think alike? Fisheries 25 (2), 21-25.
Connelly, N. A., Brown, T. L., and Knuth, B. A. (2000b). A multiple market
segmentation of Great Lakes anglers in New York. North American Journal of
Fisheries Management 20 (2), 399-407.
Connelly, N. A., Knuth, B. A., and Brown, T. L. (2001). An angler typology based on
angler fishing preferences. Transactions of the American Fisheries Society 130 (1),
130-137.
Cooke, S. J., and Cowx, I. G. (2004). The role of recreational fishing in global fish
crises. Bioscience 54, 857–859.
Cooke, S. J., and Cowx, I. G. (2006). Contrasting recreational and commercial
fishing: Searching for common issues to promote unified conservation of fisheries
resources and aquatic environments. Biological Conservation 128, 93-108.
Cowx, I. G. (2001). Recreational sport fishing in fresh waters. Encyclopedia of Life
Support Systems, 89-94.
Cowx, I. G. (2002). Recreational fishing. In ‘Handbook of Fish Biology and
Fisheries, Volume 2: Fisheries’. (Eds P. J. B. Hart and J. D. Reynolds.) pp. 367-390.
(Blackwell Science Ltd: Oxford, UK.)
Crosson, S. C. (2010). A social and economic survey of recreational saltwater
anglers in North Carolina. NC Department of Environment and Natural Resources,
Division of Marine Fisheries, Morehead City, NC.
232
Crowe, F. M., Longson, I. G., and Joll, L. M. (2013). Development and
implementation of allocation arrangements for recreational and commercial fishing
sectors in Western Australia. Fisheries Management and Ecology 20 (2-3), 201-
210.
Dambacher, J. M., Gaughan, D. J., Rochet, M. J., Rossignol, P. A., and Trenkel, V.
M. (2009). Qualitative modelling and indicators of exploited ecosystems. Fish and
Fisheries 10 (3), 305-322.
Danylchuk, A. J., and Cooke, S. J. (2010). Engaging the recreational angling
community to implement and manage aquatic protected areas. Conservation
Biology 25 (3), 458-464.
DeAngelis, D. L., and Mooij, W. M. (2005). Individual-based modeling of ecological
and evolutionary processes. Annual Review of Ecology, Evolution, and Systematics
36, 147-168.
DeAngelis, D. L., Cox, D. K., and Coutant, C. C. (1980). Cannibalism and size
dispersal in young-of-the-year largemouth bass: Experiment and model. Ecological
Modelling 8, 133-148.
Dempson, J., Robertson, M., Cochrane, N., O’Connell, M. F., and Porter, G. (2012).
Changes in angler participation and demographics: analysis of a 17‐year licence
stub return system for Atlantic salmon. Fisheries Management and Ecology 19,
333–343.
Department of Fisheries (2004). Proposals for community discussion on the future
management of pink snapper fishing in Cockburn Sound and surrounding waters.
Department of Fisheries, Fisheries Management Paper No. 187, Western Australia.
Department of Fisheries (2011). Resource assessment framework (RAF) for finfish
resources in Western Australia. Department of Fisheries, Fisheries Occasional
Publication No. 85, Western Australia.
Department of Fisheries (2012). Recreational fishing guide: West coast region.
Government of Western Australia, Department of Fisheries, Published May 2012,
Western Australia.
233
Department of Fisheries (2013). Recreational fishing guide 2013: Simpler rules for
better fishing. Government of Western Australia, Department of Fisheries, Published
February 2013, Western Australia.
Devroye, L. (1986). ‘Non-uniform random variate generation.’ (New York: Springer-
Verlag: New York.)
Diggles, B. K., and Ernst, I. (1997). Hooking mortality of two species of shallow-
water reef fish caught by recreational angling methods. Marine and Freshwater
Research 48 (6), 479-483.
Dillman, D. A. (1978). ‘Mail and Telephone Surveys.’ (Wiley: New York.)
Dillman, D. A. (1991). The design and administration of mail surveys. Annual
Review of Sociology 17, 225-249.
Dillman, D. A. (2000). ‘Mail and Internet Surveys: The Tailored Design Method.’
2nd Edn. (John Wiley and Sons: New York.)
Ditton, R. (2008). An international perspective on recreational fishing. In ‘Global
Challenges in Recreational Fisheries’. (Eds O. Aas.) pp. 5-12. (Blackwell Publishing
Ltd: Oxford, UK.)
Ditton, R. B. (1996). Human dimensions in fisheries. In Natural resource
management: The human dimension. (Ed A. Ewert) pp. 73–90. (Westview Press:
Boulder, Colorado.)
Ditton, R. B., and Holland, S. M. (1984). Understanding involved fishermen: a
survey on members of the Gulf Coast Conservation Association. Government
Reports, Announcements and Index, National Technical Information Service (NTIS),
US Department of Commerce 84 (20).
Ditton, R. B., and Hunt, K. M. (2001). Combining creel intercept and mail survey
methods to understand the human dimensions of local freshwater fisheries.
Fisheries Management and Ecology 8, 295-301.
Ditton, R. B., Loomis, D. K., and Choi, S. (1992). Recreation specialization: Re-
conceptualization from a social worlds perspective. Journal of Leisure Research 24
(1), 33-51.
234
Dockner, E. J., Jorgensen, S., Van Long, N., and Sorger, G. (2000). ‘Differential
games in economics and management science.’ (Cambridge University Press:
Cambridge, UK.)
Donnelly, M. P., Vaske, J. J., and Graefe, A. R. (1986). Degree and range of
recreation specialization: Toward a typology of boating related activities. Journal of
Leisure Research 18, 81–95.
Dorow, M., Beardmore, B., Haider, W., and Arlinghaus, R. (2009). Using a novel
survey technique to predict fisheries stakeholders’ support for European eel
(Anguilla anguilla L.) conservation programs. Biological Conservation 142 (12),
2973-2982.
Dorow, M., Beardmore, B., Haider, W., and Arlinghaus, R. (2010). Winners and
losers of conservation policies for European eel, Anguilla anguilla: an economic
welfare analysis for differently specialised eel anglers. Fisheries Management and
Ecology 17, 106–125.
Dreyfus-León, M. (2006). Modelling cooperation between fishermen with a cellular
automaton. A framework for fishing effort spatial dynamics. Ecological Informatics
1 (1), 101-105.
Dreyfus-León, M., and Kleiber, P., (2001). A spatial individual behaviour-based
model approach of the yellowfin tuna fishery in the eastern Pacific Ocean. Ecological
Modelling 146, 47–56.
Dreyfus-León, M. J. (1999). Individual-based modelling of fishermen search
behaviour with neural networks and reinforcement learning. Ecological Modelling
120, 287-297.
Duffy, J., and Ünver, M. U. (2006). Asset price bubbles and crashes with near-zero-
intelligence traders. Economic Theory 27 (3), 537-563.
Eales, J., and Wilen, J. E. (1986). An examination of fishing location choice in the
pink shrimp fishery. Marine Resource Economics 2 (4), 331-351.
Ewert, A. W. (1996). ‘Natural Resource Management: The Human Dimension.’
(Westview Press: Oxford.)
235
Fairclough, D. V., Dimmlich, W. F., and Potter, I. C. (2000a). Length and age
compositions and growth rates of the Australian herring Arripis georgiana in
different regions. Marine and Freshwater Research 51 (6), 631-640.
Fairclough, D. V., Dimmlich, W. F., and Potter, I. C. (2000b). Reproductive biology
of the Australian herring Arripis georgiana. Marine and Freshwater Research 51 (6),
619-630.
Fairclough, D.V., Molony, B.W., Crisafulli, B.M., Keay, I.S., Hesp, S.A. and Marriott,
R.J. (2014). Status of demersal finfish stocks on the west coast of Australia.
Department of Fisheries, Fisheries Research report No. 253, Western Australia.
Falk, J. M., Graefe, A. R., and Ditton, R. B. (1989). Patterns of participation and
motivation among saltwater tournament anglers. Fisheries 14 (4), 10–17.
FAO (2008). Fisheries technical guidelines for responsible fisheries. Technical Paper
No. 4 (suppl 2, Add 1). Food and Agriculture Organisation of the United Nations,
Rome.
FAO (2012). The state of the world fisheries and aquaculture. Food and Agriculture
Organisation of the United Nations, Rome.
Fedler, A. J., and Ditton, R. B. (1994). Understanding angler motivations in
fisheries management. Fisheries 19 (4), 6-13.
Fenichel, E. P., Abbott, J. K., and Huang, B. (2013). Modelling angler behaviour as
a part of the management system: synthesizing a multi‐disciplinary literature. Fish
and Fisheries 14 (2), 137-157.
Fisher, E. A., Hesp, S. A., and Hall, N. G. (2011). Exploration of the effectiveness of
alternative management responses to variable recruitment. Centre for Fish and
Fisheries Research, Murdoch University, FRDC Project Report 2008/006, Western
Australia.
Fisher, M. R. (1996). Estimating the effect of nonresponse bias on angler surveys.
Transactions of the American Fisheries Society 125, 118-126.

236
Fisher, M. R. (1997). Segmentation of the angler population by catch preference,
participation, and experience: A management-oriented application of recreation
specialization. North American Journal of Fisheries Management 17 (1), 1-10.
Fletcher, W. J., and Santoro, K. (Eds) (2012). Status Reports of the Fisheries and
Aquatic Resources of Western Australia 2011/12: The State of the Fisheries. p.376.
(Department of Fisheries, Western Australia.)
Fletcher, W.J., and Santoro, K. (Eds) (2013). Status Reports of the Fisheries and
Aquatic Resources of Western Australia 2012/13: The State of the Fisheries. p.377.
(Department of Fisheries, Western Australia.)
Fowler, C. W. (1999). Management of multi-species fisheries: from overfishing to
sustainability. ICES Journal of Marine Science: Journal du Conseil 56 (6), 927-932.
Frédou, T., Ferreira, B. P., and Letourneur, Y. (2006). A univariate and multivariate
study of reef fisheries off northeastern Brazil. ICES Journal of Marine Science:
Journal du Conseil 63 (5), 883-896.
Frijlink, S.D., and Lyle, J.M. (2010a). A socio-economic assessment of the
Tasmanian recreational rock lobster fishery. p.67. (Tasmanian Aquaculture and
Fisheries Institute, Hobart, Tasmania.)
Frijlink, S. D., and Lyle, J. M. (2010b). An evaluation of motivations, attitudes and
awareness of Tasmanian recreational fishers. p.62. (Tasmanian Aquaculture and
Fisheries Institute, Hobart, Tasmania.)
Gaertner, D. (2010). Common trends model in catch per unit of effort for the
tropical tunas. Collective Volume of Scientific Papers ICCAT 65 (2), 417-429.
Gao, L., and Hailu, A. (2010). Integrating recreational fishing behaviour within a
reef ecosystem as a platform for evaluating management strategies. In ‘Advanced
Information Networking and Applications (AINA), 2010 24th IEEE International
Conference, Perth, Western Australia, April 2010’. pp. 1286-1291.
Gao, L., and Hailu, A. (2011). Evaluating the effects of area closure for recreational
fishing in a coral reef ecosystem: The benefits of an integrated economic and
biophysical modeling. Ecological Economics 70, 1735–1745.
237
Gao, L., and Hailu, A. (2012). Ranking management strategies with complex
outcomes: An AHP-fuzzy evaluation of recreational fishing using an integrated
agent-based model of a coral reef ecosystem. Environmental Modelling & Software
31, 3-18.
Gao, L., and Hailu, A. (2013). Identifying preferred management options: An
integrated agent-based recreational fishing simulation model with an AHP-TOPSIS
evaluation method. Ecological Modelling 249, 505-527.
García-Berthou, E. (2001). Size-and depth-dependent variation in habitat and diet
of the common carp (Cyprinus carpio). Aquatic Sciences 63 (4), 466-476.
Gartside, D. F., Harrison, B., and Ryan, B. L. (1999). An evaluation of the use of
fishing club records in the management of marine recreational fisheries. Fisheries
Research 41 (1), 47-61.
Gautrais, J., Jost, C., and Theraulaz, G. (2008). Key behavioural factors in a self-
organised fish school model. Annales Zoologici Fennici 45 (5), 415-428.
Gentner, B., and Sutton, S. (2008). Substitution in recreational fishing. In ‘Global
Challenges in Recreational Fisheries’. (Eds O. Aas.) pp. 150-170. (Blackwell
Publishing Ltd: Oxford, UK.)
Gigliotti, L. M., and Peyton, R. B. (1993). Values and behaviors of trout anglers,
and their attitudes toward fishery management, relative to membership in fishing
organizations: a Michigan case study. North American Journal of Fisheries
Management 13 (3), 492-501.
Gillis, D. M., Peterman, R. M., and Pikitch, E. K. (1995). Implications of trip
regulations for high-grading; a model of the behavior of fishermen. Canadian
Journal of Fisheries and Aquatic Sciences 52 (2), 402-415.
Gillis, D. M. (2003). Ideal free distributions in fleet dynamics: a behavioural
perspective on vessel movement in fisheries analysis. Canadian Journal of Zoology
81 (2), 177-187.
Gitschlag, G. R., and Renaud, M. L. (1994). Field experiments on survival rates of
caged and released red snapper. North American Journal of Fisheries Management
14 (1), 131-136.
238
Gode, D. K., and Sunder, S. (1993). Allocative efficiency of markets with zero-
intelligence traders: Market as a partial substitute for individual rationality. Journal
of Political Economy 101, 119-37.
Gode, D. K., and Sunder, S. (1997). What makes markets allocatively efficient.
Quarterly Journal of Economics 112 (2), 603-30.
González, J. C., Dalforno, C., Suppi, R., and Luque, E. (2009). A fuzzy logic fish
school model. In Proceedings of the 9th International Conference on Computational
Science: Part I . (Allen et al., eds.), pp. 13-22. Springer Berlin Heidelberg.
Graefe, A. R. (1980). The relationship between level of participation and selected
aspects of specialization in recreational fishing. PhD Thesis, Texas A&M University,
College Station.
Graefe, A. R., and Fedler, A. J. (1986). Situational and subjective determinants of
satisfaction in marine recreational fishing. Leisure Sciences 8 (3), 275-294.
Granek, E. F., Madin, E. M. P., Brown, M. A., Figueira, W., Cameron, D. S., Hogan,
Z., Kristianson, G., De Villiers, P., Williams, J. E., Post, J., Zahn, S., and Arlinghaus,
R. (2008). Engaging recreational fishers in management and conservation: Global
case studies. Conservation Biology 22, 1125-1134.
Gray, R., Fulton, E., Little, R., and Scott, R. (2006). Ecosystem model specification
with an agent based framework. CSIRO Marine and Atmospheric Research,
Technical Report No. 16, Western Australia.
Greenstreet, S. P., Spence, F. B., Shanks, A. M., and McMillan, J. A. (1999). Fishing
effects in northeast Atlantic shelf seas: patterns in fishing effort, diversity and
community structure. II. Trends in fishing effort in the North Sea by UK registered
vessels landing in Scotland. Fisheries Research 40 (2), 107-124.
Greiner, R., and Gregg, D. (2010). Considering recreational catch and harvest in
fisheries management at the bio-regional scale. Fisheries Management and Ecology
17, 336–345.
Grimm, V. (1999). Ten years of individual-based modelling in ecology: what have
we learned and what could we learn in the future? Ecological Modelling 115, 129–
148.
239
Grimm, V., and Railsback, S. F. (2005). ‘Individual-based Modeling and Ecology.’
(Princeton: Princeton University Press.)
Grimm, V., Berger, U., Bastiansen, F., Eliassen, S., Ginot, V., Giske, J., Goss-
Custard, J., Grand, T., Heinz, S., Huse, G., Huth, A., Jepsen, J. U., Jørgensen, C.,
Mooij, W. M., Müller, B., Pe’er, G., Piou, C., Railsback, S. F., Robbins, A. M.,
Robbins, M. M., Rossmanith, E., Rüger, N., Strand, E., Souissi, S., Stillman, R.A.,
Vabø, R., Visser, U., and DeAngelis, D. L. (2006). A standard protocol for describing
individual-based and agent-based models. Ecological Modelling 198, 115–126.
Grimm, V., Berger, U., DeAngelis, D. L., Polhill, J. G., Giske, J., and Railsback, S. F.
(2010). The ODD protocol: A review and first update. Ecological Modelling 221,
2760–2768.
Grimm, V., Revilla, E., Berger, U., Jeltsch, F., Mooij, W. M., Railsback, S. F., Thulke,
H. H., Weiner, J., Wiegand, T., and DeAngelis, D. L. (2005). Pattern-oriented
modeling of agent-based complex systems: Lessons from ecology. Science 310,
987-991.
Hahn, J. (1991). Angler specialization: measurement of a key sociological concept
and implications for fisheries management decisions. American Fisheries Society
Symposium 12, 380–389.
Hampton, J., and Majkowski, J. (1987). A simulation model for generating catch
length-frequency data. In ‘Length-based methods in fisheries research Conference
Proceedings, Kuwait’. (Eds D. Pauly and G.R. Morgan.) pp. 193-202. (Kuwait
Institute for Scientific Research: Safat, Kuwait.)
Hejleh, M. (2014). ‘Metropolitan Perth and Regional Western Australia.’ Available at
http://www.perthandregionalwesternaustralia.com/ [accessed 28 November,
2011].
Hemelrijk, C. K., and Kunz, H. (2005). Density distribution and size sorting in fish
schools: an individual-based model. Behavioral Ecology 16 (1), 178-187.
Henry, G. W., and Lyle, J. M. (2003). The National Recreational and Indigenous
Fishing Survey. Australian Government Department of Agriculture, Fisheries and
Forestry, FRDC Project No. 99/158: NSW Fisheries Final Report Series No. 48,
Canberra.
240
Hesp, S. A., Burch, R. J., Tink, C. J., and Hall, N. G. (2010). Development of an
agent- based model to communicate implications of recruitment variability of
finfish to recreational fishers. Centre for Fish and Fisheries Research, Murdoch
University, FRDC Project Report 2008/033, Western Australia.
Hesp, S. A., Potter, I. C., and Hall, N. G. (2002). Age and size composition, growth
rate, reproductive biology, and habitats of the West Australian Dhufish
(Glaucosoma hebraicum) and their relevance to the management of this species.
Fishery Bulletin 100 (2), 214-227.
Hesp, S. A., Tweedley, J. R., McAuley, R., Tink, C. J., Campbell, R. A., Chuwen, B.
M., and Hall, N. G. (2012). Informing risk assessment through estimating
interaction rates between Australian sea lions and Western Australia’s temperate
demersal gillnet fisheries. Centre for Fish and Fisheries Research, Murdoch
University, FRDC Project Report 2009/096, Western Australia.
Hickley, P. (1998). Recreational fisheries – social, economic and management
aspects. In ‘Recreational Fisheries: Social, Economic and Management Aspects’.
(Eds P. Hickley and H. Tompkins). pp. 137-157. (Fishing News Books: Oxford.)
Hilborn, R. (1985). Fleet dynamics and individual variation: Why some people catch
more fish than others. Canadian Journal of Fisheries and Aquatic Sciences 42, 2-13.
Hilborn, R., and Ledbetter, M. (1979). Analysis of the British-Columbia salmon
purse-seine fleet - dynamics of movement. Journal of the Fisheries Research Board
of Canada 36, 384–391.
Hilborn, R., and Walters, C. J. (1992). ‘Quantitative fisheries stock assessment:
choice, dynamics and uncertainty.’ (Chapman and Hall, New York.)
Hilborn, R., Branch, T. A., Ernst, B., Magnusson, A., Minte-Vera, C. V., Scheuerell,
M. D., and Valero, J. L. (2003). State of the world's fisheries. Annual Review of
Environment and Resources 28 (1), 359-399.
Hubbard, S., Babak, P., Sigurdsson, S. T., and Magnússon, K. G. (2004). A model
of the formation of fish schools and migrations of fish. Ecological Modelling 174 (4),
359-374.
241
Hunt, K. (2001). Use of angler information in fisheries management. LakeLine 21
(3), 37-39.
Hunt, L., Haider, W., and Armstrong, K. (2002). Understanding the fish harvesting
decisions by anglers. Human Dimensions of Wildlife: An International Journal 7 (2),
75-89.
Hunt, L. M., Arlinghaus, R., Lester, N., and Kushneriuk, R. (2011). The effects of
regional angling effort, angler behavior, and harvesting efficiency on landscape
patterns of overfishing. Ecological Applications 21 (7), 2555-2575.
Hunt, L. M., Kushneriuk, R., and Lester, N. (2006). Developing Agent-Based Models
of Recreational Behaviours at a Landscape Scale: The case of Recreational Fishing
in Northern Ontario. In ‘Exploring the Nature of Management. Proceedings of the
Third International Conference on Monitoring and Management of Visitor Flows in
Recreational and Protected Areas.’ (Eds D. Siegrist, C. Clivaz, M. Hunziker, and S.
Iten). pp. 307-310. (University of Applied Sciences Rapperswil: Switzerland.)
Hunt, L. M., Kushneriuk, R., and Lester, N. (2007). Linking agent-based and choice
models to study outdoor recreation behaviours: A case of the Landscape Fisheries
Model in northern Ontario, Canada. Forest Snow and Landscape Research 81, 163–
174.
Hunt, L. M., Sutton, S. G., and Arlinghaus, R. (2013). Illustrating the critical role of
human dimensions research for understanding and managing recreational fisheries
within a social‐ecological system framework. Fisheries Management and Ecology 20
(2-3), 111-124.
Huse, G., Railsback, S., and Feronö, A. (2002). Modelling changes in migration
pattern of herring: collective behaviour and numerical domination. Journal of Fish
Biology 60 (3), 571-582.
Huston, M., DeAngelis, D. L., and Post, W. (1988). New computer models unify
ecological theory. Bioscience 38, 682-691.
Hutt, C. P., and Bettoli, P. W. (2007). Preferences, specialization, and management
attitudes of trout anglers fishing in Tennessee Tailwaters. North American Journal of
Fisheries Management 27 (4), 1257-1267.
242
Hutton T., Mardle S., Pascoe S., and Clark R.A. (2004). Modelling fishing location
choice within mixed fisheries: English North Sea beam trawlers in 2000 and 2001.
ICES Journal of Marine Science 61, 1443-1452.
Hyndes, G. A., Platell, M. E., and Potter, I. C. (1997). Relationships between diet
and body size, mouth morphology, habitat and movements of six sillaginid species
in coastal waters: implications for resource partitioning. Marine Biology 128 (4),
585-598.
IBM Corporation. (2011). IBM SPSS Statistics for Windows, Version 20.0. Armonk,
NY: IBM Corp.
ID Consulting Pty Limited (n.d.). ‘Community profiles’, ID Consulting Pty Limited.
Available at http://home.id.com.au [accessed 28 November, 2011].
Inada, Y. (2001). Steering mechanism of fish schools. Complexity International 8,
1-9.
Jennings, C. A. (1992). Survey of non-charter boat recreational fishing in the US
Virgin Islands. Bulletin of Marine Science 50 (2), 342-351.
Jennings, N. R. (2000). On agent-based software engineering. Artificial intelligence
117 (2), 277-296.
Johnston, F. D., Arlinghaus, R., and Dieckmann, U. (2010). Diversity and
complexity of angler behaviour drive socially optimal input and output regulations in
a bioeconomic recreational-fisheries model. Canadian Journal of Fisheries and
Aquatic Sciences 67, 1507-1531.
Joyce, S. J., Tomlin, S. M., Somerford, P. J., and Weeramanthri, T. S. (2013).
Health behaviours and outcomes associated with fly‐in fly‐out and shift workers in
Western Australia. Internal Medicine Journal 43 (4), 440-444.
Justus, J. (2005). Qualitative scientific modeling and loop analysis. Philosophy of
Science 72, 1272–1286.
243
Kaitala, V., and Munro, G., (1995). The economic management of high seas fishery
resources: some game theoretic aspects. In ‘Control and Game-Theoretic Models of
the Environment’. (Eds C. Carraro and J.A. Filar.) pp. 299-318 (Birkhäuser:
Boston.)
Karali, E., Rounsevell, M. D., and Doherty, R. (2011). Integrating the diversity of
farmers’ decisions into studies of rural land-use change. Procedia Environmental
Sciences 6, 136-145.
Kempf, A. M., and Remington, P. L. (2007). New challenges for telephone survey
research in the twenty-first century. The Annual Review of Public Health 28, 113-
126.
Kennedy, R. C., Lane, K. E., Fuentes, A., Hollocher, H., and Madey, G. (2009).
Spatially aware agents: an effective and efficient use of GIS data within an agent-
based model. In ‘Proceedings of the 2009 Spring Simulation Multiconference.’ pp.
1-8. (Society for Computer Simulation International).
Kerstetter, D. L., Confer, J. J., and Graefe, A. R. (2001). An exploration of the
specialization concept within the context of heritage tourism. Journal of Travel
Research 39 (3), 267-274.
Kim, S. S., Kim, J. H., and Ritchie, B. W. (2008). Segmenting overseas golf tourists
by the concept of specialization. Journal of Travel & Tourism Marketing 25 (2), 199-
217.
Kirchner, C. H., Holtzhausen, J. A., and Voges, S. F. (2001). Introducing size limits
as a management tool for the recreational line fishery of silver kob, Argyrosomus
inodorus (Griffiths and Heemstra), in Namibian waters. Fisheries Management and
Ecology 8 (3), 227-237.
Koen-Alonso, M. (2009). Some observations on the role of trophodynamic models
for ecosystem approaches to fisheries. In ’The Future of Fisheries Science in North
America’. (Eds R. J. Beamish and B. J. Rothschild.) pp. 185-207. (Springer:
Canada.)
Kuentzel, W. F., and Heberlein, T. A. (1992). Does specialization affect behavioral
choices and quality judgments among hunters?. Leisure Sciences 14 (3), 211-226.
244
Kuentzel, W. F., and McDonald, C. D. (1992). Differential effects of past experience,
commitment, and lifestyle dimensions on river use specialization. Journal of Leisure
Research 24 (3), 269-287.
Kyle, G., Norman, W., Jodice, L., Graefe, A., and Marsinko, A. (2007). Segmenting
anglers using their consumptive orientation profiles. Human Dimensions of Wildlife
12, 115–132.
Larkin, M. F., Ault, J. S., Humston, R., and Luo, J. (2010). A mail survey to
estimate the fishery dynamics of southern Florida’s bonefish charter fleet. Fisheries
Management and Ecology 17 (3), 254-261.
Latour, R. J., Brush, M. J., and Bonzek, C. F. (2003). Toward ecosystem-based
fisheries management. Fisheries 28 (9), 10-22.
Lee, J.H., and Scott, D. (2004). Measuring birding specialization: A confirmatory
factor analysis. Leisure Sciences 26 (3), 245-260.
Lenanton, R., St. John, J., Keay, I., Wakefield, C., Jackson, G., Wise, B., and
Gaughan, D. (2009). Spatial scales of exploitation among populations of demersal
scalefish: implications for management. Part 2: Stock structure and biology of two
indicator species, West Australian dhufish (Glaucosoma hebraicum) and pink
snapper (Pagrus auratus), in the West Coast Bioregion. Final report to Fisheries
Research and Development Corporation on Project No. 2003/052. Fisheries
Research Report No. 174, Department of Fisheries, Western Australia.
Lewin, W. C., Arlinghaus, R., and Riera, V. (2006). Documented and potential
biological impact of recreational fishing: insight for management and conservation.
Reviews in Fisheries Science 14, 305–367.
Little, L. R., Kuikka, S., Punt, A. E., Pantus, F., Davies, C. R., and Mapstone, B. D.
(2004). Information flow among fishing vessels modelled using a Bayesian network.
Environmental Modelling and Software 19, 27-34.
Little, L. R., Punt, A. E., Mapstone, B. D., Begg, G. A., Goldman, B., and Williams,
A. J. (2009). An agent-based model for simulating trading of multi-species fisheries
quota. Ecological Modelling 220, 3404-3412.
245
Lomnicki, A. (1992). Population ecology from the individual perspective. In
‘Individual-based Models and Approaches in Ecology: Populations, Communities and
Ecosystems.’ (Eds. D. L. DeAngelis and L. J. Gross). pp. 3-17. (New York: Chapman
and Hall.)
Lyle, J. M. (2008). Application of a telephone-diary methodology to estimate catch
and effort in recreational fisheries: examples from Australia. In ‘ICES Annual
Science Conference, Halifax: Canada, 22-26 September 2008.’ p. 10.
Lyle, J. M., and Smith, J. T. (1998). Pilot survey of licensed recreational sea fishing
in Tasmania 1995-96. Department of Primary Industry and Fisheries, Technical
Report No. 51, Tasmania.
Lyle, J. M., Coleman, A. P. M., West, L., Campbell, D., Henry, G. W. (2002). New
large-scale survey methods for evaluating sport fisheries. In ‘Recreational Fisheries:
ecological, economic and social evaluation’. (Eds T. J. Pitcher and C. E.
Hollingworth). pp. 207–226 (Blackwell Science: Oxford.)
Lyle, J. M., Morton, A. J., and Forward, J. (2005). Characterisation of the
recreational fishery for southern rock lobster, Jasus edwardsii, in Tasmania,
Australia: implications for management. New Zealand Journal of Marine and
Freshwater Research 39 (3), 703-713.
Macal, C. M., and North, M.J. (2007). Agent-based modeling and simulation:
Desktop ABMS. Proceedings of the 2007 Winter Simulation Conference. (Eds S. G.
Henderson, B. Biller, M. H. Hsieh, J. Shortle, J. D.Tew, and R. R.Barton). pp. 95-
106. (Center for Complex Adaptive Agent Systems Simulation, U.S.A.)
Mackie, M., McCauley, R. D., Gill, H.S., and Gaughan, D.J. (2009). Management
and Monitoring of Fish Spawning Aggregations within the West Coast Bioregion of
Western Australia, Draft final report (December 2008) to Fisheries Research and
Development Corporation on Project No. 2004/051 (Subject to FRDC approval).
Fisheries Research Report, Department of Fisheries, Western Australia.
Malseed, B. E., and Sumner, N. R. (2001). A 12-month survey of recreational
fishing in the Peel-Harvey Estuary of Western Australia during 1998-99.
Department of Fisheries, Fisheries Research Report No. 127, Western Australia.
246
Malseed, B. E., Sumner, N. R., and Williamson, P. C. (2000). A 12-month survey of
recreational fishing in the Leschenault Estuary of Western Australia during 1998.
Fisheries. Western Australia, Fisheries Research Report No. 120, Western Australia.
Margenau, T. L., and Petchenik, J. B. (2004). Social aspects of muskellunge
management in Wisconsin. North American Journal of Fisheries Management 24,
82–93.
Mathews, R. B., Gilbert, N. G., Roach, A., Pohill, J. G., and Gotts, N. G. (2007).
Agent-based land-use models: a review of applications. Landscape Ecology 22 (10),
1447–1459.
Mathiesen, C. (2003). Analytical framework for studying fishers’ behaviour and
adaptation strategies. In ‘Proceedings of The Eight Conference of the Circumpolar
Arctic Social Sciences Ph. D. Network, August, 2003.’
McCluskey, S. M., and Lewison, R. L. (2008). Quantifying fishing effort: a synthesis
of current methods and their applications. Fish and Fisheries 9, 188–200.
McConnell, K. E., Strand, I. E., and Blake-Hedges, L. (1995). Random utility models
of recreational fishing: Catching fish using a poisson-process. Marine Resource
Economics 10, 247-262.
McFarlane, B. L. (1994). Specialization and motivations of birdwatchers. Wildlife
Society Bulletin 22 (3), 361-370.
McFarlane, B. L. (1996). Socialization influences of specialization among
birdwatchers. Human Dimensions of Wildlife 1 (1), 35-50.
McGlennon, D., and Lyle, J. M. (1999). Bycatch in Australian recreational fisheries:
Is it an issue? In ‘Establishing meaningful targets for bycatch reduction in
Australian fisheries, Australian Society for Fish Biology Workshop Proceedings,
Sydney’. (Eds C. D. Buxton and S. E. Eayrs). pp. 82-86. (Australian Society for Fish
Biology: Sydney.)
McIntyre, N. (1989). The personal meaning of participation: Enduring involvement.
Journal of Leisure Research 21 (2), 167-179.
247
McIntyre, N., and Pigram, J. J. (1992). Recreation specialization re-examined: The
case of vehicle based campers. Leisure Sciences 14 (1), 3-15.
McLane, A. J., Semeniuk, C., McDermid, G. J., and Marceau, D. J. (2011). The role
of agent-based models in wildlife ecology and management. Ecological Modelling
222 (8), 1544-1556.
McPhee, D. P., Leadbitter, D., and Skilleter, G. A. (2002). Swallowing the bait: Is
recreational fishing ecologically sustainable? Pacific Conservation Biology 8, 40–51.
Melville-Smith, R., Anderton, S. M., and Caputi, N. (2001). Predicting the
recreational western rock lobster (Panulirus cygnus) catch in Western Australia.
Marine and Freshwater Research 52 (8), 1527-1534.
Metcalf, S. J., Moyle, K., and Gaughan, D. J. (2010). Qualitative analysis of
recreational fisher response and the ecosystem impacts of management strategies
in a data-limited situation. Fisheries Research 106, 289–297.
Miller, G. S. (1986). The definition and rendering of terrain maps. In ‘'86
Proceedings of the 13th Annual Conference on Computer Graphics and Interactive
Techniques, 1986, August’. pp. 39-48. (ACM: New York.)
Miller, T. J. (2007). Contribution of individual-based coupled physical-biological
models to understanding recruitment in marine fish populations. Marine Ecology
Progress Series 347, 127-138.
Moustakes, A., Silvert, W., and Dimitromanolakis, A. (2006). A spatially explicit
learning model of migratory fish and fishers for evaluating closed areas. Ecological
Modelling 192, 245-258.
Nagy, L., Fairbrother, A., Etterson, M., and Orme-Zavaleta, J. (2007). The
intersection of independent lies: increasing realism in ecological risk assessment.
Human and Ecological Risk Assessment 13 (2), 355-369.
O'Sullivan, D. (2008). Geographical information science: Agent-based models.
Progress in Human Geography 32, 541-550.
248
Oh, C. O., and Ditton, R. (2006a). Using recreation specialization to understand
multi-attribute management preferences. Leisure Sciences: An Interdisciplinary
Journal 28 (4), 369-384.
Oh, C. O., and Ditton, R. B. (2006b). Specialization differences in anglers’
preferences for red drum (Sciaenops ocellatus) harvest regulations. In ‘Proceedings
of the 57th Gulf and Caribbean Fisheries Institute, November 08 – 12, 2004’.
pp. 869-880. (Gulf and Caribbean Fisheries Institute: St. Petersburg, Florida USA.)
Oh, C. O., and Ditton, R. B. (2008). Using recreation specialization to understand
conservation support. Journal of Leisure Research 40 (4), 556-573.
Oh, C. O., Ditton, R. B., and Riechers, R. (2007). Understanding anglers’
preferences for fishing tournament characteristics and policies. Environmental
Management 40, 123–133.
Ormsby, J. (2004). A review of the social, motivational and experiential
characteristics of recreational anglers from Queensland and the Great Barrier Reef
Region. Great Barrier Reef Marine Park Authority, Research publications series no.
78, Australia.
Parrish, J. K., Viscido, S. V., and Grünbaum, D. (2002). Self-organized fish schools:
an examination of emergent properties. The Biological Bulletin 202 (3), 296-305.
Pelletier, D., and Ferraris, J. (2000). A multivariate approach for defining fishing
tactics from commercial catch and effort data. Canadian Journal of Fisheries and
Aquatic Sciences 57 (1), 51-65.
Penne, C. R., and Pierce, C. L. (2008). Seasonal distribution, aggregation, and
habitat selection of common carp in Clear Lake, Iowa. Transactions of the American
Fisheries Society 137 (4), 1050-1062.
Pikitch, E., Santora, E. A., Babcock, A., Bakun, A., Bonfil, R., Conover, D. O.,
Dayton, P., Doukakis, P., Fluharty, D., Heneman, B., Houde, E. D., Link, J.,
Livingston, P. A., Mangel, M., McAllister, M. K., Pope, J., and Sainsbury, K. (2004).
Ecosystem-based fishery management. Science 305, 346-347.
249
Pitcher, T. J., and Hollingworth, C. E. (2002). Fishing for fun: where's the catch?. In
‘Recreational Fisheries: ecological, economic and social evaluation’. (Eds T. J.
Pitcher and C. E. Hollingworth). pp. 1-16. (Blackwell Science: Oxford.)
Plagányi, É. E. (2007). Models for an ecosystem approach to fisheries. Food and
Agriculture Organisation of the United Nations No. 477, Rome.
Policansky, D. (2002). Catch-and release recreational fishing: a historical
perspective. In ‘Recreational Fisheries: ecological, economic and social evaluation’.
(Eds T. J. Pitcher and C. E. Hollingworth.) pp. 74-93 (Blackwell Science: Oxford.)
Policansky, D. (2008). Trends and developments in catch and release. In ‘Global
Challenges in Recreational Fisheries’. (Ed O. Aas.) pp. 202-208. (Blackwell
Publishing Ltd: Oxford, UK.)
Pollock, K. H., Jones, C. M., and Brown, T. L. (1994). ‘Angler survey methods and
their applications in fisheries management.’ (American Fisheries Society, Special
Publication 25: Bethesda, Maryland.)
Pollock, K. H. (2010). Review of the Telephone Diary Survey of the Tasmanian
Recreational Rock Lobster Fishery. Prepared for Tasmanian Association for
Recreational Fishing Inc., Tasmania, Australia.
Post, J. R., Persson, L., Parkinson, E. V., and Kooten, T. V. (2008). Angler
numerical response across landscapes and the collapse of freshwater fisheries.
Ecological Applications 18 (4), 1038-1049.
Post, J. R., Sullivan, M., Cox, S., Lester, N. P., Walters, C. J., Parkinson, E. A., Paul,
A. J., Jackson, L., and Shuter, B. J. (2002) Canada's recreational fisheries: the
invisible collapse?. Fisheries 27 (1), 6-17.
Pradervand, P., and Baird, D. (2002). Assessment of the recreational line fishery in
selected Eastern Cape estuaries: trends in catches and effort. South African Journal
of Marine Science 24 (1), 87-101.
Prior, S. P., and Beckley, L. E. (2007). Characteristics of recreational anglers in the
Blackwood Estuary, A popular tourist destination in southwestern Australia. Tourism
in Marine Environments 4, 15-28.
250
Punt, A. E. (2008) Refocusing stock assessment in support of policy evaluation. In
‘Fisheries for Global Welfare and Environment’. (Eds K. Tsukamoto, T. Kawamura,
T. Takeuchi, T. D. Beard Jr., and M. J. Kaiser) pp. 139-152. (5th World Fisheries
Congress: Terrapub, Tokyo.).
R Development Core Team (2013). R: A language and environment for statistical
computing. R Foundation for Statistical Computing, Vienna, Austria. ISBN 3-
900051-07-0, URL http://www.R-project.org.
Radomski, P. J., Grant, G. C., Jacobson, P. C., and Cook, M. F. (2001). Visions for
recreational fishing regulations. Fisheries 26 (5), 7-18.
Raguragavan, J., Hailu, A., and Burton, M. (2010). Economic valuation of
recreational fishing in Western Australia. Australian Journal of Agricultural and
Resource Economics, in press. Available at
http://ageconsearch.umn.edu/handle/97473 [accessed 28 November, 2014].
Railsback, S. F. (2001). Concepts from complex adaptive systems as a framework
for individual-based modelling. Ecological Modelling 139, 47-62.
Reid, D. (2008). Overview of recreational fishing in Australia. In ‘Global Challenges
in Recreational Fisheries’. (Ed O. Aas). pp. 13-18. (Blackwell Publishing Ltd: Oxford,
UK.)
Reynolds, J. D., Dulvy, N. K., Goodwin, N. B., and Hutchings, J. A. (2005). Biology
of extinction risk in marine fishes. Proceedings of the Royal Society B: Biological
Sciences 272 (1579), 2337-2344.
Richardson, D., and Denniss, R. (2011). Mining the truth: The rhetoric and reality
of the commodities boom. Australia Institute.
Roach, B., Trial, J., and Boyle, K. (1999). Comparing 1994 angler catch and harvest
rates from on-site and mail surveys on selected Maine lakes. North American
Journals of Fisheries Management 19, 203–208.
Rose, K. A., and Cowan, J. H. (1993). Individual-based model of young-of-the-year
striped bass population dynamics. I. Model description and baseline simulations.
Transactions - American Fisheries Society 122, 415-438.
251
Rothschild, B. J. (2000). 'Fish stocks and recruitment': The past thirty years. ICES
Journal of Marine Science 57, 191-201.
Ryan K.L., Morison, A.K., and Conron, S. (2009). Evaluating methods of obtaining
total catch estimates for individual Victorian bay and inlet recreational fisheries.
Final report to Fisheries Research and Development Corporation Project No.
2003/047. Department of Primary Industries, Queenscliff. 124 pp.
Ryan, K. L., Wise, B. S., Hall, N. G., Pollock, K. H., Sulin, E. H., and Gaughan, D. J.
(2013). An integrated system to survey boat-based recreational fishing in Western
Australia 2011/12. Fisheries Research Report No. 249, Department of Fisheries,
Western Australia.
Sainsbury, K. J., Punt, A. E., and Smith, A. D. M. (2000). Design of operational
management strategies for achieving fishery ecosystem objectives. ICES Journal of
Marine Science 57, 731–741.
Salas, S., and Gaertner, D. (2004). The behavioural dynamics of fishers:
management Implications. Fish and Fisheries 5, 153-167.
Salz, R. J., and Loomis, D. K. (2005). Recreation specialization and anglers'
attitudes towards restricted fishing areas. Human Dimensions of Wildlife 10 (3),
187-199.
Salz, R. J., Loomis, D. K., and Finn, K. L. (2001). Development and validation of a
specialization index and testing of specialization theory. Human Dimensions of
Wildlife: An International Journal 6 (4), 239-258.
Sampson, D. B. (1991). Fishing tactics and fish abundance, and their influence on
catch rates. ICES Journal of Marine Science: Journal du Conseil 48 (3), 291-301.
Sampson, D. B. (1994). Fishing tactics in a two-species fisheries model: the
bioeconomics of bycatch and discarding. Canadian Journal of Fisheries and Aquatic
Sciences 51 (12), 2688-2694.
Saul, S., Die, D., Brooks, E.N., and Burns, K. (2012). An individual-based model of
ontogenetic migration in reef fish using a biased random walk. Transactions of the
American Fisheries Society 141 (6), 1439-1452.
252
Schlüter, M., Mcallister, R. R. J., Arlinghaus, R., Bunnefeld, N., Eisenack, K., Hölker,
F., Milner-Gulland, E. J., Müller, B., Nicholson, E., Quaas, M., and Stöven, M.
(2012). New horizons for managing the environment: review of coupled social-
ecological systems modeling. Natural Resource Modeling 25 (1), 219-272.
Schönfisch, B. (2001). Simple individual based models of movement, alignment and
schooling behaviour. Future Generation Computer Systems 17, 873–882
Schramm, H. L., Jr., Bray, G. S., and Gill, D. A. (1998). Determination of factors
that affect angler retention and recruitment. Completion report. U. S. Fish and
Wildlife Service Division of Federal Aid, Arlington, Virginia.
Schramm, H. L., and Gerard, P. D. (2004). Temporal changes in fishing motivation
among fishing club anglers in the United States. Fisheries Management and Ecology
11 (5), 313-321.
Schnute, J. T., Maunder, M. N., and Ianelli, J. N. (2007) Designing tools to evaluate
fisherymanagement strategies: can the scientific community deliver? ICES Journal
of Marine Science 64, 1077-1084.
Schwarz, N., and Ernst, A. (2009). Agent-based modeling of the diffusion of
environmental innovations-an empirical approach. Technological Forecasting and
Social Change 76 (4), 497-511.
Scott, D., and Godbey, G. (1994). Recreation specialization in the social world of
contract bridge. Journal of Leisure Research 26 (3), 275-295.
Shin, Y. J., and Cury, P. (2001). Exploring fish community dynamics through size-
dependent trophic interactions using a spatialized individual-based model. Aquatic
Living Resources 14, 65-80.
Shin, Y. J., Shannon, L. J., and Cury, P. M. (2004). Simulations of fishing effects on
the southern Benguela fish community using an individual-based model: learning
from a comparison with Ecosim. African Journal of Marine Science 26 (1), 95-114.
Silvano, R. A., and Valbo-Jørgensen, J. (2008). Beyond fishermen’s tales:
contributions of fishers’ local ecological knowledge to fish ecology and fisheries
management. Environment, Development and Sustainability 10 (5), 657-675.
253
Smallwood, C. B., Beckley, L. E., and Sumner, N. R. (2006). Shore-based
recreational angling in the Rottnest Island Reserve, Western Australia: Spatial and
temporal distribution of catch and fishing effort. Conservation Biology 12, 238-251.
Smallwood, C.B., Pollock, K.H., Wise, B.S., Hall, N.G., and Gaughan, D.J. (2011).
Quantifying recreational fishing catch and effort: a pilot study of shore-based
fishers in the Perth Metropolitan area. Department of Fisheries, Fisheries Research
Report No. 216, Western Australia.
Smith, A. D. M. (1993) Risks of over- and under-exploiting new resources. In
‘Riskevaluation and biological reference points for fisheries management.’ (Eds S. J.
Smith, J. J. Hunt, and D. Rivard). pp. 261-267. (Canadian Special Publication of
Fisheries and Aquatic Sciences 120)
Smith, W., Kyle, G., and Sutton, S. G. (2012). Angler segmentation using
perceptions of experimental quality in the Great Barrier Reef Marine Park. In
‘Proceedings of the 2010 Northeastern Recreation Research Symposium’. pp. 98-
104. (USDA Forest Service.)
St John, J., and Syers, C. J. (2005). Mortality of the demersal West Australian
Dhufish, Glaucosoma hebraicum (Richardson 1845) following catch and release:
The influence of capture depth, venting and hook type. Fisheries Research 76, 106–
116.
Stephenson, P., and Jackson, G. (2005). Managing depleted snapper stocks in inner
Shark Bay, Western Australia. Fisheries Assessment and Management in Data-
Limited Situations, Alaska Sea Grant Program, 1-20.
Storey, K. (2001). Fly-in/fly-out and fly-over: mining and regional development in
Western Australia. Australian Geographer 32 (2), 133-148.
Stuart-Smith, R. D., Barrett, N. S., Crawford, C. M., Frusher, S. D., Stevenson, D.
G., and Edgar, G. J. (2008). Spatial patterns in impacts of fishing on temperate
rocky reefs: Are fish abundance and mean size related to proximity to fisher access
points?. Journal of Experimental Marine Biology and Ecology 365 (2), 116-125.
254
Sullivan, P. J., Breidt, F. J., Ditton, R. B., Knuth, B. A., Leaman, B. M., O’Connell, V.
M., Parsons, G. R., Pollock, K. H., Smith, S. J., and Stokes. S. L. (2006). "Review of
recreational fisheries survey methods." Ocean Studies Board–Division on Earth and
Life Studies, National Research Council of the National Academies, Washington, DC
(2006).
Sumner, N. R., and Williamson, P. C. (1999). A 12-month survey of recreational
boat-based fishing between Augusta and Kalbarri on the West Coast of Western
Australia during 1996-97. Fisheries Research Report No. 117. Department of
Fisheries, Western Australia.
Sumner, N. R., Williamson, P. C., Blight, S. J., and Gaughan, D. J. (2008). A 12-
month survey of recreational boat-based fishing between Augusta and Kalbarri on
the West Coast of Western Australia during 2005-06. Fisheries Research Report No.
177. Department of Fisheries, Western Australia.
Sumner, N. R., Williamson, P. C., and Malseed, B. E. (2002). A 12-month survey of
recreational fishing in the Gascoyne bioregion of Western Australia during 1998-99.
Department of Fisheries, Fisheries Research Report No. 139, Western Australia.
Sun, Z., and Müller, D. (2013). A framework for modeling payments for ecosystem
services with agent-based models, Bayesian belief networks and opinion dynamics
models. Environmental Modelling & Software 45, 15-28.
Sutinen, J. G., and Johnston, R. J. (2003). Angling management organizations:
Integrating the recreational sector into fishery management. Marine Policy 27, 471-
487.
Sutton, S. G. (2001). Understanding catch-and-release behavior of recreational
anglers. PhD Thesis, Texas A&M University, College Station.
Sutton, S. G. (2006). An assessment of the social characteristics of Queensland’s
recreational fishers. CRC Reef Research Centre, Technical Report No. 65, Australia.
Sutton, S. G., and Ditton, R. B. (2001). Understanding catch-and-release behavior
among US Atlantic bluefin tuna anglers. Human Dimensions of Wildlife 6 (1), 49-66.
Sutton, S. G., and Ditton, R. B. (2005). The substitutability of one type of fishing
for another. North American Journal of Fisheries Management 25 (2), 536-546.
255
Thapa, B., Graefe, A. R., and Meyer, L. A. (2005). Moderator and mediator effects
of SCUBA diving specialization on marine-based environmental knowledge-behavior
contingency. The Journal of Environmental Education 37 (1), 53-67.
Thapa, B., Graefe, A. R., and Meyer, L. A. (2006). Specialization and marine based
environmental behaviors among SCUBA divers. Journal of Leisure Research 38 (4),
601.
Thunberg, E. M., Bresnyan, E. W., and Adams, C. M. (1995). Economic analysis of
technical interdependencies and the value of effort in a multi-species fishery.
Marine Resource Economics 10, 59-76.
Tracey, S. R., Reinfrank, R., and Lyle, J. M. (2011). Evaluation of a recreational
angler logbook program for Tasmania. (Institute for Marine and Antarctic Studies,
University of Tasmania: Hobart, Tasmania.)
Tseng, Y. P., Kyle, G. T., Shafer, C. S., Graefe, A. R., Bradle, T. A., and Schuett, M.
A. (2009). Exploring the crowding–satisfaction relationship in recreational boating.
Environmental Management 43 (3), 496-507.
Uchmański, J., and Grimm, V. (1996). Individual-based modelling in ecology: what
makes the difference? Trends in Ecology & Evolution 11, 437-441.
Van Dyke Parunak, H., Savit, R., and Riolo, R. L. (1998). Agent-based modeling vs.
equation-based modeling: A case study and users’ guide. In ‘Multi-Agent Systems
and Agent-Based Simulation’. (Eds J. Sichman, R. Conte, and N. Gilbert). pp. 10-
25. (Springer: Berlin, Heidelberg.)
Van Winkle, W., Rose, K. A., and Chambers, R. C. (1993). Individual-based
approach to fish population dynamics: an overview. Transactions of the American
Fisheries Society 122 (3), 397-403.
Vaske, J. J., Donnelly, M. P., and Heberlein, T. A. (1978). Perceptions of crowding
and resource quality by early and more recent visitors. Leisure Sciences 3, 367–
381.
Virden, R. J., and Schreyer, R. M. (1988). Recreation specialization as an indicator
of environmental preference. Environment and Behavior 20 (6), 721- 739.
256
Wakefield, C.B. (2006) Latitudinal and temporal comparisons of the reproductive
biology and growth of snapper Pagrus auratus (Sparidae), in Western Australia.
Western Australia.[PhD Thesis]. Centre for Fish and Fisheries Research, Murdoch
University, Western Australia.
Ward, H.G.M., Quinn, M.S., and Post, J.R. (2013) Angler characteristics and
management implications in a large, multistock, spatially structured recreational
fishery. North American Journal of Fisheries Management 33 (3), 576-584.
Weithman, A. S. (1999). Socioeconomic benefits of fisheries. In ‘Inland Fisheries
Management in North America’. 2nd Edn. (Eds C.C. Kohler, and W.A. Hubert.)
pp. 193-213. (American Fisheries Society: Bethesda, Maryland.)
Wellman, J. D., Roggenbuck, J. W., and Smith, A. C. (1982). Recreation
specialization and norms of depreciative behavior among canoeists. Journal of
Leisure Research 14 (4), 323-340.
Whipple, S. J., Link, J. S., Garrison, L. P., and Fogarty, M. J. (2000). Models of
predation and fishing mortality in aquatic ecosystems. Fish and Fisheries 1, 22-40.
Wilde, G. R., and Ditton, R. B. (1999). Differences in attitudes and fishing motives
among Texas catfish anglers. American Fisheries Society Symposium 24, 395–405.
Wilde, G. R., Ditton, R. B., Grimes, S. R., and Riechers, R. K. (1996). Status of
human dimensions surveys sponsored by state and provincial fisheries
management agencies in North America. Fisheries 21 (11), 12-17.
Wilde, G. R., Riechers, R. K., and Gitton, R. B. (1998). Differences in attitudes,
fishing motives, and demographic characteristics between tournament and
nontournament Black Bass anglers in Texas. North American Journal of Fisheries
Management 18, 422–431.
Wilen, J. E., Smith, M. D., Lockwood, D., and Botsford, L. W. (2002). Avoiding
surprises: Incorporating fisherman behaviour into management models. Bulletin of
Marine Science 70 (2), 553-575.
Williamson, P. C., Sumner, N. R., and Malseed, B. E. (2006). A 12-month survey of
recreational fishing in the Pilbara region of Western Australia during 1999-2000.
Department of Fisheries, Fisheries Research Report No. 153, Western Australia.
257
Wise, B., St. John, J., and Lenanton, R. (2007). Spatial scales of exploitation
among populations of demersal scalefish: implications for management. Part 1:
Stock status of the key indicator species for the demersal scalefish fishery in the
West Coast Bioregion. Final Report to the Fisheries Research and Development
Corporation on Project No. 2003/052. Fisheries Research Report No. 163. p.130.
(Department of Fisheries: Western Australia.)
Worm, B., Hilborn, R., Baum, J.K., Branch, T.A., Collie, J.S., Costello, C., Fogarty,
M.J., Fulton, E.A., Hutchings, J.A., Jennings, S., Jensen, O.P., Lotze, H.K., Mace,
P.M., McClanahan, T.R., Minto, C., Palumbi, S.R., Parma, A.M., Ricard, D.,
Rosenburg, A.A., Watson, R., and Zeller, D. (2009). Rebuilding global fisheries.
Science 325 (5940), 578-585.
Xiao, Y., (2004). Modelling the learning behaviour of fishers: learning more from
their successes than from their failures. Ecological Modelling 171, 3–20.
Yu, R., Pan, M., Railsback, S. F., and Leung, P. S. (2009). A prototype agent based
fishery management model of Hawaii’s longline fishery. In ‘18th World IMACS /
MODSIM Congress, Cairns, 13-17 July 2009’. pp. 2170-2177. (Cairns, Australia.)
Zischke, M. T., Griffiths, S. P., and Tibbetts, I. R. (2012). Catch and effort from a
specialised recreational pelagic sport fishery off eastern Australia. Fisheries
Research 127, 61-72.

258

Appendices


Appendix A Recreational fisher phone survey. Interview script for computer-
assisted telephone interviewing (CATI) system (provided by Edith
Cowan University (ECU) Survey Research Centre, Joondalup, W.A.)
Pre-amble
Good afternoon/morning/evening, my name is _________ and I’m calling from the
Edith Cowan University Survey Research Centre, on behalf of a researcher at
Murdoch University.
May I please speak with _____________.
We’re conducting a survey about recreational fishing in W.A. and your boat licence
number was randomly selected from the recreational fishing boat licence register
held by the Department of Fisheries.
The survey asks questions related to recreational fishing in W.A. and will contribute
to a 3-year research study. Although the findings of the survey may be published,
none of the information you provide will be linked back to you as an individual.
The survey has been approved by the Murdoch University Human Ethics committee.
It is completely voluntary and if you decide to take part, you can choose to opt out
at any time.
The survey will take approximately 15 minutes to complete. May I please run
through it with you now?
Before we begin, I want to assure you of confidentiality for any answers you may
give, and let you know that parts of this survey may be listened to for training and
quality control purposes.

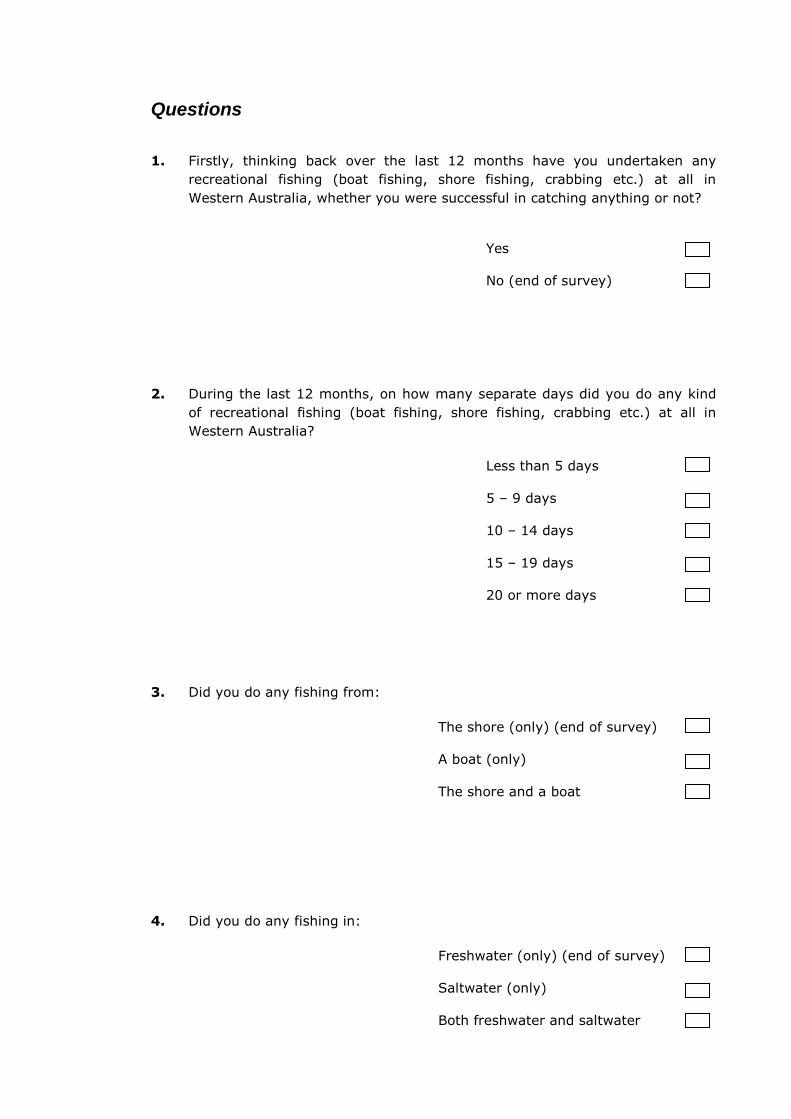
Questions
1. Firstly, thinking back over the last 12 months have you undertaken any
recreational fishing (boat fishing, shore fishing, crabbing etc.) at all in
Western Australia, whether you were successful in catching anything or not?
Yes
No (end of survey)
2. During the last 12 months, on how many separate days did you do any kind
of recreational fishing (boat fishing, shore fishing, crabbing etc.) at all in
Western Australia?
Less than 5 days
5 – 9 days
10 – 14 days
15 – 19 days
20 or more days
3. Did you do any fishing from:
The shore (only) (end of survey)
A boat (only)
The shore and a boat
4. Did you do any fishing in:
Freshwater (only) (end of survey)
Saltwater (only)
Both freshwater and saltwater
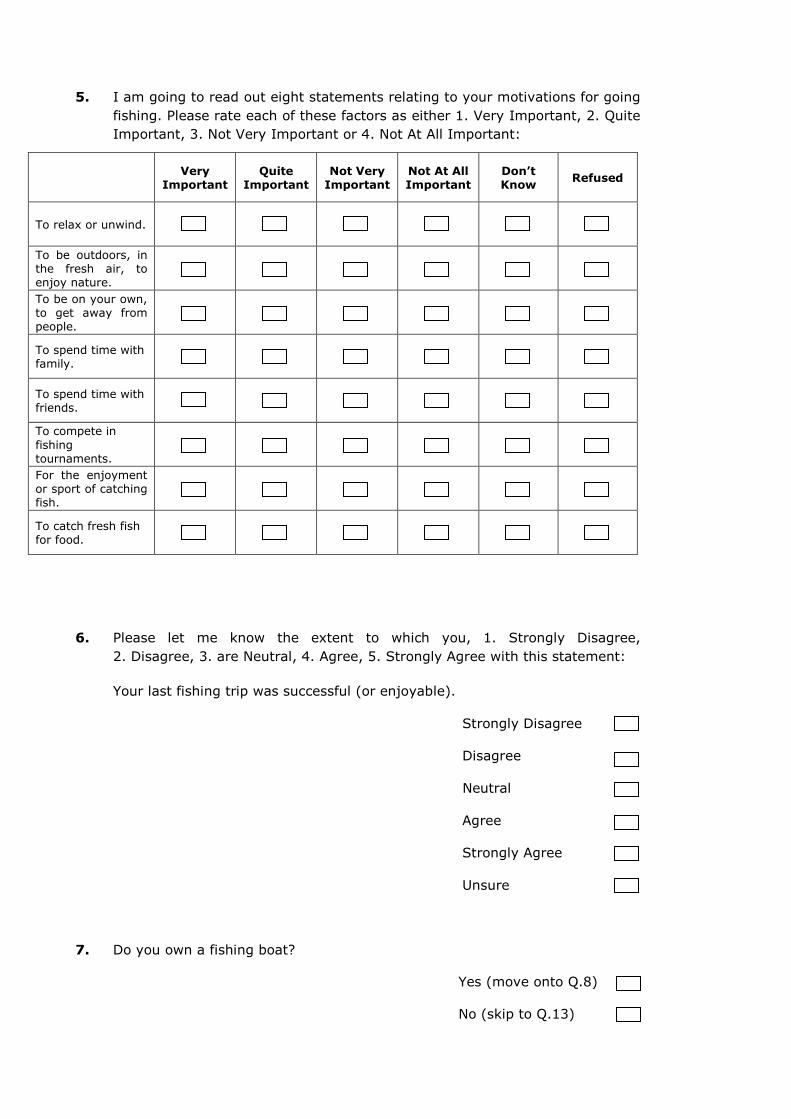
5. I am going to read out eight statements relating to your motivations for going
fishing. Please rate each of these factors as either 1. Very Important, 2. Quite
Important, 3. Not Very Important or 4. Not At All Important:
Very
Important Quite
Important Not Very
Important Not At All Important
Don’t Know
Refused
To relax or unwind.
To be outdoors, in the fresh air, to enjoy nature.
To be on your own, to get away from people.
To spend time with family.
To spend time with friends.
To compete in
fishing tournaments.
For the enjoyment or sport of catching fish.
To catch fresh fish for food.
6. Please let me know the extent to which you, 1. Strongly Disagree,
2. Disagree, 3. are Neutral, 4. Agree, 5. Strongly Agree with this statement:
Your last fishing trip was successful (or enjoyable).
Strongly Disagree
Disagree
Neutral
Agree
Strongly Agree
Unsure
7. Do you own a fishing boat?
Yes (move onto Q.8)
No (skip to Q.13)
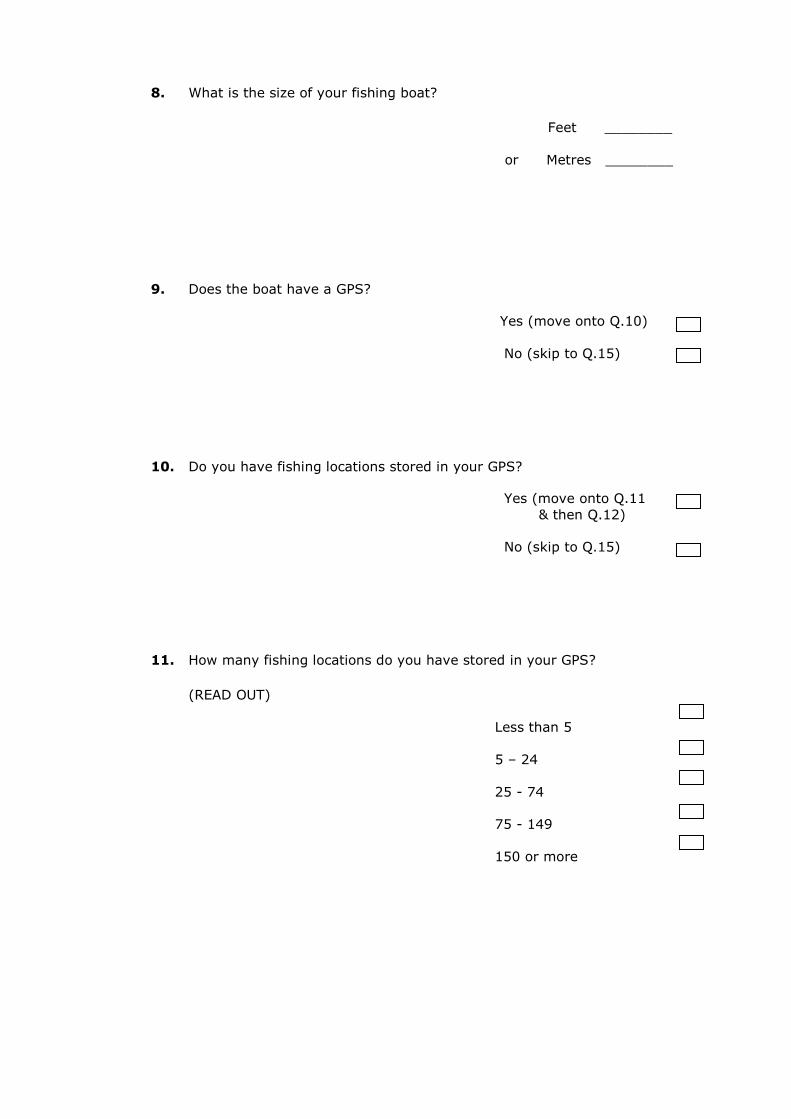
8. What is the size of your fishing boat?
Feet ________
or Metres ________
9. Does the boat have a GPS?
Yes (move onto Q.10)
No (skip to Q.15)
10. Do you have fishing locations stored in your GPS?
Yes (move onto Q.11
& then Q.12)
No (skip to Q.15)
11. How many fishing locations do you have stored in your GPS?
(READ OUT)
Less than 5
5 – 24
25 - 74
75 - 149
150 or more
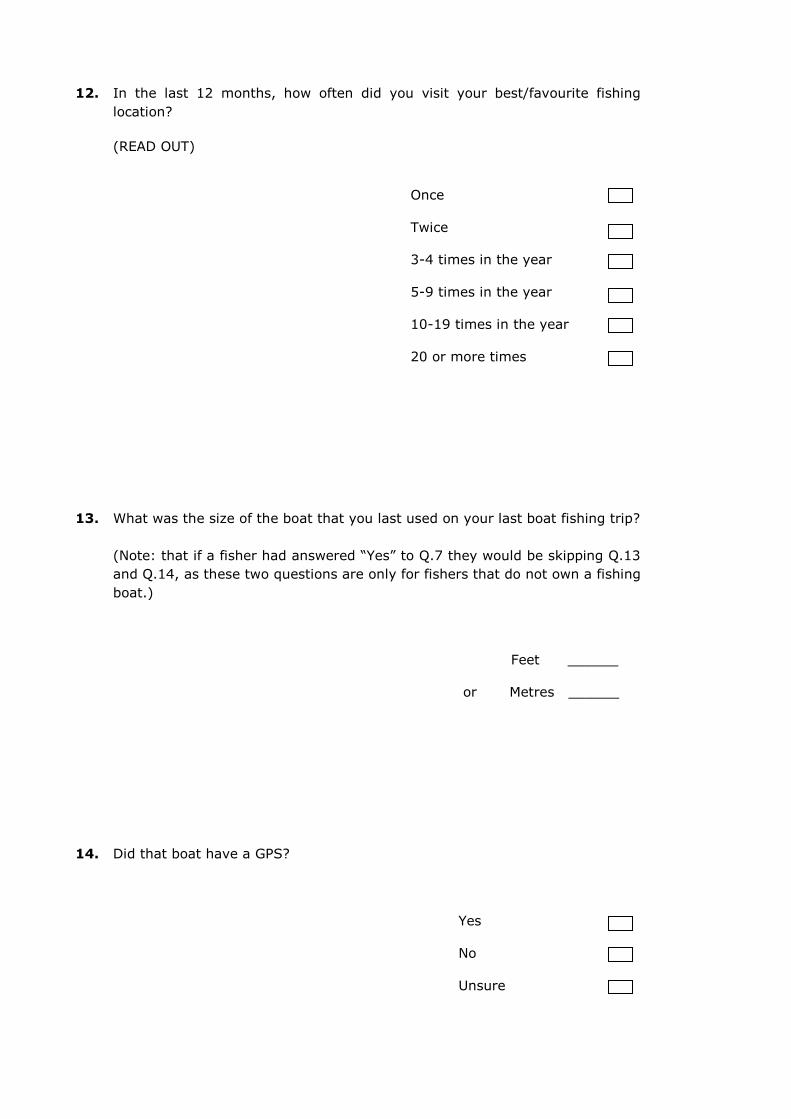
12. In the last 12 months, how often did you visit your best/favourite fishing
location?
(READ OUT)
Once
Twice
3-4 times in the year
5-9 times in the year
10-19 times in the year
20 or more times
13. What was the size of the boat that you last used on your last boat fishing trip?
(Note: that if a fisher had answered “Yes” to Q.7 they would be skipping Q.13
and Q.14, as these two questions are only for fishers that do not own a fishing
boat.)
Feet ______
or Metres ______
14. Did that boat have a GPS?
Yes
No
Unsure
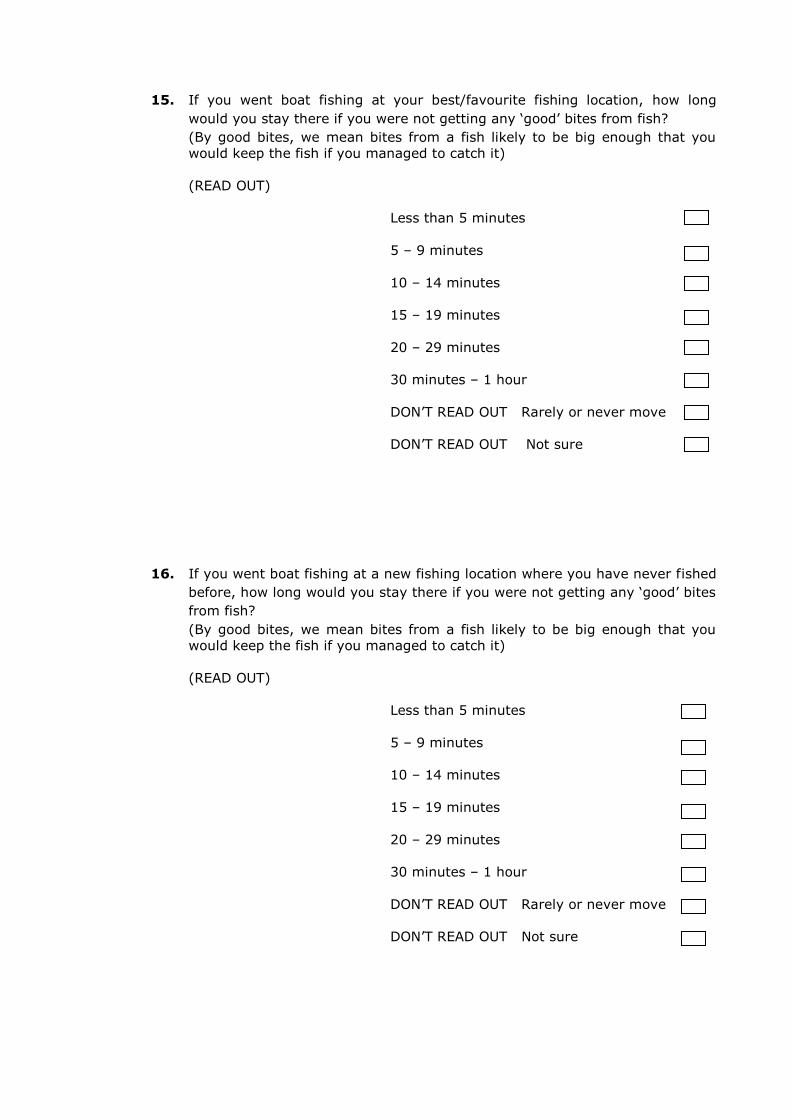
15. If you went boat fishing at your best/favourite fishing location, how long
would you stay there if you were not getting any ‘good’ bites from fish?
(By good bites, we mean bites from a fish likely to be big enough that you
would keep the fish if you managed to catch it)
(READ OUT)
Less than 5 minutes
5 – 9 minutes
10 – 14 minutes
15 – 19 minutes
20 – 29 minutes
30 minutes – 1 hour
DON’T READ OUT Rarely or never move
DON’T READ OUT Not sure
16. If you went boat fishing at a new fishing location where you have never fished
before, how long would you stay there if you were not getting any ‘good’ bites
from fish?
(By good bites, we mean bites from a fish likely to be big enough that you
would keep the fish if you managed to catch it)
(READ OUT)
Less than 5 minutes
5 – 9 minutes
10 – 14 minutes
15 – 19 minutes
20 – 29 minutes
30 minutes – 1 hour
DON’T READ OUT Rarely or never move
DON’T READ OUT Not sure
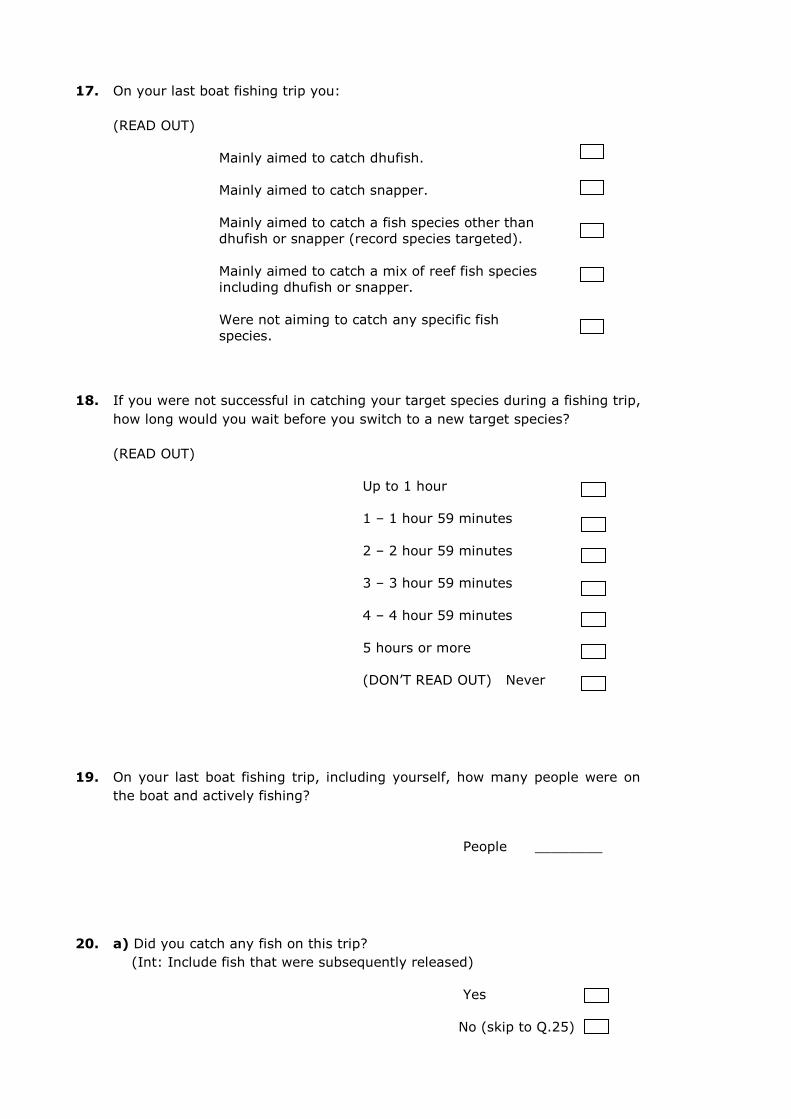
17. On your last boat fishing trip you:
(READ OUT)
Mainly aimed to catch dhufish.
Mainly aimed to catch snapper.
Mainly aimed to catch a fish species other than
dhufish or snapper (record species targeted).
Mainly aimed to catch a mix of reef fish species
including dhufish or snapper.
Were not aiming to catch any specific fish
species.
18. If you were not successful in catching your target species during a fishing trip,
how long would you wait before you switch to a new target species?
(READ OUT)
Up to 1 hour
1 – 1 hour 59 minutes
2 – 2 hour 59 minutes
3 – 3 hour 59 minutes
4 – 4 hour 59 minutes
5 hours or more
(DON’T READ OUT) Never
19. On your last boat fishing trip, including yourself, how many people were on
the boat and actively fishing?
People ________
20. a) Did you catch any fish on this trip?
(Int: Include fish that were subsequently released)
Yes
No (skip to Q.25)
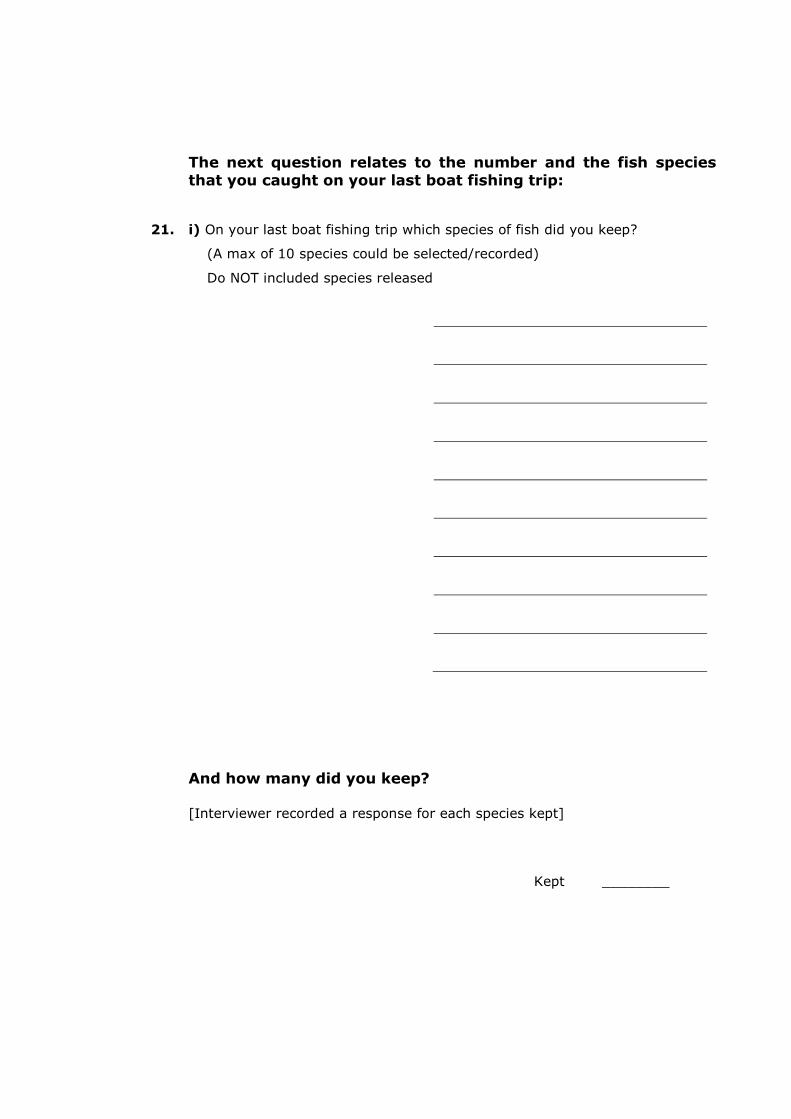
The next question relates to the number and the fish species
that you caught on your last boat fishing trip:
21. i) On your last boat fishing trip which species of fish did you keep?
(A max of 10 species could be selected/recorded)
Do NOT included species released
And how many did you keep?
[Interviewer recorded a response for each species kept]
Kept ________

22. ii) Which species of fish did you release?
(A max of 10 species can be selected)
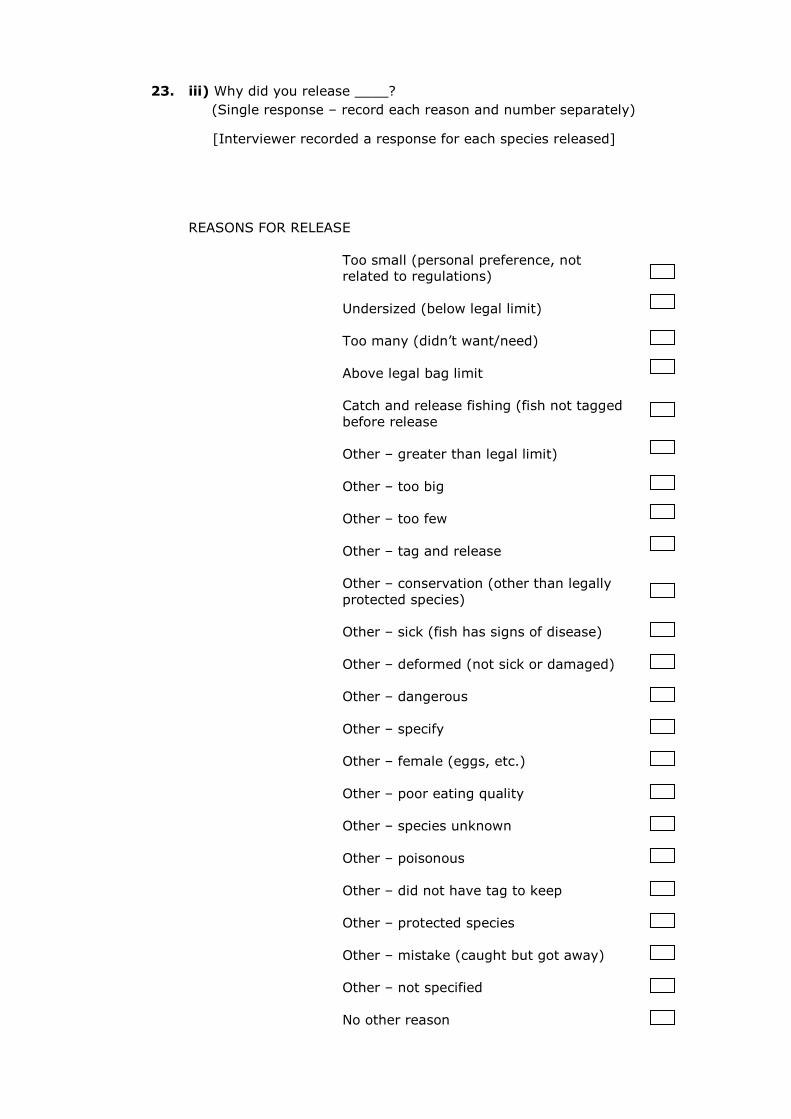
23. iii) Why did you release ____?
(Single response – record each reason and number separately)
[Interviewer recorded a response for each species released]
REASONS FOR RELEASE
Too small (personal preference, not
related to regulations)
Undersized (below legal limit)
Too many (didn’t want/need)
Above legal bag limit
Catch and release fishing (fish not tagged
before release
Other – greater than legal limit)
Other – too big
Other – too few
Other – tag and release
Other – conservation (other than legally
protected species)
Other – sick (fish has signs of disease)
Other – deformed (not sick or damaged)
Other – dangerous
Other – specify
Other – female (eggs, etc.)
Other – poor eating quality
Other – species unknown
Other – poisonous
Other – did not have tag to keep
Other – protected species
Other – mistake (caught but got away)
Other – not specified
No other reason
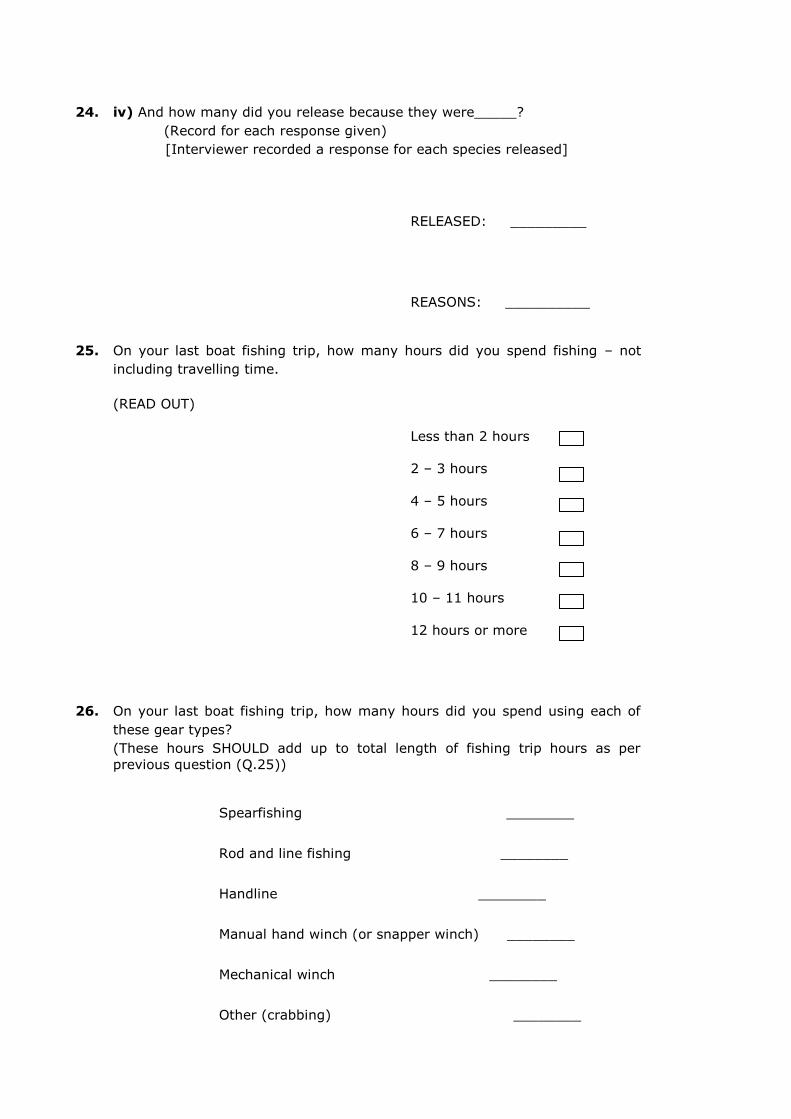
24. iv) And how many did you release because they were_____?
(Record for each response given)
[Interviewer recorded a response for each species released]
RELEASED: _________
REASONS: __________
25. On your last boat fishing trip, how many hours did you spend fishing – not
including travelling time.
(READ OUT)
Less than 2 hours
2 – 3 hours
4 – 5 hours
6 – 7 hours
8 – 9 hours
10 – 11 hours
12 hours or more
26. On your last boat fishing trip, how many hours did you spend using each of
these gear types?
(These hours SHOULD add up to total length of fishing trip hours as per
previous question (Q.25))
Spearfishing ________
Rod and line fishing ________
Handline ________
Manual hand winch (or snapper winch) ________
Mechanical winch ________
Other (crabbing) ________
27. On your last boat fishing trip, did you fish
(READ OUT - MULTIPLE RESPONSE POSSIBLE)
Using a sand anchor
Using a reef anchor (or reef pick)
By drift fishing using a sea anchor
By drift fishing without using a sea anchor
Other - specify
28. On your last boat fishing trip, in what water depths did you fish?
(READ OUT - MULTIPLE RESPONSE POSSIBLE)
Less than 15 metres
15 – 24 metres
25 – 34 metres
35 – 54 metres
55 – 94 metres
95 metres or more
(DON’T READ OUT) Unsure
29. On your last boat fishing trip, how far did you travel from the boat
ramp/pen to your first fishing spot?
(READ OUT)
Less than 5 km
5 – 9 km
10 – 14 km
14 – 19 km
20 – 29 km
30 km or more
(DON’T READ OUT) Unsure
30. How many locations did you fish at on your last boat fishing trip?
Number of locations ______
31. i) On your last boat fishing trip, how many kms did you move from your first
fishing location to the next (second) location?
Metres ______
or km ______
32. ii) On your last boat fishing trip what was the greatest distance travelled
between any one fishing location and the next?
Metres ______
or km ______
33. For the move we just asked you about, where you travelled furthest between
fishing locations, you did this because …?
(READ OUT)
You weren’t catching any fish.
You obtained your catch/bag limit for the fish
species you were targeting and decided to
target a different fish species somewhere else.
You decided to travel to one of your favourite
fishing locations, which happened to be a long
distance from where you had been fishing.
You were heading home and decided to stop to
fish at a location along the way.
The weather turned rough, so you headed to a
fishing spot in a more sheltered location/closer
to shore.
The weather became calm, so you decided to
try a fishing sport further offshore.
Other - specify
34. On your last boat fishing trip, you decided to head home because …?
(READ OUT)
You obtained your catch/bag limit
You weren’t catching any fish
You had been on the water all day/ getting
late
The weather turned bad
You had commitments at home
You weren’t catching your target fish
Other – specify
35. You would cancel a fishing boat trip if …?
(READ OUT)
[The third box should be ticked if the second box has been ticked and so on…]
Forecast of moderate wind strength
(11-16 knots or 20-29 km/h)
Forecast of fresh wind strength (17-21 knots
or 30-39 km/h)
Forecast of strong wind strengths (22-27
knots or 40-50 km/h – strong wind warning)
Forecast of near gale strength (28-33 knots
or 51-62 km/h – strong wind warning)
36. i) How many kilometres offshore would you travel if the weather was fine and
the water was flat calm?
km ______
37. ii) How many kilometres offshore would you travel if the forecasted wind
strength is moderate (11-16 knots or 20-29 km/h)?
km ______
38. iii) How many kilometres offshore would you travel if the forecasted wind
strength is strong (22-27 knots or 40-50 km/h – strong wind warning)?
km ______
39. Would you start a boat fishing trip earlier in the day if the weather forecast
predicted a fresh or strong early afternoon sea breeze?
Yes
No
Unsure
40. During your last boat fishing trip, you fished on a:
(READ OUT - SINGLE RESPONSE)
Public holiday
Normal weekday
Normal weekend

41. I am going to read out six (6) statements. Please let me know the extent
that you 1. Strongly Disagree, 2. Disagree, 3. are Neutral, 4. Agree
or 5. Strongly Agree with each statement:
Strongly Disagree
Disagree Neutral Agree Strongly
Agree Unsure NA
You have many fishing spots on your GPS, but of these, there are a few which you visit far more frequently than the others, because
those few spots provide exceptional fishing.
The areas you tend to start fishing on a particular fishing trip are often those where, on your previous
fishing trip, you had good success.
You often fish in areas which friends have recommended?
You use nautical charts, or other charts (such as those available from tackle shops with approximate
coordinates of fishing locations) as a guide to help you start
searching for new fishing spots.
You use information available from the
internet to locate new fishing locations
You often use depth contour and/or other inbuilt information in your GPS to locate new fishing spots.

We have come to the last question, and I am going to read out
five (5) statements relating to your fishing behaviours in the
last 12 months and whether these have changed in the last
year compared to previous years.
42. Using the same scale as the previous questions, where 1. is Strongly
Disagree, 2. is Disagree, 3. are Neutral, 4. Agree or 5. Strongly Agree
please let me know the extent that you agree with each statement.
(Perth Metropoiltan boundaries include areas between Cape Bouvard –
Wedge Island (just north of Lancelin))
Strongly Disagree
Disagree Neutral Agree Strongly
Agree Unsure NA
Your fishing trips tend to be shorter
in duration.
You go out fishing more regularly.
You now catch a wider range of fish species.
You target a different fish species
You tend to fish in areas outside the Perth Metropolitan Region

..And just a couple of demographic questions to help us classify
responses.
1. Are you:
(DO NOT ASK – INTERVIEWER TO CODE GENDER)
Male
Female
2. How old are you?
(Age in years)
3. What is your current postcode?
Post Code
That is the end of the interview.
Thank you for your time. Just to remind you my name is __________, I am from the Survey Research Centre at Edith Cowan
University.
If you would like more information abut this survey you can call the researcher (Calais Tink) 08 9360 2256 or look up the website www.cffrfisheriesmodelling.net/.
If you have any questions about this research you can telephone
our office on 08 6304 2100.


Appendix B Edith Cowan University (ECU) Survey Research Centre certificate
of accreditation.


CERTIFIED
MARKET RESEARCH -AS ISO 20252-
Edith Cowan University ECU Survey Research Centre,
Joondalup Campus, 270 Joondalup Drive
Joondalup WA 6027
Operates a 111anagernent systern that complies with the requirements of:
AS ISO 20252:2007
Provision of market and social research utilising:
Telephone interviewing for quantitative data collection Telephone recruitment for quantitative and qualitative research
Central location interviewing for quantitative data collection
Date of Issue: Expiry Date: Certificate Number: Certification Number: Certification Date:
19 February 2009 31 January 2012 14219-01 14219 16 January 2009
This Certificate remains the property of NCS International Pty-Limited ACN ina 659 211 A wholly owned subsidiary of The National Association of Testing Authorities, Australia ACN 004 379748
AccreditatiOn bY the Joi11_t Accreditation ·system of Australia and New Zealand (i,w..rw.jas-anz.com.au\reglster~


Appendix C Formal approval documentation from the Human Research Ethics
Committee, Murdoch University, W.A. (Project Number 2009/114).


Research Ethics Office
Division of Research and Development
Chancellery Building
South Street
MURDOCH WA 6150
Telephone: 9360 6677
Facsimile: 9360 6686
www.research.murdoch.edu.au/ethics
HREC Approval Letter 221107
Monday, 18 May 2009
Dr Alex Hesp
65A The Promenade,
Mt Pleasant,
WA 6153
Dear Alex,
Project No. 2009/114
Project Title Development of an agent-based model to communicate implications of
recruitment variability of finfish to recreational fishers
Your application in support of the above project, received on 23 April 2009, was reviewed by the Murdoch
University Human Research Ethics Sub-Committee and was
APPROVED – subject to the following CONDITIONS:
a) Provide a list of indicative questions for the focus group
b) Please provide separate Information and Consent letters.
c) Information Letter should include contact details for the Ethics Office. See
www.research.murdoch.edu.au/ethics/hrec/advice.html for the standard wording.
You are not authorised to commence data collection until all conditions listed have been addressed to the
satisfaction of the Human Research Ethics Committee. Your response to the conditions should be
forwarded in writing to the Research Ethics Office. Once the Committee is satisfied that the conditions
have been met, you will be issued with a formal approval.
Please quote your ethics project number in all correspondence.
Kind Regards,
Dr. Erich von Dietze
Manager of Research Ethics
cc: Prof Norm Hall; Miss Calais Tink; Miss Rowena Burch


Research Ethics Office Division of Research and Development
Chancellery Building
South Street
MURDOCH WA 6150
Telephone: 9360 6677
Facsimile: 9360 6686
www.research.murdoch.edu.au/ethics
HREC Amendment Apprv 100111
Thursday, 07 July 2011 Dr Alex Hesp 65A The Promenade Mt Pleasant WA 6153 Dear Alex,
Project No. 2009/114 Project Title Development of an agent‐based model to communicate implications of recruitment
variability of finfish to recreational fishers AMENDMENT: Run the survey as a one‐off telephone interview, as advised. Your application for an amendment to the above project, received on 4/07/2011 was reviewed by the Murdoch University Research Ethics Office and was;
APPROVED
Approval is granted on the understanding that research will be conducted according the standards of the National Statement on Ethical Conduct in Human Research (2007), the Australian Code for the Responsible Conduct of Research (2007) and Murdoch University policies at all times. You must also abide by the Human Research Ethics Committee’s standard conditions of approval (see attached). All reporting forms are available on the Research Ethics web‐site. I wish you every success for your research.
Please quote your ethics permit number in all correspondence. Kind Regards, Dr. Erich von Dietze Manager of Research Ethics cc: Prof Norm Hall; Calais Tink and Rowena Burch

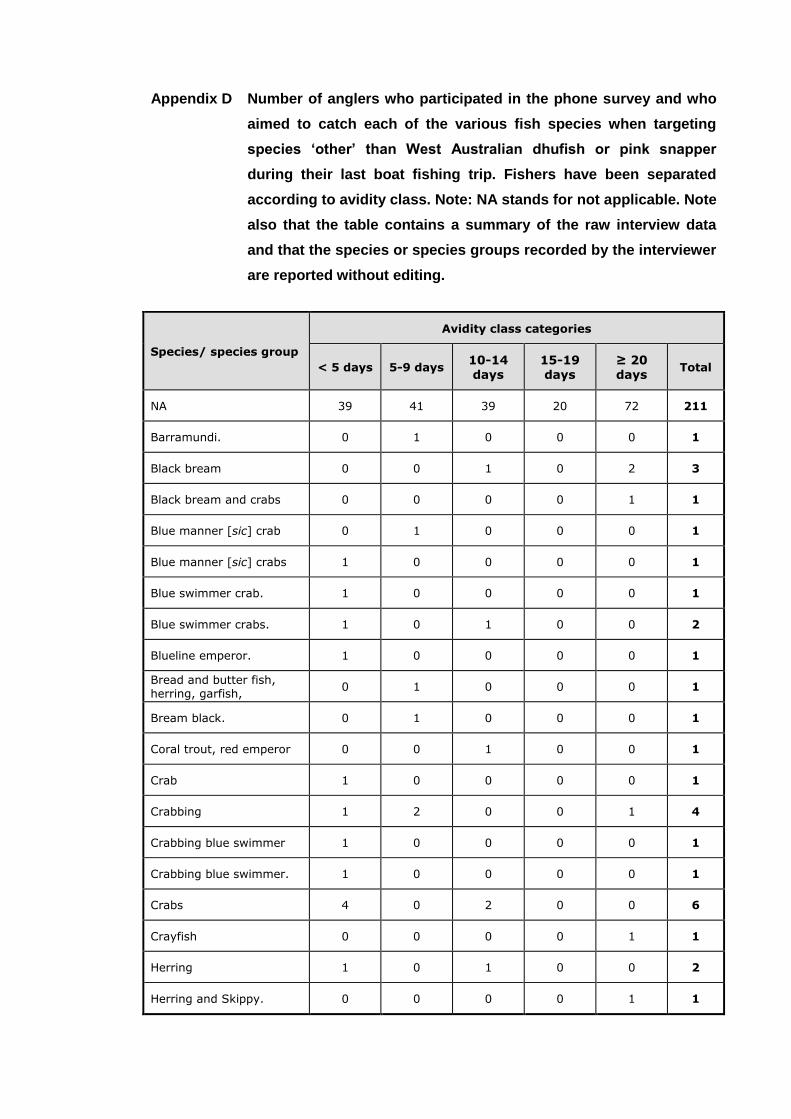
Appendix D Number of anglers who participated in the phone survey and who
aimed to catch each of the various fish species when targeting
species ‘other’ than West Australian dhufish or pink snapper
during their last boat fishing trip. Fishers have been separated
according to avidity class. Note: NA stands for not applicable. Note
also that the table contains a summary of the raw interview data
and that the species or species groups recorded by the interviewer
are reported without editing.
Species/ species group
Avidity class categories
< 5 days 5-9 days 10-14 days
15-19 days
≥ 20 days
Total
NA 39 41 39 20 72 211
Barramundi. 0 1 0 0 0 1
Black bream 0 0 1 0 2 3
Black bream and crabs 0 0 0 0 1 1
Blue manner [sic] crab 0 1 0 0 0 1
Blue manner [sic] crabs 1 0 0 0 0 1
Blue swimmer crab. 1 0 0 0 0 1
Blue swimmer crabs. 1 0 1 0 0 2
Blueline emperor. 1 0 0 0 0 1
Bread and butter fish, herring, garfish,
0 1 0 0 0 1
Bream black. 0 1 0 0 0 1
Coral trout, red emperor 0 0 1 0 0 1
Crab 1 0 0 0 0 1
Crabbing 1 2 0 0 1 4
Crabbing blue swimmer 1 0 0 0 0 1
Crabbing blue swimmer. 1 0 0 0 0 1
Crabs 4 0 2 0 0 6
Crayfish 0 0 0 0 1 1
Herring 1 0 1 0 0 2
Herring and Skippy. 0 0 0 0 1 1
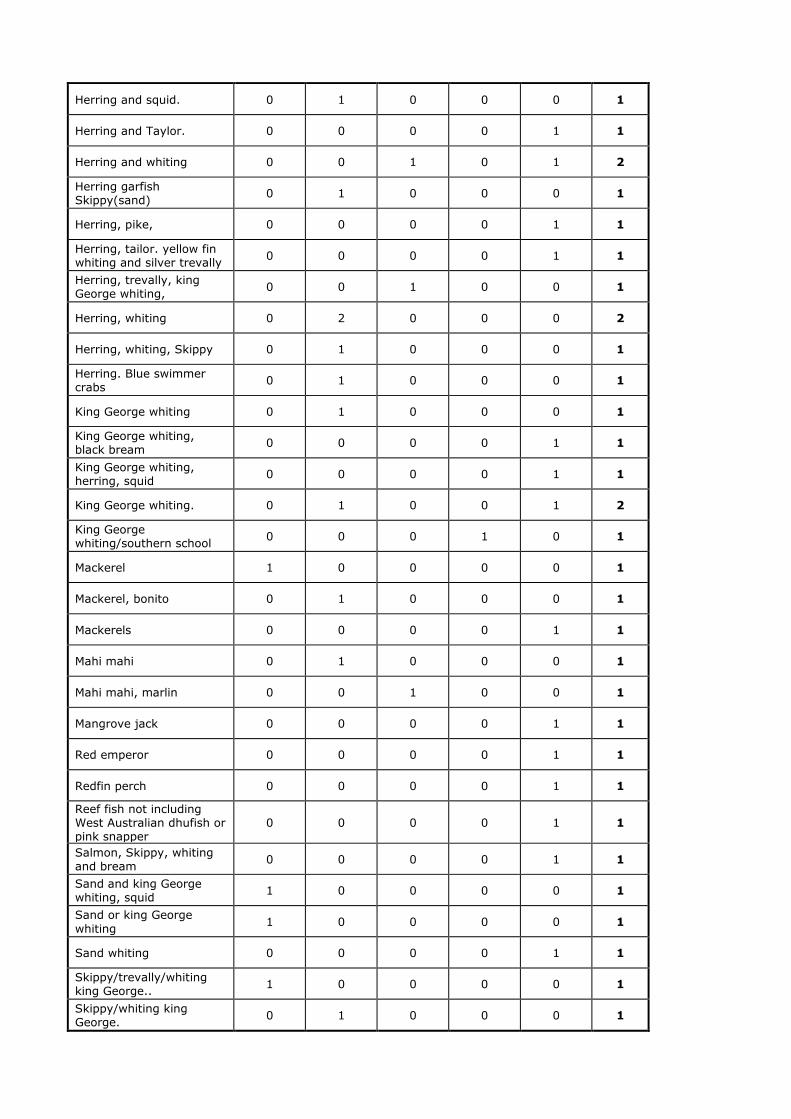
Herring and squid. 0 1 0 0 0 1
Herring and Taylor. 0 0 0 0 1 1
Herring and whiting 0 0 1 0 1 2
Herring garfish Skippy(sand)
0 1 0 0 0 1
Herring, pike, 0 0 0 0 1 1
Herring, tailor. yellow fin whiting and silver trevally
0 0 0 0 1 1
Herring, trevally, king George whiting,
0 0 1 0 0 1
Herring, whiting 0 2 0 0 0 2
Herring, whiting, Skippy 0 1 0 0 0 1
Herring. Blue swimmer crabs
0 1 0 0 0 1
King George whiting 0 1 0 0 0 1
King George whiting, black bream
0 0 0 0 1 1
King George whiting, herring, squid
0 0 0 0 1 1
King George whiting. 0 1 0 0 1 2
King George whiting/southern school
0 0 0 1 0 1
Mackerel 1 0 0 0 0 1
Mackerel, bonito 0 1 0 0 0 1
Mackerels 0 0 0 0 1 1
Mahi mahi 0 1 0 0 0 1
Mahi mahi, marlin 0 0 1 0 0 1
Mangrove jack 0 0 0 0 1 1
Red emperor 0 0 0 0 1 1
Redfin perch 0 0 0 0 1 1
Reef fish not including West Australian dhufish or pink snapper
0 0 0 0 1 1
Salmon, Skippy, whiting and bream
0 0 0 0 1 1
Sand and king George whiting, squid
1 0 0 0 0 1
Sand or king George
whiting 1 0 0 0 0 1
Sand whiting 0 0 0 0 1 1
Skippy/trevally/whiting king George..
1 0 0 0 0 1
Skippy/whiting king George.
0 1 0 0 0 1
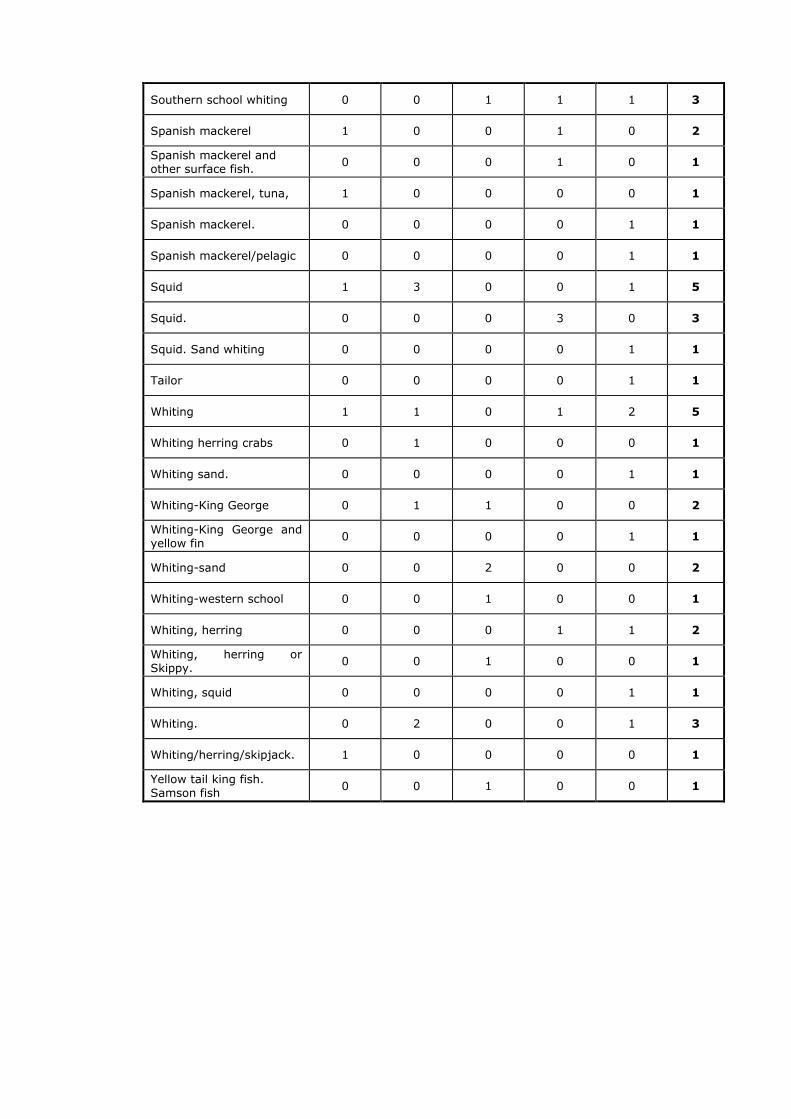
Southern school whiting 0 0 1 1 1 3
Spanish mackerel 1 0 0 1 0 2
Spanish mackerel and other surface fish.
0 0 0 1 0 1
Spanish mackerel, tuna, 1 0 0 0 0 1
Spanish mackerel. 0 0 0 0 1 1
Spanish mackerel/pelagic 0 0 0 0 1 1
Squid 1 3 0 0 1 5
Squid. 0 0 0 3 0 3
Squid. Sand whiting 0 0 0 0 1 1
Tailor 0 0 0 0 1 1
Whiting 1 1 0 1 2 5
Whiting herring crabs 0 1 0 0 0 1
Whiting sand. 0 0 0 0 1 1
Whiting-King George 0 1 1 0 0 2
Whiting-King George and yellow fin
0 0 0 0 1 1
Whiting-sand 0 0 2 0 0 2
Whiting-western school 0 0 1 0 0 1
Whiting, herring 0 0 0 1 1 2
Whiting, herring or Skippy.
0 0 1 0 0 1
Whiting, squid 0 0 0 0 1 1
Whiting. 0 2 0 0 1 3
Whiting/herring/skipjack. 1 0 0 0 0 1
Yellow tail king fish. Samson fish
0 0 1 0 0 1

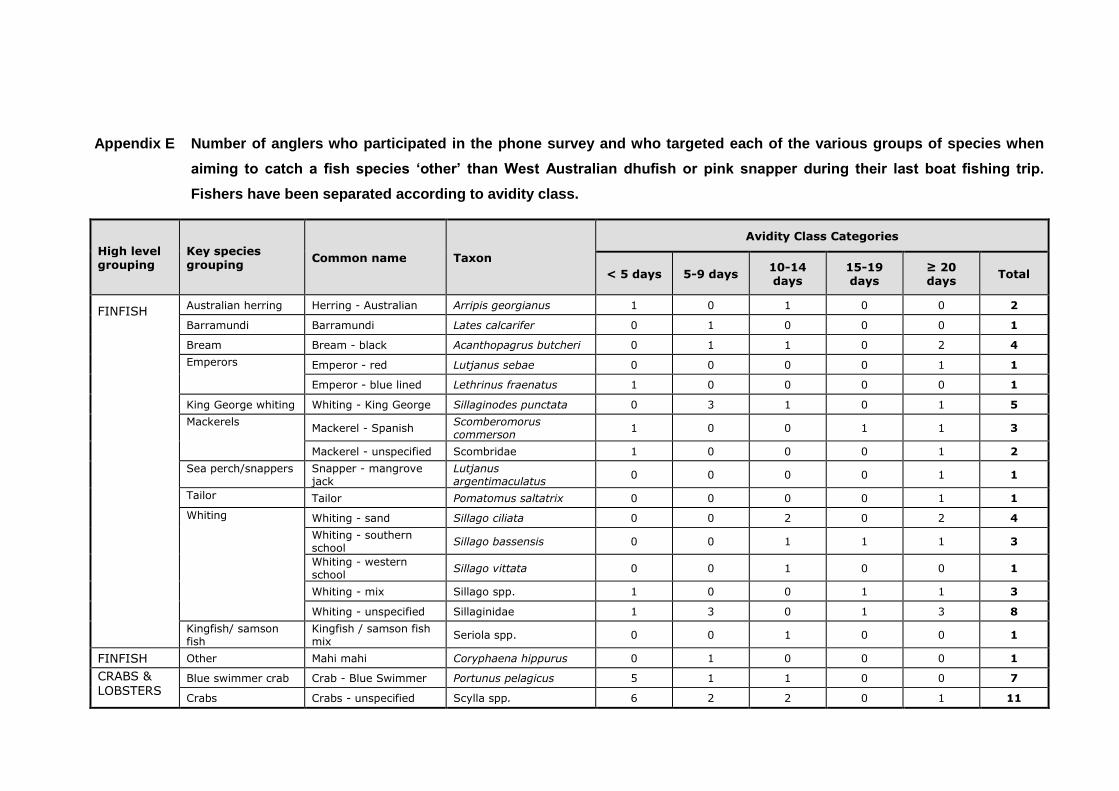
Appendix E Number of anglers who participated in the phone survey and who targeted each of the various groups of species when
aiming to catch a fish species ‘other’ than West Australian dhufish or pink snapper during their last boat fishing trip.
Fishers have been separated according to avidity class.
High level grouping
Key species grouping
Common name Taxon
Avidity Class Categories
< 5 days 5-9 days 10-14 days
15-19 days
≥ 20 days
Total
FINFISH Australian herring Herring - Australian Arripis georgianus 1 0 1 0 0 2
Barramundi Barramundi Lates calcarifer 0 1 0 0 0 1
Bream Bream - black Acanthopagrus butcheri 0 1 1 0 2 4
Emperors Emperor - red Lutjanus sebae 0 0 0 0 1 1
Emperor - blue lined Lethrinus fraenatus 1 0 0 0 0 1
King George whiting Whiting - King George Sillaginodes punctata 0 3 1 0 1 5
Mackerels Mackerel - Spanish
Scomberomorus commerson
1 0 0 1 1 3
Mackerel - unspecified Scombridae 1 0 0 0 1 2
Sea perch/snappers Snapper - mangrove jack
Lutjanus argentimaculatus
0 0 0 0 1 1
Tailor Tailor Pomatomus saltatrix 0 0 0 0 1 1
Whiting
Whiting - sand Sillago ciliata 0 0 2 0 2 4
Whiting - southern school
Sillago bassensis 0 0 1 1 1 3
Whiting - western school
Sillago vittata 0 0 1 0 0 1
Whiting - mix Sillago spp. 1 0 0 1 1 3
Whiting - unspecified Sillaginidae 1 3 0 1 3 8
Kingfish/ samson fish
Kingfish / samson fish mix
Seriola spp. 0 0 1 0 0 1
FINFISH Other Mahi mahi Coryphaena hippurus 0 1 0 0 0 1
CRABS & LOBSTERS
Blue swimmer crab Crab - Blue Swimmer Portunus pelagicus 5 1 1 0 0 7
Crabs Crabs - unspecified Scylla spp. 6 2 2 0 1 11
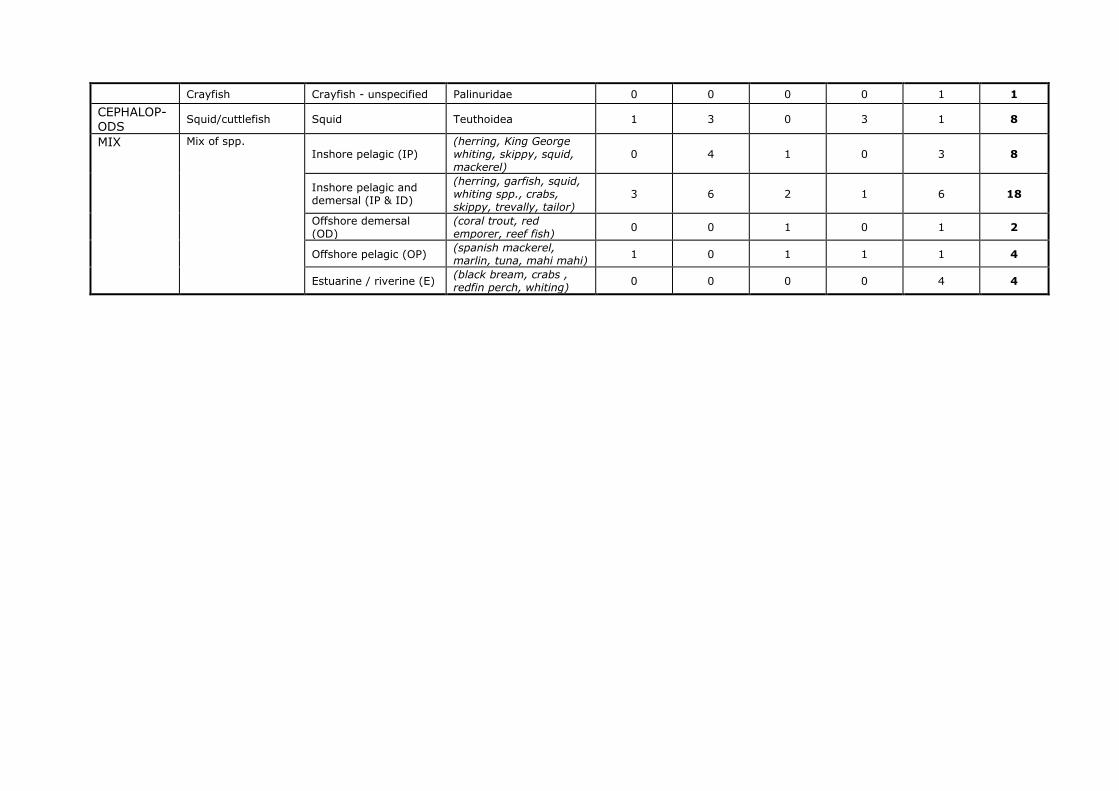
Crayfish Crayfish - unspecified Palinuridae 0 0 0 0 1 1
CEPHALOP-ODS
Squid/cuttlefish Squid Teuthoidea 1 3 0 3 1 8
MIX Mix of spp. Inshore pelagic (IP)
(herring, King George whiting, skippy, squid, mackerel)
0 4 1 0 3 8
Inshore pelagic and demersal (IP & ID)
(herring, garfish, squid, whiting spp., crabs, skippy, trevally, tailor)
3 6 2 1 6 18
Offshore demersal (OD)
(coral trout, red emporer, reef fish)
0 0 1 0 1 2
Offshore pelagic (OP) (spanish mackerel, marlin, tuna, mahi mahi)
1 0 1 1 1 4
Estuarine / riverine (E) (black bream, crabs , redfin perch, whiting)
0 0 0 0 4 4
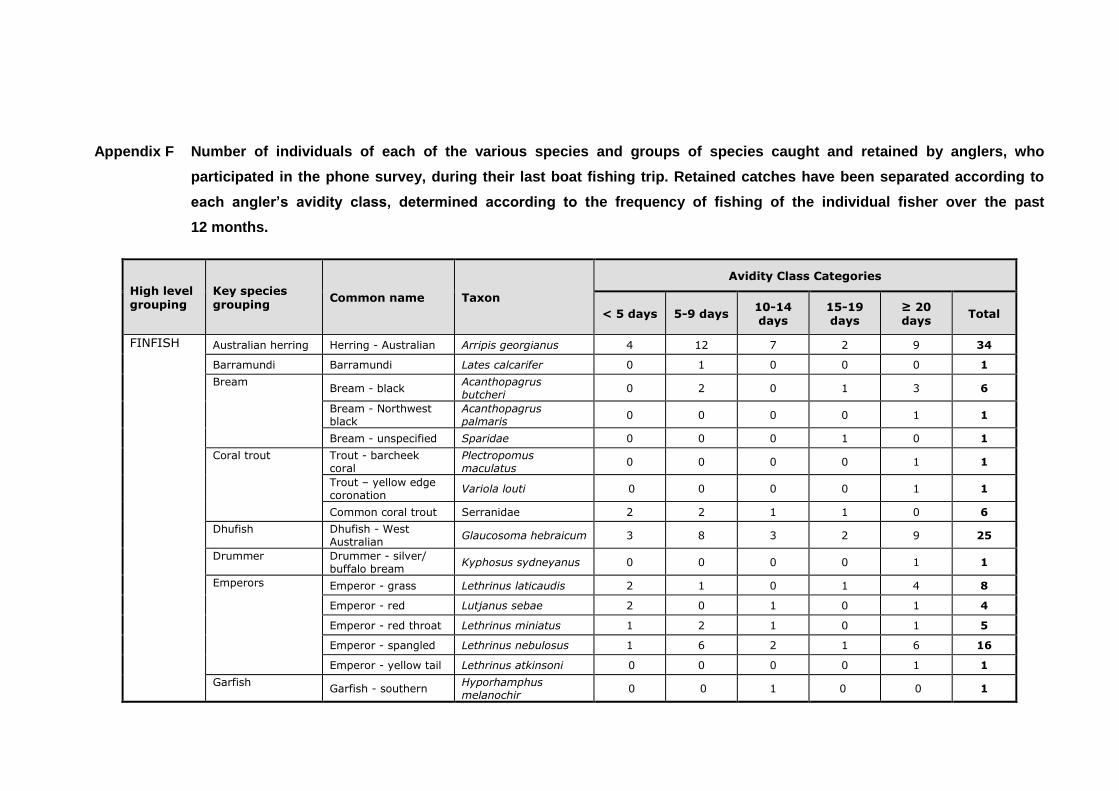
Appendix F Number of individuals of each of the various species and groups of species caught and retained by anglers, who
participated in the phone survey, during their last boat fishing trip. Retained catches have been separated according to
each angler’s avidity class, determined according to the frequency of fishing of the individual fisher over the past
12 months.
High level grouping
Key species grouping
Common name Taxon
Avidity Class Categories
< 5 days 5-9 days 10-14 days
15-19 days
≥ 20 days
Total
FINFISH Australian herring Herring - Australian Arripis georgianus 4 12 7 2 9 34
Barramundi Barramundi Lates calcarifer 0 1 0 0 0 1
Bream
Bream - black Acanthopagrus butcheri
0 2 0 1 3 6
Bream - Northwest black
Acanthopagrus palmaris
0 0 0 0 1 1
Bream - unspecified Sparidae 0 0 0 1 0 1
Coral trout
Trout - barcheek coral
Plectropomus maculatus
0 0 0 0 1 1
Trout – yellow edge coronation
Variola louti 0 0 0 0 1 1
Common coral trout Serranidae 2 2 1 1 0 6
Dhufish Dhufish - West Australian
Glaucosoma hebraicum 3 8 3 2 9 25
Drummer Drummer - silver/ buffalo bream
Kyphosus sydneyanus 0 0 0 0 1 1
Emperors
Emperor - grass Lethrinus laticaudis 2 1 0 1 4 8
Emperor - red Lutjanus sebae 2 0 1 0 1 4
Emperor - red throat Lethrinus miniatus 1 2 1 0 1 5
Emperor - spangled Lethrinus nebulosus 1 6 2 1 6 16
Emperor - yellow tail Lethrinus atkinsoni 0 0 0 0 1 1
Garfish
Garfish - southern Hyporhamphus melanochir
0 0 1 0 0 1
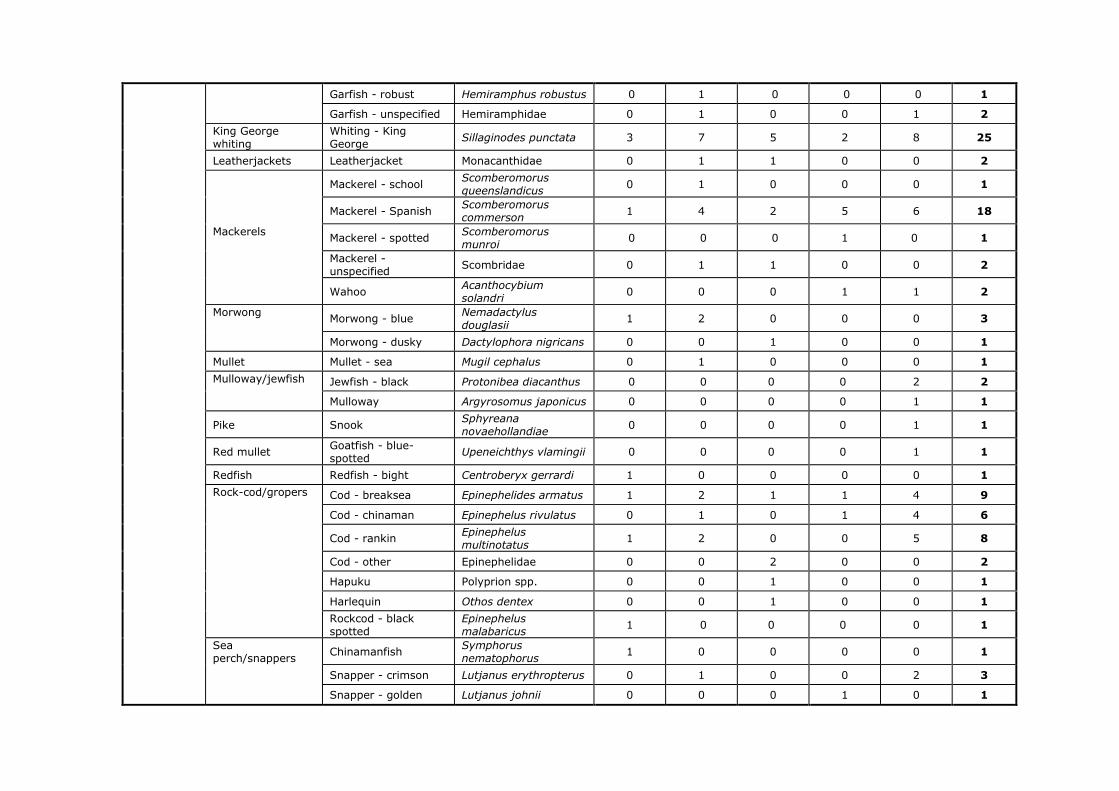
Garfish - robust Hemiramphus robustus 0 1 0 0 0 1
Garfish - unspecified Hemiramphidae 0 1 0 0 1 2
King George whiting
Whiting - King George
Sillaginodes punctata 3 7 5 2 8 25
Leatherjackets Leatherjacket Monacanthidae 0 1 1 0 0 2
Mackerels
Mackerel - school Scomberomorus queenslandicus
0 1 0 0 0 1
Mackerel - Spanish Scomberomorus commerson
1 4 2 5 6 18
Mackerel - spotted Scomberomorus munroi
0 0 0 1 0 1
Mackerel - unspecified
Scombridae 0 1 1 0 0 2
Wahoo Acanthocybium solandri
0 0 0 1 1 2
Morwong
Morwong - blue Nemadactylus douglasii
1 2 0 0 0 3
Morwong - dusky Dactylophora nigricans 0 0 1 0 0 1
Mullet Mullet - sea Mugil cephalus 0 1 0 0 0 1
Mulloway/jewfish
Jewfish - black Protonibea diacanthus 0 0 0 0 2 2
Mulloway Argyrosomus japonicus 0 0 0 0 1 1
Pike Snook Sphyreana novaehollandiae
0 0 0 0 1 1
Red mullet Goatfish - blue-spotted
Upeneichthys vlamingii 0 0 0 0 1 1
Redfish Redfish - bight Centroberyx gerrardi 1 0 0 0 0 1
Rock-cod/gropers
Cod - breaksea Epinephelides armatus 1 2 1 1 4 9
Cod - chinaman Epinephelus rivulatus 0 1 0 1 4 6
Cod - rankin Epinephelus multinotatus
1 2 0 0 5 8
Cod - other Epinephelidae 0 0 2 0 0 2
Hapuku Polyprion spp. 0 0 1 0 0 1
Harlequin Othos dentex 0 0 1 0 0 1
Rockcod - black spotted
Epinephelus malabaricus
1 0 0 0 0 1
Sea perch/snappers
Chinamanfish Symphorus nematophorus
1 0 0 0 0 1
Snapper - crimson Lutjanus erythropterus 0 1 0 0 2 3
Snapper - golden Lutjanus johnii 0 0 0 1 0 1
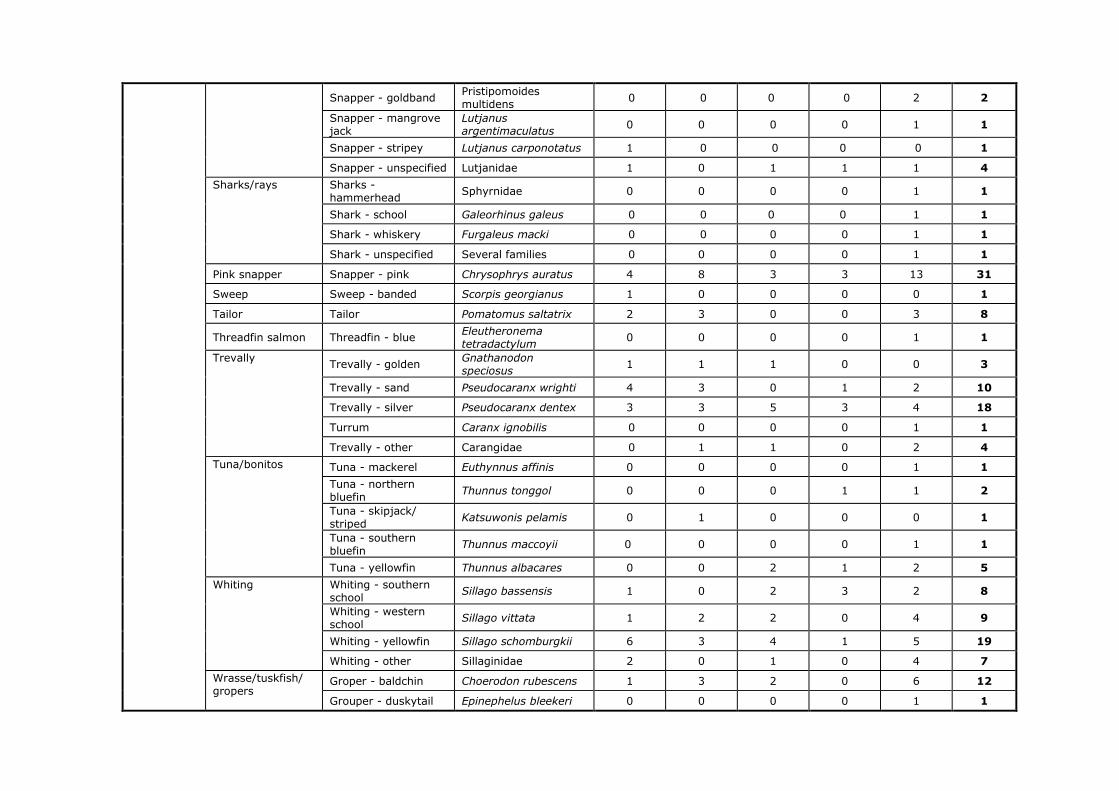
Snapper - goldband Pristipomoides multidens
0 0 0 0 2 2
Snapper - mangrove jack
Lutjanus argentimaculatus
0 0 0 0 1 1
Snapper - stripey Lutjanus carponotatus 1 0 0 0 0 1
Snapper - unspecified Lutjanidae 1 0 1 1 1 4
Sharks/rays
Sharks - hammerhead
Sphyrnidae 0 0 0 0 1 1
Shark - school Galeorhinus galeus 0 0 0 0 1 1
Shark - whiskery Furgaleus macki 0 0 0 0 1 1
Shark - unspecified Several families 0 0 0 0 1 1
Pink snapper Snapper - pink Chrysophrys auratus 4 8 3 3 13 31
Sweep Sweep - banded Scorpis georgianus 1 0 0 0 0 1
Tailor Tailor Pomatomus saltatrix 2 3 0 0 3 8
Threadfin salmon Threadfin - blue Eleutheronema tetradactylum
0 0 0 0 1 1
Trevally
Trevally - golden Gnathanodon speciosus
1 1 1 0 0 3
Trevally - sand Pseudocaranx wrighti 4 3 0 1 2 10
Trevally - silver Pseudocaranx dentex 3 3 5 3 4 18
Turrum Caranx ignobilis 0 0 0 0 1 1
Trevally - other Carangidae 0 1 1 0 2 4
Tuna/bonitos
Tuna - mackerel Euthynnus affinis 0 0 0 0 1 1
Tuna - northern bluefin
Thunnus tonggol 0 0 0 1 1 2
Tuna - skipjack/ striped
Katsuwonis pelamis 0 1 0 0 0 1
Tuna - southern bluefin
Thunnus maccoyii 0 0 0 0 1 1
Tuna - yellowfin Thunnus albacares 0 0 2 1 2 5
Whiting Whiting - southern school
Sillago bassensis 1 0 2 3 2 8
Whiting - western school
Sillago vittata 1 2 2 0 4 9
Whiting - yellowfin Sillago schomburgkii 6 3 4 1 5 19
Whiting - other Sillaginidae 2 0 1 0 4 7
Wrasse/tuskfish/ gropers
Groper - baldchin Choerodon rubescens 1 3 2 0 6 12
Grouper - duskytail Epinephelus bleekeri 0 0 0 0 1 1
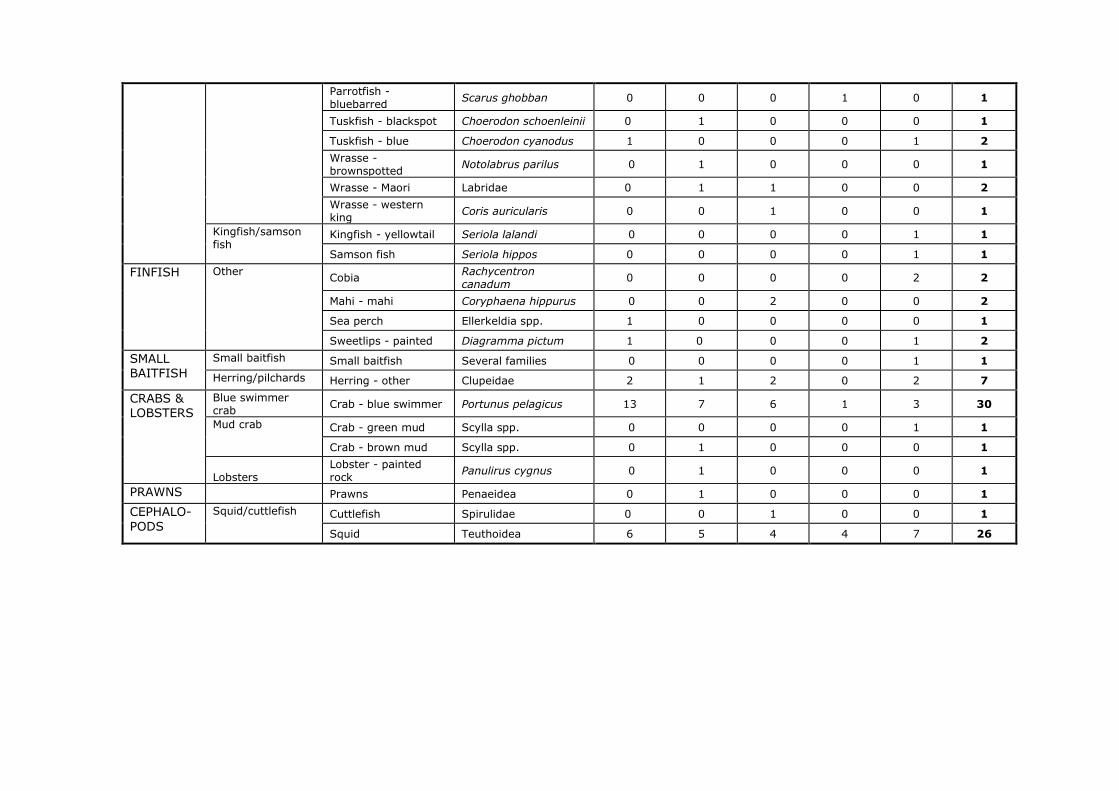
Parrotfish - bluebarred
Scarus ghobban 0 0 0 1 0 1
Tuskfish - blackspot Choerodon schoenleinii 0 1 0 0 0 1
Tuskfish - blue Choerodon cyanodus 1 0 0 0 1 2
Wrasse - brownspotted
Notolabrus parilus 0 1 0 0 0 1
Wrasse - Maori Labridae 0 1 1 0 0 2
Wrasse - western king
Coris auricularis 0 0 1 0 0 1
Kingfish/samson fish
Kingfish - yellowtail Seriola lalandi 0 0 0 0 1 1
Samson fish Seriola hippos 0 0 0 0 1 1
FINFISH Other
Cobia Rachycentron canadum
0 0 0 0 2 2
Mahi - mahi Coryphaena hippurus 0 0 2 0 0 2
Sea perch Ellerkeldia spp. 1 0 0 0 0 1
Sweetlips - painted Diagramma pictum 1 0 0 0 1 2
SMALL BAITFISH
Small baitfish Small baitfish Several families 0 0 0 0 1 1
Herring/pilchards Herring - other Clupeidae 2 1 2 0 2 7
CRABS & LOBSTERS
Blue swimmer crab
Crab - blue swimmer Portunus pelagicus 13 7 6 1 3 30
Mud crab Crab - green mud Scylla spp. 0 0 0 0 1 1
Crab - brown mud Scylla spp. 0 1 0 0 0 1
Lobsters Lobster - painted rock
Panulirus cygnus 0 1 0 0 0 1
PRAWNS Prawns Penaeidea 0 1 0 0 0 1
CEPHALO-
PODS
Squid/cuttlefish
Cuttlefish Spirulidae 0 0 1 0 0 1
Squid Teuthoidea 6 5 4 4 7 26
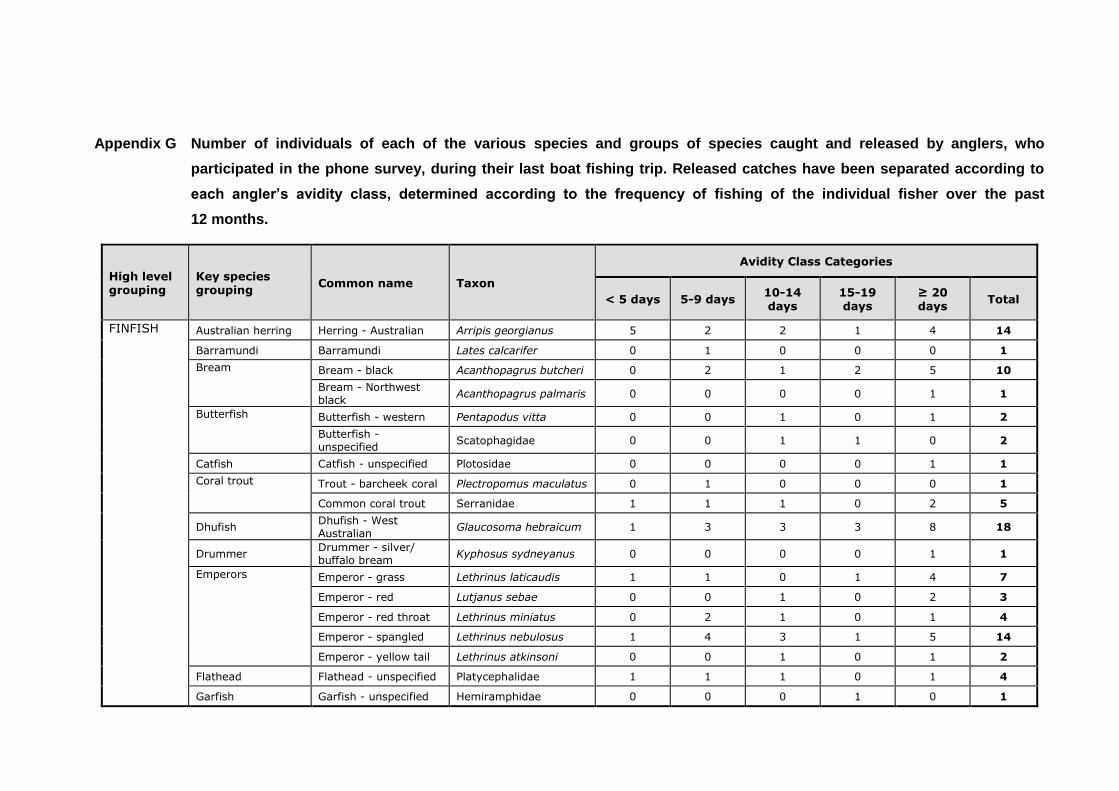
Appendix G Number of individuals of each of the various species and groups of species caught and released by anglers, who
participated in the phone survey, during their last boat fishing trip. Released catches have been separated according to
each angler’s avidity class, determined according to the frequency of fishing of the individual fisher over the past
12 months.
High level grouping
Key species grouping
Common name Taxon
Avidity Class Categories
< 5 days 5-9 days 10-14 days
15-19 days
≥ 20 days
Total
FINFISH Australian herring Herring - Australian Arripis georgianus 5 2 2 1 4 14
Barramundi Barramundi Lates calcarifer 0 1 0 0 0 1
Bream
Bream - black Acanthopagrus butcheri 0 2 1 2 5 10
Bream - Northwest black
Acanthopagrus palmaris 0 0 0 0 1 1
Butterfish
Butterfish - western Pentapodus vitta 0 0 1 0 1 2
Butterfish - unspecified
Scatophagidae 0 0 1 1 0 2
Catfish Catfish - unspecified Plotosidae 0 0 0 0 1 1
Coral trout
Trout - barcheek coral Plectropomus maculatus 0 1 0 0 0 1
Common coral trout Serranidae 1 1 1 0 2 5
Dhufish Dhufish - West Australian
Glaucosoma hebraicum 1 3 3 3 8 18
Drummer Drummer - silver/ buffalo bream
Kyphosus sydneyanus 0 0 0 0 1 1
Emperors
Emperor - grass Lethrinus laticaudis 1 1 0 1 4 7
Emperor - red Lutjanus sebae 0 0 1 0 2 3
Emperor - red throat Lethrinus miniatus 0 2 1 0 1 4
Emperor - spangled Lethrinus nebulosus 1 4 3 1 5 14
Emperor - yellow tail Lethrinus atkinsoni 0 0 1 0 1 2
Flathead Flathead - unspecified Platycephalidae 1 1 1 0 1 4
Garfish Garfish - unspecified Hemiramphidae 0 0 0 1 0 1
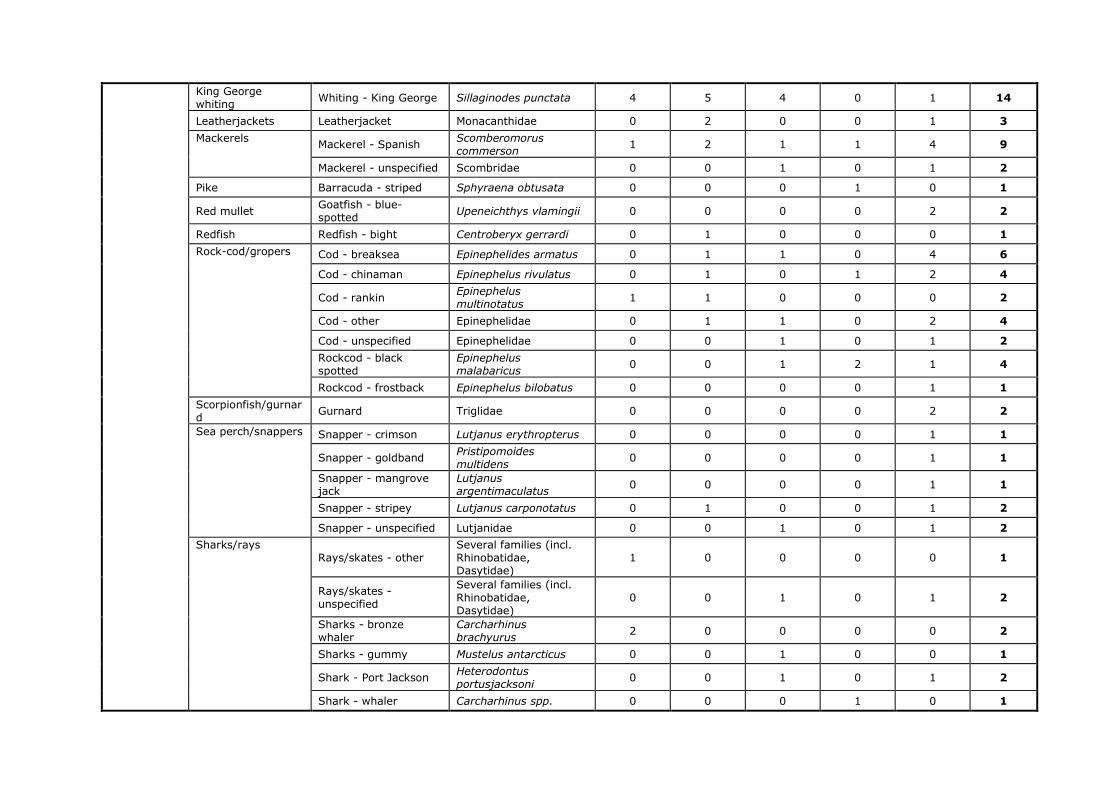
King George whiting
Whiting - King George Sillaginodes punctata 4 5 4 0 1 14
Leatherjackets Leatherjacket Monacanthidae 0 2 0 0 1 3
Mackerels Mackerel - Spanish
Scomberomorus commerson
1 2 1 1 4 9
Mackerel - unspecified Scombridae 0 0 1 0 1 2
Pike Barracuda - striped Sphyraena obtusata 0 0 0 1 0 1
Red mullet Goatfish - blue-spotted
Upeneichthys vlamingii 0 0 0 0 2 2
Redfish Redfish - bight Centroberyx gerrardi 0 1 0 0 0 1
Rock-cod/gropers
Cod - breaksea Epinephelides armatus 0 1 1 0 4 6
Cod - chinaman Epinephelus rivulatus 0 1 0 1 2 4
Cod - rankin Epinephelus multinotatus
1 1 0 0 0 2
Cod - other Epinephelidae 0 1 1 0 2 4
Cod - unspecified Epinephelidae 0 0 1 0 1 2
Rockcod - black spotted
Epinephelus malabaricus
0 0 1 2 1 4
Rockcod - frostback Epinephelus bilobatus 0 0 0 0 1 1
Scorpionfish/gurnard
Gurnard Triglidae 0 0 0 0 2 2
Sea perch/snappers
Snapper - crimson Lutjanus erythropterus 0 0 0 0 1 1
Snapper - goldband Pristipomoides multidens
0 0 0 0 1 1
Snapper - mangrove jack
Lutjanus argentimaculatus
0 0 0 0 1 1
Snapper - stripey Lutjanus carponotatus 0 1 0 0 1 2
Snapper - unspecified Lutjanidae 0 0 1 0 1 2
Sharks/rays Rays/skates - other
Several families (incl. Rhinobatidae, Dasytidae)
1 0 0 0 0 1
Rays/skates - unspecified
Several families (incl. Rhinobatidae, Dasytidae)
0 0 1 0 1 2
Sharks - bronze whaler
Carcharhinus brachyurus
2 0 0 0 0 2
Sharks - gummy Mustelus antarcticus 0 0 1 0 0 1
Shark - Port Jackson Heterodontus portusjacksoni
0 0 1 0 1 2
Shark - whaler Carcharhinus spp. 0 0 0 1 0 1
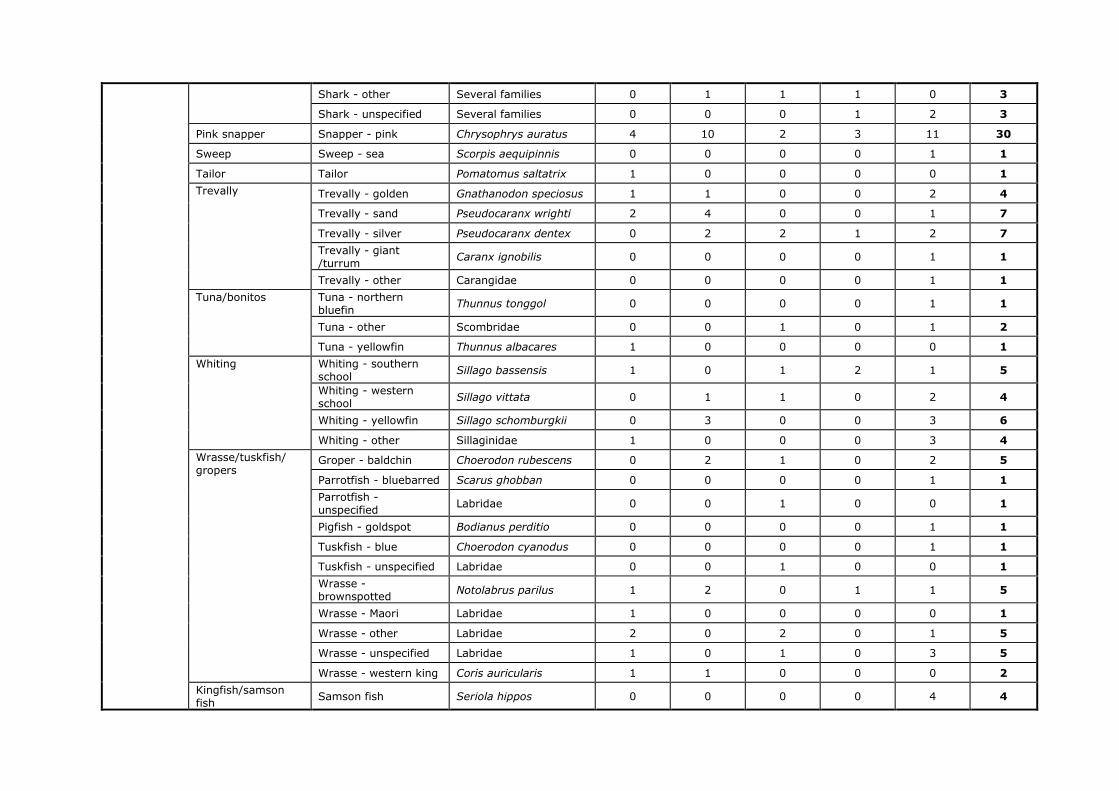
Shark - other Several families 0 1 1 1 0 3
Shark - unspecified Several families 0 0 0 1 2 3
Pink snapper Snapper - pink Chrysophrys auratus 4 10 2 3 11 30
Sweep Sweep - sea Scorpis aequipinnis 0 0 0 0 1 1
Tailor Tailor Pomatomus saltatrix 1 0 0 0 0 1
Trevally
Trevally - golden Gnathanodon speciosus 1 1 0 0 2 4
Trevally - sand Pseudocaranx wrighti 2 4 0 0 1 7
Trevally - silver Pseudocaranx dentex 0 2 2 1 2 7
Trevally - giant /turrum
Caranx ignobilis 0 0 0 0 1 1
Trevally - other Carangidae 0 0 0 0 1 1
Tuna/bonitos
Tuna - northern bluefin
Thunnus tonggol 0 0 0 0 1 1
Tuna - other Scombridae 0 0 1 0 1 2
Tuna - yellowfin Thunnus albacares 1 0 0 0 0 1
Whiting
Whiting - southern school
Sillago bassensis 1 0 1 2 1 5
Whiting - western school
Sillago vittata 0 1 1 0 2 4
Whiting - yellowfin Sillago schomburgkii 0 3 0 0 3 6
Whiting - other Sillaginidae 1 0 0 0 3 4
Wrasse/tuskfish/ gropers
Groper - baldchin Choerodon rubescens 0 2 1 0 2 5
Parrotfish - bluebarred Scarus ghobban 0 0 0 0 1 1
Parrotfish - unspecified
Labridae 0 0 1 0 0 1
Pigfish - goldspot Bodianus perditio 0 0 0 0 1 1
Tuskfish - blue Choerodon cyanodus 0 0 0 0 1 1
Tuskfish - unspecified Labridae 0 0 1 0 0 1
Wrasse - brownspotted
Notolabrus parilus 1 2 0 1 1 5
Wrasse - Maori Labridae 1 0 0 0 0 1
Wrasse - other Labridae 2 0 2 0 1 5
Wrasse - unspecified Labridae 1 0 1 0 3 5
Wrasse - western king Coris auricularis 1 1 0 0 0 2
Kingfish/samson fish
Samson fish Seriola hippos 0 0 0 0 4 4
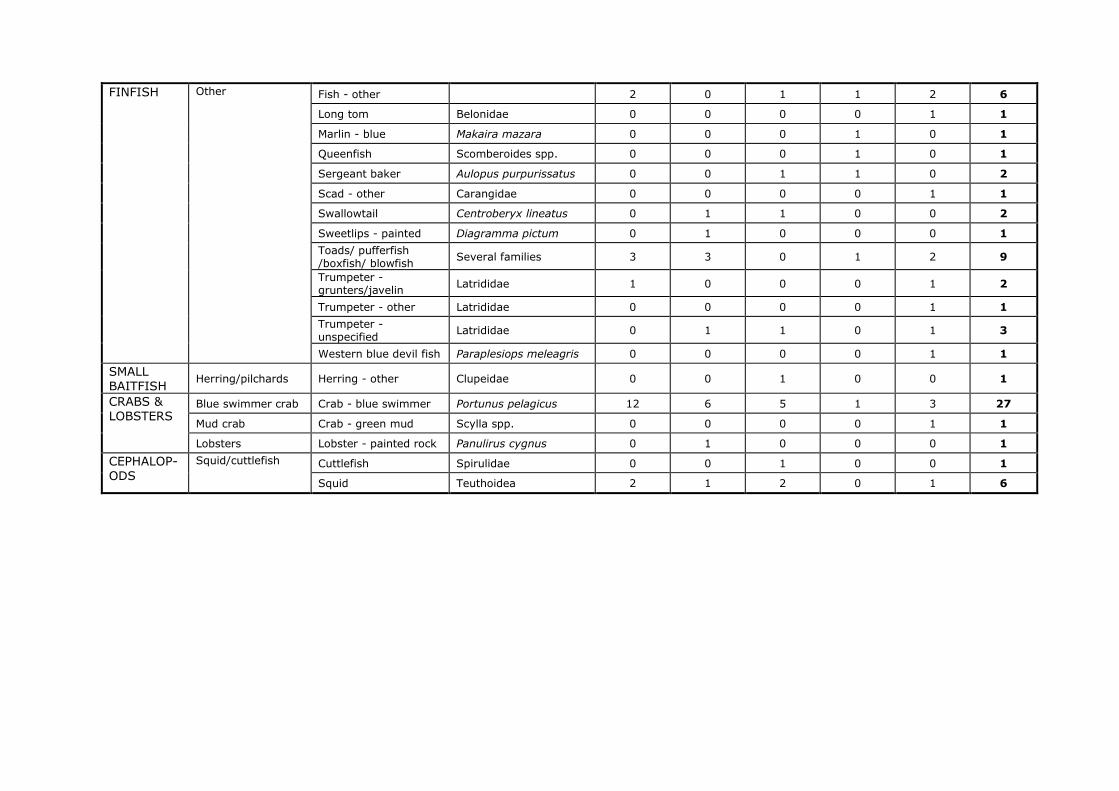
FINFISH Other
Fish - other 2 0 1 1 2 6
Long tom Belonidae 0 0 0 0 1 1
Marlin - blue Makaira mazara 0 0 0 1 0 1
Queenfish Scomberoides spp. 0 0 0 1 0 1
Sergeant baker Aulopus purpurissatus 0 0 1 1 0 2
Scad - other Carangidae 0 0 0 0 1 1
Swallowtail Centroberyx lineatus 0 1 1 0 0 2
Sweetlips - painted Diagramma pictum 0 1 0 0 0 1
Toads/ pufferfish /boxfish/ blowfish
Several families 3 3 0 1 2 9
Trumpeter - grunters/javelin
Latrididae 1 0 0 0 1 2
Trumpeter - other Latrididae 0 0 0 0 1 1
Trumpeter - unspecified
Latrididae 0 1 1 0 1 3
Western blue devil fish Paraplesiops meleagris 0 0 0 0 1 1
SMALL BAITFISH
Herring/pilchards Herring - other Clupeidae 0 0 1 0 0 1
CRABS & LOBSTERS
Blue swimmer crab Crab - blue swimmer Portunus pelagicus 12 6 5 1 3 27
Mud crab Crab - green mud Scylla spp. 0 0 0 0 1 1
Lobsters Lobster - painted rock Panulirus cygnus 0 1 0 0 0 1
CEPHALOP-ODS
Squid/cuttlefish
Cuttlefish Spirulidae 0 0 1 0 0 1
Squid Teuthoidea 2 1 2 0 1 6
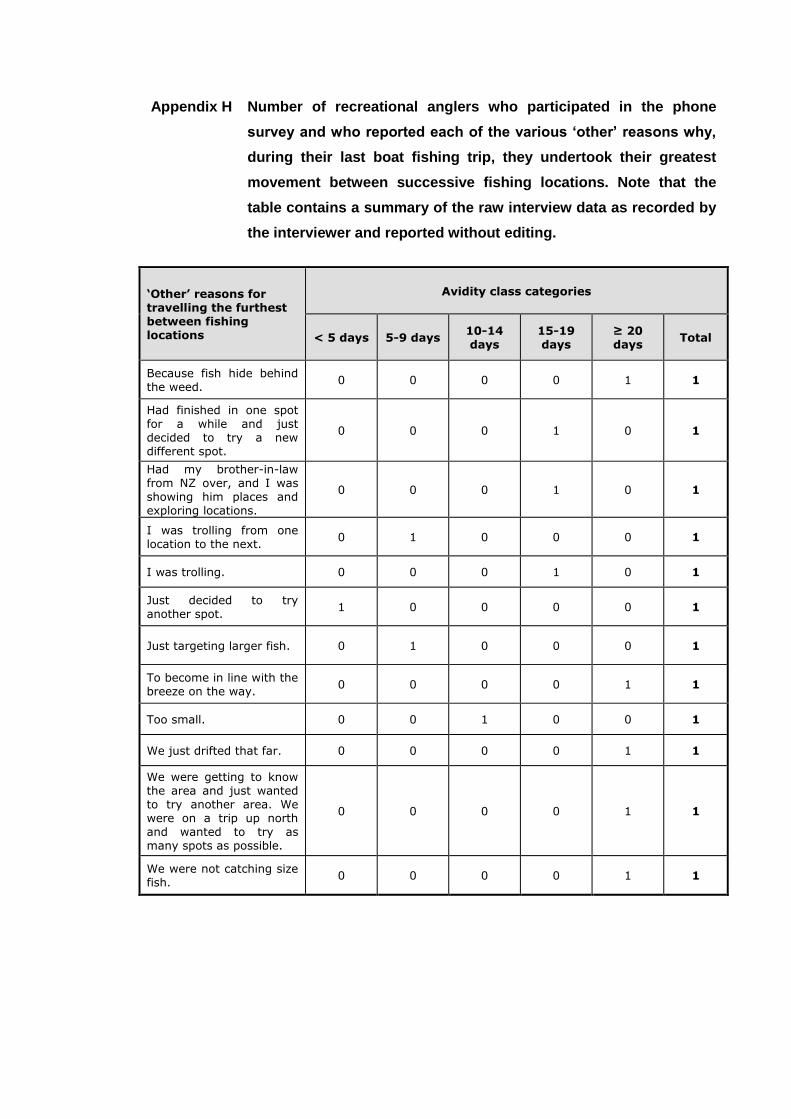
Appendix H Number of recreational anglers who participated in the phone
survey and who reported each of the various ‘other’ reasons why,
during their last boat fishing trip, they undertook their greatest
movement between successive fishing locations. Note that the
table contains a summary of the raw interview data as recorded by
the interviewer and reported without editing.
‘Other’ reasons for travelling the furthest between fishing locations
Avidity class categories
< 5 days 5-9 days 10-14 days
15-19 days
≥ 20 days
Total
Because fish hide behind the weed.
0 0 0 0 1 1
Had finished in one spot for a while and just decided to try a new different spot.
0 0 0 1 0 1
Had my brother-in-law from NZ over, and I was showing him places and exploring locations.
0 0 0 1 0 1
I was trolling from one location to the next.
0 1 0 0 0 1
I was trolling. 0 0 0 1 0 1
Just decided to try another spot.
1 0 0 0 0 1
Just targeting larger fish. 0 1 0 0 0 1
To become in line with the breeze on the way.
0 0 0 0 1 1
Too small. 0 0 1 0 0 1
We just drifted that far. 0 0 0 0 1 1
We were getting to know the area and just wanted to try another area. We were on a trip up north and wanted to try as many spots as possible.
0 0 0 0 1 1
We were not catching size fish.
0 0 0 0 1 1


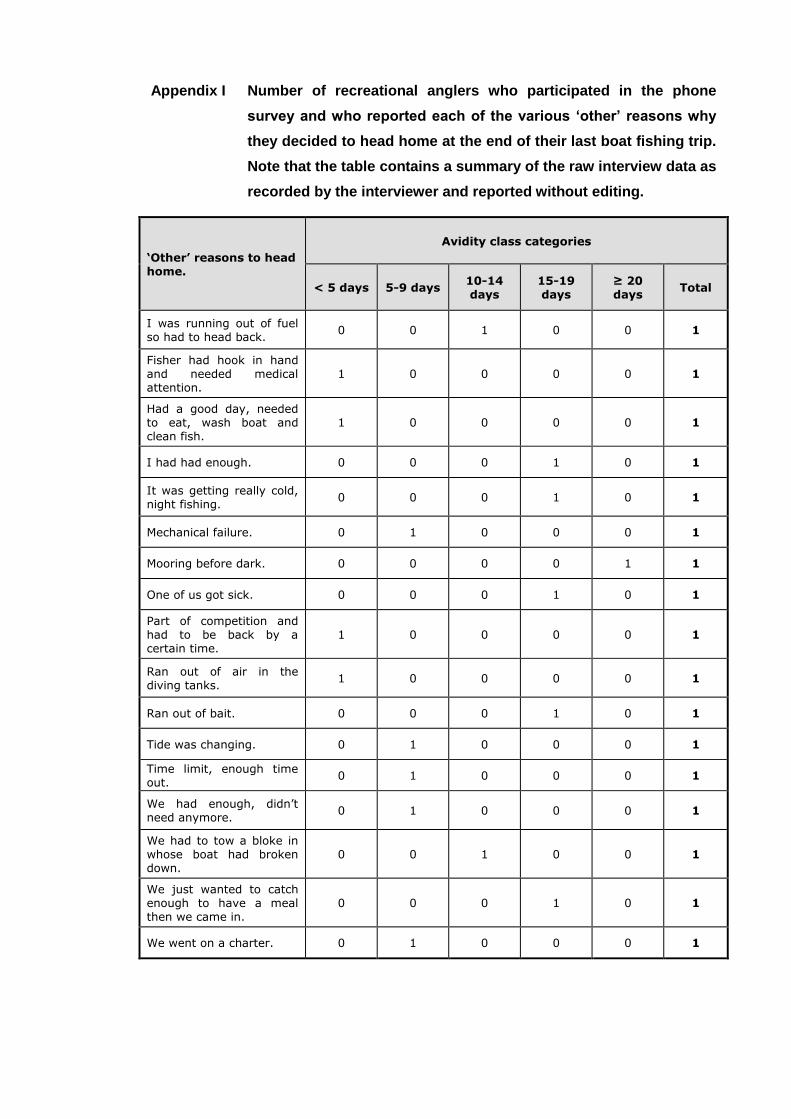
Appendix I Number of recreational anglers who participated in the phone
survey and who reported each of the various ‘other’ reasons why
they decided to head home at the end of their last boat fishing trip.
Note that the table contains a summary of the raw interview data as
recorded by the interviewer and reported without editing.
‘Other’ reasons to head home.
Avidity class categories
< 5 days 5-9 days 10-14 days
15-19 days
≥ 20 days
Total
I was running out of fuel so had to head back.
0 0 1 0 0 1
Fisher had hook in hand and needed medical attention.
1 0 0 0 0 1
Had a good day, needed to eat, wash boat and clean fish.
1 0 0 0 0 1
I had had enough. 0 0 0 1 0 1
It was getting really cold, night fishing.
0 0 0 1 0 1
Mechanical failure. 0 1 0 0 0 1
Mooring before dark. 0 0 0 0 1 1
One of us got sick. 0 0 0 1 0 1
Part of competition and had to be back by a certain time.
1 0 0 0 0 1
Ran out of air in the diving tanks.
1 0 0 0 0 1
Ran out of bait. 0 0 0 1 0 1
Tide was changing. 0 1 0 0 0 1
Time limit, enough time out.
0 1 0 0 0 1
We had enough, didn’t need anymore.
0 1 0 0 0 1
We had to tow a bloke in whose boat had broken down.
0 0 1 0 0 1
We just wanted to catch enough to have a meal then we came in.
0 0 0 1 0 1
We went on a charter. 0 1 0 0 0 1


Appendix J Consent to participate in the recreational fisher survey form.


Consent form
Project title: “Development of an agent-based model to communicate implications of recruitment
variability of finfish to recreational fishers (FRDC Project 2008/033)”
1. I agree voluntarily to take part in this study.
2. I have read the background information provided about the project and have been given a full explanation of the
purpose of this study, of the procedures involved and of what is expected of me.
3. I understand I am free to withdraw from the study at any time without needing to give any reason.
4. I understand that the findings of this study may be published. However, no information which can specifically
identify me will be published.
5. I understand that the questions being asked of me are not of a personal nature, and that my name and identity
will not be linked in any way to the data being requested.
6. I understand that the questions being asked in the survey and focus group discussion are of a general nature,
which aim to capture fisher knowledge on the habitats and movements of dhufish and snapper, and the ways in
which fishers target these species.
7. I understand that the information provided by me will be used to develop a computer model for exploring
interactions between recreational fishers and fish, and that this model will be made freely available for
download to the general public via the Centre for Fish and Fisheries Research website
(http://www.cffr.murdoch.edu.au/).
Signature of Participant: ________________________ Date: …..../..…../…….
(Name)
Signature of Investigator: ________________________ Date: ..…../…..../…….
(Name)

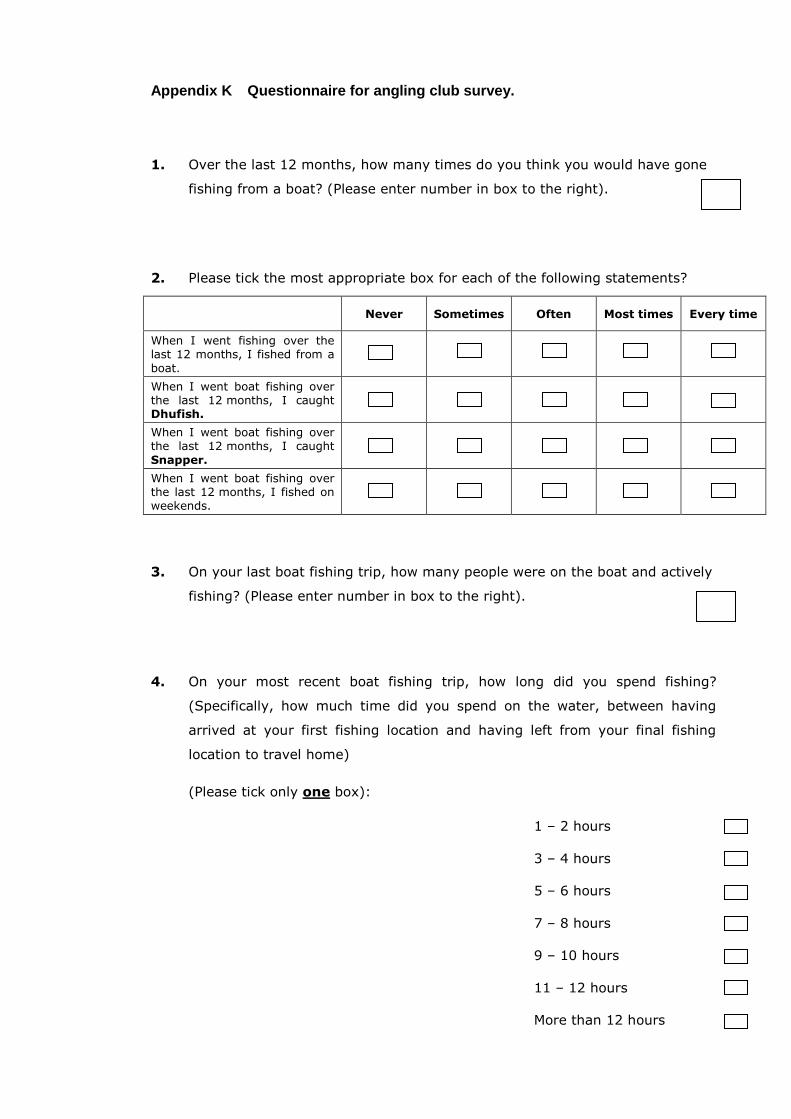
Appendix K Questionnaire for angling club survey.
1. Over the last 12 months, how many times do you think you would have gone
fishing from a boat? (Please enter number in box to the right).
2. Please tick the most appropriate box for each of the following statements?
Never Sometimes Often Most times Every time
When I went fishing over the last 12 months, I fished from a
boat.
When I went boat fishing over the last 12 months, I caught Dhufish.
When I went boat fishing over the last 12 months, I caught
Snapper.
When I went boat fishing over the last 12 months, I fished on weekends.
3. On your last boat fishing trip, how many people were on the boat and actively
fishing? (Please enter number in box to the right).
4. On your most recent boat fishing trip, how long did you spend fishing?
(Specifically, how much time did you spend on the water, between having
arrived at your first fishing location and having left from your final fishing
location to travel home)
(Please tick only one box):
1 – 2 hours
3 – 4 hours
5 – 6 hours
7 – 8 hours
9 – 10 hours
11 – 12 hours
More than 12 hours
5. If you went boat fishing at one of your favourite fishing locations, how long
would you stay there if you were not getting any “good” bites from a fish?
(By good bites, we mean bites from a fish likely to be big enough that you
would keep them, if you caught those fish) Please tick only one box:
Less than 5 minutes
5 – 10 minutes
10 – 15 minutes
15 – 20 minutes
20 – 30 minutes
30 minutes – 1 hour
Rarely or never move
6. If you went boat fishing at a location where you have never fished before,
how long would you stay there if you were not getting any “good” bites from
fish.
(By good bites, we mean bites from a fish likely to be big enough that you
would keep them, if you caught those fish) Please tick only one box:
Less than 5 minutes
5 – 10 minutes
10 – 15 minutes
15 – 20 minutes
20 – 30 minutes
30 minutes – 1 hour
Rarely or never move
7. Which times of the day do you consider best for catching Dhufish?
(Please tick multiple boxes if required):
Sunrise/ early morning
Mid morning
Mid day
Mid afternoon
Late afternoon/sunset
Night
I use a lunar (or solunar) chart
No particular time is best
Not sure – I rarely catch dhufish
8. Which times of the day do you consider best for catching Snapper?
(Please tick multiple boxes if required):
Sunrise/ early morning
Mid morning
Mid day
Mid afternoon
Late afternoon/sunset
Night
I use a lunar (or solunar) chart
No particular time is best
Not sure – I rarely catch snapper
9. On my last boat fishing trip:
(Please tick only one box)
I was mainly aiming to catch Dhufish
I was mainly aiming to catch Snapper
I was mainly aiming to catch fish species other than
Dhufish or Snapper
I was aiming to catch a mix of fish species including
Dhufish or Snapper
10. On your last boat fishing trip, how many Dhufish did you catch?
(Please enter number in box to the right).
11. On your last boat fishing trip, how many Snapper did you catch?
(Please enter number in box to the right).
12. On your last boat fishing trip, how many Dhufish did you release?
(Please enter number in box to the right).
13. On your last boat fishing trip, how many Snapper did you release?
(Please enter number in box to the right).
14. On your last boat fishing trip, did you catch and retain the bag limit for
Dhufish?
(bag limit = 1 fish per day)
Yes
No
15. On your last boat fishing trip, did you catch and retain the bag limit for
Snapper?
(bag limit = 2 fish per day)
Yes
No
16. On your last boat fishing trip, which times of the day were you actively
fishing?
(Please tick multiple boxes if required):
Sunrise/ early morning
Mid morning
Mid day
Mid afternoon
Late afternoon/sunset
Night
17. When you go boat fishing, what percentage of your time do you spend using
the two types of fishing methods listed below?
(Note: If you fish by both methods, the percentages should add up to
100%):
Line fishing (that is, using a handline, rod and line, line
with snapper or mechanical winch)
Spearfishing
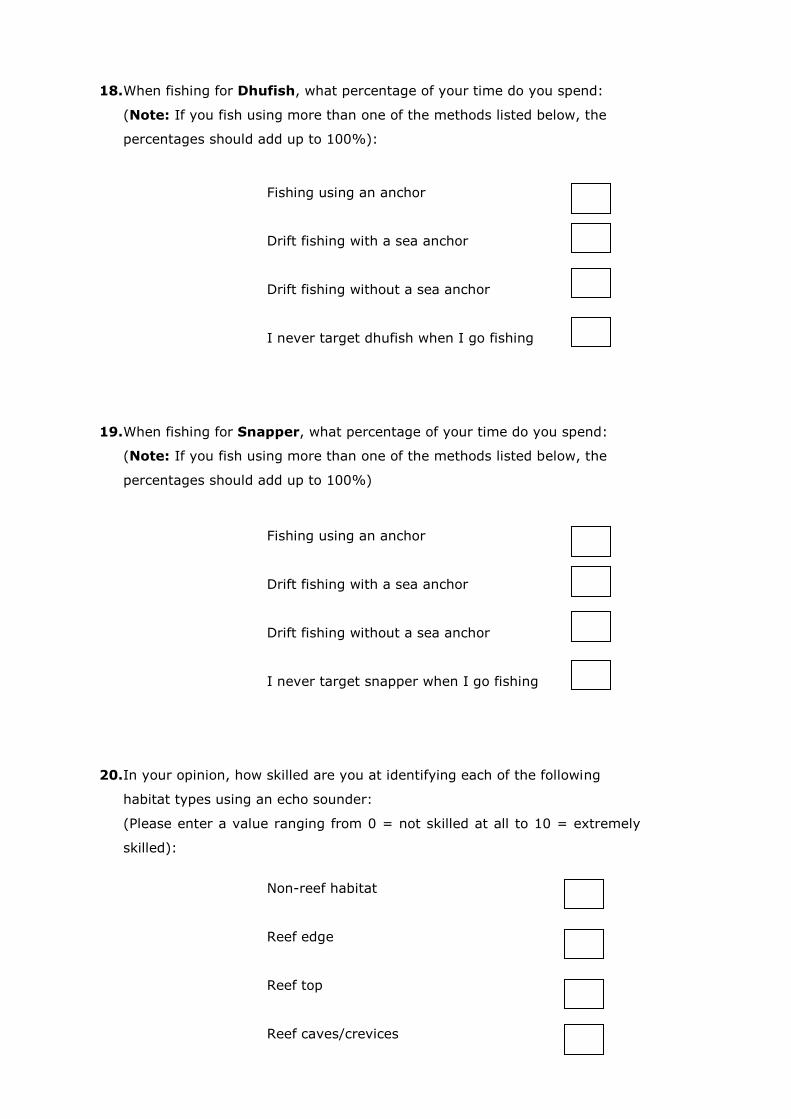
18. When fishing for Dhufish, what percentage of your time do you spend:
(Note: If you fish using more than one of the methods listed below, the
percentages should add up to 100%):
Fishing using an anchor
Drift fishing with a sea anchor
Drift fishing without a sea anchor
I never target dhufish when I go fishing
19. When fishing for Snapper, what percentage of your time do you spend:
(Note: If you fish using more than one of the methods listed below, the
percentages should add up to 100%)
Fishing using an anchor
Drift fishing with a sea anchor
Drift fishing without a sea anchor
I never target snapper when I go fishing
20. In your opinion, how skilled are you at identifying each of the following
habitat types using an echo sounder:
(Please enter a value ranging from 0 = not skilled at all to 10 = extremely
skilled):
Non-reef habitat
Reef edge
Reef top
Reef caves/crevices
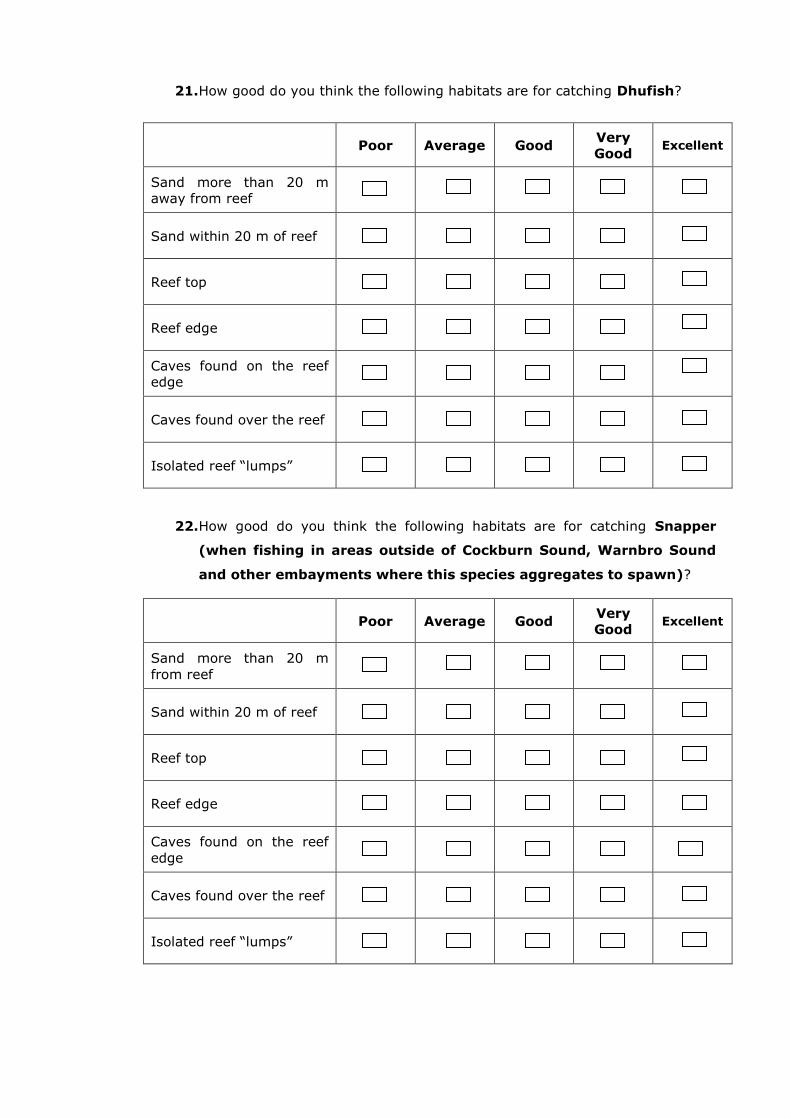
21. How good do you think the following habitats are for catching Dhufish?
Poor Average Good Very
Good Excellent
Sand more than 20 m
away from reef
Sand within 20 m of reef
Reef top
Reef edge
Caves found on the reef
edge
Caves found over the reef
Isolated reef “lumps”
22. How good do you think the following habitats are for catching Snapper
(when fishing in areas outside of Cockburn Sound, Warnbro Sound
and other embayments where this species aggregates to spawn)?
Poor Average Good Very
Good Excellent
Sand more than 20 m
from reef
Sand within 20 m of reef
Reef top
Reef edge
Caves found on the reef
edge
Caves found over the reef
Isolated reef “lumps”
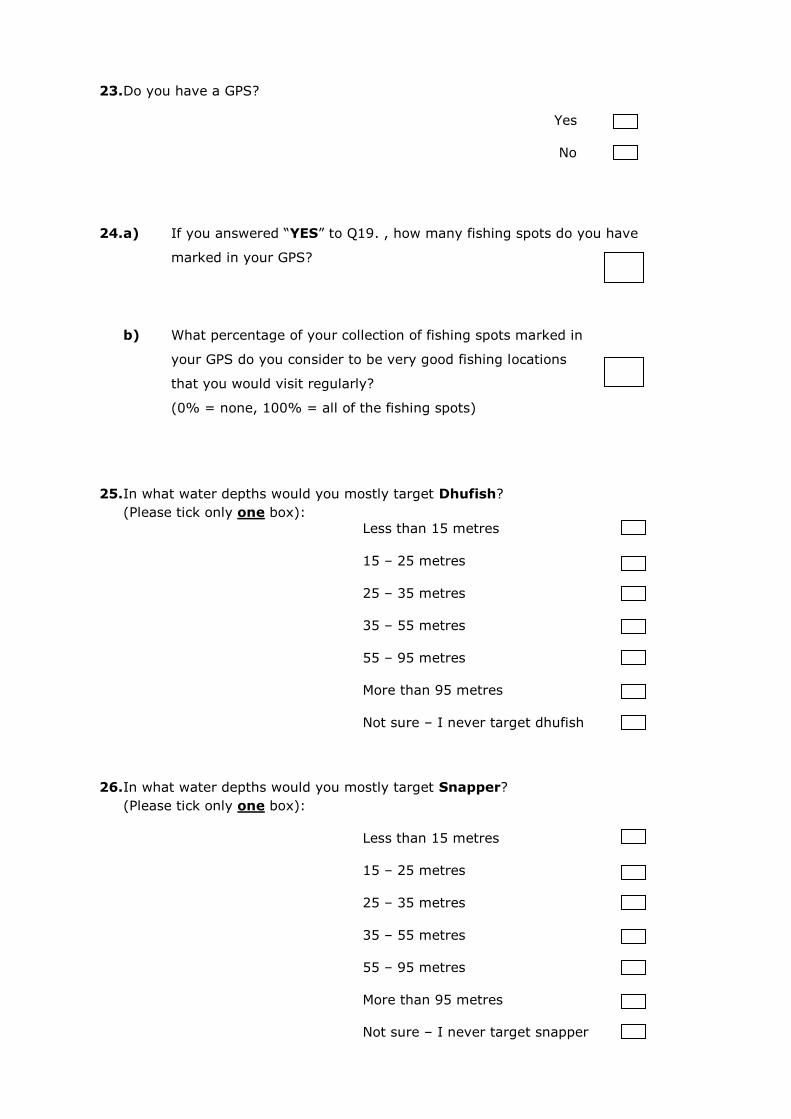
23. Do you have a GPS?
Yes
No
24. a) If you answered “YES” to Q19. , how many fishing spots do you have
marked in your GPS?
b) What percentage of your collection of fishing spots marked in
your GPS do you consider to be very good fishing locations
that you would visit regularly?
(0% = none, 100% = all of the fishing spots)
25. In what water depths would you mostly target Dhufish?
(Please tick only one box):
Less than 15 metres
15 – 25 metres
25 – 35 metres
35 – 55 metres
55 – 95 metres
More than 95 metres
Not sure – I never target dhufish
26. In what water depths would you mostly target Snapper?
(Please tick only one box):
Less than 15 metres
15 – 25 metres
25 – 35 metres
35 – 55 metres
55 – 95 metres
More than 95 metres
Not sure – I never target snapper
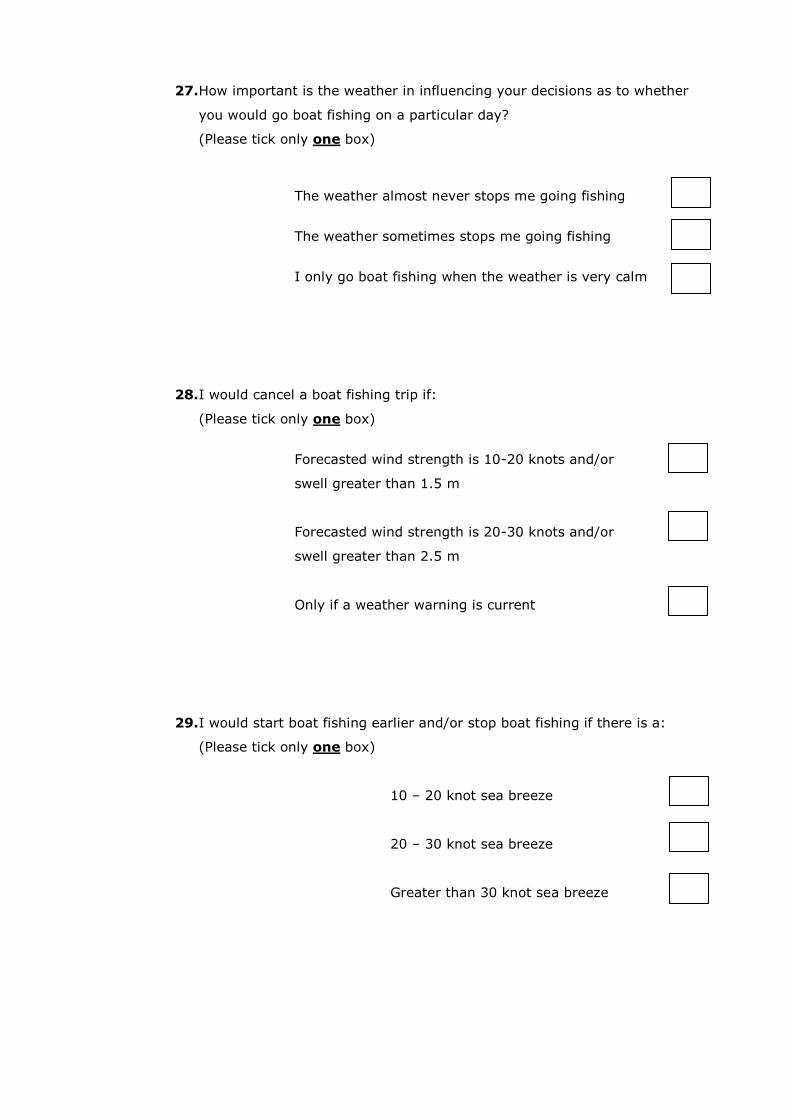
27. How important is the weather in influencing your decisions as to whether
you would go boat fishing on a particular day?
(Please tick only one box)
The weather almost never stops me going fishing
The weather sometimes stops me going fishing
I only go boat fishing when the weather is very calm
28. I would cancel a boat fishing trip if:
(Please tick only one box)
Forecasted wind strength is 10-20 knots and/or
swell greater than 1.5 m
Forecasted wind strength is 20-30 knots and/or
swell greater than 2.5 m
Only if a weather warning is current
29. I would start boat fishing earlier and/or stop boat fishing if there is a:
(Please tick only one box)
10 – 20 knot sea breeze
20 – 30 knot sea breeze
Greater than 30 knot sea breeze
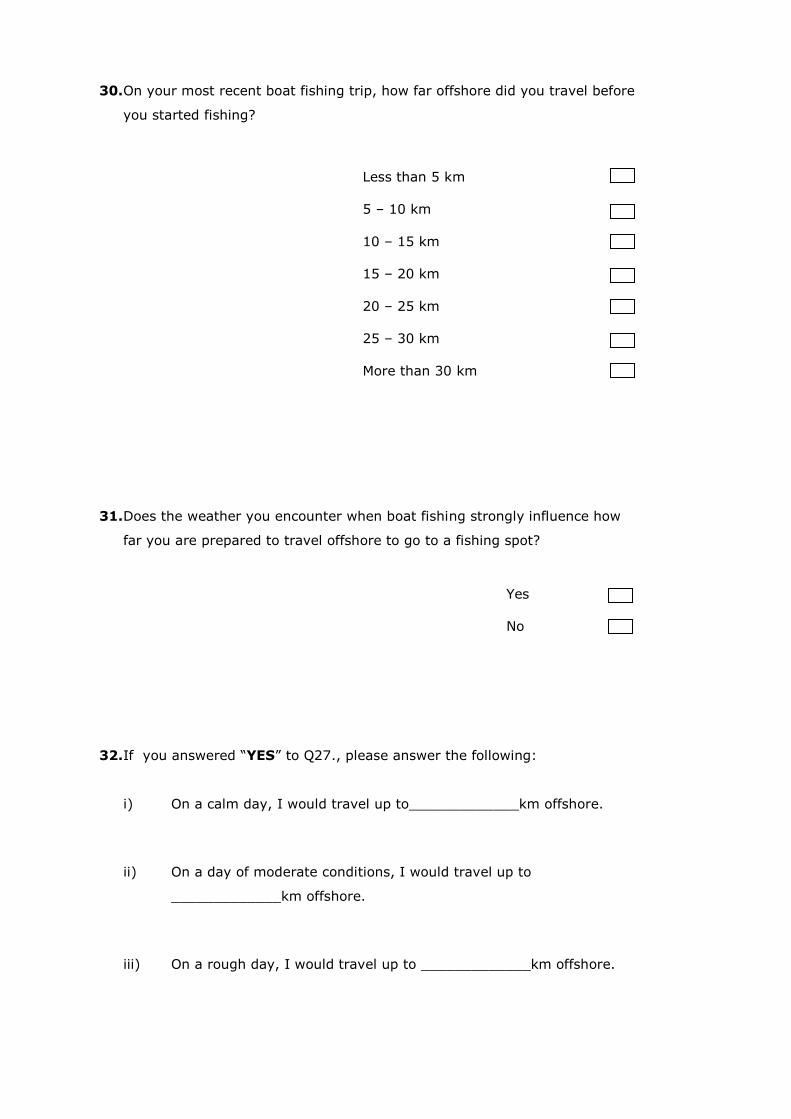
30. On your most recent boat fishing trip, how far offshore did you travel before
you started fishing?
Less than 5 km
5 – 10 km
10 – 15 km
15 – 20 km
20 – 25 km
25 – 30 km
More than 30 km
31. Does the weather you encounter when boat fishing strongly influence how
far you are prepared to travel offshore to go to a fishing spot?
Yes
No
32. If you answered “YES” to Q27., please answer the following:
i) On a calm day, I would travel up to_____________km offshore.
ii) On a day of moderate conditions, I would travel up to
_____________km offshore.
iii) On a rough day, I would travel up to _____________km offshore.
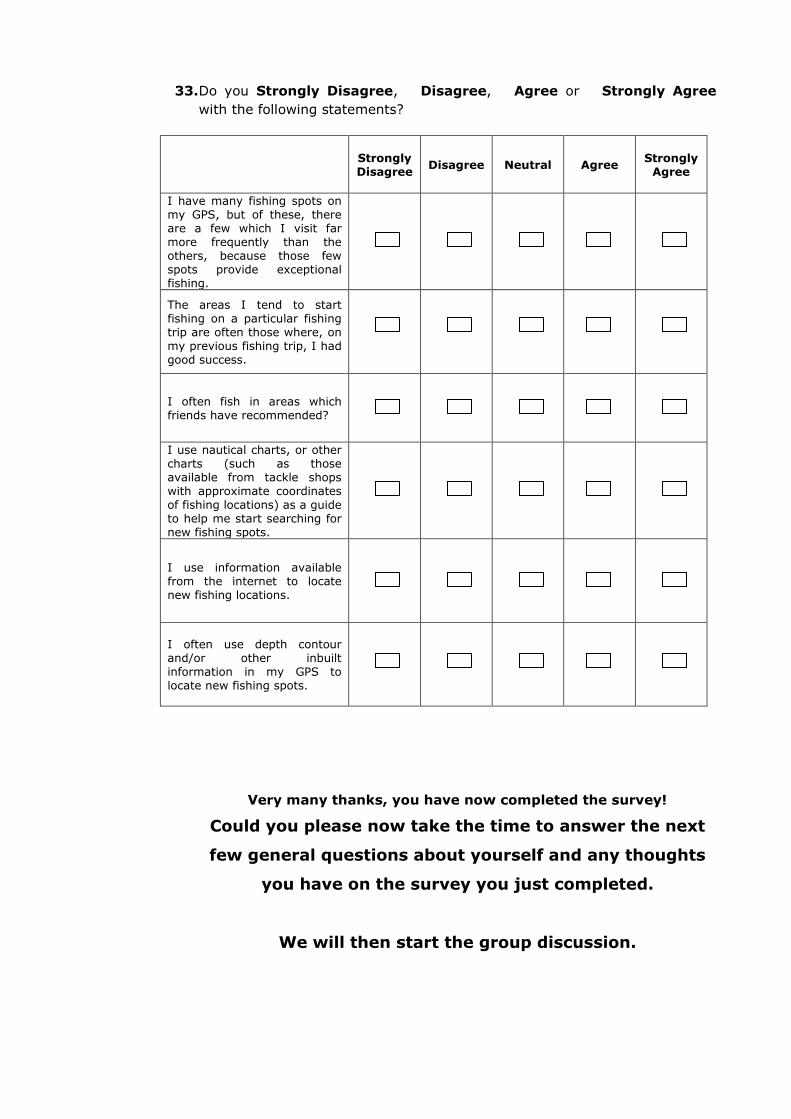
33. Do you Strongly Disagree, Disagree, Agree or Strongly Agree
with the following statements?
Strongly Disagree
Disagree Neutral Agree Strongly
Agree
I have many fishing spots on my GPS, but of these, there are a few which I visit far more frequently than the others, because those few spots provide exceptional fishing.
The areas I tend to start fishing on a particular fishing trip are often those where, on my previous fishing trip, I had good success.
I often fish in areas which friends have recommended?
I use nautical charts, or other charts (such as those available from tackle shops with approximate coordinates of fishing locations) as a guide to help me start searching for new fishing spots.
I use information available from the internet to locate new fishing locations.
I often use depth contour and/or other inbuilt information in my GPS to locate new fishing spots.
Very many thanks, you have now completed the survey!
Could you please now take the time to answer the next
few general questions about yourself and any thoughts
you have on the survey you just completed.
We will then start the group discussion.
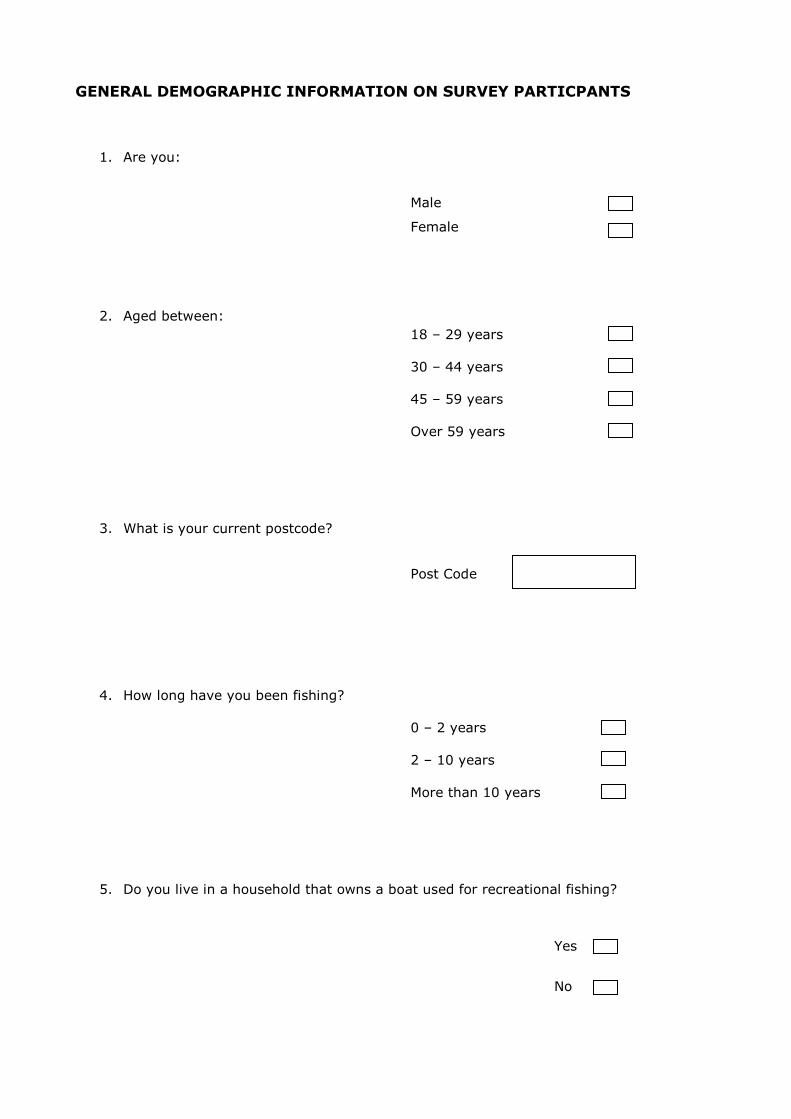
GENERAL DEMOGRAPHIC INFORMATION ON SURVEY PARTICPANTS
1. Are you:
Male
Female
2. Aged between:
18 – 29 years
30 – 44 years
45 – 59 years
Over 59 years
3. What is your current postcode?
Post Code
4. How long have you been fishing?
0 – 2 years
2 – 10 years
More than 10 years
5. Do you live in a household that owns a boat used for recreational fishing?
Yes
No

Please provide any comments you would like to make regarding the survey or any
additional information you would like to give? Some suggested areas on which you
may wish to comment:
1.) Any aspects you feel should have been included in the survey and why
2.) What you understand about the habitats of Dhufish and Snapper and their
movements
3.) How you use your knowledge about Dhufish and Snapper to increase your
fishing success
4.) What do you do differently to target Dhufish vs Snapper?
i) Fish at different times of the day for the different species,
ii) Use different fishing techniques,
iii) Fish over different habitats?
5) What features on an echo sounder are most indicative of the best habitats
for Dhufish and Snapper, and why (that is, what do those features indicate
to you about the habitat)

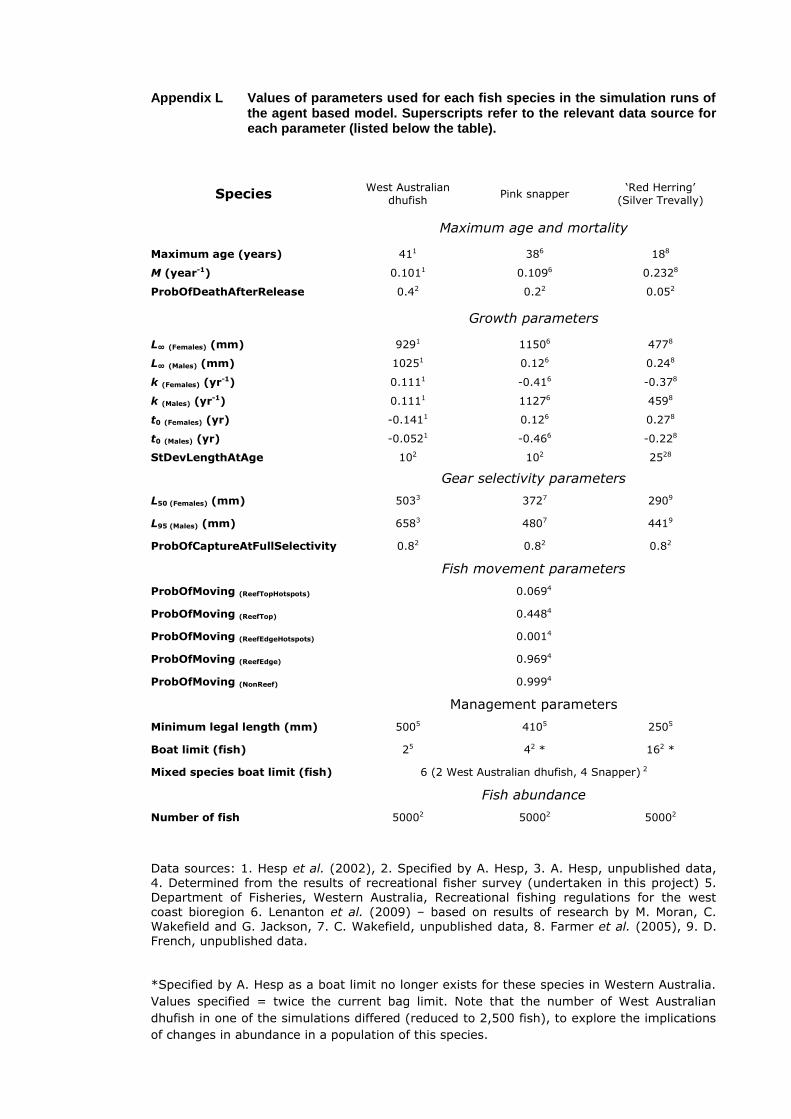
Appendix L Values of parameters used for each fish species in the simulation runs of the agent based model. Superscripts refer to the relevant data source for each parameter (listed below the table).
Species West Australian
dhufish Pink snapper
‘Red Herring’ (Silver Trevally)
Maximum age and mortality
Maximum age (years) 411 386 188
M (year-1) 0.1011 0.1096 0.2328
ProbOfDeathAfterRelease 0.42 0.22 0.052
Growth parameters
L∞ (Females) (mm) 9291 11506 4778
L∞ (Males) (mm) 10251 0.126 0.248
k (Females) (yr-1) 0.1111 -0.416 -0.378
k (Males) (yr-1) 0.1111 11276 4598
t0 (Females) (yr) -0.1411 0.126 0.278
t0 (Males) (yr) -0.0521 -0.466 -0.228
StDevLengthAtAge 102 102 2528
Gear selectivity parameters
L50 (Females) (mm) 5033 3727 2909
L95 (Males) (mm) 6583 4807 4419
ProbOfCaptureAtFullSelectivity 0.82 0.82 0.82
Fish movement parameters
ProbOfMoving (ReefTopHotspots) 0.0694
ProbOfMoving (ReefTop) 0.4484
ProbOfMoving (ReefEdgeHotspots) 0.0014
ProbOfMoving (ReefEdge) 0.9694
ProbOfMoving (NonReef) 0.9994
Management parameters
Minimum legal length (mm) 5005 4105 2505
Boat limit (fish) 25 42 * 162 *
Mixed species boat limit (fish) 6 (2 West Australian dhufish, 4 Snapper) 2
Fish abundance
Number of fish 50002 50002 50002
Data sources: 1. Hesp et al. (2002), 2. Specified by A. Hesp, 3. A. Hesp, unpublished data, 4. Determined from the results of recreational fisher survey (undertaken in this project) 5. Department of Fisheries, Western Australia, Recreational fishing regulations for the west
coast bioregion 6. Lenanton et al. (2009) – based on results of research by M. Moran, C. Wakefield and G. Jackson, 7. C. Wakefield, unpublished data, 8. Farmer et al. (2005), 9. D. French, unpublished data.
*Specified by A. Hesp as a boat limit no longer exists for these species in Western Australia.
Values specified = twice the current bag limit. Note that the number of West Australian
dhufish in one of the simulations differed (reduced to 2,500 fish), to explore the implications
of changes in abundance in a population of this species.

Image supplied by my other very talented god daughter Caitlyn Barrett, age 4.

Copyright © 2022 FDOKUMEN