.SPONS AGENT - ERIC
370
ED 117 378 --,AUTHOR TITLE 4STITUTION .SPONS AGENT lEibRT NOTE AVAILABLE FROM. EDRS PRICE DESCRIPTORS ABSTRACT DOCUMENT RESUME^ Cs 006 010 Sung, Betty Lee Chinese American Manpower and Employment. City Univ. of New York, N.Y. City Coll. Manpower Administration (DOI), Washington, D.C. Office of Research and Development. DINA-2-1-36-73-13-1 75. Ar 373p. National. Technical Information Service, Springfield, Virginia 22161 (no price given) 4 MF-$0.83 HC-$19.41 Plus Postage . Biculturalism; *Census Figures; Chinese; *Chinese Americans; *Cultural Factors; Demography; *Employment Patterns; Ethnic Groups; Ethnic Studies; *Immigrants; Income; Manpower Development; Manpower Utilization; Occupational Surveys; Racial Discrimination; Socioeconomic Inflaences; *Socioeconomic Status; Tables (Data); Work Attitudes A study of the e onoiic characteristics and occupational status of the Chinese in the United'States, based primarily on a special tabulation of the 1970 census, has resulted in a demographic profile of this bicultural and 'physically distinct ethnic group. potential improvement and expansion of the occupational sphere' of the Chinese is discussed in terms of cultural aspects. Extensive tabulation accompanies the text, including 89 tables, 7 charts, and 9 maps. Each-of the 14 chapters contains a list of findings relating to employment aspects of the Chinese; titles include: (1) Patterns of Chinese Immigration; (2) Foreign-born and Alien; (3) Geographical Dispersion; (4) Pducational Level; (5) Labor Force and Occupational Pattern; (6) Working Women; (7) Chinese in Government Wprk; (8) -Unions a 'Major Hurdle; (9) Income; (10) Unemployment and Underemployment; (11) The Chinese Work Ethic; (12) Self - employment and Small Business; (13) Cultural Baggage; and (14) Racism Modified. A listing of 34 summary findings, cultural anchors and differences, and 24 recommendations are provided, with four tables appended. It is stated that the study may be useful to social scientists, government agencies, administrators, and social service organizations. (LH) ********************************************************************** * Documents acquired by EPIC include many informal unpublished ',* * materials nest available from other sources. ERIC makes every effort * I/ * to obtain the best Copy available. Nevertheless, items of marginal * * reproducibility are often encountered and this affects the quality '* * of the microfiche and hardcopy reproductions ERIC makes available * * via the ERIC Document Reproduction Service (EDRS). EDRS is not * responsible for the quality of the original document. Reproductions * * supplied by EDRS are, the best that can be made from the original, * **********************;14******************tt************************* i oe /
-
Upload
khangminh22 -
Category
Documents
-
view
0 -
download
0
Transcript of .SPONS AGENT - ERIC

ED 117 378
--,AUTHORTITLE4STITUTION
.SPONS AGENT
lEibRT
NOTEAVAILABLE FROM.
EDRS PRICEDESCRIPTORS
ABSTRACT
DOCUMENT RESUME^
Cs 006 010
Sung, Betty LeeChinese American Manpower and Employment.City Univ. of New York, N.Y. City Coll.Manpower Administration (DOI), Washington, D.C.Office of Research and Development.DINA-2-1-36-73-13-175. Ar373p.National. Technical Information Service, Springfield,Virginia 22161 (no price given)
4
MF-$0.83 HC-$19.41 Plus Postage .
Biculturalism; *Census Figures; Chinese; *ChineseAmericans; *Cultural Factors; Demography; *EmploymentPatterns; Ethnic Groups; Ethnic Studies; *Immigrants;Income; Manpower Development; Manpower Utilization;Occupational Surveys; Racial Discrimination;Socioeconomic Inflaences; *Socioeconomic Status;Tables (Data); Work Attitudes
A study of the e onoiic characteristics andoccupational status of the Chinese in the United'States, basedprimarily on a special tabulation of the 1970 census, has resulted ina demographic profile of this bicultural and 'physically distinctethnic group. potential improvement and expansion of the occupationalsphere' of the Chinese is discussed in terms of cultural aspects.Extensive tabulation accompanies the text, including 89 tables, 7charts, and 9 maps. Each-of the 14 chapters contains a list offindings relating to employment aspects of the Chinese; titlesinclude: (1) Patterns of Chinese Immigration; (2) Foreign-born andAlien; (3) Geographical Dispersion; (4) Pducational Level; (5) LaborForce and Occupational Pattern; (6) Working Women; (7) Chinese inGovernment Wprk; (8) -Unions a 'Major Hurdle; (9) Income; (10)
Unemployment and Underemployment; (11) The Chinese Work Ethic; (12)
Self - employment and Small Business; (13) Cultural Baggage; and (14)Racism Modified. A listing of 34 summary findings, cultural anchorsand differences, and 24 recommendations are provided, with fourtables appended. It is stated that the study may be useful to socialscientists, government agencies, administrators, and social serviceorganizations. (LH)
*********************************************************************** Documents acquired by EPIC include many informal unpublished ',** materials nest available from other sources. ERIC makes every effort *
I/
* to obtain the best Copy available. Nevertheless, items of marginal *
* reproducibility are often encountered and this affects the quality '** of the microfiche and hardcopy reproductions ERIC makes available *
* via the ERIC Document Reproduction Service (EDRS). EDRS is not* responsible for the quality of the original document. Reproductions ** supplied by EDRS are, the best that can be made from the original, ***********************;14******************tt*************************
i
oe /

OP.
U S. DEPARTMENTOF HEALTH.EDUCATION & WELFARENATIONAL INSTITUTE OF
EDUCATION
THIS DOCUMENT HAS BEEN REPRO.DUCEO EXACTLY AS RECEIVED FROMTHE PERSON OR ORGANIZATION ORIGIN-ATING IT POINTS OF VIEW OR OPINIONSSTATED DO POT NECESSARILY REPRE-SENT OFFICIAL NATIONAL INSTITUTE OFEOUCATION POSITION OR POLICY
Report, to
Manpower Administration --- - -
U.S. Department of Labor
Chinese AmericanN- Manpower k
Epipioyutent
13etty .&e Surly.Department of Asian StudiesCity Coiiege of New York,
\si1975
1.14,1
1

tJ
I
This report was prepared for the Manpower Administration,U.S: Department of Labor, under research and deVelopmentgrant No. 21-36-73 -13. Since grantees conducting researchand development projects under Government sponsorship areencouraged to express their own judgefaent. freely, thisreport does not necessarily represent the official opinion-or policy of the Department of Labor: .. -.The grantee is solely
responsible for the contents of this report.
Reproduction in whole or in part permitted for any purposeof the United States government. -.
All other rights reserved. Not for reproduction or quota-tion without\ express written permiasion from the author.
-,

BIBLIOGRAPHIC DATASHUT
1. Rt.prt No.DLMA 21- 36- 73 -13 -1
2. . 3. Recipiept's Accession No._
!,-.
4. 'Title an.1 Suht kit
CHINESE AMERICAN MANPOWER AND ErPLOYMENT
. . .
5. Report Date
September 1975:,
6
7.--Au4lor4h4--- -- -_ _=Y=LEE3111107-7_1____
8-2.e.r.forminr_Orgaizatiom Rept.N --RFCUNY-534----
____
9. Performing Organizatton.Namt. and Address _
City College of the ,
City University of New York138th and Convent Ave. .
, New:York, NY 10031
10.. Project/Task/Work Unit No.
11. Contract/Grant No.
DL -21 -36 -73 -13
12.-Sponsocinit Organivation Name and Address -
Usk. Departmeht of Labor.
Manpower Administration.
,
Office of Research and Development 1601 D Street, N.V., Washington, D.C. 20213
13. Type of Report & PeriodCovered
Final; 1970-1975
14.
..
15. Supplementary Notes '-.
.. . ,,
16. Abbtracts Study of the employment characteristics and occupational status of the Chinesein the United States based primarily on a special tabulation of the 1970 census and supplemented by data from other sources. Topics covered include immigration, geographicaldispersion, demographic characteristics, education, occupations, working women, unions,civil service, income, unemployment, underemployment, self-employment, cultural differ -ences,-Trejudice, and_how the Chinese are coping with their probleMs.
In addition to developing a basic set of statistical data about this ethn1c group,the report brings out, many cultural aspects and sensitivities that must be addressed inassessing or in projecting any potential course of action for improving or expanding ,
. ,
the occupational sphere of the Chinese.Brought out also are the special obstacles that a bicultural and physically distinct
people like the Chinese encounter in competing in the American labor market. The rePort,
is specific and pragmatic in its findings and recommendations. The study is useful to,. .: : . : : qp a 4I ; :4 I : : 01 g : - : : : : : 111. : I : I i :17. Key Words and Document Analysis. 17a. Descriptors
1/.
Civil Service, Construction industry, Employment, Ethnic groups, Governmentemployees, Labor unions,,,'Clanpower% Professional perdonnel, socioeconomicstatus, Unemployment -if' .- .
F
.
, . .
174 Identifiers/Open-Ended Terr6s
-
Asian Am icons; Census, 1970; ChineseAMericans; Chinese immigration; .
Discr ation; Educatiog--Chinese; Occupations --- Chinese; Orienteli;
Population--Chinese; Racial Prejudice t /.
_ .
/6.
.
/17c. COSATI Fieldroup 51 4Is, Antilability Statement Distribution -is unlimited.4iailable from National Technical Infoimation'igervice, Springfield, Va. 22151.
,
19. Security Class (This ,,21.Report) , ,,
UNCLASSIFIED
No. of Piges377
20. Security Class (ThisPage
-UNCLASSIFIFD
22. Price.,
pittrartsirtev.a.m/4 THIS FORM MAY BE REPRODUCED
USCOMMOC 14t52.P72
o

4
CONTENTS
List of TablesList of ChartsList of Maps
Foreword 1
Chapters
I Patterns of Chinese Immigration 7
II Foreign-born and Alien 31
III Geographical Dispersion 47
IV Educational Level 75
V Labor Force and Occupational Pattern 101
VI Working' Women 4 133
VII Chingse in Government Work 157
VIII Unions a Major Hurdle 181
IX ,.,Income 199
'Unemployment and Underemployment 223
XI The Chinese Work Ethic 249
XII Self-eipployment and Small Business 275
XIII Cultural Baggage .305
.00
XIV Racism Modified 319
ConclusionAppendix 342
Bibliography 357
-v-
5
0
A

f
1,
4
LIST OF TABLE§
1A Chinese Immigrants Admitted by Sex and Age Group, 1962-1973.
1B Percentage of Chinese Immigrants Admitted by Sex and Age Grbup, 1962-1973.
2 Intended City of Residence of Chinese Immigrants, Years Ended June 30,1962-1972. -4
3 Estimated Jobs in New York City and Suburban Counties, 1970-1990.
4 Immigrant Aliens Admitted from China or Hong Kong as Region of Birth,
by Major Occupation Group, 1950-1972.
5 Quota and NonquotaImmigiants from Chia and Hong Kong, 1963-1972.
6 Chinese Foind Deportable by Violation.of Status, 1963-1972.
7 Nativity of the Chinese in the United States,'1900-1970.
8A Live Births of the Chinese in the U.S., by Sex, 1946-1969. .
8B Deaths of the Chinese in the U.S., by Sex, 1946-1969.
9 Native-Born and'Foreign-Born:U.S., Chinese, Japanese and Filipinos, 1970.
10 Chinese Who Became Naturalized Citizens, 1963-1973.
11 Citizenship,of the Chinese in the U.S. byl'erceht, Total and SevenSelected States, 1970.
12 Mother Tongue of Chinese in the U.S., by Percent, 1970.
13 The.Largest Centers of Chinese Population in theU.S., 1950; 1960, 1970.
14 percentage of Chinese in Four Urban Centers to Total U.S. ChinesePopulation, 1960, 1970.
'15 Chinese Population by State and Percent Change, 1960, 1970.
16 Physical Mobility of the Chinese in the'U.S. 16 Years and Over, for
Selected States, 1970.
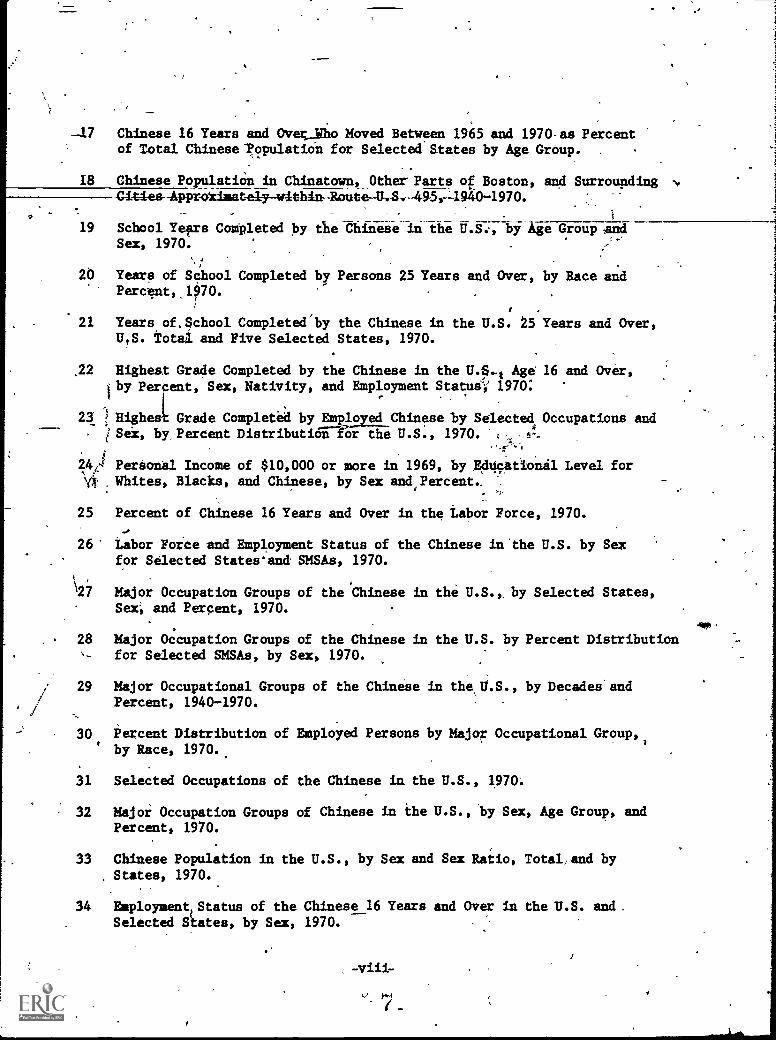
-17 Chinese 16 Years and Over..Who Moved Between 1965 and 1970as Percentof Total Chinese 'Population for Selected States by Age Group.
18 Chinese Population in Chinatown, Other Parts of Boston, and Surrounding41-t4es-Approkinately-within-Houte-U-.8,49-5,-4940-1970.
i
19 School Yefrs Completed by the Chinese in the U.S.-, by Age GroupSex, 1970.
, ,
20 Years of School Completed by Persons 25 Years and Over, by Race andPercent, 1970.
1
21 Years of, School Completed/by the Chinese in the U.S. 25 Years and Over,U,S. Total and Five Selected States, 1970.
,22 Highest Grade Completed by the Chinese in the U.§..t Age 16 and Over,fby Pertent, Sex, Nativity, and Employment Statuti',' 1970:
23 Highest Grade Completed by Emplond_Chinese by Selected Occupations andiSei, by, Percent Distributiortor the U.S., 1970.
24? Perional Income of $10,000 or more in 1969, by ,E4gcational Level forVT Whites, Blacks, and Chinese, by Sex and,Percent,
25
26'
'27
Percent of Chinese 16 Years and Over in the Labor Force, 1970.
Labor Force and Employment Status of the Chinese in the U.S. by Sexfor Selected States and SMSAs, 1970.
Major Occupation Groups of the Chinese in the U.S., by Selected States,Sex, and Percent, 1970.
Air
28 Major Occupation Groups of the Chinese in the U.S. by Percent Distributionfor Selected SMSAs, by Sex, 1970.
.111
29 Major Occupational Groups of the Chinese in the U.S., by DecadesandPercent, 1940-1970.
30
31
i'ercent Distribution of Employed Persons by Major Occupational Group,,by Race, 1970.,
Selected Occupations of the Chinese in the U.S., 1970:
32 Major Occupation Groups of Chinese in the U.S., by Sex, Age Group, andPercent, 1970.
33 Chinese Population in the U.S., by Sex and Sex Ratio, Total,and byStates, 1970.
34 Employment. Status of the Chinese 16 Years and Over in the U.S. and.Selected States, by Sex, 1970.

'/
I .
35 Employment Status of Chinese Females with Husbands Present and Children,Under 6 for the U.S. and Five SelectedStates, 1970.
36. Chinese'Women in the U.S. 15 Years and Over, Single or Ever Married, 1970.
37 Chinese Families with Own Children. 18 by Number of Children, fot
the U.S. and iive Selected Stat
V
s, 1970. ,
:
-. .
38 Fertility of ehinese Women in e Childbearing Ages, 1970.
39. Percent of Women Ever Married, by Children Ever Born of the Chinese inthe U.S., 1070.
1
40 Children Ever Born to Chinese Women Ever Married, 15 Years and Over, byNativity, 1970.
41 Fertility of Chinese Women Ever Married,,15 Years and Over, by Level ofEducation and Percent, 1970.
./4
42A Seven Ranking Occupations of Chinese Women, 1970.
42B Number of Workers in Four.Major Occupational Groups of Chinese Women, 1970.
43 Size of Chinese Families in the U.S., Total and Five Selected States, 1970.
44 Chinese Employed asT Government Workers as Percent of Civilian LaborForce, for Five.Selected States, 1970.
45. Chinese Government Workers, by Age Grbup, 1970.
46 Chinese, Government Workers in Federal, State and Local Governments, byNumber and Percent at Each Level, 1970.
47 Orientals Employed in Agencies of Federal Government, General ServicePay System, 1967-1971.
48 Ethnic Comparison of Federal Government Wage Systems Employees, by Percent,1967-1970.
49 Ethnic Comparison of U.S. Postal System Employees, by Percent, 1967-1971.
50 San Francisco Government Employees of Oriental Extraction, by MajorOccupation Group and Sex, as of December 31, 1971.
.4 51 Income of Orientals in San Francisco County and City Government Service, 1971.
,Number of Chinese in New York City Government-Agencies, 1971.
53 New York City Goverment Employees of Chinese Extraction, by Sex andOccupational Classificatpn, 1971.

-5
54 Salary Level of Netv York City Government Employees of Chinese Extraction,by Sex, 1971 .'/
55 Apprenticeshiii in New York Areal QUalifications, .Training Period, andWages-f-4.974v---
.6 Racial Composition of Zen Construction Unions in San Francisco, 1970.
57 Union Membership in the Building Trades, by Minority Groups in New YorkRegion, 1972.
58 Family Income of the Chinese in the U.S., Total and Five Selected States, 1969.
59 Comparison Between therage Income of the Chinese and the National and StateAverages, 1969.
60 Family Income of -the Chinese bathe U.S., by Number of Earners, 1969.
61 Comparison of Personal and Family Income of the Chinese in the U.S., 1969.
62 Chinese Persons and Families with Income Less Than Poverty Level, TotalUS. and Five Selected States., 1969.
63 Personal Income of the Chinese in the U.S., by Age Group and Sex, 1969.
64. Average Earnings of Employed Chinese Who Worked 50-52 Weeks in 1969, bySelected ccupations and Sex.
65 So a of Income of Chinese Families in theU.S:, 1469.
r
66 'Unemployment Rate for Males in the Civilian Labor Force in Ten SMSAs. 1970.
67 Comparison of Employment Status and Labor rorce of the Chinese in the U.S.,by Age Group and Sex, Total U.S. and FiveSelected States, 1970.
68 Education and Employment Status of Chinese Males 16 to 21 Years Old, forTen SMSAs, 1970.
69 Underemployment of the Chinese as Reflected in Chinatown Manpower Roster, 1972.
70 Current Occupation and Occupation Five Years Ago of the Chinese 16 Yearsand Over, 1970.
-
71 Cdrrent Industry and Industry Five Years Ago of the Chinese 16 Years andOver, 1970.
t.
72 ,Occupational Level of Orientals in Three San Francisco Companies, 1970.
73 EmPldied Chinese Who Worked 40 or Mcreliours Per Week in 1969, by Sex.
ti
-x-\, ,
L
0 1
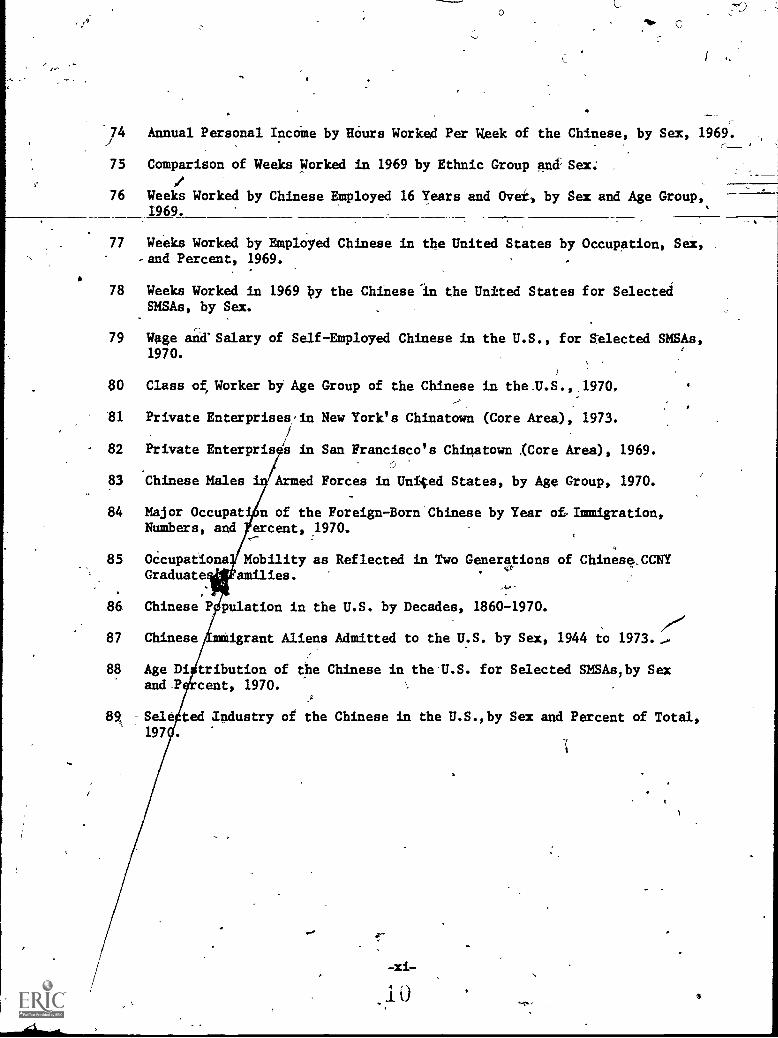
'74 Annual Personal Income by Hours Worked Per Week of the Chinese, by Sex, 1969.
75 Comparison of Weeks Worked in 1969 by Ethnic Group and Sex;
76 Weeks Worked by Chinese Employed 16 Years and Over, by Sex and Age Group,1969.
77 Weeks Worked by Employed Chinese in the United States by Occupation, Sex,-and Percent, 1969.
78 Weeks Worked in 1969 by the Chinese In the United States for SelectedSMSAs, by Sex.
79 Wage and'Salary of Self-Employed Chinese in the U.S., for Selected SMSAs,1970.
80 Class of Worker by Age Group of the Chinese in the U.S-, 1970.
81 Private Enterprises,in New York's Chinatown (Core Area), 1973.
82 Private Enterpris S in San Francisco's Chinatown ,(Core Area), 1969.
83 Chinese Males Armed Forces in United States, by Age Group, 1970.
84 Major Occupat n of the Foreign-Born'Chinese by Year oLImmigration,Numbers, and ercent, 1970.
85 Occupations Mobility as Reflected in Two Generations of Chinese,CCNYGraduate: ,t 4' amilies.
86 Chinese P pulation in the U.S. by Decades, 1860-1970.
87 Chinese mMigrant Aliens Admitted to the U.S. by Sex, 1944 to 1973....
88 Age Di tribution of the Chinese in thell.S. for Selected SMSAs,by Sexand P cent, 1970.
89 Selo ted Industry of the Chinese in the U.S.,by Sex and Percent of Total,197'.
".14

LIST OF CHARTS.fr
Chinese-Aliens Admitted to the United States, 1944=1970.
Students Admitted to the United States from Hong Tong andChina, 1963-1972.
C Age Distribution of Chinese in California and Hawaii,' 1970.
Comparison Among Personal Incomes of Chinese Males, ChineseFemales, and Family Income, 1969.
E Oriental Employees in the Federal-Government GeneralService Pay System, 1967-1971.
F Ethnic Distribution of Federal Government Employees inGeneral Seriice Pay System, 1971.
G Organizational Chart, Office of Mino ity Business Enterprise.
LIST OF
1 Rwangtung Province (South ).
2 San Francisco Chinatown P per, 1970. .
3 SanFrancisco Chinatown roper and Richmond Area, 1970.
a
4 Expanding Chinatown New York, 1970.
5 Chinatown--Oakland, California, 1970.
6 Los Angeles' China wn, 1970.
7 Philadelphia--Ch a awn, 1970.
8 Chicago--Chinat 1970.
9 Boston's Chin own, 1890-1970.

- FOREWORD
The.1960s we the decade of protest against racial inequality,environmental pollution, and senseless wa ys:' The anger characterizingthe period was both frightening,and,prtadsingpromising in that theconscience of the American people was aroused to action.
The 19700;111 be a decade of redress. Progfess will be regis-:
tered, but how progress depends upon how committed we are tothe principles we espouse, the policJ,es we fol ow, and the tactics
we employ. -
Now that the shouting and recrimination have toned down, the-nation is .taking a hard look at what can be done. The hard look'.
means facts andYthe imp/ications.of those facts. What are the causes
of the pathology? The symptoms are already manifest.
To look at one area--racial inequalit in employmenttheManpower Administration of the Departme o ,Labor awarded me agrant to undertake a study of the econo is haracteristics andoccupational status of the Chinese in t e iced States. The intent
was to obtain a demographic profile of the Chinese and to determine
where the Chinese stand occupationally and ez6nomically,. It was
\ suggested that I utilize; -the findings of the 1970 census instead,of undertaking,my own survey. This was an excellent suggestion, 0
cept in the past, the Census Bureau tabulated and published verylittle detailed information about the Chinese. The information
wa there--all gathered during the taking of the census--but inracial breakdown, the Chinese are usually lumped under the inaistin-
'guis able heading, "Others". The grant afforded me the opportunityto tae the Public Dim Sample Tapes and do a special tabufation
perta ing to the Chinese.
There're drawbacks to sole. reliance upon the 1970 census data.The most obVious one, of course, is that tht information is'alreadyout of date. ',Rapid increase in the Chinese population over recentyears has radically changed the make-4p of this ethnic group. Likeparched land soaking up water after a drought, the Chinese have beenflocking here since 1965 to be reunited with their families. Apnrox-.-.
7
imately one - fourth of the Chinese now in the United Stat have comein since 1970. Consequently, the census of that year reflected' thesituation of the settled Chinese who had been in the United Satesa bit longer more than it did the situation of recent iMmigrants.
Without question,%there has been underenumeration of'*the Chineie,andthe excluded population may be sizable. We 'shall see that theChinese are heavily concentrated in urban areas and especially in thecoastal Chinatowns. Almost half of the population is foreignrborn.The native-born axe the Younger generations, but it-is the parentsor the foreign-born who fill out the,qUestionnaires. -Censuses aredefinitely not a part of their tradition or background;.'
The Chinese are highly suspicious of government officials. Theyhad experienced sixty-one years of stringent exclusion (1882-1943)and twenty-two more years of restricted Immigration (a 105 quotauntil 1965), so that. the ghosts of illegal or extralegal entry ,stillhaunt them. These'peqple tend to avoid the census taker.
ChinatOwns today are not exactly secure neighborhoods, andpeople do not readily open their doors to strangers. Even whenthe door is opened and an interviewer 4; introduced by a mutualacquaintance, the suspicions are-there. A wall of silence'greets
b the census taker.
Fully cognizant of the difficulties that Would be encountered,'te New York'sChinatown carried out an extensive campaign to educate
the people and whip up enthusiasm so that everybody would be counted.At the last moment, the New York City COUncil even voted monies toprint the census forms in Chinese. A group of dedicated young people,concerned about underetumeration, Worked. very hard as census takers,but they would be the first to admit-that many Chinese chose not,to,be counted or were left out inadvertently.
Most the Chinese who filled out theii questionnaires,or who responded to the census takers, tended to be native-bop,English-speaking, better educated, and non-:Chinatown residents. If
we take into account the fact that the data is slanted in thesedirections, the census is not,without its worth. After.all, thecensus attempts a 100 percent.headcount,and a 20 percent samplingof social and economic characteristics. In interpreting the censusdata therefore, one must constantly keep in mind these biases.
Nineteeh-seventy was the firsttime that the Census Bureaudevoted a special report to the Japanese, Chinese, and Filipinos, andthis volume, PC(2)1G, provided a wealth of statistics never beforetabulated or published. As the data presented in this volUme camefrom the basic records made from the original census questionnaires'and,Was based upon a 20 percent sample, I utilized the data'frOM
/

this volume wherever possible. But my study called for many crosstabulations or other information not found in the special report.Since the basic census tacords and confidential and not availableto the public, I utilized the Public Use Sample Tapes, which hadbeen carefully constructed to reflect as closely as possible anaccurate cross section of the demographic characteristics of theAmerican population.
Dr. Paul T. Zeisset, of the Census Bureau, thiman who constructedthese tapes, explained to me in great, detail the selection processand the weighting of the factors, but' I am afraid he lost me in the
technicality of the explanation. Suffice it to say that the reputationof the Census Bureau is such that fe4 question its methods or integrity.
The Public Use Sample Tapes draw upon a 1 percent sample. In
comparing the computer print-outs from the tables I constructed withthe available 20 percent data from the Census Bureau, I found thatthe figures for the larger categories were fairly close. In thefiner categories and minute breakdowns, there were discrepancies.In those cases; I discounted_the data or omitted those tabulationsentirely. All data used have been carefully studied and analyzed;
Acknowledgments
A great deal of attention was devoted to scrutiny of the censusquestionnaire and the Public Use $ample Tape to see what informationcould be gleaned and what cross tabulations were possible. Forinvaluable assistance in this phase of my research% I am indebted toMs. Tobia Bressler and Nampeo McKenny and their wonderful staff atthe Ethnic Origins Division of the Census Bureau.
When the tables were set up and formated, they. were sent toSa. Walter Postle of the Region IX Manpower Administration inn Francisco, who had generously offered me the use of his computer
facilities at the Lawrence Radiation Laboratoties.
Miss Sylvia Sorrell was assigned to program my tabulatiohs. I
cannot stress enough the importance of her expertise in decipheringand translating my needs into meaningful print-outs.
did not rely upon the census data alone. r searched thebibliographies and indexes for private research material, as wellas other governmental sources. Luckily, the EEOC reports generatedmuch' information on the ethnic make-up of work forces. State andmunicipal government statistics were combed for comparative purposes.Annual publicptions, such as Vital Statistics of the United Statesand the Immigiation and Naturalization Service Annual Repotts, were'-goldmine-sources.
I

t,
I tried.to corroborate my findings or test them by talking to,Chinese people, young and old, from all walks of life, and fromdifferent regions, of the country. I studied the listings pastedon the employment offices in the CAdatowns of San Francisco andNew York. I interviewed successful men and women in their fields.I. had long talks with my graduating seniors to find out'how theywent about applying for jobs and what was their attitude towardwork and the future. My research assistants were sent out toascertain the pay scale for certain occupations by asking people onthe jobs.
At this point, I would like to acknowledge the contributionsof a few of my student assistants. They are Wai Ting Leung, AnitaYue, Chor Lee, Ellen Lau, and Yuk Wah Mui. The voluminous tablesin this report were typed by Lillian Ling and Cynthia Sung.
I attended as many Asian-American gatherings as I could possiblysqueeze into my hectic schedule. My community contacts on both theEast and Vest Coasts stood me .in good stead and .6Pened up for me manysources of infOrmation.
Most important, rvias in the midst of where things were happening.'New York City has become the focal point of Chinese-American awareness.Ethnic consciousness is most acute with the young and rising genera-tions of Chinese-American youth who are in colleges and universities.At City College New York, there is an Asian-American student enrollmentof approximately 1,400. Its Department of Asian Studies stressesthe Asian-American aspect, and it can claim to be the East Coastbirthplace of the Asian-American movement.
I needed the activity, the pace, the strong sentiments expressed.by my students to cull from their attitudes and to validate my findings.I am also grateful for the strong support given by the Ofiegeadministration that enabled me to undertake this research.
ef.,
All these other avenues, inspirations, and sources of materialwere used to supplement, interpret, and corroborate the statisticalinformation from the census. Space does not permit me to acknowledgeall of the people whom I consulted and interviewed. Even if theyare not named, they will know that they were part of this effort.
Before and after X embarked on my project, I consulted Dr. Eli.Ginzberg of the Graduate School of Business, Columbia University,and recently appointed chairman of President Ford's National Commissionfor Manpower Policy. In spite of his tremendous commitments toteaching, writing, research, and civic undertakings, he took timeout to point me in the right direction andto read my manuscript:
Messrs. Alan Wong of San Francisco and Danny Yung, both of whomare involved in research on Chinese-Americans, also graciously consented
4
-4-
;
J
to look over -my findings and recommendations. ,
Of conrse,nong of this research would have been possible wereit not for the grant minty:lame by the Manpawer Administration. AtManpower, ten thousand thanks go- to- Howard Rosen, Herman Travis,Stuart Garfinkel, Frank Mott; and Karen Greene.-.-Mrs._ Greeie, supervisedmy grant,' and she was a Houdini when it came to unraveling red_iape.:_
At the Research Foundation of City College,, it was Mr. MortonPavane who hounded me relentlessly until I handed in my proposal,which. - started the ball rolling, 'and it was he and his staff who kept
a fiscal eye,on thd-grant expenditures.-
Credit for editing the manuscript goes to Mrs. MuriamEurewitzand Barbara Kelman-Burgower, who helped me tie the report together,and who polished those rough edges.
As rhave already recounted, this was a masaive endeavor involvingmany groups and many People,'all of whom played essential roles'inthe structuring-of'this study and report. .To each and-every one, Iagain acknowledge my debt and proffer my thanks. One more expressionOf gratitude remains;, and that one goes to my family: To my husband,
Charles Chia Mou Chung, for his moral support and understanding, tomy daughter, Cynthia Sung; who typed 'the final report,' and to alleight of our children, who shared and spared their mother during thesepast two and a half years.
4.411.0ne
0, -5-I

.34
thOttitaIldEL
.26
25
24
23CHART A
22 CHINESE ALIENS ADMITTED TO. THE UNITED STATES
194471978
21
20
19-
18
173
16
15
14
13
12
11
10
9
8
6
0
/
MNfemale
Male
Source: Appendix Table 87.
1944 46 50 52 54, 56 58 60 62 :64 66 6 :"70 72, 74 ;
YEAR
17 I

1-
4.
CHAPTER I
PATTERNS OF CHINESE IMMIGRATION
The history of thig nation spans but a few hundred years and,for more than a century and'a quarter, the Chinese have been a part,of it. The Chinese were among the "Forty-niners" who flocked-toCalifornia during the Gold Rush. These Chinese came from the southernChinese province of Rwangtung, near the mouth of the Pearl River.They left their homes, braving the unknown, pdlling up firmly embeddedroots, risking the executioner's ax, and Journeying 7,000 miles acrossthe Pacific in sail-driven vessels' co seek their fortunes in a newland they called the "Mountain of Gold." They were referring tothe hills of.San Francisco during the days of the Gold Rush. Thepull was the prospect of-gold, but, the push`was the impoverishedsoil of China, which would yield not even a marginal livelihood,made poorer by civil strife and political unrest.
Hardly tyo years after the first cry of gold went up, 25,000stalwarts from Cathay were fpund in California. The virgin landsand undeveloped country needed hands, and the' Chinese willinglyprovided the manpower to work the 'mines, drain the ditches, tillthe soil, harvest the atag,..and build the net of railroads that
bound the nation together. When their work was done, their ungratefulb9neficiaries said, "America is for whites. Go back to where youcame frop."
. America for the Whites
Thus was set in motion a racist campaign that resulted in a,continuing series of legislative maneuvers designed"to keep theChinese out and to .makt life intokrabli for those who remained.
Chinese - immigrants dropped from 40,000 in 1882 (prior to'. exclusion) to 10 persons in the year 1887. For sixty-one years
following,, fourteen separate pieces-of legislatiOn were enactedby the United States Congress that virtuaWealed the doors of
)%the-United States against Chinese immigration. These laws wererepealed in 1943, when a gesture of goodwill was made toward China,but repeal was'little more than that7-a gesture.
-7-
18

Beginning in 1943, the Chinese were given a quota of 1b5 immigrantsper year, and this'quota included anyone of Chinese blood, regardlessof his country of birth or residence or allegiance. For the nexttwenty -two years, until 1965, a mete 6,055 Chinese were admitted tothe United States. This figure included persons admitted under anumber of refugee relief acts.
At that rate of admission it is a wonder that there were anyChinese at all extant in the United States. To preserve themselvesagainst complete extinction, the Chinese resorted to inconspicuouscircumvention of the immigration laws so that, for a half centurybefore repeal, the Chinese population for the entire country hoveredaround 60,,000 to 80,000 and was almost-all adult male, with fewfemales and few children. If they all attended a football game-at the same time one afternoon in the Orange Bowl in Miami or theCotton Bowl in Dallas, they would fit comfortably into either stadium.Dispersed throughout the country, they were hardly noticeable andpolitically impotent.
It was the express intent of the American government to keepit that way. Governmental policy was dirdoted not only against theithinese, it was aimed against any people of darker shades of skincoloring--the most desirables were the Northern European types.This intent was spelled out in the immigration laws by-the nationalorigins quotas; Great Britain, Germany, Ireland and the Scandinaviancountries had claim to about 120,000 quota slots out of the 150,000total available annually. By 1965, this racist viewpoint was nolonger in vogue and sus absolutely indefensible. The national originsquotas were amended and an entirely different premise substitutedfor American immigration policy.
The Chinese and most other Asiatic countries were prima.beneficiaries of this change in the immigration laws. Formerly,with-the exception of Japan, with a 'quota of 185, Turkey, with aquota of'225, and, pf course, the Chinese with 105, no other Asiancountry had a quotacof more than a 160. The Immigration Act of1965 extended the upper limit of any one country to 20,000. Conse-quently, it was inevitable that a spurt in Asian immigration wouldresult.
#
Removing the Cork
Since 1965 and the. liberalization 'of quotas, Chinese immigrationin particular has been spectacular. Chart A shows the rate by sexat which Chinese aliens were admitted to the United States for thirtyyears following repeal of the exclusion acts. If admittance had
, depended solely upon the 105 quota allotted Chidesepersons, thetotal numbers would have remained in the hundreds. But, in 1946,
-8-
19

some relief was given by a proviso permitting Chinese male citizensto bring their wives and children into, the country without charge -
to the national quota. That same year, the War Brides Actives passed,allowing GI wives to join their husbands in the States, again wi houtcharge to the quotas. Consequently, Chinese immigration slowlyclimbed up to six thousand until President John Kennedy, by execu 'lyeorder, permitted the admission of a number of refugees. This tookChinese immigration into another higher plateau, bUt it was notuntil the full force of the 1965 Immigration Act took effect thatimmigration really soared, increasing by as much as 400 percent to500 percent. (See also Appendix Table 87.)
This percentage increase can be exploited by sensationalism,and it has been. Scaremongers are already headlining their articleswith captions like "Growing Surge of Immigrants from Asia" and"Trickle Turns to Flood.'" Few take note of the facts that thebase was so small for so long and that consequently, a comparableincrease in numbers for other countries with larger immigrationbases would yield smaller percentage increases.
Nonetheless, the spurt in immigration has made a tremendousimpact upon the Chinese communitieq in the United States and hascompletely altered the demographic characteristics of this ethnicgroup. The immigrants of yesteryear were able-bodied males-whosepurpose in coming was 'to earn and save enough to go back to China.They brought no family, and they lived the lives of rootless transients.They filled the gap in the lower occupational strata, working at jobsthat other disdained. They clustered in Chinatowns for the familiarityand security, in numbers. They were poorly educated and made littleor no attempt to learn the English language. ,
Before 1943, Chinese immigrants were not permitted to becomecitizens no matter how long they had resided in this country, sothey had no political backing and little use for American customsor ways. They were made scapegoats for the ills of the times, and,they were used as a political football to be booted and booqd ateven when their numbers had dwindled to the point of insignificance.They were forbidden by the Alien Land Acts,to own land. Denied anormal family life by a court ruling that all Asians were aliens'ineligible to citizenship and hence not permitted the benefits ofthe family reunification aims under the immigration laws, they were _.,also denied the right to intermarry in many Western states.
Thus cowed And oppressed by the weight of institutionalizeddiscrimination, the Chinese worked hard within 'his circumscribedconfines, looking only to the day when he could be free to returnto his homeland. By true definition, therefore, the Chinese,wasnot an immigrant, but a transient - -a sojourner. Each generationdeparted these shores leaAng no roots that reached into American
-9-
2U

TABLE 1A
CHINESE IMMIGRANTS ADMITTED BY SEX AND AGE GROUP, 1962-1973
1962
1963
1964
1965
1966
1967
MTAL
IMMIGRANTS
4,669
5,370
5,648
4,769
17,608
;25,096
M
TOTAL
1,916
2,753
2,297
3,073
2,597
3,051
2,242
2,527
8,613
8,995
12,1311
12,285
Under 3 Yrs.
92
160
98
110
102
137
78
103
548
520
734
646
5-9 Yrs.
104
85
115
117
135
165
117
115
953
828
1,125
1,006
.10-19 Yrs.
.335
335
389
483
419
448
439
430
1,888
1,739
2,309
2,187
20-29 Yrs.
319
885
411
992
16
939
338
704
1,376
1,649
2,221
2,913
30-39 Yts.
232
409
407
509
554
611
438
398
1,817
1,480
3,310
2,329
40-49 Yrs.
210
306
256
315
355
312
293
'
294
998
912
1,528
1,223
50 -59 yrs.
278
311
262
3Q2
fkl8
277
226
274
532
904
879
955
60-69 Yrs.
279
192,
276
93
327
128
221
165'
355
630
514
683
70-79 Yrs.
61
54
77
51
86
32
82
41
13Q
289
160
288
.11080 Yrs. +
615
61
15
210
316
44
31
55
I-'.
1968
1969
TOTAL
IMMIGRANTS
16,434
20,893
MF
M
10".
"...
1971
1972
1973;
17,956
17,622
21,730
21;656
MF
MF
1.1
FM
I°
'TOTAL
7,862
8,572
10,001
10,892
8,586
9,370
8,287
9,335
10,437
11,293
Under 5 yrs.
399
450
-
686
622
437
438
396
390
617.
531
5-9 Yrs.
639
518
989
891
685
636
561
509
755
734
10-19 Yrs.
1,412
1,523
1,964
2,037
1,427
1,428
1,153
1,245
1,506
1,548
20-29 Yrs.
1,438
2,409
1,588
2,756
1,776
3,249
2,106
3,679
2,610
4,264
30-39Yrs.
1096
1,478
2,337
1,823
2,258
1,602
2,345
1,606
2,622
1,797
40-49 Yrs.
904
789
1,277
1,182
1,028
862
901
767
1,234
965
50-59 Yis.
530
645
'709
744
551
557
484
556
629
688
60-69 Yrs.
379
478
,-311
545
285
374
246
367
323
467
70-79 Yrs.
151
223
117
239k
-..117
177
87
171
'
112
239
80 Yrs. +
16
59
23
53
22
47
8'45
29
60
9,937
11,719
571
539
750
660
1,445
1,583
,2,537
4,058
1,981
1,630
1,164
1,045
765
1,119
526
743
174
277
24
65
Source:
U.S. Immigration and Naturalization Service, Annual Reports (Washington,
D.C.:.1962-1973, Tables 9.
3
TABLE 18
PERCENTAGE OF CHINESE IMMIGRANTS ADMITTED, BY SEX AND AGE GROUP,,
1962-1973
1962
1963
.1964
1965
1966
1967
AGE GROUP
Total (100%)
Under 5 Years
4.8
5.8
4.3
3.6
3.9
4.5
3.5
4.1
6.4
5.8.
5.7
5.3
5-9 Years
.5.4
3.1
5.0
3.8
5.2
5.4
5.2
4.6
11.1
9.2
8.8
8.2
10-19 Years
17.5
12.2_
16.9
15.7
16.1
14.7
19.6
17.0
21.9
19.3
18.0
17.8
20-29 Years
16.6
32.1
17.9
-32.3
12.2
30.8
15.1
27.9
16.0
18.3
17.3
23.7
30-39 Years
12.1
14.9
17.7
16.6
21.3
20.0
19.5
15.7
21.1
16.5
25.8
19.0
40-49 Years
11.0
11.1
11.1
10.3
13.7
10.2
13.1
11.6
11.6
10.1
11.9
10.0
50-59 Years
14.5
11.3
11.4
938
11.1
9.1
10.1
10.8
6.2
10.1\
'6.9'
7.8
60-69 Years
14.6
7.0
12.0
6.3
12.6
4.2
9.9
96.5
4.1
7.0
4.0
5.6
70-79 Years
'-3.2
2.0
3.4
1.7
3.3
2.0
3.7
1.6
1.5
3.2
1.2
2.3
80 and Over
0.3
0.5
0.3
0.0
0.6
0.1
0.4
0.1
0.2
0.5
0.'2
0.4
-4-I
------
1\D
ILA
1968
1969
1970
1971
1972
1973
AGE GROUP
- M
MF
MF
Total (100%)
Under 5 Years
5.1
.2
'6.9
5.7
5.1
4.7
4.8
4.2
5.9
4.7
5:8
4.6
5-9 Years
8.1
6.0
9.9
8.2
8.0
6.8
6.8
5.5
7.2
6.5
7.6
5.6
10-19 Years
18.0
17.5
19.6
18.7
16.6
15.2
13.9
13.3
14.4
13.7,,
14.5
13.5
20-29 Years
18.3
28.1
15.9
25.3
20.7
34-.7
25.4
39.4
25.0
37.8
25.5
34.6
30-39 Years
25.4
17.2
.23.4
16.7
26.3
17.1
28,3
17.2
25.1
15.9
19.94
13.9
40-49 Years
11.5
'9.2
12.8
10.9
12.0
9.2
10.9
.8.2
11.8
8.5
11,7
8.9
50-59 Years
6.7
7.5
7.1
6.8
6.4
5.9
5.8
6.0
.6.0
6.1
7.7
9.6
60-69 Years
4.8
5.6
3.1
5.0
3.3
4.0
3.0
3.9
3.1
4.1
5.3
6.3'
70-79 Years
_1.9
2.6
1.2
2.2
1.4
1.9
1.0
1.8
1.1
2.1
1.8
2.4
80 and Over
0.2
0.7
0.2
0.5
0.3
0.5
0.1
0.5
0.3
0.5
0.2
0.6
Source:
Table IA.

soil. In spite of the long history of the Chinese in this country,each successive generation had to-start anew without the benefit
of a foundation built by those before him.
The picture began to change alter World War II. The impetusWas not the repeal of the entire qdy of Chinese exclusion acts in1943--the 105-quota was,tantamount to exclusion and was so intended.It was the War Brides Act of 1946 that wedged open the door forwives of Chinese who had served in the Armed Forces of the UnitedStates. The tpurein Chinese immigration after 1946, shown inChart A, reveals that almost 90 percent of the immigrants werefemales taking, the first opportUnity they could to join theirhusbands in this country.
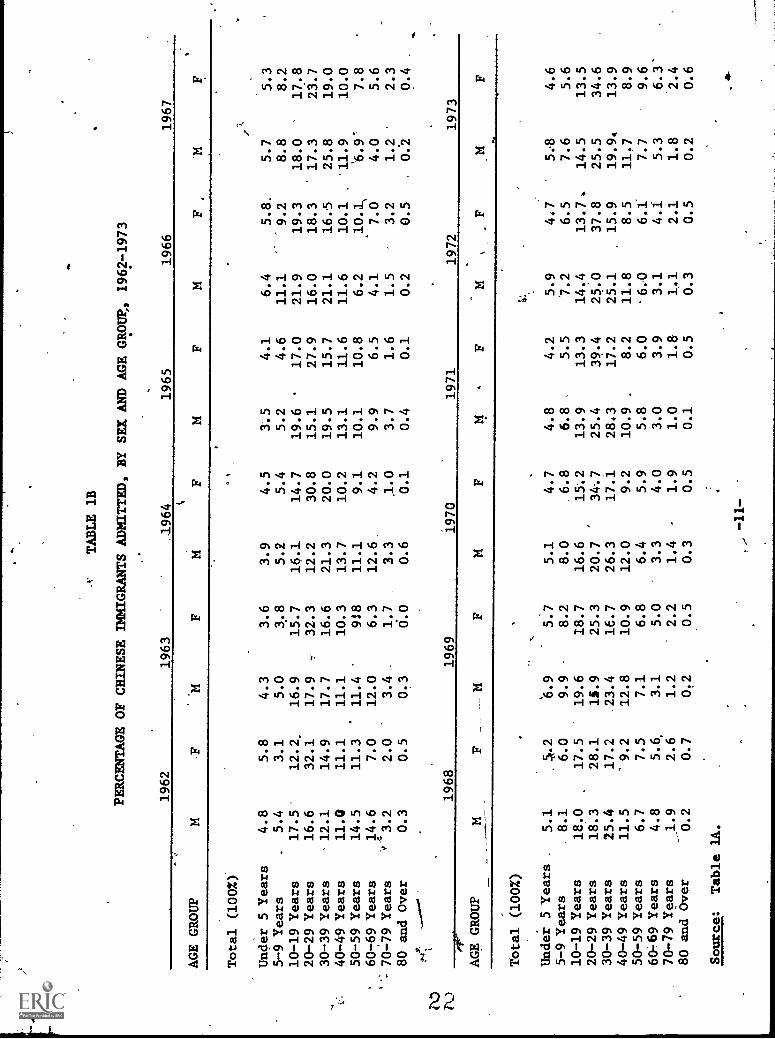
'Almost every year since that time, female immigrants haveexceeded males. The tremendous disparity of the sexes seems t'exert a magnetic pull that is still evident among Chinese immigrants,today. The proportion of females to males hovered around 9:1 formany years. It has declined, but as late as 1973 females still;,made up-54 percent of the total Chinese immigrants. (SeeTablesL& and 1B.)
The predominance of the female in the Chinese immigrationpattern has great imillications for the Chinese population-in this
country. Foi one, the genocidal policy of cutting off a futurenative-born Chinese generation was arrested. Children born of the
reunions made possible by the War.Brides Act are the emergingleaders of their people, and their outlook is entirely differentfrom that of past generations. The communities are now betterestablished by the presence of women and children, young and old,thus bringing about a restructuring of Chinese society into familiesrather than.comi6nal organizations.
Age Groupe
An outstanding.featUre of the Chinese female immigrants is
that generally one-fourth to one-third are concentrated in the.20- to 29-year' age group. This one factor has held constant formore than a decade. (See Table Le..) It probably indicates thatfemales are generally taken as'brides in China and then are broughtto the United States by husbands at least ten years older than they,for the largest age group for male immigrants is the 30- to 39 -year
one.,
The fact that Chinese immigrants consist overwhelmingly ofgrown adults has several imOlications. For one, these people are
already set iii their ways and outlook. In other words, adjustmenttakes longer than for the younger ones, and, most likely, there
will be a gravitation toward Chinatowns. Second, these immigrantswill need to seek a livelihood right away. Third, they are producers,rather than dependents, instead of adding to the taxpayers' expense'for schooling, they will join the.labor force directly.
Immigration below the ten-year age bracket is insignificant.The future young of the Chinese-American population will be theoffspring of the heavy influx of-young women and will be native-bbrn. At the same time, it is unusual to see men and .women intheir eighties immigrating to the United States. This is a definitedeparture from the past, when the old invariably returned to Chinato enjoy their latter years and be buried in the motherland; trafficnow seems to be heading the other way. These elderly do not seem'to be sitting in their rocking chairs, smiling benignly at theirlarge brood of grandchildren either. In fact, one-fourth of theChinese males over ,sixty -five are still in the labor force, andone-eighth-of the feMales in the same age bracket are, too. (See
Table 25.)
Intended Residence in the United States
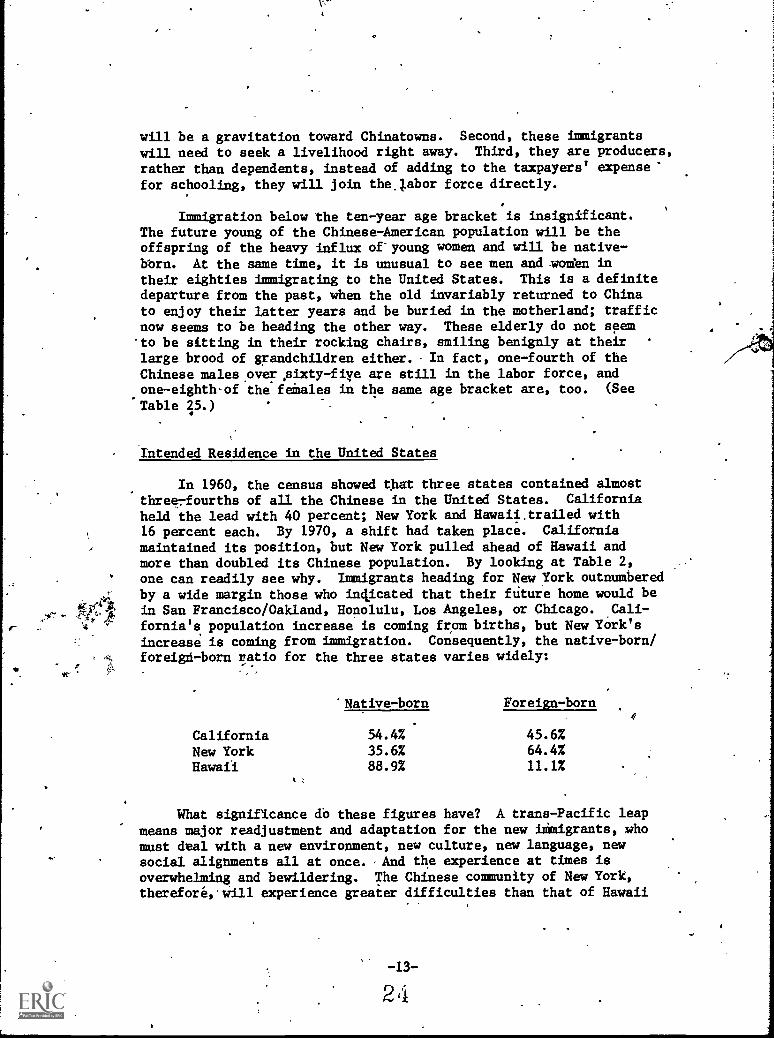
In 1960, the census showed that three states contained almostthree- fourths of all the Chinese in the United States. California
held the lead with 40 percent; New York and Hawaii,trailed with16 percent each. By 1970, a shift had taken place. Californiamaintained its position, but New York pulled ahead of Hawaii andmore than doubled its Chinese population. By looking at Table 2,
one can readily see why. Immigrants heading for New York outnumberedby a wide margin those who indicated that their fUture home would bein San Francisco/Oakland, Honolulu, Los Angeles, or Chicago. Cali-fornia's population increase is coming from births, but New York'sincrease is coming from immigration. Consequently, the native-born/foreign-born ratio for the three states varies widely:
'Native-born Foreign-born
California 54.4% 45.6%
New York 35.6% 64.4%Hawaii 88.9% 11.1%
What significance do these figures have? A trans-Pacific leapmeans major readjustment and adaptation for the new immigrants, whomust deal with a new environment, new culture, new language, newsocial alignments all at once. And the experience at times is
overwhelming and bewildering. The Chinese community of New York,therefore,.Will experience greater difficulties than that of Hawaii
-13-
24

TABLE 2
'
INTENDED CITY OF RESIDENCE OF CHINESE IMMIGRANTS, YEARS
ENDED JUNE 30, 1962-1972
San Francisco
and Oakland
New York City
and New Jersey
Honolulu
Los Angeles
and Long Beach
,,
Sacramento
IN.,
Seattle
C.31
.
Chicago
.`r
Boston
.
and Cambridge
Philadelphia
Houston
1962
1963
1964
1965
1966
1967
1968
1969
1970
1971
1972'
831'
853
764
799
3,621
3,233
1,827
2,502
1,845
968
1,696
s'
999
1,010
957
817
3,336
4,624
3,029
3,364
2,776
3,263
4,839
93
113
89
.90
'
303
294
220
369
385
242
334
.4
,
210
257
241
262
865
1,300
772
.938
743
802
930
76
76
77
87
402
353
146
223
163
107
146
66
88
122
55
207
301
224
251,
158
150
199.
88
161
206
104
306
754
386
407
'367
402
661
75
104
110
100
337
,3418
308
252
206,
,223
241
33
'
34
'
47`
22
82
167
119
136
99
135
184
42
44
37
34
124
175,
121
155
184
106
177
Source:
U.S. Ina4gration and Naturalization Service, AnnualReports (Washington, D.C.:. 1962-1972),
Table 12B.
-14-
^.
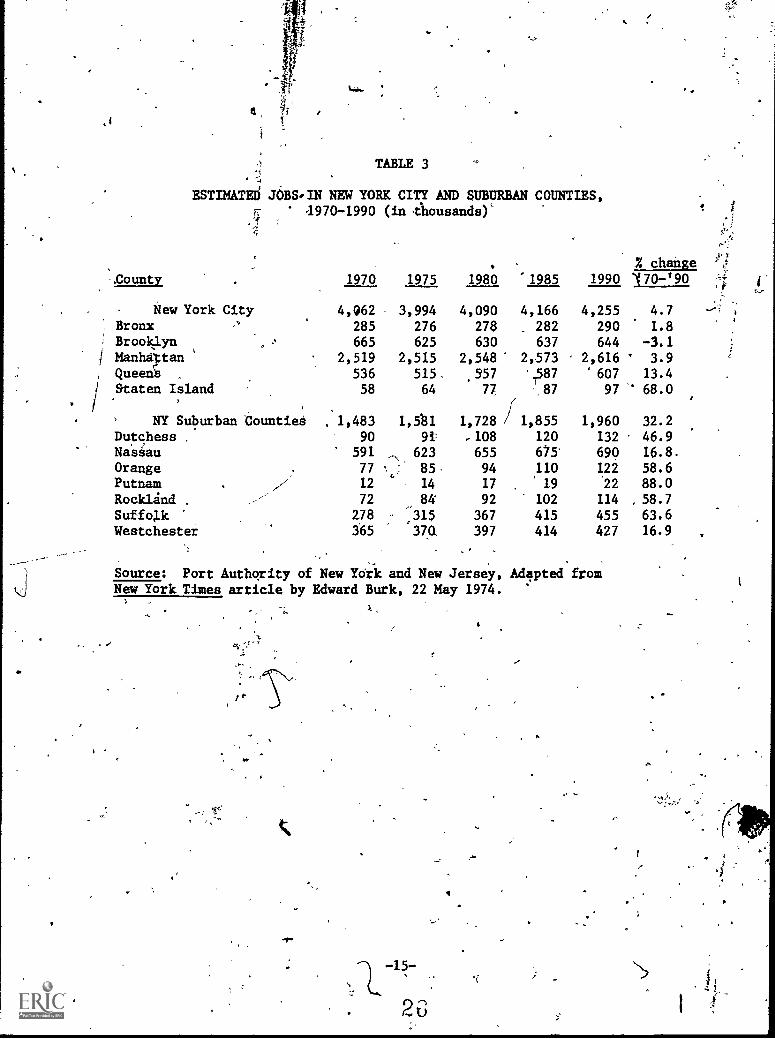
TABLE 3
ESTIMATED JOBSIN NEW YORK CITY AND SUBURBAN COUNTIES,' 4970-1990 (in ousands)'
"1!
`.County
New York CityBronxBrooklyn
i Manhattan 'Queens .
iStaten Island
NY Suburban Counties .
DutchessNassauOrangePutnamRocklind ,
SuffolkWestchester
I change1970 1975 1980 1985 1990 170-'90
4,Q62 3,994 4,090 4,166 4,255 4.7285 276 278 282 290 1.8
665 625 630 637 644 -3.12,519 2,515 2,548 2,573 2,616 ' 3.9
536 515 .557 .,587 607 13.4
58 64 77 87 97 68.0
1,483 1,5/31 1,728 1,855 1,960 32.290 9i .108 120 132 46.9
591 _ 623 655 675 690 16.8.
77 85 94 110 122 58.612 14 17 19 22 88.072
,84 92 102 114 . 58.7
278 315 367 415 455 63.6365
,
370. 397 414 427 16.9
Source: Port Authority of New York and New Jersey, Adapted fromNew York Times article by Edward Burk, 22 May 1974.
A;

V
4
a
t!.
4
-16-
INHong Kong
ungahan
MAP 1
tr.
KWANGTUNG PROVINCE (S
th China)
Area Around Pearl River Delta'frim Where
Most Chinese in United Stites Emigrated
ot
Source:
Adapted from map by H. Mack Lai in
Thomas Chinn, History of therChinese in
California (San Francisca:. Chinese Historical
Society, 1969).

t
or California because of its larger percentage of newcomers,especially in view of, the fact that cities like New York arelosing jobs rapidly to the suburban areas or more likely toother areas of the country. (See Table 3.)
4
Where Are They Coming From?
Iii the past, Chinese immigrants generally have originatedfrom the area within a small radius of the mouth of the PearlRiver near the city of, Canton. To be specific, the county ordistrict of Toishan and three or four districts adjoining it arefountainhead. To ascertain whether Chinese immigrants are morediverse in their place of origin now or whether these places arestill the main 'sources of immigration/tO the United States, acount was taken from the data of a study now underway by theChina Institute. Of those indicating their-hometown,'48 percentof those surveyed in 1972 were from Sze Yup, or the four districts,and 30 percent were from Toishaa itself, 12 percent were from thecity of Canton. In other words, Chinese immigrants are stillpredominantly Toishanese, but those from other areas and provincesare increasing. ,
The immigrants hail from the abovementioned districts inmainland China, but they e6bark.Eront Hong Kong because an exitvisa is difficult to obtain from the Chinese government. An exit
vigais also required to leave Taiwan, and immigrants to the United`States from thisisland constitute a growing pioportion, thoughnot as great as that from the Pearl River Delta. These two groups
speak a different dialect, and their backgrounds are quite dissimilar.
Occupations
%ecause of such-past immigration barriers to this country as
exclusion, circumvention of the laws, detention in quasi-prisonslike Hilis Island or Angels Island, only the laboring classes wouldSubject themselves to the indignities of trying to gain admissionto the United States. What*Chinese of any wealth, position, back-ground, or educational attainment would come to the United States?Hardly any. Not until the 1950s was there any shift in the emphasisfrom brawn to brains.
The very early immigrants were mineriand farmers and railroadlaborers. Then followed thd service workers and, operatives, whoperpetuated themselves in the laundry and restaurant business until
recent times. Today, of those. who indicate their occupation intheir application, for immigration, the largest percentage are
pro--, fessionals and technicians. Thiscan be verified by the figuresd
c
28

TABLE 4
AllocanuirmAT..mp ADMITTED FROM CHINA OR, HONG KONG* AS REGION OF BIRTH, BY MAJOR OCCUPATION GROUP, 1950-1972
As
:A*
.
4..
Number
Year
Admitted
mC
.;I-
1el
tici
-t 4
>O
.8 a
;ck
0E
l0
01-1
adt
74^0
74^
P4
4-7.rb
00
40_0
kt
'4
rx, cif
I
.i
..8
0;C
.
II' .
8t';
0tn
4W
to4.
)
...,-4-
kla uu
0a
0a
k 0
cdE
lk
0a
4 1-
1.8
fti
is.r
..
0 0
co 0
0 -s
41
'VI
-4 Cd k
ed. e
dcd
0ta4 A
o tu
lia 0$4
0 rt., 0
$4
0o0
co 0
tcl
rx4
.8.
8c0
r2
84 M
.rl A
0 M
0Wk
1950
1951
192
1953
1954:).
1955
1956
1957
1958
.
1959
1960
1961
--.\......
1-,494
1,821
1,421
1,536
2,770
2a05
4,450
5,425
-3,213
342
5,722
844
3,681
475
3,213
625 f
83
106
70
66
95
,118
.* 551
1,029
50
.52
78763
279
4o
182 22
'
1, 2 10
___ 3
32
12 4
--=
,
-12.
1
12 4-
9
21,
16
15 33
43
119
*.
250
l08 6
231 9
2 198'6
39
99
35
17
35
52
214
392
1015o
233
.60
155 26
94
51
7
47 3 5 2
a7 44
67
29 5
65 4
33 2
15 3
"
,
11
58
14 3
12 7
60
25
- --
68 2
63 1
36___
2
13 9
16
24
16
64
74 38 1
196 2
245 2
152 3
1 1 6 2 it
.6
44 9
22 1
26 1
37
.18 4
3
18 4 5
18 36
110
321
235 3
388 6
386 6
255 4
2 7 1
22
12
10
- --
20
___ 9
10
___
2 3 2
___
- -- 1
27
14 9
.........
16
..........
34
............
18
1,336
1,451
1,251
1,407
2,547
2,405
3,163
3,145
2,043
224
3,680
696
2,177
392
2,231
532
(continued)
'From 1958 on,top figure refers to ChinatineludingTaiyan,andbottom figure refers to Hong Kongc
-18-
q

TABLE 4-- Continued
.8I)
toc.
)a
ti,
a).8
a;'il
::4;
a).8
ti;st
;8
ti;a;
.
1to
R.;
.,
4C
OE
l0
..-1
iJ P
p0.
,c:$
o gt
'Ai .
P1
Pr
1-1
.04)
r: g
iNumber
al
-2
^G4
0r.4
r.4
iJr;cd
cda)
.1-
'p
.8A
iiN
W 0
.; k
.r.
r.4
rdto
CD
4).S
4S
-i rd
0. r
d1-
11-
1gt
' 0Year
Admitted
M0
gt,
1 g
rZi r
Zi
Ei>
Ma)
a:r4
01
alS-
1 0
g), a
.11
r-i
t C;
tAr?
.,8 'c')
0 X
0A
'al
.80
cia
c$3.
4). M
.2c/
a 0
pirZ
i 814
. 196
24,
017
270
323
9-168
26
62
233
III
66
332
5'
27
2,586
652 '
44
___
10
39
42
21
7.
......
...54
3.
'
1963
-4;6
58712
-
5223
160
38
43
254
57
336
924
.2,797
712
96
- --
748
82
64
7__
_53
4,
-1964
5,009
1,014
6307
157
19
ho
207
12
382
14
13
2,838
t39
53.
13
42
5-
-.1
8- --
517
1965
4,057
.281
27
307
143
62
59
287
.20
473
14
12
2,372
712
79
- --
937
51
73
11
1__-
559
1966
13,736
1,142
30
573
585
213
251
1,386
133
1,884
34
88
7,417
3;872
'
-139
___
15
42
13
929
437
,1
3,583
1967
19,741
3,924
23
851
739
184
349
1,298
251
2,023
27
155
9,917
5,355
403
358
141
33
16
52
15
84
37
4,540
1968
'
12,738
2,536
18
539
481
107
221
603.
345
1,091
23
6-
-__
105
,069
3,676
344
169
103
26
19
28
13
484
53,036
1969.
,'15,440
2,688
15
569
64o
199
445
706
519
1,253
5,453
194
_-_
48
82
17
19
29
23
-37
17
300
8,o8
116
4,96sr
1970
14,093
3,715
18
544
,6o3
237
325
575
218
980
13164
6;801
3,868
209
36
97
18
22
44
'
547
315
3,367
1971
14,417
4,108
4458
541
132
349
610
127
1,145.
16
556,
872
3,205
184
124
106
23
12
62
244
--:.
22,745
1972
17,339
4,060
1672'
746
196
464
971
229
1,513
22
145
8,320
4,391
203
-46
117
21
'
16
94
465
-6
3,819
Source:
U.S. immigration and Naturalization Seivice, Annual Reports
(Washington, D.C.: 1950-1972).

put out by the Immigration and Naturalization Service, by a directtabulation of applications fyom thetong Kong Consulate, and by a'"gpecial tabulation of the 1970 census. This preponderance ofprofessionals also holds true for immigrants from other nations.
Especially since 1966, the professional and technical categoryhas exceeded the other occupational groups by a wide margin. TOa large measure this is dictated-by,the preference system of theImmigration and Naturalization Act that gives'priority to thosewith needed skills and training. On the other hand, it is alsoasreflection of the flight of the intelligentsia_ and monied classesfrom China Taiwan and Ho Kong following the dverthrow of theNationalist government and the takeaver'of Mao Tse-tung in 1949.A highly elite corps of formtr officials, and experienced personnelin business, technology, and-education sought political refuge inthis country,and this group has contributed immeasurably to theadvancement of science, medicine, art, and the understanding of-China. Thousands of these refugees now teach in-the Ameiicancolleges and universities, and thousands more are in private industryand enterprises. Since 1949, over 20,000 Chinese have entered the.country under the various refugee relief acts. (See Table 4.)
Brain Drain:4,
From the American point of view, the high caliber of recent ,
Chinese immigrants is a positive factor because the human resourcesof a nation are its most valuable asset, but, from the point ofview of the emigrating nation, it is an incalculable loss and whatis popularly termed a "brain drain".
. The anomaly -of the situation is that the brain drain is notalways reflected in the official immigration figures. Many Chineseare admitted under-nonimmigrant classifications -as officials orstudents or visitors. Afterwards, their status is adjusted topermit them to remain in this country.
Chart B shows the number of students from China ands Hgng Unixadmitted to this country over the past ten years. It increasedfrom 2,045 in 1963 ,to 8,194 in 1972. Taiwanese students are includedin the figures. These students must be college graduates, overtwenty-two year old, and, if male, have completed their militaryservice. Most must qualify by highly competitive examinationsbefore they are permitted to go abroad for higher study. To usea cliche, these students are the cream of the crop. Their familycircumstances must also be shove average to enable their parentsto support, sons and daughters abroad. This is no mean feat,considering the unfavorable rate of exchange between Hong Kongor Taiwan dollars and American currency. The students- are more
-20-
3 if,
0

CHART ,B
0
STUDENTS ADMITTED TO THE UNITED STATES FROM HONG KONG AND CHINA*
1963 to 1972
YEAR HONG KONG CHINA TOTAL
1972 4,633 3,561
1971
1970
1969
1968
1967
1966
1965
1964
1963
3,954 3,014
3,336 , 3,400
2,412 3,082
1,673 2,306
1,287 2,127
1,202 2,713
' ,895 1,995
854 1,674
,831 1,214
Hong Kong . Chind
6 4 '2
(In Thousands)
0
8,194
6,968
6,736
5,494
3,979
3,414
3,915
2,89a
2,528
2,045
Source: U.S. Immigration and Naturalization Service, Annual Reports(Washington, D.C.: 1963-1972).
*China includes Taiwan, 4
U,

inclined to be males because of the traditional emphasis placedr upon giving males in the family better educational opportunities.
Students of Chinese descent originating from Southeast Asia,Cana* or Latin America are tabulated separately under their countryof origin. In. the United States, these students tend to identify,more closely with the Chinese population than with the country
'that issued them a passport, but they are not counted in the totalsof Chinese students.
Of those who leave Hong Kong, mainland Ching, and Taiwan,how many remain in this country? My information is taken fromtwo studies: "A New Estimate, of the Student Brain Drain fromAsia," by Tat K. Oh,1 and "China or Taiwan: The Political Crisisof the Chinese Intellectual," by Shu Yuan Chang.2 Mr. Oh basedhis deductions on a survey of Asian students on the campuses of theUniversities of Wisconsin and Minnesota. His estimate of thosewho did not plan to leave the United States immediately upon completionof their studies was approximately 8(k percent at the highest, and46 percent at the lowest. Ms. Chang's study included intellectualsas well as students. When queried whether they would like to remainpermanently in the United States, only half said yes. Ten percent
, were undecided and 40 percent said no. 'Yet Ms. Chang found that,/ only 2 percent to 6 percent of the Chinese students from Taiwan`actually.went back during the years 1962-1969.
This discrepancy is quite revealing. Many do not intend ordesire to remain, but they stay on anyway, hoping that politicalconditions in their homeland will improve so that they can ga home.These students or intellectuals have tasted freedom and want tolive under a more democratic form of government. This is one ofthe main reasons why they6prefer the United States to their motherland.3
-, Objective: Family Reunification
.'
.
Glancing back at Table .4, one sees that the column on theright, labeled "No OccupatiOn," is consistently/he largest
oportion of the Chinese immigrants. Take the year 1970 as anexample: 17,961 persons were admitted;' 10,168 sai4 they had no
1. International Migration Review, 7(1972): 449-56.
2. Amerasia Journal, 2(Fall 1973): 47-81..
3. Ibid.'
-22-
a3

occupation. Of these, 5,051 were under nineteen years of age and742 said they were over sixty. (See Table' IB.) Of the remainder,no doubt, most are womenwives and mothers who keep alome fortheir families. From these figures, it is obvious that well overhalf of thelimmigrants from China and Hong Kong are not immediatecontenders in the labor market. But they lend stability to theChinese community by immigrating as part of a family unit or tobe reunited with family members already in the United States.Immediate family members such as spouse-and children are entitledto enter the country without charge to the quota. Table 5 showsChinese immigration by quota and nonquota. One can see a steadyand consistent decline in the nonquota column, indicating that
. the objective of family reunification may soon be achieved andthat most future Chinese immigrants will be coming in under thenumerical limitations and preference categories of the quota.
In essence, then, Chinese immigration consists of two majorgroups, both of which directly reflect the immigration policy ofthe American government. At one extreme, we have highly qualifiedprofessidnals, screened under the third preference, who, in all
probability, are somewhat conversant in English. The other extrememirrors the family reunification goal. This latter group consistsof relatives of former immigrants. In general, the latter grouphas a lower educational and socioeconomic background. By andlarge, the do not speak English and will have greater difficultyaccommodating themselves to life in the United States.
Work and Pay
Among the conditions upon which a visa is issued to an immigrantare that hekhaveoa sponsor and can demonstrate'that helfill not bea public charge. In other words, he must have an offer-'of employmentfrom an employer and certification from the United States Departmentof Labor that his line of work'does not compete unduly with jobs,of American citizens. The Department of Labor also requires thathis skills or training be in short supply or in demand in thiscountry. Consequently, most immigrantewill not be unemployed.Their primary problem is underemployment. For instance, alormerofficial in the Chinese government with years of technical experienceto his credit accepted a draftsman's job, primarily because thatfirm offered to sponsor him. There are innumerable other instancesof former doctors, teachers, accountants, engineers, et alia, whotake jobs as janitors and waiters when they first arrive. Some stayin the rut because of language problems or because they are afraidto venture out and compete-vigorously in the job market. For others,it is a matter of time before they can utilize their knowledge andskills in the profession in Which they were.educated.-
-23-
CLV'0(14
4
'David S. North, in his study.of "Immigrants and the American. Labor Market," found that upper occupational level immigrants
generally moved lower and the lower occupational level immigrantsgenerally moved upward right after arrival in this country. Thecrucial factor in job success was command of the English language.4
In the case of the Chinese, although a 'concentration towardthe lower pay scale can be seen for recent immigrants, an isolatedfew have already penetrated the $20,000-plus level.
illegal Entry
Not too long ago, my husband and I were invited to speak tothe alumni of the Young Presidents Association. A question wasput to me: "Aren't many Chinese presently in the United Statesillegal entrants?" "I know three chefs," said the man in themelon shirt and white jacket, "and they all jumped ship."
To people all over the World,'the magnetism of the UnitedStates is very strong. The appeal comes from the freedom enjoyedby those within its boundaries, the better educational opportunities,and the economic advantages. To those who must wait interminablyfor a visa issued-within the quota limitations, there is a temptationto enter the country by. illegal or extralegal means:
In the past, illegal entry was fairly'commonplace becausethat was practically the only way to gain admission to this country. .
The detection was so great that the Chinese refrained fromany pub icity or visibility. Illegal entry is not as widespreadtoday. The Chinese can enter as bonafide immigrants and thesemake up the larger numbers. Violators of the immigration lawsgenerally fall into the categories of visitors, students, andcrewmen. These people are admitted to the United Statea as non-immigrants. In other words, they enter the country for a specificpurpose, and they are requiredto leave after that purpose isfulfilled. There is-an-increase in the number of illegal nonimmigrants.. '
In 1972, 64,400 visitors from China came in as tourists or for abrief visit, and most departed. The table shows us that apprOximatel'600 who were apprehended overstayed-their y_iait. _This may have beenintentional or inadvertent, but the numbers who violated theirstatus are small in relation to the numbers who came. StUdentswho stay on after they have finished school are more nuperons.By and large, these students file quickly to readjust their statusto permanent resident so that they will not be'in violation of the
4. Op. cit., 31(Washington, D.C.: U.S. Department of Labor, 1974).
-247

TABLE .5
QUOTA AND NONQUOTA IMMIGRANTSFROM CHINA AND BONG KONG,
Year
1963-1972
Quota Nonquota
No. X No.
1963 367 6.8 5,003 93.2
1964 333 5.9 5,315 94.1
1965 1,152 24.2 3,617 75.8
1966 12.900 73.3 4,708 26.7
7967 19,712 78.5 5,384 21.5
1968 12,386 75.4 4,048 24.7
1969 17,258 82.6 3,635 17.4
1970 14,699 81.9 3,257 18.1
1971 14,598 82.8 3,024 17.2
1972 16,546 85.2 2,881 14.8
Source: U.S. Immigration and Naturalization Service,
Annual Reports {Washington, D.C.: 1963-1972).
TABLE 6
4
CHINESE FOUND DEPORTABLE BY VIOLATION OF STATUS, 1963-1972
Year , Visitor Student
1963 238 282
1964 265 293 I
1965 -339 431190 388 618
1967 507 779
1968 588 992
1969 554 953
1970 550 705
1971 534 828
1972 605 456
Crewmen
1,9792,1823,0682,8551,9633,2325,2633,5192,9104,692
Source: U.S. Immigration and Naturalization Service,Annual Reports ('Washington, D.C.: 1963-1972), Table 27B.
-25-
38 .

immigration laws; Since 1973, when a new immigration ruling wentinto effect, students from Hong Kong have found it more difficultto adjust their status. Jumping ship is. the popular term used forcrewmen who do not leave the country when their shore leave is up.In other words, they enter the country when their ship (oz plane)lands. For some, their overstay is, unintentional: they cannotfind another vessel to ship out on before their leave expires.Technically, they are in violation of their immigration statusanthare subject to deportation. (See Table 6.)
Those crewmen who evade detection and remain in the countryfind themselves in a very precarious set of circumstances. They'find it hard to obtain employment because they cannot work withoutthe green card, which verifies that they are legal immigrants
/admitted as permanent residents. As a rule, these crewmen do nothave family or kin to turn to, and the majority are not from theprovince of Kwangtung or from the Canton area, so they are lookedupon as outsiders by the more homogeneous Cantonese.
These crewmen are the favorite targets of zealous immigrationagents who swoop down on a restauran or Chinese establishment and
-:-«aine up all the Chinese wiphin for 0pection. If they cannotproduce green cards on the\spot, they are detained or taken intocustody. These tactics subject the Chinese to harrassment andfear. Many do not understand the immigration inspectors Susdo,not know what they are after. Others do not know that suchsearches without warrants are illegal and a violation of theircivil rights. they are just plain scared out of their wits, evenif they have nothing to hideor fear.
In his article, "The Illegal Alien: Criminal or EconomicRefugee?"5 Austin T. Fragomen asserts that approximately 2,900Chinese who.entered the country without inspection were, deportedin 1973. Presumably, these people were smuggled in. How thiswas accomplished and how they were apprehended as entering withoutinspection are not known. The rate of apprehension is quite hightestifying to the efficiency of the Immigration and NaturalizationService in apprehending Chinese.
Here to Stay
Unlike the Chinese immigrant in bygone years, today's immigrantis here to stay. This fact can be ascertained.by the increasingnumbers who apply for citizenship. The jump from 2,800 naturalized
5. Op. cit., (New York: Center for Migration Studies, 1973).
-26-

in 1971 to 9,056 in 1973 attests to the eagerness with which theChinese immigrants are becoming citizens as soon as they fulfillthe requirementa. (See Table 10.). The reason why the numbersare not greater than they are is that there is a waiting periodof five years before citizenship can be conferred. Large-scaleChinese immigration was not possible before 1965., The bureaucraticprocess and red tape add to the interval between setting foot onAmerican soil and the issuance of that prized piece of naturalizationpaper., ,
re.
4
2,
, -27-
48
SUMMARY OF FINDINGS*, ,-- ,r- _it-- ,,.- . :t.44f ..,. .."
,e'1. The,first,love of Chine immigrants were pioneers of
the American liest.,k=',- ,
2.1 In spiv of its long history, the Chinese-American"population has continually been a first-generation one made upspredominantly of adult males. This distorted population picture-was brought about by sixty-one years of Chinese exclusion andtwentyriwo more years of restricted immigration.
3. The impact of the Immigration and Nationality Act of1965 on the Chinese-American community has been tremendous.
4. The Chinese are the fourth largest immigrant group inthe United States today. they are fully utilizing their national ,
quota of 20,000 annually.
5. Since 1946, Chinese immigrants have been predominantly.4
female. About one-fourth of the females fallwithin the 20- to29-age group, and one-half within the 20- to 39-age group.
6. Male immigrants are older. The largest age group is
30- to 39-yefrs old.
7? Whereas former immigrants were from the lower socioeconomicclasseS, today's immigrants are gradually shifting toward theprofessional and technical classes. .
8. Approximately one-half of the immigrants do not indicatean occupation. In all likelihood, these are housewives whodidnot work outside the home in China.
',#, 9. The Chinese immigrants are still a fairly homogeneous,
group hailing primarily from the Canton area, but this homogenietyis being diluted. ,
t J
10. By the shifting of the proportion between quota andnonquota immigrants, the effects of governmental policy towardfamily reunification may be leveling off and the upper limits ofChinese immigration may stabilize around the 20,000 national clodta..
/
11. Crewmen are the most =common violators ofthe imMigratiOnlaw's, according to the,41migration and Naturalization Service, butthe rite of apprehension is high. .
'0
12. Today's Chinese immigrant is no longer a sojourner. Heintends to put down roots in this country and to make it his home.
-28-
30

(
RRC0M)RKNDAT0NS
The f show a sharp increase in Chinese immigrants within
the last few years along with 4 drastic, change in'the type o men
and women who come\to the United States today. ,The immigrant j*
yesteryear was expected to come in at'the bottom of the occupatiopal.scale and work his way up. Todai's immigrant is screened fin. his
education;and skills, and he cannot tie expected to start atAthe
lowest rung, in the economic ladder., Yet he may be handicapPed by-
unfamiliarity with the American ways, by language problems, perhapier,
by licensing stipulation and citizenship'requirementa: The Eiltuatial.
creates a manpower anomaly which call e. for sameadjustient betWeen
the high caliber of recent-immigrants Ind the bottobt-rung jobs that
immigrants are expected to take. ,
,
It is obvioui that some' realignment is necessary it the
immigration preference system. Is the United,States to be a.
haven only for cheprivileged and'theesich? Is:it-fair,to the
world's developing countries to siphon off the cream of..their r
sons and daughters? 'The third and sixth preference quotas should
be utilized to aim for a more equitable mix of rich and pobr,.
male and female, ydung and old, and not be-restri4tddprimarily
to the highly skilled or educated and to*thode who can show that
they have at least '$10,000 in the bank to-bring, into the UnitedStated. , 41
pr t
Since 1949, 216060 Chinese have been admitted'to thiSI:countrY. an
The sudden influx, especially since 1965, has'taxed the facilities .
of the Chinese-American communities, if not overwhelmed them
completely. In trying to absorb this influx, the Chinese commimities '
have suffered severe dislocation.
Note 61e Cuban Refugee Program and its success in.assisting
Cuban refugees to resettle, to find jobs, or.tO obtain temporary" :
welfare aesistance,to bridge their period oftransition. Approxi-matay 450,000 Cubans were aided at a cost to (the federal governmentr
of $412 million. The program has been hailed as &prime exampleof how-government seed money can'be utilized to advantage, for,
in aiding these people in their transition, 5he economy of those
placer where the Cubans have resettled has benefited considerably.
. .
In one instance, we see a large group of'Cuban refugees
resets ed successfully with government aid. In the case of the
Chin se, wenee a group. heracallyistruggling to get on it feet
but plagued with problems of,overcrowded housing, underemplo went,
. juvenile delinquency and personal maladjustment.
-Why ,the differential treatment? Proponents of the Cuban
c
R
t
I
, .
Refugee Program cite humanitarian reasons, an anti- Communist stance,as well as the fact that it'.was something done to assuage a. nationalguilt conscience. If so, greater 'retribution is due the Chinese.
fot neatly a century of discrisanatcry and shameful immigration.practices against themi. In this period of transition and readjustmentfrom years of population imbalance, it is imperative that'soiecognizance be -taken of the immigration difficulties that the
Chinese communities are now experiencing. At present, the ChinaInstitute in New York;is conducting a more in,-depth study of recent-Chinese immigrants. Their-findings should shed more light on the',.,specifics.
p
V
a
30-
41
r

0.
-oroap,_
CHAPTER 'II
FOREIGN-BORN AND ALIEN
A
, .-John P. Kennedy,, thirty-fifth President of the United States
entitled, a well-known book of his A Nation of ITorn-ttants. That weare a nation of immigrants, is an .accepted fact, and the 1Chnnedysare an outstanding example: In 1848, Patrick kennedy, a penniles'sIriitbman from,Wexford, arrived in' Boston. His son became a saloonkeeper. His -grandson earned millions in Wall Street and became the
. AViassador to the Court of St. James. His great-grandson--became the Tresident of the United States. In four. generations,
.
the Rennedys had come from the bottom .and, gone to the top... .. t
c
:To 36,'-an. Immigrant Is to Hale One Strike Against 'You
Apparently, being an immigrant was for some no great disadvantage,,and a-- '''naturalized citizen presumably enjoys all the rights andprivileges of an American-born': except one: eligibility to be thePresident_ Or vice-president of the United States. But lit is obViousthat ,-a foreign-torkpesscriilias greater hurdles to thawailativeobalm, even if the Constitution does guarantee equality 'under'the
. ,
In chaper I,:we, mentiOntid that most Chinese immigrants areadults in thei*.,tweitties or thirtties. These people have, grown up ',
;.'105W, at different culture* ifi a ,differene milieu. Their' languageChinese and their ways are firmly Molded: Higratidn, totheM,
.., is _Yanking up,.deepry imhedd toots_and'Ir,ansplant,ine them' in, -''toots.'',f-,..',--foreign soil, a -trsiimati4.- erience that requires' a ",tremendoua,
. -. ,..-,,...'.' ''amount of readjustipe4t. , ,
, . . ., . . . ., , .,,,. e ..,
I
,jranY:Chinese.are political refugees who have given up all ' :174:
their worldly '-possessions and have aperienced,Persoilal tragedyin their-,,lives. 'ThoUgh in midlife, they are. starting, froth
To, be .i-chixtege immigrant is to have .one :Strike against'you. Redemption- lies. in the hopes- and "dreams'. that., fhe.iiewootherathink this country,.wili',Offerthem.

I.
Nativity,
. Each decade since 1900 has seen an increase in the percentage
of native-born Chinese in America and a corresponding decrease inthe percentage of foreign-born. -The year 1970 was an exception to
this trend.
TABLE 7
NATIVITi OF CHINESE IN THE UNITED STATES, 1900-1970
Native- ,.Foreign-
Year Born Born
°
19001910
19201930190
, 49601.970
10i,21%
304152'536153
-90Z
79%705948-473947
o
-"!"-177:.
Source: tr. S".,' Census-Bureau, Decennial Census 0900-1970)
The winds.have changed, and it is my contention.thit. the.1980
dieennial.C'enens -Will show a greater percentage of ;foreign-born
Chinese 'for two basic reasons. The Chinese birthrate is 1.57-
-less thin...;theiiplacement rate of 2.1. Each year'.frOm, 6,000 to
7,000 Chinese babies are born (See Table- BA)--; 'Whereas annual
atiOn"fromrChina runs close to 20,000. There, is no question
that iie Chinese poi:diet/on in the United States 1411 be sustained
by`;-*,4ration and not by native births.
Tii..4:native-borri/foreign-born-proportionkvalY greatly from
atate";t'O. atate, In New York, the percentage. of .f oreign7boin runs
'.Aas high as 64. In Hawaii, it is 11, petcent.".-,. ;In California, it is
"46 .percent.r
Xre actualityp, the ;proportion of foreign-bOrnIa greater than.
it seems, due to the way the Census Bureau defines native-born.
. ,,, The :Census Bureau includes in the category-of native -born, people
7-, bor abroad who have at least one parent who: is an American citizen.
4n'other words, if a person were born in China but h4'father claimedAmerican citizenship,.. he would be classified as natiWe-bOrn: ,
derivative citizenship was the channel whereby molt Chinese. effected .
entry into this country despite the exclusion laws: Until" the late, ,
-32-
.."
r
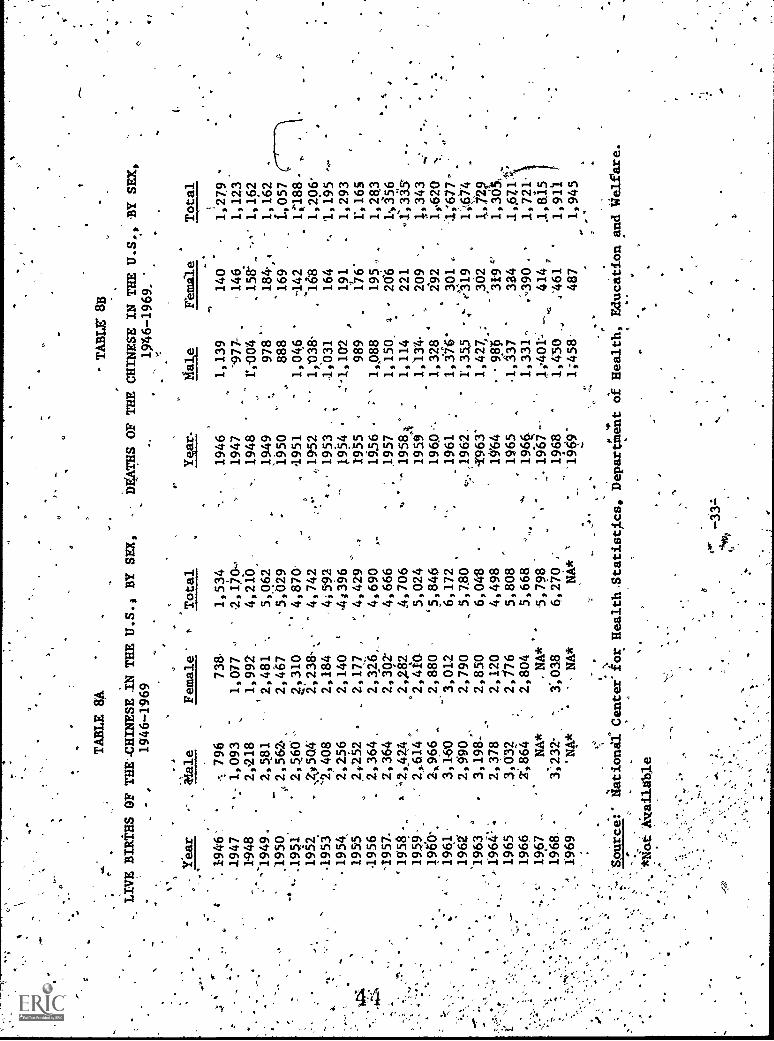
...
-
TABLE a4
_.
,
...LIVE BIRTHS OF THECHINESE iN THEU.S., BY SEX,
.,
1946 -1969
t.
TABLE 8B
DFATHS OF THE CHINESE IN THE U.S., BY SEX,
1546-1969.
-Year
.,...,
. 'Male
Female'
*Total
Year.
Hale
Female
1946'.
1947
1-948
.-.796
'
,..-1,093
2,218
738
1,077
.
1,992 ,
1,534
'
,170
4,210
1946
1947
1948
1,139
-
ro3o4
140
-146.
158'
'1949.
2,581
2,481
%5,062
1949
978
184,4
-
'
.1950.
-.=2,56.Z
.2,467
'5,029
'-
1950
888
169
.1951
''
2,66
Z,310
''4,870
.951
-
1,046
'
-142
1952
, 2 004
2,238-.,-
4,742
,I952
1,'038-
'108
I95j
`2,408
2,184
-4%592
,-. 1953
;1,031
164
-1954,
2,256
2,140
'
-4096
1954
,191
.
1955
2,52
.2,177
,".. 4,429
'"
1955
.989
.1176'
956
.2,364
2,326,_.
4,690
1956
1,P88
195
-1957.
2,364
2%302
.4,666
1957
1,150_
420%
` 1558.,
k '-2,424
.4,706
1958.4C
1,114
221
1950-.'
190'0%
.' 2,614
2%966
..,
.22.8.2
2,410
2,880
5,024
'5,846
1959
1960-,
I 134-
*
1,328
4209
292
1961.
3,160
3,012
6,172
.1961
1,3i6"
qoi
1962
"
2,590
2,790
5,780
1,355
":"
/319
1963
3,198:
2,850
6,048
/963'
1,427,:
302
2,378
2,120
4,498
19'64
3194'
1965
_3,032
2,176
5,808
1965
1,337
-
334
1966
2;864
2,804
5,668
..-390.
1967
1968.
NA*
3;232-
-NA*
."
,3;038
5,798
6,270
.-
1968
'1;401:
1,450
-,
414,
.461
1969
'NA*
',NA*
NA*
'
'1909"
1;458-
487
'
liationif Center" for
*dui
Mai
labl
e- z-
.1
Total
1279
1,123'
1,162
1,162
1.,057
1,7188.
,
1,206'
1,195
1,293
r,16s
1,283
1056
4,335
1,343
1,20
4;677,'
404
.
i.
1., 7
21,305,,
14)712'
1,721.
.1,f115
1,911
1,945
e
Health Statistics, Department of Health, Education and #elfare.
-
a

4
AJ
STABLE 9
f".4
NATIVE -BaN AND FOREIGN-BORN,
U.S:, CHINESE, JAPANESE AND FILIPINOS, 1974'
ru. s
.Chinese
Japanese
Filipinos
Native
Foreign
Native
Foreign
Native
Foreign
Native
Foreign
- Born
Born
Born
born
Born
Born
Born
Born
(in thousands)
.'
;
United State6
193,591
9',679
229,237
204,232
464,175
122,500
15/$853
178,970
Percept- .
95.2'
4.8
52.9
'47.1
79.1
20.9
46.9
53.!1
California
18,199
1,758-
92,663
77,711
167,438
44,683
56,583
79,058
Percent
91.2
8.8
54.4
45.6
78.9
21.1
'
41.7
58.3
A,
New York,
Perdent
16,1Z7
88,4
2,110
11.6
29,586
35.6
.
53,595
64.4
t
8,51
43.2
11,254
56.8
4;166
'30.7
9,391
69.3
Hawaii
693
76
46,566
5,809
196,848
20,821
61,73F
33,623
-Percent
96,1
9.9
88.9
'''
11.1
90.0
10.0
.64.8
35.3
-Source:r U.S. CensusBureau, U.S. Summary, PC(1)C1, Table 143;
Subject Report, PC(2)1G, Tablei 3, 18-,-33.
-.
41.
ft
-34-
'

1940s there were few Chinese women here, ao Chinese born on Americansoil are g fdirlyecent occurrence; Hende, all but a very fewChinese id the °United States were born outside the United States.Since native-borbcannot be taken literally to mean United States-born; we must make allowance for this definition and reduce thenumbers considerably.
How does the Chinese\aative-boA/foreign-born ratio;compArewith other ethnic groups? In 1900, approximately 15 percent of
.
the American population was foreign-bort. By.1970, the percentagehad shrunk to less than 5 percent. (See Table 9.) The UnitedStates is now producing her own sons and daughters. The percenta6of foreign-born Japanese-Americans in the United States is considerablysmaller than-that for Chinese-Americans. It is about 21 percent,or about one in five. Again, the variation between states is great- -10 percent in Hawaii versus 57 percent in New York. For the Chinese,the nativity ratio is approximately 1:1. But if warevipe the .
census definition of native-born to exclude those not born in theUnited States, the foreign-born proportion would be greater.
Citizenship
Place of birth is a major determinant of citizenship, butA
it is not the sole determinant. The United States confers citizenship'by.twt imeansf by birth and, by naturalization. Birth means beingborn oirAmerican soilor born to at least one parent who is anAmerican citizen. To become a naturalized citizen, one must meetcertain requirements and make application.
Before 1943, Chinese in the United States were not eligibleto apply for naturalization no matter how long they had residedin the country, how fluently they spoke English, or,how ardently'they subscribed to the, ideals of American democracy and its formof government. As far back as 1870, the Chinese had been declared"aliens ineligible to citizenship." The logic for this was thatthe Constitution granted the free white manthe right to benaturalized, and the Fourteenth Amendment certainly extended this,right to the black man, but, since the yellow man was neither whitenor black, he was adjudged ineligible. Only after repeal of theexclusion acts was the right of naturalization given to the Chinese.
I
The requirements for citizenship are more stringent than isordina ily,presumed.- To enter the United States, one needs animmigration visa. To obtain such a visa, the applicant must provethat he'wili notbecome a public charge, that he isnot taking ajob away from anyond else, that his training orskills are inshort supply, add that he will have a place to live when he gets
4-35-.
I
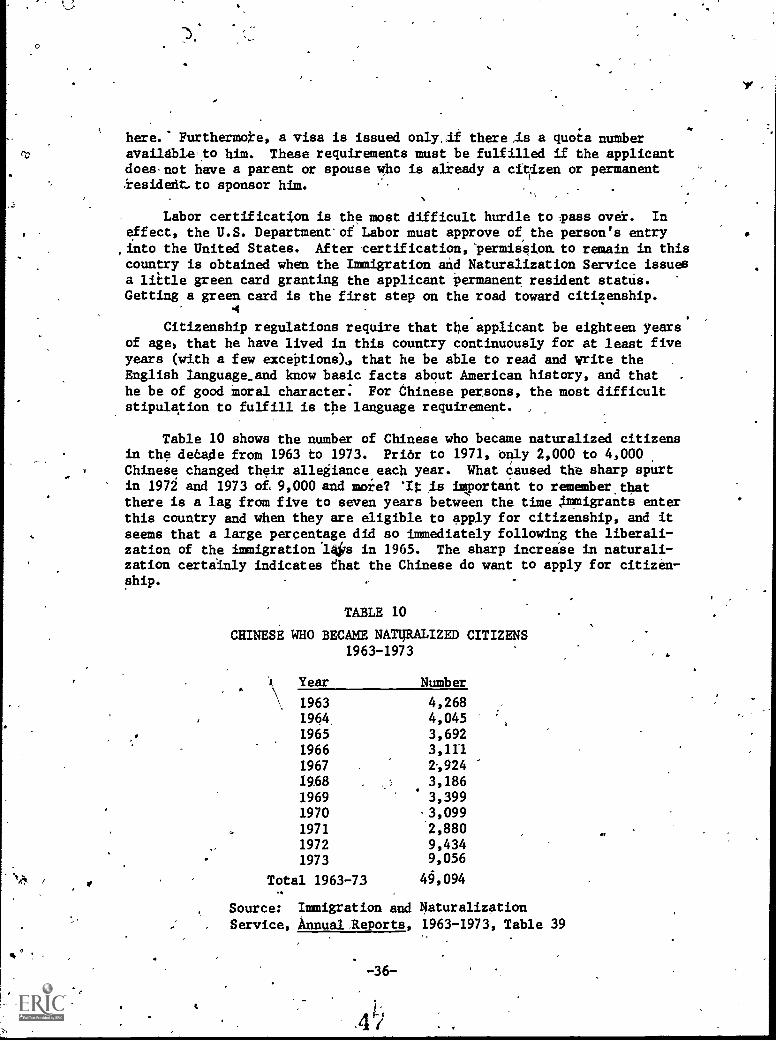
O
eso
-
here.' Furthermoke, a visa is issued only, if there ,is a quota numberavailable to him. These requirements must be fulfilled if the applicantdoesnot have a parent or spouse who is already a citizen or permanent.'resident. to sponsor him.
Labor certification is the most difficult hurdle to ,pass over. Ineffect, the U.S. Department'of Labor must approve of, the person's entryinto the United States. After 'certification, Permissiom to remain in thiscountry is obtained when the Immigration and Naturalization Service issuesa little green card granting the applicant permanent resident status.Getting a green card is the first step on the road toward citizenship.
4
Citizenship regulations require that the applicant be eighteen yearsof age, that he have lived in this country continuously for at least fiveyears (with a few exceptions),, that he be able to read and write the .
English /anguage_and know basic facts about American history, and that .
he be of good moral character: For Chinese persons, the most difficultstipulation to fulfill is the language requirement. ,
Table 10 shows the number of Chinese who became naturalized citizensin the de6afte from 1963 to 1973. Prior to 1971, only 2,000 to 4,000Chinese changed their allegiance each year. What caused the sharp spurtin 1972 and 1973 of 9,000 and more? 'It is important to remember thatthere is a lag from five to seven years between the time immigrants enterthis country and when they are eligible to apply for citizenship, and itseems that a large percentage did so immediately following the liberali-zation of the immigration '141,7s in 1965. The sharp increase in naturali-zation certainly indicates that the Chinese do want to apply for citizen-ship.
TABLE 10
CHINESE WHO BECAME NATURALIZED CITIZENS1963-1973
\ Year Number
\ 1963 4,2681964, 4,0451965 3,6921966 3,1111967 2-,924
1968 3,186
1969 3,3991970 3,0991971 2,8801972 9,4341973 9,056
/ Total 1963-73 49,094
Source: Immigration and Naturalization
Service, Annual.Reports, 1963-1973, Table 39
-36-
.4Y
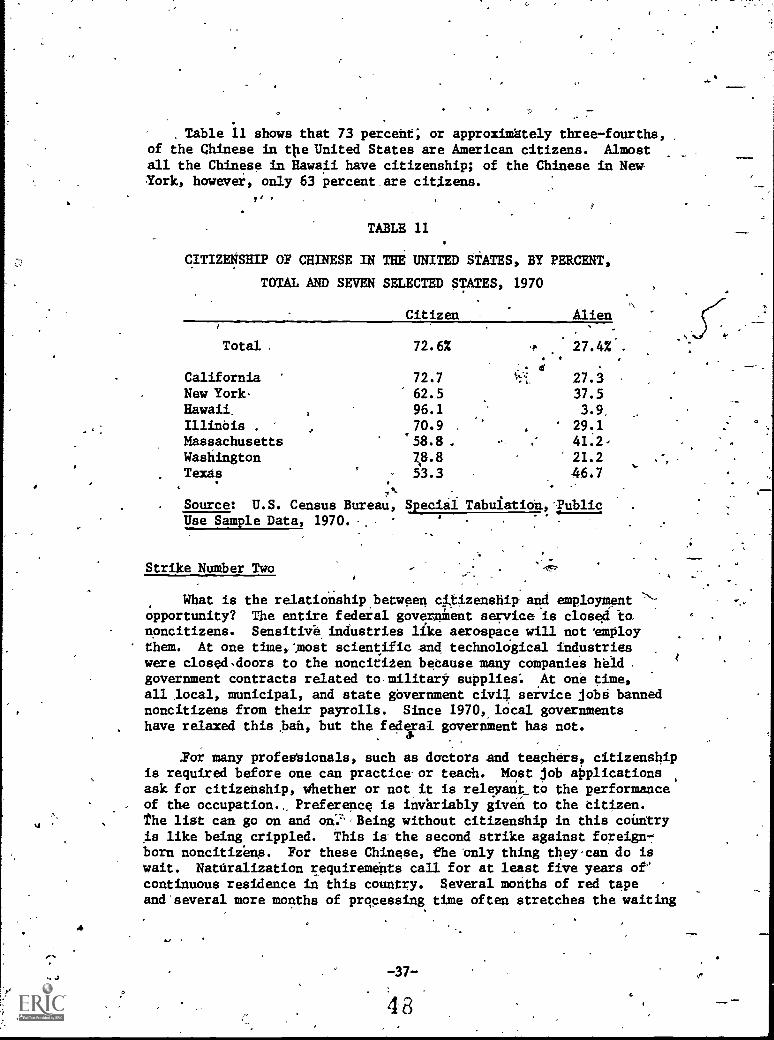
. Table 11 shows that 73 percent; or approximately three-fourths,of the Chinese in tie United States are American citizens. Almostall the Chinese in Hawaii have citizenship; of the Chinese in NewYork, however, only 63 percent are citizens.
TABLE 11
CITIZENSHIP OF CHINESE IN THE UNITED STATES, BY PERCENT,
TOTAL AND SEVEN SELECTED STATES, 1970
Citizen Alien
72.6% 27.4%"-
is. d
27.337.53.9.
29.141.2-21.2
46,7
Total .
California 72.7
New York- 62.5Hawaii 96.1Illinois . 70.9Massachusetts '58.8.Washington 7,8.8Texas - 53.3
716
Source: U.S. Census Bureau, Special Tabulation, PublicUse Sample Data, 1970.
,
Strike Number Two
What is the relationship between citizenship and employmentopportunity? The entire federal goverment service is closed to.noncitizens. Sensitive industries like aerospace will not 'employthem. At one time,most scientific and technological industrieswere closed doors to the nonciti2en because many companies held .government contracts related to.militarSi supplies. ,At one time,all local, municipal, and state gbvernment civil service jobs bannednoncitizens from their payrolls. Since 1970,, local governmentshave relaxed thisbah, but the federal government has not.
For many profestionals, such as doctors and teachers, citizenshipis required before one can practice-or teach. Most job ajplicationsask for citizenship, whether or not it is releyent to the performanceof the occupation Preference is invariably given to the citizen.the list can go on and od.',Being without citizenship in this countryAs like being crippled. This is the second strike against foreign -'born noncitizens. For these Chinese, the 'only thing theycan do isWait. Naturalization requirements call for at least five years ofcontinuous residence in this country. Several months of red tape '
and'several more months of processing time often stretches the waiting

period out to nearly seven years. For example, most of the peoplewho got their citizenship papers, in 1973 arrived in this countryin 1966 or 1967. During these six or seve years, the noncitizenis severe 'y 'restLiuled 14 his options. He has few alternativeexcept to take any job available at any pay,Offered because beggarscannot be choosers, and employers knoW that 'rs well.
Mother Tongue: Strike Mumbei-Three
Having traveled extensively throughout the world and havingexperiedced the frustration of not being ableto communicate ina land where I could not speak the language, I can appreciate howan immigrant feels when he first arrives in this country if hedoes not speikHnglish. The simple task of getting something toeat-and finding my way back .the hotel with 'the help of a Berlitzhandbook-is not comparable to making a whole new life forrogeselfin a foreign, land. Suppose.i_had to compete actively for jobwith"the natives of that, country! I.am afraid I would be at aterrible disadvantage, and I cannot-imagine who would employ me,even for the most routine tasks, such as operating an elevator. .
'could learn the numbers for the floors'easily enough, but whatwould happen if sOmeoneaskRdfor.directionst I would not be ableto respond.
This simple introspection helps me understand what an immigrantlaCes,when.he uproots 'himself slid:tries to suppOrt)himselfinanother country where the langdage, ways, -and culture'ate entirelydiffetent from his' own. The immediatnikH for employment puts aninetantaneduadetand'on hii po:,flietoqf overnight. This cs'nabsolutely impossible task; a new langdage cannot be acquiredovernight. -The inability to communicate-=-to'coevey ones ideasand to underStand someone elseiisthe single greatest handicapthat the Chinese bear. It is,sttike muMbet.threeAhatalmost*puts them out of the ball gate,. . ,
'To what extent is language a problem amonghe Chigesain theUnited States? The census data reveals that it is a reater-ptoblem.,
than is generally presumed, although the Census Bureau tends to. feel that the mother tongue data is overstated. According to Table 12,kat least three out of -four Chinese persons listed.Chinese as their _
mother tongue. This is theelanguageuetally apoken'in an individual'shome in early childhood. In all likelihood, this perCebtage ia,even greater than recorded because the'people.who did not report *.their mother tongue'but come from a Chinese7ipeaking:home.aresubmerged in the "other or not repirt.d" category. ,
, t
a

'
A
I. included Spanish and French in my tabulation for some'clueas to whether Chinese are' immigrating to the United States frpmLatin America and,Southeast Asia. I was able to ascertain thatCuban Chinese are one large group that has entered; the country inre&nt years, but I was also curious to know how -many Chineseqcame to this' country- as displace&.personsor refugees from theVietnamese war. This information, however, could not be extrapolatedfrOM the census figures on mother tongue--Chinese refugees of thewar might still have reported their mother tongue as Chinese, notFrench or Vietnamese: Among the large numbers of South Vietnameserefugees, I am sure a considerable number are- of Chinese extraction.
TABLE i2
MOTHER TONGUE OF CHINESE IN THE
UNITED STATES, BY PERCENT, 1970
United StatesCalifornia.
English
.14% .
12
11,
Chinese Spanish, FrenchOther or
Not Reported
74%
78
'1%
1
0%.
0
11%
10New York 4
.4483 , 2 p .,.u.
Hawaii 45 0 0 '11
Illinois 14\ 72 0 0 . "14
Massachusetts 4 \, 85 0 0 11'
Source: U.S. Census Bureau,Special Tabulation, Public Use-Sample Data,1970.
Note: Based on 1.perceat sampling:
You Speak Funny
"
But whether a person speaks,Chinese or Spanish or Indonesianis not the issue: The national language of the United States isEnglish. In' the state of New York,,:only-kpercent of'the Chineselist English as their mother tongue:,--In'CaliforAia; 12 percent,and in Hawaii, 44 percent do so.
O
.These. figures also point out-the places where the lack ofEnglishmay prove to be a problem. The Chinese in the United Statesare still very much a Chinese-speaking group. To what - extent they
are bilingual'or also fluent in English,-we do not'know exactly;the census does not give us this information. From personal obser-vations, I would say that a very large proportion have problems
s.
with the English language--even college graduates or post - graduatestudents. AF umber of my acquaintances have no difficulty inreading or writing, but they have a heavy accent that is difficultto understand. These people are extremely self-conscious about'their speech,and are reluctant to open their mouths. Consequently,they gravitate toward occupations where they will,not have to deal,with the Public, preferring instead 'to Croget_themselves'in workdealing with numbers or machines.
At least these persons can still resort to the written language.The People most in need of help are those who Can neither speak; norread, nor write English. And the most handicapped are those who areilliterates in any language. Learning builds on learning and, withoutlearning techniques carried over from childhood, an illiterate startsfar below ground zero.
Mother tongue is also a supplementary indicator of ethnicorigin, country of origin, and the degree.of acculturation.Obviously, the Chinese have, clung to their language more tenaciouslythan other national groups. This is commendable and it could provealiatibnal asset to have a human resource of bilinguq. people. Thekey word here is bilingual7-in.other words, to be conversant inboth languages. Lack of English will invariably prove a handicap;giving up one's mother tongue is psychologically damaging. Onereason why such a large percentage of Chinese have retained- theirmother, tongue is the recentness of their arrival in this country.The American-bornare turning their backs on the Chinese language.The parents dend theirchildren to Chinese language schools andmake every effort to transmit.the,language to their offspring, butthe battle is a losing one., After the offspring become adults,
, . most lament their Inability to 'speak Chinese.
-40-

SUMMARY .OF FINDINGS
e
1. The non-English-speaking foreign-bdrn Chinese immigrant has.three strikes against him when he uproots' himself and tries to start
life anew in this country.
2. There are more Chinese-Americans born abroad than are born inthe United States. The foreign-born ratio will become greater becauseimmigration exceeds native births. In essence, the Chinese-Americanpopulation is largely a first-generation or immigrant-generation one.
3. The tremendous adjustment that first-generation Chinese-Americans must make puts them 1n a disadvantaged position in everyrespect. They must reeducate themselves completely and quickly.Call strikgnumber one.
4. Not having citizenship in this country is like being crippled.Many industries will not or cannot hire noncitizens; professionalsmay not practice. A large area of the job market, therefore, isforbidden ground to those without citizenship papers. Call strike
number two.
5. The Chinese.do apply for naturalization as soon as theyfulfill the length of residence requirement.. The law says fiveyears; the usual wait is six to seven years before papers are issued.There is no recourse except to wait.V
' 6. Lack of knowledge of the English language places the Chinesein a most unfavorable competitive position when itcomes td lookingfor a job. In most instances it puts the Chineseout of the jobmarket, except in occupations owned and operated by other Chineseor catering to the Chinese. Call strike number three.
7. As few as 4 percent of the Chinese in New York and Massachusettslist English' as their mother tongue. In all likelihood, these areAmerican-born Chinese who make no effort to retain their Chineselanguage, but regret it later.'
8. Hawaii's Chinese have less of a problem with the Englishlanguage; 44 percent list English as their mother tongue. The
nationwide percentage is 14 percent.
9.
the
statistical data on mother tongue provides other clues
# beside the number who speak Chinese. It is an index of acculturationand it could reveal where the Chinese emigrated from, other thanChina and Bing Kong.
-41-
ti
RECOMMENDATIONS
Immigrants
' In August 1973, CongresswomanPatsyM introduced, a bill(H.R. 9895) in the NinetY-third Congress to provide kederal programsof educational,.employment, and,other assistance to areas with heayy,concentrations of foreign-born persons. Tie bill declared that:
111,
r(whereas) 1. many foreign-borirpersods in theUnited States lack sufficient education to functionadequately in our technological society; .
.2. the lack of adequate education prevents manysuch persons from having satisfactory employMent oppor-tunities;
3. newly arrived foreign-born Americans alsbexperience difficulty in such areas as food; housing,and health;
. -
4. the needs ofnewly arrived foreign-bornAmericans may place'heavy financial .strains oncommunities in which they,reside;
5. a number of "gateway Cities" exist wheresuch persons reside in great :numbers, thereby placingdisproportionate burdens on:particular areas of the
AO country;
6. the policies under which persons move to theUnited States are set and determined by the federalgovernment;
7. the federal government therefore has aresponsibility to assist those states and citieshaving concentrations of foreign-born populationsin meeting the special needs thereby thrust uponsuch communities.
1
Congresswoman Mink called for federal aid to states where morethan 5'percent of the population are immigrants. The aid"would gotoward programs of eddcation, health; housing, and job training.In addition, travel grants of up to $250 per immigrant would beprovided for travel from a "gateway city" to another state for.purposes of employment. Mks; Mink recognized tii*Imost immigrantstend to concentrate in seaboard cities, placing the burden ofadapting the immigrant to his new homeland upon ft limited numberof such cities. The travel allowance would induce immigrants to
4
,42-
53

I" 7
$'
ot.
disperse and relocate to'other states. r
I heartil endorse Congresswoman Mink's bill and hope that.itwill be enact . If such funds are available to the dtates, thereare some a istrative recommendations that I. would. make:
. '
1. A multiservice center where iMharants can go for hAlpif the'need should arise should be set up...
. 2. The center'muht aye multilingual personnel if ibis tobe able to,effettively hel the new immigrant.
* 3.' the existence of, t center must be publicized so that theimmigrant knows that there,is aplace_to which he can turn if heneeds help. A brockure describing the center and its services mightaccompany the issuance of the immigration visa.
4. More incentives'should be offered to encourage dispersionof the immigrants inland or to cities other than the ;'gateway=' ones.
5. Subsidiary grants should be offered to community institutionsor organizations if these*organizations can pNovide a more personaltouch in dispensing services,
41,
6. Socialservace agency directories directing the new immigrantto other places where he might seek assistance of guidance should becompiled.
7. A simple language or phrase book,t like the Berlitz languagebooklets for travelers should be made available to enable theimmigrants to look up essential phrases they will use daily.`
I envision the multiservice center as something like the WeltomeWagon carried on by many communities, to welcome families who havejust moved into the neighborhood. I shall/never forget the friendly.lady who called upon me when I fiist moved Ile() my present home.
She was herself a local resident. She ;told me about 'the area, theschools, the transportation'facilities, and the local storks.
'even presented mg With a padket of discount coupond, I was, so moved
by this friendly gesture that'I have patronized these stores regularlyever since.. The stores empldyed thelady,to make theie calls, and itwas money well spent. If all the families she called upon felt asdo, iewas also money wisely,spgnt.
' 'Citizenship
In'January 1970, the Equal Employment Opportunity Commissidnissued guidelines pn discrimination because of national origin.
1 -43-
5(4
I
t
.
,quote from Title -29-- Labor, Chapter RIV, Part 1606.1:
(c) -Title VII of the Civil. Righ5S4eprotects all individuals, both citizens and.domiciled or residing in the United States,discrimination 'on the basis of race, color,sex, or national origin.
of 1964.
noncitizens,against
religion,
(d) Bedause discrimination on the basis ofcitizenship has the. effect of, discriminating on the,basis of national. origin, a lawfully immigrated alien
. is domiciled or residing Yin this country may ,notbe iscriminafed againston the'basis of his citizenship, except that it is not an unlawful employmentpractice for an employer, pursuant to section 703(g),to refuse to employ:any person who does not fulfillthe requirements imposed in the ihterests of national'security pursuant to, any statute of the 'United Statesor any-Executive order ofthe President respectingthe particular position or the particular. premisesin question.' .
(e) In addition, some States have enacted lawsproh bitleg theemployment of noncitizens.. For the
stated,abpve; such laws are in conflict withand a here ore, superseded by.Title'VII of theCivil ights -Act of 1964.
-ThtSeguideline'is effective upon pla1ication.1
State and local governments have removed their.ban upon noncitizensfor civil sdrvice jobs,' but the'federal governMent has not.', InFebruary 1974, the Ninth Circuit Court of Appeals in San Franciscohanded down a uhanimpuddecision calling upon the federal govermentto permit resident aliens to apply )or federal employment, Theruling came as a result 0 a lawsuit filed more'iban three yearspreviously by five San,Franciican Chinese aliens. As of this,writing, the ruling is being, appealed by the federal government-andmore than 3 million civil service jobs are still closed to noncitizens.It is ironic that 'the government that ,is asking for enforcedent ofthe Civil Rights Act should try to cArcumvent the guidelines of itsown laws,especially.since exemptionlas already been provided forthose jobs that. might'jeopardize national security. Besides; most
1. Federdl Register, vol..135, no. 8(Januarylei 1970): 421..
2, East /West, The Chinese-American Journal (Febrdary 6; 1974).
,L44*-
.
4

0
4
", At.
of the jobs in the national bureaucracy are not defense. related.
0Language
at
Bnglishr-language classes-fin. adults will eqUip_them to step
beyond ,the boundaries ot,ChinatoWn'and enable them to expendtheir
occupational:horizons. Of all programs, I,ave this top priority,:.and so do all .the community.leaders-and th4iTdigrainta that I 'havespoken to: I stress adult because mos of the recent immigrants .
are Over-age twenty.. These,..people; t afford'the'luxdry'offull7time-sehoblingf-Ehey must work.,, C eses must; therefore,..he'-'
held before or after work_hours.
To give sopie idea of the urgency of the problem, the Chinese-',communities have responded to the need with individual and s ,poradic
attempts to alleviate the situation. Churches and gociel.sgencies,offer English language classes with volunteer teachers. Concerned,,
individuaistutor others. Some groups'manage to'get.piecemealfunding. But teachers andadministrators'are uncertain whether
',their programs will-he there nexeyear. The uneettainttmak*itdifficult to attract the best qualified and profesSional Pertoinel,and much of the time of the admimistrators-iis spent trying to raiseenough money to keep. the progiams running.
,
The English language elegies offered by the-Chinatown FoundetiOn.in New York are An example of this sort'of progiam,Funded by theNew York State Depattment of Education and HEW, the prograii can,'
accommodate 500 students. Over 1,500 persons applied within a few
days after classes were announced: Attendance is excellent. -Abseecefrom three classes without a.good excuse means that the itudefit is
dropped and, another eagerly takes hit place. Classes are offered
in 'the morning to acc 4 the restaurant worker's and in theii.11
evenings to accommodate t garment factory workers. It is most'
heartening to see the. eagerness with,which these students cone toelaises, but it is more than disheartening, to see them turned away
.because the classes are filled.
For those who areturneAd away from language classes,' as well
as those -who live some distance from Chinatown; l would recommend
television classes. This method has been successfully tried inSan Francisco and has been well reCeiled. The same video tapescan be repeated or rerun it other cities over educational channels.TeleVision classes.are pot as fective as classroom. instruction,
hoirever, because there is no eacherpresent for practide orinteraction or correction of mistakes.
-45
5

0-
Cs.
A co
-
O
. . ..-4.
Bilingual.Education ,
v.-*
For tflose4ho-have'spent ten or twelvg,years learning one. - ., ,4
langUage--Chinese--only to find thai.it is no longer usefUl'becausethis isa land where it is not:the medihm of expression, bilingual
,,education may be a trnsitional.ald. The right to bilingual education 1,
,waslixaranteed by a Supreme Court ruling handed down 14 the.
.
Lau -v:' NicholsNichols ease in .3anuary.1174.- In. its,ruling.,,,the Supreme ..
_ Court-saidatiolents who do dot understand English are effectiVelY --*.foreclosed frOm any meaninpfui education!6
.
.r
. -. , "
The Congress, has acted with the passage of the Bilingual ',
Education Reform Act of- i.974, but rto plans,have been formulatedfor its implientation. The machinert.of government grinds slowly.Laws on the books do not in themselves remedy social ills. Theymust be put'into effect.
... .
I.I I
A
,t
- 1
4 ,
)A ;
I
..
4 ..
f:
3. Loc.. eit *March 29 1974'. `s.
A
-46-7'
1 '4.A.
..
-

t
/
MIS
CHAPTER III
GEOGRAPHICAL0DIS1ERSION -., , ,
. .
, . ..
. If three strips were laid .down vertically each extending two ,:
degrees east and tqo degrees west of the 74th, 120th, and 158th '..meridians on a map of the United States,. they would cover the areas. /
where over 90 percent of the Chinese reside. These.neridians arealdng the East Coastl.the West Coast, and Hawaii. The only ather...,.., , --
significant concentrations of Chinese are in the midwesterp cityof Chicago and,,surprisingly,'Houston; Texas, which lately seemsto be attracting the Chinese.. Outside these coastal Strips, onemight thousands, of miles without-encountering a Chinese - .
, ,,..
face.. ,.. : c-
The coastal states have traditionally been the destination ofall immigrant groups,when they first' -land in the United ,States.
Bach national or ethnic group tends to congregate in particular :.
localei, giving rise to-distinctive communities and.coioring theseareas with the flavor'of their nativecultures. . .
. .
An Urban Population. , . ..
,
lir T hifrelustering-phenomenon seeMs stoche more intense with the
Chiftese: Not 'mil:y4re theyoan,almost Completely.urban population
(97 percent),. they tend.to gravitate to a.limitee-number of cities,priniirily San ?rancid-co; New York,Alonolu1u,.and Los Angeles; and in
.. :thesecities-they tend' be found.yitisin,the borders of a very.
_.. distinct area "called, .. ----'"
,4'.' ". -','. r. r , . e
' 4 .. Table 13 sjiows the'eleven'Standard Metropolitan Statistical :.. .
. Areas (SMSA) that.haVethe highest'ghineskpopulations: In everyone of "the-se urban centers, ,,the inci0eirserc.ixt.'Population over' a ' ,
twenty -year periOd!wasfeubstential .and, in ,zany instances, it .
-dOubled with each 4ecaiie".. The most iMpreadve gain:9as'injlewYork aity,,:with an inct'ease.s4-40:000- or 1091percent.; SEssifose, -,
a town, about fifty miles southeast of-San Frandisco,rarever,:,'
..,, ,
.,. . .,
. .. ..:
' b.%-i . ...r..... ,
0,
.
-6 ,e
} err...4' :. .
1 . '.:. . , , .' 1 ' ::. .7: 4. ''
47 =. , .. .. 4;
, .4 Iv' r e -'-'" '.... A
i . # ,I..! ' s. v ,- 4.- % '
1 ,,:..s, ., . , '
, ..ts . . Ye,'
z

.'
11'1
1TE 1:4RGE§r
ciE
ryrx
is..o
r.19604.1970-
Sanranciiico
liakland
,New York
'"
Honblu'lu
,
. "
Los Angeles
tong Beach
Chi
cago
:-
-
BostOn
Sacr
amen
toW
agib
iAgt
ott,
D. C
'..1
14..
San,Jose
'.
.
Seattlg '
Philadelphia
.,
4ti
Source:
'U.S. Census
Bur
eau,
.
',
.1960--
'19
76.:
'
34,774t
*am
76;208'
15,409,,
:48;288..
97a75:.! '19;402
49,798:
3i737
14653
2,07. :
'''5";564:
.14025.
'
14,444,
1025.
8498
,-)74817.;
Lq611,
7,04
,2,544
4082
'
...
1
..-
.'
-.
NO
TE
:. T
heSIiSA boundaries'are
not,'exactly .the
sam
e,fronk ceinFus
to-censusa
San'. Francisco-Oakland SM$. :includes; midi
'aconnties.in* 1970 thin in 19.60';,
iPerCent
19504960.
;2
119
109'
-157
92 ft7.
115.,
20.5 ,-
,-
*No't- Available
.
Increase
"
196041970
.
-I-6t
'
'109
31
-
.,
110
.1.16
11662,
111.
6).
1Por example,*tbe
er.
`s
'. o,
)
. , .

.
I -
ked up the most spectacurar percentageincrease. In 1950, it
.a Chinese population -of 192. This figure increased,by moretlyin 205 percent over the next decade and by 1,236 percent ten years
Iaier. In many ways, San Jose has become ameXtended suburb of San
Fra cisco. Its electronics industries, have attracted many profes-
, Sid lly trained and technically skilled Chinese Ito the area.
.
r L
to, T.The ranking of the cities has also undergone important shifts. San
-.Ffanc co has always held the lead as,the oldest and largest centec,ofChine e population,. hut It' attracted fewer person's during the decade from
. ,,1960 t 1970 than did New York. At the same time, former Chinese residentsof San \Francisco.weke moving, out to Sacramento, San Jose, Stockton, or
other.. earby towns, maintaining ties with San Francisco, but preferring
'a less ngedted placefor'their children to grow up in.
Ove 92 percent of Haaiits Chinese reside in Honolulu. In 1960, it
was neck and -neck with New York City for second place. Ten years later,
New Yoik d Pulled far ahead of Honolulu, with 76,208 Chinese residents
to Honolh les 48,288, Honolului4 growth had come about during the decadefrom ,1950 to. 1960. _Since then, the increase has slowed down consi-
derably. mmigrahts are not going to'Honolulu, and the young people are
moving the island to the mainland. (See Table 14.) -
.i,
Qf the three ranking cities, New:York is, growing the most rapidly...
DuriAg the ensue year 1970, it trailed San Francisco only slightly:
. nowr the abf lute number of'Chlnese in the.SMSA of New York may alrea
'exceed that .kf San'Francisco. Attention to Chinese-American problems' ,
must, iheref e, focus mare upon-this Eastern Seaboard city, rather than
'upon the,trad fidnal centers of Chinese population.
TABLE 14
,PERCENTAGE OF CHINESE IN FOUR URBAN CENTERS TO TOTAL
.:UNITp STATES CHINESE POPULATION, 1960', 1970
, ' SMSA 1960 1970.
San Francisco ,22% 20%
Ao
kew York, ' 16% 18%
- Honolulu 16% 11%
Los Angeles 8% 9%.
'Source: U.S. ,ensus Bureau, Subject Reports, PC(2)1C
* (1960), and PC(2)1G (1970
0 1

CHART C
AGE DISTRIBUTION OF CHINESE IN CALIFORNIA AND HAWAII
CALFORNIA
HAWAII
L
Age Ggoup
Ey54cNER
80 -
84
75 -
79
- 74
65-
69
`0'6
0 -
64
55 5
950
-54
45 -
4940
-44
35-
-30-
34*
25 2
920
- 24
1. 5
19
19-?
} 14
5 -
9
-4R
DE
RS
109
8-r
G5
4 32
10.3
4-56
7891
0T
HO
US
AN
DS
Source:
U.S. Census Bureau, Special Tabulation, Public Use Sample Data.
50

<I
f-5
Factors Influencing Growth
Before long,' New York City may -be the'mosi-.concentrated centerof Chinese population. A look at the intended state of residencewill provide some answer to,this:Atamatic shift. (See Table 2.)The number of immigrants who go to-Hawaii has become insignificant.At the most, less than 400 have been-immigrating to Hawaii.eachyear over the past ten years, and in some years it,was less than ,.
100. Yet, in almost every yeat'during the.same period,,the'numberimmigrating to New York has been roughly ten times the number goingto Hawaii. ,
,
The Pacific Island State is also losing its'young men and womenin the 25- to 35-year age group:' (See Chart'C.) At many of theAsian American conferences that I attend, I, come across numerous.young Asians from Hawaii who nowfwork or live on the mainlaid Onlyyesterday I attended a dinner where I sat it a table for ten people;three of the ten were Hawaiian-born young Men."
Los Angeles continuesto attract immigrants, but the otherMBAs with sizable Chinese populations seem to be increasing frommigration between the states, rather thanimthigration from China
, or elsewhete abroad.
The difference in make-up of the Chinese population in thevarious localities are very great. Many of the tables in thisstudy were set up--sometimes by cities,' sometimes by state, andsometimes by region--to point out these differences so that specifidproblems would not be camouflaged by national averages.
The age pyramids (Chart C) show California on the left andHawaii-on the, right. The one for California is faiklycrepresentativeof the total Ghinese populatibn in the United States, and it revealsa most importaht trend: with each younger age group from 20 to-24on down,,the numbers get smaller. The base of the pyramid is no .longer the broadest. With each yoUnger five-year age group, we notea decreasing population.
' Later in our study, we will see that the nuaer of childrenborn to Chinese parents over the ten-year period between 1959 and'1968 was only 5,000-6,000 for the entire United States. (See Table8A.) This fadt is further substantiated by the number of childrenever born Co Chine:fie-American women ever Married.. (See Table 3g.)
Preii.nt in All Fifty States
The Chinese are heavily, concentrated in a few cities, but they .
2-51-
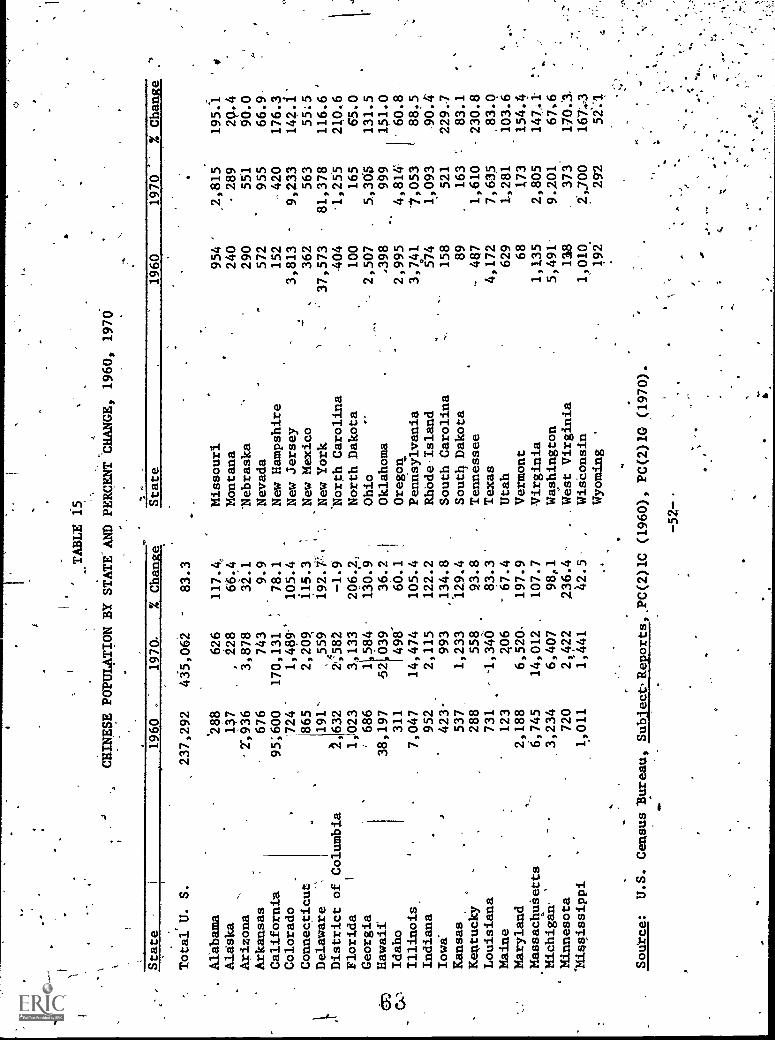
TABLE 15
CHINESE POPULATION BY STATE AND PERCENT CHANGE, 1960, 1970
,
-..-
State
1960
.1976
% Change
State
1960
1970
% Change
Total'U. S.
237,292
435,062
83.3
.Alabama
288
626
117.4,
Missouri
954
2,815
195.1
Alaska
137
,228
66.4
Montana
240
289
26.4
Arizona
-2-,936
3,878
32.1
-Nebraska
290
551
90.0
Arkansas
676
743
9.9
Nevada
572
955
66.9
California
95;600
170,131
78.1
New Hampshire
152
420
176.3
Colorado
724
1,489'
105.4
New Jersey
3,813
9,233
142.1'
Connecticut
865
2,209
115.3
New Mexico
362
563
55.5
Delaware
191'
559
192.7
New York
37,573
81,378
116.6
'
District of Columbia
L632
2:582
-1.9
'North Carolina
404
1,255
210.6
Florida
1,023
3,133
206.2.
North Dakota
100
165
65.0
Georgia
686
1'
130.9
Ohio
2,507
5,365
131.5
dp-)
Hawaii
38, 197
32
039
1498-
36.2
Oklahoma
.398
999
151.0
0.)
Idaho
311
60.1
Oregon.
2,995
4,814
60.8
Illinois,
7,047
14,474
105.4
Pennsylvania
3,741
7,053
88.5
Indiana
.952
2,115
122.2
Rhode,Island
574
1,093
90.4
Iowa
423-
993
,134.8
South Carolina
158
521
229.7
Kansas
537
1,233
129.4
Sout4 Dakota
89
.163
83.1
Kentucky
288
558
93.8
Tennessee
487
1,610
230.8
Louisiana
731
, -1,346
83.3
Texas
4,172
7,635
83.0
Maine
123
206
- 67.4
Utah
629
1,281
103.6
Maryland
2,188
6,520
197.9
Vermont
68
173
154.4
Massachueetts
6,745
14,012
107.7
Virginia
1,135
2,805
147.1
Michigan
'
3,234
6,407
98,1
Washington
5,491
9.201
67e6
Minnesota
720
2022
236.4
West Virginia
138
373
170.3
1,011
1,441
42.5
Wisconsin
1,010
2,700
167.-3
Wyoming
'
192
292
52..1
Source:
U.S. Census Bureau, Subject.Reports,.PC(2)1C (1960), PC(2)1G (1970).
-52-

0
are also widely:dispersed. This statement is not -a contradiction'considering that there are Chinese in all of the fifty United States.The 1910 census enumerated about 165 hardy souls in each. of theDakotas and 173 in the state of Vermont. Even Alaska had 228.Judging from the state figures, the Chinese do not like the gold.climate, but that cannot be, the deciding factor. Michigan wintersare quite severe, yet'thatsiate has over 6,400 Chinese residents;
In the late nineteenth century, the Chinese population ofthenorthwestern states of Washington, Idaho, and Wyoming'was fairly'substantial. The early.Chinese were engaged in Waling gold inIdaho' and coal in Wyoming, and in domestic service and producefarming in Washington. Some vestiges of those early Chinesesettlements still remain, but others are fast disappearing.2
Table 15 gives us a breakdown of the Chinese population bystate-for the census years 1960 and 1970, and shows the percentagechange during the decade. The five leading states in Chineselpopulation are California, New ^York, Hawaii, Illinois, and Massachu-setts. Following at some &stance are the states Of Washington andTexas. This last state should be subjected to closer scrutiny sowe can discover why it has almost doubled its Chinese populationin the last two decades.
Every state registered substantial gain, except for the District'of Columbia with a -1.9 percent change. This figure is extremelymisleading however, since it reflects the movement of.the Chineseout of the central city, or district proper, into. the surroundingsuburbi in Maryland and Virginia. The SMSA figures for the nation'scapital shows that there are at present 8,298 persons of Chineseancestry. The actual percentage increase from 1960 to 1970 forthe DC-VA-MD SMSA is 111.'
Is there any noticeable shift in the Chinese population from-state to state or region to region? The large number.of immigrantstends to overshadow the movement of those already residing in theUnited States, but some data from the census give an indicationwhether the Chinese are moving away from the West, whether they are
1. Sister M. Alfreda Elsensohn, Idaho ChineseLore, (Caldwell,Idaho: Caxton Printers, 1970).
,2. In 1973, I visited Walla Walla and learned that the Chinabuilding had just been torn down and some of the old records andpapers contained within had been carted away with the rubble.
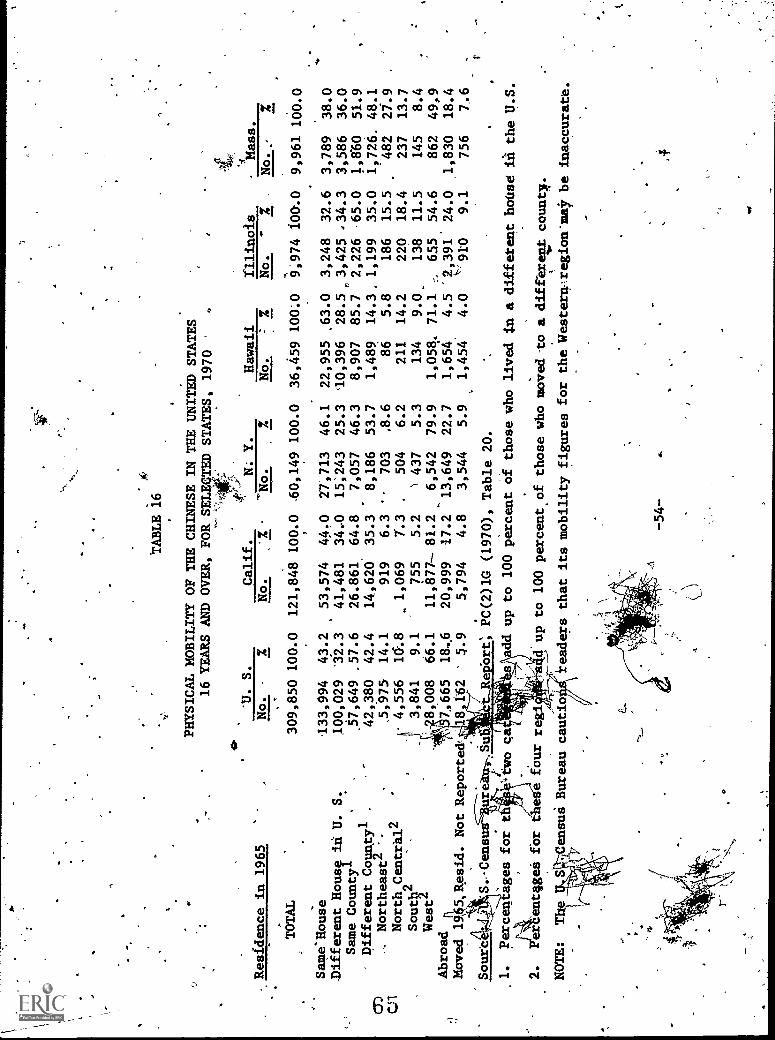
TABLE
16.
-
.PHYSICAL MOBILITY OF THE CHINESE IN THE UNITED STATES
..--
16 YEARS AND OVER, FORSELEITED STATES,
1970
..
- .
.
CD
C.1
1
U. S.
Calif.
N. Y.
Residence in 1965
,No.
%No.
,'X
'No.
Z
TOTAL
309,850 100.0
121,848 100.0
60,149 100.0
Same'House
33,994
43.2
53,574
44.0
27,713
46.1
Different Housf hi U.
S.
100,029 1[2.3
41,481
34.0
15;243
25.3
Same County l
57,649
57.6
26.861
64.8
7,057
46.3
Different Counryl
42,380
42.4
14,620
35.3
'
8,186
53.7
-Northeast2 "-
.5,975
14.1
919
6.3
703
,8.6
.
North Centeal'-q
J1-4,556
16.8
1,069
7.3
.504
6.2
Sout42
'
i3,841
9.1
755
5.2
\ 437
5.3
1-lest
8,008
66.1
11,877- 81.2
6,542
79.9
Abroad
,665
18,6
20,999
17.2
13,649
22.7
'0
Moved 19 5,Resid. Not Reported.
162
'
5.9
5,794
4.8
3,544
5.9
Sourb
S..-Census ureaui--,bus
.-1..
Re.brt; PC(2)1G (1970), Table 20.
..
Vi
Hawaii
rllinois
Mass.
No.
f%
No.
-%
No...
%
36,459 100.0
9,974 100.0
9,961 100.0
22,955 ,63.0
3,248
32.6
3,789
38.0
10,3
9628.5 ,,3,425 34.3 3,586
36.0
8,907
85.7
2,226 65.0
1,860
51.9
1,489
14.3, 1,199
35.0
1,726. 48.1
86
5.8
186
15.5
482
27.9
211
14.2
220
18.4
237
13.7
134
9.0
138
11.5
145
8.4
1,058. 71.1
,655
54.6
862
49,9
1,654
4.5 'i 391' 24.0
1,830
18.4
k1,454
4.0
910
9.1
756
7.6
!
gnat
1.
percentages for th
two qaa
dd up to 100 percent of those who lived in a different house ia theU.S.
il
Pleient4ges:
-4
.')
,
2.
fbr these four regi
up to 100 percent of those who moved-to a diff-erent county.
.).ii'
'
i-
.
NOTE:
Tbf
S.1:1Gensui Bureau
cautio
readers that its mobility figures for the WesterErregion"may be inaccurate.
,/.
-
4

0
I
still concentrating in the cities or treking out to the suburbs likethe rest of America, whether they are.getting out of Chinatowns orexpanding the boundaries of their own settlements to further- accommo-date the influx of immigrants, and whether they are filtering into
. states where they have never ventured before. As we look at the
Jfigures, we will try to find out what triggered the inkre s or".exodus.
A Rootless People
As I study the various aspects of statistical data on theChinese, I am continually surprised by some startling facts. One
of these is the high mobility tel;e of the Chinese. Only 43.2percent were living in the samedonse as they had five yearsearlier, which means that 57 percent, or almost three out of fivepersons sixteen years and over moved between the years 1965 and
1970. They had either moved to a different house in the samecounty or to a different county or were abroad. In fact, about
one out of five were immigrants. This rate varies by state and
age. In Table 16,'we can see that'only 4.5 percent of Hawaii's,Chinese sixteen years and over were abroad, whereas 24 percent ofIllinois's Chinese were. This gives one some idea of the 'disparity
of characteristics of the Chinese from state to state. These
figures also confirm what we already know: New York and Illinoishave the highest percentages of immigrants..
In states like California and Hawaii, the people, who changedtheir residence from that of 1965 generally moved to a differenthouse within the same county, and they tended to stay in the West.But it is significant that, whereas about one-fourth moved from theWest to New York, the reverse flow was much less. Again, we seethat New York has greater magnetic force.
Where we tabulated mobility by age group, we can see that themost mobile age group is 25 to 34.. For all. the states tabulatedin Table 17, the percentage of this age group.who moved between1965 and 1970 runs from 60.8 percent, for Hawai4 to 84.5 percent,for Illinois. This means that three to four out of five Chinesepersons in this age group changed their residence during this five-year interval, and, for a large proportion,of those who moved intothese states, ehe jump was a trans - Pacific one. In other words, theywere not in this country five ykars ago. :The 20 to 24 age group's
mobility is only slightly less spectacular. The significance ofthese figures is that the adult Chinese population is essentiallya recently uprooted one.
-Of those who moved within the United States,, about two-thirds
-55--
66

TABLE 17
CHINESE 16 YEARS AND OVER WHO MOVED BETWEEN 1965 AND 1970 AS A PER:CEN"iOF
TOTAL CHINESE POPULATION, BY AGE GROUP, FOR SELECTED STATES
Age GroUP,1970; Residence,1965
16 = 19 years
Different House
Abroad
20 - 24 years
Differ House
Abroad.
25 - 34 years
-(7D
Different House
Abroad-
35 - 44 years
Different House,
Abroad
45 - 64 years
Different House
Abroad
65 years and over
Different House
Abroad
U. S,
Calif.
N. Y.
Hawaii
Illinois
Mass.
50.1%
48.5%
51.2%
31.3%
59.9%
53.9%
17.8
17.9
21.8
5.8
14.4
.20.1
70.8
70.6
6t5.5
50.2
79.9
77.2
29.6
39.3
31.4
9.0
36.0
27.8
78.6
77.5.
70.9
60.8
84.5
$1.6
27.3
21.2
31.9
7.8
35,3
26.1,
X55.2
52.7
55 8
40.9
61.4
56.0
14.8
14.6'
23:2
3.7
it 1
8.6
39.6
40.4.
41.6
24.9
49.5.
45.5
11.1
11.8
15.3
2.5
14.6
'13.1
39.3
45.4
35.7
23.7
45.3_
41.;2
1.0
10:2
11.8
1.
15.6
8.4
Source:
U.$L Census Bureaui Subject Report, PC(2)1G (1970), Table 20.
NOTE:
The U.S. Census Bureau cautions readers that,its mobility figures for the Westmay be inaccurate.
-56-

stayed in the same county, except for those living in.NewYork.--There, the.tendency leaned just a bit toward moving out of Manhattan,no doubt, into the suburban counties of the greater metropolis. It
seems that there is reluctafice to make any Ting-distancejump aftar,.the gigantic.one from across the Paella Ocean.
The realization that three out of five Chinese sixteen yearsand over moved yithin a fiveyear period is quite jarring untilone campares,y)with figures for whit s and blacks. It seems.thatabout half the American population; white or black,'moved over thesame period. The American population is generglly quite mobile,but for the Chinese the experience may be more unfamiliar.. Theancestral home was often the abode of a family reaching backformany; aany generations; stability; tradition; roots, are the thecultural heritage of most Chinese. Mobility is a more difficultphenomenon for them to cope WM.
. .
Huddling Together for Security
This'high rate of uprooting undoubtedly causes nostalgia orhomesickness4 which isidescribed as a brOoding, poignant, severemelancholia caused by absence from one's family and familiarsurroundings. Toeduce the shock and emotional pain and loneli-ness, the Chinese tend to seek out their own kind and to congregatein certain sections of the urban centers which are paptilarly calledChinatowna.:
In the past, other factors, such as the Alien, Land Acts,'restrictive ,covenants, and white aversion to havinean Oriehtalneighbor, contributed also to the consolidation of these distinctethnic.enclaves. Chinatowns were inevitably in the older sectionsofthe lore city. In San Francisco, Chinatown is situated smackin the centee;of the business, financial, shippink, and civic dis-tricts. (See Maps 2 and 3.) In cities like Oakland (see Maps4 and 5)and New York, as well as other place's, Chinatowns are in the-shadow:v.,.
...of city hall. New York's Chinatown is found in thelowertip ofManhattan. (See Map 4.) Itis apparefit'.from these locations thatthe Chinese were early residents of the major urban centers. Theyoccupy what is now prime real estate, but invariably. the sectionsare 'rundown slums,
In the -"San Francisco's Chinese Community Citizens' Survey' 4 and Fact Finding Committee Report," it was found.thaf 77 percent
of the\dwellings in Chinatown were substandard.3 Sixty percent '
7-4145 ,
3., .0p. cit., (San }rancisco: H.J. Carle, 1969), p. 55.
-57-
68
All05

t-
.JEFFERSON ST
BEACH ST
NORTH POINT ST
BAY ST
FRANCISCO S
CHESTNUT ST.
LOMBARD ST
GREENWICH ST
`FILBERT ST
UNION ST.
GREEN ST.
VALLEJO ST.
BROADWAY
PACIFIC AVE.
JACKSON ST..
HAP 2-
SAN FRANCISCO CHINATOWN.PROPEk
1070
v.
.
t
5,
-
1111111 4,000 +
ggixAte 4u%
ge.tret...4-0.w.
5
:::::-!!:. 1,000.+
I 1111.'111;11
Y11.11.11.11.1 500 4.
3,000 +
2,000 +
""C
S.
i I IL
[7:1
I
1
_1
-1 77-7--1P--
:C555
tk
WASHINGTON ST
CLAY ST
SACRAMENTO ST
N.CALIFORNIA ST
PINE ST.
BUSHST.
SUTTeR ST..
414111114411WWI IONirt virago MN
oh3E1ED"au Li
EIHT1 0E7a x
, -> . x40 7 N .0
0 S. 7.'..W 0 Z . Art WZ ' le . 52 w >z w rc o 4> 0. .J X .J
Space:
a
tr1 k
. 0-
Cr0
2 a.
w
F
,s0 , r
Compiled by.Betty Lee Sung and Wai Leong
-58-
1
Cr
2O
o-z0
2
XO
-14

t
MA
P 3
SAN
FR
AN
CIS
CO
CH
INA
TO
WN
PR
OPE
R A
ND
RIC
.,1-1
M0N
O A
RE
A.
,
GO
LD
EN
GA
TE
rXs
rCs
0 Sh
..:,e
rte0
:..m
.174
6P. 1
VS
",%
I. "
011
..
Air
KE
Y:
Chi
nato
wn
Prop
er'
\50
0 -
5,00
0pe
r tr
act
Ric
hmon
d00
499
500 -
999
Nim
1,0
00 -
1,5
00
1970
x
.< ;Ou
.609
Y v
`

4
s
qv,
of the buildings in New York-is ChinatoW4 were built before 1900-and ,
99-spercent were built before 1939. In his Chisiatown'Report, written.for the :city Planning Com Mission-in-19.694 pann3i,tting-irrOte:
.
Within the core of ,Chinatown 'arid in.: the suriounditig.areas, most of the buildings were constructed before 191:Some of them are fireproof but-most,:afe- not, .and few. arembderni.zed. The, few .buildings constructed since-1'45t -can -be easily detected and counted on one hand.- Ills .phYT,sica1-plant of Chinatown is old; frelluent1Tobsolete, "andvarious. 'degrees of decay. .
, . ,
-
In' 1970, I visited- Sacramento just before,the inauguration ofthat city's brand-new Chinatown. I .strolled- through the inner mallwith its sculptured gardens and moon gates. I visited tlie,COnfudianTemple and- gazed up at the high-rise Wong' F,amily, Absociation. -
Everything was gold and red and spanking-new. The oldreh#Latovnhad been completely leveled end a new one planted, designed'ana.rebuilt ontwo city blocks adjacent to. SacramersOo's 4orartercialdistrict. .'
,
I,crosied t4 street and peered doWn; into filthy holes.; nearby.remnants of buildings that had not been included in the new Chinstotat,complex. These decaying structures told me what the. old ChinatOwnmust have been like before the renewal. , "
Ubiquitous Chinatowns
Do most Chinese live within Chinatowns? Ate these plaCesstill islands of Cathay'in America? The answers to these qUestionsdepend upon the city you are talking about. Sbme,Chinatatma aregrowing and expanding and some are in. various 'stages of decline orhave disappeared--and for diffeient reasons.
In Honolulu, where ethnic bdundaries were neven-sharply defined,
Only' the Chinese lixanifested-any marked tendencyno concentrate residentially . . v by 1884' for exam-
ple; the Chinese population of Honolulu had increasedto more thanfive thousand persons, of whom 73 Percentresided within the Chinatown district. This, inci-dentally, was the _period when anti-Chinese agitationwas at its height. . . . Within another twenty years, ,
Chinatown was definitely on'the decline. . . .5, -
0-
4. Op. cit., (New York: Planning Commiss , 1969), p. 46.
5.. Andreill Lind, Hawaii's People University Press ofHawaii, 1967), p. 55.
"41'. °
-60-
.3 7 i

MEM
.:-: 111 I .7 :
S
:4 . I 1 : 1 , 1 a
. Z 11 2*
so
^ . :
._1/0114*$te.04gfilt;
141,5::MMMMMM .,
,::-
,
-
S
\NV
,
I
SI
111
111
11111111

(OM
1 I
1
19al
ih
1ai
lIl
liii
iillr
giV
it.?:
!U.
4t1
Etu
tom
mE
amt.
IIII
1-1
'1
I1
1fr
II1
OM
111
eam
oo...
.'5
11L"
Mtn
xsw
ay
i1iT
---1
II
1'1
Li
-I r
?"--
? r-
---1
r-,
1 r-
-1 i-
----
1 1-
---,
t r--
-1 r
'-'-i
[ve
I1 1
s
'-62-
1
.,,
r,r 19
70
Sour
ce :
Oak
land
Chi
nato
wn.
Pro
ject
..4

As one travels through the Pacifig Northkest, one can latchglimpses of leaning shacks that once were the centers of flourishing
Chinatowns in the.mining districts. These are now ghost Chinatowns.
Urban sprawl, urban renewal, eminent domain have all been -factors in the, demise of many a Chinatown, but when there is aneed, a new one will spring up. It happened in the case of Los
Angeles (see Map 6), where the site ofthe old Chinatown wasneeded for a railroad station. The residents redistributedthemselves inta_three Chinatowns, but'the Los Angeles Chinatownis now reconsolidated into a major one along North Broadway.
Philadelphia's Chinatown was heriously reducedin size when the city converted the main street ofthe ghetto into a thoroughfare leading into theBenjamin Franklin Bridge. . . . Pittsburgh's China-town was totally obliterated by the building of amodem expressway. . . .6 (see Map 7.)
Chicago's old hinatown is centered at Cermak Road and Went-worth Avenue on the South Side, but, with its population more thandoubled since 1960, the old Chinatown has no more room for expansion.Besides, more Chinese are found on the North Side, so an enterprisingbusiness group has been quietly buying up a three -block stretch of'property along Argyle Street and is busily planning a fanciful new
Chinatown. 7 (See Map 8.)
Boston's Chinatown is the mutilated victim of a superhighway--theMaasachUsetts Turnpike. When that,cement ribbon bisectedChinatown, half of the community life died and the people movedaway. In 1940, 62 percent of Boston's Chinese resided in Chinatown.Each decade saw a reduction: 57 percent in 1950, to 25 percent in
1960, to 9 percgnt in 1970: Table 18 shows how widely .scatteredthe Chinese are in the metropolitan Boston area, and the pattern of
their dispersion. Although only a small percentage of Chinesereside within the Chinatown area, the place still ,serves as a social
and cultural center. (See Map 9.)
San grancisco's Chinatown
San Francisco's Chinatown burst its seams and spilled over into
6., Rose Hum Lee, The, Chinese in the United States of America:; '(Rong'Kong: Hong Kong University Press, 1960), pp. 65,-6..
7. East/West (April 1974).
-63-

N,
0-.1
/.r
-/.1
;I
.rA
r,""
.'
''.
'1s
1!:.-
ra%
-64-
.
RAP 6
Source:
Los Angeles Chamber of Commerce Publication

r
North Beach and spread out to the Inner Richmond distribt, Map 2shows the core areas and expand0 census traits. 33,208 Chineselfved in thisarea'in 1970, and-'the population density reached from120 to 180 persons per gross are as compared to 24.6 persons per
'gross acre city-wide.8 Map 3 Shows'the,proximity of the-NorthBeach area and Inner Richiond district to ChinatoWand explainswhy, in part, Richmond has become "the other Chinatown."
In a-series of articles in March and April 1974, East/Weststated that real estate prices'are going through the'roof in theRichmond district and 80 percent of the buyers are Chinese. Togive some idea of the rapid influx, East/West said, "One blockin the Richmond/core area has seen 14,-property purchases thisyear. Ten of them were made by Chinese."
The houses in this area are primarily private dwellings andamong the' attractions of the area are its excellent public trans-portation to the.main Chinatown, better housing, and proximity toGolden Gate Park. Only 10,265 Chinese were counted in the Richmonddistrict in 1970, but if the recent frenetic scramble, for real es-tate in that area is any indication, the numbers must have increasedphenomenally. Still, Richmond is a bedroom community and has notcut its Umbilical,: cOrd,to the main Chinatown. Nor is there anyway, at-this moment, to ascertain whether new immigrants are snapping ,up the CAkatown premises vacated by movers to Richmond and other.districts. If SO, Chinatown proper's problems can only be-aggra-vated by the rapid turnover of its tenants and the more acuteneeds of its recent arrivals. -,
New York's Chinatown
New York's Chinatown merits special attention because it willno doubt soon replace San Francisco as the Most important centerof the Chinese in'the United States for reasons already set forthabove. .
When Calvin Lee wrote his book,, Chinatown., U,S.A., in 1965, hepredicted the decline of Chinatown and 'so did Rose Hum fzee, the eminentsociologist end former head of the Department of Sociology at. RooseveltCollege. 10 But these People were writing before the enactment of the
8. "San Francisco Chinese Community Citizen's Survey and Fact-FindingCommittee Report,"'p... 54.
9. East/West (April 10, 1974), p. 8.
10. Rose Hum Lee, "Decline of Chinatowns in the U.S.," AmericanJournal of Sociology 54 (March 1949): p. 442.
76'-65-

-J,.%
"'L
_IL
_..I
L.1
Gir
ad
t'allq
icI
1
II-
kn.
1.-I
rst
ilr--
t-G
C-c
-G
IOA
Kb
1"I
I3.
17L
:37:
1, r
i Li 1
7,i
[117
;-1
_n7
1F
_ .
rh*4
\fa
lser
o S
ot,
LM
AP
7
PHIL
AD
EL
PHIA
CHINATOWN
'
-1970
-7V
.o.
Ako
no,
of A
rt
76
L
Iy
%A
rdZ
IWR
IE71
4if
a
[Mtn
?:ca
jtom
en
1.14
.44M
1ri
t t=
4-",
°G,.-
--I
I
,1,..
-:C
athe
dral
of
R.1
,-,;F
I,,,,
,,n1
.1..,
,..,..
_.c.
.....'4,),
,,it.
,,'1"
11: f
."4.
c_.
co4,
17rA
t "'"'
,1;1
;;717
.1C
N.V
.4,
,.,,,,
Lt c
ol1-
II"l
loPh
o II
I
y iu.
c.A
. C
9140
ST.
....-
o O
feb
l;Ilj
LS
hent
oHta
Cw
Al
Wam
ent;/
I:
II
I ' L
ouI
L...
43 j
1.1_
, Far
e,: i
Sel
a E
d....
..1c
ER
T
Ple
adI
OW
j711
:[1
RA
IN F
. 1-1
-t,
-
---.
7---
-r-
-1jU
In...
...,
"-a]
TPe
nnC
ame'
Inn
' FG
;hor
mIl
lloor
orof
tstr
oo-1
I-1
far
esdi
rm1'
ici
tyO
r :a
'1;
r H
A A
mu
110
'MA
RK
ET
AN
T (
MIM
ISa
d,' .
..j i
,L
-,...
----
--'
YW
CA
.i
Pout
sle
4 L
_sL
ip-E
lf,,u
sL__
_ A
liril
it- H
olid
ay In
n=-
II K
"'"h
. 7r
,.c.
I
,..71
Penn
Cen
tel
t
1
1
C E
STN
T
foto
hos
t Chu
rch
p -
1 r-
--1
Lii
mitt
r,H
olid
ayId
, 1
,
oynt
letif
11-1
4*/;s
h'id
lijin
vi .7-1
Lat
a747
8e ;n
ue S
t: O
f. d
Hot
elL
oten
in d
ecer
a-. I
ImpI
n S
W&
flo,
prC
hin:
nom
iqsr
-
Scou
t--
-11a
1 A
IN
lz,,,
,,[
I F,
;:-..7
,a
Met
htit
Dd
=11
,24-
si.A
1,r,
...7,
1=,"
AN
I<I,
Lts
s
tii+
771
T1;
ir1
... u
.s 1
wyg
w.Q
Inde
pend
sn
Col
** fa
Ifer
sa,n
,o
Pfa
telo
l,c4y
L I
3
L
174a
rttfi
k S
ckoo
f71
Sw
ett o
afA
zti:
I
I-1
1 1
,acc
L__
fF
Pead
ial
frE
lf.
"1C
lot
La fr
o1
Lou
Ty%
:fia
t4.
-I 1
1111
,
It.op
m11
Mon
d:T
liV
olvo
Lai
11
f /A
l k f
rit 6
1711
**SW
111
0.,,,
,,,I
1 I
Clo
w c
ocoa
IPo
ly, C
roon
erL
111
-J1.
clu
Car
neFr
ia,
-1
TH
.,
firm
i15T
1
ifts
tonc
Al
aj tf
.mor
m lO
ossr
anrt
irzi
rJr
$
r711
.46.
17°'
"r--
--1M
edic
°411
Ben
jam
in F
ank
lin H
ate
t...'7
tont
o
lAar
r
1,40
4 T
hlic
ticc^
-e-,
,,,L
,,:'
j
f:lo
or S
rorr
erri
glA
Usi
nct_
iL
IV!!
!..!
"Isd
eldh
.n, 4
[-2,
1,,,b
,aof
mow
ofPr
oosy
l000
ra
s
The
Bar
clay
Hot
elI
Ic-
het"
'r41
.-44
6."°
s'°
44
avay
irtr
al
tlt'T
...-
Ho*
L1
ST
ladr
ywoo
t tV
rillin
FIR
to7l
iarr
e. ;:
7.1-
1Ncw
Cai
toA
t7IZ
ir..
com
4,,,,
,,,.,
,46
1, :7
/6,C
41,
t.. ;
4....
....
1
[111
1F-
--- J
t.,,,,
reer
kt '
s,
mi..
; ',.;
',4*.
i.1-4
,..-e
......
JIl
i.--
7r.
-7. 1
4'"
:'1
.111 MI
i
itil l
ihi
; 1 >1
111W
aAis
lon!
S,7
0or
;
PI13
11gr
dor
e Si
1
"
7°07
$1 tr
vet
,41
L w
ayP
rofm
rit
alA
nts.
* 11
too
1.:1
4H
P."1
1 L
---4
4:41
Source: 'American Automobile Association
Society
Hill
1222
.
HA
W.,
Tan
Arc
ara
Tit:
A77
221
4;71
jr1
I1,
:r7i
.ic
-Ilf
tz:.
-66-
Ti
r1
LOM
EIA
Y.W
.H.A
.$T
Oil
I7
, ! E_a .
7.:3
f:ad
II
LJ
1_1
11
nth
IIC
E1-
1E
i1
E-1
{-1
1-1
I-1
r--1
rtr
I-Fi
F:1
-1ru
n t
c4.

)-- tIFOCcomum=
MINE FABloRPARD 7,
KlEkIEL
If aRwuaArt
Iv
El
W.
wMCA
' E12121.11TI1:11212R111
avia
.cv-
firff .1111111MIIIMPIIKCIFAh
DOWNTOWN
CHICAGOAND LAKEFRONT
MAP 8
SCALE OF MILES3 IA
CMIE INCH LOMAX'S APPROXIMATELY VS OF A MILEF
w
EISENHOWER
HARRIS/3r- EONGRE
AV
vr.
w
13TH
14TH
commizEin NMI , ,flonsieriMiriell tr.
__1 "ming I'lh-ONTARio cr 0.77 -- 7 4 IsE)
I 'a ,
"-'"-". g."( -=',I t ST
14
W OHIO _ST STN \.
lnIW/111=3 Niiirni,Z-rirr
.,. LA-09 _UM. kififfilli
oc)-,.
, V-7K 12 Mk
re2 ....7,IIIIFIEa
ANY
clz.,Po r, mi. '^i'
= C ., g -4-4. ' F, RAN=I
I ln i Wttic%<
.-.... ...
ACKSCN BtI
xr,ST
52E1
woosPt.
DeZDAnvSISJ
ST
at.% vror.
011D1111100WV11111LSI
Slal
rn
CENSUSWO"34070
/46._
=1151111111UC
mrs...VANI/MIMI ST- =1101.4A-iris 1161E0
W
w
W
y
egniT
!". rt its
< 1111 COMM zco ST
E r" illiii4"1:2014 Vf
1111 ,
.10
MIMI.tt
W 17TH
,
3241,
TODsr.Pt
r
giI
r1
te
r /----
st.
It
2 11,M Spot if
72.10Pc23PC
aI
MOILCORANot t
a.Men
ITE *TY
zLS
.1. te. S.PV11$411 Hag
RCC mnPIT. TvT.-
butt Cu Ipt OCP
z
s.,vIn
Chierys,
Cs.hatR $1.0.4*
AvAtstvi
P
my/4, ron'tv,/,'-
MONR
E ACKS N
I>)',Crud Ce160
41.
Talc
1 'CO
4
Ce.hd '041 E
1 1
VI ISM ilIst
NIST y
It
.411 Cn
NMI /1/
sr
111-
Mr
E DR.
IOUikN
VetDR.
\pp
DR.
T
CRilhd
maw&ew Notcovs
DI Revel RoanPew
tv-NiTr4.!arPAMIR $10044 die
livers NullArum /tem
CologioTodd 0.11
1 UPI CIA
Chicago
GRANT'Harbor
egclgitall roPtais
,BALBO R.
03 edam.2tspg gtg? tk.o.
V.5 kt
WA*. Rog
Pt.1114
en.
I nlr
IN )
t11.
4T H zISTct:49111('
Iwko, It
Wail RAMO
tt'.7-4 E 4 rtt 8...vo mom,
'A.., kka'La- -..._ai
15TH
XE .. FAi
Ot. .Pelit CM
El \. , , ii,
ST,
', k '
,i
1
ril
71:7
PARK
Aseedga
11 34'
US.Cas cui
=V.
Siv. >
TIt
ST
to
,pg
ti t
WAI CRON 01,
lull tI ova .<VssP sr, I/ET AT
lvinaInge
I, 11O CULLtIt:, tl
BurnhamPark
Harbor
.020
1111®
IRREI,TIC
111Lt l4 1111111111
4111.1.111.1111111.1.111.0
21 2/TH
"WT11
291 ST
'
V
Lep
2RT
V1 .SAMIAA E 111
Source: American Automobile Association 6 0
.4
4.
MIN Mr,a
12111LiE
ir17In
1 AMOOV
:g
l'12ht/ STo r1. ......r.mo.
tOtoC,
t
1;1T'
1 TO
TNHe-
II
El
Contickace
29111
E /31 f',4
12th SSRC
NORMS'ISLAND
NOP!.1
Merrill
3W Shod,
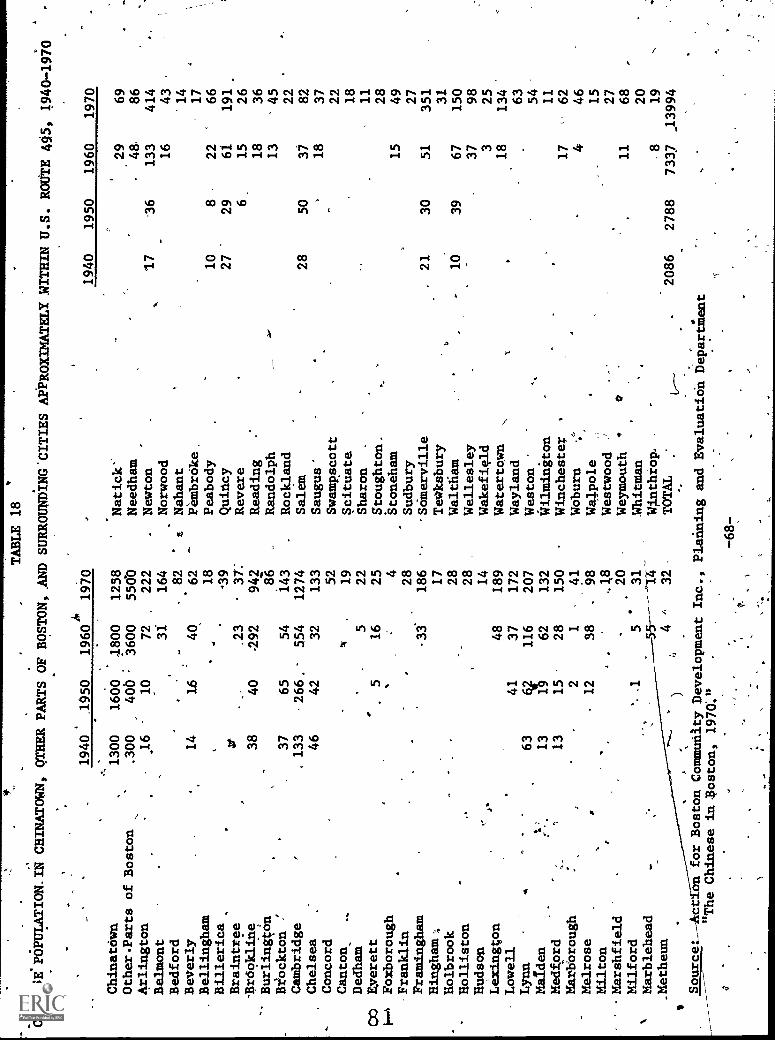
,TABLE 18
'
CHINEHIPOPULATION.Iii
CHINATOWN, OTHER PARTS OF BOSTON,.AND SURROUNDINGCITIES APPROXIMATELY WITHINU.S. ROUTE 405, 1940-1970
CO
1.-.P.
N
s
_1940
1960*
1970
,1940
1950
1960
1970
.1950
.,_.
-
Chinatown
1300
1600
1800
1258
..
Natick'
Other.Parts of Boston
.300
_40b :
3600
550b
Needham
.
Arlington
.16
10
.72
222
Newton
Belmont
31
164
Norwood
Bedford
-82
'
zNahant
Beverly
14
L6
.
40
62
..
PembrOoke,
Bellingham
.,
18
Peabody
Billerica
.39
Quincy
.0
Braintree
.23
31.
Revere
-Brookline
38
40
292
942
Reading
Burlington
'
.86
Randolph
,Biockton
-'
37
65
54
143
Rockland
Cambridge
. 133
.266. 554
1274
Salem
Chelsea
:46
42
32
133
Saugus'
'
Concord
52
Swampscott
Canton.
A.
*19
Scituate
Dedham
522
Sharon
.
.Everett
.5
16
25
Stoughton _
Foxborough
.4
Stoneham
-Franklin
.28
Sudbury
Framingham
-33
186
-Somerville
Hingham-,.
17
Tewksbury
Holbrook
28
Waltham
Holliston
28
Wellesley
Hudson
...
14
Wakefield
Lexington
p48
189
Watertown
.x
.
Lowell
41
37
172
Wayland
..
Lynn
-..
63
116
207
Weston..
-,
Maiden
t;
...
13
62
62
132
Wilmington
Medford
13
15
28
150
Winchester
,
Marberough
21
-
41
Woburn
..'
Melrose
12
38
.98
Walpole
Milton
r.
.,18
Westwood
Marshfield
20
Weymouth
.o
Milford
*- .1
531
Whitman
,
Marblehead
-55_____-.14
Winthrop.
.Metheun
.4 A
32
TOTAL
,,
Source:
on for Boston Community Development Inc., Planning and Evaluation
Department
"The Chinese in Boston, 1976."
17 10
27
28
.21 16
2086
'
16 8
,
29 6_
50
30
39
2788
2948
13316
22 61
15
18
13
37 18
15
51
6737 3
.
18
17 4
11 .8
7337
69
86
414
43
.14
1766
19126
36
' 45
22
82
3722
18
1128
49 27
35131
15098
25
13463
54 11
('
62
46 15
27 68
20 19
13994
4-687
c

She
n...N
ut Ili
tna
1'
z
AM
ON
Iwo,
Ave
nue
1:14
nEar
t0.
JH
arris
on
\,
an> \
1 (4
-
Was
hing
trS
hit e
t
11I
,
:
--a
of
HI
-116
ST
ON
'S ,C
HIN
AT
OW
N,
1890
-197
0Map from Boston's ABCD Plia4ng Dept.'
111
,,
t
Nt
C
sTnE
tt
;-
x1,
-,- -
.2. 1
"'3
...,
a '7-
,g
_J
IN
i--
a--
'L.
t
0/11
10.
_...I, _A
' - -
,,,...
,-
.
-
tift;.
.
.'V
"
aQM
IZIN
G1=
i 2=
6""
.12
At
1.,"
1
;;17
i"
o ; It_
-If
ie2.
WI
,
114,
050%
'111
101
_-1
.
/
ft/7
1ift
6.01
1
ftl
s4r
1-4
%it
WII
IIM
MO
.
4 41
4
ST
RE
ET
40-
4n-o
`
r..
'"--
."A
PPR
OV
MA
TE
150UNDARIES
Oy -
_
xxxx.xxxxx 1590
1951
-69-Arter
41.4
1 O
OO
OO
41
41910
sir
sr s
r 4,
sdr
195
.nua
nYnn
XX
nnvn
..1935 orsom 1970 fillf,Ir9
Sfn
EC
T
oalls
t
J,4
thr
0 0
J

o
Immigration and Nationality Acof 1965k which changed the entirescenario for the Chinese in this country.
0,
Today's New York -Chinatown, compared with that of-1960, has'increased in size three-fold. Unlike the.Chinese in San Francisco
or Chicago, where there was no adjacent roam_kor expansion, NewYork's Chinese have been 'moving into other ethiic ghettos surroundingChinatown. Little Italy Ind the Jewish stronghold off Delancey.Street are slowly receding, while recent Chinese immigrants arereplacing the former inhabitants of earlier immigration vintage.This turnover is but another repetition of the classic patternwherein the newest immigrant groups takes over the Lower EastSide, while the former immigrant' group moves up and out.
With each passing year, hoWever, the physical environment of 'the area deteriorates further and the social ills of the neighborhoodprogreis., The Chinese, now moving in to be as close at possible toChinatown, have inherited'the dregs of the Lower East Side-- dilapi-dated buildings, tht worst schools, overcrowded conditions, high
--tsluininitals,"filthy, garbage-ridden and pest-infested streets androoms, and indequate city services, ad nauseum.
People now ask, "Why is it thata formermodel community, likeChinatown is experiencing gang killings,-muggings, school dropouts,and health problems unknown to the community a decade ago?" Theanswer. is simple and has been given by socia scientists long ago.Whenever a large immigrant group is uprooted and set down into theenvironment of the Lower East Side, the result will 'be a impoundor end-prbduct of what we see in Chinatown today and what we sawin the ghettos of.the.drish,:the Jews, the Italiani, and the PuertoRicans of yesteryear. The experiment has beenrepeated"many times '41
'previously, always with the same outcome.
0 Chinatown proper in New York has traditionally been bound onthe north by Canal Street, on the west by Mulberry Street, and onthe east and south by the Bowtry and Park Row. This area takes in
census ttacts 29 and 27. By 1960, the surrounding tracts'8, 16,18, and 1 Also had large Chinese populations: .The deity PlanningCommission indicdted that there were.10,604 Chinese residing inCI:14114On in 1900.11 In 1970, the .census counted 21,796-Chinese.for these same six census.tracts, but the b6undaries of residentialChinatown have extended to-cover many more census tracts. ,Judging
11. D.Y. Yuan, "Chinatown and'Beyond: The Chinese Population inMetropolitan New York," Phylon 30 p. 59.
8 4
-707

b
from the Chinese population by "census tracts,12 the boundariesof the enlarged New York Chinatown reach as far north as HoustonStreet, and there are WIreadyindications that FourteenthSereetwill shortly be the new' northern boundary. .Expansion southeasliwardhas also taken"place to as far as the East River's edge. (See,
Map 4.)
'Within this expanded area are found approximately three out F -7of four of the Chinese living in Manhattan. In other words, instead_'of scattering likg Boston's Chinese,t New York's Chinese have tended,it seems, toward gpater concentration. 'In the eight-block censustract 29 alone, there are about 6,000 persons of Chinese extraction,which is more than the total number of Chinese, foundrin the entireSMSA of Philadelphia. Twocensus tracts, 29 and 414 contain moreChinese than the states of Illinpis and Massachusetts combined. Andwhen one considers the Chinese community in New Yo2k, one has tothink of nineteen Census tracts rather than the six of 1960. Thisis the extent'to which New York's Chinatown has pushed its boundaries.
Obviously, then, someChinatowns are fading away, and theirinhabitants scattering. Some have undergone fade-lifting; somehave moved to different locations, and some are like a powerfulmagnet drawing the Chinese closer together, culturally and spatially.Each community must be viewed separately and dealt with separatelywithin its own context. Even here two questions might be raised:Why the differences in Chinatowns in different cities? If thereis a decided propensity `for the 4hinese to stick together, whlkisn't this consistently true? -"
Does residence, in or near a Chinatown affect the occupationalprospect of the Chinese? How about residence in,a particular state,city, or region? These are question which we seek to answer as weanalyze our data. Wherever applicable, I gave broken down my
:tabulations by,regiOn, state, or SMSA to see if place of residence '
or moving away from Chinatown has significant effect upon occupation,income, and upward mobility of the American Chinese.
12. Author undertook-aspecial tabulation of "Minority Populapionby Cetaus Tracts for EleyenSMSAs, 1970." This data was issued
'separately in threevolumes by the Department of Asian Studies,City College New York.
.-71-
8 5.

-
1
.
SUMMARY OFFINDINGS
1. The Chinese in the Uniterd States are highly concentraied:
a. along three logitndinal strips on the East and:Westits and the islands of Hawaii;
e lgrge urban centers;
in Chinatowns.
'Of
.t
2. Three times. as jnany immigrants are heading toward New
Yo4 City as, are head: to San Francisco. New York drags more.,--
immigrants t the n e other cities with sizable Chinese poPu-
. 1 -...... lation commie -.
s 3. Hawaii's4Chinese populatil growth rate is much lowerthan that of the mainland states. \ , " .
,.
. q ,. . .
s4.'
4, 2 5 .., . '.
.4. The agelkyramid A the ChiaeheTopulation is beginningto resdkble more au age diamond -- widest in the midd .and tapering.
'off.rat.both ends. This means few teenagers; fewer c ildren,, andeven fewer infants. 1
. t
. //
J 5. One out of five Chinese sixteen y arb and over, was not )in this country in 1965 and three out of five moved within thefive -year, period of 1965 to 1970. In effect, the Chinese popula-tion has been &highly mobile-androotlessone.
;._ ---. 12- . .ez Vik.
6. There are significant variat ns in employment patternsand economic characteristics of the C Inese based upon place of. .
residence. .
.
f*
o
7. The Chinatownithroughout the United Stites are undergoingma)or_transformations., The closed, taid, and "orderly" Chinatdwnsof the past have been-dramaticilly affected by the recent largeiafl,ux of immigrants".
.
-4
,
&,V-72-
7

RECOMMENDATIONS
A decided shift is - place in the, pattern of demograplic
distribution among t Chinese. The older and better-known Chinesecenters like Ho. ulu and San Francisco are proportionately losingpeople to n- settlements like New York, San Jose, and Houston.New Yor s influx is coming from immigration. San Jose and Houston's_ -"
is coming from intraregional movement. The occupationalroblems of the migrant groups are not the e as those for.-the
immigrants. The migrant groups may be mov g because o£-upward'econdbic and social mobility. the immigr t group made a trans- ,
Tacific')ump and, in the process) uproote itself to totally alien
soil. it has problems Id a strange environment, a different lan-guage, difjereqt ways of doing things,'idas of, seniority or tenurefromform occupations, and conirontition with'new requirementsof citizenship, licensing, Lresidencel and whatnot. In looking at
the oblems of employment, it'is essential to give priority toth e areas With.the greatest need: New York's Chinese seem toe hqddling together for greater secqrity and comfort, but ,in the
process theymay be creating other problems of overcrowding andexcessive crutch-leaning upon one another. The concentration alsocreates a favorable climate for exploitation of cheap labor.--
,--
..,
,It is also axiomatic that high concentration creates hie
visibility of an identifiable minority group. Psychologically,1.ths tends to generate fears that the majority's existence and°
-.
way of life is being threatened by the minority. I would recommend. that the Chinese_' gradually be indiCed-Or aided to disperse, but
account must be taken of their desperate need for:saie proximity
. to a Chinese center, .
t
8-
*
9)
Perennial Students
CHAPTER IV
EDUCATIONAL LEVEL
Case One: Jason Wu came to the U' ted Stgtes in 1946. He
was among theeecond batch of bright oung men selected by the
Chinese government, immediately afte the cessation of hostilities
. with Japan to go abroad for sieci ized training in the United
.States. His field was hydraulic gineering, and he looked forward
to a-promising futUres4fter the- completion of his studies at the
Ainiverfsity of Illinois..
JssoniSlready had . a b- helor's degree from the Southwest
Associated University in ungking, China, Wore coming td the
.United States. By 1948 he had'earned his master's degree. The 4political situation in. China was very uncertain, and hisyarents ,
had urged him to pro ng his stay in the United Stites. 'He decided
to go for his:docto ate.. -
A year lat , the, Nationalist government had fallen, and,!in
1950, the Kore- War brcike out. The United States immediately
banned theide rt of all Chinese students with technical and
scientific s ills With his financial support from Ching cut off,
Jason was ught a bind. What was he `to do? He Was not sure
that he c uld ever get a JO], as a hydraulic engineer in this 'country.
. Perhaps eshould be more practical and learn Something that he
could tilize to earn a-living somehow. He switched to accounting'
and, ith the-aid of Economic.CooperationAdministration (ECA)
fun's, managed to complete his masters -in that field.,
The KOrean War dragged on. Even with his accounting degree,
/Jason. could :fnot employment. HiEs. professor in eneneering,
realizingthis plight, offered him a teaching assistantship along
with ,the chance to complete his doctorate. Jason grasped the
opportunity.
0-75-
8.8
ti

fr
C
IA
' By 1955, Jason had two master's degrees and a Ph.D., but'still 110 job. He was not permitted to leave the United States;but neither was he permitted to work because he held a student
.visa. The only course open to'him was to find a part-tithe teachingPosition and continue his student status by,doing:research.
4,Ten years after his graduation from college, he was still,
studying--not by choice but by force-of circumstances.
Case Two: It was the second time around for Kai-Ming Fongwhen he arrived in the United States in 1951. The first time waswhen he worked for a master's degree from Georgia Tech in 1945;he had gone back'to Shanghai immediatelefterwards. Within afew years, he had already become manager of Technical Services atthe Shanghai airport. In ,1949, Shanghai was liberated by MaoTse-tung4s troopd, and Kai-Ming fled the city for Hong ,Kong. Heconsidered himself highly fortunate to receive a coveted .Visatothe United States under the Refined Relief Act.
'
During his fiist sojourn 14 the United States, he had not ,
paid much attention 0 what was going on outside of campus. Inspite of his education, his experience, and his know-how, Kai-Mingrealized that he was 'a fish,out'of water. The task now was tosurviVe.in a fOreign.,land. Re accepted a lowly draftsman'sRositioh.in an aerospace plant on Longlelandaand every night'commuted toBrooklyn Polytechto pursUe a Ph:D. degree in aeronautical engineering.;His indomitable determination kept him going in spite of bone- weariness,and mental fatigue.. After work, it was classes;, after classes, it wasstudying, There was no time for relaxation, no time for irls,- no timefor fUn. By the time Kai-Ming received his doctorate, be had'FisSedout a ldt on life. He was thirty-five years old' and still; single., ;*
O.,
Cage-Three: Dr. S. W.; Lee had worked .in the obstetrics and .:gynecology ward ofthe'Canton General Hospital tot- many years. bdfore
. his arrival in the.bEitedStates in'the'1956. His M.D. was 'earned ,
.from a Canadian university. But Dr.-Lee could'not practice medicinewhen he first dame to this, country: Reason number one He was nota-citizen. Reason number two: His-M.D. was not from an'American
. university. ., .
BmployMen r Dr. Leewas .a matter of .dire necessity. He, ,
had a wife and two young daughters with him. To tide them over,Mrs. Lee worked as a hostess id a restaurant. Dr. Lee finally e .
found a position'as medical researcher at Mt. Sinaiollospitale 4The pay was insignificant and the work was elethentary, conSideringDr. Leg's education"and former experience.
.
-767
4

TABLE 19
,
'SCHOOL YEARS COMPLETED BY THE comm. IN
THEcU.S., BY AGE GROUP AND SEX, 1970
Jr
-
Total 16 Yrs:+
16-.19 Yrs.
20-24.Yre
25-34 Yrs.
35-44 Yrs.
No.
No.
No.
No.
'%
No;
Maid;
163,893
100e0.--18,757
100.0 - 22;996, 100.0
33,575
100.0
31,082
100.0
7Elementary
Less than 5 yr's.
15044
9.6.
166
0.9
139
1.5
844
2.5
2;013
6.5
5-7 years
13,494'-
8.2
236
1.3
302
1.3
1,032
3.1'
2,'474-
8.0.
'8 years
'
7,962
:4.9
492-
2.6
'192
1.0..
581
1.7
1,500
.4.8
High,School
1-3 years
24,703/
15.1 '.10"000
53.3
1,664
7./
2,472
'
.7.4
3,593
11.6(
.4,years
'
32 910
20.1.
5,137
27.4
4,750
20/7
6,241
18.6
6,579
21.2
College
1-3 years
28,125
17.2
2,707
1414 '12,465
54.2
5,324
15.9
'
3,836
12.3
-4 yrs: or .mote
40,1355
21.0
13
0.1
3,284'
14.3
17,081
50.9.11,087
35.7
Med, Sch. Yrs Compl.
12.6
11.5
.14.0
16.,1
'12.9
Percent H.S. Grads.
62:2
41.9
89.1 /
85.3
69.2
Females.
145,012
110.0
17,p99
100.0
22,888
100.0
32,411"
100.0
28,194
'100.0
Elementary
Less. than 5 yrs,
22,202
15.3
194
1.1
-520
2.3
1,682
5.2"
4,238
'
15.0
5-7 years
12,292
'8.5
236
1.4
716..
3.1
1,788
5.5
3,258
11.6
8 years. -
6,294
4.3
452
2.6
.4340
1.5
982
3.0
1,349
4,8
High School
1-13nars
19,623
13.5
8,773-51.1
1,762
7.7
2,655
8.2
2,638
9.4
4 Yeats
35,101
24.2
.4,648
27.1- 5,405
23.6
7,920
'24.4
8,325
29.5
College
1-3 years
25,547
17.6
2,781
16.3, 10,790
41.7
5,964
18.4.
3,421
12.1
4 `jars.. or more
23,953
16.5
15 .
.1
3,355
14.7
11,420
35.2
4,965
17.6
Med. Sch. Yrs Compl.
12.3
11.6
13.8
13.6
12.3
Percent.H.S. Grads.
58.3
43.5.
85.4
78,.1
-59.3
Source: U.S. Census Bureau, Subject Report, PC(2)1G
(1970).
-77-
45-64 Yrs.
65 Nx
.+N6.
%iNo.
42,239'
.15,244
6,587
15.6
5,379%
t,290.
14-.9
,3,160
3,556
8.4
1,641
5,568
.13.2 A.:400
8,685
20.6.
1',518
3,358
4a5
8,195
.19.4 4 .1,295
11.5
6.7
47.9
21.3
4o
32,808
100.0
11,612
8,907
'27.1
6,615
.4,67/
14.3
1,617
2,336
,7.1
815
3,099
9.4
6'
7,907
24.1
896
2,206
6.7'
,..
385
3,676
11.2.
522
9.5
4.4
oltr
15.15
1
00.0
.
38.0
20.7,
108
.9.2
.10.0
...2.9.
8.5
100.0
.57.4
13.9
7.2
4.0
7.7'
,
3.3
4.5

Work, g at Mt. Sinai, however, entitled Dr. Lee to enroll forspecial crourses in the medical school without fuition. So after
his long trail of premed, medi8a1 school, internship and residencytotaling more than ten years, Dr. Lee was back in the classroom.
V/ ...
'CaseFour: Ronald Wong (Wong is oneof the most common Chinesesurnames) was born in Newark, New Jersey. He loved baseball, he
loved rock music, he loved the,outdoors, and he loved people. His
family operated a restaurant,, and, after school, he helped aroundin the dinidg room, filling the soy sauce bottles and sugar bowls,drying the silverware, taking in the dirty dishes, and whenever hecould, he turned on the juke box.
Patrons would come in and sit at the bar, watch the baseball,games on T.V. and sip their drinks. Ronald soon became great palswith Maurice Cohen, the salesman who sold his father bot4.0 liquor
and wines. Ronald would listen to Maurice Cohen's storieof theplaces.he went to and the commissions he earned, and Ronald decidedthat when he grew up he wanted to be a liquor salesman.
"What?!" shouted his father and mother when he first mentioned
the idea. "Absolutely no. We have labored all ourlives so that
we can afford to send you to college. You are our first-born son.We want you to be educated% not like us who -can barely read or
write. You must go to the university to study. Be a doctor, be
an engineer. But a liquor° salesman! How can you possibly disap-
point us so?" So Ronald went to the university and studied engi-neering for years. ,Now he has a desk job and a nine -to -five
schedule, drawing up blueprints that bore him stiff. All the while,'
he daydreams of being out on the road, listening to the ball gameswhile he's driving and using his persuasive personality to sell thebar, and liquor store owners five cases of bourbon when they only
wanted four.
Oveudticated
.
Cases one to four above explain impart why the Chinese are
such a,highly edudated people. Add to that the high esteem iv whichscholars or menof learning are held in the Chinese culture andyou can see wit). a full qtiarter of all Chinese males in the United
States sixteen years sand over'are college graduates or postgraduates.(See Table 190, Even 16.5 percent of the females hive attained this
this educational level. And when you follow the column down under -
the 25- to 34 -gear age bracket--a time when most people have finishedtheir'formal education--you will find an astounding. 50.9 percentofthe males and 35.2 percent of the females in the college graduate or
91
4
1

postgraduate level. Note alio that in this age bracket, 85.3 percentof the males are high school graduates and the median years of schoolcompleted is more than sixteen. In other words, half of the Chinesemales 25 to 34 years old have sixteen or more years.of schooling.
A more detailed breakdown from my special tabulation of thePublic Use Sample Data reveals that 16 percent of Chinese malesand 9 percent of the females have gone for postgraduate studies.,
At this point, I must again caution against unqualified inter-pretation of the census data, for the numbers may be biased to astrong extent by the return of census questionnaires from the bettereducated. Neverthel6ss, in the absence of more reliable statistics,we must perforce use what we have with the understanding that theinformation is biased.
If the 25- to 34-year age group.educational attainment is high,that of the future generations promiges to be higher. In the aebracket immediately preceding, the 20- tb 24-year-old group, illite-racy is minimal and the percentage of high school graduates is 85.4for the females and 89.1,for the males. Those who are at tendingcollege or are,graduates reach 68.5 percent for the males and 56.4percent for the females.
Undereducated
Age and sex are the crucial variables. At one extreme we havean extraordinarily well-educated group. At the other end of the agescale, especially among Chinese females, we have the opposite. In
the same table, we see that 38 percent of the males_and.ayNOpping57.4 percent of the females 65 years and over have five years ofschooling or less. And in Table 20, we see that the "less" means20 schooling at all. In fact, 11 percent of the total, Chtnesepopulation are illiterate. Thus, the educational profile, muchlike the employment pattern of the Chinese in the United Statesruns to extremes with a large proportion of highly educated peopleand too many illiterates in either Chinese pr4English..
Compare the eduCational level of the Chinese with that-of,thewhites, blacks, and Japanese in Table20. The illiteracy rate,for whites is 1.6 percent; for blacks, 3.50percent; and for theJapanese, 1.8 percent; but for the Chinese, leis 11.1 percent--seven'times greaterAthan for whites and three time greater thanfor blacks.
t,
Case Five: Gim Gok, or Golden Chigsanthemuc is one of the
-79-r.

TABLE 20
EARS OF SCHOOL COMPLETED BY PERSONS 25 YEARS AND OVER,
BY
`
Total
25 Years and over (100%)
RACE AND PERCENT, 1970
Chinese
Whites.
'Blacks
Japanese
227,165
109,900,000
10;375,000
-353,707
No Schooling
-11.1%
1.6%
3.3%
1.8%
_Elementary
1years
5.1
3.9
11.3
2.4
5 - 7 years
10.7
8.3
18.7
6.3
.8 years
5.6
13.6
10.5
8.5
9High' School
1 - 3 years
9.7
16.5
24.8
12.3
4 years
21.2
35.2
21.2
39.3
CollegQ
1 - 3 years
11.0
10.7
5.9
13.6
4 years or more
25.6
11.6
4.4
15.9
Median School Years
12.4
12.2
9.8
'
12.5
-% High School Grads.
57.8
52.3
31.4
.68.13
Source:
U.S. Census Bureau, Subject Reports:
PC(1)C1, PC(2)1B, PC(2)1q.(1970
-80-
CS

14 percent in the 45-to,64-yeil age bWcket who-has had fiveyears of tchooling oCless. She it forty -six years old, in this
country four years, 1 s in a railroad apartment is New York'tChinatown, has four children,cend works asa seamstress in agarment factory. ..H husband is a c of in's. New Jersey restaurant.
Every day her husband commutes, t New Jersey and returns to:Chinatown to sleep at the ungodly hour of two in the morning.The children:--all four of thearfleep in one room, and the onlyplace-where they can do their homework is the kitchen table. The
kitchen also serves as livingrOom and bathroom. The bathtub isright next to the kitchen sink.
Gim Gok would like to move to New Jersey to accommodate herhusband and provide better living quarters for her children, but
sheis afraid. She doesn't speak English. When she ventures:3 anywhere outside Chinatown, one of the children must accompany
here She knows that if sheimaves to New Jersey, she likely wouldnot find anotherjob. She goes for English language clgpses onenight,a week,'but learning a new language without the foundationof knoWing how to read and write 1 one's mother tongue is doublydifficult.
'Who's Better Educated?
When school costs money, a selective process comes into pia.),
and some groups are fav9red over others. Education was not publicly
supported in China, nor is there tax-supported universal educationin Hong Kong and Taiwan today. Neither is school compulsory. Under
these circumstances, those financially better of give priority forschooling to their sons. ,'
If the family can afford tafend both sons and daughters, thelatter may be educated if the family has shed the centuries -oldconcept that females are spoiled for wifehood or motherhood if they
acquire some book-learhing. That females are not worthy of educa-tion may still be a very prevalent belief among the Chinese. This
explains why approximately 15 percent' of all Chinese females inthe United States have-less than five years ofo schooling and 10
percent Dave never entered a classroom. It is generally the foreign-
. 'born female who is the most deppiVed,and, hente, 4e most handi-) capped. Her occupational sphere is, therefore, extremely circum-
scribed and limited to the'most simple and menial jobs..
. ...1,
.It is difficult for us to, imagine how one can functioneffectively in thighli literate, technical, and complexsociety without possessing-the means of written communication,
,
-81 -
"zi.

...
CD
0
TABLE 21
YEARS OF SCHOOL COMPLETED
BY,THE CHINESE IN THE U.S. 25 YEARS AND OVER,
U.S. TOTAL AND FIVE SELECTED STATES:1970
Years of School Completed
tr.S
Calif
N.Y.
No.
%No.
.44 Total 25 Yearei-*
22701.6..5.
100.0
88;307
100.1
44,993
160.0
No SchoOling
25,205
11.1''
11,972
13.6
7,125
15.8
Elementary l -4 years
11,522
5.1
4,533
5.1
3,037
6.7
5-7 years
.24,296
10.7
8,884
10.1
7,001
15.6
8 years
12;780-
.5.6
4,218
4.8
3,096
.6.9
High School 1-3 years
22,121
9.7
8,004
9.1
4,889
10.9
iryears
48,071
21.2
19,210.
21.8
7,721
1712
College 1-3 years.
.4 years or more
c
24,929
58,241
,11:0
25:6
12,759
18,727
14.4
21.2
3,121
9,003
6.9
20.0
4.
Median School Years
12.4
12.3,
10:4
% High School Grads.-1'
57.8
57.4
44.1
Source:
U.S. Census Bureau, Subject Report, PC(2)10 (1970), Table
18.
NOTE: 184sed on a, 20 percent sampling.
C
tv Alt
.01
-82--
I-
Illinois
Mass
.No.
%.
No.
YNo.
28,310
99.9
7,337' 100.0
7,084
1,183
4.1
543
7.4
714
1,429
5'
244
3.3
414
2,109 *
819
11.-2
1,035
1,807,
6.4
621
8.5
534
3,066
10.8
767
10.5
716
10;666
37.7.
'1,199
16.3
1,304
2,948
10.4
663
9.0
465
5,102
18.0
2,481
33.8
1,902
12.4
12.6
-- -66.1
59.2
12.1
51.8
99.9
10.1
14.6
7.5
10.1
18.4
6.6
26.8
Ae"S
A
but I have known a number of women who have:managed admirably,compensating with native intelligence: !
My, former housekeeper was such a woman. When she first came
to work.for us, I had to drive her to Chinatown every week on her
day off and go pick her up. Because we lived eighteen tiles fromtown, I found these trips extremely time-consuming and inconvenientto me. In spite Of the fact that she had just come to the UnitedStateaE decided to show her how to take a-bus and subway, trans-ferring toithe Lexington Avenue subway at Grand Central Station.'Anyone familiar with the New York subway system would know thatGrand Central Station is the easiest place of all 'to get lost,even when one is in 'full command of the'English language and can
reed the signs or ask for directi4ne: To this lery day/ having
lived overtwenty years in,w.New York I still must rely uponthe signs to transfer or come up to the street-level at the right
r exit.
The first filewe transferred at Grand Central Station,myself, was confused; I had taken wrong turn. 'So I took her
back.to the starting point and said, "Forget what we did before:'Let's start all over again," An4 we d. I needed to show her
only once. She went totChinatown every week thereafter and nevergot lost. Ironically, I accompanied her on another occasion to
'Chinatown_over the same route, and, once again, I was confusedabout which stairway to climb; she corrected me. I asked`herhaw she codldremember after having been led only once. Shepointedout to me all the guidepopts she'used find her way. These were '
ordinary things that I had never notice in all the times I had
gone over that route:;
ky housekeeper was an excellent cook with Chinese cuisine,.but I wanted her to make some Western dishes from time to time.
. The first Christmas she was with us,.I taught her how to makesome favorite cookies for the holidays. Each .time I make those .
cookies, I have to refer to the recipe, but I showed my housekeeper
the proportions only once. For seven Christmases thereafter,"Themade those cookies without'asking me to look up the recipe again.This woman had developed her faculties ot memory and recall tocompensate for her inability to read and write.
To repeat illiteracy is generally a problem with those overforty-five, e ecially the women. The yoinager generations are'
highly-educ ed, regardless of sex. .
-83-
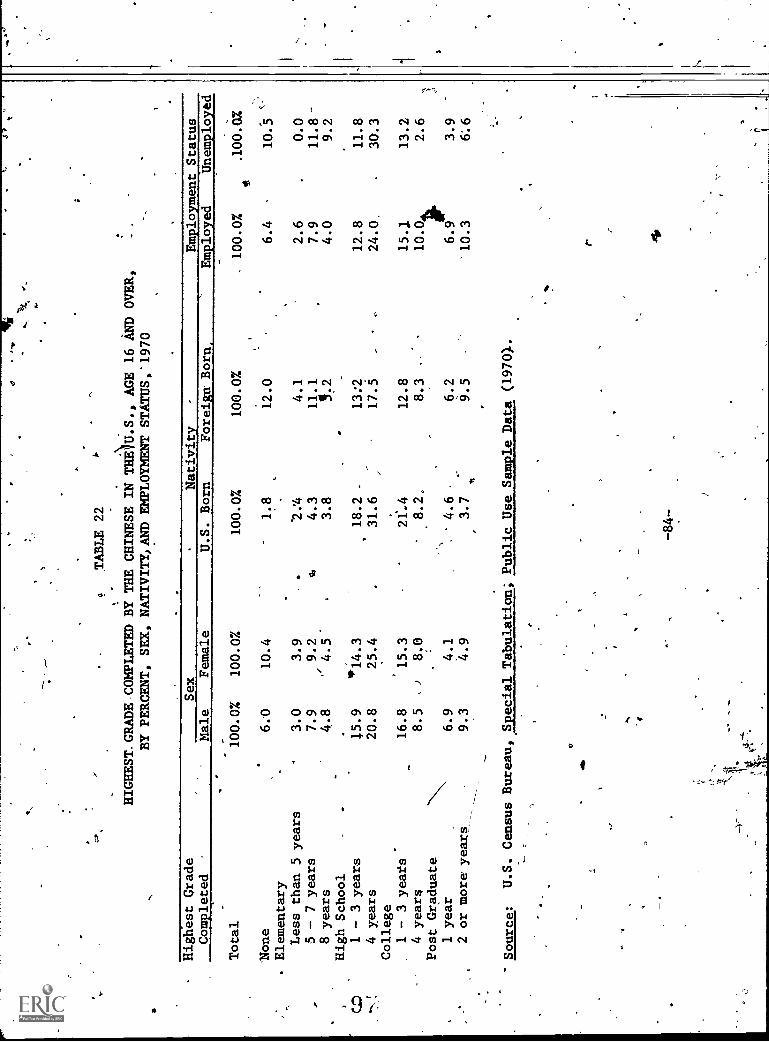
IT
1TABLE 22
HIGHEST.GRADE,COMPLETED BY THE CHINESE IN TH.AU.S., AGE 16 AND OVER,
BY PERCENT, SEX, NATIVITTAAND EMPLOYMENT STATUS'1970
Highest Grade
Completed
Sex
Nativity
-
Employment Status
Male
Female
U.S. Born
Foreign Born,
Employed
Unemployed
.
Total
'None
Elementary
Less than 5 years
5 - 7 years
8 years
High School
1 - 3 years
4 years
College
1 - 3 yeats
4 years
Post Graduate
1 year
2 or moreyears__
.- 100.0%
6.0
3.0
7.9
4.8
15.9
20.8
16.8
8.5
6.9
9.3
100.0%
10.4
3.9
9.2
'
4.5'
'14.3
25,4
'15.3
,)
8.0
4.1
4.9
. lb
100.0%
1.8
2.'4
4.3
3.8
18.2 .
31.6
21'.4
8.2
4.6
3.7
-
100.0%
12.0
4.1
11.1
g.2
.
13:2
17.5
12.8
8.3
...
6.2
9.5
100.0%
6.4
2.6
7.9
4.0
12.8
24.0.
151
10.04.
6.9it
10.3
t.loo.ila
10.5
0.0
11.8
9.2
11.8
30.3
13.2
2.6
3.9
6'.6
Source:
U.S. Census Bureau, Special Tabulation; Public Use Sample Data (1970.
db
-84-
%
4

k
Education and Nativity %w
In this country, education' is a birthright, In fSct, inmoststates,it is compulsory until Age 16. The kind of education weget is another matter, but just using highest grade completed Asa-yardaick, we find very few. in the lower grade Iovel among thenative-born Chinese. In face,' the Chinese in this country have %
generally availed themselves as much as possible of the educationalopportunities open to them, even in thethe days when a collegeeducation led only'to a bartender's job or other menial work. Theparents, in most cases, were the propelling force in goading theirchildren on to higher educational achievement, evi when they,themselves, were illiterates. The motivating factor is the highesteem accorded men of learning within the ChineAsystem of culturalvalues. In.:the social hierarchy in China, scholars stood'at the
top. Thatis why parents continually urge, eir children to studyhard and reach highet in school. AX the lea t, a high school
eeducation is a must, and mo e than a third of all''a ive-born Chinesego on to college. 4. four-year college degree is,t e rule, whileanother 8 percent go on to graduate school. (See Table 22.) _
The foreign-borneducational profile is quite different. Twelve
percent are illiterate and another 10 percent .finished only the eighthgrade. These figures reflect thejears of school completed for theChinese 16 years of age or older.. (If.they'had not gone higher thaneighth grade after age 16, the likelihood of their going back to schoolis remote.) So, whereas more than one-third of the native -bprn areof college level, about one-third of the foreign-born are below theeighth grade level. 4
4
At the other extreme, better than'16 percent of the foreign-bornare postgradyates. Add this percentage to the 21 percent enrolledin dr graduated from college and you have'a U-shaped educationalcurve instead of the normal bell shape.
Education and Employment Status
it. .1 . .
The unemployment rate for the Chinese, counted. in the census, is
relatively low. Those who were omitted from the census arethe oneslikely to have unemployment difficulties, but,their plight,does notshow-up in our figures because they were not included. Butwhat .
effect does education have on finding emplotment or holding on toa job? Thelogical assumption would be that the bettereducated. 7
have less diff ulty, hence, the unemployment rate:would be lower.
This fact not substantiated for the Chinese. %.
O
In the last column in Table 22, we find a 10.5 percent unemp oy-
4
4

4)
416
men rate for those with no 9ducation and 'the same percentage forthose with postgradliate edudEtion.1 In other words,'gchooling mayreach a point of diminishing returns. A very low 2.6.percent .
unemployment rate is registered for college graduates. After that,more educgiion may create a probletrof-being overqualified, greaterdifficulty is experienced in finding a position tommensurate Nith
' one"s education.
I remember reading an anecdote about the Yale graduate enteringthe labor marketin the recession year of 1971. in the first roundof,applications he seht to employers, he stressed* the fact that he'was a Yale graduate, a chemical engineer, and a summa cum laude. 'Hereceived no offer of employment and the bulk of rejection lettersmade a point of the fact that he was overqualified for any positionavailable at the moment.
In the sechndjound of applications'he sent out,'he scaleddown,his qualification considerably. He merely stated that he was ',
a college graduate with a chemica, engineering major. The responseswere less emphitically negative, but still there was no firm offerof employment.
.
y that time, the young man's funds were desperately low, andhe n eded work in alit:try. He picked a firm where, he thought hehad a change to, move up if he 'could get in, apd he wOtte once moreto- the personnel director merely stating: "Able bodied young man.Willing,to o anything:" He was hired.immediately4
Oy'uglification is not the prime reason why Chinese postgradu-ates a of find employMehi. The more likely reason is that r, hey are
no emitted to work or that they must maintain their student statusto remain in this country. .Several examples of this forced educatiOnwere given at the beginning of this chapter.
e
Better Education' Better Job? - I
.
By correlating yfiars of school\comileted with the occupatids:of:the'Chinese in the, United States, I'tried to obtain some inklingwhether more schooling leads to Netter jobs. Nhe results aretabylated in Table.23, and the figures are broken down by horizontalpercentageafor,males and females. In other words, the total numberof architects, for example, make up'100 percent. What proportionare high school graduates, qiihat proportion are college graduates,and what proportion are postgradhates? .! '
4. .
It is` obvious that theChihese professional, whether male orfemale, is extremely 'well eduCated, but it is intriguing that 3.1
. ,
) ;
-86-
, 9 5
e

TABLE 23
HIGHEST GRADE COMPLETED BY EMPLOYED CHINESE BY SELECTED OCCUPATIONS' AND SEX,-BY PERCENT DISTRIBUTON
OR THE U.S., 1970
Selected Occupation &'Sex
Employed Males 16 Years and'Over (100%)
Professional and Technical
Architects
Computer Specialists
Engineers
Lawyers and Judges
Librarians, Archivists & Curators
Mathematical Specialists
Life and Physical Scientists
Physicians, Dentists, Related Pract.
Ilealtb Workers, Exc. Practioners
Social Scientists
Teachers, College and University
Teachers, Elem. & Second.
Technicians, Except Health
Writers, Artists said Entertainers
Research Workers
Other Professional, Workers,_
Managers and Administrators, Exc. Farm
Salaried: Manufacturing
Trade
Service Industries
Other Industries
Self-Employed:.Minufacturing
Trade
Service Industries
Other Industries
Elementary
High School
4llege
Less than 5
5-7
81-3
41-3
22.3
'
5 or more
22
7.2
7.8
4.3
13.6
13.6
20.7
0.3
0.3
02.1
5.4
12.9
57.4
O0
00
O0
00
O1 . 2
01.2
0o
0. 0
o0
00
o0
00
o0
00
3.1
00
0
0o
o20.0
o0
o. 0
0o
00
o0
00
O0
02.9-
OO.
o-
9.5
O0
0100.0
O0
03.4
5.8
9.4
16.7
22.2
.8
33.3
O12.5,
3 .3
56.3
2.3
4.7
3 .V
55.8
O20.0
60.0
ao
2 .0
80.0
O0
0100.0
O4.8
.3
61.9
O6.3
.1
87.5
20.0
06 .0
0O
05 .0
50,0
3.2
6.5
.7
80.6
O0
1 .7
83.3
17.1
51.4
.9
25.7
9.5
23.8
2B.6
28.6
00
00
10.3
10.3
1).3
65.5
3.6
16.5
26.6
.11.5
12.9
13.7
O0
00
00
4.2
4.2
025.0
29.2.
12.5
10.0
20.0
00
20.0
10.0
O0
04.5
31.8
9.1
O0
,0
33.3
33.3
'0
5.5
10.9
7.3
18.2
34.5
9.1
21.4
21.4
7.1
21.4
028.6
At,
616.7
016.7
16.7
16.7
,
25.0
75.0
12.5
12.5
20.0
31.8
22.7
O33.3
.3
7.3.
O0
16.7
16:7
(continued)

- 1\
TABLE 23 - -continued
Eletentary
High School
Selected Occupation &-Sex
Less than 5
5-7
81,3
41-3
kSales Workers
2.2
00
17,8
20.0
22.,2
Insurance Agents and Brokers'
00
00
0-
oStock and Bond Salesmen-
00
00
33:3'
0Sales Clerk, Retail Trade
00
025.0
25.0
Other Sales Workers
4.5
.0
018.2
18.2
k
Clerical-and Kindred Workers
1.9
5.7
4.9
8.6
40.0'.
..
Bank Tellers
00
020.0
0Bookkeepers
010.0
0.
040.0
File Clerks
00
00
0Office Machine Operators
'
00
0d-
41.7
F.-.
Secretaries, Stenographers and Typists
00'
00
40.0
CD
Other Clerical Workers
2.8
7.0
2..8
11.3
43.7
1---:',
Craftsmen and Kindred Workers
5.9
3.5
12.9
17.7.
40.0
14.1
Mechanics and Repairmen Includ. Auto
3.8
011.5
19.2
30.8
30.8
Printing Trade Craftsmen
14.3
28.6
'
00
57.1
0Construction Craftsmen
11.1
011.1
16.7
50.0
'' 5.6
Tailors
050.0
050.0
00
Other Craftsmen
'
3.1
018.8
18.8
40.6
9.4
College
45 or more
40.0
50.0
33.3
25.0
18.8
°27.3
13.6
.28.6
'8.6
20.0
30.01
50.0
41.7
20.0
,
26.8
'Operatives, Except Transport
15.5
14.4
7.2
23.7
35.1
3.1
Food Industry
..,,,
12.5
-6.3
12.5
43.8
25.0
0Apparel
12.5
18.8
12.5
43.8
12.5
0Laundry and Dry Cleaning Operatives
30.8
26.9
015.4
23.1
3.8
Other Operatives
:7.7
.7.7
7.7
12.8
56.4
5.1L
17.8
50.0
33.3
6.3
18.2
.4.8
60.0
'0
20.0,-
0
50.0'
0
18.3
8.3
20.0
20.0
1.4
4.2
1.2
4.7
O3.8
00
f0
5.6
00
1.1
6.3
O1.0
00
00
O0
O2.6
b1
continued)

.i---a-.
,.....em
.,
Pk,
TABLE p --continued
!II
Selected Occupation & Sex
>Elegientary
High School
4Colleg
Less than 5
5-7
81-3
4\ 1-'3
'
4,
a5 or more
Transport Equipment Operatives
,
old.
\
12.5
6.9
5.3
10.0
11.1
16.1
7.7
16:7
,
\\
.0
',N500
N6
\,,
NN
21.8
s
l
0
6..9
"5.3
10.,0
11.1
18.2
15.4
19.4 0
.
0 0
14.3
0
10.3
5.3
20.0
11.1
6.6
,0
7.4 0 0 0
14.3
31.3
27.6
31.6
20.0 0
20.7
'37.5
27.6
36.8
10.0
44.4
22.3
i
12.5
,
17.2
f
15.8
20.0
,
I
22.2,,
12.0
$
0 0 0' 0 0
3.3
6.3
3.4 0
10.0 0
0.8
-0
0.5
50,0 0 0 0
Laborers, ExcegtFanm
Freight, Stock and Material Handlers
Other Laborers
.'
AFarm Workers and Managers
c
Serviee Workers, Except Privae'Hous
'
Cleaning Service
,
Food Service
.
illealth Service
Personal Service
Protective Service
-
Private Household Workers
\`\
\
',
15.4
21.8
50.0 0 0
19.0
30.8
21.3 0 0
5757.1
19.0
'
23.1
10.2
.
0
50.0
i
28 NI 6'
i
0:
7.7
2.8 0 0
0.4.3
9.5
'
Souicce:
U.S. Census Bureau, Special Tabulation, Public.Use Sample Data (1970).
',40TE:
Based on a 1 percent sampling.
-89-
4
30
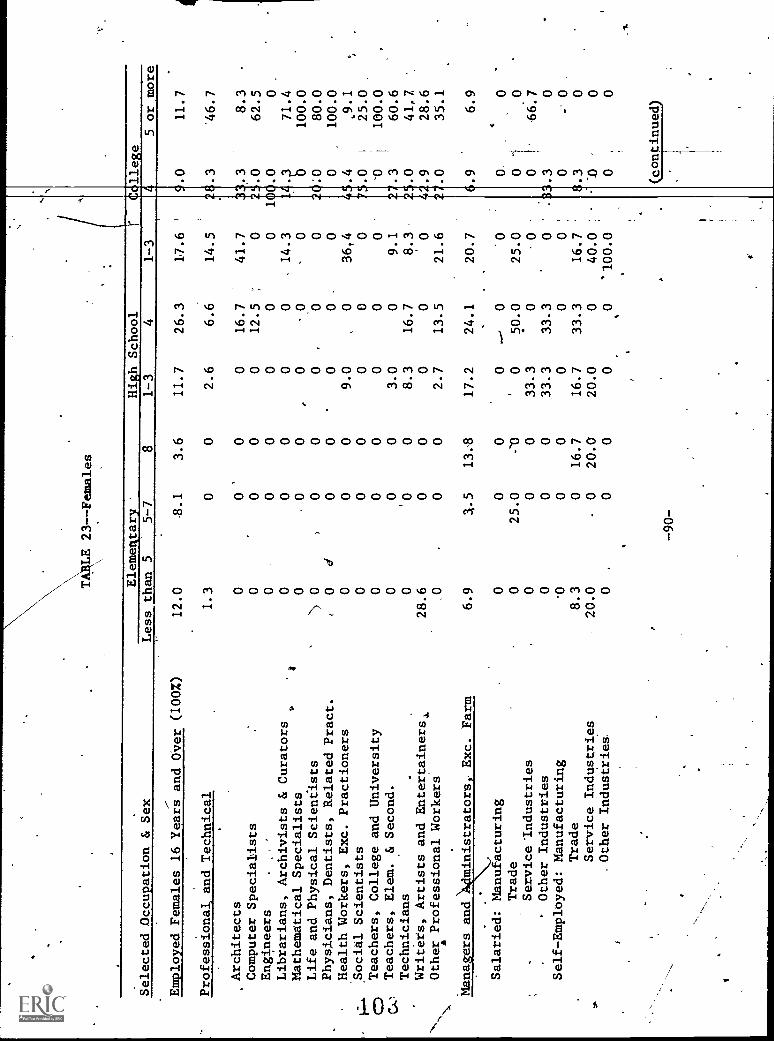
\,
TABLE 23 - -Females
Selected Occupation & Sex
Elemeivary
High School
Less than 5
5-7
81-3
41-3
,
Employed Females 16 Years and Over (100%)
12.0
8.1
3.6
11.7
26.3
17.6
Professional, and Technical
1.3
00
2.6
6.6
14.5
Architects
00'
00
16.7
41.7
Computer Specialists
00
00
12.5
'
0
Engineers
.
00
00
00
Librarians, Archivists & Curators
00
00
014.3
Mathematical Specialists
00
0,
00
-0
Life and Physical Scientists
00
00
00
Physicians, Dentists, Related Pract.
i0
<I
00
00
0Health Workers, Exc. Practioners
00
09.0
036,4
1-:-
,Social Scientists
00
00
00
CD
Teachers, College and University
00
00
00
C.,..'
Teachers, Elem. & Second.
00
03.0
09.1
Technicians
0'0
08.3
16.7
8.3
Writers, Artists and Entertainers,
28.6
00
00
0Other Professional Workers
*0
00
2.7
13.5
21.6
Managers and
ministrators, Exc. Farm
6.9
3.5
13:8
17.2
24.1
20.7
Salaried: Manufacturing
00
00
---
00
Trade
025.0
-.0
'
050.0
25.0
Service 'Industries
00
033.3
00
Other Industries
00
033.3
33.3
0Self-Employed: Manufacturing
'0
00
00
0Trade
8.3
016.7
16.7
33.3
16.7
Service Industries
20.0
020.0
20.0
040.0
.0ther Industries
00
00
0'100.0
-90-
llege
5 or more
'
'.O
11.7
.'46.7
' '
.33
8.3
.0
62.5
1)1.0
0'.3
71.4
100.0
1.0
80.0
0100.0
.4
,.9.1
.0
I5
10
1(2)().
.3
60.6
.0
41,7
.9
28.6
.0
35.1
..9
6.9
4
0'
,3 0
-.0
0 0
66.7 0 0 0 0 0
(continued)

TABLE 23--Females continued
Selected Occupation & Sex
Elementary
High School
,
Less than.5
5-7
81-3
41-3
Sales Workers
7.5
12.5
7.5
20.0.
27.5
22.5''
'1
Insurance Agents and Brokers
,0
00
050.0
50.0
Sales Clerk, Retail Trade
Other Sales Workers
6.9
11.1
17.2 0
10.3 0
24.1'
11.1
,
13.8
66.7
11*
Clerical and Kindred Workers
1.6
1.6
1.3
11.8
45.0
28.2
'Bank Tellers,
00
010.0
40.0
30;0
Bookkeepers
00
00
44.4
37.0
File Clarks
00
00
80:0
20.0
Office Machine Operators
00
016.7
44.4
2212
)--"
Secretaries, Stenographers and Typist
,c--)
Telephone Operators
m..
0 00 0
1.3 0
6.4
25.0
50.0
25.0
351F9103
'''
Other Clerical,
4.4
4.4
2.2
19.8
38.5
Craftsmen and Kindred Workers
00
14.3
14.3
57.1
0
Tailors
'0
050.0
50.0
00
Other Craftsmren
00
00
80.0
0
Operatives,'Except Transport
35.4
24.7
6.3
13.3
15.2
5.0
t,
Food Industry
033.3
00
33.3
33.3
Apparel Indugtry
39.6
27.0
5.4
13.5
9.9
4.5
Laundry and Dry Cleaning Operatives
50.0
16.7
8.3
25.0
00
Other Operatives
18.7
18.7
9.4
9.4
37.5
6.3
-91-
C Ilege
5 or more
2,5,
0
00
3.5
0,o
o'
. .5 0,
.1
.6
4.2 o 0 0
5.6
3.9 0
6.6
14.3 0
20.0 0-
(continued)

TABLE 23--Females continued
Elementary
High School
College
Selected Occupation & Sex
Less than 5
5-7
81-3
41-3
Laborers, Except Farm
020.0
00
60.0
20.1
Freight, Stock and Material Handlers
025.0
00
50.0
25.0
Other Laborers
.0
00
t0
100.0
Farm Workers and Managers
50.0
025.0
00
Service Workers, Except Private Household
18.7
7.8
4.7
15.6
26.6
20.1"
Cleaning Service
33.3
16.7
033.3
016.7.
}....&
Food Service
20.0
8.0
4.0
16.0
24.0
22.Q
CD
Health Service
,0
050.0
050.0
0C)1,
Personal Service
00
00
66.7
16.7
Private Household Workers
20.7
13.8
3.5
27.6
27.6
- 6.9
Source:
U.S. Census Bureau, Special Tabulation, Public Use Sample Tapes (1970
NOTE:
Based on a 1 percent sampling.
.1
-92-
4.
5 or more
O0
O-0 0
O25.0
6.3
0
.0
0
6.0
0
O0
16.7
0 o

'as
. percent of those list ,,- dentists, and related
practitioners have less than five years of schooling. Perhapsthese "doctors" are herbalists or masseuses who claim the powerof-healing:
_
Managers and administrators who work for a salary are highlyeducated.- Those who-are self-employed n &ed not be. Male salesand clerical, workers_are inordinately overeducated. For instance,60 percent of the Chinese male bank tellers are college graduates.This_job actually requires only a high school degree. Fifty percentof Chinese males in file clerk jobs are college graduates-. .
Chinese females, even those with a college education, areheavily concentrated in-clerical jobs.. Approximately half ofthose with one to three years of college, one-fourth of thosewho graduated, and one - eighth of those who are postgraduates remain --at the clerical level.1 This averages out to approximately one-third of all Chinese females who-everrattended college (and wenoted previously that almost one-fourth of the Chinese females16 years and over have had some college-education). It seems thatfemales have a very difficult iime'trying to rise above the clericalxanks, whether Chinese or not.
More School, Higher Pay?
The-general assumption-is-that a higher education commandsa better job, which in turn means more pay. Does the correlation
. follofor the Chinese? After studying Table 24, we can say that,in some eggpects, the principle holds true. Those Chinese in thehigher income brackets are better educated, but the reverse doesnot follow. More education does not always-result in better pay.
Of Chinese males 16 years or older, one out'of five highschool graduates earned more than $10,000 in 1969, whereas two outof five college geaduates earned.this-annual personal income. Theproportion of those earning $10,000 or more increases to half ofthose with a-postgraduate degree. -B-Ut what about the three infive college graduates and the other half of the postgraduates whofall somewhat, or even substantially, below this income level? Is
this the norm or is it below par? Let us compare these percentageswith thoie for whites and blacks.
4
The data reveals that 59.6 percent of white male college grads
1. U. S. Census Bureau, Special Tabulation, Public Use Sample Data(1970).
-93-

TABLE 24
-PERSONAL'INCOME OF $10,000OR MORE IN 1969, BY EDUCATIONAL LEVEL
FOR WHITES, BLACKS, AND C4INESE, BY SEXAND PERCENT
High_Scho
raduates
White
Black
Chinese
% with -Pers. Income of $`10, 001. Or mo
Fema e
. Male
32.5
10.4
20.9
College Graduates
White
59.6
CD
Black
35.3
Chinese
38.3
Post Graduates
White
67.1
Black
53.0
Chinese
50.9
e
.2
9.3
27.7
34.2
13.3
Source:
Whites and Blacks: U.S. Census Bureau, GeneralPo ulation Character
tics, '-
vol. II, (1970), Table 249; Chinese: U.S.
Census Bureau, S ecial Tabulati it, Public
Use Sample Data (1970).
-94-

have a personal income of $10,000 or mores whereas the black and.Chinese male trail far behind with 35.3 percent and 38.3 percentrt433lettiy_e3_ .11 - - n.percent go over the $10,00_0 mark, while the Chinese male fallsbehiffd-the black male in earning capacity..
The disparity of income between male and female of any raceis deplorable. Females with the same educational attainment nevercome near the earning power of their male counterparts, and theChinese female postgraduate is at the bottom of the ladder. Herblack sister seems to be doing better than either,whites or Chinese.
So when it comes down to the nitty-gritty, the rewards forthe Chinese are not there. They have schooling, often attainedat a high personal cost--such as postponement of marriage, financialsacrifice, and the foregoing of any social life or recreation, Theyrhave cracked open the doors of professional and technical occupations,but their income is in no way commensurate with their educationalachievement,
I
10

SUMMARY OF FINDINGS
-1. A large proportion of the Chinese population is hig lyeducated:: one=fourth of the males and one-Stith eif-the f=u-lesare college graduates.
2. The educational attainment for the younger age groins- -those below 25 years of age--promises to be even higher.
3. At the other extreme, a large proportion of the Chi esepopulation in the United States.is illiterate. It is 11 perc nt,comparedlto 1.6 percent for whites and 3.3 percent for blacks.
4. The opposite-poles educational profile is generally foundamong the foreign-born Chinese. The native born are neither illi-terate nor 'do they go beyond college graduation-to the- degree thattheir foreign-born counterparts do.
5.-:,The high educational attainment of such a large proportionof the Chinese is due partially to the cultural tradition of respectfor scholarshiR, but primarily to enforced classroom attendancemandated in large part by immigration considerations.
6. The highireducated male tends to gravitate toward a white-collar professidnal or technical job, but many are in positionsbeneath their qualifications.
7. One-third of the Chinese females who have ever attendedcollege are in clerical work.
8. More school does not mean better pay for the Chinese. Infact, they form the most poorly paid group at comparable educationallevels.
9. Whether illiterate or postgraduate, the Chinese female isthe most disadvantaged. The occupational sphere is- extremely limitedand the financial remuneration is far below that of Chinese males orthat of her white and black sisters."
1
/105-96-
-9.

AtCOMMENDATIONS
j nese are a
bifurcated group, so recommendations cannot be applied to the group-"TS a litmFM7710P-bave-a hIghly educated group consisting of foreign-born-immigrants and native-born Chinese-Ameficans. On the otherhand, the large number Of illiterates poses a different set ofproblems.
DEOTWIWniFINNILIE:1-1.4411MTWIT4TIMIkKirMli
The continuation of schooling far beyond the normal rangeseems to
.
be artificially propped up. The most compelling reasonis to_maintain student immigration status, If this condition wereremoved, the investment in formal schooling might be more profitablyused toward other, more interesting personal pursuits. Not thatthe education has not stood the Chinese in good stead. It hascertainly raised their occupational status, to the point that one-fourth of the Chinese are now in professional or technical-work,but being in the upper occupational classes has not brought commen-surate financial returns.
Schooling is fine, but more does not always mean better. Mypersonal opinion is that this high educational level has beenattained at great personal cost. I do not refer merely to theinvestment of time, effort, and money, but also to the postponementof marriage and children, and, the absence of recreation and leisuretime for the more aesthetic aspects of life.
Formal education goes far beyond the point of optimum for theChinese. In many respects, we are driven by an inner compulsionstemming from insecurity that we have to be better in every repectthan the next person. Perhaps we have to be.- The census tabulations,certainly support this belief. The Chinese cannot afford to havethe bare minimum educational qualifications; he must have better toremain competitive.-
There is a tendency everywhere to equate quantity (degrees oryears of school completed) with quality. We are beginning to seea reaction against this kind of thinking, and a higher degree maylead to greater- employer resistance against overqualification.Clearly the postgraduates-amongthe Chinese have a higher unemploy-ment rate.
Book learning may divert a person from-other types of workwhich may be more financially or personally rewarding. The expec-tation is,that a professionally trained person will go into theprofessions. Ronald Wong, in Case Four,-is a prime example. Morestatus accrues to a college graduate or engineer, but Ronald wouldhave preferred another line of work.
110-97-

,Vo
0
As wejsaw in Chapter I, a disproportionate number of Chinese-1141 1 - - -
davatud tm-r-eaducation and -Laud new -in the UniteStates. If they .were accountants in Hong_ Kong,., the.boOkkeep.tng
system may be different from that in New York. If they weredoctors in Taiwan, even experienced practitioners, they may haveto undergo further schooling before they can practice in thiscountry. Obviously, there are going to be few calls for teachersof 'Chinese philosophy in Chicago.
This is a more highly technical society than'the'one mostChinese have lived undei in the Far East. Even such a routinething such as usittg the telephone may be a new experience to therecent immigrant. High-speed subways may be a frightehing,experiencefor someone who has never been on one. Adjustthnt' to a new country .
is a total, and overwhelming, reeducation process. Everything mustbe learned at once, and this learning is not restricted to prepara-tion for a job per se. It involves such things as knowing how touse a knife and fork and to eat off a plate, instead of eating, outof a bowl with choRpticks.
Holding a responsible job means'more than technical or prof es -,sional know-how. it means familiarity with the social amenities,playing golf with the boss on the weekends, chatting about baseballat the water cooler. My'`own opinidn is that the Chinese need moreeducation in the social arena than in the areas of more technicalor academic knowledge. The Chinese need to know more about theAmerican government'and the political process. They need citizenshipor civic knoWledge so that they can become acquainted with the forcesthat might affect their lives. They need a broadening of theirhorizon, rather than more speci4lization in their academic iield.
'At the other_extreme, we have a.disproportionate number ofolder meTf and, especially, women who have no schooling whatsoever.It is extremely difficult, if not impossible, to set up the traditionalstructure of imparting knowledge by books, classroom, and the black-board for these people who do not have any previous exposure to thistype of education. Their learning processes have all been experiencedthrough actual life situations.
T -Simpler goals and simplereXpeCtations may be planned for thesepeople by such organized programs as learning how to use the telephoneby using one, hov-to,ride a.bus by riding one, how to find-out which_bus to take by taking various routes, how to utilize the services ofa bank by visiting the premises and opening an account. Trainingsessions such as these may seem elementary to those of us long exposedto these everyday occutrences, but they are untried and oftentimesfrightening experiences for new immigrants. I know many Chinese who
I I- .1 1
-98-
.o""

will not take a job outside Chinatown because they are afraid theywill get lost on the bui. They will not go for a job interview'because they are much too self-conscious about their speech andmannerisms. ,These.barriera are often more difficult to surmountthan attending classes and preparing oneself professionally for'a position. Many Chinese are more than adequately trained intheir field of work, but they are overlooked in promotions becausethey are inadequate in the social sphere.
In the past, tilt Chinese in the United States looked to China,as a refuge from the hostile American society where they resided."They lived vicariously in China's past civilization and glories.They made little attempt to carve a niche for themselves in Americansociety. Today's younger generation Chinese-Americans do not acceptthat accommodation. They are American citizens, and they will enjoythe privileges'and shoulder the respOnsibilities of that status.
Each and every Chinese in the United States should learn aboutthe history and experiences of his people so that he can be comfor-
table with his identity. He need not be looked upon as foreigi.
Because he has opted for American citizenship, this is his countryas much as it is any other American's. He need not apologize forhis parents' customs nor their humble origins. Their migration is,
in itself, a heroic feat. Thi is an aspect of our education thatmust be reinforced.
Finally, we,must reexamine our attitudes toward the female
gender. The census tabulation points out the unforgivable inequitiesshoultMred by the Chinese women. They are less favored with theopportufiity for schooling, and too high a percentage are illiterate.I do' not know how these past wrongs can be corrected. The harm is
done. But a 14ige'proportion of Chinese females with college degreesand Ph.D.s are eti,ll working in occupations which insult their
ability and in04ilignce,. At the same time, their income trailsso far behind that of their male Chinese classmates' tha't it is.
pitiful.W
' Women's Lib- has bolstered the black females' position, butthe Chinese female labors under a double disadvantage. As far
as I-know, those Chinese females who have gained professionallyor economically have paid a high price in their personal life.They shoulder a double load Of homemaker and career women. They
marry later. and have fewer children. Their success is viewed as
a'challenge to their husband's ego. Most Chinese women are still.reticient about challenging the status quo.' Without active involve-ment and support, the liberation of the Chinese female can onlyreap the lean pickings of the wider feminist movement.
112-997. ,

1
)
CHAPTER V
LABOR FORCE AND OCCUPATIONAL *PATTERN
Misleading Stereotypes
"What? How can those puny Chinamen build railroads?. Theyhaven't got the strength," exclaimed J.H. Strobridge, superintendentof the work force on the Central Pacific Railroad 'and the man incharge of recruiting workers for the transcontinental railroad.
"They built the Great Wall, didn't they?" wastheStrobridge admitted that he did not have an answer to that question,so he agreed to try the.Chinese out. Eventually they formed themain labor force on the construction of the iron rails,that spannedthe American continent and linked the Atlantic with .the Pacific.
Following the humiliating defeat of China at the hands of theBritish Navy in the Opium War, the imposing Celestial Empire wasmasked as a paper dragon and revealed in all its nakedness'as atechnologically backward nation. The prophets of doom began prophe-sying the decline and dismemberment of the Chinese Empire becausethis slumbering dragon had slept too long and could never catch up.Their conclusion was based upon the assessment that the Chinese weretoo philosophical to make good scientists or technicians. This
premise also proved to be grossly erroneous. TEday China is a
nuclear power, and Chinese-Americans work. predominantly ifi the
fields of science and technology.
Similar fallacies come up time and again about certain peopleor groups being more'suited to one occupation or another, merelybecausk they have been Ling identified with certain types of work.It is very hard for a Chinese to shake off the stereotype that heis a laundryman, or houseboy, or waiter, and many are suprised tolearn that, at one time or another, the Chinese in.the United Stateshave'run the gamut of occupations.
-101-
113

The Range of Occupations
We know the Chinese came originally to work as gold miners,although they were small farmers, tradesmen, and fishermen back inthe old country. They returned to these occupations as soon asthe surface gold began to peter out. In the 1880s, 75 percent ofall farm hands in California were Chinese. As fishermen, theybrought up large hauls of fish, shrimp, and other seafood fromthe virgin waters of San Francisco Bay to feed the hordes swarmingto the West.
They were the carpenters, shipbuilders, masons, and craftsmenwho built the first vessels and homes in California. Their monu-mental feat in the construction of the_ transcontinental railroadis recorded history. They made the shoes and fabrics that clothedthe people. There was hardly an industry during those days ofthe Gold Rush where they were not found in numbers until they were.driven, taxed, or excluded from' their jobs. And when the purgeand persecution ended, the Chinese were left with nothing to'dobut what the white man did not want to do. These,jobs were washingand ironing, cooking and-- -serving food, and waiting on the masters.
and mistresses at their beck and call. These jobs came under thegeneral heading of what the predominantly male population thenlabelled "women's work." Thus, occupationally, the Chinese wereemasculated for almost'a century. Aside from those in laundries,restaurants,' and domestic service, there were but a few otherswho worked in small grocery stores or curio shops.
Many Americans consider the choice of occupation as a basicright. This belief isso fundamental that we give very littlethought to the, fact that it is not universal and that sometimes,even in this country, the choice is restricted by many factorsand conditions.
Not until recent times have the Chinese had any choice ofoccupation. World War II triggered the change, but it was aroundthe 1950s that the Chinese started easing into other lines ofwork. By the 1960s, the pace had turned into a spurt, and theChinese made rapid strides forward. The object of this study is_to find out how the Chinese have regrouped occupationally. Ourfirst task is to find out what size group we are dealing with,and what their employment pattern is at present. Perhaps somelight can be thrown on why they are in these positions. in otherwords, what were the causative factors? From knowledge of wherewe are, we will attempt to see if the pattern of Chinese employmentcan be expanded, horizontally and vertically.
This is a large order but a necessary beginning of that first
-102 -
114

TABLE 25
PERCENT OF CHINESE 16 YEARS AND OVER IN THE LABOR FORCE, 1970
Age and Sex
U.S.
Calif.
N.Y.
Hawaii
Ill.
Mass.
Males
73.2
73.5
71.1
73.4
-72.3
16-19 years
37.5
41.0
26.5
37.1
33.2
35.3
20-24
58.0
60.8
53.6
-76.6
53.5
59.0
25-34
.86.7
88.9
88.8
92.1'
84.8
82.3
35-44
95.5
95.7
'96.3
96.2
95.0
'94.0
45-64
87.8
87.5
86.2
88.4
87.5
92.6
65f
24.8
23.6.
.21.9
'26.6
32.9
26.0
Females
49.5
51.0'
49'.2
54.2-
'53.2
16-19 Years.
34:5
36.6,
29.4*
37.1
37.8
46.3
20-24;
55.7
59.0
54:1
64.7
56.7
56.9
-25-34
50.3
'54.6
47..,6
64:1
45.5
50.5
35-44
...
59.1
60.9
.61.2
68.3
sp.9
61.3 P,
`,45-64
57.4
58.0
.
57.6
60,1
63.2
62.5
.1'
65+
12.0
11,1
..
,:14.8
6.8
14.9
20.2
.
Source!
U.S. Census Bureau, Subject Report, Pc(2)1d(1970), Table 19.
-
NOTE:
In labor force means the employed or those looking fot work..

_"1")step in the thousand-league journeys because occupation, or career,profession, job, work, or whatever one may want to call the activity,is the single most important basic aspect of our lives. It takesup the major portion of our waking hours and provides thewherewithalfor our daily existence./ it determines where we live and how welive:. It may also circumscribe Our social life. Thetis why astudy of the occupational status of the Chinese is fundamental tothe undeistanding of'this ethnic group.
1,4
Labor Force
,./
How large'a group are we dealing with when we talk about theoccupational pattern of the'Chineae? The number of civilians'16 yeais ancl'over who are-employed or looking for work is calledthe labor force. 'Excluded are persons such as housewives, thosedoing vo teer work, students, retirees, those who are unableto Work, and those.not actively seeking paid employment.
it
The Chinese labor force was approximately 190,000 1970. againgt a total population of 437,000. 1 Using round n ers, of
. the,i90,000 labor force, 120,000 were males and 70,000 w e females.$ Approximately three-fourths of the males and one -half of the .
f*ales 16 years and over were in the labor force. A co arisonof labor force participation rate by whites and blacks g en}below is taken from the 1970 census:
. .
4 s--
a
Male Female
Chinese 73.2% 49.5%white 80.6% 43.4%Black 69.8% 47.5%
There' is an appreciable difference in labor force participationrates between the three ethnic groups. The, percentage (80.6 percent)of white males in the labor force is significantly higher than thatfor the Chinese (73.2 percent) or blacks (69.8 percent). The Chineseoccupy an intermediary position between the two groups. The reasonfor the lower rates for Chinese males stems from the prolonged periodof their education, which keepi them out of the labor market but doesnot mean that they are unemployed. This is obvious from Table 25,
4
1. The size of the labor force has increased substantially sincethat time becauSe of the. heavy influx of immigrants over recent years.
116-104-

TABLE
THECHINESE-IN THE U.S.'
E&AVitL.'1C-,-_,7D'''P--144".Z."-......W-------"-
United Statei Total
States
.
California
New York State
Hawaii SMSAs
Boston
Chicago
Honolulu
Los Angeles-Long Beach
New York
Sacramento
San Francisco-Oakland
San Jose
,
Seattle-Everett
.4Wash. D.C.- Md. -Va.
46,008
23,030
13,603
72.5
71.0
74.6
EMPLOYMENT STATUS'OF
A,Males
.
'
Females
Labor Force
Employed Unempl'd
Labor FOrce
Employed Unempl'd
No:
%No.
%No.
%'
No.
%
117,924
' 73.2
114,433
3.,0
71,786
49.5
69,129
3.7
44,164
4.0
22,497
2.3
13,315
2.1
3,468
72.5,-
-3,371
241
3,475
74.5
189
,2.5
12,627
74.
-
.12,364
2.1
11,841.
11,384
3.9
21,,584
1.1
21,075
2.4
2,553
68.3'
2J99
2.1
23,47
71.4
22,448
4.4.
2,309
-78.5
2,227
3.6*
2,069 -
71.5
1,990
3.6-
2,084
73.3-
2,055
1.4
29,983
51.0
13,295
49.2
9,935
54.1
28,575
4.7
12,910
2.9
9,761
1.8
2,112
54.8
2,020
4.4
1,967
50.9
1,916
2.6,
9,331
54.6
9,174
1.7
7,159
51.4
6,931
3.2
12,685
49.8
12,325
2.8
1,588
44.3
1,412
11.1'
16,917
54.0
16,279
. 3.8
1,192
45.8
1,119
6:1
1,216
49.6
1,132
6.9
1,355
49.5
1,303
3.8 '
Source:
U.S. Census Bureau, Subject Report, PC(2)1G (1970), Tables 19,.28.

I
sho percent of Chinese in the labor force by age group andsex Not until 25 to 34 years of age do the Chinese males startco g into the, labor force in numbers and dy the next age category,3 to A4, they are into the labor matket.almost full-force.
More Women Working
What is revealing about our findings is that a greater percen-tage of Chinese women are in the labor force compared to the blacksor whites. It has been popularly assumed that a large proportionof black women are employed outside of the home, either because of,low family income or the absence of a male breadwinner, and thatthis situation has had a deleterious effect an the.black family.Our figures show a larger percentage'of Chinese women in the laborforce, and the,fact comes somewhat as a surprise. The impact ofthis development may be significant. The increasing participationof Chinese females in employment outside of the home is treated in,greater length in Chapter VI.
Table 26 shows labor force and employment status of the Chiqe#t,by sex, for the three heavily Chinese populated states and ten SNS44.There does not seem to be any pattern in the labor force particifii0On,rates for Chinese males, the lowest being 68.3 percent, in Sact40e4tpls.California, and the highest, 78.5 percent, in SSn Jose, Califot0,44-,
There was a 10 percentage-point variation for these plact#,both of which are in the same state and faiily close to one anOthdr.Sacramento also registered the lowest labor force participatiptirate for Chinese females (44.3 percent) and had the greate8t UnemP4OW"ment rats, 11.1 percent. /
1
These figures are puzzling considering that Sacramentplisstate capital, and government is a fairly stable and stead) lndustriwhich emplOys a substantial proportion of clerical workers, teaches ",and health workers. These are traditional female domains. I am 4'inclined to question these figures,
Major Occupation Groups
,'The variety and job titles identified by the Bureau of Cens#prUhs to 494, but they can be grouped under tan major occupationAtegories: As listed in Table 27, these range from professiongand technical to private household workers. These major occ4p#1.0ngroups simplify the handling of our statistics, but they.ttiesk 0,nYfacts that must-be examined in more detail. Nonetheless, it 41/important to view the whole before viewing the parts.,
-106-
118
-
1
wti

C.4
1)
TABLE 27
MAJOR OCCUPATION GROUPS OF THE CHINESE IN THE U.S.,
BY SELECTED STATES. SEX. AND PERCENT, 1970
Major Occupation
U. S.
Calif.
N. Y.
Hawaii
Illinois
Mass.
Group and Sex
No
No.
No.
No.
No.
%No.
Males Employed 16 yrs. +
114,433
100.0
44,164
100.0
22,497
100.0
13;315 100.0
3,914
100.0
3,858
100.0
Professional & Technical
33,119.
28.9
11;400
25.8
.4,866
21.6
2,883
21.7
1,438
36.7
1,121
29.1
Managers & Administrators
13,061
11.4
4,989
11.3
2,278
10.1
1,878'
14.1
338
8.6
39;
10.1
Sales Workers
.
5,021
4.4
2,385
5.4
946
4.2
866
6.5
134
3.4
54
1.9
Clerical Workers
10,762
9.4
5,388
12.2
1,813
8.1
1,499
11.3
274
7.0
248
6.4
Craftsmen
8,367
7.3
3,463
7.8
"I
963
4.3
2,595
19.5
137
3.5
125
3.2
Operatives
11,998
10.5
4,943
11.2
3,367
13.0
1,229
9.2 '
355
9.1
313
8.1
Laborers
3,787
3.3
1,784
4.0
360
1.6
697
5.2
89
2.3
82
2.1
Farm Workers
830
0.7
481
1.1
,14
0.1
146
1.1
14
0.4
6.0.2
Service Workers
27,010
23.6
9;100
20.6
7,784
34.6
1,516
11.4
1,125
28.7
1,51,8
39.4
Private,Household Workers
478
0.4
231
0.5
106
0.5
60.1
10
0.3
00.0
Females Employed 16 yrs. +
69,129
100.0
28,575
100.0
12,910
100.0
9,761 100.0
2,228
100.0
2,25
100.0
.Professional & Technical -
13,402
19.4
4,332
15.2
2,004
15.5
1,860
19.1
610
27.4
409
18.1
.Managers & Administrators
Sales Workers
'
2,636
3.8
5.1
987
1,558
5.5
479
430
3.7,
3.3
534
5.5
890
9.1
3655
1.6,.
2.5
16
86
0.7
3.8
Clerical Workers
21,989
31.8
10,453
36.6
3,246
25.1
3,619
37.1
626
28.1
639
28.3
Craftsmen
846
1.2
351'
1.2
182
1.4
190
2.0
39
1.8.
00.0
Operatives
15,556
22.5
6,567
23.0
5,426
42.0
778
8.0
460
20.7
843
37.4
Laborers
592
0.9
199
0.7
92
0.7
100._ 1.0
26
1:2
10
0.4
Farm Workers
"
---361
0.5
;50
0.9
60.1
54
0.6
00.0
70.3
Service Workers
8,842
12.8
3,259
11.4
769
6.0
1,650
16.9
348
15.6
213
9.5
Private Household Workers
1,374
-22.0
619
2.2
276
2.1
86
0.9
28
1.3
32
1.4
Source:
U.S. .Census Burdau, Subject Report, PC(2)1G (1970), Table 22.

The striking fact that emerges from Table 27 is the heavyconcentration in the-professions and service work for the males.This is a twin-peak situation or a tendency toward extremes.Assuming that the ten occupational categories also reflect anascending or descending scale of economic status associated withthese occupational groups, we can say that the Chinese are bothat the top-and the bottom of the economic scale. For example,28.9 percent of all Chinese males in the United States are inthe professions, which is the top Cif the scale. Yet 23.6 percentare in service work which is near the bottom. Again, we have abifurcated group in economic status.
The proportions in each group vary from state to state, butthe pattern holds true for these two categories, except in the
- state of Hawaii.2 In some states, like Illinois, the extremesare even more pronounced. 36.7 percent are in the professionsand 28.7 percent is service work. States like New York andMassachusetts have a much greater percentage of males in servicework, but the percentage in the professions is substantial aswell.
A twin-peak situation alsó holds for the Chinese female, .
but the peaks are closer together toward the middle of the economicscale. The largest numbersi_are_foundln clerical work and thesecond largest come under the heading operatives. These two occu-pation groups combined-include from approximately one-half totwo-thirds of all females employed.
Variation by Cities'
The opposite - poles, employment picture peevails even in break-
down by cities (see Table 28), but it is accentuated in some casesby an even greater concentration in either the professions orservice work for the males. For example,_47.9 percent of theChinese males in Washington,_D.C., are in the professions, whereas
2. In almost every table in this report, we can see that thefigures for Hawaii differ noticeably-from those for the mainlandstates. That is because Hawaii's Chinese were unfettered byAmerican racism until the islands became a territory,of the UnitedStates in 1898:--Even-then, the social climate was more favorablethan,that found on the mainland. As aconsequence, the Chinesewere able to move out and'up into other occupations more quickly.
1.20-108- i

TABLE 28
MAJOR- OCCUPATION GROUPS OF THE CHINESE IN THE U.S,,
BY PERCENT DISTRIBUTION FOR SELECTED SMSAS, BY SEX, 1970
Ma or Occu ation Grou s
'
Boston. Chica o
L.A.
Honolulu ,Lon
Beach
New
York
Sacramento
S.F.
Oakland
San
Jose
Seattle
Everett
D.C.Va.
Md.
Males Employed 16 Yrs.+
100.0%
100.0%
100.0%
100.0%
100.0%
100.0%
100.0%
100.0%
100.0%
100.0%
Professional, Technical
-27.5
31.7
'22.2
32.0
18.6
25,5
19.8
50.5
25.1
47.9
Managers
10.2
.9.4
14.1
10.9
10.3
14.5
10.3
9:1
13.7
10.1
Sales Workers
1.2
3.7'
'6.5
5.7
4.5
3.6
5.9
4.9
3.9
1.2
Clerical Workers
6.8
7.8
11.4
10.5
8.3
13.5
14.8
' 7.3
9.2
6.1
Craftsmen
-,. 2.4
4.0
20.0
6.1
4.3
5.4
9.7
t6.0
7.6
. 3.6
Operatives
7.9
9.4
8.9
12.3
15.7
9.8
12.3
5.5
4.9
3.8'
Laborers, exc. 'farm
2,3
2.2
5.2
3.5
1.7
6.2
-3.5
2.3
2.2
2.8
Farmers, Mgrs. & Laborers
SerIlice Workers
002 1
414
0.4
31.1
0.6
11.2
0.2
18.6
0.1
36.0
2.6
19.0
0.3
22.7
7.0
7.1
0,2
33.2
0.2
23.4
Private Household Workers
0I
0.3
00.3
0.5
00.7
0.3
00.9
'
Females Employed 16 Yrs.+
I
Professional, Technical
.15.
22.7
18.9
20.3
14.0
13.3
10.9
32.4
18.6
34.4
Managers
'
0.
1.7
5.4
3.5
3.6
3.9
3.2
2.7
2.5
,
4.3 '
Sales Wo'rkers
3.
2.4
9.4
5.3
3.4
3.5
5.8
5.4
5.9
4.4
Clerical Workers
28.5
30.4
37.5
33.9
25.4
43.6
38,2
29.9
24.2
29.9
Craftsmen
02.0'
1.9
0.7
1.4
0.8
)1.6
0.8
0.4
0.8
Operatives
39.6
23.4
8.2
25.6
43'.7
14.1
26.3
7.7
29.6
5:7
Laborers, exc. farm
0.5
1.4
1.0
0.4
'
0.7
1.4
0.5
1.3
1.5
0.4
Farmers, Mgrs. & Laborers
0.3
00.5
0.1
01.3
0.3
12.0
0.8
0Service Workers
9.9
14.8
16.5
8.3
5.6
13.8
11.1
6.4
14.9
14.2
Private Household Workers
1.2
1.2
0.7
2.1
2.1
4.2
2.2
1.4
1.6
5.9
Source:
U.S. Cenius Bureau, Subject Report, PC(2)10
(1970). -109-

41.5 percent of those in Boston are in service work. The lowestpercentage in the.professions is found in New York City (18.6percent), and` 36 percent of the males are in service work.
There is no departure in the twin-peak-female pattern ofemployment either, except for the same concentration of eitherclerical workers or,Opeiatives, depending upon the city. 43.6percent are in clerical position in Sacramento, whereas 43.7percent are operatives in New York City. The few exceptionsare foUnd in Washington, D.C., San Jose, California, and Honolulu,where female professionals exceed the numbers in the operativescategory.
Four SMSAs shown in Table 28 are within the sate of California.They are Los Angeles, Sacramento, San Francisco-Oakland, and San Jose.The latter three are fairly close to one another, but the variationin the percentages of the various occupation groups is prondunced.For instance, only 10.9 percent of the females in San FriACisco arein professional jobs,- whereas in San Jose, 50 miles south, thepercentage is 32.4. 12 percent of the females in that city arefarm laborers; whereas in some places women in farming are few oralmost nil. >
Aside from the professions and service work, the Chinese malesappear to have a healthy percentage of 10 percent to 15 percentunder the managerial category. This is a deceptive figure. Closerscrutiny will reveal that these managers, more ofted than not,are owner-operators of small businesses such as restaurants, giftthops, or grocery stores.
Some comment is in order about the other major occupationalcategories and the conspicuous absence of Chinese from these types-of jobs--sales work, for example. A national percentage Of 4.4percent of the males and 5.1 percent of the females. are in saleswork. Again, more often than not, these sales workers are employedin the Chinatown curio shops which cater to the,tourists, or theyare, salespeople who cater to their own people, such as insurance ,
salesman whose clients are of tbeir own ethnic group., Sales work .
calls for extensive dealing with the public, and thtre has beenreluctance-on the part of both the employer's and the Chinese tovanquish fears about how clients will react to a salesperson ofChinese ancestry.
Craftsmen
The crafts is one field to which the Chinese would be ideallysuited. Crafts are skilled. and other manual occupations. Approxi-
12g2-110-

mately 30 million blue-collar workere;areemployed in thisOcduPational category in the United States. Craftsmen transfofm the
ideas of scientistsand the plans of engineers into goods nd
services. They operate transportation. and communication sSistelia.
They build'omes and factories and machines. They 'are the mechanics
and the repairmen, fhe carpenters and the bricklayers. In the --.
crafts; one works with materials and with the hands more than with
ideas or with the public.
However, crafts are heavily unionized,,and entry into theseoccupations is extremely difficult. (This subject will be dealt
with more fully in Chapter VIII.) As a result, Chinese represen-
tation in,the crafts is insignificant. For example, it was but
4.3 percent in New Yotk State iu 1970. In actual numbers, it was
less than a thousandChinese males for the entire EmpireState.
Laborers, Farmers and Household Workers
qt.t one time, laborers, farmers, and household workers werethe predominant occupations of the Chinese in the United States.Tdday, the Chinese have almost disappeared from these major occu-,
pation groups. This rapid decrease is seen in Table 29, whichshows the occupational grouping of the Chinese for the four decennial
censuses. Private household workers went from 6.2 percent, in 1940,
to 0.8 percent% in 1970. Farmers went from 3.8 percent, in 1940,
.td 0.6 percent, in 1970. Laborers increased from a tiny 0.7 percent,
in 1940, to 2.3 percent in 1970, and we may see a slight increasein this category in 1980 as a result of the recent influx of immi-grants, but the Increase will never be significant to any de fee.
The most spectacular finding from4Table 29 is the phenomenal
increase in the professional and'tothnical percentages from amere 2.8 percent, in 1940, to 7.1 percent, in 1950 to 17.9 percent,
in 1960, and a whopping 26.5 percent in 1970. At the same time,
the work force increased five times within this thirty-year time -
span.
' The decrease in the managerial and sales positions can beexplained again by the fact that the small owner-operated stores
'are dwindling rapidly, and it looks as if everyone is scrambling
to get into the professional and technicalfields.
How do these percentages measure against those for whites,
blacks and Japanese? Table 30 gives a comparison. The Chinese
are far ahead of :all three other ethnic groups by percentage in
the professions; they trail far behind all three groups in thecrafts, and they are on even keel with the blacks in service work.
123

TABLE 29
MAJOR OCCUPATIONAL GROUSS OF THE CHINESE IN THE U.S.,
BY DECADES AND PERCENT, 1940-1970
MAlor Occupational-Groups
1940
1950
1960
1970
Tatal Employed
36,454
48,409
98,784
181,190
Professional Technical
2.8%
7.1%
17.9%
26.5%
Managers
20.6
19.8
12.7
8.9
Sales Workers
,11.4
15.9
6.6
4.3
Clerical Workers
11.4
.15.9
13.8
16.8
oCraftsmen
1.2
2.9
5.2
5.4
Operators
22.6
17.1
15.0
14.8
Laborers, except farMers
0.7
1.7.
1.3
2.3
Farmers
3.8
2.6
.1.G
0.6
Service Workers
30.4
28.8
18.8
19.6
Private Household Workers
6.2
2.6
1.0
0.8
Not Reported
0.3
1,5,
6.5
-
Source:
U.S. Census Bureau, Decennial Censuses (1940, 1950, 1960, 1970).
NQTE:
Between 1960 and 1970., some job titleswere shifted fray: one occupation
groupDto another., especially in the service work category.
0
-112-

TABLE 30
'PERCENT DISTRIBUTION OF EMPLOYED PERSONS
'MAJOR OCCUPATIONAL GROUPS, BY RACE, 1970
Major.occupational Groups
Chinese
Whites
Blacks
Japanese
Professional, Technical
''
26*5%
14.8%
-8.3%
19.0%
Managers
8.9
11.4
-,22
8.2
'Sales Workers
4:3
.6.7
2.2
6.4
ClerAcal Workers
16.8
18.0
13.8
20.2
Craftsmen
5.4
13.5
9.1
11.8
Operators
14.8
17.0
'23.6
11.7
Laborers, except farmers
2 :3
4.1
9.3
5.9
Farmers
,0.6
4:0
3.1
3.8
Service Workers' '
19.6
'9.4
'
20.0
11.0
Private Household Workers.
0.8
.,,-1.3
,.
4.
5,
8.3 ...
1.8
"
Sour
ce:
U.S
. Ceu
susi
Bur
equ;
Sub
ject
Rep
orts
(19
70).
o,
1.0

Detailed. Occupations
TO get down to specifics, exactly what professions or occu-pations are the Chinese engaged in? The Census Bureau lists 494occupation titles, but in Table 31 I have selected the ones inwhich the Chinese are'to be found to a greater degree.
In studying the figures, and percentages in this table, wesee some decided areas of concentration. There are 8,862 engineersand another 3,631 engineering and science technicians for an approxi -matetotal of12,500. Educators, both at college and precollegelevels, run close to another 10,000. Professional health personneladd up to about 8,000. These three groups already total about 40,500out of"48,000 professionals.
There are reasons why the Chinese are predisposed toward thesethree professions. Some of the reasons were mentioned at thebeginning of this chapter. To recapitulate briefly, one reason isthe importance attached to science and technology in Chinese educa-tional institutions in an effort to catch up with the West. Anotherreason is.that engineering and science arecourses of study morelikely to be-chosen by students who have problems expreSsing them-selves in English or who are shy about dealing with people. Themore impersonal disciplines of engineering and science or mathmeet their needs in that respect. A third reason is that Chineseparents understand what an engineer, or teacher, or doctor is.They do not quite know what a.psychologist or anthropologist is:Therefore, the parents tend to push their sons into,these tradi-tional disciplines. A fourth reason pertains to the educators orteachers. In social status, the scholar' or man of learning enjoystop prestige, hende the penchant toward teaching as a.career.
,
"tntry into these professions is also.samewhat easier fotI- the Chinese in the United States. Professional competence is
- an important criterion in these fields, and the Chinese canhandle this requirement better than the more illusive ones,-such as the ability ,to_socializeor play-office politics.
If the Chinese araculturalXy inclined toward these profes-,
t sions and have succeeded very well in them, there is little.reasonwhy anyone should.question their inclination, except that whenthere'is such a heavy oncentration in a limited number of profes-sionsthe group is extremely vulnerable to economic or socialchange.
ppro
ke-.educators for example. Close to one-fifthof thefessibnals are teachers in the grade and secondary schools oressors in universities and colleges. We know from the popula-
-114-
12i,

0.
t
TABLE 31
SELELZED OCCUPATIONS OF THE CHINESE IN THE U.S., 1970
Selected Occupations Male Female Total %-
Total 16 Years and Over 113,929 67,261 181,190 100.0%
Professional, Technicar& Kindred Workers . 34,436 13,565 48,001 26.5%
Accountants 2,073 823 2,896 1.6%
Architects 596 44 640 0.4%
Computer Specialists 1,288 414 1,702 0.9%
Engineers g,780 82 8,862 4.9%
Aeronautical & astronautical 510 0 510 0.3%
Chemical 531 ' 0 531 0.3%
Civil 2,222 40 2,262 1.2%
Electrical & electronic 2;588 22 2,610 1.4%
Industrial . 148 0 148 0.1%
Mechanical 892 20 912 0.5%
Lawyers & Judges 327 45 372 0.2%
Librarians, Archivists & Curators 234 561 795 0.4%
Mathematical Specialists 122 154 276 0.2%
Life and Physical Scientists 2,244 582 2,826 1.6%
Biological 382 126 608 0.3%
Chemists 1,353 417 1,770 1.0%
-physicists and astronomers . 278 19 297 0.2%
Personnel and Labor Relations Workers 340 83 423 0.2%
Physicians, Dentists & Related Practitioners 3,344 586 3,930 2.2%
Dentists 423 0 423 0.2%
Pharmacists . 591 156 747 0.4%
Physicians, medical & osteopathic 2,200 408 2,608 1.4%
Registered Nurses, Dieticians & Therapists 156 1,413 1,569 0.9%
Health Technologists & Technicians 373 1,073 1,446 0.8%,
Religious Workers 19"6 27 223 0.1%
Social Scientists 285 94 379 0.2%
Social and Recreation.Workers -372 461 833 0.5%
Teachers, College & University t 4,059 1,005 5,064 2.8%
Biology . , . 99 57 156 0.1%
Chemistry 244 74 318 0.2%
Physics .
. , ., 389 0 389 T.2%Engineering . 545 0 545 -04%Mathematics 318 88
..-406 0.2%
Health specialties 181 121 302 0.2%
PsychologyEconomics
54
f03
24
21'
78
1240.0 %'
0.1%
History 116 40 1'56 0.1%
English . ) 96 79 175. .0.1%
Foreign'Language 150 104 254 0:1%
Teachers, Except College & University 1,209 3,332 4,541 '2.5%
Elementary School- 198 1,866 2,064 1.1%
Pre-kindergarten '& kindergarten 0 379 379 0.2%
Secondary School 807 675 -1,482 0.8%
-115-
:127
(continued)
/

4k
TABLE 31-continued
Selected Occupations- Male Female Total I
'Clerical and Kindred Workers 9,768 20,73 6 30,504 16.8%Bank Tellers
9C117 600 717 0.4%
Bookkeepers 1,04, '731 2,166 2,897 1.6%
Cashiers 1,354 2,485 3,839 2.1%Counter Clerks, Except Food 267 253 520 0.3%Estimators & Investigators N.E.C. 182 257 439 0.2%Expediters & Production Controllers 240 83 .P 323 0.2%File Clerks 521 552 1,073 0.6%Library Attendants & Assistants 252 510 762 0.4%Mail Carriers, Post Office 517 32 549 0.3%Office Machine Operators . 649 1,605 2,254 1.2%Postal Clerks 706 302 1,008 0.6%Receptionists 22 410 432 0.2%Secretaries 153 ,924 3,077. 1.7%Shipping & Receiving Clerks 482 66 548 0.3%Statistical Clerks 207 450 657 0.4%.
Stenographers 21 247 268 0.1%Stock Clerks Srl Storekeepers 613 294 907 0.5%Telephone Operators 69 327 396 0.2%Ticket, Station & Express Agents 130 . 164 294 0.2%Typists 206 2,958 3,164 1.7%
Craftsmen and Kindred Workers 8,789 1,060 9,849 5.4%Bakers 278 85 363 0:2%Construction Craftsmen 1,748 19 1,767 1.0%
Carpenters 569 19- 588 0.3%Electricians 580 0 580 0.3%Plumbers & Pipe Fitters 255 0 255 0.1%
Mechanics & Repairmen 2,463 143 2,606 1.4%Aircraft 370 46 416 0.2%Automobile mechanics 718 21 739 0.4%Radio & television 508 17 525, 0.3%
Metal Craftsmen Except Mechanics 566 26 592 0.3%Machinists 215 ' 8 223, 0.1%
Printing Craftsmen 464 116 580 0.3%Tailors 333 106 439 0.2%Telephone Installers & Repairmen 231 0 231 '0.1%
Operatives Except Transport 4,914 15,025 24,939 13.814
Assemblers 269 332 601 0.3%Checkers, Examiners & Inspectors; Manufacturing 284 138k,
.
422 0.2%Clothing Ironers & Pressers ' . 1,408 686 2,094 1.2%Cutting Operatives N.E.C. 123 120' 243 0.1%Dressmakers & Seamstresses, Except Factory 17 222 239 0.f%Garage Workers & Gas Station.Attendants 734 0 734 0.4%Laundry &.'Dry Cleaning Qperatives N.E.C. . 1,921 860 2,781 1.5%Meat Cutters & Butchers, Exc. Manufacturing . 1,572 81 1,653 0.9%Metalworking Operatives,Operatives, Exc. Precision Machines'
.
280 104 384 0.2%
. 'r
-116- , / (continued)
128
r

tABLE'31 --continued
-
Selected Odcupations
Engineering and Science TechniciansChemicalDraftsmenElectrical & electronic engineering
Writer's,Artists and EntertainersDesigners .
Editors & reportersPainters & sculptorsPhotographers
' Public relations men & publicity writersWriters, artists & entertainers n.e.c:
Research Workers Not Specified
Managers and Administrators Except FarmBank Officers and Financial ManagersBuyers, Wholesale & Retail TradeManagers and Superintendants, BuildingOfficials and Administrators, Public Adiastrn:
Federal public administration & postal service'Restaurant, Cafeteria & Bar Managers--Sales Managers & Dept. Reeds, Retail TradeManagers & Administrators Salaried
ConstructionDurable goods, manufacturingNon-durable goods inc. not spec.Transportation .
Wholesale tradeRetail trade
General merchandise storesFood storesFinance, insurance & real estateBusiness & repair servicesPersonnel servi'ces
Managerd & Administrators N.E.C. Self-EmployedWholesale tradeRetail trade
Food storesPersonnel serviced:
Sales Workers.'.0
Insurance Agents, Brokers & UnderwritersReal Estate Agents &'BrokersStock .& B_ ond Salesmen
:Salesmen .& Sales-ClerkN.E.C.Sales representatives,'wholesale trade'-Sales clerks, retailZtradb
beneralmerchandise storesFbod storesApparel & assessories stores
.
manuf.
I
-1]7-
129
Male Female .Total %
3;189 442 3,631 2.0%
244 .64 308 0.2%
1,45/ .170 1,627 0.0839 0 839 0.5%
2,02Q 651 2,671 1.5%467 57% 724 0.4%
190 125 315 0.2%.
407 68 475 0.3%
282 20 302 0.2%
108 66 174 OA%293 ' 75 368 0.2%
1,961 766 2,727 1.5%
.13,189: 175
361200
397
3363,207
352
3,328181
228391
267
3331,051
116571200160
1204,020
277
2,1611,805-
1,203
4,690504
236,306
3,107.5692,066
2751,047
2,868 16,057 8.9%239 614 *. 0.3%
;p0-, 503 0.3%.119 319 ..0.2%,
66 463 0.3%
. 381 . 0.2% .
546 3,753 2.1%.352' Oi
596 3,924 2.2;
0 181 0.1%
0 228 pA.% .
.79, 470. .0.3%
, 66 , 333 0.2%
'.' 0 333 0.2%
'29.3 1,344 0.7%
'52 168 0.1%
132 703 0.4%
0 - 200 0.1%36 20 0.1%
20. 340' 6.2%
847' 4,867 2.7%
28 '305 0.2% >
434 2,595 1.,4%
317 2,122 1.2%
324 1,527 0.8%
3,180 7,870 4.3%
' - 98 602 0.3%
34 27.0 6.1%
20 326 0.2%2,812 5,919 3.3%
72 ..641 0.4%2,458 4,524 2.5%
1,102 4377 0.8%
450 1,497 0.8%176 304. 0.2%
.(cOntinued).0 .
,
,1

TABLE 31--continued
Selected Occupations "\-1, -Male Female Total %
Packers & Wrappers,-Except Meat & Produce 256 583 839 0.5%
Sewers & Stitchers 185 -9,801 9,986 5.5%
Transport Equipment Operatives 1,824 32 1,856 1.0%
Deliverymen & Routemen 484 13 497 0.3%
Truck Drivers 389 19 408 0.2%
Laborers, Except Farm 3,597 650 4,247 2.3%Freight & Material Handlers 152 66 218 0.1%Stock Handlers 1,417 305 1,722 1.0%
Farmers & Farm Managers 421 78 499 0.3%
Farm2Laborers & Farm Foremen 260 -217 477 0.3%
SerlAce Workers, Except Private Household 26;724 8,742 35,466 19.6%
Cleaning Service Workers 1,545 445 1,990 1.1%Food Service.Workers 22,302 5,567 27,869 15.4%
Bartenders ,
Busboys764
1,39043
94
807.
1,484'0.4%
0.8%Cooks, exc. prillate household / 11,433 1,350 12,783'. 7.1 %'
Dishwashers 1;127 442 1,569 0:9%
Food counter & fountain workers 119 220 339 0.2%
Waiters . . 6,211 2,532 8,743 4.87..
Rood service workers, n.e.p. exc. priv. househld. 1,258 886 2,144 1.2%
Health Service Workers '/
340 ' 764 1,104 0.6%
Personal Service Workers "625 990 1,615 0.9%Hairdressers & Cosmetologists 27 431 458 - 0.3%
Protective Service Worker 377 62 1 439 -'0.2%
Private Household Workers 317 1,108 1,425 0.8%
Source: U.S. Census Bureau, Subject Report, PC(2)7A (1970).
1.30:'-118-1

tion census that the younger age groups are shrinking and thatthe birth rate is already below replacement level. School enroll=ment and even'college enrollment has dropped drastically, so that ,
the teed for educators will correspondingly shrink. When we haveall our eggs-in a few baskets, we may run the.risk of high unemploy-ment affecting a large number of the Chinese.
The'Preponderance of enginders,among the Chinese hasgienrise to self-:stereotyping by the present college generation, andengineers are put damn as one of a common breed. The girls simplycannot gdt excited about dating as engineer. They have alreadytyped him as a studious, introverted, quiet, dull perton. And someengineers see themselves in the same light. Yet the choice ofengineering as a major persists. Out of curiosity, I tallied themajors of the Chinese students in one of my classes. Of 51 students,14 were engineering majors, 11 were in the sciences, 8 were notsure, and the remaining 18 were spread out over.the other disciplines.
The prospects for health workert are brighter, and this is theoccupational field with growth potential. More people are neededfor the increased demands for better health dare. And this fieldis more diversified as well.
Explode the Myth
According to the 1970 census, a myth concerning the Chinese- -that thergare few in the creatiVe careers--must be exploded. Notthat the numbers are spectacular, but 2,600 is significant. Chinesein the creative professions work as designers, painters or sculptors,photographers, writers, and editors. The editors most likely workin the ethnic press. N. /
In a study of Chinete newpapers conducted f r his master'sdegree at the School of Journalism at Columbia iversity, Andy
. McCue found that there were many editors but n reporter on anyof the newspapers. These editors earned pitif 1 salaries like$200 a month. They had very respectable titl s, b4t little else.
Service Work.ft
As the term implies, workers in this occupation group providea service such as food preparation, cleaning,and maintenance,health care, personal care or protective service. Ten millionAmericansware'in these occupations, and about 35,000 Chinesefall under this heading. Service work has traditionally beenthe most important occupation group for. the Chinese..in this
41.
I t,;
country because it includes those- jobs which fa 1 loithin ,the. f
heading of restaurants and laundries.
; ,
Ih same cities, like'Boston, New York, and Seattilegservicework is still the leading occupation group for the Cpinere. Andit is the male, much more so than the femalewho is,in#bervicework. For the Chinese in particular, service,work today is almostsynonymous with such restaurant jobs as cook, waiter, bartender,dishwasher, etc. (See Table 31.)
From 1550 to 1960, service work amonethe Chinese declinedsignificantly from 28.8 percent to 18.8 percent of the totalChinese employed. The 1970 census registers a slight increaseto 19.6 percent. My own projection is that this category will,increase in importance in 1980because of the huge influx ofimmigrants who will be going into these occupations.
I would say that the percentage and numbers in restaurantwork is even greater than the 19.6 percent figure. A later table(Table 89), showing employment breakdown by industry, revealsthat approximately 30,000 out of a working labor force of 180,000,or one out of everyeix Chinese persons employed, are connectedwith eating or drinking places.,
' Actually, the 3,753 who classified themselves as managersof restaurants, cafeterias, and bars, may also be classified asrestaurant workers because, by and large, the managers are self-employed owners who invariably double as cooks,, headwaiters, orbartenders. Other persons, such as cashiers and bookkeepers;generally listed under the clerical category also come under theprovince of restaurant work.
Thus we see that this one line of work,employs 23,000 personsand far exceeds any other type of employment for the-Chinese.
The Disappearing Laundryman
The Chinese laundryman is headed for extinction. Listedunder clothing, ironers and pressers, and laundry and dry cleaningoperatives are 4,800 for the entire United States. (See Table 31.)Others may be in laundries as truck drivers or "managers," but.this line of work for the Chinese is definitely passe. Not toomany years ago, more Chinese were in laundries than in any otherline of work.3 Today, the laundry 'business has been edged out
'. I
3. Betty Lee Sung, The Story of the Chinese in America (New York:Colliers, 1971), Ch. 11..
132-120-

almost entirely by home washers and dryers, permanent press fabrics,and the disdain_by the .Chinese themselves for laundry work. Unfor-tunately, the image of the Chinese laundryman persists in the publicmind because it is constantly reinforced by the press and media.Today's laundries are run primarily by older immigrants. In the
1950s and early 1960s, laundries were popular with newly arrivedimmigrants because laundry work did not require much capital orskill. Today, one can't give away a lanndry--even one with manglesand presses. There are no takers.
Retail food stores--even superbarkets--are also losing groundwith the Chinese. Less than 1 percent of the Chinese remain inthis line of work. At one time, it ranked just behind laundriesand restaurants as the most important occupation. Of the three,
only restaurant work remains in the forefront, and it,is outstrippingall other types of work by the number of people engaged in it.
Garment Industry
The, newly arrived femaleimmigrant today goes into the garment,factory. About 10,000 are employed as operatives, meaning predomi-nantly sewing machine operators. The Chinese have now supplantedthe Jewish and Italian operators, in the garment industry.
In New York City, 43.7 percent of all employed Chinese femalesare operatives. New York City happens to be the capital of theclothing industry in the United States? but garMent factoriesutilizing Chinese female labor are also found dotting the borders
' of Chinatowns throughout the country. In Boston, the percentageis 39.6 percent; in Chicago, 23.4 percent; in San Francisco-Oakland,26.3 percent; in Seattle, 29.6 percent. These high percentagesgive us some idea of the importance of the garment industry inthe employment picture of the Chinese female.
Clerical Work
Native-born Chinese females or, the better educated ones arefound in such clerical jobs as bookkeeper, cashier, ,secretary,office machine operator, typist, and file clerk.' The concentrationof Chinese females in the clerical category is even more pronouncedthan that in the operatives category. 31.8 percent or close to22,000 out of a labOr forde of 70,000, are in this occupation
''group alone. In California and Hawaii, the percentage is evengreater, running from 36 percent to 37 percent. If we look atthe educational attainment of the Chinese female (see Table 23),,it is immediately obvious that she is grossly underemployed.
13%' -121-

Construction
. Seven out of ten craft jobs held by the Chinese are inCalifornia or Hawaii., Yet, ,even in these areas, the Chineseare woefully-underrepresented in the building trade crafts:carpentry, masonry, electrical work, and plumbing. Altogether,only 1 percent of the Chinese labor force is found in.the con-struction craft jobs, and the small percentage does not mean,that they do not seek this type of work:
This fact yas highlighted when the Chinese Cultural Centerwas being built in San Viancisco's Chinatown in 1970. The buildinghouses -a 572-room Holiday Inn Hotel', and the Cultural Center :.
occupies one floor. An organization called Chinese for AffirmativeAction, f6rmed to ferret out inequities,and discrimination againstAsians in employment, charged that only 3 of the 220 workers onthe payroll of the construction firm were Chinese. The CAA furtherstated that, "A recent survey of 57 building trade locals inSan Francisco by the-Federartqual Employment Commission showedthat less than one percent of the 537060-construction workers in,San Francisco are Chinese while the Chinese population comprise10 percent of the population.."4
On the other side of the continent, Chinese in the constructimrcrafts are even Scarcer. In 1969, according to the same governmentreport, there were exactly six males of Oriental extraction in theconstruction crafts in NeW York.
One Saturday morning, Jul, 1974, Asian pickets marched andchanted outside the Confucius Plaza site in New York's Chinatown 4P
to-protest the,absence of Chinese construction workers on a 42-million housing and school proiSif-financed in part by gOvernmentaid. The grievance was that out of a seventy-one-person workforce, only four were of Chinese extraction. One was an engineer,two were laborers, and one_an office worker; not one Chinese helda craft job. The protesters felt that this was one of the firstmajor projects to rise, in New York's Chinatown, and that, ifanywhere, a Chinatown project A.b6uld have a fair representationof Chinese construction workers.5
4. "Chinatown Employment Under the Gun," East/West (July 15, 1970).
5. "Asians Picket Building Site, Charge Bias," New York Times(June 1, 1974).
-122-

Age and Employment
.Ordinarily,'advancing years bring commensurate advancementin occupation. With the Chinese, it is those in the 25 to 34age bracket who are occupying the upper strata jobs, whereasthose in the upper age brackets are concentrated toward thelower end'of the occupational scale.
For Chinese miles 45 years or over, service work leads allthe other categories, and we have already discussed the natureof theSe jobs. These are the older immigrants who came herebefore World War II and perhaps recent immigrants who have dif-ficulty with the language. The likelihood of these men shiftingtheir occupational field is rather remote.
That there are 17 percent 45 years and over who all themselves
managers, looks favorable, but is somewhat deceiving. Time has
enabled these men to accumulate some capital, and no doubt,manyhave invested it into a small business of their own--a restaurantor gift shop, perhaps. A good third of the managers are of thistype. The professions are still strong with those in the 45- to64-year age bracket.
The number of women working is greater in the 45- to 64-yearage bracket than for any other group. By 45 years of age, awoman's children are grown or in their teens, and she is nottied down to domestic or maternal duties. Of the 18,000 Chinesewomen working, one-third are in operative jobs. These are flex-
ible, fairly easy to come by, and do not need much skill. No
knowledge of the English language is necessary, and the,jobs arelocated on the fringes of Chinatown. The co-workers are peoplelike themselves, and garment factories fulfill a social functionas well as an employment one.
Now let us swing to the other end and consider the teenagegroup of 16- to 19-year-olds. Actually their situation is diffe-rent from the regular' workers because those in this age groupare still enrolled in school. Whatever jobs they hold are part-time, after-school, or weekenejobs. The type of jobs they holdis not too consequential. These will not be their chosen careersor occupations. Teenagers take jobs for spending-money or tosupplebent their educational expenses. They take what they canget for short periods of time. It would be ideal if these youngPeople could utilize this period in their, lives to experiment andsample the real world of work, but teenagers take what they canget when teenage jobs, are hard 'to come by.
There are roughly 35,000 Chinese, young people in this age .

TABLE 32
MAJOR OCCUPATION GROUPS OF CHINESE IN THEU.S., FY-SEX, AGE GROUPS, AND PERCENT, 1970
Occnpation_Group
Total
16-19 Yrs.
20-24 Yrs.
25 -34 Yrs.
35-44 Yrs.
45-64 Yrs.
65+
-No.
%No.
%No.
%No.
%No.
%No.'
'
No.
Males
114,433
100.0
6,434
100.0
11,526
100.0
28,058
100.0
28,962
100.0
35,869
100.0
3,584
100.0
Prof. Tech.
33,119'
28.9
364
5.7
2,610
22.6
13,679
48.8
9,505
32.8
6,531
18.2
430
12,0
Managers Admin.
13,061
11,4
42
0.7
428
3.7
2,110
7.5
3,687
12.7
6,161
17.2
633
17.7
Sales Workers
5,021
4.4
473
7.4
554
4.8
965
3.4
1,072
3.7
1,636
4.6
321
9.0
Clerical Workers
10,762
9.4
1,346
20.9
2,189
19.0
2,213
7.9
2,054
7.1
2,692
268
7.5
Craftsmen
8,367
7.3
228
3.5
842
7.3
1,872
6.7
2,276
7.9
2,984
8.3
165
4.6
Operatives
11,998-
10.5
989
15.4
1,319
11.4
1,926
6.9
2,709
9.4
4,625
12..
430
12.0
Laborers
3,787
3.3
948
14.7
603
5.2
515
1.8
633
2.2
964
2.7
124
3.5
Farmers & F. Mgrs.
478
0.4
10
0.2
-25
0.2
57
0.2.
115
0.4
224
0.6
47
1.3
FSrm Laborers
352
0.3.
76
112
29
0.3
38
0.1
62
0.2
123
0.3
24
0.7
Service Workers
27,010
23.6
1,941
30.2
2,922
25.4
4,652
16.6
,776
23.4
9,659
26.9
1,060
29.6
Private Household
478
0.4
17
0.3
50.0
.01
0.1
73
0.3
270
0.8
82
2.3
Females
69,129
100.0
5,578
100.0
12,205
100.0
15,714
100.0
16,124
100.0
18,218
100.0
1,290
100.0
Prof. Tech.
13,402
19.4
192
3.4
2,243
18.4
5,855
37.3
2,270
17.1
2,225
12.2
137
10.6
Managers' Admin.
2,636
3.8
46
0.8
i69
1.4
412
2.6
785
4.9
1,165
6.4
.59
4.6
Sales Workers
3,531
5.1
877
15.7
680
5.6
408
2.6
620
3.8
879
4.8
67
5.2
Clerical Workers1
21,989
31.8
2,912
52.2
6,126
50.2
4,837
30.8
4,280
26.5
3,719
20.4
115
8.9
Craftsmen
?4
846,
1.2
20
0.4
78
0.6
142
0.9
214
1.3
330
1.8'
62
4.8
Operatives,
15,556
22.5
371
6.7
1,018
8.3
2,374
15.1
5,105
31.7
6,209
34.1
479
37.1
Laborers
.
592
0.9
72
1.3
75
0.6
79
0.5
98
0.6
243
1.3
25
1.9
Farmers & V. Mgrs.
-114'
0.2
00.0
19
0.2
60.0
26
Q.2
59
0.3
40.3
Farm Laborers
247.
0.,4
37
0.7
20
0.2
33
0.2
36
0.2
106
0.6
15
1.2
Service Workers
.8,842
12.8
974
17.5
1,630
13.4
1;370
8.7
1,910
11.8
2,708
14.9
250
19.4
Private Household
1,374
2.0
77
-
1.4
147
1.2
198
1.3
300
'
1.9
575
3.2
77
6.0
Source:
U.S. Census Bureau, Subject Report, PC(2)1G (1970), Table 22.
-124-

group. They make up 8 percent of the total Chinese population.One-third of them hold some type of job. This is a smallerpercentage than white teenagers of the same age bracket, butit is a higher percentage than that of the blacks.
The most outstanding fact that comes to light when theoccupational. pattern is, broken'down by age group is the highpercentage in the professions for the 25- to 44-year age groupfor both males and females. These age groups consist of menand women who have completed, their formal education and have madea choice of careere. Almost half of the males in the 25- to34-year age group are in professional and technical work, andanother 7 percent are in the managerial classification. Abouttwo out of every five Chinese women are similarly situated inthese two top occupational categories. If these figures areany indication of the potential of the Chinese, the future looksoptimistic. Meanwhile, for the present, some real problemsexist.
13-125-

Y I
SUMMARY OF FINDINGSAg 14-Ms- ake' '
.1
1. 'Stereotypes have-bXed theg Chinese in the public mind.
The view is tai they are 'suitable for only certain types of work.The truce isthat during their hundred and thirty odd years ofhistory iqthis country, they have run the gar* of the majoroccupation 'groups, concentrating in large numbers in one area oranother, depending upon the social or politidal attitude toward,4Lem at the time. -
.
2. In 1970, the Chinese-American labor force numberedapproximately 190,000. Three-fourths of the males and one-half"of thwfemales 16 years and over are in the labor market.
3. The male labor force participation rate is c9nsiderablylower than the national average. The female rate is sodethathigher.
4. The labor force participation rate fluctuates widelyfrom city to city.
5. The occupational pattern for Chinese males by major groupbreakdown tends toward extremes--a concentration in the professionalcategory and another concentration in the service work group. For
feilares, the twin-peak concentrations are the clerical and opera-tives categories.
6. The middle-class occupations of sales workerand crafts-men are conspicuously fe' among the Chinese. Clerical work isprevalent with native -born females ankthe better-eduCatedVoreign-born females.
7. Categories frok which the Chinese are almost totallyabsent are farmer, unskilled laborer, and private household worker.Yet, at one time, these were the predominant occupations of theChinese.
8. The most spectacular increase has been in the professionaland technicaffield, rising from 2.8 percent, in 1940,., to 26.5percent, in 1970. For the'males, the percentage is even greater,28.9 percent, and for males in the 25- to 34-year-oldgroup thepercentage is 48.8.
49. Of the.professional careers, engineers an educators
lead the field, followed by personnel In health work.
10. The restaurant business is the single most importantsource of employment for the Chinese. 30,000 are engaged in this
?188

field alone.> .
'
-. - :-11. Ten thousand Chinese females, usually foreign-born.
immigrants, are employed as operatives,.predomidattly In.,the%garment industry.. ,
12. Laundries and food stores Are fading out asChidese enterprises. _ .
&
Y
. .
;.7
k.
-- '13. An age breakdown of occupations 'held bythe,Chi6 'cdpe . .;.4 .
reveals that the older generations generally hold lower echelon .l..
..- .. .
jobs, but there is a record-breaking penetration of t4e profes-,,sional and technical levels by the younger generations. '
i. ., '
a
..
ti I
1.
ar
f
4
k.
",
a'
-
, S
;
.a

se
RECOMICENDATIOES
A Chinese labor force of 190,000 for the entire United Statesis a veritable "drop in the bucket." To those who feel threatenedbyan imaginity.flood of Asians: May-your minds be set at ease;The occupational pattern of the Chinese is simply too polarized
1 'and too concentrated in a few occupations. There must be a morebalanced distribution- throughout the occupational spectrum. Thereis no reason, why Chinese cannot be managers or administrators,,carpenters'or bricklayers, sales personnel or brokers. Justbecause they are not in positions like these now is no reasonwhy, they cannot be. Once a breakthrough is accompliShed, others
. generally follow. However, many presently entrenched in theseoccupational groups -are putting up strong resistance to admittingChinese in their ranks. TheChinese cannot fight this battlealone. Reheat legislation and directives, such as EE0C,'ContractCompliance, and Affirmative Action, have given-the Chinesegoodleverage. Such actions show that government can legislate change.
4. + .
#
. ,
. As professionals, too many Chinese are in the.fielda Of:engineeting and teaching...*All -the-eggs-in-two-baskets situation -makes the,Chinese,highly vulnerable tp,any shift in the ecohOMYor labor market." Take teaching, for example.. Demographers havealready pointed out the declining birihrate,andthe continual,
. '" "decrease in the lower age bracketa. Teachers are already inoversupply, and future demand is steadily decreasing.' Chinese s'
educators would do well to consider preparing for another,Ttofes- <- ,
,- sion. . 1[ 4 , -, '..1 ,.
, e ,
, One out of every six persons in the labor,
force is'inL.,
restaurant Vork.' Chitese food ia popular. and-Same of ,the, have Income veritable American institutions., Still,, the same
'''.A....-recommendation applies: Disperse intp.Oiher lines of work. Therising cost Of,food or abUsiness setback couldcut,dOwn on
. restaurant patronage and adiaproPortionite-nuMber of Chinesewould be 'affected. .
.
t'
t
The same coul d be said for th7e.heaconcettraiion'ofChinese; femalealt aerial and aperative'jobTheproblem
clerical area ii due more to seXism that to racism, forthe same situation hold true for non-Chinese feiales. ,A,,sUggestedalternative field for disperilotwpiad be the field of "health,,a rapidly growing industry, .
<, -
lithen.tOPOut of every fiVe Chinese females eMployedin Etw--York are likely',-,to be fpunCin the garment industry -ire
gine bpvterrow is the range of-oceupations and how limited the,options 'for thetfiltedi female. One of ,my research asOstahts,
-128-
C
11
I.
,....,
t
Ellen Lau, intervieweds number of women in the garment factories,and some of the answera.they give (and most likely in this order-of importance) to why they work there are listed below:
0
1.
2.
3.
41
5.
6.
_
Easeof,getting a jobDon't have to ride the bus or subway to get to workFlexible scheduleDon't speak EnglishCan learn job proficiently in about a week.Social and informal atmosphere,in factory.
c,
There are about 230 garment factories scattered around thefringe of New York's Chinatown: Some have only ten or twelvesewing machines; others operate on a larger scale. A good numberof these factories are owned by Chinese contractors who.bid forjob lots on Seventh Avenue, and the. competition is very keen.
The operators work on a. piece-rate basis. The New York garmentworkers are unionized and there are union. regulations governinghoursand wages,but the competition is so'great that both-theboss and workers wink ,at the clock and the ,payscale'and operate
as competitively as possible-.
Such a high concentration of the females in dne type'of:work alone is a most unhealthy situation. I would recommend
that studies be undertaken immediately to examine the difficulties.Ithese females operated under and to either introduce these womento other industries or bring the industries tb the vicinity ofChinatown, The better'solution would be to help these women goa short distance beyond the Chinatown borders, but. this is easier,
said than done. Most of these women are so deathly afraid of'venturing out that they would prefer to accept lower.. wages and
working conditions than to venture foith._. Thii fear,is not -confined to the Chinese female;,ielii the same forthe .
male. Restaurants in the suburbs that,need cdoka,' or bartendirs,or waiters must send a car to Chinatown daily to pick up. thdir
help. Otherwise'they could not fihd empiOyeep. ,
. ,.
. -
Since this is, at present, an accepted- practice fde,themales, it can be employed in a modified form for the females.,
.. Any plant or enterprise wishing to use Chinese female workerscan arrange for scheduled transpOrtation fram:Cbinatown .=
a station wagon picking them up in the morning and taking'themback in the evening. I dare say over a perioa'of time,after the workers have gotten used to. the idea ofgoing beyond'Chinatown, some of their fears will'be dispelled and theycanbe weaned to public transportation. -
'
Since fear of the outside world is such an inhibiting factor,
141,
A

in the choice of occupation, I would also recommend that employees'",
bt hired in a,smali group at a time, In "numbers, they will find
courage, one 'bolsterl.ng the other. The firm .may also hire a.;bilingual perami,t4 act as guide 1114 leader during the' initiation-period. The leader explain their duties,, show thew thelayout, introduce them to their cdr,workersi tell them- their benefitd, take their down to the lunchrefam, etc., and stay with them-uritiX they feel more comfortable. This ismore than :what theusual fii-m will do for Ittf newly hired employees, but I baieVtthit the firm will be more than rewarded fbr -ite gffortse-
,.
,,-
*s
Anothet bolution; would be to try; to ,bripte plight ,41dubtry. .
to the 'vicinity of Chihafawn. am not -6ing_t9 recommend .setting_up another agency' tq undertake this sob. .There; irViany already
stence..6.' The knot in the situation 'is therslacie of awareness'e
*--s, - ,
that the. Asian cam:Enmities' have 104loyment, problems... This ',pant, - C/garlY lkinbld, Witte, 4ice-president of
.the New York Chamb.er.of Commsroe.and Industry,. 'and ift...Veorge'
*Allen Foilkest first' deputy-Commissioner of the Department ofCommerce .end. Industry, Board of Economic- Wemelopment Administra
'tion -City of 14,ew York.at public heariliga.conducted.
,the Civil Rights COmmidSion.. \!Both these gentleien,said essin-. tinny, "With reference ba'..inctessing* Asian America4 eiiploymint
and tipirading in odi membe firms, we -frankly :'=ve not beenat:7are
Y. of -the existence of. any problem in this at 2
.,-
:Brougfit out in. the testimony b p4rade of representatives° fraa agencies like the. two meiti..ed,ihove and' otherS from govern-ment and private concerns, al are the facilities' that Cawbe.utiligei to help the Chine own 'communities- diversify, into. other
4ines of work; Let m /fat a nuMbei of these catalytic organi-zations or agencie- . Every state has ,parallel agencies,, tut
the NewNew York St= e Department of ,Commerce alone, there are:
' 1. ew York Job' Development Authority- -makes long-term
Ascot, mortgage loans for construction of .new or expanded .produc-: 4
facilities. A A
,2. Job incentive:Program-approves state tax credits for.firms constructing new plants or expanding facilities and providing'job opportunities in low-income areas and operating approvedtraining programs.
-
0: United Stites Cammission on Civil. Right) Public Hearing,New York, July 12, 1974, unpublished transcript.
14'2-130-
4
c,

eY
1
4
1
,
\\ 3.,.Industtial Location Servicespecalist in helping firms,,
:, large An.ctsmal.14 to find the right.locatio4,gor-their plant14 inNo i 1. strict,confidence ap:Lat no coat. -. ..O.P. _ -
: :, '
,
, :'...
4. .Nii,1 York, Business Develcfpmett Corporationa quasi-npublitcoriwyktion which -may' lend financial assistance to industry inNey York*State when-requirements are beyond the limitation ca:
,
conyentionalendifii institutions.,
5. *Small Business AdministrationaoazifeTkoney to business for-equity or,long range,finanCing. . -,'
.
.'
., ,
-,
6. International Commercepromotional efforts todevelop....,
foreigi trade salesopportunities. A *. ' .
S.. AA% ' . ' t.
, ....4
:A, :"t " Piiiate.Orunizftiois such as the Executive Volunteer Corps,4 ''. ,,
.. .' where retired executives offer the bVneTit of their experienceaud.expertise, and commercial banks are othei tracks which canhelp the Chinese community expand its employment horizons and
, cincreasdlts dconamic.p&dntial. -
...
.
.- .
e'210
Pt
I
t
%.
17')/'e
'131 ,'". A
.1
.5111.
n
,
6
'

'I
,
-
-
<,
gRAPTER v
WORKING WOMEN
Shirley Temple Black, the darling'child-star of the 1950s,has earned millions in a career and manner thatsfewcan hold e-,*
."--cdnd16 to/ Aet,..as I sat down'to write this-gapter, 1 recalled--reading in the,Sunday Parade magatind of July 14, 1974 that thisdidtinguished lady had just been appointed to the Board of Direc-tors ofIralt Disnel.Productionli. ',She is the first.female ever
elected tp the board. lien asked ,why she vadothosen, one Disney
spokesman remarked, "Window dredging/.
r I could not help but wonder how Mrs. Black, who undonbtedlyhas more instinct and know-how about juvenile entertaintent in4her little pinkie than most of her male co-directors on the board.
;4have in their' heads; woad react to that statement. ,If it happenedto Shirley Temple Black, can you imagine what..the rest of us womenexperience continually ?'
.
Shadows, Chattels, or Adjuncts 4
.Even in,the.year 1975, women are not thought of seriously interms of occupation or career. They'work twelve to,sixteen hodrsa day, perpetuating the human race, clothing and feeding their .,
.families, keeping the Wheels of daily life rhnning'sMoothly, andptoviding their males with the suppcitt and quickup.eci enable th044,to carry on in their careers. :Women's work"iutS...the'gamut, and
is never done. That is why it is not even lookid upon as an moil-. 'Nation, nor given its proper due, Itagine what llcli4d happen if.,all 'housewives went on strike. The world wouldliome to a stop and
there would be. absolute chaos.
, .For centuries; women were' considered shadows, chattels, Or
'adjuncts to their menfolk. In China,-COnfticiUg subordinated fe-
males at childhood to theit fathers, at maturity to; their hUsbands,

f.
\
and at.old age., to their sons. Even after a mother had nurturedand raised her son to manhood, she was' still considered his infer-ior. Confucian tenets governed, Chinese civilization for more than2,000.years. It is only within the last few decades)that womeneverywhere have begin to assert themselves. In asserting themselves,they are saying, "We can do whatfyou do We want to do what youdo.. We want to be(paid what you`dre paid. We are no longer contentto live in your shadows relegated permanintlito supportive rolesor lowly tasks that you consider beneath male dignity! to perform."
Double Burden
The drawback to these assertions is that, although women.arnow competing in the labor market outside the home and, in everyinstance, have proven themselves competent to any task performedby men, they are still saddled with the work og their former'states.They have gained in one respect without being relieved of theirduties in the other, thus giving them a double role. and doubleburden.
Let us compare the daily routine-of a working mother with'wham-I am very familiar to that.of her husband. The mother worksmore from economic necessity than from choice. She took a lob sixweeks after the birth of her fourth child, because the husband'searnings simply could not cover the family expenses.
Every morning, the mother begins her day with preparing break- .
fast and hag lunches for the children who go to school, she dressedthe younger ones and takes them to a neighbor who looks after themduring the day. She straightens the house a little before leavingand makes sure that all the windows are closed and all the doorsare locked before running for, the bus. In contrast, the husbaidwakes, up at the litest possible moment, shaves, washes, and sitsdown to his breakfast. After he eats, he picks up his briefcaseand drives to work in the city.
Every evening the process is reversed with the mother rushinghome to pick up the children, she washes and bathes them, cooksthe dinner and cleans up afterwards. Seldom does the husband offerto help his wife, and when asked to do so, the reply invariably is,"The house and children are women's:work," This husband is an extrememale chauvinist but to what extent do husbands share the houseworkof,washing, cleaning, ironing; shopping, cooking, and tending to theneeds'of the children? At best,. the burden remains heavier on thewomen.
1 45

TABLE 33
CHINESE POPULATION IN THE U.S., BY SEX AND SEX RATIO, TOTAL AND BYSTATES, 1970
States
at
U.S. Total
Alabama
Alaska
Arizona
Arkansas
Califoraa
Colorado
Connecticut
'Delaware
District of Columbia
o.h Florida
C'')
Georgia
Hawaii
Idaho
Indiana
Illinois
Iowa
KAnsAs
_
Kentucky
Louisiana
Maine
Maryland
Massachusetts
Michigan
Minnesota
Mississippi
Sex Ratio-Males:
Sex Ratio-Males:
Males
Females
100 Females
States
Males
Females
100 Females
228,565
206,497
110.8
347
279
144
84
2,025
1,853
374
3.69
E7,835
82496
.807
682
1,173
1,036
296
263
1,405
1,177
1,660
1,473
892
£92
26,097
25,942
279
219
1,174
941
7,767
6,707
560
43'3
703
530
307
251
752
588
113
93
3,363
13,157
7,5449
6,483
3,474
'2,933
1,355
1,067
766
675
124.4
Missouri
171.4
Montana
109.3
Nebraska
101.4
Nevada
106:-/It
New Hampshire
118.f
New Jersey
113.2
New Mexico
112.5
New York
119.4'
North Carolina
112.7
North Dakota
128.9
Ohio
100.6
Oklahoma
127.4
Oregon
124.8
Pennsylvania
115.8
Rhode Island
129.3
South Carolina
132.6
South Dakota
122.3
Tennessee
127.9
Texas
121.5
Utah
106.5
Vermont
116.1
Virginia
118.4
Washington
127.0
West Virginia
113.5
Wisconsin
Wyoming
'4/
Source:
U.S. Census Bureau, General Population Characteristics (1970).
41,559
1,256
124.1
168
121
138.8
355
216
155.1
535
420
127.4
215
205
104.9
4,902
4,331
113.2
346
217
159.4
43,919
37,459
117.2
711
544
,...
13Q.7
88
77
114.3
2,815
2,490
113.1'
544
451
121.5
2,584
2,230
115.9
3,789
3,264
116.1
582
511
113.9
287
234
122.6
86
77
111.7
879
731
120.2.
4,072
.3,563
114 3
745
536
139.0
92
81
113.6
1,474'
1,331
110.7
4,801,
4,400
109.1
192
181
106..1
1,484
1,216
122.0
160
132
121.2

oft
Womsnpowet.Plahning
In manpower planning for the masculine sector, one considers'such factors as education, occupation, industry, income, economicconditions, labor force size, etc. All of these factors applyequally to the feminine sector, bUt there are other dimensions aswell. The female was endowed by nature to bear caldren and nur-ture them. She cannot forsake this tole,'nor does she-want to.Hoc women today will still assign first priority to being wifeand mother. She is the central figure in any family. When wetalk about womanpower, we must look also at marital status, familycharacteristics, birth and fertility rates; and the husband's atti-tude or position. Women's employment decisions are predicatedprimarily upon,the family's welfare.
...11104
For eiample, I have given up a number of jobs when my employers .
relocated out of town, and I have refused positions outside.of NewYork.City. If I were aumn,.my first consideration would be whetherI wanted-to stay with the job. If so, my family would move with me.For many years, I worked three or four days*a week, what you,mightcall parttime, because of the demands of my family. Yei, in essence,working four days a week is tantamount to full time, except for thepay and the benefits. You simply complete in four days what ordi-narily would be stretched out over five. No employer.hires an extraperson to cover that one day's work, and the parttime employee setspaid by the hour or day without holidays and other fringe benefits.Yet a woman will opt for parttime if'it gives her _Quit little bitof extra time to devote to her family.
The type of profession or occupation that a woman accepts isweighed heavily, by family considerations. For many years, I choseto work as a librarian in the local public' library because it was,close toome, my-children could go and study there after school,.and I could run home quickly in any eventuality. Even if I didnot consider-these factors, employers would consider them for me.I remember one particular instance, a wonderful position that I'applied for.,/ The employment agency interviewer was especially
impressed with my background. The job was for a university insti-tute and called for someone who spoke a Far Eastern language. Theduties were to arrange the itinerary of Far Eastern scholars invitedto the university for lectures or symposiumk and to see that thesedistinguished visitors were received hospitably.
At the university, the personnel office interviewed me andsent me an to the director of the institute.' The director wasfavorably impressed by my background'and qualifications.and wasabout to offer me the job when he asked, "By the way, are yOumarried?" An affirmative answer was followed by the next question,

"Do you -have children?" The .thirst question was, Pilaw many?" My
answer to that question cut me out irrevocably. I received i veryfatherly admonition-"to stay hake and take are of my children,who needed me."
This is not an'isolated incident, neither in my own case norin that of my fellow sister workers everywhere. We are bound bynature, by tradition, by,our families, by employers, and-by society"-is general when we seek employment oufside.of the home:: We are notfree agents. Women have only-begun to figure in the U.S. laborforce since World Weill. ,In 1940, only, z/..4 percent 'of the totalU.S. female population was employed outside the home. By 1950,the percentage had increased to 31; by 1960, to 37; and by 1970,to 43.1 ,Among Chinese females 14,years and over, those in thelabor,force in 1960 were 44 percent and, in 1970, when the agebracket was ,upped to 16, years and over, the percentage was 50.,
Female Labor, Force
In other vords, the proportion-of Chinese females gainfullyemployed is higher than the national average, and this does nottake into account unpaid'family workers in the family-type res-,taurants, groceries, and laundries who do not classify,themselvesas "employed." Suffice it,to say that the Chinese female hasalways been an important member of the rice-winning eam'in thefamily.
Anyway, the figures for te\Ohinese cannot be used, as a basisfor comparison with the natio4i1 average. The presence of Chinesewomen on the American scene is a recent phenomenon. Around the
turn of the century, there were about fifteen males to every Chinesefemale. The ratio mproved by 1940 to 3:12. Today the sex ratiois 111 males to every 100 females, a substattial improvement, butstill out of proportion.
In the 1970 census we hate, for the first time, meaningful
employment figures for Chinese females. (See Table 34.) Closeto one-half ofthbse 16 years and over are in the labor'force,-(eitheryorking or looking for 4ork). The unemployment rare isvery low--only 3:7 percent. ',Obtaining employment doed not seem
-----1. Census.Bureav, Statistical-Abstract
2. Betty Lee Sung, The Story of-the ChineseCollier Books, 1971), pp. 117, 320.
(1971), Table 331.
in America (New York:,,
.

t
t.
to be a:diffiCulty with Chinehe feialeehe gar& is morewhat type of job and at what pay.- Recent immigrants,-fresh offthe plane, can valk into one of the -small'gatment factories scat-tered throughout Chinatown, or its petiphetal area'and-startlwark-
'ing the next day.. They work by) the piece; and their ,hours arefairly flexible. Piece work at low rates is allays avdilable.
TABLE 34
. EMPLOYMENT STATUS OF THE CHINESE 16 YEARS AND QM IN THE U. .
AND FIVE SiLECTED STATES, BYSEX, 1970
Percent Male,
PerCent FemaleIn LaborForce*
Em-played
'Unep...
playedIn LaborForce*
Ew-played/
Ahump...
played
-.United States 73.2 97.0 - 3.0 49.5" 46.3 3.7
California 73.5 96.0 4.0 , 51.0 55.3 4.7
New York 71.1 57.7 2.3 . 49.2 97.1 2.9Hawaii 76.1 97.9 2.1 54.2 98.-2 .8,IllinoiS .= 73.4 97,.3 2.7 50.2 's 97c5"Massachusetts 72.3 97.4 2.6 53:2 , .96.0 4.0"
Source: U.S. Census Bureau, PC(2)1G '(1970) Table 19:
NOTE: Based on a 20 percent sampling.
*Employed or looking for work--not in labor force' refers to students,retired persons, housewives or inmates of institutions:
."A comparison -of labor force status with whites, black's, and'Japanese shows that a largerjercentege of Otiental women (50-per-"cent) work outside the home than-do black (48'Tercent) ot:whitewomen:(41 percent). Black and white-women also have higher unem-
,--ploytent taths, 7.7 and 4.8 percent respectively.compared to, 3,7,.
:fat Chingse; and 3.0 peicent, for Japanese women.*-4
One,,naturally,aesumes that fewer married women living 'with- -,
their, Husbands work. That is not so. Thete's a.slight 'edgeAmpiii40 women, in general, that their husbands will snptet them",_',but,t1le odds are narrowing. In 1940, 15 percent of ,married' women
their husbands held outside jobs. 'In 1970', the rate
-,44i1,41-perceitt. 'k
°U.S,Oendiis....Bureaa,,.Siatistical Abstract (1971), Vitae
*1 ` -
, ". 0-
,
149.

J
For-,Chinese women living with their husbands,. almost half ofthese women work (See Table 35), and the percentage increases astheir length of_stay in,the United States grows. In a state likeHawaii, where the Chinese population is more acculturated, signif-icantly more women'work when they are married, live with theirhusbands, and have children under six years of age. What is hap-pening in Hawaii could be indicative of what will eventually hap-pen to Chinese females in New York.
Working Mothers
One-third of Chinebe mothers who are liting with their husbandsand have children Under six hold jobs,outsideaf the home. ,Youngchildren, therefore, ,have not .kept these mothers from employment. The
percentage of black mothers in'the same category is much higher03.7), and of white mothers it is much lower (25.0). Keep in mindthat the figures are for'woMet who are Wing with their husbands,and so, preaumably,,have some other means of support.
When the youngept child marches,off to school, the mothers-march off to, Work.,,The overall figures for mothers in the UnitedStates shows a fantastic:leap in the labor'force at thisijuncturdin their lives: ,The, ercentage goes from 30 percent of those with
. children under .6 to 49 percent of those with children from 6 to17 years old. "This ;last percentage exceeds'even those women mar-ried and living with husbands, who have no children.4 One couldinterpret these figures' to mean that mothers may have to'worktosupport the family adequately.
This then raises questions aboutmarriage and children Sind theincreasing tendency.of women to enter the labor force.. Is there-:-.
should there be - -some recognition of sex differences in occupation,industry,' hours worked, income, etc.? How can wamWdeel with their.desire far marriage and a family, and a career as Mtn haVe'always had all three; but with a helpmeet to take are of the domes-..tic side. 1A career' woman hasto juggle all three4--411 the.whilebuilding up a huge guilt complex that she is neglecting her'huPbandand children. Men have no such hangups. '
The wisdom of,"Me..-..tooism" or chasing after'male-ePtablished
standards and goals is questiOnablei 'Women are not.-men and to'.try-to.go-after everything that men do is siIly.at times. .For,
example, the first woman who passed the New Yark City exatinaeion
44. U.S. Census Bureau, Statistical Abstract (1971)0 Table 332.
150-139-
IN
I

Cal
.
TABLE 35
EMPLOYMENT STATUS OF CHINESE FEMALES WITH HUSBANDS' PRESENT AND CHILDREN UNDER 6,
FOR THE U.S. AND FIVE SELECTED STATES, 1970
Females 16 Years and Over
No. in Labor Force
Percent in Labor Force
No. Employed
Percent Employed
Wives Emplid--husb. present
Percent all Wives - -husb. pr.
U.S.
Calif.
'N.V.
Hawaii
Illinois
Mass.
' 145,012
58,782
27,014
18,349
4,556
4,427
71,786
9,935
2,285
2,350
49.5
54.1
50.2
53.1
69,129
96.2
40051
46.9
With Children Under 6
% h/w Fam. w. Child. Under 6
3
29,983
13,295
51.0
49.2
28,575
12,910
9,761
2,228
' 2,255
95.3
97.1
98.1
97.5
96.0
15,967
7,854
5,815
1,269
1,345
47.6
47.5
53.6
45.6
'512,..2
10
3,654
1,490
.6
35.2
27.8
1,349
297
324
Source:
U.S. Census Bureau, Subject Report, PC(2)1G (1970), Tables 18,,19, 23.
-14
i9
29.1
32.4

.
for a maintenance job had to lift and carry a;
120-poundeack for'
a certain distance. This is not:equality. There are, biological
differences that must be recognized, and the maternal role is to
be taken into account. t
Women must Strive for marriage, family, and career on a more
equitable basis. Since her child- bearing role cannot be shared,
she can be compensated by part-time work, by day-care center's, bymore flexible hours, and, more importarm,..by changed male attitudes
toward domestic responsibilities., The unfortunate part of it is
that women belie either shouldered the extra burden or compromised
their roles as wives and mothers.
Late Marriages
Marrying later is one answer that Chinese females have come
up with. In Table 36 we see that 68.6 percent are still single in
the age bracket of 20 to 24 years.** comparison, only 36 percentof the American females have not yet tied the knot. An astonish-
ingly large 'proportion of Chinese women maintain their single sta-
tus until they reach 30 to 34 years of age. Then the percentage
of those married shoots up to the 90s. Eventually as'many as 96nemrdeno_get_married.,_which_means. that Chinese do not eschew
marriage; they just postpone it.
Size `of Families
In?the olden days in China, large families werea source of
pride and a symbol of status. The Chinese met their social, eco-nomic, and religious needs through ,the family. In an agricultural
'economy, many. hands were needed to till the land. Social security
was provided through the communal and 'collective efforts of a broad-
based family. The larger the family, the more members it had to
cope with the contingencies of .life.
Even man's longing for immortality, and his yearn-ing for knowledge of the infinite was woven into theframework of the family institution through practiceof ancestor worship.- The living were thus linked with
the dead into infinity. The worst sin that a man could
commit was to die without progehy'and sever the familyline. This led to the intense 'desire of the Chinesepeople for sons and more sons, not only to insure thefamily continuity,' but to give a wider base to the
152-141-r
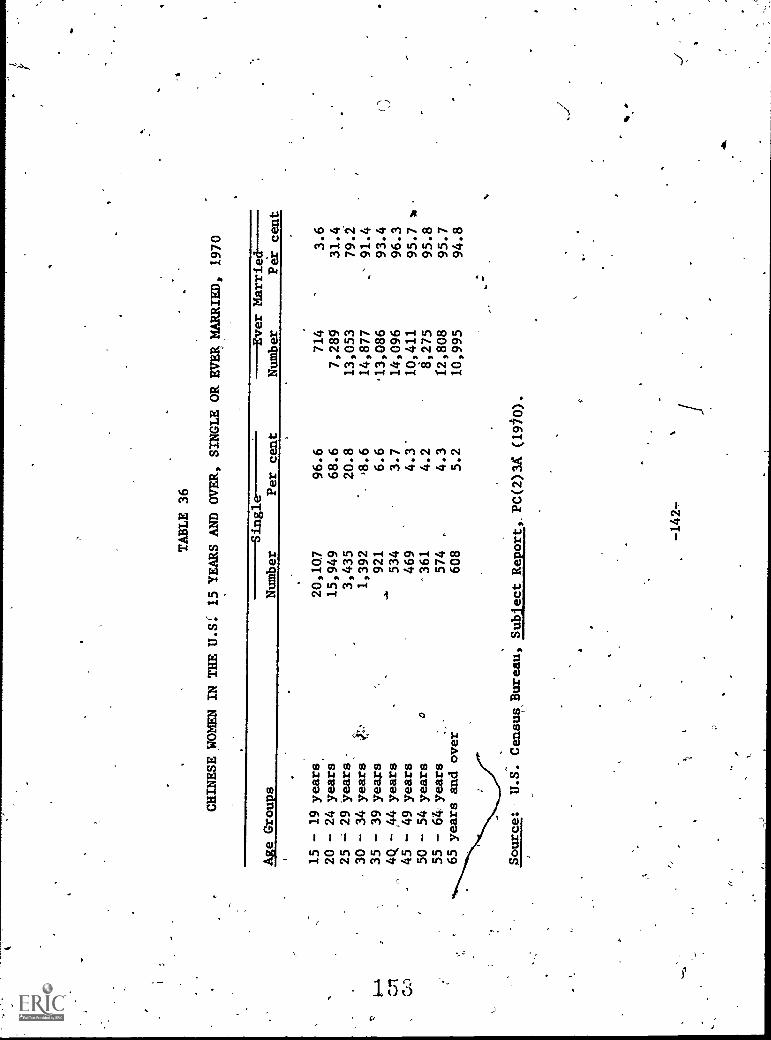
TABLE 36
CHINESE WOMEN IN THE U.S: 15 YEARS AND OVER, SINGLE OR EVERMARRIED, 1970
Age Groups
----Ever Married--
Number
Per cent
Number
Per cent
15 - 19 years
20,10.7
96.6
714
3.6
20 - 24 years
15,949
68.6
7,289
31.4
25
29 Years,
3,435
20.8
13,053
79.2
30 - 34 years
1,392
,8.6
14,877
.- 91.4
1,
35 - 39 years
..1
921
6.6
'13,086
93.4
0 )crt
4Q - A4 years
534
3.7
14,096
96.3
Co
45 - 49 years
469
4.3'
10,411
95.7 *
50 - 54 years
0361
4.2
8,275
95.8
55 - 64) years
574
.4.3
12,808
95.7
65 years and over
608
5.2
10,995
94.8
Source:
U.S. Census Bureau, Subject Report, PC(2)3K (19/0).
-142-

' 0
TABLE 37
,CHINESE FAMILIES lain OWN CHILDREN UNDER 18 BY NUMBER OF CHILDREN,
FOR THE U.S. AND FIVE SELECTED STATES, 1970
Own Children
U.S.
,Calif.
N.Y.
Hawaii
Illinois
Mass.
Under 18
No.
%\
No.
- '%
No..
%No.
%No.
%No.
%-
A
All Families
94,931
99.9
37;437
100.0
18,56
100.0
12,304
99.9
2,920
99.9
2,920
99.9
40
None
35,069
36.9
13 941
'
37.2
7,034
37.9-
4,961'
40.3
979
33.5
.943
32.3
118,899
19.9
7,1 1
19.2 "
3,698
19.9
2,263..
18.4
'
602
20.6
699
23.9
219,454
20,5
7,736
20.7
. 3,844
20.7
2,169
17.6
699
23.9
542
18.6
312,377
13.0
5,020
13.4
2,405
13.0
1,503
12.2
375
12.8
375
12.8
45,825
6.1
2,225
5.9
1,095
5.9
854
6.9
,183
6.3
213'
7.3
52,422
2.6
965
2.6
399
2.2
38/
3.1
-45
1.5
132
4.5
6 or More
885
0.9
359
71
0.4'
167
1.4
37
1.3
416
0.5
L0
)....
'.
'
Source:
U.S. Census *ream, Subject Repo;t,6(2)1G (1970), Table 23.
Cft
TABLE 311
,FERTILITY OF CHINESE WOMEN
44,
THE CHILDBEARING AGES,' 1970
Children Ever Born to
Women Ever Married
,U.S:
15 -24 Years-0ld-
Children per 1,000 WOmen Ever Married
8,099
786
25-34 YearsT'Old
27, 92
Children per 1,000 Women Ever Married
,778
,
35-44 Years Old
,.26,711
Children per 1,000 Women Ever Married
3,005-
k1
lif.
Hawaii.
71,612
895
7 922
806
9,953-
5,146'
,f,499
1,815
1,833 '
2,351
11,499
5, 06
3,165
2,966
2,9.5
3k206
Source:
U.S. Census Bureau, Subtect RepOrt, PC(2)1G (1970), Table 18
-143-
Ill%
Mass.
.294
731
1,102
1;652
856
3,114
280
.946
'963
1,746
671,
3,250
,..
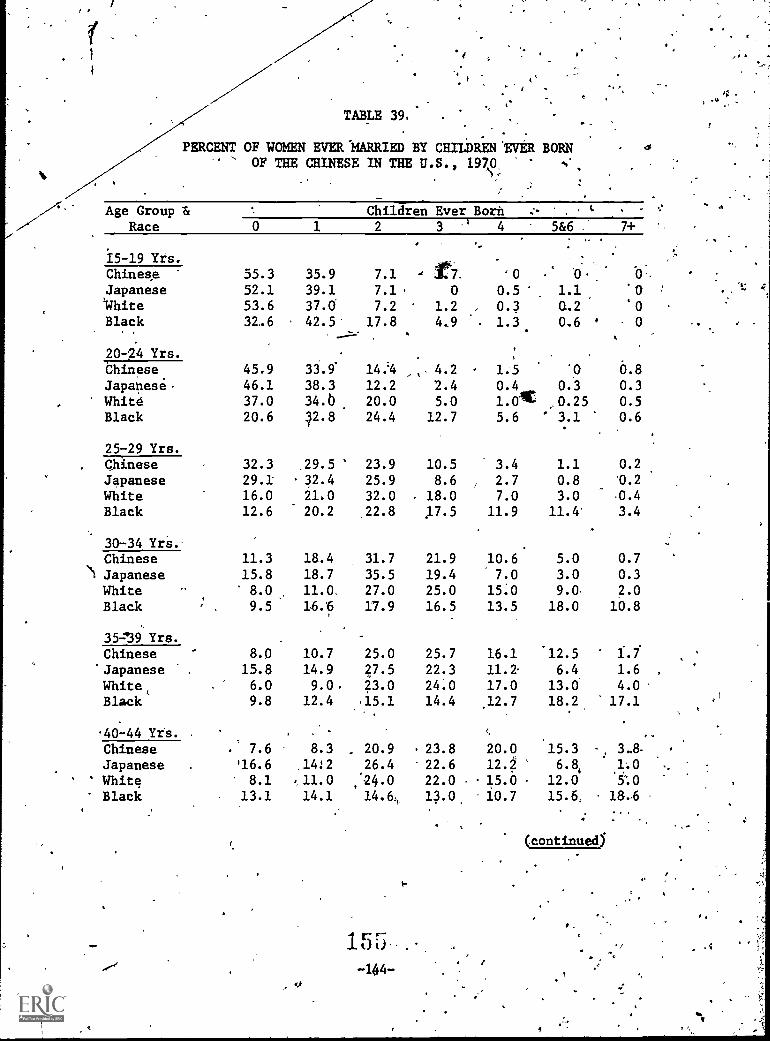
.TABLE 39..
PERCENT OF WOMEN EVER MARRIED BY CHILDREN EVER BORNOF THE CHINESE IN THE U.S., 1970,
Age Group le
RaceChildren Ever Born
0 1 2 3 4 5 &6 . 7+
.15-19 Yrs.
55.3 35.9 7.1 J .7. -0 .' O. 0ChineseJapanese 52.1 39.1 7.1. 0 0.5 1.1 .0'White 53.6 37.0 7.2 1.2 , 0.3 Q.2 .0Black 32.6 42.5 17.8 4.9 1.3 0.6 ' 0
20-2.4 Yrs.
Chinese, 45.9 33.T 14:4 4.2 - 1.5 '0 0.8Japanese- 46.1 38.3 12.2 2.4 0.4 0.3 0.3White 37.0 34.b 20.0 5.0 1.0 0.25 0.5
Black 20.6 12.8 24.4 12.7 5.6 3.1 0.6
25-29 Yrs.Chinese 32.3 .29.5 23.9 10.5 3.4 1.1 0.2
Japanese 29.1 s 32.4 25.9 8.6 , 2.7 0.8 '0.2
White 16.0 21.0 32.0 18.0 7.0 3.0 0.4
Black 12.6 20.2 .22.8 17.5 11.9 11.4 3.4
30-34 Yrs. .
Chinese 11.3 18.4 31.7 21.9 10.6 5.0 0.7
NI Japanese 15.8 18.7 35.5 19.4 7.0 3.0 0.3
White 8.0 11.0 27.0 25.0 15.0 9.0 2.0
Black 9.5 16. 17.9 16.5 13.5 18.0 10.8
35zn9 Yrs.
Chinese 8.0 10.7 25.0 25.7 16.1 '12.5
'Japanese 15.8 14.9 27.5 22.3 11.2 6.4 1.6
White, 6.0 9.0. 23.0 24.0 17.0 13.0 4.0
Black 9.8 12.4 '15.1 14.4 12.7 18.2 17.1
40-44 Yrs.Chinese .' 7.6 8.3 . 20.9 23.8 20.0 15.3 -, 3.8.
Japanese '16.6 14:2 26.4 22.6 12.2 6.8, 1.0 ..
White 8.1 11.0 24.0 22.0 15.0 12.0 5:0Black 13.1 14.1 14.6,, 13.0 10.7 15.6, 18..6
,*
155 .
-144-I
(continued)
,

.j.
4
3
et.
I.
TABLE 39-- continued
1-
.* Woman Ever Children Ever Born
Married 0 1 2 3 , 4 5&6 7+
. O45-49 Yrs. ., .
Chinese . ,.10.5 11.3- 20.6,, 19..65 18.2 16.2 3.5
Japanese 13.2 12:5 26.8' 23.7. 13.6 8.6 '1.3Whitt ; . 9.8 13.0 26.0. 21.0 12.0 10.0 4.0
Black' 18'.0 16.1 14.9 12.1 9.3 13.0 16.3. ,
50-54 Yrs.
Chinese 9.2 14.8 21.3 18.2 411 17.1 13.7 5.4
Japanese 11.0 14.0 25.0 22.7. 15.0 9.6 2.3
White 12.9 16.0 27.0 19.0 10.0 8.0 4.0
Black 44 73.1 18.2 14.7 10.7 8.0 11.0 14.14,
V ....55-64 Yrs:Chinese 9.7 16.2 22.5 17.2 14.3 14.0 5.8Japanese 12.3 12.9 21.0 18.3 13.6 14.4 7.2
White 17.9 19.0 25.0 15.0 8.0 7.0 4.0
Black 27.1 19.2 14.0 10.0 7.2 9.3 13.0
65 Yrs.+Chinese 8.0 14,0 18.6 16.8' 11.3 16.9 14.0
Japanese 9.2 9.9 14.3 13.8 13.3 21.1 18.1
White 17.6 17.0 21.0 15.0 9.0 lb.0 8.0
Black "25.6 ' 17,4 13.5 9.9 7.8 10.1 15.3
'Source: U.S, Census Bureau, Subject Report, PC(2)3A (1970)..
4
.
't156.
-145-
4-

rft
,S tir
It
' .
- collective system.5, ;*
. was rot uncommon to come across Chinese' men and. women who,'had Sixteen or even twenty four brothers, and sisters: -The.siblingsdid not always hive the same mother because pancubinage was anaccepted practice in" China, but seven oreight offSpiingof-one,mother Were not uhusualat all.' Smaller families were the exCep-
.. tiOni,and the barren woman wmt mucb.pitied::-A iOmar was naught inChina until she had given -her husband a son, and, once a son Maas f
produced, her position in'the,family.was'fixed.4-She could never _
be cast out.,
One would expeet:iOnie vestige of this cultural heritage anddesire for large families -to Carry over into the' Chinese- Americafakily. 'No one was-more auprisid than I when I looked at the num-lex of children urdei, 18 in Chinese faMilies. The tabulationsare shown in Table 37. More than a third of the 95,000 families. hadiro ohildrei; one' or tvb,offapring.was the norm; and a sharp
,
drop registered after the third child.. _
'- ..:#4
,,
. ,..,..
'Table-38 shows jte.fertility rate-of Chinese women of child- .
bearing age. The figures confirm that:ChinesevOmen are averaging.between two and three children. It is puzzling,,in view, of thefact that Westernizatioft is usually accompanied by a lower fertility 'mate that the fertility rate of Chinese womenih 'Hawaii is higher -
than that, of the mainland states, especially in the. ore,,productive-.6 25- to 34 -yeat age bracket. 'Hawaii has a more balanced-Chinese ''"
population and is 'farther aheadin assimilation.- '6. ...,
,!. 1. . .
J .
Postponing Children . c
1 0
A comparison (see Table 39)'with' whites, blacks; and,iapanese.women shows that Chinese women are having far fewer children than
le. their sisters ofother races. The Chinese.are,not anly-postponingmarriage', they are postponing children. 4t -age 20 to 24,.45.9
veicent of married Chinesewomen have no.childrer at:all. At age25:to 29, almost one-third are still childless,',whereas the.samepercentage Of white females already have two Children. py.thetima'a.womanrreaches:30 years of- age; her'Oildbeatinrspan hasalready been-halved, and the prospects that she will give birthto more than two or, three,childrei-is ,quita remote. 'It seems thatthe Chinese and.Japanese faiiIies.are the most-limited"of all.
r
5. Sung, Story of the Chinese in America, p. 153:
.
1 7.
. -146-
3 0
.

,
Do foreign-born Chinese women tend to have more children,than
":1bei native-born? it does not look that way on Table 46. The per-cedtages for native-born and foreign-born are almost parallel.Nativity is not the decisive factor; time and the circumstancesare greater determinants.
The younger generation Chinese female is limiting her family
severely. Only the older women have larger` families. For example,
of those in the 45 to 49 age bracket, about 16 percent have fiVeor six children. Fourteen percent of those 65 years or over haveseven or more children,. The difference is a span of only Shout
fifteen to thirty-five years. Within this short period of histori-cal time; we are witnessing a social change Of-far-reaching conse-quence. One of the pillars of Chinese culture has been toppled.
Why Fewer Children
The answer to why Chinese females are marrying later and lim-iting their families may be indicated is the prolonged years ofschooling. They wait-for grgauation before getting married orhaving children. Table 41 shows fertility of Chinese women bylevel of education, and reveals an inverse correlatiod betweeneducation and the number of children born. In:other words, the
Tess schooling, the more children. No college graduate or post-,
graduate has -sever or eight children. One-fourth of the femalesat this educational level have no children at all, and three outof four have-no more than two children. The decision may lie. with
the Chinese males who think along thrsame lines. If the maledecides that he cannot get married or have children until he gradu-atet4 his marital partner may have to go along. As we saw in
Chapter IV, he, too,,is prolonging his education well beyond thenormal range. In the cycle'of events, the ultimate culprit maybe the immigration restrictions placed upon work for students.How can a student think about establishing a family if he has no:way to support that family? --Irr-the final analysis, the Chinesepopulation in the United States may again be structured by legal,
rather than cultural, controls.
The total Chtnee female labor force in 1970 was about 72,000
persons; Of this number, about 30,000 are in California, 13,000in New York, and 10,000 in Hawaii. In, other'Words, they are highly
concentrated. Again, the reader is cautioned that these figuresare now different. The heavy immigrationof recent Years must'betaken into account, especially since New York is getting the majorshare of the new immigrants.
Occupations of the Chinese females are extremely limited.
158-147-
4

4
TABLE 40
CHILDREN EVER BORN TOEVER MARRIED; 15 YEARS AND OVER .BV NATiyal, 1970
ix
O . -
Children EverBorn
, ,
"Women 'Ever Married ,
Native-BornNoz...a. %
Foreign-No. %
, -
Q 7,600 18.6 11;800 16.41, , 5,700/ 14.0 12,600 17.52 9,800 24.0 16000 23413 7.300' 17.9 11,400 15.94 4,800 11.8 9,400 13.15 2,100 5.1 5,200 7.2
6 1,500 3.7 2,600 3.67 1,200 2.9 i,400 1.98 er'More -800 2.0 900W 1.3
Soutce: U.S. Cenitus Bureau, Public Use Sample Data,Special Tabulation (1970).
NOTE: Based on a 1 percent' sampling.
5
159.
-148-

_Number of
Children
Ever Born-
0 1 2 3 A 5 6
.7 8A-
Vertical
Total 1002
TABLE 41
`ERTILITY OF CHINESE WOMEN EVER MARRIED, 15 YEARS AND OVER,
BY LEVEL OF EDUCATION AND PERCENT, 1970
No Schooling
Percent
Number
Vert.
Horiz,
1,200
7.9
6.2
1,600
10.6
8.7
3,500' 23.2
13.3
3,200
21.2
17.1
1,900
12.6
13.4
1,200
7.9
16.4
1,000
6.6
24.4
,900
6.0
34.6
600
4.0
35.3
15,100
Elementary (1-8)
Percent
Number
Vert.
Horiz.
2,500
10.0
12.9
3,300
13.2
18.0
4,700
18.8
17.9
3,900
15.6
20.9
4,700
18.8
33.1
3,200
12.8
43.8
1,000
4.0
24.4
1,100
4.4
42.3
600
2.4
35:3
25,000
High School (9-12)
Percent
Number
Vert.
Horiz.
7,800
19.2
6,500
16.0
11,300
25.4
6,600
16.3
5,200 '12.8
1,800
4.4
1,300
3.2
600
1.5
500
1.2
40,600
40.2
35.5
39.2
35.3,
36.6
24.7
31.7
23.1
29.4
Source:
U.S. Census Bureau, Special Tabulation, Public Use Sample Data (1970).
NOTE
Based on a 1 percent sampling.
kr
3
-149-
Collge & Post-Grad.
Percent
Number
Vert.
Horiz.
7,90Q
6,900
7,800
5,000
2,400
1,100
800 0 0
31,900
24.8
40.7.
21.6
37.7
24.5
29.7
15.7
26.7
7.5
16.9
3.4
15.1
2.5
19.5
0.0
0.0
0.0
0.0.
;
Horizontal
Total 1002
19,400
18,300
26,300
18,700
14,200
7,300
4,100
2,600
1,700
,2,,_
112,
600
0

0
P9
-Over 30,000 of the 72,000 are in the following seven occupations,in order-of importance:: (They nay be-rowesenfed in other fieldsbut not in large numbers.)
TABLE 42A
SEVEN RANKING OCCUPATIONS CF CHINESE WOMEN
Specific Occupation `'No.,
Seamstresses , 10,023-'"Food Service Workers '5,567Teachers to 12th Grade .3,332Typists 2,954Secretaries 2,924Sales Clerks 2,812Cashiers 2,485
TOTAL 30,097
Source: -U.S. Census Bureau, Subject Report,PC(2)7A (1970).
By broad occupational group, the breakdown may be regroupedas'folIows:
TABLE 42B
NUMBER' OrWORKERS IN FOUR MAJOR OCCUPATIONAL
GROUPS OF CHINESE WOMEN, 1970
Occupational Group,i
Clerical, .20,736'Operatives 15,025'
Service WorkersSales Workers 3,180
TOTAL' 47,683
Source: U.S. Census Bureau, Suklect Report:PC(2)7A (1970).
Thd pattern seems to be that foreign-born or poorly educatedwomen go into the garment factories andlood service work, whereasthe native-born and educated go into clerical. and sales work. In
161-150-

CP
)
TABLE. 4.3
SIZE OF:CHINESETANTLIES IN THEU.S., TOTAL-AND-FIVE SELECTED STATES; 1470
Number of Families
Size of Families
U.S.
No.
94,
4
2persons
3 persons
073
4 persons
19,802
5 petsons
15,445
6 persons
9,802
7-perons
6,083
8 persons
1,485
9 persons
591
14 or more peisons
461,
Total Persons in Families
380,39
Average per Family
4.91'
Calif.
N.Y.
Hawaii
'
Illinois
Hass.
%No.
XNo.
%No.
X.
NoR.
%No.
%
1004
37,437
100.0
.18,546
100.0
12,304,100.0
2,920 '100,0
2,920'
100.0
24..6j
9,074 ,
24.2
4667
25.2
'2,739
22,3
'- 682
23:4
658
22.5
18.8
6,888
18.4
3480
18:8
.2,367
19.2
501
17.1
521
17.8'
20.9
7,758
20.7
3)776
20.4
2,545
,21..7,
669
22.9
608
'
20.8
16.3
6,394 -
17.1
3,034
16.3
2,047
16;61%
444,
15.2,
420
14.4,
.""
10.3
1,871
10.1
1,962
10.6
1,341
11:01
133
11.4
424
14.5
,
6.4
,2,371
6.3
'
1,348
.'7.3
801
6.5
213
7.3
242.
.8.3
1.6'
I
692
1.8
188
1.0
249
2,01
31'.
Ira
25
0.9
.0:6
0.5
209
i
180-
0.6
0.5
6229
0.3.
0.2
13974
1.:k
0.6
19
28
'
0.7
'
1.0
.19- 3
'
0.6
Oil "
150,9381.,
73;651'
50,689
3,97
4.12 /
Source:
U.S. Census Bureau, Subject Report,PC(2)1C(1970),, Table 23.
NOTE: *Baned,on a 20
percent sampling.
gt
xv005.0

In C
ome
Bra
cket
$15,
000
or'
Mor
e
$10,
000
to$1
5,00
0
$5,0
00to
$10,
000
Les
sth
ai$5
,000
CH
AR
D
CO
MPA
RIS
ON
AM
ON
G P
ER
SON
AL
IN
CO
ME
S O
F W
NW
-MA
LE
S, C
HIN
ESE
FEM
AL
ES,
AN
D P
AH
ILY
,IN
CO
ME
, 196
9;.,
r
9.4%
,1.
1%28
.4%
14.6
%3.
6%=
25.1
% 27.5
%21
.7%
28,9
%
..%
4FA
mla
ggila
ggite
°"4
,.
. ,:-
..:
,-
--
Med
ian:
.'
Mea
n.
Mal
e.
..$51
223
,',,,:
*$60
7-7
:.
...
.v .
;...r
,Fe
mai
e$2
,6}1
6-'.4
i.,.5
12.
.
-tra
$10,
610
.
4IwontaiNNIV
iiggi /3,0;!.'
:.s.,.e; ....1...
wk.,*
:,...:
1020
.30
-40
6070
Perc
ent
Sour
ce:
U. S
. Cen
sus
Bur
eau,
Sub
ject
Rep
ort,
PG(2
)IG
, (.1
970,
'
r

7
., ,
.the professions and technical occupation group, Chinese females
gravitate toward,tiadhing and health service work:. The narrow
range of jobs-for Chinese femalessis_vvry aPparent.
, .
Income
Thii.topic has been dealt with and will be dealt with through-dut this study, but it cannot be overemphasized that females earnabout half the pay of the males; Chart A shows that almost threeout Of four females have a personal income.of less than $5,000 peryear and that their median income was $2,686, compared to $5,223
.for Chinese males, which is already 'low. A closer scrutiny of
work:and'pay follows in Chapter IX.t
*Of
A

SUMMARY OF FINDINGS
1. Women of all races are entering the labor forte at anincreasing rate. A larger proportion of Chinese females are employedthan either black or white females.
02. The unemployment rate for Chinese females, at 3.7 percent,
is comparatively low. The type of work they perform - -piece work atlow rates--is always available.
3. Matrimony does not take a woman out of the labor market.Half of the Chinese wives living with their husbands are employed.
4. One-third of Chinese mothers with children under six areemployed.
5. Chinese females are postponing marriage until theirlatetwenties or early thirties.
6. Oen though large'families are a deeply rooted cultural tra7dition of the Chinese, the size of families among the Chinese in theUnited States has shrunk to an average of four persons.
7. Births have fallen ofg to a crude birth rate'of less than1.5. (Replacement rate is 2.1.) Chinese females are having theirfirst child at'a much older age, and they are having fewer childrenthan any other¶racial group identified by the census.
8. The low birth rate prevails among both foreign-born andnative-born Chinese females.
. The older Chinese females had more children,' The younger.onessre having fewer.
/
-10. The better-educated female has a much lower fertility rate.
11. Chinese female employees are highly concentrated in alimitedumber of. occupations. The better-educated ones are inthe professional and clerical' rfields--predominantly the latter.'The recent immigrants and less edvated ones are in garment fac-tories and ,food service.
12. 'About three out of 'four Chinese females earned less than.85,000 in 1969.
;

RECOMMENDATIONS ,
.
Viva la difference! Equality of thetseies.in employment must
take into account the inherent role of child-bearing responsibilities'of the-female. If this factor is ignoredk any gains wrested fromthe male sector outside the home will merely add on to a woman'stotal working hours and duties. fier gains would be offset by a
heavier load. Society, too, must question whether the gender whichcarries generations to zome should be so physically spent and de-prived of time that she cannot devote herself to hprbiologicalrole.
What are the effects on children deprived of maternal care at,various stages in their upbringing? SOciologists have debated theissue eitensively,hut their approach is generally to see if thereis any cause-and-effect relationship between working mothers and
.problem children. Some argue that it is the quality of time spentwith the children; others argue that children need a full-timemother. No one has come up with solutions to accommodate working.mothers sa that they can better handle both job and home.
_
Paid vacations'and medical insuranceI,
are now standard,benefits
of most jobs. Employers recognize the necessity, for employees tohave rest and recreation if they are to perform well. These extras
do not detract; they add to productivity.
My recommendations"would be that employers recognize thatfemale employees are split between job band home duties: I doubt
if anyone would suggest that women go back into the home and kitchen.That females will become an increasingly important part of.thelaborforce is an irreversible trend. Nor do I believe that male workerswould like an all-male working world at all. I am sure they enjoy
the presence of the other sex. It now behooves labor planners andnegotiators to consider the special situation of female workers.
In a trip to the People's Republic of China in 1973, I visiteda textile factory near Peking. The mill hid a child-care center onthe premises where the mothers left their children when they worked.'Time off to feed their babies Was given the nursing mothers. At
meal timesor breaks, themothers could go over and see their Chil-dren. A communal kitchen served meals at reasonable prices whenthe mothers did not wish to cook at home. Most worker's went homefor an'evening meal prepared in their own quarters, but the communalkitchen was a convenience in case the mother was too tired that day.The fact that home meals are still prepared by the women in Chinadid not escape my eyes.
The fact that in the United States, over 10,000 Chinese women
166
r '

I.
o
in a labor force of 72,000 are in one occupation alone--garmentworkers,-Lis disquieting. The apparel industry. is facing stiffcompetition from importsironically, fromthe Far East wherethey are made by even cheaper4sian labdr. _The garment workeris in a highly vulnerable position. Effort Must be made to di-versify the %xtremely limited field of occupations of the lees-educated, novi-English-speaking, recent female immigrants. Theycan and should be taught other skills and introduced to otherlines'of work. 'Some planning should be undertaken to ease intodiversification before the problem comes to a head. This planningrequires research into.the situatipn, an-understanding of the cultural background, and aknOwledge of the .imMigrantst pioblems.This research or study should be initiated as soon as possible.
The scope of the study-would be.simplaied by the fact thatthe Chinese garment workers are highly concentrated in New YorkCity and San Francisco. Studies undertakervin either of thesetwo cities would apply to other places as well. New York shouldbe the site to study since it,is the'clothing capital of the nation.More information is,needed about the industry, its importance inthe economy of the city, the educational level and qualificationsof the garment workers, their family status and doMestic responsi-bilities, their knowledge of English, and their willingness toventure beyond a certain,radius.of Chinatown.
The-concentration of highly' educated Chinese femfles in cleri-cal jobs is anothertarget that calls for dispersion. As we sawin Chapter IV, about one-third of the Chinese females 16 years andover have been to college o are college graduates. These ladies.
01achieve white-collar statu , but litple else.. 20,736--again, out
,,of a work force of 72,00 -are in the clerical positions of book-keepers,'secretarles, typists, file clerks, etc. They are quali-fied for better jobs, but are victims of sexism, more than racism.It appears that the Chinede female worker is an all-around loser.
"*g
-156-

CHAPTER VII
CftINESE IN GOVERNMENT WORK
A mandarin was a public official during the dime when emperorsor empresses sat on the imperial throne in Peking, He held one ofnine ranks entitled to wear a button in his cap aid a symbol of
_office. To attain officialdom was the highest asO.rationof everyvxmn in imperial China. No other position held as' much status,1;prestige, power, or opportunity for wealth.
Outside of royalty and nobility, an official-Position wasattained through civil service examinations. Forthirteen centu-riesl, China selected the men to run,her goverament on the -basis
of scholarship and merit. Every effort,whs made/ to render the.
tests as fair and impartial -as possible. Many histovians main-, tain that the continuity of China's political identity stems from,
the social mobility that the examination. - system; engendered: In
other words, the lowly could aspire office through dili-'gent study. The system provided an upward chancel for ambitiousmen without political upheaval.
Apex of the Occupational Scale
To illustrate what official status meant to China, professorFlag Ti Ho tells a story from Chinese. literature about an abusedand indigent scholar, Fan, Who finally passed his provincialexamination and attained the rank of Chu-Jen.
. . . This second degree; which entitledFan to. aneventual off ice, was charismatic in more than one
'way; 'it completely transformed his economic and Im-
o. cial status overnight. A local retired country magi-
iv strate . . . immediately called and offered Fan alarge house and some ready cash., Soon the smaller
men of the locality offered Fan either a part oftheir land, shares of their stores or themselves as
"0

V
.
..
. .
domestic servants--all.in hopes of gaining hip favar>and,pretectien.l.
,
$ Officials had wide discretionary latitude .in governing their-domains., It-was most important td curry their favor., Froftsper *
Ho'concludip that "money in Ming-Ch'ing, China xasnot'Ian ultimate source-of power. It had to be translated into offlhilstatus to make its power fully -
Poi centuries, therefore, the Chinese regarded government'service as the apex of the occupational pcile4. High social; statusattached to government service, and,this cultural value was trans..-ferred from the old'country to the riew., This explains the highpercentage (19, or'almost one out of every five Chinese employed:in'the United States) who work far eithex.-the federsX2 state prJocal*goveraments. And it is all the more remarkable when oneeRinsiders thit the Chinesepopulationpenelists predoicinintly offoreign-born aliens who are excluded from governmentaervice-by .
the citizenship requirement.
,
. TA13LE 44r .
CHINESE EMPLOYED AS GOVERNMENT WORIceRs AS PERCENT Og
LABOR,.
, CIVILIAN A FORCE FORTIVESELECTED STATESi 19.7.0
io.
Pct. of CiV.%
Labor Force. .
Tiatal
MaleFemale
CaliforniaNew YorkHawaii
Massachusetts-
\
.
34;50019,7oa13,9.00
*
14,0003,100
14,6,500
1, 300'
300
19Z".
18
19'
18
9.3049.!
-6, .
4.
2
d
I
Source: U.S.. Census Bureau; Special Tabulation, PublicUse Sample ,Data (1970). .
.Note:' Based ona rpercent sampling. .
A
1. Ping-Ti Hot,ocial Mobility in China since the Fourteenth'Century," in Traditional China, JaMes T.C..Liu and Wei-mink Tu, eds.(Englewood Cliffs, N.J. : Prentice Hall, '1970), v. 65. '4
2. Ibid. p. 66. -.
ea'
-158-v.

i
I.
. : No. .% %. .. .%- .1. A it
TOtitl 16 Years + . - 34,705 '. 100 v;.
16-19 years : r 1; 744 5 1
20-24 year # , * 5;299- ..4. 15 1-
- 25--A4 .years-, ,r-
10,271 ,- 30,,: 35-44 years.
.)3,137 "24 - ,.
, 46-64 years
, '65 fivers +
,-...'-' ,', .8 ,871 251
.. , - .., .
.9 Source: 'U.S. Census Bureau, Subject Retort, PC(2)1G...
. (1970), Table 21. . - ".., . .
...r
r
Table 44 gibes the number of Chinese 'employed in governmentservice by seledte4bstat-ge. Id Hawaii, with 96;percent-of her
,
Chinese population citizenEi, 30-percent are in government ,service.Fourteen thousand- Chinese, or 18 pir4ent,:vork, for Abe government I
I. n, California. In. New York and Massachusetts, the ,percentagesare rather Insignificant.. Ire'these states, the foreign-born .
proportion- is higher ands thehistory.of the Chinese is more recent. ', -.
,.. p .. &,.
.Age Variable
The matuie (age 30 plus) second- or third- generation Americ2an-:,
.bernChinetie is more likely.to have aimed for a career in govern-nient. Timity or.thirty years ego, he stood little chance of
: getting a: position' other than menial York 'in ivate industryoutsid4 his community. Since, civil s&-Vide Sid primarily ona merit stem, his chances in ,government were b titer.. 'Looking.at Table 45 below, it.is very apparent &it Chinese-Americans-in- the upper age .krzoilts are -more into gove;cnment .service.
- .. - TABLE..4-5' i
NPMBER AM? PERCENT' O. elliNESi bovitiver L.' ii4O- iick*st-;'*.' .N 1-:- - "
: :' BY AGE' GROUP 1970. ,
4:
Level of Government .1.
Government is one Of the fastest growing industries. in theUnited States: In -l940; federal governzient jobs stood at aboutI million. By 1950, .t was 2 By 1970, it 'wan 'close .6
3 million. *The-number'of state- anriocel government jabs are
`-k
".
AA'
N
9

"TABLE 46
St
..
" CHINESE GOVERNMENT WORKERS IN FEDERAL, STATE, AND LOCALGOVERNMENTS, BY NUMBER AND PERCENT AT EACH LEVEL, 1970
U. S.. Total*Mali
FemaleCalifornia'New.YorkHawaii, ,
IllinciikMassachusetts
Federal State
Number% of Govt.. '
Number% of Govt.
. Wkrs..,.
, Wkrs., .
, .
11,700 34% - 13,400 39%
8,400 43 8,200 42"-i4 '3,300 24 5,200 37'- 5,200. 37 3,500 25
800 26 800 26 ,
°;-` 2;900 45', , -2,600 40' 200 , 15 900 69 '.
* * 200 6r ,
Local% of Govt'.,
:'.'Number Wkrs.
9,400 27%4;000 205,400 '39.
.5,300 ' 381,500 48 .,1,000,1.'4 .15 .
200 . ., 1.5,.100 . 33'
. . ,. ,7
, A 't ' e +.0
'Source: U.S. Census Bureau, Special Tabulation Public lise'Sample Data (1970).i
'" e ,4,,
e..
`NOTE: Based on a 1,Tercent sampling, 9, *a
e r
,.*Mona reported in celisUs:7 `g ; .."', . ..
. ,' -,,, -
$
0 .s 0,,
. .;
. ..,. ,c, .
.1.i.,11 I. 4
4rt. ....4.
Q
,
171 .
-16o-

CHART E
S.
bRIENTAL EMPLOYEES IN THE FEDERAL GOVERNMENT GENERAL SERVICE PAY SYSTEM, 1967-1971
Per cent
.
1
40 20 10
Mee
.. it
1311
4me
.111
1 0
IMM
O1
SS
MO
.
1111
.
Men
G.S. 1-4
G.S
5-8
0.
e e 1. es
111
Me.
KOil
G.S. 9-11
Grade Level
M0.
11i
1.S
,
G.S. 12-13
Egig 1967
1g69
K1970
P-7:1971
G. S . 14-15
Source:
U. S. Civil Service Commission, Study of Minority Group Employment in the
Federal Government
SM70-67B-71B
(1967, 1969, 1970, 1971).
-161-

s.
four times the number of federal jobs.3
Table-46 shows that state gdvernments hire more'Chinese thandoes either the federal or local,. although the'federal,governmentdoes not trail too far behind. In the federal government, roughly\one-third of the Chinese'males employed are professionals and technicians, one-third are in clerical ,work 'and one-fifth are in thecrafts. The federal government is the one place where Chinese,.have managed to penetrate into the craft occupatiOns. Plipese.females in federal government service art overwhelmingly concen-trated in clerical jobs.
In state governments,,the Chinese have fared better. Eighty.percent of the males and 60 percent of the females are in theprofessional-technical category. Thirty percent of the distaffworkers are concentrated in clerical work.
.0In local government, the Chinese female has outdone herself.
Two- thirds are in,the professions, whereas only one-half of themales are in this category. What doestthis translate into'? Itis simply that this large percentage of Chinese females in theVrofessions represent school teachers and librarians.4 Educationis a function of local government. * ,
Federal Government Jobs and Pay
A series of recent publications put out by the Civil ServiceCommission Minority Group Employment-in the Federal Government,gives a breakdown of workers employed by broad ethnic groups.This data should be highly, accurate because it is taken frompayroll information. The Chineiefigures, however, are submergedunder the more general heading, "Oriental," so we mustlook atthem in this context. Asian groups, generally share the sameoccupational experiences, but each group has problems unique toitself. In the absence of a more detailed breakdown, the Otientalshbcategory must suffice.
.
The bar graph (Chart H) shows the gradual change inlgade,rank for four years since-1967. No data was available for 1968.The viewer can perceive a gradual decrease in the lower grade
. levels and just as gradual an increase in the GS 14-15 leVels., :The GS 16-18 levels were too minute to-show up in the bar graph.
4
3. U.S. Department of,tabor, Occupational Outlook Handbook(Washington, D.C. Government Printing Office, 1972), p. 841.
4. U.S. Census Bureau, Special Tabulation; Public Use Sample Data(1970).1
-162-
173
L

Per cent
s*.60,
50
40
30
20
CHART F
ETHNIC DISTRIBUTION OF FEDERAL GOVERNMENT EMPLOYEESIN GENERAL SERVICE PAY'SYSTEM, 1971
larrocrtxxxio-tv
Blacks
American Indians
Spanish Surname
Orientals
All Others
G.S.
1-4
G.S.
k 5-8
$
G.S.
9-11G.S.
12-13
Grade Level
I
4
G.S. G.
14-15 16-
Source: U. S. Civil Service Commission, Study of Minority GroupEmployment in Federal Government, (1971).
-163-
174

TABLE 47
. .
ORIENTALS EMPLOYED IN AGENCIES OF FZDERAL GOVERNMENT,GENERAL SERVICE PAY SYSTEM, 1967-1971
Agency 1967 1969 1970 1971
Total All Agencies 20,393 21,432 21,405 20,889
State Department 208 203 184 178
Treasury 501 504 596 687
Defense Total 11,791 12,126 11,386 10,268Office of Secretary of Defense 278. 390 131 132
Army 3,436 3,602 3,430 3,403Navy 6,027 5,842 5,677 4,847Air Force s- 1,987 2,043 1,905 1,651Supply -- 249 243 235
Justice 88 132 154 171
Post Office 3,766 3,962 4,250 3,964Interior . 463 462 414 411
Agriculture 395 417 442 464Commerce 214 272 306 287Labor 42 49 49 65
Health, Education, Welfare 684 677 792 879Housing/Urban Development 82 104 105 135
Transportation 365 398 405_ 660Atomic Energy ,12
ft.Federal Reserve System 2
21
3
30
4
354
Management and Budget 1 . 3 2 5
Canal ZOne 7 6 6 8
Civil Aeronautics 1 2 2 2
Civil Service Commission 33 29 38 45
Equal Employment Commission 1 2 7 10
Federal Communication Commission 5 5 5 8
Federal Deposit Insurance Corporation 7 8 14 13
Federal Home Loan 7 8 7 7
Federal Power Commission 13 12 -13 16
Federal Trade Commission 6 6 7 5
General Accounting 11 16 20 .20.
General Service Administration 404 389 .380 578
Government Printing '7 10 , 12 13
United States Information Agency 136 155- 145 147
Interstate Commerce Commission 2 6 5 7
National' Aeronautics & Space Administration 179 202 193 184
National Labor Relations Board 16 15 18 23
National Science Foundation 1 7 7 5'
Office of Economic Opportunity- 15 15 23 23Panama Canal Company . 4. 10 11 11
Railroad Retirement Board 6 4 6 5
Securities and Exchange Commission 3 \ 5 4 5'
Selective Service Commission. 21 , 26' 34 34
Small Business Administration 28 16 23 82
Smithsonian Institution 12 10 9 12
United States Soldiers,Home 1 2 3 0
Tennessee Valley Authority 16 23 30 28
Veterans Administration 837 1,089 1,262 1,581
Federal Courts 0 1 2 4
Source: U. S. Civil Service Commission Minority Group Employment in the Federal
Government (1967 -711
1.76
f
By and large, Oriental workeri in the federal government-aze.-clustered around the entry. levels of GS 5, 9 and 11. A compariL.
-son with other ethnic 'groups is illustrated in the line graph,
Chart F. As a group, Orientals seem to have come off fairly well:
In Agencies Employed
Of the 20,889 Orientals employed 4n the federal governmentin 1971, 11;700 are Chinese.5- Since no data is available oh the ,
Chinese alone, wp w471 URP the priental figures as a guideline.Table 47 was set up to show the agencies in which Orientals arefound. The largest number are found in the bepartment of Defense,'which,includes the Army, Navy, Air Force, Supply, and the Officeof the Secretary. One-half the Orientals employed in the federalgovernment work in the Department of Defende. At"the time of,..
this writing, I was unable to find out what type or work thesepeople engage in,but an agency such as the Corps of Engineersis a likely place to utilize the services of engineers and techni-cians. The auditing dividions and the medical services in thearmed forces are also areas in.which.Orientals are likely to be
Oriental employees in'the Veterans Administration haveincreased the most. The functions of this agency are primarilymedical, educational, and insurance-oriented. Again, these aretraditional fields for the Oriental professional.
Outside the ranking system of General Service (GS) jobs,the federal government has a different system of ranking for wagesystem_(WS) workers and-postal workers. One might say the GSJobs are white-collar occupations, whereas the WS jobs are blue-=.
collar, paid at the prevailing local hourly rates for similarwork._ Table /4 shows that the' number of Orientals are dwindlingin WS jobs, but that their income has increased more rapidly ,
than all other ethnic gkoups4._,_ -
5. Ibid.
6., By way of comparison, the'Department of Defense has alwaystaken up a disproportionate share of the federal civilian payroll.Out of 2.9 million, 41 percent work for the Department of Defense.
1 7
-165-

.
TABLE 48
CdMPARISON OF FEDERAL GOVERNMENT WAGE SYSTEMS
aEMPLOYEES, BY PERCENT, 1967-1970
Wage Systems
Blacks
Sp. Surname
Amdr. Indian
-Orientals
All Others. -
No.
%No.
,%
.No.
%-
'No.
%.
-No.
%-1967 Total
121,829
100.0
32,024
.. 100.0
5,725
100.0
6,928'
100.0
430,141
100.0
*
Up Thru $5,499
55,742
45.7
9;593
29.9
2,344
40.9.
'
1,066
15.4
68,927
16.0.
$ 5,500-$ 6,999
47,432
'38.9
% -
14,869
46.4-
2,367
41.3
2,526
36.5
.161,341
37.
$ 7,000-$ 7,999
15,396
,126,
..5,862
18.3
708
'12.4
: 2,232,
32.2'
.122,918.
28.6
$ 8;000-$ 8,999
2,300
1v.9
..)
1,239
3.9
'57
2.,
516. t
7.4
38,209
8.9
'
-$ 9,000-$ 9,999
789
.6
330
1.0
-8j
*1.4.
423
6.1
25,372
5.9
$10,000-$13,999
_166
-il
-124.
.4
-
62
1.1
160
20'
12,543.
2.9
$14,000-$17,999
4*
5*
4*
5*
...
741
.2-
$18,000 & Over
0*
'
2,
*'
0,
*0
*.
e90.
*/
...,,.
1969'Total
112,093,
100.0
31,807
100.0
5,396
100.0
6,449
100.0
`
404,626
100.0.
Up Thru. $5,499
21,945
19.6
3,867
'
12.1,
462
.8.6
529
,8:2
21,475
5.3
$ 5,500-$ 6,999
49,366
44.0
'
9,889
31.1
1,919
35.6
' 1,556
24A.
.88,604
21.9_
$ 7,000-$ 7,999
22,281
19:9
9,667
30.4
1,393
25.9
1,406
21%8
106;047
26.2
$ 8,000-$ 8,999
11,888
10.6
5;709
17.9
898
16,6
1,444
22.4
93,642
23.1
..$ 9,000 - ''9,999
4,19r
3.7
1,747
5-.5,
304
5.6
795
'
12.3
43,961
10.9
$10,000-$13,999
2,289
2.0
881
2.8
356
6.6
690
10.7
'
47022
11.7
414,000$17,999
117
..1
39
---1--..1
57
1.0
'
.24
.4
'
2;804
.7
$18,000 &.Over
16
81
f5 -
:.1
771
.2
'
,.
.
1970 Total
061619
100.0
,30,003
100.0)
5,509
100.0
6,155
100.0
%-372,656
100.0
Up Thru $5,499
1,366
10.7
1,115
3.7
250
4.5
193
J.1
,,
8,377
2.2
$ 5,500-$ 6,999
,345
*36.9
5,779
19.3
1,421
25.8
1,058
17:8
47,365
12.7,
$ 7,000-$ 7,999
24,587
23.1
7,616
25.4.
1,307
23.7
1,107
18.0
63,207
.17:0
$ 8,000-$ 8,999
17,364
16.3
.8,463
28,2
1,079
1.9
1,103
*
17.5
93,956
25.2
$ 9,000-$ 9,999
9,896
9.3
5,178
17.2
871
15.8
1,606
26.1 "
82,511
22.1
$10,000-$13,999
3,933
"3.7
1,786
5.9
530
9.6
978
15.9
70,608
18.9
$14i000-$17,999
119
.1
60
.2
*45
.1
64
10.
5,707
1.5
$18,000 & Over
9*
.6
*_.
6*-
6Q.1
925
.2
Source:
U.S. Civil Service Commission
Minority Group Employment in
the Federal Government, (1967,
1969, 1970).
*Less than .1 percent.
4'
-166-

TABLE, 45
ETHNIC COMPARISON OF U.S. POSTAL ;iaTEMEMPLOYEESi''BY PERCENT; 1967-1971
PFS Rank Blacks Sp. Surname Amer. Indian Orieutalt -A11 OtherdNo. No. % No. % No. - X No. X
67 Total 132,011 100.0 14,776 100.6.1t057 1O .0 3;758 100.0 546,744 100.0S 1-4 123,632 93.7 13,626 92.2 917 86.8 3,337 88.8 459,648.. 84:1
7805 1,034 7.0 124 11:7 '374 10.0 68,409 12:59-11 467 .3 87 .6 '.. 13 1.2 39 1.0 14,379 2.6 -Y
2-15 97 27. .2 3. .3 , 7 .2 3,916 ,7
16-18 7 2- *. 0 * 1 .* 359 *
.19-20 .3 0 * 0. - 0 * 33
1969 Total 136,322 100.0 17,494 100.0. 1,182 100.0 3,947' 100.0 541359PFS 1-4 124,173 91.1. 15,847 90.1 992 83.9 '3012 84.0 451,330 83;4
'5-8' 11,343, 8.3 1,485 8.5 165 14.0 '575 14.6 70,743 13.19-11 623 .5 127 .7 22 1.9 44 1.1 14,543 2.7
12-15 170 .1 33 ,.2 3 .2 15 .4. -4,28816-IS 11 2 * 0 1 !ft 418 -*
19-20 2 0 o * 37 ...-*
1970 Total 138,753 100.0 19,045 100.0 1,271 100.0 4,232 100,0 550,678' 100.0PFS 1-4 124,549 89.8 17,124 89;9 1,056 83.I 3,485 82.3 457,754 831
5-8. 13,176 1,730 9.1, 185 14.6 662 15.6 72,844 13.2
9-11 771.5.5 150 .8 27. 2.1 1 66 1.6 15,014 '2.7
12 -15 .241 .2 37 .2 . 3- .2 18 .4 4,514 .:8
18 14 4 0 * 1 515 .1'
19,-20 2, 0 ' 0 * 0 * N 37 *
1971 Total. 130,350 100.0 18,175 100.0 1,224 100.0 3,952 100.0.'542,108 100.6.
PFS li4 36,444 23.3 3,108 17.1 197 16.1 473 12.0 57,711 10.65,8 98,004 75.2 14,512 80.0 878 71.7 43,341 ,, 84.5 417,140 ,- 76.9
9-11 1,190 , .9 1.5") 4.2 51 2.3 23,280 4.3'12-15 410 '40 '60 .3 8, -16 25 ':.6 5,841 1.116-18 46 '8 3 .2 a 775 s 1
19-20 2 * 1 1z
* 81
2 6. * 0 * 0 0 4 36- *, f
. -.. -
4th Class 99 .* 103 .6 ,. .. 36 2.9 ,4, * 4,476 ' 1.1
Rural Carriers 149 97 -,-.5 , 50 4.1 114 .3 30,7681, 5.7. . - :
./
Source: U.S. Civil Service Commissitin Minority Group Employment Lithe i'ederalGovernment(1967, 1969, 1970, 1971).
*Less than percent
178-167-
.4
z

TABLE 50 -
SAN FRANCISCO GOVERNMENT .EMPLOYEES':OF ORIENTAL EXTRACTION,
BY MAJOR OCCUPATION
.,
Major` Occupation Group
'
.
GROUP AND SEX, AS or DECEMBER 31, 1971
..
...,
.
$'
Totzli
-Males
'
Females
,
No.
'%
'No.
-%
No.
%. A
,--
,.
..
Total
693
s
joo.o
459
op.
223++
1.00.0
Officials-and Managers
14
2.0
412
22
0.9
.
Professional
326
47.0
207'.
45.1
:119
50.9
.Technical
87
12.6
82
17.9
',5 '
2:1
'
Official and Clerical.
1d
140
20.2
37
8.1
103.
'
44.0
Craftspersons-
35
5.1
35 '
7.6_____----0---7- 0.0
Operatives -
36
5.2
36
.8
"0
0.0
Laborers
00.0
0.0
00.0
Uniformed Protect. Serv.
99
2.0
00.0
1....,
Service Workers
6.1
37
8.1
52.1
------------Agrie
and_,Horti Wk
40.6 ,
40.9
00.0
(L.)
Source:
Commission on Human Rights, San Francisco,
Racial and Ethnic Employment
Pattern Survey, City and County of San Francisco Employees
(December 31, 1971).
,
-168-='
ti
,

The Postman Cometh
Of .approximately 730,000Apost office jobs in the nation,
3,000-4,000 are held by Orientals. Orientals include the Chinese,
Japanese, Koreans, and other nationalities like Vietnamese. Iwould, venture a guess that most of the postal employees under theheading Orientals are Japanese than Chinese. Even limped together,there were but 3,947 Orientals in the Postal System in 1969. Thefigure rose to 4,232 in 1970,-but declined the year following to
3,952.
In 1967, 89 percent of the Oriental postal workkg were inthe lower PFS 1-4 ranks- By'1971, most had moved out of theseranks, but only into the next two higher ranks; PFS 5 to 9. Theywere conspicuously absent from the higher ranks extending upwaid.to,: PFS 21. (See Table49.),-
The obvious conclusion that can be drawn from these figuresis that the vast employment network of the U.S. Postal System is
';Isk highly segregated bloodline of the federal government.
San Francisco County and City Government
The charm of this gateway city to the Pacific Ocean hasalways been its Chinatown with its large Chinese-American popU--lation. Out of a population of approximately moo, oyer.8percent are Chinese, and 2 percent Japanese. To administer theaffaira of government, San Francisco employs a work force of more
than 20,000. Of this number on the regular payroll ii December1971, only 693 were Orientals.
At the state and local government levels, Orientals areprimarily in professional and technical jobs; clerical jobs followslightly behind. Their numbers in administrative and managerialpositions are insignificant, as is their-presence in all the other
0 major occupational categories. Table 50 gives,a detailed-break-down.
Pay for Oriental males from the San Francisco government in1971 clustered around the $880- to $1,250-per-month brackets.Females were more evenly' distributed in the pay scale, although
, 50 percent held professional positions. Table 51 is more explicit.
New York City
' Let us span the continent and go to the second largest center
18u-169-
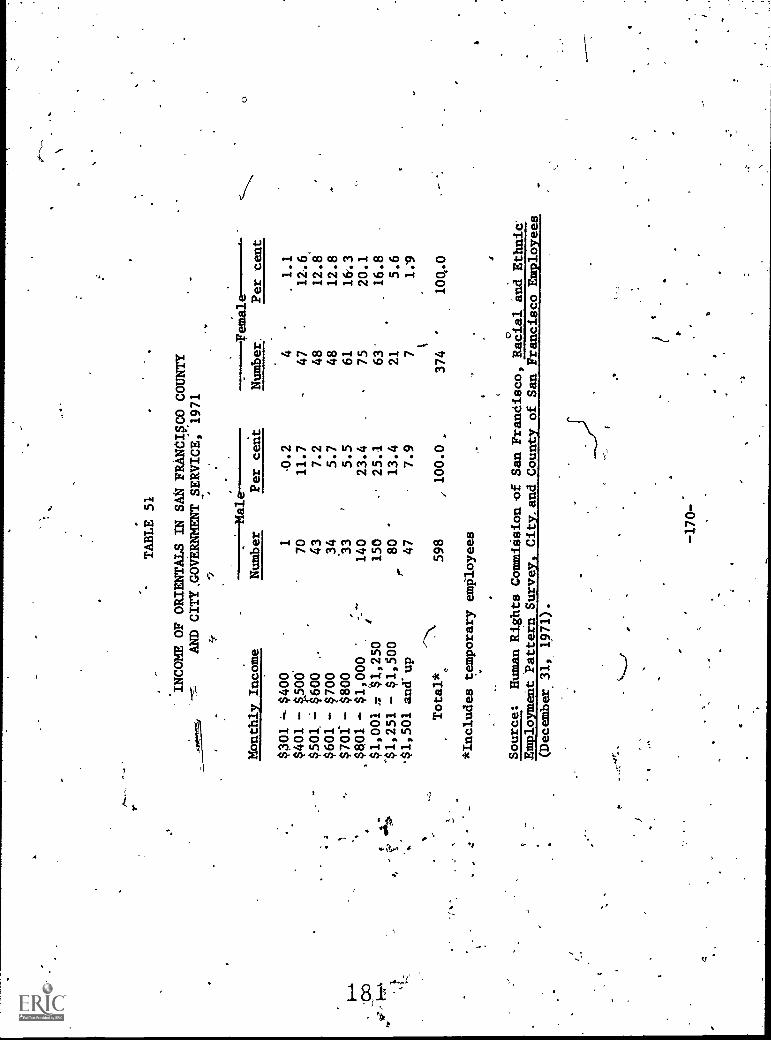
s_
'
TABLE 51
INCOME OF ORIENTALS IN SAR FRANCWO COUNTY
AND CITY.GOVERNMENTSERVICE; 1971
v
Monthly Income
Number
Per cent
_
Number,Female-
Per cent
$301 t $400
10.2
41.1
$401 - 006
70
11.7
47
12.6,
$501,
600
43
7.2
48
12.8
$601 -
34
5.7
48
12.8
$701 - $800
.33
5.5
61
16.3
$Et01 - $1,000
140
23.4
75
20.1
$1,001
$1,250
150
25.1
63'
16.8
'$1,251 - $1,500
80
13.4
21
5.6
'$1,501 and" up
47
7.9
71.9
Total*
598
,100.0
374
'
1004.0
*Includes temporary employees
.or
Source:
Human Rights Commission of San Frandisco, Racial and Ethnic'
Employment *Pattern Survey, City. and County of San Francisco Employees
(December 31, 1971).
-170--

TABLE 52
NUM114nE-CHINESE-IN--NEW--YORX__CITI dOVERMIENT_ AGENCIES, 1971
N.Y.C. Government Agencies
Total City ----Chinese.EmplOyees.---
Employees Total' Males Females
Administration, Office of 0 'O 0
Art Comiaission -2 0 . a 0
Borough President Offices 20,r 2 2 0
Budget, Bureau of the 279 2 2
City Clerk .54 0 0 0
City Planning, D 368 3
City Sheriff ' 109 0 o 10
Collective Barge , Office of . 25 0
Comptroller, Office of the 1,176 5 3 2
Consumer Affairs, Department of 335 '" 0 0 0 '
Correction, Department of 3,681 4 3 1
County Clerk --Queens 51 6' 0 0
District.Attorney Office 662 2 1 1
"Economic-Development Admin. 508 2 2 0
Education: Board ofA Environmental Protection Administration
88,641
19,411
231
21
62.
,19
169
2
Estimate, Board of.Bureau of Franchises 19 1 1 0
. 'Estimate, Board of Bureau of the Secretary 24. 0 o . 0
Finance Administration 2,043 r, 5 2 3
Fire, Department of 14,873 0 0 0
Health and-Hospitals Corporation 40,646 ' 286 137 149
Health Services Administration '6,374 43 26 17
Housing and Development Admin. 4,863 23 19 .4 .
Housing Authority 11,312 15 .9 6
Human Resources Admin. 25,503 .93 65 28 .
Human'Rights,,Commission'on - 54 0 0
Investigation; Department of 83 0 0 0
'Jamaica Planning and Development, OffiCe of 13 0 0 0
Law, Department of 698 3 0 3
Lower Manhattan Development, Office of -12 0 0 0
Mayor, Office of the 201 0 0' 0 C",
Midtown Planning and' Development, Office'of 22 2 2 0
Model Cities Administration 442 3 2 1
MUnicipal Services Adminittration 3,917 16 13 3
,Parks Recreation and Cultural Affairs Admin.Personnel, Department of
4,895406
3,
,0
3
,0 0
Police, Department'of 35,310 15 78 7
Public AdministratorsPublic Events, Department of
,45
18
0
`00
0 ' 0
Standards and Appeals, Board of 34 ,0 0 0
Staten Island Development, Office of 0 0 4- 0
Court -- Richmond County 18' 0 0.Surrogate's,
Tax Omission 22 0 0 0
.,',:Teacher's Retirement Board 11Q 1 0 . 1
Ttansportation Atinistration 255 . 14 ' 10 4
,Ttibtorough Bridge and Tunnel Authdrity 5,429 0
Veteran's Affairay Division of 26 0- 0 0
Water Supply, Board of 591 20 '20 '0
Total Number in City Government 273,881 817 413 404
Source: Commission pn Human Rights, New York City, The Employment of Minorities, Women
and the Handicapped in City Governmintv Report of 'a° 1971 Survey.)
, , k.
182

ti
.
of Chinese population on the East coast --New York City. The`population of the five boroughs of the.metrOpolitan area is putat 7.8 million, and, according to the 1970 census, there are70,182 Chinese. This is not even 1 percent-of the populationin this sea of humanity. ,Nevertheless, the Chinese are a highly
"concentrated, visible groUp\th.at forms a viable community becauseof this consolidation.
The New York City government employed a work force of 273,881in 1971. Of this number 817 were Chinese. Two-thirds of thisnumber were in education or health services. The rest werescattered in lonely isolation throughout the fifty-odd agenciesof the municipal government. Table 52 shows the distribution.Even in the Board of 'Education and the Health and Hospitals
Corporation,.where they were strongest in numbers, they wereweak in comparison to =the total personnel in those two agencies.
Three important services of the municipal government aresanitation, fire protection, and police protection. Sanitation,listed'under.the Environmental Protection Administration-, employed
4
19,411 persOns, of which 21 were Chinese. The POlice Departmentpayroll was 35,310, of which 15 were Chinese. The Fire Departmentemployed 14,873, and there was not a single Chinese to be foundin the entire lot.
The absence of Asians in these three municipal agencies isa common pattern in all metropolitan areas in the United States.In an intensive affirmative action investigation by the CaliforniaFair Employment Practices Commission, it was found that Asians were.
woefully'underrepresented in or completely absent from the Policeand Fire Departments of Los Angeles, Oakland, Santa Clara andBakersfield.7
Of those Chinese who do work for the city governMente threeout of four are.professionals and another 8 percent are paraprofes- .
sionals. Knowing that the Chinese are found-predominantly in theBoard.of Education or the Health and Hospitals Administration, wecan surmise that they are eitfierteachers,or medical care personnel.(See Table 53.)
Table 54 shows the salary level of Chinese employed in theNew York City government. Since three-fourths of the jobs heldbyChinese are in the professional ranks, it is not
obs heldby
o
7. -Vicki Seid, "Police,, Fire Departments Lack Asiansi.Says FEPC,"East /West (Augu
M-172-

.
"4,
NEW YORK CITY GOVERNMENT EMPLOYES OF CHINESE EXTRACTION-,
By.SEX AND OCCUPATIONAL CLASSIFICATION, 1971
Source: Commission on Human Rights, New York City, The Emslovment of Miqpritiee,Women and the Handicapped _In City Government: Report cot& 1971 Survey.
.1,
TABLE .54
SALARY LEVEL OF. NEW YORK CITY GOVERNMENT EMPLOYEESOF CHINESE EXTRACTION, BY SEX, 1971
Total Male . Female
EX, 1971
, Salary Level' # % it, % #
Under $5,200
'
. 21 2.5 6 1.5
$5,200-7,299 112 13.7 41 9.9
7,300-10,499 55 6.8 25 6.1
10,500-12,999 366 44.8 138 33.4
13,000-17,999 , 228 -27.9 185 44:8
18,000-24,999 > 12 1.4 11 2.7
25,000+ , 3 0.3 2 0.5
Unknown , - 20 2.4 5 1.2
Total Male . Female
Total 817. ,o 99.8
, Salary Level' # % it, % #
Under $5,200
'
. 21 2.5 6 1.5
$5,200-7,299 112 13.7 41 9.9
7,300-10,499 55 6.8 25 6.1
10,500-12,999 366 44.8 138 33.4
13,000-17,999 , 228 -27.9 185 44:8
18,000-24,999 > 12 1.4 11 2.7
25,000+ , 3 0.3 2 0.5
Unknown , - 20 2.4 5 1.2
15 3.7
71 17.6
30 7.4
228 56.4
43 10.6
1 0.3
1 0.3
15 3.7
413 100.1 404 100.0
.
Source: CoMmission on Human Rights, New York City, The Employment.
of Minorities, Women and the Handicapped in City Government: Report
'of a 1971 Survey:-
413 100.1 404 100.0
-173-
hp o 1:84
.
Source: CoMmission on Human Rights, New York City, The Employment.
of Minorities, Women and the Handicapped in City Government: Report
'of a 1971 Survey:-
15 3.7
71 17.6
30 7.4
228 56.4
43 10.6
1 0.3
1 0.3
15 3.7

. .
14.
.
to fhd that three-four,ths of .tip earned: salaries in the $10,500-,$17,999 range. These salaries are below those for comparablepositions in private industry or professional service. Fromperional knowledge, I feeI-that a disproportionate number ofChinese doctors work in the city hospitals, mainly because theyhave not met .the residence Or citizenship requirements to prac-tice.
Decline in Government Service
There is a slight indication that government service may belosing its aura for Chinese Americans. At one time, ft was thebest channel for them.to move out of their few traditional.andrestricted' lines of work in the service category and into theprofessional, technical, and clerical ranks. Today, private .
industry is more amenable to hiring Chinese, and the Challenge'and opportunites offered by pritate industry must be weighed,against the cultural status and 'security of civil service. Be-sides, the mandarin U.S.-style in no way approaches the mandarinof imperial China. The former is but a cog in the vast bureau-cracy of public administration; the latter wielded influence andpower, and his position was more akin to that of an Ameficanelected official.
7 .
Not all jobs in government are obtained through competitivecivil service Pxamnations. There are noncompetitive positions- -usually atthe higher levels- -which are filled on the basis of aperson's experience, skills, and background., Then there are theappointed positions made on the basis of political considerations,as well as qualifications,.and,finally,.there are the electedofficials.
t
The Chineseahave Managed very well to gain entry into thecompetitive positions,' carrying out the routine functions ofgovernment responsibly and efficiently. But the ranks of jobsfilled by election,appointment, or personal consideration's arevery thin for the Chinese indeed.
In testimony presented before the California Fair'EmploymentPractices Commission in San Francisco in 1970, the story ofFrancis Ching was. brought out.
;n September 1969, a civil service examination wasgiven for the post of directorship (of the Los Ange*s
$,-
.
148 5-174-
400
,
4 s

a
CountyDipartment of. Arboreta and Botanic_ Gardens).Francis Ching., who worked his way up through theranks since 1956', and had an 4;S:'from Michigan State.University, was placed number one-on the list. But
the 25--min ,-Board of Governors decided to pick Dr. '
Jbhn Beard of Australia, the only other perion whopassed thestest. .
Los Angeles County Supervisor Frank Borelli objectedto giving the job to a man who held no Americanzenship and stuck by Francis Ching. Other supervisorsagreed; the Board of Governors decided in light ofthis situation to holea second eyomination. The Board
of GOVernors' President further specified that in thesecond eiamination, questions be included that relatedto "the public relations and social aspects of thecandidates."
Again Francis thing, who had been superintendent atthe department since 1967, topped the list. Insteadof awarding the post to him; however, the governorschose to re-interview the top three scorers on the
test. Francis Ching and two other finalist were askedto give a 15-minuteepeech before the governors at a
luncheon on April 2'of this year. The luncheon wasfollowed by a cocktail party. 'The governors then de-Cided who was "best" for thjob. It was clear then
the governors cared more fOr"social status and-pres-'tige than for qualifications. Most of all, they did
not want Francis Ching, After the luncheon, they Chose
the man who came out second in the exam.
However, undgrthe leadership of Supervisor Borelli,the Board of SUpervisors unanimously voted to overridethe recommendation of-the Board of Governors of the
Botanic Department. Francis Ching thus became thesecond ApianrAmericaii and the first' Chin9se to' head
a majorlepartment in. county government.°
Another example cited inthe.Commission testimony was the
case of Mrs. Ming H.N. Moy, who had Worked for fifteen years in
6. "Chinese in San Francisco, 1970, Employment Problems'of,theCommunity as Presented in Testimony Before the California Fair
"Employment Practices Commission" (Tr'anscript).
A '186-175-

the budget department at McCellan Air Force Base. She held therank of GS-41,but formineyears had received no promotion.'Mrs. Moy held a B.A. degree from George Washington University' 'and an M.A. degree in economics from Duke University. In herpersonal files were many letters of commendation. After repeatedlybeing ignored for promotion, Mrs. Moy filed a complaint. Theofficial reason given for not promoting her was that she couldnot communicate with other because of her Oriental accent. How--
ever, according to her attorney, "Mrs. Moy speaks precisely andher grammar is impeccible." Besides, her job in the budgetdepartment dealt more with books and numbers than with the public.The issue of speech was, completely irrelevant.
To sum up, the Chinese found in government service a wedgeto break out of their ghetto occupations. They,are pr ily inthe professional and technical jobs, performing the hi:' y skilledtasks in the daily operations of governmental functions but, whenit comes to promotions into the supervisory or menagerie. ranks,they are skipped over on the pretext that they are deficiEnglish or socially not presentable.
41.6
'S
-176-
.14
O

SDHHARY OF FINDINGS
1. Almost one out of five Chinese persons employed work ingovernment service., They are found primarily in the states of
Hawaii and California. This percentage is unusually high consi-dering that, until very recent times, government employmentrequired American citizenship and.the Chinese population in theUnited States is heavily foreign-born and alien.
2. The reason lies in the status attached to governmentservice and the lower racial bars of the civil service system.
3. In state and local governments, the Chinese are predomi-nantly professionals and technicians. Translated into specificoccupations, this means that they are teachers, engineers, andmedical personnel.
g
4. In grade level and earnings, the Chinese may be classi-.
'fled as in the middle or upper-middle echelons.
5. .The Chinese have come off better than other ethnic minori-ties in government service, but very few have managed to penetrate
the upper grades.
6. Large are s of government employment, such.as the PostalSystem, the Sanitation, Fire, and Police Departments, have veryfew, if any, Orientals-on their payroll.
7. Civil service examinations consist of a written portion
and an oral portion. The exclusion of Chinese from government
service cank .veniently be carried out inthe more subjective
oral portion o the examination. This is frequently the case.
188-177 -'

10
4 RECOMMENDATIONS
1
'When 19 percent, or one out of every five Chinese personsemployed, are in government, we can see how important-governmentemployment has been in the lives of the Chinese in the UnitedStates. For decades, government service has been the primaryhope of native-born Chinese American and the channel by which theyclimbed out the service and operatives occupations to which a-Eywere restricted. Through competitive examinations or proof ofcompetence, such as the licensing of teachers, nurses,.librarians,or accountants, the Chinese were able to prove that they werecompetent to perform the duties required.
Government service has expanded occupational opportunitiesfor the Chinese people and it has given them upward mobilityinto the middle ranks. Having proven themselves, the Chinese
readyeady to move forward. The probleth today is not getting inbut going up. Promotion criteria must be reviewed to remove someof the myths and stereotypes about the Chinese. There i? toomuch presumption that whites will not take orders from a Chinese,that a Chinese might not be able to handle himself in the socialmilieu-, that the Chinese speak only pidgin Englisbor have aheavy accent. 1 am forever amused by people who ame up to com-pliment me on how well I speak English without an accent.
The issue of whether government employees must be citizensof the United States was resolved at the state and local levelby guidelines issued by the Civil Right Commission late in 1969.The guidelines 'state that the citizenship requirement discrimi-nates against persons on account of national origin and, therefore,is in violation of Title VII of the Civil Rights Act. The U.S.Civil Service Commission,has taken exception to this Interpreta-tion and has not removed the citizenship ban. This question wasdiscussed in detail in Chapter II. My recommendation is that thefederal government as an employer should itselfcomply with itsown guidelines handed down for the state and local governments,except in positions involving national security and defense.
The bulk of the Chinese employed in government are in jobsfilled by competitive examinations. The higher level jobs areeither filled on a" noncompetitive basis, by appointment, or byelection. These are the managerial, administrative, or policy -making jobs. The reason why I diknot cover this area is thatthere are so few in the upper echelons. The appointive and elec-tive jobs require involvement in the political processes, andthe Chinese have been reluctant to participate. It- behooves theChinese to realize that the United States is a democracy wherethe people are expected to be informed and involved; and to tike
185-178-

an active part in the political proceimes of government. If they
expect to have a voice in the determination of aifitirs that affect
their lives and their interests, they must take a more active poli-
tical role.
190-179-

CHAPTER VIII
UNIONS A MAJOR HURDLE
The strongest bastion, ainst entry into the skilled crafts--particularly the building and construction industry--are the unions.
,Peculiar to this line of work is'the fact that hiring is done,not'by contractors, but through the unions, and union cards'arehard to come by.
The craft unions, as oppOged to industrialrunions, are strongezclusionists, and it is their intention to keertheir numberslow, their wages high, and their influence in the trades absolute.If.one were to look at the structure of the unions and their,hiring practices, one would realize how,entrenched their positionis, for they can determine the size and composition of the workforce, the hiring and the firing, th'e qualifications for entryinto the crafts, when and under what circumstances'their numberscan work, and, to a large extent, the benefits and wages.
. You Can't Be a Plumber Just Because You Want To Be
If you want to a secretary, you go.to school, and learn
typing, shorthand; and general office practices. Whercyou havefinished your studies, you can apply to any firm that wishes to.hire a secretary. Youhave no idea how many other persons aretaking a secretarial course, nor do the schools limit the numberof studenti they take in. .Those who take the courses and whoeventually become secretaries are governed by many factors, chiefamong them the forces of supply and demand.
fl
In the building and. construction trades, however, the uniondetermines how many apprentices are to be*admitted into the crafts.To be admitted, a prospective apprentice must be sponsored by twomembers. This sponsorship has given rise to nepotism and a situ-ation where a craft may be dominated by persons with close familyties.

The union leadership, may decide that at any given time thereshall be no more than 10,00 plumbers for a metropolitan area,and that no more than 75 apprentices will be accepted for thecalendar year to replace the ones who retire, die, or move away.Consequently, even.if 100 fathers had 100 sons waiting to stepinto the trade, 25 would have to wait until a slot opened up.That literally left no opening twany outsiders.
The age qualifications are another major screening processto iceep.,the ranks of the crafts thin. Table 55 gives the qualifi-cations4or appientices for the major unions in the New York area.The age cut-off is in the late teens to mid-twenties. If a youngman has not made a choice to become a plumber,by age g4, he will,already be over-age and disqualified.
With very few exceptions, most unions require that theapprentice be a citizen of the United States or that he hasfiled for naturalization papers. In other instances, he mustalso have lived in the state for as long as three years. Thesequalifications are immaterial to the performance of the job and,to a large degree, screen out ammigrant groups like the Chinese.
The length of the apprenticeship is a further deterrent.The period generally runs from three,to five years, during whichtime the wages are only about one-half the journeyman's rates.For example, the apprentice plumber starts off.with $5.49 perhour compared to $8.25 for a journeyman, and the apprentice mustserve five years before attaining journeyman's status.
Still, the status gets him nowhere until he is a member ofthe union, because the unions control the hiring halls and jobreferrals. A booklet published by the New York City Commission,on Human Rights called "Bias in the Building Industry" flatlystated that:
. The contractors continue to shirk their respon-sibility to include minority group workers in their'work force. . . Their LEGAL responsibility is setforth in a recent National Labor Relations Boardruling, confirmed by the U.S. Court of Appeals forthe Second Circuit, which're-affirmed four basiclegal doctrines:
1. Hiring is a management responsibility'thaicannot be delegated to unions.
2. Union membership cannot be imposed as acondition of initial 9mployment becauSe this
192-182-

TABLE 55
APPRENTICESHIP IN NEW YORKkAREA:
QUALIFICATION, TRAINING
PERIOD, AND WAGES, 1974
.
'Period ..'
QUALIFICATIONS
ITTieTi-
Start-
Jouriey
Physical
Educe-
Resi-
ticer
Citizen
IPR
°imen
tion
Exam
Age
dence Test
ship
ship
Wage
Wag
rP
.
Auto Mechanic
Yes
18-26
-Yes
'-
.4 yrs
.$3.35/hr. $5.1 /hr.
Baker
Yes
18+
--
Yes
-3 yrs
$75./wk.
$178./ k.
Bricklayer
0Yes
17-t1
09th gr.
3,yrs.
Yes
74 yrs
44.60/hr. $9.2 /hr.
Carpet & Linoleum Layer
Yes
17-27
9th gr.
Yes
Yes
4 yrs
4.60/hr.
8.4 Or.
Bldg. Construct. Carpenter
Yes
17-27
9th gr.
,-
Yes
Yes
4 yrs
5.65/hr.
9.1 (hr.
Shop'& Mill Carpenter
Yes
17-27
9th gr.-
-Yes
Yes
4 yrs
5.31/hr.
9.1 /hr.
Cement Mason
Yes
18-21
8th gr.
1 yr.
--
3 yrs
4.93/hr ,9,8
Electrician,
Yes
19-22
H.S.
2 yrs.
Yes
Yes
4 yrs
3.05/he.
8./
hr..
Iron Worker Ornamental
Yes
18-30
10th gr.
3 yrs.
Yes
Yes
3 yrs
5.86/hic- 8.4
hr.
Iron Worker (Rigger & Machine)
4Yes
18-28
10th gr..
-Yes
-3 yrs
4.50 /hr.
7.3 hr.
Iron Worker Structural.
()
Yee
18-28
10th gr.
-Yes
Yes
3 yrs
5.25/hr
8.5
hr.
Metal Lather
...
Yes
18-25
10th gr.
1 yr.
Yes
Yes
3 yts
3.85/hr.
8.7 /hr.-
Millwright
,Yes
17-27
9th gr.
-Yes
Yes
4 yrs
4:60/hr.
8,4
hi.
-
C.'?
Painter,'Decorator, Paper Hanger
Yes
18-25
10th gr.
-Yes
-3 yrs
4.41/hr.
7.3
hr.-
Co
Plasterer
Yes
18-21
9th gr.
1 yr.,
--
3 yrs
$162./wk. $299.
k.
Plumber (Local 1)
Yes
17-21
H.S.
3 yrs.
Yes
-5 yrs
'5.49/hr.
8.2 hr.
Plumber ( Local 2)
.0
Yes
18-24
H.S.
.3 yrs.
Yes
Yes
5 yrs
2.85/hr.
7.0 hr.
Painter:Caulker & Cleaner
.Yes
18+
7th gr.
--
3 yrs:
2.50 /hr.
5.6' hr.
Sheet Metal Worker
Yes
18-25
H.S.
-Yves
-4 yrs
5.58/4r. 1E5 hr.
Sheet Metal Worker,(signs) l'
Yes
18-22
H.S.
-'
Yes
Yes
5 yrs
2.90/hr.
5.80 hr.
Steamfitter
Yes
18-24
--H.S.
1 yr.
Yes
Yes
5 yrs
3.42/hr.
$.6
hr.
Stond Rigger
.Yes
18-28
10th gr.
1 yr..
Yes
Yes
3 yrs
4.75/hr.
8;7
hr.
Structured Steel & Bridge Painter
Yes
18-26
H.S.
-.
--
2 yrs
4.53/hr.
9.47 hr.
.°
Source:. Apprenticeship Information Center, New York State Employment Service.
'
tL
-183r

a
. ,
creates a closed shop in violation of federal,labor law.
3. Labor contract clauses on hiring cannot -beso rigged as to create or perpetuate anillegalclosed Amp. . . .
4. The satisfactory completion of union testsor other requirements cannot, be made a conditionof employment.
More than ten years after this ruling, the labor needsof the contractors are still met by asking the union to send outX number of men. The booklet goes on to say that "it is beyond ,
credulity that a union official or business4agent will seek-out .
any non-union men. . . . If there is a shortage of-men the con-tractors .will pay overtime rates to union men or acCept.referralsfrom out-of-town locals."
4
Management Surrendered Right to Hire
. When confronted by the complete, surrender Of their right tohire, the contractors protested that, if any nonunion men were onthe job, the union men would walk'off. The contractors take'further refuge behind the-skirts of the unions. The contractors-_,
assert that they do not discriminate becauseof.the color of aman's skin; that they will accept a nonwhite if the union,sendshim; but if the union is lily-white or practices discriminaiionit is not their responsibility.'
Before the reader-comes to' the erroneous concldsion tbatthischapter is a condemnation of labor unions,'let me hasten to saythat it is not, the concept of the labor movement that Is questioned,but its exclusionist policy against nonwhites that is deplored. ,
Table 56, Racial Composition ofTen Construction Unions in San'Francisco in I970, reveals how few there are in that West coastcity. In the New York region, we have figures compiled by theUGC for 1972. For 317 locals with a total membership of 175,934,there are 229 Asian Americans. (See Table, 57.,) A closer look at 4the nonwhite union membership will reveal that a good portion of .
the work force'ia in the laborer category
Government Steps Ina.
Since the contractors are reluctant to cooperate in opening
. the doors/ of employment in the crafts to minorities4;thevarious
19'4:
-184-,

4
I\levels of government have pabsed laws and issued executive ordersand decrees to try to open up a wedge. The CivilRights Act of
1964 has been on the law books for a decade, and Title VII of theAct declares racial' disnrimination.in private employment unlawful.
'Until 1972, however, the Equal Employment" Opportunities Commission -.set up wader' the Acito implement the law found its effectiveness^seriously hampereeby its.inability to enforte any violation
the law.O
At the federal'level, Presidential Executive Order 11246 setup the Office of Contract Compliance. This order imposes on the
contractor in all federal contracts and federally assisted cpnstruc-
tion contracts the obligation to take affirmative action to ellsime
that applicants ere employed, and employees treated equitably without
regard to their race, creed, or'national origin. Affirmative action
mandates positive effort on the part of the employer or contractor;to recruit nonwhites and to see that they are given equal opportg-nity for advancement. To enforce compliance, the government has
the right to cancel the contract or prohibit .the contractor'.frpsbidding onany future contract. The executive order was eventually
ther strengthened by'requiring that the employer show that hemet definite goals in hiring minority workers in his work force
/ before he was permitted to bid on government4assisted contracts.
It as recognized that the pattern of -discrimination
and excl ion began at the apprenticeship level. In 1967, the
U.S. Departm t of Labor, announced that various trade union locals
would be denied federbl certificatidn unless they 'reconsideredtheir reftsal to admit nonwhites.to their apprenticeship pro'grams.
Without these government measures, it is doubtful whether the'unions or contractors would,haire opened up their ranks to nonwhites
at all, and, even with these measures; there is .serious doubt whether
they havelaade much of an impact.- Professor Benjamin W. Wotkinson,in his exhaustive study published under the title Blacks, Unions'and the EE0C,1 cone ides that'remediation has been insignificant.Of he seventrfive*Zases of complaints brought before the EqualEmploytent Opportunity Commission mentioned in his study, agreements
were exedated.in.only eighteen. Of these, the compliance in many,
,instances was perfunctory and,did not get at the root of systematic /,
exclusion of Minorities from'iheunions.
1. (Lexington, Mass.: Lexington Books, D.C. Heath, 1973), p.;9 ..
EGi'
L185-
43
GP
h
t

Hometown Plans
--I-n-seme--inotancea, the industry and 1scz1 =acne thatselvesoffered to upgrade their commitment to -bringing minority workersinto-the trades when -- they- realized that the social climate could,no longer accept theirexelusidnist position. At the same time,.governmental pressures were making it a. bit uncomfortable forthem; when the tight money markeeis reducing private constructionto a minimum, public construction looms larger and may be the onlytype of work available. Consequently, a number of so-called home-town plans came into being to facilitate the employment and train- .ing of minority individualsInto fully qualified union-craftsmen.One of the better-known plans was the New York. Plan, set up up in1970 in anogreement between the Board of Urban Affairs (represen-ting the industry and the unions), the State of,New York,, and theCity of New York. The plan was to be funded on a-fifty-fifty basisbetween the. state and the city, minus any federal funding.
The New York Plan committed itself to a training Program for'1,000 minority_ trainees who, either because of age, education, orother reasons, did not qualifyfor the union apprenticeship program.In the first thfee years of the plan's existehce, the, Board of UrbanAffairs, which administers the training program, claimed that it hadplaced 940 trainees: 666 were currently active, 340 were upgraded,and 43 had graduated into journeymen status and attained unionmembership.
From its inception, the New York Plan was suspect. The citydelayed endorsement and pulled out of the plan completely in January1973. The plan's only financial support came from the State Depart-ment of Labor. One of the criticisms leveled against the New York --Plan was that .it was not_movinvininoritiea-intil" fhe unions fastenough.--As-granatei of the trainee programs, minorities were stilljobless until they could be affiliated with a union:, apprentices-had an advantage over the trainees for union membership. Anothercriticism wet' that: not all of the craft uniong, and especially thehigher-paying ones; were signatories to the New York Plan.:
Although e6 Board of Urban Affairs claimed that minoritymemberShip in some of the crafts ranged from 4 percent to 40 percent,an organization called Fight Back challenged these figUres and saidthat "if there is any construction site in the city where there is40 percent minority participation, then where have they got them?Where-in the hell are they?"
In'January 1973, the City of;New York withdrew from the planand imposed mandatory goals for Minority hiring,compareble to theproportion of,the population in which they are found in the city.
1'
;A-

al .
A
*.
.The federal government.istituted its mandatary goals in'December
1974. Several suits hOw in the courts are seeking to resolve thequestion whether- the industry-and-uniona,--which-have-been_tradi-franailYeintaiionigtThtemfilTytheiff-practices, can.tef to police themselves.
The New York Plan claims to be one of the better hometownplans," If so; not much can be said about the others: the.BuffaioPlan, the-New Chicago Plan, the Pittsburgh Plan, and the SeattlePlan. .
.Few Chinese in Construction Crafts
Where'do the Chinese fit into this picture? Hardly at all,andthat precisely the Point we want to make. If we turn back
-'-to Table 30, showing Major Occupktional Groups of the Chinese by,Percent, we see that,in 1970-the.percentage of Chinese engaged inthe. crafts was 5.4 percent. HoWever", if we look at Table 31 showingselected occupations iot,the'Chilieqe: in-more detail, we find a total
of only 1,767; or 4 percent of the dhinese labor fofce, in theconstruction:crafts in 1970. Of this number the state 61 Hawaiialone cliiimed.elarge proportion-7 one out of every five persons-.1n,the labor force in: that state.iiai.in the crafts. .That leaves
but a-scattered few for the entire Mainland United States.7
The scant nurlibers are quiteevidenebYthe figutes given in;Table 56,showing racial' composition often construction:unions in,.
San Franclsco=ana Table 37, showing somewhat,_ comparable data for'thq New York region.2 e 4
There is a total-of 365 Orientals in,the ten construction unions, .
in Sa*Francisco. 270 of these are in one union alone. Only 20 ere, ...f,-..,-.
', in the plumbers union in a city, where4Prientals make up about 10. %
percent of the population.- . .1.. .:.
2. Note:-that in some of our tables the term Oriental is employedand leathers Asian - Americans is used. Thetie terms are not synon-ymoils, nor do they Dive us any breakdown for the Chinese. In theabsence of, other data,r the figures .are given as indicators; The'
term Oriental generally keeps the Far 'Eastern peoples such as theChinese, Japanese, and Koreans. Asian- Americans take in the Fili-
.pinos-and Indians, -as well as. the Vietnamese, Indonesians, Malayans,.etc. 4
-187-
4
1.

o
_TABLE 56
RACIAL COMPOSITION OFTEN CONORUCTION UNIONS IN
SAN FRANCISCO, 1970'.
PO
Spanish
Unions.
Total
Whites
Blacks
Surnames
Orientals
Indians
Catpet Lincileum and
Tile Layers Union
Local 1238
Electrical Workers
Union Local 6
Elevator Constructors
Union Local 8
Glaziers UnioA
Local 718
CbC)
Iron Workers
Union Local 377
Lathers Unidn
LAbal. 65
Operating Engineers
.Unlon.LAtal 3
`, Plumbers Union'
Tgcal 2$
Sheet'
al Werkerli,'
Union Local 104\-
Tile Setters IThion
Local 19
299
284
210
430-
323
12
86
4
, 1,204
1,061
'
'
35
31
11
600
547
16
28
3
305
341
1.*
41
i5
1,162
934
196
91,2
I
,,
184
24.
540
i5
32,000
31,175
.72
454
270
29
e
2,748
2,583
.9
121
'20
S.
960
895
842'
12
'3
Source:
East/West,(De
. 23
1970) (Taken from HUD tabulation).
-188-
3

TABLE 57
UNION MEMBERSHIP IN THE BUILDING TRADES,
_BY MINORITY
Unions in Building Trade
GROUPS IN NEW YORK REGION, 1972
'
Total
Black
Sp. Surnamed
Asiln-Amer.
(100%)
No.
12.4
No.
%
5:1
No.
.%
0.1
All Bldg. Trades (317 locals)
175,934
21,839
8,925-
229
Mechanical trades
59,016
3,399
5.8
3,674
6.2
18
0.0*
Electrical Workers
30,639
2,264
7.4
2,787
9.1
30.0*
Iron Workers
11,387'
902
7.9'
751
6.6
11
0.1
Plumbers and Pipefitters
11,339
87
0.8
49
0.4
30.0*
Sheetmetal Workers
2,534
26
1.0
13
0.5
00.0
;Other Mechanical trades
^'
3,117d
120
74
2.4
0.0*
Trowel and Misc. trades
65,554
4,691
7.2
2,062
3.1
107
0.2
Asbestos Workers
499
51.0
20.4
00.0
Bricklayers
6,151
314
5.1
50.8
10.0*
Carpenters
40,658
3,002
7.4
1,5
3.7
104
0.3
Operating Engineers
13,135
748
5.7
304
2.3
20.0*
Plaster and Cement Workers
4,211
582
13.8
190
4.5
00.0
Other'Trowel & Misc. trades
900
40
4.4
70.8
00.0
Laborers, Painters, Roofers
51,364
13,749
26.8
3,189
6.2
104
0.2
Laborers
43,305
12,944
29.9
2,565
5.9
97
0.2
Painters and allied trades
6,497
604
9.3
611
9.4
70.1
Roofers
1,562
201
12.9
13
0.8
00.0
Source:
Equal Employment Opportunity Commission, News Release (July 14, 1974).
*Less than .1 percent
-189-
r. Indian
186
Ars
.53
71914
'7 22
113 2 9
46
55 1 0
258
234 6
18
X
0.7
1.4
0,2
6.3
0.1.
'0.3
0.7
0.2
0.4
0.1
0.1
0.4
0.0*
0.0
0.5
0.5
0.1
1.2

For the New York regipn, we have later figures for 1972,encompassing union membership in the building trades for 317locals. For a much-larger area-and-under a broader-definition;"AslAb=Abieeraan," there is a total oz 212v persons, or one-tenth
_ -of _l_percent,_who....are_in the construction-crafts. . Ther-e are-- -
three plumbers of Asian descent in New York.
Ready and Willing
It is quite evident that these figures say something, andthat thty say it loud and clear. Asian-Americans are definitelynot in he construction crafts. Is it because*they choose. notto go into this line of work or have they been effectively exclu-ded? The question was answered for me by David Wong, directorof the Recruitment and Training Program in Westchester, New York,watchdog for the Office of Federal Contract Compliance.
In my interview with him, he said,
Last week, I had an opening to refer a plasterer.I put one:ad in' the Chinese newspaper and made a spotannouncement over the local FM station that broadcastsonce a week on Saturdays. Thirty Chinese applicantscame to me for that job.
My territory is Westchester, but whenever I havea little time, I come down to Chinatown to volunteer,my services. I've been'with the Recruitment and Train-ing Program for about five years and Iave personallyplaced 44.Asiaa Americans in the various trades. Whenthe DeMatteis Construction Firm was awarded the Confu-cius Plaza contract3 two years ago., I mentioned to theBoard of Urban Affairs and Mr. DeMatteis that theyshould give some consideration to putting Atian Americansinto a project that is going up inour own community. '
I sent about twenty people up to the State EmploymentOffice to register'-for trainee positions, but not oneof those people were called. After the protest demon-stration, suddenly everyone looked bewildered and said,"Look,-we did not know any Asian Americana were interes-ted."
Now we come to question about qualifications andknowledge of the English language. I have found out
3. See p. 122 for reference to this case.
2 0 v
-190-

since last year that the fifteen Chinese who took thesheet metal test and steamfitters' test scored the ,
highest of all the. minorities. They_tame=in_first inmath, -first in spatial relations, and even first inEnglish._Sa_far, to_work yet._ _
If somebody tells me that they don't know whereto find qualified Asian-Americans for constructionwork, I'can supply them with 135 names to select fromnow. We have skilled carpenters, bricklayers, elec-tricians, and tilemen from the old country with manyyears of experience. They just need some training inthe building codes and methods used in this country.
Chinese Not a Minority
Minorities have a hard enough time battling the fortressof the trade unions, but in this fight, where all the ethnic 1
minorities are in the same boat, the. Chinese or Asians are leftout in the cold. The anomaly is that the minorities could notpenetrate the construction industry without government pressurein the form of Affirmative Action or Contract Compliance, yet,when machinery was sat up to aid minorities, the Asians were not
cognized- as minorities.
AccorOng to James McNamara of the Federal Office of ContractCompliance, in testimony before the Civil Rights Hearings forAsian-Americans,
\Orientals simply have not been recognized by thegovernment agencies, by the unions, or by the contrac-tors As,a group that are considered minorities and a groupthat is considered disadvantaged . . the New YorkStaee-CoMmission on Human Rights . . . does not consi-der Orientals to be entitled to that kind of specialtreatment known as a dispensation from the State lawsagainst discrimination. . . . On the federal level,we haVe had some recent experiences with the U.S., At-torney's Office in the Southern Ihstrict. . . . The
problem is, again, they do not recognize Orientals.inthe definition of minorities, at least in the two casesthat our office had some involvement in.
As a consequence of this ruling, Asians are outside of affir-mative,attion, outside of contract compliance, outside of theequal employment opportunity umbrella. They have to compete disad-,vantageously not only with whites, but also with ditbpnwhite
201-191-

minorities who are given government backing through these specialprograms.
writer was present at th'i-Civir-AikEts Committee Hearingswhen-Mr, .McNamara ls-testimony-was taken. The. chaff
Williams, sat bolt upright--; and he called for clarification fromcounsel. "Is it legislative or executive responsibility to definethe groups that are includieiathin the general heading 'minority'?"he asked. "It is judicial," he was told. In the two instances,mentioned, it was a judge's ruling,, but further questioning unco-vered the fact that interpretation of an executive order is anexecutive function, and in this instance, it was the responsibilityof the solicitor of the Department of Labor.
hen the ball bounced back into the lap of the Office ofContract Compliance, the spokesman said Asian-Americans were al-ways considered within the definition of a minority. Still puz-zled, Chairman Williamssaid, "The Federal attorneys and judgesmust have based their interpretation upon some law or executiveorder," and he called for a copy of the court order. -----,
Minority Within a Minority
Even in instances where the Asian has been recognized as aminority coming under the umbrella of affirmative action and con-tract compliance, he faces competition with other minority groupsscrambling for the limited number of slots. Again, the DeMatteiscase in the conatruction of ConfUcius Plaza in New York's China-town is an excellent example.'
Refine the awarding of any public- monies contracts in New .
York, contractors must demonstrate that they are in compliancewith minority hiring goals. When the Chinese community leadersasked for reassurances on this score at the signing of the con-tract, they were told by/the attorneys, "Don't worry, the govern-ment will make sure of that."' When -the work got undetwai,, theChinese discovered that ably four people out of a work fqrce ofseventy-one were Chinese; one was the architect, two were laborersand a third,*n office worker. When queried about.a $42 millionconstruction project going up in,Chinatown with no provision bythe contractor to utilize Chinese craftsmen, the contractor replied"We are in compliance. Our, percentage of minority employees exceedsthe recommended goals."
1.
A spokesman for the Office of Equal Employment Opportunitymaintained that the law and executive orders did not specify.propor-tionate-representation among the minorities. "We cannot break 1;,
11%
1,s
minorities up into categories, so many blacks, so many Puerto
Ricans, so many Asian-Americans, etc. When a contractor showsus that his work force is 40 percent lack and Puerto Ridan, he
has.shown us he is in compli.,--
t
True, thabsolutely noChinese crafttheir line of wocontractors, the
. chance when they
letter of t e law waafulfilled, but there wasensitivity- the feelings or position of-the
who real ze that, if they are excluded fromk right on se own front steps by the the
ions, and other minorities, they stand littleha to'compete elsewhere.
1
J
2,06
-193-

-"SDHMARY OF FINDINGS '
I. Occupations like the -bedding-andeonstruet4an erafts-hre.contfolled-Ffthe unions. ;The caatrol7is almost absolute beausethe unions_determine_the.liza and_composition of the work force,
ithe hiring and the-firng the qualifications -for entry into thecrafts, when and under what circumstances their members cah work,and to a'large extent the benefits and the wages.- This controlhas been very effective in keeping minority-groups out of theindustry.
2.- Title VII Of the Civil Rights Act has not proven tooeffective in righting these wrongs because the Equal EmploymentOpportunity Commission could only conciliate complaints and didnot have enforcement powers until 1972.
3. 'Federal Contract' Compliance was also impotent until itwas strengthened by the stipulatiOn of preaward compliance byunions and contractors.
4. Hometown plans, whereby the industry and unions offeredto police themselves, have not been too successful'and are beingterminated in favor'of, mandatory goals.
. I
5. If the blacks and numerically larger nonwhite minoritieshave had a tough time-breaking into the industry,. the Chinese arehaving a worse time of it. In fact, they are conspicuously absentfrom the craft occupations.
6. Rationalizations that the Chinese do not:want to gointothe crafts or that hey are unqualified are simply not true. Theyare willing,, able, and eager to enter the construction crafts ifthey can batter down the exclusidnist,walls of the industry andunions.
7. In instances where minorities are being helped to scalethe barriers put up by 'the unions and construction industry by suchgovernment programs as Affirmative Action, Equal Employment Oppor-tunity, and conlract Compliance, the Chinese are considered autsidethe purview of these aids because they are not considereda minority.There is no clear-cut interpretation and determination.
8. Even where they are recognized as a'minority, the Chineseare edged out by the more vocal, activist, and numerically strongerminorities.
204-194-

RECOMMENDATIONS -
It-Was-onLy-adetade-igo (in the 1960s) that many union struck
froth their constitutions clausal tIlat read like-the followin : "No -'
personsarll become a member of the BLE (Brotherhood of-LociiEngineers> unless he is a white man"; or "An applicant for m ber-ship must be white born, of good moral character, sober and ndus-trious:"
Toopen up as area of employmenewhere the labor unions areso firmly entrenched and where their traditional and espoused policyagainst the.celored races are so deeply imbedded is not going to bean easy task. Using as an example, the building and constructi nin4ustry,where Asian-Americans have had some experience in tryingto penetrate the union barriers, we realize that the results hivenot been too significant, even though EEOC; Federal Contract Compli-.ance, and the Hometown Plans had applied some leverage to the effort.
If we look'back at Tables 56 and 57 in-this chapter, showingeither minority representation or Asian-American membership in thebuilding and construction unions, we will see that the situationhas improved but a wee bit. According to Professor BenjaminWolkinson, who conducted a thorough study of the black experience 'in unions, labor union cases litigated by the EEOC exceed thOseof all employment discrimination cases by four and a half times."
From this observer's viewpoint; it seemq that there are twoerroneous approaches in the efforts of government, contractors',and everyone involved to increase minority representation in thebuilding and construction industry:
1. Using old*methods to fit new conditions; in other words,trying to push minorities into union-established channels fortraining, apprenticeship, union membership, and job referrals.The results have not been encouraging. It is simply, futile andunrealistic to think that the "haves" in terms of union membershipare going to voluntarily relinquish their privileges and peroga-tives without strong resistance.
2. Concentrating too,much on the trainee aspect withoutproviding.for employment opportunities at the end of the trainingperiod. The trainee period isa long one. It is also a parallelpne tothe,apprenticeship programs., If the trainees are subordi-nated to the apprentices in job preference, trainees will be dis-
.
- 4. Wolkinson, Op. cit., p. 132.

coutaged from entering or completing their training. if thetrainees see no hope at the end,of their period of traininglthe-training-pr I .
The-bottleneck-and stopper are the union hiring halls, wherethe membership holds the keys to job referrals. If the hiringhalls continue to resist integration or dole out*nfew token slotsto minorities, this is where the logjam is; this is where the gov-ernment must direct its efforts to.increase the flow.
Sinde management or the contractors have long relinquishedtheir right of hiring to the unions, they may just as well relin-quish it to a third pary who will try earnestly to open up theindustry to workers without regard to skin color.
Bypass the Union
My recommendation is to bypass the union's exclusionist ap-prenticeship program and.bypasS the union hiring halls in jobreferrals and placement. Here is how the scheme'would work:Since contractors must pledge to aim toward a goal of minority'representation in their work force prior to contract Award, theycould just as well allocate these job slots to an outfit like theRecruitment and Training Program now under contract to the Officeof Contract Compliance. This program is run by a private outfitthat has had an outstanding record of providing supportive ser-vices to enable minorities to seek and hold jobs:in the Construc-tion industry. RTP could be entrustfta also with the actual place-ment in jobs of minority workers who have finished training, thosealready qualified by virtue of holding diplomas from vocationalschools, by virtue of being licensed, or,by virtue of long yearsof experience in the trade; The essential criteria are to provethat the worker is qualified.
The RTP as it is presently set up merely warms up the minor-.ity applicants in anticipation of getting into the game." It seeksout and prepares applicants to take the exams given by the unions;it helps the applicant obtain necessary papers and documents suchas birth certificates, high school diplomas, and citizenship papers;it helps minority members register at the state employment office.But the criteria and procedures are still union-established andunion - controlled. As a result, large numbernf-the beneficiariesof RTP efforts are still sitting on the bench in the dugout, waitingto be called.
After recruiting and ascertaining that the applicants arequalified, the RTP should be empowered to place the minority workers
20-196-

4
into slots set asides them. Its task would be notheyfrom that of the union hiring halls, except that they would be
--__motivated toward-getting minority representation into an industry_ _
that has traditionally been lily-white..__-.-7---------r-*N
For the,Chinesep who.are neither here nor there--not partof the majority, but not 4adjudged a minority by some political,jurisdictions--there must be some, recognition that all minoritiesare not alike, although all minorities are disadvantaged by racialdiscrimination. There is special need in'the Chinese communitiesat present because of the unprecedented increase in the Chinese-American population within the last few years. Part of the reason,foi this sudden spurt is the removal of highly discriminatory immi-gration'legislatiOn directed specifically against thcChinese.
The Chinese experience is different from that of other ethnicgroups. Many immigrants were skilled craftsmen before they cametb the United States. They are looking for jobs in their line ofwork. They are hard4-working and reliable. In other words, theyare qualified, willing, and able. They should not be denied thechance to break, into the tide.
From a number of people in Chinatown working in the manpowerarea, I solicited suggestions on how to facilitate the entry ofChinese-Americans into the crafts. The opinion seems to be thatthe Chinese are unfamiliar with how to go about getting into theindustry and that they need a little more "handholding" at thispoint.
The Chinese are somewhat conditioned by their cultural back--ground to be reticient and noncompetitive. In China, humility is,
considered a virtue. Iu this country, such- .character traits are
viewed as weaknesses and are decided drawbacks if today's contem-poraries are to be in the vanguard for penetrating the union strong-holds. Consequently, I would recommend that branch Recruitment andTraining Programs be established in the Chinatowns of New York andSan Francisco to serve the, Asian populations of the Ebst and WestCoasts: Proposals for such Chinatown-based programs have begnsubmitted to the Department of Labor for three consecutive yearsand were turned down each time. As mentioned previously, handhold-ing is vitally necessary for the initial thrust. I am sure thatonce.the Chinese gain entry into the crafts they will be able tohold their own by their performance. Their record will be theirown best advertisement.
Maintain Standards
Minority workers must never permit themselves to lower the
20i-197-

.
(7)
standards of job performance. To do.so would be.self-defeating.No one should be able to point a finger at the minority craftsmenand call them inferior or not up to par. I.would not want myapartment house or office building to go up with shoddy workmanship. -I would not like to pay extra for inefficiency in the constructionof public works through heavier taxes. Nor should any.employerbe compelled to-accept unproductive workers.
Minority workers must be judged by their performance. Theyshould be given no dispensation,for poor skills or bad, work habits.I am not recommending that minority workers be hired-merely becausethey are black or of Spanish origin or Asian or Chinese. What I"am saying here is that there are qualified minority workers whocannot enter the crafts because of racial discrimination. Thisis clearly evident when'Chinese applicants scored highest in ma0i',,highest in spatial relations, and even highest in English, butwere never called. This evidence is reinforced when a metropolislike New York City, with a population of.close to 10 million,counted only 229 Asian craftsmen in its union locals in 1972.
206.
-198-
A
tor
CHAPTER IX
INCOME
The:coficept of incame,is not the same with all people. In
the modern business world, there are standardized bookkeeping andaccounting procedures which tend to give some measure of uniformity,but a dollars-and-cents figure does not always mean the same.
I remember my father's very simple bookkeeping method. He 7operated,a hand laundry,- doing all the washing and ironing himself.We had a monstrous cash register on which he rang up all receipts.From the cash register, he paid all bills in cash. Our home was
above the laundry, so whenever we needed money for groceries,'clothing, or household needs, my father took money' from the regis-
ter. At the end of the week, he counted whatwas left in the cashregister drawer, minus a fixed sum that he had put into the regis-
ter for change at the beginning. This amount, to him, was hisweekly income, and he put_the,amount down in a little spiral note-
,book.
What a savings he effected in keeping records!, His,earningswere what he had left at the end of the week.
Eat You, Sleep You
My father employed a helper in the laundry. This person slept.
in our house and ate at our table. He was paid a net sum_at the
end of the week. That was his income. In China, most businessesor firms hired workers on this basis.' Room and board were providedby the employer gratis./ Wages were cash payments in addition to
room and board. This is what foreign firms in Chinese cities cameto know as !'Eat you, sleep you." When they negotiate to hire localhelp, food and lodging are expected as part of the job, but are not
part of the wages.
When the Chinese work for their own countrymen in the United
2Q{
-199-

.
States,.the same conditions apply. .If a chef in a Chinese restaurantis hired%at $600 a month, he'expects,$600 net in his pay envelope.Income-taxes, Social Security deductions, medical insurance have allbeen taken care of by the employer. Employers generally have livingquarters for their help should the help choose to live there. Thesequarters are like dorms with beds, but they are a place to sleep.Meals are served bathe business establishment.
When workers, enticed by the prospe9t of higher wages ventureoutside the Chinese fold, they are often very much suprised that_food and lodging must come out of their own pockets. They may not'realize how expensive these two items are and how burdensome it isto find a place to live andto prepare one's own meals.
Evei when room and board are not part of the deal, incometaxes and Social Security taxes are. In questioning over twentyemployees who work in the restaurants and groceFy stores in China-town, I found that everyone's taxes and Social Security deductionswere assumed by the employer. Chinese employees think in termsof the dollars and cents in thein pay envelopes. Employers takeinto account the fact that they are responsible for all'the extraitems that increase the cost of hiring help. Therefore, wage andsalary, when working for one's own countryman,'is not comparableto the amount when working for a non-Chinese employer. And theseare considerations to take into account when interpreting incomefigures for the Chinese.,
Don't Take Income Figures at Their Face 1V'a].ue
Income Is one of the least reliable characteristics reportedby the U.S.,census,.yet it is considered one of the best measuresof economic well-being because it is closely related to educationalattainment, occupation, ptandard.of living, and other characteris-tics. 'According tothe Census Bureau, the rate of nonresponse tothe question on income ren about 10.6ercent in 196tOzaa is nowconsiderably higher.' People often regard this ques ion as aninvasion of privacy. Even when it is answered, the reporting of'income cannot be too accurate for many reasons. People generallydo not consult their records when they answer the questions onincome. They give approximations based on.memory, and it is easyto forget minor or irregular sources of income. If,they get apromotion and raise in salary, they may have forgotten that their"
1. U.S. DepartmeLwf Commerce, The Methods and Materials ofDemography, vol. (1971), p. 365.
.42 0
-200-
pay for the first part of the yearwas-less.,
Some show-offs like to bolster their egos by thinking of
themselves as $20,000- or $50,000-a-year individuals. Othersunderreport because they underreported on their income tax returns.Some workers receive payment in kind, not cash. A farm family may
be much better of than a city family withthe same cash receipts.Wage levels may be lower in certain regions with a correspondinglower cost of living. Income may be the best measure of economicwell-being, but dollars and cents are not. 'Income figures must,therefore, be interpreted with these factors in mind.
Nor is income just wages or salary or proceeds from self-
employment. If one is fortunate enough to have a rich aunt or grand-,
parents, one may not have to exert any effort at all to have a
substantial income. If one spends freely, and another puts his
savings in a bank to earn interesi,'the'latter will have a sideincome. A former neighbor of tours earned very, little as a subway
token seller, but he lived with is mother -in -law, who had bought
het home at a total price of $4,000. The.bome was paid off and"
the taxes were minimal. A similar home today would cost $30,000
with a higher assessment base for real estate taxes. Consequently,
he bad a decided financial advantage over-our family, even though .we earned more. '
For many Chinese, these side benefits are few; if any. WeChinese were not permitted to put down roots is the United States,because we were not permitted to enter the country except undersevere limitations. We were not permitted to buy real.estate inmany Western states at preinflation prices because of-the AlienLand Acts. Recent immigrants left behind most of their worldlypossessions to start life anew in this country. Eviry single
item they need must be purchased now at current inflated prices.In other words, more of the income of Chinese families must bespent for the basic things that others who have lived longer inthe United States may. have already-accumulated. This means that
the. hinese are at a disadvantage in the use of their income.Income, therefore,.is relative not only to time'ind place and incoiparison to others,, but also according to circumstancesp.candi-
tions, and history.
Family Income
With;;these factors in mind, we can now look at the incomefigures presented by'the 1970 census pertaining to the Chinese..Most economistsfor demographers consider thel'amily as an economic
unit and pool the income of-all the family members.,
\rd
\ r 211 A
-201-
3
cz,

to
1 i l
Family Income
TABLE 58'
FAMILY INCOME OF THE CHINESE IN THE
TOTALAND FIVE-SELECTED STATES, 1969
U. S.
No.
c-
Calif.
No.
%
N. Y.
No.
Hawaii
No.
Illinois
Maa
s.No.
All Families
Less than $1,000
,
$1,000
-$1,999
$2400
-$2,999
$31500
-$3,999
$4,000 .". $4,999
$5,000
-$5,-999
$6,900
-$6,999
$7,000
-$74999
\$8,000'1-48,999
$9 ' 000
-$9;-9
$10;000
-$11,9
$121'000.- $14,999
$15,000
-$24,999
$25,000 or 'more
----
.
Medign. Inc.:isle
Mean Income
-..
94,931
100.0
2,378
2.5
2,449
2..6
3,021
3.2
4,037
14.3
4,737
5.0
'5,393
5.7
5,543
5.8
5,638
5.9
5,413
5.7
5,494
5.8
11,028
11.6
12,841
13.5
'20,361
'21.4
6,.598
,7.0
:r.
-'--
,
$10,610'"--)-:
$12,210
-...
.
37,437
'857
"1,011
1,294
1,343
1,523
,1,912
'2,142
-2,012
.1,994
'2,221
4,83p
5,572
8,215
2,311
$10,915
$12,188 Nk
100.0
8,546
2.3
535
2.7
626 .
3.5
695
4.1
999
.4.1
1,514
5.1
1,539
5.7
1,506
.5.4
1,437
5.3
1,335
5.9
1,145
12.9
1,892
14.9
1,848
21.9
2,722
6.2
753
$8,316
$10,028
100.0 12,304
2.9
175
-3":4
188
3.7
230
5.4
239
8.2
330
8.3
421
8.1
428
7.7
496
7.2
548
6.2
510
10.2
1,263
10.0
1,823
14.7
3,916
4.1
1,737
$14,179
$15,936
100.0
2,920
1.4
88
-77
LA
52
1.9
-155
2.7
141
3.4
172
3.5'
,123
4.0
155
4.5
180
4.1
''174
10.3
-371
14.8.
513
31.8
567
_r4.1
152
$10,771
'$11;754
Source:
U. S. Census Bureau.
ect
Based on a 20 percent sampling.
-202-
3.
2.6
1.8
5.3
4.8
5.9
4:2-,
5.3
6.2
6.0
12.7
17.6
19.4
5.2
No.
2,920
86
-6,2
-9r
192
100.0
2.9
2.3
3.1
:6
235
8.'
177
6.1
176
6.0
--Z76
9.5
181
6.2
195
6.7
325'
11.1
315
10.8
493
16.9,
111
3.8
$8,884
$10,475

TABLE 59-
COMPARISON BETWEEN AVERAGEINCOME OF THE-CHINESE-AND THE.
NATIONAL ANp STATE AVERAGES, 169
Family Income--
Median
Mean
United - States
..
'Chinese in the United States
$ 9,590
10,610
$10499
12,210
California
..,1
10,732
12,227
Chinese in California
i10,915
12,188
New York
10,617
12,491
Chinese in New York
8,316
10,028
Hawaii
11,554
'
13,077
Chinese in Hawaii
14,179
15,93'6
Illinois
10,959
12,338
Chinese in Illinois
.1
-10,771.
11,754
Massachusetts
10,83'
12,283-:
Chinese in Massachusetts ---------
.8,884
'10,475
__Source:
U. S: Census BUreau, Chinese: Subject Report, PC(2)1G (1970),
Table 24; U.S. and States: Subject Report', PC(1)C1 (1970), Table 178.
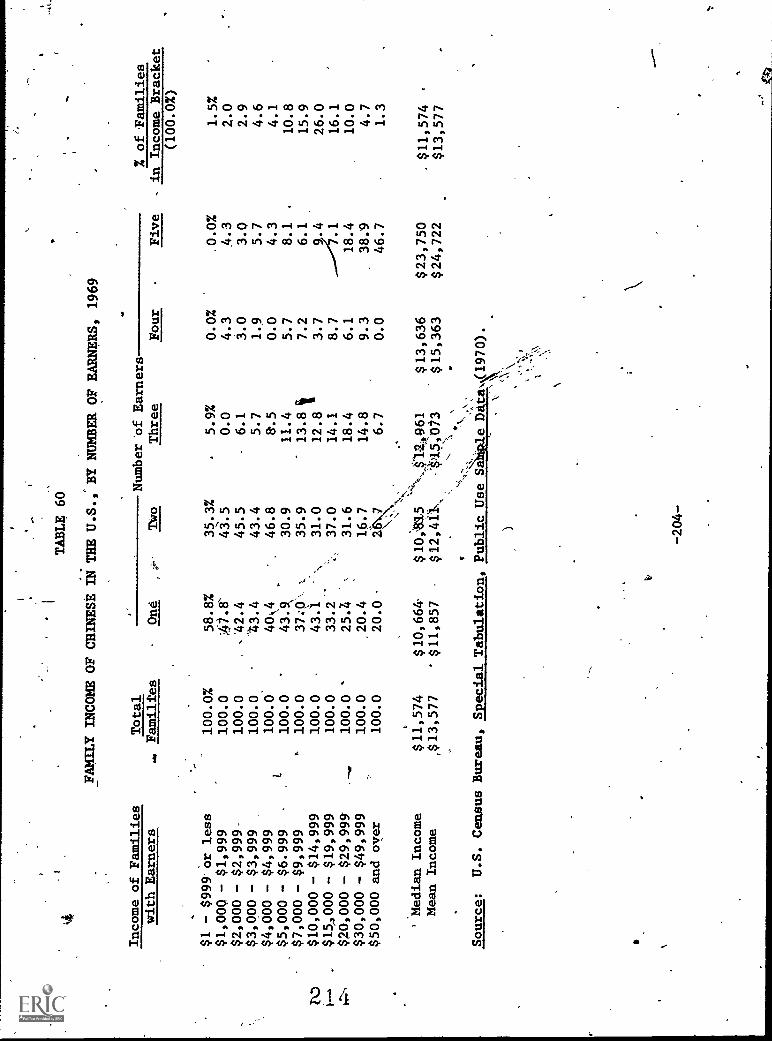
TABLE 60
FAMILY INCOME OF CHINESE IN THE U.S.,'BY NUMBER OF EARNERS, 1969
Income of Families
Total
Number of Earners
Three
One
TWo
Four
with Earners
Families
$1 - $999 or less
100.0%
58.8%
35.3%
5.9%
0.0%
$1,00Q - $1,999
100.0
42.8
43.5
0.0
4.3
$2,000 - $2,999
100.0
,42.4
45.5
6.1
3.0
$3,000 - $3,999
100.0
'43.4
43.4
5.7
1.9
$4,000 - $4,999
100.0
4044
46.8
8'.5
0.0
$5,000 - $6.999
100.0
43.9
30.9
11.4
5.7
$7,000 - $9,999
'100.0
37:0,
,..
35.9
13.8 t
7.2
FU
$10,000 - $14,999
100.0
43.1
'.
31.0
12.8
3.7
-..-.
$15,000 - $19,999
100.0
33.2
37.0
14.1
8.7
4:=..,
$20,000 - $29,999
100.0
'25.Z
31.6
18.4
6.1
$30,000 - $49,999
100.0
20.4
1647
14.8
9.3
$50,000 and over
100.0
20.0
26\7
6.7
0.0
.,
' Median Income
$11,574
$10,664
$10;81.5
, \,,,$1.2061
$13,636
Mean Income
,$13,577
$11,857
$12,411.
$45073
$15,363
g.,,\,
Source:
U.S. Census Bureau, Special Tabulation, Public Use Sa p1e Datam(1970).
\ 'N
).'\ '';'
'"
-204-
% of Families
Five
, in Income Bracket
(100.0%)
0.0%
1.5%
4.3
2.0
3.0
2.9
5.7
4.6
4.3
4.1
8.1
.10.8
6.1
15.9
9.4
26.0
--.4.1
16.1
18.4
10.0
38.9
4.7
46.7
1.3
$23,750
,$11,574
$24,722
$13,577

Table 58 shows family income of the Chinese in the United
Stated and five selected states. There seems to be wide disparityin family income from state to state. California, with its largerChinese population, approximates the national pattern of incomedistribution--about 5 percent for eadh.81,000 aggregate, exceptat the lower and higher extremities. The Chinese in New York arenoticeably poorer, and those in Hawaii, significantly better off.
There is a close relationship between incone'and length ofstay in this country. The old-timers are;doing well and the recent
arrivals are having a hard time. The Chinese in New York are faringthe worst. Their median income is close to $6,000 below that ofChinese in Hawaii. That is a very big gap. The 'Chineie in Massa-
chusetts are only a little better off. Ohviously-, the eastern states,
with the more recent influx of immigrants; have a significantly lowerincome. In the two eastern states New York and Massachusetts--the Chinese are predominantly service workers and operatives; therate of illiteracy is high, but so is the proportion of college gradu-ates. (See Tables 21 and 27.) The main causal factor in the much
lower income geems to be the recentness o arrival in this country.
How does the average Chinese family intone compare with the'U.S. and state averages? Table 59 gives a comparison. In theUnited States and in the states of California and Hawaii, the Chinesemedian, as well as theomean, income-is higher. In New York, Illinois,
and Massachusetts, the figures are lower.I
The mean is higher than the median ia every instance, whichindicates that the Chinese in the upper - income half have a substan-tially higher income to pull up the average. And the Chinese inHawaii have pulled up the U.S. family income of the Chinese. Atten-tion to regional or state differences must, therefore, be consideredin any social or economic planning.
Multi-earnersr ,
401
Since the average income of the Chinese family exceeds in manyinstances that for the people of the nation and some states, can itbe surmised that the Chinese are well paid and well off? On thesurface, it may appear that way' until we- tike a look at the numberof earners in the Chinese families. eI had not given this mattermuch thought until I read a term paper:m.1u mitted by one of my stu-
'dents on the lifestyle of a Chinese f . The'family consisted
of parents and six offspring. It,seemed'as if their eating andsleeping habits were very irregular betause someone was invariablygoing to work or coming home. The father and two older childrenhad full-time jobs; two other younger girls who were still in
2.1
-205-

TABLE 61
COMPARISON OF PERSONAL AND FAMILY INCOME O
THE CHINESE IN THE U.S., 1969
Income
Total Persons or Families
$1 - $999 or less
$1,000 7- $1,999;:
$2,000 - $2,999
'$3,000 - $3,999
$4,000 - $4,999
.$5,000 - $5,999
$6,000 - $6,999.
-$7,000 - $7,999
I\D
.$8,000.- $8,999
F--'
$9,ocio - $9,999
Li
$10,000 - $14,9 9
$15,000 or more
Median Income
Mean Income
4.
Less than $5,000
$5,000 - $10,000
$10,000 - $15,000
$15,000 or more
Male
No.
Personal
16+_%
Income Female
164:
No.
Y.
Family IncOme
No.
146,969
.100.0
1r0099
17,286
12,707
12,332 0,
11,216
9,619
8,821
8,215
7,491
6,247
21,419,
13,817'
$5,223
$6,877
'
71,340
40,393
21,419
13,817
12.1
11.8
8.7
8.4
7:6
6.5'
6.0
5.6
5.1
xri6.3
14.6
9.4
48.5
27.5 .
14.6
9.4
a
95,332
100.0
23,744
16,209,
11,237
10,304
8154
7: 57
5,216
3,748
2,933
1,687
3,478
1065
$2,686-
$3,512
70,148
20,641
3,478
24.9
17.0
11.8
10.8
9.1
7.4
5.5
4.0
3.1
1.8
3.6
1.1
73.6
21.7
1.1
Source:
U. S. Census Bureau, Subject Report,ApC(2)1d (1970), Tables 19, 24.
-206-
.-
-
,
94,931
'2,378
2,449
3,021
4,037
4,737
5,393
5,543
5,638
5,413
5,494
23,869
6,979
$10,610
$12,210
16,622
27,481
23,869
26,979
100.0
2.5
2.6
3.2
4.3
5.0
5.7
5.8
5.9
5.7
5.8
25.1
28.4
.17.5
28.9
25.1
28.4

school had part-time jobs, but their hours were rather long. Theyworked in a supermarket at night, stacking the shelves. The motherwas continually sending off one of her brood to school or to work.But five paychecks tere'coming into that family -- dutifully handed
to the mother every Friday.,
The fact that half of the Chinese females 16 years and overare in the labor force is a telling clue that the family incomefor, the Chinese comes from more than one source. The number ofearners in:Chinese families is given in Table CO. In the.$10,000to $14,999 bracket, just a bid over two out of five (43.1 percent)attained this familyincome one earner. ,61 percent had twoearners, and as much as 9.4 percent'of the farkilies with this in-come had five earners. Obviouily, then', the additional personsputting into the family "kitty" w11 rais4-the total amount, but,when viewed in light of manpower expended and remuneration per.unit of .labor, the pidture does not look as rosy.
The higher mean family income may come from the_16.1.percentof families with.$15,000 to $19,999 and even the 10.0'percent with$20,000 to $29,999, but in these higher income brackets, the incre7ment invariably cones from a larger number ofeainera, rather thanfrom increases iaindividual pay.
Per Capita Income f.
This fact is apparent when personal incomeis c9mpare4 withfamily income. These figures are presented in Table 61. Personalincome is that amount received per individual 16 years and over.When one examines this table, the seeming affluence ofthe Ghineeefades. Only one-fourth of the Chinese males earned over $10,000,and less than 5 percent of the females did. If family membersdid not pool their incomes, the Chinese would be in a sorry eco-nomic shape.
Are the Chinese Poor?
In 1970, for the first time in U.S. census history, a newconcept or,eonomic characteristic was introduced into the census.It was the.7.poverty level, index. "The index provides a range ofpoverty income cutoffs adjusted by such factors as family size,sex of the family head, number of children under 18 years old, andfarm and non-farm ,residence."2
2. U.S. Census Bureau, "General Social and Economic Characteristics,"U.S. Summary (1970), Appendix 30.

TABLE 62,
CHINESE PERSONS AND FAMILIES.WITH INCOME LESS THAN POVERTY LEVEL,
TOTAL U.S. AND FIVE SELECTED STATES, 1970
,IncomeLess Than Poverty Level
U.S.
Calif.
N.Y.
Hawaii
111.
Mass.
Families
9,753
.3,694
2,560
676
301
371
Percent all Faz1s
10.3
.9.9
13.8
5.5
10.3
12.7
Mean Size of Families
3.98
'
4.03
.4.03
3.89,,
3.75
4.45
Mean Income Deficit
$459,6
$1,645
'
$1,506
$1,551
$1,533
$1,698
With Related Children Under 18
"19302
2,344
1,716
397
i152
-
284
Families With. Female Heads
,1,290
559 '
174
209
'^
19
42
Unrelated Individuals 14 Yrs. +
17,867
6;983
3,344
958
*,625
578
'
Percent Unrelated Indiv. 14 Yrs +
40.3
40.3
36.5
37.7
38:8
37.3
N' Mean Income Deficit
$1;1174
$1,157.
$1,142
$1,038
$1,181
$1;136
1......
Percent 65 Yrs. +
24.1
21.0
39.6
18.7
24.4
.....)
..,
,x
,
,37.4
Persons Involved
55,748
21,668
13,188
3,566
1,718
2,150
Percent of all Persons
13.3
13.0
16.3
6.9
12.9
t 16.1
Percent 65 Yrs. +
13.4
13.1,
16.4
18.9
12.7
9.1
Source:
U.S. Census Bureau, Subject Report, PC(2)1G (1970), Table 24.
NOTE:
Based on a 20 percent sampling.

In 1969, the poverty thresholds ranged from approximately
$1,500 tq $6,000. The average poverty threshold for a nonfarm
family-of four headed by a male was $3,745. The thresholds are
computed on a national basis only and are not adjusted for localor state variations in the cost of living.
Table 62'shows the number of Chinese families with income less
than poverty level. 9,753 families fall into this category, and
the table gives a further breakdown by states. New York has a
higher percentage of poverty -level families, with 13.8 percent,compared to a Chinese national average of 10.3 percent. This
proportion is just about the same as for'the U.S. poverty levelfor whites (10.2 percent), but substantially below that for black
families(29.9 percent). Again, the ttader is reminded that Chinese
families have multi-earners. There is a good deal of moonlighting(working at two jobs) and long hours so that the income figures
are not exactly comparable.
Pay Goes Up with Age
There is a definite correlation between income and age, except
for those beyond age 65. The reason is apparent, and follows the
normal course of events. The only remarkable factor about thepay-age correlation is the long period it takes for the Chinese to
get started. By age 20 to 24, over three-quarters of the Chinesemales earn less thgi $4,000,and it is not until the 25 to 34 age
category, that the males begin to move into the higher income brac-.
kets. Thisis explained in large part by the fact that the Chinese
are still going for their graduate degrees, and whatever earnings
they make come from school-related or part-time'work.
The 40.6 percent of male teenagers 16 to 19 years old who have
no income (see Table 63) is a current and potentially explosive
troublespot. Young fellows at this age need initiation into the
work world. Their demands are also great, fueled and increased
by the long hours spent front of televison. Teenagers should
have more access to paying jobs, which would give them some senseof personal worth and would reduce their time, watching the "boob
tube" or hanging out with the gang. Teenage gangs and their vio-
-) lent behavior in San Francisco and New York's Chinatown are now
headline producers. The old adage still holds, "Idle hands are
the devil's workshop."
Pay for Chinese females increases with age at a much slower
pace than for males. The median pay is apptoximately one4alfthat of the males for all age brackets except the teens. At the
height of their earning power (age 35 to 44) only 7.5 percent take
(41
-209-

TABLE 63
PERSONAL INCOME OF THE CHINESE IN THEU.S., BY AGE GROUP AND SEX, 1969
Am
/fetal L6 yrEvi+
16-19
20-24
25-34
-
35-44
45-64
M-77-77-if
'65+
No: i
% '
No.
%No.
No.
No.
%'
No.
.Male 16 Years +
163,853
18,757
22,996
33,575
31,082
42,239
15,244
Without Income*
16,924
10.3
7,610
40.6
4,303
18.7
1,947
5.8
645
2.1
1,510
3.6
909
6.0
With Income**
.146,9'69,100.0
11,147
100.0 18,693
100.0
31,628
100.0
30,437
100.0
40,729
100.0
14,335
100.0
Under $2000 or ross
35,085
23.9
9,029
81.0
9,416
50.4
3,335
10.5
1,722
5.7
4,158
10.2
7,425
51.8
.$2,000 - $3,999
25,039
17.0
1,586
14.2 -5,266
28.2
5,347
16.9
3,143
10.3
6,068
14.9
3,647
25.4
$4,000 - $5,999
20,835
14.2
333
3.0
2,034
10.9
5,220
17.0
4,702
15.5
7,207
17.7
1,337
9.3
$6,000 -47,599_
_'
17,036_ 11.6
147
1.3
1,104
5.9
4,631
14.6
4,343
14.3
6,114
15.0
697
4.9
$8,000 - $9,999
13,738
9.4
21
0.2
569
3.0
4,175
13.2
3,934
12,9
4,657
11.4
382
2.7
$10,000 - $14,999
21,419
14,.6
18
0.2
259
1.4
6,439
20.4
7,450
24:5
6,791
16.7
462
3.2
$15,000 or.more
13,817
9.4
11
0.1
45
0.2
2,481
7.8
5,161
17.0
5,734
14.1
385
2.7
Median Income
$5,223
$916
'
'$1;985
$6,887
$8,643
$6,904
$1,943
Z-N
DMean Income
$6,877
$1,277
$2,650
$7,4
58$9,951
$8,842
$3,348
4i,
FeMale 16 Years +
1454012
17,099
22,888
32,4114
28,194
32,808
11,612
Without Income* "
49,680
34.3
7,627
44.6
5,935
25.9
12,09
39.0
10,146
36.0
10,692
32.6
2,641
22.7
With Income**
95,332 100.0
9,472
100.0 16,953
100.0
19,772
100.0
18,048
100.0
22,116
100.0
8,971
100.0
Under $2,000 or loss
39,953
41.9
7,891
83.3
8,900
53.0
5,383
27.2
4,513
25,0
6,556
29.6
6,710
74.8
$2,000 - $3,999
21,541
22.6,
1,227
13.0
3,908
23.1
4,315
21.8
4,541
25.2
6,192
28.0
1,358
15.1
$4,000 - $5,999
15,711
16.5
262
2.8
2,781
16.4
3,994
20.2
3,984
22.1
4,296
19.4
394
4.4
$6,000 - $7,999
8,964
9.4
46
0.5
1,081
6.4
3,130
15.8
2,402
13.3
2,120
'9.6
185
2.1
$8,000 - $9,999
4,620
4.9
50.1
174
1.0
1,727
8.7
1,253
. 7.0
1,345
6.1
116
1.3
$10,000 - $14,999
3,478
3.7
29
0.3
86
1.0
1,043
5.3
1,080
6.0
1,121
5.1
119
1.3
$15,000 or more
1,065
1.1
12
0.1
23
0.1
180
1.0
275
1.5
486
2.2
89
1.0
7Median Income
$2,686
$856
$1,889
$4,090
$3,988
$3,464
$1,188
Mean Income
$3,512
$1,154
$2,486
$4,472
$4,493
$4
94
$1,918
1
Source:
U.S. Census Bureau, SubjectReport, PC(2)1G (1970), Table 21.
*Percentage based on all persons 16years and over.
**Percentage based onpersons with income.
-210-

in over $10,00 annually.
Income by Occupation
What does a Chinese doctor earn? An engineer? A garment
worker? A service worker in the food industry? Table 64 givesmedian earnings by selected occupations. Why is it that Chinesephysicians' or dentists' earnings average out to between $14,000and $15,000? This is considerably below a doctogr's earning capac-ity. 1 could venture a conjecture that many have not fUlfilledthe licensing or citizenship requirements and are earning a smallpittance in a hospital as a resident physician, whereas the estab-lished M.D.'s may be doing quite well.
Cheaarhinese Labor7rAm,,
A strong Argument used to push through the Chinese ExclusionAct and its extensions time and again was that the Chinese werecheap labor willing to accept lowerrwages, which undermined theAMerican standard of living. I assure you that no one wants toaccept lower wages if he can get more, but employers and the labor-market must rid themselves of the notion that Chinese manpowercan be obtained at less than the going rate.
When I was working in the public library, a reader came overto my desk one evening and told me how much he enjoyed reading mybook, Mountain of Gold,'
"I am a great admirer of the Chinese people," he gushed. "They'
are hard working and reliable. My business'is film processing. I
develop movie and documentary films, and I would like to hire someChinese. Cali. you recommend someone ? "'
I felt a momentary surge of pride from the man's comments andoffered to'contact an acquaintance who handles job, referrals at the
China Institute,
"I need two people at least," continued the prospective employ-er. "I will train one man to process film,. and I would like anotherperson for stock control." The:JAB sounded rather interesting, andthe year was 1969, when jobs were not too plentiful.
China Institute responded to my call immediately and dispatcheda recent graduate in engineering, for the film processing job and an :
education major for the stock control job. Two weeks later, I saw
' the prospective employer in the library again. Curious about the
221-211-

TABLE -64
AVERAGE EARNINGS OF EMPLOYED CHINESE WHO WORKED 50-52WEEKS IN 1969) BY SELECTED(OCCUPATIONS AND SEX
Occupations
Median
Professional and Technical
Architects
Computer Specialists
Engineers
Lawyers and Judges
Librarians, Archivists & Curators
Mathematical Specialists
Life ,nd.Physical Sciehtists
Physicians, Dentibts & Related Practitioners
Health Workers ext. Practitioners
Social Scientists
.Teachers, College & University
Teachers,Elementary & Secondary
Technicians
Writers, Artists, & Entertainers
Research Workers
Other Professionals
$11,049
11,000
10,600
13,062
13,000
8,500
13,000
134,10
100
s;000
.15,000
10,750
4,800
8,Q00
10,000
6,000
4,777
Managers and Administrators
8,450
Salaried - Manufacturing
25,000
Trade
7,750
Service Industries
11,000
Others
12,000
Self-Employed
-- Manufacturing
6,000
'Trade
7,833
Service Industries
6,600
Others
5,000
Sales Workers
6,714
Insurance Agents and Brokers
10,000
Stock and Bond Salesmen
,)
25,000
'Sales Clerk, Retail Trade
4,666
Other Sales Workers
7,250
-212 -.
Earnings---
Mean
-Female Earnings-
Median
-Mean
$11,445
11,167
12,313
13,541
12,-600
$6,076
6400
9,000
9,000
$6,591,
6,625
7,688
7,000
13,900
7,000
7,060
13,000
17,500-
17,500
13,075
9,500
7,500
14,719
15,000
15,750
7,600
9,000
7,900
14;500
5,000
:3,250
10,597
2,500
5,429
7,105
6,500
.6,530
7,986.
4,000
3,667
11,275
4,000
4,417
6,000
arum
..
7,732
5,000
'5,917
9,901
6,375
7,093
23,125
8,913
6,000
6400
18,900
8,000
'7,333
11,591
8,500
13,667
6.667
5,750
6,545
8,607
6,000
5,300
7,417
6,000
6,000
. 8,409
2,533
3,314
10,250
11,000'
7,500
22,500
4,815
2,363
2,980
8,786
3,000'
3,313
(continued)

TABLE 64-- continued
Occuzationd
----Male Earnings=
Median
---Female Earnings
Median
-Mean
-Mean
Clerical and Kindred Workers
$5,529
6,666
7,666
3,000
5,000.
5,500
4,923
9,937
9,666
8,333
9,500
7,000
9,363
5,562
81,250
2,125'
5,600
5,857
8,000
3,500
3,500
3,500
8,000
4,555
3,666.
4,516
7,000
7,000
'8,000
5,0110
$6,084
8,200
7,300
3,000
5,667
5,200
5,978
9,137
8,981
9,583
9,611
7,000
9,047
6,379
9,967
3,767
6,338
7,533
4,661
5,053
3,833
9,444'
4,886
4,500
4,797
4,250
4,625
8,500
4,625
1
J$4,717
'4,200
5,416
3,400
5,000
5,333
3,000
3,916
3,000
0
2,000
5,000
3,095
4,000
2,818
3,000
4,000
3,000
2,000
4,000
5,000
2,619
.3,000
2,333
5,000
3,000
2,000
$4,786
4,400
4,889
3,100
5,111
5,072
3,125
4,773
4,583
2,000
"5,875
3,438
4,000
3,290
2,750
4,03a
3,125
2,833
4,000
4,625
3,000
3;333
-2,773
5,000
3,667
=11
2,130
Bank Tellers
Bookkeepers.
File Clerkt
Office Machine Operators
Secretaries, Stenographers, and Typists
Telephone Operators
Other Clerical Workers
- -Craftsmen and Kindred Workers
-
Mechanics and Repairmen incl. Automobile
Printing Trade-Craftsmen
Construction Craftsmen
Tailors
Other Craftsmen
Operatives, exc. Transport
Food Industry
.
Apparel Industry
Laundry and Dry Cleaning Operatives
Other Operatives
Transport Equipment Operatives
Laborers. exc. Farm
Freight, Stock, andrMaterial Handleri
Other Laborers
'
Farm Workers and Managers
Service Yorkers
Cleaning Service
F:oat
Service
Hth SFrvice
Personal Service
Protective Service
Private Household Workers
Source:
U.S. Census Bureau, Special Tabulation,
Publ
ic U
se S
ampl
e D
ata
(197
0).

TABLE 65
.(
SOURCE OF INCOME OF CHINESE FAMILIES IN THE U.S., 1969
Source of Income
U. S.
Calif.
Hawaii
N. Y.
Illinois
Mass.
All Families
94,931
37,437
12,304
18,546
2,920
2,920
Wage and Salary
84,786
33,174
.11,265
16;769
2,598
2,727
Mean Wage and Salary
$10,862
$10,489
$14,090
$ 9,417
$11,177
$9,545
Non-farm Self Employment
17,472
7,956
'1,403
2,747
520
434
Mean'Non-farm Self Employment
$ 8,527
$ 8,741
$12,845
$ 5,960
$ 6,963
$6,173
Arm Self Employment
713
434
106
20
15
18
Mean Farm Self Employment
$ 6,312
$ 8,160
$ 5,412
4*m
Z\D
Social Security
13,589
5,787
2,473
2,569
314
374
i\D
Mean Social Security
$ 1,311
$ 1,291
$ 1,450
$ 1,227
*$ 1017
$1,118
Public Assistance or Welfare
3,445
1,959
330
622
41
125
Mean Public Assist. or Welfare $ 1,253
$ 1,174
$ 1,627
$ 1,320
.......
$1,276
Other Income
41,040
17,151
5,833
6,692
1,140
1,109
"Mean Other Income
.$ 1,524
$ 1,486
$ 2,508
$ 1,155
$ 1,057
$1,139
Source:. U. S. Census Bureau, Subject Report, PC(2)1G (1970),
Table 24.

04'
9
4,
' outcome of the two referrals, I approached the man and inquired if ,
the two people were hired.2
-"No,"'he'said. "The young man didn't want the job, and theyoung Wy's English was not good 'enough to handle the paperwork."My ruction was: Well, I tried; and I let the natter go at that.
Some time-later, I met my acquaintance from the China Instituteand asked him about the referral. "That man offered Ccoolie wages," he replied.' "He just wanted good cheap labor.'
. ,
"What about the other job?" I inquired. "The man said herEnglish was not up to par."
"Nonsense," my friend replied. "She was justbired at P.S.as a teacher. I think the Board of Education is a better judge-of her'English than that fellow. She, too, was insulted by the
-salary he offered her."
Now from the other side'of the coin: In an interview with aChinese-American bank officer in Chinatown, I asked what the bankswere doing to widen the scope of employment opportunities for theChinese in Chinatown. His off,-handed remark was: "I have been
trying to sell Chinatown to the electronics industry..'I tell theniwe have cheap, dependable labor here."0Need I comment further on'this statement? .
,Source of Income
The main reason why I set up Table 64 to reflect earnings byoccupation rather than income by occupation was to find out whata Chinese makes on a given job. Income is a more inclusive term,,covering receipts'from all sources. The census lists wageflondsalary, self-employment income, Social Security, public assistanceor welfare, and other income. The latter category covers interest,dividends, rent, royalties, gifts, inheritance, gambling winnings,prizes, etc. However,,the census does not give a detailed,bresk-
down for these.0
In examining the data in Table 65, we see that the main sourceof income comes from being gainfully employed, either working forothers or for oneself, in a business or profession. About 14 per-cent are on Social,Security, and 3.6 percent on public assistanceor welfare.
Ivan Light, in his-book Ethnic Enterprise in America, wrote:
2 2 5-215-

Between 1900 and 1940, in only two instances didthe Chinese obtain assistance from tax funds. Followingthe San Francisco fire and earthquake of April 1906 whenChinatown was entirely burned out, the Chinese did re:ceive some public aid. 16 proportion to their numbers,however, the Chinese. received only one- thirtieth of thefree soup and rehabilitation accorded other an Francis-cans. . .
The second occasion on which theXhinese securedaid from public authorities was the Great Depression. . .
These law figures,are the more remarkable in view ofthe'poverty o the Chinese relative to more advantaged .
whites.3
In the past, the reluctanoe to apply for public assistance inthe face of dire need was due more to fear of the government thanto absence of need.-.The Chinese felt that if they applied forpublic assistance, they would be subject to deportation, and thiswas the sword of Damocles that hung over their heads.
Public assi'stance viewedin a different,light by today'syounger generation of eser-Americans. There is no Damocles'sword for them-and government assistance is not considered dole.In fact, many interest groups vie for funds and demand their fairshare of the government's tax revenues.
Savings
The most revealing clue in Table 65 comes from the numberslisted under "Other Income." In his study of ethnic enterprise.Itran Light stated that the Oriental communities had decided eco-omic advantages over the black communities in that they had ethnicinstitutions and, more important, capital. With low-paying occupa-tions, where did the Asians obtain capital? Only from savings and
the, pooling of resources.
The Chinese are a frugarand careful spending people. Bysaving their pennies and nickels and dimes, they save to investand_earn dividends or interest. According to Table 65, 41,040. ,
out of the 94,931 families (43.2 percent) had income from ottersources to augment their earnings. In my book, Mountain of Cold,,
3. Op. cit., (Los Angeles and Berkeley: University of CaliforniaPress, 1972), p. 87.
226-216-

aq
0
I describe some of the simple methods contrived by the Chinese
to save and obtain..credit.4 Ivan Light also describes.others.5
With resource to capital, the Chinese could undertake venturesthat would lift them out of the laboring class into the small
r-entrepreneuclass. These skills were dramatically depicted inthe process with which Nyuk Tsin Kee, a penniless,- illiteratepeasant woman inoJames Michener's novel, Hawaii, built up a for-tune so that the family became an economic tour de force on theIslands.
The trait or ability of the Chinese top one demand andsave capital for future utilization gives them building blocksupon which to expand their earning power. Many Chinese buy sharesin going enterprises, like restaurants, where they may insure them-selves of a job if they are a part -owner and at the same time Col-lect dividends in,addition to a wage and salary. When they arepart-owner, they are more conscientious and less wasteful, so the
benefits acciue all around.
Although the Chinese communities are going through a tremen-dous transition at this time, accommodating to the huge influx ofimmigrants,"they are taking positive steps.to pull themselves upby their own bootstraps: Just as they devised a simple creditsystem'called the hui, litetally a club whereby they pooled savingsto make available capital, "minorities are banding together andpooling their' esources to finance savings and loan associationsthat service their local communities. Federal and state authori-
ties are approving these new associations in record numbers."
Since January1972, theFederal Home Loan Bank approved fif-teen new charters for mutually owned banks in the western reigion-and three of these charters were gfanted to Chinese-oriented asso-ciations. The first to open its doors, in Los Angeles Chinatown,had over $5 million in deposits by the end of the first year. Thesecond to Open: in San Francisco's Chinatown, had on deposit over$2.5 million in 1,250 accounts in, just under four months of opera-
tion. The third, and newest opened in San Fraddisco's Richmondarea, and a fourth application is pending for Oakland's Chinatown.On the East Coast, the Chinese-American Bank in New York's China-
A
4. Sung, Op. cit., 'pp. 140-142.
5. Light, Op. cit., pp. 23-27.
6. Richard Springer, "Minority-Based Savings and Loans on the
Upsurge," East /West (August 21, 1974).
-217-
22

town has been in existence for over a decade, and it has playedan important role im the financial life of the community.' InWashington, D.C., well-known CBS television reporter Connie Chungis organizing an Asian-American Bank to serve minority communities.
This accrual of capital is one of the hidden economic strengthsof the Chinese people. Along, with education, it has been a primefactor in the maintenance of economic life in a hostile environment.Both education and capital resources are stepping stones to upwardmobility for the Chinese in the United States.
I
-218-
228

41.
SUMMARY OF FINDINGS
1. In interpreting the figures on income, one must be awarethat the concept of income in the Chinese mind is not the same asthat in the American mind. Chinese employers are responsible forloard,'if not room, income taxes, Social Security payments, andoftentimes, health insurance. Eighty dollars a week means $80 inthe pay envelope. Net income is what the Chinese employee reportsas income, and as we all know, there is a substantial differencebetween the high-sounding income we are offered and what is leftover in our paychecks.
2. The Chinese-American family income shows wide disparityfrom state to state. New York is significantly poorer than Hawaiior California.
3. The national median income for Chinese families is slightlyhigher than for the United States as a whole, but this figure issomewhat deceptive. .
4. There are multi-earners in the Chinese families who tendto boost the family income.
.5. Personal income is a more accurate reflectionof what theChinese make. These figures are comparatively low.
6. Are the Chinese poor? No, if the yardstick ii familyincome upon which the poverty index is based. A more accuratemeasurement would be income per unit of work.
7. The time has come to cleanse our minds of the idea thatthe Chinese are a source of cheap labor. ,
8. The earnings figures for the Chinese are a more' accuratereflection of what the Chinese are being paid in their respectiveoccupations.
9. A good proportion of Chinese families have, income fromsuch other sources as dividends, interests, and return on invest-
,.bents.
10. Capital accumulation has been one of the major sourcesof economic strength of the Chinese people.
11. Public assistance to the Chinese has beentminimal. The.'
younger generations of Chinese-Americans no longer view governmentassistance as dole. ciOn the contrary, they are beginning tviefor their fair share of the government's revenues.as taxpayers.
-219-
229

gip
RECOMMENDATIONS I
After presenting an entire chapter on income of the Chinesein the United States based upon the 1970 census, I am going toshoot holes through it and sarT do not'place too much trust onthe reliability of the dollars and cents figures from, the census.These numbers do, 'however, provide guidelines in certain respects.For instance, Chinese persons employed by non-Chinese will adheremore closely to American bookkeeping procedures and the conceptof income will be more in line with the usual definition of incomeaccording to accepted accounting proCedures. The white-collar
occupations fall within:this purview.
Some occupations_ are more likely to have been counted in thecensus,-and if the census-figures lean heavily in the directionof white-collar jobs, some account of this Aust be taken in theinterpretation of the percentages. In instances like these, use
of the actual figures may be abetter- index. One cannot escape
the fact that there are approximately 4,000Chinese-Americanphysicians -or dentists and over 5,000 teachers In colleges or
universities. These numbers tell us something whether or'nOt thegarment workers or waiters have been undercoUnted. Income for the
white-collar workers may be taken more or less at face value. In-
come for-the other large groups, such'as operatives and service
workers, is not as reliable. But then oranges cannot be added toapples, and the blue-collar workers' income cannot be placed sideby side with the white collareworkers'to get a-true composite.
I-11ve already mentioned the rife of nonresponse to the income
question on the census survey. In conversation with some of thedemographers at the Census Bureau in Washington, I asked what isthe range of deviation of the income figures. Plus or minus 10
percent was the answer. To my mind, that is a large margin of
deviation. The reason: Few people hesitate to answer questions
pertaining to sex, marital status, occupation, hours worked, resi-dence, etc., but income is a very private question.
Nevertheless, the income data ioes reveal some glaring symptoms.Among them, the depressed level of income of Chinese females, andthe large proportion of teenagers who have no income at all. These
two syndromes cannot be *disputed. Both call for'remedies that I.
am not competent to offer as a simplistic solution. They require
attention fromthe ethnic community and from labor, goVernment,
and educational stitutions. These'problems are not just peculiar
to the Chinese. ey are also symptomatic of the, employment Situ-,
ation as a whole.
Income is measured in-terms of money, but money is not the
- 23u-220-
4

A
ultimate measure. It depends upon what you do with the money. Youcan Spend it, waste it foolishly, hide it in the mattress, or use itto generate more money. A bright spot in the picture is the thriftyhabits of the Chinese and their ability to accumulate capital as astepping stone to a better life. Some of'the credit facilitiesdeveloped by the Chinese in the past may be fading away, and themore impersonal, complicated setups of the American banking system
taking their place. But recent immigrants, who are coming from arural or less developed economy, are not familiar with the sophis-ticated procedures of applying for credit fromi banks. The more
personal and siMple Credit facilities within the ethnic communityshould be revived for those who feel. that they can deal more comfor-tably with a familiar setup. For example, the Lee Family AssOol-atioln Credit Union is a very successful model-to foitow. It operates
likeany other credit union, but its membership is based, upon the,
extended kinship family. The special features of a credit'institu-ti=ke this are the primary relationship of its members, theel tion of the language barrier, and the less stringent pro-cedues governing its operations because the members are-known to
one another.
Since we cannot put too much faith in the census figures onincome, and it is very difficult to get valid figures, we areoperating in the dark when we attempt to make recommendations.Boweveri-.1 hope I have been able-to point out some of the culturaldifferences in concept of income, and some of the factors pertainingto the Chinese-American employment picture which mask the-true .;
financial status of the Chinese.
231 --221-

CHAPTER X
UNEMPLOYMENT AND UNDEREMPLOYMENT
"GM Lays Off 12,000 More," "Freeze on Government Hiring,""Pink Slips to 300 at Singer," "The Ax Falls Again at School las-trict'26." These 1974 headlines mean the same `thing: people arebeing separated from their jobs, and theunemplbyment figures arerising. Such headlines forebode the general, employment situationand do not pertain specifically to the Chinese. However, if thegeneral unemployment rate rises, can it be anything but more pes-simistic for the Chinese?
The answer is not always the seemingly obvious one. In 1970,
a year of relative prosperity, the unemployment rate for whitemales was 3.6 percent; for black males, it was 6.3 percent; forthe Chinese male, it was only 3.0 percent. The female unemploymentrates ran to 4.7 percent for whites, 7.7 percent for blacks, and3.7 percent for the Chinese.1
In some states, the unemployment rates for the Chinese wereeven lower. Table 26 shows the labor force and employment statusof the Chinese for three states and ten SMSAa. For males, theunemployment rate sank to 1.4 percent in.Washington,.D.C.% and inmost other eastern states it was but a little higher than 2 percent.The unemployment rate in the western states ran higher, and it washighest in the an Francisco-Oakland area. Nevertheless, whencompared city by city with the urban area rate for all persons,the Chinese unemployment rate falls far below that of the generalarea. More important, the disparity is frequently a large one.(See Table 66.) From these figures, one could simply surmise thatfor the Chinese, jobs are easy to come by.
.
1. Figures for blacks and whites: U.S. Census Burea04 Sub ectReport, PC(1)C1 (1970); for Chinese, PC(2)1G (1970. , '
232-223-

TABLE 66
UNEMPLOYMENT RATE FOR MALES IN THE CIVILIANLABOR FORCE INIEN SMSAS, 1970,
SMSA's All Persons Chinese
Boston 3.5 2.8 a
Chicago 3.5 2.5Honolulu 3.0 2.1Los Angeles-Long Beach 6.2 3.9New Yobk 3.8 2.4lacramento 7.2' 2.1,Skin Francisco-Oakland 5.8 4.4Sii0ose 5.8 3.6Seattle-Everett 8.2 3.8Wash. D.C.-Md.-Va. 2.7 1.4
4 '
Source: U. S. Census Bureau, U.S. Summary, PC(1)C1 (1970,Table 184; Subject Report, PC(2)1G (1970), Table 28.
(
233-224-

01,.
Perhaps. One must admit that the Chinese have benefittedtremendously from the assertion of minority groups for their legit=ioate rights over the past two decades, and they owe a great debtto the Civil Rights Movement, Which initiated his drive. Butwithin the Chinese context, there are other factors that mask thelow rate of unemployment. The reasons are many and varied.
Jobs in Search of People
Obviously, the Chinese aS a group cannot be considered slickers.Industry is a strongly ingrained character trait reinforced by sheernecessity of the impoverished background from which they sprang.When the opportunity for making money presented itself in the UnitedStates,,the immigrants hastened to "make hay while the bun shines."In fact, one might say-they are greedy and tend to overwork. (Work
attitudes and the Chinese work ethic are dealt with at greaterlength in Chapter XI.)
A large proportion of the Chinese population now in this coun-
try are a recently uprooted people. They have incurred large expen-
ses to make the trans-Pacific journey. They are starting life anew
and their expensesare heavy. One xicorinner in the is not
sufficient. All hands must be'on deck to keep, the family afloat.Employment is An absolute economic necessity, regardless of whattype of. employment.
There are always jobs in search of people. Many such jobs,however, are the more undesirable ones which are low in status,unpleasant in nature, low in pay, and paid by the piete. Other
drawbacks are long working hours, poor working conditions,' off\liours, repetitive and unimaginative work,"-dead-end jobs, and other
aaattractive conditions. It has traditionally been the lot of thenewest wave of immigrants to assume/these positions until they or;their children could move up and out. In a highly. mobile society
like that in the UnitedStates, the loweechelovoccUpationsalways. have a high turnover rate. People who are willing to accept,eiploymeit in these jobs have no pro lem finding, work,, and /rah "-remployer can find a steadyreliabEt so a'of labor for such posi=,
Lions, he ...is more-thAn'elated.
. The garment industry is a good example. It is extremely easy
to get a job as a seamstress. The usual procedure is for a friend
or relative togtake the applicant down in person and introduce herto the owner or boss. The boss says, "Try it out." Theapplicant.sits down at a machine and the. friend explains to'her what is to
be done. They work at first with some scraps, and then the appli-,cant is given a garment. She takes her time and may finish it with
234-225-

the help. of her friend in threeor four hours or as long as isneeded. The boss doesn't care. He pays by the piece. The payis something like sixty cents dskirt.
,/
Perm at twenty cents, the women grasp it eagerly. It is a,job that they can handle. They do not have to go far beyond China-town, and once they get the knack of finishing a garment, they canfind ready employment id another factory. There are over 230 gar- '1
meat factories in and around New York's Chinatown, and others.arebeing attracted to Chinatown to tap the reservoir of high-qualityChinese female labor at cheap prices. .
Kitchen duties are a large area of employment for Chinese,males. The hours are long, the temperature in the kitchen is al-
, wayslot, the duties are not the most pleasant, the status is low.Restaurants always have openings for dishwashers, in spite of theinstallation of dishwashing,machine 'and other mechanical devices.One of the biggest headaches of a restaurant manager is to find a ,
person to scrape the dishes and put them into the dishwashing machine.Few people want the job. They may take it for three months or half-a.year, but, they do not stay long. A dishwasher's position is veryeasy to .come by.
'In cities like-New York, San Francisco, Los-Angeles, Boston,etc., many jobs held by the Chinese are ingrown occupations ser-vicing the Chinese community itself. Chinatowns may be the fastestgrowing sectors in many large cities where urban decline is the rgeneral trend. The huge influx of recent immigrants has created .
. a demand forgoods and services within the community. Almost, any
business opening up in New York's Chinatown seems to be making 2-
money. The local economy relies not so much on the tourist trade-today as on local consumption. The newcomers-are+lyinifurniture,clothes, appliances, and_food. They need the servic"Lof, barbera;,-doctors, dentists,tankers, lawyers, and accountantd. Any discrim-
. inatiOn resulting from a redession in the larger American economywill be buffered by the fact that the Chinese in Chinatowns areconsumers as well as-workers, and their demand for goods and ser-
'vices have created many jobs.
Business Bad -- Unemployment Down
-Would you believe that when business is bad the unemploymentrate among the Chinese may decrease rather than increase? In yearspast, it generally did. The population was fairly homogeneous andoftentimes related. If a person lost his job, a relative wouldtake him into his restaurant or laundry or grocery store until the
_fellow landed another. Strongly inherent in the Chinese culture is
235-226- .11;

4
s
r-
4
an emphadis on family and social obligatiOns. This is in strong
contAbt to the practice in tikes of adverse business conditionswhen American business management efficiency calls immediately for
a cut-Inpersonnel.
American businessmen were surprised-to learn of some of these
traditional Oriental practices while doing businias in Japan. They
discovered that, once a Japanese worker iShired, he considers hisemfiloyment,a lifelong relationship, except under unusual circum-
stances. When sales fell off for Toyota, the workers in Japanwere furloughed at 90 percent pay. At the same time, General Motors -
in ,Detroit laid off 12,000 workers, leaving them to,unemploymentinsurance and their own resources until such time as the costaccountants could justify their return to the plant.
Today's circumstances among the Chinese-Americans are somewhatdifferent. There are fewer self-owned and operated enterprises topermit this method of mutual aid; the population is more diverse,people are more impersonal; family ties are not as strong; there isunemployment insurance. Furthermore, American society amid culture
tend to deprive the worker of his sense of duty, security, andbelonging.
Escalator Profits
Along the same lines of reasoning, the Chinese small business-.
men can survive and surmount business adversity a little bit better
when he has more flexibility. Take the average Chinese restaurant.
It is seldom owned by One man any more. The usual procedure is to
pool the capital resources and manpower of a small group-which setsup a joint venture, either in a partnershipor corporation. The
_partners are both employers and employees. Each one insures for
himself a job and a salary. When business is good, they ,give them-
selves a raise. When business is bad, they look at the receiptsand hay, "We'll have to take less this month." The employers/employees are not out of work. They try to pull through the bad
times together.
These are some of the techniques and responbes that the Chinesehave developed to live and survive in the Milted States.' The:problemis that, as the employment horizons are broadened and the Chinesemust compete in the larger, society' in an alien. setting, they aregoing to encounter situations in which responses have not been tried,
,and developed. Each,man or woman is going to be on his own to meetthe problems,not as &group, but as an individual. The nature ofthe transition period-is conj ectural. No one can.predict which waythe wind will blow, and the generation of the 70s will'be in the
1236
-227-

O
.
vanguard. WilLthe Chinese fall back upon the the traditiOnalresponses? Should they crawl back into their shells and insulatethemselves by gelf -isolation as the did in the past? Or will
',they devise new ways to deal collectively with the specter ofunemployment? -- e
Who Are the UneiTlayed?
The unemployed are the recent immigrants. In fact,'the sta-tistics covering that may noteven be in the 1970 census. Had theybeen ittludedrthe unemployment rates would have tea much higher.The reasonsoare inherent in their migration. They..gave up what-ever occupation or fitatus or income they had in their homeland tobegin life anew in this countfy. When they got here, they imme-diately joined the ranks of those looking fbrlobs. The problemlies in haif ep help these newcomers smooth over their period oftransition.
ApproxiMately two-thirds of the total immigrants coming intothe country fall withinIthe age bracket of twenty to.sixty years.Three out of'four able-bodied adult males /bin the ranks of thoselooking for employment. About half of the women will join thelab.= force; The most urgent employment needs of the Chinese liewith.the new immigrants. Their greatest obstacle is unfamiliaritywith the language and American customs. They do not know how orwhere to turn for help except to their immediate relatives, orfriends, whose own knowledge df the employment field may be.equallylimited: If I were to give priority to any one aspectof theemployment -.situation of the Chinese, I would concentrate on helpingthe new immigrant.
Refugees in Limbo
The unemployed are the'refugees. Generally, employers shyaway from hiring'anyone who does not have a green card testifyingto the fact that he or she is lawfully admitted as a permanent,resident and Jet-permitted to seek employment in this_country.Non - immigrants, such as visitors, students,' businessmen, andtourists are not allowedto work. Refugeea area 'Special case.They are permitted to work, bgtthey are not issued a green carduntil they have a record of two years of good conduct in thiscountry. Most employers do not knoW of this technicality, however,and will only accept the green card as proof of eligibility. Fur-thermore, a great deal of publicity has been givet to a bill spot -'Bored by Representative Deter W. Rodino.in the Cangress'whichwould severely penalize the employer of an alien who is tot enti-
, 237
tied-to work here, thereby creating more uncertainty and fear.
Not Female Operatives
The unemployed are not the women in jobs. For
example, in New'York, San Francisco, Chicago, and Boston, where
the garment industry is strong, the unemployment rate is very
low. In New York City, the proportion of the total Chinese fe-1mile labor force in operative jobs is 43.7 percent and the unem-ployment rate for Chinese females is 2.8percent. (See Tables
26 and 28.) In Sacramento, 43.6 percent-are in the clerical
field and the unemploiment,rate is 11.1 percent._4rbelieve these
unemployment figure's reinforce my contention that some jobs are
easy to come by when no one else wants them. The figures also
support my argument that as the Chinese leave their ammunity
and reach out into the larger society, they will become highly
vulnerable to'the ups and downs of the larger economy.
Young or Old
There is no distinct pattern to unemployment by age group.
In Table 67; we have a comparison of percent betwen the Chinese
in the labor force and unemployment rate by age groups for th'e
United States, and five states. For females, the proportions are
almost identical: they are found in the labor force more or less
proportionate to their rate of unemployment1 But the percentages
for the males present some disturbing dislocations.
In the national figures, the fate of unemployment for young
men from 16 to 24 years is double that of their proportion in the
labor force. In the state of Hawaii, the rate is triple or higher.In other words, Chinese maled in the 20- to 24-year age bracketare 11- percent of the labor force, yet they take up 31 percent of
the unemployed. This may explain why Hawaii's young men are leaving
the islands.
In New York, the dislocation is at the other end of the age
spectrum. Chinese males are 35 percent of the labor force in the
45- to 64-year age bracket, but they constitute 44 percent of the
unemployed.
In Massachusetts, the' problim is worse. The greatest proportion
of unemployed is found lathe 25- to 34-year age bracket. These
ape bracketi are generally the ones in which thefull potential of
the male workers is achieved. `They have finished,their education; .
they are most likely married and have families to support; they have

IN THE
Age Group and Sex
Males 16 Yrs. +
16 -19.yeais
20-24 years
,25 -34 years
.35-44 years
ICJ----45 -64 years
co
65 years +
Females 16 Yrs. +
16-19 years'.
20-24 years
25 -34.years
35-444 years
45 -64 years
-65 years +
4 .h`
TABLE.67,
COMPARISON OF EMPLOYMENT ,STATUS ANDI.ABOli FORCE OF THE CHINESE
U.S., BY AGE:GROUP AND. SEX, FOR TOTAL- U.S. ANDFIVE SELECTED STATES, 1970 i
U. S. Total
California
New York.-
Hawaii
Illinois
Massachusetts
%%
X%
Z.
X;
Labor Unem-
Labor Unem-
Labor Unem-
Labor Unem-
Labor Unem-
Labor Unem-
Force pl d
Force 777-.4:1
Force 71-r-.- d-
Force
"---
11.1
71Force
pl d
Force. pl d,
100
100
6'12-
11'
22
,24
16
25
s14
31
'30
35
rob'
'No
812'
18
'20,
23
22
23
20\
26
23
24
i00
100
100,
100
712
48
12
.22
914
.22
12,
21
13
26
'15
26
13
'31
34
35
44
35
.3
7
100
100
100
100
911
711
18
20
17
17
21.
16'
30'
'24
20
25
19
25
30
28'
1/J
..2
82
5
Source:
U. S. Census Bureau, Subject Report, PCt2).11G (1970), Table 21.
.
-230-..
100
100
100
100
100
100
6.30
57
6.
411
31
11
23
12
20'
19
631
23
28
43
24
10
'24
11
22
13
'37
22
2.5s
23
28
21
42
312
3'
100
100
100
100
100
722
9,
,9
12
12
14
22
20
;0
19
19
19
26
26
24 ,,'
24
23
.16
23
.19
19
35
15
20 r
20
25
24'
12
2!
3,
.

4
TABLE 68
-EDUCATION AND EMPLOYMENT STATUS OF CHINESE MALES
16 TO 21 YEARS OLD, FOR TENSMSAS, 1970
,Total No.
Not Enrolled in Sch. Not Hi-Sch. Grad.
Unemol'a or Not.
in Labor
Forge
2Males 16-21 Years Old
(100%)
No.
%No.
No.
.-
U. S.
31,297
5,347
17
1,584
5784
3Boston
1,082
259
,24
68
6' 34
3
Chicago
i797
102
13
42
'
521
'
3
1'6
Honolulu
x,728
725
26
154
6110
4
AA.
Los Angeles-Long Beach
2,901
379
13
41
New York City
5,217
1,099
21
491
1 9.
17
245
1 5
Sacramento
908
116
13
33
46
1
t.Simm Francisco-Oakland
6032
960
15
259
4157
2San Jose'
,650
57
88
18,
1
Seattle
606
109
18
34
6.10
2Wash. D.C.-Md.-Va.
385
-
46
12
14
4,
0
Total 10 SMSAs
21,806
3,852:
18
1,144
5608
3
.Source:
U. S. Census Bureau, SubJect_Report, PC(2)16 (1970), Tables 19,
28.

NI
bad time to gain some experience and an opportunity to establishthemselves. If they are unemployed at this stage in their lives,the problem is doubly acute.
)
Teenage and Youth Unemployment
According'to Ta61e 68, teenage and youth unesiployment is notmuch of a problem, except in New York City and, to a lesser degree,San Francisco. This table gives the number of Chinese males whoare 16 to 21 years of age for ten SMSAs. in the United States withsizable Chinese populations. The columns show the'number of youthsin that city, and the-percentages who are not enrolled in school,who are not high school graduates, and who are unemployed. Of the608 who fit all these labels, 245 are found in New York City and157 are found In San Francisco. AgainoNewlork seems to be theproblem area. Perhaps these idle youth may be the.,cause of therecent waves of crime plaguing New York's., Chinatown.'
Underemployment. ,
The problem of underemployment is greater than that of unem-ployment for thi Chinese. There are always some jobs to'serve the-immediate needs of staving off hunger or the bill collector if -oneis willing to do the work. When it comes to dire necessity, oneaccepts such work, even though the position,thay,he far beneath theworker's qualifications.'
Contributing to the Underemployment syndrome is the UnitedStates government immigration policy of giving preference to per-sons with good skills and education. When highly educated andskilled persons are admitted to this country but are hampered atevery turn to practice their trade;or profession, underemploymentinevitably reiults. 'The former Shanghai plastics manufacturer isworking,as a waiter. The former accountant from Hong-Kong is thesalad-and-dessert man in 'a kitcheni--Se 'former principal of anormal school sells groceries' in aChineie food'store. The farmerstarlet of movies and nightclubs works, as a restaurant cashier anddoubles as a take-out clerk,' The former professor is a janitor.The former doctor is an orderly. Instances like these arwall toocommon. To get a general idea of how pervasive underemployment is,I took the first twenty names off -the roster of trainees who hadcompleted their twelve-week course at'the Chinatown Manpower Proj-ect in Chinatown and listed their educatiod,'their former positionsin Hong Kong or Taiwan, and their present positions (Table 69).The rest of the group is just like the first twenty.,
24-232-

C
cO
C
r
TABLE 69
UNDEREMPLOYMENT OF THE CHINESE AS REFLECTEDIN CHINATOWN MANPOWER ROSTER, 1972
Case No. Education Past Experience Present Position
1 College Student Teacher in Hong Kong Embroidery work
2 High School Grad. Nurse Maintenance work,
3 liormil Sch. Grad. Teacher , 4 Cashier 'N
4 High School Grad. Self-employed.business Managersmall business
5 College Grad. (eco) Teacher in Hohg Kong Assembler, office supplies
6 College Grad. (eco) Teacher in Hong Kong Cashier
7 College Grad. (bus) Teacher in Hong Kong Clerk, service agency
8 College Grad. (ed.) Teacher in Hong Kong SecretarrelChinese agency
9 College Graduate Gov't service, Taiwan' Ass't ManagerRestaurant10 Nursing Sch. Grad. Nurse, TaiWan Nurses Aide, Nursing Home
11 College Graduate Herb doctor Nurses Trainee.
12 College Graduate, Nurse Nurses Aide, Hospital
13 College Graduate\ Medical doctor Teacher, Advanced ESL
14 College Graduate. Minister, Hong Kong Examiner intBank
' 15 College Grad. (law) Teacher in Taiwan Bank Clerk
16 Nursing Sch. Grad. Registered Nurse in H.K. Preparing for nurse's license
17, College Graduate H.S.,Teacher in H.R. Restaurant Manager .
/Ef High -School Grad.. In charge, rubber fact. Advanced ESL Class
19 High School Grad. Teacher in Hong Rong Restaurant Cashier
20 College Grad. (law) Lawyer in Taiwan' Bank, Examinihg Clerk
-SouiceV Chinatown Manpower Project, (1972).
e
242-233-,

CURRENT OCCUPATION
TABLE 70
AND OCCUPATION FIVE YEARS
16 YEARS AND OVER, 1970 (inhundreds)
AGO OF THE.,CHINESE
Five Years
-Occupation
Ago
-
Current
1970
Prof.
Mgrs.
Sale.
Cler.'
Labor-.
Occupation
Total
Tech.
Admin. Wkrs.
Wkrs.
Crafts,
Oper.
ers
Males 16 Yrs. 4.
.
1,125
30
104
26
48
65
8.3
20
Prof., Tech.
359
15
15
32
2Managers, Admin.
120
20
83
Sales Workers
47
16
01
02=
Clerical
94
52
30
0)
4Craftsmen
98
23
61
Operatives
113
26
0'
12
81
Laborers
31
00
00
11
6Farmers
20
0'
00
0'
00
Service Workers
257
25'
35
38
1
IU
Private Household
40
0'
O0
0"0
0
1.1
Females 16 Yrs.'+
732
79
20
15
100
591-
4Prof., Tech.
155
62
07
,0
10
Managers, Adm.l.n.
27
11
10
00
Sales Workers
39
T
22
01
00
Clerical Workers
220
62
70
20
Craftsmen
14
00
*0
14
10
Operatives
151
22
0-.
20
10
Laborers
70
00
00
04
Farmers
20
00
00
00
Service Workers
105
0.1
0'
2"0
20
Private Ro6Sehold.
12.
0,
'0
00
.0-
00
'
Source:
U..S. Census Bureau, Special Tabulation, PublicUse Sample Data (1970).
NOTE:
Based on a 5:percent
sampling:
-234-
Farm-
Serv.
Pvt.
ers
Wkrs.
H.R.
2164
01
00
70
03
00
50
03
00
40
01
02
00
04,
02
051
30
10
00
00
00
0.
40
00
0.
0a
00
.0
00
00
0 0

TABLE 71
CURRENT INDUSTRY AND INDUSTRY FIVE YEARS AGO
OF THE CHINESE 16 YEARS AND OVER, 1970
(in hundreds)
1970
Current Industry*
total
Males 16 Years +
Manufacturing
Transportation
Communication
Trade:
Gro6
res
Eat' D ink Places
Finance,.Insurance, Real Estate
Busilless'and Repair Service
Personal Services
Entertainment & Recreatn'l
Professional Service
Public Administration
Females 16 Years +
Manufacturing
Transportation
Communications
Trade:
Grocery Stores
Eat, Drink Places
Finance, Insurance, Real Estate
Business -and Repair Service
Personal Services
Entertainment & Recreatntl Serv.
Profesiional Service
Public Administration
1,125
14228
2253
241
394170
Serv.
12
213
96
Source:
f.
Industry Five Years Ago
---Trade----
Fin.
Bus.
Ent
Eat,
Ins:
'
Rep.
Pers.
Rec.
Prof.
Pub.
Mfg.
Transpe Comm.
Groc.
Drink R.E.
Serv. Serv.
Serv.
Serv; ;Adm.
..1Q.L.
29
14
51
168
1-:-.-.--..s0
10
41
00
1--, 0
0.
2,
11
9----
01
00
36
22
54
30
02
11
11
00
02
1
1'"0
00
2
40
0.
12
04
01
1
732
.4,2,...
44
15
161
1--....,1
,1
1
8..0
2'"---L,..0
09
00
.......211-
018
-- 0
00` ---_12
70
20
011r--,....,
54
11
00
10
00
00
50
00
05
00
0,0
200
40
00
45
10
00
43 1 0 0
R.
0
10,
0 5 2
U.S. Census Bureau, Special Tabulation, Public Use Sample Data (1970),
NOTE:
Based on a 5 percent sampling.
*Omitted because numbers ware insignificant:
17
22
58
5116
7,
00
-0
04
1'
a0
00
z.
1
11
00
6.0
00
.0-
00
00
46
02
2-
15
1'0
01
0
0---X -,
20
4'.
0
q0----
48
03
00
00-
-4
00
ii0
02-
---:,,,95
---4--.
01
02
'
9
23
425
38g
,
30
10
10
4'
1
10
0A
10
00
00
0O.
00
0'
. 0
-0
00
00
10
00'
00
05
0
6'.--,,,.....
...0
02
0"
02-----._ 22-------__,'0
10
20
.0
Iy-, -__A"-1---_1_
10
,1
01)- --..Z3
.
Agriculture, Construction, Mining, Utilities and Sanitation SerVices.

Some people will say, "So what? It happens to all, immigrantgroups who first come here. The setback is'an inevitable part ofthe transitional proCess. Given time, they will catch up." Some
0. do, but the Majority won't. This is evident when welook at.Tab1.es70 and,71. The Chinese simply do not readily move from one lineof work to another. They tend to stay put. If they,accept-empIor'-.liumitat a lower level, the tendency is that they will stay there'fOr some time, unless helped to move out ofthe rut or given astrong impetus to .do so on their own,-,
Stuck, at Entry Level
Underemployment is also prevalent among the native-born Chinese-American who ddea not face the same problem of transition as hisforeign-borncounterpart. Since he has little problem with theEnglish language and the'likelihood is that he is highly educated,he will encounter no difficulty finding'employment at the entrylevel of professional careers. He usually performs competentlyand logs considerable years of-experience, but fellow workers whocame in atthe Same time he did,will have gone on to bigger 1414,2.better positions while he still plugs away in the same positionyear after year.
These Chinese are the engineers who draft the plans, thearchitects who do the renderings, the teachers who have the samegrades every year, the lab technicians who do the tests, the ii-braiians who catalog the books, etc. They are the unsung workerswho do their daily chores quietly, and efficiently, and then'areoverloVrd at promotion time. They have professional positions,but they are drones.
The Drones Are the Workers
Because they are drones and the drones are the workers, thereis a tendency to try to retain such people in their positions aslong as possible. For example, if -an executive has a super-effi-cient secretary who is Able to relieve him of much of the tediousdetails of his job, he-is going to try-to keep her as long as pos-sible, even though she may be qualified to move up into the execu-tive ranks. If the secretary never expresses a desire for a pro-motion, the boss will most likely not initiate action to promoteher, and, even if she indicates that site is willing and capable ofmoving ahead, the boss may covertly try to obstruct ter promotion.
All too often; the Chinese-AMerican never voices dissatisfac-tiou with his position. He is quiet, reliable,, docile; in effect,
-236-

he is penalized for his performance, rather than rewarded. He isperpetuated as a drone rather than -given an opportunity to make
decisions or Come,:up with new bleep. Tragically few people are
aware of the extent that many Canese-Americans are underemployedbecause- they remain so quiet.
Worse yet is when deliberate attempts are made to keep highlyqualified personnel from moving ahead, for indefensible motives.
.--At the Civil-Rights Commission_ Hearings on: Equal Opportunity forAsian- Americans in theliew.Xorkarea in 1974, Dr. John S. Hongrevealed some of the tactics employed to keep Asian doctors, edu-.catc4 and trained abroad, fiok advancing in their professions.Dt"HOig said4
- From the economic. point of view,.the new wave ofAsian immigrants repreients some form of net gain to
-,the U.S. They are some of the best minds in Asia.They are highly skilled and established professioftalstin their countries.
In 1971; a very conservative estimate-of $50,000.As the face value of the foreign medical graduate atthe time, he enters the countrtr, .
Foreign medical graduates have-contributed verymuch tcothe health:care of this country, yet amongthose I interviewed, there was a mixed feeling ,of,
%gratitudeana.dissatisfaction. . . . The competence
of a foreign medical graduate is disregarded, simplybecause he does not-have the Standard ,Certificateissued by the-ECFMa (Educational Council for ForeigRMedical Giaduates)".Instances were cited whereinsome residents were nominated for. senior Cr chief
positions but were turned down for the same reason.
'There seemato be an intentional scoring to seeto it that there are not enough passing prospectiveinterns to fill up completely all internship positions.
available. A shortage of interns produces a shortageof physicians. The lesser the Supply, the greaterthe demand; the higher the medical costs.2
Dr..Hong went on to say that doctors are often given visasbecause they have a M.D. after their names, "but once they enter
2. Testimony given before Civil Rights Commission Hearing in New
'York (Friday, July 12, 1974): II pp. 203-4.,C:
24-6
-237-

C)
the dountry, without the ECIPMG they will never have an. opportunityto be employees or intern residents'in the so-called approvedtraining hospitals. . . Often they are used as technicians ornurses' aides or in almost any capacity.3
The implication here waErthat these doctors are paid lessthan a doctor bit are used to do medical work. In fact, suchforeign medical graduates can be hired cheaper than the goingrate for a nurse.
Dr. Chungik Rhep also testified before the same commissionhearings and his reference pertained to nurses, nutritionists,eafmacists, and X -ray and lab technicians. It was again pointedout that such professionals are granted' lases from Asian countriesbecauseof the simple fact that they are skilled technicians andprofessionals, but once they come to'this country they cannot finda job because of the constraints of professional associations whotake the position that unless yougo through the same kinJ ofinternship and the same kind of licensing, a permit is not issuedand a job cannot,belound.
Dr. Rhee gave an example of how Asian pharmacists are beingexploited, and Mr. Albert J. Sica, executive secretary of theState Board of Pharmacy in New York`confirmed it. 'Brought outin their testimonies was the'fact that pharmaCists are givenpreference in applying for an immigrant visa, but foriy-eightstates and the District of Columbia bar graduates of foreign phar-macy schools from applying for licenses to practice..
In New York and Illinois, applications are accepted, but theforeign pharmacists must serve a period of internship before theycan take the regular licensing examination. Since there are onlytwo states in the country that will accept pharmacists educatedand/or trained abroad, prospective interns gravitate to these twostates, and the supply exceeds the demand to such a degree thatpharmacists in these states must offer their services free for aone- or two-year period in order to have the opportunity to workas an intern to -qualify for the licensing examination.- If onerefuses to work for free (the euphemism is 'Volunteer their ser-vices"), someone else will. Theeconomic hard.ahips borne-bythe,families,of these men or women are devastating during the timethat these pharMacists are serving out their internships. At thesame time, one might say', these people are not just underemployed
3.
247-238-
A
2

C.
-TABLE 72
'-
OCCUPATIONAL LEVEL OF.ORIENTALS IN THREE` AN'FRANCISCO COMP4NIES, 1970
Job Categories
Clothing.Manufaeturer
Printing Company
Heavy Industry
Total,
Orientals
Employees
Total
Orientals
Total
Orientals
Employees
Employees
Officials ands Managers
10'
016
056
0professionals\
10
10
026
0TeChniCians
20
--
20
Sales Workers
_--
N18
0....-
Office and Clerical
40
51
179
1.
Craftsmen (skilled)
139
.
28
'.
170
9105
0Operatives (semi-skille0
-20
1117
11
157
4-
Laborers (unskilled)
10
-136,
775
1
Service Workers
3,
0.
...M
IN,
10
TOTAL
180
29
518
'28
501
6
Source:
"Chinese in San Francisco,"-employment pi'oblemd of the community as preisented in testimony before
the California Fair Employment Practice Commission (1970, p. 14.
'*No job category given by that company.

,'or underpaid, they are undergoing compulsory serVitude.
On the West Coast, similar hearings of employment problems
C 9f the Chinese were conducted before the. Fair Employment PracticesCommissioi. At those hearings, Mr. James W. Chin, of the Depart-Bent of Defense, Office of Contract Compliance, selected at randomthree San Francisco companies to illustrate the underutilization3of Orieatals,,in specific job categories. The figures he gave weretabulated and set forth in Table 72.
4
Mt. Chin pointed out thatthe,1absent from the higheeteVeliONhal-0of experience in the field of'interethe employment profiles reflected inatypical.
ientals are Conspicuouslyt positions. In his six-years
hnic relations, he feels thathe companies cited are not
Female Underemployment
The most flagrantly underemployed are the.Chinese females.Their plight has already been touched upon in many instances inthis report,, and Chapter VI ds devoted exclusively to Chinese fe-male employment. In spite of the high educational attainment(approximately one out of three has, some college education or isa college graduate), the positions they occupy are lowly and theincome they receive is deplorable. (See also Chapters IV and IX.)I risk being repetitive, but I do feel that I cannot emphasizetoo much the'grosaly inequitable situation of the Chinese female.
4
4. Ibid., II pp. 200 ff.
5. '"Chinese'in San Francisco, 1970," employment problems qf thecommUnity'as presented in testimony before the California lairEmployment Practic'es Commission, p. 14.
24a,-240-
.1
A

a
SUMMARY OF FINDINGS
1. In.1970, the unemployment rate for the Chinese in theUnited Stites was noticeably. lower than that for whites or blacks.
2. The low unemployment rate may be attributedto thefollowing:
a. The Chinese are conditioned to hard work by cultuial andeconomic circumstances in their homeland. ,
b., They may have incurred large debts in coming to thistcoun-,coun-
try and must work extra bard to pay back the debtp.
b. Because of the compelling urgency to earn a livelihood and -
because there is little choice, the Chinese. are willing to takecertain jobs that no one else wants. Such jobs are easy tp
come by. '
d. Many jobs held by-the, Chinese are generated by the commun-,ity and are community related.
e. Employment is oftentimes artificially shored up when times
are bad. The unemployed are squeezed into going concerns until
better times. '
7
f. In Chinese,enterprises, the partners are generally bot
employers and,employees. In bad times, the partners-tightentheir belts, and in good times, they work a little haider.
3. The recent immigr4nts pose the most urgent unimplOymentproblems. Their need for Sobs is immediate. They have do'Socia).
Security or'tnemploythent compensation cushiOn to fall back on.%
.They have pibblems of language and adjustment. The recent
grants are the priority group for employment attention.
fr
t'*
4. 'Political refugees are suspended in a peculiar limbo, be-
cause employers think they do not have the right .to seek-employ,
meat in this country.
5. Women operatives have Attie difficulty finding employment.7
. .. 6. In Hawaii, the young from age 16 to 24 arlbe most likely
capdidites for the ranks of the unemployed. In New tori, the age
range is 45 to 64. In Massachusettg, it shifts to,25 to 34 --the- .
-Worst possible age range for being unemployed. ."
7. In absolute numbers, New York City has the largest number
250-241-
I
I.
4
t
0
of.idle youth not enrolled in school, not high school graduates,and not employed. The number is 245 out of a naflonal total of608. '
. 8. For the Chinese, the underemployment problem is greaterthan. that of unemployment.
I ,.
9." Under the 1965 Immigration Azt ants are granted _preferential visas if they are highlyedut4 pr possess skillsin short supply in. this country, but-dte-to zthe recentness oftheir arrival and their language difficulties, they invaiiably,
take low-payIngind low-status jobs to meet their immediate eco-nOiic needs.
,10. The census. shows that, once in a job,out Of their occupations.=
4
11.
} problemslevel of
few Chinese move
The native -born Chinese-American encounters differentof underemployment. He is generally stuck at the entryprofessional positions.
12.
qualifiedto obtain
Sometimes, deliberate attempts are made to keep highlypersonnel from attaining professional status in ordertheir services cheaply or for free.
.13. Attention is,being called again to the gross underemploy-
meat of Chinese females whose educational attainment is fairly, high,but whose occupational status and income are very low.
0
251v.
-242-

riY
p
O
RECOMRENDATIONS
-Judging on the surface from the.
unemploymenf rates for the
Chinese according to the.1970 census, the Chinese situation incomparison to other minority groups or to the national averagelooks wonderful. 'Nast economists or manpower,administrators wouldconclude that die Chinese are a model minority, a hard-workingpeople, a group that takes care of its own, and, hence, no'furtherattention need be directed toward them.'
This viewpoint is fairly prevalent throughout,Americaa offi-cialdom, arid it explains why so few programs with such meagerfunding have been set pp for the Chinese. In fact, most of the_uplift projects initiated under the "Great Society" and "War onPoverty" programs,arebised on the prevalence of pathological,conditions,in'the communitiet nvolved. lei group can show thatit has three times the national unemployment late, five times the'crime rate, two times the broken family rate, one and a half timesthe school dromittf rate, ad nauseum, the chances for obtaining
-governmental funding are excellent.' And, the opposite holds true.'If a people try to be self-sustaining, self-reliant, industrious,even to the extent of lowering their sights considgrably and ac-cepting work far beneath their qualifications so that they neednot be unemployed or apply for welfare, they are overlooked, ig-nored, or bypassed.
( In fact; the more vocal, activist members of th Chinese "dom
mutity are anxiously awaiting the results of this rd ort. Fromrather cursory deduction of the overall census fi es and from
superficial studies of social scientists who are no really famil-iar with the customs, the ways,the thinking, and t e history ofthe Chinese in,the United States, it seems that.ano her statisticalstudy of the census would only reinforce the belief that the Chinesehave to problems. .They have already expressed thee- fears to me.
V.
A New Policy
My first recommendation, therefore, is to loo' beyond theunemployment figures and interpret theM in conjunc ion with thecultural background and, special characteris'fics of the 4roup in-
volved. If the criteric:for government funding, enue sharing,
or awarding of grantp continues.to be based exclupathology, then the desperate may feel that they e to adop
_the tactics 'of the pathological laorder'to be'h d. If the
payoff comes from demonstrations, protests, -riot , violenceand such, the new'breed,of Chinese - Americans, who are imbued th
10,the American outlook in many respecti$ may feel at this is the
,
. X5.2 ;2.
a
-243r
yV,

rft
only way to attract attention and. to get,anything done. The factthat the government came running' with fistfuls ,of money into Wattsand Detroit and Bedford-Stuyvesant in the late 1960s hanot beea_lost upon the youth of ChinatOwAs. Such tactics have been increas-ingly employed or advocated to bring about some amelioration of theintolerable conditions in San Francisco and New York's Chinatowns..At the same time it does seem ironic that present-day goveruMentpolicy for service to its people 'operates on the basis of a' reverse treward system.
Job Referrals
4iy second recommendation would be to provide mare and betterjob referral services. to the Chinese community. Specifically, inthe larger Chinatowns, a bianch of the Federal or State EmploymentService should be set up with/bilingualpersonnel whO are fully'cognizant of the language prOblems and special circumstances ofthe hinese. These cheer counselors should make every effort tohelp the Chinese diversify inta.as many areas pf eMploymentfas.possible.
A good model for this,type of branch office is the State Emirployment Servicein San Francisco's Chinatown, under the director-,,ship of-Mk. Steve Lee, who hap a-staff of .approximately twenty-
4 five employment interviewers. Mr. Lee had been with the StateEmployment Department foi more than a quarter of a century beforehe was asked to'head the branCh office, which openedin /965. *
Each *_tenth he receives an average of about 500.applinatlons forjobs and manages to fill about 150 of these. "Mr. ,Lee feels thatjob placement of the recent immigrants is especially difficult ,
for several reasons. One is that the Chinese applicants need a-great deal of hand-holding: They are.timidifearful, and, we'" zofgoing beyond, the borders Of Chinatown. A second reasov. is, ofcourse, the languhge, and a third reason is, the nontransferabaltyof-former skills. For, example,, a_ skilled midwife has noMartetfor her servlces'in the United States. A subsistence" rice farmerfrom southern China would be totally rost on a ieebanizedltarm,
I.`where rice planting is done by Airplanes.
Mr. ;Lee also operates a chef training program_ under a govern-.
ment EDA grant, at which each trainee is charged fifty, dollars toattend school for a five and a half month period.- These chefs arenot trained to make chopstey and chow mein;,rather theyare taughtthe continental cuisine. After graduation, they are= placed in ,
hotels-and name restaurants. "cood.chefS can. .0earn up to $26,00per year," said like Lee, "and our trainees are accepted into'theunion readily." Mr. Lee feels that his training program has been. 1-
/
253-244-
4,

I
highly successful.
In New York, where the number of immigrants coming into that
city exceeds that of San Francisco by .more than three times, there
is no similar employment service branch in'Chinatown. Outside of
a few private employment agencies that handle restaurant personnel
only, there are two agencies partially funded by the gqvernment.,
These are the Chinatown planning Council,-which is a multiservice
agency that deals Only perlpherall7 with job referral; and the
Chinatown Manpower,Project, Which, is geared more to Sob training
than to job referral.
Both these agencies are funded by private sources, contributions,
and the government a ear -to -year basis. Some of the personnel
are volunteers., Those who are salaried cannot commit themselves toany kind of continuity or look upon their service as a career. There
is no question that service and borale could be greatly improved if
the personnel could look upon' their jobs as something more than a-,
transient position, dependent upon the yearly renewal of the grant
or the operating funds. That is why such an important service as
job referrals for the Chinese should havejsame permanence and con-
tinuity. Incorporating it into the state or federal Employment
Service and extending it to a group sorely in need of its services
would hive that effect: After all, that. is the, raison d'etre of
the, employment services in the first place. <
In an interview with Mr. Paul Wong,,the acting director of the
Chinatown Manpower Project in New York, I learned that jOb.appli-
cants run to about 125 per week,,but that placements.average only
about 15. The personnel in that office number one and a half place-,
went counselors, one job developer, and one and a half vocational
counselors,__"The problem," says the direttor, "is that four people
can only accomplish so much within.a.certain period of time."
Training Programs
The Chinatown Manpower 14oject in New York came into being in '
1972' with the backing of such dedicated public aerianteras.the
Honorable Peicy Sutton; Borough President of Han4attan;.Commissioner..
Joseph ,Erazo, of:thellanpawer Development and.Career,TriningAdmin-jt
istration; Commissioner Lucille Rose, of.the Human Resources Admini-
stration; and Bishop Paul Moore, of the Protestant Episcopal-Church,
who generously donated the facilities of a four -story building at
46,Henry Street to house the program. Thi fouading.director and
driving force behind the project was)Mi. Nightingale Fong; who has
moved on to become New York City deputy commissioner.44 employMent.
254 , ,
-245- '
-

()
-
,
From the beginning, the project wa set up primarily to equiptrainees with a basic set of skills so hat they could take on aprescribed job. The subjects chosen were typing, bookkeeping, key-punch, and basic office practices. In the beginning, there wereonly slots for twenty trainees. By 1974; there were sixtI traineesenrolled in these courses. The trainees receive a stipenal-of $50 -
per week for living expenses. The prograni lasts from twelve tosixteen weeks. The students attend classes from 9 A.M. to 5 P.M.daily. They are taught basid English and vocational,guidance inaddition to their lesson and practice at the office machines.
knThere are simulated job terviews, and the trainees are givenpointers on how to dress an what to expect in a job interview.All books and supplies are provided free to the trainees.
As it is currently setup, thwstaff of the Manpower Projectconsists of the following: the director; placement counselor,one and'a half; job developer', one; vocational counselor, one andebalf; teachers, eight and a half;_ipenttal information and liason,person, one; intake counselor, One.-,
The Chinatown Manpower Projeot in'New York is only two yearsold, but it bas already graduatedabout-ten classes. Under, thestipulations of government funding, the project must plaie 50 per-cent (the tequitement now is 75 percent) of its trainees in jobs.nig project has the proud record of 95 percent placement in non-traditional Chinese jobs.' In looking over the lists of trainees,I bbticed that the graduates of the-program were placed in banks,ineurancecompanies, the telephone company, computer centers, andthe like. They'were not graduated to compete again in the narrowand limited jobs with Chinese enterprises. within the Chinatowncommunity.
Jai spite of tfiis'outstanding record, I learned much to mydisbelief that, to a large extent, the,ChinatoWn Manpower Pxojectfunding' hai'come froci.priiiiite sources. Through solicitation 'bythe director, private companies such as IBM and RCA have pledgedsupport of the program in various ways. For instance, IBM suppliesthe,typewriters, keypunch machines, punch cards, and an instructor;RCA underwrote the costs of five other instructors. I mentioned1previouslylhatthe Protestant Episcopal Church donated the useof the premisda.
/,
,' For-this quality manpower training center, the project receivedfriim *government sources a mere pittance of $133,440 for the fiscalyear 1973. Of:cOurse,.the Chinese community is grateful that ithas, the cedter, aid it can be proud of the fact that it has success-
fully solicited'private sources of funding, but government fundingIlas been token at best. Again, we come back to the question: must
2 U;.r
-246,
./
C.
a group be penalized for self-reliance, efficiency, and4erformance?
,'My third recommendation is, therefore; tothe Department of
Labor. 'It should underwiite broader-based training programs for the
Chinese on a performance basis. :If the community or director cancome up with supiOrt from private sources, the government shouldreward such effort by coupling it to effort expended and resultsobtained. The worst possible policy would be to- say, "The Chinese
are doing a good job by themselves. We don't have to bother with
them. Yesi they have an enormous problem of adjustment and trans-ition, but they'll take care of their own." This attitude can only
.invite the type of protest add resentment that will manifest itselfin undesirablp ways.
A fourth suggestion would be to rectify,the glaring omissionof training programs geared more for the Chinese male. The subjects
currently taught are entirely in the clerical field. They should
be expanded to include training in the trades or crafts.
Remediation of Underemployment
To repeat, underemployment is a greater problem than unemploy-
ment for the Chinese. For example, political refugees are invari-'ably persons with impressive backgrounds. The American peopleshould try to utilize the'services of these people to the fullestextent. .Or take the example of the foreign-trained pharmacists;New York and Illinois aye the only two states where their creden-tials are accepted for/internship. Can the other forty-eight states
justify their refusal to accept these skilled professionals trainedabroad?
More attention should be paid to job referrals: Mr. Paul
Wong, acting director of,the Chinatown Manpower Project in NewYork, brought out the feet that those who come in to apply forjobs are. generally highly skilled or educated people. 'About four
out of five are of this caliber. -These people do not need training
except in English, and not necessarily in written English or gram-
mar. What they need are jobs in their line of work. A job devel-oper should devote intensive effort to locating jobs that needprOfessionally trained people with a minimum command of spoken
English or of public contact.' Given time, these people will pickup enough of the'language to function effectively. At the same
time, they will be self-supporting, and the stipends that theymight have received in retraining could be used foethe job devel-
oper's salary instead.
The underemployment of the native-born Chinese-Agerican or
2 5 6-247-
4r.

those who have penetrated the higher occupation groups, but arestuck at the entry leVel, poses a different'set,of problems alto-gether. Theirs is a matter of more aggressive effort to pushahead, to throw off the burden of past discrimination and stereo-types. Both these topics will be dealt with in greater length inChapter ITV.
\,
257-248-
J

A Ir
CHAPTER XI
THE_CEUTERLWORK ETHIC
The Purloined Work Ethic
While I was thumbing through some magazines in a waiting vimone day, an article called "Protestant Ethic, Chinese Style "''caught
my eye.. The writer' of the article was recounting' some of the
evangelical attitudei'toward work marveled at by visitors coming
out of China. Nothing revolutionary about that, commented the
writer. China filet borrowed the Protestant ethic of hard work
from the West. His exact words were less benign. I believe he
said, " . . . the Chinese purloined our ethic. . . . "1 'This
writer reminded me of the.period when -Russia was reestablishingcontact with the Western world after World War II anctwent about
claiming credit for'inventing everything imaginable.
Down throughtheamTthe Chinese people have known nothing,but hard work. There wasliFother,choice. When Sou must scroungeand scrape a bare livelihood from an overpopulated land,,you be-come accustomed, to toiling from sunup to sundown. As an undeVel-
oped nation, China had neither enough capital nor enough 1=4pin. ,
the ecdnomic triad of productivity. -All that was availible was
labor, and. highly competitive labor at that. It'was either work
or starve. That was a lesson every, Chinese-learned very early, 'in life and took with him wbefever he went.',
I can still remember idle- dais when Iivias alittle girl. My
father, opened. his doors at iii 0104a-in-Pie morning and closedthem atten'o'clock at night. He operated a-thand 1.4updry.like.
. .!:,,
most. Chinese in the tinted States did,at.thatAime.: Irecall how ','
I always 'awoke -to the swishing of ihe'imishitig mid** ind'thalatm,,of its-Motors.' lie Lived aboVehthe laundry, amitheligrk-vis,for- :, : '''
4 g
* *
4
1. Nation, (August.,2, 1971),
CJK
-249' 4,1
.1

-TABLE 73
EMPLOTEACHINESE WHO WORKED
40 OR MORE HOURS
134t
-vig
trIN 1969,-BY SEX
.
or.- moire
EMpliii,ed:ierdonitiCfears
4.-.
-,
4-8
OX
ftofessiOuallind TeChiiisAI-
.=
'73
"..Manager44%d- 4 :biiinistrAtet4
-7-
7 ,
,93
SedAtiliit
'--
...
:- .'
.91
,.....
.7...94'
---
Self
-f-
OnO
cixs
a_
.;40,410.40A;6.....
..1%,
18-.-:
."-:'2.---cIericiiriftikkeiia,..:....
".--
-71
-.-":- ArAfttitnen
:;.'-i,":',
.1,'"*
'';''
88
,-.:-
..°
:P.i,
;r-4
1';:i
t411
11c1
0:--
-gi-
t''V
--.7
-':87
-85.'
,,
..
1.
"*Pi
ar e
r,In
diip
try.
- .'
82
`:T
aattu
uly
92
...-:
....
.a442-Dry.
,Cle
anin
gLabors
---
'-
.*
60
-Sep
ds-"
ifor
keis
''..
-,
'Foo
dg il.C14S.
8182
trivate'Household '
85
. .,:r
-..
.
4,
Female
.;'''S
O h
is.*
40 hrs.,
60 hzs.*
.or-more
ur more
or more
.' 5
;62%
57
6%.
1-
282
25
770
0'',
'40
88
35
11
52
10
457
671
17
7/
828
67,
013
67
342
91
504
60
'0
17
.62
13
-'19
60
16
,
0.58
4
..
.*iiiCi: it. S.
Census Bureau, Special Tabulation; Public
Use Sample Data (1970).
NOTE:
Basdd on a 1 percent sampling.
*Subdivision of the 40-hours-or-more
category.
.a
-250-
.4

".
ever in sight. After washing came the starching, after,the starchingcame the drying, then the ironing, the folding, the sorting, and the'
wrapping. After.dinner,,it.was time.to sort the next day's-wash and
repeat the labors of the day before. Occasionally, my father. sat
down,, rolled a cigarette, drank a cup,of tea, then resumed his work.There was onl"" -brief time out for meals.
This went on'for six days a week. On Sunday, he opened from.9:00 A.M. to noon to accommodate the customers, who came in for their
packages, but we did no, washing oF ironing that day. After lunch,
my father went off to Chinatown. Sometimes relatives came. by to
visit the family. Each week there was a half day of rest.
On holidays, we'did not wash, but aside from these brief res-pites, the work continued the year around without vacation from oneyear to the next: In this fashion, my father raised his family of
five children.
I just took a pencil and figured the hours that my.father worked.per week. It comes out to sixteen hours a, day, six and a half daysa week, a total of ninety -nine hours.
A 100-Hour Week.
The hours in restaurant work are just as long. My si ter andbrother-in-law were in that line of work. Their day start at
10:00 A.M., when they started to prepare for the day's lun heon:The restaurant Opened up, at 11:00 A.M. It closed st padn ht, butthere were invariably stragglers who took their time f fishing their"
midnight snack. When my brother-in-law turned,the key in#3.he lockto the front doors, the help still had to mopThe.floo s and'cleanthe kitchen before they went home to sleep. At 6:00 A. ., my brother-in-law would 411 the meat and produce markets to order his suppliesfor the next day and then back to bed for another few ks before,
he got on the,treadmill again. .
The restaurant routine went on for scven'days a wee withoutending. In the middle of'the day; between lunch and Jinnthere was i lull, but the doors remained open. Restauran workinghours also ran close to 100 hours per week.
Backfire
Whenever I relate the above information to my children, theyalways, counter with, "But Ma, that was in YOUR days." I realize
now that the point I wanted to put across to them about how hard
260
-251- .
my parents worked and bow much-we as children had to help Outhe family business did not register with/my children at allonly did it not register, it backfired. Not only didtheyciate their life of relative ease, they just thought the ofmust. ave been pretty dumb clucks to have worked so hard.
inNot
t appre-folks
Now, mind you, when I speak about a 100 hour week I notreferring to thelMiddle.Ages: In 1938,-one of the most "r-ical"pieces of legislation to come out of the New Deal" was the ageand Hour Law, which provided for a forty-four-hour max work.,week to bedicreased to forty, hours by 1940. At the sake time,minimum wages were set at twenty-five cents an, hour to b increasedto forty cents by 1945." Today, the work week for white collar jobsis generally thirty-five hours and for blue, collar work- s, fortyhours, but then electricians, I understand, have a twent -hour week.
Not so for the Chinese. From'Table 73 we see that they stillput in long hard hours. An overwhelming proportion wbr forty hoursor more, and a considerable proportion of both males an femaleswork sixty or more hours., The onesiwhoTut in the long st hoursare the self - employed managers and laundry operatives. he propor-tion of males who work lesa:than thirty-five hours per ek is lessthan one in six, and for females about one in four. Obv ously, not toomany are part-time' workers. Nor does it look as if the women workmuch fewer hours at their jobs than do the men. About two out of_,five males who, are self-employed put in more -than sixty hours perweek: We cannot-tell from the census whether-they. put in is manyas the ninety-nine hour that my father' dial in bit; laundry. The
. fact that up to one-half of the laundrymen still work over sixtyhours testifies to thei lives as continubus toil.
More Than You Think
On'top of the long hours already reported on the census ques-tionnaire, I suspect that the' Chinese have not reduced their working.hours per week to any appreciable'degree, in spite of the changedattitude of the yOunger generations toward loft hours. Let me tellyou why I suspect this.
-Ten thousand female operatives work for the garment industry.One of the.advantages of working by piece work is the greater freedomthat these women have in coming and going, which allows them to fittheir working schedules with their domestic and maternal responsi-bilities.. One would suspect th t these women work to supplementtheir family incomes and that t ey would put in less hours than theusual forty. However, 67 p t stated that they work the fullwork week or more, and the probability is that they work more than
2131-252-
t..

PT.
A forty -hour, week.
The fact that they4must conform to union regulations is still
.no-deterrent, Thermions try to enforce their regulations, butthere are still many instances of women Working behind lockeddoors on Saturdays and Sundays. The extra hours are not reported
'because they may be contrary to union rules.
Restaurants try to abide by the eight-hour regulations, butmost employees in this line of work'must put in six days,a week
'
With one; day off during the week: That already makes the restaurant.workees week a,forty-eight-hour one, but unless the'businessattracts a continuous clientele, it cannot afford two shifts ofworkers,to cover Imicheon and dinner. As a result, restaurant -
workers get.what is know in the trade as a short-off; In other
'words, the worker's day is cut into two segments. goes to work
from eleven totwo o'clock, takes off for three hours, and resumeswork at fitrein the afternoon tocbrier the dinner hours. In sum,
the restaurant worker's day is a very long one.1, .
We have already mentioned in Chapter V the prevalence ofdouble shifts,and double jobs of many Chinese. The moonlighting'
may or m4y not be steady work, and is usually not reported to
the Internal Revenue Service or tO the Census Bureau.
Another'predominant dCcupatiOn of the Chinese population in -the United States is in the field of education To think: that
'teachers or professors merely put in the prescribed hours' in the
classroom is extremely naive. Many hours are spent by conscientiousteachers in drawing up their lesson plans, grading papers, andkeeping up with developments in their profession. Professors spendan inordinate amount of time doing research and writing on, top
of their teaching duties. Few of these people ever stop:to/add up'their work hourd per week. I can say'widiabeolute.certainty that'
. it exceeds thethirty-five or forty hours customarily comprising
the work week.
InThapter IV we also noted that the Chinese prolong their -
education far beyond the,ordinary, student's age. To my surprise
I. found that.a,large proportion'of.my students at City College of ,
New York work at a full-tiMe job. One young-fellow played the,drums. all night in nightspots'and came to My early class at 9:00 A.M.Andther stacked groceries all night in a-supermarket. A-thirdworked for a utility company, but found time to do his studying,
on the job. A nineteen-year-old girl sold stockings every day from
3:00 P.M. to 9:00 P.M. . .".
The fact, therefore, that the family- or personal incomea.of
262-253-

.17
-
AN
NU
AL
PE
RSO
NA
L I
NC
OM
E, B
Y H
OU
RS
WO
RK
ED
, PE
R W
EE
K O
F T
HE
CH
INE
SE, B
Y .S
EX
, 196
9.
.
-TABLE
74
Income
a
.,
Hours' Wotked Per Week
'
Workee69, Under 15
15-23
(100.0X);
Na. 4"--.
_X
No.
Males 16 yrs.0ve
$1-999 or Los.
$1,000 - 1,999
g,000 - 2,999
.
$3,000 - 3,999
$4,000 =- 4099_
$5,000 - 6,999
$7;000
:- 9,999
$10,000 ,- 14,999
.
$15,900 - 19099
$20,000 - 29,999
$30,000 - 49,999
-
$50,000+
r. .
0-
/
Females 16 yrs., & Over
$1-999 or Loss
$1,000,- 1,999
$2,000
$3,000 - 3,999
$4,000 - 4,999
$5,000 - 6,999
$7,000 - 9,99'9
$10,000 - 14,999
$15,000 - 19;999
.$20,000 - 29,999
$30,000 - 49,999
$50;000+
_136',200 '
45;766 -
12,3960
11,206
10,500'
_- '10,600
':
9.000
17,400
21-000-
23,700
4,800
'44-400
'
.1 300
.
--
600
.. .
5,706
5.3
12,300
2,100
344 : 1,500
.:.'17.1.-:. 1,50
.600
-
'7.8'
.2,000
1,006-
-43.;§.
,1,800.
,ipo,
. 1.4
1,266
300
-1.0. :
200
- .200--!:'i%0
-'1,300,'
100
0.'4
1,2Q0
, 100
-
1.2"-
-300
0-.0
,200
0'.''
O.'
100
.0
-0
.
85,400 .;5,700
8.7
15,2Q0
2,800-
32.6'
13;900
1;200'.-13-.8-.
2,400
3,0007
966
,0.
760
4400
9,100
400.,
.0
2;$00;
9,400.,
-400:
5.4
Roc(
14,300
200
- 1.6
1,600
9,200
100
1.2
690
3,900
'
106
2.8
., 600
700
00
0200
0'
0100
400
00
00
00
Source:
U. S. Census BUreau, Special Tabulation (1970).
NOTE:
Based
on a 1-percent sampling.
4'
-
35 -39
.
40
41-48
X*
.
No.
Y.
Ro-
7.
No.
XC
,No.
'
%.-
4P
11.4
4,700
4.3
48:800
45.1 -16,100
14.9.
20;700
19.1
`24.6
A,
0'
01,700
27.9
400
6.6
400
6.6
21..4
.400
5%7
,2,300
.32.9
_700
10.0
900
12.9
.
26.0
zoo
2.6
1,800
23.4 -
1,500
19.5
1,600
20.8
300
3.6'.
2,606
31.0
1,100
13.1'
,1,600
16.2'
7.9
200
'800
2:7
5.3
31,600
6.700
48.6
1,000
41..1
2,500
13.5
16.4
1,300
3,700
17.6,
24.3
6.7
1)30
06.7
9;100
46.9
3,200
16.5
4,300
22.2
.-54.2.
3.5
5.1
900-
'200
300
3.9
2.3
7.7
14,200
4,300
1,800
62.0
2,900
50:0
1,800
'
46.2
800
121.7,
20.9
20.5
3,600
,1,900
800
150
22.1
26.5
9:1
100
9.1
300
27.3,,
100
9t1
500
45.5
*0
400
66.7
100
16.7
100
16.7
1.97
7.,000
16..7
29,900
45.6
-4,800
7.3
5,200
7.9
27.9
400
4.7
..1;800
20.9
"
300
3.5
900
10.5
14.5
860-
9.2
2,700
31.0
700
8.0
:306
3.4
.23.9."
700
9.9
22,700
38.0
1,000
14.1
500
7.0
25X-
MG,
11.3
3,400
42.5
500
6.3
800
10.0
12.2.
800-
.10.8
4,400
59.5
200
2.7
700
9.5
'12.7.'
1,800
14.3
7,100
56.3
1,200
9.5
700
5.6
7.-1
1,200
'14.3
'
5,400
64.3
400
1.2
1,000
11.9
'
'300
8.3
2,100'
58.3
400
11.1
100
2.8
'
0'0
'0
300
50.0
100
16.7
200
33.3
50.0
-
0'0
0100
50.0
00
o.
100
33.3
60
200
66,7
00
00
00
0.
-254
-
' # /
the Chinese look rosier than the national average must be probed
a little deeper to uncover some of the reasons contributing to the'
higher figures. Long'hours are definitely an important factor.
This statement is substantiated by the cross tabulation of personal
income by hours worked per week of the Chinese... (See Table 740"
The table is constructed%to.show a horizontal percentage by
income group. The higher percentages armori toward the right-
hand:dolumns of longer work weeks. Again,' an anomaly shows_up in
these figures. .Foi inetance, 45 percent of the males-who earned
$30,000-$49,999 put in More than forty-nine hours. On the other. '
hand, every income bracket showed a large proportion who also put'
in forty -nine or more hours without improving their financial
positions. The conclusion to:be drawn from this data is that
to earn more a Chinese must work 'longer hours, but longer hours
do, not necessarily result in a'higher income.
; A
ZoWeeks Worked Per Yeart.'
There are only fifty -two weeks in a year.' 61 percent of the
Chinese males worked tEe full year. This percentage is much lower
than 68 percent for white males and 71 percent for Japanese males.
(See,Table 75.) The figures do seem a bit low for the Chinese
and appear somewhat out of character. Since the number of weeks
worked includes paid vacations, we can interpret these figures
to mean that the Chinese are not fully employed throughout the
year. I do not rUle'out this conclusion. ,If so, then we. see here
a symptom of employment malaise. Howevitr, there may be some other,
plausible reasons.
Over 5 pereent of the employed Chinese are educators who may
be employed on a school-year bisAs, Which is nine to ten months
per year. It cannot be said th.it these pecIple are working at less
than full-time.
Another 10,000 Chinese fatties are in the garment industry,,
and they are paid on a piecework basis. The garment industry is
seasonal. There are months when the new styles Are coming out and
.the workers put in extra hours. Then come the slow periods and
t-there is little or no work for. weeks on end.
And, finally, we must remember the prolonged years of education,
whtch prevent many a student from being employed for the full Year.
In spite of the above explanations, the figures still appeardisquieting. and merit closer scrutiny to discover the underlying
reasons why the Chinese work fewer weeks per year.
2 6
-25s- .

a
a
.TABLE 75
'COMPARISON OF WEEKS WORKED IN 1969BY ETBNIC-GRQDP AND SEX
1>a
C.)
-
e .1
Males 16 Years and Over
Chinese
Japanese
Whites
Blacks
,_
61
22
17
42
30
28
7116
13
522522
-
.
-68
1913
44
'
2729
58
27 15
43
' 32.
'26
50 - 52 weeks
'
27 - 49 weeks
26 weeks or less
Females 16 Years and Over
50 - 52 weeks
27 -t 49 weeks
.26 weeks or less
e
1,0
I
Source:
.S. Census
7.
/..
Spanish
Surnamed
62
14
39
29, '-
32
Bureau, 1:14 S. 'Summary PC(1)C1, Table,93;.Sub
ect_Report PC(2)1G.
-256-
n.,

c7.
h.;
1 . 4 .T
/ ' '14. .:
- . .._ ' A
5 . . ..
Table 76 may give us some 'clue. It Aho s weeks'porked by
age group and sex. For males, the 35- to I.year age gimps
seem fully'employed. IL'-is the-teenage and early twenties age
groups that work only part' of tie year.
,The female work cycle is different. ,woman's childbearing
. 'and childrearing'iole reduces her ifivolvemint in paid, employment
during the .20-- to.44-lear age group, and t is-the'middle-144-',- woman who is more able to devote full'tdm to a job'outside the .
home. .This fact has always been apparent but insufficient attentionhal been directed toward helping this s eat of the labor force-in
-its special circumstances.
I7 ',
1
Occupation and Weeks Worked
Is. a 17year employmedt more common with certain occupations?
. From 'Table 77 we -find that laborers, salespersons, operatives,,clerical workers, and Service workers are more likely to have ashorter work, year. ositionsfin these job categories have.tradi-tionally beeft more unstable with a higher rate of part -time work
* and turnover.,.4,
Ak!pa6tern appdhis when we scrutinize the 'reeks worked for
4.selected cities of Chinese condentration. The SMSAs with the, larger
proportion of recent.Ch-inese immigrants, such as Boston and New YorkCity, :find that their employed labor force works a shorter work '-year,than More established -communities like Honolulu and Washington,
D.C. # (See -Table '780
How do we reconcile the png'work week and the short work .year for the Chinese? Reviewing-the situation inlight of thegeneral economic conditioni for 1969,, we ,must, take into accountthat theyear preceding-the 1970 censug was a recess4n year. .-
However, if employees are eager to work and to work long hardhourswhen.they are holditig a job but, are not, sure of haVing year -round-employment, then we have uncovered another symptom Of 'employ-
ment ills. .
Hard Work Out 'of Style?..
Is'hardwork,going out o$ style? It-doesseem that way with'
high rates of absenteeism,idle youth, clock-Watchers? threerdayweekends, job dissatisfaction,'unreliable help, 'and increasing .
welfare already mentioned *at when I broached the subject:of hard wori,,my children found itie thought of working long hoursstupid and the idea of working the year round' without letup unthinkable.-
-257-

-
-
TABLE 76.
-
..
WEEKS WORKED BY CHINESE EMPLOYED 16 YEARS AND
BY SEX 114D,AGE GROUP, 1969
Weeks Worked,-
Total 16
--Yrs= & Over
Males Employed
,
132,516
50 -52 Weeks
-81,-16
27 -49` Weeks
28,856
'
'26-Weeks' or Less
_Percent Males Employed
50- 52
61.2%
,Weeks
27-0 Weekg
--
21.8%
N).*
26 Weeks Or'Lass
17.0%
C")
*t t,
Females Em lo
50-52 Weeks
27-49 Weeks
26,yeeks4 Less
Percents F
50 -52' Meeks
27-49 %4e'elcs
26 Weeks or Less
ro
leer Employed
Source:
83,821
35,146
25,500
23175
41.9%
30.4%
27.6%
16-19 Yrs
20-24 Yrs
25 -34 Yrs
35-4yrs
.
.45--64
'Yrs
10,760
17,889
30,778
30,096
36;1
82,
4131
.1'
1,658
5,230
-20,111
-23027.
.,4,28,221
2;619
2;443
4,871
7,302
,5141-76-!=z.
7,606
,158:
.
6,659
7,788
3,365
1,293
'
-1,034
15.4%
29.2%
65.3%
77.5%
22.7%
27.2%
23.7%
18.2%
61.9%.
'43.5%
10' .9%
4'.3Z
8,988'
16,439'
18;862
17,612
!1,041 -
4,751
'
8,151
9,322
'1,11.8
'4,931
-..
6:,282
--
5;381
5,829
6,757
.4,429
.2;909
-
'
11.6%
28.9%
43.2%.
,'-..
52.9%
23.67.
30.0%,
33.3%
30.6%
64.9%
41.1%
23.5%
16.5%
U.S.Tinsus-Bureau, SUViectReport, PC(2)1G (1970.
MIE:
Based on a 20. percent sampling.
1
.
,
- .
."
73.9%-s
54.4%
19.9%
'
'
6.2%
.21.5%
,
.20,066
1,854
11,195
686
6,122.
666-
2,749 -
'
502
.:55.8%
-37.0%
30..5%
35.9%'
13.7%
.2/.1%'
J4

S
TABLE 77
.-
N.
..-.
.
"'WEEKS WORKED BY EMPLOYED CHINESE IN THE UNITED STATES,
''.
BY OCCUPATION, SEX, AND PERCENT, 1969
.- .
1\D
,Cn.
Co
Employed Persons 16.Yearslh
Worked' in 1969
,
44'
50
- 52
40
Weeks
-26
1 -
13
:- 49
27 - 39:
14"
Male
_Female
Male Female
Male Female
Male Female-
Male 'Female::
..
...
71%
85
64
62
. 86
6380
57
78
6483
44%
93
5959'
50'
44 080
2552 23
13%
13
16
14 8
15
13
11 016
.17
.
21%
3
14
18
'17
29 0 02519
15'
7%
1 9-
1 4 8 7"
7
11 8 0
-
14%
3
11 5 i
1714 0
' 0 014
31
8%
0 7 7 2'
,' 6 Q
11*
J1 8 0
T11%
-0 -5 0 0
-7.8 X) O,,'
25.
14 8
'
;-0 I-
,
1%
.1 5
:i.11-''
00
7 0'14 6 4
"D
-8%
011 817 5 0
2025 1
23
Professional, and Technical
Managers and Administrators
Sales Workers
.
Clerical Workers
Craftsmen
.,
Operatives
Transport Operatives
aborers.
Fa
Workers
Service Workers
'Private Household Workers
Source:
U.S., Census Bureau, Special Tabulation, Public Use Sample
Data (197Q).
NOTE:
Based on a 1.percent.sampling.
-259-

TABLE 78
WEEK WORKED IN 1969 BY '1'HE CHINES IN THE U.S.FOR SELECTED SMSAS, BY SEX''
Total16+'
_Hales 16, Yrs.+
lEoston..Chicago'Honolulu.L.A. -Long Beach
N.Y.C.-'..Sacramento
S.F.-OaklandSan JoseSeattle-EverettD.C.-Md.-Va.
Females 16 Yrs.+BostonChicago.
HonoluluL.A. -LongLBeachN.Y.C.SacramentoS.F.-OaklandSan JoseSeattre-EverettD.C.-Md.-Va.
3,929-3,828
14,06512,75923,405e-2,948
25,8912,704,
2,3272,387
2,510'
. 2,28410,3998,30514,096
I
. 2,118. 9,213
1,480= 1,449
1,642
50-52Wks.
'27
X
-49Wks.
'26 Wks.
or less
2,014 51.3 988 25.1 927 23.6
2,396 62.6 863 22.5- ., 569 14.9
10,726 76.3 1,606 11.4 1,733 12.3
7,954 62.3 2,777 ?LS 2,028 15:9
13,181. 56.3 6,602 28.2 3,622 15.5
1,955 " 66.3 488 16.6 505 17.1
15,698, 60.6 5,859 22.6 4,334 16.7
1,741 64.4 495.. 18.3 468 17.3
'1;379 59.3 601 25.8 347 14.91
. 1,717 71.9 352 14.7 318 13.3
836 '33.3 922 36.7 752 30.0
8 &3 38.7 828 36.13 573 25.1
6,163 59.3 1,941 18.7 2,295 22.1
34284 39.5 2,73/ 32.9 2,290 27.6
5,675: 40.3 5,256 37.3 3,165 22.5
721 34.0 449 21.2 948 44.8
8,018' 41.7 ,6,296 32.8 4,899 ' 25.5
548 37.0, 415 28.0 517 34.9
568. 39.2 493 34.0 388 26.8
722 44.0 425 25.9 495' 30.1
i
Source: U.S. Census Bureau, Subject Report, PC(2)1G 0970).
NOTE: Based. on a 20 percent efmplingt I,
w ,
265-260-
tis

a
They have the luxury of this attitude at present. they beable to afford the same attitude when duty, obligation, and necessityreplace parental support? Or haVe these values also gone out ofstyle?
A survey by Daniel Yankelovich found that "students, by andlarge, no longer subscribe to the traditional view that hard workwill pay off. Nor do they regard work as an important value.Yet in spite of these feelings, .there is no visible sign of any,
increased tendency toward avoiding hard work as a necessary partof life."2 In the same survey, 37 percent did not believe thatduty comes before pleasure.
Eli Ginzberg, chairman of the National Manpower AdvisoryCommittee and consultant,to six presidents on manpower policy,rejects the notion-that people no longer want to work hard. Hefeels that thd conditions of our lives have changed. Social andwelfare benefits have liberated people from working solely tosatisfy/their basic needs. People now want control over theirown lives. "It is not that people have gotten lazy; rather theylike the notion that they?re not beholden to their present bossfor their future to the same extent that workers once were."' Hefeels thatpeople will work hard if they have an opportunity toget something for working.3
Do the poor want o work? This was the topic of a studyconducted by the Brookngs Institution. One of the questionsasked was, "Supposing that somebody just gave you the money youneeded every irk; would you.like this better than working?"More than 72 percent of all groups responding said that they wouldrather be working. The .poor consistently expressed the view thateducation and hard work were the means to get ahead.4
Then how is it that Studs Terkel can write a huge, fat volumebased on interviews with people from all walks of life and cometo the Conclusion that most of the 85 million' white,- and blue-collarworkers in this country hold jobs which make them sick?
Y
Daniel Yankelovich Inc., The Changing Values on Campus, Surveyfor the John D. Rockefeller, III Fund (N.Y.: Washington Square Press,1972), p. 30.
3. Interview with Eli Ginzberg, "Is Hard Work Going,Out of Style?" inU.S. News and World Report (August 23, 1971), pp. 52-56.
4. Leonard Goodwin, Do the Poox3WX[t Work? (Washington, D.C.:Brookings Institution, 1972).
-261-
27d

Workers suffer from headaches, backaches, ulcers, alcoholism,drug addiction, and even nervous breakdowns, all because they findtheir work unsatisfying and consider it "another form of'violence."After three years of research, Terkel reports that most of the.people he interviewed found their work monotonous or painful.5
mostwithout the benefit of interviews, surveys, and studies,
most of us will agree that present day job performance leaves much,to be desired. And while we rail at, the other person's indifference,
we rationalize our own slack. For instance, the man who takes the
Monday off to go skiing will level his choicest obscenities toward:the automobile factory worker when his brand new. Chevrolet breaks
down en route to the ski lodge. The new bride who feigns sickness ,to stay home from the office for a furniture delivery is infuriatedwhen her sofa does not arrive on the date promised because thetruckmen obtained tickets for the World Series and did 'not show up
for work. And so on, down the line.
Most people need an,Ocupation. We are-programmed since infancy
to look upon a career occupation as a source of iiivelihood and
as a respectable means of engagingour.time. However, we may fiat
very distasteful the tasks we must perform within that occupation,unless we find other purposes and other meanings in those chores.
Charles Reich, in his book, The Greening of America, blamesthe media and advertisers for job dissatisfaction. Through tele-vision and the "slicks," the public is persuaded to believe in the
6principle of hedonism. Pleasure is found in sex, material possessions,
and excitsRent. "We are no longer expected to find work happy or
satisfyiiii7 There is, for example, no advertising designed to create
pride in craftmanship or in a worker's self discipline. Nor is
anyone convinced that he should work for the good of the community."6
Attitude of Chinese toward Work
The stereotype of the Chinese is that he is a hard worker; heis a reliable worker; he works long hours without letup or complaint.I think our census data bear this out. For this group, the condi-
tioning of the old country still prevails. For most, the problem
of economic survival or security is their uppermost concern. Theyhave little choice.' They must compensate for their disadvantaged
5. Studs Terkel, Working (New York: Pantheon, 1974).
6. Charles Reich, The Greening of America (New York: Random House,
1970).
-262-
271

,
..position by having more in the family work, 'hy working longar,hours, by-- working at moni-tliat-46me-jeb. ".
, ADo they enjoy their, work? Are;thorless disenchanted than" the"
workers Studs Terkel interviewed? After,l,had left-home-and. gone to-.college, I used to lodk'bick-at.our family life and marvel at thestamina that my parents exhibited: And rbelieve_it was, the normfor their compatriots in this country'at the time. I neveirealiiedthe depths to which my-father hated fhe'Woribe did-for more tben,thirty years of his4ife. This feeling revealed to me WAgnwent back to Hong Kong to visit himrafte#Hhis retirement: Yet, I ..:,do not recall that he ever slackened bisipace, slept late just becausehe was too tired, Or took off a day other than a holiday.
What kept him goiiii-when he was.bone-tired and sick of themonotony and drudgery of his work? I cahmenture my, own opinion:livelihood, duty, and future godI;--thesiiple reality was thatthere was little else for a Chinese to do at'the time, and dutybound him to su port his family to the best of his ability. But' '
I suspect that hat kept my father going yes the thought that inthe future, wh he had laid an economic base, he could cast offhis yoke. Providence was good to him in that his plans bore fruit.My father bought a building in Hong Kong after his retirement andlived off the milts-for the remaining twenty years of hip life.
--The work-horse image that I carried of him was dispelled completely .
when I saw how much he, too, knew how to enjoy economic freedomand leisure.
The Past Is Past
Perhaps I am reminiscing about a bygone era and differentcircumstances. Formerly) the Chinese in the United States was' asojourner. He planned for his eventual return to a land wherehis status was more assured. Today's Chinese are transplants.They haie cast their future in the United States, but they areno longer sure that a pot of gold is going to beat the end oftheir working days. The rewards are more uncertain; the prospectsmore illusory.
-As Eli Ginzberg said, "People do not mind working hard ifthey have the opportunity to get something for working." Peopledo not shun'work if work is fulfilling, for as one sage remarked,
. "By_labor -Wisdom gives pulguancy to pleasure, and by pleasure sherestores vigor to labor.",
Our forebears were haunted by-the specter of economic inse-'7turity and bound by the strong bonds of duty. The upcoming .
-263-
27?6

' ' .
-.,
n.
;,
generations' of Chdriese-r.Americana .at e,..be* hioUgh:E,.up, in.-a climate
'. that takes affluenCe-for granted. `Ye.s*.reven some 'of .-the young-
-Chineee immigraitts' Whose f4bers gcaMe;-0-"tt4s country. ahead 'of
-- theit families 403; -this"*ay., The children did not, see., their
fathers. toil and'.:Sweat at their 'liars. They cashed the remittancechecks sent- back to, Hong, Kong, which pith a favorable tate of ex-
,
change afforded the:roversoverte.43..Ch.ines.
e. families a relative_ degree ofz..
, affluence. - '.
,_ , .,
"
; . It is not the- -color `of the--,ski al or national-origin that deter- .
' billies a person's attitude, toward work.- It 'is the'circumstances
Wend ondition's surrounding one LS upbringing. Those' who are reared
With.tlie specters of 'htinger and want stalking them are 'Compelled
to put their nOseS to .ths grindstone. In this country;,we now have
. 1 social benefits which reduce this insecurity,' so it Is inevitable
that the intensity- of work efforisis- correspondingly reduced.
ICareer Choices.
This freedom_ from- the shiales.of want 4. h.11 duty in-the choice
of occupation was 'quite' apparent in the study. done' by
' Yankelovich. Of the 1,244 siUdents.he surveyed', he ,tound-' the
Joliowing goals, ±n determining career choices, -*order of impOr'tance: chance to make a contribution; .cliallenge' of the job;"
ability to expresa Oursplf; free time, for outdide interest;:opportunity to work with other people--not manipulate them;'se,
curity; money; chance to get ahead; family and job. - prestige,
It is interesting to note that security and-, money-fall at the.
lower end of the scale ,of goals.
In a questionnaire. that I handed out to, a group of young-
Asian MBA (Master, of Business Administration) students from Eastern
Seaboard colleges at a, conference held at Columbia University is
1974, I elicited some inkling of what these budding busineSsmen .
considered personal success. They were given five-choices ,to. rank
in order of importance: $50,000 a 'year; high policy- making poSition;
doing something worthwhile; doing what you enjoy ,doing;,,Making a
name for yourself. The stand-out criterion_ of success was high
policy-making position, followed' by doing something? worthwhile;
and then doing what you enjoy doing: The $50,000 was ix the middle:
The prestige or name came last. .
.
Thirty-five of the respondents out of a,rotil of forty-nine
7. Yankelovich, Op. cit., p. 47.
27 3.-`
-264-
tC

were foreign-born Asiani. Yet their aspirations did. not differ
much from the students from Mr. Yankelovicb's sample. The oppor-tunity to make decisions and to feel that one's work is worthwhileare more 'Important than the money or the prestige.
ti
B.W. was my, student in his freshman year.' 'He-was a veryoutspoken and idealistic,young'man. The late sixties and" early
:seventies were the peak years of camput unrest;: and the numberof students who did not question-the status quo^ were few and far '
'between. Let me statfor the record that B.W. was a fairly vocal.ditsenter.
- -
Aftet'he had finished my class, I did not see' him for morethan thted years. Then -one day he came by my; office to.,say goOd-
:hya. graduating," he announced I could not believe that .
-the :Years hAd gong:by -so swiftly, but B.W. had changed so much hewas almost like's different person. He was neater. He had even'.grown taller..-He was deferential,.and the'way he talked showedthat he had matured'a great deal overthe three years'. B.W. was
'twenty-four years old. He had come.to,-the Unite& States at agethirteen; and he spoke with a slight Accent We had a long talk,
.and'he told me- his plans for the future. The reason I had notseen him around campus was that for.his-last year te.had'beenworking full time during the day and finishing up his course workat night. He was studying electrical. engineering, and he workedfor a electric company repairing transformers,, starting at $170'per_week. He was-then earning200. As'soon as he graduated,.hibsalary would be upped to $220.
"Looks like you'reall set," I commented. '1,Dg you like your
work?"
"lee an easy job,"'he.replied. "the teaton why I could Workfull timawas that I had plenty of time to, do my homework on companytime. The first'day Ivett to try out .for the job, I,repaireifour, transformeit that day, even without-experience. .I'could doten now,'Ihir I only do one or two."' .
;
'MY,interest "was ;piqued. "Why?" I asked.
.
"Well, when'I-first went there, I trieeto do my test, andmy4ellow workets came upth me-and said, !Whit are/you trying
k -to,prove?' I didn't want to ,get on the bad tide of my fellowworkers, so I slowed doUn. The supervisor doesn't complain. He'svery satisfied with mY:work. Ithink I would like to go into
. -
, research .and development.t lel felt I were on the tail of something.,interesting,- I'would work day and niiht., Mid if I,came up with a
development, I Coulddemand an increase in pay, a promotion, of
.2.74
-265-
N
, ,

fi
start looking elsewhere."
, I an not going to classify B.W. as a.slackerhelyorked at alull -time job and carried a full course load in college. B.W.is playing the game according to the rules. Re is a motivatedand intelligent young man. He is moving ahead and he is settihghis sights on the next goal to be attained. He went throUgh the
° usual stages of probing and questioning when he was growing up,and he adapted easily to the circumstances at hand. I don't thinkhe will ever take a subservient stance because he is quite confident
,of his own ability: ,
'The difference between;the old work ethic-and the new stemsfrom the 'Change in our economic circumstances and our outlook onlife. In former days, work was looked upon as an end in itself.Today, work is the means to an,end and is not the sole pursuit inlife. This is a societal change that the younger generations aregrappling with and trying to bring about.
Cad Chinese youth help but be affected by the social milieuin which they live? As they are redoved,in time from the. immigrantgeneration, they too will take on American values and will exhibit
. a loWer lintenslty, of work effort.' Let me give several specificexamples I pcountered in dealing with my students at City College.
'late
..
In spring of 1972, I received- a call from a goverhment.personnel officer who told me She had six typist jobs for thesummer. She inquired whether any of my'Students would beinterestedin applying..., Frankly, 1,Was very excited, about the' offer` because
shmmer,jobs are not exactly'the easiest to get, and fthoughi thatamong my students there would be a number who would jump at the'opportunity. At ieast that is how I erroneously viewed the'situa-tian. I took"my student,roster'and called six'persons immediately.,The general reaction was: "Typing! I don't mantto type." Notone of the siX exhibited the.least interest. They'waited to workat something more exciting. . , .
a received a circular announcing A position in Washington, D.C.,with theCivil Rights Commission.- Iwanted to reconimend one of my
. 'Ivry bright students who' watt extremely active in'Asian-Ameridanaffairs on campus. I felt, that the position was tailored-inade for
him and that, if*he reallY.winted to work for the cause of Asian'Americans, here was his chance tb demonstrate his zeal in a positionwhere he could bring about dhadge. He,refused to apply, although-he said the job appeiled to,him beause he)did not'want to leavehis friends inNew York: .$ . , .
I,
... ,
. , =
I visited a edumunity.,program 'set up by the Neighborhood Youth ,
1
s., ,
275.-266-
,
I
I

V.
Corps one summer.; The intent of, the program was "to keep theyoungsters off the streets." A number of young lads and girlswhom I recognized were there. /t was a Iery hot afternoon, and
some of the young men were stripped to the waist and sprawled
out in the seats or on the benches. -There was not the slightestsign of any activity.
"What are you doing here?" I asked.
"We wog here," I was told.
"Really! What kind of work do. you do?" ,
"We stay off the streets."
That may have been,a facetious remark, but, in looking backat the events I pregame these young people had fulfilled the intentof the program.
Work Is Saintly
Industry is'a commendable trait, and it is fast becoming a
scarce one. But even good things can be overdone,, and the Chinese
tend to overdo in this area. If we are immigrants from China, we,are too recently removed from the fear of ditre want ,to be indolent.If we, have grown up in this country, we,are just as recently removedfrom the injustices of racism, prejudice, and discrimination. Allare haunting' specters. We are like squirrels let loose in apileof acorns in autumn. Never have, we had such an opportunity to make
money,'so we work without ceasing to store up our acorns for thewinter. -\ .
. .0
We are so ingrained with equating saintliness" with work thatwe also equate idleness or leisure with sin. Imbued with thesevalues as conditioned by our circumstances and environment, we
0 carry them throughout our lifetimes, and we are self-propelled,driven mainly by our sense of insecurity.
.
In .a visit ts a Cfiinatown garment' factorysifting on the edge of their,seats, itching tomachines. It was a: ost
oflone o'clock and the en
Union regulations, ecree that no one may work dur
period and all macilines must be closed. But instea
. .
I saw the women .
et at their sewingf the'lunch hour.
the lunchof utilizing
the lunch hour t6 get away from their work, to eat a leisurelymeal, or to relax a bit, a number of women utilized their lunchhour to ready their garments in preparation for the clock to strikeone when theyeould open their machines again.' They were paid by
273-267-

a.
4
the piece and they were racing against themselves. These womenreminded me of race horses straining against the reins at thestarting gate.
I have a Chinese neighbor who used to be a-designer for oneof e largest department stores in the country. By profession,he i also an architect. During the weekdays, he works full timeas designer. At night, he, works on commissions as an ar hitect.In payment for rede6orating it,' he acquired shares in a restaurantat which-he works as a maitre d' on weekends. Actually; one in-come would have sufficed for this gentleman's family expenses, butthis'way his time was totally taken up by his work,oleaving verylittle time. for him to spend with his wife and children.
Insecurity
' One of the leading complaints that my students voice against-their parents is that they are hungry. There is a greatdeal of hidden resentment that t e parent's love of money is greEieerthan their love for their children. Of course, the parents feelthat their toil-is to provide a security-cushion for the children,but fthink the children would bather have more. of their parents'time and attention. The genet tion gap between parent and childin the Chinese family is already very wide, and we are seeing themanifestations of that gap_ in behavior 'problems of the young people.I do not know to what extent the work habits of the older genera-tions can be changed. If they cannot, the younger geherations,who are more flexible, must try to understand the thinking andconditioning of their elders.
The Chinese are also driven by fear 6 losing theirdobs.When they work, theyvrllong, hard hours, but for one-sixth ofthe Chinese malesowho worked twenty-six weeks or less per year,it may be a feast-or-famine situation. 'The census data is notdetailed enough to support this conclusion, but this clue may besymptomatic.: It is recommended that further inquiry or a_closerlook be taken at the extent of and.reason for the part-time employ-ment of the Chinese.
Overcompensation
. It is not just that the Chines; equataindustry, and hardwork with saintliness, it is also that they can* afforeto bemediocre, or to let their guard down that they mhst uphold the goodimage of family and national group, that one bad egg spoila the
' broth for all Chinese. Combined, thede psychological burdens
-268-4

.4
1/44.10.
constitutea heavy yoke to bear. . .
R.C. stood up in class one day and told about, his experience
when he went to apply far i Christmas job-at M ; 1/epartment
Store. had just joined a' long lihe'lof applicants when., the
petso ficer came out of his office and walked up and down
the 1 ling out all the Chinese applicants who had gone with
R.C. to ply for jobs, c"You, you, and you," he said, "are hired.",e,He had not even looked at their applications,
"Why?" inquired R.C.
"All Chinese .are good workers," replied the.personnel officer.
R.C. and his companions d not refuse the jobs, but they,
felt that they had to measure up to a certain expectation. Theyhad an-image to uphold and could never feel free to let theirguard-down. ,=If someone did. not fit into the mold, the generalcomment would. be, "You are not like a Chinese."
Good or Bee
Commenting pn the work ethic of therChinese,or any othergroup of people involves a value judgment whether it js good or
bad to keep one's nose to the-grindstone, to.feel obligated todo one's best, or to have the freedad to take one's job in strideand work at-one's own will and pace. The answer may depend upon
which side of the fence we are on, Wbether-wreare the employer
or employee.
The work ethic may also involve a cultural background or
heritage. People from the southero climes are inclined to takethings easier because of the hot weather: Two thousand six hundred
years ago, Confucius had already-laid down a body -of ethics forChina, and this is what he hid to say aboutjndolencel
"A lazy person is like a piece of rotten wood.,'It cannot,be carved."
Edwin Markham, an American poet, cried out in protest whenhe saw Mil.let's famous painting, "The Man,Writh the Hoe," which
shows a farm laborer gnarled and bent from his work in the field.,tHe penned his famous poem with the same title. Markham viewed
man as slightly below the angels, thus his anguish at seeing, this
noble creature of God's creation'ag-"abrother to the pZ"and"a slave to the whehl of labor." He asked:
s
. .
s
,269-
4
-.

611
"Id thip the Thing the -Lord Goa made and gave ,
To 'have dominion over sea and land; ,
To trace the stars and search the heavens for power;To feel the passion of Eternity?"
..---\
Somewhere between-
Marihmand Confucius, there must be ahappy medium.
;
1. air
b
-
2 7i)7270
or

4".
I
f.
SUMMARY OF FINDINGS
1. The'Chinese were'conditioned,by economic necessity in
their homelandto hard work and long hours. ht.
2. , 100;-hour weeks were quite common in th% traditionaloccupations of laundrjes, restaurants, and small'business enter-prises:
3'. Long hours are still the rule, rather than the exception,among the Chinesetoday: '
4. Moonlighting, or having a second or third job, is fairlycommon also.
5. When calculated in terms of hours worked, the hourlyincome rate of the Chinese appears less favorable.than the totalincome figures would indicate.
6.-.Ths work year is shorter for the Chinese in comparison^
with other ethnic groups. Only 61 percent worked the 50- to 52-, .
week years. Even worse, one out of six males worked 26 hours or
less. This. is a rather large percentage who worked only .half thetime'during the year 1969.
7. he attitude toward hard work andlong hours is changing,especi y among the younger generations, who view work in a dif-
ferent ight froin their parents.
8. In spite of growing .orker alienation toward their jobs,
the findthgs from many studies indicate that people di) not.shunwork, they just want more control over their own lives.
9. The stereotype.of the Chinese is that he is an industrious
worker. The census figures bear this out, if the long hours are
any indication. This does not mean, however, that the Chinese is
any happier' in his work.' The necessity of earning a livelihood,the strong, sense .of duty,'and his dreams for the future sustain
him in,his daily drUdgery. These values are diminished: (a) when
social and welfare programs afford the present generations analternative which permit Them to deemphasiae the,importance ofwork; (b) when the value of work is fragmented and the role ofthe worker is splintered and denigrated; (c) when the purpose ofthe work is obscure or runs counter to humanistic values.
10. The heavy influx of immigrants from China will sustainthe reputation of the Chineseas a hard-working group, but thelonger they are here in this country, the more likelihood of theiradopting the prevailing American values_toward work.
28i-271-
,
A
1
- .
7
RECOMMENDATIONS
rstood at the corner of Main Street and'Northern Boulevardin.FlUshing, New York one day and watched the parade of humanity,go by. Somebody looking atme umuldsay I was - .idling, bpt rwadobserving peopletat work. :
A taxi cut off my view. The driven loiked,s len ,and surly.
I'Wondered if he enjoyed driving a cab. -A truck driyer came next,perched high.on his seat. He reminded'me of a little boy,at'play.The pizza man in the store behind me was throwilnghis doughin'theair, slapping and stretching it as he.wOrked if into a crust. Atelephone installer was catching forty' winks in his truck. Disposableblack plastic bags full of garbage were piled high on the sidewalkwaiting for the garbage-men to come by. They are not called garbagemen any more; the correct euphemism is sanitary engineers.-
I spied an older woman on the telephone in the real estateoffice. It looked-as if she was hot on the trail: of :sale.. A -
young girl in the same office sat in front- o£ her typewriter., Her
attention was,focused on the young man seated do her right. 'Several'men were standing against the wall of'a furniture store. They Sebmedin no hurry to go anywhere or do anything.
This busy corner of a bustlAng metropolis reflected the spectrumof work attitudes. The garbage, for instance. I believe thestarting salary for sanitary engineers today is $12,000. For that
money, New York City'should have top-notch, conscientious men.There is no shortage of men applying for the jobs, but the workremains so distasteful and low, status that New York, has been called
one of the dirtiest cities in the world. .
There are some jobs that no one likes to do; for example,stoop labor, cleanpag public toilets, filing cards day after day.Who is going to dorthe menial work? In the past, those who couldafford it hired others to do the jobs they did .not want to' do.Conquerors enslaved the conquered for these tasks. The' hiteEuropeans subjugated the colored races on their own soil and rele-gated,them to the lowly taslcs, while the lords and masters worewhite' suits, lived, in their manors, and .issued orders. Slaveryin the South was a manifeatation of the white mart's distaste-forthe badk-breaking work of growing cotton and tobacco. He.soughtsome method to get out of it and slavery was his answer. Thewhole history of Asian immigrants to the American West is butanotheE manifestation. of the white man's disdain for such venial
work as cultivation of crops, ditch digging -to reclaim tidelands,laying railroad tracks, cooking meals, and washing clothes. The
white man was caught on the horns of a dilemma: he did not want
t 281-272-; /

'the yellow or,btotin.man around, yet heicould not do withouthim,,because of the many chores that he performed.
With the rise of the masses and the rising consciousness ofthe black, yelldn-brown, and red men, the distasteful jobs canno longer be pushed on tothe shoulders of the colored races. But
the question remains: Who is going,to do the unpleasant jobs?
We saw from Mr. Yankelovich's survey and my questionnairethat almost everyone likes to give orders and enjoy whaipte isdoing. There must be someone on the other end to receive and
carry out the order. Perhaps the Chinese on the mainland have come
up with some answers. Here are some of the methods they use:
1. Ascribe new status to manual work. The laborer, the
farmer, the working an are glorified. The parasite is.not allOwed
to exist. The position of being a former landowner or progeny of
the leisure class is now an onus that is bornheavily.
2. Rotate work. Every worker must leave his regular job,_ ora specified time and either work on the farm, work in a factory',
or do his daily stint in an unpleasant but necessary task, For .4
instance, doctoks, professors, storekeepers, nursgst et alia, maybe assigned to bring in their qucita of cow dung or-horse manurefrom the droppings on the streets. The streets are cleaned and
the droppings are added to the fertilizer stocks.
3. The existence of,an'intellectual elite or any other ,
privileged class is being nullified by such policies as decreeingthat all students must, after graduation from high school, put in
a'two-year tour of duty on the farm or in a factory. By being in
the shoes of these people`, the learned-come to appreciate firsthandthe problems' of the laboring people.
4'
4. Workin teams. When.a project needs to be done, largegroUps of people are mobilized at once and the, task is attacked in
full force. If irrigation ditch must be dug, a date is set,the people infotmed, the gong sounded, and everyone is mobilized
for the job at hand. This generates a cooperative spirit and be-cause everyone else is working, an individual is less apt.tO shirk
his duty.
5. Give purpose and direction to work. There must be dedi-
cation to a cause. -The cause may be for God, for country, formankind, to make the world safe for democracy, to rid the4iountry'
of, imperialists, to give our children the privileges we never had--
the list is endless. Again, let Usecall that doing something"worthwhile is the second strongest work motivation.
282-273-

6. Encourage self-criticism and group struggle. Work groupsmeet periodically to review performance. Each person assesses hisown contribution to see 'if he has done his best. Then his peersjudge and criticize him. By these cathartic and scrutinizingroutines the individual is goaded on to better performance.
These are some of the methods used in China, where distinctionbetween classes is being reduced to ensure that one group does notuse or exploit another, and that the pleasant and unpleasant tasksare shared.
I am not recommending that we adopt any of the above or thatthey are applicable in this country. Many, in fact, are not simplybecause we emphasize individualism over the social group or comiun-ity. But China has come up with new ways of dealing with,a revolu-tionized classless society, the'feverish pace at which China isforging ahead is not due tb a work ethic purloined from the-West.
I
28o-Z74-

CHAPTER. XII
SELF-EMPLOYMENT AND SMALL BUSINESS
Not Qualified for a Job
The day after-the funeral, late at night,4Mrs. Chin sft atthe kitchen table, wondering how she was going to manage withouther husband. Mentally, she took' stock of herself. She was fifty-eight years old; she could barely read and write in Chinese, letalone in English; she had no skills and ao qualifications. Allher life she had depended upon her husband, who was a chef, andhis savings and insurance were skimpyat best. Her daughter sathunched over in the upholstered chair, her head between her knees.,Perhaps thy were thinking about the same thing. The daughtermight have to drop out of school and find a job. It pained Mrs.Chin to think about it, and the words would not form on her lipsto broach-the subject to the girl.
The ne2rday, Mrs. Chin went to visit a friend, a woman'who-was known for her generous nature in,helping others.with Problems.
listened
her, Mrs. Chin confided her predicament. The Helpful Ladylistened attentively and askedMrs; Chin if she would be willingto work so that her daughter could finish her schooling "Of
course," replied Mrs. Chin, "but what can I do? Who would hirean ignorant old woman like me?"
"How about peddling Some small items?" suggested the Helpful
Lady. "I will take ,you to ii\whOlesaler where you can buy some
small things. We'll go to the city government and apply for apeddler's license. You won't risk much, and you-can try it out."
At the wholesaler's, they settled on men's belts and ladies'earrings. The belts cost twelve dollars a dozen and the earrings
six dollars adgzen. They took two dozen each and bought a gullsuitcase and a Stand. Mrs. Chin was instructed to stand in frontof a busy department store with her wares.. In a few hours', Mrs.Chin had disposed of all her stock at a 100 percent markdp. In
28v-275-

one day, Mrs. Chin had grossed $36, more than she would have earnedin any type of job. At the end of .the week, she came to the HelpfulLady again to ask her help in opening a bank account, into whichshe deposited $200.
Mrs. Chin was soon able to replenish her stock on her own,and she began to branch out into other items on different days:Sometimes it was men's or ladies' scarves; sometimes it was smalltoys; sometimes it was umbrellas. Mrs. Chin loved her work. Sheenjoyed being among people. All the English she needed was the'-.price of the item she was selling. She paid cash for her stockand, when an item did not sell, she returned it to the supplierwho gave her something else in exchange. She was in business forherself, and her livelihood was assured.
A job is not-the answer for everybody. To have a job -is toperform a service for someone else in exchange for a wage or salary.This someone else (the employer) must have-come to the conclusionthat the-employee possesses a combination of'knowledge, skills, "
and time on which he can, capitalize to earn a profit. He minimizeshis risk by hiring thoaeo can how that they have the necessarybasic qualificatid: The'chanc s are minimal that old, ignorant
iwoman who has n ...worked befOr will be hired. Thripbestrecoursefor Mrs. Chin, therl ore, was t 'employ herself.
Work for Self or Work for Others fx
"I've worked for large companies, and I've worked for Mallcompanies, but I like to work for me best." This statement expressesthe attitude of another type of person who prefers being self-employedto working for someone else.
In a study undertaken at Michigan State University entitled-"The Enterprising Man," it was found that men who strike out ontheir own in private enterprises are somewhat different from thosewho are employed. The former cannot live within a framework ofoccupational behavior set up by others. He is more likely to bea loner; steeped in middle-class values; willing to work long,hard hours; has' organizing abilities; craves upward mobility, '
power and status; is unwilling to submit to authority; can bounceback quickly after reverses; is competitive in action and attitudes;has initiative and drive; and probably comes from a rural, ratherthan an urban, background. The industry, drive, thrift, endurance,-and agrarian background of the Chinese closely resemble the person-ality traits of the enterprising man. And to the ambitious.personstuck at a certain level in the organizational hierarchy, the onlyWay to go up may be to start one's own business. .
0
28 't.;
-276-

t
No Choice-But . . .
The Second Constitution of California, drawn up in 1879,"forbids,all corporations to employ any-Chinese, debars them from
-the suffrage . . . forbids their employment on any public works,
annuls all contracts for 'coolie labor,' directs the legislatureto provide for the punishment of_any company which shall employ ,
Chinese, to impose conditions on the residence of Chinese,-and tocause their removal if they fail to observe these conditions."'
In 1928, the Stanford University Placement Ser4ice stated,"It is almost impossible to place a Chinese or Japanese of eitherthe first or second generation in any kind of position, engineering,manufacturing or business., Many firms have general regulationsagainst employing them; others object to them on thigrounds thatthe other men employed by the firms do not care to work with them. "2
Until very.recently,_white firms simply did not hire Chinese
employees. There was no choice but for the Chinese to createtheir own jobs by setting uR small service or business enterprises.Until recently, small busiiess has been the rule, rather than the-exception, in the employment pattern of the Chinese Iii the United
States.
Spared the Indignity of Groveling fora Job
The private enterprise ,pattern of employment made the Chinese"
different from other ethnic or minority groups who relied more
heavily upon working for othe)for a'living. LingIdu, in hisbook, Chinese in North America,3 estimated that there were 10,000laundries, 4,300 restaurants, and 2,000 groceries operated by the
Chinese in continental United States. These were the three main
occupations of the Chinese, and they took the fgem of self-Tinedand operated private businesses,- generally'run as individual or
family enterprises.
In my book, Mountain of Gold, I compared the experiences of
St
1. James Bryce, The American CommonwealtO(New York: Macmillan
and Co., 1927), p. 43.
2. gliot G. Mears, Resident Orientals on the American PacificCoast (Chicago: University7.of'Chicago Press, 1928), p. 200.
3. Op. cit. (Privately pUblished in Chinese, 1949).
. 286

the Yugoslav immigrants and the blacki with that-if the Chinese.'The former sold their labor to the construction and mining companiesin Pennsylvania, and employment depended.upon seasonal fluctuationand the whims of the construction -bosses. Strikes and layoffsmeant uncertainty of interne, insecurity of job tenure, hunger, andwant.
Black ownership of private businesses.was almost nil, evenin their own ghettos. This total economic dependence upon thewhite man held the black man down'and perpetuated his- inferiorstatus. Not that laundry or restaurant work is less menial thanthat of janitor, ditch digger; field hand, miner, or constructionworker; it was simply that the Chinese were independent andseif-sufficient. They were a aced the indignation, abuse, and hurt
,that came from grovel for a job.
Family Businesses
By and large, the Chinese'enteriilses had the following- charac-teristics:
1. Contrary to popular myth, they were fairly2Widely scatteredin large urban-centers along the East and-West Coastsi'and were notconcentrated entirely in Chinatowns or segregated ghettos. .
2., They catered more to nonChinese clientele. Therefore,.
the economic base was broad.
3. They were very smallin Capitalization. Equity capitalcame.Trimarilylrom pooled savings._ Little or none came fromnon-,Cilinese financial sources.
4. They were set up along a kinship basis. Laundries andgroceries were generally mom-and-pep stores. In such businesses,the family was'a work unit; aiving together (usually above, or'behind the stoie), and everyone pitched in to help out. Fatherand mother weralways present, .:and the'children grew up seeingtheir parents work and having responsibility for the performanceof chores. This worksexperience has had tremendous impact uponthe second-generation Chinese-iMerican, shaping his work attitude-and character;4
4. Lin Yutang, Chinatown Family (New York: John Day Co." 1948);Jade Snow Wong, Fifth Chinese Daughter (New York: Harper Bros.,1950).
28

TABLE 79
WAGE AND SALARY OR SELF-...EMPLOYED CHINESE
IN -THE U:S., FOR SELECTED SMSAS, 1970
SMSA
Total Empl:(100%)
Wage & Salary
Self - Employed
16 yrs .and over
No.
No.
%
United States
183,562
163,009
88.8
20,553,
11.2
.
Boston
53391
'
4,991
92.6
'400
7.4
Chicago
5,305
4,780
90./
,525
9.9
Honolulu
.21,538
20,287
94.2
1,251
5.8
.\
,Los Angeles-Long Beach
18,315
16,103
87.9
-.
2,212
12.1,
New,York
3.3,400
'
30,330
90.8
'3070
9.2
Sacramento
3,911
3,357
85.8
554
14.2
San Francisco-Oakland
34,502
89.1
, 4,225
10.9'
San Jose
3,346
2,839
84.9
507
15.2
Seattle-Everett
.3,122
2,726
87.3
396
12.7.
Washington D.C.-Md.-Va.
3,358
3,028
90.2
330
9.8
Source:
p.s.
Census Bureau, Subject Report, PC(2)1G (1970), Tables 19, 28.
NOTE:
Based.on a 20 percent sampling.
-279-
fr
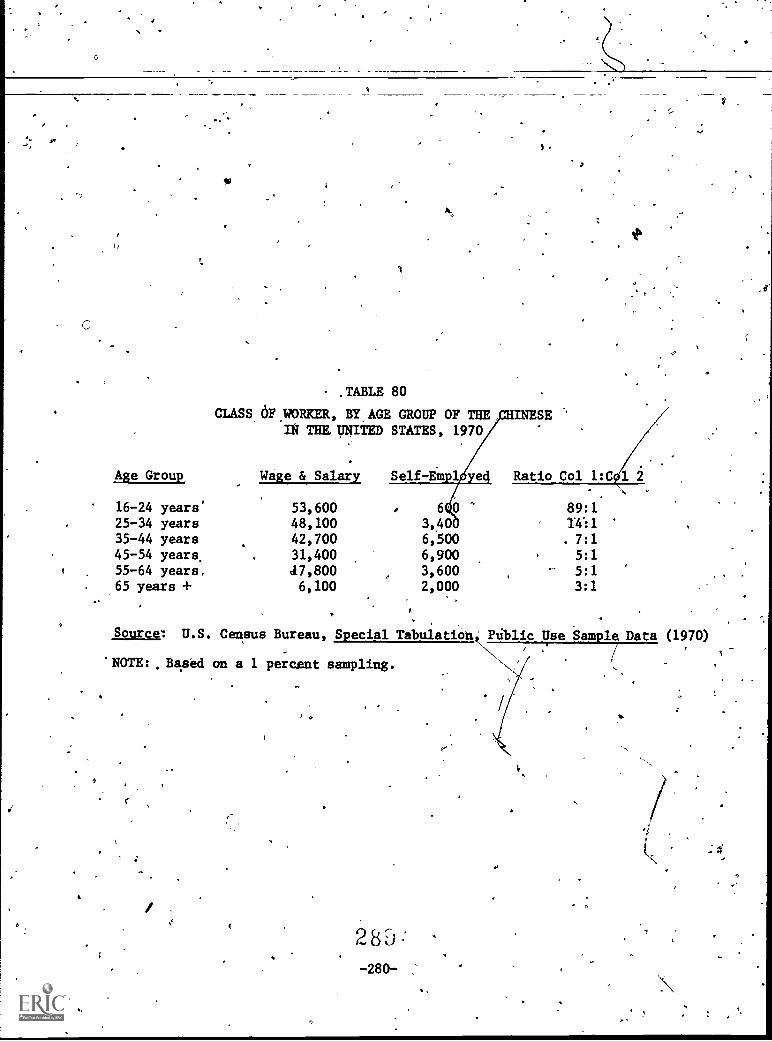
0
6.
TABLE 80
CLASS OF WORKER, BY AGE GROUP OF THEIN THE UNITED STATES, 1970
INESE
Age Group Wage & Salary Self-Emil Ratio Col 1:C1 2
16-24 years' 53,600 6 89:125-34 years 48,100 3,.40 14:135-44 years 42,700 6,500 7:1
45-54 years. 31,400 6,900 5:155-64 years, 41,800 3,600 5:165 years + 6,100 2,000 3:1
Source: U.S. Census Bureau, Special Tabulations Public Use Sample Data (1970)
'NOTE: Based on a 1 percent sampling.
2K.3;-280-
,

A ,
.t
.
.5. Restaurants required more capital investment and, therefore,.w e usually cooperative,venturesbased upon a larger kinsBip group.'For example, several-brothers would form a partnership, or uncles '%
and cousins would hold shares in an incorporated restaurant. -
15. The operation of these enterprises was fairly simple. kAlthough few had previous experience in their type of wor* theowners could swap stories about their experienceErnr call upon-a compatriot for information about suppliers and problem solving.
7. Earnings were marginal or low by American standards.Nevertheless, they provided employment and income in a hostileland. -
Revolution in Chinese Employment Pattern
Since 1950, a quiet revolution has taken place in the'employ-
meat pattern of the Chinese. They have abandoned their privatebusinesses in droves and prefer working for wages and salaries.Two main factors are responSible for this upheaval. First,, obstacles
to finding a job were lowered; and,second, recent generationsdisdain the long hours; hard work, and marginal nature of smallbusiness or service enterprises. They prefer4 9- to 5-schedule,no risk",' and a no-headaches-after-hours job.
Table 79 shows Chinese employed in 1970 by class of worker.Those who earn a wage and salary far exceed those who are self-employed. The national ratio is about 8:1. Broken down by cities,the percentages reveal that Chinese on the West; Coast are morelikely to be self-employed than those on the East Coast. Why?
The reason slay, be that the Chinese on the East Coast are morerecent immigrants and may not yet have sufficient capital to embarkon any private venture. Another reason sly be that there are moreprofessional people_who area self-employed on the West Coast.
The young definitely prefer being employed to self-employment.'This fact is-quite obvious from Table 80 showing the ratio, byage group, of wage and salary workers to the self-employed. Theolder generation still clings"to small businesses because thereis no ether alternative., The younger generations are'primarilyin the professions and evidently prefer working for others.
A word of caution, however, about accepting at face value thesefigures compiled from the census. The category wage-and-salaryincludes all peksons who work for any Incorporated firm. .Many pri-,vate enterprises will incorporate to limit their liability, althoughthey may be one-mad or family-operated setups. In Chinese restaurants,
p 29i-21-
ft,
-s-

#
particularly when the venture is a cooperative,one, the,Festaurantwill be owned' collectively anClthe shareowners are both employersand employees. These peopleluvre invested capital in a small,private enterprise, but .they are salaried employees of 'their' ownbusinesses. Since restaurant work is the single leading area ofemployment for the Chinese in the Halted States, thwactual 'impoor7.tance of small tusiness'enterprises has not diminished to.the,extentindicated by the census.
Chinatown Enterprises.
Intheir own ghettos or Chinatowns, the Chinese are definitelyproprietors of their own businesses. Tables 81 and 82 show. thetype of services.and commercial establishments in which the Chineseare engaged in New York and San Francisco's Chinatowns. The figuresare outdated, but the type bf enterprises give us an-inkling of °
the characteristics of these small businesses.
1,0 They cater to Chinese clientele. '
They seek to capitalize on the- tourist trade.
3. They offer essential aervi4es.
4. Garment o sewing factories are the only manufacturingu.1,,a. ,, enterprises shown where the market is with non-Chinese clientele.
. Recently, light indusiries, such as electronic Components andfrozen foods' have been introduced.
. ,
J-
5. They are operated by a group li,ed in education,, language,'or financial resources. ,
Theisiall size and lack of variety of the Chinatown enterprisesare just as revealing as the existing types. Inother.wordi, the '
Chinatown Chinese are still small-time operators. The florist shop'maybe a husba4rand -iwife store. The tailor shop may be one stepremoved from Mrs:tin, our,old lady-peddler mentioned at the begin-7ning of this' chapt The accountant may operate from his desk'space with a limited Chinese'clientele. Here is a, symptom thatwarrants closer scrutiny. Can the Chinese aim for bigger and better*enterprises? DO they have the resources and capability to try? Is
.....-imrpate enterprise an answer to the' employment proSlem of immigrantswho cannot meet the job specification of language proficiency? There 0
is a great need, for exploring this eiVenueyf inquiry.t .
29I
L282-
;

TABLE 81
PRIVATE ENTERPRISES EN NEW YORK'S CHINATOWN (CORE AREA), 1973
Number of
Number of
Type of Business
!Establishments
Type of Business
Establishments
Restaurants
77
Dentists
6Exporters and Importers
72
Furniture
6Garment Factories
60
Theaters
6Groceries
52
Florists
6Doctors (Physicians and Surgeons)
46
Bakeries
6Insurance, Real Est. and Stock Brokers
35
Clothing Stores
6Gift Shops
30
Employment Agencies
6Coffee Shops
25
Carpenters, Painters and Plumbers
5Lawyers
22
Drug Stores
5Chinese Newspapers, News Agencies & Publns.
15
Jewelers
4Meat and Poultry
15
Liquor-Stores
4Accountants
Barber Shops.
13
13
Photo Studios
China, Cookery and Glass Wares
4, 4
Banks
12
Tailors
4Printers
12
Department Stores
3Beauty Salons
10
Advertising and ARt Design
3Herbalists
jt
10
Funeral Parlors
ti3
BbOk Stores
9Candy Stores
2Laundry-SUppiy-andAppliance
9Fish:Markets
2+Radio, TV'and Recorded Music
8Cigars and Cigarettes
1
Dry Cleaning and Laundries
8Transportation Company
1
Noodle Manufacturers
7
Source;
Chinese Trading Journal, New York Chinese Import and Export Association, 1973.
NOTE:
These figures are quite outdated but are given to show types of enterprises Chinese in Chinatown
are
engaged in.
For example., I know froM"personal knowledge.that.garment factories have swelled to over 230 as
of 1975.
-283-

, TABLE 82
PRIVATE ENTERPRISES IN SAN FRANCISCO'S. CHINATOWN (CORE AREA), 1969
Type of BusinessNumber of
Eatablishmenta
Markets and Grocery Stores 162Dry Goods and Find Arts (Curio Shops) 136Sewing Factories 120 .
Restaurants 67Insurance Offices 41Pharmacies 29.
Laundries 29BakeriesClothing Shops 18
Hotels and Motels'` 15
Beauty Salons 15Banks 13Jewelry Shops 12
Barber Shops 10Studios 9
Travel Agencies 9
Schools 9
Noodle Factories 7
-Atinter and Carpenter Shops 6
'Theaters 5
Book Stores 5
Printing Shops 5Architects if 4
Shoe Stores 3
TOTAL 747
Source: San Francisco Chinese Community Citizens Survey andFact Finding Committee Report (1969).
NOTE: These' figures are quite outdated but are given to showtyped of enterprises Chinese in Chinatown are engaged in.
29 io-284-
.1

Beyond Chinatown Borders
Private enterprises outside Chinatown are more varied and
-operster-on-a-larger-sealer-No:syektenteitie-study-r-has-been-lindertaken.of these businesses,_ but they_are much more sophisticated and effi7
cleat. Offhand, I can list a few whose capitalization could easilyexceed a million dollars, and they,are not within the traditionalrestaurant, supermarket, or garment factory categories.
Case History I: The most impressive undertaking I have visitedis the ETEC corporation in Hayward, California, which makes anelectron microscope called Autoscan. James Dao, the president, 0
and Nelson Yu, the technical manager, are young men in their mid--thirties. They are the founders, the owners, and the driving forcebehind this most Unusual venture. According to Mk,. Dao, there are
only six companies in the entire world that manufacture electronmicroscopes. Three are in the United States, and ETEC is oneofthem.
. .
When I visited the plant in 1973, the company had'been inbusiness for only two and a half years. Since its inception, the
staff had grown-to 126, most of them highly educated and highlypaid scientists and technicians: The company was doing about$500,000 in business a month. The scanning electron microscopes
sold from $50,000 to $250,000 each. The A4toscan is one of the
latest development& in electron7optical inbtrumentation. It has
a magnification range of 5 times to 240,000 times. It can produce
three-dimensional images inwhich all details are in sharp focus.The extraordinary features of the,Autoscan are astounding, and thepossibilities that this microscope has for medical and physicalresearch are boundless.
Nelson Yu has the technical know-how. He was an assistantto the professor at Stanford who developed the electron microscope.James Dao runs the business end. He is a graduate of the Universityof California at Berkeley with a degree in electrical engineering.-He came to the United .States at theage of thirteen. and has wotkedever since at jobs ranging from milking cows to waiting on tablesto electrical engineering for the city government. James Dao admits
that entrepreneurs are a special breed. "If you are afraid of
hard work," he said, "forget it."
. .
The following three case histories were compiled by ErnestD. Chu, senior vice-president of an investment banking house offWall Street, and are excellent examples of small business successespioneered or led by Chinese Americans,:
224-285-

Case History II: Wa9gco Inc.
-and-produces-aUlguatio-taps=drlve-systems
-teltrCariiire-ds,,ecord, store and reproduce.aata on computertapes), and sell% them to' original equipment manufacturers mainly foruse in minicomputers and related systems. In fiscal 1973, the companybroadened its product line by the introduction of a fixed-head discdrive.
The company chairman is Dr. Ben C. Wang. Twenty -five years.ago, Dr. Wang was a freshly arrived immigrant from China. He had$100 in his pocket and a conviction that as long as he could find-a job--any kind of a job he. "would never starve in the U.S." Today,Wangco Inc. is-the nation's second largest producer of tape drivesfor the mini-computer industry, and Wang himself is worth $3 million-plus in company stock and other interests.
After working his way through the University of California,
atBerkeley and the Illinois Institute of Technology, engineer Wap%,went to work for IBM and "drifted into computer peripheral's. Laterlured' to-Ampex, he developed direct-driven, single-capstan tapedrive, which is still.a standard in the industry. Attracted by -
Wang's growing reputation, Scientific -Data Systems hired him tostart up a new computer peripherals operation in 1964. Five yearslater, Wang was ready to go into the peripherals business for himself.Catching the first wave of growth in the new mini-computer business,his little company expandeal rapidly to $10.7-million volume and$1.2- million net in fiscal 1973. The company'employs over 400people. The sales and earnings record ofWangco Inc. shows hoW-'"the business has groWn:
ShareNet Inc.
$1,610000. '$1.5441,103,000 1.01421,000 .36 .
(84,000) (.14)(550,000)
r(1.28)
Year Sales
1974 $18,260001973 10,680,0001972 4,599,0001971 1,598,000.1970 23,000
Case History III: Macrodata Corporation
Macrodata Corporation makes and designs equipment for testingsmall- and large-scale integrated Semiconductor circuits whichperform specialized memory and,logic functiOns, such as data storage,counting, timing, and mathematical computation. It also makescomputer-controlled design systems and offers design consultingservices. Its chairman and president is Dr. William C.W. Mow and
29-286-

its vice president is Stuart Liu. Its sales anti earnings record
are given below:
Year Sales IncomeShare
Earnings. _
1973 $8,609,000 $655,000 $0.82
1972 4,699,000 389,000 0.62
1971 2,650,000 196,000 0.32
1970 77,000 (817,000) (1.32)Lb
1969 18,000 (140,000) (0.24) -
Case History IV: Finnegan Corporation
Finnegan Corporation was founded by Robert Finnegan, but raninto serious financial difficulties. After the appointment of
T.Z. Chu as president and chief operating officer, the companyhas shown an impressive growth record.
The company develops, manufactures, and sells. spectrometersystems. These systems are used to detect, identify, and quantifythe constituents of gases, liquids, and solids. The company'ssystems are in. use in the fields of biomedicine, for the analysisOf drugs and drug metabolites in toxicology and pharmacology appli-cations; analytical chemistry, for quantitative and qualitativeanalysis of compounds in research and industrial setting; environ-mental research and pollution control, for identification of chemicalcontaminants in water, soil foodstuffs and air; ancrforensic science,for positive identification of various types of physical evidenceused in criminal justice proceedings. It also makes incrementalshaft encoders..
Finnegan Corporation employs.about 300 people.condition of these companies are given to show thatAmericans have been successful in business venturesscale.
Year Sales
1974 $10,500,000(est.)
1973 7,933,0001972 5,501,0001971 3,906,000(T.Z. Chu came in)1970 2,677,0001969 1,999,000
.29'6-287-
Net
The financiala few Chinese-on an impressisie
ShareEarnings
$600,000(est.)
$0.95(est.)
322,000 0.6342,000
(9,200)1. (0.03)
(600,000) (3.15)
(146,000) (1.13)
4
. 7
4 1
.1 7
1

Export and Import0
International trade, an important area Of-employment and incomesource fOr the Chinese is the United States will inevitably grow.Formerly-, it was confined to-- importation of foodstuffa and art- -
the former for the Chinese population, and the latter for the touristtrade. The market for today's imports is entirely different. Textiles,electrOn pioducts, and wool products lead the list of imports fromTaiwan, and exports to that island consist of agricultural products(wheat, cotton, soybeans, and tobacco), machinery tools, and vehiclesand vessels. The volume of trade runs to about $4 billion annually,according to the Chinese Information Service.
.Trade with the People's Republic of China was forbidden'bYThe Trading with the Enemy Act, passed in 1950, during the KoreanWar. Trade did not resume until shortly before President Nixon'svisit to Peking in 1972. Both countries are proceeding cautiously,so that the volume of trade is not significant at the moment.China's trading policy Will be dictated more by politics than byeconomics. Those who wish to trade with China must have her per-mission or sanction. They are'invited to the Trade Fair in Canton,which is held biannually in the spring and the fall. At the-fair,contacts are established with the Foreign Trading Corporations,which are legally responsible for negotiating all China's ttadtcontracts.
American firms wishing to ao business. With China will havea great need for personnel familiar with the language, the culture,and the channels, of doing business with the People's Republic.Interpreters of the culture, as Well as the language,'Will be ingreat demand. The Chinese are not going to cater to.Americans byconducting their-:business entirely in English, as was ,done in thepast. Americans'expecting to do business in volume would be advisedto take a Chinese interpreter with them tothe Canton Trade Fairs.
The subtleties'of Chinese etiquette also warrant extra. attention.American busiiessmen are accustomed to snapping their fingers andexpecting' results on the double. The Chinese place great" tore onpersonal contact and person-to-person relationships. .Their salescontract may be sparsely expressed,.including only the most basicelements of the transaction, such as a concise description of thegoods and their specifiCations, delivery date, type of packing,. unitprice, total price, and method of payment. American businessmenmay insist on detailed and exact terms couched in highly legalisticwording that may prove offensive to Chinese sensitivity. Thesedifferences,requirethe services of middlemen versed in the waysof both countries.
297-288-

The Chinese must also be apprised of American regulatidnsgoverning import-giport trade. Stipulations, such as place of
.origin labeling, reporting of end-use of the product, declaration-of trade volume to the-American government, etc., are procedures
that must_be_e4plained_toChinese officials who do not encountersuch red tape in trade with Southeast Asian,r-African totinfi±eiiiH"
Acting as intermediaries who can provide such services forcompanies dealing in trade with the People's Republic is a poten-tial field of private enterprise for refugees and immigrants whomay have rich experience in international trade in China or South-east Asia, And there is no reason why, such persons cannot eventuallydeal directly in importing and exporting themselves on a largerscale than do the small firms which now operate out of Chinatowns.
Management. Consultant Fi4rnis
Engineering is a favorite profession of thinese males. Howengineering skills can be utilized in a private venture is shownby a management consulting firm on'Long Island, New York. The
firm specializes in troubleshooting.' It packages a group of highlyspecialized engineers and sends theta in under contract for a specific
job and specific period of time. The engineers are on the payroll
of the consulting firm. The advantages to the contracting clientsare that they can get competent and skilled personnel quickly withouthaving to recruit and put extra people on the payroll and then laythem off upon completion of the taskat hand. One might say the
function of. this consulting firm is parallel to that of officetemporaries; except that the latter handles secretarial and clericalhelp while the former handles engineers and technicians.
The owner of this service enterprise is,a second-generationChinese and a product of New York's Chinatown. He has about fifty
engineers on his payroll. The volume of his business can be gauged
by his weekly payroll. One could say that his business is substan-tially removed from that of the garment factory that his widowedmother worked for.
Private ventures of the Chinese outside Chinatdwns are manyand varied. Others that quickly come to mind are a manufacturerof plastic boats, a home-cleaning service, a computer sales agency,a tin-and-gold foil milli --and a sailboat chartering company.
From Mrs. Chin, the peddler, to ETEC, manufacturers of electronmicroscopes, the Chinese have shown that they can work for themselves,that they have the enterprising traits to succeed at it, and that theyare willing to work hard and persevere, toward their goals. They also
296-289-

had a few other factors in their favor, not the least of which istheir ability to garner equity capital to get started.
r.
Availability of Ctedit-7.-
Through their kinship organizations, such as the family asso-ciations, the Chinese devised credit facilities sO that they couldsave and have access to funds.in the event of emergency or sudden-need. Some of these rotating credit clubs are described in detailin Ivan Light's Ethnic Enterprise in America. Professor lightattributes the Chinese and Japanese ownership of small--business inno small measure to these facilities for capital accumulation.5
-'-
EiThe rotating credit associations or savings clubs operate on
he principleof pooling resources. The clubs are organized onthe basis of family name or, close association:, Those who electto join the club agree to pay into the pool a fixed sum, tea 'dollarsa week, for example. If there are fifty shares in .the pool, thetotal pot would be $500. The pool would run for fifty weeks.
A.
Each week, persons needing the money bid for the pool. Ifthe successful bid is twenty-five cents, each share pays in $9.75and the biddetakes the lump sum collected of $487.50. No moneyis ever left in the club. If no one bids for the money, all namesof the shareholders who have not yet received a pool are put ina hat and One name is withdrawn. That persons receives the totalpool for the week.
In estence, this is a cooperative banking system in which themembers are both borrowers and depositors, but no funds are everleft on deposit. The savings club does not have to look for prof-itable investment opportunities to pay interest on money deposited.There is no danger of anyone absconding with the money since theclub members are related or known to one another. Fixed and operatingexpenses are minimal.
Such money pools were adequate for the simpler Chinese commun-ities of yesteryear, but they can no longer serve the larger Chinesepopulation in the United States today. Some of these savings clubsstill exist, but they cannot provide the services offered by creditinstitutions like banks.
5. (Los Angeles and'iBerkeley: University of California Press, 1972)pp. 45-61.
29i-2901
0
_would _presume_that_a_hankproVide more sophisticatedand satisfactory service than the rotating credit associations.-However,--zthe first thinese-Ameritan -Bank; -founted--in---during the effii 1900s, closed its doors in 1926. The bulk of itsservices wads in the remittance of - foreign exchange to 'China and itsimpact upon_ the commercial life of the Chinese in the United Stateswas nil. filown as the Canton Bank, it was suspeded for misman-.
agemeni.§
Not until 1962 did another Chinese-owned bank appear on theAmerican sane. It was the state - chartered Cathay Bank of Los
Angeles.7 Chinese owned lanks in the United States can still be
counted the fingers of one hand, but the Chinese have availedthemselvesi of the services of American banks. For instance, twelve
banks,(nonle owned by Chinese-Americans)8 have offices or branchesin New York's Chinatown, and their business is brisk. Services
are no longer limited to remittances, but cover the full range of
banking services.
I interviewed the manager;of The Bank of North America, oneof the largest banks in Na York's Chinatown. It is not Chinese-owned, alOhoug -when One walks into the bank one may think so. Its
staff is U0 percent Chinese, and practically all its patrOns are
1too: Theibranch located in Chinatown about ten years ago, nosingout other- giantsi like'Chase Manhattan and the Chemical Bank, whichrecognized the potentialities of the Chinese community only recently.
The 'lank of North America is a commercial bank, as differen-
tiated from a saVings bank. Its loans are made primarily to res-
taurateur importer-exporters, and gift shop owners. The average
loan is f r about $10,000. At this bank, the Chinese borrower
generally has little difficulty obtaining credit. The rate of
delinquen payment, the manager told me, is "very, very small."
In r viewing my conversation with the bank manager, I read,
_signs of trength and symptoms of malaise of the Chinese entrepreneur
in Chinatown. The strengths are that he encounters little problem in
6. Ibid. p. 474- 1
7. Idem.
8. The C inese American Bank of New York is the former Bank of
China and is foreign-owned.
30u-291-
I
obtaining credit, and his- credit rating is excellent. This intan-gible asset has stood the Chinese businessman,in good stead.Wherever he has gone and wherever he has traded, he has built upa solid reputation of honesty and-integrity. 'His word is as
of-the-Chitiese.-In some parts of the world, Southeast Asia in particular,theChinese operate vast trading empires, and much of the buainessis (bine by verbal agreement. The Chinese guard this,reputationof honesty and integrity carefully, for to them this intangibleasset is worth more than gold or silver; -If any Chinese in theUnited States is tempted to sell this reputation short he willharm both himself and his compatriots.
:The symptoms of malaise are revealed by the limited type of. borrowers and by the size of the loans. It evidences small-scale s'
and perhaps marginal businesses employing few people and handlgga small volume. My hope i "that the Chinatown entrepreneprs willdream of bigger and more venturesome undertakings and'that theywill launch into more'efficient and optimum use of capital andmanpower. But,to-cliMb out of the Little League into the BigLeague may take'more capital and more know-how than she plinatownbusinessman 'can muster.
Office of Minority Business Enterprise*
-
There are many federal resources available to mindiity entre-preneurs that will provide them with funds, with counsel and advice,and with technical assistance, To coordinate these activiles, theOffice of Minority Business Enterprise (OMBE) wa$createdop March15, 1969, by President Nixon's Executive Order No. 11458. Anannouncing the creation of OMBE, "the President indicateathatthere were 116 federal prograMs, administered by, twenty or mOte'federal agencies, that might help minorities go into businessfor themselves or that could help to develop existing businesses!°MBE's job would be to coordinate the government's efforts andkeep track of all workable programs."? In addition, the mainprogram of OMBE is to get private corporations, commercial banks,
(yand the government itself to speed the development of minoritybusinesses. The device to be used is the Minority EnterpriseSmall Business Investment Company, or MESBIC.
Actually, MESBIC is no more than a revised version of the
9. Edward H. Jones, Blacks in Business (New York: Grosset SI Dunlap,1971),Tp. 132-.
301-292-

41{
Small Business Investment Company, authorized by the Small BusinessInvestment Act of 1958. -A-SBIC is a company chartered under state
ass-Adm4nistration--to make investments in small businesses. A minimum of $300,000 wasrequired as minimum capitalization of the parent company. This--money is then invested in small business of the SBIC's choice. As
the SBIC invests its money, it,,,is allowed to draw additional fundsfrom the federal government fO?iore investments, up-to a maximumof twice its own capit zation. Thus $300,000 could grow to $900,000
14This. sum could be furt e4 pyramided, since the small businesses inwhich SBIC made an investment could then turn to the SBA and receiveadditional assistance in loans or guarantee of loaps. The MESBICdiffers essentially from the SBIC only in the fact that it seeksout,miUority small businesses and the minimum capitalization isreduced to $150,000 int,teaa of $300,000.10 Experience has shot.
however, that an optimum capitalization is in the range of million'6 $2 million. A central feature of each MESBIC it the Vnuingmanagement assistance it provides without charge to tt enterprAses
in which it invests or to which it lends money. assistance is
designed,to insure their kUccessful and competi ve operation.1
.
Of the sixty-six MESBICs now licens t to4Noperate in 1974, only
one was started by a Chinese-American She is Mts. Rose Leong, a
Los Angeles building developer and onstruction contractor. Mrs.
Leong arrived in the United Si in 1948. She obtained a Master'sDegree in education from th= lniver'sity of Southern. California and,
in 1955,,she started a 1 estate investment company. LateF, when
she announced that g wanted to be a construction contractor,
ipveryone laughed her. She started in business by building struc-
tures which w e leased to the Post Office as branches. She went on
to build a rtments fpg office buildings for some of the nation'sbest- corporate tenants.--) She admits that_ vireo- she first started
she not even know what a two-by-tour was.
In March 1974, with 4300,000 of her own money, Mrs. Leong putup the capital for her own MESBIC, the Chinese Investment Company
of California, the first federally-lidensed minority venture capitalcompany to be formed'and the only one wholly capitalized by a woman.Mrs. Leong now feels that she would like to share her talents and.help others get started."
484Ptf..,
..!
10. 401A., pp. 132-134i
11. "Fibm China with Skill," Commerce Today (April 4.4 1974), p. 7.
302(4kt;
c).

Other Government Reseuneeo
.O nririmrmIrna.- - all Z bran e tothe minority businessilan,-the-Nitional-Minorlty Purchasing -CouhaU--worka-tolicrease corporate p' chases ffom minor#ffirms. /beGeneral Services Adminis1ra4tion offers counseling on doing businesswith the government by assisting minority busigessmen to developa government market for their product's and services and to obtaincontract opportunities. The Economic Development Corporation of-the Department of Commerce is not-usually aimed at the small minor-ity entrepreneur, but it can provide technical and management 'ass's,.tance.
SBA Section 8(a)-- Procurement Program
A Presidential directive in 1969 requested all federal agenciesand' departments to provide procurement opportunities for minoritybusinessmen by exempting them from competitive bidding and alloiiinga cost differential. These dispensations were carried out underSection 8(a) of the Small Business Act. This is how the 8(a)'program operates:
"The minority businessman contacts his local SBAjoffice andtells the procurement specialist about the products lie cat 'produie.SA specialists then visit the businessman's company and makes anon-site field survey and evaluation of the company's capability.If the business has the capability, SBA then locates and. identifiesthe products it needs. and contacts a federal agency that wants tobuy. SBA negotiates the contract."12
The General Services Administration Purchasing Agency for thefederal government is further permitted to set aside 10 to 15 percentof its total purchases for minority businesses and contractors.on apermanent basis. These provisos now guarantee a substantial marketfor many businesses now unable to compete with larger companies.3
OMBE-Funded Asian Programs
There are a number of OMBE -funded programs initiated by Asiansin California. Among them are Asian American National Business
12. Jones, Op. cit., p. 138.
13. Idem.
3 0 C-5
-294-

Alliance, Inc., in Los Angeles; Asians, Inc., in San Francisco;end Arcata Management, in Palo Alto. All these firms act as
management consultants to Aged-Americans.
4The d'ir'ector of Arcata is Buck Wong, a MBA graduate from
Stanford. In his words, "We are attempting to help those minoritybusinessmen who. have a better opportunity for success. We aretrying-to get away from the.marginal operations that have in thepast been supported. We offer free consultation. We will traina staff.member of the'minority enterprise in accounting. We willhelp establish a business'plan. We will try to line up capitalto get a company started. The timwe stay_ with a company variesfrom three weeks to eighteen months. On the average we devote165 man-hours to a company, usually spread over a long period.Our client load ranges from 'fifty to sixty."
Awing the compiiiiies helped by Arcata was Lee Engineering, ofPalo Alta.' It now has an annual business of over $1, million,including a contract in 1974 for a nuclear power plant and asewage disposal piping system. 14,
1\-)
There is no qUestion that the government lob established apolicy and has embarked on programs designed to aid the minoritybusinessman'in breaking into private enterprise. This policy was
instituted in recognition of the fact-thiieminoriti6 compri$e17 percent of the American population, but own from 1-3 percentof all busihesses and do only 1 percent of the business volume.For further information 'about federal resources for minoritybusinessmen, OMBE puts out 4 number of booklets of which minoritiesshould' avail themselves:
1. "Special Catalog of Federal Programs Assisting MinorityEnterprise" (1971). Description-of 85 federal programs specificallydesigned to aid minority business enterprise and an additional 175programs which offer potential business opportunities tominorities.
e
2. "Minority:Busineis Opportunity Committee HandhOok, Guidance.and procedures': (July 1974).
3.' "Franchise Opportunities Handbook" (September 1973).
These.booklets are very specific and provideyaluable information.
14. *Chinatown News (Vancouver, Canada: Chinese Publicity Bureau Ltd.,August 18,974), p. 15-16.
.304.
-295-

My feeling is that few Chinese are-aware of the resources available.to them, although many of these programs have been operative in theblaqk and ipanish-speaking communities for a number of years now.With the tradition of small private enterprise that the Chinese inthi. s country have, it is now time for them to move on to biggerand more diversified ventures.
v.296-
..of

SUMMARY OF FINDINGS
1. Traditionally, small business has been the rule, ratherthan the exception, for the Chinese in the United States because:
a. The Chinese could not meet standards Set up by Americanfirms for jobs.
b. The temperament and background of the Chinese immigrantwas more suited to self-enterprise.
c. American iiims simply did not hire Chihese.
2. Self-employment spared the Chinese some of the demeaningtreatment meted out to minority groups who depended totally uponsomeone else for jobs.
3. As the social climate and attitude toward the Chineseimproved, the predominant pattern of self-employment has changedto one in which wage-and-salary workers exceed the self-employed.
4. Contrary to popular belief, Chinese. enterprises werelocated primarily Outside Chinatowns and most catered to non-Chinese
clientele. These businesses were set up on a family basis. They
operated on a marginal level andmanaged to stay afloat primarilybecause of perseverance, long hours, and unpaid help available fromfamily members.
5. Chinatown enterprises, especially those inside the ghetto,
t catered to a Chinese,clientele and were very limited in scale,size, and variety.
6. Hand laundries, formerly overwhelmingly the most commontype of self--owned and operated type of enterprise up to twentyyears ago, is now on the verge of extinction.
7. Chinese ventures outside of Chinatown's borders today aremore varied and -operate on a larger scale.
8. Foreign trade is an important area of potential for Chinese- .
American businessmen.A
9. A valuable, intangible asset that,the Chinese have is theirreputation for honesty and integrity in business dealings.
10. The Chinese have traditionally created their Own sourcesof capital and credit to launch them into private enterprise ona small scale. Today, capital needs are greater than the local

t
.
community can provide.
11. The Office of Minority Bsuiness Enterprise was set upin 1969 to coordinate and facilitate government efforts to helpminority entrepreneurs with loans, counsel, amatechnical assis-tance. Since such assistance is available, the Chinese shouldmake use of these government services. -
/1
a()
=298-

BE6ONMENDATIONB
The slrastic reversal of the Chinese employment pattern, fromprivate entrepreneur (aleeit on a small scale) to wage or salary
work can be viewed from two angles.
/ On the pluh,side, the Chinese now do have an entree into
he.mainstreamujob market. Many are fully qualified to compete-
ar.ill levels in the'otcupational ladder. They need no longer
create their own jobs .to eke out a marginal livelihood by putting
in long hours and hard work. In working for others their respon-sibility usually ends when they leave their place of employment,and they need not risk their capital and savings.
With the decline of turn self-owned and operated businesses,there arise a number of likely minuses. What I consider thenegative-side may ba more sociological-or psychologicarthanoccupational or economic, but these aspects are related to economics,and the well-being or. malaise in -one affects the other.
. 034, being se14-employed, the Chinese insulatehemseIves, orwere ht least one iteli removed from occupational discrimination.They never put thet6eIves in a.position to be last hired and first!'fired. The usual.response to bad times of the Chinese self -employed
was to tighten the:belt and expect less, which is perhaps a mite /
better than being outright unemployed. If their jobs depended
upon.a boss, they Wiould more likely be lila off or firedt Being
one's own boss also'added to ones self-image and dignity, especially.when such,dignity was constantly undercut and trampledAir.
The Chinese'also found collective security in the way they
set up their private businesses. The; family wasthe working unit,but family did Ot always mean mom att:i pop and children. Rather,
it meant the enXhrged kinship group. Economic dependence heldthe4amily memlieratogether and generated jobs for the close of
kin. All thespactors were important to the survival of the
Chinese in thelpaht.
What I' consider the saving grace of the Chinese, however,the younger generation Chinese-Americans look upon as 'an albatross.
They do not care to continue at all in their family businesses.They view their parents' work with distaste and disdain. They
would prefer getting a job and working for Cifhere§ to being self-
employed. The traits of industry and thrift are old-fashionedand even stupid. Who wants to work so hard? There's more to.
life than working." These are the attitudes that replaced theones of self-help, fikoily solidarity, and mutual aid. And theseattitudes are refle ted in the high ratio (8:1)'of employed to
3'0 8,
-299- q

4
P!'
self-employed.
Vulnerability to Economic Reverses
But if I suggested that the Chinese are now overexposedand averreliant upon employers for a livelihood, and that the
--Chinese are now in a-position highly vulnerable to occupationalreverses in the event the country plunges into a depression? WouldI be accused of being too apprehensive, overly pessimistic, oreven paranoid? Perhaps, but the possibilities exist. There arehistorical precedents, and who was it that said, "History repeatsitself?"
I realize that times have changed., Attitudes have changed.The nature of small busihess has changed. The Chinese populationhas changed increasingly to a first-generation immigrant groupwhich lacks familiarity with American ways and the English language.So would I be considered reactionary if I advocated, as my firstrecommendation, a strong backward look at self-employment andsmall business ventures. To be sure, I do not mean a return tothe restaurants, laundries, grocery stores, gift shops, one-manstands, or family-run operations that characterized Chinese entre-preneurship in thepast. I am thinking along more sophisticatedlines and on a somewhat larger. scale.
Iii fact; the risks of going. into business for oneself areextremely high. One out of every three businesses fails withina year. The rate of failure decreases as net worth incriases,14which is-Why it is vitally important to be adequately capitaliied.
The Chinese do ?have access to limited capital, but big money'is a different_ story. Commercial bark6 trust the Chinese, but,/asa rule, they are not in the habit of providing entrepreneurs withrisk capital. Access to venture capital is what the Chinese,need,and taking advantage of government-proffered assistances such asMESBICs may.be one answer. The mechanism whereby tIESBICs makeavailable venture capital was touched upon earlier. They'are setup to involve private investors and to provide tisk capital to'minority enterprises. MESBICs provide counseling and technicalassistance as' well.
'MESBICs have been available for three years now and in only
14. Joseph D. Phillips, Little Business-in the American Economy(Urbana': University of Illinois Press, 1958); p. 55.
Z.)
-300-

'7
one instance have the Chinese taken advantage of this opportunity.
Obviously, the Chinese have not availed themselves of many oppor-tunities set up for minority enterprise, and my belief is that they
simply do not know about them. A second recommendation, therefore,
is to create better channels of information to ethnic communitiesother than the black and Spanish-speaking ones. This recommendation
applies also to government programs other than MESBIC that helpminority businesses find needed resources, and managerial, technical,
and marketing assistance.,
My third recommendation, therefore, isto invite Asian- Americanmembers to serve on the private sector Minority Adilisory Council.(See Organizational Chart G.)' 'These people would convey the pulse
and economic conditions of the Asian communities,to the ExecutiveOffice of the President through GMBE. An Asian- American should be
included in the Nada Sector Interagency Committee. This person's
responsibility would be to make sure that Aiian-Americans are apprisedof the help available from the government and that they are fairlyrepresented for their share of programs awarded. Hopefully, Asian
representation will insure better channels of information in both
directions: from the government to the Chinese community, and from
1 the Chinese community to the government.
2
Chinese Do Meet Criteria
The Chinese make good candidates for assistance under the
minority business enterprise program. Mr. Newton Downing, diregtor
of the New York Office of Minority Business Enterprise, emphaticallystated-that his office is not intended to be a panacea for socialills nor,,4 giveaway program for ineligibles who do not have thepotential for successful operation of a private venture:, He said
that the,monay and efforts of the program must be concentrated ontarget beneficiaries who have the potential to spearhead and stimrulate the movement to eliminate inequities in our economic systemand influence the integration of minorities into the political and
social fabric of our country.
Mr. Downing is well aware that enthusiasm, interest, specialized
skills, and willingness to work hard and put in long hours are notenough to insure successful operation of a business venture. This
was pointed out in nine Case studies by Alvin N. Puryear and Charles
A. West in their book, Black Enterprise.15 One of the men there
described had had years of experience making pocketbooks. He was
15. (New York: Anchor Press, 1973).
310-301-

PUBLIC SECTORINTERAGENCYCOMMITTEE
CHART G4
ORGANIZATIONAL CHART
OFFICEOF MINORITY BUSINESS ENTERPRISE
EXECUTIVE OFFICEPRESIDENTIAL ORDER
11625
MINORITY BUSINESSOPPORTUNITY COMMITTEE
(.ABOC)
STATE OFFICE OF-MINORITY BUSINESS
ENTERPRISE(STATE OMBE)
S.
MM. 6111,
U.S. DEPT. OFCOMMERCE
1111110 - -- mmalm 4SIMEM
NATIONAL OFFICEOMBE
REGIONAL OFFICEOMBE
*WNWIMIMO IMINEme .11* 00111* MEM.* 11.1==.; gamma mamol
FIELD OFFICERS
=10
PRIVATE SECTORMINORITY ADVISORY
COUNCIL
BUSINESS MANAGEMENTDEVELOPMENT
BUSINESS RESOURCECENTER (BRC)
BUSINESS AND TRADEASSOCIATION
BUSINESS DEVELOPMENTORGANIZATION (BDO)
CONSTRUCTION CONTRACTORS-ASSISTANCE CENTER (CCAC) .
MINORITY BUSINESS &TRADE ASSOCIATIONS
1
MINORITIES
EXPERIMENT ANDDEMONSTRATION
A11 efforts and resourced represented by.agepcies and organizations indicated on
this chart are accessible tominority entrepreneurs
4j02'.
3 1

skilled in a trade, but lacked managerial ability: An then fellowwas extremely artistic and could create beautiful fabr c designs.A market existed for his product, but the designer d. not know
how to handle money. Another man's life-long ambition had beento own the TV repair business in which he had worked most of hislife. Yet, when each man became captWIE-Uf-his shi he flounderedand would have sunk had it not been for government = ssistance under
the Minority Business Enterprise Programs.
Nevertheless,-there-are the large numbers wh .sink in spiteof everything, and these cases have been rather iscouraging. Thefailures put the government assistance programs o test and challengemy recommendation that the Chinese reverse the end away from self-employment. The Chinese, however, have had al. ng tradition ofbeing their own boss, and cultural tradition s equipped them withthe temperament, the industry, the credit concepts, and the kinshipsupport to operate on a miniscule scale. Now it ia time for themto expand their vision and move up in scale, not out of small businessand self-employment entirely.
.4+
What Kinds of Businesses?
The type 'of business venturdsthat the Chinese should considerought to have some of the following characteristics:
1. They should utilize the talents of a highly educatedpopulation for its managerial and technical ability, and shouldcomplement it with a group that can provide a steady source oflabor. The purpose of the latter, of course, is to try to accom-modate the recent immigrants who must find employment quickly, butdo not have the,Edgaish facility that would enable them to competein the labor market. In-effect, an attempt should be made tocreate jobs for other Chinese, if possible.
2. They should diversify into other occupations and industries.
to broaden the economic base beyond the existing narrow ones ofretail trade and service enterprises. Areas for Widening shouldextend to professional services, manufacturing, and even agriculture.An agri-business would be such an enterprise. It would apply modernbusiness practices to agricultural production. Ownership and opera-
tion of a hotel would be another area-of diversification.
3. They should encourage dispersion of the heavy populationconcentrated in Chinatowns. One can see immediately the differencesin the type of enterprises that_exist.in Chinatowns and those thatare no longer tied to the ghetto. In other words, locate outsideof Chinatowns. Create employment opportunities that will pull the
312-303-

Chinese away, so that they can put aside their crutch after aeriod of Adjustment.
These characteristics are not all inclusive. Perhaps I amadding another difficult dimension-(social consciousness andresponsibility) to an already difficult task (that of setting upa successful private enterprise). But, if government is seriouslytrying to address itself to social problems, the private sectormust not evade the issues entirely.
4,N
3 i 3,-304-
-;'" ,-

CHAPTER XIII
CULTURAL BAGGAGE
Since eight out of nine Chinese are wage or salary employeeswho at one time or another must look for a job, the question
naturally arises: What special problems do they encounter in'
seeking and finding employment? It is not within the scope of
this report to deal with the problems common to all job-seekers,for to most people job hunting is a trying ordeal. Therefore,
we will consider only those factorg which especially affect the
Chinese.
The mere fact that they are physically different from themajority racial stock in the United States sets the Chinese apart,and the fact that they are biculturally rooted in equally strongand competing civilizations compounds the problem.' Anthropologistshave noted that, when peoples from less developed cultures comeinto contact with the better developed cultures, the weaker readily
yields to the stronger: When both cultures are strong, the conflictis amore intense.
Cultural Dissimilarities
Bicultural conflicts pose formidable obstacles to the Chineselooking for jobsespecially those in the higher echelons. ppm
example, the American approach is "to get out there and sell your-
self." To do that, one must toast about or, even exaggerate one's
educational background, personal qualities, experience, responsi-
bilities, and abilities. The applicant must demonstrate that hestands heads above many other applicants and prove that-he is-
best qualified for the job. Such tactics call for aggressivenessand assertiveness, which go-strongly against the grain of'the
Chinese character. To pursue a job in this fashion in China wouldlower inestimably the employer's opinion of the applicant and mark
him as one of uncouth and coarse manners. Humbleness and humility
are prized virtues in China, but they are cultural yokes when it
3 I 4-305-

e",:\
f
comes to looking for a job in the United States.
According to Francis L.K. Hsu, the noted anthropologist, theAmerican culture is individual-centered; the Chinese Culture,situation-centered. The former calls for self-reliance and ruggedindividualism; the latter, for mutual dependence and accommodation.Hsu'i entire book, Americans and Chinese: Reflections on TwoCultures and Their People,' points out the cultural dissimilar iesin American and Chinese life, and he uses as an example how Ameri-cans and Chinese view the plot and drama of the movie version ofMarcia Davenport's novel, Valley of Decision.
The plot involves a wealthy industrialist whose son isunhappily married to a woman who sides with her father-in-lawin a labor dispute. The son is sympathetic toward the workers',and he falls in love with the family maid. When violence eruptsin a labor strike, the industrialist is killed. When order isrestored, the son takes over management of the plant and insti-tutes liberalised factory policies. He divorces his wife andmarries the family maid.'
Hsu wrote:
. . . to the American audience this was good drama, since-every conflict was resolved in a way that is desirablefrom an American point of view. The production conflictwas resolved in favor of new views on manufacturingmethods over the old-fashioned ones; liberal attitudestoward labor won out in the social conflict with hard-fisted attempts to suppress the workingmen; (and theson and maid were married). . . . 2
To a Chinese audience, however, the son was shamefully unfilial."A son in conflict with his father was a bad son, and a maid Whowould help such a son in his ventures was a bad woban. Throughthe same Chinese lens, the daughter-in-law was regarded as anextremely virtuous woman who suffered in malicious*handa."3
Hsu gives another example of how cultural baggage interfereswith the Chinese in the United States when they should speak up
1. (New York: Doubleday Natural History Press, 1972).
2. Ibid., p. 3.
3. Idem.
31.5-306-
/
sty

Si
7,
for their rights.
The patternuf mutual dependence directs all men- -laborer and businessman, tenant'farmer and landowner --
, o seek their security and advancement through p sons,
through the alliance of superior, intd subord3 4ate Thismeans that when there is conf4ct, the teladency is tocompromise rather thin to adopt a unilateral sition.
It/is for these reason's that Chinese workers havenever bgen militant.;:supporters of large-scale labormovements and. havellot, in, the Western sense of theterm, proved tiPbesood or persevering fighters in aneconomic struggle. The individdal dois.not fight withthe owner and managers for hiOter wages or better work-.Ing conditions, but tries tR,,athieve thiee goals byjoining their ranks or influaicing them through familyconnections, friendship, and neighborhood or comihnal
ties.4
t74
xr
These tried and tested tacpcR'evolved from an overpopulatedsociety where accommodation oiled the geari of daily life and whose'
goals were to reduce conflict to a minimum. Taken from its nativesetting, this reluctance td*challenge the status quo can place they'Chinese at a disadvantage.
Personality Tests
Many American corporations use personality tests to screen
job applicants. These tests are designed to probe 'the inner recesses.of-a person's psyche, and they include such-devices as the RorschachInkblot Test and .the Tbematic Apperception Test (TAT). These testsarellot only given as standard procedureto job -applicants, butare used to weed out personnel and to checkup on people alreadyon the work force. .
No matter what tests are given{,. the interpretation of them
is surcharged with, dominant American values. For example,Dr.Burleigh Gardher, of Social Research Inc.,,a.giant testing outfitin Chicago, claims'to have distilled (from the TAT) the twelvefactors that make a good business leader. "The men'who-stillfeel strong emotional ties --far more than mere affection--to themother hive systematically had difficulty,in the busiUess situation,"
4.. Ibid., p. 309.
316-307-

-1
warns Dr. Gardner. Such men are not executive timber.5 Dr. Gardnerprobably has not read the family history of the Rothchilds, nor abiography of Franklin D. Roosevelt; in both cases, strong-willedmothers ruled the family roosts. The Chinese in Southeast ASia9perate huge business enterprises, and they, cling to the kinshipfamily 'of theirmotherland. o
The American standard of, emotional maturity, however, is tocut parental ties as soon as possible. -Against thAe yardsticks,
'chow can a Chinese pass the personality tests and be considered foran executive position when he has been taught since infancy thatthere is no greater virtue than to honor, respect, love, and obeyone's parents? In all probability, the values he prizes may work,against his interest in getting beyond the personnel officer.Even if he gets in, he will not climb too high unless he forsakeshis Chinese upbringing and becomes an unfilial.son, or is awareof these cultural.discrepancies as they are applied in the UnitedStates, and takes measures to protect himself.
Proclivity or Disdain for at? Occupation
In every society, there is a social 'ranking of occupationsindependent oft-monetary rewards. or centuries, in Europe, theclergy was the highest, calling. In Asia, the monk occupies avery lowly status. In eighteenth-century England, the man ,ofmeans for leisure wore white gloves to show that-he did not haveto dirty his hands at any task whatsoever, and he was looked upto and envied. Tu- other societies, he would be Consider a use-less parasite.
Movie, stage, and television stars enjoy giddy fame and commandastronomical salaries in the 'United States; actors and actressesare placed near the bottom of the occupational totem pole in China.The samaurai, 'or warrior class, stood directly below royalty andnobility in Japan;-the-military was at the bottom of the entireheap in China. And so it goes. Etch culture judgesjts octuftationsaccoAing to' ts own,acale of values, ,but, in nioving frOm onecountry to the other, the immigrant-finds that the yardstick haschanged on hi. What he once considered lowly or prestigious,positions maiThe completely reversed,,, and he might have to revisehis attitudes; and thinking.
From tiie immemorial,' the philosopher and scholar stiOod at
4
0
5. Quoted Martin, L. Gross, The Brain Watchers (New, York: RsadomHouse, 1962 p. 61. ,r.
3-308 -.
I
n
-'a

the apex of the occupation Scale in China. Then came farmers,
the liboring class, the tradesmen, and, last of all, the Military
men. The cultural holdover is quite eviden in the high educa-
tional attainment of the Chinese 1n the U States and in the
heavy concentration of the labor force in he teaching profession.
However, if the declining birthrate fores ws a shrunken student
population with less employment opportunities in the educationalfield, Chinese- Americans will be disproportionately and adversely
affected.
What is more difficult.fbr many Chinese to overcome is theirattitude toward certain lines or work. From personal knowledge, .
I detect a high degree of disdain among the foreign-born Chinese
for such occupations as religious work, acting, heavy labor, and
soldiering. There is a decided reluctance-to go into these fields,
The Military
The census of 1970 shows only 2,098 males of Chinese ancestry_In the armed forces of 'the United States (see Table 83), and these
few may have been the result ofthe draft, rather than voluntary
enlistment. Now that the draft has ended, the numbers may be fewer
yet. That is why I hesitated to include the military as an employ-ment possibility for the Chinese. .But, after I.interviewed Air
Force Maj. Jung R. Chung, I felt that a.few ofliis comments from
his personal.experience were worth mentioning...
TABLE 83
CHINESE MALES IN ARMED FORCES
IN UNITED STATES, BY AGE GROUP, 1970
Age Group Number
Total 16 Years & Over 2,098
16-19 Years 7520-24 Years 1,039
25-34 Years 480
.35-44 Years 244
45-64 Years 147
65,Years & Over 13*
Source: U.S. Census Bureau, SubjectReport, PC(2)1G (1970), Table 21.
*An unlikely number and Perhaps attributableto Bureau of the Census- allocation formula.
3'38-309-
.4
-1

.
Major Chung feels that the armed forces at the officer's leveltoday offer more of an opportunity to break into the managementlevel and administrative work.' Having been employed in privateindustry in a technical capacity and having gone as high as hecould in that respect, he found himself up against a etone wallin trying to get into management: As an officer in the air force,Major Chung, who is still a young man, will gain invaluableistrative and leadership experience that will stand him in goodstead should he go back into4iivate industry.
The branch of the aimed forces that he -knows best, the.,,airforce, is a'highlytech15ical outfit. lien and women trained inthe air force have marketable skills for the private sector. Whenthese people return to civilian life, they enhance the economicstrength of the nation. According to the Department of Labor, oneout of every six civilian craftsmen or technicians received hisinitial technical training in some military school.
The air force is the first breath of the armed services topromote a persod of Chinese descent to the rank of brigadiergeneral. Gen. Dewey-KwocCung Lowe was born in Oakland, California.He graduated from the University of California at Berkeley, andhe has a -law.degree from the San Francisco Law School. The generalis a much- decorated command pilot with the Legion of Merit and theDistinguished Flying-Cross among his many awards and honors,
the military is a conduit for training and- experience, bI doubt if it holds any appeal whatsoever to the Chinese. Soldieringhad been such, a despised occupation for the Chinese for too long.
These few examples of cultural divergence give some inkling ofthe tremendous adjustment whiih the Chinese undergo and which affects,directly or indirectly, their employment situation. There are innum-erable other instances that would take too long to recount here. We-
have repeatedly mentioned the most important cultural barrier of all- -that of.the language. Now, I would like to point out why the foreign -born Chinese-speaking person encounters greater difficulty than 'aEuropean immigrant, for instance.
From Ideogram to Alphabet
The language difficulties cannot be stressed enough. Everyperson conternedirlth the employment of, the Chinese in the UnitedStates emphasizes and reemphasizes this one hurdle. The problekranges from the bewildered soul, who can hardly pronounce yes,andno, to the distinguished professor, perfectly fluint.in writtenand spoken English, but who is denied reappointment because he has
3!-310-

a heavy accent.
Why is language any more of a hurdle for the Chinese than itis for other immigrant groups? There are several reasons.
Most Western languages are based upon an alphabet, whichserves as a key to pronunciation and writing. Many words in French,Spanish, Italian, or German are quite similar to-the English.. Thus,
a European would have less difficulty making out that teleiono (Spanish)
or telephone (French) or teiefon (German) is the telephone than woulda Chinese, who is accustomed to a totally different form of writingand speech. -In Chinese, the characters for telephone are rifwhich literally translated means electric talk.
The Chinese language consists of monosyllabic characters ofpictographs, ideograms, and phonetic compounds representing words,things, or concepts. Each character is squarish-shaped and iswritten from top to bottom and from right to left --the exact oppo-,site from English or any of the Occidental languages, which arewritten from left to right horizontally. The characters below area sample of Chinese writing. To get some idea,of what the trans-ference involves,-I would suggest that the English- reading personof this report take a pencil, and try to copy some of the characters
from this excerpt. Undoubtedly, the exercise will heighten appre-ciation for,the Chinese immigrant's language problems.
3E
Apart from syntax or customary usage, Chinese has no inflectionof number, case, person, tense, or gender. It i& not bad Chineseto say, "I .E yesterday," "I 215.1 today," "I Bo tomorrow," or "I would
have Bo last week." For a Chinese to have to break down a verb intovarious forms dep,..ning upon thea time of the action imposes a newrule in langua to which.he or she is not accustomed.
, offTo furth
e
add to the complications, there is no equivalentmasculine gender in the nouns and pronouns in modern
.4
X
Chinese. Everything is neuter. That is why so many Chinese usehe or him for both sexes, not realizing that such usage creates anunfavorable impression upon a potential employer.
Chinese words can be,used freely as different parts of speech.Sqme English words canbe'used as noun, verb, adjective, or adverbwithout being labeled-bad English, but the Chinese language is moreflexible, and a word can be any part of speech, depending upon itsword order in the sentence.
The Chinese language is very economical in its.use of words.Correct Chinese does not mandate saying, "He is very poor," whenit is perfectly clear to say, "He very poor.".
The number of Chinese characters ranges as high as 50,000,although the telegraphic code lists only 10,000. Howevei, thereare less than 600 sounds for all these characters in Mandarin.The author of the article on Chinese language in the BncyclopediaAmericana, Prof. Y.R. Chao, whimsically demonstrated how one soundcan represent many characters. He wove a story of 53 differentcharacters, all pronounced 110 around "Aunt Yi's Pancreas." Thedifference between the characterS0 deduced from the tone, or theinflection, orthe word order. For example: /
"Ma, ni hao?" means "Mother, are yoU well?" but "Ni ma hao,"means either your mother WO is well, your horse (mg) is well,or your flax (mg) is good, depending upon the tone, the inflection,ior the context.
There are certain sounds in English that are nonexistent inChinese. For instance, the.lack of an r in the 'Chinese languagecauses much embarrasAment for Chinese waiters who say, "flied lice."Final consonants are another headache. Pencils are pronounced
pensou. tend and lent, bad and bat, place and plaza are indistin-guidhable:
Many of these troublesome areas make it extremely difficultfor the Chinese to. ,learn English readily. Even .when- they-can
commit their thoughts to paper idthout grammatfcai error?!theyare still confronted with vocal difficulties of speech and prgpun-'ciation that employers tend to interpret as handicaps or initicationsof an inferior education.
Dialects Galore
To'complicate matters, spoken Chinese is not-iaiform. Fortur
nately, the written language is. Although.the majority of Chinese
3.2a-312-
-t

1
in America came from an area in and around Canton, the Chinesepopulation in the United States is becoming more diverse, as immi-grants come in from northern, western, and central China, and the
island of Taiwan. Most of the immigrants from the areas outside
Canton speak a common dialect based upon Mandarin. There are local
variations in the speech but, by and large, the people can understand
one anothet.
Mandarin is quite different from Cantonese, and both are
mutually unintelligible. The gap is not as great as that betweenChinese and English, but the difference is ,neat -enough to create
a boundary between these two major dialect-speaking groups. TheCantonese-speakers will identify more with the Chinatown communityandits Institutions, whereas the Mandarin-speakers generally feellike intruders when they go into-Chinatown. They are not as likely
to cluster together and will reach out into the larger community
for employment opportunities. In a way, this nonacceptance of theMandarin-speaking groups in Chinatowns may be a blessing in disguise.
Personally, I think there is a significant correlation betweenhigher mobility for the Mandarin-speaking group than for the Cantonese-speaking one, although no studies have been conducted on this score.
In sum, the language barrier is the'igreatest hurdle that theimmigrant Chinese must scale. Even though he may master the written
language, he may never speak without an accent, and this will inevit-ably be a handicap to him in all of his dealings, both economical '
and social,
322-313-
4.
SUMMARY OF FINDINGS
1. The mere fact of being Chinese does pose special employ,-meat problems for the group.,
2. Oftentimes, the widely disparate cultural values of twostrong civilizations create bicultural conflicts that the Chinesemust resolve. Examples of these are the competitiveness and aggres-siveness of the West in contrast to the humbleness and accommodationof the East. Another is the strong emphasis on parental ties, whichis valued in China, but looked upon as a weakness in the United States.
3. Psychological tests, commonly used toda in hiring,, retaining,and promoting, are highly value-oriented against the Chinese.
4. Cultural attitudes in favor of or against certain linesof work limit the occupational options for many Chinese.
5. Learning English is a more difficult task for the Chinesebecause of the wide disparity of the two languages. English isbased upon a Romanized alphabet and has a highly structured grailmar.Chinese is a pictorial and ideographic language with little gram-matical construction. To complicate matters, spoken Chinese variesconsiderably according to loeal dialects. A Shanghai Chinesecannot understand a Cantonese Chinese, and vice versa. TheCantoneseChinese tend to identify-with Chinatowns, whereas the non-Cantonese,alienated from the community, tend to reach out more into the largersociety. 4
a
323-314-
RECOMMENDATIONS
The melting pot theory in this nation of immigrints has already
been debunked. Lip service has been paid to cultural pluralismin which diversity of cultures is fully accepted, but it is notyet a reality. The "stranger," as Prof. Elliott Skinner6 labelsthe outsider, is never completely accepted. The West has presumedits own superiority for so long that it has disdained to even look-.at the Eastern cultures. That mistake was already committed byChina centuries ago when the Celestial Emperors thought China wasthe center o universe and thereiwas'ho need to deal with thebarbaric white man. Not until the same blasted such ideas withtheir gunboats and carved the Chinese empire into foreign spheresof influence did the rulers revise their thinking.
The gunboat tactics worked against the Chinese in the nineteenthcentury, but are backfiring in the twentieth. The technologicalculture of the West has reached its zenith, but its social culturelags far behind. We see this in the disintegration of the family,the generation gap, the alienation of the individual from society,labor strife, crime-ridden cities, and the escape through drugs.
Take'American competitiveness, which is so highly valued andis the key, to upward mobility-in the United States. Again, to
quote Dr. Hsu: "American competitiveness . . . never brings men
together because its basis is 'eaciiiiir himself'. One individual's
gain invariably means some degree of loss to others. . . . The
more successful need the inferiority of the less successful to
make their triumph more absolute."7.
As for untying the paternal apronstrings so highly touted asa special characteristic of the top -notch executive, Dr. Hsu has
this to say: To the Chinese, "the parent-child ties are permanent
rather than transitory. It is taken for granted that they areimmutable, andso are not subject to individual acceptance orrejection. "8 It is precisely in the primordial relations of thefamily that -the Chinese find continuity, permanence, and personal
security. That is why some values cannot be compromised. They
cannot and should not be given up for a bowl of porridge. Conversely
6. "Theoretical Perspectives on the Stranger," paper presented atColumbia University, Cultural Pluralism Seminar, 1974.
7. Op. cit., p. 305.,
8. Ibid., p. 111.
/ t
,324. -315-
110'
e'

the West could take a few lessons from the East in the sphere ofsocietal precepts. A Chinese sage questions Seriously the allegedsuperiority of Western civilization, which he thinks, destroysfathers and sons together.
.
In your land, power can do nothing. hour politicsconsists,in changes of heart, it leads to general revo-lution and then to reaction against' revolution, whichis another revolution. Your leaders do notAes40 yourfree men are forced to labor, you are afraid of yourslaves, your great men kiss the feet of the crowd, wor-ship children and depend on everybody.
. . . You have neither the patience that weaveslong lives, nor a feeling for the irregular, nor a senseof the fittest place Tor a thing, nor a knowledge ofgovernment. You exhaust yourselves endlesily rebegin-ning the work of the firit day. So your ancestors aretwice dead, and you are afraid of death.
. . . We men of these parts feed by continual,millions in the most favorable valleys of the earth,and the depth of this ImMense sea of individuals haskept the form of g familg'in an unbroken line from theearliest days. Every mai here feels that he is bothson and father, among thousands and, tens of thousands,and is aware of being held fast by the people aroundhim'and the.dead below him and the people to comelike alrick in a brick wall. He held@ . . .
Think of the web o4our race and tell me, irsEwho cut your roots and dry your flowers, how is ityou still exist? Will it.be for long?7 .(Italicsmine.)
In spite of such admonishment, the cultural values of China'sgreat heritage are loosening their hold on Chinese-Americans. Thefallacy, of this line of thinking is that to adjust to living inthe United States, one must embrace the American way in sum total s.
and cast off the Chinese heritage like an out-grown garment. Thistendency is beoming increasingly prevalent, at great psychologicaldamage to those who are the farthest removed from their ancestralculture. I-recommend that all Chinese-Americans pause in their
.7W
9. Quoted in Paul Valery, "The Wisdom of the Orient," New YorkTimes 25 March 1971 (p. 39).
r r-. 3
-316-

tracks toward Americanization, and be a little more selective
about what is accepted. At the same time, let us study our
cultural heritage to see what is superior and can be retained.
This way, there will be give and take of the best from both
civilizations.
Technological Aids for Language Learning
Where American technology could be put to good use is in the
area of language learning. Since Chinese is so radically differentfrom those languages based upon a Roman alphabet, greater time and
effort must be devoted to its mastery. Since most immigrants come
to the United States full grown and after their formal` education
has been completed, attending classes poses.a formidable hurdle,especially if there are family responsibilities that take on first
priority..
In Chapter II, I.recommended the' establishment of more nglish
language classes for adults. In addition to the classes, w ich.in
all likelihood can only be established where there" are large concen-trations of Chinese,,I would recommend that the state educationdepartments or the Federal Office of Education fund the preparation
and recording of cassette tapes inInglish language instruction
for'Chinese. These tapes should be prepared by linguists versed
in the teaching of English as a second language. The Chinese diar'
lect used to explaii-the_terms and the lesson should be Cantonese,
father than Mandarin. There are a number of records and tapes now
available- or the Mandarin - speaking person, but little for the
Cantonese speakers. Yet is the-latter-who make up the bulk of
the'Chineee-population,in the United States.
These tapes should be made widely available on loan throughthe public library aystei to those who do not have time to attend
classes. The tapes can be played-on any ordinary cassette recorder,so the time and place of their use is flexible. This method ofdistribution-of educational materials does not depart from usual
_library ptactice or procedure. Currently, many librariei provide
hooks in Braille for the blind,'large7print books for the elderly,and den music records and works of art for music and art lovers.
Cassette language-tapes-could beranother service geared to the
Chinese whq Want to learn English on their-own.
Ample publicity must-be given-through the Chinese press and
radio to the availability of such tapes. Unless prospective users
are informed of'the existence and easy accessibility of such tapes,
few people will eves benefit from them: Therefore, it is just as
important to publicize the tapes as to create them.
326-317-

r,
CHAPTER XIV
RACISM MODIFIED
Overcoming Stereotypes, Both Good and Bad
As a highly visible and distinct ethnic group, the Chinesein the United States are subject to a number of factors that arenot applicable to.most other groups looking for jobs or beingconsidered for promotion.
beliefssuch'factor is stereotyping.
"Stereotypes are a set of beliefs and disbeliefs about any groupof people."' Such beliefs or disbeliefs are legitimatized as.representing classifications of people based istinctive, easilyrecognized, and easily articulated criteria shed by members ofsociety. Such attributes, as assigned to a group, may however,
-. be based upon a false impression, a misinterpretation, an outdatedcharacteristic, or a deliberate attempt to disparage a group and
relegate it.to a disadvantaged' social status.
Tied to the Apronstrings of the Mother Country
When will the Chinese-Americans be considered apart from the
mother country? Invariably the first question to which any Chinese-American will have to respond when he sits across the desk from aninterviewer is, "How long have you been in this country?" Even
when the reply is, "I was born here. I've lived here all my life,"the presumption is that an ethnic Chinese is a Chinese nationalforever and ever. He is tied in with the ups and downs of Sino-
American relations.
I can wager.that favorable or ill treatment of the Chinese in
1. Howard J. Ehrlich, The Social Psychology of Prejudice (New York:
John Wiley, 1973), p. 20.
327!\7 -319-
rthe United States corresponds to the rise and fall of China's inter-national status and her relationship with the United States. Prioto World War II, the Chinese were unassimilable aliens, ineligiblesto citizenship. During World War II, they were an ally -in -arms,Thandthe Chinese Exclusion Acts were repealed. The Chinese wore buttonsproclaiming, "I am Chinese" to differentiate themselves from theJSpanese. To have proclaimed, "I am American" would not have servedthe purpose at all. During the Korean War, Chinese businessesagain had to exhibit signs stating, "I am Nationalist Chinese" todisassociate themselves from the Communist Chinese, and J. EdgarHoover, former director of the FBI, publicly stated that he suspectedthe entire Chinese-American populace of being potential Communistagents. In -1972, President Nixon's visit to Peking heralded anaura of elevated status and prestige for the-Chinese in the UnitedStates.
Few other,national groups are so irrevocably tied to theapronstrings of the mother country. The Italian never had toanswer for the deeds of Mussolini and is never told, when ha-iscritical of some aspect of American life, "Why don't you go backto where you came from?" German- Americans were never incarceratedin concentration camps during World War II. A Russian immigrantis not automatically labeled a Communist. White ethnics werenever labelled the "enemy" or "gook," even as they were servingon the front line in the U.S. Army in the Vietnam theater of war,as Asian- Americans were.
An American-born Jew is never asked, "Haw long have you beenin thidcountry?" and he is never complimented on how well hpspeaks English without an accent. An American black is not asso-ciated with any of the African nation's. On the contrary Nigerianblacks and West Indian blacks make special efforts to separatethemselves from American blacks so that they will be associated withtheir,mOtherland, but, if they'do not wear their native dreas andheaddress, they are taken for native-born Americans. An ethnicChinese, however, IS taken for a foreigner forever.-
"A Foreigner Has No Right to a Job"
When there are many applicants for a job or when a nulber ofaspirants are vying for a promotion, the competition gets keen,and stereotyping serves a very useful purpose for disqual gingpotential competitors. If all Chinese-Americans are cons eredforeign, then patriotism or nationalism can be invoked to lacethe Chinese-American at a disadvantage: "What right have
Amerose
foreigners got to take a job awaY from a full-blooded r can?";
"We've got to protect out own."; "Americans first."; and Chose
3 8 '6-320-

damned foreigners are taking the bread out of the mouths of oursons and daughters," become the rallying cry.
Somewhere along the line, someone conveniently forgot thatthis country is a-nation of immigrants, and after naturalization,all persons, whether native-born or foreign-born, are citizensand are entitled to all-the rights and privileges that such citi-
7 zenship confers. In an era of declining employment, even third-or fourth-generation Chinese-Americans may be subjected to unpleas-antries and hostile stares suggesting that they have deprived"Americans" of their jobs.
Cheap Labor, Hard-Working
The first wave of Chinese immigrants to hit the Western shoresover a hundred years ago came as coolies. Coolie literally meansbitter strength, and it is true these men had nothing more to offerthan their muscles and their labor. They were willing to work atjobs the white man scorned, and they were willing to do it for less.As a result, the Chinese came to be associated with cheap labor.
Stereotypes die hard. More than a century later, the Chineseemployee is expected to work for less, and he is offered less thanthe gopg rate. Worse yet, it is presumed that Chinese are contentwith less. The fact that he is earning less than persons withcompaile education is documented in Table 64. Some employersmay even consider it an affront 'if a Chinese-American asks for thesame salary and working conditions as others of his caliber arecomAnding.
At-the same time, the prevailing belief that all Chinese arehard-workers exacts from the Chinese-American an extra toll to liveup to the stereotyped expectation. If a Chinese person departsfrom the stereotyped image of being hardworking, noncomplaining,docile, and, quiet, he is told, "YoU're Chinese, but you don't ACTChinese," as if all Chinese were alike.
Laundryman, Restaurant Worker
All right, so the predominant occupation of the Chinese inthe United States until the 1950s was as laundryman, but, in theyear 1975, the Chinese laundryman is fast becoming extinct. Res-taurant work is still a very important occupation among the Chinesetoday, but that does not mean the Chinese are not capable of holdingdown important jobs or of performing important tasks. Yet, it israther difficult to get people in this country to accept the fact
329-321-

that there are Chinese bankers, outstanding Chinese scientists andarchitects, Chinese presidents of colleges and Chinese presidentsof large corporations. Somehow the American mind can not erase,the image of the Chinese as mere laundrymea.and restaurateurs,and I can osafely,say that, in the experience of almost every adultChinese-American, he has been taken at least:three times for oneor the other.or both.
Sometimes it is even hard for the Chpese themselves to acceptthe fact that some of their kind have penetrated the upper echelon.One day, I noticed a visiting student in my class. After class,she came up to speak to me and she told me that she was from BostonUniversity. I asked her if she knew Calvin Leer
"Vm a freshman," she replied, "I don't know any of theupperclassmen."
"He's not a student. He was the president." I explained.
"Of the Chinese Student Club? I hav t joined yet."
"No, Calvin Lee was president of Boston university. He leftBostolTUniversity last year to become Chancellor of the Universityof Maryland at Baltimore. L just thought you might have known him."
. ,.
"You're kidding," she said in absolute disbelief. "Presidentof EU! You're kidding!"
On another occasion,.a student asked if he could do his termpaper on some outstanding Chinese-American: He had come across thename Admiral Chang of the United States Navy, and was extremelycurious about how a person of Oriental ancestry ever got to be anadmiral of the United States Navy. Chang is a very common Chinesename, and I was every bit as curious as my student to track dowel
. this infCrmation. To tell the truth, I was quite skeptical. I
confessed that I simply could not visualize someone of Chineseancestry being in such,high office in the military command. Fortun-ately, my negativism did not deter my student. It turned out that,'
, although Admiral Chang was not Chinese, he was an Oriental of Koreandescent. Such feelings of inadequacy are symetomatic of a Peoplewho have been, relegated to an inferior statuve a prolonged period\.of time, and the low self-esteem is a dectded drawback to upwardmobility of a group highly qualified in other respects.
Favorable Labels
Some stereotypes attributed to the Chinese have been laudatory,
:a3L1-322- /
Vs.

1
rather than derogatory. Such favorable labels tacked on to-the
group as a whole are industrious, honesi, dependable, intelligent,efficient, and strongly familial.' Elsewhere in this report, I
have presented anecdotes which illustrate how such blanket labels
have aided the Chinese in finding employment. In factwhenbusiness films are under-compulsion to upgrade their minorityrepresentat ion,. the Chinese are actively sought.by personnel of- ,
ficers who earnestly believe that all Chinese possess these qual-
ities. Ng nephew, o wor for a major oil company, was the first
Oriental hired by th Shortly afterwards, the vice-president
in chirge of personnel took hitifo lunch and solicited his help,ta getting more Chinese to work for the company.
I interviewed a recruiter from one of the largest electricaland appliance manufacturers in the country. The question I put
to her was: "Do you think racial, discrimination48 still a factor
to contend with for the Chinese job applicant?"
"On the contrary;" she replied. "Whiney r we 'Yee a Chinese
.name, we flag the appliesition." -
A Chinese fr nd of mine on Long- Islam uns a homeL.cleaning
service. He owns he,business, but he does not do the cleaning
himself, nor does e use Chinese help. The business goes under
a Chinese name, so my friend was able to quickly,nttract a long
list of potential customers. However, when the workmen showed up
to do the cleaning, many housewives called the office in protest."We thought you were going to send us Chinese workmen," they insisted. r"The Chinese are so much -more dependable and reliable."
As mechanisms for the reinforcement, of prejudice, stereotypes
can be irrational and contradictory. The Chifiese are At imice honest.
and sneaky; they are cunning and mysterious. "You just can't' trust
them.!' They are artistic, but not creative. They are immoral, yet
highly civilized. They are good businessmen, and they are Communists.Take your-pick.' Stereotypes, whether good or bad, arenot applicable
to every member in the goup. determinants of stereotypes are to
be found, not in the target group, but 'in the-enilronm 2 and those
characteristics attributed to the Chinese lihic0.affe their economic,
status are to be found in the social settinelit economy of the
United States. They change with the inteljlati nal climite and they,
change with the economic situation. They" are applied,-to the group
without allowing for individual differences.
it I
2. Ibid.t rte'
331-323-
Does Belief Lead to Action?
Stereotypes are a set of beliefs about _a group. Prejudice isa negative attitude, but' discrimination is overt action and prejudiceacted out. Today's practitioners of discrimination are no longeropenly crude._NO one will put a want ad in the newspaper saying,'"Chinese need not apply." Laws could never pass' legislative bodies .
today in the out-and-out racist language commonly found in theanti- Chinese statutes-of the 1880s. Federal government policy isnO longer officially racist. There are even wittbdogin governmentand private agencies who protect and seek to guard the interests ofracial minorities. But that does not mean that prejudice and dis-crimination no longer exist. Some of it is rerouted. Some aremasked and given respectable euphemisms; some are hung on institu -'tional hooks. When accomplished through thesediversionary tactics,it is disguised and no longer recognizable.
For example, the first Chinese ExClusion Act of 1882 did nothave any qualms about naming the Chinese specifically. By 1924',
racism had putn silk gloves, and the yellow and brown peopleswere redefined as "aliens ineligible to citizenship." The endresult was the same.
Law and order means one thing to the whites and another-thingto the blacks. To thelatter, it means keeping the black in hisplace., To the majority group and to a naive world at large, itmeans a legitimate function of government to exercise social-control.
"Local experience" is a new term that is frequently encounteredby Chinese immigrants looking for employment outside of di% (Chinatowncommunity: For example, a reservation agent who worked ftir"an inter-national airline for five years in Hong Kong may apply fora similar'job in New York. Her experience is discounted, or not counted atall, 'because she does not 'have local experience, meaning experiencein the United States. In some instances, local experience isimportant to job performance; but, in most-instances, the skillsand experience are readily transferrabl.e, given a short period ofreorientation. Therefore local experieliCe translates. into a "No"that is difficult for. an immigrant to overcome.
r...
.Inequities and Disadvantages -
. . ,
Todwhat'extent is employment discrimination practiced againstthe Chinese and what form does it take? rthink we have touchedupon this topic in aliOst every chapter of this'reliorig It-Wouldbe redundant to repeat everything here. 'Discrimination against ,
the Chinese is no longer -expressed in outright hostility,: but is:
. .. ,
'
332,-;3z47
\

0
C
I
grounded more along the lines of inequities andstemming from their immigration status or cultural c ricts and
dissimilarities.
Unfortnaately, some of these inequitievpose employment barriersthat are impossible for large numbers of Chinese to scale throughpersonal effort. Examples of these are such legal roadblOtks ascitizenship requirements--min4simm waiting period-of five/ears--or probationary periods for refugees--kiniman waiting period twoyears. Another solid wall against an ethnic group which has sorecently been admitted to these shores after nearly a century of
exclusion is state prohibited employment of foreign-trained profes-sitnala., The father-son tradition of gaining admittance to thetrade union is an area-where the Chinese find it almost impossibleto effect a breakthrough.
disadvantages shouldered by the Chinese which are inherentin their cultural differences can be moderated somewhat through 'personal. effort. How? By attending English language classes,by persevering through the period of cultural shock and transitiOn,and by beiig better or mote competitive. There is no question thatthe Chinese haveto try harder to obtain the same or lesser results,and no one can or, will -.dispute the fact that gross inequality exists.;
Tilting the Boundary"
However, let' us recognize thatthere has been substantial..progress in economic opportunities for minorities xithin the past
several decades. The facts and figures bear this cut:3 The progresshas not been uniformly distributed nor equally applied, but signif-icant c4ages for the better have come about.
Roger-Daniels and HarryRitano, ift'their book, American Racism,4depict thechange iu the models given below.
Fig. A
Whites
Nonw111.tes
Pig. B
rtes
C
Non-IWh.
All whites suierior. Most Wiites superior'la group superior,.
. .
3. , 'Bayard', Rustin,. "Affirmative Action in an !contrary ,Of Scarcity:
New York Teacher 3 November 1974. . . ,
,
4. -(Enilewoed Cliffs:-. Prentice Hall 1970), p. 95.
- %...2
:333,
e
r.

.<
,TABLE 84
..
iqui6ROCCUPATIONS OF THE FOREIGN -BORN CHINESE, BY YEAR OF IMMIGRATION, NUMBERS, ANDPERCENT, 1970
Major' Occupation Group'
1965-
1970.
1960-
1964
19557,
'1960
..
Year of Immigration
195b-
1945-
1935-
.
,1954
1949
,1944'
1925-
1934
1915-
1924
Before
1915
41.
Total
For.-Born
1
Professionals
. 14,700
9,500
7,300
4,000
3,800
1,300
300
100
041,700
(Percent)
30.0
39..5
29.0''
30.2
12.5
.3.9
1.5
0.0
33.0
.Managers
(Percent)
.1,300,
' 2.6
.35.8
800
3.0
1,000
,5.4
1,400
10.1
600
4.8
2,400
23.1
1,000
13.2
1,300
19.7
400
10.8
10,300
8.2
Sales Workers
(Percent)
2,700
5.5
1,100
4.2,
09 4.3
200
1.4
500
,4.0
400
3.8
700
9.2
100
1.5
100
7.7
6,600
5.2
Cletical Woykers
8)700
5;20,p
3,000
.
'
800
1,300
.300
800
500
020)600
(Percent)
17.7
'
19.6
16.2
5.8
10.3
2.9
10.5
7.6
0.0
16.3
Craftsmen
1,400
700
...
'700
700
.300
"600
.200
20d
0'
5,200
-(percent)
2.8
2.6
3.8
5.1
2.4
15.8
2.6
3.0
0.0
4.1
Operatives
7,200
4,500
3,100
2,300
2,600
2,400
1,500
1,000
200
2,500
(Perceit)
Laborers
14.6
800
17.0
500
16.8
100
, 16.7
100
20.6 ,
400
...
23.1
100
19.7
200
15.2
200
15.4 0
2.0
2,500
(Percent)
1.6
1.9
0.5
0.7
3.2
1.0
2.6
3.0
0.0
2.0
. Farm Workers
200
100
0100
0100
0100
0600
(Percent)
0.4
'
0.4
0.0
0:7
0.0
'
1.0
0.0
1.5
0.0
0.5
Service Workers
11,300
3,800
2.500
4,240
,A 3,100
2,800
2,500
2,900
400
34,200
' (Peicent)
23.0
'-14.3
13.5
1014,
24.6
26.9
32.9
43.9
30.8
27.1
Private Uousehold
900
300
00
-0
0400
' 200
200
2,000
(Percent)
1.8
1.1
b.0'
0.0
0.0
0.0
5.3
3.0
15.4
1.6
TOTAL (1,00%)
49,200
26,500
18,500
13;800
12,600
10,400
7,600
6,600
1,300
126,200
Source:
U.S. Census Bureau, Special Tabulation, Public Use
Sample Data (1970).
-326-
I
The authors maintain that American society as presently struc-tured supports a two-category system of sttatiMatiort in. racerelations,' he whites are equated with the-superior-and,the_non-.whitest with the inferior. The boUndariet are maintained* beliefs,attitudes, organizations, structurea4"inatitutions, and mechanismswhich support the distinction between races. The once horizontalboundary line in Figure Alas now given way to the tilting line ofFigure B, and may progress to a vertical line, as in Figure C, whereno group is superior to the other, but each group coexists side byside without removal of the boundary and loss of -group identity.
I believe that the Chinese have tilted the,dividing boundaryin the manner described by Daniels and Kitano. Some individualshave done: better,than their white -counterparts, but. they have notcompletely touched the top, whereas most are still in the lower
half of Figure B.
Some indication of occupationalimobility"Oan be gleaned from .
Tabli84. Immigrants who came to the United States prior to 1945have, by and large, remained in theOperalives and service workerscategory. The percentage in the managerial classification isdeceptive: As previously pointed out;mostof these people areself-employed managers of:their-oWn Oen businesses. Keeping
in mind that the type of"Chinese immigrants changed'drasticallyafter 1949, -we can -see that those who had been in the United Statesfor twenty years-at the time of the 1960 census. have,managed tomove up Into the professional category to -the extent-of 39.5 per-
cent. At the same time, the service workers category shrank to-13.5,percent*
A smallei percentage of the more recent immigrants in the1965-1970 column are.in the,professional,grou0, (30 percent), and
more are in the service warkerscategory (23 percent). It seems
that given timeand the span may be-a-twenty-year period or anentire generation --- upward mobility does occur. The first-generation
may not see the fruits of its labor and its struggles, but at leastthe secotd-generation may reap or harvest what their parents sowed.
These assertions caii"be documented from two sources. Tables
71 ana-72 show current occupation and occupation five years agoand current industry and industry five years ago of the Chinese.Delineating the largest figure in, each vertical column gives usa perfectly diagonal line, shoWing that the Chinese do not'moveout of their occupations readily7-at ,least. not in aliie-year span.Offthe 16,-400 Chinese'males who were service workers in 1965, 14,000
were still service workers in 1970.: Thisdmmobility.in occupation
and'industry,held,true,consistently.
IA".38o .
1'1
I
I

2
C3
JO.
TABLE 85
OCCUPATIONAL MOBILITY AS REFLECTED IN TWO GENERATIONSOF CHINESE CCNY GRADUATES' FAMILIES
No: ofStudents Father's Occupation CCNY Alumni's Present Occupation
20 ,Laundrymen 6-teachers, 2 engineers, 1 accountant,1 manager, 1 scientist, 2 executives,1 actuary/trainee, 1 computer programmer,2'clerks, Tnp responses.
15 Restaurant Workers - 2 teachers, 2 engineees, 2 managers,1 executive, 1 computer programmer,1 hoSpital investigator, 1.supervisor,1 field assistant, 2unemployed, 2 noresponses.
Engineers 2 engineers, 1 intern
Teachers 1 engineer1,scienast,.
1 ACcountant 1 consultant .
1 Statistician 1 engineer
6 Businessmen 2 teachers, 1 junior executive; 1 actuary!'trainee, 1 research assistant, 1 UN,worker
2
1
1
1
1
Clerks 1 patent attorney, 1 clerk
Seaman 1 engineer
Clergyman 1 teacher.
Housetioy 1 junior executive
Warehouse Worker..,..,_, 1 engineer
1 Adult Education Aide armed forces
1 Manager 1 no response,.
Officer 1 engineer
Chinese Association 1 reacherPresident
330

t.
'TABLE 85-- continued
No, ofStudents Father's Occupation CCNY Alumni's Present Occupation
7 Retired 3 teachers, 2 lab technicians, 1 businessman,. ,
1 student'
3 lInemploxed 1 teacher, 1 rattearch assistant, 1 supervisor
5 Deceased 1 teacher, 1 junior executive, 1 labtechnician, 1 businessman, 1 technician
7 No Response
80 c .TOTAL
3 engineers, 1 computer programmer,1 consultant, 1 technician, 1 clerk
Source: Survey of City C011ege New York.Chinese Alumni (1972).
t '
t'
e
aa7/-329- -
11
,)
4

l
MY Son, the Engineer
However, upward occupational mobility does become a, realityfor the second generation, if a small sample of the alumni ofCity College of New York is representative of the lower socioeco-.nomic class Hof Chinese in the United States. CCNY is a municipal,tuition-free institution of higher learning that -,has traditionallyattracted the sons and daughters of immigrant families in thisgateway metropolis.. From 1960 to 1972, CCNY graduated 400.studentsof Chinese ancestry. A questionnaire sent to these alumni netted80 replies. The occupation of the father was compared to that ofthe graduate. This information is tabulated in Table'85. Thirty-five of the total respondents gave their fathers' occupation aslaundryman or restaurantgworker. Others included seamen, clerk,house-boy, warehouse worker,'and a scattered few as businessmenor professionals. In general, the fathers held low-level, low-paying jobs. The column to the right gives the occupations ofthe CCNY graduates. The job titles show that most are in theprofessions, in business, in technical work, or in administration.The four in clerical work'are females. In general the income ofthese graduates is higher than the median United States familyincome for 1969.
When asked if they were satisfied with their jobs, 44 of thegraduates timid yes, seventeen said no, fourteen gave no answer and
'five were not sure.
What were their chances for advancement? The tabulated.figureswere: excellent, 14; good, 25; fair, 12; poor, 11; no response,, 18.
When queried about what they thought were the main obstaclesto occupational advancement, the reasons given were:
Economic conditions 24No social contacts 22Inadequate training 19,Language problem 5
Lack of interest or ability 5
Being female 5Racism 1
\.)
No opportunityLaziness
1
1
No' response 19
TOTAL 98 (some aluMili gave
more than one reason)
The number of responses in-this,survey is too small to beindicative in any way, but the largest number of those who did
'44 336-330-

,r
rat
ry
reply felt that economic conditions was the primary factor governingtheir upward mobility, and a close second was lack of social contacts.Both of these factors merit a little further comment.
1975--Recession Going into"Depression-.
The.acid test comes when economic conditions are bad. It is
easy to be tolerant andmagnanimous when there is prosperity and-full employment. And is what this country has enjoyed, exceptfor minor dips, since World War II. In this favorable economicclimate, minorities in the United States were able to push forbetterment of their status, and they have succeeded in tilting thehorizontal bar as depicted in Figure B above. But as I sit hereat my typewriter in 1975, dark clouds shroud theeconomic horizon.Creeping anxiety and insecurity are gripping the nation. Opportunistpoliticians are already calling for'a crackdown di aliens. Someof the gains from the Civil Rights Movement, Equal Employment Oppor-tunity, Affirmative Action, and Contract-Compliance have alreadybeen eroded. The black unemployment rate is twice that of thewhites. The Bureau of Labor Statistics does not issue separatefigures for Asians, so we have no why of knowing how the Chineseare faring.
Heated debates ensue over the question whether seniorityprovisions are to be modified in favor of minorities.. Strongvoices are raised against the'goals and timetables,of the Aff irma-tive Action plans. Will the government ease 'its pressure on employersto comply with the law on minority hiring if the. economic situationworsens?
Seniority
This job security clause is contained in virtually all collec-tive bargaining contracts. But minorities charge that seniorityperpetuates discrimination because they werelast hired, hence.first in line to be fired. Co4anies caught between the collectivebargaining agreements and contracts signed with the Equal EmploymentOpportunity Commission have asked the courts for a decision. Inthe Jersey Central Power & Light Company case, the jUdge Ordered'
` the company and union "to work something out tonsistent with bothA contracts. "5 The solution was to set up three senforitrlists.
R.
5. Newly Bender, "Job Discrimination 10 Years After the Ban,"New York Times 10 November 1974.
339-331-

4
,One for minorities, one. for females, and one for all others.Layoffs would:come-from the bottom of the lists rotating frOM
, Column A to Column B to Column C, thereby preserving some ofthe gains made by minorities and women.
I
Quotas:
In another case, Charles Watkins et al., v. theContinentalCan Company and the Steelworkers Union,. thejudge ordered thereinstatement of seven blacks acobrding to a formula that would
__help maintain their steady-parcantage_in the work force. Out of--- a work force of 400, there-were-originally 50 blacks. In a drastic
cutback, the company retained only 149 whites and 2 blacks. Thejudge held that the blacks' low seniority and the disparate effectthe layoffs had on them stemmed from the company's racially discrim-inatory hiring policies before 1965.
Appeal on the Watkins case is being watched very cloiely.Many legal minds contend that it cannot be upheld. William J.Rilberg; Solicitor of. Labor at the Labur-Ddiartment said, "It'sone thing when peopleare laid off and there are other jobs inthe community. But when you compound layoffs with the knowledgethat there are no other jobs and you add to that a racial overtone,you have a serious probldm. It,shouldn't be handled cavalierly by ,
middle-class white lawyers who are in no danger of, losing theirjobs. ,Employment is life.'.It's food."6
Making a distinction between quotas and goals is very difficult.Both are based on percentages, but quotas are fixed, whereasgoalsare flexible objectives to aim for within a certain time limit.
Reverse Discrimination
Are minorities getting priority consideration for the scarcejobs? Are they being hired .over the better-qualifie&white males?"Definitely," assert the whites, and the number of complaintscharging reverse discrimination are rising rapidly. Some indica-tion of the cpurts'.atance was expected from the Defunis case, inwhich a,white male said he was discriminated against by the Univer-sity'of Washington Law School because other candidates with lowertest scores and lower grades were admitted whereas he was not. By
6. Ibid.
,3116 ,-332-
a.

e.1
the time the courts came around to hearing the case, the issue wasa moot one, and they said as much. Mr.-Defunis had been belatedlyadmitted and had'already earned his law degree. --a
On charges of reverse discrimination, Mt. John Powell, chairmanof the Federal EEOC, said,."There night be cases where the expecta-.tions of the white majority might have to be modified."7 RobertD. Lilley, president of ATT, expanded onthis viewpoint by saying,"What the White male is losing is not opportunity itself but thefavored place he's held over the years in relation to that oppor-tunity."
It does seem that same effort is being made to bold-onto some '
of the'gains.made by minorities over the past two decades. Civil.Rights, Equal Employment Opportunity, Affirmative Action were notcompletely abandoned at the first sign of economic setback. However,the decision in the cases cited above were handed down toward thelatter part of 1974; just when the recession was beginning to befelt. As the recession deepened and unemployment climbed,,Affirw-ative Action plans came under stronger. attacks. Selective hikinggiving an edge to minorities was expressly forbidden, and, in the'case of the appointment of a school principal in New York's schooldistrict No. 4, the job was taken away front -a woman of Puerto Ricanextraction and given to a white male because of the latter's higherqualifications.
Antidiscrimination Legislation
There ip no question that'antidiscrimination legislation hasbOn a strong lever in raising the status of minorities, and theChinese have benefited as much as the blacks, Puerta Ricans, Chi-canos, and other ethnics. These laws were strong levers and theywere strong crutches. But as Bayard Rustin said, "An affirmativeaction program cannot find jobs for the unemployed or help thenmderem0yed into better jobs if thosejobs do not exist. "8 Racismand discrimination cannot be dealt with outside the context of theAmerican economy.
tack of Social Contacts
The other main reason given by CCNY Chinese alumni as the
7. _Quoted in Ibid.
,8. Rustin, Loc cit.

determining factors of occupational mobility was lack of socialcontacts. =In a speech presented before the Asian-American Conferenceat Princeton in 1974, Professor James Wei gave a birdseye view ofwhere the Chinese engineers and scientists are at today. ProfessorWei, a graduate of MIT, formety taught at Princeton. He worked forMobil Oil and Dow Chemical for many years and now holds a chairprofessorship at the Univers1t3k of Wilmington.
=
Pointing out that engineering is one of the major occupationsof the Chinese Male professional,. he said that the diversity ofjobs held by Chinese engineers today was simply-beyond the imagi-
.-117"1 natiOnrback in 1950. Chinese engineers tend to go into field'swhere the technology is changing rapidly, such as electronics,aeronautics, petroleum, and chemistry. These fields are challengingand demanding. Not too many Chinese engineers are in highway _
construction or the building of schools or public housing, andProfessbr Wei gave a very plausible reason for their absence."You need political connections for these projects," he explained.
"If I were to grade the accomplishments of Chinese engineersas a group over. these past twenty-five years," Professor Wei con-tinued, "I think I would give then a B in terms of prestige, interms of numbers in the'field, and in terms of income. But inpositions of,responsibility, they are conspiciously absent. Atthe management level, you are no longer dealing with concepts'orthings,'you are dealing with people, and upward mobility is deter-mined by socializing and social amenities."
) This is precisely the area to which the Chinese must,payattention. They are going to have to attack the bulwarks ofprivate clubs and elitist organizations, and they are going toencounter resistance. As the Chinese reach"beyond the middlelevel, the ascent becomes steeper, the competition keener, andthe going rougher. All things being equal, racism may -rear itsugly head and xednject itself at the higher levels just as it isbeing reduced at the lower ones.
Will efforts toward meeting the standards set by the dominantgroups eliminate the boundaries between the races? A brilliantcolleague of mine advances the theory that cleavages between theraces can never be bridged. Once a group in the lower stratumattains the culture, the speech, the values, and the way of lifeof the upper stratum, the standards will be changed or revisedand other, impediments put in their path so that the lower stratumwilt never come up to the expectations of the upper. Hence.onegroup will always feel superior to the other by some imposed cri-teria.
7
3112-334- ,

There is some validity,to this line of reasoning, but it istoo defeatist and pessimistic an attitude. Without hope, thereis no incentive and no reason to go on.' 1 believe that there areremedies or, at least, improvements to problems. 1 believe thatknowledge and understanding of the differences between peoples andthe underlying causes of their friction can pave the way towardsolutions.
This research and report on the occupational status and economiccharacteristics of the Chinese in the United States is a means tothat end. By looking at their special circumstances and conditions,by finding out where they are, at, by assessing the impact of theirhistory in this country, by pointing out the divergence of their .
culture from American expectations, and by bringing out the inequitiesand disadvantages shouldered by the Chinese, we obtain the facts withwhich to come to workable solutions.
-335-
I
V.

SUMMARY OF FINDINGSA
1. The Chinese are hindered, by stereotypes applieo th'egroup.
A
.NO,matteChowAar back the:roots of ,a Chinese-Amettcango in this country, he is always looked upon' as a4fOreigper, analien, and,a usurper of'what rightfully belongs-6 "Americans."
3. Attitudes toward Chinese-Americans ride upend down from-goodwill to hostility, depending upon the foreign relations ofthe United. ;Spates and China.
4. It is hardto rid employers of the notion that.all Chinesewill work harder for less;
5. It is also difficult to shed the laundryman, 'restaurantworker image.
.
6., Lair self--esteem can work to the psychologiCal detrimentof the Chinese.
7. Soie stereotypes of the Chinese are laudatory an(someare contradictory, which'goes to show hoW illogical they can be.
8. Discrimination is no Conger blatant. Some Of it is re-routed. Some is masked, and some is hung on institutionalooks.One must look more carefully tonnmask the disguises.
9. Substantial progress has been effected in economic oppor-tunities for the Chinese. %Upward, mobility is not generally exper-ienced by the first generation. It is the second generation that
.reaps the harvek of the hardshipstand toil of tbelirst.
10.. With the country facing sconadic adversity, the gains ofthe minorities- over the past ,two decades may be eroded and Set back.
11. Questions of seniority and quotas Versus affirmativeaction plans and charges of reverse diseriminition are being testedin the courts. In the first round, minorities seemed to havheld,onto some of their gains, but the final round may tell a different__story. In sum, the- economic-healt of-the nation determine-e-ta alarge extent the race relations.
12. Lack of social contacts is one of the main roadblocks toupwardciobility for the Chinese.
. ,1
13. Research and reports like this one provide the backgroundand the facts for workable solutions to the problems of the Chinese-Aiericans.
, . 34'ii, -3347.

:
RECOMMENDATIONS
The language" of today's stereotypes is far more positivethanthe one applied to the Chinese in the early days of the West, butstereotypes are not constant. They change with the economic weather,and they improve or deteriorate according to-the relations of theUnited States with the, ancestral land.
Can race relations be improved through education or contactor inforiation? To a limited degree, yes, under the right'conditions.Education and information by themselves do not change attitude's.Science has proved there is no innate difference between the racesbut that does not lessen conviction that some races are inferior toothers.
The saying that "No man is a herlb to his valet" asserts that
close contact does not .netessarily reduce prejudice: Eminent
'psychologists have already established this fact. Southerners
were no less prejudiced toward their black mammies, although therelationship magi have been one as close as mother 'and child.
1
Stereotypes-and prejudices are shaped primarily by three
' dominant influences in a personis%lifi--the family, the school,.andthe media. Family influence is the'strongest and the mostlasting, but so far as the government is concerned, the familycannot'be,the starting point in any attempt to dispel stereotypesand reduce prejudice because it is difficult to reach into individualhomea.Mevar,iables,aretoo.great--Andthetargettoonispersed.
, That leaves the school and the media, both of which are highlyconcentrated and centrally controlled. Ch ice of school curriculum,
textbooks, and educational materials are ttera of,,board policies
or decisions made by a few school administrators. Over twa-thirdsof the American mpulationlives in metropolitan areas where, a fewschool boards wield tremendous influence over.the educational,..,content of'our public schools: these people have the power toinfluence, for better or worse, the attitudesi.the thinking; andeven the'actionstf our .future citizens. With compulsory educatiOn,
.4-Aii-our children are,processed, for six hours a day, for ten to_1_41welve_years_of their formative years,'through the schools. This
is'the vital area Edliay-iittedrit to ameliorate the pervasive racism
that'afflicts our nation..
gurprisidglyz few textbooks:."Fontain any reference whatsoevertothe'role of.the Chinese in the early development of the Americazki.West and their ignominous treatment and exclusion frail this coil
, I have examined high school history tezto,860-pages thick in whichonly one sentencementioned thd Chinae in the United States in
3;4'6 41
-337-

4-
s..
passing; Most texts I exami46d,had no referiiite at all.A'
'
Art appreciation courses ignore completely the entire spectrum --'_.of artistioaChievement in the:East.- The omission tends 'to suggest'that Eastern civilization had,little.are Wortby.,,of appreciation..High school students have at least heard-of Shakespeare, Goethe, .- .
Hugo, Dostoevski,,but have they ever bad a chance. to see thee:names. , .
.,
Li Po, Tu Fu, or Ssu Mn Chien in print? . ,
. .
I.-,
In New York City, only one .public school out of. 800 offered:'Chinese l4nguage As a course of study IllriOr to the implementation ..,
, of'bilingual education. I.doubt if any.other city outside-0V.California offers the Chinese language in itfpUblio-schools at
. .,all., . -
My recommendation is that a specl.al:tadnission'beapfOintedon the national leiel to review the bureiculuiand the content ofour educational matter for intentional ethnicslu;s and stereotyping,not just for Chinese-Americans; but for all ethnic groups. Thecommissionivould make redoMmehdatioia,to the-Secretary Zif Health,Education, and Welfare'for,the introduction of a more balanced --Curriculum and for a more diverse study of, the peoples and areas '-of the world., Currently, the 'course of study schoolsispredominantly European cehtered, but'our dealings,with the:worldare not. Today's newpaper headlines are focused mote on.Asin;hAfrica, the Middle Easb,'and'Latin American than.on Europe. The 'UnitedStatei finds itself tremendously'handicapPed when it-knowsso little about these yast continents and their peoples. -.For theirmit saki and fpr the sake of the future course .of American. history,
. American children must be exposed to and led to'appreciate thetifferehces in the varied races, cultures, and languages. If theirentire education is lacking in any exPosure.to these plaees, people,
3and things,liater contact will'only renter theususpicious andsuperciliouetoward these strangers. The,schooli', therefore, arethe appropriate place and the most powerful force. toward effecting
;any modification of stereotypes and prejudice.
The Media
At prime time on any. given dilN, 50 million People may be:sittingin front ofthgir televisink sets. In' 1969, 95 petceat of thehouseholds repoited that they -had a television setAnda third ofthese reported that they had two sets or'more. Radios are e'v'en ,
more commonplace, being,found not or0.3,:in-the *ire, but in almostevery automobile on the street. Only theee television networksand seven radio networks control the airwaves. Witfi'isuch awesome
power concentrated in a few hands, television and radio can pretty
346'
-338-
4

.
.
4
-much determine the minds of the -American people._ The medium ofprint 'is no less influential ,in Whatever form: 'bookeperiodicals,%newipapera,*vertisedents; and-the comics. Nor can we omit themaies and records. The mmdia:already stands indicted for a hostof past 'sins. The stamp of Fu Manchu, the Dragon Lady; Chop-,Chop,the pidgin-English-speaking dOmestic are still yrith,ns.
Can we expect some reform in' the fire? At he Civil RightsCommission Hearings in New York City on July 1974; representatiVes_from themedia,all admitted that their-consciousness was raisedby the testimony preaented,before the panel. Television and radiostations, advertisement agencies, and representatives from a number
-e.of the' major newspapers ,'iii New York testified that they had reviewboards to screen far offensive ethnic slurs or material of questionabletaste-. Yet, when confronted with examples of offensive characteri-zation or cominerciala, most, of the representatives confessed that.they had not thought of these commercials as such.
An example,given was a pesticide commercial. In the ad, wefirst see a swarm of menacing insects threatening our homes. Withone spray of the insecticide, all the pests meet their doom. Thead is effective in selling insecticides, but it also depicts theinsects with slanted eyes and Oriental features.
Another, ad sold men's shirts. The scene is one with a slinky,sexy, gorgeous "China doll" admiring'the tall, blonde Caucasian manwho towers above a group of short, dark Asian-men. "I see nothingoffensive in that ad," objected an advertising man. "The girl ispresented as a beautiful wdman,.beautifuliy attired. Any womanwould be proud to be her."
"Which goes to prove our point that non-Asians are not tuned -
in, to Asian sensitivity," was the reply. "Why is it that Asian`waien are always in the role of looking-up to white men? Wouldyou have reversed the scene by showing a beautiful white woman'admiring a Chinese man with envious Caucasians looking on?"
'A recommendation to the media, therefoxep_ii-o open theirranks to Asian writers, reporters; editors, producers, 'Cameramen,Performers, and actors. According tO,Alvin Ing, president of theOriental Actors Association, the number of.Asians employed.by themdia is Very grim. There is not one Asian actor on Broadwaytoday. About five years ago, the figures showed only one Asian-American actor on,Broadway in three years. -
i.
'It' 1974, a landmark decision was handed down* against the Lincoln .
Rinertory Theatre of,Lca inn Center New York, finding it guilty of
scrimi failednation because "it systematically fail or refused to give
...
. ,
-339-......
'
(:r
*
4
Io
equal opportunity to Asian Americanattors, particularly as evidencedby the regularirgarding of Oriental parts to non-Oriental actors. ",.
Black-face9:fs no longer practiced on the'stagefor in televtsiOn,
but yellow -face is. till quite prevalent. The star of Kung Fu, a
popular T.V. show, is a case in pOint:
Those Chinese - Americans who have entered the media have &Tiegreat credit to,theMselves: Connie Chung; who-has international.exposure on*WCBS-TV, ,is a prime example. In 1971, she was named
Outstanding Young Woman-of America, and the iMerican Associationof University Women warded her the Metro Area. Mass Media citationfor outstanding excellence in the fie/4 of news reporting. However,
the Connie Chungs are.rare. At the 11211 York Civil Rights Hearings,
the media said itwould welcome more'applications from Asians.Admittedly, the Asians are apprehensive about their chances. It
would facilitate matters if the industry could set up an apprentice-ship program for minorities, and pursue a vigorous AffirmativeAction plan to tap the'lidden reservoir of latent Asian talent.
My last recommendation would be to the Chinese themselves.They have the privilege; the duty, and the obligation to prdtecttheir interests and their image from false or offensive represen-tation. That is why organizations such as the Chinese for Affirm-.ative Action in San Francisco-ireto be commended for their efforts.This organization works actively. for the eradication of stereotypesand the expansion of employment opportunities for'Asians. Join
such organizations, or lend them your support. If you cannot beiivolved directly, contribute to their operating expenses. Inform
yourselves of thele'vers of control in the American system. For
example, every three years the radio and televisiOn stations comeup,for review of station performance in the renewal of their licenses.'Leverage Cati be exerted at this time, if not sooner, for some
accountability by the, stations. "Eternal vigilance is the price
of liberty," is a statekent'attrihuted to Thames Jefferson; If
the white forefathers hadto pay the price then in the founding
of'this nation, t is no less true now in the preservation of the
nation.
4
9. Blacking a white man's face to enable him to play the role of
a black.
348-340-
;1

4.1
.
f
/-
CONCLUSION
-The.purpose of this _study and research. was fourfo :
'1. .To .generate a basic statiifical boa of data from' reliable
Sources about the.Chinedaiin the United Stat s.-
/2." To .zeto in on Chinese - American manpo er and emplOyment
characteristics:,
3. To point out arms of cultural diff- enoe'S and divergence
which affect the attituae, behavior, and perfo .:ce of the Chinese,
in this country in their quest for a meaningful livelihood.
4. ,3o make concrete suggestions for exp aing, both vertically
and horizontally; the occupational horizon of he Chinese- Americans.
The task that I mapped out for.myself_mas a large one. If it
was too ambitiods,.at least it was a beginning,. Now that I am about-,
to put the final period to this report, I.ferv.tly hope that this
study is: but the first of many to come. ,So nuc needs tb be known
about the entire area of social and economic,cir umstances of aneven lesser known ethnic group that is undargoin treiendous upheaval.
That is whythe purpose listed first above took p iority above all
the others. From-the data developed, I hope oth- researchers will
take up where I left off.it
Basic Statistical Body of Data
As was mentioned in the Foreword and as is qdite obvious,throughout the report; my data came primarily from th 1970 census.
Its limitations already have been stated, but the data did reflect
a wide sample at a certain time. Since there is no oth r. comparable
data bank ad comprehensive asithe 1970 'census, it wasus primarily
as a jumping -off place. At leadt it provided some facts here none
existed before. And in years to come the data be pat of the'
history of. the Chinese in the United States.
In my desire to take every adVantage of the special oppo tunity
afforded me under the Manpower Administration grant to underta e a'
speci4tabulation, I tried to extract as mach information as could
,349 .
-341-
\
,
L.

\4.S
reasonably handle without going too far astray from the main topicof occupation and,etployment. Although some of the data may not havebeen used for this report, the statistics were tabulated.nevertheless.
Examples of what I am- alluding to are three separate monographsput ou under the imprimatur of the Asian Studies Department at CityColl York on ethnic population by census tracts for eleven.majo As. These tables provide a detailed breakdown of minoritypo ations in the major Urban centers of the United States. Hopefully, -
demographers., social scientists, school boards, and government agencieswill find these tabulations useful for their particular' purposes.Copies were made available to the Manpower Administration,the CensusBureau, and research libraries.
The Census Bureau tabulated and pUblished some data on Chinese-Americans for only five states. I was ableto obtain comparable- .
data for the remaining forty-five,states. When the tabulations arepublished, Chidese in all fifty states may obtain figures pertainingto their own area.
Even in the tables used and reproduced in this report, '1 tried.
to be more inclusive and detailed rather than abbreviated or concise.This tends to make the tables a'little cumbersome-and difficult toread, but for the sake of those who need a detailed breakdown, theinformation will be available. It is possible to add up the partsto arrive at the whole, but the process is not reversible.
There are.rich diggings in the statistical information fromthe tables in this report for other researchers, students, academicians,social 'scientists, urban planners, community workers, and others. Myfindings and analyses only grazed the surface. Perhaps others willfind different interpretations from the same figures. Maybe thefigures will spark other ideas that can be pursued further :14
Quite obviously, the 4970 census was not the only statisticalsource' utilized. State and municipals government publications wereconsulted wherever and wheneVer possible, and these yielded unexpected,
-findings for our purposes. Once uncovered as sources of nformation,'they can be tapped again and again for future reference.
To relate governmeptal statistic's to what is actually happeningin the communities-takes a thorough familiarity with the Chinesecommunities and their leaders in a 'number gi cities spanning theAmerican continent. Through the' medium orthisreport, I have triedto express some of the thoughts, the anxieties, and-the suggestions,of many working in the field who are concerned and whd are ethnicallyconscious about their place in the larger American schime. thesefeelings were garnered throughinterviews, through correspondence,or expressed at conferences. I hope that l' have accurately conveyed,
3 5 .
3427
X
4

these thoughts.
One area that was not touched upon at all was housing. This
was covered by a separate census and bit removed from occupationand employment. Since time was limited, no attempt was made todeal withvphis subject, but it deserves priority attention.as anarea of major concern.
Summary of Findings
Occupation is livelihood which translates into income, food,and'survival. Since it is a basic determinant of our daily existence- -how we likre, cur social statta,,and how we spend the major portionof our waking hours--it is the most logical area with which to beginany study of the Chinese in the United States. The thrust of this
report ip aimed at the economic characteristics and occupationalstatus of the Chinese with a view toward finding out where and hawthey stand and to make suggestions for improvement where necessaryand feasible.
At the end of every chapter in this report, I listed the findingsthat had, a bearing on employment aspects of the Chinese. To recapitulate
briefly, I have set down the more significant factors below:
1. The history of the Cbinese inthe United States goes backfOr more than 100 years'but the Chinese have perpetually remainedan immigrant group due'to the past exclusionary policies of this
country.
2. Immigration has increase spectacularly since 1965, whenthe immigration laws were revised.
3. The new law favors the professional and skilled. Consequently,
there has been a shift in the type of Chinese immigrants coming in
4. The newiAmmigrants are heading eastward--especially to
/Ow York City.'
5. The 1970 census data do not reflect from one -fifth toone-fourth of the Chinese who have. entered the country since 'that
time.
6. This vast increase in immigrants has once again tilted theChinesg population in this country toward a foreign-born one.
7. The foreign-born are handicapped by the tremendous adjustmentthey have to make,(by the language barrier, and by their lack of
citizenship.
351
*a.
t

-161.7" 01-4 0I
8. The Chinese population is concentrated,along three verticalstrips in the United States: the East and West Coasts ana- theHawaiian
9. Ninety-seven percent of the Chinese are-found in largeurban cities, priwTray7New-York, San Francisco, Honolulu,Aand
-,los Angeles.
10. The new immigrants need the security of Chinatowns to helpthem in their transition. In those cities with large immigrantpopulations, the Chinatowns are expanding and the problems arejooreacute. These are the areas of greatest need.
11. As presently constituted, the-Chinese population is oneofextremes with concentrations-at opposite'ends of the pole,education-wise and occupation-wise. They tend to be either collegegraduates or illiterates, and they are in the professions or servicework.
12. The Chinese labor force in 1970 was but 190,000.
13. A very narrow range of jobs, such as restaurant work,engineering, and college teaching, are the most prevalent occupationsfor Chinese males.
14. A phenomenal increase toward the professions is especiallyevident among the younger generation Chinese-Americans.
15. One-third of the Chinese.females have sometcollege education,but they are concentrated in two areas of employmentgarment workand clerical work.
. 16. The proportion of Chinese females in the labor force isgreater than that for black or white females.
17. The Chinese' female is pitifully, ,underemPloyed and underpaid
compared to either her white or black sisters.
18. The effect of-employment on the Chinese-American femaleshas been postponement of marriage and postponement of children,resulting in a birthrate below replacement level.
19. Close to one out of five Chinese in the labor force isin goverment service.
20. In government, the Chinese are primarily professionalsor technicians, and they have attained the middle ranks.
21. In state and local government, they are/almost totally
3 5 2-344-

o
absent from such agencies as the sanitation; fire, or policedepartments.
22. In the construction industry, where the unions controlthe hiring and firing,' the Chinese are-conspicuously absent. The
union stronghold has been assaulted but not'penetrated as yet.
23. The Chinese family median income is higher than the'national average, but the figures in themselves are deceptive.
24. The higher income may fie the result ok' more people 'in
the family working, having more than one job, working longer hoursor a longer work week. The Chinese put in long work hours, not somuch fromtchoice as from necessity.
25. The substantially lower personal income figures,reveal
a more accurate measure.
26. In Hawaii, where the Chinese have experienced less'discrimination, the median family income is close to-$6*000 higher
than that of the Chinese in New York. Substantial differences
like these reveal where the troubled areas are.
27. The Chinese concept of income differs from the American,so dollars and cents may not represent A true income picture.
28. The unemployment rate for the Chinese labor force iscomparatively low. One explanation may be that the Chinese workat jobs beneath their ability and qualifications rather than beunemployed. Hence, underemployment is fairly widespread.
29. A disquieting factor seems to be the erratic work year;the Chinese are not employed the year round.
30. Whereas the Chinese used to compensate for their disad-vant ged position in the labor market by hard work, there isdecided'Shift in this attitude among the younger generationsgrowing up in the United Statei.
31. Career motivations are based more upon opportunity fordecision-making, doing something worthwhile, and doing what you
enjoy doing rather than.od the tore conventional motives of duty,money, or status.
32. Self-employment or small business enterprises, once hepredominant mode of employment for thaChinese, has declined precipil-tiously. In 1970, the ratio of salaried and wage workers to theself-employed was 8:1.
3 5r3'-345-

,"
33:, The traditional.family=operated.enterprises,-such aslaundries, gift shops, grodery stores, and restaurants, are losingground,to occupatiqns in.tbe,proiessions and incorpOrated businesses.
14.''Tbe thinese,have the temperament and Makin:4nd forsuceseful entrepreneurship. -At the same-time, theyto-iiiited capitarthrOugh their habit of thrift and. their:coMmunitycredit 'f acilIties.
,Cultural Anchors and Differences
More than for most:bther ethni6 groupsin the United States,the'emplOyment pattern,of the Chinese is4a product of their culture.Their -cuisine created for them a field' of employment in restaurantsand food service that has lasted for more than a hundred years.Their esteem for the scholar and for,learning prodded them ontohigh educational attainment, even when, college degrees, brought fidprospect of occupational reOards. The status of being a governinentofficial was prestigious enough to lure one-fifth of the Chinese -American labor force into government. The bonds.of-the kinshipfamily'were so strong that it enabled, the Chinese to vurgivein,this country against eiceedingly difficult odds. Unemploymentnever want being cold `'and hungry and out on the streets as'lgngas the aoore of the family..assaciAtrisn headquarters were open.What they considered virtues..,suCh as humility and willingness toaccommodate, has worked against their interest in upward mobility.
The instances of culturally-based aspects of employment Paretoo numerous to repeat - -especially since they have been.recountddthroughout this report. Why has 'the culture maintained such a hold
the Chindse when other groups gave up the ways of the motherlandsoon after ;hey arrived in this country? The main reasons are:-
*-4
.
1. Am..idantimigration laws-compelled the Chinese tp remaina first -generation'ibmigrant people with no roots in the United.States. t
,Z.I*Relected,by the larger.society, the ChineseitUrned inward; "
and perpetuated theoir own ways.
3. 'The Chinese culture was strohg"enoughto:compete effectivelyagainst Americanization,.
-
4. The,,Chinese are physically distinct and easily identifiableas different frOM the majority white stock in the'United States.
<
Only within recent years have many of the discriminatory laws-against the Chinese been repealed hereby modifying some of the
35.4-346-
41,

4
&
,
effects-of die above factors. Fot the first time, we now have asubStatitial:natiVe-bdrn college-age group in the population. The
C'hine'sg:neig no longer' live in constant fear of the immigrant,inspectois. Ci7V-1.1 Rights legislation has pierced some of the barriers;exacted againSt minority gioups in the past. 'As evidenced by thestatietics in-this report based upon the 1970 census, the Chinesehate moved- forward dtamatically. As a result, the hold of Chlneseculture 4s:aiso.,loosenIng.
IrarChinese are now experiencing a two-way tug, commonly calledali(identity Crisis. Amp they Ameticans or ,are they'dhineseq Aret ,to'hey give up their Chinese ways and values completely if suchare incperatiVe in thetugged and competitive American society? Arethey to:discard their language and turn. their backs 6" the teachingsof their parents and ancestors? How can they reconcile the conflictwhen the values are diametrically opposite?
Even when they become totally American in speech, thought, and. 'action, what happens when they are still looked upon as foreign or
Alen because their physical features are different? What effectdo these new factors have on Chinese-AMericans in relation to their
' occupational choices and the. opportunities open to them?
What chances are there that the gains so recently won by theChinese will continue' on an upward course or be consolidated? There
is the ever-present possibility that under adverse economic conditionsthere may be a backslide and a reversion to racial.- intolerance andprejudice.
Summary of Recommendations
Today, we are accepting more and more the fact that the powerof govetnment can be exerted for desirable social change or for fheremediation of society's ills. If any doubt lingers that governmentpolicy can totally alter and shape fhe course of our lives, we haveonly to look back at how American immigration laws dominated, pervaded,and shaped the lives of the Chinese in the United States for nearly
a century. Government decreed the make-up of the immigrants whetherthey were to be male or female, young or old; rich or poor, skilled,or otherwise, educated or illiterate, cultured or uncouth. Indirectly,
it shaped the family structure andthe personalities of the Chinese,and the heavy hand of the laws 'could be felt in every sphere ofactivity undertaken.
At the outset of this study, I mentioned that the 1970s will bethe decade of redress following a decade of protest. I earnestly:
hope that the findings from this study can be used as gUidepostdto show the way toward the prospect of better hopes and a better
35-347-
rA
0
life for a long-suffering people.'p
If the record of the Chinese in-the United States appears brightand sanguine from this report, then it,is all to their credit thatthey were able to surmount insuperable barriers and handicaps, notMerely to survive, but to try to forge ahead. If they-have accomplished,let it be prooWhat they constitute a valuable human resource thatwill add to, not detract from, the national store. But those encounteringdifficulty in making the transition as a result of their uprootingdeserve assntance to help them in their resettlement;, for the morerapid their adjudiMent, the more quickly they will become usefulmembers Of society.
Let me, therefore, sum up briefly my main recommendations, notonly to the government, but also to all Americans and to the Chinese-
,.Americans themselves.
1. Keep in mind that the people whose needs are greatest werenot counted in the 1970 census. Additional and on-going studiesneed to be undertaken to bring the findings up to date.
2. Provide the Chinese with the maximum opportunity to learnthe EnglishIlanguage.
3. hive the Chinese the same considerations 'accorded otherminoritiesi_underthe,special provisions of the Civil Rights Acts,the Equal Employment Opportunity Act, Affirmative Action Plans,Contract Compliance, etc. All too often the Chinese are not consideredminorities and are excluded from the provisions and benefits' ofminority programs.
4. Passthe "Gateway Bill" sponsored by Congresswoman Patsy Mink.
5. Reconsider all laws which purposely or inadvertently shutout large segments of the Chinese work force, either citizenshiprequirements or licensing stipulations that have no bearing on theability to perform,the job.
6. Encourage dispersion of the Chinese away from the ghettosand large'urban centers like New York and San Francisco. Employersin other areas may well consider the desirability and.feasibilityof hiring Chinese personnel.
7.- Give special consideration to the highly disadvantagedposition of the Chinese female, who is either highly educated orilliterate but poorly paid, and who is in special need of facilities;such as day-care centers, and special consideration, such as part-time
*Irk:
-348-

.
J
4 -
)3. Provide opportunities for Chinese females to break out of
the molds'of garment worker and Clerical worker.
9. Expand the occupational horizon of Chinese professionals,'
who are too highly concentrated in the fields of teaching and engineering.
10. Review obstacles, such 'as subjective oral examinations orpersonality teststhat effectively bar the Chinese from upwardmobility into the executive ranksor managerial positions.
11. Increase government andprivate commitment to more manpowerretraining and job referral service to the Chinese. Currently,
government - funded. programs at any level: and in any area for the Chinese
have been minimal and token, at best. ti
12. Develop alternatives to'hiring and firing in,the construction
industry if the unions persist in discriminating against minorities.
13. Make more effective use of the Federal Office of MinorityEnterprise to encourage a backward look at the advantages of self-
. employment that has stood the Chinese in good stead over the years.
14. Draw upon the reservoir of Chinese - Americans who are familiar
With both China and the United States to bridge the chasm that hasSeparated the nations for'a quarter ofa century.,
15. Use their talents also as middlemen to expand-commerce and
trade.
16. Restore the 'facts of the true role and-the contributions ofthe early Chinese to the history and development of this country. It
'is the task of educators in ethnic studies courses, of publishers ofhistory books, and of the -media to correct the mistaken and stereotypedimages generally .held about the Chinese.
17. Learn to accept the Chinese-American and other nationalgroups with identifiable'physical differences as people who have:legitimate rights in this country to earn a livelihood and to enjoyequal privileges and protection under the law.
18. Seek to i dentify and groom leaders or potential leaders. in
'the communities..
19.' Support further researction the Chinese, so the true facts
' will/le available to enable thesovernment and the leaders to make
rational and constructive, decisions.
20. Do riot dispara or put down thecUltural traits ordifferences of the Chinese. The American way'is not alWays the

best, and the Chinese way is not always to be discarded., This pointis-especially directed at those Chinese-Americans who ,go through aperiod of self- hatred .in their quest to belong and get ahead inAmerican society.. .
For the Chinese specifically:
21. The test employment insurance.for the Chinese is to createa work force or a bank of skills and talents 030-is not'eSsilyreplaceable. When accomplished individually, loVever, as the Chinesbhave been wont to do in the past, it can never be, an effectiVe andcollective force. A.
22: Organize and develop a national organizftion, comparableto the NAACP or Anti-Defamation League or Japanese-American Citizen'sLeague, that will work for the welfare of the Chinese, that willserve as a watchdog to guard their interests, and that will bringstrength and solidarity .to the group.
23. Join with other Asian groups that share similar experiencesand similar,problems and broaden this base with other minority groups
form a coalition for more effective leverage.
115.r
24. Become more politicized and tuned in to what is hiPpeningon the localand national scene. A democratic form of governmentdemands citizen involvement and participation. If involvement isnot part of the Chinese heritage) then special civics classes orliterature should be provided to help the Chinese bridge this culturalchasm.
. It is quite obvious that I have not confined my suggestions orrecommendations solely to what the government can do-to hel a minorityof minorities during this period of tremendous upheaval brought onby the upsurge in immigration and by a heightened ethnic consciousness.The government has the resources and mechanism by which it can facilitatean easier adjustment for the group. If it has extended such assistanceto other immigrant groups and minorities, then surely the Chinese areno less deserving. I hope that this study is but the first link infurther government attention'to Chinese-Americans.
To the Chinese people and communities, I hope that some of thesefindings will enable them to better understand themselves and to actupon any pertinent data from this research to expand their employmentopportunities.
And to all Americans, whether black, white, brown, red, or yellow,let u$ bemindful that we are a nation of immigrants. We'rose to ourpodition as leader of the world of nations through the invigorating
3 5 is'
-350-
00.
-

t
4
./ 6
mixtgre.of'diverse cultures and peoples. It is the constant infusionOf new,Illood that is tas.country's source, of greatness and wealth.
35j.
-351-
ri

"'40.
r-APPEND'IX
TABLE 86
CHINESHPOPDLATION IN THE U.S. BYDECADES, 1860-1970
Source:
Decade Numbers
1860 34,9331870 63,199-1480 105,4651890 107,4881900 89,863.1910 71,5311920 61,6391930 74,954
1940 77,5041950 117,6291§60 237,2921970 435,062
U.S. Census Bureau, Census of Population, 1860-1970'
O
S
3
-3527

..,
CHINESE.
Years.
.,
IMMIGRANT
Male
ALIENS
TABLE 87
ADMITTED TO THE U.S.,
% Femtile
BY SEX, 1944-1973
%
'Annual,
Tgtal. ___..,_.
1944 10 29 -. 24 71 # 34
1945. 20 41.
64.
59- :109
1945 71 31 . 162 69 233
1941 142 13 986 87 .s.". ,.1,128
1948 257 8 3,3.17 1 92 . 3,574
1949 242 10 2,248 . 907 .2,490
,--
1950 110 8 1,179 92 1,269
1951 126 11 957 89 1,083
1952 116 10 1,034 90 1,152
1953 203 19 89Q 81 1,093
1954 1,511 55 1,236 -45- 2,747
1955 1,261 48 1,367 52 2,628
1.956 2,007 45 - 2,443 55 4,450
195.7 2,487 49 - 2,636 -' S1' 5,123'
1958 1,396 44;. 1,799 56 3,195
1959 2,846 '47 3,185. 53 6,031
.1960 1,873 51 1,.739 49 3,672
1961 1,565 41 2,273 59 3,838
1962 1,916 42. ..
2,753 5$ 4,669,
1963 2,297 43 3,073 57 5,370
41964 2,597 46 3,051 54 ,648
1965 2,242 47 2,527 53 4,769
1966 8,613 49 8,995 51 17,608
1967 , `12,811 51 12,2$5 49 25,096
19,68 7,862 48 8,572 52 . 16,434
1969 10,001 48 10,892 52 20,893
1970 8,586 48 9,370 52 17,956
1971 8,287 47 9,335 53 , 17,622
1972 10,437 48 11,293 52 21,7.30
'1973 9,937 46- '11,719 54 '21,656
Source: Immigration. and Naturalization Service, Annual Reports,
(Washington, D.C.: 1944-1973).
36r.-353-
7
6,
,

'TABLE 88
AGE DISTRIBUTION OF THE CHINESE IN THE U.S. FOR SELEOTED SMSAS, B'
sgx ANY PERCENT, 1970
Age Group
Boston'
Chicago
Honolulu
L.A.
'L. Beach
New
'
York
Bacra-
mento
Male Total.
6,585
8.1%.
17.5
-
10.6
11.6
8.6'
20.0
174,
6.6
'
.
6,449
9.4%
16.3'
9.4
9.2
,8.4
2411
16.9
6.2
'
24,533
.7.8%
20.9
10.i
7.7
5.8
18.0
21.8
.7.9
'
:
21,840
9,2%
18.6
9.3
10;0
7.5
4.5
16.4
.4.5
'
41,486
7 :5%
17.3
'9.9
8.2
'5.2
23.4
21.9
8.6
-5 307.
6 :.5%
:.
211.5
14.0
9.4
''4.0
19.8
.-
17.9
,6.8
'
Under 5.
5-14
15-19
20-24
.25=29
3044
45-44
.
65 and Oyer
4W
-
Female, Total,
5,572'
5,546
.
24,. 364'
t19 660
,___
5,611
5,150
.
Under 5
.#9.1%
..
9.3%
%7.1%
JB.2%
"8.4%
8.3%
5-14
-'
19.8
18.9
20.7
1'19.1
18:6
20,2
15-19,0
11.4
10.8
'
9.6'
9.6
9.8
13.8
20,24.*
f11.7
11.1
',8.$
.12.0'
10.,7
11.0
25 -29
8.8.
9.5
.%5,4
' 1.0:
7.5
5.7
36-4,4
19.2
22.8-
18:7
23.7
22.3
:20.8
45-64
15.1
12.8
,'
..21.7
...13.7
17.4
-
14.5
and Over
4,9
'
4.a
7.9
4.7
5.3.
'5.6
'65
',
t
.
-
Source:
UaS.'CensusBureau, Subiect-ROprt, PC(2)1G (1940),-Tiible
-4.
S.F.
San
Seattle
D.C. -
Oakland
:Jost
Everett
Md.-Va.
'
45,393
4,182
.4,030
3,910
'
7.1%
8.8%
7.0%
8.1%
la.5
19.7
19.8.
17.1
110.9
8.2
10.5
8.7
9.6.
15.1
9.7
6.1
5.2
,7..6
6.7
7.1
19.9
26.3.
21.3.
.23.1
20.8
12-6
1718
22.3
8.1
'
1.7
7.2
..
7.2
-4,
,,3
43,d09.
3,837
'
.3;671
.3,948
...
...
.
'
4.9%
'
10.8%''
9.3%
9.3%
.
8.2-
20.1
,22.1
20.4
4
11.0
8.6*
.-10.4.
7.2
.11.1
14.1
%10.0
9.5
5.6
11.7
.
8%7
10.4
22.0.
20.3
.19.8
,23.5
18.1
:11.5
.14.4
.14.6
70
2.9
5.3
'
5.2
C
-354-
I
I

TB LE 89, 4. .
SELECTED INDUSTRY OF THE CHINESE IN THE .1,.St,.BY SFX,AND FER,O4NT OF Tina. 1970
_
Selected Industry
Total 16. Years and Over
Agriculture, forestriesheriesMining;
donstrudtionManufacturing -
Durable GoodsMetal industries,Machinery, -excl. electricalElectrical mach., equip. & supplies'Transportation equipment
Nondurable Goods._Food axed kindred products
Canning& preserv. fruit,fyeg. & seafoodTextile mill productsYarn, thread& fabric mill&
Apparel & other fab. text-pmd.-Printing, publish. & allied indust.Chemical & allied,products
Trankportation, Commun. & otherpub.y.til."Transportation'Water transportation
7 Aix' transportationCommunibaCions
Telephones (wire & radio)Utilities & sanitary services
Wholesale & retail. trade
Wholesale tetacle
Food & relatedproductsRetail trade
General merchandise storesFood stores .
_-Grocery storesGasoline service-RationApparel I access. stores, exc.'shoe storeEating.&.drinking places,Drug stores
FinanCe, insurance'& real estateBankingSeCurity, commod. brokerage & invest. iv-
. Insurance -
Real estate incl. real est..insu2%,law off.Businet's & repair services :
BuSineSs services'
Male
*113,929
1,069
*277
_3,753_16,038
9,907'-6631,5262;2592,9446,075.1;039
246170101
951,370 s.
1,2755,3672,889
693804
852643713
r.
-3,451T48
38,9731,14211668"-6,581
. 961343
24,4E6655.. -
4,1851,266
842
934765
3,2604 .1,829
Commercial research, devel. & test. lab. r 507
2729.76
"1,550366-
1 ;667
4,582: 0- 27
Computer programing services,-. ,:uRepair -Services.,
--Personal services
Pri-Oate-thovseholds
Hotels tc motels'
lia4Icitring,, 'cleaning
Beauty shops
/''
& other garment seriCe5,,t
3p5-
3 6;3, .1
Female:- Tata'
!'67,261.
-. 30365
388'
35,731- 1,989
166. 236
369227
13,519878564
377276
10,176594..
427
2,155
79611581
-5o2182
1,648422
14,8482,46o ___
2,728
2,350"21
. 5466,356
3344:6852,137
340
1.,5564"-
2261,177
924. 0.
141140
41596.
714
732;1,817.
, 397
181,190 100:0%
0.8%0.1%2.2%
1/.5%6.3%0.4%0.9%2.4%1.7%
10.8%1.0%0.4%0.3%0.2%6.1%1.0%0.9%
-4.1%.2.2%0.4%0.7%0.7%-0.6%0.4%
342
4,141.
31,76011,896
__- 829
1,7622,628
, 3,17119,5941,917810547
37711,1281,9641,7027,5224,084772
1,4151,4331,1115
895
i1. 79
2.8%
0 0:6%53,821 29.7%,3;602 1.9%10,396 , 5.7%8,940 4,9%982 .0.5%
889 -0.4%,
30,792 16.9%989 0.5%
8,870 -4.8%3,40E 1.8%
, '0.6%
211:/4493;
1.3%991
.
2.4%2;753
' 507413
.
1,116,. 4,946
1,0802,390 :
_6;399;,424
(CO43,nued)
1.5%0.2%
0:2%..0.6%.!.1..
6..5%,
.0.5%1.3%3.5%,0.2%

TAUB 89-- continued -4
Selected Industry Male Female Total
Entertainment & recreation services '765 489. .1,254 0.6%Profe;sional & related' services . 21,449 17,482 38,931 21.4%Health services , ,.4,624 .4,608
..Offices of physicians
9,232 5.0%804 4lat 0.6%
Hospitals0.3%
ospitals , 2,791Offices of dentists . 381 245
3,222 6,013 3.3%.,.. Legal services -258 359 '617 0.3%
Educational services- 10,811 9,083Elementary secondary schoolsColleges & iversities
/1,629 #3,5778,871 4,746
.
2.8%&
10.9%
7.5%Liliraries 183 433 616 9.3%
Welfare services _-
290 417 _. 707 0.3%Non-profit membership organizations 341 415 756 0.4%Engineering &.architebtural services 2,565 310 2,875 1.5%Accounting, auditing & bookkeeping services 485 386 871 0.4%
Public administration 7,992 3,601 11,593 6.3%Postal services 1,607 355 '1,962 1.0%Federal public administration 3,760 2,034' 5,814 3.2%
State public administration 919 729 1,648 0.9%
Local public administration - 1,171 373 1,544 0.8%
Source: U.S. Census Bureau, Subject Report, PC(2)7C (1970)_._
.
(V .
36,i-356-
0
ARTICLES
BIBLIOGRAPHY
\..../
, . .- Bender, Marilyn, "Job Discrimination 10 Years after the Ban,"
New York Times, 10 November 1974. .
Benzin, Peter, "Who Gets Laid off First?: Seniority vs. Minorities,"Long Island Press, 24- November 1974.
Berger, Peter L., "A Lot of Beautiful People. No One Left to Dothe Chores," U.S. News & World Report, 4 December 1972, p..564..
Chang, Shu Yuan, "China or,Taiwan: The Political Crisis of theChineie intellectual," Amarasia Journal_vol4-2-(Fall-1973)-----
pp-4.7,81.- -----;
"From China with Skill," Commerce Today, 1 April 1974.
,Ginzberi, Eli, "Is Hard Work Going Out of Style?" U.S. News & WorldReport vol. 71, 23 August 1971:
Hsu, Francis'L.R., "Rugged Individualism Reconsidered," ColoradoQuarterly, vol. IX no. 2 (Autumn 1960).
Oh, Tai R., 4kew,Estimate of the Student78rain Drain from Asia,"International Migration Review, 1761V7 (1972), pp. 449-56.
"Orientala Find Hies is Down Sharply in U.S..," New York Times,'13 December 1970.
"Protestant Ethic Chinese Style," Nation no. 213, 2 August 1971,pp. 67-8.
Rustini Bayard, "Affirmative Action in an Economy of Scarcity,"N.Y. Teacher, 3 November 1974.
Shabecoff, Philip, "HEW Study Finds Job Discontent Is Hurting Nation,"' New YOrk'Times, 22 December 197t,,.
36"i-357-
.11

4
Skinner, Elliott P., "Theoretical Perspectives on the Stranger,"Paper presented at Columbia University, Cultural PluralismSeminar, 1974.
Smothers, Ronald, "Polarizatioi Over Hiring Minorities in BuildingTrade," New York Times, 17 March 1975.
Sneeling, Robert 0., "Are There. Jobs Enough for All of Usk"U.S. News & World Report, 30 October 1972.
Steim, Michael, "Jog Decline Threatens City's Economy," New:YorkTimes, 21 July 1974.
Yuan, D.Y., "Chinatown and Beyond:: The Chinese Population inMetropolitan New York," Phylon, vol. 27 no. 4, pp. 321-32.
BOOKS
Allport, Gordon, W., The Nature7of Prejudice (Reading,'Mass.:Addison-Wesley, 1954).
AlterMad,--Hyman, Counting People: The Census in History(New York: Harcourt & Brace, 1969).
b.
Bogue, Donald J., Principles of Demography (New York: John Wiley,1968).
Chinn, Thomas, ed., A History of the Chinese in California: ASyllabus (San Francisco: Chinese Historical Society of America,1969).
Daniel, Roger,and Harry Kitano, American Racism: Exploration ofthe Nature of Prejudice (Englewood Cliffs: Prentice-Hall,
/ 1970).
4Ehrlich, Howard J., The Social Psychology of Prejudice (New York:
John Wiley, 1973).
Ford, Thomas R. and Gordon F. DeJong, ed., Social Demography(Englewood Cliffs: Prentice-Hall, 1970).
Ginzberg, Eli, Middle Class Negro in the White Man's World(New York: Columbia University Press, 1967).
Goodwin, Leonard, Do the Poor Want to Work? (Washington, D.C.:Brookings Institution, 1972).
36G-358-

Hansen, Gladys C., The Chinese in-California: A Brief BibliographicHistory (Portland, Ore.: Richard Abel, -1970).
Hiestand, Dale, Discrimination in Employment (Ann Arbor, Mich.:The Institute of Labor and Industrial Relations, U. of Michigan,Wayne State University, and National Manpower Policy Task Force,
1970).
Ho, Ping Ti, "Social Mobility in China Since the 14th,CeAtury," inTraditional China (Englewood Cliffs: Prentice-Hall, 1970).
Hsu, Francis'L.K., Americans and Chinese--Two Ways of Life (New York:Henry Schuman, 1953). "; .
The Challenge of the American Dream: The Chinese in America
(Belmont, Ca,: Wadsworth, 1971).
Jones, Edward H., Blacks.in Business,(Neary: Grosset and Dunlap,1971). , , :5
J.P1.,
..
Light, Ivan H., Ethnic Enterprise in America (Los Angeles and Berkeley:University of California Press, 1972).
Lin, Yutang, Chinatown Family (New York: John Day, 1948).
Lind, Andrew, Hawaii's People (Honolulu: University Press of Hawaii,1955).
Loewen, .awes W., The Mississippi Chinese: Between Black and White(Cambridge, Mass.: Harvard University Press, 1971).
Lowenstein, Edith, The Alien and the Immigration Law (New York:Common Council for American Unity, 1957).
Mears, Eliot G., Resident Orientals on the American Pacific Coast(Chicago: University of Chicago Press, 1928).
Miller, Stuart Creighton, The Unwelcome Immigrant: The American
Image of the Chinese; 1785-1882 (Los Angeles and Berkeley:University of California Press, 1969).
Nee, Victor and Brett de Bary Nee, Longtime Californ': A Documentary
Study of an American Chinatown (New York: Random House, 1972).
Norgren, Paul H. and Samuel E. Hill, Toward Fair Employment (New York:Columbia University Press, 1964).
36-7-359-
1

A
Northrup, Berbert and Richard L. Rowan, et al., Negro Employment inBasic Industry: A Study of Racial Employment Policies .in SixIndustries (Philadelphia: Industrial Research Unit, WhartonSchool of Finance and tommerce,University of PenngylvaniaPress, 1970).
Peterson,,William., Population, 2nd ed. (New York: MaCMillan Co.,
1969).
Puryear, Alvin and Charles A: West,_Black Enterprise, Inc.: CaseStudies of 'a New Experiment in Black Business Development'(New York: Anchor Press/Doubleday, 1973).
Reich, Charles A., The Greening of America Oew York: Random House,
1971).
Saxton, Alexander, The Indispensable Enemy: Labor and the Anti-Chinese Movement in California (Los Angeles and Berkeley:University of California Press, 1971).
Smuts, Robert, Women and Work in America.(New-York: Schocken Books,1971).
SQvern, Michael, Legal Restraints: on Racial Discridination inEmployment (New York: Twentieth Century Fund, 1966).
Spengler, Joseph J. and es Dudley, Demographic Analysis: Selected .
Readings (Glencoe,QtisIll.: Free Press, 1956).
Spero, Sterling D. and Abram L. Harris, The Black Worker: The Negro,
and the Labor Movement (Port Washington, N.Y.: Kennikat Press, ,
1966, reissue); originally published by Columbia UniversityPress, 1931.
Sung, Betty Lee, Mountain of Gold (New York:-MacMillan Co.', 1967;reissued as Story of the Chinese in America, New Yoik: Collier
Books, 1971).
Terkel, Studs, Working (New.York: Pantheon, 1974).
United States, Department of Health, Education and Welfare, PublicHealth Servite, Vital.Statistics of the United SUtes(Washington, D.C., 1946-69).
Viewpoints, Red and Yellow, Black and Brown (Minneavolis: WinstonPresd,,1972).
36,8-360-

Waley, Arthur, Three Ways of Thought in Ancient,China (Garden City,'N.Y.,: Doubleday, 1939).
.
Weiss, Melford S., Valley City: A Chinese Community in America(Cambridge, Mads.: Schenkman, 197.4).
Wolkinson, Blacks, Unions and the EEOC (Lexington, Mass.:D.C. Heath, 1973).
-11*r.
Wong, Jade Snow, Fifth Chinese Daughter, (New York:AiarVer Bros.,,1950).
Wu, Cheng-Tsu, ed., "Chink!" (New-York: World Publishing, ,1972).
Yankelovich, Daniel, The ChangingValueson Campus- (New York:Washington Square pess, 1972).
The New Morality: A Profile of American Youth in the
70s (New York: McGraw-Hill Co., 1974).
GOVERNMENT DOCUMENTS
United Nations, Department of Economic and Social Affairs, "Methodsof Analyzing. Census Data on Economic Activities of the .
Population," PopUlation Studies No. 43 (1968).
U.S. Department of Commerce, Bureau of the Census, "Japanese, Chinese
.and Filipinos in the United States,' Census of Population,PC(2)1G (1970).
, "Marital Status," Census of Population; PC(2)4C c1970).
, 'The Methods and Materials of Demography," vols. I and II
(1971).
, "Minority-Owned Businesses: 1969."
, "Negro Population," Census of Population, PC(2)1B (1970).
, "1970 Census Users' Guide," parts I and II (October 1970).
, "Public ilie94kples of Basic ReCords from the 1970 Census"
(April 1972).
, "Social and Economic Status of the Black Population inthe United States, 1971," Special 'Studies, P-23, no. 42.
.369.-361-

4
, "United States Census of Population, 1960: Non-whitei population by Race."
1
,U.S4 Office of Management and Budget,' ''Social Indicators" (1973).
U.S. Office of Minority Business Enterprise, "Business DevelopmentProgram" (1975).
, "Federal Programs Assisting Minority Enterprise" (1971).
, "Funded Organizations" (1973).
, "Minority Business Opportunity Committee Handbook" (1974)). .
, "Progress of, the Minority Business Enterpriie Program"(1973).
0
U.S. Department of Justice, Immigration and Naturalization Service,"Annual Reports" (1961-73).
U.S. Department of Health,' Education and Welfare, Higher EducationDivision Office for Civil Righti, "Availability Data, Minoritiesand Women' (June 1973). . .
, "A Study of Selected Socio-Economic Characteristics ofEthnic Minorities Based on the 1970 Census," v61. II:-Asian
'Ainericans, HBW no.,US 75121, Office of Special Concerns(Arlington, Va.: prepared by Urban Associates, July 1974).
U.S. Department of Labor, Bureau of Labor Statistics, "The Economicsof Worktng and Living in New York City," Report no. 29 (July 1972).
"New York City in Transition:, Population, Ribs, Pricesand Pay in a Decade of Change," Report no. 34 (July 1973),
, "Occupational Handbook" (1973).
"Social; Econbmic and Labor Force Characteristics ofResident§ in New Yoik,City's Low Income-Areas," Report no. 30(September.1972).
U.S. Manpower Administration,. "Breakthrough for Disadvantaged Youth"/' (1969).
,
, "Immigrants and the American Labor Market" Research-
Monogtapb no. 31 (1974).
,'"5ummary Manpower Indicators for San Francisco Basekon.the 1970 Census",(1972).
.41
- 37

0
re°
'U.S. Civil Rights Commission, "The Federal Civil Rights Enforcement
1.1
EffortA Reassesswe'(January 103).'.
, "Hearings and Testimony Presented before Commission in
New York City,MJ..
('July 12, 13, 1974).,
. ..- '..
* .
.S: Civil. Service Commission, "kinority'.GrOlp Employment, in the
Federal Government" (1969-72):
U.S. lqual Employment Opportunity Commission; "Affirmative Action,and Equal Employment: A Guidebook for Employers," vol. 2 , t(January 1974): : i
C ' ..
.r. .
, "Employment Profiles bf Minoritiesand Women in theSMSAs of 17'Large Cities, 1971," Report no. 41: 4
c !....
.
, "Seventh Annualaellori, 1972:". "
,prellident's'Advisory ColinCil'On Minority Business Enterprises.
"Minority Enterprise and Expanded Ownership Blueprint for
the '70s" (June 1971). -' .
STATE AND LOCAL GOVERNMENT REPORTS'
Boston
Action for Boston dOmmunity Development, "The Chinese inBoston,
197- 0." ,
Harvard Urban Eield Service an6Aation for Boston.dommunity-Development, "Chinatown Planning Project, 1971:"
New York
New York City, Human Resources. Administration, Manpower and CareerDevelopment,Agency, "Chinatown Manpower Project" 0973). 4
New York City, Human Resources Adninistration, "Ethnicity andPoverty in New York City in the Seventies" (July 1974):
New York City, Commission on Human Rights, "The EMployment of. Minorities, Women and the Handicapped in City Government"
.(1971). 4Aj
' 4
New York State, Department of Civil Service, 'Occupations, JobStatus and Ethnic Characteristics.of Employers in New YorkState Agencies," 5th Annual Report (1971).
. 371-363-

4
New York State, Department of Labor, "Minority Manpower Statisticswith Special Reference to Their Application in AffirmativeAction Compliance Programs; 1971."
California -
Manpower Planning Council City and County of San Francisco,"Comprehensive Manpower Plan" (May 1973).
San Francisco, Department of City Planning, "Chinatown 1970 Census:Population and Housing Summary and Analysis" (August 1972).
, "Chinatown 701 Study Staff Report" (1972).
San Francisco Human Rights Commission, "Racial and Ethnic EmploymentPattern Survey: City and County of San Francisco Employees"(December 1971).
State of California, Human Resources Development, "Area ManpowerReview: San Frlancisco -Oakland SMSA, Annual Outlook and
Planning" (April 1973).
State of California, Fair Employment Practice's Commissione "Ghinese/ in San Francisco, 1970."
State of California, Department of Industrial Relations, Division'of Fail- Employment Practices, "Californians of Japanese,Chinese, and Filipino Ancestry" (June 1965).
' -OTHER Dopmtins AND REPORTS
"Asian-America," Bulletin of Concerned Asian Scholars, SpecialIssue, vol. 4 no. 3 (Fall 1972).
"Asian Women," UniVersity of California at Berkeley (1971).
"Asians in America: A Bibliography of Master's Theses and DoctoralDissertations," Asian American Research Project, Universityof California at Davis (March 1970).
"Business and the Development of the Ghetto Enterprise," TheConference Board, Inc., (New York: 1971).
"Cattell, Stuart, "Health, Welfare and Social Organizations inChinatown, New York City," Community Service Society (1962).
East/West, The Chinese-American Journal, San Francisco.
3"'')ec_
"The Future of Chinatown," Chinese-American Civic Association (1972).
"Immigrants, and Ethnicity: Ten Years of Changing Thought, 1960-1970,"American Immigration and Citizenship Conference (1972).
McCue, Andy, "The China Post and the Chinese Language Daily Newspapersof New York City," Columbia University Master's Thesis (1974.
Proceedings of "The National Conference of Christian Work Anong the
Chinese in America," Honolulu (1965).
"National Asian American Studies Conference, II," California StateUniversity at San,Jose (1973).
Oei, Kendall, "Black Beans and Shrimp: A Study of the Chinese
Cubans of Miami," Harvard University Undergraduate Thesis
(1974). \,
"Roots: An Asian American Reader," University of California at 7
Los Angeles, Asian Studies Center (1971).
"San Francisco Chinese Community Citizen's Survey and Fact-FindingCommittee Rep9rt" (1969).
U.S.-China Business Review, National Council for U.S.-China Trade
(January-February 1974).
.Wong, John, "Voting Patterns of Inner City Chinese in Boston,"
unpublished paper (1972).
7
373.-365-
INNIImmum,
4 *