Use of a stochastic simulation model to identify an efficient protocol for ovarian cancer screening
20
ELSEVIER Use of a Stochastic Simulation Model to Identify an Efficient Protocol for Ovarian Cancer Screening Nicole Urban, ScD, Charles Drescher, MD, Ruth Etzioni, PhD, and Chris Colby, PhD Cancer Prevention Research Program, Fred Hutchinson Cancer Research Center, Seattle, Washington (N.U., R.E., CC.), Department of Health Services, University of Washington, Seattle, Washington (N.U.), Marsha Rivkin Ovarian Cancer Research Center, Seattle, Washington (N.U., C.D.), Department of Obstetrics and Gynecology, University of Washington, Seattle, Washington (C.D.), Division of Research, Kaiser Permanente, Oakland, California (C.C.) ABSTRACT: The intervention protocol for an ovarian cancer screening trial should be efficient as well as effective, because it may become the standard of care if the trial demonstrates mortality reduction. To identify an efficient ovarian cancer screening protocol, the effectiveness and cost-effectiveness of selected single modality and multimodal screen- ing strategies were estimated using a stochastic simulation model. Screening was simu- lated over a 30-year period in a hypothetical cohort of 1 million women aged 50 at the beginning of the period. The net present value of the cost per year of life saved was estimated for six protocols involving transvaginal sonography (TVS) and/or the tumor antigen CA 125. Internal and external validation was performed, and sensitivity analyses were conducted to assess the robustness of the ranking of the strategies. A multimodal strategy involving CA 125 with a threshold for positivity of either elevation above 35 U/ml or doubling since the previous screen, followed by TVS only if CA 125 is positive, was found to be efficient in the sense that no other strategies saved as many years of life at lower cost per year of life saved. Used annually, this strategy cost under $100,000 per year of life saved over a range of assumptions. The model’s predictions are consistent with results reported in the literature regarding the performance of TVS and CA 125. The multimodal strategy used annually or every six months was efficient compared to either ultrasound or CA 125 used alone, over a range of assumptions. Simulation of screening may be useful in selecting a screening protocol to be tested in a randomized controlled trial. Controlled Clinical Trials 1997;18:252-270 0 Elsevier Science Inc. 1997 KEY WORDS: Ovarian cancer, screening, cost-effectiveness, trial design, simulation model INTRODUCTION A randomized controlled trial (RCT) to test the efficacy of screening for ovarian cancer is costly. The screening protocol used in the trial should be Address reprint requests to: Nicole Urban, ScD, Fred Hutchinson Cancer Research Center, 1100 Fairview Avenue North MP-804, P.O. Box 19024, Seattle, WA 98109-1024. Received February 5, 1996; revised ]uly 11, 1996; accepted August 30, 1996. Controlled Clm~al Trials 18:251-270 (1997) 0 Elsev~er %ence Inc. 1997 655 Avenue of the Americas, New York, NY 10010 0197-2456/97/817.00 PII 50197.2456(96)00233-4
Transcript of Use of a stochastic simulation model to identify an efficient protocol for ovarian cancer screening
ELSEVIER
Use of a Stochastic Simulation Model to Identify an Efficient Protocol for Ovarian Cancer Screening
Nicole Urban, ScD, Charles Drescher, MD,
Ruth Etzioni, PhD, and Chris Colby, PhD Cancer Prevention Research Program, Fred Hutchinson Cancer Research Center, Seattle, Washington (N.U., R.E., CC.), Department of Health Services, University of Washington, Seattle, Washington (N.U.), Marsha Rivkin Ovarian Cancer Research Center, Seattle, Washington (N.U., C.D.), Department of Obstetrics and Gynecology, University of Washington, Seattle, Washington (C.D.), Division of Research, Kaiser Permanente, Oakland, California (C.C.)
ABSTRACT: The intervention protocol for an ovarian cancer screening trial should be efficient as well as effective, because it may become the standard of care if the trial demonstrates mortality reduction. To identify an efficient ovarian cancer screening protocol, the effectiveness and cost-effectiveness of selected single modality and multimodal screen- ing strategies were estimated using a stochastic simulation model. Screening was simu- lated over a 30-year period in a hypothetical cohort of 1 million women aged 50 at the beginning of the period. The net present value of the cost per year of life saved was estimated for six protocols involving transvaginal sonography (TVS) and/or the tumor antigen CA 125. Internal and external validation was performed, and sensitivity analyses were conducted to assess the robustness of the ranking of the strategies. A multimodal strategy involving CA 125 with a threshold for positivity of either elevation above 35 U/ml or doubling since the previous screen, followed by TVS only if CA 125 is positive, was found to be efficient in the sense that no other strategies saved as many years of life at lower cost per year of life saved. Used annually, this strategy cost under $100,000 per year of life saved over a range of assumptions. The model’s predictions are consistent with results reported in the literature regarding the performance of TVS and CA 125. The multimodal strategy used annually or every six months was efficient compared to either ultrasound or CA 125 used alone, over a range of assumptions. Simulation of screening may be useful in selecting a screening protocol to be tested in a randomized controlled trial. Controlled Clinical Trials 1997;18:252-270 0 Elsevier Science Inc. 1997
KEY WORDS: Ovarian cancer, screening, cost-effectiveness, trial design, simulation model
INTRODUCTION
A randomized controlled trial (RCT) to test the efficacy of screening for ovarian cancer is costly. The screening protocol used in the trial should be
Address reprint requests to: Nicole Urban, ScD, Fred Hutchinson Cancer Research Center, 1100 Fairview Avenue North MP-804, P.O. Box 19024, Seattle, WA 98109-1024.
Received February 5, 1996; revised ]uly 11, 1996; accepted August 30, 1996.
Controlled Clm~al Trials 18:251-270 (1997) 0 Elsev~er %ence Inc. 1997 655 Avenue of the Americas, New York, NY 10010
0197-2456/97/817.00 PII 50197.2456(96)00233-4

252 N. Urban et al
highly specific as well as sensitive, because ovarian cancer is rare and definitive diagnosis requires abdominal surgery which has significant risks, morbidity, and costs. Several annual screening protocols have been proposed for investiga- tion 111, including transvaginal sonography (TVS) [2], CA 125 with a criterion for positivity of elevation to 35 U/ml [3], CA 125 followed by TVS if elevated to 30 U/ml 141, and CA 125 (elevated to 35 U/ml) in combination with TVS and pelvic examination 151. The last strategy, which has been recommended for women with a family history of ovarian cancer who desire screening [6], is currently being tested in a randomized controlled trial [5].
Each year, about 22,000 women in the United States develop ovarian cancer and about 13,300 women die of the disease. Ovarian cancer incidence and mortality rates rise with age, peaking at 70 and 74, respectively; median ages at diagnosis and death are 63 and 69, respectively. Within-stage ovarian cancer five-year relative survival rates are 90%, 41%, and 21% for localized, regional, and advanced disease, respectively. Diagnosis of localized disease occurs in 23% of cases; diagnosis of advanced disease occurs in 52% of cases [7]. Ovarian cancers are generally staged at laparotomy according to the recommendations of the International Federation of Obstetrics and Gynecology (FIGO) 181.
Interest in TVS screening for ovarian cancer has been increasing [2,9,10], but critics want to see data on costs and benefits 111-131. A large study of TVS screening for ovarian cancer suggests sensitivity as high as lOO%, and specificity of 98.1% [2,14]; a more recent study corroborates these high performance charac- teristics in the context of multimodal screening [151.
Serologic testing, particularly the tumor antigen CA 125, has also been the subject of much interest and debate in the literature [16--251. CA 125 elevated to a level of 35 U/ml or greater is reported to have sensitivity of 81% and specificity of 84% in patients presenting with pelvic masses 1231, but sensitivity is believed to be only about 50% in early-stage disease 1251. Methods for improv- ing the sensitivity and specificity of CA 125 have been explored, including its role in multimodal screening 14, 151 as well as alternative positivity criteria such as a lower threshold for elevation [17,21,24] and rising CA 125 on serial determinations 1181.
Monte Carlo and decision analysis methods have been used in cost-effective trial design [26, 271, investigation of the potential for mortality reduction of screening for ovarian 131 and breast cancer 128,291, and evaluation of the cost- effectiveness of screening for other cancers [301. We argue in this paper that stochastic simulation modeling can be useful as well in selecting a screening protocol to test in a cancer screening trial. When an RCT is viewed as an investment, its value depends on the costs and benefits of the intervention that is recommended and implemented on the basis of trial results, as well as those that occur during the trial 126, 27, 31, 321. The net present value of the costs and benefits of intervention generally dominate the cost-effectiveness ratio for the trial 127,311. Therefore, to assist in trial design, we simulate theconsequences of offering screening to the target population using the results of the trial. We do not simulate the trial itself.
Skates and Singer have used a simulation model to estimate the effectiveness of annual screening of post-menopausal women by CA 125 using a threshold for positivity of 35 U/ml 131. We extend their work by considering TVS as well as CA 125; exploring alternative positivity criteria for CA 125; incorporating

Efficiency in Ovarian Cancer Screening 253
the effects of competing mortality, benign tumors, and clinicians’ reluctance to repeat surgery in a woman with several instances of elevated CA 125; and incorporating cost-effectiveness analysis. We hope that work of this kind will be useful in the design of future screening trials. This work is not intended to encourage ovarian cancer screening outside the context of an RCT, or to replace an RCT as a means of demonstrating screening efficacy.
METHODS
Overview
A strategy is cost-effective if it yields an additional benefit worth the additional cost over a defined period and relative to a defined baseline 1331. In the case of cancer screening, cost-effectiveness is expressed as a ratio that measures the cost per year of life saved [YLSI attributable to screening. The baseline for the analysis is no screening, or a less effective screening strategy. A strategy is efficient if it costs less per YLS than other strategies that save the same years of life.
We estimated cost-effectiveness in terms of the projected, discounted cost per YLS of several ovarian cancer screening strategies 133-351, defined a base- case, and performed sensitivity analyses. We employed standard conventions for analyzing and reporting the cost-effectiveness of prevention interventions, which have been recommended by Russell 1351. These conventions include a societal perspective, use of a discount rate of 5%, discounting of benefits as well as costs, and exclusion of medical care costs attributable to other diseases that are incurred as a result of longer life attributable to screening. Because measures of quality of life of ovarian cancer patients were not available, ex- pected life years saved were not quality-adjusted.
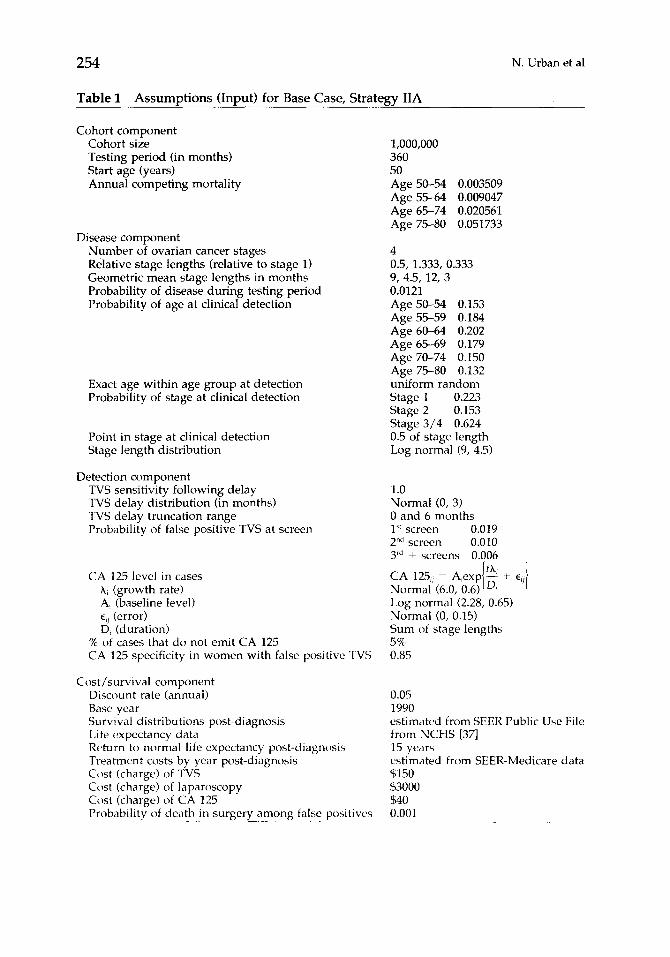
A stochastic simulation model, programmed in Gauss [36], was used to evaluate the relative cost-effectiveness of alternative screening protocols in order to eliminate from consideration clearly inferior strategies. The model simulates the natural progression of disease, then superimposes a screening program and evaluates how the screening strategy used alters longevity and costs. Table 1 summarizes our assumptions (inputs to the model). Assumptions were empirically based, either on available data or on reports in the literature. Sensitivity analysis was employed when evidence to support base-case assump- tions was weak. With minor modifications as noted, the disease progression model and the CA 125 detection model are based on previous work by Skates and Singer 131. The TVS detection model and the survival model are new.
Simulation of the Process of Ovarian Cancer Disease Progression and Screening
Generation of Screening and Cancer Cohorts
The population to be screened is defined as a cohort of one million women aged 50 in 1990. The screening and case ascertainment period is 360 months. Based on the incidence of invasive epithelial ovarian cancer between the ages of 50 and 80, each woman faces a probability of 0.0121 of having ovarian cancer diagnosed during the case ascertainment period. To account for competing mortality, each woman also faces a small annual probability of death from all
254 N. Urban et al
Table 1 Assumptions (Input) for Base Case, Strategy IIA
Cohort component Cohort size Testing period (in months) Start age (years) Annual competing mortality
Disease component Number of ovarian cancer stages Relative stage lengths (relative to stage 1) Geometric mean stage lengths in months Probability of disease during testing period Probability of age at clinical detection
Exact age within age group at detection Probability of stage at clinical detection
Point in stage at clinical detection Stage length distribution
Detection component TVS sensitivity following delay TVS delay distribution (in months) TVS delay truncation range Probability of false positive TVS at screen
CA 125 level in cases A, (growth rate) A, (baseline level) E,, (error) D, (duration)
% of cases that do not emit CA 125 CA 125 specificity in women with false positive TVS
Cost/survival component Discount rate (annual) Base year Survival distributions post-diagnosis Life expectancy data Rc+urn to normal life expectancy post-diagnosis Treatment costs by year post-diagnosis Cost (charge) of TVS Cost (charge) of laparoscopy Cost (charge) of CA 125 Probability of death in surgery among false positives ___~_-._--
1,000,000 360 50 Age 50-54 0.003509 Age 55-64 0.009047 Age 65-74 0.020561 Age 75-80 0.051733
4 0.5, 1.333, 0.333 9, 4.5, 12, 3 0.0121 Age 50-54 0.153 Age 55-59 0.184 Age 60-64 0.202 Age 65-69 0.179 Age 70-74 0.150 Age 75-F-80 0.132 uniform random Stage 1 0.223 Stage 2 0.153 Stage 3/4 0.624 0.5 of stage length Log normal (9, 4.5)
1.0 Normal (0, 3) 0 and 6 months 1” screen 0.019 2”d screen 0.010 3rd + screens 0.006
Log normal (2.28, 0.65) Normal (0, 0.15) Sum of stage lengths 5% 0.85
0.05 1990 estimated from SEER Public Use File from NCHS [37] 15 years estimated from SEER-Medicare data $150 $3000 $40 0.001

Efficiency in Ovarian Cancer Screening 255
other causes, which increases with age (Table 1) 1371. Healthy women exit the model at age 80; women with ovarian cancer are followed until death.
Generation of Age and Stage at Diagnosis of Cancer
Each case is assigned an age and stage at diagnosis in the absence of screen- ing. The Public Use File for all regions of the Surveillance, Epidemiology, and End Results (SEER) program of the National Cancer Institute (NCI) was used to estimate the proportion of women diagnosed between the ages of 50 and 80 in each five-year age group and in each SEER stage of diagnosis. Of 18,797 cases of epithelial ovarian cancer diagnosed between 1973 and 1987, 14,076 occurred in women between the ages of 50 and 80. Of the 13,560 cases for whom staging information was available, 22.3% were detected in SEER stage local, 15.3% were detected at SEER stage regional, and the remaining 62.4% were diagnosed after the cancer had spread beyond the pelvic area, SEER stage distant. For each case, a uniform (0,l) percentile score is generated and converted to an age category at diagnosis to preserve the age distribution given in Table 1. An exact age (month) at diagnosis is obtained by assuming that cases are distributed uniformly within each five-year age category. Similarly, each case is assigned a uniform percentile score to index a stage at diagnosis from the distribution reported in Table 1. Although the simulation software supports the use of FIG0 staging [ 111, the results reported here are based on SEER staging to accommodate the inclusion of cases diagnosed prior to 1983, when SEER began to collect the extent-of-disease data necessary to convert to FIG0 staging.
Generation of Rate of Disease Progression and Age at Tumor Inception
The model assumes four disease stages corresponding to the FIG0 stages, with durations distributed log-normally with geometric means 9, 4.5, 12, and 3 months respectively, each with a 50% coefficient of variation. The length of Stage 1 is assumed independent of the stage of disease at clinical diagnosis; and Stage 2 is assumed half the length of Stage 1; Stage 3, 1.333 times the length of Stage 1; and Stage 4, .333 times the length of Stage 1. Each case is assigned a duration of months in Stage 1 of the disease, which defines the remaining disease stage lengths. These assumptions are based on the opinions of clinicians, as reported by Skates and Singer [3]. To accommodate the use of SEER staging in a model designed for FIG0 staging, FIG0 stages III and IV are assumed to comprise SEER Stage 3 (distant), with a mean duration of 15 months.
Based on the method of Skates and Singer, diagnosis following clinical detection is assumed to occur at the midpoint of each stage, and the age at tumor inception and transition times between stages are back-calculated. For example, age at the beginning of disease Stage 1 is obtained by subtracting from the age at diagnosis half of the length of the stage in which diagnosis occurred and the lengths of all preceding stages. The term “tumor inception” is operationally defined as the first month in which the tumor is potentially detectable by a hypothetical screening modality.
256 N. Urban et al
Generation of Age at Death among Clinically Detected Cases
Survival post-diagnosis is assumed independent of the duration of Stage 1 disease in the base case. Kaplan-Meier survival curves were estimated from data available from the SEER program on 13,560 cases of ovarian cancer diagnosed between 1973 and 1987. Within-stage survival distributions for women diag- nosed between the ages of 50-59, 60-69, and 70-80 are included as tables in the Gauss program. Each case is assigned a percentile score distributed uniform (0,l) representing her percentile in the relevant age- and stage-specific empirical survival distribution. For example, a case might be randomly assigned the 75th percentile in the distant stage survival distribution for women aged 50-59 at diagnosis. Her age at death is calculated by adding her survival time to her age at diagnosis. Remaining life expectancy at 15 years post-diagnosis, based on U.S life tables 1371, is added to the survival of women surviving more than 15 years. Because life expectancy tables end at age 85, life expectancy at age 85 is used for women surviving beyond age 85.
Generation of TVS Status
TVS is assumed to be 100% sensitive x months after tumor inception (the beginning of disease Stage l), where x is assumed to follow a normal distribution with mean 0 and standard deviation 3 months, truncated such that if x < 0, it is set to 0, and if x > 6, it is set to 6. When cancer is not present, and before the cancer is detectable, sensitivity is assumed to be 0. These assumptions imply a sensitivity for TVS of about 88% in the context of an annual screening program and base-case assumptions of the model.
Generation of CA 125 Status
Each woman is assigned a level of CA 125 for each month of the screening period, randomly generated from the exponential distribution given in Equa- tion (1). Following Skates and Singer, among 95% of cases the level of CA 125 is assumed to increase exponentially over time according to the following model for the j’” CA 125 measurement taken on the ith case:
CA 125, =
where time t .= 0 at the beginning of disease Stage 1, X, is the exponential growth rate, and Di is the duration of disease, i.e., the sum of all four stage lengths, for the ith case. X, is distributed N(6.0, 0.6) (normal with mean = 6.0 and standard deviation = 0.6), independent of A, which is the baseline level of CA 125 for the ith woman prior to tumor inception; log A, is distributed N(2.28, 0.65) in accordance with distributions of CA 125 reported in the literature [3,20]. hi equals 0 among women without ovarian cancer, prior to the beginning of disease Stage 1 among cases, and in the 5% of cases whose tumors do not emit CA 125. These assumptions imply that, in 95% of cases, CA 125 grows exponentially from its baseline with time since tumor inception at a rate that depends inversely on the assigned stage durations.

Efficiency in Ovarian Cancer Screening 257
In healthy women as well as cases, ei, is distributed N(0, 0.15) to reflect measurement error [3]. Departing from Skates and Singer, we further assume that in 15% of the women in whom TVS is falsely positive, CA 125 behaves as if the benign tumor were malignant. These assumptions are consistent with reported rates of positivity of CA 125 among women with benign pelvic masses [23,38], and preserve the implications of Skates and Singer’s assumptions that, in the absence of ovarian cancer, CA 125 mean and variance are 12 and 85, re- spectively.
Generation of True and False Positive Screens
Screens start one month after the woman enters the model on her 50th birthday, and occur periodically in accordance with a defined screening proto- col that includes CA 125 and/or TVS. If the protocol includes CA 125, the serum marker’s level is calculated at each screen month and compared to the positivity criterion. If the positivity criterion is met, the test is considered to be a true positive if tumor inception has occurred; otherwise it is a false positive. Departing from Skates and Singer, we recognize that clinical practice would limit the number of times a woman would be referred for definitive diagnosis on the basis of an elevated CA 125, and incorporate changes in CA 125 on serial tests as a test positivity criterion.
Similarly, if the protocol includes TVS, the month of each screen is compared to the month of tumor inception plus the TVS sensitivity delay; the TVS screen is considered a true positive if the screen takes place after tumor inception plus the delay. Benign tumors are assumed to drive the false positivity of TVS. TVS and transabdominal ultrasound (TAU) are reported to have specificities of 98.1% 1141 and 96.8% [391, respectively, at a first (prevalence) screen. The probability of a healthy postmenopausal woman’s TAU being falsely positive has been reported to decrease from 0.0326 at a first screen to 0.0175 and 0.0103 at the second and third screens, respectively 1391. Applying the ratios of second and third to first-screen probabilities for TAU to the higher first-screen specific- ity for TVS, we assumed that the probability that a healthy woman would falsely screen positive on TVS would be 0.019, 0.010, and 0.006 at the first, second, and subsequent screens, respectively.
Generation of Age and Stage at Screen Detection of Cancer
The age at screen detection is given by the month of the first true positive screen. If the age at clinical detection is greater than the age at detection by screening, the disease stage at detection by screening is calculated by referring to the age at tumor inception and the lengths of the disease stages assigned to the case. It is assumed that diagnosis following screen detection occurs within the month of screen detection.
Generation of Age at Death among Screen-Detected Cases
If the stage at diagnosis following detection by screening is earlier than the stage at diagnosis following clinical detection, a new age at death is assigned by indexing the new relevant age- and stage-specific survival distributions,

258 N. Urban et al
and adding survival to age at diagnosis following detection by screening. The same percentile score that had been used to obtain an age at death following clinical detection is used to generate the new survival time from screen detec- tion; for example, the 75th percentile as described above. Thus, for example, a case who has a relatively favorable survival given her age and stage at clinical diagnosis will have a similarly favorable survival following screen detection. This approach departs from the method of Skates and Singer, who employ life expectancies and a probability of cure.
Generation of Age at Death among False Positives
It is assumed that a woman faces a 0.001 probability of death each time a laparoscopy is performed.
Calculation of the Benefits and Costs of Screening
Calculation of YLS among Screen-Detected Cases
For each woman, the YLS is the difference between the age at death with and without the screen when there is a shift from distant stage to local or regional stage, or from regional to local stage. In the model, screening occasion- ally results in an earlier age at death, if the lead time exceeds the survival gain due to negligible between-stage differences in survival. Clinically, however, this would occur only if earlier treatment resulted in earlier demise of the patient. Therefore, in the base case, we replace negative survival differences generated by the model by zero.
Calculation of Savings in Treatment Costs among Screen-Detected Cases
Within-stage expectations of ovarian-cancer-attributable treatment costs over the 15 years post-diagnosis were estimated from the SEER-Medicare file [40], made available for this study by the Applied Research Branch of the NCI, and included as tables in the Gauss program. Estimation methods are reported elsewhere [411. Savings in treatment costs, the monetary benefits of screening, are calculated for each case with a shift from distant to local or regional stage, or from regional to local stage, as the difference in the net present value of the costs over her remaining lifetime with and without the screen. It is possible for treatment costs to be higher with than without the screen.
Calculation of Screening Costs among All Women
For each woman, screening and diagnosis costs are calculated by multiplying the number of procedures by their unit costs, which were obtained by means of a telephone survey of relevant laboratories and medical facilities. Although costs rather than charges are of interest, only charge data were available. A sample of physician offices, hospital clinics, and laboratories were contacted to learn charges in the Seattle area for CA 125 blood tests and for TVS proce- dures. Charge data were collected only if the facility performed at least 20 of the procedures per week. Consideration of these data in consultation with
Efficiency in Ovarian Cancer Screening 259
practicing gynecological oncologists led us to cost assumptions for the base case of $40 for CA 125, $150 for TVS including transabdominal and/or color Doppler procedures as needed, and $3000 for laparoscopy, including both physician and facility fees. In the case of true positives, only half of the cost of laparoscopy is counted as a screening cost, in recognition of the clinical need to follow laparoscopy immediately by laparotomy in confirmed malignancy.
Reporting of Results
The model was used to rank candidate screening strategies in terms of the net present value of their YLS and cost per YLS, which were estimated for six strategies involving TVS and/or CA 125. The health benefit of a screening strategy is the difference in age at death with and without the screen. The monetary benefit (cost) of the strategy is similarly the difference in costs with and without the screen, including treatment costs as well as screening and diagnosis costs. All costs are measured in 1990 dollars, and all costs and benefits are discounted by 5% to 1990, the time at which the investment decision is made. Discounting has the effect of weighting costs and benefits that occur in the future less heavily than those that occur immediately [42]; it is appropriate in the context of trial design when considering the costs and benefits of interven- ing in the population after the protocol tested in the trial is adopted [31,32]. Discounted YLS and costs are calculated for each individual woman, and then summed over all women. Variability in the estimates, based on 20 replications, is reported for the most efficient strategy.
Model Validation
We performed two types of model validation. Internal validation checked the mechanics of the survival and detection components of the model. External validation evaluated the disease progression and detection components of the model, and identified needed sensitivity analyses.
Intrrnal Validation
Internal validation was used to check that YLS and savings in treatment costs were being calculated correctly, and that the detection model yielded accurate performance statistics. The model estimated the average expected net present value of attributable treatment costs over the 15 years post diagnosis of ovarian cancer to be $23,292, $35,673, and $32,941 for SEER stages local, regional, and distant, respectively. Analogous numbers estimated using the Kaplan-Meier Sample Average (KMSA) estimator and the SEER data were $23,212, $34,942, and $33,507, as reported by Etzioni et al 1411.
Similarly, the model calculated YLS for each case using survival distributions estimated within age category and stage at diagnosis from the SEER Public Use File. The model reports an average gain in years of life over all cases experiencing a shift from one stage to another of 10.6 years for a shift from stage distant to local, 6.4 for a shift from stage regional to local, and 4.0 for a shift from stage distant to regional. The YLS attributable to an ovarian cancer stage shift can be approximated outside the model by estimating life expectancy
260 N. Urban et al
conditional on ovarian cancer stage at diagnosis. Computationally, this calcula- tion is a simple application of Kaplan-Meier curves where time to death is measured by the age of the woman at death. Women who have not yet died are censored at the age they were last known to be alive. The difference between life expectancy among the local stage cases and the distant stage cases is an estimate of the years of life saved by detection in local stage rather than distant stage, assuming that all women diagnosed with local stage disease would have survived to progress to distant stage had they not been detected at local stage. Shifts in stage from distant to regional and regional to local are derived simi- larly. Because the screening simulation targets women between the ages of 50 and 80, analysis was limited to the 13,560 cases of epithelial ovarian cancer occurring in women age 50 to 80 in which stage was known. Expected survival is to age 78.4 among cases diagnosed while the cancer was confined to the ovaries (local), to age 71.7 among regional cases, and to age 67.5 among distant cases, respectively. On average, then, a shift from stage distant to local saves 10.9 years of life, a shift from stage regional to local saves 6.7 years of life, and a shift from stage distant to regional saves 4.2 years of life.
Under base-case assumptions in the context of annual screening, the model generates the following estimates of sensitivity, specificity, and positive pre- dictive value [PPVI: TVS: sensitivity 88.4%, specificity 99.3%, and PPV 4.9%; CA 125 above 35 U/ml: sensitivity 49.6%, specificity 99.6%, PPV 6.4%; CA 125 doubling: sensitivity 62.8%, specificity 99.9%, PPV 15.9%. These estimates were compared during model development to estimates reported in the literature. TVS has been reported to have sensitivity and specificity of 100% and 98.1% respectively 1141. CA 125 at a threshold for positivity of 35 U/ml has been reported to have sensitivity of 81% in a population heavily weighted by late- stage cases [231. The sensitivity and specificity of CA 125 doubling are unknown, but its specificity in women with initially elevated CA 125 has been reported to be 99.9% 1181.
Internal validation was performed as well by replicating the work of Skates and Singer [31 with respect to detection of malignancy. To perform this replica- tion, we disabled the following portions of our model: competing mortality, the CA 125 limit on false positives, and benign tumors. Our model reports that screening with CA 125 alone with a positivity criterion of 35 U/ml yields a FIG0 stage distribution of 41% Stage I, 28% Stage II, 29% Stage III, and 2% Stage IV. Skates and Singer report analogous numbers of 43%, 25%, 30%, and 2%. Our model, however, yielded 2.2 years of life saved per case, whereas theirs yielded 3.4 (both undiscounted), suggesting that our use of empirical survival distributions is a more conservative approach than Skates and Singer’s probability of cure.
External Validation
It was possible to analyze data generated by the model to obtain estimates of between- and within-woman variance in CA 125 among healthy women. These estimates were compared to estimates of the variation in CA 125 over time within a woman as well as cross-sectionally, among healthy women aged 50 and above, obtained from data made available by Beth Karlan, MD, Director of the Gilda Radner Ovarian Cancer Center in Los Angeles 1431. In the Karlan
Efficiency in Ovarian Cancer Screening 261
series between-woman variance was 36, and within-woman variance was about 49 as estimated by a simple random effects model [44], while the model adapted from Skates and Singer generated between- and within-woman variances of 80 and 5, respectively. Overall, the variances are comparable, but the contribu- tion of within-woman variance is higher in the Karlan series. Skates and Singer did not consider changes in CA 125 as a criterion for positivity, but in our work using this higher within-woman variance changed the performance char- acteristics of CA 125 doubling to sensitivity 64.3%, specificity 86.3%, and PPV 0.007. Sensitivity analysis was used to assess the effect on our results of assum- ing this higher within-woman variance in CA 125.
External validation of the disease detection portion of the model was also performed by replicating through simulation the work of Jacobs, et al, who have recently reported the sensitivity and specificity of a prevalence screen using CA 125 >30 U/ml followed by TVS [15]. The model was used to simulate their experience by employing a five-year screening interval and a criterion for CA 125 positivity of >30 U/ml. Clinically diagnosed cases occurring within two years of the screen were counted as “interval cancers” to simulate a prevalence screen with a two-year follow-up. In 22,000 women screened, Jacobs et al found 19 cancers, of which 11 were screen-detected and 8 were diagnosed clinically within two years; of the 8 interval cancers, 7 were “missed” by the CA 125 and in one case, the woman did not return for TVS following a positive CA 125 test. The simulation model generated 17 cancers, of which 8 were screen-detected and 9 were diagnosed clinically within two years. Considering only the cancers detected clinically within one year of the prevalence screen, Jacobs reported 2 false negatives (of which one was a failure to return for TVS), while the model generated 3. Jacobs reported sensitivities of 65% and 85%, respectively, based on two- and one-year interval cancers; the model generated sensitivity of 76% based on presence of disease at the time of the screen. Jacobs reported positive predictive value (PPV) of 27%; the model generated PPV of 12.5%. Jacobs’ experience was somewhat better, reflecting conservative assump- tions used in modeling.
Sensitivity Analyses
We conducted sensitivity analyses to investigate the effects on results of alternative assumptions that (1) the average duration of Stage 1 disease is (a) 5 months or (b) 13 months; (2) TVS cost is reduced by one-third to $100; (3) the within- and between-woman variances in CA 125 are 49 and 36 rather than 5 and 80, respectively; (4) TVS is (a) 100% sensitive immediately in all women or (b) 85% sensitive following the previously assumed delay; (5) 10% rather than 5% of ovarian cancers fail to emit CA 125; (6) survival post-diagnosis depends on the rate of disease progression pre-diagnosis; (7) when lead time exceeds the gain in survival attributable to screening, survival gains are nega- tive; (8) health effects and costs are not discounted; and (9) TVS-favoring conditions prevail.
Selection of Screening Strategies for Analysis
Table 2 describes the screening protocols. All employ laparoscopy for defini- tive diagnosis. If malignancy is confirmed, laparotomv is performed immedi- ately. If surgery is performed following a positive TVS,‘the ovaries are removed

262 N. Urban et al
Table 2 Ovarian Cancer Screening Strategies
Strategy IA: ANNUAL TVS: TVS is performed annually.Pbbr Strategy IB: ANNUAL CA 225, ELEVATED: CA 125 is performed annually. If CA 125
exceeds 35 U/ml, the woman is referred for laparoscopy.6sd Strategy IC: ANNUAL CA 725, RISING OR ELEVATED: CA 125 is performed annually.
If CA 125 exceeds 35 U/ml, or has doubled since the last screen, the woman is referred for laparoscopy.b,”
Strategy IIA: ANNUAL TVS CONDITIONAL ON RISING OR ELEVATED CA 225: CA 125 is performed annually. If CA 125 exceeds 35 U/ml, or has doubled since the last screen, the woman is referred for TVS. If TVS is positive, she is referred for laparosco-
PY?,b,c,d Strategy IIB: SIX-MONTH TVS CONDITlONAL ON RlSlNG OR ELEVATED CA
125: CA 125 is performed every six months. If CA 125 exceeds 35 U/ml, or has doubled since the last screen, the woman is referred for TVS. If TVS is positive, she is referred for laparoscopy.“b,Ld
Strategy IIC: TWO-YEAR TVS CONDITIONAL ONRISING OR ELEVATED CA 225: CA 125 is performed every two years. If CA 125 exceeds 35 U/ml, or has doubled since the last screen, the woman is referred for TVS. If TVS is positive, she is referred for laparoscopy.“,b,‘,d
“If TVS cannot be performed or is inadequate, transabdominal ultrasound is employed.
“If malignancy is confirmed by laparoscopy, laparotomy and oopherectomy are performed immedi- ately, and periodic screening is discontinued.
’ Benign tumors are surgically removed, prophylactic oopherectomy is performed, and periodic screening is discontinued.
“If the same woman has two instances of elevated CA 125 with no confirmation of malignancy, her threshold for positivity is increased to CA 125 > 100 U/ml.
and periodic screening is discontinued. In all of the strategies with a positivity
criterion for CA 125 of elevation, if a woman has two instances of elevated CA 125 with no confirmation of malignancy, her threshold for positivity is increased to CA 125 > 100 U/ml.
Annual screening by TVS used alone (Strategy IA) provides a standard against which alternative strategies can be compared. TVS is generally recog- nized by clinicians as the screening modality of choice for high-risk women because of its high sensitivity 12, 10, 451, but critics cite the need for cost- effectiveness studies because of its low specificity and high cost [12]. Annual use of CA 125 alone with a criterion for positivity of 35 U/ml (Strategy IB) has been investigated by Skates and Singer [3].
A strategy calling for a positivity criterion for CA 125 of either doubling or elevation above 35 U/ml (Strategy IC) is included to improve the sensitivity of CA 125. It is well known that among women with ovarian cancer, rising or falling levels of CA 125 are highly predictive of progression or regression of the disease I.461.
A multimodal strategy calling for TVS conditional on elevated or rising CA 125 (Strategy HA) improves cost-effectiveness by avoiding TVS in women with normal CA 125, and avoiding surgery in women with normal TVS. The same strategy used every six months (Strategy IIB) improves effectiveness while retaining cost-effectiveness. Finally, in an effort to improve cost-effectiveness, we considered use of this multimodal strategy every two years (Strategy IIC).

Efficiency in Ovarian Cancer Screening 263
Table 3a Performance Characteristics of Single Modality Ovarian Cancer Screenine Strateeies”
Strategy
IC IB Annual
Annual CA 125 IA CA 125
ScrEing (Elevated) (Elevated Annual
Performance Criterion or rising) TVS
Stage at Diagnosis Percent local stage 22.0% 36.6% 52.6% 66.4% Percent regional stage 15.4% 30.9% 26.7% 20.1% Percent distant stage 62.6% 32.5% 20.7% 13.5%
Costs (in millions) for l,OO,OOO women screened
Screening costs $534 $532 $1,978 Diagnosis costs $199 $217 $277 Treatment costs -$14 -- $27 -$38 Total net costs $719 $722 $2,217 Marginal net costs +$3 $1,495
Effectiveness Years of life saved (YLS) 6,347 11,229 15,168 Marginal YLS 4,882 3,939
Cost-Effectiveness (in thousands) Average cost per YLS $113.3 $64.3 $146.2 Marginal cost per YLSh $0.5 $379.6
‘/ Screening occurs annually in a cohort of l,OOO,OOO women beginning at age 50. Analysis is over a 30-year period. Costs are measured in 1990 dollars. Costs and benefits are discounted at 5% to the beginning of the period.
h The marginal cost per year of life saved is equal to the marginal net costs tin thousands) divided by the marginal years of life saved. For each strategy, these are defined relative to the next most effective strategy. The strategies are arranged from left to right in ascending order of effectiveness.
RESULTS
Identification of Efficient Strategies
Table 3 presents results of the simulations which are based on approximately 10,500 cases of ovarian cancer generated in a cohort of 1 million women over a 30-year period. Within each part of Table 3, the strategies are arranged from left to right in ascending order of effectiveness, measured by potential YLS. The last line in the table reports the marginal (incremental) cost-effectiveness of the strategy, measured by the additiona cost per additional YLS relative to the next most effective strategy. Both costs and benefits are discounted at 5% to 1990; costs are reported in 1990 dollars.
Table 3a presents results for the single-modality strategies, including TVS (IA), CA 125 at a cutoff of 35 U/ml (IB), and CA 125 with a threshold for positivity of either elevation above 35 U/ml or doubling since the last screen (IC). These estimates suggest that Strategy IA is the most effective, saving 15,200 years of life over the 30-year period at an average cost of $146,000 per year of life saved. Strategy IB costs $113,000 per year of life saved, but saves only 6,300 years of life. Strategy IC saves 11,200 years of life at cl cost per YLS
264 N. Urban et al
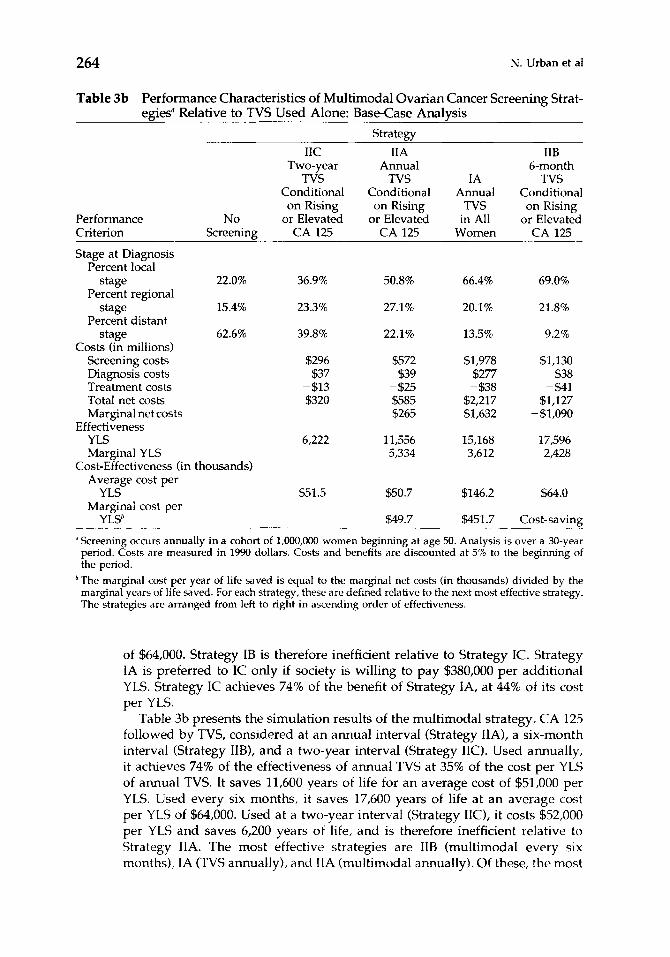
Table 3b Performance Characteristics of Multimodal Ovarian Cancer Screening Strat- egiesR Relative to TVS Used Alone: Base-Case Analysis
Strategy
IIC IIA IIB Two-year Annual 6-month
TVS TVS IA TVS Conditional Conditional Annual Conditional
on Rising on Rising TVS on Rising Performance No or Elevated or Elevated in All or Elevated Criterion Screening CA 125 CA 125 Women CA 125
Stage at Diagnosis Percent local
stage 22.0% 36.9% 50.8% 66.4% 69.0% Percent regional
stage 15.4% 23.3% 27.1% 20.1% 21.8% Percent distant
stage 62.6% 39.8% 22.1% 13.5% 9.2% Costs (in millions)
Screening costs $296 $572 $1,978 $1,130 Diagnosis costs $37 $39 $277 $38 Treatment costs -$13 -$25 -$38 -S41 Total net costs $320 $585 $2,217 $1,127 Marginal net costs $265 $1,632 -$1,090
Effectiveness YLS 6,222 11,556 15,168 17,596 Marginal YLS 5,334 3,612 2,428
Cost-Effectiveness (in thousands) Average cost per
YLS $51.5 $50.7 $146.2 $64.0 Marginal cost per
YLSh $49.7 $451.7 Cost-saving
* Screening occurs annually in a cohort of l,OOO,OOO women beginning at age 50. Analysis is over a 30-year period. Costs are measured in 1990 dollars. Costs and benefits are discounted at 5% to the beginning of the period.
‘The marginal cost per year of life saved is equal to the marginal net costs (in thousands) divided by the marginal years of life saved. For each strategy, these are defined relative to the next most effective strategy. The strategies are arranged from left to right in ascending order of effectiveness.
of $64,000. Strategy IB is therefore inefficient relative to Strategy IC. Strategy IA is preferred to IC only if society is willing to pay $380,000 per additional YLS. Strategy IC achieves 74% of the benefit of Strategy IA, at 44% of its cost per YLS.
Table 3b presents the simulation results of the multimodal strategy, CA 125 followed by TVS, considered at an annual interval (Strategy IIA), a six-month interval (Strategy IIB), and a two-year interval (Strategy IIC). Used annually, it achieves 74% of the effectiveness of annual TVS at 35% of the cost per YLS of annual TVS. It saves 11,600 years of life for an average cost of $51,000 per YLS. Used every six months, it saves 17,600 years of life at an average cost per YLS of $64,000. Used at a two-year interval (Strategy IIC), it costs $52,000 per YLS and saves 6,200 years of life, and is therefore inefficient relative to Strategy IIA. The most effective strategies are IIB (multimodal every six months), IA (TVS annually), and IIA (multimodal annually). Of these, the most

Efficiency in Ovarian Cancer Screening 265
cost-effective strategies are IIA and IIB, the multimodal strategy used annually or every six months. For Strategy IIA, 95% confidence intervals for YLS and cost per YLS are 11,070 to 11,882 and $49,200 to $52,900, respectively.
Sensitivity Analyses
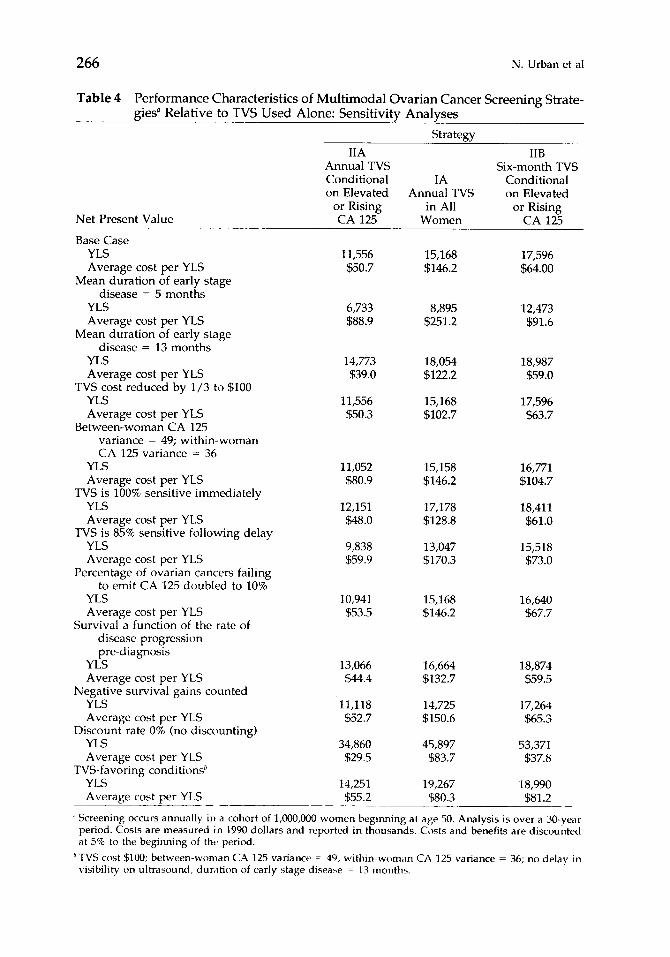
The three strategies identified as the most effective, shown in Table 3b, were subjected to sensitivity analysis to determine the effect of changes in key assumptions on their relative cost-effectiveness (see Table 4).
Shorter average duration for the early stage of the disease (5 rather than 9 months), which implies more aggressive disease, reduces the effectiveness and cost-effectiveness of all three strategies. Under this assumption, the multimodal strategy used every 6 months outperforms the other strategies, but it costs $92,000 per YLS. Conversely, longer average duration for the early stage of the disease (13 rather than 9 months) improves the performance of all three strate- gies, especially the multimodal strategy performed annually, which costs $39,000 per YLS under this optimistic assumption.
A higher within-woman variance in CA 125, holding constant total variance, adversely affects the performance of the multimodal strategies, but they still perform better than TVS used alone. Under this assumption, the multimodal strategy used annually costs $81,000 per YLS. As reported in Table 4, the relative ranking of the strategies is also robust to varying the sensitivities of TVS and CA 125; linking survival post-diagnosis to the rate of disease progression pre- diagnosis; assuming that when lead time exceeds the gain in survival attribut- able to screening, survival gains are negative; counting health effects and costs with no discounting; and lowering TVS cost to $100. A combination of four TVS-favoring conditions improves the performance of annual TVS to $80,000 per YLS, making it efficient relative to the multimodal strategy performed every six months, and competitive relative to the multimodal strategy per- formed annually.
DISCUSSION
Conclusions
Our results suggest that annual screening by TVS conditional on elevated or rising CA 125 is more efficient than annual screening by TVS in an unselected group of postmenopausal women. Using this multimodal strategy every six months increases the chance of early detection and, therefore, the possibility of observing a significant mortality differential. This, in turn, will increase the power of a screening trial with disease-specific mortality as its endpoint. The multimodal strategy is relatively cost-effective under a wide range of as- sumptions.
Limitations
Results must be interpreted with caution because of potential sources of bias, lack of empirical evidence to support some assumptions, and the limited number of screening strategies selected for investigation.
266 N. Urban et al
Table 4 Performance Characteristics of Multimodal Ovarian Cancer Screening Strate- gies” Relative to TVS Used Alone: Sensitivity Analyses
Strategy
Net Present Value
IIA Annual TVS Conditional IA on Elevated Annual TVS
or Rising in All CA 125 Women
Base Case YLS Average cost per YLS
Mean duration of early stage disease = 5 months
YLS Average cost per YLS
Mean duration of early stage disease = 13 months
YLS Average cost per YLS
TVS cost reduced by l/3 to $100 YLS Average cost per YLS
Between-woman CA 125 variance = 49; within-woman CA 125 variance = 36
YLS Average cost per YLS
TVS is 100% sensitive immediately YLS Average cost per YLS
TVS is 85% sensitive following delay YLS Average cost per YLS
Percentage of ovarian cancers failing to emit CA 125 doubled to 10%
YLS Average cost per YLS
Survival a function of the rate of disease progression pre-diagnosis
YLS Average cost per YLS
Negative survival gains counted YLS Average cost per YLS
Discount rate 0% (no discounting) YLS Average cost per YLS
TVS-favoring conditions’ YLS Average cost per YLS
11,556 15,168 $50.7 $146.2
6,733 $88.9
14,773 $39.0
11,556 $50.3
11,052 $80.9
12,151 $48.0
9,838 $59.9
10,941 $53.5
13,066 $44.4
11,118 $52.7
34,860 $29.5
14,251 $55.2
8,895 $251.2
18,054 $122.2
15,168 $102.7
15,158 $146.2
17,178 $128.8
13,047 $170.3
15,168 $146.2
16,664 $132.7
14,725 $150.6
45,897 $83.7
19,267 $80.3
IIB Six-month TVS
Conditional on Elevated
or Rising CA 1%
17,596 $64.00
12,473 $91.6
18,987 $59.0
17,596 $63.7
16,771 $104.7
18,411 $61.0
15,518 $73.0
16,640 $67.7
18,874 $59.5
17,264 $65.3
53,371 $37.8
18,990 $81.2
’ Screening occurs annually in a cohort of l,OOO,OOO women begmning at age 50. Analysis is over a 30-year period. Costs are measured in 1990 dollars and reported in thousands. Costs and benefits are discounted at 5% to the beginning of tht, period.
‘TVS cost $100; between-woman CA 125 variance = 49; within-woman CA 725 variance = 36; no delay in visibility on ultrasound, dur,ltion of early stage disease = 13 months.

Efficiency in Ovarian Cancer Screening 267
In screening studies, lead-time bias and length-biased sampling pose threats to validity. Lead-time bias occurs because screening advances the date of diag- nosis, so that even if screening has no effect on the date of death, survival measured from the date of diagnosis will appear longer in screendetected than in clinically detected cases. In a screening program, the lead time is unobservable in a screen-detected case, whereas in the model, the survival of each case is known for both screen detection and clinical detection. Lead-time bias is avoided by calculating the survival gain as the difference between the ages at death with and without screening. Length bias occurs in the context of screening programs because the distribution of tumor growth rates differs between screen- and clinically detected cases [47]. When there is dependence between disease progression and survival, the survival of screen-detected cases (which tend to progress slowly) cannot be compared to survival of clinically detected cases to yield an estimate of screening benefit. Because in the simula- tion, each woman serves as her own control, the estimates generated by the model have no length bias.
Another potential source of bias is that the model bases the ages at death with and without screening on survival distributions estimated from the SEER data. We assume that late- and early-stage cancers in the SEER database have similar rates of disease progression, which allows us to use the early-stage- at-diagnosis data as our best guess regarding the survival behavior of cancers detected early as a result of screening. This assumption would be untenable if screening had been performed in the population represented by the SEER data. Although we are confident that very little ovarian cancer screening occurred in the United States during the 20-year observation period [1974-19931, we cannot be sure that women diagnosed in late and early stage have the same natural history of disease. Only a randomized controlled trial can confirm results regarding gains in longevity.
Benefits were estimated conservatively in that we ignored survival gains attributable to earlier diagnosis within stage at diagnosis. The assumption that survival, for a given stage at diagnosis, is similar with and without screening introduces a potential methodological bias; however, cancers that progress slowly are more likely to be detected by periodic screening, and women with these cancers might be expected to exhibit better survival following diagnosis. In the base case, we assumed survival post-diagnosis to be independent of the rate of disease progression prior to diagnosis. To assess the effect of this assumption on estimates of cost-effectiveness, sensitivity analysis was per- formed.
Because assumptions about the sensitivity and specificity of the screening modalities, the rate of increase of CA 125 in diseased women, and the relation- ship between CA 125 levels, disease progression, and visibility on TVS are not easily verifiable empirically, we performed an external validation. The results are encouraging with respect to the disease progression and detection compo- nents of the model, but a randomized controlled trial is needed to validate its survival component. Sensitivity analyses suggest that, in particular, more evidence is needed regarding the duration of the earliest stage of the disease and the within-woman variance in CA 125.
Other potentially efficient strategies for ovarian cancer screening should also be investigated, including the use of combinations of markers to improve

268 N. Urban et al
sensitivity [38] and use of a lower threshold for elevation of CA 125 in a multimodal strategy 141. The extent to which rising CA 125 is useful depends on the within-woman variance of CA 125 in healthy women and the validity of the assumption that fast-growing tumors have fast-growing CA 125. More evidence is needed in this regard.
Implications
Within the next decade, a large trial will provide estimates of the mortality reduction attributable to screening for ovarian cancer [5] which can be used to validate further the simulation model. Using data from the trial, the model might then be used to estimate the effectiveness of alternative screening strate- gies that are potentially more cost-effective than the strategy employed in the trial.
Analysis of cost-effectiveness using a stochastic simulation model is useful for identifying questions to be addressed by a screening trial, as well as for suggesting screening strategies that might be cost-effective to test in a trial. Conclusions can be drawn about the relative efficiency of the various screening protocols under base-case assumptions, but the absolute estimates of cost- effectiveness should be interpreted with great caution. A trial must demonstrate effectiveness before any screening protocol is adopted outside the context of research. We hope that the concepts and approach presented here will be useful to researchers planning and designing screening trials in the future.
The authors are grateful to Beth Karlan, MD, of Cedars-Sinai Medical Center in Los Angeles for access to her data. They gratefully acknowledge suggestions from Margaret Pepe, PhD, regarding methods used to estimate years of life saved using the SEER Public Use File; assistance from Fran Maloy, PhC, Mary Baker, PhD, and Arnold Potosky, PhC, with analysis of the SEER-HCFA data; advice from T. Raghunathan, PhD, regarding specification and programming of the stochastic simulation model; helpful comments from Matt Gable, MS, as well as from Larry Kessler, PhD, and Martin Brown, PhD, of the Applied Research Branch, Division of Cancer Prevention and Control, NCI; project coordination by Adelina Tseng, MBA; programming assistance from Raymond Cha andLaurenClarke;and word-processingby Shelly Hager and KimBirum.Theauthorsacknowledge the efforts of the following individuals in creating the linked SEER-Medicare data base used in this study: Arnold Potosky and Larry Kessler of the Surveillance Program of the Division of Cancer Prevention and Control, NCI; James Lubitz and Gerald Riley of the Office of Research and Demon- strations, and Ronald Prihoda, Edward Franey, and Rebecca Gruenberger of the Bureau of Data Management and Strategy, Health Care Financing Administration; staff of Information Manage- ment Services [IMS], Inc.; and the principal investigators and staff of the individual Surveillance Epidemiology and End Results [SEER] p ro gr am tumor registries. The research was supported by Contract NOlCN-05230 from the Division of Cancer Control of the NCI, National Institutes of Health. The computer program is available from the authors on request.
REFERENCES
1. Jacobs IJ, Oram DA. Potential screening tests for ovarian cancer. In: Sharp F, Mason WI’, Leake RE, eds. Ovarian Cancer. New York: WW Norton, 1990.
2. van Nagell JR, Higgins RV, Donaldson ES, et al. Transvaginal sonography as a screening method for ovarian cancer: a report of the first 1000 cases screened. Cancer 1990;65:573-577.
3. Skates SJ, Singer DE. Quantifying the potential benefit of CA 125 screening for ovarian cancer. 1 C/in E+&wzioZ 1991;44:365-380.
Efficiency in Ovarian Cancer Screening 269
4. Jacobs I, Stabile I, Bridges J, et al. Multimodal approach to screening for ovarian cancer. Lancet 1988;i:268-271.
5. Kramer BS, Gohagan J, Prorok PC, Smart C. A National Cancer Institute-sponsored screening trial for prostatic, lung, colorectal, and ovarian cancers. Cancer 1993;71: 589-593.
6. Ovarian Cancer: Screening, Treatment, and Follow-up. NIH Consensus Statement. 57 Apr 1994; 12[3]:1-30.
7. Miller BA, Ries LAG, Hankey BF, et al, eds. SEER Cancer Statistics Review. 1973-1991. National Cancer Institute, NIH Publication No. 942789, 1994.
8. Manual for Staging of Cancer. 2nd ed. American Joint Committee on Cancer, 1983.
9. Campbell S, Bhan V, Royston I’, Whitehead MI, Collins WI’. Transabdominal ultra- sound screening for early ovarian cancer. Br Med J 1989;299:1363-1367.
10. Boume T, Campbell S, Steer C, Whitehead MI, Collins WI’. Transvaginal color flow imaging; a possible new screening technique for ovarian cancer. B Med 1 1989;299:1367-1370.
11. Jacobs I. Screening for early ovarian cancer [letter to the editor]. Lancet 1988;ii:171.
12. Keatinge R. Transabdominal ultrasound screening for early ovarian cancer [letter to the editor]. Br Med J 1990;300: 193-194.
13. Dawson A. Transabdominal ultrasound screening for early ovarian cancer [letter to the editor]. Br Med j 1990;300:193-194.
14. van Nagell JR, Depriest I’, Puls L, et al. Ovarian cancer screening in asymptomatic postmenopausal women by transvaginal sonography. Cancer 1991,68[3]:458-462.
15. Jacobs I, Davies AI’, Bridges J, et al. Prevalence screening for ovarian cancer in post-menopausal women by CA 125 measurement and ultrasonography. Br Med 1 1993;306:1030-1034.
16. Bast RC, Siegal FP, Runowicz C, et al. Elevation of serum CA 125 prior to diagnosis of an epithelial ovarian carcinoma. Gynecol Oncol 1985;22:115120.
17. Zwimer M, Bieglmayer CH, Klapdor R, Kreienberg R, Luthgens M. An international proficiency study with the tumor marker CA 125. Int I Biol Markers 1990;5:55-60.
18. Zurawski VR, Sjovall K, Schoenfeld DA, et al. Prospective evaluation of serum CA 125 levels in a normal population, phase I: the specificities of single and serial determinations in testing for ovarian cancer. Gynecol Oncol 1990;36:299-305.
19. Zurawski VR, Orjaseter H, Andersen A, Jellum E. Elevated serum CA 125 levels prior to diagnosis of ovarian neoplasia: relevance for early detection of ovarian cancer. lnt ] Cancer 1988;42:677-680.
20. Einhorn N, Sjovall K, Schoenfeld DA, et al. Early detection of ovarian cancer using the CA 125 radioimmunoassay [RIA]. Proc Am Sot Clin Oncol 1990;9:157.
21. Maggino T, Sopracordevole F, Matarese M, Di Pasquale C, Tambuscio G. CA-125 serum level in the diagnosis of pelvic masses: comparison with other methods. Eur ] Gynarcol Oncol 1987;6:590-595.
22. Zurawski VR, Broderick S, Pickens P, Knapp RC, Bast RC. Serum CA 125 levels in a group of nonhospitalized women: relevance for the early detection of ovarian cancer. Obstef Gynecol 1987;69:606-611.
23. Bast RC, Knauf S, Epenetos A, et al. Coordinate elevation of serum markers in ovarian cancer but not in benign disease. Cancu 1991;68:175&1763.
24. Westoff C, Gollub E, Pate1 J, Rivera H, Bast R. CA 125 levels in menopausal women. Ol~tct Cynerol 1990;76:42%431.
25. Jacobs I, Bast RC Jr. The CA 125 tumor associated nntigtm: a review of the literature. Hlonnn Rtpmd 1989;4:1-12.
26. Baker SG. Heidenberger K. Choosing sample si/es tcj maximize expected health benclfits sublect to a constraint on total trial co\ts. Med DL’CIS Making 1989;9:14-25.

270 N. Urban et al
27. Detsky AS. Using cost-effectiveness analysis to improve the efficiency of allocating funds to clinical trials. Stat Med 1990;9:17%184.
28. Shwartz M. A mathematical model used to analyze breast cancer screening strategies. Operations Research 1978;26:937-955.
29. Shwartz M. Validation of a model of breast cancer screening: an outliner observation suggests the value of breast self-examinations. Med Decis Making 1992;12[3] :222-228.
30. Habbema JDF, Oortmarssen GJ, Lubbe JN, van der Maas PJ. The MISCAN simulation program for the evaluation of screening for disease. Biometrika 1984;20:79-93.
31. Urban N, Baker M. The Women’s Health Trial as an investment. Med Decis Mak- ing 1989;9:59-64.
32. Detsky AS. Using economic analysis to determine the resource consequences of choices made in planning clinical trials. j Chron Dis 1985;38:753-765.
33. Weinstein MC, Stason WB. Foundations of cost-effectiveness analysis for health and medical practice. N Erzgl y Med 1977;296:716-721.
34. Doubilet P, Weinstein MC, McNeil BJ. Use and misuse of the term “cost-effective” in medicine. N Engl J Med 1986;314:253-256.
35. Russell LB. Is Prevention Better Than Cure? Washington, DC: The Brookings Institu- tion, 1986.
36. Gauss 386 2.1, Aptech Systems Inc, Kent, WA, 1984-1991.
37. U.S. Department of Health and Human Services. PHS Centers for Disease Control. NCHS 1991. VitaI Statistics of the U.S. 2988 Vol. II Mortality, Part A, Table 14. Sect. 1, General Mortality, 7.
38. Woolas RI’, FengiJi X, Jacobs IJ, et al. Elevation of multiple serum markers in patients with stage I ovarian cancer. ] Nat Cancer Inst 1993;85:1748-1751.
39. Campbell S, Royston P, Bhan V, Whitehead MI, Collins WI’. Novel screening strate- gies for early ovarian cancer by transabdominal ultrasonography. Br ] Obstet & Gynaecol 1990;97:304-311.
40. Potosky AL, Riley GF, Lubitz JD, Mentnech RM, Kessler LG. Potential for cancer- related health services research using linked Medicare-tumor registry database. Med Care. 1993;31:732-748.
41. Etzioni R, Urban N. Estimating the costs attributable to a disease with application to ovarian cancer. I Clin Eyi 1996;49:95-103.
42. Keeler EB, Cretin S. Discounting of life-saving and other non-monetary effects. Mnnngmrnt Sci 1983;29:300-306.
43. Karlan BY, Raffel LJ, Crvcnkovic G. A multidisciplinary approach to the early detection of ovarian carcinoma: rationale, protocol, design, and early results. Am 1 Obs 6 Gyn 1993;169:494-501.
44. Snedecor GW, Co&ran WG. Statistical Methods Ames, Iowa: Iowa State Univ. Press, 1971.
45. Smith LH, Oi RH. Detection of malignant ovarian neoplasms: a review of the literature. II. laboratory detection. Obst b Gynecol Survey 1984;39:329-360.
46. Bast RC Jr, Klug TL, St. John E, et al. A radioimmunoassay using a monoclonal antibody to monitor the cclurse of epithelial ovarian cancer. N Engl J Med 1983;309:883-887.
47. Shwartz M. Estimates ot lead time and length bia> in a breast cancer screening program. Cnncer 1980;46:844-854.
48. Zurawski VR, Knapp RC, Emhorn N, et al. An initial analysis of preoperative serum CA 125 levels in patients with early stage ovarian carcinoma. Cynecol OllcoZ 1988;30:7-14.
49. Bast RC. Perspectives in the future of cancer marker>. Clir~ Cherr! 1993;39:2444-2451.