Enrichment analyses identify shared associations for 25 ...
93
ARTICLE Enrichment analyses identify shared associations for 25 quantitative traits in over 600,000 individuals from seven diverse ancestries Graphical abstract Authors Samuel Pattillo Smith, Sahar Shahamatdar, Wei Cheng, ..., Genevieve Wojcik, Lorin Crawford, Sohini Ramachandran Correspondence [email protected] Smith et al., 2022, The American Journal of Human Genetics 109, 871–884 May 5, 2022 Ó 2022 The Author(s). https://doi.org/10.1016/j.ajhg.2022.03.005 ll
-
Upload
khangminh22 -
Category
Documents
-
view
1 -
download
0
Transcript of Enrichment analyses identify shared associations for 25 ...

ARTICLE
Enrichment analyses identify shared associations for 25 quantitativetraits in over 600,000 individuals from seven diverse ancestries
Graphical abstract
Smith et al., 2022, The American Journal of Human Genetics 10May 5, 2022 � 2022 The Author(s).https://doi.org/10.1016/j.ajhg.2022.03.005
Authors
Samuel Pattillo Smith,
Sahar Shahamatdar, Wei Cheng, ...,
Genevieve Wojcik, Lorin Crawford,
Sohini Ramachandran
9, 871–884
ll

ARTICLE
Enrichment analyses identify shared associationsfor 25 quantitative traits in over 600,000individuals from seven diverse ancestries
Samuel Pattillo Smith,1,2 Sahar Shahamatdar,1,2 Wei Cheng,1,2 Selena Zhang,1 Joseph Paik,1 Misa Graff,3
Christopher Haiman,4 T.C. Matise,5 Kari E. North,3 Ulrike Peters,6 Eimear Kenny,7,8,9,10
Chris Gignoux,11 Genevieve Wojcik,12 Lorin Crawford,1,13,14,16 and Sohini Ramachandran1,2,15,16,*
Summary
Since 2005, genome-wide association (GWA) datasets have been largely biased toward sampling European ancestry individuals, and
recent studies have shown that GWA results estimated from self-identified European individuals are not transferable to non-European
individuals because of various confounding challenges. Here, we demonstrate that enrichment analyses that aggregate SNP-level asso-
ciation statistics at multiple genomic scales—from genes to genomic regions and pathways—have been underutilized in the GWA era
and can generate biologically interpretable hypotheses regarding the genetic basis of complex trait architecture. We illustrate examples
of the robust associations generated by enrichment analyses while studying 25 continuous traits assayed in 566,786 individuals from
seven diverse self-identified human ancestries in the UK Biobank and the Biobank Japan as well as 44,348 admixed individuals from
the PAGE consortium including cohorts of African American, Hispanic and Latin American, Native Hawaiian, and American Indian/
Alaska Native individuals. We identify 1,000 gene-level associations that are genome-wide significant in at least two ancestry cohorts
across these 25 traits as well as highly conserved pathway associations with triglyceride levels in European, East Asian, and Native Ha-
waiian cohorts.
Introduction
Over the past two decades, funding agencies and biobanks
around the world have made enormous investments to
generate large-scale datasets of genotypes, exomes, and
whole-genome sequences from diverse human ancestries
that are merged withmedical records and quantitative trait
measurements.1–8 However, analyses of such datasets are
usually limited to the application of standard genome-
wide association (GWA) SNP-level association analyses in
which SNPs are tested one-by-one for significant associa-
tion with a phenotype9–11 (Table 1). Yet, even in the largest
available multi-ancestry biobanks, GWA analyses fail to
offer a comprehensive view of genetic trait architecture
among human ancestries.
SNP-level GWA results are difficult to interpret across
multiple human ancestries because of a litany of con-
founding variables, including (1) ascertainment bias in
genotyping,2,5 (2) varying linkage disequilibrium (LD) pat-
terns,18,19 (3) variation in allele frequencies due to
different selective pressures and unique population his-
1Center for Computational Molecular Biology, Brown University, Providence, R
Brown University, Providence, RI 02912, USA; 3Department of Epidemiology4Department of Preventative Medicine, University of Southern California, Los
cataway, NJ 08854, USA; 6Public Health Sciences Division, Fred Hutchinson C
Health, Icahn School of Medicine at Mount Sinai, New York City, NY 10029, US
of Medicine at Mount Sinai, New York City, NY 10029, USA; 9Department of Me
USA; 10Department of Genetics and Genomic Sciences, Icahn School of Medici
Informatics and Personalized Medicine, University of Colorado, Denver, CO 80
more, MD 21287, USA; 13Department of Biostatistics, Brown University, Provi
02142, USA; 15Data Science Initiative, Brown University, Providence, RI 0291216These authors contributed equally
*Correspondence: [email protected]
https://doi.org/10.1016/j.ajhg.2022.03.005.
The Ame
� 2022 The Author(s). This is an open access article under the CC BY-NC-ND
tories,19–23 and (4) the effect of environmental factors on
phenotypic variation.24–27 These confounders and the
observed low transferability of GWA results across ances-
tries2,28,29 have generated an important call for increasing
GWA efforts focused on populations of diverse, non-Euro-
pean ancestry individuals.
We also note, as other studies have,6,30 that the GWA
SNP-level test of association is rarely applied to non-Euro-
pean ancestry individuals.31 There are two likely explana-
tions for leaving non-European ancestry individuals out
of analyses: (1) researchers are electing to not analyze
diverse cohorts because of a lack of statistical power and
concerns over other confounding variables (recently
covered in Ben-Eghan et al.30) or (2) the analyses of non-
European cohorts yield no genome-wide significant SNP-
level associations. In either case, valuable information is
being ignored in GWA studies or going unreported in re-
sulting publications.30–32 Even when diverse ancestries
are analyzed, GWA studies usually condition on GWA re-
sults identified with European ancestry cohorts to detect
and give validity to other SNP-level associations.6 While
I 02912, USA; 2Department of Ecology, Evolution, and Organismal Biology,
, University of North Carolina, Chapel Hill, Chapel Hill, NC 27599, USA;
Angeles, CA 90089, USA; 5Department of Genetics, Rutgers University, Pis-
ancer Research Center, Seattle, WA 98109, USA; 7The Center for Genomic
A; 8The Charles Bronfman Institute for PersonalizedMedicine, Icahn School
dicine, Icahn School of Medicine at Mount Sinai, New York City, NY 10029,
ne at Mount Sinai, New York City, NY 10029, USA; 11Division of Biomedical
204, USA; 12Department of Epidemiology, Johns Hopkins University, Balti-
dence, RI 02906, USA; 14Microsoft Research New England, Cambridge, MA
, USA
rican Journal of Human Genetics 109, 871–884, May 5, 2022 871
license (http://creativecommons.org/licenses/by-nc-nd/4.0/).

Table 1. The three genomic scales and corresponding association tests used in this study
Genomic scale Association test Model of genetic trait architecture Relevant example
SNPs standard univariate genome-wideassociation (GWA) test
the true mutation-level trait architecture isthe same for all individuals
many inflammatory bowel diseasemutations replicate across ancestries12
SNP-sets/genes gene-level association tests (e.g., gene-ε,13
SKAT14)core genes are the same across allancestries, with potentially varying causalSNPs
late-onset Alzheimer disease risk fromApoE4 allele is lower in African ancestryindividuals15
Pathways/networks
pathway enrichment and networkpropagation (e.g., Hierarchical HotNet,16
RSS17)
core genes differ across ancestries but areall in the same annotated pathway
skin pigmentation architecture in the samepathway differs between African andEuropean ancestry individuals2
The models of genetic trait architecture corresponding to each genomic scale and statistical method that have been previously invoked in the literature (includingrelevant examples cited in the last column). These nested genomic scales should routinely be leveraged in multi-ancestry GWA studies to generate biologicallyinterpretable hypotheses of trait architecture across ancestries.
this study design can also identify shared SNP-level associ-
ations in non-European ancestry cohorts that are under-
powered for applications of the standard GWA framework,
it will not identify ancestry-specific associations in non-Eu-
ropean ancestry cohorts. In our own analysis of abstracts of
publications between 2012 and 2020 with UK Biobank
data, we found that only 33 out of 166 studies (19.87%)
reported genome-wide significant associations in any
non-European ancestry cohort (Figures S1 and S2).
Focusing energy and resources on increasing GWA sample
sizes without intentional focus on sampling of non-Euro-
pean populations will thus likely perpetuate an already
troubling history of leaving non-European ancestry sam-
ples out of GWA analyses of large-scale biobanks such as
the UK Biobank.30 However, we note that non-European
ancestry GWA studies have—and will continue to have—
smaller sample sizes than existing and emerging Euro-
pean-ancestry GWA cohorts, limiting the precision of
effect size estimates in these studies. What has received
less attention than the need to improve GWA study design
is the potential of enrichment analyses to characterize ge-
netic trait architecture in multi-ancestry datasets while ac-
counting for variable statistical power to detect, estimate,
and replicate genetic associations among cohorts.
In this analysis, we illustrate that focusing solely on p
values from the standard GWA framework is insufficient
to capture the genetic architecture of complex traits. Spe-
cifically, we propose that expansion of association analyses
to the genomic scale of genes and pathways generates
robust and interpretable hypotheses about trait architec-
ture in multi-ancestry cohorts. We define enrichment ana-
lyses as testing whether a user-specified set of SNPs, such as
SNPs in a given gene or pathway, is enriched for trait asso-
ciations beyond what is expected by chance based on the
number of SNPs in the set and the LD structure among
SNPs in the set.13,17,33 These enrichment analyses can
2increase the power to detect associated genes through
the aggregation of SNPs of small effect (which explain
the majority of the heritability of most traits34,35). Mathie-
son36 recently highlighted the pattern of homogeneity of
direction of effect in multi-ancestry studies even when in-
dividual SNPs are not categorized as genome-wide signifi-
cant in multiple ancestries. Gene-level and pathway-level
872 The American Journal of Human Genetics 109, 871–884, May 5,
enrichment analyses can prioritize biological regions
where there is homogeneity in the direction of SNP-level
signals of association, generating biologically interpretable
hypotheses for the genetic architecture of complex traits in
multiple ancestry cohorts. Gene and pathway enrichment
analyses expand the existing opportunity for the charac-
terization of conserved genetic architecture across multiple
ancestries, or other partitions of samples in biobank data-
sets (e.g., by biological sex or age), through the identifica-
tion of biologically interpretable associations.
In this study of 25 quantitative traits and more than
600,000 diverse individuals from the UK Biobank (UKB),
BioBank Japan (BBJ), and the PAGE study data (Tables
S1–S10), we detail biological insights gained from the
application of gene and pathway level enrichment ana-
lyses to seven diverse ancestry cohorts. We perform genetic
association tests for SNPs, genes, and pathways across mul-
tiple ancestry groups with a trait of interest. We test for
significantly mutated subnetworks of genes by using
known protein-protein interaction networks and the Hier-
archical HotNet software.16 Enrichment analyses do not
require generating additional information beyond stan-
dard GWA inputs (or outputs for methods that take in
GWA summary statistics). We demonstrate that moving
beyond SNP-level associations allows for a biologically
comprehensive prioritization of shared and ancestry-spe-
cific mechanisms underlying genetic trait architecture.
Material and methods
Data overviewWe performed statistical tests of association at the SNP, gene, and
pathway level for 25 quantitative traits. These analyses were per-
formed on data from seven ancestry cohorts drawn from the UK
Biobank, BioBank Japan (BBJ), and PAGE consortia (Table S3).
The number of samples included in each ancestry cohort ranged
from 574 (American Indian/Alaska Native in the PAGE study
data) to 349,411 (European in UK Biobank). The number of
SNPs tested in each ancestry ranged from 578,320 (African in
the UK Biobank) to more than 12 million (African American in
the PAGE dataset). Full enumeration of the samples studied,
including sample size, and number of SNPs for each ancestry
cohort are given in Tables S1 and S5–S10. For an extensive
2022

description of each cohort from the three biobanks that we
analyze in this study, see the supplemental information.
SNP-level GWA analysesIn the European, African, and South Asian ancestry cohorts from
the UK Biobank, we performedGWA studies for each ancestry-trait
pair in order to test whether the same SNP or SNPs are associated
with a given quantitative trait in different ancestries. SNP-level
GWA effect sizes were calculated with plink and the –glm flag.37
Age, sex, and the first twenty principal components were included
as covariates for all traits analyzed.7 Principal-component analysis
was performed with flashpca 2.038 on a set of independent
markers derived separately for each ancestry cohort with the plink
command –indep-pairwise 100 10 0.1. Using these parameters,
–indep-pairwise removes all SNPs that have a pairwise correlation
above 0.1 within a 100 SNP window and then slides forward in in-
crements of ten SNPs genome wide. In the implementation of
gene-ε, we assume pruning highly correlated SNPs still accurately
captures the association signals identified in the standard GWA
framework.14,39 Summary statistics for the 25 quantitative traits
in the Biobank Japan, as well as available ancestry-trait pairs in
the PAGE study data, were then compared with the results from
the association analyses in the UK Biobank cohorts (same traits
as listed in Table S5). In each analysis of an ancestry-trait pair, a
separate Bonferroni-corrected significance threshold was calcu-
lated with the number of SNPs tested in that particular ancestry-
trait pair. We elected to use a Bonferroni-corrected significance
threshold to be conservative (compared to, say, an often-used
GWA significance threshold of 53 10�8; see Figure 1). We label a
given SNP association as replicating among cohorts if the esti-
mated effect size of that SNP surpasses the Bonferroni-corrected
significance threshold inmore than two ancestry cohorts analyzed
here (Figure 1 and Table S11). We believe that the use of a conser-
vative significance threshold, such as the Bonferroni correction,
helps to illustrate the statistical challenges faced bymulti-ancestry
GWA studies due to very imbalanced sample sizes.
To further analyze our ability to accurately estimate GWA SNP-
level effect sizes in each ancestry cohort given the imbalanced
sample sizes of the datasets we studied, we performed theoretical
power calculations across a range of values for both effect sizes
and minor allele frequencies as described in Sham and Purcell.9
In this framework, we selected absolute value of effect sizes to be
equal to 0.1, 0.5, and 1. We then performed power calculations
for each of these when paired with a minor allele frequency of
0.01, 0.1, 0.25, and 0.5. In Figure S3, we plot the power of the stan-
dard GWA framework to detect SNP-level associations between a
genotype and a quantitative trait of interest for sample sizes for
up to 30,000 individuals by using a standard GWA significance
threshold of 53 10�8.
Because multiple cohorts we analyzed (in particular the Amer-
ican Indian/Alaska Native and Native Hawaiian ancestry cohorts)
lack power to estimate effect sizes accurately under the theoretical
model described in Sham and Purcell,9 we also implemented two-
stage GWA studies with a less stringent test of replication for SNP-
level association signals. We used the European ancestry cohort as
a discovery cohort for genome-wide significant SNP-level associa-
tions for each trait, and we used each non-European ancestry
cohort as a validation cohort.We then calculated a nominal signif-
icance threshold for each trait as 0.05 divided by the number of
significant variants for each trait in the European cohort that
were tested in at least one other cohort. The corresponding nom-
The Ame
inal significance thresholds, number of SNPs that were significant
in the European ancestry cohort, and the number of SNPs that sur-
passed the nominal significance threshold in at least one other
ancestry cohort are given in Table S12. Replication counts and pro-
portions are illustrated in Figure S4 and the ranges of significant
effect sizes for each ancestry trait-pair are shown in Table S13.
Finally, for each variant that was significant with the two-stage
nominal threshold, we performed a variant-specific power calcula-
tion by using the marginal European-ancestry effect size and each
non-European ancestry cohort’s minor allele frequency and sam-
ple size with the method outlined in Sham and Purcell.9 The
maximumpower achieved by a variant in each cohort-trait pairing
is given in Table S14 and the number of variants with greater than
90% detection power are given in Table S15.
Gene-level association testsIn order to test aggregated sets of SNP-level GWA effect sizes for
enrichment of associated mutations with a given quantitative
trait, we applied gene-ε29 to each ancestry cohort we studied for
each trait of interest, resulting in 125 sets of gene-level association
statistics (Table S3). The gene-ε method takes two summary statis-
tics as input: (1) SNP-level GWA marginal effect size estimates bb
derived with ordinary least-squares and (2) an LD matrix S empir-
ically estimated from external data (e.g., directly from GWA study
genotype data, a matrix estimated from a population with similar
genomic ancestry to that of the samples analyzed in the GWA
study). It is well-known that SNP-level effect size estimates can
be inflated as a result of various correlation structures among
genome-wide genotypes. gene-ε uses its input bb to derive regular-
ized effect size estimates through elastic net penalized regression.
gene-ε uses the LD matrix S to test each gene for enrichment of
SNP-level associations beyond what is expected by chance (given
the number of SNPs in the gene and the LD among them), thereby
identifying genes that are enriched formutations associatedwith a
trait of interest.13,14,17,33,40,41
In practice, gene-ε and other enrichment analyses14,41,42 can be
applied to any user-specified set of genomic regions, such as regu-
latory elements, intergenic regions, or gene sets. These gene-level
enrichment analyses enable identification of traits in which ge-
netic architecture may be heterogeneous among individuals at
the SNP level across individuals by increasing sensitivity to iden-
tify interacting mutations of moderate effect on a given trait.
Applying gene-ε in multiple ancestry cohorts allows researchers
to further test whether genes associated (i.e., enriched for SNP-
level associations signals given the LDmatrix) with a trait of inter-
est are the same, or vary, across ancestries. gene-ε takes as input a
list of boundaries for all regions to be tested for enrichment of as-
sociations. In our study, we applied gene-ε to all genes and tran-
scriptional elements defined in Gusev et al.43 for human genome
build 19.
In our gene-level analysis, SNP arrays included both genotyped
and high-confidence imputed SNPs (information score R 0.8) for
each ancestry-trait pair. To compute the LDmatrix, we first pruned
highly linked SNPs so that the number of SNPs included for any
chromosome was less than 35,000 SNPs—the computational limit
of gene-ε due to the size of the LDmatrix—by using the plink com-
mand –indep-pairwise 100 10 0.5. For the UK Biobank European,
South Asian, and African ancestry cohorts, we then derived empir-
ical LD estimates between each pair of SNPs for each chromosome
in each cohort by using plink flag –r square applied to the empir-
ical genotype and high-confidence imputed data. We then used
rican Journal of Human Genetics 109, 871–884, May 5, 2022 873

A
C
B
D
Figure 1. Less stringent significancethresholds lead to a decrease in the pro-portion of replicated SNP-level associa-tions and an increase in the proportionof gene-level associations among ances-tries for each of the 25 traits analyzed(A) Proportion of all SNP-level Bonferroni-corrected genome-wide significant associa-tions in any ancestry that replicate in atleast one other ancestry is shown on thex axis (see Table S11 for ancestry-trait-spe-cific Bonferroni-corrected p value thresh-olds). On the y axis, we show the propor-tion of significant gene-level associationsthat were replicated for a given phenotypein at least two ancestries (see Table S16 forBonferroni-corrected significance thresh-olds for each ancestry-trait pair). The blackstars on the x- and y-axes represent themean proportion of replicates in SNP andgene analyses, respectively. C-reactive pro-tein (CRP) contains the greatest propor-tion of replicated SNP-level associationsof any of the phenotypes.(B) The x axis indicates the proportion ofSNP-level associations that surpass a nom-inal threshold of p value < 10�5 in at leastone ancestry cohort that replicate in atleast one other ancestry cohort. The yaxis indicates the proportion of gene-levelassociations that surpass a nominalthreshold of p value < 10�3 in at leastone ancestry cohort and replicate in atleast one other ancestry cohort. Nominalp value thresholds tend to decrease the
proportion of replicated SNP-level associations and tend to increase the proportion of replicated gene-level associations. The numberof unique SNPs and genes that replicated in each cohort is given in Figure S18.(C) The x axis indicates the proportion of SNP-level associations that surpass a nominal threshold of p value < 10�3 in at least oneancestry cohort that replicate in at least one other ancestry cohort. The y axis indicates the proportion of gene-level associations thatsurpass a nominal threshold of p value < 10�2 in at least one ancestry cohort and replicate in at least one other ancestry cohort. Thenumber of unique SNPs and genes that replicated in each cohort is given in Figure S19.(D) The x axis represents the proportion of variants that were significant in the European and at least one non-European ancestry cohortwith an alternative significant threshold defined as 0.05 divided by the number of significant European variant associations. The y axis isthe corresponding proportion of genes that were significant in at least one non-European ancestry cohort with the same threshold calcu-lation for genes. Note that the axes in (D) are different from one another and the axes of the other panels. As shown in panels (B), (C),and (D) nominal p value thresholds tend to decrease the proportion of replicated SNP-level associations and tend to increase the pro-portion of replicated gene-level associations. Expansion of three letter trait codes are given in Table S2 and a version of this plot withall trait names displayed as text is shown in Figure S17. Figure S17 shows the same set of plots with all traits represented as text.
the ancestry-specific SNP arrays to calculate 23,603 gene-level as-
sociation statistics for the European ancestry cohort, 23,671
gene-level association statistics for the South Asian ancestry
cohort, and 23,575 gene-level association statistics for the African
ancestry cohort.
To calculate gene-level association statistics with Biobank Japan
summary statistics, we first found the intersection between SNPs
included in the analysis of each trait and SNPs included in the
1000 Genomes Project phase 3 data for the sample of 93 individ-
uals from the Japanese in Tokyo (JPT) population. Note, this inter-
section was different among some traits, as the genotype data in
the Biobank Japan were from different studies, which in turn
used different genotyping arrays. We then pruned highly linked
markers for each trait separately by using the plink flag –indep-
pairwise 100 10 X where X was determined by finding the highest
possible value that led to the inclusion of less than 35,000 SNPs on
each chromosome for the trait. Because of the increased density of
SNPs with effect size estimates for height, X was set to prune more
conservatively at X¼ 0.15. For all other traits, X was set to 0.5. The
874 The American Journal of Human Genetics 109, 871–884, May 5,
number of regions for which a gene-ε gene-level association statis-
tic was calculated for each trait is given in Table S5.
GWA summary statistics for the five cohorts in the PAGE study
data were used as input to gene-ε for each available ancestry-trait
combination. The array of markers for each ancestry cohort in
the PAGE study data was pruned with plink flag –indep-pairwise
100 10 X. X was set to the maximum value in each ancestry that
ensured no chromosome contained more than 35,000 markers:
X was set to 0.05 for the African American cohort, 0.08 for the His-
panic and Latin American and American Indian and Alaska Native
(AIAN) cohorts, and 0.25 for the Native Hawaiian cohorts. Finally,
for each ancestry-trait combination, genes that passed the Bonfer-
roni-corrected p value (p ¼ 0.05/number of genes tested) were
labeled as ‘‘significant’’ throughout this study (see Table S16 for
specific thresholds).
We used LD estimates from reference panels for the ancestry co-
horts where genotype data was unavailable (BioBank Japan and
PAGE datasets). As discussed in other papers proposing enrich-
ment analyses,17,44 the discordance between GWA summary
2022

A
C
B
Figure 2. C-reactive protein is an exceptional trait where standard GWA analyses may be sufficient to identify shared genetic archi-tecture among ancestry cohorts(A) Manhattan plot for SNP-level associations with C-reactive protein levels. Ancestry-specific Bonferroni-corrected significance thresh-olds are shown with dashed horizontal gray lines and listed in Table S11. Note that the scale of the� log10-transformed p values on the yaxis is different for each ancestry for clarity.
(legend continued on next page)
The American Journal of Human Genetics 109, 871–884, May 5, 2022 875

statistics estimated from a large cohort and LD estimates from a
small reference panel may lead to increased false discovery rate
and power in the application of gene-ε. Finally, we additionally
show that gene-ε detects a large proportion of the same significant
genes in the European ancestry cohort with a more stringent r2
threshold of 0.1 (see Table S17).
Pathway analysis and network propagation using
Hierarchical HotNetWe tested for significantly mutated subnetworks of genes in each
ancestry-trait pair by using the method Hierarchical HotNet.16
Briefly, Hierarchical HotNet uses hierarchical clustering of scores
(such as gene-level association statistics41 or mutations in cancer ge-
nomes16,45) propagated on a protein-protein interaction network
that are enriched for trait associations beyond what is expected by
chance. The method enables identification of strongly connected
components in the network, which are interpretable as subnet-
works of interacting genes enriched for mutations associated with
a trait of interest. Unlike using annotated gene lists,46 network prop-
agation of association statistics enables identifying novel gene sets
underwriting complex traits as well as crosstalk between annotated
pathways. We identified subnetworks of interacting genes enriched
for associations with each trait of interest by using network propa-
gation of gene-ε gene-level association statistics as input to
Hierarchical HotNet.16 In this study, these gene scores were set
to � log10-transformed p values of gene-ε gene-level association
test statistics (see also Nakka et al.41,47). For each ancestry-trait com-
bination, we assigned p values of 1 to genes with p values greater
than 0.1 tomake the resulting networks both sparse andmore inter-
pretable (again see Nakka et al.41,47). In addition, ancestry-trait pairs
in which less than 25 genes produced gene-ε p values less than 0.1
were discarded as there were an insufficient number of gene-level
statistics to populate the protein-protein interaction networks.
We used three protein-protein interaction networks: Reacto-
meFI 2016,48 iRefIndex 15.0,49 and HINTþHI.50,51 For the Reacto-
meFI 2016 interaction network, interactions with confidence
scores less than 0.75 were discarded. The HINTþHI interaction
network consists of the combination of all interactions in HINT bi-
nary, HINT co-complex, and HuRI HI interaction networks.
We ran Hierarchical HotNet (103 permutations) on the thresh-
olded � log10-transformed gene-level p values for each ancestry-
trait combination. We restricted our further investigation to the
largest subnetwork identified in each significant ancestry-trait-
interaction network combination (p < 0.05).
Results
Multiple recent studies have interrogated the extent to
which SNP-level associations for a given trait replicate
(B) Manhattan plot of SNP-level associations around the CRP geneBoundaries of the CRP gene are shown with vertical dashed blackthe region. Black stars in the European, South Asian, and East Asiandated as contributing to serum levels of C-reactive protein.55,56
(C) Heatmap of Bonferroni-corrected significant genotyped SNPs replSNPs in the 1 MB region surrounding the CRP gene. Entries along ththe 1 MB region surrounding the CRP gene for each ancestry. The cociations replicated out of all possible replications in each ancestry pairconsidered). For example, the maximum number of genome-wide sigEast Asian is 25, and 20 replicate, resulting in the cell color denotinSNPs, is shown in Figure S20.
876 The American Journal of Human Genetics 109, 871–884, May 5,
across ancestries, both empirically and under a variety of
models (see Wojcik et al.,6 Durvasula and Lohmueller,28
Shi et al.,44 Carlson et al.,52 Liu et al.,12 Eyre-Walker,53
Shi et al.54). To extensively compare variant-level associa-
tions among the seven ancestry cohorts that we analyzed,
we first examined the number of genome-wide significant
SNP-level associations that replicated exactly on the basis
of chromosomal position and reference SNP cluster ID
(rsID) in multiple ancestries (see Figure S5A and
Figure S5C, with Bonferroni-corrected thresholds provided
in Table S11). Exact replication of at least one SNP-level as-
sociation across two or more ancestries occurs in all 25
traits that were studied. The C-reactive protein (CRP) trait
had the highest proportion of replicated SNP associations
in multiple ancestries, with 18.95% replicating with the
standard GWA framework in at least two ancestries, but
has a relatively low number of unique GWA significant
SNPs (2,734) when compared to other traits (Figure 1).
This is most likely because the genetic architecture of
CRP is sparse and highly conserved across ancestries, as is
shown in Figure 2. We note that the concordance of
genome-wide significant SNP-level association statistics
for CRP among five ancestry cohorts is exceptional. In
the other 24 traits we analyzed, we did not observe any
SNP-level replication among five cohorts. C-reactive pro-
tein, which is encoded by the gene of the same name
located on chromosome 1, is synthesized in the liver and
released into the bloodstream in response to inflamma-
tion. In our standard GWA analysis of SNP-level associa-
tion signal in each ancestry cohort with CRP, rs3091244
is genome-wide significant in a single ancestry cohort.
rs3091244 has been functionally validated as influencing
CRP levels55,56 and is linked to genome-wide significant
SNPs in the other two ancestries for which genotype data
are available. Interestingly, all GWA significant SNP-level
associations for CRP in the Native Hawaiian ancestry
cohort replicate in both the African American (PAGE)
and the Hispanic and Latin American cohorts (these three
cohorts were all genotyped on the same array).
In the other 24 traits, the proportion of genome-wide
SNP-level replications was below 10% (Figure 1A). For poly-
genic traits, replication of SNP-level GWA results is chal-
lenging to interpret considering the large number of
GWA significant associations for the trait overall. For
example, height contains the largest number of replicated
SNP-level associations in our multi-ancestry analysis—but
located on chromosome 1 for each ancestry (zoomed in from A).lines. All six ancestries contain genome-wide significant SNPs inplots represent rs3091244, a SNP that has been functionally vali-
icated between each pair of ancestries analyzed. Here, we focus one diagonal represent the total number of SNP-level associations inlor of each cell is proportional to the percentage of SNP-level asso-(i.e., theminimumof the diagonal entries between the pairs beingnificant SNPs that can possibly replicate between the Hispanic andg 80% replication. A similar matrix, computed including imputed
2022

these only represent 8.90% of all unique SNP-level associ-
ations with height discovered in any ancestry cohort. A
more comprehensive discussion of previously associated
SNPs is available for both height and CRP in the supple-
mental information. The number of SNPs that replicate
among cohorts vary by trait and, as a proportion of the to-
tal number of significant SNP-level association signals, is
typically less than 10% (Figure S5).
We also explored how varying the SNP-level significance
threshold for each ancestry cohort influences the replica-
tion of SNP-level associations by using the standard GWA
framework (Figures 1B and 1C). We performed power cal-
culations for a range of set effect sizes and minor allele fre-
quencies (according to the design and discussion in Sham
and Purcell9) to identify cohorts where GWA studies lack
power to identify associations with a nominal significance
threshold of 53 10�8. The two largest cohorts we studied
here, the European ancestry cohort and East Asian ancestry
cohort, are sufficiently large to identify true SNP associa-
tions regardless of choice of effect size or minor allele fre-
quency (Figure S3). Conversely, in the two smallest cohorts
we studied, the AIAN and Native Hawaiian cohorts, GWA
studies would lack power to detect true SNP associations
with either small effect ðb%0:1Þ sizes or low minor allele
frequencies (MAF < 0.05) (Figure S3).
We then applied a two-stage GWA study design with a
less stringent nominal significance threshold for replica-
tion in the non-European ancestry cohorts; the resulting
thresholds are shown in Table S12. The nominal signifi-
cance threshold was calculated as 0.05 divided by the num-
ber of Bonferroni-corrected significant SNPs in the Euro-
pean ancestry cohort that were tested in at least one
other ancestry cohort. Using the European ancestry cohort
for discovery of associations, we calculated the proportion
of associated SNPs that were nominally significant in at
least one non-European ancestry cohort (Figure 1D). As ex-
pected, the proportion of SNP-level replication increased
across all 25 traits that were studied (maximum percentage
of replication was 94.23% for Basophil count, 49 of 52
SNPs; minimum percentage of replication was 40.39% for
hemoglobin, 580 of 1,436 SNPs). Number and proportion
of replicated SNP-level associations with this framework
are shown in Figure S4. These results are in agreement
with our results from the application of two fine-mapping
methods, SuSiE17 and PESCA,44 to the SNP-level summary
statistics of the European and East Asian ancestry cohorts;
this analysis also indicated widespread homogeneity in di-
rection of effect among significant SNPs (described in the
supplemental information, Tables S18–S22).
Enrichment analyses aggregate SNP-level association sta-
tistics with predefined SNP sets, genes, and pathways to
identify regions of the genome enriched for trait associa-
tions beyond what is expected by chance. Published
enrichment analyses have demonstrated the ability to
identify trait associations that go unidentified with stan-
dard SNP-level GWA analysis.13,14,17,57–60 The standard
GWA method is known to have a high false discovery
The Ame
rate (FDR),61,62 which enrichment analyses can mitigate.
Our analyses in Figure S6 and Figure S7 illustrate that
two methods—regression with summary statistics
(RSS),17 a fully Bayesian method, and gene-ε29—control
FDR particularly well both in the presence and absence
of population structure. However, Figure S8 and Table
S23 illustrate that both GWA study and gene-ε are limited
by the sample size of the cohort of interest. Specifically,
when the sample size is set to 2,000 individuals, power is
low and FDRs are high for both the standard GWA frame-
work and gene-ε. Enrichment methods increase power
for identifying biologically interpretable trait associations
in studies with smaller sample sizes and with heterogenous
genetic architecture than do present-day GWA studies and
therefore can be particularly useful when analyzing multi-
ancestry genetic datasets with merged phenotype data. For
example, Nakka et al.41 identified an association between
ST3GAL3 and attention-deficit/hyperactivity disorder
(ADHD) by using methods that aggregated SNP-level sig-
nals across genes and networks. ADHD is a trait with heri-
tability estimates as high as 75% that had no known
genome-wide significant SNP-level associations at the
time; Nakka et al.41 studied genotype data from just
3,319 individuals with cases, 2,455 controls and 2,064
trios.63 A study by Demontis et al.64 later found a SNP-level
association in the ST3GAL3 gene but was only able to do so
with a cohort an order of magnitude larger (20,183 individ-
uals diagnosed with ADHD and 35,191 controls, totaling
55,374 individuals).
Because non-European GWA ancestry cohorts usually
have much smaller sample sizes compared to studies
with individuals of European ancestry, enrichment ana-
lyses offer a unique opportunity to boost statistical power
and identify biologically relevant genetic associations
with traits of interest by using multi-ancestry datasets. In
a simulation study with synthetic phenotypes generated
from the European and African ancestry cohorts in the
UK Biobank, we show that gene-ε is able to identify signif-
icantly associated genes even in smaller cohorts
(N ¼ 10;000 and N ¼ 4;967 in the European and African
ancestry cohorts, respectively) without the inflated FDR
that is often exhibited by the standard GWA framework
(Figures S9 and S10). Additionally, in these simulations,
gene-ε correctly identifies ‘‘causal’’ genes that are
commonly associated in both cohorts (Figures S11 and
S12). These simulations illustrate the utility of modeling
LD (and in the case of gene-ε, additionally shrinking in-
flated effect sizes) information to identify enrichment of
SNP-level associations in predefined SNP sets.
In an analysis performed by Ben-Eghan et al.30 on 45
studies analyzing UK Biobank data, the second most
commonly stated reason for omitting non-European co-
horts in applied GWA analyses was the lack of power for
identifying SNP-level GWA signals. We tested for gene-
level associations in each of the 25 complex traits in each
ancestry cohort for which we had data (Tables S1–Table
S10) and identified associations in genes and
rican Journal of Human Genetics 109, 871–884, May 5, 2022 877

transcriptional elements shared across ancestries for every
trait. All of our analyses discussed here used gene-ε (see per-
formance comparison with other enrichment analyses in
Cheng et al.13 and Figures S9–S12), an empirical Bayesian
approach that aggregates SNP-level GWA summary statis-
tics, where p values for each gene are derived by construct-
ing an empirical null distribution based on the eigenvalues
of a gene-specific partitioning of the LD matrix (for more
details, see Cheng et al.13). Our analyses show that several
hematological traits have a higher rate of significant gene-
level associations that replicate across multiple ancestry
cohorts than SNP-level associations that replicate across
ancestry cohorts (Figure 1B). These include platelet count
(PLC), mean corpuscular hemoglobin (MCH), mean
corpuscular hemoglobin concentration (MCHC), hemato-
crit, hemoglobin, mean corpuscular volume (MCV), red
blood cell count (RBC), and neutrophil count
(Figure S5F). Focusing on platelet count as an example,
we identify 65 genes that are significantly enriched for as-
sociations in multiple ancestries when tested with gene-ε
(see Table S16 for details on Bonferroni thresholds we
used to correct for the number of genes tested; Table S24
displays gene-ε for the shared significant genes in non-Eu-
ropean ancestry cohorts).13 Fifty-five of these genes are
significantly associated in both the European and East
Asian ancestry cohorts, and the remaining ten all replicate
in other pairs of ancestry cohorts. Overall, each of the six
ancestry cohorts in our analysis share at least one signifi-
cant gene with another ancestry cohort, as shown in
Figure S13. Our analysis of platelet count illustrates how
the implementation of gene-level enrichment analyses
can lead to the identification of shared elements of genetic
trait architecture among ancestry cohorts that would have
not been identified with the standard SNP-level GWA
framework alone. Additionally, gene-level enrichment an-
alyses yield statistically significant results that are biologi-
cally interpretable across ancestry cohorts even when sam-
ple sizes were highly variable.
Results from gene-level enrichment analyses can be
further propagated on protein-protein interaction net-
works to identify interacting genes enriched for association
signals.45 Often, studies use network propagation as a way
to incorporate information from multiple ‘‘omics’’ data-
bases in order to identify significantly mutated gene sub-
networks or modules contributing to a particular dis-
ease.65 An unexplored extension of network propagation
is how it can be used with multi-ancestry GWA datasets
to identify significantly mutated subnetworks that are
shared or ancestry specific.47
To conduct network propagation of gene-level associa-
tion results in our analyses, we applied the Hierarchical
HotNet method16 to gene-ε gene-level association statistics
for each trait-ancestry dataset. In Figure 3, we display the
significant (p value < 0:01) network results for triglyceride
levels in three ancestry cohorts: European, East Asian, and
Native Hawaiian (networks separated by ancestry are avail-
able in Figure S14). In both the European and East Asian
878 The American Journal of Human Genetics 109, 871–884, May 5,
cohorts, we identify enrichment of mutations in a highly
connected subnetwork of genes in the apolipoprotein fam-
ily. In addition, we identify a gene subnetwork enriched for
mutations in the East Asian and Native Hawaiian cohorts
that interacts with the significantly mutated subnetwork
identified in both the European and East Asian cohorts.
For instance, beta-secretase 1 (BACE1) is a genome-wide
significant gene-level association in the East Asian cohort
but does not contain SNPs previously associated with tri-
glycerides in any ancestry cohort in the GWAS Catalog.
BACE1 has gene-ε significant p values in both the East
Asian ancestry cohort (p ¼ 3.57 3 10�13) and European
ancestry cohort (p ¼ 5.55 3 10�17). BACE1 was significant
at the gene level but contained no previously associated
SNPs in any cohort in the GWAS Catalog. BACE1 plays a
role in the metabolism of amyloid beta precursor protein
and is known to play a role in amyloid precursor protein
(APP) metabolism.66 Additionally, both APOL1 and HBA1
were identified as significantly associated with triglycerides
via gene-ε in our analysis of the Native Hawaiian ancestry
cohort, and both genes were part of significant subnet-
works identified by Hierarchical HotNet in the European
and Native Hawaiian ancestry cohorts. It is important to
underscore that the results from the Native Hawaiian
ancestry cohort are based on a relatively small sample
size (N ¼ 1,915). While small sample size can increase
the FDR in the gene-ε (Figure S8), we highlight the net-
works identified as enriched for associations with triglycer-
ides in the Native Hawaiian ancestry cohort due to their
proximity and biological connection to the networks iden-
tified in the well-powered European and East Asian
ancestry cohorts. Furthermore, there were no variant-level
associations for triglyceride levels that were significant in
both the European and Native Hawaiian cohorts (Tables
S14 and S15). If analysis had stopped at the variant level,
the shared signal of association would have gone unidenti-
fied. Details on replicated SNP-level and gene-level associ-
ations among ancestries for triglyceride levels are shown
in Figure S15 and Figure S16, respectively. While the iden-
tification of these subnetworks is predicated on the use of
LD panels derived from 1000 Genomes populations as ref-
erences, we find widespread validation of SNP-level associ-
ations with triglyceride levels in many of the genes
included in the significant subnetworks (see GWAS Cata-
log results in Table S25 and gene-ε p values for each gene
included in the subnetwork in Table S26).
SNP-level and gene-level association results are further
discussed for both platelet count and triglyceride levels
in the supplemental information. Our results indicate
that network propagation methods, such as Hierarchical
HotNet, can identify subnetworks of genes on known pro-
tein-protein interaction networks that are enriched for sig-
nificant gene-level associations beyond what is expected
by chance. As is the case with triglyceride levels in the Eu-
ropean, East Asian, and Native Hawaiian cohorts analyzed
in this study, application of pathway enrichment analyses
offers the potential to identify subnetworks of interacting
2022

Figure 3. A subnetwork of apolipoprotein genes is significantly enriched for mutations in European, East Asian, and Native Hawaiianancestries associated with triglyceride levelsThe largest significantly altered subnetwork (p value< 0.05) for triglyceride levels contains overlapping gene subnetworks for each of theEuropean, East Asian, and Native Hawaiian ancestries when analyzed independently with Hierarchical HotNet.16 Each node in thenetwork represents a gene. The shading of each node indicates the statistical significance of the association of that gene with triglyceridelevels in a particular cohort. Two genes are connected if their protein products interact based on the ReactomeFI 201648 (European, EastAsian) or iRefIndex 15.049 (Native Hawaiian) protein-protein interaction networks. Several genes from the apolipoprotein gene familyare significantly associated with triglyceride levels in both the European and East Asian cohorts (see data and code availability). Addi-tionally, the interactions between them form a highly connected subnetwork. Smaller subnetworks identified in the Native Hawaiiancohort are distal modules that are connected to the subnetwork detected in the European cohort. Not all genes in the largest significantlyaltered subnetwork for the Native Hawaiian ancestry group are shown for visualization purposes (127 not pictured here). Genes thatcontain SNPs previously associated to triglyceride levels in a European cohort in the GWAS Catalog are indicated with y. Similarly, genesthat contain SNPs previously associated with triglyceride levels in a non-European cohort in the GWAS Catalog are indicated with z. Thestudies identifying these associations are given in Table S25.
genes that are enriched for gene-level association signals in
multiple ancestry cohorts.
Discussion
Many recent studies have proposed changes to multi-
ancestry GWA study design2,5,6,28,30–32,67–69. In this anal-
ysis, we have focused on the potential of methods to in-
crease the insight gained into complex trait architecture
from multi-ancestry GWA datasets via the generation of
biologically interpretable hypotheses. We demonstrate
the potential gains of moving beyond standard SNP-level
GWA analysis by using 25 quantitative complex traits
among seven human ancestry cohorts in three large bio-
banks: BioBank Japan, the UK Biobank, and the PAGE con-
sortium database (Tables S1–S10). Ultimately, we believe
that studying complex traits demands analysis across mul-
tiple genomic scales and ancestries in order to gain biolog-
ical insight into complex trait architecture and ultimately
achieve personalized medicine.
As has been previously noted,5,31 non-European
ancestry cohorts are often excluded from GWA analyses
of multi-ancestry biobanks; complementing the analyses
of Ben-Eghan et al.,30 we find that 80.13% of UK Biobank
studies over the last 9 years only report significant SNP-
level associations in the white British cohort (Figures S1
and S2), despite the tens of thousands of individuals of
non-European ancestry sampled in that dataset. Unless
this practice is curbed by the biomedical research commu-
nity, it will exacerbate already existing disparities in
The Ame
healthcare across diverse communities. There are un-
doubted benefits from increased sampling in a given
ancestry for association mapping with the standard GWA
framework, but it is still unknown the extent to which re-
sults from larger GWA and fine-mapping studies using Eu-
ropean-ancestry genomes will generalize to the entire hu-
man population.2,26
As long as sample sizes of non-European ancestry co-
horts in GWA studies remain relatively small, researchers
tend to not analyze these data fully, making it imperative
to consider alternative tests to the standard GWA frame-
work in order to fully leverage the data available for study-
ing the genetic basis of human complex traits. Two-stage
GWA studies with nominal significance thresholds in repli-
cation cohorts offer one approach for identifying repli-
cated associations. In addition, application of multi-
ancestry fine-mapping methods such as PESCA44 support
the results of recent analyses from Mathieson36 that even
when SNP-level significance is not observed in multiple
ancestry cohorts, the direction of effect is generally the
same. These methods continue to rely on the statistical
detection of association from individual SNPs. Given that
multi-ancestry biobank datasets have variable power to
detect SNP-level associations given differences in sample
size and minor allele frequencies across cohorts
(Figure S3), many researchers simply ignore non-European
ancestry samples in GWA studies,(2,5,6,30) potentially
perpetuating health disparities and limiting our under-
standing of the genetic basis of complex traits and any
heterogeneity in genetic trait architecture.44,47 For these
reasons, we strongly recommend drawing on enrichment
rican Journal of Human Genetics 109, 871–884, May 5, 2022 879

analyses to study genetic associations with a trait of inter-
est, as enrichment analyses offer the opportunity for
generating interpretable hypotheses regarding the shared
biological mechanisms underwriting complex traits by us-
ing large-scale multi-ancestry datasets with variable sample
sizes. Enrichment analyses offer a biologically interpret-
able way of boosting power to detect genetic architecture
without alterations to the original design of a study.
There are multiple other technical considerations for con-
ducting multi-ancestry association analyses that we do not
consider here, which future studies may explore further in
the context of SNP-level association studies and enrichment
analyses. First, because we are analyzing some datasets for
which we did not have access to genotype data (BioBank
Japan and PAGE study data), we relied on reference panels
to estimate LD, which is not ideal for enrichment analyses
(as has been explored by Zhu and Stephens,17 Shi et al.44).
While we draw on the published literature to validate our
findings of shared genetic architecture underlying the com-
plex traits studied here (Table S25), our pipelines highlight
the importance of managed access to individual-level geno-
type data for gaining insight into the genetic basis of com-
plex traits. Second, we have not addressed the downstream
consequences of using self-identified ancestry to define co-
horts in large-scale GWA studies (but see Willer et al.,70 Lin
et al.,71 Yang et al.,72 Urbut et al.73). Third, each sample we
analyzed has also experienced environmental exposures
thatmay influence the statistical detection of genetic associ-
ations, and some of those environmental exposures may be
correlated with genomic ancestry.19,74–76 Interrogation of
the influence of gene by environment interactions on com-
plex traitsmustbedonewithhighly controlled experiments,
which can in turn help prioritize traits in which association
studieswill be interpretable anduseful. Lastly,weunderscore
that increasing sample size in GWA studies alone will not
resolve these fundamental biological questions: the propor-
tion of phenotypic variance explained by associations
discovered as sample sizes increase in GWA studies has
largely reacheddiminishing returns,42 andgene-by-environ-
ment interactions are increasingly influential, and esti-
mable, in large biobanks with cryptic relatedness.77,78
Many recentmethodological advances that leverageGWA
summary statistics have focused on testing the co-localiza-
tion of causal SNPs (e.g., fine mapping79–82), the non-addi-
tive effects of SNP-level interactions (i.e., epistasis83,84), and
multivariate GWA tests.73,84–86 While these methods can
be extended and applied to multi-ancestry GWA analyses,
they still focus on SNP-level signals of genetic trait architec-
ture (see also Brown et al.,87 Galinsky et al.88). Unlike the
traditional GWAmethod, enrichment analyses increase sta-
tistical power by aggregating SNP-level signals of genetic as-
sociations and allowing for genetic heterogeneity in SNP-
level trait architecture across samples as well as offering the
opportunity for immediate insights into trait architecture
with existing datasets. These methods have been compara-
tivelyunderused inmulti-ancestryGWAstudies.Application
of enrichmentmethods to small cohorts is prone to the same
880 The American Journal of Human Genetics 109, 871–884, May 5,
statistical limitations as the standard GWA framework,
namely, less power to detect true associations and elevated
false positive rates when applied to small sample sizes
(Figure S8, Table S23). However, enrichment of associations
can be assessed at multiple biological scales—genes, gene
sets, and networks—thereby allowing for biologically
informed insight into trait architecture when small sample
sizes are studied inconjunctionwithbetter powered cohorts,
generating targeted hypotheses for biological validation.
Thus, comparison of results from enrichment analyses offer
the opportunity to identify therapeutic targets in ancestries
where sample sizes are limited.
While many studies note that differences in LD
across ancestries affect transferability of effect size esti-
mates,6,52,89–91 recent studies in population genetics have
additionally debated how various selection pressures and
genetic drift may hamper transferability of GWA
results across ancestries (see for example, Edge and Rosen-
berg,21,22 Novembre and Barton,24 Harpak and Przewor-
ski,26 Durvasula and Lohmueller,28 Mostafavi et al.29).
Future GWA studies should be coupled with approaches
from studies of how evolutionary processes shape the ge-
netic architecture of complex traits.26,34,53,92
Two open questionsmust be tackled when studying com-
plex trait architecture in the multi-ancestry biobank era: (1)
to what extent is the true genetic trait architecture (causal
SNPs and/or their effects on a trait of interest) heteroge-
neous across cohorts6,93 and (2) which components of
GWA results (e.g., p values, estimated effect size, direction
of effect sizes) are transferable across ancestries at any
genomic scale? Continued application of the standard
SNP-level GWA approach will not answer these questions.
However, enrichment methods that aggregate SNP-level ef-
fects, test for effect size heterogeneity, and leverage genomic
annotations and gene interaction networks offer opportu-
nities to directly test these fundamental questions. Methods
can and should play an important role as biomedical
research shifts current paradigms to extend the benefits of
personalizedmedicine beyond people of European ancestry.
Additionally, biomedical researchers should continue to
pressure both funding agencies and institutions to diversify
their sampling efforts in the name of inclusion and address-
ing—instead of exacerbating—genomic health disparities.
In addition to those efforts, we believe existing and new
methods can increase the return on investment in multi-
ancestry biobanks, ensure that every bit of information
from these datasets is studied, and prioritize biological
mechanism above SNP-level statistical association signals
by identifying associations that are robust across ancestries.
Data and code availability
All scripts and publicly available data from GWA, gene,
and pathway association tests are available at https://github.
com/ramachandran-lab/multiancestry_enrichment. Results from
PESCA analyses were provided through personal correspondence
by Huwenbo Shi.
2022

Supplemental information
Supplemental information can be found online at https://doi.org/
10.1016/j.ajhg.2022.03.005.
Acknowledgments
We thank Kirk Lohmueller and Alicia R. Martin for helpful com-
ments on an earlier version of this manuscript as well as the Craw-
ford and Ramachandran Labs for helpful discussions. This research
was conducted in part with computational resources and services
at the Center for Computation and Visualization at BrownUniver-
sity as well as with the UK Biobank Resource under application
number 22419. The Population Architecture Using Genomics
and Epidemiology (PAGE) program is funded by the National Hu-
man Genome Research Institute (NHGRI) with co-funding from
the National Institute on Minority Health and Health Disparities
(NIMHD). The WHI program is funded by the National Heart,
Lung, and Blood Institute, National Institutes of Health, U.S.
Department of Health and Human Services through contracts
75N92021D00001, 75N92021D00002, 75N92021D00003, 75N9
2021D00004, and 75N92021D00005. The HCHS/SOL study was
carried out as a collaborative study supported by contracts from
the National Heart, Lung and Blood Institute (NHLBI) to the Uni-
versity of North Carolina (N01-HC65233), University of Miami
(N01-HC65234), Albert Einstein College of Medicine (N01-
HC65235), Northwestern University (N01-HC65236), and San
Diego State University (N01-HC65237). S.P.S. was a trainee sup-
ported under the Brown University Predoctoral Training Program
in Biological Data Science (NIH T32 GM128596). L.C. acknowl-
edges the support of an Alfred P. Sloan Research Fellowship and
a David & Lucile Packard Fellowship for Science and Engineering.
This work was also supported by US National Institutes of Health
R01 GM118652 and National Institutes of Health R35 GM139628
to S.R. S.R. acknowledges additional support from National Sci-
ence Foundation CAREER Award DBI-1452622.
Declaration of interests
C.G. owns stock in 23andMe. E.K. and C.G. aremembers of the sci-
entific advisory board for Encompass Bioscience. E.K. consults for
Illumina.
Received: November 1, 2021
Accepted: March 2, 2022
Published: March 28, 2022
Web resources
gene-ε, https://github.com/ramachandran-lab/genee
Hierarchical HotNet, https://github.com/raphael-group/hierarchical-
hotnet
PESCA, https://github.com/huwenboshi/pesca
RSS, https://github.com/stephenslab/rss
References
1. Nagai, A., Hirata, M., Kamatani, Y., Muto, K., Matsuda, K.,
Kiyohara, Y., Ninomiya, T., Tamakoshi, A., Yamagata, Z.,
Mushiroda, T., et al.; BioBank Japan Cooperative Hospital
Group (2017). Overview of the BioBank Japan Project: Study
design and profile. J. Epidemiol. 27 (3S), S2–S8.
The Ame
2. Martin, A.R., Gignoux, C.R., Walters, R.K., Wojcik, G.L., Neale,
B.M., Gravel, S., Daly, M.J., Bustamante, C.D., and Kenny, E.E.
(2017). Human demographic history impacts genetic risk pre-
diction across diverse populations. Am. J. Hum. Genet. 100,
635–649.
3. Sankar, P.L., and Parker, L.S. (2017). The PrecisionMedicine Ini-
tiative’s All of Us Research Program: an agenda for research on
its ethical, legal, and social issues. Genet. Med. 19, 743–750.
4. Bycroft, C., Freeman, C., Petkova, D., Band, G., Elliott, L.T.,
Sharp, K., Motyer, A., Vukcevic, D., Delaneau, O., O’Connell,
J., et al. (2018). The UK Biobank resource with deep phenotyp-
ing and genomic data. Nature 562, 203–209.
5. Martin, A.R., Kanai, M., Kamatani, Y., Okada, Y., Neale, B.M.,
and Daly, M.J. (2019). Clinical use of current polygenic risk
scores may exacerbate health disparities. Nat. Genet. 51, 584–
591.
6. Wojcik, G.L., Graff, M., Nishimura, K.K., Tao, R., Haessler, J.,
Gignoux, C.R., Highland, H.M., Patel, Y.M., Sorokin, E.P., Av-
ery, C.L., et al. (2019). Genetic analyses of diverse populations
improves discovery for complex traits. Nature 570, 514–518.
7. Sohail, M., Maier, R.M., Ganna, A., Bloemendal, A., Martin,
A.R., Turchin, M.C., Chiang, C.W., Hirschhorn, J., Daly, M.J.,
Patterson, N., et al. (2019). Polygenic adaptation on height
is overestimated due to uncorrected stratification in genome-
wide association studies. eLife 8, e39702.
8. Berg, J.J., Harpak, A., Sinnott-Armstrong, N., Joergensen, A.M.,
Mostafavi, H., Field, Y., Boyle, E.A., Zhang, X., Racimo, F.,
Pritchard, J.K., and Coop, G. (2019). Reduced signal for poly-
genic adaptation of height in UK Biobank. eLife 8, e39725.
9. Sham, P.C., and Purcell, S.M. (2014). Statistical power and sig-
nificance testing in large-scale genetic studies. Nat. Rev. Genet.
15, 335–346.
10. Price, A.L., Spencer, C.C.A., and Donnelly, P. (2015). Progress
and promise in understanding the genetic basis of common
diseases. Proc. Biol. Sci. 282, 20151684.
11. Visscher, P.M., Wray, N.R., Zhang, Q., Sklar, P., McCarthy,
M.I., Brown, M.A., and Yang, J. (2017). 10 years of gwas dis-
covery: biology, function, and translation. Am. J. Hum.
Genet. 101, 5–22.
12. Liu, J.Z., van Sommeren, S., Huang, H., Ng, S.C., Alberts, R.,
Takahashi, A., Ripke, S., Lee, J.C., Jostins, L., Shah, T., et al.; In-
ternational Multiple Sclerosis Genetics Consortium; and In-
ternational IBD Genetics Consortium (2015). Association an-
alyses identify 38 susceptibility loci for inflammatory bowel
disease and highlight shared genetic risk across populations.
Nat. Genet. 47, 979–986.
13. Cheng, W., Ramachandran, S., and Crawford, L. (2020). Esti-
mation of non-null SNP effect size distributions enables the
detection of enriched genes underlying complex traits. PLoS
Genet. 16, e1008855.
14. Wu, M.C., Lee, S., Cai, T., Li, Y., Boehnke, M., and Lin, X.
(2011). Rare-variant association testing for sequencing data
with the sequence kernel association test. Am. J. Hum. Genet.
89, 82–93.
15. Rajabli, F., Feliciano, B.E., Celis, K., Hamilton-Nelson, K.L.,
Whitehead, P.L., Adams, L.D., Bussies, P.L., Manrique, C.P., Ro-
driguez, A., Rodriguez, V., et al. (2018). Ancestral origin of
ApoE ε4 Alzheimer disease risk in Puerto Rican and African
American populations. PLoS Genet. 14, e1007791.
16. Reyna, M.A., Leiserson, M.D.M., and Raphael, B.J. (2018). Hi-
erarchical HotNet: identifying hierarchies of altered subnet-
works. Bioinformatics 34, i972–i980.
rican Journal of Human Genetics 109, 871–884, May 5, 2022 881

17. Zhu, X., and Stephens, M. (2017). Bayesian large-scale multi-
ple regression with summary statistics from genome-wide as-
sociation studies. Ann. Appl. Stat. 11, 1561–1592.
18. Pritchard, J.K., and Przeworski, M. (2001). Linkage disequilib-
rium in humans: models and data. Am. J. Hum. Genet. 69, 1–
14.
19. Berg, J.J., and Coop, G. (2014). A population genetic signal of
polygenic adaptation. PLoS Genet. 10, e1004412.
20. Jakobsson, M., Edge, M.D., and Rosenberg, N.A. (2013). The
relationship between F(ST) and the frequency of the most
frequent allele. Genetics 193, 515–528.
21. Edge, M.D., and Rosenberg, N.A. (2014). Upper bounds on FST
in terms of the frequency of the most frequent allele and total
homozygosity: the case of a specified number of alleles. Theor.
Popul. Biol. 97, 20–34.
22. Edge, M.D., and Rosenberg, N.A. (2015). A general model of
the relationship between the apportionment of human ge-
netic diversity and the apportionment of human phenotypic
diversity. Hum. Biol. 87, 313–337.
23. Hormozdiari, F., Zhu, A., Kichaev, G., Ju, C.J., Segre, A.V., Joo,
J.W.J., Won, H., Sankararaman, S., Pasaniuc, B., Shifman, S.,
and Eskin, E. (2017). Widespread allelic heterogeneity in com-
plex traits. Am. J. Hum. Genet. 100, 789–802.
24. Novembre, J., and Barton, N.H. (2018). Tread lightly interpret-
ing polygenic tests of selection. Genetics 208, 1351–1355.
25. Rosenberg, N.A., Edge, M.D., Pritchard, J.K., and Feldman,
M.W. (2018). Interpreting polygenic scores, polygenic adapta-
tion, and human phenotypic differences. Evol. Med. Public
Health 2019, 26–34.
26. Harpak, A., and Przeworski, M. (2021). The evolution of group
differences in changing environments. PLoS Biol. 19,
e3001072.
27. Pereira, L., Mutesa, L., Tindana, P., and Ramsay, M. (2021). Af-
rican genetic diversity and adaptation inform a precisionmed-
icine agenda. Nat. Rev. Genet. 22, 284–306.
28. Durvasula, A., and Lohmueller, K.E. (2021). Negative selection
on complex traits limits phenotype prediction accuracy be-
tween populations. Am. J. Hum. Genet. 108, 620–631.
29. Mostafavi, H., Harpak, A., Agarwal, I., Conley, D., Pritchard,
J.K., and Przeworski, M. (2020). Variable prediction accuracy
of polygenic scores within an ancestry group. eLife 9,
e48376.
30. Ben-Eghan, C., Sun, R., Hleap, J.S., Diaz-Papkovich, A.,
Munter, H.M., Grant, A.V., Dupras, C., and Gravel, S. (2020).
Don’t ignore genetic data from minority populations. Nature
585, 184–186.
31. Popejoy, A.B., and Fullerton, S.M. (2016). Genomics is failing
on diversity. Nature 538, 161–164.
32. Bustamante, C.D., Burchard, E.G., and De la Vega, F.M. (2011).
Genomics for the world. Nature 475, 163–165.
33. Zhu, X., and Stephens, M. (2018). Large-scale genome-wide
enrichment analyses identify new trait-associated genes and
pathways across 31 human phenotypes. Nat. Commun. 9,
4361.
34. Boyle, E.A., Li, Y.I., and Pritchard, J.K. (2017). An expanded
view of complex traits: from polygenic to omnigenic. Cell
169, 1177–1186.
35. Sinnott-Armstrong, N., Naqvi, S., Rivas, M., and Pritchard, J.K.
(2021). GWAS of three molecular traits highlights core genes
and pathways alongside a highly polygenic background. eLife
10, e58615.
882 The American Journal of Human Genetics 109, 871–884, May 5,
36. Mathieson, I. (2021). The omnigenic model and polygenic
prediction of complex traits. Am. J. Hum. Genet. 108, 1558–
1563.
37. Chang, C.C., Chow, C.C., Tellier, L.C., Vattikuti, S., Purcell,
S.M., and Lee, J.J. (2015). Second-generation PLINK: rising to
the challenge of larger and richer datasets. Gigascience 4, 7.
38. Abraham, G., Qiu, Y., and Inouye, M. (2017). FlashPCA2: prin-
cipal component analysis of Biobank-scale genotype datasets.
Bioinformatics 33, 2776–2778.
39. Bulik-Sullivan, B.K., Loh, P.R., Finucane, H.K., Ripke, S., Yang,
J., Patterson, N., Daly, M.J., Price, A.L., Neale, B.M.; and
Schizophrenia Working Group of the Psychiatric Genomics
Consortium (2015). LD Score regression distinguishes con-
founding from polygenicity in genome-wide association
studies. Nat. Genet. 47, 291–295.
40. Wu, M.C., Kraft, P., Epstein, M.P., Taylor, D.M., Chanock, S.J.,
Hunter, D.J., and Lin, X. (2010). Powerful SNP-set analysis for
case-control genome-wide association studies. Am. J. Hum.
Genet. 86, 929–942.
41. Nakka, P., Raphael, B.J., and Ramachandran, S. (2016). Gene
and network analysis of common variants reveals novel asso-
ciations in multiple complex diseases. Genetics 204, 783–798.
42. Zhang, Y., Qi, G., Park, J.H., and Chatterjee, N. (2018). Estima-
tion of complex effect-size distributions using summary-level
statistics from genome-wide association studies across 32
complex traits. Nat. Genet. 50, 1318–1326.
43. Gusev, A., Ko, A., Shi, H., Bhatia, G., Chung, W., Penninx,
B.W., Jansen, R., de Geus, E.J., Boomsma, D.I., Wright, F.A.,
et al. (2016). Integrative approaches for large-scale transcrip-
tome-wide association studies. Nat. Genet. 48, 245–252.
44. Shi, H., Burch, K.S., Johnson, R., Freund, M.K., Kichaev, G.,
Mancuso, N., Manuel, A.M., Dong, N., and Pasaniuc, B.
(2020). Localizing Components of Shared Transethnic Ge-
netic Architecture of Complex Traits from GWAS Summary
Data. Am. J. Hum. Genet. 106, 805–817.
45. Leiserson, M.D., Vandin, F., Wu, H.-T., Dobson, J.R., and
Raphael, B.R. (2014). Pan-cancer identification of mutated
pathways and protein complexes. Cancer Res. 74, 5324.
46. Subramanian, A., Tamayo, P., Mootha, V.K., Mukherjee, S.,
Ebert, B.L., Gillette, M.A., Paulovich, A., Pomeroy, S.L., Golub,
T.R., Lander, E.S., and Mesirov, J.P. (2005). Gene set enrich-
ment analysis: a knowledge-based approach for interpreting
genome-wide expression profiles. Proc. Natl. Acad. Sci. USA
102, 15545–15550.
47. Nakka, P., Archer, N.P., Xu, H., Lupo, P.J., Raphael, B.J., Yang,
J.J., and Ramachandran, S. (2017). Novel gene and network as-
sociations found for acute lymphoblastic leukemia using case–
control and family-based studies in multiethnic populations.
Cancer Epidemiol. Biomarkers Prev. 26, 1531–1539.
48. Fabregat, A., Sidiropoulos, K., Garapati, P., Gillespie, M., Haus-
mann, K., Haw, R., Jassal, B., Jupe, S., Korninger, F., McKay, S.,
et al. (2016). The reactome pathway knowledgebase. Nucleic
Acids Res. 44 (D1), D481–D487.
49. Razick, S., Magklaras, G., and Donaldson, I.M. (2008). iRefIn-
dex: a consolidated protein interaction database with prove-
nance. BMC Bioinformatics 9, 405.
50. Das, J., and Yu, H. (2012). HINT: High-quality protein interac-
tomes and their applications in understanding human dis-
ease. BMC Syst. Biol. 6, 92.
51. Rolland, T., Tasan, M., Charloteaux, B., Pevzner, S.J., Zhong,
Q., Sahni, N., Yi, S., Lemmens, I., Fontanillo, C., Mosca, R.,
2022

et al. (2014). A proteome-scale map of the human interactome
network. Cell 159, 1212–1226.
52. Carlson, C.S., Matise, T.C., North, K.E., Haiman, C.A., Fesin-
meyer, M.D., Buyske, S., Schumacher, F.R., Peters, U., France-
schini, N., Ritchie, M.D., et al.; PAGE Consortium (2013).
Generalization and dilution of association results from Euro-
pean GWAS in populations of non-European ancestry: the
PAGE study. PLoS Biol. 11, e1001661.
53. Eyre-Walker, A. (2010). Evolution in health and medicine
Sackler colloquium: Genetic architecture of a complex trait
and its implications for fitness and genome-wide association
studies. Proc. Natl. Acad. Sci. USA 107 (Suppl 1 ), 1752–1756.
54. Shi, H., Gazal, S., Kanai, M., Koch, E.M., Schoech, A.P., Sie-
wert, K.M., Kim, S.S., Luo, Y., Amariuta, T., Huang, H., et al.
(2021). Population-specific causal disease effect sizes in func-
tionally important regions impacted by selection. Nat. Com-
mun. 12, 1098.
55. Szalai, A.J., Wu, J., Lange, E.M., McCrory, M.A., Langefeld,
C.D., Williams, A., Zakharkin, S.O., George, V., Allison, D.B.,
Cooper, G.S., et al. (2005). Single-nucleotide polymorphisms
in the C-reactive protein (CRP) gene promoter that affect tran-
scription factor binding, alter transcriptional activity, and
associate with differences in baseline serum CRP level.
J. Mol. Med. (Berl.) 83, 440–447.
56. Zhang, S.-C., Wang, M.-Y., Feng, J.-R., Chang, Y., Ji, S.-R., and
Wu, Y. (2020). Reversible promoter methylation determines
fluctuating expression of acute phase proteins. eLife 9, e51317.
57. Browning, B.L., and Browning, S.R. (2007). Efficient multilo-
cus association testing for whole genome association studies
using localized haplotype clustering. Genet. Epidemiol. 31,
365–375.
58. Liu, J.Z., McRae, A.F., Nyholt, D.R., Medland, S.E., Wray, N.R.,
Brown, K.M., Hayward, N.K., Montgomery, G.W., Visscher,
P.M., Martin, N.G., Macgregor, S.; and AMFS Investigators
(2010). A versatile gene-based test for genome-wide associa-
tion studies. Am. J. Hum. Genet. 87, 139–145.
59. de Leeuw, C.A., Mooij, J.M., Heskes, T., and Posthuma, D.
(2015). MAGMA: generalized gene-set analysis of GWAS
data. PLoS Comput. Biol. 11, e1004219.
60. Zhang, Q.S., Browning, B.L., and Browning, S.R. (2015).
Genome-wide haplotypic testing in a Finnish cohort identifies
a novel association with low-density lipoprotein cholesterol.
Eur. J. Hum. Genet. 23, 672–677.
61. Storey, J.D., and Tibshirani, R. (2003). Statistical significance
for genomewide studies. Proc. Natl. Acad. Sci. USA 100,
9440–9445.
62. Stephens, M. (2017). False discovery rates: a new deal. Biosta-
tistics 18, 275–294.
63. Neale, B.M., Medland, S.E., Ripke, S., Asherson, P., Franke, B.,
Lesch, K.P., Faraone, S.V., Nguyen, T.T., Schafer, H., Holmans,
P., et al.; Psychiatric GWAS Consortium: ADHD Subgroup
(2010). Meta-analysis of genome-wide association studies of
attention-deficit/hyperactivity disorder. J. Am. Acad. Child
Adolesc. Psychiatry 49, 884–897.
64. Demontis, D., Walters, R.K., Martin, J., Mattheisen, M., Als,
T.D., Agerbo, E., Baldursson, G., Belliveau, R., Bybjerg-Grau-
holm, J., Bækvad-Hansen, M., et al.; ADHD Working Group
of the Psychiatric Genomics Consortium (PGC); Early Life-
course & Genetic Epidemiology (EAGLE) Consortium; and
23andMe Research Team (2019). Discovery of the first
genome-wide significant risk loci for attention deficit/hyper-
activity disorder. Nat. Genet. 51, 63–75.
The Ame
65. Cowen, L., Ideker, T., Raphael, B.J., and Sharan, R. (2017).
Network propagation: a universal amplifier of genetic associa-
tions. Nat. Rev. Genet. 18, 551–562.
66. Perneczky, R., Alexopoulos, P.; and Alzheimer’s Disease euroi-
maging Initiative (2014). Cerebrospinal fluid BACE1 activity
and markers of amyloid precursor protein metabolism and
axonal degeneration in Alzheimer’s disease. Alzheimers De-
ment. 10 (5, Suppl), S425–S429, 429.e1.
67. Hindorff, L.A., Bonham, V.L., Brody, L.C., Ginoza, M.E.C.,
Hutter, C.M., Manolio, T.A., and Green, E.D. (2018). Priori-
tizing diversity in human genomics research. Nat. Rev. Genet.
19, 175–185.
68. Sinnott-Armstrong, N., Tanigawa, Y., Amar, D., Mars, N., Ben-
ner, C., Aguirre, M., Venkataraman, G.R.,Wainberg, M., Ollila,
H.M., Kiiskinen, T., et al.; FinnGen (2021). Genetics of 35
blood and urine biomarkers in the UK Biobank. Nat. Genet.
53, 185–194.
69. Peterson, R.E., Kuchenbaecker, K., Walters, R.K., Chen, C.Y.,
Popejoy, A.B., Periyasamy, S., Lam, M., Iyegbe, C., Straw-
bridge, R.J., Brick, L., et al. (2019). Genome-wide association
studies in ancestrally diverse populations: opportunities,
methods, pitfalls, and recommendations. Cell 179, 589–603.
70. Willer, C.J., Li, Y., and Abecasis, G.R. (2010). METAL: fast and
efficient meta-analysis of genomewide association scans. Bio-
informatics 26, 2190–2191.
71. Lin, D.-Y., Tao, R., Kalsbeek, W.D., Zeng, D., Gonzalez, F., 2nd,
Fernandez-Rhodes, L., Graff, M., Koch, G.G., North, K.E., and
Heiss, G. (2014). Genetic association analysis under complex
survey sampling: the Hispanic Community Health Study/
Study of Latinos. Am. J. Hum. Genet. 95, 675–688.
72. Yang, J., Zaitlen, N.A., Goddard, M.E., Visscher, P.M., and
Price, A.L. (2014). Advantages and pitfalls in the application
of mixed-model association methods. Nat. Genet. 46, 100–
106.
73. Urbut, S.M., Wang, G., Carbonetto, P., and Stephens, M.
(2019). Flexible statistical methods for estimating and testing
effects in genomic studies with multiple conditions. Nat.
Genet. 51, 187–195.
74. Vrieze, S.I., Iacono, W.G., and McGue, M. (2012). Confluence
of genes, environment, development, and behavior in a post-
gwas world. Dev. Psychopathol. 24, 1195–1214.
75. Gage, S.H., Davey Smith, G., Ware, J.J., Flint, J., and Munafo,
M.R. (2016). G¼ e: What gwas can tell us about the environ-
ment. PLoS Genet. 12, e1005765.
76. Borrell, L.N., Elhawary, J.R., Fuentes-Afflick, E., Witonsky, J.,
Bhakta, N., Wu, A.H.B., Bibbins-Domingo, K., Rodrıguez-San-
tana, J.R., Lenoir, M.A., Gavin, J.R., 3rd., et al. (2021). Race and
genetic ancestry in medicine - a time for reckoning with
racism. N. Engl. J. Med. 384, 474–480.
77. Young, A.I., Frigge, M.L., Gudbjartsson, D.F., Thorleifsson, G.,
Bjornsdottir, G., Sulem, P., Masson, G., Thorsteinsdottir, U.,
Stefansson, K., and Kong, A. (2018). Relatedness disequilib-
rium regression estimates heritability without environmental
bias. Nat. Genet. 50, 1304–1310.
78. Young, A.I., Benonisdottir, S., Przeworski, M., and Kong, A.
(2019). Deconstructing the sources of genotype-phenotype as-
sociations in humans. Science 365, 1396–1400.
79. Hormozdiari, F., Kostem, E., Kang, E.Y., Pasaniuc, B., and Es-
kin, E. (2014). Identifying causal variants at loci with multiple
signals of association. Genetics 198, 497–508.
80. Hormozdiari, F., van de Bunt, M., Segre, A.V., Li, X., Joo, J.W.J.,
Bilow, M., Sul, J.H., Sankararaman, S., Pasaniuc, B., and Eskin,
rican Journal of Human Genetics 109, 871–884, May 5, 2022 883

E. (2016). Colocalization of GWAS and eQTL Signals Detects
Target Genes. Am. J. Hum. Genet. 99, 1245–1260.
81. LaPierre, N., Taraszka, K., Huang, H., He, R., Hormozdiari, F.,
and Eskin, E. (2021). Identifying causal variants by fine map-
ping across multiple studies. PLoS Genet. 17, e1009733.
82. Wang, G., Sarkar, A., Carbonetto, P., and Stephens, M. (2020).
A simple new approach to variable selection in regression,
with application to genetic fine mapping. J. R. Stat. Soc. Series
B Stat. Methodol. 82, 1273–1300.
83. Crawford, L., Zeng, P., Mukherjee, S., and Zhou, X. (2017). De-
tecting epistasis with the marginal epistasis test in genetic
mapping studies of quantitative traits. PLoS Genet. 13,
e1006869.
84. Turchin,M.C., and Stephens,M. (2019). Bayesianmultivariate
reanalysis of large genetic studies identifies many new associ-
ations. PLoS Genet. 15, e1008431.
85. Zhou, X., and Stephens, M. (2012). Genome-wide efficient
mixed-model analysis for association studies. Nat. Genet. 44,
821–824.
86. Stephens,M. (2013). A unified framework for association anal-
ysis with multiple related phenotypes. PLoS ONE 8, e65245.
87. Brown, B.C., Ye, C.J., Price, A.L., Zaitlen, N.; and Asian Genetic
Epidemiology Network Type 2 Diabetes Consortium (2016).
884 The American Journal of Human Genetics 109, 871–884, May 5,
Transethnic genetic-correlation estimates from summary sta-
tistics. Am. J. Hum. Genet. 99, 76–88.
88. Galinsky, K.J., Reshef, Y.A., Finucane, H.K., Loh, P.R., Zaitlen,
N., Patterson, N.J., Brown, B.C., and Price, A.L. (2019). Esti-
mating cross-population genetic correlations of causal effect
sizes. Genet. Epidemiol. 43, 180–188.
89. Bitarello, B.D., and Mathieson, I. (2020). Polygenic scores for
height in admixed populations. G3 10, 4027–4036.
90. Marnetto, D., Parna, K., Lall, K., Molinaro, L., Montinaro, F.,
Haller, T., Metspalu, M., Magi, R., Fischer, K., and Pagani, L.
(2020). Ancestry deconvolution and partial polygenic score
can improve susceptibility predictions in recently admixed in-
dividuals. Nat. Commun. 11, 1628.
91. Huang, H., Ruan, Y., Feng, Y.-C.A., Chen, C.-Y., Lam, M.,
Sawa, A., Martin, A., Qin, S., and Ge, T. (2021). Improving
polygenic prediction in ancestrally diverse populations.
Preprint at medRxiv. https://doi.org/10.1101/2020.12.27.
20248738.
92. Hayward, L.K., and Sella, G. (2019). Polygenic adaptation after
a sudden change in environment. Preprint at bioRxiv. https://
doi.org/10.1101/792952.
93. McClellan, J., and King,M.C. (2010). Genetic heterogeneity in
human disease. Cell 141, 210–217.
2022
The American Journal of Human Genetics, Volume 109
Supplemental information
Enrichment analyses identify shared associations
for 25 quantitative traits in over 600,000
individuals from seven diverse ancestries
Samuel Pattillo Smith, Sahar Shahamatdar, Wei Cheng, Selena Zhang, Joseph Paik, MisaGraff, Christopher Haiman, T.C. Matise, Kari E. North, Ulrike Peters, EimearKenny, Chris Gignoux, Genevieve Wojcik, Lorin Crawford, and Sohini Ramachandran

S1 Supplemental Note for Smith et al. 2021 - “Enrichment anal-1
yses identify shared associations for 25 quantitative traits in2
over 600,000 individuals from seven diverse ancestries”3
S0.1 SNP-level results for height and C-reactive protein4
In Figure S5A and Figure S5D, we found that, across 25 traits analyzed, height had the greatest number5
of genome-wide significant SNP-level associations (76,910 unique associations) in at least one ancestry. Of6
these SNP-level associations, 8.90% (7,377 SNPs) replicate based o↵ of rsID in at least two ancestry cohorts.7
Height is not the only trait in which the standard GWA SNP-level association test detects associations that8
replicate extensively across ancestries. In fact, SNP-level associations replicate in each of the 25 continuous9
traits that we analyze in this study.10
We analyzed SNP-level associations with C-reactive protein in six ancestry cohorts: African-American11
(PAGE), European, South Asian, East Asian, Native Hawaiian, and Hispanic and Latin American cohorts.12
C-reactive protein is an example of a trait with a sparse and highly conserved genetic architecture across13
ancestries, as shown in Figure 2. Many SNPs within the CRP gene have been previously associated with C-14
reactive protein plasma levels1–3. In our analysis, rs3091244 is genome-wide significant in only the European15
ancestry cohort, and has been functionally validated as influencing C-reactive protein levels4,5. The SNP16
rs3091244 is located in a promoter region slightly upstream of CRP, and it has clinical implications for both17
atrial fibrillation6 and lupus erythematosus7 (European p = 1.54⇥ 10�116; East Asian p = 1.15⇥ 10�9).18
We expanded our search for replicated GWA SNP-level association signals across ancestry cohorts by19
scanning for 1 Mb regions that contained associations to the same phenotype in two or more ancestries—20
a process often referred to as “clumping”. These windows were centered at every unique genome-wide21
significant SNP in any ancestry for a given trait (we refer the 1Mb window around the significant SNP as a22
“clump”, Figure S5B and Figure S5E). In addition to the largest number of unique SNP-level associations,23
height also had the largest proportion of clumps containing a significant SNP-level GWA association signal24
that replicated in at least two ancestry cohorts (see Figure S5B and Figure S5E). The three traits with the25
greatest proportion of clumps containing SNP-level GWA signals that replicate in multiple ancestry cohorts26
were height (77.09% of clumps), urate (65.89%), and low density lipoprotein (54.40%).27
In addition to the SNP-level associations on chromosome 1 surrounding the CRP gene across all six28
ancestry cohorts (displayed in Figure 2), there are other regions of the genome that contain significant GWA29
associations with C-reactive protein that replicate in multiple ancestry cohorts. On chromosome 2, there is a30
cluster of four SNPs significantly associated with C-reactive protein levels in the European, East Asian, and31
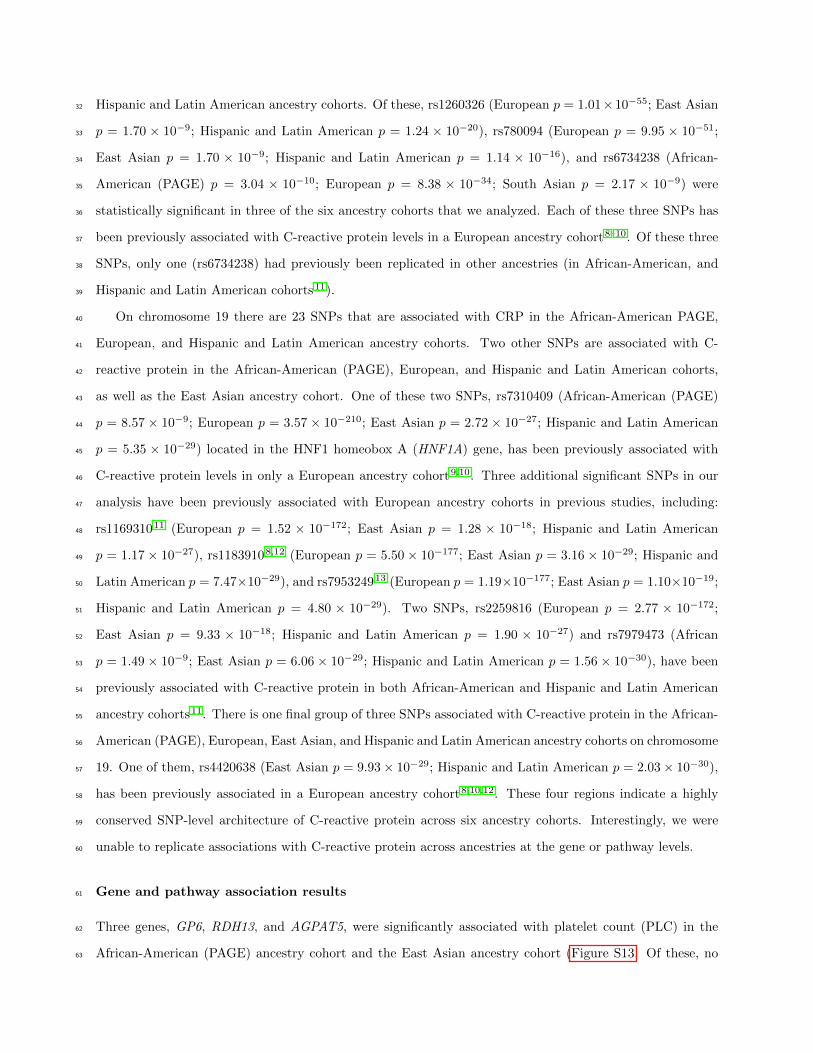
Hispanic and Latin American ancestry cohorts. Of these, rs1260326 (European p = 1.01⇥10�55; East Asian32
p = 1.70 ⇥ 10�9; Hispanic and Latin American p = 1.24 ⇥ 10�20), rs780094 (European p = 9.95 ⇥ 10�51;33
East Asian p = 1.70 ⇥ 10�9; Hispanic and Latin American p = 1.14 ⇥ 10�16), and rs6734238 (African-34
American (PAGE) p = 3.04 ⇥ 10�10; European p = 8.38 ⇥ 10�34; South Asian p = 2.17 ⇥ 10�9) were35
statistically significant in three of the six ancestry cohorts that we analyzed. Each of these three SNPs has36
been previously associated with C-reactive protein levels in a European ancestry cohort8–10. Of these three37
SNPs, only one (rs6734238) had previously been replicated in other ancestries (in African-American, and38
Hispanic and Latin American cohorts11).39
On chromosome 19 there are 23 SNPs that are associated with CRP in the African-American PAGE,40
European, and Hispanic and Latin American ancestry cohorts. Two other SNPs are associated with C-41
reactive protein in the African-American (PAGE), European, and Hispanic and Latin American cohorts,42
as well as the East Asian ancestry cohort. One of these two SNPs, rs7310409 (African-American (PAGE)43
p = 8.57 ⇥ 10�9; European p = 3.57 ⇥ 10�210; East Asian p = 2.72 ⇥ 10�27; Hispanic and Latin American44
p = 5.35 ⇥ 10�29) located in the HNF1 homeobox A (HNF1A) gene, has been previously associated with45
C-reactive protein levels in only a European ancestry cohort9,10. Three additional significant SNPs in our46
analysis have been previously associated with European ancestry cohorts in previous studies, including:47
rs116931011 (European p = 1.52 ⇥ 10�172; East Asian p = 1.28 ⇥ 10�18; Hispanic and Latin American48
p = 1.17 ⇥ 10�27), rs11839108,12 (European p = 5.50 ⇥ 10�177; East Asian p = 3.16 ⇥ 10�29; Hispanic and49
Latin American p = 7.47⇥10�29), and rs795324913 (European p = 1.19⇥10�177; East Asian p = 1.10⇥10�19;50
Hispanic and Latin American p = 4.80 ⇥ 10�29). Two SNPs, rs2259816 (European p = 2.77 ⇥ 10�172;51
East Asian p = 9.33 ⇥ 10�18; Hispanic and Latin American p = 1.90 ⇥ 10�27) and rs7979473 (African52
p = 1.49 ⇥ 10�9; East Asian p = 6.06 ⇥ 10�29; Hispanic and Latin American p = 1.56 ⇥ 10�30), have been53
previously associated with C-reactive protein in both African-American and Hispanic and Latin American54
ancestry cohorts11. There is one final group of three SNPs associated with C-reactive protein in the African-55
American (PAGE), European, East Asian, and Hispanic and Latin American ancestry cohorts on chromosome56
19. One of them, rs4420638 (East Asian p = 9.93⇥ 10�29; Hispanic and Latin American p = 2.03⇥ 10�30),57
has been previously associated in a European ancestry cohort8,10,12. These four regions indicate a highly58
conserved SNP-level architecture of C-reactive protein across six ancestry cohorts. Interestingly, we were59
unable to replicate associations with C-reactive protein across ancestries at the gene or pathway levels.60
Gene and pathway association results61
Three genes, GP6, RDH13, and AGPAT5, were significantly associated with platelet count (PLC) in the62
African-American (PAGE) ancestry cohort and the East Asian ancestry cohort (Figure S13. Of these, no63

significant SNPs in glycoprotein VI platelet (GP6 ) have been reported in the GWAS catalog for either64
ancestry cohort. However, a single SNP within GP6, rs1613662, has previously been associated with mean65
platelet volume in a GWA study analyzing a European ancestry cohort14. GP6 plays a critical role in66
platelet aggregation, and mutations have been previously associated with fetal loss15. Retinol dehydrogenase67
13 (RDH13 ) has no reported GWAS catalog associations with platelet count, but is within 60kb of a SNP68
significantly associated with platelet aggregation16. Of the three genes significantly associated with PLC69
in both the European and AIAN cohorts, 1-Acylglycerol-3-Phosphate O-Acyltransferase 5 (AGPAT5 ) is a70
member of a gene family known to play a role in immunity and inflammation response17.71
Alcohol dehydrogenase 2 (ALDH2 ) has additionally been associated with hypertension in an elderly72
Japanese cohort18. A member of the RAS oncogene family (RAB8A) has been shown to play a role in73
the inhibition of inflammatory response. In contrast, cut like homeobox 2 CUX2 contains a significantly74
associated SNP in the array used in this study for the East Asian ancestry cohort, but it has no previous75
associations in a European ancestry cohort. However, CUX2 is significantly associated at the gene-level in76
both the European and East Asian ancestry cohorts. Although not reported as being associated with PLC77
in the GWAS Catalog, a single SNP, rs61745424 which encodes a missense mutation, has been previously78
identified as being related to the trait19. The gene-" association statistics for the seven genes significantly79
associated with PLC are available in Table S24.80
Finally, a single gene, acyl-CoA dehydrogenase family member 10 (ACAD10 ) associated in our gene-level81
analysis of PLC, was significant in both the European and East Asian ancestry cohorts (European gene-82
" p = 1.47⇥10�10; East Asian gene-" p = 2.00⇥10�10) but contained no previous associations in the GWAS83
catalog. The African-American and Hispanic and Latin American ancestry cohorts analyzed in Qayyum84
et al. 20 both contain SNPs within ACAD10 that are significantly associated with PLC.85
In our analysis of triglyceride levels in six ancestry cohorts (African-American (PAGE), European, East86
Asian, South Asian, Hispanic and Latin American, and Native Hawaiian), we identified shared genetic87
architecture at the SNP, gene, and subnetwork level. Replicated SNPs and genes between the six ancestry88
cohorts are shown in Figure S15-Figure S16. We focus our discussion of results at the network level in89
the European, East Asian, and Native Hawaiian ancestry cohorts (Figure 3). In the European and East90
Asian ancestry cohorts, we identified 55 shared genome-wide significant associations at the gene-level. Of91
these results, eight genes lie in the same significantly mutated subnetwork (Hierarchical HotNet p < 10�3)92
when analyzing each ancestry cohort independently. Five of those eight genes belong to the apolipoprotein93
family of genes, including: apolipoprotein A1 (APOA1 ), apolipoprotein A4 (APOA4 ), apolipoprotein A594
(APOA5 ), apollipoprotein C3 (APOC3 ), apolipoprotein E (APOE ). Specifically, the apolipoprotein play a95
central role in lipoprotein biosynthesis and transport. All of these genes contain SNPs previously associated96

with triglyceride levels in a European ancestry cohort21–26. All five genes also contain SNPs previously97
associated with triglyceride levels in non-European ancestry cohorts. Specifically, APOA1, APOC3, and98
APOE each contain SNPs previously associated with triglyceride levels in African-American and Hispanic99
and Latin American ancestry cohorts21,22. APOA5 has previously been associated to triglyceride levels in100
an East Asian, African-American, and Hispanic and Latin American ancestry cohorts24,27.101
The other three genes that were significantly associated with triglyceride levels in the European and East102
Asian ancestry cohorts are members of the largest significantly mutated subnetwork including phospholipid103
transfer protein (PLTP ; European gene-" p = 4.29⇥ 10�9; East Asian gene-" p = 6.66⇥ 10�15), lipoprotein104
lipase (LPL; European gene-" p = 4.08⇥10�13; East Asian gene-" p = 1.00⇥10�20), and angiopoietin like 3105
(ANGPTL3 ; European gene-" p = 8.86⇥ 10�8; East Asian gene-" p = 1.00⇥ 10�20). PLTP has previously106
been associated with triglyceride levels in European, African-American, and Hispanic and Latin American107
ancestry cohorts21,22,24,28–32. LPL is one of the most well-studied genes in the regulation of triglyceride levels.108
It has previously been associated with triglyceride levels in European ancestry cohorts21–26,28–32,32–45, East109
Asian ancestry cohorts27,46, and African ancestry cohorts as well as Hispanic and Latin American ancestry110
cohorts21,24,28,29,42,44,45,47,48. The final gene that was genome-wide significant in both the European and111
East Asian ancestry cohorts, ANGPTL3, has no previous associations in the GWAS catalog and presents112
a novel candidate gene within the network. While not significant in any gene-level analysis, ANGPTL4113
(European gene-" p = 1.00 ⇥ 10�20; East Asian gene-" p = 9.99 ⇥ 10�1) is from the same family is present114
in the largest subnetwork in the European cohort and also has also been previously identified as having115
associations in European, African, and Hispanic and Latin American ancestry cohorts24,28,42,44,45,49.116
In our analysis of the European ancestry cohort from the UK Biobank, we additionally identified a set of117
eight genes that are connected to the core network discussed above. One of these genes is ANGPTL4, which118
we discussed above. Five of these genes were significant at the gene-level in the European ancestry cohort,119
including four apoliprotein genes (APOC1 ; European gene-" p = 1.67 ⇥ 10�16, APOC2 ; European gene-120
" p = 3.57⇥10�13, APOC4 ; European gene-" p = 3.72⇥10�13, and APOB ; European gene-" p = 1.00⇥10�20)121
and lipase maturation factor 1 (LMF1 ; European gene-" p = 8.03 ⇥ 10�7). Each of these genes have been122
previously associated with triglyceride levels in a European ancestry cohort24. Additional associations123
were also found in that same study which conducted a meta-analysis of European, African-American, and124
Hispanic and Latin American ancestry cohorts. The final two genes included in the significantly mutated125
subnetwork of the European ancestral cohort, APOL1 and HBA1, were not were not identified as genome-126
wide significant by gene-" and have no previous SNP-level associations with triglyceride levels in the GWAS127
Catalog. Interestingly, both APOL1 (Native Hawaiian gene-" p = 8.89⇥10�11) and HBA1 (Native Hawaiian128
gene-" p = 2.46⇥10�10) were both identified as genome-wide significant by gene-" in our analysis of the Native129

Hawaiian ancestry cohort and the interaction between them was identified in our Hierarchical HotNet50130
analysis as present in both the European and Native Hawaiian ancestry cohorts.131
In addition to APOL1 and HBA1, six more genes are connected to the core network of genes that overlap132
in the East Asian and European significantly mutated subnetworks. Of these, both HBA2 and B4GALT3 are133
significant at the gene-level in the Native Hawaiian ancestry cohort alone. They are each connected to genes134
identified in both the European and Native Hawaiian ancestry cohorts as members of the largest significantly135
mutated subnetwork. The final three genes include kallikrein related peptidase 8 (KLK8 ), pancreatic lipase136
PNLIP, and wnt family member 4 (WNT4 ) which were not significant at the gene-level and did not contain137
previous SNP-level associations in the GWAS catalog.138
Three of the genes within the network identified in the East Asian ancestry cohort contain previously139
associated SNPs in both European and non-European ancestry cohorts, including: cholesteryl ester transfer140
protein (CETP), proprotein convertase subtilisin/kexin type 6 (PCSK6 ), and proprotein convertase subtil-141
isin/kexin type 7 (PCSK7 )21,29. The final three genes in the significantly mutated subnetwork identified in142
the East Asian ancestry cohort were not significant at the gene-level and do not contain previously associated143
SNPs in the GWAS catalog in any ancestral cohort. Lecithin-cholesterol acyltransferase (LCAT ) is involved144
in cholesterol biosynthesis and apolipoprotein F (APOF ) encodes one of the minor apolipoprotein genes145
present in plasma. Finally, tyrosine-protein kinase receptor 3 (TYRO3 ) plays a role in ligand recognition146
and cell metabolism51. The gene-" p-values in each ancestry cohort for each of the 28 genes discussed here147
are shown in Table S26.148
Supplemental Figures149

Figure S1: Number of publications we identified using UK Biobank data from 2012 to 2020.Studies identified using PMIDs as described in the Supplemental Information. Studies that are displayedon the UK Biobank website (https://www.ukbiobank.ac.uk/) and identified on PubMed are shown inpurple. Studies listed on the UK Biobank website but do not have a PMID are shown in blue, and studiesonly identified using PubMed but not listed on the UK Biobank website are shown in red. The protocolsfor identifying studies both on PubMed and the UK Biobank website are detailed in the SupplementalInformation. Data from both the UK Biobank website and PubMed were accessed on January 12, 2021.

Multi-ancestry
Figure S2: Number of studies published using UK Biobank data from 2012 to 2020 thathave available metadata in the GWAS Catalog. Our protocols for identifying studies from theGWAS Catalog are detailed in the Supplemental Information. Multi-ancestry studies are shown in pur-ple and include those that list samples of more than one ancestral group in the GWAS catalog (as de-fined according to the protocol using Popejoy and Fullerton 52 , available on the GitHub page https://github.com/ramachandran-lab/redefining_replication). Studies that only list samples of Europeanancestry in the GWAS catalog are shown in blue. Every multi-ancestry analysis includes samples of Euro-pean ancestry and of at least one other ancestry. GWAS Catalog data was accessed on January 10, 2021from the website https://www.ebi.ac.uk/gwas/docs/file-downloads using the final release file of 2020(see file named gwas catalog v1.0.2-associations e100 r2020-12-15.tsv).

Minor Allele Frequency
Ancestry Cohort
Hispanic andLatin American
African-American
South Asian
Native Hawaiian
AIAN
A
B
C
Absolute value of e!ect size = 0.1
Absolute value of e!ect size = 0.5
Absolute value of e!ect size = 1
Sample size of discovery cohort
Figure S3: Power calculations for the standard GWA framework as a function of sample sizesusing a range of e↵ect sizes and minor allele frequencies. A. For an absolute value of e↵ect sizeequal to 0.1 we performed power calculations for the standard GWA framework for cohorts with sample sizesof up to 30,000 individuals. Similar plots for absolute value of e↵ect size set to 0.5 and 1 are shown in B.and C., respectively. A full description of the power calculations is given in the Materials and Methods.

Anthropometric Blood pressure Hematological Metabolic Kidney C-reactive protein
Count
associations (Nominal)
Replicated SNP-levelassociations (Nominal)
Proportion
B
D
Count
Proportion. . . . .
association (Bonferroni)
Replicated SNP-levelassociations (Bonferroni)
A
C
Figure S4: Summaries of replicated SNP-level associations when using two-stage GWA studydesign a nominal significance threshold. (A) Number and (C) proportion of nominally significantSNPs associated with a phenotype in the European ancestry cohort that were replicated in at least oneother ancestry cohorts using a nominal p-value threshold calculated as 0.05 divided by the number of SNPssignificantly associated with that trait in the European ancestry cohort. The corresponding thresholds foreach trait are listed in Table S12. For ease of comparison, (B) number and (D) proportion of Bonferronisignificant SNP-level associations that replicate among ancestry cohorts using the ancestry-trait Bonferroni-correction thresholds shown Table S11. Expansion of three letter trait codes are given in Table S2. Expansionof three letter trait codes are given in Table S2.

A B C
D E F
Count Count Count
Proportion Proportion Proportion. . . . . . . . . . . . . . .
associations associations in clumps associations
Anthropometric Blood pressure Hematological Metabolic Kidney C-reactive protein
Replicated SNP-levelassociations
Replicated SNP-levelassociations in clumps
Replicated gene-levelassociations
Figure S5: Summaries of replicated associations at multiple genomic scales among ancestrycohorts for all 25 traits analyzed using Bonferroni-corrected thresholds. Expansion of three let-ter trait codes are given in Table S2. (A) Number and (D) proportion of genome-wide significant SNPsassociated with a phenotype in at least one ancestry cohort that were replicated in at least two ancestrycohorts. In all 25 traits, genome-wide significant SNPs replicate in at least two ancestry cohorts. Heightcontains over 7,000 replicated SNPs among the seven ancestry cohorts analyzed, illustrating its highly poly-genic architecture. For many traits across all categories, with the exception of other biochemical (i.e., CRP),the replication rate of genes is higher in gene-level associations than at the SNP-level. (B) Number and(E) proportion of 1Mb windows, or “clumps”, that contain at least one genome-wide significant SNP-levelassociations for a given phenotype in at least two ancestry cohorts. (C) Number and (F) proportion ofgenome-wide significant gene-level associations that replicate among ancestry cohorts. Replicated associa-tions in hematological are common at the gene-level in hematological and metabolic traits. For instance, inthree of the four cohorts with mean corpuscular hemoglobin (MCH) measurements HBA1 and HBA2 wereidentified as significant associated with MCH in the African, European, and East Asian ancestry cohortsTable S3. The denominator of the proportion is calculated as the total number of unique SNPs, clumps,or genes that are significantly associated with a trait in at least on ancestral cohort. Note that D and Fcorrespond to Figure 1A and B, with an altered x-axis upper limit of 0.8 in this figure.

Scenarios
FDR
0.0
0.2
0.4
0.6
0.8
1.0
h2=0.2/n=5000 h2=0.2/n=10000 h2=0.6/n=5000 h2=0.6/n=10000 h2=0.2/n=5000 h2=0.2/n=10000 h2=0.6/n=5000 h2=0.6/n=10000
gene−εRSSSKATGWAS
Sparsity = 1 percent Sparsity = 10 percent
h2 = 0.2N = 5000
h2 = 0.2N = 10000
h2 = 0.6N = 5000
h2 = 0.6N = 10000
h2 = 0.2N = 5000
h2 = 0.2N = 10000
h2 = 0.6N = 5000
h2 = 0.6N = 10000
Scenarios
Powe
r
0.0
0.2
0.4
0.6
0.8
1.0
h2=0.2/n=5000 h2=0.2/n=10000 h2=0.6/n=5000 h2=0.6/n=10000 h2=0.2/n=5000 h2=0.2/n=10000 h2=0.6/n=5000 h2=0.6/n=10000
gene−εRSSSKATGWAS
Sparsity = 1 percent Sparsity = 10 percent
h2 = 0.2N = 5000
h2 = 0.2N = 10000
h2 = 0.6N = 5000
h2 = 0.6N = 10000
h2 = 0.2N = 5000
h2 = 0.2N = 10000
h2 = 0.6N = 5000
h2 = 0.6N = 10000
Unstructured Population
Figure S6: gene-" outperforms and controls false discovery rate (FDR) better than otherassociation methods in simulations with varying heritability and sample size. Simulations weredesigned to assess gene versus SNP-level association false discovery rate (FDR) and power in an unstructuredpopulation as described by the protocols in the Supplemental Information. The top and bottom panelsshow the FDR and power of four di↵erent association methods on 100 simulated datasets, respectively. Wecompared performance of three gene-level association test methods (gene-"53, RSS54, SKAT55) with outputsfrom the standard GWA association test under di↵erent simulation parameters (sample size N , narrow-senseheritability h
2, and sparsity). We define sparsity as the proportion of SNPs that are ground-truth causal.Standard errors across the simulated replicates are shown using black whisker plots. Simulation protocol isdescribed in the Supplemental Information.
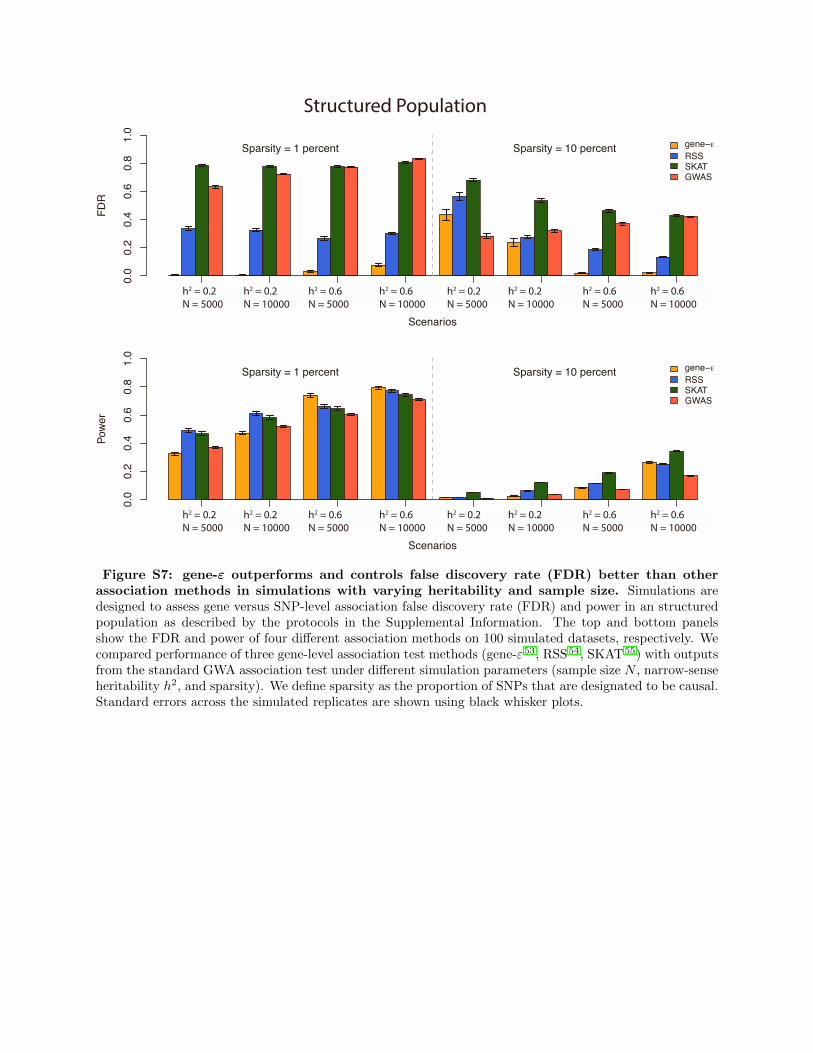
Scenarios
FDR
0.0
0.2
0.4
0.6
0.8
1.0
h2=0.2/n=5000 h2=0.2/n=10000 h2=0.6/n=5000 h2=0.6/n=10000 h2=0.2/n=5000 h2=0.2/n=10000 h2=0.6/n=5000 h2=0.6/n=10000
gene−εRSSSKATGWAS
Sparsity = 1 percent Sparsity = 10 percent
h2 = 0.2N = 5000
h2 = 0.2N = 10000
h2 = 0.6N = 5000
h2 = 0.6N = 10000
h2 = 0.2N = 5000
h2 = 0.2N = 10000
h2 = 0.6N = 5000
h2 = 0.6N = 10000
Scenarios
Powe
r
0.0
0.2
0.4
0.6
0.8
1.0
h2=0.2/n=5000 h2=0.2/n=10000 h2=0.6/n=5000 h2=0.6/n=10000 h2=0.2/n=5000 h2=0.2/n=10000 h2=0.6/n=5000 h2=0.6/n=10000
gene−εRSSSKATGWAS
Sparsity = 1 percent Sparsity = 10 percent
h2 = 0.2N = 5000
h2 = 0.2N = 10000
h2 = 0.6N = 5000
h2 = 0.6N = 10000
h2 = 0.2N = 5000
h2 = 0.2N = 10000
h2 = 0.6N = 5000
h2 = 0.6N = 10000
Structured Population
Figure S7: gene-" outperforms and controls false discovery rate (FDR) better than otherassociation methods in simulations with varying heritability and sample size. Simulations aredesigned to assess gene versus SNP-level association false discovery rate (FDR) and power in an structuredpopulation as described by the protocols in the Supplemental Information. The top and bottom panelsshow the FDR and power of four di↵erent association methods on 100 simulated datasets, respectively. Wecompared performance of three gene-level association test methods (gene-"53, RSS54, SKAT55) with outputsfrom the standard GWA association test under di↵erent simulation parameters (sample size N , narrow-senseheritability h
2, and sparsity). We define sparsity as the proportion of SNPs that are designated to be causal.Standard errors across the simulated replicates are shown using black whisker plots.

Powe
r
0.0
0.2
0.4
Powe
r
0.0
0.2
0.4
FDR
0.0
0.4
0.8
FDR
0.0
0.4
0.8
Structured Population Unstructured Population
Sparsityh!
0.01 0.01 0.1 0.10.2 0.6 0.2 0.6
Sparsityh!
0.01 0.01 0.1 0.10.2 0.6 0.2 0.6
Sparsityh!
0.01 0.01 0.1 0.10.2 0.6 0.2 0.6
Sparsityh!
0.01 0.01 0.1 0.10.2 0.6 0.2 0.6
A Bgene−eGWAS
Figure S8: gene-" outperforms and controls false discovery rate (FDR) better than the stan-dard GWA framework in simulations with varying heritability and sparsity. All simulations weredone with 2,000 individuals to test the power of gene-" to detect associations in a small cohort. The FDR(top) and power (bottom) for each parameter set are calculated across 100 simulated replicates. A. Resultsfrom simulated populations where population structure is present. B. Results from simulated populationswhen population structure is not present. Mean power and false discovery rate, as well as correspondingstandard errors, are shown in Table S23 for clarity.

Spar
sity
= 0.
1
Proportion Shared SNPs = 0
Spar
sity
= 0.
5
0.0 0.2 0.4 0.6 0.8 1.0
0.0
0.2
0.4
0.6
0.8
1.0
Recall
Prec
ision
0.0 0.2 0.4 0.6 0.8 1.0
0.0
0.2
0.4
0.6
0.8
1.0
FPR
TPR
0.0 0.2 0.4 0.6 0.8 1.0
0.0
0.2
0.4
0.6
0.8
1.0
Recall
Prec
ision
0.0 0.2 0.4 0.6 0.8 1.0
0.0
0.2
0.4
0.6
0.8
1.0
FPR
TPR
0.0 0.2 0.4 0.6 0.8 1.00.0
0.2
0.4
0.6
0.8
1.0
Recall
Prec
ision
0.0 0.2 0.4 0.6 0.8 1.0
0.0
0.2
0.4
0.6
0.8
1.0
FPR
TPR
0.0 0.2 0.4 0.6 0.8 1.0
0.0
0.2
0.4
0.6
0.8
1.0
Recall
Prec
ision
0.0 0.2 0.4 0.6 0.8 1.0
0.0
0.2
0.4
0.6
0.8
1.0
FPR
TPR
0.0 0.2 0.4 0.6 0.8 1.0
0.0
0.2
0.4
0.6
0.8
1.0
Recall
Prec
ision
0.0 0.2 0.4 0.6 0.8 1.00.0
0.2
0.4
0.6
0.8
1.0
FPR
TPR
0.0 0.2 0.4 0.6 0.8 1.0
0.0
0.2
0.4
0.6
0.8
1.0
Recall
Prec
ision
0.0 0.2 0.4 0.6 0.8 1.0
0.0
0.2
0.4
0.6
0.8
1.0
FPR
TPR
0.0 0.2 0.4 0.6 0.8 1.0
0.0
0.2
0.4
0.6
0.8
1.0
Recall
Prec
ision
0.0 0.2 0.4 0.6 0.8 1.0
0.0
0.2
0.4
0.6
0.8
1.0
FPR
TPR
0.0 0.2 0.4 0.6 0.8 1.0
0.0
0.2
0.4
0.6
0.8
1.0
Recall
Prec
ision
0.0 0.2 0.4 0.6 0.8 1.0
0.0
0.2
0.4
0.6
0.8
1.0
FPR
TPR
A
B
Narrow-sense heritability = 0.2
Recall Recall Recall Recall
Prec
ision
Prec
ision
Prec
ision
Prec
ision
Proportion Shared SNPs = 0.25
Proportion Shared SNPs = 0.5
Proportion Shared SNPs = 1
TPR
FPR
TPR
FPR
TPR
FPR
TPR
FPR
Recall Recall Recall Recall
Prec
ision
Prec
ision
Prec
ision
Prec
ision
TPR
FPR
TPR
FPR
TPR
FPR
TPR
FPR
African
European
Figure S9: gene-" identifies associated genes in two simulated ancestry cohorts under a varietyof genetic architectures with low narrow sense heritability. A. Precision-recall (top row) and receiveroperating curves (bottom row) for gene-" analysis of cohorts simulated using genotypes from individuals ofEuropean (N = 10,000; blue line) and African (N = 4,967; red line) ancestry, respectively. Narrow-senseheritability was set to h
2 = 0.2 in each simulation. Sparsity of causal SNPs was set to a proportion of 0.1 andthe proportion of causal SNPs shared was tested at di↵erent values. 50 replicates of each set of simulationsunder each parameter were performed. B. Precision-recall (top row) and receiver operating curves (bottomrow) for gene-" analysis of 50 replicated simulations of a European and African cohort using a causal SNPsparsity of 0.5.

Spar
sity
= 0.
1Sp
arsit
y =
0.5
A
B
0.0 0.2 0.4 0.6 0.8 1.0
0.0
0.2
0.4
0.6
0.8
1.0
Recall
Prec
ision
0.0 0.2 0.4 0.6 0.8 1.00.0
0.2
0.4
0.6
0.8
1.0
Recall
Prec
ision
0.0 0.2 0.4 0.6 0.8 1.0
0.0
0.2
0.4
0.6
0.8
1.0
Recall
Prec
ision
0.0 0.2 0.4 0.6 0.8 1.0
0.0
0.2
0.4
0.6
0.8
1.0
Recall
Prec
ision
0.0 0.2 0.4 0.6 0.8 1.0
0.0
0.2
0.4
0.6
0.8
1.0
FPR
TPR
0.0 0.2 0.4 0.6 0.8 1.0
0.0
0.2
0.4
0.6
0.8
1.0
FPR
TPR
0.0 0.2 0.4 0.6 0.8 1.00.0
0.2
0.4
0.6
0.8
1.0
FPR
TPR
0.0 0.2 0.4 0.6 0.8 1.0
0.0
0.2
0.4
0.6
0.8
1.0
FPR
TPR
0.0 0.2 0.4 0.6 0.8 1.0
0.0
0.2
0.4
0.6
0.8
1.0
Recall
Prec
ision
0.0 0.2 0.4 0.6 0.8 1.0
0.0
0.2
0.4
0.6
0.8
1.0
Recall
Prec
ision
0.0 0.2 0.4 0.6 0.8 1.0
0.0
0.2
0.4
0.6
0.8
1.0
Recall
Prec
ision
0.0 0.2 0.4 0.6 0.8 1.00.0
0.2
0.4
0.6
0.8
1.0
Recall
Prec
ision
0.0 0.2 0.4 0.6 0.8 1.0
0.0
0.2
0.4
0.6
0.8
1.0
FPR
TPR
0.0 0.2 0.4 0.6 0.8 1.0
0.0
0.2
0.4
0.6
0.8
1.0
FPR
TPR
0.0 0.2 0.4 0.6 0.8 1.0
0.0
0.2
0.4
0.6
0.8
1.0
FPR
TPR
0.0 0.2 0.4 0.6 0.8 1.0
0.0
0.2
0.4
0.6
0.8
1.0
FPR
TPR
Proportion Shared SNPs = 0
Narrow-sense heritability = 0.6
Proportion Shared SNPs = 0.25
Proportion Shared SNPs = 0.5
Proportion Shared SNPs = 1
African
EuropeanPr
ecisi
on
Prec
ision
Prec
ision
Prec
ision
RecallRecallRecallRecall
FPR FPR FPR FPR
Recall Recall Recall Recall
FPR FPR FPR FPR
TPR
Prec
ision
TPR
TPR
Prec
ision
TPR
TPR
Prec
ision
TPR
TPR
Prec
ision
TPR
Figure S10: gene-" identifies associated genes in two simulated ancestry cohorts under avariety of genetic architectures with high narrow sense heritability. A. Precision-recall (top row)and receiver operating curves (bottom row) for gene-" analysis of cohorts simulated using genotypes fromindividuals of European (N = 10,000; blue line) and African (N = 4,967; red line) ancestry, respectively.Narrow-sense heritability was set to h
2 = 0.6 in each simulation. Sparsity of causal SNPs was set to aproportion of 0.1 and the proportion of causal SNPs shared was tested at di↵erent values. 50 replicates ofeach set of simulations under each parameter were performed. B. Precision-recall (top row) and receiveroperating curves (bottom row) for gene-" analysis of 50 replicated simulations of a European and Africancohort using a causal SNP sparsity of 0.5.

FDR
Narrow-sense heritability = 0.2
Sparsity = 0.1 Sparsity = 0.5
Pow
er
Proportion of overlapping causal SNPs0 0.25 0.5 1 0 0.25 0.5 1
Proportion of overlapping causal SNPs0 0.25 0.5 1 0 0.25 0.5 1
A
Bgene−εGWAS
gene−εGWAS
Spar
sity
= 0.
5Sp
arsit
y =
0.1
0.00 0.02 0.04 0.06 0.08 0.10
0.0
0.2
0.4
0.6
0.8
1.0
FPR
TPR
0.00 0.02 0.04 0.06 0.08 0.10
0.0
0.2
0.4
0.6
0.8
1.0
FPR
TPR
0.00 0.02 0.04 0.06 0.08 0.10
0.0
0.2
0.4
0.6
0.8
1.0
FPR
TPR
0.00 0.02 0.04 0.06 0.08 0.10
0.0
0.2
0.4
0.6
0.8
1.0
FPR
TPR
0.00 0.02 0.04 0.06 0.08 0.10
0.0
0.2
0.4
0.6
0.8
1.0
FPR
TPR
0.00 0.02 0.04 0.06 0.08 0.10
0.0
0.2
0.4
0.6
0.8
1.0
FPR
TPR
0.00 0.02 0.04 0.06 0.08 0.10
0.0
0.2
0.4
0.6
0.8
1.0
FPR
TPR
0.00 0.02 0.04 0.06 0.08 0.10
0.0
0.2
0.4
0.6
0.8
1.0
FPR
TPR
C
D
Proportion Shared SNPs = 0
gene-!
GWAS
TPR
TPR
TPR
TPR
TPR
TPR
TPR
TPR
FPR FPR FPR FPR
FPR FPR FPR FPR
Proportion Shared SNPs = 0.25
Proportion Shared SNPs = 0.5
Proportion Shared SNPs = 1
Figure S11: gene-" (orange) has a lower false discovery rate for identification of sharedgenetic determinants between cohorts than the standard GWA framework (red). Narrow-senseheritability (percent variance explained by the genotype matrix) was set to h
2 = 0.2 for all simulations.A. False discovery rate of shared genetic determinants between two ancestry cohorts using varying levels ofcausal SNP sparsity and proportion of shared causal SNPs between the cohorts. B. Power of gene-" andthe standard GWA framework to detect shared genetic determinants between two cohorts. Error bars werecalculated using the results from 50 simulations of each parameter set of sparsity and proportion of sharedcausal SNPs for both FDR(A) and Power(B). C. Receiver operating curves corresponding to simulations ofgenetic architecture when causal SNP sparsity is equal to 0.1 (corresponding to the left-hand panels of Aand B). D. Receiver operating curves corresponding to simulations of genetic architecture when causal SNP

Narrow-sense heritability = 0.6Sparsity = 0.1 Sparsity = 0.5
Pow
erFD
R
Proportion of overlapping causal SNPs0 0.25 0.5 1 0 0.25 0.5 1
Proportion of overlapping causal SNPs0 0.25 0.5 1 0 0.25 0.5 1
A
Bgene−eGWAS
gene−eGWAS
Spar
sity
= 0.
5Sp
arsit
y =
0.1
0.00 0.02 0.04 0.06 0.08 0.10
0.0
0.2
0.4
0.6
0.8
1.0
FPR
TPR
0.00 0.02 0.04 0.06 0.08 0.10
0.0
0.2
0.4
0.6
0.8
1.0
FPR
TPR
0.00 0.02 0.04 0.06 0.08 0.10
0.0
0.2
0.4
0.6
0.8
1.0
FPR
TPR
0.00 0.02 0.04 0.06 0.08 0.10
0.0
0.2
0.4
0.6
0.8
1.0
FPR
TPR
0.00 0.02 0.04 0.06 0.08 0.10
0.0
0.2
0.4
0.6
0.8
1.0
FPR
TPR
0.00 0.02 0.04 0.06 0.08 0.10
0.0
0.2
0.4
0.6
0.8
1.0
FPR
TPR
0.00 0.02 0.04 0.06 0.08 0.10
0.0
0.2
0.4
0.6
0.8
1.0
FPR
TPR
0.00 0.02 0.04 0.06 0.08 0.10
0.0
0.2
0.4
0.6
0.8
1.0
FPR
TPR
C
D
Proportion Shared SNPs = 0
gene-!
GWAS
TPR
TPR
TPR
TPR
TPR
FPR FPR FPR FPR
Proportion Shared SNPs = 0.25
Proportion Shared SNPs = 0.5
Proportion Shared SNPs = 1
FPR FPR FPR FPR
TPR
TPR
TPR
Figure S12: gene-" (orange) has a lower false discovery rate for identification of sharedgenetic determinants between cohorts than the standard GWA framework (red). Narrow-senseheritability (percent variance explained by the genotype matrix) was set to h
2 = 0.6 for all simulations.A. False discovery rate of shared genetic determinants between two ancestry cohorts using varying levels ofcausal SNP sparsity and proportion of shared causal SNPs between the cohorts. B. Power of gene-" andthe standard GWA framework to detect shared genetic determinants between two cohorts. Error bars werecalculated using the results from 50 simulations of each parameter set of sparsity and proportion of sharedcausal SNPs for both FDR(A) and Power(B). C. Receiver operating curves corresponding to simulations ofgenetic architecture when causal SNP sparsity is equal to 0.1 (corresponding to the left-hand panels of Aand B). D. Receiver operating curves corresponding to simulations of genetic architecture when causal SNPsparsity is equal to 0.5 (corresponding to the right-hand panels of A and B).

55
Gen
e In
ters
ectio
ns
0 200 400 600Signi!cant Genes
4 3 2 1
20
40
60
South AsianHispanic and Latin American
Native Indian/Alaska NativeAfrican (PAGE)
EuropeanEast Asian 624
2399780
2919
Figure S13: All six ancestries have gene-level associations with platelet count that replicatein at least one other ancestry. Total number of genome-wide significant genes in each ancestry, aftercorrecting for total number of regions tested, are given in the bar plot located in the bottom right (significancethresholds are given in Table S16, sample sizes are given in Table S6 - Table S9). Shared gene-level associationstatistics between pairs of ancestries are shown in the vertical bar plot; the pair of ancestries representedby each bar can be identified using the dots and links below the barplot. Of the 65 genome-wide significantgene-level association statistics that replicate in at least two ancestry cohorts, only 25 contain SNPs thathave been previously associated with platelet count in at least one ancestry in at least one study in the GWAScatalog (https://www.ebi.ac.uk/gwas/home) This plot was generated using the UpSetR package56.

PLTP
ANGPTL3
ANGPTL4
HBA1
CETP
PCSK6
PCSK7
APOF
LCAT
TYRO3
APOC2
LMF1
KLK8
PNLIPWNT4
A B C
APOC1
APOB
APOC4
APOC2
LPL
APOA1LMF1
APOL1
APOE
APOA4
APOC3
APOA5LPL
ANGPTL3BACE1
APOA5
APOC3
APOA4
APOE
PLTP
APOA1
APOL1
HBA1 HBA2
B4GALT3
Figure S14: Significantly mutated subnetworks associated with triglyceride levels identifiedin the (A) European, (B) East Asian, and (C) Native Hawaiian ancestry cohorts. Significantlymutated subnetworks were identified using the Hierarchical HotNet method50. Genes that were identified ineach ancestry as significantly associated with triglyceride levels using the gene-" method are shaded usingancestry-specific color coding (also used in Figure 3, European—blue, East Asian—pink, Native Hawaiian—green). Significantly mutated subnetworks in the (A) European and (B) East Asian cohorts were identifiedusing the ReactomeFI57 protein-protein interaction network, and the significantly mutated subnetwork inthe (C) the Native Hawaiian cohort was identified using the iRefIndex 15.058 protein-protein interactionnetworks. Genes that are present in any of the significantly mutated subnetworks that contain SNPs pre-viously associated with triglyceride levels in the GWAS Catalog are listed with corresponding citations inTable S25.

6115
2551
639 632
234140
46 27 21 8 5 5 4 4 3 2 2 2 2 1 1 10
2000
4000
6000
Varia
nt In
ters
ectio
ns
6000400020000Significant Variants
South Asian
Native Hawaiian
African-American (PAGE)
Hispanic and Latin American
East Asian
European 6,543
3,628
1,518
43
35
20
Figure S15: Shared SNP-level associations with triglyceride levels in six ancestral cohorts.Total number of genome-wide significant genes in each ancestry, after correcting for total number of regionstested, are given in the bar plot located in the bottom right (significance thresholds are given in Table S11and sample sizes are given in Table S6 - Table S9). Shared SNP-level association statistics between pairs ofancestries are shown in the vertical bar plot. The pair of ancestries represented by each bar can be identifiedusing the dots and links below the vertical barplot. This plot was generated using the UpSetR package56.

433
334
219
7055
7 6 5 5 2 2 2 10
100
200
300
400
500
Gen
e In
ters
ectio
ns
Hispanic and Latin AmericanSouth Asian
EuropeanEast Asian
Native Hawaiian4503001500
Significant Genes
6
81
287
401
448
Figure S16: Shared gene-level associations with triglyceride levels in five ancestral cohorts.Total number of genome-wide significant genes in each ancestry, after correcting for total number of regionstested, are given in the bar plot located in the bottom right (significance thresholds are given in Table S16and sample sizes are given in Table S6 - Table S9). Shared gene-level association statistics between pairs ofancestries are shown in the vertical bar plot. The pair of ancestries represented by each bar can be identifiedusing the dots and links below the vertical barplot. This plot was generated using the UpSetR package56.

CA
Proportion of variant replicationsBonferroni corrected
Pro
porti
on o
f gen
e re
plic
atio
nsB
onfe
rron
i cor
rect
ed
Pro
porti
on o
f gen
e re
plic
atio
nsp-
valu
e <
10-2
Anthropometric Blood pressure Hematological Metabolic Kidney C-reactive protein
B
Pro
porti
on o
f gen
e re
plic
atio
nsp-
valu
e <
10-3
Proportion of variant replicationsp-value < 5 x 10⁻⁵
Proportion of variant replicationsp-value <10-3
Figure S17: Less stringent significance thresholds lead to a decrease in the proportion ofreplicated SNP-level associations and an increase in the proportion of gene-level associationsamong ancestries for each of the 25 traits analyzed. A. Proportion of all SNP-level Bonferroni-corrected genome-wide significant associations in any ancestry that replicate in at least one other ancestry isshown on the x-axis (see Table S11 for ancestry-trait specific Bonferroni corrected p-value thresholds). On they-axis we show the proportion of significant gene-level associations that were replicated for a given phenotypein at least two ancestries (see Table S16 for Bonferroni corrected significance thresholds for each ancestry-traitpair). The black stars on the x- and y-axes represent the mean proportion of replicates in SNP and geneanalyses, respectively. C-reactive protein (CRP) contains the greatest proportion of replicated SNP-levelassociations of any of the phenotypes. B. The x-axis indicates the proportion of SNP-level associations thatsurpass a nominal threshold of p-value < 10�5 in at least one ancestry cohort that replicate in at least oneother ancestry cohort. The y-axis indicates the proportion of gene-level associations that surpass a nominalthreshold of p-value < 10�3 in at least one ancestry cohort and replicate in at least one other ancestrycohort. Nominal p-value thresholds tend to decrease the proportion of replicated SNP-level associations andtend to increase the proportion of replicated gene-level associations. The number of unique SNPs and genesthat replicated in each cohort is given in Figure S18. C. The x-axis indicates the proportion of SNP-levelassociations that surpass a nominal threshold of p-value < 10�3 in at least one ancestry cohort that replicatein at least one other ancestry cohort. The y-axis indicates the proportion of gene-level associations thatsurpass a nominal threshold of p-value < 10�2 in at least one ancestry cohort and replicate in at least oneother ancestry cohort. The number of unique SNPs and genes that replicated in each cohort is given inFigure S19. As shown in panel B, nominal p-value thresholds tend to decrease the proportion of replicatedSNP-level associations and tend to increase the proportion of replicated gene-level associations. Expansionof three letter trait codes are given in Table S2.

Anthropometric Blood pressure Hematological Metabolic Kidney C-reactive protein
Count Count
Proportion Proportion
Replicated SNP-levelassociations
Replicated gene-levelassociations
A B
C D
Figure S18: Summaries of replicated associations at multiple genomic scales among ancestrycohorts for all 25 traits analyzed using nominal p-value thresholds (SNP p-value < 5 ⇥ 10�5,gene p-value < 10�3). (A) Number and (C) proportion of genome-wide significant SNPs associated witha phenotype in at least one ancestry cohort that were replicated in at least two ancestry cohorts using anominal p-value threshold of 5⇥10�5. (B) Number and (D) proportion of genome-wide significant gene-levelassociations that replicate among ancestry cohorts using a nominal p-value threshold of 10�3. Expansion ofthree letter trait codes are given in Table S2.

Anthropometric Blood pressure Hematological Metabolic Kidney C-reactive protein
Count Count
Proportion Proportion
Replicated SNP-levelassociations
Replicated gene-levelassociations
A B
C D
Figure S19: Summaries of replicated associations at multiple genomic scales among ancestrycohorts for all 25 traits analyzed using nominal p-value thresholds (SNP p-value < 10�3, genep-value < 10�2). (A) Number and (C) proportion of genome-wide significant SNPs associated with aphenotype in at least one ancestry cohort that were replicated in at least two ancestry cohorts using anominal p-value threshold of 10�3. (B) Number and (D) proportion of genome-wide significant gene-levelassociations that replicate among ancestry cohorts using a nominal p-value threshold of 10�2. Expansion ofthree letter trait codes are given in Table S2. Expansion of three letter trait codes are given in Table S2.

African(PAGE)
European
South Asian
East Asian
Oceanian
African(PAGE)
European
South Asian
East Asian
Oceanian
Proportion of possible variants replicated228
12
13
16
33
8
39
22
162
455
10
120
187
8
1536
207
19
550
22
816Hispanic and Latin American
Hispanic and
Latin American
Figure S20: Pairwise replication of SNP-level association signals for C-reactive protein insix ancestral cohorts using genotype and imputed data. Imputed data was available and includedin this analysis for each of the six cohorts. The inclusion of imputed SNPs in GWA analysis of C-reactiveprotein increases both the number of significant SNPs in each ancestry (along the diagonal) as well as thenumber of replicating significant SNP-level associations among pairs of ancestry cohorts (lower triangular).The corresponding analysis of pairwise SNP-level replication using only genotype data from each cohort isshown in Figure 2C.


MCV
MCH
MC
HC
Hei
ght
Eos
inop
hil
Pla
tele
tD
BP
RB
CE
GF
RC
RP
Mon
ocyt
eB
asop
hil
BM
IHemoglobin
Hematocrit
Ura
teH
DL
SB
PLDL
Cholesterol
WBC
Neutrophil
Lym
phoc
yte
Trig
lyce
ride
HB
A1C
60
80
100
120
140
160
180
South Asian
Hemoglobin
Hematocrit
RB
CB
asop
hil
Hei
ght
BM
IP
late
let
Mon
ocyt
eU
rate
Trig
lyce
ride
Eos
inop
hil
EG
FRM
CH
CC
RP
Lym
phoc
yte
HB
A1C
HD
LDBP
SBP
LDL
Cholesterol
MCV
MCH
WBC
Neutrophil
60
70
80
90
100
110
120
130
140
150African (UKB)
Bra
nch
Leng
thB
ranc
h Le
ngth
150
200
250
300
350
400
European
Bra
nch
Leng
th
MCV
MCH
Hei
ght
BM
IH
BA
1CM
CH
CLy
mph
ocyt
eM
onoc
yte
Eos
inop
hil
CR
PB
asop
hil
WBC
Neutrophil
DBP
SBP
Ura
teE
GFR
Trig
lyce
ride
HD
LLDL
Cholesterol
Pla
tele
tRBC
Hemoglobin
Hematocrit
50
100
150
200
250
300
350
400
450
500 East Asian
Bra
nch
Leng
thB
ranc
h Le
ngth
LDL
Cholesterol
Lym
phoc
yte
Eos
inop
hil
Bas
ophi
lC
RP
Mon
ocyt
eH
eigh
tD
BP
MC
HC
Pla
tele
tW
BC
Neu
troph
ilH
BA
1CE
GFR BM
ITr
igly
cerid
eH
DL
RBC
Hemoglobin
Hematocrit
MCV
MCH
SB
PU
rate
BA
DC
Figure S21: Multiple prioritized trait clusters with shared core genetic trait architecturereplicate in the (A) African (UKB), (B) European, (C) South Asian, and (D) East Asianancestry cohorts. The WINGS algorithm identified prioritized phenotype clusters in each of these ancestrycohorts, denoted in each dendrogram as clades with emboldened lines. Three clusters of phenotypes werefound in all ancestries (shown and labeled in black), comprising: mean corpuscular volume (MCV) andmean corpuscular hemoglobin (MCH), hemoglobin and hematocrit, and the metabolic traits low-densitylipoprotein (LDL) and cholesterol levels. In both the European and East Asian ancestry cohorts, red bloodcell count (RBC) was also a member of the hemoglobin and hematocrit phenotype cluster. Two otherphenotype clusters were identified in at least two ancestry cohorts. One of these clusters contains whiteblood cell count (WBC) and neutrophil count, and the other contains diastolic and systolic blood pressure(DBP and SBP). These two clusters are color-coded according to the ancestry cohorts in which they areprioritized. The WINGS algorithm was applied to traits from each ancestry cohort separately as describedin the Supplemental Information.

Supplemental Tables150

Ance
stry
cohort
label
inth
isstudy
Stu
dy
Label
from
originalstudy
Sample
Size
Number
ofSNPs
European
UK
Bioban
kSelf-identified
whitebritish
349,411
1,933,096
EastAsian
Bioban
kJa
pan
EastAsian
19,190
-206,692
4,823,101-6,628,005
Hispan
ican
dLatin
American
PAGE
Admixed
Hispan
ican
dLatin
American
15,522
-21,955
8,576,622-8,822,607
African
-American
(PAGE)
PAGE
African
-American
3,750-17,280
12,107,345
-12,274,127
Sou
thAsian
UK
Bioban
kSelf-identified
Sou
thAsian
5,716
958,375
African
(UKB)
UK
Bioban
kAfrican
4,967
578,320
NativeHaw
aiian
PAGE
NativeHaw
aiian
1,777-3,938
6,656,996-6,966,169
American
Indian/A
laska
Native
PAGE
AIA
N574-645
3,970,247-8,504,923
Table
S1:Ance
stry
cohortsanalyze
din
this
study.
InstudieswhereGWA
summarystatistics
wereavailable
tous,
sample
size
andnu
mber
ofSNPsdi↵er
dueto
original
studydesign.Thespecificsample
size
andnu
mber
ofSNPsforeach
traitin
studiesfrom
Bioban
kJa
pan
andPAGE
areprovided
inTab
leS5-Tab
leS10.

Trait Name Code
Body mass index BMI
High density lipoprotein HDL
Low density lipoprotein LDL
Hemoglobin A1c HBA1C
Estimated glomerular filtration rate EGFR
C-reactive protein CRP
Systolic blood pressure SBP
Diastolic blood pressure DBP
Platelet count PLC
Mean corpuscular hemoglobin concentration MCHC
Mean corpuscular hemoglobin MCH
Mean corpuscular volume MCV
Red blood cell count RBC
White blood cell count WBC
Table S2: Abbreviations used throughout this study for 14 quantitative traits analyzed inthis study. The remaining 11 traits analyzed were Basophil count, Cholesterol, Eosinophil count, Height,Hematocrit, Hemoglobin, Lymphocyte count, Monocyte count, Neutrophil count, and Triglyceride levels,respectively. These are not abbreviated in the main text.

Trait Name or Code AIAN Native Hawaiian Hispanic
BMI Yes Yes Yes
Basophil count No No No
CRP Yes Yes Yes
Cholesterol Yes Yes Yes
DBP Yes No Yes
EGFR Yes No Yes
Eosinophil count No No No
HBA1C Yes Yes Yes
HDL Yes Yes Yes
Height Yes Yes Yes
Hematocrit No No No
Hemoglobin No No No
LDL Yes Yes Yes
Lymphocyte count No No No
MCH Yes No Yes
MCHC No No No
MCV No No No
Monocyte count No No No
Neutrophil count No No No
PLC Yes No Yes
RBC No No No
SBP Yes No Yes
Triglyceride No Yes Yes
Urate No No No
WBC Yes No Yes
Table S3: Traits assayed in the PAGE study data by ancestry cohort. Data were available foreach of the 25 listed traits in the UK Biobank European, South Asian, and African cohorts, as well as, theEast Asian cohort from the Biobank Japan. Thus, each trait was analyzed in a minimum of four ancestriesand a maximum of seven ancestries.

Trait
Number of significantSNPs in at least theEuropean or East
Asian cohort
Number of SNPs withsame direction of
e↵ect
Percentage of SNPswith same direction of
e↵ect
BMI 6,374 4,456 69.91
Basophil 884 520 58.82
CRP 694 463 66.71
Cholesterol 3,451 2,379 68.94
DBP 1,962 1,320 67.28
EGFR 7,129 5,038 70.67
Eosinophil 5,890 3,608 61.26
HBA1C 3,030 2,206 72.81
HDL 5,995 4,077 68.01
Height 33,577 22,090 65.79
Hematocrit 5,382 3,602 66.93
Hemoglobin 5,280 3,601 68.20
LDL 2,521 1,929 76.56
Lymphocyte 2,214 1,237 55.87
MCH 6,763 4,674 69.11
MCHC 1,760 1,124 63.86
MCV 7,489 5,208 69.54
Monocyte 3,929 2,565 65.28
Neutrophil 5,431 3,850 70.89
PLC 11,014 7,161 65.02
RBC 9,211 6,263 67.99
SBP 1,807 1,182 65.41
Triglyceride 3,743 2,686 71.76
WBC 6,017 4,105 68.22
Urate 5,864 3,787 64.58
Table S4: E↵ect size homogeneity in variants identified as significant in the European or EastAsian cohorts. In each of the 25 traits analyzed in this study a majority of variants that are significant inat least the European or East Asian cohorts had the same direction of e↵ect in the other ancestry cohort.

Trait Name or Code Sample Size Total SNPs Pruned SNPs Regions Citations
Basophil count 62,076 5,653,566 410,465 23,106 59
BMI 158,284 5,653,566 410,465 23,085 60
CRP 75,391 5,608,701 408,166 23,108 59
DBP 136,615 5,653,566 410,465 23,085 59
eGFR 143,658 5,608,701 408,166 23,108 59
Eosinophil count 62,076 5,653,566 410,465 23,106 59
HDL 70,657 5,608,701 408,166 23,108 59
Height 159,095 6,296,332 354,647 23,679 61
Hematocrit 108,757 5,653,566 410,465 23,106 59
Hemoglobin 108,769 5,653,566 410,465 23,085 59
HbA1c 75,391 5,608,701 408,166 23,108 59
LDL 72,866 5,608,701 408,166 23,108 59
Lymphocyte count 62,076 5,653,566 410,465 23,106 59
MCH 108,054 5,653,566 410,465 23,106 59
MCHC 108,738 5,653,566 410,465 23,106 59
MCV 108,526 5,653,566 410,465 23,085 59
Monocyte count 62,076 5,653,566 410,465 23,106 59
Neutrophil count 62,076 5,653,566 410,465 23,106 59
PLC 108,208 5,653,566 410,465 23,085 59
RBC 108,794 5,653,566 410,465 23,085 59
SBP 136,597 5,653,566 410,465 23,085 59
Cholesterol 128,305 5,608,701 408,166 23,108 59
Triglyceride 105,597 5,608,701 410,465 23,108 59
Urate 109,029 5,608,701 408,166 23,108 59
WBC 107,694 5,653,566 408,166 23,085 59
Table S5: Number of individuals, total SNPs, pruned SNPs used for gene-", and genes andtranscription factors (regions) included in the analysis for each trait in Biobank Japan data.Regions were defined using the hg19 list provided in Gusev et al. 62 .

Trait Name or Code Sample Size Total SNPs Pruned SNPs Regions
BMI 17,127 12,139,115 404,401 24,216
CRP 8,349 12,274,126 404,572 24,206
DBP 11,380 12,148,801 405,188 24,218
eGFR 8,261 12,128,273 403,371 24,207
Hemoglobin A1c 17,127 12,139,115 404,401 24,215
HDL 10,085 12,114,827 404,089 24,201
Height 17,280 12,139,907 404,522 24,201
LDL 9,720 12,107,344 403,740 24,218
MCHC 3,750 12,132,232 405,558 24,217
PLC 8,850 12,131,935 404,497 24,193
SBP 11,380 12,148,801 405,188 24,218
Cholesterol 10,137 12,110,337 403,674 24,222
Triglyceride 9,980 12,110,879 403,455 24,206
WBC 8,802 12,126,732 404,579 24,219
Table S6: Number of individuals, total SNPs, pruned SNPs used for gene-", and genes andtranscription factors (regions) included in the analysis for each trait in the African-Americancohort of the PAGE study data.
Trait Name or Code Sample Size Total SNPs Pruned SNPs Region Count
BMI 21,955 8,812,436 432,762 24,138
CRP 15,912 8,576,621 397,941 24,118
DBP 21,549 8,784,112 430,360 24,126
Estimated glomerular filtration rate 18,548 8,702,426 422,598 24,123
HbA1c 21,955 8,812,436 432,762 24,138
HDL 17,751 8,583,603 412,771 24,122
Height 22,187 8,822,606 433,604 24,132
LDL 17,373 8,588,800 413,074 24,116
MCHC 15,522 8,763,739 427,208 24,132
PLC 18,949 8,612,804 415,201 24,115
SBP 21,549 8,784,112 430,360 24,126
Cholesterol 17,802 8,586,887 412,830 24,115
Triglyceride 17,856 8,594,121 413,546 24,104
WBC 18,206 8,603,503 414,462 24,123
Table S7: Number of individuals, total SNPs, pruned SNPs used for gene-", and genes andtranscription factors (regions) included in the analysis for each trait in the Hispanic and LatinAmerican cohort of the PAGE study data.
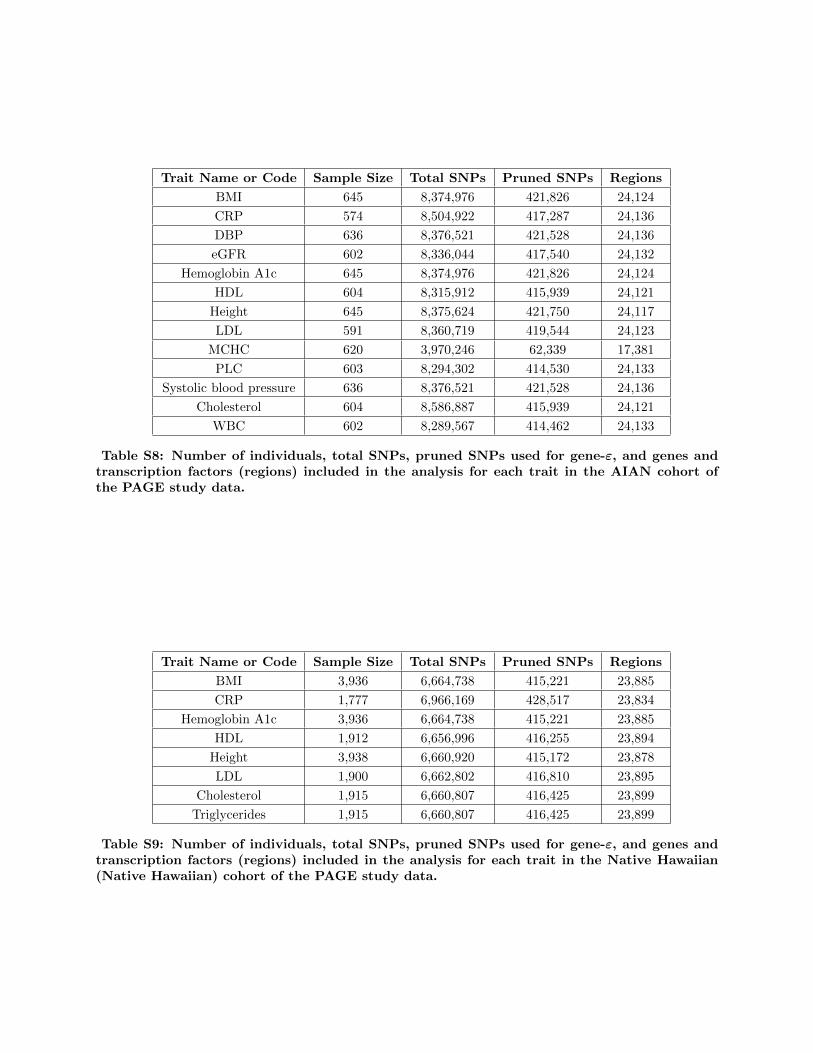
Trait Name or Code Sample Size Total SNPs Pruned SNPs Regions
BMI 645 8,374,976 421,826 24,124
CRP 574 8,504,922 417,287 24,136
DBP 636 8,376,521 421,528 24,136
eGFR 602 8,336,044 417,540 24,132
Hemoglobin A1c 645 8,374,976 421,826 24,124
HDL 604 8,315,912 415,939 24,121
Height 645 8,375,624 421,750 24,117
LDL 591 8,360,719 419,544 24,123
MCHC 620 3,970,246 62,339 17,381
PLC 603 8,294,302 414,530 24,133
Systolic blood pressure 636 8,376,521 421,528 24,136
Cholesterol 604 8,586,887 415,939 24,121
WBC 602 8,289,567 414,462 24,133
Table S8: Number of individuals, total SNPs, pruned SNPs used for gene-", and genes andtranscription factors (regions) included in the analysis for each trait in the AIAN cohort ofthe PAGE study data.
Trait Name or Code Sample Size Total SNPs Pruned SNPs Regions
BMI 3,936 6,664,738 415,221 23,885
CRP 1,777 6,966,169 428,517 23,834
Hemoglobin A1c 3,936 6,664,738 415,221 23,885
HDL 1,912 6,656,996 416,255 23,894
Height 3,938 6,660,920 415,172 23,878
LDL 1,900 6,662,802 416,810 23,895
Cholesterol 1,915 6,660,807 416,425 23,899
Triglycerides 1,915 6,660,807 416,425 23,899
Table S9: Number of individuals, total SNPs, pruned SNPs used for gene-", and genes andtranscription factors (regions) included in the analysis for each trait in the Native Hawaiian(Native Hawaiian) cohort of the PAGE study data.

Trait Name or Code Sample Size Total SNPs Pruned SNPs Regions
BMI 4,647 15,362,633 433,356 24,085
CRP 1,811 14,374,461 428,656 24,116
DBP 1,086 12,470,507 416,273 24,112
eGFR 150 8,314,417 337,167 24,017
HbA1c 4,647 15,362,633 433,356 24,085
HDL 2,378 13,413,244 428,598 24,072
Height 4,679 15,366,710 433,005 24,103
LDL 2,316 13,327,313 428,741 24,075
MCHC 128 8,089,136 315,583 23,946
PLC 541 10,528,072 421,929 24,098
SBP 1,086 12,470,507 416,273 24,112
Cholesterol 2,387 13,436,190 428,656 24,078
Triglyceride 2,381 13,423,953 429,246 24,073
WBC 543 10,570,051 421,776 24,095
Table S10: Number of individuals, total SNPs, pruned SNPs used for gene-", and genes andtranscription factors (regions) included in the analysis for each trait in the Asian cohort of thePAGE study data.

Tra
itNameorCode
African
orAfrican-A
mer
ican
East
Asian
AIA
NNativeHaw
aiian
Hispanic
(⇥10�
8)
(⇥10�
8)
(⇥10�
8)
(⇥10�
9)
(⇥10�
8)
Basop
hilcount
8.646*
8.844
NA
NA
NA
BMI
0.412
8.844
0.597
7.502
5.674
CRP
0.407
8.915
0.588
7.176
5.830
Cholesterol
0.414
8.915
0.601
7.507
5.823
DBP
0.412
8.844
0.597
NA
5.692
EGFR
0.412
8.915
0.600
NA
5.746
Eosinop
hilcount
8.646*
8.844
NA
NA
NA
HBA1C
0.412
8.915
0.597
7.502
5.674
HDL
0.413
8.915
0.601
7.511
5.825
Heigh
t0.412
7.941
0.597
7.506
5.667
Hem
atocrit
8.646*
8.844
NA
NA
NA
Hem
oglobin
8.646*
8.844
NA
NA
NA
LDL
0.413
8.914
0.598
7.504
5.822
Lym
phocytecount
8.646*
8.843
NA
NA
NA
MCH
8.646*
8.844
NA
NA
NA
MCHC
0.412
8.844
1.259
NA
5.705
MCV
8.646*
8.844
NA
NA
NA
Mon
ocytecount
8.646*
8.844
NA
NA
NA
Neutrop
hilcount
8.646*
8.844
NA
NA
NA
PLC
0.412
8.844
0.603
NA
5.805
RBC
8.646*
8.844
NA
NA
NA
SBP
0.412
8.844
0.597
NA
5.692
Triglyceride
0.413
8.915
NA
7.507
5.818
Urate
8.646*
8.915
NA
NA
NA
WBC
0.412
8.844
NA
NA
5.812
Table
S11:Bonferronip-valueth
resh
old
correc
ted
fornumber
ofSNP-lev
elassociation
testsper
form
edforea
chance
stry
-tra
itpair.
Thresholdsarecalculatedas
0.05
divided
bythenu
mber
ofSNPstested
ineach
ancestry-trait
pair.
Theterm
“NA”indicates
that
there
was
nodataforthat
ancestry-trait
pair.
ThethresholdforBon
ferron
i-correctedsign
ificance
was
thesameforeverytraitin
theEuropean(p-value
<2.587⇥10
�8)an
dSou
thAsian
(p-value<
5.217⇥10
�8)cohorts
from
theUK
Bioban
k.TraitsforwhichtheUK
Bioban
kAfrican
cohortwas
used
aredenoted
witha*;
otherwise,
theAfrican
-American
cohortfrom
thePAGE
studydatawas
used.See
Tab
leS2forexpan
sion
oftraitcodes.

Tra
itNameorCode
NominalSignifica
nce
Number
of
Number
of
Pro
portion
of
Uniden
tified
non-E
uro
pea
n
Thre
shold
Variants
Tested
Rep
lica
ted
Variants
Rep
lica
ted
Variants
Associations
MCV
1.46⇥10
�05
3,414
2,008
0.588
7,830
PLC
1.25⇥10
�05
3,998
1,792
0.448
6,073
Heigh
t2.80⇥10
�06
17,877
10406
0.582
37,360
BMI
2.22⇥10
�05
2,254
1,478
0.656
2,762
DBP
5.37⇥10
�05
931
528
0.567
719
SBP
8.17⇥10
�05
612
352
0.575
1,315
WBC
1.87⇥10
�05
2,680
1,192
0.445
17,800
RBC
1.71⇥10
�05
2,918
1,674
0.574
3514
Hem
oglobin
3.48⇥10
�05
1,436
5,80
0.404
368
Hem
atocrit
2.99⇥10
�05
1,670
1,068
0.640
524
MCH
1.56⇥10
�05
3,214
1,904
0.592
7,851
MCHC
4.58⇥10
�05
1,091
722
0.662
26,507
Lym
phocyte
8.03⇥10
�05
623
327
0.525
536
Mon
ocyte
3.53⇥10
�05
1,418
896
0.632
1,568
Neutrop
hil
5.07⇥10
�05
987
527
0.534
1,550
Eosinop
hil
4.00⇥10
�05
1,249
802
0.642
2,143
Basop
hil
9.62⇥10
�04
5249
0.942
2,017
Urate
2.56⇥10
�05
1,951
1,414
0.725
6,530
Triglyceride
3.99⇥10
�05
1,254
928
0.740
3,902
Cholesterol
1.96⇥10
�05
2,557
1,742
0.681
2,847
LDL
3.16⇥10
�05
1,580
1,115
0.706
1,735
HDL
2.86⇥10
�05
1,751
1,089
0.622
4,737
HBA1C
6.31⇥10
�05
7,92
4,16
0.525
899
EGFR
2.00⇥10
�05
2,506
1,315
0.525
2,227
Table
S12:Nominalp-valueth
resh
old
correc
tedfornumber
ofBonferroni-co
rrec
tedSNP-lev
elassociationsfoundin
theEuro
pea
nance
stry
cohort.Toillustrate
how
SNP-level
statisticalreplication
amon
gan
cestry
cohorts
isprohibited
byexternal
factors(e.g.sample
sizes,
genotyp
earraydesign),Wecalculatedthenu
mber
ofSNP-level
replication
swhen
thresholdsfornon
-Europeancohorts
arecalculatedas
0.05
divided
bythenu
mber
ofsign
ificant
SNPsin
theEuropeancohort.
This
designis
analogou
sto
atw
o-stageGWA
fram
ework,
wherenon
-Europeanan
cestry
cohorts
arenot
usedfordiscovery
andassociationsdiscoveredin
theEuropeanan
cestry
cohortareusedto
findreplicates.
Replication
ofSNP-level
associationsign
alsincreaseswhen
less
stringent
thresholdsareused.Number
ofvarian
tsthat
weretested
intheEuropeanan
cestry
cohortan
dat
least
onean
other
cohortwereincluded
inthiscalculation
andaregivenhere.
Wealso
includethenu
mber
ofvarian
tsthat
wereidentified
innon
-European
ancestry
cohorts
usingaBon
ferron
i-correctedsign
ificance
thresholdto
illustrate
how
thisstudydesignmay
misssign
alsin
other
ancestries.See
Tab
leS2forexpan
sion
oftraitcodes.

Gen
eEuro
pea
nEast
Asian
South
Asian
African-A
mer
ican
Hispanic
and
Latin
Amer
ican
AIA
NNativeHaw
aiian
MCV
0.013-0.153
0.024-0.153
0.136-0.268
0.113-0.522
NA
NA
NA
PLC
0.0132-0.190
0.024-0.140
0.124-0.171
5.715-17.196
3.732-18.805
100.736-100.736
0.0
Heigh
t0.009-0.115
0.0178-0.150
NA
0.064-0.267
0.051-0.113
NA
NA
BMI
0.0133-0.113
0.020-0.110
NA
0.068-0.068
0.064-0.101
NA
NA
DBP
0.0136-0.070
0.022-0.074
NA
NA
0.787-0.806
NA
NA
SBP
0.0129-0.066
0.022-0.064
NA
NA
4.64-4.643
NA
NA
WBC
0.0135-0.122
0.024-0.104
0.117-0.145
0.027-0.198
0.018-0.112
NA
NA
RBC
0.012-0.107
0.025-0.142
NA
0.115-0.297
NA
NA
NA
Hem
oglobin
0.0108-0.129
0.025-0.083
NA
0.162-0.232
NA
NA
NA
Hem
atocrit
0.011-0.093
0.024-0.085
NA
0.241-0.241
NA
NA
NA
MCH
0.013-0.159
0.024-0.153
0.104-0.277
0.109-0.541
NA
NA
NA
MCHC
0.014-0.115
0.024-0.106
NA
0.152-1.28
0.088-0.489
0.118-9.222
MA
Lym
phocyte
0.014-0.078
0.033-0.264
0.503-0.503
0.647-0.647
NA
NA
NA
Mon
ocyte
0.0133-0.195
0.0329-0.123
NA
0.423-0.423
NA
NA
NA
Neutrop
hil
0.014-0.160
0.033-0.106
0.123-0.142
0.108-0.518
NA
NA
NA
Eosinop
hil
0.013-0.149
0.033-0.188
NA
NA
NA
NA
NA
Basop
hil
0.014-0.120
0.033-0.167
0.363-0.581
0.241-0.626
NA
NA
NA
Urate
0.0112-0.097
0.024-0.346
0.092-0.251
0.104-0.682
NA
NA
NA
Triglyceride
0.013-0.204
0.0247-0.318
0.113-0.311
0.043-0.616
0.032-0.159
NA
0.102-0.169
Cholesterol
0.013-0.309
0.023-0.285
0.118-0.268
4.280-30.434
2.734-15.098
NA
NA
LDL
0.0136-0.121
0.030-0.514
0.139-0.367
3.785-29.006
2.371-18.999
16.273-33.101
14.133-16.297
HDL
0.013-0.296
0.030-0.529
0.106-0.369
1.368-23.818
0.838-32.374
NA
22.726-46.409
HBA1C
0.013-0.090
0.039-0.139
NA
0.068-0.068
0.064-0.101
NA
NA
EGFR
0.0133-0.195
0.021-0.095
0.119-0.162
NA
1.102-1.102
12.494-27.656
0.0
CRP
0.0137-0.122
0.0300-0.127
0.106-0.263
0.094-0.418
0.0626-0.434
NA
0.211-0.254
Table
S13:Rangeofe↵
ectsize
sforsignifica
ntSNPsin
each
ance
stry
cohort.
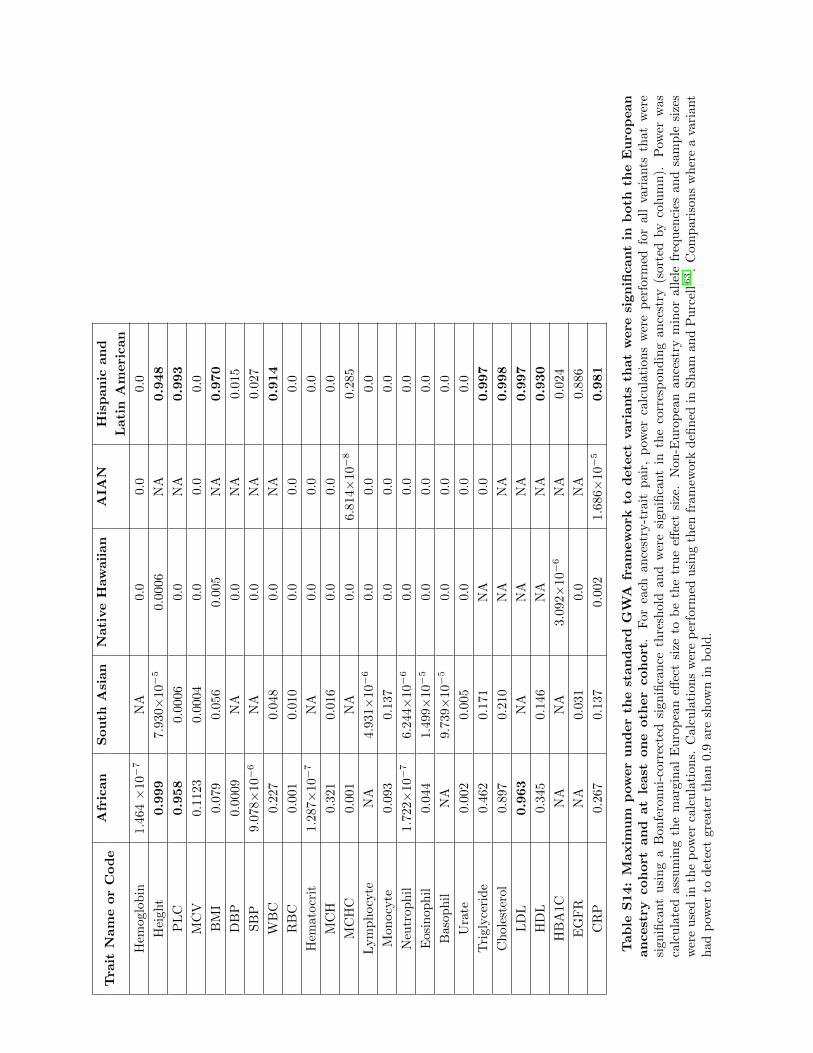
Tra
itNameorCode
African
South
Asian
NativeHaw
aiian
AIA
NHispanic
and
Latin
Amer
ican
Hem
oglobin
1.464⇥10
�7
NA
0.0
0.0
0.0
Heigh
t0.999
7.930⇥
10�5
0.0006
NA
0.948
PLC
0.958
0.0006
0.0
NA
0.993
MCV
0.1123
0.0004
0.0
0.0
0.0
BMI
0.079
0.056
0.005
NA
0.970
DBP
0.0009
NA
0.0
NA
0.015
SBP
9.078⇥
10�6
NA
0.0
NA
0.027
WBC
0.227
0.048
0.0
NA
0.914
RBC
0.001
0.010
0.0
0.0
0.0
Hem
atocrit
1.287⇥
10�7
NA
0.0
0.0
0.0
MCH
0.321
0.016
0.0
0.0
0.0
MCHC
0.001
NA
0.0
6.814⇥
10�8
0.285
Lym
phocyte
NA
4.931⇥
10�6
0.0
0.0
0.0
Mon
ocyte
0.093
0.137
0.0
0.0
0.0
Neutrop
hil
1.722⇥
10�7
6.244⇥
10�6
0.0
0.0
0.0
Eosinop
hil
0.044
1.499⇥
10�5
0.0
0.0
0.0
Basop
hil
NA
9.739⇥
10�5
0.0
0.0
0.0
Urate
0.002
0.005
0.0
0.0
0.0
Triglyceride
0.462
0.171
NA
0.0
0.997
Cholesterol
0.897
0.210
NA
NA
0.998
LDL
0.963
NA
NA
NA
0.997
HDL
0.345
0.146
NA
NA
0.930
HBA1C
NA
NA
3.092⇥
10�6
NA
0.024
EGFR
NA
0.031
0.0
NA
0.886
CRP
0.267
0.137
0.002
1.686⇥
10�5
0.981
Table
S14:M
axim
um
power
under
thestandard
GW
Aframew
ork
todetec
tvariants
thatwer
esignifica
ntin
both
theEuro
pea
nance
stry
cohort
and
atleast
one
oth
erco
hort.
For
each
ancestry-trait
pair,
pow
ercalculation
swereperform
edforallvarian
tsthat
were
sign
ificant
usingaBon
feronni-correctedsign
ificance
thresholdan
dweresign
ificant
inthecorrespon
dingan
cestry
(sortedby
column).
Pow
erwas
calculatedassumingthemarginal
Europeane↵
ectsize
tobethetruee↵
ectsize.Non
-Europeanan
cestry
minor
allele
frequencies
andsample
sizes
wereusedin
thepow
ercalculation
s.Calculation
swereperform
edusingthen
fram
eworkdefined
inSham
andPurcell6
3.Com
parison
swhereavarian
thad
pow
erto
detectgreaterthan
0.9areshow
nin
bold.

Tra
itNameorCode
African
South
Asian
NativeHaw
aiian
AIA
NHispanic
and
Latin
Amer
ican
Hem
oglobin
0(1)
NA
0.0
0.0
0.0
Heigh
t4(56)
0(2)
0(5)
NA
16(408)
PLC
1(163)
0(8)
0.0
NA
6(262)
MCV
0(18)
0(7)
0.0
0.0
0.0
BMI
0(3)
0(1)
0(35)
NA
48(212)
DBP
0(1)
NA
0.0
NA
0(109)
SBP
0(1)
NA
0.0
NA
0(99)
WBC
0(71)
0(25)
0.0
NA
35(104)
RBC
0(3)
0(3)
0.0
0.0
0.0
Hem
atocrit
0(1)
NA
0.0
0.0
0.0
MCH
0(22)
0(8)
0.0
0.0
0.0
MCHC
0(3)
NA
0.0
0(135)
0(110)
Lym
phocyte
NA
0(7)
0.0
0.0
0.0
Mon
ocyte
0(1)
0(2)
0.0
0.0
0.0
Neutrop
hil
0(2)
0(32)
0.0
0.0
0.0
Eosinop
hil
0(7)
0(1)
0.0
0.0
0.0
Basop
hil
NA
0(2)
0.0
0.0
0.0
Urate
0(1)
0(8)
0.0
0.0
0.0
Triglyceride
0(30)
0(61)
NA
0.0
124(311)
Cholesterol
0(85)
0(11)
NA
NA
16(943)
LDL
7(132)
NA
NA
NA
17(634)
HDL
0(21)
0(31)
NA
NA
2(241)
HBA1C
NA
NA
0(39)
NA
0(73)
EGFR
NA
0(86)
0.0
NA
0(5)
CRP
0(136)
0(32)
0(27)
0(8)
12(358)
Table
S15:Number
ofvariants
thathadgre
aterth
an90%
power
under
thestandard
GW
Aframew
ork
thatwer
esignifica
ntin
the
Euro
pea
nance
stry
cohort
and
atleast
oneoth
erco
hort.Numbersin
parentheses
arethetotalnu
mber
ofvarian
tsthat
could
becompared
betweentheEuropeanan
dcorrep
onding(column)an
cestry
cohort.
Pow
erwas
calculatedassumingthemarginal
Europeane↵
ectsize
tobethetrue
e↵ectsize.Non
-Europeanan
cestry
minor
allele
frequencies
andsample
sizeswereusedin
thepow
ercalculation
s.Calculation
swereperform
edusing
then
fram
eworkdefined
inSham
andPurcell6
3.

Tra
itAfrican
orAfrican-A
mer
ican
East
Asian
AIA
NNativeHaw
aiian
Hispanic
and
Latin
Amer
ican
(⇥10�
6)
(⇥10�
6)
(⇥10�
6)
(⇥10�
6)
(⇥10�
6)
Basop
hilcount
1.121
2.197
NA
NA
NA
BMI
2.096
2.197
2.073
2.093
2.072
CRP
2.097
2.085
2.072
2.100
2.073
Cholesterol
2.096
2.198
2.073
2.092
2.073
DBP
2.096
2.197
2.072
NA
2.073
EGFR
2.097
2.198
2.073
NA
2.073
Eosinop
hilcount
2.121*
2.197
NA
NA
NA
HBA1C
2.096
2.198
2.073
2.093
2.072
HDL
2.097
2.198
2.073
2.093
2.073
Heigh
t2.097
2.131
2.073
2.094
2.072
Hem
atocrit
2.121*
2.197
NA
NA
NA
Hem
oglobin
2.121*
2.197
NA
NA
NA
LDL
2.096
2.198
2.073
2.093
2.073
Lym
phocytecount
2.121*
2.197
NA
NA
NA
MCH
2.121*
2.197
NA
NA
NA
MCHC
2.096
2.197
2.877
NA
2.072
MCV
2.121*
2.197
NA
NA
NA
Mon
ocytecount
2.121*
2.197
NA
NA
NA
Neutrop
hilcount
2.121*
2.197
NA
NA
NA
PLC
2.097
2.197
2.072
NA
2.073
RBC
2.121*
2.197
NA
NA
NA
SBP
0.412
8.844
0.597
NA
5.692
Triglyceride
2.096
2.197
NA
2.072
2.073
Urate
2.121*
2.197
NA
NA
NA
WBC
2.092
2.197
2.072
NA
2.073
Table
S16:Bonferronip-valueth
resh
old
correc
ted
fornumber
ofgen
e-level
association
testsper
form
edforea
chance
stry
-tra
itpair.
Thresholdsarecalculatedas
0.05
divided
bythenu
mber
ofSNPstested
ineach
ancestry-trait
pair.
Theterm
“NA”indicates
that
there
was
nodataforthat
ancestry-trait
pair.
ThethresholdforBon
ferron
i-correctedsign
ificance
was
thesameforeverytraitin
theEuropean(p-value
<2.092⇥10
�6)an
dSou
thAsian
(p-value<
1.085⇥10
�6)cohorts
from
theUK
Bioban
k.TraitsforwhichtheUK
Bioban
kAfrican
cohortwas
used
aredenoted
witha*;
otherwise,
theAfrican
-American
cohortfrom
thePAGE
studydatawas
used.See
Tab
leS2forexpan
sion
oftraitcodes.

Tra
itNameorCode
Initialgen
e-level
Pru
ned
gen
e-level
Number
of
Pro
portion
of
associations
associationsr2>
0.25
replica
ted
associations
replica
ted
associations
MCV
434
336
174
0.400
PLC
241
295
116
0.481
Heigh
t192
327
119
0.620
BMI
347
482
930.268
DBP
215
717
630.293
SBP
524
375
530.101
WBC
167
279
490.293
RBC
233
476
770.330
Hem
oglobin
175
525
790.451
Hem
atocrit
267
356
720.270
MCH
246
562
161
0.654
MCHC
205
388
106
0.517
Lym
phocyte
3852
230.605
Mon
ocyte
179
122
710.397
Neutrop
hil
211
549
124
0.588
Eosinop
hil
87482
560.644
Basop
hil
88237
350.398
Urate
391
444
540.138
Triglyceride
285
346
136
0.477
Cholesterol
167
477
136
0.814
LDL
120
443
670.558
HDL
213
496
136
0.638
HBA1C
235
421
890.379
CRP
105
526
340.324
EGFR
294
181
770.262
Table
S17:Number
andpro
portionofgen
e�"gen
e-level
associationsth
atare
replica
tedunder
amore
stringen
tpru
ningth
resh
old.
Inou
rinitialan
alysis
oftheEuropeanan
cestry
cohortwepruned
allvarian
tsusingan
r2>
0.5threshold.Here,
wesetthethresholdas
r2>
0.25
andrecalculatedthegene�
"gene-levelassociationstatistics
foreach
trait(see
).Replication
ofassociated
genes
usingdi↵erentr2thresholdsvaries
bytrait,
theinclusion
ofas
man
ySNPsas
computation
ally
possible
inthegene-"fram
eworkis
optimal
inidentifyingtraitassociated
genes.

Tra
it
PESCA
EUR
only
and
EUR
GW
Anominal
significa
nce
PESCA
EAS
only
and
EAS
GW
Anominal
significa
nce
PESCA
both
and
EUR
GW
Anominal
significa
nce
PESCA
both
and
EAS
GW
Anominal
significa
nce
PESCA
both
and
GW
Anominal
significa
nce
inboth
BMI
00
97539
94
Cholesterol
213
1454
11
HDL
58
2974
27
LDL
06
1643
13
MCH
314
39180
39
MCV
111
44215
44
Triglyceride
48
1549
15
Table
S18:Over
lapbetwee
nSNPsiden
tified
byPESCA
andGW
Aanalysesin
theEuro
pea
nance
stry
cohort
from
theUK
Biobank
and
theEast
Asian
ance
stry
cohort
from
theBiobankJapan.For
sevencontinuou
straits,wecompared
SNP-level
associationp-values
from
ouran
alysis
totheposterior
probab
ilitiescalculatedin
Shiet
al.6
4usingthePESCA
fram
ework.
For
each
oftheseventraits,therewereSNPsthat
had
aposterior
probab
ility>
0.8of
beingcausalin
bothan
cestries
andwerealso
nom
inally
sign
ificant
(p-value5<
10�6
)usingthestan
dardGWA
SNP-level
fram
ework.

Trait Name orCode
Median E↵ectSize Correlation
E↵ect Sizes> 0.1 (Mean)
Median PIPCorrelation
PIPs > 0.01(Mean)
BMI 0.0143 0 0.073 67.3
Basophil 3.69⇥10�6 0 0.002 211.8
CRP 0.096 0.7 0.159 142.6
Cholesterol 0.966 1 0.232 53.1
DBP 0.001 0.6 0.012 173.1
EGFR 4.71⇥10�6 0 0.005 149
Eosinophil 0.0179 0.2 0.042 325.8
HBA1C 0.012 0.2 0.025 26.8
HDL 0.325 0.1 0.219 57.6
Height 9.20⇥10�5 1.6 0.010 187.7
Hematocrit -4.16⇥10�6 0.5 0.015 40.3
Hemoglobin -1.13⇥10�5 0.6 0.014 45.8
LDL 0.949 1 0.331 60.9
Lymphocyte -1.01⇥10�6 1.5 0.001 1368.5
MCH 7.098⇥10�6 0.6 0.007 60.9
MCHC -2.00⇥10�6 0.9 0.01 58.7
MCV 1.71⇥10�5 0.6 0.01 70
Monocyte 0.002 0.1 0.017 349.4
Neutrophil 0.038 0.1 0.071 66.5
PLC 0.609 0.9 0.154 112.5
RBC 9.650⇥10�5 0.9 0.028 49.7
SBP 0.001 0.6 0.019 166.8
Triglyceride 0.348 0.0 0.247 164.7
Urate 0.252 0.5 0.24 39.9
WBC 0.0002 0.1 0.01 347.8
Table S19: Replication of e↵ect sizes and posterior inclusion probabilities (PIPs) among tenindependent subsamples of the UK Biobank European ancestry cohort using SuSiE65 for fine-mapping. The sample size of the ten independent, non-overlapping subsamples of the UK Biobank Europeanancestry cohort was set to 10,000. For the 1,895,051 SNPs that were analyzed in every European ancestrycohort subsample ( Table S1) and the e↵ect sizes and PIPs (columns 2 and 4, respectively) generated using theSuSiE method65, we calculated the median correlation coe�cient between all possible pairwise comparisons(10 choose 2) of the European ancestry cohort subsamples. Column 3 reports the mean number of SNPswith e↵ect sizes greater than 0.1 across all ten European ancestry cohort subsamples for each trait. Column5 reports the mean number of SNPs with a posterior inclusion probability greater than 0.01 across the tenEuropean ancestry cohort subsamples for each trait.

Tra
itName
orCode
Number
of
Share
dE↵ec
tSizes
>0.1
Med
ian
E↵ec
tSize
Correlation
African
E↵ec
tSizes
>0.1
Euro
pea
nE↵ec
tSizes
>0.1
(Mea
n)
Number
of
Share
dPIP
s>
0.01
Med
ian
PIP
Correlation
African
PIP
s>
0.01
Euro
pea
nPIP
s>
0.01(M
ean)
BMI
05.12⇥10
�5
20
10.027
1206
8.9
Basop
hil
0-3.01⇥
10�5
00
00.001
403
40.3
CRP
0-3.68⇥
10�6
00.4
05.88
⇥10
�5
9533.6
Cholesterol
10.5
10.9
50.467
1144
8.4
DBP
01.58⇥10
�5
100.3
00.008
1249
20.3
EGFR
02.41⇥10
�6
10
00.001
984
24.7
Eosinop
hil
0-1.97⇥
10�5
00
00.003
979
29.3
HBA1C
0-1.15⇥
10�6
50.2
00.004
959
6.5
HDL
00.014
00.1
20.014
3111.6
Heigh
t0
-1.22⇥
10�5
190.7
00.003
208
33.7
Hem
atocrit
0-1.14⇥
10�5
10
00.016
199
12.2
Hem
oglobin
0-6.31⇥
10�6
10
00.022
568
12.5
LDL
10.674
11
80.497
995
13.5
Lym
phocyte
02.71⇥10
�5
00
10.001
60115.5
MCH
01.14⇥10
�5
10.2
00.005
1332
11.8
MCHC
0-1.56⇥
10�6
10.2
00.008
646
13.6
MCV
02.58⇥10
�6
10.2
00.005
917
11.8
Mon
ocyte
0-2.44⇥
10�5
00
20.002
2215
27.7
Neutrop
hil
0-0.0001
10
00.001
2386
10.2
PLC
0-0.017
10.6
30.035
2088
13.7
RBC
0-6.35⇥
10�6
10.1
0-0.002
312.7
SBP
04.31⇥10
�5
130.1
00.008
1133
20
Triglyceride
00.004
00.1
80.009
2231
25.6
Urate
10.01
20.3
30.051
334
9.8
WBC
0-0.0001
10
50.0006
2862
48.3
Table
S20:
Rep
lica
tion
ofe↵
ectsize
sand
poster
iorinclusion
pro
babilities(P
IPs)
betwee
nth
eUK
Biobank
African
ance
stry
cohort
and
ten
indep
enden
tsu
bsa
mplesofth
eUK
Biobank
Euro
pea
nance
stry
cohort
using
SuSiE
65forfine-mapping.Eachof
thetenindep
endent,
non
-overlap
pingsubsamplesof
theUK
Bioban
kEuropeanan
cestry
cohortwas
setto
beequal
insize
tothesample
size
ofthe
African
ancestry
cohort(N
=4,967),Tab
leS1.
Columnheaderscontaining”(mean)”
indicateameanisgenerated
averagingover
thetenindep
endent
Europeanan
cestry
cohortsubsamples.
For
the496,997SNPsthat
werean
alyzed
inboththeAfrican
ancestry
cohortan
deveryEuropeanan
cestry
cohortsubsample,wecompared
theSuSiE
65e↵
ectsize
estimates
andPIP
s.For
bothe↵
ectsizesan
dPIP
s,themediancorrelationcoe�
cientbetween
theAfrican
ancestry
cohortan
dthepairw
isecomparison
toeach
Europeanan
cestry
cohortsubsample
isreportedin
thethirdan
dseventhcolumns,
respectively.Column3reports
thetotalnu
mber
ofSNPswithe↵
ectsizesgreaterthan
0.1in
theAfrican
cohort.
Columnfourgivesthemeannu
mber
ofe↵
ectsizesgreaterthan
0.1in
theEuropeanan
cestry
cohortsubsamplesforeach
trait.
Weperform
edthesamecomparison
forthePIP
susinga
thresholdof
0.01.Column2reports
thenu
mber
ofSNPsthat
surpassedan
e↵ectsize
of0.1in
boththeAfrican
ancestry
cohortan
dat
leaston
eof
theEuropeanan
cestry
cohortsubsamples.
Column6reports
thenu
mber
ofSNPsthat
surpassesaPIP
of0.01
intheAfrican
ancestry
cohortan
dat
leaston
eEuropeanan
cestry
cohortsubsample.

Tra
itName
orCode
Number
of
Share
dE↵ec
tSizes
>0.1
Med
ian
E↵ec
tSize
Correlation
South
Asian
E↵ec
tSizes
>
0.1
Euro
pea
nE↵ec
tSizes
>0.1
(Mea
n)
Number
of
Share
dPIP
s>
0.01
Med
ian
PIP
Correlation
South
Asian
PIP
s>
0.01
Euro
pea
nPIP
s>
0.01(M
ean)
BMI
07.07⇥10
�5
10
00.0173
180
18
Basop
hil
0-1.10⇥
10�5
00
00.0008
210
78.4
CRP
00.0309
00.4
170.121
181
64.7
Cholesterol
00.004
00.9
20.0127
209
DBP
0-2.12⇥
10�5
00.6
00.013
115
40
EGFR
0-1.26⇥
10�5
00
05.12
⇥10
�5
452
44.2
Eosinop
hil
02.16⇥10
�5
00
00.006
6369.1
HBA1C
0-3.33⇥
10�5
20.3
00.011
133
13.3
HDL
00.525
00.1
30.505
7812.2
Heigh
t0
-2.13⇥
10�5
121.1
10.001
754
66.8
Hem
atocrit
0-4.78⇥
10�6
10.3
06.24
⇥10
�5
2417.4
Hem
oglobin
0-4.19⇥
10�6
10.3
00.011
1916.1
LDL
00.491
11
140.386
4415.6
Lym
phocyte
0-4.40⇥
10�6
01.1
00.0001
113
343.1
MCH
05.29⇥10
�6
20.5
00.008
7822.3
MCHC
0-5.77⇥
10�6
10.9
00.007
4520.3
MCV
01.74⇥10
�5
30.5
00.005
8126.3
Mon
ocyte
0-4.05⇥10
�6
00.1
00.001
156
76.8
Neutrop
hil
00.221
00
160.172
7025.7
PLC
00.577
00.8
10.679
126
22.7
RBC
02.79
⇥10
�6
00.3
0-0.011
4120.9
SBP
0-0.0004
00.3
00.037
116
43.2
Triglyceride
00.158
00
530.173
189
46.4
Urate
00.137
10.4
60.150
5215.8
WBC
00.001
00
180.008
5293
Table
S21:Rep
lica
tionofe↵
ectsize
sandposter
iorinclusionpro
babilities(P
IPs)
betwee
nth
eUK
BiobankSouth
Asianance
stry
cohort
and
ten
indep
enden
tsu
bsa
mplesofth
eUK
Biobank
Euro
pea
nance
stry
cohort
using
SuSiE
65forfine-mapping.Eachof
thetenindep
endent,
non
-overlap
pingsubsamplesof
theUK
Bioban
kEuropeanan
cestry
cohortwas
setto
beequal
insize
tothesample
size
oftheSou
thAsian
ancestry
cohort(N
=5,660),Tab
leS1.
Columnheaderscontaining”(mean)”
indicateameanis
generated
averagingover
theten
indep
endentEuropeanan
cestry
cohortsubsamples.
For
the863,569SNPsthat
werean
alyzed
inboththeSou
thAsian
ancestry
cohortan
devery
Europeanan
cestry
cohortsubsample,wecompared
theSuSiE
65e↵
ectsize
estimates
andPIP
s.For
bothe↵
ectsizesan
dPIP
s,themediancorrelation
coe�
cientbetweentheSou
thAsian
ancestry
cohortan
dthepairw
isecomparison
toeach
Europeanan
cestry
cohortsubsample
isreportedin
the
thirdan
dseventhcolumns,
respectively.Column3reports
thetotalnu
mber
ofSNPswithe↵
ectsizesgreaterthan
0.1in
theSou
thAsian
cohort.
Columnfourgivesthemeannu
mber
ofe↵
ectsizesgreaterthan
0.1in
theEuropeanan
cestry
cohortsubsamplesforeach
trait.
Weperform
edthe
samecomparison
forthePIP
susingathresholdof
0.01.Column2reports
thenu
mber
ofSNPsthat
surpassedan
e↵ectsize
of0.1in
boththeSou
thAsian
ancestry
cohortan
dat
leaston
eof
theEuropeanan
cestry
cohortsubsamples.
Column6reports
thenu
mber
ofSNPsthat
surpassesaPIP
of0.01
intheSou
thAsian
ancestry
cohortan
dat
leaston
eEuropeanan
cestry
cohortsubsample.

Tra
itNameorCode
Coch
ran’s
QamongEuro
pea
nCoch
ran’s
Qbetwee
nAfrican
Coch
ran’s
Qbetwee
nSouth
Asian
subsa
mples(p-value)
and
Euro
pea
nsu
bsa
mples(p-value)
and
Euro
pea
nsu
bsa
mples(p-value)
Heigh
t641.91
(2.10e-132)
395.01
(1.09e-78)
4036.8(0.0)
BMI
316.69
(7.48e-63)
6,916.75
(0.0)
1076.76(5.39e-225)
MCV
160.05
(7.25e-30)
11,489.97(0.0)
155.06
(3.37e-28)
PLC
51.29(6.15e-08)
13,141.96(0.0)
386.07
(8.67e-77)
DBP
254.32
(1.22e-49)
9,725.02
(0.0)
241.54
(3.26e-46)
SBP
126.20
(7.16e-23)
1,0479.39(0.0)
286.38
(1.17e-55)
WBC
1458.39(1.87e-308)
20,351.80(0.0)
374.37
(2.65e-74)
RBC
102.75
(4.36e-18)
29.34(0.001)
153.12
(8.51e-28)
Hem
oglobin
114.35
(1.91e-20)
5,022.47
(0.0)
76.74(2.18e-12)
Hem
atocrit
149.67
(1.03e-27)
1,205.09
(1.15e-252)
93.03(1.34e-15)
MCH
90.29(1.42e-15)
14,366.33(0.0)
158.25
(7.44e-29)
MCHC
260.58
(5.80e-51)
14,674.80(0.0)
112.79
(1.46e-19)
Lym
phocyte
3105.01(0.0)
396.931(4.23e-79)
1,062.61
(6.05e-222)
Mon
ocyte
811.20
(8.26e-169)
9,186.25
(0.0)
433.65
(6.41e-87)
Neutrop
hil
95.72(1.15e-16)
24,580.86(0.0)
141.67
(1.92e-25)
Eosinop
hil
4,919.90
(0.0)
3,615.16
(0.0)
873.53
(3.16e-181)
Basop
hil
833.69
(1.18e-173)
1,879.65
(0.0)
541.10
(7.19e-110)
Urate
73.29(3.44e-12)
93.37(1.15e-15)
110.03
(5.26e-19)
HBA1C
100.17
(1.45e-17)
14,073.79(0.0)
639.21
(6.93e-131)
EGFR
361.48
(2.23e-72)
11,478.25(0.0)
3,012.83
(0.0)
CRP
288.30
(7.91e-57)
117.51
(1.62e-20)
509.40
(4.33e-103)
Triglyceride
138.42
(2.19e-25)
9,133.51
(0.0)
564.80
(6.09e-115)
HDL
175.95
(3.54e-33)
30.98(0.00059)
292.39
(6.32e-57)
LDL
101.33
(8.45e-18)
3,935.88
(0.0)
86.14(3.12e-14)
Cholesterol
158.82
(1.30e-29)
5,919.75
(0.0)
43.87(3.47e-06)
Table
S22:
Coch
ran’s
QSta
tisticsand
p-values
forco
mpariso
nsofSuSiE
65
forfine-mapping
poster
iorinclusion
pro
babilities
amongUKB
ance
stry
cohorts.
WecalculatedtheCochran’s
Qstatisticforposterior
inclusion
probab
ilities>
0.01
foreach
pairw
isecomparison
ofEuropeancohortsubsamples.
Wereportedthemedianvalueof
thesecomparison
sforeach
trait.
Wethen
calculatedthemedianCochran’sQ
when
comparingthetenEuropeansubsamplesto
theAfrican
andSou
thAsian
ancestry
cohorts
intheUK
Bioban
k.

False discovery rate
gene-"
Structured Population Unstructured Population
Sparsity 0.01 0.1 0.01 0.1
h2 = 0.2 0 (0) 0.010 (0.044) h
2 = 0.2 0.418 (0.183) 0.618 (0.085)
h2 = 0.6 0.020 (0.141) 0 (0) h
2 = 0.6 0.097 (0.284) 0.327 (0.245)
GWAS
Sparsity 0.01 0.1 Sparsity 0.01 0.1
h2 = 0.2 0.447 (0.153) 0.636 (0.075) h
2 = 0.2 0.01 (0.1) 0.001 (0.011)
h2 = 0.6 0.127 (0.324) 0.38 (0.241) h
2 = 0.6 0.057 (0.227) 0 (0)
Power
gene-"
Structured Population Unstructured Population
Sparsity 0.01 0.1 Sparsity 0.01 0.1
h2 = 0.2 0.023 (0.043) 0.045 (0.104) h
2 = 0.2 0.002 (0.038) 0.392 (0.108)
h2 = 0.6 0.0006 (0.0006) 0.0002 (0.002) h
2 = 0.6 0.0006 (0.0006) 0.0004 (0.002)
GWAS
Sparsity 0.01 0.1 Sparsity 0.01 0.1
h2 = 0.2 0.154 (0.038) 0.397 (0.052) h
2 = 0.2 0.010 (0.038) 0.001 (0.108)
h2 = 0.6 0.0002 (0.0008) 0.005 (0.004) h
2 = 0.6 0.057 (0.0006) 0 (0.002)
Table S23: Performance of the standard GWA framework and gene-" in simulations of asmall cohort with N = 2, 000 individuals. Mean false discovery rate and power for 100 simulations of apopulation under each parameter set shown in Figure S8. Standard errors are given in parentheses.

Gene African-American European South Asian East Asian AIANHispanic and
Latin American
RDH13 4.14⇥ 10�10 9.95⇥ 10�1 8.80⇥ 10�2 1.76⇥ 10�6 1 7.88⇥ 10�1
AGPAT5 1 1.30⇥ 10�6 7.83⇥ 10�1 5.00⇥ 10�1 7.33⇥ 10�8 1
GP6 7.20⇥ 10�10 9.93⇥ 10�1 1.47⇥ 10�1 9.07⇥ 10�7 1 6.92⇥ 10�1
ALDH2 1 1.00⇥ 10�20 1.13⇥ 10�2 1.00⇥ 10�20 1 1
RAB8A 9.57⇥ 10�1 1.00⇥ 10�20 1 5.76⇥ 10�6 1 9.97⇥ 10�1
CUX2 1 5.13⇥ 10�7 1.16⇥ 10�1 3.44⇥ 10�11 1 1
ACAD10 1 1.47⇥ 10�10 1.10⇥ 10�2 2.00⇥ 10�10 1 1
Table S24: Gene-level association p-values for seven genes associated with platelet count inat last two ancestry cohorts. Of the 65 genes that were associated with platelet count in at least twoancestry cohorts, these seven contained previously identified SNP-level associations in studies submittedto the GWAS Catalog. Previous associations in the GWAS Catalog are discussed in the SupplementalInformation. Ancestry-specific Bonferroni corrected significance thresholds for gene-level association analysisof platelet count are shown in Table S16.
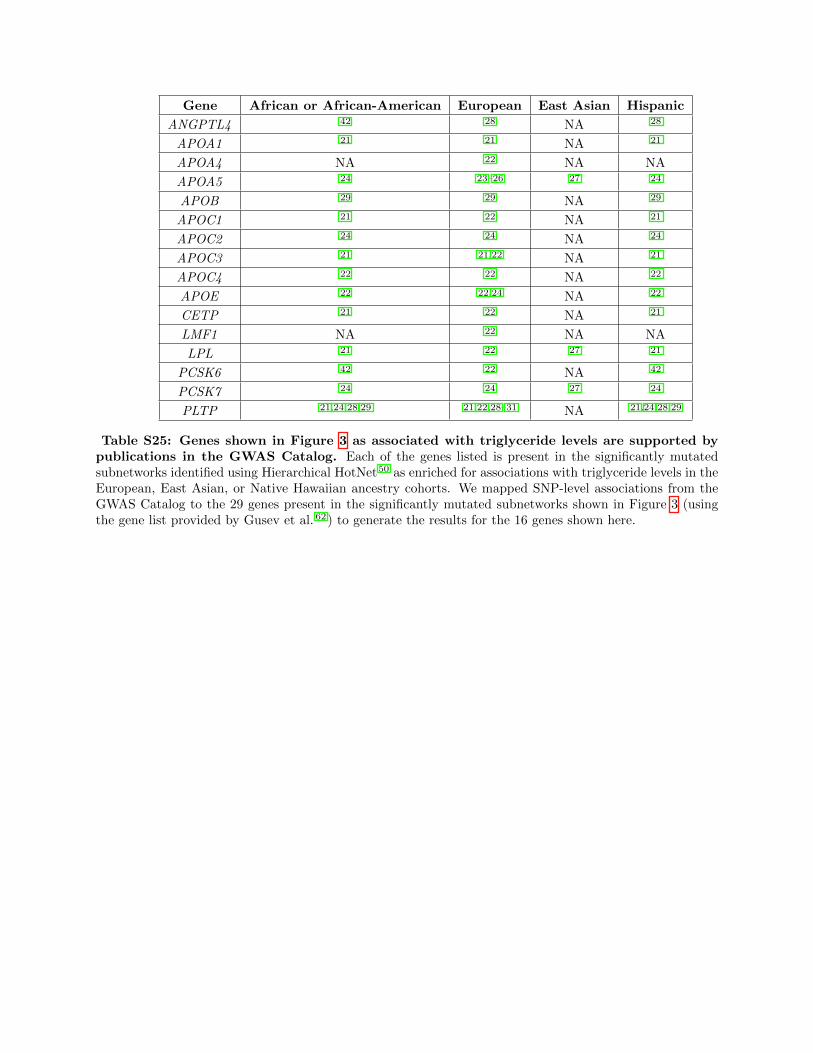
Gene African or African-American European East Asian Hispanic
ANGPTL4 42 28 NA 28
APOA1 21 21 NA 21
APOA4 NA 22 NA NA
APOA5 24 23–26 27 24
APOB 29 29 NA 29
APOC1 21 22 NA 21
APOC2 24 24 NA 24
APOC3 21 21,22 NA 21
APOC4 22 22 NA 22
APOE 22 22,24 NA 22
CETP 21 22 NA 21
LMF1 NA 22 NA NA
LPL 21 22 27 21
PCSK6 42 22 NA 42
PCSK7 24 24 27 24
PLTP 21,24,28,29 21,22,28–31 NA 21,24,28,29
Table S25: Genes shown in Figure 3 as associated with triglyceride levels are supported bypublications in the GWAS Catalog. Each of the genes listed is present in the significantly mutatedsubnetworks identified using Hierarchical HotNet50 as enriched for associations with triglyceride levels in theEuropean, East Asian, or Native Hawaiian ancestry cohorts. We mapped SNP-level associations from theGWAS Catalog to the 29 genes present in the significantly mutated subnetworks shown in Figure 3 (usingthe gene list provided by Gusev et al. 62) to generate the results for the 16 genes shown here.

GeneAfrican-American
(PAGE)European South Asian East Asian
NativeHawaiian
Hispanic andLatin American
APOA1 4.99⇥ 10�1 1.00⇥ 10�20 9.91⇥ 10�1 1.00⇥ 10�20 7.52⇥ 10�1 4.99⇥ 10�1
APOA4 4.99⇥ 10�1 1.00⇥ 10�20 2.51⇥ 10�5 1.00⇥ 10�20 9.15⇥ 10�1 4.99⇥ 10�1
APOA5 4.99⇥ 10�1 1.42⇥ 10�11 1.60⇥ 10�6 9.95⇥ 10�1 3.67⇥ 10�12 4.99⇥ 10�1
APOC3 4.99⇥ 10�1 1.00⇥ 10�20 9.82⇥ 10�1 9.83⇥ 10�1 3.05⇥ 10�15 4.99⇥ 10�1
APOE 4.99⇥ 10�1 1.00⇥ 10�20 8.65⇥ 10�1 1.00⇥ 10�20 1 1
PLTP 4.99⇥ 10�1 4.29⇥ 10�9 9.66⇥ 10�1 6.66⇥ 10�15 1.00⇥ 10�2 4.99⇥ 10�1
LPL 4.99⇥ 10�1 4.08⇥ 10�13 3.00⇥ 10�3 1.00⇥ 10�20 6.59⇥ 10�1 4.99⇥ 10�1
ANGPTL3 4.99⇥ 10�1 8.86⇥ 10�8 2.00⇥ 10�3 1.00⇥ 10�20 4.00⇥ 10�3 1
ANGPTL4 4.99⇥ 10�1 1.00⇥ 10�20 9.78⇥ 10�1 9.99⇥ 10�1 9.89⇥ 10�1 1
APOC1 4.99⇥ 10�1 1.67⇥ 10�16 4.99⇥ 10�1 1.00⇥ 10�20 9.81⇥ 10�1 4.99⇥ 10�1
APOC2 4.99⇥ 10�1 3.57⇥ 10�13 7.71⇥ 10�1 1.11⇥ 10�1 9.11⇥ 10�1 4.99⇥ 10�1
APOC4 4.99⇥ 10�1 3.72⇥ 10�13 7.36⇥ 10�1 2.58⇥ 10�14 9.73⇥ 10�1 4.99⇥ 10�1
APOB 4.99⇥ 10�1 1.00⇥ 10�20 9.99⇥ 10�1 7.32⇥ 10�12 1.00⇥ 10�3 1
LMF1 9.98⇥ 10�1 8.03⇥ 10�7 1 3.21⇥ 10�2 3.79⇥ 10�5 9.98⇥ 10�1
APOL1 4.99⇥ 10�1 5.30⇥ 10�2 6.40⇥ 10�2 1 8.89⇥ 10�11 4.99⇥ 10�1
HBA1 4.99⇥ 10�1 3.75⇥ 10�5 9.99⇥ 10�1 4.51⇥ 10�1 2.46⇥ 10�10 1
HBA2 4.99⇥ 10�1 1.30⇥ 10�5 9.99⇥ 10�1 4.51⇥ 10�1 3.93⇥ 10�10 4.99⇥ 10�1
B4GALT3 4.99⇥ 10�1 6.80⇥ 10�2 7.21⇥ 10�1 4.99⇥ 10�1 1.23⇥ 10�6 1
KLK8 1 1 1.62⇥ 10�6 9.89⇥ 10�1 1.00⇥ 10�3 1
PNLIP 4.99⇥ 10�1 9.99⇥ 10�1 9.26⇥ 10�1 7.75⇥ 10�1 1.00⇥ 10�3 4.99⇥ 10�1
WNT4 4.99⇥ 10�1 9.61⇥ 10�1 9.99⇥ 10�1 4.99⇥ 10�1 3.29⇥ 10�5 4.99⇥ 10�1
BACE1 4.99⇥ 10�1 5.55⇥ 10�17 2.20⇥ 10�2 9.99⇥ 10�16 6.69⇥ 10�1 4.99⇥ 10�1
CETP 4.99⇥ 10�1 1.00⇥ 10�3 9.99⇥ 10�1 1.41⇥ 10�6 9.99⇥ 10�1 4.99⇥ 10�1
PCSK6 4.99⇥ 10�1 1 9.99⇥ 10�1 1.83⇥ 10�5 1.00⇥ 10�3 4.99⇥ 10�1
PCSK7 4.99⇥ 10�1 1.66⇥ 10�8 9.97⇥ 10�1 1.00⇥ 10�20 9.99⇥ 10�1 4.99⇥ 10�1
LCAT 4.99⇥ 10�1 5.00⇥ 10�1 1 6.24⇥ 10�3 4.38⇥ 10�1 4.99⇥ 10�1
APOF 4.99⇥ 10�1 5.78⇥ 10�1 7.79⇥ 10�1 4.10⇥ 10�3 9.64⇥ 10�1 4.99⇥ 10�1
TYRO3 4.99⇥ 10�1 9.28⇥ 10�1 9.99⇥ 10�1 1.20⇥ 10�2 8.57⇥ 10�1 4.99⇥ 10�1
Table S26: Gene-" p-values for the 28 genes present in the significantly mutated subnetworksassociated with triglyceride level in the European, East Asian, and Native Hawaiian cohorts.Each of these genes is present in Figure 3 which depicts the overlapping significantly mutated subnetworksidentified using Hierarchical HoNet50 identified in an analysis of triglyceride levels in the European, EastAsian, and Native Hawaiian cohorts. Known SNP-level associations identified within the bounds of thesegenes in previous studies submitted to the GWAS Catalog are discussed in the Supplemental Information.Ancestry-specific Bonferroni corrected significance thresholds for gene-level association analysis of triglyc-eride levels are shown in Table S16.
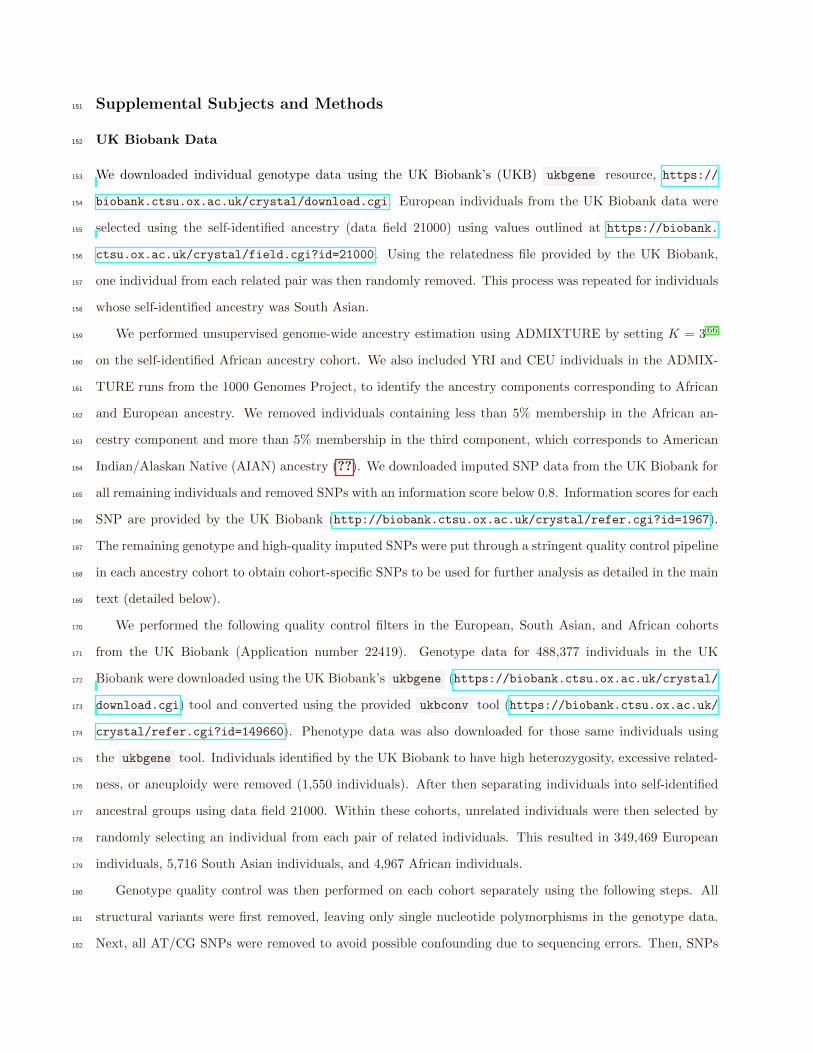
Supplemental Subjects and Methods151
UK Biobank Data152
We downloaded individual genotype data using the UK Biobank’s (UKB) ukbgene resource, https://153
biobank.ctsu.ox.ac.uk/crystal/download.cgi. European individuals from the UK Biobank data were154
selected using the self-identified ancestry (data field 21000) using values outlined at https://biobank.155
ctsu.ox.ac.uk/crystal/field.cgi?id=21000. Using the relatedness file provided by the UK Biobank,156
one individual from each related pair was then randomly removed. This process was repeated for individuals157
whose self-identified ancestry was South Asian.158
We performed unsupervised genome-wide ancestry estimation using ADMIXTURE by setting K = 366159
on the self-identified African ancestry cohort. We also included YRI and CEU individuals in the ADMIX-160
TURE runs from the 1000 Genomes Project, to identify the ancestry components corresponding to African161
and European ancestry. We removed individuals containing less than 5% membership in the African an-162
cestry component and more than 5% membership in the third component, which corresponds to American163
Indian/Alaskan Native (AIAN) ancestry (??). We downloaded imputed SNP data from the UK Biobank for164
all remaining individuals and removed SNPs with an information score below 0.8. Information scores for each165
SNP are provided by the UK Biobank (http://biobank.ctsu.ox.ac.uk/crystal/refer.cgi?id=1967).166
The remaining genotype and high-quality imputed SNPs were put through a stringent quality control pipeline167
in each ancestry cohort to obtain cohort-specific SNPs to be used for further analysis as detailed in the main168
text (detailed below).169
We performed the following quality control filters in the European, South Asian, and African cohorts170
from the UK Biobank (Application number 22419). Genotype data for 488,377 individuals in the UK171
Biobank were downloaded using the UK Biobank’s ukbgene (https://biobank.ctsu.ox.ac.uk/crystal/172
download.cgi) tool and converted using the provided ukbconv tool (https://biobank.ctsu.ox.ac.uk/173
crystal/refer.cgi?id=149660). Phenotype data was also downloaded for those same individuals using174
the ukbgene tool. Individuals identified by the UK Biobank to have high heterozygosity, excessive related-175
ness, or aneuploidy were removed (1,550 individuals). After then separating individuals into self-identified176
ancestral groups using data field 21000. Within these cohorts, unrelated individuals were then selected by177
randomly selecting an individual from each pair of related individuals. This resulted in 349,469 European178
individuals, 5,716 South Asian individuals, and 4,967 African individuals.179
Genotype quality control was then performed on each cohort separately using the following steps. All180
structural variants were first removed, leaving only single nucleotide polymorphisms in the genotype data.181
Next, all AT/CG SNPs were removed to avoid possible confounding due to sequencing errors. Then, SNPs182

with minor allele frequency less than 1% were removed using the plink267 --maf 0.01 . We then removed183
all SNPs found to be in Hardy-Weinberg equilibrium, using the plink --hwe 0.000001 flag to remove all184
SNPs with a Fisher’s exact test p-value > 10�6. Finally, all SNPs with missingness greater than 1% were185
removed using the plink --mind 0.01 flag.186
Finally, we note that the number of filtered SNPs in the African cohort is smaller than the number187
of filtered SNPs in the European cohort. These results stand in contrast to expectation about number of188
independent variants in these two populations. We believe this to be due to ascertainment bias on the189
genotyping array.190
Biobank Japan Data191
We downloaded summary statistics for 25 quantitative traits from the Biobank Japan (BBJ) website (http:192
//jenger.riken.jp/en/result)59–61,68. The sample descriptions and number of SNPs included in our193
analyses are given in Table S5. The number of SNPs included in the analysis of each trait represent those194
SNPs that: (i) contained an rsid number that could be mapped to the hg19 genome build, (ii) overlapped195
with SNPs contained within the 1000 Genomes Project phase 3 genotype data, and (iii) had a minor allele196
frequency greater than 0.01 in Japanese (JPT) individuals in the 1000 Genomes Project. We used the 1000197
Genomes phase 3 data from 93 JPT individuals to estimate the linkage disequilibrium (LD) between SNPs198
in BioBank Japan for which we had the summary statistic data; LD was estimated separately for each of199
the 25 quantitative traits using the trait specific SNP arrays. LD estimates were used in the calculation of200
regional association statistics.201
Population Architecture using Genomics and Epidemiology (PAGE) Study Data202
Summary statistics for genotyped and imputed SNPs in five admixed populations were downloaded from the203
Population Architecture using Genomics and Epidemiology (PAGE)69 with permission granted via approval204
of manuscript proposal. We included summary statistics for up to 14 quantitative traits for African-American,205
Hispanic and Latin American, Native Hawaiian, American Indian/Alaska Native, and Asian ancestry cohorts206
when available. All AT/CG SNPs were omitted, and SNPs with an IMPUTE2 information score greater than207
0.8 were included in this analysis. Number of individuals and SNPs varied across ancestry-trait combinations208
and are given in Table S5 - Table S10.209
Individuals from the 1000 Genomes Project phase 370 and the Human Genome Diversity Panel (HGDP)71210
were used to obtain LD estimates between SNPs for each ancestry cohort. To construct the LD reference211
panel for PAGE summary statistics from the African-American ancestry cohort, unrelated individuals from212
the 1000 Genomes Americans of African Ancestry in SW USA (ASW) and African Caribbeans in Barbados213

(ACB) were used. Only SNPs found in both the 1000 Genomes imputed data and PAGE summary statistics214
files were used in gene-level association and heritability analyses. We used the same approach to compute215
reference LD estimates between SNPs for the Hispanic and Latin American, AIAN, and Asian ancestry216
cohorts, with the following 1000 Genomes reference population, respectively: Mexican Ancestry from Los217
Angeles USA (MXL) and Puerto Ricans from Puerto Rico (PUR); Colombians from Medellin, Colombia218
(CLM) and Peruvians from Lima, Peru (PEL); and the East Asian superpopulation (EAS). For the Native219
Hawaiian individuals from the PAGE study, there were no appropriate reference populations in the 1000220
Genomes data. In order to construct a reference LD matrix for the Native Hawaiian ancestry cohort, we221
randomly sampled individuals from populations in the most recent release of the HGDP proportional to the222
global ancestry of the Native Hawaiian cohort. The Native Hawaiian cohort’s global ancestry proportions223
were determined using ADMIXTURE runs to be 47.89% Oceanian, 25.16% East Asian, 25.51% European,224
0.90% African, and 0.54% AIAN in a separate publication (Wojcik preprint - in prep.). We did not sample225
from populations with less than 1% of the total ancestry in the admixture analysis referenced above. The226
resulting sample from which LD was estimated included 39 individuals from the Papuan Sepik in New227
Guinea and Melanesian in Bougainville, 14 individuals from the French in France, and 14 individuals from228
the Yoruba in Nigeria.229
WHI study cohort description230
The Women’s Health Initiative (WHI) is a long-term, prospective, multi-center cohort study investigating231
post-menopausal women’s health in the US. WHI was funded by the National Institutes of Health and the232
National Heart, Lung, and Blood Institute to study strategies to prevent heart disease, breast 124 cancer,233
colon cancer, and osteoporotic fractures in women 50-79 years of age. WHI involves 161,808 women recruited234
between 1993 and 1998 at 40 centers across the US. The study consists of two parts: the WHI Clinical Trial235
which was a randomized clinical trial of hormone therapy, dietary modification, and calcium/Vitamin D236
supplementation, and the WHI Observational Study, which focused on many of the inequities in women’s237
health research and provided practical information about incidence, risk factors, and interventions related238
to heart disease, cancer, and osteoporotic fractures. For this project, women who self identified as European239
were excluded from the study sample (dbGaP study accession number: phs000227).240
HCHC/SOL study cohort description241
The Hispanic Community Health Study / Study of Latinos (HCHS/SOL) is a multi center study of His-242
panic/Latino populations with the goal of determining the role of acculturation in the prevalence and devel-243
opment of diseases, and to identify other traits that impact Hispanic/Latino health. The study is sponsored244

by the National Heart, Lung, and Blood Institute (NHLBI) and other institutes, centers, and o�ces of the245
National Institutes of Health (NIH). Recruitment began in 2006 with a target population of 16,000 persons246
of Cuban, Puerto Rican, Dominican, Mexican or Central/South American origin. Household sampling was247
employed as part of the study design. Participants were recruited through four sites a�liated with San Diego248
State University, Northwestern University in Chicago, Albert Einstein College of Medicine in Bronx, New249
York, and the University of Miami. Researchers from seven academic centers provided scientific and logistical250
support. Study participants who were self-identified Hispanic/Latino and aged 18-74 years underwent ex-251
tensive psycho-social and clinical assessments during 2008-2011. A re-examination of the HCHS/SOL cohort252
is conducted during 2015-2017. Annual telephone follow-up interviews are ongoing since study inception to253
determine health outcomes of interest. (dbGaP study accession number: phs000555).254
BioMe Biobank study cohort description255
The Charles Bronfman Institute for Personalized Medicine at Mount Sinai Medical Center (MSMC), BioMeTM256
54 BioBank (BioMe) is an EMR-linked bio-repository drawing from Mount Sinai Medical Center consented257
patients which were drawn from a population of over 70,000 inpatients and 800,000 outpatients annually.258
The MSMC serves diverse local communities of upper Manhattan, including Central Harlem (86% African259
American), East Harlem (88% Hispanic/Latino), and Upper East Side (88% Caucasian/White) with broad260
health disparities. BioMeTM 58 enrolled over 26,500 participants from September 2007 through August261
2013, with 25% African American, 36% Hispanic/Latino (primarily of Caribbean origin), 30% Caucasian,262
and 9% of Other ancestry. The BioMeTM 60 population reflects community-level disease burdens and health263
disparities with broad public health impact. Biobank operations are fully integrated in clinical care pro-264
cesses, including direct recruitment from clinical sites waiting areas and phlebotomy stations by dedicate265
Biobank recruiters independent of clinical care providers, prior to or following a clinician standard of care266
visit. Recruitment currently occurs at a broad spectrum of over 30 clinical care sites. Study participants267
of self-reported European ancestry were not included in this analysis. (dbGaP study accession number:268
phs000925).269
MEC study cohort description270
The Multiethnic Cohort (MEC) is a population-based prospective cohort study including approximately271
215,000 men and women from Hawaii and California. All participants were 45-75 years of age at baseline, and272
primarily of 5 ancestries: Japanese Americans, African Americans, European Americans, Hispanic/Latinos,273
and Native Hawaiians. MEC was funded by the National Cancer Institute in 1993 to examine lifestyle risk274
factors and genetic susceptibility to cancer. All eligible cohort members completed baseline and follow-up275

questionnaires. Within the PAGE II investigation, MEC proposes to study: 1) diseases for which we have276
DNA available for large numbers of cases and controls (breast, prostate, and colorectal cancer, diabetes,277
and obesity); 2) common traits that are risk factors for these diseases (e.g., body mass index / weight,278
waist-to-hip ratio, height), and 3) relevant disease-associated biomarkers (e.g., fasting insulin and lipids,279
steroid hormones). The specific aims are: 1) to determine the population-based epidemiologic profile (al-280
lele frequency, main e↵ect, heterogeneity by disease characteristics) of putative causal SNPs in the five281
racial/ethnic groups in MEC; 2) for SNPs displaying e↵ect heterogeneity across ethnic/racial groups, we will282
utilize di↵erences in LD to identify a more complete spectrum of associated SNPs at these loci; 3) investi-283
gate gene x gene and gene x environment interactions to identify modifiers; 4) examine the associations of284
putative causal SNPs with already measured intermediate phenotypes (e.g., plasma insulin, lipids, steroid285
hormones); and 5) for SNPs that do not fall within known genes, start to investigate their relationships with286
gene expression and epigenetic patterns in small genomic studies. For this project, MEC contributed African287
American, Japanese American, and Native Hawaiian samples.(dbGaP study accession number: phs000220).288
Fine-mapping analyses289
Methods: Protocol for implementation of SuSiE and PESCA290
To perform SNP-level fine mapping analyses on a given quantitative trait, we applied Sum of Single E↵ects291
(SuSiE) variable selection software65. SuSiE implements a Bayesian linear regression model on individual292
level data where sparse prior distributions are placed on the e↵ect size of SNP and posterior inclusion293
probabilities (PIPs) are used to summarize their statistical relevance to the trait of interest. The software294
for SuSiE requires an input ` which fixes the maximum number of causal SNPs to include in the model. In295
this work, we consider results when this parameter is chosen conservatively (` = 3000). We used the three296
cohorts for which we had genotype data from the UK Biobank (African, European, and South Asian) to297
test whether there was e↵ect size heterogeneity among ancestries in the 25 traits analyzed in this study. We298
first selected ten independent, non-overlapping subsamples of 10,000 individuals from the European ancestry299
cohort and filtered out any SNPs that had a minor allele frequency of less than 0.01. For each subsample, we300
then applied SuSiE to each of the 25 traits and compared the e↵ect sizes and posterior inclusion probabilities.301
The average number of SNPs with an e↵ect size greater than 0.01 and average number of SNPs with a PIP302
greater than 0.01 for each trait across the ten cohorts are reported in Table S19. Table S19 also reports the303
median correlation coe�cient of e↵ect sizes and PIPs among the 45 pairwise comparisons between the 10304
subsample cohorts.305
We then applied SuSiE to the African and South Asian ancestry cohorts and compared their resulting306

e↵ect sizes and PIPs to ten independent, non-overlapping subsamples of the European ancestry cohort. The307
number of SNPs with an e↵ect size greater than 0.1 and PIPs greater than 0.01 in both the focal cohort308
(either African or South Asian) and at least one of the ten European ancestry subsamples of the same size309
are reported in Table S20 and Table S21. Also reported in these tables, are the mean number of e↵ect sizes310
greater than 0.01 and PIPs greater than 0.01 across the European ancestry subsamples for each trait and the311
number of unique e↵ect sizes greater than 0.01 and PIPs greater than 0.01 that were only identified in the312
African or South Asian ancestry cohorts. Finally, Table S20 and Table S21 report the median correlation313
coe�cient of the African or South Asian ancestry cohort e↵ect sizes and PIPs with the ten European ancestry314
subsample cohorts of the same size.315
We report the median Cochran’s Q statistic calculated among all pairs of European subsamples for316
posterior inclusion probabilities (PIPs) Table S22. Additionally, we report the median Cochran’s Q for317
both PIPs and e↵ect sizes between the ten European ancestry subsamples and the South Asian and African318
ancestry cohorts from the UK Biobank.319
We compared the results of two fine-mapping methods, SuSie65 and PESCA72, when applied to SNP-level320
summary statistics in the European (UKB) and East Asian (BBJ) cohorts. SuSie is an iterative Bayesian321
stepwise selection method that identifies a credible set of SNPs that contribute to a phenotype of interest65.322
Using the e↵ect sizes and standard errors generated from the standard GWA framework for each trait in each323
ancestry, we applied SuSiE in order to identify probable sets of causal SNPs. We then found the correlation324
between the posterior inclusion probabilities of each SNP in the European and East Asian cohorts.325
Unlike SuSiE, the PESCA framework is explicitly designed for identifying shared SNP-level association326
signals between multiple ancestry cohorts versus ancestry-specific associations72. In addition to GWA sum-327
mary statistics, PESCA uses information about the correlation structure between SNPs (i.e., LD) to identify328
SNPs that are likely to be causal in two cohorts of interest. Shi et al. 72 analyzed seven continuous traits in329
the European (UKB) and East Asian (BBJ) cohorts using PESCA and produced posterior probabilities that330
individual SNPs were: (i) associated with a phenotype in both the both cohorts, (ii) associated with the331
trait of interest only in the European cohort, or (iii) associated with the trait of interest only in the East332
Asian cohort. For each trait, we calculated the number of SNPs that were nominally significant (p-value333
< 10�5, as in the original PESCA analysis) in the standard GWA framework in both the European and334
East Asian cohorts and had a PESCA posterior probability of being associated in both ancestries > 0.8 (see335
Table S18). We also found the number of SNPs that had a PESCA posterior probability of being associated336
in both ancestries > 0.8 that were only identified as significant in one ancestry using the GWA framework.337
Finally, we explored the recent proposition of Mathieson 73 that the direction of e↵ect for SNP-level338
summary statistics might be conserved among ancestry cohorts even if those variants are not genome-wide339

significant in either cohort. To that end, for each of the 25 traits that we analyzed, we compared the direction340
of SNP e↵ect sizes between the European and East Asian ancestry cohorts. We were only able to carry this341
analysis out for variants that were genotyped in both cohorts (Table S18). For each remaining nominally342
significant variant, we stored the direction of the e↵ect size and checked the direction of e↵ect size in the343
other ancestry. When zero was included within the range of the e↵ect size plus or minus one standard344
deviation, we assumed the SNP did not have the same direction in both cohorts. We note that this test345
may be confounded by the precision of e↵ect size estimation and warrants further exploration, including an346
analysis of local false sign discovery rates (see74,75).347
Results: Fine-mapping methods have variable e�cacy in identification of SNP level associa-348
tions among ancestry cohorts349
Often, replication of GWA results across cohorts is tested using genomic regions centered on a SNP. Scans350
across the region surrounding the SNP of interest are usually defined arbitrarily — using physical windows351
(or “clumps”) to smooth over ascertainment bias and varying LD across cohorts or ancestries instead of352
using regions that are biologically annotated such as genes or transcriptional elements. While clumping353
presents an easy way to scan for regional replication of a given GWA finding, the corresponding results are354
not readily interpretable when prioritizing GWA results for downstream validation. We performed clumping355
using windows of size 1Mb centered around significant SNP-level associations (see Materials and Methods).356
Height had the largest proportion of windows that contain a SNP-level association that replicated in at least357
two ancestries (Figure S5B and Figure S5E). In the three traits with the greatest proportion of windows358
containing SNP-level replications — height (77.09% of clumps), urate (65.89%), and low density lipoprotein359
(54.40%) — we then recorded the number of genes and transcriptional elements within the window that360
contained GWA significant SNP-level associations. We found that for all three traits, the vast majority of361
1Mb windows that were used to clump SNP-level associations contained multiple genes and transcriptional362
elements with significantly associated SNPs: height (94.04% of significant variants are within 1 Mb of two363
or more genes, 17.93 genes in clump (mean) ± 15.71 (standard deviation)), urate (97.47%, 18.44 ± 13.72),364
and low density lipoprotein (99.12%, 14.85 ± 12.89). Thus, we find window-based clumping does not easily365
produce biologically interpretable hypotheses for downstream validation.366
Recent analyses of multi-ancestry GWA cohorts have also tested for e↵ect size heterogeneity64,65,69,76,77.367
We applied the fine-mapping method SuSiE65 to identify signals of e↵ect size heterogeneity in the three368
ancestry cohorts for which we had access to raw genotype data (UK Biobank European ancestry, African369
ancestry, and South Asian ancestry individuals; see Table S1). We find little evidence of correlated SuSiE370
e↵ect size estimates among ancestry cohorts, including among independent subsamples of the UK Biobank371

European ancestry individuals Table S19 - Table S21. In addition, we applied PESCA (a method developed372
by Shi et al. 64) to the results of our SNP-level analysis to understand how the modeling of LD to a↵ected the373
power to identify probably causal SNPs shared in the European and East Asian ancestry cohorts. PESCA374
improves upon standard clumping approaches by modeling the LD in a region to identify SNPs that are375
likely to be causal for the same trait in multiple ancestries. In a comparison with the results from seven376
continuous traits analyzed in the original study64, we found that the vast majority of SNPs identified by377
PESCA as causal (posterior probability > 0.8) in both ancestries were also nominally significant in our SNP-378
level association results (see Table S18). Both SuSiE65 and PESCA64 demonstrate the utility of modeling379
variation in LD structure among ancestries when conducting multi-ancestry GWA studies.380
Recently, Mathieson 73 proposed the hypothesis that the direction of e↵ect sizes is the same among381
ancestries, even when the e↵ects are not genome-wide significant. To test this, we compared the direction382
of e↵ect in SNPs that were significant in either the European or East Asian ancestry cohort to the direction383
of the e↵ect in the other ancestry where the SNP was tested using the standard GWA framework. We limit384
the comparison to the European and East Asian cohorts due to their large sample sizes which increases the385
precision of e↵ect size estimates. Table S18 shows the number of variants that were significantly associated386
with each trait in at least one of the European and East Asian ancestry cohorts, and also displays the number387
of those variants that have the same direction of e↵ect as the significant variant in the other ancestry. In the 25388
traits that we analyzed, the direction of e↵ect was conserved in both the European and East Asian ancestry389
cohorts (between e↵ect direction concordance from 55.87% and 76.56% of SNPs across 25 traits). The390
remaining SNPs where the direction of the e↵ect size was not conserved represent those SNPs that: (i) had391
di↵erent direction of e↵ect size, (ii) were not tested in both ancestry cohorts, or (iii) had e↵ect size estimates392
within one standard error of zero (Table S18). The observed conservation of e↵ect size direction in multiple393
ancestry cohorts, even when SNPs are non-significant in one or more cohorts, is a primary assumption394
of regional enrichment methods and supports Mathieson 73 ’s hypothesis and findings. This suggests that395
regional enrichment methods, which are sensitive to shared patterns of e↵ect size direction among cohorts,396
are a natural approach to apply to GWA summary statistics even in the absence of replication SNP-level397
GWA signals among cohorts. We ultimately acknowledge that a more in depth analysis of fine-mapping398
application to multi-ancestry genetic data is needed to make any conclusions. This precursory analysis using399
the SuSiE54 and PESCA64 highlights that there is widespread heterogeneity in direction of e↵ect.400
S0.2 Description of the gene-" framework401
A unique feature of gene-" is that it treats SNPs with spuriously associated nonzero e↵ects as non-associated.402
gene-" assumes a reformulated null distribution of SNP-level e↵ects �j ⇠ N (0,�2"), where �
2" is the SNP-403

level null threshold and represents the maximum proportion of phenotypic variance explained (PVE) by a404
spurious or non-associated SNP. This leads to the reformulated SNP-level null hypothesis H0 : E[�2j ] �
2" .405
To infer an appropriate �2" , gene-" fits a K-mixture of normal distributions over the regularized e↵ect sizes406
with successively smaller variances (i.e., �21 > · · · > �
2K = 0). In this study as in Cheng et al. 53 , we407
assume that associated SNPs will appear in the first set, while spurious and non-associated SNPs appear408
in the latter sets. As a final step, gene-" computes its gene-level association test statistic for the g-th gene409
by conformably partitioning the regularized GWA e↵ect size estimates and computing the quadratic form410
Qg = �|g �g. Corresponding p-values are then derived using Imhof’s method. This assumes the common gene-411
level null H0 : Qg = 0, where the null distribution of Qg is dependent upon the eigenvalues from the scaled412
LD matrix �2"⌃. For details on implementation, validation and performance comparison with simulations,413
and empirical application to UK Biobank white British individuals in six traits, see Cheng et al. 53 .414
S0.3 Regression with Summary Statistics (RSS) Enrichment.415
Consider a GWA study with N individuals typed on P SNPs. For the j-th SNP, assume that we are given
corresponding e↵ect sizes b�j and standard error bsj via a single-SNP linear model fit using OLS. RSS then
implements the following likelihood to model the GWA summary statistics54
b� ⇠ N (bS⌃bS�1�, bS⌃bS) (1)
where bS = diag(bs) is a J ⇥J diagonal matrix of standard errors, ⌃ is again used to represent some empirical
estimate of the LD matrix (i.e., using some external reference panel with ancestry matching the cohort of
interest), and � are the true (unobserved) SNP-level e↵ect sizes. To model gene-level enrichment, RSS
assumes the following hierarchical prior structure on the true e↵ect sizes
�j ⇠ ⇡j N (0,�2�) + (1� ⇡j) �0, (2)
�2� = h
2
0
@JX
j=1
⇡j N�1bs�2
j
1
A�1
, (3)
⇡j =⇣1 + 10�(✓0+aj✓)
⌘�1, (4)
where �0 is point mass centered at zero, h2 denotes the narrow-sense heritability of the trait, aj is an indicator
detailing whether the j-th SNP is inside a particular gene, ✓0 is the background proportion of trait-associated
SNPs, and ✓ reflects the increase in probability (on the log10-odds scale) when a SNP within a gene has
non-zero e↵ect. Here, the authors follow earlier works78 and place independent uniform grid priors on the

hyper-parameters {h2, ✓0, ✓}. Note that, unlike other methods, RSS does not calculate a P -value for assessing
gene-level association. Instead, RSS produces a posterior enrichment probability that at least one SNP in a
given gene boundary is associated with the trait
Pg := 1� Pr [�j = 0, 8j 2 Jg |D] (5)
where D represents all of the input data including the GWA summary statistics {b�,bs}, the estimated LD416
matrix ⌃, and any applicable SNP annotations or weights a = (a1, . . . , aJ). See54,79 for more details on417
preferred hyper-parameter settings. As noted in the main text, RSS is relies on a Markov chain Monte Carlo418
(MCMC) scheme for sampling posterior distributions and estimating model parameters. As a result, its419
algorithm can be subject to convergence issues if these (or the random seed) are not chosen properly.420
S0.4 SNP-set (Sequence) Kernel Association Test (SKAT).421
The implementation of SKAT required access to raw phenotype y and genotype X information for N
individuals typed on J SNPs. To assess enrichment of the |Jg| variants within gene g, consider the linear
model with sub-matrix Xg
y = �0 +Xg�g + e, e ⇠ N (0, ⌧2I) (6)
where �0 is an intercept term, �g = (�1, . . . ,�|Jg|) is a vector of regression coe�cients for the SNPs within
the gene of interest, and e is a normally distributed error term with mean zero and scaled variance ⌧2. For
model flexibility, gene-specific SNP e↵ects �j are assumed to follow an arbitrary distribution with mean
zero and marginal variances aj�2� , where �
2� is a variance component and aj is a pre-specified weight for
the j-th SNP. To this end, SKAT uses a variance component scoring approach and tests the null hypothesis
H0 : � = 0, or equivalently H0 : �2� = 0. The corresponding gene-level test statistic bQg then takes on the
familiar quadratic form
bQg = (y � b�0)|Kg(y � b�0) (7)
where b�0 is the predicted mean of trait under the null hypothesis, and is computed by projecting y onto the
column space of the intercept (i.e., a vector of ones). The term Kg = XgAgAgX|g is commonly referred to
as an N ⇥N kernel matrix, where Ag = diag(a1, . . . , a|Jg|) is used to denote a diagonal weight matrix that
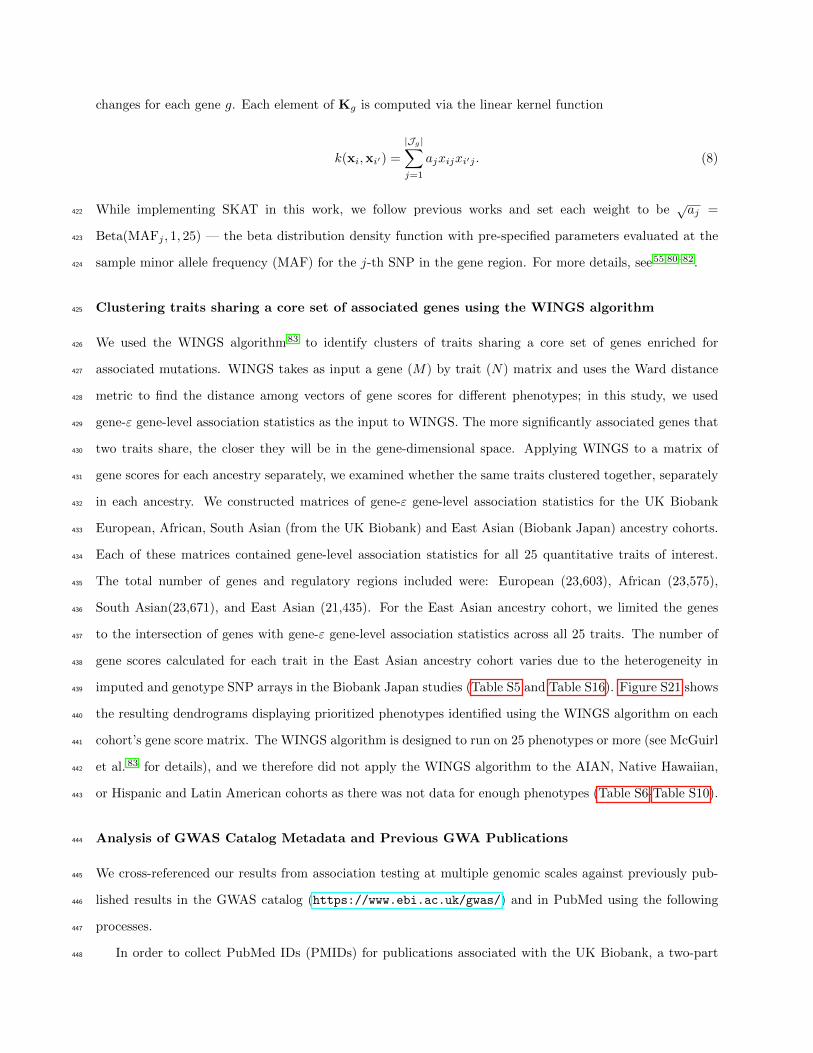
changes for each gene g. Each element of Kg is computed via the linear kernel function
k(xi,xi0) =
|Jg|X
j=1
ajxijxi0j . (8)
While implementing SKAT in this work, we follow previous works and set each weight to bepaj =422
Beta(MAFj , 1, 25) — the beta distribution density function with pre-specified parameters evaluated at the423
sample minor allele frequency (MAF) for the j-th SNP in the gene region. For more details, see55,80–82.424
Clustering traits sharing a core set of associated genes using the WINGS algorithm425
We used the WINGS algorithm83 to identify clusters of traits sharing a core set of genes enriched for426
associated mutations. WINGS takes as input a gene (M) by trait (N) matrix and uses the Ward distance427
metric to find the distance among vectors of gene scores for di↵erent phenotypes; in this study, we used428
gene-" gene-level association statistics as the input to WINGS. The more significantly associated genes that429
two traits share, the closer they will be in the gene-dimensional space. Applying WINGS to a matrix of430
gene scores for each ancestry separately, we examined whether the same traits clustered together, separately431
in each ancestry. We constructed matrices of gene-" gene-level association statistics for the UK Biobank432
European, African, South Asian (from the UK Biobank) and East Asian (Biobank Japan) ancestry cohorts.433
Each of these matrices contained gene-level association statistics for all 25 quantitative traits of interest.434
The total number of genes and regulatory regions included were: European (23,603), African (23,575),435
South Asian(23,671), and East Asian (21,435). For the East Asian ancestry cohort, we limited the genes436
to the intersection of genes with gene-" gene-level association statistics across all 25 traits. The number of437
gene scores calculated for each trait in the East Asian ancestry cohort varies due to the heterogeneity in438
imputed and genotype SNP arrays in the Biobank Japan studies (Table S5 and Table S16). Figure S21 shows439
the resulting dendrograms displaying prioritized phenotypes identified using the WINGS algorithm on each440
cohort’s gene score matrix. The WINGS algorithm is designed to run on 25 phenotypes or more (see McGuirl441
et al. 83 for details), and we therefore did not apply the WINGS algorithm to the AIAN, Native Hawaiian,442
or Hispanic and Latin American cohorts as there was not data for enough phenotypes (Table S6-Table S10).443
Analysis of GWAS Catalog Metadata and Previous GWA Publications444
We cross-referenced our results from association testing at multiple genomic scales against previously pub-445
lished results in the GWAS catalog (https://www.ebi.ac.uk/gwas/) and in PubMed using the following446
processes.447
In order to collect PubMed IDs (PMIDs) for publications associated with the UK Biobank, a two-part448

data collection process was used. The first process was to directly search for publications with variations449
of the term “UK Biobank” (e.g., U.K. Biobank, United Kingdom Biobank) from PubMed using the Entrez450
Programming Utilities (E-Utilities) API. The E-Utilities API is the public API to the NCBI Entrez sys-451
tem and allows direct access to all Entrez databases including PubMed. Search queries were formulated by452
narrowing publications using year published and then further narrowing to those publications with varia-453
tions of the search term “UK Biobank” in either the title or abstract. The open-source Python package454
Entrez (https://biopython.org/DIST/docs/api/Bio.Entrez-module.html) from the Biopython Project455
was used to facilitate interaction with the E-Utilities API.456
The second data collection process was to gather information from publications listed directly on the UK457
Biobank website (https://www.ukbiobank.ac.uk/). Since the majority of publications on the website did458
not have an easily accessible PMID, identifying information including publication title and year was scraped459
and used to retrieve a publication’s corresponding PMID (again using the E-Utilities API). The HTML/XML460
document parsing Python library Beautiful Soup (https://www.crummy.com/software/BeautifulSoup/461
bs4/doc/) was used to parse the HTML of the various UK Biobank webpages, and the Python Requests462
library (https://requests.readthedocs.io/en/master/) was used to programatically send HTTP calls463
to the server hosting the website. PMIDs were retrieved directly from the XML output of the E-Utilities464
API calls.465
The PMIDs retrieved from both processes were aggregated into a single set of unique PMIDs, as some466
publications were identified by both processes. Publications that could not get associated PMIDs from the467
second data collection process were flagged for manual processing. The PMIDs that were retrieved from468
PubMed directly but could not be found based on the publication information provided on the UK Biobank469
website were noted. Conversely, the PMIDs that could be retrieved from publication information found on470
the UK Biobank website but not directly from PubMed were also noted.471
Using the compiled list of PMIDs, analyses of the UK Biobank data set reported in the GWAS cat-472
alog association data were compiled. Previous genotype-to-phenotype association data and sample an-473
cestry descriptions were downloaded from https://www.ebi.ac.uk/gwas/docs/file-downloads. Unique474
genotype-to-phenotype associations were parsed using a set of custom python scripts. All scripts used475
in the curation of PMIDs, parsing of GWAS catalog summary data, and determination of previously476
published genotype-to-phenotype associations from UK Biobank studies are available on GitHub (https:477
//github.com/ramachandran-lab/redefining_replication).478

Simulation design to test the power and false discovery rate of GWA and gene-level association479
analyses480
Simulations of a single population481
In our simulation studies, we used the following general simulation scheme to generate quantitative traits482
using real genotype data on chromosome 1 from N randomly sampled individuals of European ancestry in483
the UK Biobank. This pipeline follows from previous studies53,84. We will use X to denote the N ⇥ J484
genotype matrix, with J denoting the number of single nucleotide polymorphisms (SNPs) encoded as 0, 1, 2485
copies of a reference allele at each locus and xj representing the genotypic vector for the j-th SNP. Following486
quality control procedures detailed in the Supplemental Information, our simulations included J = 36,518487
SNPs distributed across genome. We used the NCBI’s RefSeq database in the UCSC Genome Browser to488
assign SNPs to genes which resulted in G = 1,408 genes in the simulation studies.489
After the annotation step, we simulated phenotypes by first assuming that the total phenotypic variance490
V[y] = 1, and that all observed genetic e↵ects explained a fixed proportion of this value (i.e., narrow-sense491
heritability, h2). Next, we randomly selected a certain percentage of genes to be enriched fotr associations492
and denoted the sets of SNPs that they contained as C. Within C, we selected causal SNPs in a way such493
that each associated gene at least contains one SNP with non-zero e↵ect size. Quantitative continuous traits494
were then generated under the following two general linear models:495
• Standard Model: y =P
c2C xc�c + e496
• Population Structure Model: y = Wb+P
c2C xc�c + e497
where y is an N -dimensional vector containing all the phenotype states; xc is the genotype for the c-th498
causal SNP; �c is the additive e↵ect size for the c-th SNP; and e ⇠ N (0, ⌧2I) is an N -dimensional vector499
of normally distributed environmental noise. Additionally, in the model with population structure, W is an500
N ⇥ M matrix of the top M = 10 principal components (PCs) from the genotype matrix and represents501
additional population structure with corresponding fixed e↵ects b. The e↵ect sizes of SNPs in genes enriched502
for associations are randomly drawn from standard normal distributions and then rescaled so they explain503
a fixed proportion of the narrow-sense heritability V[P
xc�c] = h2. The coe�cients for the genotype PCs504
are also drawn from standard normal distributions and rescaled such that V[Wb] = 10% of the total505
phenotypic variance, with the variance of all non-genetic e↵ects contributing V[Wb] + V[e] = (1� h2). For506
any simulations conducted under the population structure model, genotype PCs are not included in any of507
the model fitting procedures, and no other preprocessing normalizations were carried out to account for the508
additional population structure. More specifically, GWA summary statistics are then computed by fitting a509

single-SNP univariate linear model via ordinary least squares (OLS):510
b�j = (x|jxj)
�1x|jy; (9)
for every SNP in the data j = 1, . . . J . These OLS e↵ect size estimates, along with an empirically LD matrix511
⌃ computed directly from the full N ⇥ J genotype matrix X, are given to gene-". We also retain standard512
errors and p-values for the implementation of competing methods: RSS54, SKAT55, and the standard GWA513
SNP-level association test. Given the simulation procedure above, we simulate a wide range of scenarios for514
comparing the performance of gene-level association approaches by varying the following parameters:515
• Number of individuals: N = 5,000 and 10,000;516
• Narrow-sense heritability: h2 = 0.2 and 0.6;517
• Percentage of enriched genes: 1% (sparse) and 10% (polygenic);518
Furthermore, we set the number of causal SNPs with non-zero e↵ects to be some fixed percentage of all SNPs519
located within the designated genes enriched for associations. We set this percentage to be 0.125% in the520
1% associated SNP-set case, and 3% in the 10% associated SNP-set case. All performance comparisons are521
based on 100 di↵erent simulated runs for each parameter combination. Lastly, for each simulated dataset,522
we also selected some number of intergenic SNPs (i.e., SNPs not mapped to any gene) to have non-zero523
e↵ect sizes. This was done to mimic genetic associations in unannotated regulatory elements. Specifically,524
five randomly selected intergenic SNPs were given non-zero contributions to the trait heritability in the 1%525
enriched genes case, and 30 intergenic SNPs were selected in the 10% enriched genes case.526
All performance comparisons are based on 100 di↵erent simulated runs for each parameter combina-527
tion. We computed gene-level p-values for gene-", SKAT, and the single-SNP GWAS. For evaluating the528
performance of RSS, we compute posterior enrichment probabilities. For all approaches, we assessed the529
power and false discovery rates when identifying enriched genes at either a Bonferroni-corrected threshold530
(p = 0.05/1, 408 genes = 3.55 ⇥ 10�5) or according to the median probability model (posterior enrichment531
probability > 0.5)85. Figure S6 and Figure S7 show the mean performances (and standard errors) across532
all simulated replicates. Figure S8 illustrates that both GWAS and gene-" are limited by the sample size of533
the cohort of interest. Specifically, when the sample size is set to 2,000 individuals power is low and false534
discovery rates are high for both the standard GWA framework and gene-".535

Simulations of genetic trait architecture in two populations536
We used the African (UKB) cohort and a subset of the European cohort and simulation studies to test the537
ability of GWAS and gene-" to detect shared causal SNPs (in the case of gene-", genes containing causal538
SNPs) in a multi-ancestry study. Using the same simulation protocol as that described for testing power of539
di↵erent enrichment analysis methods, described in Simulations in a single population, we labeled all genes540
containing at least one causal SNP as ”causal”. We first determined the power of gene-" to identify SNPs or541
genes that are causal in each cohort under a variety of genomic architectures. The total amount of variance542
explained in the phenotype by the causal SNPs (i.e. the narrow-sense heritability) to be equal to 0.2 or543
0.6. In each of these contexts, the sparsity of causal variants as a function of the total number of variants544
was set to either 0.1 or 0.5. These values of causal SNP sparsity were selected in order to ensure that an545
ample number of SNPs were associated with the phenotype in both cohorts. Finally, the overlap in causal546
SNPs between the two cohorts was tested at proportions equal to 0 (no overlap in causal between SNPs547
cohorts) 0.25, 0.5, and 1 (complete overlap in causal SNPs between cohorts). For each of these parameter548
sets, 50 replicate simulations were performed of two cohorts derived from 10,000 European individuals and549
4,967 African individuals, respectively. We summarize the performance of the standard GWA framework550
and gene-" across the parameter space. Generally, gene-" performs better on the European cohort than it551
does in the African cohort, but is better powered in the African cohort when the causal SNPs are the same552
in both cohorts (Figure S9 and Figure S10). Additionally, gene-" performs better when identifying causal553
genes that are shared between the two cohorts - particularly when traits have high heritability Figure S11 -554
Figure S12.555
References556
[1] Terhi Kettunen, Carita Eklund, Mika Kahonen, Antti Jula, Hannu Paiva, Leo-Pekka Lyytikainen, Mikko557
Hurme, and Terho Lehtimaki. Polymorphism in the c-reactive protein (crp) gene a↵ects crp levels in558
plasma and one early marker of atherosclerosis in men: The health 2000 survey. Scandinavian journal559
of clinical and laboratory investigation, 71(5):353–361, 2011.560
[2] Amy Z Fan, Ajay Yesupriya, Man-huei Chang, Meaghan House, Jing Fang, Renee Ned, Donald Hayes,561
Nicole F Dowling, and Ali H Mokdad. Gene polymorphisms in association with emerging cardiovascular562
risk markers in adult women. BMC medical genetics, 11(1):6, 2010.563
[3] E Komurcu-Bayrak, N Erginel-Unaltuna, A Onat, B Ozsait, C Eklund, M Hurme, N Mononen, R Laak-564

sonen, G Hergenc, and T Lehtimaki. Association of c-reactive protein (crp) gene allelic variants with565
serum crp levels and hypertension in turkish adults. Atherosclerosis, 206(2):474–479, 2009.566
[4] AJ Szalai, J Wu, EM Lange, MA McCrory, CD Langefeld, A Williams, SO Zakharkin, Varghese George,567
DB Allison, GS Cooper, et al. Single-nucleotide polymorphisms in the c-reactive protein (crp) gene568
promoter that a↵ect transcription factor binding, alter transcriptional activity, and associate with dif-569
ferences in baseline serum crp level. Journal of Molecular Medicine, 83(6):440–447, 2005.570
[5] Shi-Chao Zhang, Ming-Yu Wang, Jun-Rui Feng, Yue Chang, Shang-Rong Ji, and Yi Wu. Reversible571
promoter methylation determines fluctuating expression of acute phase proteins. Elife, 9:e51317, 2020.572
[6] S-N Chang, C-T Tsai, C-K Wu, J-K Lee, L-P Lai, S-W Huang, L-Y Huang, C-D Tseng, J-L Lin, F-T573
Chiang, et al. A functional variant in the promoter region regulates the c-reactive protein gene and is a574
potential candidate for increased risk of atrial fibrillation. Journal of internal medicine, 272(3):305–315,575
2012.576
[7] Hyoun-Ah Kim, Hye-Young Chun, Seung-Hyun Kim, Hae-Sim Park, and Chang-Hee Suh. C-reactive577
protein gene polymorphisms in disease susceptibility and clinical manifestations of korean systemic lupus578
erythematosus. The Journal of rheumatology, 36(10):2238–2243, 2009.579
[8] Abbas Dehghan, Josee Dupuis, Maja Barbalic, Joshua C Bis, Gudny Eiriksdottir, Chen Lu, Niina580
Pellikka, Henri Wallaschofski, Johannes Kettunen, Peter Henneman, et al. Meta-analysis of genome-wide581
association studies in¿ 80 000 subjects identifies multiple loci for c-reactive protein levels. Circulation,582
123(7):731–738, 2011.583
[9] Paul M Ridker, Guillaume Pare, Alex Parker, Robert YL Zee, Jacqueline S Danik, Julie E Buring, David584
Kwiatkowski, Nancy R Cook, Joseph P Miletich, and Daniel I Chasman. Loci related to metabolic-585
syndrome pathways including lepr, hnf1a, il6r, and gckr associate with plasma c-reactive protein: the586
women’s genome health study. The American Journal of Human Genetics, 82(5):1185–1192, 2008.587
[10] Symen Ligthart, Ahmad Vaez, Urmo Vosa, Maria G Stathopoulou, Paul S De Vries, Bram P Prins,588
Peter J Van der Most, Toshiko Tanaka, Elnaz Naderi, Lynda M Rose, et al. Genome analyses of¿ 200,000589
individuals identify 58 loci for chronic inflammation and highlight pathways that link inflammation and590
complex disorders. The American Journal of Human Genetics, 103(5):691–706, 2018.591
[11] Alex P Reiner, Sandra Beleza, Nora Franceschini, Paul L Auer, Jennifer G Robinson, Charles Kooper-592
berg, Ulrike Peters, and Hua Tang. Genome-wide association and population genetic analysis of c-593

reactive protein in african american and hispanic american women. The American Journal of Human594
Genetics, 91(3):502–512, 2012.595
[12] Paul Elliott, John C Chambers, Weihua Zhang, Robert Clarke, Jemma C Hopewell, John F Peden,596
Jeanette Erdmann, Peter Braund, James C Engert, Derrick Bennett, et al. Genetic loci associated with597
c-reactive protein levels and risk of coronary heart disease. Jama, 302(1):37–48, 2009.598
[13] Deog Kyeom Kim, Michael H Cho, Craig P Hersh, David A Lomas, Bruce E Miller, Xiangyang Kong,599
Per Bakke, Amund Gulsvik, Alvar Agustı, Emiel Wouters, et al. Genome-wide association analysis of600
blood biomarkers in chronic obstructive pulmonary disease. American journal of respiratory and critical601
care medicine, 186(12):1238–1247, 2012.602
[14] William J Astle, Heather Elding, Tao Jiang, Dave Allen, Dace Ruklisa, Alice L Mann, Daniel Mead,603
Heleen Bouman, Fernando Riveros-Mckay, Myrto A Kostadima, et al. The allelic landscape of human604
blood cell trait variation and links to common complex disease. Cell, 167(5):1415–1429, 2016.605
[15] Juraj Sokol, Kamil Biringer, Maria Skerenova, Miroslav Hasko, Lenka Bartosova, Jan Stasko, Jan606
Danko, and Peter Kubisz. Platelet aggregation abnormalities in patients with fetal losses: the gp6 gene607
polymorphism. Fertility and sterility, 98(5):1170–1174, 2012.608
[16] Andrew D Johnson, Lisa R Yanek, Ming-Huei Chen, Nauder Faraday, Martin G Larson, Geo↵rey Tofler,609
Shiow J Lin, Aldi T Kraja, Michael A Province, Qiong Yang, et al. Genome-wide meta-analyses identifies610
seven loci associated with platelet aggregation in response to agonists. Nature genetics, 42(7):608–613,611
2010.612
[17] Takao Shimizu. Lipid mediators in health and disease: enzymes and receptors as therapeutic targets613
for the regulation of immunity and inflammation. Annual review of pharmacology and toxicology, 49:614
123–150, 2009.615
[18] Yuji Shimizu, Kazuhiko Arima, Yuko Noguchi, Shin-Ya Kawashiri, Hirotomo Yamanashi, Mami Tamai,616
Yasuhiro Nagata, and Takahiro Maeda. Potential mechanisms underlying the association between sin-617
gle nucleotide polymorphism (brap and aldh2) and hypertension among elderly japanese population.618
Scientific Reports, 10(1):1–9, 2020.619
[19] John D Eicher, Nathalie Chami, Tim Kacprowski, Akihiro Nomura, Ming-Huei Chen, Lisa R Yanek,620
Salman M Tajuddin, Ursula M Schick, Andrew J Slater, Nathan Pankratz, et al. Platelet-related621
variants identified by exomechip meta-analysis in 157,293 individuals. The American Journal of Human622
Genetics, 99(1):40–55, 2016.623

[20] Rehan Qayyum, Beverly M Snively, Elad Ziv, Michael A Nalls, Yongmei Liu, Weihong Tang, Lisa R624
Yanek, Leslie Lange, Michele K Evans, Santhi Ganesh, et al. A meta-analysis and genome-wide associa-625
tion study of platelet count and mean platelet volume in african americans. PLoS Genet, 8(3):e1002491,626
2012.627
[21] Raymond Noordam, Maxime M Bos, Heming Wang, Thomas W Winkler, Amy R Bentley, Tuomas O628
Kilpelainen, Paul S de Vries, Yun Ju Sung, Karen Schwander, Brian E Cade, et al. Multi-ancestry629
sleep-by-snp interaction analysis in 126,926 individuals reveals lipid loci stratified by sleep duration.630
Nature communications, 10(1):1–13, 2019.631
[22] Tom G Richardson, Eleanor Sanderson, Tom M Palmer, Mika Ala-Korpela, Brian A Ference, George632
Davey Smith, and Michael V Holmes. Evaluating the relationship between circulating lipoprotein lipids633
and apolipoproteins with risk of coronary heart disease: A multivariable mendelian randomisation634
analysis. PLoS medicine, 17(3):e1003062, 2020.635
[23] Alexander M Kulminski, Jian Huang, Yury Loika, Konstantin G Arbeev, Olivia Bagley, Arseniy Yashkin,636
Matt Duan, and Irina Culminskaya. Strong impact of natural-selection–free heterogeneity in genetics637
of age-related phenotypes. Aging (Albany NY), 10(3):492, 2018.638
[24] Thomas J Ho↵mann, Elizabeth Theusch, Tanushree Haldar, Dilrini K Ranatunga, Eric Jorgenson,639
Marisa W Medina, Mark N Kvale, Pui-Yan Kwok, Catherine Schaefer, Ronald M Krauss, et al. A large640
electronic-health-record-based genome-wide study of serum lipids. Nature genetics, 50(3):401–413, 2018.641
[25] Aldi T Kraja, Dhananjay Vaidya, James S Pankow, Mark O Goodarzi, Themistocles L Assimes,642
Iftikhar J Kullo, Ulla Sovio, Rasika A Mathias, Yan V Sun, Nora Franceschini, et al. A bivariate643
genome-wide approach to metabolic syndrome: Stampeed consortium. Diabetes, 60(4):1329–1339, 2011.644
[26] Cassandra N Spracklen, Peng Chen, Young Jin Kim, Xu Wang, Hui Cai, Shengxu Li, Jirong Long, Ying645
Wu, Ya Xing Wang, Fumihiko Takeuchi, et al. Association analyses of east asian individuals and trans-646
ancestry analyses with european individuals reveal new loci associated with cholesterol and triglyceride647
levels. Human molecular genetics, 26(9):1770–1784, 2017.648
[27] Makoto Kurano, Kazuhisa Tsukamoto, Shigeo Kamitsuji, Naoyuki Kamatani, Masumi Hara, Toshio649
Ishikawa, Bong-Jo Kim, Sanghoon Moon, Young Jin Kim, and Tamio Teramoto. Genome-wide asso-650
ciation study of serum lipids confirms previously reported associations as well as new associations of651
common snps within pcsk7 gene with triglyceride. Journal of human genetics, 61(5):427–433, 2016.652

[28] Paul S De Vries, Michael R Brown, Amy R Bentley, Yun J Sung, Thomas W Winkler, Ioanna Ntalla,653
Karen Schwander, Aldi T Kraja, Xiuqing Guo, Nora Franceschini, et al. Multiancestry genome-wide as-654
sociation study of lipid levels incorporating gene-alcohol interactions. American journal of epidemiology,655
188(6):1033–1054, 2019.656
[29] Amy R Bentley, Yun J Sung, Michael R Brown, Thomas W Winkler, Aldi T Kraja, Ioanna Ntalla,657
Karen Schwander, Daniel I Chasman, Elise Lim, Xuan Deng, et al. Multi-ancestry genome-wide gene–658
smoking interaction study of 387,272 individuals identifies new loci associated with serum lipids. Nature659
genetics, 51(4):636–648, 2019.660
[30] Ida Surakka, Momoko Horikoshi, Reedik Magi, Antti-Pekka Sarin, Anubha Mahajan, Vasiliki Lagou,661
Letizia Marullo, Teresa Ferreira, Benjamin Miraglio, Sanna Timonen, et al. The impact of low-frequency662
and rare variants on lipid levels. Nature genetics, 47(6):589–597, 2015.663
[31] Tanya M Teslovich, Kiran Musunuru, Albert V Smith, Andrew C Edmondson, Ioannis M Stylianou,664
Masahiro Koseki, James P Pirruccello, Samuli Ripatti, Daniel I Chasman, Cristen J Willer, et al.665
Biological, clinical and population relevance of 95 loci for blood lipids. Nature, 466(7307):707–713,666
2010.667
[32] Cristen J Willer, Ellen M Schmidt, Sebanti Sengupta, Gina M Peloso, Stefan Gustafsson, Stavroula668
Kanoni, Andrea Ganna, Jin Chen, Martin L Buchkovich, Samia Mora, et al. Discovery and refinement669
of loci associated with lipid levels. Nature genetics, 45(11):1274, 2013.670
[33] Rita PS Middelberg, Manuel AR Ferreira, Anjali K Henders, Andrew C Heath, Pamela AF Madden,671
Grant W Montgomery, Nicholas G Martin, and John B Whitfield. Genetic variants in lpl, oasl and672
tomm40/apoe-c1-c2-c4 genes are associated with multiple cardiovascular-related traits. BMC medical673
genetics, 12(1):123, 2011.674
[34] Sekar Kathiresan, Olle Melander, Candace Guiducci, Aarti Surti, Noel P Burtt, Mark J Rieder, Gre-675
gory M Cooper, Charlotta Roos, Benjamin F Voight, Aki S Havulinna, et al. Six new loci associated676
with blood low-density lipoprotein cholesterol, high-density lipoprotein cholesterol or triglycerides in677
humans. Nature genetics, 40(2):189–197, 2008.678
[35] Jaspal S Kooner, John C Chambers, Carlos A Aguilar-Salinas, David A Hinds, Craig L Hyde, Gregory R679
Warnes, Francisco J Gomez Perez, Kelly A Frazer, Paul Elliott, James Scott, et al. Genome-wide scan680
identifies variation in mlxipl associated with plasma triglycerides. Nature genetics, 40(2):149, 2008.681

[36] Sekar Kathiresan, Cristen J Willer, Gina M Peloso, Serkalem Demissie, Kiran Musunuru, Eric E Schadt,682
Lee Kaplan, Derrick Bennett, Yun Li, Toshiko Tanaka, et al. Common variants at 30 loci contribute to683
polygenic dyslipidemia. Nature genetics, 41(1):56–65, 2009.684
[37] Maria Keller, Dorit Schleinitz, Julia Forster, Anke Tonjes, Yvonne Bottcher, Antje Fischer-Rosinsky,685
Jana Breitfeld, Kerstin Weidle, Nigel W Rayner, Ralph Burkhardt, et al. Thoc5: a novel gene involved686
in hdl-cholesterol metabolism. Journal of lipid research, 54(11):3170–3176, 2013.687
[38] Richa Saxena, Benjamin F Voight, Valeriya Lyssenko, Noel P Burtt, Paul IW de Bakker, Hong Chen,688
Je↵rey J Roix, Sekar Kathiresan, Joel N Hirschhorn, Mark J Daly, et al. Genome-wide association689
analysis identifies loci for type 2 diabetes and triglyceride levels. Science, 316(5829):1331–1336, 2007.690
[39] Yurii S Aulchenko, Samuli Ripatti, Ida Lindqvist, Dorret Boomsma, Iris M Heid, Peter P Pramstaller,691
Brenda WJH Penninx, A Cecile JW Janssens, James F Wilson, Tim Spector, et al. Loci influencing692
lipid levels and coronary heart disease risk in 16 european population cohorts. Nature genetics, 41(1):693
47, 2009.694
[40] Rubina Tabassum, Joel T Ramo, Pietari Ripatti, Jukka T Koskela, Mitja Kurki, Juha Karjalainen, Priit695
Palta, Shabbeer Hassan, Javier Nunez-Fontarnau, Tuomo TJ Kiiskinen, et al. Genetic architecture of696
human plasma lipidome and its link to cardiovascular disease. Nature communications, 10(1):1–14,697
2019.698
[41] Liang He, Yelena Kernogitski, Irina Kulminskaya, Yury Loika, Konstantin G Arbeev, Elena Loiko,699
Olivia Bagley, Matt Duan, Arseniy Yashkin, Svetlana V Ukraintseva, et al. Pleiotropic meta-analyses700
of longitudinal studies discover novel genetic variants associated with age-related diseases. Frontiers in701
genetics, 7:179, 2016.702
[42] Derek Klarin, Scott M Damrauer, Kelly Cho, Yan V Sun, Tanya M Teslovich, Jacqueline Honerlaw,703
David R Gagnon, Scott L DuVall, Jin Li, Gina M Peloso, et al. Genetics of blood lipids among˜ 300,000704
multi-ethnic participants of the million veteran program. Nature genetics, 50(11):1514–1523, 2018.705
[43] Dawn M Waterworth, Sally L Ricketts, Kijoung Song, Li Chen, Jing Hua Zhao, Samuli Ripatti, Yurii S706
Aulchenko, Weihua Zhang, Xin Yuan, Noha Lim, et al. Genetic variants influencing circulating lipid707
levels and risk of coronary artery disease. Arteriosclerosis, thrombosis, and vascular biology, 30(11):708
2264–2276, 2010.709
[44] Gina M Peloso, Paul L Auer, Joshua C Bis, Arend Voorman, Alanna C Morrison, Nathan O Stitziel,710
Jennifer A Brody, Sumeet A Khetarpal, Jacy R Crosby, Myriam Fornage, et al. Association of low-711

frequency and rare coding-sequence variants with blood lipids and coronary heart disease in 56,000712
whites and blacks. The American Journal of Human Genetics, 94(2):223–232, 2014.713
[45] Tuomas O Kilpelainen, Amy R Bentley, Raymond Noordam, Yun Ju Sung, Karen Schwander,714
Thomas W Winkler, Hermina Jakupovic, Daniel I Chasman, Alisa Manning, Ioanna Ntalla, et al.715
Multi-ancestry study of blood lipid levels identifies four loci interacting with physical activity. Nature716
communications, 10(1):1–11, 2019.717
[46] Yoichiro Kamatani, Koichi Matsuda, Yukinori Okada, Michiaki Kubo, Naoya Hosono, Yataro Daigo,718
Yusuke Nakamura, and Naoyuki Kamatani. Genome-wide association study of hematological and bio-719
chemical traits in a japanese population. Nature genetics, 42(3):210, 2010.720
[47] Marc A Coram, Qing Duan, Thomas J Ho↵mann, Timothy Thornton, Joshua W Knowles, Nicholas A721
Johnson, Heather M Ochs-Balcom, Timothy A Donlon, Lisa W Martin, Charles B Eaton, et al. Genome-722
wide characterization of shared and distinct genetic components that influence blood lipid levels in723
ethnically diverse human populations. The American Journal of Human Genetics, 92(6):904–916, 2013.724
[48] Deepti Gurdasani, Tommy Carstensen, Segun Fatumo, Guanjie Chen, Chris S Franklin, Javier Prado-725
Martinez, Heleen Bouman, Federico Abascal, Marc Haber, Ioanna Tachmazidou, et al. Uganda genome726
resource enables insights into population history and genomic discovery in africa. Cell, 179(4):984–1002,727
2019.728
[49] Elisabeth M van Leeuwen, Aniko Sabo, Joshua C Bis, Jennifer E Hu↵man, Ani Manichaikul, Albert V729
Smith, Mary F Feitosa, Serkalem Demissie, Peter K Joshi, Qing Duan, et al. Meta-analysis of 49730
549 individuals imputed with the 1000 genomes project reveals an exonic damaging variant in angptl4731
determining fasting tg levels. Journal of medical genetics, 53(7):441–449, 2016.732
[50] Matthew A Reyna, Mark DM Leiserson, and Benjamin J Raphael. Hierarchical hotnet: identifying733
hierarchies of altered subnetworks. Bioinformatics, 34(17):i972–i980, 2018.734
[51] Christoph Heiring, Bjorn Dahlback, and Yves A Muller. Ligand recognition and homophilic interactions735
in tyro3 structural insights into the axl/tyro3 receptor tyrosine kinase family. Journal of Biological736
Chemistry, 279(8):6952–6958, 2004.737
[52] Alice B Popejoy and Stephanie M Fullerton. Genomics is failing on diversity. Nature News, 538(7624):738
161, 2016.739

[53] Wei Cheng, Sohini Ramachandran, and Lorin Crawford. Estimation of non-null snp e↵ect size distribu-740
tions enables the detection of enriched genes underlying complex traits. PLoS genetics, 16(6):e1008855,741
2020.742
[54] Xiang Zhu and Matthew Stephens. Bayesian large-scale multiple regression with summary statistics743
from genome-wide association studies. The annals of applied statistics, 11(3):1561, 2017.744
[55] Michael C Wu, Seunggeun Lee, Tianxi Cai, Yun Li, Michael Boehnke, and Xihong Lin. Rare-variant745
association testing for sequencing data with the sequence kernel association test. The American Journal746
of Human Genetics, 89(1):82–93, 2011.747
[56] Jake R Conway, Alexander Lex, and Nils Gehlenborg. Upsetr: an r package for the visualization of748
intersecting sets and their properties. Bioinformatics, 33(18):2938–2940, 2017.749
[57] Antonio Fabregat, Konstantinos Sidiropoulos, Phani Garapati, Marc Gillespie, Kerstin Hausmann,750
Robin Haw, Bijay Jassal, Steven Jupe, Florian Korninger, Sheldon McKay, et al. The reactome pathway751
knowledgebase. Nucleic acids research, 44(D1):D481–D487, 2016.752
[58] Sabry Razick, George Magklaras, and Ian M Donaldson. irefindex: a consolidated protein interaction753
database with provenance. BMC bioinformatics, 9(1):405, 2008.754
[59] Masahiro Kanai, Masato Akiyama, Atsushi Takahashi, Nana Matoba, Yukihide Momozawa, Masashi755
Ikeda, Nakao Iwata, Shiro Ikegawa, Makoto Hirata, Koichi Matsuda, et al. Genetic analysis of quanti-756
tative traits in the japanese population links cell types to complex human diseases. Nature genetics, 50757
(3):390–400, 2018.758
[60] Masato Akiyama, Yukinori Okada, Masahiro Kanai, Atsushi Takahashi, Yukihide Momozawa, Masashi759
Ikeda, Nakao Iwata, Shiro Ikegawa, Makoto Hirata, Koichi Matsuda, et al. Genome-wide association760
study identifies 112 new loci for body mass index in the japanese population. Nature genetics, 49(10):761
1458, 2017.762
[61] Masato Akiyama, Kazuyoshi Ishigaki, Saori Sakaue, Yukihide Momozawa, Momoko Horikoshi, Makoto763
Hirata, Koichi Matsuda, Shiro Ikegawa, Atsushi Takahashi, Masahiro Kanai, et al. Characterizing rare764
and low-frequency height-associated variants in the japanese population. Nature communications, 10765
(1):1–11, 2019.766
[62] Alexander Gusev, Arthur Ko, Huwenbo Shi, Gaurav Bhatia, Wonil Chung, Brenda WJH Penninx, Rick767
Jansen, Eco JC De Geus, Dorret I Boomsma, Fred A Wright, et al. Integrative approaches for large-scale768
transcriptome-wide association studies. Nature genetics, 48(3):245, 2016.769

[63] Pak C Sham and Shaun M Purcell. Statistical power and significance testing in large-scale genetic770
studies. Nature Reviews Genetics, 15(5):335–346, 2014.771
[64] Huwenbo Shi, Kathryn S Burch, Ruth Johnson, Malika K Freund, Gleb Kichaev, Nicholas Mancuso,772
Astrid M Manuel, Natalie Dong, and Bogdan Pasaniuc. Localizing components of shared transethnic773
genetic architecture of complex traits from gwas summary data. The American Journal of Human774
Genetics, 106(6):805–817, 2020.775
[65] Gao Wang, Abhishek Sarkar, Peter Carbonetto, and Matthew Stephens. A simple new approach to776
variable selection in regression, with application to genetic fine mapping. Journal of the Royal Statistical777
Society: Series B (Statistical Methodology), 82(5):1273–1300, 2020.778
[66] David H Alexander, John Novembre, and Kenneth Lange. Fast model-based estimation of ancestry in779
unrelated individuals. Genome research, 19(9):1655–1664, 2009.780
[67] Christopher C Chang, Carson C Chow, Laurent CAM Tellier, Shashaank Vattikuti, Shaun M Pur-781
cell, and James J Lee. Second-generation plink: rising to the challenge of larger and richer datasets.782
Gigascience, 4(1):s13742–015, 2015.783
[68] Akiko Nagai, Makoto Hirata, Yoichiro Kamatani, Kaori Muto, Koichi Matsuda, Yutaka Kiyohara,784
Toshiharu Ninomiya, Akiko Tamakoshi, Zentaro Yamagata, Taisei Mushiroda, et al. Overview of the785
biobank japan project: study design and profile. Journal of epidemiology, 27(Supplement III):S2–S8,786
2017.787
[69] Genevieve L Wojcik, Mariaelisa Gra↵, Katherine K Nishimura, Ran Tao, Je↵rey Haessler, Christopher R788
Gignoux, Heather M Highland, Yesha M Patel, Elena P Sorokin, Christy L Avery, et al. Genetic analyses789
of diverse populations improves discovery for complex traits. Nature, 570(7762):514–518, 2019.790
[70] Peter H Sudmant, Tobias Rausch, Eugene J Gardner, Robert E Handsaker, Alexej Abyzov, John Hud-791
dleston, Yan Zhang, Kai Ye, Goo Jun, Markus Hsi-Yang Fritz, et al. An integrated map of structural792
variation in 2,504 human genomes. Nature, 526(7571):75–81, 2015.793
[71] Anders Bergstrom, Shane A McCarthy, Ruoyun Hui, Mohamed A Almarri, Qasim Ayub, Petr Danecek,794
Yuan Chen, Sabine Felkel, Pille Hallast, Jack Kamm, et al. Insights into human genetic variation and795
population history from 929 diverse genomes. Science, 367(6484), 2020.796
[72] Huwenbo Shi, Steven Gazal, Masahiro Kanai, Evan M Koch, Armin P Schoech, Katherine M Siewert,797
Samuel S Kim, Yang Luo, Ti↵any Amariuta, Hailiang Huang, et al. Population-specific causal disease798
e↵ect sizes in functionally important regions impacted by selection. Nature Communications, 12(1):799
1–15, 2021.800
[73] Iain Mathieson. The omnigenic model and polygenic prediction of complex traits. The American Journal801
of Human Genetics, 2021.802
[74] Matthew Stephens. False discovery rates: a new deal. Biostatistics, 18(2):275–294, 2017.803
[75] Sarah M Urbut, Gao Wang, Peter Carbonetto, and Matthew Stephens. Flexible statistical methods804
for estimating and testing e↵ects in genomic studies with multiple conditions. Nature genetics, 51(1):805
187–195, 2019.806
[76] Farhad Hormozdiari, Emrah Kostem, Eun Yong Kang, Bogdan Pasaniuc, and Eleazar Eskin. Identifying807
causal variants at loci with multiple signals of association. Genetics, 198(2):497–508, 2014.808
[77] Alicia R Martin, Meng Lin, Julie M Granka, Justin W Myrick, Xiaomin Liu, Alexandra Sockell, Eliza-809
beth G Atkinson, Cedric J Werely, Marlo Moller, Manjinder S Sandhu, et al. An unexpectedly complex810
architecture for skin pigmentation in africans. Cell, 171(6):1340–1353, 2017.811
[78] Peter Carbonetto and Matthew Stephens. Integrated enrichment analysis of variants and pathways in812
genome-wide association studies indicates central role for il-2 signaling genes in type 1 diabetes, and813
cytokine signaling genes in crohn’s disease. PLoS genetics, 9(10):e1003770, 2013.814
[79] Xiang Zhu and Matthew Stephens. Large-scale genome-wide enrichment analyses identify new trait-815
associated genes and pathways across 31 human phenotypes. Nature communications, 9(1):1–14, 2018.816
[80] Michael C Wu, Peter Kraft, Michael P Epstein, Deanne M Taylor, Stephen J Chanock, David J Hunter,817
and Xihong Lin. Powerful snp-set analysis for case-control genome-wide association studies. The818
American Journal of Human Genetics, 86(6):929–942, 2010.819
[81] Seunggeun Lee, Mary J Emond, Michael J Bamshad, Kathleen C Barnes, Mark J Rieder, Deborah A820
Nickerson, ESP Lung Project Team, David C Christiani, Mark M Wurfel, Xihong Lin, et al. Optimal821
unified approach for rare-variant association testing with application to small-sample case-control whole-822
exome sequencing studies. The American Journal of Human Genetics, 91(2):224–237, 2012.823
[82] Iuliana Ionita-Laza, Seunggeun Lee, Vlad Makarov, Joseph D Buxbaum, and Xihong Lin. Sequence824
kernel association tests for the combined e↵ect of rare and common variants. The American Journal of825
Human Genetics, 92(6):841–853, 2013.826

[83] Melissa R McGuirl, Samuel Pattillo Smith, Bjorn Sandstede, and Sohini Ramachandran. Detecting827
shared genetic architecture among multiple phenotypes by hierarchical clustering of gene-level associa-828
tion statistics. Genetics, 2020.829
[84] Lorin Crawford, Ping Zeng, Sayan Mukherjee, and Xiang Zhou. Detecting epistasis with the marginal830
epistasis test in genetic mapping studies of quantitative traits. PLoS genetics, 13(7):e1006869, 2017.831
[85] Maria Maddalena Barbieri, James O Berger, et al. Optimal predictive model selection. The annals of832
statistics, 32(3):870–897, 2004.833