Shared Mobility Simulations for Dublin - International ...
97
Shared Mobility Simulations for Dublin Case-Specific Policy Analysis
-
Upload
khangminh22 -
Category
Documents
-
view
0 -
download
0
Transcript of Shared Mobility Simulations for Dublin - International ...
Corporate Partnership Board
CPB
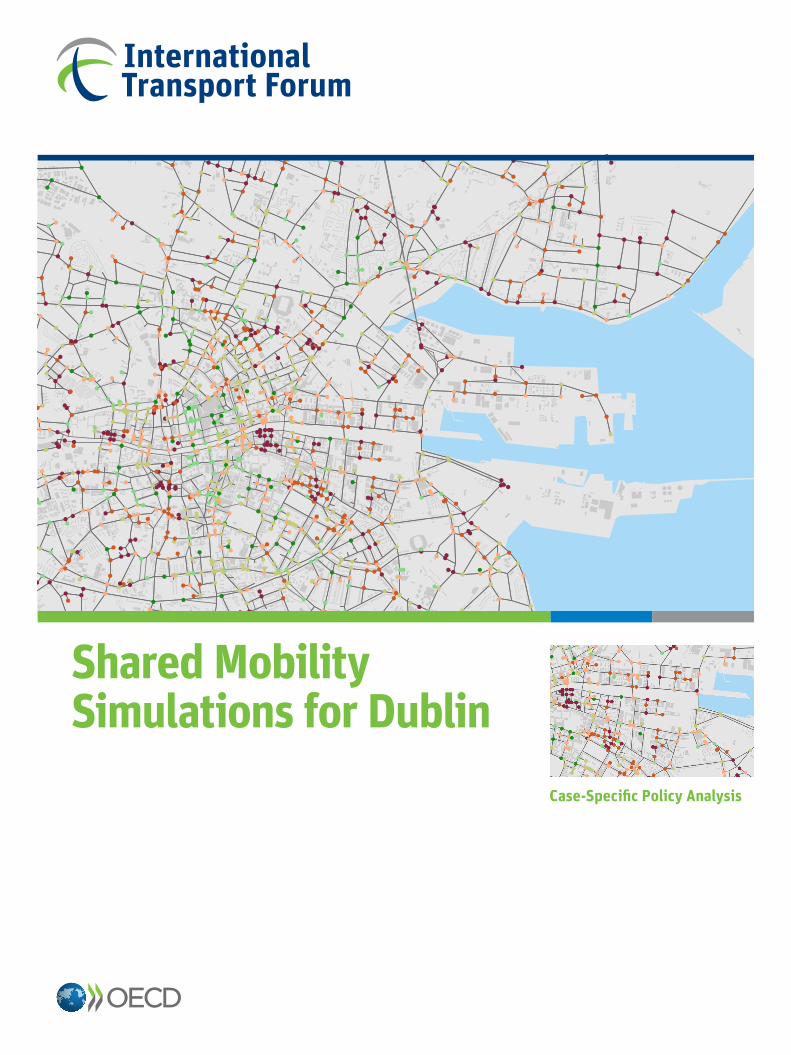
Shared Mobility Simulations for Dublin
Case-Specific Policy Analysis

Shared Mobility Simulations for Dublin
Case-Specific Policy Analysis
The International Transport Forum
The International Transport Forum is an intergovernmental organisation with 59 member countries. It acts as
a think tank for transport policy and organises the Annual Summit of transport ministers. ITF is the only global
body that covers all transport modes. The ITF is politically autonomous and administratively integrated with the
OECD.
The ITF works for transport policies that improve peoples’ lives. Our mission is to foster a deeper
understanding of the role of transport in economic growth, environmental sustainability and social inclusion and to
raise the public profile of transport policy.
The ITF organises global dialogue for better transport. We act as a platform for discussion and pre-negotiation
of policy issues across all transport modes. We analyse trends, share knowledge and promote exchange among
transport decision-makers and civil society. The ITF’s Annual Summit is the world’s largest gathering of transport
ministers and the leading global platform for dialogue on transport policy.
The Members of the ITF are: Albania, Armenia, Argentina, Australia, Austria, Azerbaijan, Belarus, Belgium,
Bosnia and Herzegovina, Bulgaria, Canada, Chile, China (People’s Republic of), Croatia, Czech Republic,
Denmark, Estonia, Finland, France, Former Yugoslav Republic of Macedonia, Georgia, Germany, Greece,
Hungary, Iceland, India, Ireland, Israel, Italy, Japan, Kazakhstan, Korea, Latvia, Liechtenstein, Lithuania,
Luxembourg, Malta, Mexico, Republic of Moldova, Montenegro, Morocco, the Netherlands, New Zealand,
Norway, Poland, Portugal, Romania, Russian Federation, Serbia, Slovak Republic, Slovenia, Spain, Sweden,
Switzerland, Turkey, Ukraine, the United Arab Emirates, the United Kingdom and the United States.
International Transport Forum
2, rue André Pascal
F-75775 Paris Cedex 16
www.itf-oecd.org
Case-Specific Policy Analysis Reports
The ITF’s Case-Specific Policy Analysis series presents topical studies on specific issues carried out by the
ITF in agreement with local institutions. This work is published under the responsibility of the Secretary-General of
the ITF. The opinions expressed and arguments employed herein do not necessarily reflect the official views of ITF
or OECD member countries.

ACKNOWLEDGEMENTS – 3
SHARED MOBILITY SIMULATIONS FOR DUBLIN — © OECD/ITF 2018
Acknowledgements
This report is part of an ongoing series of studies at the International Transport Forum on Shared
Mobility in different urban and metropolitan contexts. Funding for this specific project was provided by
the Department of Transport, Tourism and Sport and the National Transport Authority. The local project
group was led by Barry Colleary, the Head of Transport Modelling at National Transport Authority, and
included Paul Hussey, Peter O’Sullivan and John Nott (National Transport Authority). The local project
group also received support and input from Hugh Creegan (Director of Transport Planning, Investment
and Taxi Regulation at the National Transport Authority) and Aoife O’Grady (Head of Strategic
Research and Analysis, Department of Transport, Tourism and Sport).
The principal authors of this report were Olga Petrik and Luis Martinez (technical supervision), with
support from Francisco Furtado of the International Transport Forum. The project was supervised by Jari
Kauppila. The authors thank Barry Colleary for very helpful and valuable edits of the manuscript. The
authors also thank Sharon Masterson for being a liaison for the project, chairing the focus group, and
editing the manuscript. The authors also thank Liv Gudmundson for copy-editing.
4 – TABLE OF CONTENTS
SHARED MOBILITY SIMULATIONS FOR DUBLIN — © OECD/ITF 2018
Table of contents
Executive summary ....................................................................................................................................... 5
Introduction ................................................................................................................................................... 8
Modelling framework and shared modes specification............................................................................ 10
Project outline ............................................................................................................................................ 10 ITF Shared Mobility simulation model ...................................................................................................... 11 Shared modes specification ....................................................................................................................... 13
Characterisation of the study area ............................................................................................................. 16
Modelling current travel demand .............................................................................................................. 20
Model inputs .............................................................................................................................................. 20 Results of the mode choice model based on the revealed preference data ................................................ 23 Synthetic population generation ................................................................................................................ 25
Potential users of Shared Mobility ............................................................................................................. 30
Design of the focus group meeting ............................................................................................................ 30 Results of the discussion ............................................................................................................................ 31 Stated preference survey ............................................................................................................................ 32 Conclusions and implications of the focus group experiment ................................................................... 39
Setting the Shared Mobility scenarios ....................................................................................................... 41
Impact of Shared Mobility .......................................................................................................................... 47
Major mobility outcomes ........................................................................................................................... 47 Changes in access and connectivity ........................................................................................................... 52 Operational performance ........................................................................................................................... 55 Comparison with Lisbon case study .......................................................................................................... 56 Detailed analysis of selected scenarios ...................................................................................................... 57 Impacts of Shared Mobility key findings ................................................................................................... 79
Key findings and further research ............................................................................................................. 81
References .................................................................................................................................................... 84
Annex 1. Example of a stated preference survey question ...................................................................... 85
Annex 2. Characteristics of the two groups of the respondents .............................................................. 86
Annex 3. Attitudes towards the shared modes and their attributes of the two groups of the
respondents .................................................................................................................................................. 88
Annex 4. Calculation of the CO2 emissions ............................................................................................... 92
Annex 5. Effective access ............................................................................................................................ 93
Annex 6. Inputs for estimation of the costs ............................................................................................... 94

EXECUTIVE SUMMARY – 5
SHARED MOBILITY SIMULATIONS FOR DUBLIN — © OECD/ITF 2018
Executive summary
What we did
This report examines how new shared mobility services could change mobility in Ireland’s Greater
Dublin Area. Simulations of eleven different shared transport scenarios show how such services could
affect congestion, CO2 emissions and the use of public space. They also examine how such solutions
might impact service quality, the cost of mobility, citizens’ access to opportunities and their use of public
transport. The findings provide decision makers with evidence to properly weigh opportunities and
challenges created by new forms of mobility. The work is part of a series of studies on shared mobility in
different urban and metropolitan contexts.
What we found
Today’s mobility in the Greater Dublin Area could be delivered with only 2% of the current number
of private vehicles. A transport system consisting only of Shared Mobility services and the existing rail
and light-rail transit (LRT) could allow this reduction. The total distance driven by all vehicles,
emissions and congestion would be reduced by 38%, 31%, and by 37% respectively.
If only 20% of private car trips were replaced with shared modes, vehicle kilometres driven would
fall 23% and emissions by 22%. The impact on congestion would be far less strong in this scenario, with
only a 7% reduction.
Shared mobility also improves connectivity across the area and for the population. This results in a
more equitable access to opportunities for citizens. The integration of Shared Mobility solutions in the
urban and regional mobility market can aid the region in achieving decarbonising goals while promoting
improved equitable access, affordable transport and economic productivity. Introducing Shared Mobility
will help increase the use of existing bus and rail networks. In the light of the current development of bus
rapid transit (BRT) corridors and priority bus services in the Greater Dublin Area, the Shared Mobility
services were tested with a scenario maintaining existing bus supply. Keeping the core bus network
would result in a 30% reduction of transport CO2 emissions and 38% less congestion in a scenario of
converting private mobility to public transport or shared modes. Combining high performance bus
services with an on-demand Taxi-Bus service can be effective in substituting low-frequency and
inefficient bus services. The integration of new Shared Mobility services with existing public transport
creates greater flexibility for users. It also enhances performance of public transport services and
infrastructure.
The large size of the Greater Dublin area with dispersed demand make it difficult to provide public
transport for the region efficiently. Even for on-demand Taxi-Buses demand would be insufficient along
some routes. To remain efficient, Shared Mobility services in these areas could be delivered by using
vehicles with fewer seats (Shared Taxis). This would still improve mobility at an affordable cost.
Attention needs to be given to capacity at rail stations. Integrating new shared services with the
existing heavy rail network can increase rail ridership by up to a third (33%). Sufficient infrastructure for
shared vehicles that drop off and pick up passengers at the station are therefore important. The rail

6 – EXECUTIVE SUMMARY
SHARED MOBILITY SIMULATIONS FOR DUBLIN— © OECD/ITF 2018
service itself may also need increased capacity to accommodate more riders without lowering service
quality. Station layouts may need to be redesigned to ensure good access for pedestrians and cyclists.
With current technologies, electric vehicles would be of limited use for Shared Mobility services on
a regional level. Their maximum driving range is currently not sufficient for providing long-distance
service without recharging during the day. The fleet of electric vehicles required to provide the same
mobility as conventional vehicles would have to be between 9% (in scenario 10 with shared mobility
focused inside the low emission zone within Dublin city) and 19% (in the full replacement scenario)
larger to compensate for inactivity during recharging. With battery technology improving rapidly,
electric vehicles could reach required driving range within a few years. Therefore they should be
considered as an option, as their impact on CO2 emissions is significant.
The price of Shared Mobility services could be significantly lower than today’s mobility options.
On demand Taxi-Bus services could be offered at a price half that of the current public transport if
implemented at a large scale. Equally, a ride in a Shared Taxi could be offered at about 50% the price of
a conventional taxi ride today. Importantly, using Shared Taxis could be cheaper than owning and
driving a private car for people regularly taking short and mid-distance trips of up to 25 kilometres (for a
vehicle costing up to 30,000 euros). Keeping overall prices low despite the low density of population in
some parts of the Greater Dublin Area might require the integration of regional services and a cross-
subsidisation of users. This can increase the mobility costs to some users in the centre but will ensure
collective transport is available elsewhere.
Focus group findings show that users are in favour of Shared Mobility. Lower costs and reduced
waiting times are the main attractions for the users surveyed for this study. A less important factor for
deciding for or against using Shared Mobility Services was detour time for picking up or dropping off
co-riders. Most users said they were willing to use Taxi-Buses or Shared Taxis for direct trips or as
feeder services to rail transport. Sharing a vehicle with several other passengers was more acceptable to
users than sharing a ride than with one or two other persons. Young people below the age of 25 and
women are the most likely early adopters of shared services. For most of the surveyed person the critical
factor for their choice is price. Most current users of public transport would accept higher ticket price
than the current public transport prices, even for Taxi-Bus. Car users mostly expect the cost for using
Shared Mobility services to be lower than the cost of a privately owned car.
What we recommend
Consider integrating Shared Mobility services into the Greater Dublin Area transport system
Shared, on-demand mobility services could provide significant benefits to the Greater Dublin Area
by reducing emissions, congestion and the need for parking space. Shared mobility would also result in
better access to opportunities for citizens, and make access more equitable for inhabitants of areas not
well-connected to public transport.
Shared mobility services should be provided on a large-enough scale to reap full benefits
The benefits of Shared Mobility in terms of reduced CO2 emissions and congestion are higher if a
substantial portion of the area’s car users shift to the new shared modes. Restricting car use and
introducing Shared Mobility services in a small area (such as in the scenario with a small low emission
zone) can result in low vehicle occupancy and higher prices. This would cause significant bottlenecks
and congestion at park-and-ride stations at the borders of the low emission zone.

EXECUTIVE SUMMARY – 7
SHARED MOBILITY SIMULATIONS FOR DUBLIN — © OECD/ITF 2018
Use shared services as a feeder service for high-capacity public transport and the existing bus
network
The new Shared Mobility services can complement existing public transport. Properly integrating
taxi-Busses and Shared Taxis with light rail services, Bus Rapid Transit lines and the regular bus
network will improve performance of the entire transport system. In particular, shared modes can act as
feeder services for rail lines and help increase the number rail users. This will require policies prioritising
access in public space as well as improved drop-off/pick-up zones at rail stations and other major
destinations, such as schools or areas with large concentration of working places. On demand Taxi-Buses
should complement conventional bus lines or Dublin’s future bus transit system rather than replace them.
Use alternative fuels for shared mobility fleet to reduce emissions further
Electric vehicles need time to recharge. Thus a larger fleet is needed to provide the same number of
trips. If deployed for as a Shared Mobility fleet at a regional level with relatively long distances to cover,
the increase in the number of vehicles needed is significant. But electric vehicle fleets can be used in
more densely-populated sub-regions where they can cover more trips within their available range. Other
types of vehicles powered by alternative fuels, e.g. natural gas, should also be considered.
Target potential early adopters for Shared Mobility services in order to achieve scale of service
About 20% of car users would consider switching to Shared Mobility services, while public
transport consider this mode positively if improving public transport performance at comparable costs.
This would be sufficient to make the services affordable. Affordable prices, in turn, will increase uptake.
Targeted public information campaigns to raise awareness for the availability of shared services,
highlight their benefits and build acceptance among citizens will help to create sufficient scale to launch
a virtuous circle.
Set the regulatory framework for shared mobility services to generate maximum societal benefit
Shifting mobility from individual to shared transport modes requires a stable and predictable market
for the new shared services. This calls for aligned policies with regard to set price, oversee activities,
allocate concessions, regulate land-use and infrastructure design, among other issues. The simulations for
this study used a single operator. In practice, several operators (and pricing schemes) could be. Policy
parameters will have to be set carefully so the desired benefits for society are maximised. Monitoring
performance is important to be able to adjust the framework where outcomes diverge from objectives. To
facilitate this, authorities should require Shared Mobility operators to provide performance data for
agreed metrics as a condition for operating license.

8 – INTRODUCTION
SHARED MOBILITY SIMULATIONS FOR DUBLIN — © OECD/ITF 2018
Introduction
This study examines how the optimised sharing of transport services can transform the mobility in
the Greater Dublin Area (GDA), while promoting public transport integration and preserving
non-motorised modes.
A wide range of technological disruptions have been observed in transportation in recent decades.
The growth of the sharing economy, in which people exchange goods and services, is one of the most
remarkable disruptions with a potential to drastically change the conventional transportation systems.
Together with ubiquitous digitalisation, which allows the efficient matching of demand and supply, this
gives rise to the on-demand shared transport paradigm, especially in urban areas. Optimised sharing
solutions have potential to provide citizens with a more flexible, comfortable and available public
transport alternative, overcoming the inconvenience of conventional public transport. This would
encourage the shift of citizens to more sustainable solutions compared with the use of private cars, which
are very inefficient in terms of occupancy rates and vehicle usage, both in space and time. Using vehicles
more efficiently would, in turn, lead to a reduction in congestion, social exclusion, road accidents and to
the more efficient use of public space and better air quality.
In recent years the population of the GDA has grown resulting in an increase in the number of
people commuting to work and education (Central Statistics Office of Ireland, 2017). The Irish transport
authorities continue to improve and expand the public transport system coverage and performance, and
the cycling and pedestrian infrastructure. They also apply demand management measures to encourage
the shift from car to public transport. However, while almost half of people entering the Dublin City
Centre (DCC) use public transport, in the rest of the GDA the car remains the main transport mode. The
relatively low density and large area of the GDA hinders the provision of good coverage by public
transport, along with the level of frequency and reliability sufficient to serve and attract more passengers
(National Transport Authority, 2016).
The strategic plans of the transport authorities of the region have included the expansion and further
integration of the public transport network and application of demand management measures aimed at
promoting more sustainable modes of transport, including shared modes (National Transport Authority,
2016). The rapid evolution of technologies, societal trends and business models creates a challenge for
authorities who are willing to encourage a shift from a private car to shared modes, and aim to develop
regulatory environment for successful uptake of the new modes. This report presents assessment of the
impact of shared services on key performance indicators based on simulation of various mobility
scenarios in the presence of the new modes. It aims to assist the authorities in the design of the future
services and regulations to ensure their effective integration into the transport system.
The ITF Shared Mobility Model simulates daily travel for a hypothetical Shared Mobility system.
Previous ITF Corporate Partnership Board reports presented the potential impacts of new shared urban
mobility solutions leveraged by digital connectivity in the city of Lisbon (ITF, 2015; 2017). The results
of the simulations showed that large-scale introduction of the new shared modes would lead to strong
reduction in the required vehicle fleet, emissions and congestion while improving equity of access,
aiding the urban transport sector in achieving its decarbonisation objectives while promoting the other
pillars of sustainability.

INTRODUCTION – 9
SHARED MOBILITY SIMULATIONS FOR DUBLIN — © OECD/ITF 2018
To assess the impact of Shared Mobility we have used a combination of qualitative and quantitative
approaches which include a micro-simulation model and a focus group meeting to identify potential
users. The proposed shared services are Shared Taxi and Taxi-Bus. The two modes could fully or
partially replace current motorised road transport alternatives (car, motorcycle, taxi and bus) and serve as
a feeder to rail. Both kinds of services are on-demand and dynamically dispatched. Shared Taxi is a
door-to-door service provided by a 4-6 seater vehicle, moving along trajectories optimised in real-time
with small detours for boarding and alighting the passengers. Taxi-Bus is a street-corner-to-street-corner
service that requires 30-minutes advanced reservation and that provides transfer-less trips in a minibus of
8-16 people along dynamically defined routes.
Prior to the simulations, the GDA transport users’ preferences regarding the proposed shared modes
were compared to the existing urban and sub-urban transport options. The data was collected at a
specially arranged focus group meeting. The meeting consisted of a discussion and a stated preference
survey. The analysis of the data included the identification and quantification of the most important
attributes of the new modes and socio-demographic characteristics of the users that influence mode
choice. This enabled the identification of potential early adopters of the new services. The information
can be used to design new modes that are more tailored to the potential users’ needs thus ensuring that
the desired modal shift is achieved. It also facilitates the development of targeted strategies to raise
awareness of the relevant market segments informing them of the new alternatives and their individual
and societies benefits. The identified users’ preferences regarding the new modes’ attributes also allow
the adjustment of the simulation model constraints (e.g. maximum waiting time, maximum detour time)
defining the level of service of the new modes.
The micro-simulation model reproduces the daily mobility patterns and the interactions between the
users and Shared Mobility modes in a transport network in an urban context. The agent-based simulation
manifests itself in a dynamic optimised matching of demand and supply under minimal detour distances
and travel times constraints. The model enables the exploration of different transport scenarios that
preserve the behavioural preferences of the citizens. This provides insights on how the potential new
modes will perform in terms of quality of service, productive efficiency and cost competitiveness; and
their potential impact on mobility, accessibility, environment, and public space use in the GDA.
The scenarios tested include a reference full-adoption scenario and partial-adoption scenarios. In the
reference scenario the existing motorised transport alternatives (private car and buses) are completely
substituted with the Shared Mobility services. In partial-adoption scenarios only certain trips by
motorised modes are substituted, conditioned by the origin and destination, mode, and by the value of the
utility of different modes for a given transport user. While the reference scenario represents the
maximum potential of Shared Mobility, the partial-adoption scenarios facilitate the investigation of the
impact of gradually deploying the services.

10 – MODELLING FRAMEWORK AND SHARED MODES SPECIFICATION
SHARED MOBILITY SIMULATIONS FOR DUBLIN— © OECD/ITF 2018
Modelling framework and shared modes specification
Project outline
This section presents the ITF Shared Mobility modelling framework and provides a detailed
description of the simulation model and shared modes specifications. The project description mirrors
that of the previous ITF study on Shared Mobility performance for Auckland (ITF, 2017a).
The ITF Shared Mobility modelling framework is developed from five main building blocks and
study stages as presented in Figure 1. The first block addresses the characterisation of the study area.
This characterisation includes the spatial definition of the study area and its land-use characteristics;
the available transport infrastructure and services (road network and public transport services), and
the resulting transport performance by spatial division (grid), origin-destination (OD) pair and
transport mode; and the analysis of mobility using the Ireland Household Travel Survey (2012). The
elements of this block are discussed in in the section “Characterisation of the study area”.
All the data from the first building block are used to estimate a revealed preferences mode choice
model as the final input to create a synthetic mobility dataset. The synthetic population and its
socio-demographic characteristics are generated based on census data (2011) and the Household
Travel Survey (2012), expanded to the total population, by generating synthetic households’
compositions with similar mobility profiles as the Household Travel Survey sample. The trip patterns
of each representative of the synthetic population and their spatial distribution are obtained based on
the travel survey revealed preference data. The model generates the mobility of these individuals
constrained to their generated residential location, land-use distribution in the study area, and the
transportation network performance for the generated transport modes. The estimated mode choice
model produces the probabilities used to assign a transport mode for each trip. The development of
this stage is described in the section “Modelling current travel demand”.
The next stage of the study is the collection of information regarding the city citizens’
willingness to adopt Shared Mobility (described in the section “Potential users of Shared Mobility”).
To identify the GDA transport users’ preferences in the scenarios with presence of the shared modes,
ITF and the National Transport Authority organised a focus group to meet with potential users. The
meeting included a discussion, as well as a web-based revealed and stated preference survey. It
enabled the identification and quantification of the most important attributes of the shared modes and
social-demographic characteristics of the users’ influencing mode choice, as well as the calibration of
a new mode choice model. The sample size of the web-based survey was increased through the
recruitment of additional respondents. The additional information collected was used to identify the
market segments of early adopters and rank the willingness of current private motorised transport (car,
motorcycle or taxi) and bus users to switch to Shared Mobility modes. If a user switches to a shared
mode, the calculated mode choice probabilities determine the most plausible mode (out of the two
shared modes) for each trip.
After analysing the focus group results, in discussion with the National Transport Authority of
Ireland, a set of transport supply scenarios was created with different adoption levels of the shared
modes and remaining shares of private car and bus users (a total of eleven scenarios). These scenarios
are described in detail in the section “Setting the Shared Mobility scenarios”.

MODELLING FRAMEWORK AND SHARED MODES SPECIFICATION – 11
SHARED MOBILITY SIMULATIONS FOR DUBLIN — © OECD/ITF 2018
The synthetic mobility dataset and the different transport demand and supply scenarios were then
tested in the ITF Shared Mobility simulation model. The outputs for each tested scenario included
measures of the service quality, the operation performance and sustainability. These results are
discussed in the section “Impact of Shared Mobility”.
The sub-section below presents a detailed description of the simulation model and shared modes
specifications. More detailed information on the modelling framework, data sources and other
assumptions/parameters, will be made available in the forthcoming ITF publication Shared Mobility
Solutions for Cities: Modelling Framework.
Figure 1. Shared mobility modelling framework
Notes: PT- Public Transport; OD – Origin-Destination; SM – Shared Mobility. Source: ITF (2017a).
ITF Shared Mobility simulation model
The core of the modelling framework is an agent-based simulation model. The model has three
main agents interacting in a common environment: users, vehicles and a dispatcher (see Figure 2). It
reproduces the daily mobility patterns in the study area for the synthetic population, matches demand
and supply, and saves the trip logs for the estimation of performance indicators. Two types of shared
services are considered: a door-to-door Shared Taxi and an on-demand bus-like system called Taxi-
Bus.
In the simulation environment a trip is generated when a user (or a party of users) requests a
service. The mode is then assigned to the user based on the calculated mode choice probabilities.
Then a dispatcher matches the demand with the transport supply. If the user prefers a Taxi-Bus, they
need to order the service 30 minutes in advance and give information about the desired trip (location
of origin/destination and desired departure time). In the case of Taxi-Bus, the system can generate a
Characterisation of the study area
Transport infrastructure and
services
Road network
PT GTFS model
Synthetic mobility dataset
Household characterisation (Residential location, family profile)
Individual data
(age, education level)
Mobility data(trip sequence, each trip (origin,
destination, schedule, purpose,
transport mode))
Transport demand & supply scenario
Supply (Scenario specification)Private car (allowed: Yes/No)
Conventional Bus (preserved: Yes/No)
BRT (preserved: Yes/No)
Walking & biking (preserved: Yes)
Rail and Ferry (preserved: Yes)
Low Emission Zone (active: Yes/No)
Demand (Scenario specification)Private car trips (% modal shift to SM)
Bus trips (% modal shift to SM)
Transport performance by OD
pair and mode
Travel times by mode
Probability of trip
production / attraction
Land use data (Grid)Population
Employment
Ameneties (POIs)
Building footprint
Mobility seed and transport
mode preferences
Travel survey
Mode choice model
Focus group and
stated preference analysis
Willingness to shift to SM
SM mode selectionShared-Taxi
Taxi-Bus
Feeder service to
rail, ferry or BRT
Simulation (Outputs)
Service qualityWaiting time
Detour time
Operational PerformanceAverage vehicle occupancy
Fleet requirements
Costs
Society (Sustainability)Emissions
Congestion
Accessibility indicators
Parking requirements
LegendInputs
Outputs
Spatial definition and
resolution
Study area boundaries
Grid system definition

12 – MODELLING FRAMEWORK AND SHARED MODES SPECIFICATION
SHARED MOBILITY SIMULATIONS FOR DUBLIN— © OECD/ITF 2018
new route with the recent demand, allocate the clients to vehicles already under operation, or re-assign
this request to the Shared Taxi service. More specifically, the dispatcher finds the best match in Taxi-
Bus service that warrants at least 50% occupancy (at least for a part of the trip) and an average
distance-based occupancy rate greater than 25% of the vehicle capacity. If the user requests a Taxi-
Bus but there is no designated stop within the acceptable distance and/or there are not enough users to
share a bus and meet the minimum occupancy constraints, the user is upgraded to a Shared Taxi (at
the price of a Taxi-Bus).
Figure 2. Relation between agents in the simulation model
Source: ITF (2017a).
Shared Taxi requests are handled in real time. The dispatcher analyses each request and provides the
user with the pick-up time, the vehicle licence plate, the number of clients who will share the vehicle
and if the user should cross the street to reduce waiting time. The model takes into account a
distance-minimisation principle that applies not just to the requesting user but also to those already
under way in the same vehicle. The dispatcher runs a local search algorithm that tries to minimise the
additional travel distance generated by the new client, complying with the users’ constraints (waiting
time and detour time). The waiting time, detour time and arrival time of the resulting trips must be
within the model constraints. The constraints are calculated based on the current trip characteristics
with some variations within pre-set tolerances.
The obtained flows are attributed to each link of the road network though a dynamic traffic
assignment procedure that updates travel time based on volume-capacity ratio for every five simulated
minutes. The study area is divided into a grid with cells of different size: 1 000 metre x 1 000 metre,
500 m x 500 m, and 200 m x 200 m so that the denser parts of the study area are covered with smaller
cells. The origins and destinations of the generated trips are linked to the closest road network nodes.
The dispatcher defines a set of rules for matching cars to users, centralising all real-time
information required to produce and monitor these trips. The choice of which car or minibus to match
with a user’s request takes into account a time-minimisation principle that applies not just to the
requesting user but also to those already under way in the same vehicle. The dispatcher also controls
the vehicle movements when idle, ensuring efficient vehicle movements to stations and calculating
the additional fleet requirements. Whenever the car is not dispatched to a new trip, it returns to the
nearest station (depot) and stays there while idle. Taxi-Buses relocate from the last performed service
to a departure stop of the next generated route. The Shared Taxi depots and Taxi-Bus departure stops
are set across the city at predefined locations. Positioning of the Taxi-Bus stops is constrained by a
minimum distance between stops (400 m) and the selection of the road node with greater connectivity
in the neighbouring area, in order to ensure flexible routing for the vehicles, e.g. by avoiding streets
Coordinates, departure time
origin
Coordinates, arrival time destination
Shared mode preference
Dispatcher(Assignment)
pick-up user drop-offuser
orUser
travelplan(updates every
15 minutes)
walk to
stop ride Taxi-buswalk fromstop
ride Shared-Taxi
Vehicles

MODELLING FRAMEWORK AND SHARED MODES SPECIFICATION – 13
SHARED MOBILITY SIMULATIONS FOR DUBLIN — © OECD/ITF 2018
with traffic only in one direction or right-turning blocking (since in Ireland driving is on the left-hand
side of the road).
Once the users’ trip is finished, the agent representing the user leaves the simulation system and
indicators are generated in a trip log so that they can be used for ex-post system evaluation. The
model produces detailed information regarding the origins and destinations of each trip, the party on-
board (for members of the same household or people sharing a vehicle), arrival and departure time,
waiting and access time, travel time, transfers, and associated costs. The model assumes an app-based
wire payment method with no cash transactions, to allow easier, safer and faster pick-up and drop-off
of clients.
The simulation allows for the testing of the system operation either with drivers, constrained by
working regulations, or by self-driving vehicles that do not need to relocate to ensure the changes of
drivers’ shifts. The cost estimations are different for these two options.
The simulation model provides detailed outputs from the resulting mobility throughout the day
for each mobility scenario tested. These include passenger-kilometres (pkm), vehicle-kilometres
(vkm) by mode, operational performance (fleet requirement, routes operated, occupation levels by
mode, estimated costs), client satisfaction (travel time, waiting time, detour time, average number of
passengers on-board by time of the day and mode) and environmental performance (CO2 emissions).
Adoption of electric fleets and their charging requirements are also included as a parameter in the
model.
Shared modes specification
Two shared transport services, Shared Taxi and Taxi-Bus, are used to assess the impact of
Shared Mobility services. The new modes can fully or partially replace current motorised modes and
serve as a feeder to the existing rail lines. Shared Taxi is an on-demand door-to-door service with up
to six people sharing the vehicle (see Figure 3). It can be booked in real time and moves along
dynamically optimised trajectories with detours and travel times matching the pre-set constraints.
Taxi-Bus is a street-corner-to-street-corner service in a mini-bus of up to 8 or 16 people (see Figure 4)
with at least 30-minutes advanced reservation time. Taxi-Bus also moves along dynamically
optimised routes between designated stops. Both shared services offer either direct transfer-less trips,
or deliver the user to a rail station if rail connects to the destination without transfers. Table 1 shows
the shared services characteristics, which were designed in order to provide modes more comparable
with private car, including more flexibility, comfort and availability compared to the existing public
bus system, and more affordable than conventional taxi services. Some of the values presented in
Table 1 were used as a starting point for the focus group discussion (presented in the section
“Potential users of Shared Mobility”) and were subject to further adjustments based on the focus
group results.
The feeder service is specified as a pre-booking system with the booking rules and walk access
constraints of Taxi-Bus. The feeder services serve rail trips, for which one station is within walking
distance from either origin or destination. This means that the entire trip would have one transfer and
include two legs: the one by a shared mode serving only one end of the trip and the one by rail. An
origin-destination (OD) pair poorly served at both ends leads to a direct Taxi-Bus or a Shared Taxi
service.

14 – MODELLING FRAMEWORK AND SHARED MODES SPECIFICATION
SHARED MOBILITY SIMULATIONS FOR DUBLIN— © OECD/ITF 2018
Table 1. Specifications for proposed services
Mode Booking Access time
Max. waiting time
(depending on
distance)
Max. total time
loss (depending
on distance)
Vehicle type
Shared
Taxi
Real
time Door-to-door
5 minutes (≤ 3 km),
linear increase from 5
to 10 minutes
(between 3 and 12
km), 10 minutes
(≥ 12 km)
Detour time +
waiting time,
from 7 minutes
(≤3 km), up to
15 minutes
(≥12 km)
Minivan of 8
seats rearranged
for 6 seats, with
easy entry/exit
Taxi-
Bus
30
minutes
in
advance
Boarding and alighting
up to 400 m away
from door, at points
designated in real time
Tolerance of
10 minutes from
preferred boarding
time
Minimum linear
speed from origin
to destination
(15 km/h)
Minibuses with
between 8 and 16
seats.
No standing
places
Source: ITF (2017a).
Figure 3. Example of Shared Taxi vehicle
Source: Saud Al-Olayan (2017).
Figure 4. Example of Taxi-Bus vehicle
Source: TTC 9701 (2015).
Figure 5 presents a qualitative comparison of the transport modes considered in the simulation; it
compares the various performance attributes among the modes, highlighting the differences that will
lead to either market segmentation or change of performance when compared with currently available
transport services. Shared Taxi clearly presents a performance profile similar to private car, while
Taxi-Bus and feeder services try to preserve attractive features of current public transport (e.g. price)
and enhance the ones that often deter users from using conventional buses (e.g. on-board time,
waiting time and transfers).

MODELLING FRAMEWORK AND SHARED MODES SPECIFICATION – 15
SHARED MOBILITY SIMULATIONS FOR DUBLIN — © OECD/ITF 2018
Figure 5. Qualitative comparison of transport modes
Source: ITF (2017a).
The configuration of shared services and their interaction with public transport systems is
completely flexible and reconfigurable. The tested solutions do not intend to be prescriptive of what
can emerge in the market or is organised by public transport authorities, but assess the potential of
such like solutions that have been emerging in the market (Shared Taxi – e.g. UberPOOL and Lyft
Line; Taxi-Bus – e.g., Kutsuplus, in Finland, and BRIDJ in the United States of America).
Service typeService quality
AccessOn-board
timeWaiting Transfers Comfort Price
Private Car
Public transport
Shared Taxi
Taxi-Bus
Feeder service to
rail, ferry or BRT
+
and/
or
Legend: Comparative modes performance rating
Very low performance
Low performance
Average performance
High performance
Very high performance

16 – CHARACTERISATION OF THE STUDY AREA
SHARED MOBILITY SIMULATIONS FOR DUBLIN— © OECD/ITF 2018
Characterisation of the study area
The study area covers the Greater Dublin Area, which comprises the counties of Dublin (Dublin
City, South Dublin, Dún Laoghaire–Rathdown and Fingal), Meath, Kildare and Wicklow. The area is
about 6 988 km2 (Dublin City: 117 km2), of which 1 047 km2 have population and/or employment.
The population of the region was 1.8 million inhabitants in 2011 (Dublin City: 527 000), which
is the census year used for this study. Figure 6 shows the distribution of the population in the region.
The population is dense in Dublin city while in the rest of the GDA there are numerous towns with
relatively small concentrations of residential buildings, which are mostly detached houses.
Figure 6. Population distribution (2011)
Source: Ireland Census 2011, ITF, Map tiles by QGIS.
In order to increase the speed of the Shared Mobility simulation model, the study area was
divided into seven functional sub-areas and 49 unidirectional corridors connecting the sub-areas. In
these corridors the travellers have high probability of being able to share their rides, especially in the
case of Taxi-Bus. The trip assignment optimisation was run in parallel for each of the corridors.
Figure 7 shows the sub-areas and their conventional names.

CHARACTERISATION OF THE STUDY AREA – 17
SHARED MOBILITY SIMULATIONS FOR DUBLIN — © OECD/ITF 2018
Figure 7. Sub-areas of GDA used in the simulation model
Source: ITF, Map tiles by QGIS.
Around 4.6 million trips took place within the GDA on an average work day in 2012. 1.3 million
trips (28% of the whole day) took place during the morning peak period from 6 am to 10 am, and
1 million during the afternoon peak from 3 pm to 6 pm (22% of the whole day). The majority of the
trips are by private car (64%), followed by walking (25%) and public transport (8%), as shown in
Table 2. The mode shares within Dublin City are slightly different with car share less dominant (50%)
and non-motorised modes accounting for approximately 36% of the trips.
Table 2. Mode share distribution in the Greater Dublin Area, 2012 (%)
Walk Bicycle Bus Rail Car + PT Car LRT Taxi
24.6 3.4 5.9 1.0 0.4 63.6 0.6 0.5
Source: Computed by ITF based on the National Household Travel Survey (2012).
Over 200 000 people enter the Dublin City Centre every morning (185 000 in 2011 and 202 000
in 2016) and this number is projected to grow by an extra 40 000 commuters over the next few years.
Almost half of these people enter the city centre by public transport. As a result of the expansion of
the public transport network and introducing car-free zones within the city the public transport mode
share has increased from 46% in 2012 to 49% by end 2016. Car mode share has declined during the
same period from 37% in 2012 to 32% in 2016 (Dublin City Council, 2016).
The road network plays a crucial role in the GDA passenger transportation, in particular for the
area outside of the Metropolitan Area which has much less public transport coverage. Since the
mid-90s transport planning authorities have made efforts to encourage a shift from private cars to

18 – CHARACTERISATION OF THE STUDY AREA
SHARED MOBILITY SIMULATIONS FOR DUBLIN— © OECD/ITF 2018
public transport and active modes (walking and cycling) in the GDA. However, in some locations the
population density is not enough to provide good coverage of public transport with high frequency
and capacity, and active modes are not an option due to longer distance trips. Therefore, in these
locations, the car remains the main mode of transport and its use will continue to grow unless action is
taken.
Public transport modes in the GDA include bus (urban and regional), heavy and light rail. The
public transport network, as well as the road one, is supported by user information services, which are
integrated under the Transport for Ireland brand and include websites, mobile applications, social
media portals (National Transport Authority, 2016).
Bus services in the study area are either publicly subsidised or provided by commercial
operators. The public transport bus infrastructure that supports these bus routes is quite varied with
discontinuous bus priority on certain sections of transport corridors in the GDA. Changes to the core
bus network in recent years have improved frequency and reliability of the services, and, therefore,
encouraged the residents to use the bus more often. However, the remaining issues related to
frequency and reliability together with complex fare structure and need for transfers keep the
attractiveness of the bus services below the level required to drive a significant shift to the bus from
the car.
The rail network comprises heavy and light rail. The heavy rail, in turn, consists of DART,
Commuter (regional) and Inter City Rail. The DART (Dublin Area Rapid Transit) is an electric rail
system that runs along the coast of the Irish Sea. The Commuter Rail serves the rest of the area
providing transport connections between the main cities and towns in the GDA and Dublin along
several main lines using diesel trains. The Inter City network serves the rest of the country. The rail
network continues to be developed and upgraded with plans of further expansion to increase
connectivity. The light rail service (LUAS) has operated in the Dublin area since 2004 and consists of
two lines (Red and Green) and a newly finished Cross City line connecting the two. The system is
characterised by high frequency (up to every three minutes at peak hours), high capacity and
reliability.
The cycle network and footpaths for pedestrians are regularly expanded and improved in the
GDA, and the corresponding mode shares are increasing. Some issues still remain, especially outside
of Dublin City. They include absence of continuous cycle network, lack of pedestrian crossings, and
relatively poor quality of footpaths in some parts of the area (National Transport Authority, 2016).
The GDA also has carpooling, car-sharing/car-club and bike sharing services. At the moment
there are two car-sharing providers: “GoCar” and Toyota’s “Yuko” car club. The fleet of Yuko are all
plug-in hybrids. The carpool networking website (www.carsharing.ie), which connects travellers with
matching travel destinations, is supported by the National Transport Authority. At the moment a
number of app based on-demand ride-hailing providers operate within the statutory licensing
framework in Ireland. Commercial unlicensed ridesharing is prohibited. The GDA bike sharing
scheme has in more than 67 thousand subscribers and over 1 500 bicycles. Almost made 22 million
rides have been undertaken since the bike sharing system was launched in 2009 (Dublin Bikes, 2017).
The National Transport Authority (2016) forecasts that over the next 20 years suburbanisation
will grow, which, in turn, will lead to increase of car use and car ownership unless action is
undertaken. “Transport Strategy for the Greater Dublin Area 2016 – 2035” (National Transport
Authority, 2016) outlines plans for the enhancement and further integration of the transport network.
In addition to maintaining and improving the existing public transport network the plans include
constructing new light- and heavy-rail lines, metro lines, the development of the Core Bus Network,
enhanced with Bus Rapid Transit routes, and the expansion of infrastructure for cycling and walking.

CHARACTERISATION OF THE STUDY AREA – 19
SHARED MOBILITY SIMULATIONS FOR DUBLIN — © OECD/ITF 2018
The road network will be maintained, renewed and a limited number of new small projects will be
implemented, reflecting the national transport policy intentions to reduce the growth in car travel.
Demand management measures are also a part of the strategy and include land-use and park and ride
related policies, travel plans for large employers and educational campuses, promotion of use of
shared vehicle.

20 – MODELLING CURRENT TRAVEL DEMAND
SHARED MOBILITY SIMULATIONS FOR DUBLIN— © OECD/ITF 2018
Modelling current travel demand
In order to accurately assess the impacts of the new shared modes, it is first necessary to model,
in the most detailed manner possible, the current mobility in the area. To do this, “synthetic mobility
sets” are generated (also designated as “synthetic population”). These sets reproduce the entire
personal mobility for an average work day in the region. The synthetic population is represented by
the socio-demographic characteristics of each individual, their household composition and by their
travel patterns based on the travel survey containing revealed preference data that has been expanded
to the total population. The modes used for the trips are defined based on the probabilities derived
from an estimated mode choice model.
This section presents the major steps in the modelling of the current travel demand, which
include preparation of the inputs, the mode choice model assumptions and the results estimated from
the revealed preferences data of the Household Travel Survey and their application to the generation
of the synthetic population. The section also compares the results with the travel survey data. Figure 8
presents the connection between the different data sources and the final travel demand.
Figure 8. Procedures to model travel demand (current and future)
Notes: PT- Public Transport; OD – Origin-Destination; SM – Shared Mobility. Source: ITF (2017a).
Model inputs
The preparation of the inputs for the mode choice model and for the generation of the synthetic
population included the following steps:
Characterisation of the study area
Transport infrastructure and
services
Road network
PT GTFS model
Synthetic mobility dataset
Household characterisation (Residential location, family profile)
Individual data
(age, education level)
Mobility data(trip sequence, each trip (origin,
destination, schedule, purpose,
transport mode))
Transport performance by OD
pair and mode
Travel times by mode
Probability of trip
production / attraction
Land use data (Grid)Population
Employment
Ameneties (POIs)
Building footprint
Mobility seed and transport
mode preferences
Travel survey
Mode choice model
LegendInputs
Spatial definition and
resolution
Study area boundaries
Grid system definition

MODELLING CURRENT TRAVEL DEMAND – 21
SHARED MOBILITY SIMULATIONS FOR DUBLIN — © OECD/ITF 2018
- spatial division of the area and the assignment of the travel survey, census and land-use data
to the spatial units
- defining the travel survey respondents to represent the population and the travel modes to be
included in the model
- defining available travel modes for each respondent; calculation of the attributes of each
available mode (travel time, travel cost, etc.), and computation of the shortest path for each
mode based on the total travel time.
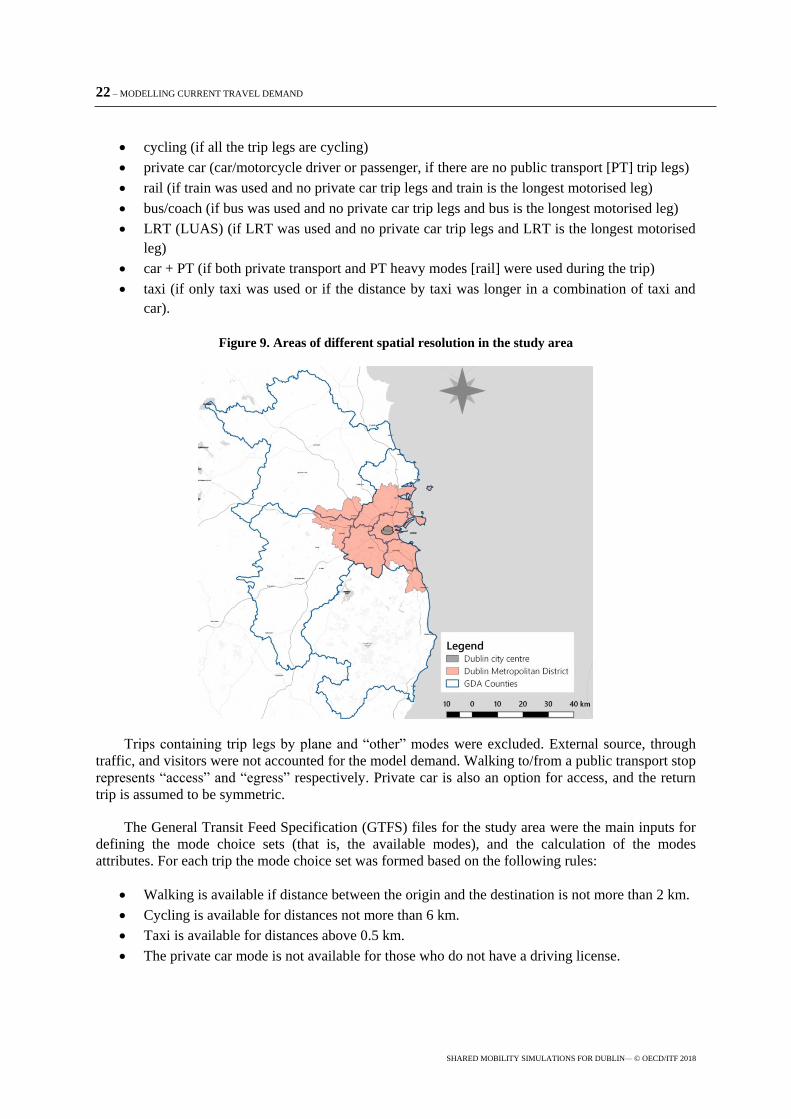
To accommodate the spatial distribution of the trips in the model, the study area was divided
using a variable grid size specification. The region spatial resolution was calculated at three levels as
identified in Figure 9: the Dublin city centre (DCC), the Dublin Metropolitan District (DMD) and the
whole GDA. The lowest resolution with grid cells of 1 000 m × 1 000 m is used in the more dispersed
areas with less interaction with the DCC, mainly in the counties of Meath, Kildare and Wicklow.
Within the DMD the resolution level is increased to 500 m × 500 m cells. The highest resolution with
grid cells of 200 m × 200 m is applied to DCC. As a result, the study area is covered with 2 058 cells
of 1 000 m × 1 000 m outside the DMD, 3 641 cells of 500 m × 500 m within the DMD, while the
DCC is covered with 1 872 cells of 200 m × 200 m. The grids are built for a variety of modelling
purposes. The simulation model relies on a grid consisting of a combination of 1 000 m and 500 m
cells with the 500 m × 500 m resolution level for the DMD and 1 000 m × 1 000 m for the outside of
it, resulting in a total of 5 699 modelling spatial units. This grid system was used to link the residential
data, and the origins and destinations of the trips of the synthetic population.
To model the current mobility situation in the GDA the 2012 data for the GDA region from the
National Household Travel Survey was used. Some responses were excluded from the data for the
mode choice model calibration in order not to bias the model results. After the exclusion,
9 578 responses (out of the initial 56 983 trip responses for whole Ireland and 19 903 for the whole
GDA) were kept and used in the mode choice model calibration. Answers from the following
respondents were excluded:
Respondents younger than 18 and older than 65, who are assumed not to be decision makers
for the mode choice. These respondents are included in the synthetic population but not in the
choice model calibration since their travel patterns and mode choices depend on other
members of the same household.
Car passengers were excluded from the mode choice model as they are not faced with the
same cost trade-offs. These respondents are preserved in the synthetic population trips. People
who did not chose driving car for the trips reported in the survey and/or had missing
information about their driving license were also excluded.
Respondents residing outside of the study area were excluded from both the synthetic
population and the choice model input data.
Trips which started and/or ended outside of the study area have been excluded from both the
synthetic population and the choice model input data.
Trips where the reported mode choice violated the choice availability constraints presented
below.
The list of the modes considered for the representation of the current mobility includes the active
modes (walking and cycling), private car, taxi and the public transport modes (bus, rail and LRT
[LUAS]). Multimodal trips are aggregated into a single trip using a rule-based definition of main
mode depending on the constituting trip legs in the following way:
walking (if all the trip legs are walking)
22 – MODELLING CURRENT TRAVEL DEMAND
SHARED MOBILITY SIMULATIONS FOR DUBLIN— © OECD/ITF 2018
cycling (if all the trip legs are cycling)
private car (car/motorcycle driver or passenger, if there are no public transport [PT] trip legs)
rail (if train was used and no private car trip legs and train is the longest motorised leg)
bus/coach (if bus was used and no private car trip legs and bus is the longest motorised leg)
LRT (LUAS) (if LRT was used and no private car trip legs and LRT is the longest motorised
leg)
car + PT (if both private transport and PT heavy modes [rail] were used during the trip)
taxi (if only taxi was used or if the distance by taxi was longer in a combination of taxi and
car).
Figure 9. Areas of different spatial resolution in the study area
Trips containing trip legs by plane and “other” modes were excluded. External source, through
traffic, and visitors were not accounted for the model demand. Walking to/from a public transport stop
represents “access” and “egress” respectively. Private car is also an option for access, and the return
trip is assumed to be symmetric.
The General Transit Feed Specification (GTFS) files for the study area were the main inputs for
defining the mode choice sets (that is, the available modes), and the calculation of the modes
attributes. For each trip the mode choice set was formed based on the following rules:
Walking is available if distance between the origin and the destination is not more than 2 km.
Cycling is available for distances not more than 6 km.
Taxi is available for distances above 0.5 km.
The private car mode is not available for those who do not have a driving license.

MODELLING CURRENT TRAVEL DEMAND – 23
SHARED MOBILITY SIMULATIONS FOR DUBLIN — © OECD/ITF 2018
The PT modes are available if a route was found such that the person does not have to walk
more than 1 000 metres to the first PT stop, more than 1 000 m from the last PT stop and
more than 250 m between the transfer stops.
Car+PT is only available if the person has a driving license and for the trips which meet the
following criteria: the PT mode is rail; the PT distance is not shorter than 1.5 km; the PT part
of the trip is without transfers; the walking distance from the PT stop to the destination is less
than 1 km.
The shares of respondents for which certain modes are available are presented in Table 3.
Table 3. Availability of modes (% of respondents)
Walk Bicycle Bus Rail Car + PT Car LRT Taxi
72.6 92.2 45.0 2.1 24.2 83.5 2.8 100.0
Based on the GTFS data, the origin and destination of the trip of each respondent and the
availability of the mode the shortest path (in terms of total travel time) has been calculated for each
mode. This allowed calculation of the mode attributes for each trip. It is important to note that the
available GTFS files for Dublin have spatial resolution of 1 km for the location of public transport
stops and stations. This fact allowed the calculation of indicators but limited the resolution of the
assessment of impacts at a detailed street level.
For trips using a PT mode, aggregated (across the trip legs) characteristics such as total travel
time, in-vehicle travel time, total access and egress time, total travel cost (prices in 2013) and number
of transfers were calculated. The walking and waiting time were penalised based on data from
Balcombe (2004). Each transfer was heavily penalised.
For car travel, the shortest paths measured in travel time are calculated between all of the cells in
the grid. The network speeds used for this calculation resulted from an average congestion level of the
network of 50% (resulting from volume divided by hourly capacity for each link). The road network
contains information on each link and is the basis for these calculations. The road network has been
validated ensuring that all the nodes are connected.
Results of the mode choice model based on the revealed preference data
A multinomial logit discrete mode choice model was calibrated based on the data described
above. The model allows the identification of the drivers of the mode choice, including trip attributes
and socio-demographic characteristics of individuals that condition their decisions. The calibrated
utility functions produce the probability of choosing each mode for each individual. Table 4 presents
the model specification and the calibration results. The variables include a common model coefficient
for in-vehicle travel time and different coefficients for the same variable in other modes. The model
fit is high (rho-squared of 0.58) resulting from the significantly skewed mode selection towards car
and walking, which provides a relevant role to the alternative specific constant (ASC).
The model calibration results give a value of time for public transport around EUR 10.23 and
EUR 11.22 for private car. These values are aligned with recent studies performed for Ireland
(Wardman et al., 2012). Public transport transfers incur a connection penalty equivalent to 10 minutes
on-board time. Public transport users value the access/egress time 1.1 times greater than on-vehicle
travel time.
24 – MODELLING CURRENT TRAVEL DEMAND
SHARED MOBILITY SIMULATIONS FOR DUBLIN— © OECD/ITF 2018
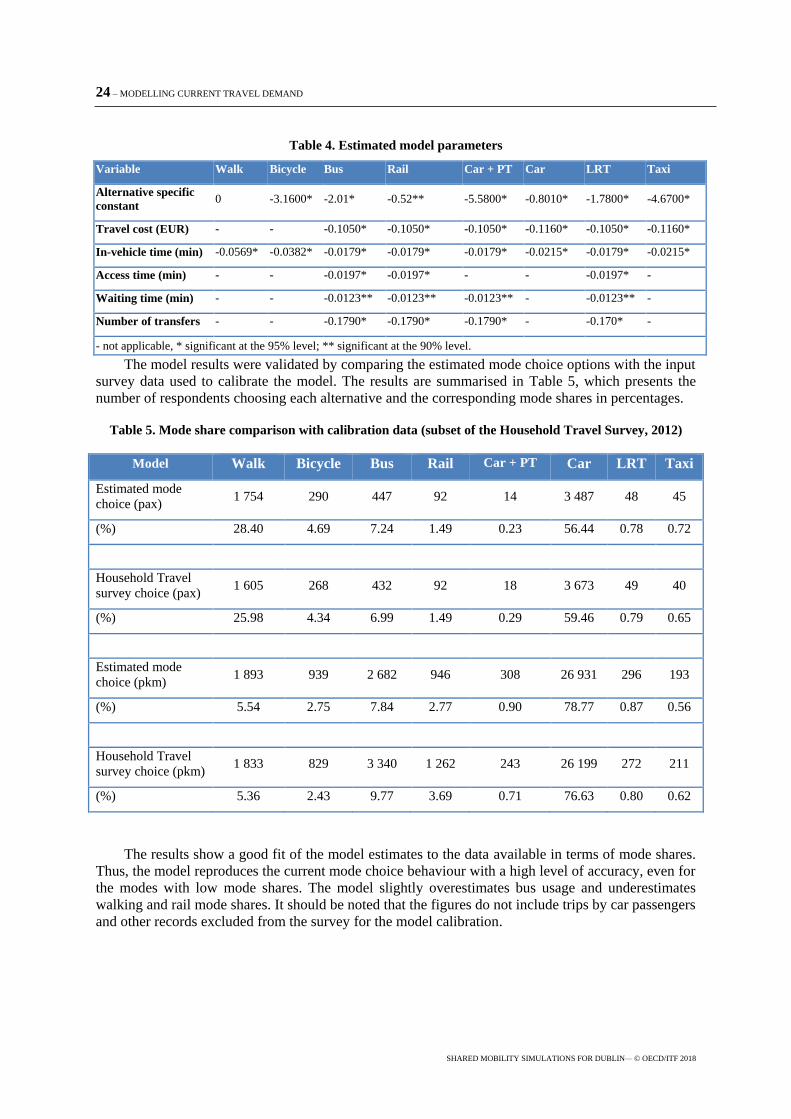
Table 4. Estimated model parameters
Variable Walk Bicycle Bus Rail Car + PT Car LRT Taxi
Alternative specific
constant 0 -3.1600* -2.01* -0.52** -5.5800* -0.8010* -1.7800* -4.6700*
Travel cost (EUR) - - -0.1050* -0.1050* -0.1050* -0.1160* -0.1050* -0.1160*
In-vehicle time (min) -0.0569* -0.0382* -0.0179* -0.0179* -0.0179* -0.0215* -0.0179* -0.0215*
Access time (min) - - -0.0197* -0.0197* - - -0.0197* -
Waiting time (min) - - -0.0123** -0.0123** -0.0123** - -0.0123** -
Number of transfers - - -0.1790* -0.1790* -0.1790* - -0.170* -
- not applicable, * significant at the 95% level; ** significant at the 90% level.
The model results were validated by comparing the estimated mode choice options with the input
survey data used to calibrate the model. The results are summarised in Table 5, which presents the
number of respondents choosing each alternative and the corresponding mode shares in percentages.
Table 5. Mode share comparison with calibration data (subset of the Household Travel Survey, 2012)
Model Walk Bicycle Bus Rail Car + PT Car LRT Taxi
Estimated mode
choice (pax) 1 754 290 447 92 14 3 487 48 45
(%) 28.40 4.69 7.24 1.49 0.23 56.44 0.78 0.72
Household Travel
survey choice (pax) 1 605 268 432 92 18 3 673 49 40
(%) 25.98 4.34 6.99 1.49 0.29 59.46 0.79 0.65
Estimated mode
choice (pkm) 1 893 939 2 682 946 308 26 931 296 193
(%) 5.54 2.75 7.84 2.77 0.90 78.77 0.87 0.56
Household Travel
survey choice (pkm) 1 833 829 3 340 1 262 243 26 199 272 211
(%) 5.36 2.43 9.77 3.69 0.71 76.63 0.80 0.62
The results show a good fit of the model estimates to the data available in terms of mode shares.
Thus, the model reproduces the current mode choice behaviour with a high level of accuracy, even for
the modes with low mode shares. The model slightly overestimates bus usage and underestimates
walking and rail mode shares. It should be noted that the figures do not include trips by car passengers
and other records excluded from the survey for the model calibration.

MODELLING CURRENT TRAVEL DEMAND – 25
SHARED MOBILITY SIMULATIONS FOR DUBLIN — © OECD/ITF 2018
Synthetic population generation
The synthetic population model generates information on the household composition, the activity
of each individual member and his or her daily mobility pattern taking into account the connections
within the household and private vehicle ownership. The model relies on:
Census data (spatially distributed population). The census data were available for census
tracts (small areas). A small area is both the smallest geographic unit and a classification
used by Ireland Central Statistics Office. The area of the small areas varies in size from part
of a city block to large areas of rural land. The small areas data were intersected with the grid,
meaning that the corresponding values of population were computed for each grid cell based
on proportions of its area belonging to small areas.
Travel survey with mobility patterns depending on the socio-demographic characteristics and
the mode choice model calibrated based on these data. The mobility patterns include the trip
purpose, starting and arrival time, and if the trip is home-based or not. The mode choice
model contains the coefficients of the utility functions of each mode, which are used to
compute the probability of choosing each mode.
Land-use data, based on the location of amenities (grouped in nine types) in each grid cell of
the study area for different types of activities (grouped in 19 categories based on the activities
reported in the travel survey). The groups of amenities include: offices, restaurants and bars,
commerce and stores, hotels, shopping centres, hospitals, education centres, dwellings,
recreational. The activities are: returning home, trips from work to main job, from work to
other job, from work to employers, business, education, shopping, social welfare, personal
business/services, medical/dental, social visits/entertainment, recreational, accompany
someone else, overnight lodgings, other. The activities were aggregated into nine groups to be
linked with the amenities.
Each of the individuals from the travel survey is replicated in accordance to the expansion
coefficient. As no expansion coefficient was computed in the Household Travel Survey, a random
sample procedure was assumed and a uniform distribution of the respondents to match to the region
population was considered. The constant factor was estimated as 479 equivalent respondents. For each
individual the agent-based model generates the structural activity representing habitual trips (work,
school, etc.), and discretionary trips (shopping, recreational trips, social visits, etc.) with the time of
the day attributed to each kind of activity. The activity pattern of each individual from the synthetic
population is kept the same as the “seed” individual from the survey. The trips’ attributes, including
origin/destination, start time, duration and mode, are based on the original seed but have a
probabilistic component that incorporates stochasticity.
The synthetic population model generates 1 320 724 mobile persons (1 801 040 inhabitants) that
reside inside the modelled area with 4 587 088 trips for an average week day in 2012. This leads to a
trip production rate of 2.55 trips per inhabitant. This value is an average and comparable with cities
medium- to high-income levels like Vienna (2.66), Turin (2.44), Singapore (2.45) or Vancouver
(2.52) in 2012 (UITP, 2015). The synthetic population does not include non-residents or visitors to the
study area. This component, while small (for example, for Greater London it is 4% of visitors and 8%
of non-resident commuters [Transport for London, 2014], means that for a smaller city like Dublin it
should be even less), can lead to underestimation of congestion in the simulation. This bias does not
affect the comparison since the baseline model and the Shared Mobility scenarios exclude this
component.
The simulated population matches the mobility survey responses well. Table 6 displays how the
probabilistic trip mode of a synthetic person matches the corresponding trip mode of the seed person
(a person from the survey based on which a synthetic person was generated using the expansion
26 – MODELLING CURRENT TRAVEL DEMAND
SHARED MOBILITY SIMULATIONS FOR DUBLIN— © OECD/ITF 2018
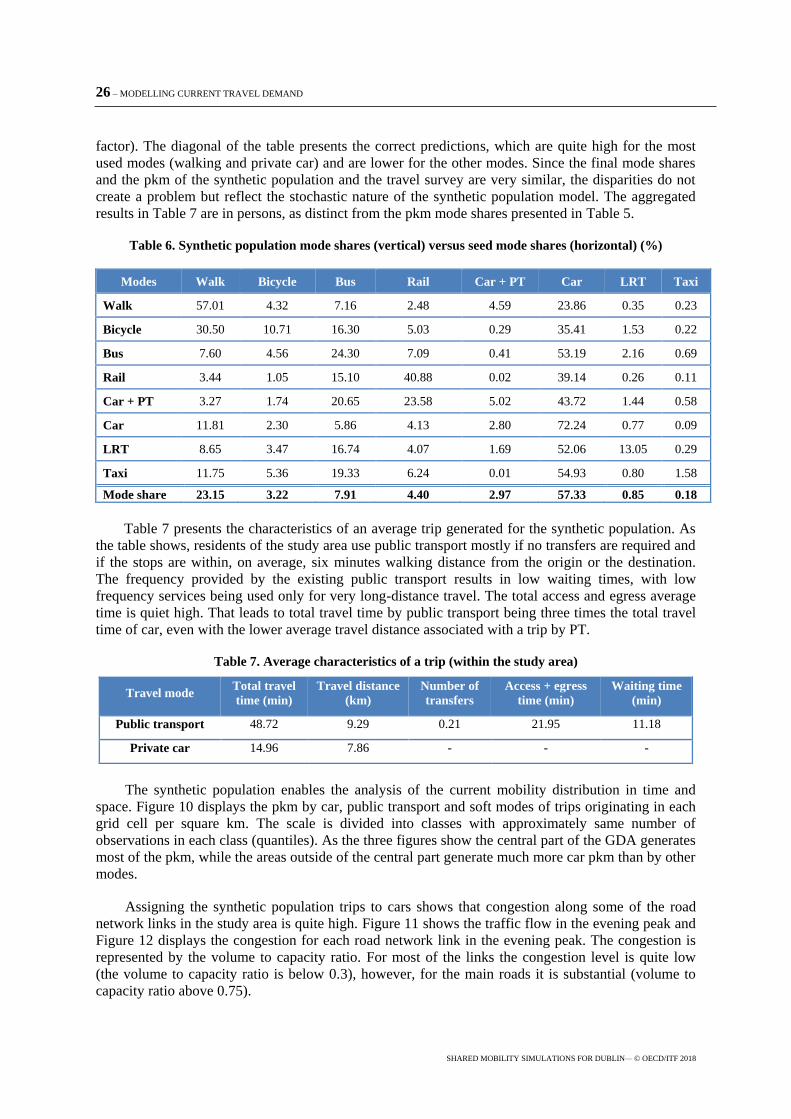
factor). The diagonal of the table presents the correct predictions, which are quite high for the most
used modes (walking and private car) and are lower for the other modes. Since the final mode shares
and the pkm of the synthetic population and the travel survey are very similar, the disparities do not
create a problem but reflect the stochastic nature of the synthetic population model. The aggregated
results in Table 7 are in persons, as distinct from the pkm mode shares presented in Table 5.
Table 6. Synthetic population mode shares (vertical) versus seed mode shares (horizontal) (%)
Modes Walk Bicycle Bus Rail Car + PT Car LRT Taxi
Walk 57.01 4.32 7.16 2.48 4.59 23.86 0.35 0.23
Bicycle 30.50 10.71 16.30 5.03 0.29 35.41 1.53 0.22
Bus 7.60 4.56 24.30 7.09 0.41 53.19 2.16 0.69
Rail 3.44 1.05 15.10 40.88 0.02 39.14 0.26 0.11
Car + PT 3.27 1.74 20.65 23.58 5.02 43.72 1.44 0.58
Car 11.81 2.30 5.86 4.13 2.80 72.24 0.77 0.09
LRT 8.65 3.47 16.74 4.07 1.69 52.06 13.05 0.29
Taxi 11.75 5.36 19.33 6.24 0.01 54.93 0.80 1.58
Mode share 23.15 3.22 7.91 4.40 2.97 57.33 0.85 0.18
Table 7 presents the characteristics of an average trip generated for the synthetic population. As
the table shows, residents of the study area use public transport mostly if no transfers are required and
if the stops are within, on average, six minutes walking distance from the origin or the destination.
The frequency provided by the existing public transport results in low waiting times, with low
frequency services being used only for very long-distance travel. The total access and egress average
time is quiet high. That leads to total travel time by public transport being three times the total travel
time of car, even with the lower average travel distance associated with a trip by PT.
Table 7. Average characteristics of a trip (within the study area)
Travel mode Total travel
time (min)
Travel distance
(km)
Number of
transfers
Access + egress
time (min)
Waiting time
(min)
Public transport 48.72 9.29 0.21 21.95 11.18
Private car 14.96 7.86 - - -
The synthetic population enables the analysis of the current mobility distribution in time and
space. Figure 10 displays the pkm by car, public transport and soft modes of trips originating in each
grid cell per square km. The scale is divided into classes with approximately same number of
observations in each class (quantiles). As the three figures show the central part of the GDA generates
most of the pkm, while the areas outside of the central part generate much more car pkm than by other
modes.
Assigning the synthetic population trips to cars shows that congestion along some of the road
network links in the study area is quite high. Figure 11 shows the traffic flow in the evening peak and
Figure 12 displays the congestion for each road network link in the evening peak. The congestion is
represented by the volume to capacity ratio. For most of the links the congestion level is quite low
(the volume to capacity ratio is below 0.3), however, for the main roads it is substantial (volume to
capacity ratio above 0.75).

MODELLING CURRENT TRAVEL DEMAND – 27
SHARED MOBILITY SIMULATIONS FOR DUBLIN — © OECD/ITF 2018
Figure 10. Daily passenger-kilometres by car (a), public transport (b), walking and cycling (b) by grid of
origin – current mobility
a)
b)

28 – MODELLING CURRENT TRAVEL DEMAND
SHARED MOBILITY SIMULATIONS FOR DUBLIN— © OECD/ITF 2018
Figure 10. Daily passenger-kilometres by car (a), public transport (b), walking and cycling (b) by grid of
origin – current mobility (continued)
c)
Source: ITF, Map tiles by QGIS.
Figure 11. Traffic flow in the road network (evening peak), current mobility
Source: ITF, Map tiles by QGIS.

MODELLING CURRENT TRAVEL DEMAND – 29
SHARED MOBILITY SIMULATIONS FOR DUBLIN — © OECD/ITF 2018
Figure 12. Congestion for each road network link (evening peak)
Source: ITF, Map tiles by QGIS.
The observations based on the synthetic population show that the public transport currently
available results in quite a high total travel time (mostly due to large access and egress time) and a
large share of the population tend to use private car, especially travellers living outside of the DMD.
At the same time, the capacity of many main roads is not sufficient to provide congestion-free
movement for motorised vehicles. Therefore, the possibility to divert users from car to more
sustainable modes with higher occupancy rates is of special concern in the study area.

30 – POTENTIAL USERS OF SHARED MOBILITY
SHARED MOBILITY SIMULATIONS FOR DUBLIN— © OECD/ITF 2018
Potential users of Shared Mobility
The successful introduction of Shared Mobility requires an understanding of the potential users’
preferences. To investigate these preferences a focus group was organised with participation from
respondents within the GDA from various socio-demographic, mobility and geographic backgrounds.
The analysis uses a combination of qualitative and quantitative methods as the focus group included a
discussion part and a stated preference (SP) survey. The former was a group discussion with mostly
open ended questions aimed at collecting qualitative data regarding the perception of the proposed
shared modes, preferences and concerns. The SP survey is a web-based questionnaire that allows the
identification and quantification of the most important attributes of the new modes and
social-demographic characteristics of the users influencing mode choice. This, in turn, allows these
preferences to be taken into account, by means of the utility functions, in mode choice in the
simulation model.
An additional sample of the GDA residents participated in the SP survey, which increased the
sample size and enabled the surveyor to determine if the participation in the focus group discussion
had influenced the users’ perception of the proposed shared modes. The findings of the focus group
also help to identify potential early adopters of Shared Mobility and provide insights for a design of
the new shared modes more tailored to the potential users’ needs.
Design of the focus group meeting
Focus groups are a common method of qualitative research involving a discussion of a topic
among several participants. It is a method that fits well with the purpose of the study as it provides the
opportunity to provoke discussion, in which participants can bring up different aspects and express
their attitudes towards the new shared modes specifically and in relation to the existing modes. The
method imitates real decision-making environments where people make decisions exposed to peer
opinions (Guest et al., 2017).
For the focus group discussion a single meeting of 15 participants was organised in Dublin. The
local partners recruited participants with diverse socio-demographic characteristics to obtain a
representative sample. Two facilitators from the ITF presented the Shared Mobility concept and the
new modes and ran the discussion for approximately 90 minutes. After that a link to the SP survey
was provided to the participants. The survey was completed on-site using laptops provided by the
local partners and on participants’ smartphones. The Irish partners rewarded the focus group
participation.
The focus group meeting consisted of three main components:
Introduction: presentation to the participants on the current challenges related to the local
mobility and the Shared Mobility concept. The latter includes the description of the proposed
shared modes and their potential integration into the local transport system.
Discussion: a structured conversation following a script aimed at identifying the
socio-demographic characteristics of each respondent, travel patterns and the main reasons for
current mode choice, and attitudes to the proposed shared modes. The first part of the
discussion focused on the socio-demographic characteristics of participant and consisted of
questions about the residential location within the GDA, age, gender and occupation. The
second part of the discussion included questions about their daily activities and the

POTENTIAL USERS OF SHARED MOBILITY – 31
SHARED MOBILITY SIMULATIONS FOR DUBLIN — © OECD/ITF 2018
corresponding number of daily trips, the main travel modes and the main reasons for choosing
certain modes and avoiding others. The last part of the discussion included questions
regarding the respondents’ perception of the proposed shared modes, the modes’
characteristics and conditions, which might attract or deter them from using the proposed
modes. Most of the questions targeted all the respondents while some were directed only to
certain transport mode users (private car, bus and rail). The latter included questions on
trade-offs between the shared modes and the currently preferred mode. All the participants
shared their opinions regarding the proposed shared modes, including which of the two was
the preferred mode, the reasons for that preference and the important characteristics of the
new modes. The relevant characteristics to be considered included ticket price, travel time,
waiting time, access time, detour time, and number of passengers to share the vehicle with.
Stated preference survey: participation in a survey (taking 10-15 minutes) to capture the
respondents’ final preferences and attitudes towards the shared modes and the potential
impact of the shared modes on the car use and ownership. The survey responses were used as
input data into the quantitative analysis.
Results of the discussion
Table 8 presents the respondents’ profiles and responses, aggregated around the main discussion
questions. The sample is representative in terms of socio-demographic characteristics and includes
respondents using different transport modes.
The focus group participants make on average 14.5 trips a week (on weekdays) and 2.89 trips a
day, with commuting as the main trip purpose (47%). Commuting times are large, while other types of
activities are mostly local and, therefore, shorter. The factors driving mode choice are flexibility,
convenience, cost, reliability and environmental performance.
Car users are sceptical regarding the possibility of the conventional PT modes becoming
attractive enough. Possible drivers for mode shift to the PT modes are ticket price reduction and a
substantial decrease in the travel time.
Car users perceive the shared modes as potentially quite convenient but believe that introduction
of the shared services will not lead to significant modal changes if conditions for access to the city
centre remain similar. Possible drivers that might force the car users to switch to the shared modes,
similarly to PT, are mainly based on the travel cost and travel time. Reliability is another important
factor. Designated lanes and parking costs could also be relevant drivers of the mode choice. Some of
the respondents stated that they would not object some car restriction measures if they are applied to
everyone.
All PT users showed a high willingness to migrate to Shared Mobility solutions. Most of the PT
respondents would accept a slight fare increase compared with the current PT costs.
The existence of feeder services is valued mainly for residents in suburban areas located just
outside the walk catchments of rail stations. However, since the rail network is not very dense, the
respondents do not perceive feeder service as an important feature of the system.
Higher number of passengers on board of the same vehicle is perceived positively. The
respondents stated that sharing a vehicle with a small party is less preferable since it might require
greater social interaction with other riders than would be the case when sharing with larger groups.
The favourite Shared Mobility option is Taxi-Bus, except during night or early morning.

32 – POTENTIAL USERS OF SHARED MOBILITY
SHARED MOBILITY SIMULATIONS FOR DUBLIN— © OECD/ITF 2018
Table 8. Summary of the focus groups answers
Question Summary of the responses
Res
po
nd
ents
ba
ckg
rou
nd
Respondent’s profile (residential
location within metropolitan area,
age, gender, occupation, car
ownership and PT usage).
15 people total, 6 female, 9 male.
Majority are working full time: students (3) and retired (2).
5 live in the city centre, everyone else within the GDA.
9 are PT users, at least occasionally; 3 do not have a car.
Mobility background. Half of the group are car owners and active users preferring this travel mode
for freedom and convenience, especially in non-work related activities.
Daily travel pattern, including the
main mode used.
Main trip purpose for most is work/study related. Most people do at least
2 trips per day. Car is the main option followed by LUAS (LRT) and the
Dublin bike sharing system.
Main drivers for the mode choice. Convenience and cost are the main reasons for mode selection followed by
flexibility and travel time.
What would make the respondent to
change from car to PT.
Most of the respondents stated that nothing would make them shift to PT
unless PT becomes cheaper and the travel time reduces substantially.
If the respondent would be willing
to move from non-PT (car/taxi)
options to the shared services (car
users).
Most respondents would use the proposed modes, depending on their costs
and travel time. Designated lanes and parking costs could be a relevant driver
to change mode selection.
Mo
da
l p
refe
ren
ces
an
d t
rigg
ers
to m
od
al
cho
ice
If the respondent would prefer to
use the flexible services. Increase in
price which the respondent would
accept (bus users).
The respondents would be willing to use the new modes. They would accept
same cost or a slight increase compared with the current cost of using a bus.
If the respondent would use a
feeder service to arrive to the PT
stop (rail/ferry users).
Very few value the feeder services as the rail network is not relevant for
everyone’s daily commuting patterns.
If the proposed shared services
would be suitable for trips the
respondent currently does with a
car. If the respondent would think
of selling the car/cars if these
services were available.
Even if the shared services are convenient for car users, almost everyone
would prefer to keep their car, for some specific trips or travelling.
The most important characteristics
of the shared modes that would
make the respondent shift from
private modes (car or taxi).
Cost is the most important factor, about 80% mentioned it, followed by
detour time and reliability.
Sh
are
d m
ob
ilit
y
Ma
rket
Seg
men
tati
on
Acceptable number of passengers
when sharing a Shared Taxi.
Almost none would object sharing with the maximum number of passengers
(to avoid need for conversation). The optimal number of passengers should
be just enough to be cheaper but not to detour too much.
Acceptable number of passengers
to share with in a Taxi-Bus. Does not matter.
Which of the two shared services
the respondent would prefer and
why.
Most prefer Shared Taxi or Taxi-Bus during the day and Shared Taxi during
lower demand periods (e.g. night services).
Stated preference survey
Survey structure and deployment
An online survey aimed at collecting data for quantitative (by means of discrete mode choice
model) and qualitative analysis was developed and presented to the focus group participants to
respond to following the discussion. The survey was adapted to the local terminology and context of

POTENTIAL USERS OF SHARED MOBILITY – 33
SHARED MOBILITY SIMULATIONS FOR DUBLIN — © OECD/ITF 2018
the GDA, including available PT modes, costs of the alternatives, etc. The survey contained four
sections:
Respondents’ profile containing questions about socio-demographic characteristics of the
respondents, their residential location (the DCC, the area outside of the DCC within
10 kilometres from its borders, and the rest of the GDA). These questions enabled the
assessment of the representativeness of the sample and the inclusion of the corresponding
variable in the utility functions of the choice model estimated from the survey. This section
also contains questions regarding the level of familiarity with relevant technologies. These
questions provide hints on how ready the respondents are to use the proposed services if it
requires use of smartphones and applications.
Stated preference scenarios (choice games) in which a respondent chooses from one of the
four available modes to make the same trip. This provides the main input for the discrete
mode choice model. The modes are combined into four groups: private car, PT (bus, rail or
LRT), non-motorised alternatives (walking or cycling) and shared modes. In the first four
choice games, the respondents have to choose one from four options, one from each mode
group. The shared mode in the first group of the choice games is unspecified, i.e., not
distinguished between Shared Taxi and Taxi-Bus. In the other four choice games, the
respondents have to choose between Shared Taxi and Taxi-Bus given the attributes for the
same trip. Each choice game presented relevant modes’ attributes including access time
(shared modes, PT), on-board time (all motorised modes), cost (all motorised modes), detour
time (shared modes), the number of passengers sharing the vehicle (shared modes),
walking/cycling time for non-motorised modes, the number of transfers and waiting time for
PT. The combinations of the modes’ attributes were generated using orthogonal design. For
that, 64 scenarios were split into eight blocks, so that each respondent would face one block.
Annex 1 presents an example a survey question, as the respondents would see it on the screen.
Mobility background revealing the respondents’ daily trip patterns, including the main
activities, frequencies, distance and a typical mode used for each trip purpose. The
respondents also had to choose a group to which they mostly belong among regular car users,
regular bus users, regular rail users or regular non-motorised travellers. This enabled the
following survey section to focus questions to respondent based on their main modes.
Attitudes towards Shared Mobility attributes including main features of the proposed
Shared Mobility services compared with their current most often used mode and acceptable
values of the shared modes’ attributes. For most of the attributes the total acceptable value in
a suggested range is asked (i.e. cost, waiting time and number of passengers on board), and
for other attributes a degree of their importance (i.e. ability to use the shared modes as feeder
services to rail), from “not relevant” to “highly important”. Additionally, this section contains
questions regarding the household’s car ownership, parking preferences and willingness to
sell some of these vehicles in the presence of shared modes on a large scale. This section
provides data for the design of the shared modes to ensure the level of service accepted by
majority of the potential users.
Together with the Irish partners, who found additional respondents for the survey and ensured
representativeness of the sample, we obtained 100 more respondents (herein after this group of the
respondents is called the “panel”). Their answers increased the sample size for the sated preference
choice experiment. Having two samples (the focus group and the panel group) enabled us to test if
participation in the focus group had affected the perception of the shared modes since such difference,
if exists, is important for information campaigns when the new services are introduced. The
sub-chapters below present the main findings obtained based on the responses to each survey section.
These include descriptive statistics and the results of the estimated mode choice model.

34 – POTENTIAL USERS OF SHARED MOBILITY
SHARED MOBILITY SIMULATIONS FOR DUBLIN— © OECD/ITF 2018
Respondent’s profiles and mobility background
The survey contains sections with questions on socio-demographic characteristics of the
respondents, their familiarity with the related technologies, and their current mobility patterns.
Annex 2 contains tables with the detailed results.
A large group of respondents are residents of areas far from the centre, that could be due to the
relatively small size of the DCC and the area, which is considered in the survey as “close to the
centre” and includes the part of GDA outside of the DCC but not further than 10 km away from the
DCC. The age distribution of the respondents is quite balanced across the six age groups. More than a
half of the respondents are full-time employees and less than 20% are part-time employees. The share
of respondents who neither work nor study is less than 9%.
The great majority of the respondents (more than 90%) own and use a smartphone, and more
than a half use a tablet. Three-quarters of the respondents actively use their smartphones, which
includes accessing real-time information about weather, news, etc. More than one-third use
smartphone apps to request transport services.
The average number of weekly trips is 15.6 per person. Most trips (36%) are commuting to or
from work or place of study with average trip duration of 27 minutes. The other most common types
of trips are for shopping and social activities. While shopping trips are relatively short (around 15 min
on average), trips for social activities are twice as long. Around a half of the respondents are regular
car users. They are followed by bus users, and by those who walk and cycle. Regular rail users
constitute the smallest share of the respondents (only 7%). Younger respondents (below 36 years old)
tend to use the soft modes more often. The other modes are used quite uniformly across the age
groups.
Attitudes towards Shared Mobility attributes
The survey included a section regarding the attitudes towards the attributes of the shared modes
compared to the current regularly used mode. The section contained questions regarding fare, access
time, lost time due to detours to pick up and drop off other passengers, transfers, possibility to use
Shared Mobility modes as feeder services to rail and ferry stations, etc. Annex 3 presents the answers
for each of the respondent group (focus and panel) split by the mode user type (car or PT).
First, the respondents answered a question about the price they were willing to pay for the shared
modes. Instead of the absolute value, the question suggested to compare the maximum acceptable cost
of a ticket by a shared mode with the current cost per trip by car or by a PT mode.
For car users the total cost of EUR 20-25 per an average trip was calculated (taking into account
not only out-of-pocket expenses for fuel but also the purchase price of the car, road tax, insurance,
maintenance and fuel) and this was suggested as a benchmark. The car users had to respond how
much they would be willing to pay for a trip by a Shared Mobility mode, using the following scale: 10
– willing to pay the current value, 5 – willing to pay a half of the current cost, 1 - not willing to use
the shared modes. Less than 15% of the survey panel car users stated that they are not willing to use
the shared modes at all, while none of the car users who participated in the focus group meeting were
so categorical. Around a quarter of the respondents would only be willing to pay half the current cost,
while the rest of the respondents were divided between those who are willing to pay more or less than
the current cost.
Bus and rail users also had to compare the cost they would be willing to pay for the shared
modes with the current PT fare. In this case, the scale varied between 10 – willing to pay the double
price, 5 – willing to pay the equivalent of the current price, 1 - not willing to pay for the shared

POTENTIAL USERS OF SHARED MOBILITY – 35
SHARED MOBILITY SIMULATIONS FOR DUBLIN — © OECD/ITF 2018
modes. Most of the PT users are willing to pay a fair comparable to the current PT ticket price. Less
than 10% of the PT users would be willing to pay double the price and less than 10% would not be
willing to pay anything for using the new modes.
The respondents also had to state how long they would be willing to walk to a stop of a Shared
Mobility mode. A quarter of the car users and around 40% of the public transport users would be
willing to work 10 minutes or more. Around 80% of both users’ types are willing to walk at least
5 minutes (which corresponds to a distance of approximately 400 metres).
Regarding the acceptability of lost time due to detours for pick up and drop off of passengers
40% of the PT users and one-third of the car users stated that they would be willing to lose five
minutes. Around 20% of all of the respondents would be willing to lose ten minutes or more. Less
than 5% of the car users and none of the PT users would unwilling to accept any detours.
All the respondents answered a question regarding the relevance of shared modes as feeder
services to or from rail stations subject to the condition that the rail trip is direct, i.e. no transfers.
Most of the respondents stated that the feeder service would be relevant to them (above 5 on the scale
between 0 – not relevant and 10 – highly relevant). This can be explained by the fact that most of the
respondents live in the GDA more than 10 km away from the DCC where rail can provide a fast
means of travel for long-distance trips, especially if the access to the railway station is quick and easy
enough. Less than 10% of the car users and less than 15% of the PT users stated that the feeder
services would not be relevant to them at all. These are likely to be the users who are either well
served by the current PT in terms of absence of transfers and access time, or prefer to keep using their
private cars instead of the shared modes.
Some questions targeted particular groups of respondents based on the travel mode they use most
often. Regular car users responded to a question on the number of passengers with whom they would
be willing to share on trip by a shared mode. Only 2% of the car users stated that they would not like
to share with anyone. More than 20% responded that they would be willing to share a vehicle with
10-15 other passengers. The PT users answered an additional question on the degree of importance of
the comfort on board shared modes and seat availability. The majority (over 80%) stated that this is
relevant to them (above 5 on the scale between 0 – not relevant and 10 – highly relevant); while only
for 3% it is not relevant at all.
The final question asked about the household’s car ownership, parking preferences and
willingness to sell some of the household’s cars if the shared services became available on a large
scale. More than 75% of the respondents have a car in the household and 28% have more than one
car. More than 60% of those who have at least one car park their cars at home. Around a quarter of the
respondents stated that they would sell at least one car.
Stated preference choice experiments
A set of stated preferences questions in the form of eight choice games for each respondent is the
core of the survey. The responses are used to determine the respondents’ perceptions of Shared
Mobility and their potential impact on the mode choice. The modes available in the scenarios are
walking, cycling, bus, rail, LRT, car, Shared Mobility modes. Each respondent answered eight choice
games: four with choices among three existing modes (one non-motorised mode, one PT mode, and
car) and a generic shared mode; and four with choices between Shared Taxi and Taxi-Bus. Annex 1
shows an example of a choice game displayed to a respondent.

36 – POTENTIAL USERS OF SHARED MOBILITY
SHARED MOBILITY SIMULATIONS FOR DUBLIN— © OECD/ITF 2018
Calibration and results of the mode choice model based on the stated preference data
The stated preference data obtained from the survey were used for the calibration of a
multinomial logit discrete choice model. Table 12 presents the model coefficients and values
calculated based on the survey, along with goodness of fit measures. For the estimation, the
alternative-specific constant of car was normalised to zero. The coefficients that were found to be
significantly different from zero (at the confidence level of 90%) were kept in the final model. A few
coefficients that did not meet that criterion but usually strongly influence the mode choice were also
kept. These included, for instance, alternative-specific constants and coefficients related to level of
service of the modes, such as travel time and cost. The rest of the coefficients were set equal to zero.
Different specifications were tested including nested logit. The introduction of nests did not improve
the model fit and the calibrated nests scale parameters were not significantly different from one. The
goodness of fit expressed by rho-squared is quite low, which is likely due to a large number of modes
included in each choice game and highly diverse answers of the respondents.
The VOT for car users and PT users is comparable to those reported in other studies for Ireland
(Wardman et al., 2012), though the VOT of the PT users is lower than the reported ones. The VOT of
the shared mode users is between the VOT of car and PT users, which can be expected for modes that
combine features of a conventional taxi and a bus. It is slightly closer to the VOT of PT which might
mean that people perceive the shared modes more as PT rather than taxi.
The estimated alternative-specific constants reveal that there are underlying preferences for PT and
shared modes. This indicates that there are net unobserved benefits for PT and shared modes relative
to car. Moreover, there are significant unobserved costs impacting on car users. Noting that the mode
share for car in the region is high this leads to the conclusion that cars costs are significantly less than
PT or PT access is insufficient in some GDA areas.
Additionally, the estimated coefficients of the model reveal that the preferences of regular car users
for the shared modes are similar to those of the PT users, and that they do not prefer one shared mode
over the other. Riding alone has a negative coefficient in the shared modes utility functions indicating
that the respondents prefer to share a vehicle, supported by quite low willingness to pay for being
alone in a vehicle (only 68 cents more for a trip to be alone in a vehicle). As the focus group
discussion showed, the respondents prefer sharing with more people than with less because it implies
lower cost and reduces the need to maintain a conversation with other passengers out of politeness.
The estimated model coefficients show that the travel cost is the most important attribute for the
mode choice. In the case of PT, it is followed by the number of transfers, access time, waiting time
and in-vehicle travel time.
Analysis of the differences in mode choice preferences depending on socio-demographic
characteristics showed that female and younger users (below 25 years old) favour the shared modes
more than others. Younger users also choose cycling more often. Older users (above 60 years old)
choose bus more often. Location of residence is important for the Shared Mobility choice only in the
case when respondents live close to the DCC (less than 10 km away). In this case, the preferences for
the shared modes are lower.

POTENTIAL USERS OF SHARED MOBILITY – 37
SHARED MOBILITY SIMULATIONS FOR DUBLIN — © OECD/ITF 2018
Table 9. Model calibration results
Parameter Estimated value
Alternative specific constant, cycle -0.401
Alternative specific constant, car 0
Alternative specific constant, walk 0
Alternative specific constant, Shared Taxi 1.770*
Alternative specific constant, PT 1.390*
Shared mode being Taxi-Bus, for car users 0
Access time, generic (PT and Shared Mobility) -0.044*
Being a car user, Shared Mobility 0
Travel cost, car -0.129*
Travel cost, PT -0.347*
Travel cost, Shared Mobility -0.583*
Being female, Shared Mobility 0.772*
Lost time, Shared Mobility -0.074*
Number of transfers, PT -0.118
Number of passengers, Shared Taxi -0.362*
Riding alone, Shared Taxi 0.397**
Travel time, car -0.021
Travel time, non-motorised modes -0.041*
Travel time, PT -0.019*
Travel time, Shared Mobility -0.050*
Waiting time, PT -0.033*
Living far from the city centre, Shared Mobility 0
Living close to the city centre, Shared Mobility -1.180*
Living close to the city centre, PT 0
Being below 25 years old, Shared Mobility 0.926**
Being above 60 years old, bus 0.939*
Being below 25 years old, bus 0
Being below 25 years old, cycle 1.320**
Adjusted rho-squared 0.14
Number of observations 920
Value of time (EUR per hour), car 9.95
Value of time (EUR per hour), PT 3.20
Value of time (EUR per hour), Shared Mobility 5.16
Correctly predicted choices (full sample), % 49
Value of riding alone (EUR), Shared Taxi 0.68 - not available, * significant at the 95% level; ** significant at the 90% level.
Impact of focus group meetings on the perception of Shared Mobility
The participation in the focus group discussion might influence positively the attitudes towards
the shared modes and their attributes, as the ITF study for Auckland showed (ITF, 2018). In order to
test this hypothesis for the GDA, answers to both the attitudes and the ST sections of the survey were
compared for the focus group respondents and for those who did not participate in the focus group
(panel respondents).
Some answers to the questions in the attitudes part of the survey (Annex 3) showed that there are
differences between the two groups despite of the fact that both samples are fairly well distributed in
terms of socio-demographic characteristics. In the case of the panel respondents, the answers have

38 – POTENTIAL USERS OF SHARED MOBILITY
SHARED MOBILITY SIMULATIONS FOR DUBLIN— © OECD/ITF 2018
distributions closer to normal compared to those of the focus group, which is in part due to the larger
size of the panel sample. Additionally, there is a positive skew towards use of the Shared Mobility
modes and acceptance of the more flexible attributes of the shared modes in the case of the focus
group respondents.
This difference between the focus group and the panel is more noticeable amongst car users. In
the case of the attitudes of car users towards the number of passengers on board Shared Mobility
modes all the focus group participants stated that they would not mind sharing a vehicle with more
than five other passengers, whereas the panel share was 55%. Among the panel respondents 14% of
the car users would never consider using the shared modes, whereas all the focus group car users
stated that they would use the shared modes subject to the cost of shared service. Additionally, 33% of
the focus group car users would accept detours of 10 minutes or longer to pick up and drop off other
passengers, while only 20% of the panel car users would accept this level of detour. All of the focus
group car users have stated that the feeder service was relevant to them (above 5 on the scale between
0 – not relevant and 10 – highly relevant), while the panel car users the share of such responses was
57%.
The regular PT users who participated in the focus group exhibited slightly higher flexibility
regarding the attributes of the shared modes compared with panel PT users. For example, 14% of the
panel PT users stated that feeder services are not relevant to them compared with 0% of the focus
group PT users. All of the focus group PT users and 72% of the panel PT users would be willing to
pay a fare which was higher than the current one.
In the case of the SP survey the difference between the two respondents groups is much smaller.
As Figure 13 shows, the shares of the respondents choosing car and shared modes in different choice
scenarios are nearly the same. In order to identify if there is a statistically significant difference
between the responses of the two groups two tests were performed: a test of an assumption that the
two data sets have different variance of the error term, and a test with including a binary variable
representing participation in the focus group into the Shared Mobility utility function of the choice
model.
Figure 13. Mode choices in stated preference survey
Focus group
Panel respondents
The assumption that the two data sets have different variance of the error term can be tested by
comparing the standard deviations σ as σfocus group data = ασPanel group data , where α is a scale term between
the two data sets (Morikawa, Ben-Akiva and Yamada, 1991). The scale term represents the difference
in the levels of random noise for the two data sets, with a higher scale term corresponding to lower
variance, that is, lower noise.
5%
14%
13%
3%
28%
22%
15% 10%
7%
16%
5% 28%
23%
11%
Walk
Bicycle
Bus
Rail
Car
Shared Transport
LRT
POTENTIAL USERS OF SHARED MOBILITY – 39
SHARED MOBILITY SIMULATIONS FOR DUBLIN — © OECD/ITF 2018
First, the scale term was calculated by combining the two data sets, with the model specification
presented in Table 9. The estimated value of the scale term is slightly higher than one; however, it is
not statistically significantly different from one.
Since the sample size of the focus group is much smaller than the one of the panel group, which
might affect the difference in the variances, a bootstrapping test was performed to compare the
variance of the two data sets if they were of the same size. For this a model with only
alternative-specific constants was estimated for a combination of the full focus group data set and of a
random subset of the panel data set, whereby the size of this subset was equal to the size of the focus
group data set. The two data sets were combined using the scale parameter. After 500 runs the mean
of the estimated value of the scale parameter and the mean of the absolute value of the corresponding
t-stats were calculated. The mean of the scale was found to be 1.11, i.e. larger than 1, which means
that the focus group data have smaller variance, and, therefore, the panel respondents have slightly
more diverse answers. However, this difference is not statistically significant, (the mean of the
absolute values of the t-stats is 0.81).
Finally, a binary variable with the value 1 for respondents participated in the focus group and 0
otherwise was included into the utility function of the shared modes while keeping the rest of the
specification as in Table 9. The statistical insignificance of this binary variable reveals that
participation in the focus group does not alter the perceived utility of the Shared Mobility services.
While the attitudes section of the survey shows that participation in the focus group changed the
perception of the Shared Mobility in favour of the shared modes, the stated preferences are not
significantly different between the two respondents groups. This means that the information
campaigns still can be important in the design and introduction stages of Shared Mobility, however,
these campaigns would have less impact than in cities with very strong preferences for use of private
car, such as Auckland (ITF, 2018).
The following sub-section summarises findings of the focus group meeting and the SP survey
and presents their practical implications.
Conclusions and implications of the focus group experiment
The focus group meeting and the SP survey provide insight into preferences of the current
transport users in the GDA, their opinions towards the Shared Mobility modes and their attributes
(fare, waiting time, detour time, access time to a stop, number of passengers on board), and special
concerns (safety, comfort, etc.). The use of a discussion part and a SP survey facilitates the collection
of both qualitative and quantitative data. The findings per se provide information on the likely public
acceptance of the new modes and their attributes, and will support decision making in the assessment,
design and deployment stages of Shared Mobility introduction in the study area. The responses
obtained from the SP survey are used as inputs for the estimation of a mode choice model. The model
parameterises the preferences and trade-offs of potential users and produces the mode choices
probabilities for the different scenarios proposed for the city. This includes identifying potential early
adopters of the shared services depending on socio-demographic characteristics, which is especially
useful for scenarios with partial adoption of Shared Mobility. In the tested scenarios the calculated
mode choice probabilities are used in the agent-based simulation model to determine which mode
each user selects.
Most of the participants expressed willingness to use the proposed shared modes if they are
introduced in the GDA. Almost all of the respondents are familiar with technologies (smartphones,
tablets, mobile applications) essential to book and use the on-demand shared services.

40 – POTENTIAL USERS OF SHARED MOBILITY
SHARED MOBILITY SIMULATIONS FOR DUBLIN— © OECD/ITF 2018
The respondents prefer to share vehicles with more travellers, which means that larger vehicles
can be used for the shared services, given sufficient demand. People of age below 25 and women are
the most likely to be earlier adopters of shared services. Based on these findings the new modes
should initially be tailored to the needs of earlier adopters (e.g. availability of on-board Wi-Fi).
The PT users articulated strong willingness to use the shared modes and expressed expectations
that the shared modes would greatly improve their current mobility. Many PT users stated that having
a possibility to use the shared modes as feeder services to rail would be of a great interest to them.
The benefits which Shared Mobility can brings to a city strongly depend on the number of car
users who shift to the shared modes. As previous studies by the ITF have shown the larger the shift
the greater the improvements to mobility in terms of congestion, emissions and equity. The desired
mode shift requires an acceptance of the new modes by car users, as buyers and as voters. The
focus group study results show that the Shared Mobility modes are quite positively perceived by
car-using participants and that some of them would be willing to substitute their car trips with trips by
the Shared Mobility services and to reduce their private car ownership. Figure 13 shows that in more
than 20% of the suggested mode choice games the respondents choose Shared Mobility. Even though
the choices depend strongly on the survey design and the characteristics of the trips by different
modes, suggested to the respondents, the results suggests that even without additional incentives from
the authorities stimulating the use of PT and shared modes and restricting car use, the mode share of
the new modes could become substantial.
The SP survey did not show statistically significant difference between mode choices of the
respondents who participated in the focus group and those who did not. However, the attitudes section
of the survey showed that the respondents who participated in the focus group and, therefore, were
exposed to more information regarding the new modes and the opinions and choices of their peers,
have less strict requirements on the attributes of the shared modes and express more willingness to use
the modes. This difference is especially noticeable in the case of the car users. This means that the
information campaigns in the introduction stage of Shared Mobility in the GDA are important for
creating a positive image of the shared modes and stimulating the shift from private car.
The cost is the most important attribute for all the respondents. The majority of the current PT
users would be willing to accept a cost higher than that of existing PT modes, even for Taxi-Bus.
Most of the car users expected the Shared Mobility fares to be lower than the current cost of using a
car (assuming that purchase cost of the car, maintenance, road tax, insurance and fuel are taken into
account). The VOT of the new modes was found to be closer to the one of PT rather to that of private
car. These findings provide the range of fares which should be used to ensure a high uptake of the
new modes.
Both the discussion and the model coefficients show that among access time, waiting time and
detour time (due to pick up and drop off of passengers) detour time is the most important, followed by
the access time. This means that the constraints on the detour time applied when the dispatcher
assigns vehicles to users are more important and should be tighter, while the constraints for waiting
and walking time to the stop can be less restrictive. The attitudes section of the survey provides the
exact levels of acceptance of such constraints and the corresponding shares of respondents. The
constraints in the Shared Mobility simulation model, which are described in the ‘Shared modes
specification’ section of this report (Table 1), were set taking into account the acceptable levels of
service obtained from the survey.
Identifying the potential users’ preferences and the factors influencing them provides rules for
mode shift in different mobility scenarios, accommodating various sets of constraints on the present
modes and assumptions on the extent of the mode shift. The next chapter presents the development of
the scenarios.

SETTING THE SHARED MOBILITY SCENARIOS – 41
SHARED MOBILITY SIMULATIONS FOR DUBLIN — © OECD/ITF 2018
Setting the Shared Mobility scenarios
The results of the previous section showed that travellers in the GDA would be willing to use
Shared Mobility; and, even with no additional incentives from the authorities, the share of the new
modes could reach a substantial proportion. However, as the new modes will become a part of the
existing complex transport system, knowing their performance under various transport system
configurations is important for the policy makers, investors and the users, as it will strongly affect the
success of the uptake and financial viability of the new transport system. The transport system
configurations may vary depending on the presence of the new shared and the remaining
“conventional” modes and their attributes, on the restriction of car use in space and time, and on mode
split of the users. This chapter presents scenarios with different transport system configurations and
different degrees of market penetration of the new shared services. The scenarios are designed to test
the performance of the GDA transport system in its evolution from the current situation to a fully
adopted Shared Mobility solution.
The Shared Mobility study for the Lisbon Metropolitan Area (ITF, 2017c) showed that replacing
car trips at marginal rates does not have significant effect. Therefore, the minimum car replacement
rate considered in all the scenarios is 20%. This is also consistent with the focus group and stated
preference survey findings suggesting this is a plausible scenario.
Table 10 shows the selected scenarios. Scenario 1 with full replacement of the motorised modes
presents an assessment of the potential of Shared Mobility in the GDA, and facilitates the comparison
of common indicators with those from the other cities for which the ITF has completed studies on
Shared Mobility (Auckland, Dublin, Helsinki and Lisbon). The rest of the scenarios are the
intermediate ones with different degrees of Shared Mobility adoption. Some of the scenarios (2-10)
include Low Emission Zones (LEZ) of different sizes with restrictions on car usage. The design of
LEZ boundaries aims to maximise the potential of park and ride in the study area. The scenarios were
selected in accordance with the vision of the Irish National Transport Authority and the Department of
Transport, Tourism and Sport.
All of the scenarios include the two shared modes: Shared Taxi and Taxi-Bus, and the feeder
services as described in section ‘Shared modes specification’. The shared vehicles can be set as
self-driving or operated by a professional driver with regular shift constraints. Usage of the existing
PT modes and private car vary across the scenarios with full or partial retention of certain modes and
links. All scenarios rely on a set of common rules for mode choice. Bike users keep using bike; those
who walk keep walking for distances below 3 km and otherwise shift to one of the shared modes.
Conventional taxi mode is removed from the transport system, so its users shift to the shared modes as
well. Rail and LRT modes are retained with their current characteristics. Each rail user keeps using
rail, if both origin and destination stations are within acceptable walking distance, and if there are no
transfers required. Otherwise the user chooses Shared Mobility either for a direct trip or as a feeder
service to rail. The LRT mode is retained but with limited feeder services provided by the shared
modes as it assumed that the most of the current LRT stations do not have enough capacity for
massive drop-off of passengers arriving by the shared modes. Where a LRT station is within
200 metres of a rail station, the shared modes provide feeder services for the LRT as well as rail at
this station.
The choice between feeder to rail and direct service by a shared mode is based on the computed
choice probabilities and the rules for feeder services. Differential weights are assigned to walking
(three times more) and the connecting Taxi-Bus time (1.5 times more) as compared to the time spent

42 – SETTING THE SHARED MOBILITY SCENARIOS
SHARED MOBILITY SIMULATIONS FOR DUBLIN— © OECD/ITF 2018
travelling on board the train. The user is assigned to the feeder service if (1) the walking segment
linking rail with the trip end (origin or destination) point is less or equal to 10 minutes; (2) the rail leg
has no transfers; (3) the total distance on the feeder part of the trip (walking plus Shared Mobility) is
shorter than the direct distance between the trip origin and destination. This ensures that feeder
services do not result in long detours from the most efficient path. A feeder service is only allowed at
one end of the trip so that the entire trip does not include more than one transfer. If at least one of
these conditions does not hold, the user is assigned to a direct service by a shared mode.
Car users shift to the shared modes according to the degree of replacement set in each scenario.
In scenarios with partial adoption of Shared Mobility by car users, the probabilities computed in the
mode choice model (section ‘Calibration and results of the mode choice model based on the stated
preference data’) are used to choose who would shift to the shared modes. The choice probabilities are
based on the utilities of the competing modes computed for each particular person and trip depending
on his/her socio-demographic characteristics and mode-specific attributes for the trip. Car trips are
sorted in ascending order depending on the ratio between the probabilities of choosing shared modes
to the probability of choosing car; so that the earlier adopters are chosen from the top of this sorted
list. The term “early” in this case does not imply any time component and it refers to those users who
have greater computed probabilities to shift to the new modes. The number of chosen early adopters is
defined by the car replacement share of the scenario. The rest of the inhabitants keep using car. The
Shared Mobility study for Lisbon Metropolitan Area (ITF, 2017b) showed that replacing car trips at
marginal rates does not have significant effect. Therefore, the minimum car replacement rate
considered in all the scenarios is 20%. This is also consistent with the focus group and stated
preference survey findings suggesting this is a plausible scenario.
Table 10. Scenarios selected for tests
Scenarios Bus Cars Rail, LRT
1 100% Replacement 100% of trips replaced Keep
2 Keep 100% of trips replaced Keep
3 100% Replacement 50% of trips replaced Keep
4 100% Replacement 20% of trips replaced Keep
5 Keep trips where Bus
with headway <5 min 100% of trips replaced Keep
6 Keep trips where Bus
with headway <5 min 20% of trips replaced Keep
7 100% Replacement
Large Low Emissions Zone (LEZ) with all private car
traffic constrained within LEZ, 20% of car users affected
by LEZ restrictions use the shared modes from the origin
Keep
8 100% Replacement
Large LEZ with all private car traffic constrained within
LEZ and 20% car reduction outside of LEZ, 20% of the
car users affected by LEZ restrictions use the shared
modes from the origin
Keep
9 100% Replacement
Large LEZ with all private car traffic constrained within
LEZ and 50% car reduction outside of LEZ, 20% of the
car users affected by LEZ restrictions use the shared
modes from the origin
Keep
10 100% Replacement
Small LEZ with all private car traffic constrained within
LEZ, 50% of the car users affected by LEZ restrictions
use the shared modes from the origin
Keep

SETTING THE SHARED MOBILITY SCENARIOS – 43
SHARED MOBILITY SIMULATIONS FOR DUBLIN — © OECD/ITF 2018
If a person chooses a shared mode, the choice of Taxi-Bus or Shared Taxi is also defined based
on the estimated choice probabilities. If a person chooses Taxi-Bus but there are not enough people to
share and, therefore, to ensure sufficient occupancy level in a Taxi-Bus vehicle, the service for this
person is upgraded to Shared Taxi at a price of Taxi-Bus. The assumed minimum acceptable
occupancy rate for a Taxi-Bus is 40%. If there is no Taxi-Bus stop in proximity a person will also be
automatically upgraded to Shared Taxi at the price of Taxi-Bus.
For Shared Taxis the fare is assumed to be equal to 75% of the current car cost but never less
than EUR 3, and for Taxi-Buses it is assumed to be 50% of the current car cost but never less than
EUR 1.5. The car cost is calculated as: EUR 10 (daily value for the purchase price of the car,
insurance, road tax, maintenance) divided by three trips per day, plus fuel cost per kilometre. The
on-board travel time (which also includes the detour time) of a Taxi-Bus is constrained such that it
never exceeds the time which is needed to travel along a Euclidian distance between the trip origin
and destination at speed of 15 km/h.
Whenever a Shared Taxi vehicle is empty and not dispatched to a new trip, it moves to a nearest
depot for idle vehicles. Figure 14 presents the potential location of the potential stops for Taxi-Bus
and Shared Taxi depots. The locations of the stops and depots were optimised in order to maximise
coverage subject to the following constraints: each node of the road network that belongs to the grid
should be within 400 m from the closest Taxi-Bus stop; every grid centroid should be less than 2 km
from the closest depot; each node in the road network in the grid should be no more than 10 minutes
from the closest depot, which is a constraint coming from the maximum acceptable waiting time for
Shared Taxi (Table 1).
Figure 14. Road, public transport and potential Shared Mobility networks
Source: ITF, Map tiles by QGIS.

44 – SETTING THE SHARED MOBILITY SCENARIOS
SHARED MOBILITY SIMULATIONS FOR DUBLIN— © OECD/ITF 2018
The Shared Mobility scenarios can be split into three groups: scenarios (Sc.) with pre-set
different degree of replacement of bus and car trips (Sc. 1-4); scenarios which keep frequent bus trips
and have varying degrees of car trip substitution (Sc. 5-6); scenarios with different levels of adoption
depending on the spatial location of the trips (LEZ with restricted access for private cars, Sc. 7-10).
The scenarios specific features for each group are presented below.
Scenarios with different degree of replacement of bus and private car trips
The first group of the scenarios tests how different degrees of replacement of car trips with and
without a bus network impact on the performance indicators of the transport system. The replacement
rates for car trips are 100% (Sc. 1-2), 50% (Sc. 3) or 20% (Sc. 4). Bus trips are either entirely replaced
by other modes (Sc. 1, 3, 4) or retained in full. Rail trips are kept if they do not require transfers.
Otherwise they are substituted either with direct trips by shared modes or with trips where a shared
mode feeds the rail, based on the rules described in the previous section. LRT trips are kept if they are
not a part of a trip chain containing trip legs by bus and if the sum of access time and waiting time of
the trip does not exceed 30 minutes. The LRT trips which do not meet these requirements are
substituted with direct trips by shared modes or, in rare cases, by shared mode feeding the LRT, as
described in the previous section.
Scenarios retaining frequent bus trips
Scenarios 5 and 6 analyse how the retention of the “core” bus network alongside the introduction
of shared modes would impact on the performance and efficiency of the transport system. Figure 15
shows the origins of the retained bus trips and the core bus network and new Dublin BRT lines.
Figure 15. Origins of the kept bus trips and the core bus network
Source: ITF, Map tiles by QGIS.

SETTING THE SHARED MOBILITY SCENARIOS – 45
SHARED MOBILITY SIMULATIONS FOR DUBLIN — © OECD/ITF 2018
In both scenarios trips by bus with a frequency greater than five minutes are replaced with trips
by the shared modes whilst the rest are kept. Rail and LRT trips are kept or substituted with shared
modes following the same rules as in the first group of scenarios. The two scenarios have different car
replacement rates: in Scenario 5 all the trips made currently by private cars are replaced with trips by
Shared Taxi or Taxi-Bus, while in Scenario 6 only 20% of the car trips are replaced. The choice of the
trips to be replaced depends on the mode choice probabilities, as described in the introductory part of
this chapter.
Low emission zone scenarios
This group of scenarios (Sc. 7-10) tests the impact of banning private cars within a LEZ during
the whole day allied with different levels of car replacement outside of the LEZ. The design of the
boundaries of LEZ is based on the maximisation of the possibility for the transfer of car drivers and
passengers to public transport at park and ride stations near the boundaries.
The model was tested using two different geographical boundaries with constraints on private car
circulation: a large LEZ and a smaller LEZ. The large LEZ boundary has 15 park and ride stations at
which users can change from car to PT or shared mode. The small LEZ has 10 stations and covers the
Dublin City Centre and the dockland area. Figure 16 shows two different sizes of LEZ which are
considered.
Figure 16. Definition of the large and small low emission zones
Source: ITF, Map tiles by QGIS.
46 – SETTING THE SHARED MOBILITY SCENARIOS
SHARED MOBILITY SIMULATIONS FOR DUBLIN— © OECD/ITF 2018
All the trips currently made by buses and private cars within the LEZ boundaries are replaced in
all the four scenarios (Sc. 7-10). Rail and LRT trips are kept or substituted with shared modes
following the rules described in this chapter for the first group of scenarios. In all of the large LEZ
scenarios 20% of the car users affected by the LEZ restrictions shift to Shared Mobility from their
origin instead of parking at the LEZ border. In the small LEZ scenario (Sc. 10) half of the car users
affected by the LEZ restrictions use the shared modes from their origin. In two large LEZ scenarios
some car users who do not cross the LEZ borders also shift to the shared modes (20% in Sc. 8 and
50% in Sc. 9).
For all of the scenarios general indicators and performance measures are calculated for the
Shared Mobility services. The general indicators include major mobility outcomes, such as vehicle-
and passenger-kilometres travelled by different modes, environmental performance (CO2 emissions),
and congestion levels. Changes in modal split, PT ridership and in access and connectivity are also
measured.
The operational performance measures include indicators general to the entire transport system
and indicators specific to the shared modes. The former allow the assessment of the overall
performance of the system while the latter provide insights into the costs and attributes of the shared
modes, and resources needed to efficiently operate the system of shared vehicles, including required
number of vehicles, drivers and depots, given the land-use configuration of the city and labour
legislation. Operational performance indicators of the shared modes are calculated for all the
scenarios and include the average occupation of vehicles and the number of vehicles needed to supply
the demand.
Additionally, in-depth analysis for four selected scenarios has been carried out. It includes more
detailed indicators and maps showing congestion levels for each link and passenger-kilometres by
different modes during the peak hours by grid. Additional operational performance indicators are
estimated for the shared modes in the selected scenarios. These include waiting times distributions,
times loss distributions, kilometres/day per vehicle, average occupation of vehicles along the day,
percentage of upgraded passengers along the day, dynamics at Shared Mobility stations (depots),
dynamics of boarding/alighting of shared vehicles at heavy public transport stations, number of
kilometres travelled by empty Shared Mobility vehicles, costs, etc.
The in-depth analysis also includes tests for electric fleet. These tests imply optimisation of
charging infrastructure considered in the simulation. The resulting charging infrastructure depends on
the charging time specifications.
IMPACT OF SHARED MOBILITY – 47
SHARED MOBILITY SIMULATIONS FOR DUBLIN — © OECD/ITF 2018
Impact of Shared Mobility
This chapter presents the results of the agent-based simulation model for the pre-set scenarios.
The results include indicators of the overall performance of the transport system after the introduction
of the shared modes and associated operational performance indicators. The former include
aggregated indicators on passenger-kilometres (pkm), vehicle-kilometres (vkm), mode shares, fleet
size, emissions, accessibility and connectivity measures, congestion levels in absolute values and in
comparison to the Baseline scenario which represents the current mobility. The operational
performance indicators include the average vehicle utilisation and the fleet size required to serve the
demand for the shared modes. The major differences among the scenarios are highlighted for further
policy insights discussion.
The chapter also includes more detailed analysis for four scenarios, which were selected based on
an assessment of the initial results from the original ten scenarios. Most of the indicators in this
analysis are disaggregated to the level of grid cells, road network links and time of the day.
The section also contains a brief comparison of the main indicators with the ones obtained for the
Lisbon Shared Mobility study (ITF, 2016).
Major mobility outcomes
CO2 emissions, the congestion levels and vkm are the indicators used to assess the overall
performance of the transport system in the study area. Table 11 displays the changes in these
indicators compared with the Baseline scenario. The relative values show the significant benefits that
each scenario with Shared Mobility brings to the transport system. The congestion is calculated as the
average of volume to capacity ratios for the actively used links. The CO2 emissions are calculated as a
sum of the emissions for each mode (Annex 4 contains the initial values used in the calculations). It
should be noted that the congestion changes presented in all scenarios that have a partial replacement
of bus do not include the reduction of congestion due to reduction in bus vehicles. However, this
reduction is negligible since the bus share in terms of traffic volumes is relatively small. Finally,
Table 11 shows how the fleet of motorised vehicles can be reduced with the presence of Shared
Mobility. In the full-car replacement scenarios shared modes can provide the same mobility in the
GDA with less than 2% of the current fleet of motorised vehicles.
As the results show, the scenario in which the current bus network is retained with the
replacement of all private car trips (Sc. 2) gives maximum benefits across all three indicators. It is
followed by two other scenarios with 100% rate of car replacement (Sc. 1 and Sc. 5). In general, if we
compare the scenarios which differ from each other by the level of car replacement alone (e.g. Sc. 1,
3, 4), the elasticity of the vkm reduction to the percentage of shift of the car users is less than 1. The
scenario with the small LEZ (Sc. 10) produces the least benefits compared to the other scenarios, with
slight reductions in vkm, congestion and CO2 emissions compared to the baseline. This means that
even though the concentration of motorised vehicles in the smaller streets around the LEZ border
might increase because of park and ride, the overall congestion in the GDA still slightly decreases.
Keeping the core bus lines makes mobility slightly more efficient in scenarios with 20% car
replacement (Sc. 6 vs. Sc. 4) but not in the scenarios with full car replacement (Sc. 5 vs. Sc. 1) where
only the congestion levels improve a little and the vkm and CO2 emissions do not. The reason for this

48 – IMPACT OF SHARED MOBILITY
SHARED MOBILITY SIMULATIONS FOR DUBLIN— © OECD/ITF 2018
could be that in the case of full adoption of the shared modes, sharing is more efficient and so the
retention of the core bus lines cannot increase efficiency any further. This is not the case when only
20% of the car trips are substituted with shared modes as there is less potential for sharing and thus
the shared modes are less efficient. In the scenarios with the retained core bus lines the CO2 emissions
depend on the bus fleet characteristics and shift to more modern bus fleet could allow obtaining more
benefits in terms of CO2 emissions reduction in such scenarios.
In the case of the large LEZ a 50% reduction of car trips outside of the LEZ (Sc. 9) produces
indicators that are only slightly better than in Sc. 8, where 20% of the car trips outside of the LEZ are
replaced with trips by other modes. This result provides evidence that the current mobility of the
initial 20% of car users that switch to shared modes is significantly less efficient than for the rest of
car drivers. Moreover, in the case of the large LEZ, most of the benefits come from the restrictions
inside the area. This is expected since trips are more concentrated in the central part of the GDA
where the LEZ has greatest impact, and, thus gives more opportunities for sharing.
It is notable that the scenarios where 20% of the car trips in the GDA (Sc. 4 and Sc. 6) are
replaced result in slightly larger vkm and CO2 emission reductions than in the scenarios with the large
LEZ (Sc. 8 and Sc. 9). That is, the same level of the environmental benefits can be achieved affecting
a lower number of the current car users in Sc. 4 and Sc. 6, focusing in the areas with greater
opportunity for sharing a ride. However, the corresponding reduction in the congestion levels in Sc. 4
and in Sc.6 is about half that achieved in Sc. 8 or in Sc. 9. This suggests there is a need to balance
environmental and congestion objectives. The results obtained for the rest of the scenarios also show
that targeting car users is crucial for reduction of the congestion. The section with the detailed
analysis of the four selected scenarios provides maps with congestion levels for each link.
Table 11. Changes in vehicle-kilometres, CO2 emissions, congestion, and fleet requirements compared to
the Baseline (%)
Scenario Vkm CO2 Congestion Motorised vehicle fleet (equivalent
private car vehicles) (%)
1 -37.5 -31.3 -36.6 -98.4
2 -41.6 -31.3 -43.2 -98.5
3 -31.2 -27.0 -19.6 -45.9
4 -23.3 -21.5 -7.3 -17.7
5 -37.2 -30.1 -38.0 -98.5
6 -24.7 -22.5 -8.9 -17.8
7 -9.4 -9.1 -14.3 -37.2
8 -20.0 -17.3 -17.6 -45.0
9 -22.4 -18.9 -20.7 -57.0
10 -1.2 -4.0 -1.9 -7.4
Note: To transform to the equivalent car vehicles, vehicles of the motorised modes are weighted by the following factors:
conventional taxi: 1; Shared Taxi: 1.1; Taxi-Bus (8 seats): 1.3; Taxi-Bus (16 seats): 1.5; Bus: 3.
The very similar levels of vkm and CO2 emissions in Sc. 6 and Sc. 9 are especially surprising,
since in Sc. 6 only 20% of the car users’ trips across the GDA are replaced whereas in Sc. 9 all the car
trips within the LEZ, 50% of the car trips outside of the LEZ and 20% of the car trips which start
outside of the LEZ and finish within the LEZ are replaced. These results can be better understood by
examining the pkm by mode in Table 12 and the number of trips by mode in Table 13. The tables
show that while the number of trips by car in Sc. 9 is about half those in Sc. 6 the difference in car
pkm is only around 20%, and the increase in pkm by Taxi-Buses is almost 300%. This is due to the
fact that many of the car users drive to the LEZ border and change to other modes. And since the
heavy-rail does not cover the LEZ territory sufficiently, most of this demand is served by Taxi-Buses.
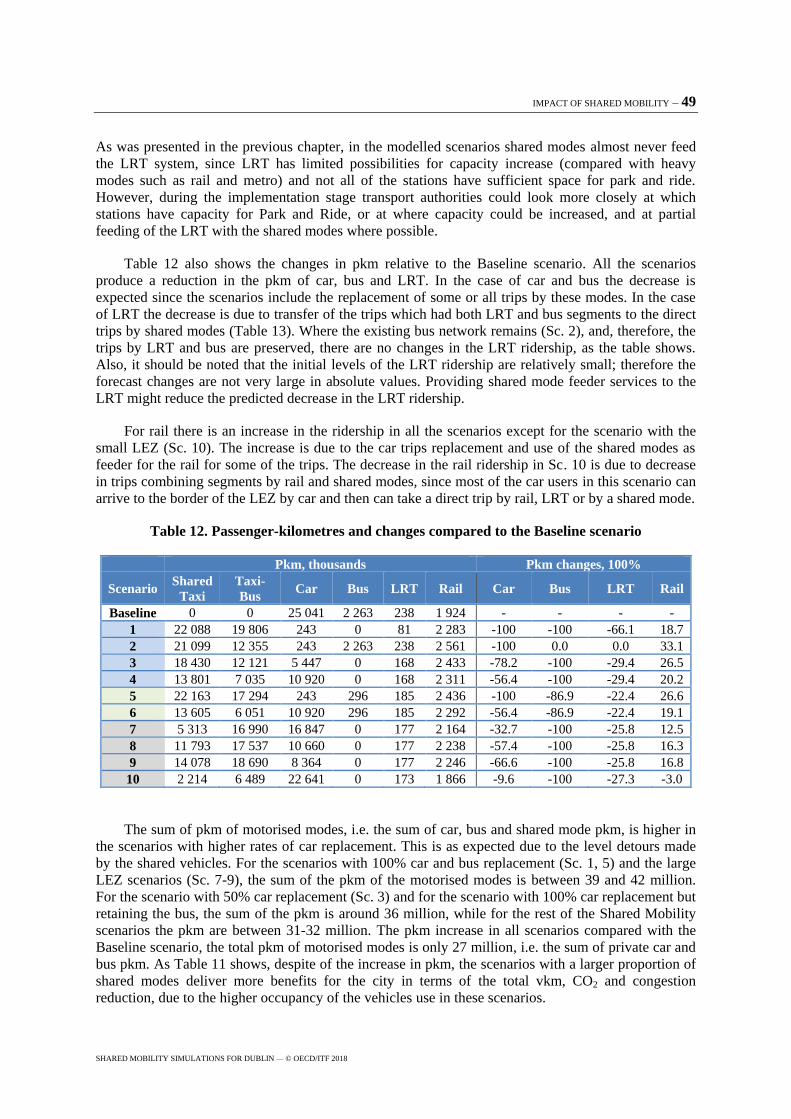
IMPACT OF SHARED MOBILITY – 49
SHARED MOBILITY SIMULATIONS FOR DUBLIN — © OECD/ITF 2018
As was presented in the previous chapter, in the modelled scenarios shared modes almost never feed
the LRT system, since LRT has limited possibilities for capacity increase (compared with heavy
modes such as rail and metro) and not all of the stations have sufficient space for park and ride.
However, during the implementation stage transport authorities could look more closely at which
stations have capacity for Park and Ride, or at where capacity could be increased, and at partial
feeding of the LRT with the shared modes where possible.
Table 12 also shows the changes in pkm relative to the Baseline scenario. All the scenarios
produce a reduction in the pkm of car, bus and LRT. In the case of car and bus the decrease is
expected since the scenarios include the replacement of some or all trips by these modes. In the case
of LRT the decrease is due to transfer of the trips which had both LRT and bus segments to the direct
trips by shared modes (Table 13). Where the existing bus network remains (Sc. 2), and, therefore, the
trips by LRT and bus are preserved, there are no changes in the LRT ridership, as the table shows.
Also, it should be noted that the initial levels of the LRT ridership are relatively small; therefore the
forecast changes are not very large in absolute values. Providing shared mode feeder services to the
LRT might reduce the predicted decrease in the LRT ridership.
For rail there is an increase in the ridership in all the scenarios except for the scenario with the
small LEZ (Sc. 10). The increase is due to the car trips replacement and use of the shared modes as
feeder for the rail for some of the trips. The decrease in the rail ridership in Sc. 10 is due to decrease
in trips combining segments by rail and shared modes, since most of the car users in this scenario can
arrive to the border of the LEZ by car and then can take a direct trip by rail, LRT or by a shared mode.
Table 12. Passenger-kilometres and changes compared to the Baseline scenario
Pkm, thousands Pkm changes, 100%
Scenario Shared
Taxi
Taxi-
Bus Car Bus LRT Rail Car Bus LRT Rail
Baseline 0 0 25 041 2 263 238 1 924 - - - -
1 22 088 19 806 243 0 81 2 283 -100 -100 -66.1 18.7
2 21 099 12 355 243 2 263 238 2 561 -100 0.0 0.0 33.1
3 18 430 12 121 5 447 0 168 2 433 -78.2 -100 -29.4 26.5
4 13 801 7 035 10 920 0 168 2 311 -56.4 -100 -29.4 20.2
5 22 163 17 294 243 296 185 2 436 -100 -86.9 -22.4 26.6
6 13 605 6 051 10 920 296 185 2 292 -56.4 -86.9 -22.4 19.1
7 5 313 16 990 16 847 0 177 2 164 -32.7 -100 -25.8 12.5
8 11 793 17 537 10 660 0 177 2 238 -57.4 -100 -25.8 16.3
9 14 078 18 690 8 364 0 177 2 246 -66.6 -100 -25.8 16.8
10 2 214 6 489 22 641 0 173 1 866 -9.6 -100 -27.3 -3.0
The sum of pkm of motorised modes, i.e. the sum of car, bus and shared mode pkm, is higher in
the scenarios with higher rates of car replacement. This is as expected due to the level detours made
by the shared vehicles. For the scenarios with 100% car and bus replacement (Sc. 1, 5) and the large
LEZ scenarios (Sc. 7-9), the sum of the pkm of the motorised modes is between 39 and 42 million.
For the scenario with 50% car replacement (Sc. 3) and for the scenario with 100% car replacement but
retaining the bus, the sum of the pkm is around 36 million, while for the rest of the Shared Mobility
scenarios the pkm are between 31-32 million. The pkm increase in all scenarios compared with the
Baseline scenario, the total pkm of motorised modes is only 27 million, i.e. the sum of private car and
bus pkm. As Table 11 shows, despite of the increase in pkm, the scenarios with a larger proportion of
shared modes deliver more benefits for the city in terms of the total vkm, CO2 and congestion
reduction, due to the higher occupancy of the vehicles use in these scenarios.
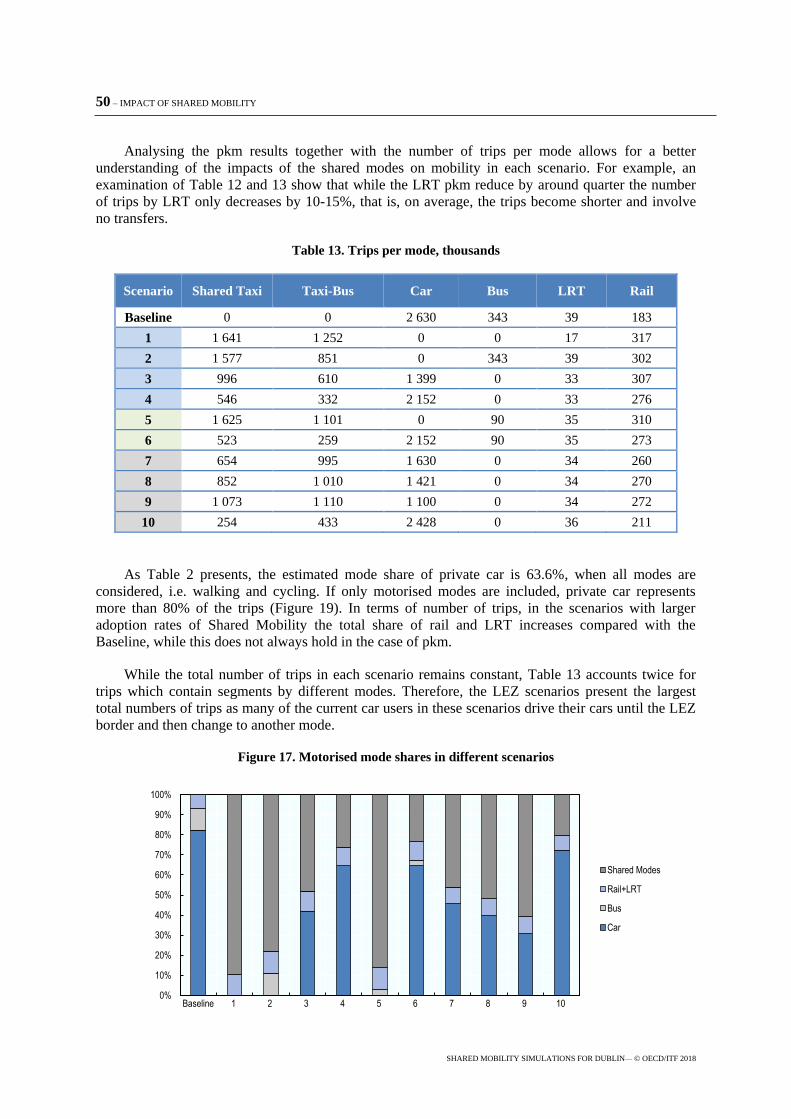
50 – IMPACT OF SHARED MOBILITY
SHARED MOBILITY SIMULATIONS FOR DUBLIN— © OECD/ITF 2018
Analysing the pkm results together with the number of trips per mode allows for a better
understanding of the impacts of the shared modes on mobility in each scenario. For example, an
examination of Table 12 and 13 show that while the LRT pkm reduce by around quarter the number
of trips by LRT only decreases by 10-15%, that is, on average, the trips become shorter and involve
no transfers.
Table 13. Trips per mode, thousands
Scenario Shared Taxi Taxi-Bus Car Bus LRT Rail
Baseline 0 0 2 630 343 39 183
1 1 641 1 252 0 0 17 317
2 1 577 851 0 343 39 302
3 996 610 1 399 0 33 307
4 546 332 2 152 0 33 276
5 1 625 1 101 0 90 35 310
6 523 259 2 152 90 35 273
7 654 995 1 630 0 34 260
8 852 1 010 1 421 0 34 270
9 1 073 1 110 1 100 0 34 272
10 254 433 2 428 0 36 211
As Table 2 presents, the estimated mode share of private car is 63.6%, when all modes are
considered, i.e. walking and cycling. If only motorised modes are included, private car represents
more than 80% of the trips (Figure 19). In terms of number of trips, in the scenarios with larger
adoption rates of Shared Mobility the total share of rail and LRT increases compared with the
Baseline, while this does not always hold in the case of pkm.
While the total number of trips in each scenario remains constant, Table 13 accounts twice for
trips which contain segments by different modes. Therefore, the LEZ scenarios present the largest
total numbers of trips as many of the current car users in these scenarios drive their cars until the LEZ
border and then change to another mode.
Figure 17. Motorised mode shares in different scenarios
0%
10%
20%
30%
40%
50%
60%
70%
80%
90%
100%
Baseline 1 2 3 4 5 6 7 8 9 10
Shared Modes
Rail+LRT
Bus
Car
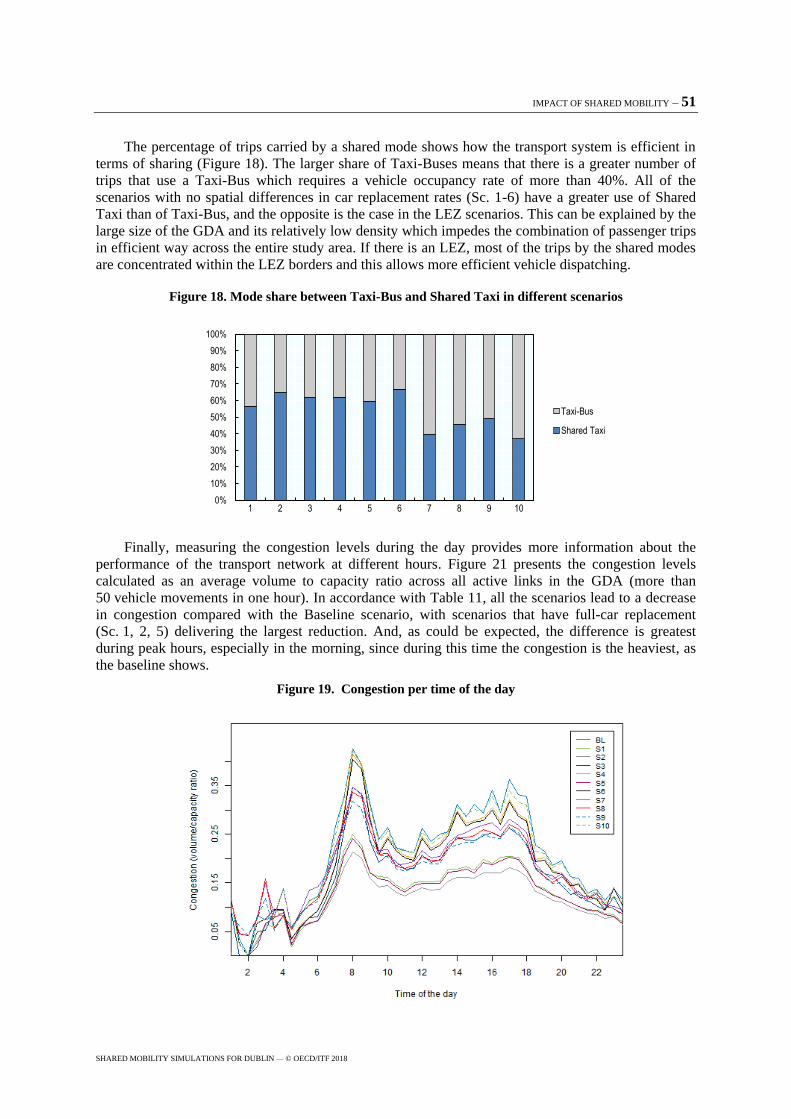
IMPACT OF SHARED MOBILITY – 51
SHARED MOBILITY SIMULATIONS FOR DUBLIN — © OECD/ITF 2018
The percentage of trips carried by a shared mode shows how the transport system is efficient in
terms of sharing (Figure 18). The larger share of Taxi-Buses means that there is a greater number of
trips that use a Taxi-Bus which requires a vehicle occupancy rate of more than 40%. All of the
scenarios with no spatial differences in car replacement rates (Sc. 1-6) have a greater use of Shared
Taxi than of Taxi-Bus, and the opposite is the case in the LEZ scenarios. This can be explained by the
large size of the GDA and its relatively low density which impedes the combination of passenger trips
in efficient way across the entire study area. If there is an LEZ, most of the trips by the shared modes
are concentrated within the LEZ borders and this allows more efficient vehicle dispatching.
Figure 18. Mode share between Taxi-Bus and Shared Taxi in different scenarios
Finally, measuring the congestion levels during the day provides more information about the
performance of the transport network at different hours. Figure 21 presents the congestion levels
calculated as an average volume to capacity ratio across all active links in the GDA (more than
50 vehicle movements in one hour). In accordance with Table 11, all the scenarios lead to a decrease
in congestion compared with the Baseline scenario, with scenarios that have full-car replacement
(Sc. 1, 2, 5) delivering the largest reduction. And, as could be expected, the difference is greatest
during peak hours, especially in the morning, since during this time the congestion is the heaviest, as
the baseline shows.
Figure 19. Congestion per time of the day
0%
10%
20%
30%
40%
50%
60%
70%
80%
90%
100%
1 2 3 4 5 6 7 8 9 10
Taxi-Bus
Shared Taxi

52 – IMPACT OF SHARED MOBILITY
SHARED MOBILITY SIMULATIONS FOR DUBLIN— © OECD/ITF 2018
Changes in access and connectivity
Indicators of accessibility and connectivity are important measures as they show the potential of
the transport system to linking people to activity opportunities (accessibility) and they reveal its
performance for the actual trips (connectivity). More specifically, accessibility is defined as the ease
of access to the amenities in the area in order to perform different kinds of activities, while
connectivity is the performance of the transport system in terms of attributes such as time, speed,
number of transfers for an average trip. The accessibility levels along a continuum of perception can
be presented by means of effective access. The effective access takes into account the travel time
related to a particular origin-destination pair using the Attraction Decay Curve (Annex 5).
The comparison of the effective access in the GDA for the full adoption scenario (Sc. 1) and for
the Baseline scenario shows that Shared Mobility improves access significantly and provides a more
even distribution of access across the study area (Figure 20).
In the Baseline scenario the areas in the centre of the GDA have much better access than the
more remote ones. In the case of full adoption scenarios access increases for the users from the central
part of the GDA and for those from the more remote parts. The number of grid cells with very low
effective access reduces by more than a quarter, from 2 352 to 1 726, while for the residents of almost
3 000 grid cells the effective access becomes greater than 60%.
The increase in the effective access due to adoption of Shared Mobility is higher for more remote
parts of the GDA than for the central part, as presented in Figure 21, which shows the ratio of the
effective access of the Baseline scenario to the effective access of the full replacement scenario
(Sc. 1). This is specially the case around train stations where walking access is too long, and park and
ride facilities might either not be in place or with low capacity. The average effective access for the
Baseline scenario across all grid cells is 18%, and 33% for the full adoption scenario, which means
that almost twice as many people living in the GDA area will have good access in the case of the full
adoption scenario. There are some areas that show a decrease in access. When compared with Figure
20, however, these are the areas that had low level of access in the Baseline scenario. Therefore, the
observed absolute negative changes are very small.
Most of the scenarios show some increase in average travel time for the current car users and a
decrease for the current PT users (Table 14). The travel time increase for the car users is a
consequence of the system design which allows a maximum detour time of 20 minutes in addition to
the original car travel time, leading to an average increase of nine minutes. This fact shows that
additional benefits have to be understood by car users to ensure capturing a significant share of those
who noted their interest in the stated preferences survey. This will allow the Shared Mobility service
costs to be attractive to customers

IMPACT OF SHARED MOBILITY – 53
SHARED MOBILITY SIMULATIONS FOR DUBLIN — © OECD/ITF 2018
Figure 20. Effective PT access to population, baseline (a) and potential of the full adoption scenario (b)
a)
b)
Source: ITF, Map tiles by QGIS.

54 – IMPACT OF SHARED MOBILITY
SHARED MOBILITY SIMULATIONS FOR DUBLIN— © OECD/ITF 2018
Figure 21. Variation of effective public transport access to population, as a ratio baseline and potential of
the full adoption scenario
Source: ITF, Map tiles by QGIS.
The total travel time decrease for the PT users also includes a decrease in the access time and in
waiting time, which often has more value than on-board time for users (Balcombe, 2004). Thus, the
shared modes lead to more even distribution of the average trip attributes across the residents of the
study area and users of different modes. These attributes are connectivity indicators serving as a proxy
for the quality of service. The last two columns of Table 14 present the current mode share of car and
PT and, therefore, provide an indication of how many users are affected by the changes. Only two
scenarios (Sc. 4, 6) lead to reduction of the average travel time for the current car users. These are the
scenarios with only a 20% car trips replacement rate. The gains in these two scenarios must be due to
the reduction in the congestion level causing faster trips for the remaining 80% of trips by car. It is
remarkable, that the average travel time of all of the PT users also reduces in these two scenarios.
Scenario 1 with full replacement leads to the shortest average travel time for the current PT users but
also to the longest one for the current car users. This is due to all current car users switching to the
shared modes and all the PT users switching to faster trips by shared modes or rail. Sc. 2 does not
result in any improvement in the average travel time for the current PT users, since all the current bus
trips are kept in this scenario, which means that the connectivity is the worst in this scenario.
However, as the previous section showed, this was the scenario leading to the greatest benefits in
terms of CO2 emissions, vkm and average congestion.

IMPACT OF SHARED MOBILITY – 55
SHARED MOBILITY SIMULATIONS FOR DUBLIN — © OECD/ITF 2018
Table 14. New mode shares and new average trip attributes for transport system users depending on the
mode they use currently for the scenarios
Car
users PT users
Car mode
share
(%)
PT and Shared
Mobility mode
share (%) Scenario
Travel
time
(min)
Total travel
time
(min)
Waiting
time
(min)
Access
time
(min)
Number of
transfers
Baseline 15 49 11 22 0.22 57 12
1 24 36 9 13 0.22 0 70
2 23 49 11 22 0.22 0 69
3 16 39 8 17 0.14 30 41
4 13 39 8 17 0.14 46 25
5 23 40 8 18 0.14 0 70
6 13 39 7 19 0.14 46 25
7 21 39 9 17 0.14 33 39
8 20 39 9 17 0.14 29 44
9 22 40 9 17 0.14 22 50
10 17 39 8 18 0.14 51 20
Operational performance
Operational performance indicators characterise the efficiency of the system from the operator’s
point of view. Table 15 presents average occupancy of the shared modes and the size of the required
fleet by the vehicle type. The vehicle types include the Shared Taxi and Taxi-Buses with 8 and
16 seats.
The average occupancy is relatively stable across the scenarios. The dispatcher in the simulation
model allocating the vehicles ensures the minimum occupancy rate of 40% for the Taxi-Buses. For
the users who order Taxi-Bus but whose trips cannot be combined to ensure the minimum occupancy
rate the dispatcher allocates Shared Taxis (in addition to the users whose mode choice is Shared Taxi).
Hence, the scenarios with lower levels of replacement of current motorised trips have lower
occupancy level in Shared Taxis. Taxi-Buses have slightly better average occupancy rates in scenarios
with the large LEZ as it is easier to combine the users into shared vehicles in the denser area.
As expected, scenarios with larger motorised-modes replacement rates require larger fleets of
vehicles to meet the demand for Shared Mobility. The full replacement scenario (Sc. 1) would require
more than 32 000 vehicles, which is the largest fleet size. This is followed by the scenario with full
car replacement and the retention of the core bus network (Sc. 5) with 30 000 vehicles. The scenario
with the small LEZ (Sc. 10) requires least vehicles (less than 9 000). Given that the vehicle ownership
in the GDA in 2011 was more than 1.1 million cars (CSO, 2011), the shared modes in the full car
replacement scenarios can provide the same mobility in the city with only around 2% of the current
fleet of private cars.
Fewer vehicle types are required to supply the new shared services in the GDA, only
differentiating the service by required distance to a stop, the need of pre-booking, and more flexible
detour and waiting times for customers. This possibility is based on the observation that the required
number of Taxi-Buses with eight seats is much lower than the number of other vehicles needed.
Therefore, a more optimal allocation of vehicles is likely possible.
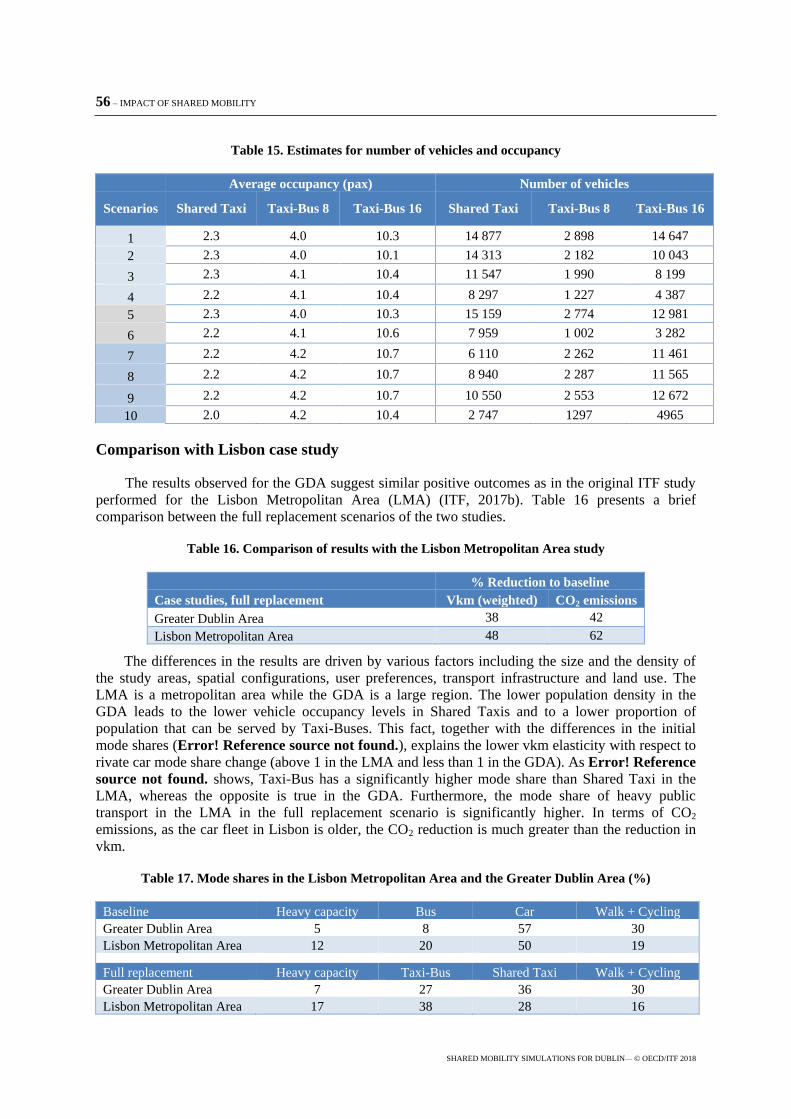
56 – IMPACT OF SHARED MOBILITY
SHARED MOBILITY SIMULATIONS FOR DUBLIN— © OECD/ITF 2018
Table 15. Estimates for number of vehicles and occupancy
Average occupancy (pax) Number of vehicles
Scenarios Shared Taxi Taxi-Bus 8 Taxi-Bus 16 Shared Taxi Taxi-Bus 8 Taxi-Bus 16
1 2.3 4.0 10.3 14 877 2 898 14 647
2 2.3 4.0 10.1 14 313 2 182 10 043
3 2.3 4.1 10.4 11 547 1 990 8 199
4 2.2 4.1 10.4 8 297 1 227 4 387
5 2.3 4.0 10.3 15 159 2 774 12 981
6 2.2 4.1 10.6 7 959 1 002 3 282
7 2.2 4.2 10.7 6 110 2 262 11 461
8 2.2 4.2 10.7 8 940 2 287 11 565
9 2.2 4.2 10.7 10 550 2 553 12 672
10 2.0 4.2 10.4 2 747 1297 4965
Comparison with Lisbon case study
The results observed for the GDA suggest similar positive outcomes as in the original ITF study
performed for the Lisbon Metropolitan Area (LMA) (ITF, 2017b). Table 16 presents a brief
comparison between the full replacement scenarios of the two studies.
Table 16. Comparison of results with the Lisbon Metropolitan Area study
% Reduction to baseline
Case studies, full replacement Vkm (weighted) CO2 emissions
Greater Dublin Area 38 42
Lisbon Metropolitan Area 48 62
The differences in the results are driven by various factors including the size and the density of
the study areas, spatial configurations, user preferences, transport infrastructure and land use. The
LMA is a metropolitan area while the GDA is a large region. The lower population density in the
GDA leads to the lower vehicle occupancy levels in Shared Taxis and to a lower proportion of
population that can be served by Taxi-Buses. This fact, together with the differences in the initial
mode shares (Error! Reference source not found.), explains the lower vkm elasticity with respect to
rivate car mode share change (above 1 in the LMA and less than 1 in the GDA). As Error! Reference
source not found. shows, Taxi-Bus has a significantly higher mode share than Shared Taxi in the
LMA, whereas the opposite is true in the GDA. Furthermore, the mode share of heavy public
transport in the LMA in the full replacement scenario is significantly higher. In terms of CO2
emissions, as the car fleet in Lisbon is older, the CO2 reduction is much greater than the reduction in
vkm.
Table 17. Mode shares in the Lisbon Metropolitan Area and the Greater Dublin Area (%)
Baseline Heavy capacity Bus Car Walk + Cycling
Greater Dublin Area 5 8 57 30
Lisbon Metropolitan Area 12 20 50 19
Full replacement Heavy capacity Taxi-Bus Shared Taxi Walk + Cycling
Greater Dublin Area 7 27 36 30
Lisbon Metropolitan Area 17 38 28 16
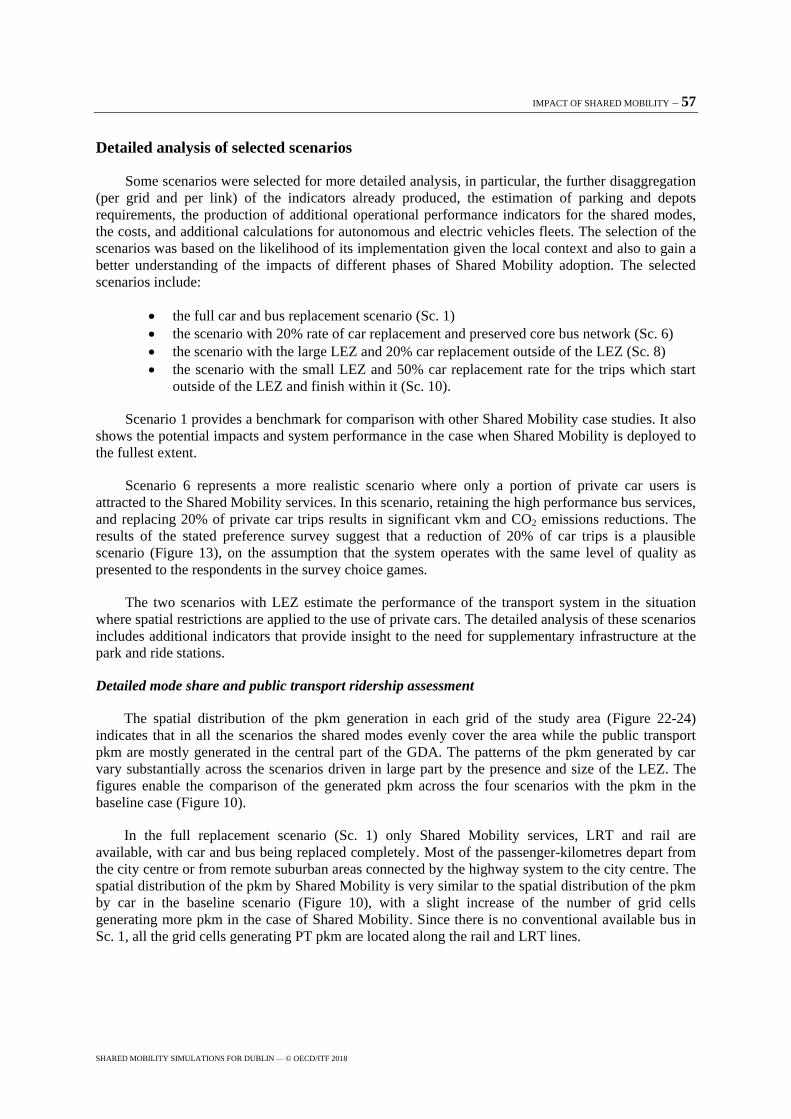
IMPACT OF SHARED MOBILITY – 57
SHARED MOBILITY SIMULATIONS FOR DUBLIN — © OECD/ITF 2018
Detailed analysis of selected scenarios
Some scenarios were selected for more detailed analysis, in particular, the further disaggregation
(per grid and per link) of the indicators already produced, the estimation of parking and depots
requirements, the production of additional operational performance indicators for the shared modes,
the costs, and additional calculations for autonomous and electric vehicles fleets. The selection of the
scenarios was based on the likelihood of its implementation given the local context and also to gain a
better understanding of the impacts of different phases of Shared Mobility adoption. The selected
scenarios include:
the full car and bus replacement scenario (Sc. 1)
the scenario with 20% rate of car replacement and preserved core bus network (Sc. 6)
the scenario with the large LEZ and 20% car replacement outside of the LEZ (Sc. 8)
the scenario with the small LEZ and 50% car replacement rate for the trips which start
outside of the LEZ and finish within it (Sc. 10).
Scenario 1 provides a benchmark for comparison with other Shared Mobility case studies. It also
shows the potential impacts and system performance in the case when Shared Mobility is deployed to
the fullest extent.
Scenario 6 represents a more realistic scenario where only a portion of private car users is
attracted to the Shared Mobility services. In this scenario, retaining the high performance bus services,
and replacing 20% of private car trips results in significant vkm and CO2 emissions reductions. The
results of the stated preference survey suggest that a reduction of 20% of car trips is a plausible
scenario (Figure 13), on the assumption that the system operates with the same level of quality as
presented to the respondents in the survey choice games.
The two scenarios with LEZ estimate the performance of the transport system in the situation
where spatial restrictions are applied to the use of private cars. The detailed analysis of these scenarios
includes additional indicators that provide insight to the need for supplementary infrastructure at the
park and ride stations.
Detailed mode share and public transport ridership assessment
The spatial distribution of the pkm generation in each grid of the study area (Figure 22-24)
indicates that in all the scenarios the shared modes evenly cover the area while the public transport
pkm are mostly generated in the central part of the GDA. The patterns of the pkm generated by car
vary substantially across the scenarios driven in large part by the presence and size of the LEZ. The
figures enable the comparison of the generated pkm across the four scenarios with the pkm in the
baseline case (Figure 10).
In the full replacement scenario (Sc. 1) only Shared Mobility services, LRT and rail are
available, with car and bus being replaced completely. Most of the passenger-kilometres depart from
the city centre or from remote suburban areas connected by the highway system to the city centre. The
spatial distribution of the pkm by Shared Mobility is very similar to the spatial distribution of the pkm
by car in the baseline scenario (Figure 10), with a slight increase of the number of grid cells
generating more pkm in the case of Shared Mobility. Since there is no conventional available bus in
Sc. 1, all the grid cells generating PT pkm are located along the rail and LRT lines.
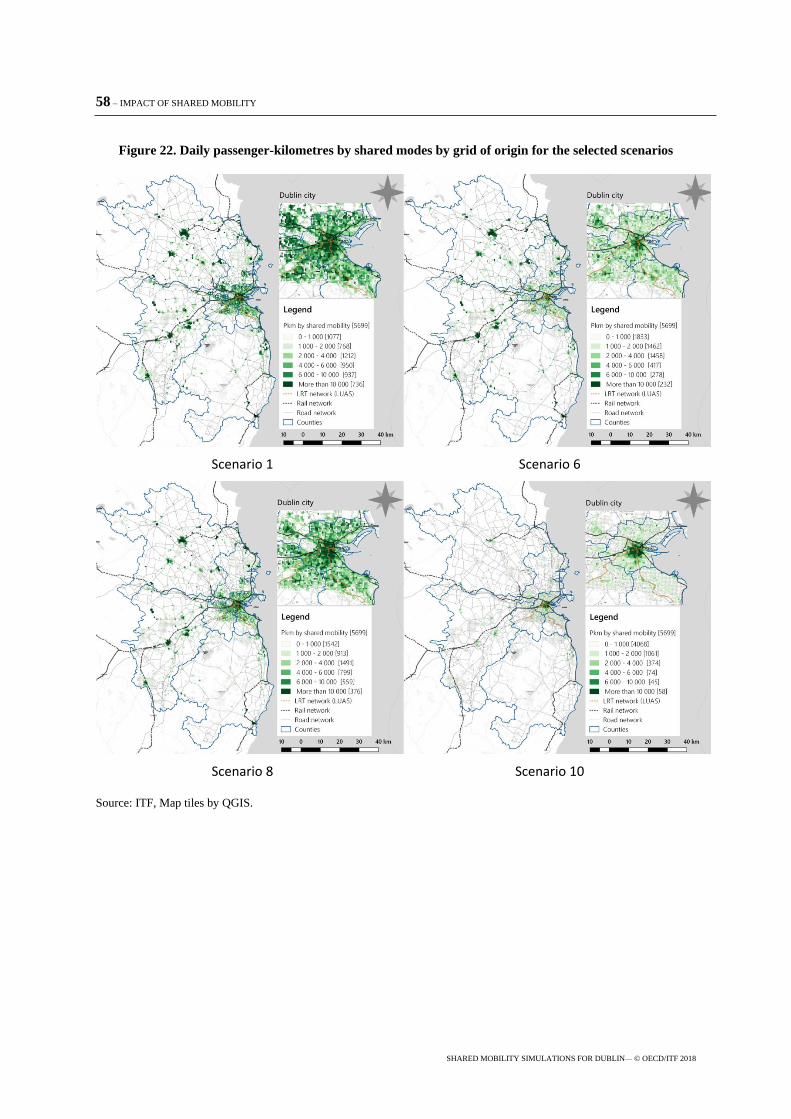
58 – IMPACT OF SHARED MOBILITY
SHARED MOBILITY SIMULATIONS FOR DUBLIN— © OECD/ITF 2018
Figure 22. Daily passenger-kilometres by shared modes by grid of origin for the selected scenarios
Scenario 1
Scenario 6
Scenario 8
Scenario 10
Source: ITF, Map tiles by QGIS.

IMPACT OF SHARED MOBILITY – 59
SHARED MOBILITY SIMULATIONS FOR DUBLIN — © OECD/ITF 2018
Figure 23. Daily passenger-kilometres by car by grid of origin for the selected scenarios
Scenario 6
Scenario 8
Scenario 10
Source: ITF, Map tiles by QGIS.
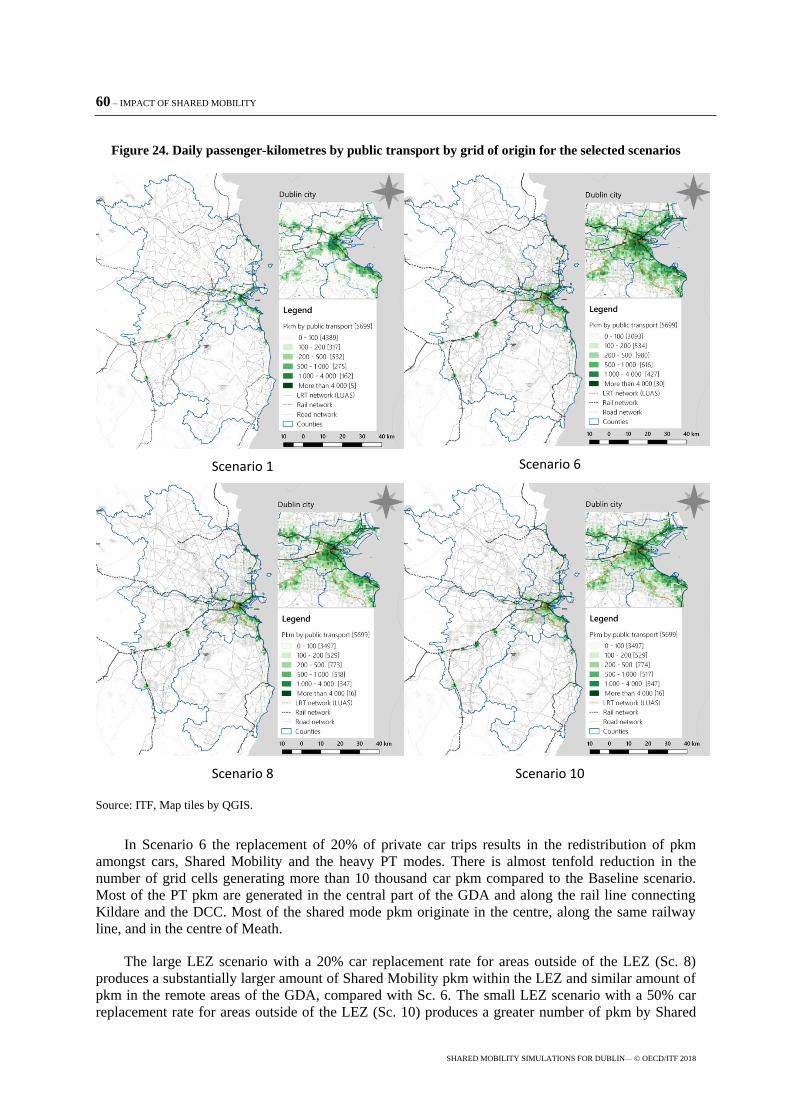
60 – IMPACT OF SHARED MOBILITY
SHARED MOBILITY SIMULATIONS FOR DUBLIN— © OECD/ITF 2018
Figure 24. Daily passenger-kilometres by public transport by grid of origin for the selected scenarios
Scenario 1
Scenario 6
Scenario 8
Scenario 10
Source: ITF, Map tiles by QGIS.
In Scenario 6 the replacement of 20% of private car trips results in the redistribution of pkm
amongst cars, Shared Mobility and the heavy PT modes. There is almost tenfold reduction in the
number of grid cells generating more than 10 thousand car pkm compared to the Baseline scenario.
Most of the PT pkm are generated in the central part of the GDA and along the rail line connecting
Kildare and the DCC. Most of the shared mode pkm originate in the centre, along the same railway
line, and in the centre of Meath.
The large LEZ scenario with a 20% car replacement rate for areas outside of the LEZ (Sc. 8)
produces a substantially larger amount of Shared Mobility pkm within the LEZ and similar amount of
pkm in the remote areas of the GDA, compared with Sc. 6. The small LEZ scenario with a 50% car
replacement rate for areas outside of the LEZ (Sc. 10) produces a greater number of pkm by Shared

IMPACT OF SHARED MOBILITY – 61
SHARED MOBILITY SIMULATIONS FOR DUBLIN — © OECD/ITF 2018
Mobility within the LEZ but less pkm by Shared Mobility than the other three scenarios. Private car
pkm reduce substantially within the LEZ boundaries of Sc. 8 and Sc. 10 compared with the Baseline
scenario since the only trips which generate car pkm within the LEZ are those that originate in the
LEZ and finish outside of it.
In all the scenarios, even those with small car replacement rates, the provision of Shared
Mobility feeder services increases the share of rail. Figure 25 and 26 show the PT ridership by
number of boardings at each PT stop or station in the study area for the Baseline and the selected
scenarios. In the full replacement scenario (Sc. 1) and scenario retaining the core bus network and
having a 20% car replacement rate (Sc. 6) the number of boardings at the central stations remains
similar to the Baseline while it increases the peripheral stations. Sc. 8 with the large LEZ leads to an
even larger increase in boardings in the periphery, while Sc. 10 with the small LEZ produces to
almost no change.
The growth increase in park and ride and PT ridership may lead to capacity issues at existing
parking facilities and stations and on rail services in some locations. Table 18 presents the spatial
distribution of boardings numbers on rail, bus and LRT (LUAS), for the Baseline scenario and for the
selected scenarios. In South Dublin the increase in rail ridership is greater than 100% in all scenarios.
In Dublin City the increase in Sc. 1, 6 and 8 is 150% or higher. In Meath and Fingal some substantial
increases can be observed, especially in the case of the full replacement (Sc. 1) and the case of the
large LEZ (Sc. 8). These results suggest that if Shared Mobility is introduced the capacity of the trains
along the corresponding rail lines and the capacity of the stations should be assessed and, probably,
increased in order to ensure that they can accommodate the predicted growth in ridership.
Figure 25. Ridership by number of boardings at each station for the Baseline scenario
Source: ITF, Map tiles by QGIS.

62 – IMPACT OF SHARED MOBILITY
SHARED MOBILITY SIMULATIONS FOR DUBLIN— © OECD/ITF 2018
Figure 26. Ridership by number of boardings at each station for the selected scenarios
Scenario 1
Scenario 6
Scenario 8
Scenario 10
Source: ITF, Map tiles by QGIS.
Analysis of the increase in the parking demand reveals similar issues. Table 19 presents the
access mode shares to PT by area. Currently the access is performed almost 100% by walking. Access
by car does not reach 1% of the public transport boardings in any of the GDA areas (it is 0.1% to
0.5%) The share of access by walking decreases as the users switch to shared modes for access to rail
stations, especially in Sc. 1 and Sc. 8. In the case of Sc. 8, with the large LEZ, a substantial part of
trips are performed partly by private car and partly by PT. In Wicklow and South Dublin the largest
shares of the PT users continue walking to access the PT stations. For the areas and scenarios where
the share of the access by car and Shared Mobility is quite high, sufficient number of space for
dropping off passengers near the PT stations should be ensured.

IMPACT OF SHARED MOBILITY – 63
SHARED MOBILITY SIMULATIONS FOR DUBLIN — © OECD/ITF 2018
Table 18. Ridership by number of boardings on rail, bus and LRT (LUAS) by area, Baseline and selected scenarios compared with Baseline
Area Baseline (pax, thousands) Scenario 1 (variation %) Scenario 6 (variation %) Scenario 8 (variation %) Scenario 10 (variation %)
Rail Bus LRT Rail Bus LRT Rail Bus LRT Rail Bus LRT Rail Bus LRT
Dublin City 92.4 225.7 25.9 74 -100 -54 49 -71 -15 66 -100 -22 27 -100 -22
South Dublin 1.8 54.3 11.1 246 -100 -56 168 -85 -17 197 -100 -21 108 -100 -21
Fingal 40.0 56.3 0.0 88 -100 0 53 -87 0 127 -100 0 28 -100 0
Dún Laoghaire-Rathdown 38.5 49.8 13.1 62 -100 -75 36 -74 -23 72 -100 -32 15 -100 -32
Meath County 2.2 11.8 0.0 91 -100 0 88 -96 0 85 -100 0 26 -100 0
Kildare County 14.7 16.9 0.0 43 -100 0 46 -97 0 46 -100 0 20 -100 0
Wicklow County 9.6 24.4 0.0 -49 -100 0 -21 -87 0 -22 -100 0 -27 -100 0
Total / Average 199.1 439.2 50.1 84 -100 -59 57 -77 -17 82 -100 -11 28 -100 -11
Table 19. Access mode shares to public transport by area (%), Baseline and selected scenarios
Area Baseline (access %) Scenario 1 (access %) Scenario 6 (access %) Scenario 8 (access %) Scenario 10 (access %)
Walking Car SM Walking Car SM Walking Car SM Walking Car SM Walking Car SM
Dublin City 100 0 0 33 0 67 71 0 29 53 4 44 67 1 33
South Dublin 100 0 0 22 0 22 84 0 16 72 0 28 81 0 19
Fingal 100 0 0 13 0 55 53 0 47 31 25 44 55 0 45
Dún Laoghaire-Rathdown 100 0 0 22 0 32 75 0 25 56 7 38 78 0 22
Meath County 100 0 0 16 0 73 41 0 59 35 0 65 52 0 48
Kildare County 100 0 0 15 0 53 45 0 55 43 0 57 53 0 47
Wicklow County 100 0 0 24 0 11 90 0 10 87 0 13 93 0 7
Average 100 0 0 26 0 55 69 0 31 54 5 41 68 0 32

SHARED MOBILITY SIMULATIONS FOR DUBLIN — © OECD/ITF 2018
Quality of service
The detailed analysis of the scenarios shows that Shared Mobility can provide quite a high level of
service to users even with the inclusion of waiting and detour time. Table 20 presents the statistical
distribution of waiting time for shared modes by distance band for each of the tested scenarios. In all the
scenarios tested the Shared Taxi delivers a very good performance across all the distance bands with less
than 25% of the customers waiting more than three minutes. The Taxi-Bus delivers inferior performance
across the indicators reported. As the table displays, the average waiting time for the 75th percentile is
15-16 minutes for all the scenarios. However, the indicator for Taxi-Bus does not represent a waiting
time at the stop but a time deviation from the reported intended boarding time. Even if the boarding time
is delayed 10-15 minutes, the user is notified and can start walking to the Taxi-Bus stop later.
Table 20. Statistical distribution of waiting time (min) by travel distance class and scenario
Mode
Scenario 1 Scenario 6 Scenario 8 Scenario 10
Travel distance
(km)
25th
perc. Median
75th
perc.
25th
perc. Median
75th
perc.
25th
perc. Median
75th
perc.
25th
perc. Median
75th
perc.
Shared
Taxi
< 2 km 1 1 2 1 1 2 1 1 2 1 1 2
[ 2, 5 ] km 1 1 2 1 1 2 1 1 2 1 1 2
[ 5, 10 ] km 1 2 3 1 2 3 1 2 3 1 2 3
>10 km 1 2 3 1 2 3 1 2 3 1 2 3
Average 1 1 2 1 2 3 1 1 2 1 1 2
Taxi-Bus
< 2 km 2 4 9 2 5 9 2 4 9 2 5 10
[ 2, 5 ] km 5 10 15 5 11 15 5 11 15 6 12 17
[ 5, 10 ] km 8 13 16 8 13 16 9 13 17 7 13 16
>10 km 8 13 17 9 14 17 10 14 18 9 14 17
Average 6 11 15 7 12 16 7 12 16 6 12 16
Another key indicator of Shared Mobility performance is the total detour time which is the average
time spent picking up and dropping off other passengers along the way (Table 21). It is calculated as the
sum of waiting time at each stop and the additional travel time for a journey compared to that of a private
car travelling directly. A constraint on total detour time is set in the dispatch algorithm for the shared
services. This constraint varies as a function of the travel distance.
In the case of Shared Taxi, the results show that for trips longer than 10 km the deviation from the
private car on-board time can exceed 10 minutes. In the case of the small LEZ scenario (Sc. 10) the
indicator has smaller values since the density of trips is quite high in the centre and it is easier to match
the rides. The scenario with a 20% car replacement rate (Sc. 6) is the one which leads to the longest
average detours, since the probability of ride-matching is smaller in this scenario.
In the case of Taxi-Bus the detours time are significantly higher but they comply with the constraint
of maintaining a commercial speed of 15 km/h for each individual trips. In all four scenarios detour
delays exceed 35 minutes for 25% for long trips when compared with direct travel by private car. This
can mean in some cases doubling current private car travel time, but still outperforming greatly the
current public transport options in very remote areas for long trips. The average value for the 75th
percentile is between 22 and 26 minutes, depending on a scenario. It indicates that in 25% of the cases a
client might be delayed by 22 minutes or more when compared with the travel by private car. This value
is larger for the case with a lower Shared Mobility adoption rate (Sc. 6).
64 – IMPACT OF SHARED MOBILITY

IMPACT OF SHARED MOBILITY – 65
SHARED MOBILITY SIMULATIONS FOR DUBLIN — © OECD/ITF 2018
Table 21. Statistical distribution of detour time (min) by travel distance class and scenario
Mode
Scenario 1 Scenario 6 Scenario 8 Scenario 10
Travel distance
(km)
25th
perc. Median
75th
perc.
25th
perc. Median
75th
perc.
25th
perc. Median
75th
perc.
25th
perc. Median
75th
perc.
Shared
Taxi
< 2 km 1 2 2 1 2 2 1 2 2 1 2 2
[ 2, 5 ] km 2 2 3 2 2 3 2 2 3 2 2 3
[ 5, 10 ] km 3 4 5 3 4 6 3 4 6 3 4 5
>10 km 6 9 13 7 11 16 7 10 14 5 7 10
Average 4 5 7 6 9 13 4 5 8 3 4 5
Taxi-Bus
< 2 km 3 6 11 3 6 11 3 6 10 4 7 12
[ 2, 5 ] km 7 13 19 8 14 19 8 14 20 8 15 20
[ 5, 10 ] km 15 20 25 15 20 25 15 21 26 14 20 25
>10 km 22 29 36 24 31 39 23 30 37 24 31 39
Average 11 17 22 14 20 26 13 19 25 11 17 23
Table 22 displays spatial detours of the Shared Mobility services under different scenarios. A spatial
detour is the ratio of the in-vehicle travel distance by a shared mode to the in-vehicle distance for the
same trip performed by private car, along the shortest path. In-vehicle distance by a Taxi-Bus can be
shorter than the corresponding in-vehicle distance by car since there the access distance to stops is not
included, but can be longer due to the extent of detours. If these two differences are approximately equal,
they cancel each other and the result spatial detour ratio is equal to 1. In the case of Shared Taxi it is
equal to 1 when the path is identical to that taken by a private car and will increase as detour distance
increases.
In the case of Shared Taxi the spatial detour ratios are very low in all scenarios. These results are a
consequence of the service design requirements and the high standards set by the model constraints. The
obtained values for different distance ranges show that the larger detour ratios happen for distances
between 2 and 5 kilometres. This is due to the model design whereby long trips that reached the
maximum allowed detour time are dispatched to the direct services to meet the model constraints
representing the desired level of service hence reducing the detour time to zero.
Table 22. Statistical distribution of spatial detour ratio by travel distance class and scenario
Mode
Scenario 1 Scenario 6 Scenario 8 Scenario 10
Travel distance
(km)
25th
perc. Median
75th
perc.
25th
perc. Median
75th
perc.
25th
perc. Median
75th
perc.
25th
perc. Median
75th
perc.
Shared
Taxi
< 2 km 1.0 1.0 1.0 1.0 1.0 1.0 1.0 1.0 1.1 1.0 1.0 1.1
[ 2, 5 ] km 1.0 1.0 1.3 1.0 1.0 1.3 1.0 1.0 1.4 1.0 1.0 1.3
[ 5, 10 ] km 1.0 1.0 1.2 1.0 1.0 1.2 1.0 1.0 1.3 1.0 1.0 1.2
>10 km 1.0 1.0 1.0 1.0 1.0 1.0 1.0 1.0 1.0 1.0 1.0 1.0
Average 1.0 1.0 1.1 1.0 1.0 1.1 1.0 1.0 1.2 1.0 1.0 1.2
Taxi-Bus
< 2 km 1.0 1.2 1.6 1.0 1.2 1.6 1.0 1.2 1.7 1.0 1.3 1.7
[ 2, 5 ] km 1.0 1.1 1.5 1.0 1.1 1.5 1.0 1.2 1.5 1.0 1.2 1.5
[ 5, 10 ] km 1.0 1.1 1.5 1.0 1.1 1.5 1.0 1.1 1.4 1.0 1.1 1.4
>10 km 1.0 1.1 1.3 1.0 1.1 1.3 1.0 1.0 1.2 1.0 1.0 1.2
Average 1.0 1.1 1.5 1.0 1.1 1.5 1.0 1.1 1.4 1.0 1.1 1.4

66 – IMPACT OF SHARED MOBILITY
SHARED MOBILITY SIMULATIONS FOR DUBLIN— © OECD/ITF 2018
The Taxi-Bus mode also achieves good spatial performance, which is stable across all the scenarios.
The obtained values indicate a 50% increase in the travel distance over direct and shortest path trips.
The values of the quality of service indicators in this sub-section are smaller for the scenarios with
larger adoption rates of Shared Mobility. This reinforces the importance of the market scale in ensuring a
good quality of service at affordable prices.
Congestion
This sub-section presents analysis of the congestion levels at the level of the road network links.
For most of the links in all four scenarios (Sc. 1, 6, 8, 10) the congestion level reduces compared to the
Baseline scenario, as can be seen by comparing Figures 27- 30 with Figure 12. There is a sharp decrease
in congestion in the central part of the GDA in the full replacement scenario (Sc. 1) and in the LEZ
scenarios (Sc. 8 and Sc. 10). Some of congested sections of the main arteries that connect Kildare with
the DCC experience a reduction in congestion in scenarios other than Sc. 10 with the small LEZ.
In the LEZ scenarios congestion within the boundaries of the LEZs decreases substantially.
However, it increases on few sections, which are mainly used to access Shared Mobility depot stations or
heavy public transport stops. These capacity constrains should be mitigated with a proper local
circulation plan for the areas near the depots, ensuring the smooth movement of vehicles in the
surrounding area, and by providing several access points between the depot and the road network to
distribute the traffic.
Parking requirements
Introduction of Shared Mobility on a large scale requires depots for the empty vehicles waiting for
their assignment. Additionally, in the case of the scenarios with LEZ (Sc. 8 and Sc. 10), park and ride
leads to the concentration of vehicles at the LEZ borders and, therefore, creates the need for additional
parking space around the border. This sub-section sheds light on the capacity requirements for the Shared
Mobility depots and for the parking stations around the LEZ borders. As expected, in the scenarios with
higher rates of adoption of the shared modes, the depot capacity requirements are much higher
(Figure 32). The small LEZ (Sc. 10) has the lowest requirements in terms of depots capacity, with large
depots concentrated within the LEZ boundaries.
In both scenarios with LEZ there are stations which require significant parking capacity for cars
bringing travellers to the border of the LEZ. In the large LEZ scenario (Sc. 8) there are four park and ride
stations, on the northern part of the LEZ boundary, which require more than eighty parking places each.
In the case of the small LEZ (Sc. 10), one station on the north-eastern edge of the boundary requires
192 parking places followed by a station on the southern edge and a station on the north-western edge,
requiring 101 and 66 places respectively.
Table 23 and Table 24 present the number of arrivals and departures at each park and ride station and the
corresponding requirements for the parking capacity. Figure 33 and Figure 34 display the LEZ
boundaries and the locations of the park and ride stations

IMPACT OF SHARED MOBILITY – 67
SHARED MOBILITY SIMULATIONS FOR DUBLIN — © OECD/ITF 2018
Figure 27. Congestion re each road network link (evening peak)
Baseline
Scenario 1 Scenario 6
Scenario 8 Scenario 10

68 – IMPACT OF SHARED MOBILITY
SHARED MOBILITY SIMULATIONS FOR DUBLIN— © OECD/ITF 2018
Figure 28. Distribution of depot stations in the GDA study area
Scenario 1 Scenario 6
Scenario 8 Scenario 10
Source: ITF, Map tiles by QGIS.

IMPACT OF SHARED MOBILITY – 69
SHARED MOBILITY SIMULATIONS FOR DUBLIN — © OECD/ITF 2018
Table 23. Park and ride stations, flow and capacity (Scenario 8)
Park and
ride stations
Arrivals Departures Required parking capacity
Car Taxi-
Bus
Shared
Taxi Car
Taxi-
Bus
Shared
Taxi Cars
Taxi-
Buses
Shared
Taxis
1 * 320 20 92 347 28 89 87 1 2
2 * 0 0 0 0 0 0 0 0 0
3 * 0 0 0 0 0 0 0 0 0
4 0 41 22 0 52 24 3 1 1
5 37 7 4 39 3 5 10 1 0
6 551 53 105 564 59 103 141 1 2
7 * 414 52 105 406 57 103 102 1 2
8 34 2 1 35 1 3 9 1 0
9 * 0 151 84 3 146 102 3 2 2
10 22 6 1 25 7 0 7 1 0
11 6 93 39 3 88 46 3 1 1
12 0 13 7 0 6 5 3 1 0
13 23 3 3 22 3 1 6 1 0
14 * 13 84 53 11 81 55 3 1 1
15 * 16 117 65 16 137 60 3 2 1
Note: The symbol * represent park and ride stations with integration with rail stations.
Figure 29. Park and ride stations (Scenario 8)
Source: ITF, Map tiles by QGIS.
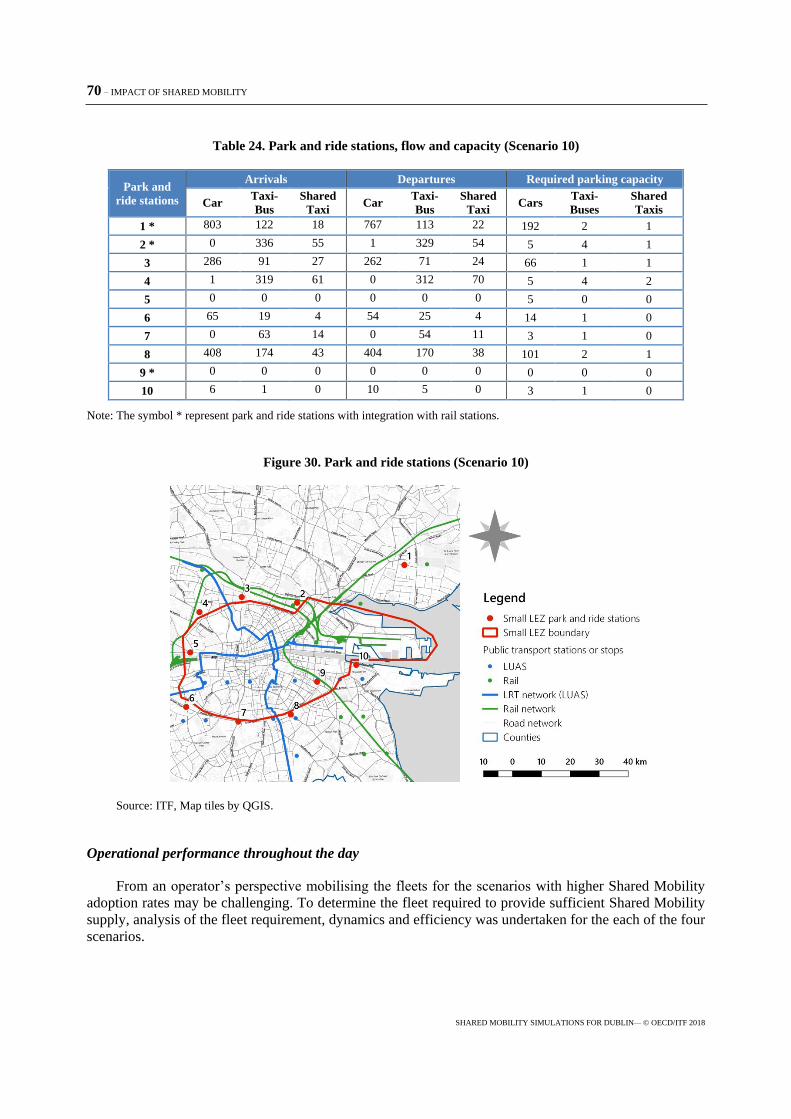
70 – IMPACT OF SHARED MOBILITY
SHARED MOBILITY SIMULATIONS FOR DUBLIN— © OECD/ITF 2018
Table 24. Park and ride stations, flow and capacity (Scenario 10)
Park and
ride stations
Arrivals Departures Required parking capacity
Car Taxi-
Bus
Shared
Taxi Car
Taxi-
Bus
Shared
Taxi Cars
Taxi-
Buses
Shared
Taxis
1 * 803 122 18 767 113 22 192 2 1
2 * 0 336 55 1 329 54 5 4 1
3 286 91 27 262 71 24 66 1 1
4 1 319 61 0 312 70 5 4 2
5 0 0 0 0 0 0 5 0 0
6 65 19 4 54 25 4 14 1 0
7 0 63 14 0 54 11 3 1 0
8 408 174 43 404 170 38 101 2 1
9 * 0 0 0 0 0 0 0 0 0
10 6 1 0 10 5 0 3 1 0
Note: The symbol * represent park and ride stations with integration with rail stations.
Figure 30. Park and ride stations (Scenario 10)
Source: ITF, Map tiles by QGIS.
Operational performance throughout the day
From an operator’s perspective mobilising the fleets for the scenarios with higher Shared Mobility
adoption rates may be challenging. To determine the fleet required to provide sufficient Shared Mobility
supply, analysis of the fleet requirement, dynamics and efficiency was undertaken for the each of the four
scenarios.
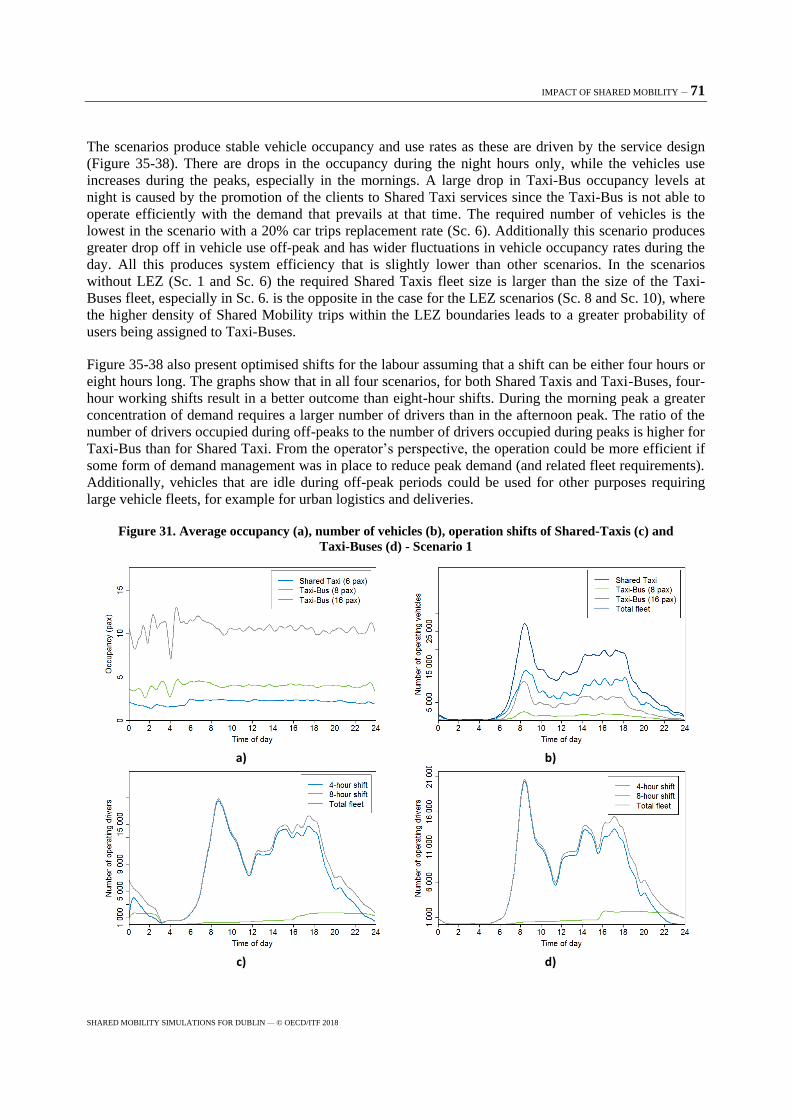
IMPACT OF SHARED MOBILITY – 71
SHARED MOBILITY SIMULATIONS FOR DUBLIN — © OECD/ITF 2018
The scenarios produce stable vehicle occupancy and use rates as these are driven by the service design
(Figure 35-38). There are drops in the occupancy during the night hours only, while the vehicles use
increases during the peaks, especially in the mornings. A large drop in Taxi-Bus occupancy levels at
night is caused by the promotion of the clients to Shared Taxi services since the Taxi-Bus is not able to
operate efficiently with the demand that prevails at that time. The required number of vehicles is the
lowest in the scenario with a 20% car trips replacement rate (Sc. 6). Additionally this scenario produces
greater drop off in vehicle use off-peak and has wider fluctuations in vehicle occupancy rates during the
day. All this produces system efficiency that is slightly lower than other scenarios. In the scenarios
without LEZ (Sc. 1 and Sc. 6) the required Shared Taxis fleet size is larger than the size of the Taxi-
Buses fleet, especially in Sc. 6. is the opposite in the case for the LEZ scenarios (Sc. 8 and Sc. 10), where
the higher density of Shared Mobility trips within the LEZ boundaries leads to a greater probability of
users being assigned to Taxi-Buses.
Figure 35-38 also present optimised shifts for the labour assuming that a shift can be either four hours or
eight hours long. The graphs show that in all four scenarios, for both Shared Taxis and Taxi-Buses, four-
hour working shifts result in a better outcome than eight-hour shifts. During the morning peak a greater
concentration of demand requires a larger number of drivers than in the afternoon peak. The ratio of the
number of drivers occupied during off-peaks to the number of drivers occupied during peaks is higher for
Taxi-Bus than for Shared Taxi. From the operator’s perspective, the operation could be more efficient if
some form of demand management was in place to reduce peak demand (and related fleet requirements).
Additionally, vehicles that are idle during off-peak periods could be used for other purposes requiring
large vehicle fleets, for example for urban logistics and deliveries.
Figure 31. Average occupancy (a), number of vehicles (b), operation shifts of Shared-Taxis (c) and
Taxi-Buses (d) - Scenario 1
a) b)
c) d)

72 – IMPACT OF SHARED MOBILITY
SHARED MOBILITY SIMULATIONS FOR DUBLIN— © OECD/ITF 2018
Figure 32. Average occupancy (a), number of vehicles (b), operation shifts of Shared-Taxis (c) and
Taxi-Buses (d) - Scenario 6
a)
b)
c)
d)

IMPACT OF SHARED MOBILITY – 73
SHARED MOBILITY SIMULATIONS FOR DUBLIN — © OECD/ITF 2018
Figure 33. Average occupancy (a), number of vehicles (b), operation shifts of Shared-Taxis (c) and
Taxi-Buses (d) - Scenario 8
a) b)
a) a)

74 – IMPACT OF SHARED MOBILITY
SHARED MOBILITY SIMULATIONS FOR DUBLIN— © OECD/ITF 2018
Figure 34. Average occupancy (a), number of vehicles (b), operation shifts of Shared-Taxis (c) and Taxi-
Buses (d) - Scenario 10
a)
b)
a)
a)
The model also estimates the number of vehicles that are idle at any moment of the day (Figure 39).
Generally, an increase in vehicle-kilometres of TNC and taxis services is reported in some contexts
(Rayle et al., 2016) due to the large amount of idle distances driven by vehicles searching for new clients,
reducing the benefits for the mobility system in terms of CO2 emissions and congestion. The ITF model
by design does not allow such movements and the vehicles are always diverted into a depot when idle,
minimising idle vehicle-kilometres and minimising the need for the road and parking capacity. The idle
kilometres performed by drivers increases significantly only at night hours, especially in the large LEZ
(Sc. 8). The small LEZ (Sc. 10) leads to more empty kilometres on average across the day.

IMPACT OF SHARED MOBILITY – 75
SHARED MOBILITY SIMULATIONS FOR DUBLIN — © OECD/ITF 2018
Figure 35. Share of empty kilometres for Shared Mobility services in four scenarios
Costs
The price per kilometre for both Shared Taxi and Taxi-Bus users is lower than that of current taxi
users; and using Taxi-Bus is cheaper than using PT (Table 25). The price of the shared modes is
calculated taking into account all costs associated with the vehicles (acquisition/capital, maintenance and
operation) and the drivers (salary and social charges), plus management costs and margin for profit (a
20% margin of labour and vehicles costs). Forms of procurement whereby the local authorities do not
supply these services directly may have different cost structures and may require different regulatory
frameworks. This can potentially be used to leverage more competitive prices for the end user. The
calculations do not include any public service subvention to support public transport operators. Public
Service Subvention level vary between 20 and 60% of the public transport operator’s revenues across
urban areas globally (Roth and Kåberger, 2002; Tscharaktschiew and Hirte, 2012). Annex 6 presents the
values used in the costs calculations.
Table 25 shows that the price of Shared Taxi is around half that of conventional taxi and is around
1.5-2 times higher than the current PT fares. The Taxi-Bus ticket price is around 19% of the cost of a
conventional taxi and is around half that of the current PT cost. It is remarkable that the Taxi-Bus
services can be offered to the potential users at half the price of PT, taking into account that in the focus
group discussion and in the stated preferences survey PT users showed some willingness to pay more for
these new services than for PT and the cost was pointed as one of the most relevant elements for the
Shared Mobility adoption. This means that some of the users might even be attracted to Shared Taxis.
Shared Taxis, in turn, can be offered at half the cost of the conventional taxi services.
There are economies of scale in the offer of these services. Scenario 1, where all car drivers and bus
users switch to Shared Mobility is the one that leads to the most affordable Shared Taxi services.
Scenario 10 with the small LEZ produces to the highest fares. In the case of Taxi-Bus the calculated fares
remain stable across all the scenarios.

76 – IMPACT OF SHARED MOBILITY
SHARED MOBILITY SIMULATIONS FOR DUBLIN— © OECD/ITF 2018
Table 25. Prices of Shared Taxi and Taxi-Bus services (EUR/km) as percentage of current taxi and public
transport fares
Scenarios Shared Taxi Taxi-Bus
Average taxi trip PT cost for user Average taxi trip PT cost for user
1 58 148 19 49
6 56 144 19 48
8 60 154 18 46
10 79 202 19 49
In Figure 40 and Table 26 the price of using Shared Taxi is compared with the costs of owning a car
(excluding parking costs). The comparison is made per km of use per day. Different car types are
considered, from an inexpensive second-hand car that costs EUR 5 000 to the most expensive segment
that costs EUR 50 000. A second hand car would lead to lower costs compared with Shared Taxi, unless
it is used for less than approximately 5 km per day. For the more expensive cars this distance is 29 km
for the small LEZ scenario (Sc. 6) and around 40 km for the rest of the scenarios.
Figure 36. Total commuting cost per day and km of car ownership vs Shared Taxi (Scenario 1)
Table 26. Break even for commuting distances (km) required for car to be less expensive than Shared Taxis
Scenarios Second-hand car,
EUR 5 000
New car,
EUR 15 000
New car,
EUR 30 000
New car,
EUR 50 000
1 4 12 24 40
6 4 13 25 42
8 4 12 23 39
10 3 9 17 29
Electric vehicles fleet
The simulation also tested the impact of the adoption of a fleet of electric vehicles. We assumed an
electric fleet with a conservative range of 150 kilometres, four hours fast charging to 100%, two hours
fast charging to 75% and that no vehicle starts operation with less than 75% charging level. The electric
0.00
5.00
10.00
15.00
20.00
25.00
30.00
35.00
40.00
45.00
0 10 20 30 40 50 60
Eur
os/d
ay
Kms/day
New car, EUR 15 000
New car, EUR 30 000
New car, EUR 50 000
Second-hand car, EUR 5 000
Shared Taxi

IMPACT OF SHARED MOBILITY – 77
SHARED MOBILITY SIMULATIONS FOR DUBLIN — © OECD/ITF 2018
vehicles’ range, charging times and charging stations are all taken into account. The four tested scenarios
show that the required fleet would need to be increased between 9.0% and 19.4% to allow short- and
long-term charging operations.
Table 27. Number of additional electric vehicles required compared with combustion engine vehicles (%)
Scenarios Shared Taxis Taxi-Bus Total
1 19.7 16.1 17.2
6 23.1 17.6 19.4
8 14.2 8.1 9.8
10 8.9 9.2 9.0
It is notable that the fleet requirement increases significantly compared with the previous studies for
Auckland, Helsinki and Lisbon. The main reason of that is the size of the study area, which goes beyond
the metropolitan scale of previous studies to a whole region with larger distances between many
origin-destination pairs. The scenarios with LEZ, where travel by the shared modes is mostly generated
in a specific area (Sc. 8, 10), produce lower additional fleet requirements, even though the Shared
Mobility services are available throughout the GDA. Scenario 6, where Shared Mobility is present in the
whole GDA and the car trip replacement rate is low, produces the most negative result. The reason for
this is that in scenarios with smaller Shared Mobility adoption rates trips by the shared modes tend to be
longer, which makes it more difficult to comply with the maximum range constraints of electric vehicles.
Additionally, the smaller market share of Shared Mobility leads to lower density of the trips and,
therefore, reduces the probability of having charged vehicles nearby.
The larger fleet size has an impact on the cost of service provision. While the average cost per km
of Shared Mobility operation drops from EUR 0.11 to EUR 0.03, the larger fleets required and the higher
acquisition costs of electric vehicles alleviate almost all the energy price gains. The overall cost for
Scenario 1 with electric vehicles drop from EUR 1.79 to EUR 1.71 per km, but some additional
kilometres are required due to the repositioning of charged vehicles leading to almost negligible savings.
This result is different from other cities studied as mentioned above, showing a need for more careful
implementation of Shared Mobility with electric fleets for regional services, unless the vehicles
maximum range increase due to technological improvements.
The integration of the charging outlets and the parking depots requires changes in the proposed
infrastructure. Table 28 and Figure 41 characterise the charging and parking requirements for Scenario 1.
The values show that less than one-third of the parking spaces need to have charging infrastructure.
Additional employees are required at depot stations to move vehicles from charging locations to simple
parking space while vehicles are waiting to be picked up by a driver or waiting to be charged.
The spatial distribution of the required parking capacity is similar to the population density and pkm
generation spatial distributions while the percentage of parking spaces with electric charging outlets
varies significantly (Figure 40). Since the study area is of a regional size and the average trip distances
are relatively long, the vehicles need to be re-charged more than once per day. That is, charging just once
at night is not enough. Yet, the requirements for parking are even higher due the very large fleet size,
implied by the use of electric vehicles since the vehicles during off-peaks need to stay parked and
charging for a period of the day loosing potential operation hours. Therefore, in the case of the electric
vehicles, the parked vehicles include those which are idle due to low demand (during the off-peak hours)
and those which are charging. The share of the parking spaces with electric charging outlets for most of
the parking stations is relatively low. The parking stations with the largest share of charging outlets are in
the DCC, on the north-east of the GDA, and along the train line connecting the DCC and Kildare. Those

78 – IMPACT OF SHARED MOBILITY
SHARED MOBILITY SIMULATIONS FOR DUBLIN— © OECD/ITF 2018
are among the areas generating most of the pkm by shared modes (Figure 22) and having most of the
traffic (Figure 27).
Table 28. Characterisation of charging and parking requirements with electric vehicles (Scenario 1)
Variable Value
Maximum station charging outlets capacity 60
Minimum station charging outlets capacity 3
Average station charging outlets capacity 6.37
Total charging capacity 2 435
Charging operations 26 199
Charging time (hours) 13 100
Minimum charging outlets use rate (%) 0.54
Maximum charging outlets use rate (%) 78.71
Average charging outlets use rate (%) 16.53
Parking capacity total 22 389
Minimum parking capacity per station 25
Maximum parking capacity per station 501
Average parking capacity per station 58.61
Figure 37. Share of charging outlets at the parking spaces (Scenario 1)
Source: ITF, Map tiles by QGIS.
IMPACT OF SHARED MOBILITY – 79
SHARED MOBILITY SIMULATIONS FOR DUBLIN — © OECD/ITF 2018
Impacts of Shared Mobility key findings
Summing up, this section presented the key findings regarding the Shared Mobility impacts on
transportation system performance in the GDA, obtained from the simulation results.
Shared mobility can bring substantial benefits to the city and its transport system in terms of
reduced congestion and CO2 emissions. The congestion reduction is strongly positively coupled with the
share of car users who shift to the shared and PT modes, while the reduction in CO2 emissions also
depends on the spatial distribution of the replaced trips. Scenarios with full replacement of car trips show
the best results in terms of CO2 emissions and congestion reduction, followed by scenario with 50% car
replacement rate and scenarios with the large LEZ.
Shared mobility leads to increased levels of accessibility and connectivity and provides more even
distribution of them across the residents of the area (spatial and social equity). The introduction of the
shared modes and their combination with the existing heavy PT modes increases the connectivity by PT
substantially, especially for those residents who are currently relatively poorly served. At the same time,
the combination of the rail and LRT systems with the shared modes provides service for the former car
users with relatively small increase in overall journey time due to waiting and detour time while
increasing their flexibility (e.g. freeing users from driving and from maintaining a vehicle for their daily
travel).
The scenario which preserved the conventional bus mode and had full replacement of car trips
produces similar results in terms of CO2 emissions and congestion reduction as the scenario in which
both bus and car trips are fully replaced. However, this scenario has lower performance in terms of
connectivity indicators, since some of the preserved trips by bus include transfers and long waiting and
access times. Keeping only the core bus network and fully replacing the car trips gives almost equal
results in terms of CO2 emissions and congestion reduction as the scenario with all the buses preserved,
and, at the same time, results in better connectivity indicators for users.
Shared mobility has the potential to increase ridership by rail. However, as all the scenarios showed,
it might reduce the use of the LRT (LUAS) system if there are no shared mode feeder services to the
LRT stations. Using Shared Mobility as a feeder, on the other hand, might require infrastructure
investments to increase the capacity of the current rail and LRT systems and their stations. Station layout
may need adaption to provide easier access and to ensure sufficient space for vehicles picking-up and
dropping-off passengers.
The results of the operational performance analysis show that the number of required Taxi-Buses
with eight seats is much lower than the number of Taxi-Buses with 16 seats and Shared Taxis. This
suggests that fewer vehicle types may be required to supply the shared services in the GDA, which might
lead to more optimal allocation of vehicles. The use of four-hour shifts for labour results in better
outcomes for the operators as well reduces the costs. During off-peaks, especially at night, there are
many idle vehicles, which could be used for other purposes requiring large vehicle fleets, such as urban
logistics and deliveries.
Introduction of a small operational area for Shared Mobility solutions, such as the smaller LEZ,
reduces the gains for the transport system in terms of CO2 emissions and congestion reduction and leads
to less evenly distributed services across the residents of the different areas. The probability of matching
for short trips and for a small number of users is lower, and this reduces the efficiency of the proposed
solutions, as observed in the small LEZ scenario. Furthermore, it also implies higher Shared Taxi fares
for the users. However, this scenario is very beneficial in terms of connectivity indicators, which, on

80 – IMPACT OF SHARED MOBILITY
SHARED MOBILITY SIMULATIONS FOR DUBLIN— © OECD/ITF 2018
average, improve substantially for the current PT users and decrease marginally for the current car users
due to the congestion reduction in the centre of the area.
The affordability of Shared Taxi service is driven by the scale of adoption. Low adoption rates lead
to a decrease in the vehicle usage efficiency. In the case of Taxi-Bus the variation in the scale of Shared
Mobility adoption across the scenarios has marginal impact on the costs. Given that the local authorities
would provide the shared services, Taxi-Bus service can be offered at a half price of the current PT use,
and Shared Taxi at a half of the conventional taxi fare.
The tested scenarios showed that the use of an all-electric vehicle fleet for provision of the Shared
Mobility services on a regional level requires up to 19% increase in fleet size. The larger fleet size, in
turn, mitigates the cost reduction benefits which can be gained due to low energy costs.
KEY FINDINGS AND FURTHER RESEARCH – 81
SHARED MOBILITY SIMULATIONS FOR DUBLIN — © OECD/ITF 2018
Key findings and further research
This is the first ITF study analysing the impact of the introduction of Shared Mobility on a regional
level. Besides having a very large scale, the Greater Dublin Area shows strong presence of
non-motorised modes (with around 30% mode share of walking and cycling) and relatively sparse public
transport network, compared to previous studies. The results of this study suggest that although the
implementation of Shared Mobility on a regional scale is more challenging, Shared Mobility can deliver
significant positive impacts to the GDA transport system and its citizens. All the tested scenarios lead to
reductions in CO2 emissions of up to one-third and in congestion levels of up to 40%. The gains become
more significant when implemented in the whole study area, even at lower car replacement rates. In fact,
better average connectivity indicators can be achieved in the scenarios with lower levels of car user
replacement due to the reduction in congestion on the one hand, and still high share of trips by private
car on the other hand. For all the scenarios the model also shows increases in accessibility with a more
even distribution of the accessibility indicators across the area. Full replacement of motorised trips in the
area can lead to reduction of the total car fleet of more than 97%. Replacing 20% of private car trips with
shared modes would still result in 23% reduction in vehicle kilometres and 22% in emissions while
impact on congestion would be less (-7%).
The new shared services should be implemented bearing in mind the spatial characteristics of the
region and distribution of the trips. The larger size of the GDA area (compared with a metropolitan area)
and the low demand density of the region leads to insufficient demand for Taxi-Buses. This means that in
the GDA an efficient Shared Mobility service could be delivered using a single type of a vehicle, in
terms of size. The quality of service could be still differentiated depending on the distance required to
walk to and from bus stops, as it is in the case of the proposed Shared Taxi and Taxi-Bus modes.
The new shared modes can be very competitive in terms of fares. The price at which Taxi-Bus and
Shared Taxi can be offered could be half that of the current PT fare and conventional taxi fare
respectively. The results also suggest that the price of using Shared Taxi could be lower than owning and
driving a private car if the trips by private car are short enough. In this study we tested only a single
pricing scheme with one operator; however, a split into regional and urban levels might lead to greater
cost-efficiency. The regional scale of operations also opens opportunities to engage the local authorities
in partnerships with third parties for procurement, maintenance and operations management, which can
potentially provide even more competitive prices for the end users. These partnerships might include new
mobility services providers, vehicle manufacturers or even other public transport operators. In addition,
fleets of substantial dimension can ensure necessary economy of scale for massive adoption of emerging
technologies such as electric powered and/or driverless vehicles. However, as the study shows, the
integration of Shared Mobility services with electric vehicles is challenging on a regional level, given
currently available technologies with relatively small driving ranges.
The study showed that the shared modes can be well integrated into the existing PT network.
Keeping the bus core network and implementing the proposed BRT lines, which covers significant part
of the bus demand, gives good results in terms of both CO2 emissions and congestion reduction and
average level of service for the users. Therefore, Taxi-Bus should cooperate with the existing bus system
instead of replacing it. The proposed BRT lines can enhance these results.

82 – KEY FINDINGS AND FURTHER RESEARCH
SHARED MOBILITY SIMULATIONS FOR DUBLIN— © OECD/ITF 2018
The feeder services that were tested for the GDA only considered the potential interaction of Shared
Mobility with rail. The results show that the potential of this interaction in the case of Dublin is smaller
than in the cities where the same model was tested (Lisbon, Helsinki and Auckland). The main reason
behind that is the smaller size of the rail network and its spatial coverage when compared with the other
urban contexts with larger networks and more diverse heavy public transport (rail, metro, BRT or ferry).
Additional system capacity may be required for some heavy-rail stations to accommodate the increased
ridership without compromising the current service quality.
If the shared modes do not feed the LRT, the LRT may lose some clients. To avoid this, Shared
Mobility feeder services could also be integrated with the LRT. The system may not be implemented in
all stations due to spatial constraints at the station and spatial layout that would allow a simple and safe
integration of Shared Mobility with the public transport supply without reserved Right of Way (ROW).
Therefore, some stations’ layouts may need to be redesigned so that the stations have good access for the
users of non-motorised modes, and also docking areas for shared vehicles to pick-up and drop-off
travellers efficiently and safely. Identifying and redesigning the LRT stations with good potential for the
Shared Mobility integration could significantly boost the savings in vkm and CO2 emissions for the
whole GDA.
The results from the focus group survey indicate that there is a reasonably high interest in using
Shared Mobility services with the potential to deliver 20% mode shift from car, as long as the quality of
services offered is high enough. Still, many users would need, at least in the beginning, to have their
private car available. The observed familiarity with digital technologies suggests that an app-based
system would not constitute barriers to the implementation and use of Shared Mobility.
The likelihood of achieving positive impacts in the region depends on the ability to attract car users
to the new types of transport solution. Policy measures, incentives, new services and information
campaigns should be targeted to ensure that potential early adopters and those with long trips currently
are attracted to these services. The focus group and the stated preference survey showed that price of the
shared services is the most important attribute that will impact the users’ mode choice. The focus group
and the stated preference survey revealed that the average durations of commuting and other common
trips, such as trips for shopping and social activities, are between fifteen minutes and half an hour. This is
consistent with the average travel times by motorised modes observed in the synthetic population
(generated in this study using the Irish National Household Travel Survey 2012, and the CSO Census
data), which is a little more than twenty minutes. These findings, in combination with the results of the
costs analysis, suggest that for most of the car users riding Shared Taxi will cost less than owning and
operating a car.
All tested scenarios show the significant potential of Shared Mobility services to reduce parking
requirements, especially on-street. This may change how the access to the kerb is perceived in the city
with its evolution from a parking location to a pick-up drop-off zone. An increase of space freed by the
release of on-street parking and decrease in congestion could lead to significant improvements in city
liveability. However, it should be kept in mind, that massive Shared Mobility introduction will require
some designated areas to serve as depots for the idle vehicles.
The introduction of Shared Mobility at the scale studied in this report implies changes to travel
behaviour and the overall transportation system that are hard to grasp in any single model or study. In
addition, there are impacts in other fields beyond transportation. The simulation provides a very detailed
analysis of several scenarios, but it does not take into account changes of the travel behaviour induced by
extensive adoption of these services or other disruption. Beyond transportation the introduction of Shared
Mobility can affect land use and real-estate value. The increase in accessibility for currently remote areas

KEY FINDINGS AND FURTHER RESEARCH – 83
SHARED MOBILITY SIMULATIONS FOR DUBLIN — © OECD/ITF 2018
can raise their commercial attractiveness and even foster urban sprawl. Estimation of such impacts and
the design of policies aimed at sprawl reduction are likely to be required.
Finally, there are issues related with whom and how the new services will be provided. The
necessary level of funding and unprecedented scale of deployment of these services might require a
collaborative effort that could involve public transport operators, ride services and taxis, vehicle
manufactures and other institutions.

84 – REFERENCES
SHARED MOBILITY SIMULATIONS FOR DUBLIN — © OECD/ITF 2018
References
Balcombe, R. (2004), The demand for public transport: a practical guide, TRL Limited.
Central Statistics Office of Ireland (2017), Census 2016 Summary Results – Part 2.
CSO (2011), Census Small Area Population Statistics (SAPS).
Dublin Bikes (2017), "Dublin Bikes Latest Figures", http://www.dublinbikes.ie/Magazine/Reports/Just-
Eat-dublinbikes-latest-figures.
Dublin City Council (2016), Canal Cordon Report.
Guest, G., E. Namey, J. Taylor, N. Eley and K. McKenna (2017), "Comparing focus groups and
individual interviews: findings from a randomized study", International Journal of Social Research
Methodology, pp. 1–16.
ITF (2018), "Shared Mobility Simulations for Lyon", International Transport Forum Policy Papers.
ITF (2017a), "Shared Mobility Simulations for Helsinki", International Transport Forum Policy Papers.
ITF (2017b), "Transition to Shared Mobility: How large cities can deliver inclusive transport services",
International Transport Forum Policy Papers, No 33, https://doi.org/10.1787/b1d47e43-en
ITF (2016), "Shared mobility: innovation for liveable cities", International Transport Forum Policy
Papers, No 21, https://doi.org/10.1787/24108871
Martínez, L.M. and J.M. Viegas (2013), "A new approach to modelling distance-decay functions for
accessibility assessment in transport studies", Journal of Transport Geography, Vol. 26/0, pp. 87–96,
https://doi.org/http://dx.doi.org/10.1016/j.jtrangeo.2012.08.018
Morikawa, T., M. Ben-Akiva and K. Yamada (1991), "Forecasting intercity rail ridership using revealed
preference and stated preference data", Transportation Research Record, Vol. 1328, pp. 30–35.
National Transport Authority (2016), Transport Strategy for the Greater Dublin Area 2016 – 2035.
Rayle, L., D. Dai, N. Chan, R. Cervero and S. Shaheen (2016), "Just a better taxi? A survey-based
comparison of taxis, transit, and ridesourcing services in San Francisco", Transport Policy, Vol. 45, pp.
168–178, https://doi.org/10.1016/j.tranpol.2015.10.004.
Transport for London (2014), "Travel in London", Report 7, pp. 1–236.
Wardman, M., P. Chintakayala, G. de Jong and D. Ferrer (2012), "European wide meta-analysis of
values of travel time", ITS, University of Leeds, Paper Prepared for EIB.

ANNEX 1 – 85
SHARED MOBILITY SIMULATIONS FOR DUBLIN — © OECD/ITF 2018
Annex 1. Example of a stated preference survey question

86 – ANNEX 2
SHARED MOBILITY SIMULATIONS FOR DUBLIN — © OECD/ITF 2018
Annex 2. Characteristics of the two groups of respondents
Table A1. Respondents’ distribution by age and residential location (%)
Residential location Age cohort
<=25 26 - 35 36 - 45 46 - 55 56 - 65 >65
Focus group
Close to the centre 7 7 7 0 0 7
Far from the centre (>10 km) 13 0 13 0 0 7
In the city centre 0 7 7 13 7 7
Panel respondents
Close to the centre 1 10 10 3 2 0
Far from the centre (>10 km) 2 9 13 10 10 6
In the city centre 0 7 6 4 5 2
Figure A2. Respondents’ occupation
Focus group Panel respondents
Figure A3. Number of respondents using smartphones and tablets
53%
20%
13%
7%
7%
57%
17%
5%
12%
9%
Full-time employee
Part-time employee
Student
Unemployed by choice
Unemployed
0% 10% 20% 30% 40% 50% 60% 70% 80% 90% 100%
Use/own a smartphone
Use/own a tablet
Use a smartphone/tablet to access real-time information (weather, news)
Use smartphone apps to request transport services (i.e. Uber, Lyft, Cabify, Taxi)

ANNEX 2 – 87
SHARED MOBILITY SIMULATIONS FOR DUBLIN — © OECD/ITF 2018
TableA2. Current mobility patterns of the survey respondents
Activity
Focus group Panel respondents
Average
number
of weekly
trips
Average
trip
duration
(min)
Most commonly
used modes
Average
number
of weekly
trips
Average
trip
duration
(min)
Most commonly
used modes
Travel to / from work or
place of study 10.6 27
Private car - driver
(38%), Cycling
(23%), Bus (15%)
5.1 27
Private car - driver
(23%), Bus (20%),
Walk (16%)
Travel to drop off / pick
up children at school or
childcare, if trip does
not include a place of
work or study
0.9 4 Private car - driver
(67%), Walk (33%) 1.6 5
Private car - driver
or passenger (42%),
Walk (33%)
Daily shopping
(e.g. supermarket) 2.9 12
Private car – driver
(50%), Walk (50%) 2.3 16
Private car - driver
(37%), Walk (33%)
Social activity
(e.g. visiting friends or
family)
4.5 30 Private car – driver
(46%), Bus (31%) 1.9 24
Private car - driver
(41%), Walk (28%),
Bus (10%)
Leisure activities
(e.g. sport) 5.2 14
Private car – driver
(58%), Walk (25%) 1.6 19
Walk (40%), Private
car - driver (39%),
Cycling (6%)
Personal matters
(e.g. doctor's
appointment)
0.4 12 Walk (40%) 1.0 13 Walk (52%), Private
car - driver (26%)
Other 2.9 33 Private car - driver
(67%), Walk (33%) 1.0 10
Walk (47%), Private
car - driver (24%),
Cycling (8%)
Table A3. Respondents’ profiles depending on the transport modes they use most (%)
User profile Age cohort
<=25 26 - 35 36 - 45 46 - 55 56 - 65 >65
Focus group
Regular car user 7 0 7 7 7 13
Regular bus user 7 0 13 7 0 0
Regular user of rail or/and ferry 0 0 7 0 0 0
Other (e.g. walking, cycling) 7 13 0 0 0 7
Panel respondents
Regular car user 0 12 18 8 10 3
Regular bus user 0 10 4 6 4 5
Regular user of rail or/and ferry 0 0 4 2 1 0
Other (e.g. walking, cycling) 3 4 3 1 2 0

88 – ANNEX 3
SHARED MOBILITY SIMULATIONS FOR DUBLIN — © OECD/ITF 2018
Annex 3. Attitudes towards the shared modes and their attributes of
the two groups of respondents
Figure A3. Attitudes of car users towards fare of Shared Mobility modes
Figure A4. Attitudes of bus and rail users towards fare of Shared Mobility modes
0%
5%
10%
15%
20%
25%
30%
35%
0 1 2 3 4 5 6 7 8 9 10
Focus group
Not willing to use the shared modes
Willingness to pay the daily cost of using a car
Willingness to pay half of the daily cost of using a car
0%
5%
10%
15%
20%
25%
30%
35%
0 1 2 3 4 5 6 7 8 9 10
Panel respondents
Not willing to use the shared modes
Willingness to pay the daily cost of using a car
Willingness to pay half of the daily cost of using a car
0%
10%
20%
30%
40%
50%
60%
70%
0 1 2 3 4 5 6 7 8 9 10
Focus group
Not willing to pay
Willingness to pay the double price
Willingness to pay the current price
0%
10%
20%
30%
40%
50%
60%
70%
0 1 2 3 4 5 6 7 8 9 10
Panel respondents
Not willing to pay
Willingness to pay the double price
Willingness to pay the current price

ANNEX 3 – 89
SHARED MOBILITY SIMULATIONS FOR DUBLIN — © OECD/ITF 2018
Figure A5. Attitudes of car users towards accessibility/walking time to stop
Figure A6. Attitudes of bus and rail users towards accessibility/walking time to stop
Figure A7. Attitudes of car users towards lost time with Shared Mobility modes
0%
5%
10%
15%
20%
25%
30%
35%
0 1 2 3 4 5 6 7 8 9 10+
Focus Group
Minutes
0%
5%
10%
15%
20%
25%
30%
35%
0 1 2 3 4 5 6 7 8 9 10+
Panel respondents
Minutes
0%
10%
20%
30%
40%
50%
60%
70%
0 1 2 3 4 5 6 7 8 9 10+
Focus group
Minutes
0%
10%
20%
30%
40%
50%
60%
70%
0 1 2 3 4 5 6 7 8 9 10+
Panel respondents
Minutes
0%
5%
10%
15%
20%
25%
30%
35%
0 1 2 3 4 5 6 7 8 9 10+
Focus group
Minutes
0%
5%
10%
15%
20%
25%
30%
35%
0 1 2 3 4 5 6 7 8 9 10+
Panel respondents
Minutes

90 – ANNEX 3
SHARED MOBILITY SIMULATIONS FOR DUBLIN— © OECD/ITF 2018
Figure A8. Attitudes of bus and rail users towards lost time with Shared Mobility modes
Figure A9. Attitudes of car users towards Shared Mobility modes used as feeder service
Figure A10. Attitudes of bus and rail users towards Shared Mobility modes used as feeder service
0%
10%
20%
30%
40%
50%
0 1 2 3 4 5 6 7 8 9 10+
Focus group
Minutes
0%
10%
20%
30%
40%
50%
0 1 2 3 4 5 6 7 8 9 10+
Panel respondents
Minutes
0%
5%
10%
15%
20%
25%
30%
35%
0 1 2 3 4 5 6 7 8 9 10
Focus group
Not relevant Highly relevant
0%
5%
10%
15%
20%
25%
30%
35%
0 1 2 3 4 5 6 7 8 9 10
Panel respondents
Not relevant Highly relevant
0%
5%
10%
15%
20%
25%
0 1 2 3 4 5 6 7 8 9 10
Focus group
Not relevant Highly relevant
0%
5%
10%
15%
20%
25%
0 1 2 3 4 5 6 7 8 9 10
Panel respondents
Not relevant Highly relevant

ANNEX 3 – 91
SHARED MOBILITY SIMULATIONS FOR DUBLIN — © OECD/ITF 2018
Figure A11. Attitudes of car users towards number of passengers on board Shared Mobility modes
Figure A12. Number of cars a respondent would sell if Shared Mobility modes were available
Focus group
Panel respondents
0%
10%
20%
30%
40%
50%
60%
0 1 2 3 4 5 6 7 8 9 10-15
Focus group
Number of passengers to share with
0%
10%
20%
30%
40%
50%
60%
0 1 2 3 4 5 6 7 8 9 10-15
Panel respondents
Number of passengers to share with
13%
27%
60%
3% 2%
19%
76%
All cars in myhousehold
2 cars
1 car
No cars
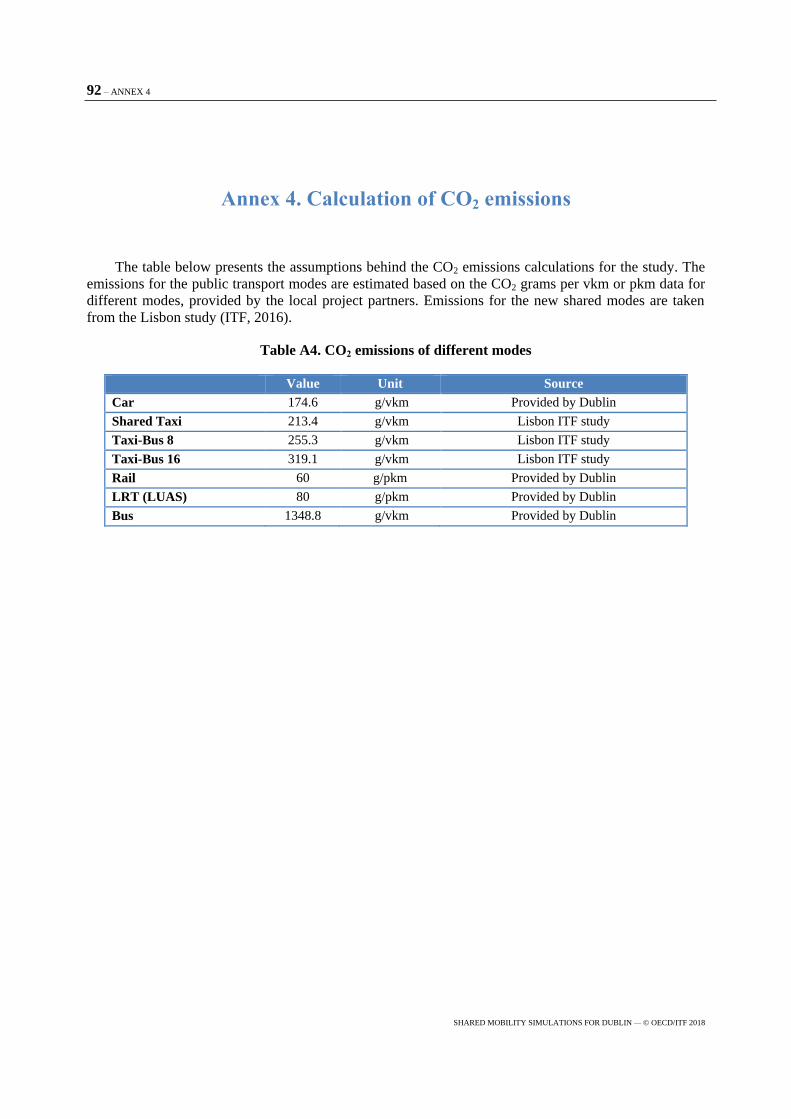
92 – ANNEX 4
SHARED MOBILITY SIMULATIONS FOR DUBLIN — © OECD/ITF 2018
Annex 4. Calculation of CO2 emissions
The table below presents the assumptions behind the CO2 emissions calculations for the study. The
emissions for the public transport modes are estimated based on the CO2 grams per vkm or pkm data for
different modes, provided by the local project partners. Emissions for the new shared modes are taken
from the Lisbon study (ITF, 2016).
Table A4. CO2 emissions of different modes
Value Unit Source
Car 174.6 g/vkm Provided by Dublin
Shared Taxi 213.4 g/vkm Lisbon ITF study
Taxi-Bus 8 255.3 g/vkm Lisbon ITF study
Taxi-Bus 16 319.1 g/vkm Lisbon ITF study
Rail 60 g/pkm Provided by Dublin
LRT (LUAS) 80 g/pkm Provided by Dublin
Bus 1348.8 g/vkm Provided by Dublin

ANNEX 5 – 93
SHARED MOBILITY SIMULATIONS FOR DUBLIN — © OECD/ITF 2018
Annex 5. Effective access
Effective access is a concept that is used across the ITF Shared Mobility studies (ITF, 2016; 2017a;
2017b; 2017c) and that allows evaluating accessibility levels along a continuum of perception, taking
into account not the absolute travel time but the travel time related to a particular origin-destination pair.
This provides a better indicator than the absolute travel time since an individual’s willingness to go from
point a to point b to carry out an activity usually depends on the remoteness of a from b. The more the
individual needs to travel the less the destination becomes attractive for carrying out the activity. To
account for that, more remote destinations can be penalised by being multiplied by a factor smaller than
1, which decreases as the travel time between the origin and destination increases. In order to calculate
the exact value of the penalty an attraction decay curve can be used (Figure A13), which shows that the
attraction reduces non-linearly as the impedance (travel time) grows (Martínez and Viegas, 2013).
In order to calculate the effective accessibility to employment (or population) the number of jobs (or
residents) in each destination grid cell is multiplied by the attraction value provided by the attraction
decay curve. For instance, if from the origin cell a destination cell is reached in 40 minutes, then the
number of jobs existing in the destination cell is multiplied by 0.2 (which is the attraction penalty in the
curve for a 40 minutes travel distance).
Figure A13. Attraction decay curve
Source: Martínez and Viegas (2013).
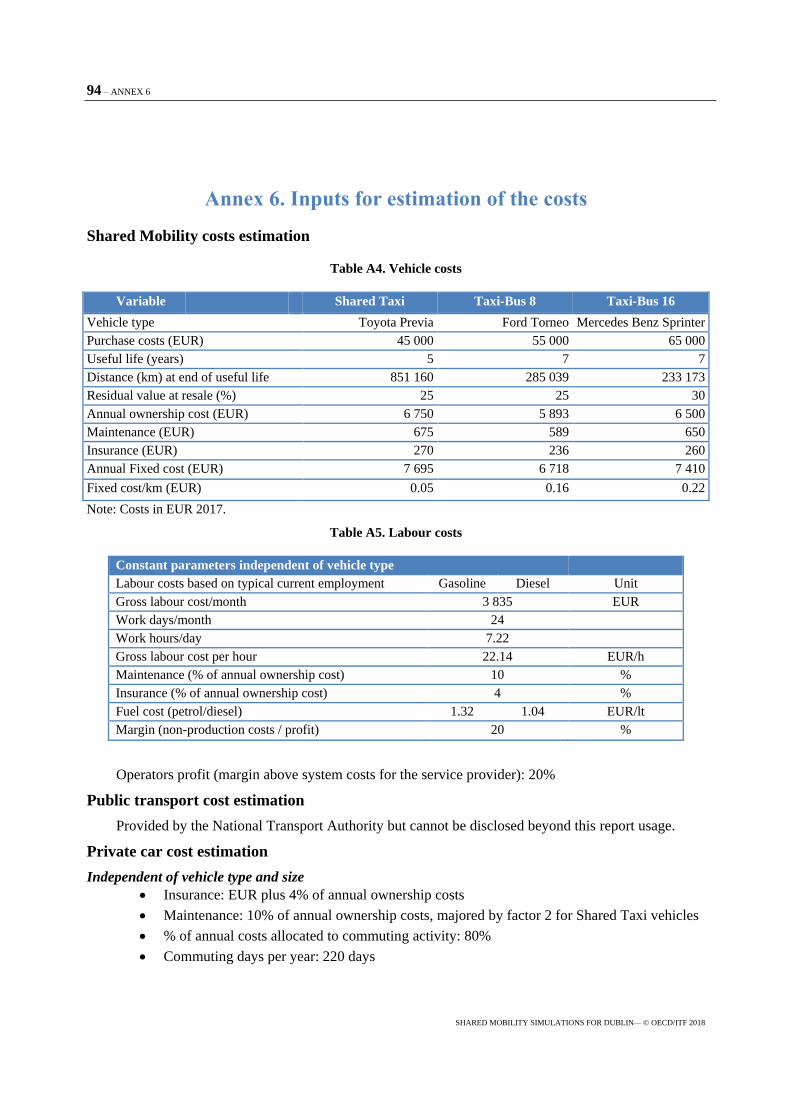
94 – ANNEX 6
SHARED MOBILITY SIMULATIONS FOR DUBLIN— © OECD/ITF 2018
Annex 6. Inputs for estimation of the costs
Shared Mobility costs estimation
Table A4. Vehicle costs
Variable Shared Taxi Taxi-Bus 8 Taxi-Bus 16
Vehicle type Toyota Previa Ford Torneo Mercedes Benz Sprinter
Purchase costs (EUR) 45 000 55 000 65 000
Useful life (years) 5 7 7
Distance (km) at end of useful life 851 160 285 039 233 173
Residual value at resale (%) 25 25 30
Annual ownership cost (EUR) 6 750 5 893 6 500
Maintenance (EUR) 675 589 650
Insurance (EUR) 270 236 260
Annual Fixed cost (EUR) 7 695 6 718 7 410
Fixed cost/km (EUR) 0.05 0.16 0.22
Note: Costs in EUR 2017.
Table A5. Labour costs
Constant parameters independent of vehicle type
Labour costs based on typical current employment Gasoline Diesel Unit
Gross labour cost/month 3 835 EUR
Work days/month 24
Work hours/day 7.22
Gross labour cost per hour 22.14 EUR/h
Maintenance (% of annual ownership cost) 10 %
Insurance (% of annual ownership cost) 4 %
Fuel cost (petrol/diesel) 1.32 1.04 EUR/lt
Margin (non-production costs / profit) 20 %
Operators profit (margin above system costs for the service provider): 20%
Public transport cost estimation
Provided by the National Transport Authority but cannot be disclosed beyond this report usage.
Private car cost estimation
Independent of vehicle type and size
Insurance: EUR plus 4% of annual ownership costs
Maintenance: 10% of annual ownership costs, majored by factor 2 for Shared Taxi vehicles
% of annual costs allocated to commuting activity: 80%
Commuting days per year: 220 days

ANNEX 6 – 95
SHARED MOBILITY SIMULATIONS FOR DUBLIN — © OECD/ITF 2018
Dependent of the vehicle type and size
Table A6. Vehicle costs depending on type and size
Variable New vehicles Second-hand
Purchase price (EUR) 15 000 30 000 50 000 5 000
Avg. Life (years) 6 5 4 8
Res. Value at resale (%) 15 30 45 5
Ann. Ownership cost (EUR) 2 125 4 200 6 875 593.75
Insurance (EUR) 180 243 350 180
Maintenance (EUR) 212.5 420 687.5 118.75
Total fixed cost (EUR) 2 517.5 4 863 7 912.5 892.5
Total fix cost commuting (EUR) 2 014 3 890.4 6 330 714
Energy cost estimation for electric vehicles fleet
Energy consumption
Range for 100% charging: 240 km
Range 75% charging: 150 km
Charging time for 75%: 30 min
Charging time for 100%: 2.5 hours
Table A7. Energy consumption and efficiency
Variable Shared Taxi Taxi-Bus 8 Taxi-Bus 16
Energy consumption of diesel (Kw.h/veh. day) 225.3 97.4 68.0
Tank-to-wheel efficiency, diesel (%) 19.0 19.0 19.0
Tank-to-wheel efficiency, electric (%) 75.0 75.0 75.0
Conversions diesel/Electric Kw.h:
1 KWh = 3.6 MJ
1 lt diesel = 38.29 MJ
1 lt diesel = 10.64 Kwh
Electricity costs
At the highest power level (41.4 KV.A)
Fixed rate/day/charging unit: EUR 1.997
Table A8. Electricity costs
Period of day Variable
peak Variable
intermediate
Variable
off peak Average
Rates/Kw.h 0.17 0.15 0.084 0.1213 EUR/Kw.h
Amount of charging (%) 5 50 45

2018
-10/
Phot
o cr
edit:
ITF
Shared Mobility Simulations for Dublin
This report examines how new shared mobility services could change mobility in Ireland’s Greater Dublin Area. Simulations of eleven different shared transport scenarios show how such services could affect congestion, CO2 emissions and the use of public space. They also examine how such solutions might impact service quality, the cost of mobility, citizens’ access to opportunities and their use of public transport. The findings provide decision makers with evidence to properly weigh opportunities and challenges created by new forms of shared transport. The work is part of a series of studies on shared mobility in different urban and metropolitan contexts.
This report is part of the International Transport Forum’s Case-Specific Policy Analysis series. These are topical studies on specific issues carried out by the ITF in agreement with local institutions.
International Transport Forum 2 rue André Pascal F-75775 Paris Cedex 16 +33 (0)1 45 24 97 10 [email protected] www.itf-oecd.org