A Review of Business Models for Shared Mobility and Mobility ...
70
A Review of Business Models for Shared Mobility and Mobility-as-a-Service (MaaS) Citation for published version (APA): Boer, M., Türetken, O., & Adali, O. E. (2022). A Review of Business Models for Shared Mobility and Mobility-as- a-Service (MaaS): A Research Report. Eindhoven University of Technology. Document license: Unspecified Document status and date: Published: 04/01/2022 Document Version: Publisher’s PDF, also known as Version of Record (includes final page, issue and volume numbers) Please check the document version of this publication: • A submitted manuscript is the version of the article upon submission and before peer-review. There can be important differences between the submitted version and the official published version of record. People interested in the research are advised to contact the author for the final version of the publication, or visit the DOI to the publisher's website. • The final author version and the galley proof are versions of the publication after peer review. • The final published version features the final layout of the paper including the volume, issue and page numbers. Link to publication General rights Copyright and moral rights for the publications made accessible in the public portal are retained by the authors and/or other copyright owners and it is a condition of accessing publications that users recognise and abide by the legal requirements associated with these rights. • Users may download and print one copy of any publication from the public portal for the purpose of private study or research. • You may not further distribute the material or use it for any profit-making activity or commercial gain • You may freely distribute the URL identifying the publication in the public portal. If the publication is distributed under the terms of Article 25fa of the Dutch Copyright Act, indicated by the “Taverne” license above, please follow below link for the End User Agreement: www.tue.nl/taverne Take down policy If you believe that this document breaches copyright please contact us at: [email protected] providing details and we will investigate your claim. Download date: 09. Mar. 2022
-
Upload
khangminh22 -
Category
Documents
-
view
0 -
download
0
Transcript of A Review of Business Models for Shared Mobility and Mobility ...

A Review of Business Models for Shared Mobility andMobility-as-a-Service (MaaS)Citation for published version (APA):Boer, M., Türetken, O., & Adali, O. E. (2022). A Review of Business Models for Shared Mobility and Mobility-as-a-Service (MaaS): A Research Report. Eindhoven University of Technology.
Document license:Unspecified
Document status and date:Published: 04/01/2022
Document Version:Publisher’s PDF, also known as Version of Record (includes final page, issue and volume numbers)
Please check the document version of this publication:
• A submitted manuscript is the version of the article upon submission and before peer-review. There can beimportant differences between the submitted version and the official published version of record. Peopleinterested in the research are advised to contact the author for the final version of the publication, or visit theDOI to the publisher's website.• The final author version and the galley proof are versions of the publication after peer review.• The final published version features the final layout of the paper including the volume, issue and pagenumbers.Link to publication
General rightsCopyright and moral rights for the publications made accessible in the public portal are retained by the authors and/or other copyright ownersand it is a condition of accessing publications that users recognise and abide by the legal requirements associated with these rights.
• Users may download and print one copy of any publication from the public portal for the purpose of private study or research. • You may not further distribute the material or use it for any profit-making activity or commercial gain • You may freely distribute the URL identifying the publication in the public portal.
If the publication is distributed under the terms of Article 25fa of the Dutch Copyright Act, indicated by the “Taverne” license above, pleasefollow below link for the End User Agreement:www.tue.nl/taverne
Take down policyIf you believe that this document breaches copyright please contact us at:[email protected] details and we will investigate your claim.
Download date: 09. Mar. 2022
Department of Industrial Engineering & Innovation Sciences
Information Systems Group
A Review of Business Models for
Shared Mobility and Mobility-as-a-Service (MaaS):
A Research Report
Merijn Boer
Oktay Turetken
O. Ege Adali
Eindhoven
Version: 04-01-2022

i
ABSTRACT
The mobility solutions that currently dominate the mobility market have raised global challenges. Specifically, mass car ownership has led to traffic congestion, shortage of parking spaces, and sustainability issues. Recently, mobility solutions driven by technological advancements have emerged to address these issues via more efficient and sustainable use of resources. However, the wide range of mobility offerings has led to a scattered mobility market, and oversight is hard to grasp for travelers. Mobility-as-a-Service (MaaS) platforms aim to address this issue by integrating mobility services into a single platform. However, MaaS providers (operators) struggle to find sustainable business models. Additionally, research on shared mobility business models is limited, and there is little oversight in the scattered business model landscape. This report addresses this issue by summarizing the dominant business models in the mobility market through a systematic review of current initiatives and literature. It provides an overview of active MaaS business models and challenges and opportunities to integrate mobility services into MaaS. The types of mobility services reviewed in this study include bike-sharing, scooter-sharing, car-sharing, e-hailing, and MaaS platform providers. For each mobility service, the dominant operating mode and the main business model actors are identified and represented using the Service-Dominant Business Model Radar (SDBM/R). Furthermore, the value exchanges between the actors are mapped in Value Capture Diagrams. The report concludes with a discussion on the challenges and opportunities related to synthesizing shared mobility modes into MaaS and the expectations for its future.

ii
TABLE OF CONTENTS
1 INTRODUCTION ....................................................................................................................... 1
2 RELATED WORK ....................................................................................................................... 3
2.1 PLATFORM BUSINESS MODELS............................................................................................................. 3 2.2 MOBILITY PLATFORM BUSINESS MODELS ............................................................................................... 3 2.3 SHARED MOBILITY ............................................................................................................................ 4 2.4 RESEARCH GAP ................................................................................................................................ 6
3 RESEARCH DESIGN................................................................................................................... 7
3.1 LITERATURE REVIEW.......................................................................................................................... 7 3.2 SCOPE .......................................................................................................................................... 10 3.3 DATA EXTRACTION AND SYNTHESIS .................................................................................................... 10
4 BIKE-SHARING ....................................................................................................................... 14
4.1 BIKE-SHARING GENERATIONS ............................................................................................................ 15 4.2 OPERATING MODES ........................................................................................................................ 15 4.3 BUSINESS MODEL BLUEPRINTS OF CONTEMPORARY BIKE-SHARING SERVICES ............................................ 18 4.4 VALUE CAPTURE OF BIKE-SHARING BUSINESS MODELS.......................................................................... 20 4.5 SUMMARY .................................................................................................................................... 22
5 SCOOTER-SHARING ............................................................................................................... 23
5.1 SCOOTER-SHARING MARKET ............................................................................................................ 23 5.2 BUSINESS MODEL BLUEPRINTS OF CONTEMPORARY SCOOTER-SHARING SERVICES ...................................... 25 5.3 VALUE CAPTURE OF SCOOTER-SHARING BUSINESS MODELS.................................................................... 26
6 CAR-SHARING ....................................................................................................................... 29
6.1 OPERATING MODES ........................................................................................................................ 30 6.2 BUSINESS MODEL ACTORS ................................................................................................................ 31 6.3 VALUE CAPTURE ............................................................................................................................. 35
7 E-HAILING ............................................................................................................................. 37
7.1 BUSINESS MODEL ACTORS ................................................................................................................ 39 7.2 VALUE CAPTURE ............................................................................................................................. 41
8 MAAS PLATFORMS ................................................................................................................ 43
8.1 MAAS MATURITY STAGES ............................................................................................................... 43 8.2 BUSINESS MODEL ACTORS ................................................................................................................ 45 8.3 VALUE CAPTURE ............................................................................................................................. 48 8.4 DEPLOYMENT STRATEGY .................................................................................................................. 49 8.5 CHALLENGES AND OPPORTUNITIES .................................................................................................... 52
9 CONCLUSIONS ....................................................................................................................... 54
9.1 FUTURE WORK ............................................................................................................................... 56
ACKNOWLEDGMENTS .................................................................................................................... 58
REFERENCES................................................................................................................................... 58

iii
LIST OF TABLES
TABLE 1. INTEGRATED TRANSPORT MODE PER MAAS PROVIDER ........................................................................................... 11 TABLE 2. REVIEWED SOURCES PER TOPIC .......................................................................................................................... 11 TABLE 3. REVIEWED BIKE-SHARING SERVICES.................................................................................................................... 14 TABLE 4. REVIEWED SCOOTER-SHARING SERVICES ............................................................................................................. 23 TABLE 5. REVIEWED CAR-SHARING OPERATORS ................................................................................................................ 29 TABLE 6. REVIEWED E-HAILING OPERATORS ...................................................................................................................... 38 TABLE 7. VALUE PROPOSITIONS OF MAAS ........................................................................................................................ 44 TABLE 8. REVENUE SOURCES FOR MAAS PROVIDERS .......................................................................................................... 49 TABLE 9. STRATEGIES FOR MAAS DEVELOPMENT ............................................................................................................... 51 TABLE 10. CHALLENGES AND OPPORTUNITIES FOR MAAS .................................................................................................... 52 TABLE 11. SHARED MOBILITY BUSINESS MODELS................................................................................................................ 54
LIST OF FIGURES
FIGURE 1. KEY AREAS OF IMPACTS OF SHARED MOBILITY (ROUKOUNI & CORREIA, 2020) ........................................................... 5 FIGURE 2. LITERATURE REVIEW PROCESS ............................................................................................................................ 8 FIGURE 3. SCOPING PROCESS ......................................................................................................................................... 10 FIGURE 4. SERVICE-DOMINANT BUSINESS MODEL RADAR (SDBM/R) TEMPLATE ................................................................... 12 FIGURE 5. VALUE-CAPTURE DIAGRAM (VCD) NOTATION (GILSING, 2020) ............................................................................ 13 FIGURE 6. BUSINESS MODELS OF THE FOURTH GENERATION BIKE-SHARING INITIATIVES ............................................................. 19 FIGURE 7. VALUE-CAPTURE DIAGRAM FOR BIKE-SHARING .................................................................................................. 21 FIGURE 8. NUMBER OF SHARED MOPEDS SINCE 2012 (HOWE & JAKOBSEN, 2020) ................................................................ 24 FIGURE 9. SCOOTER-SHARING BUSINESS MODEL BLUEPRINT ................................................................................................. 25 FIGURE 10. VALUE-CAPTURE DIAGRAM FOR SCOOTER-SHARING .......................................................................................... 27 FIGURE 11. CAR-SHARING BUSINESS MODEL ..................................................................................................................... 33 FIGURE 12. VALUE CAPTURE DIAGRAM CAR-SHARING ........................................................................................................ 36 FIGURE 13. E-HAILING BUSINESS MODEL .......................................................................................................................... 38 FIGURE 14. VALUE CAPTURE DIAGRAM OF E-HAILING ........................................................................................................ 41 FIGURE 15. FIVE STAGES OF MAAS ................................................................................................................................. 43 FIGURE 16. THE MAAS ECOSYSTEM (KAMARGIANNI & MATYAS, 2017) ............................................................................... 45 FIGURE 17. MAAS BUSINESS MODEL IN SDBM/R (ADALI, OZKAN, TURETKEN, & GREFEN, 2021) ........................................... 46 FIGURE 18. VALUE CAPTURE DIAGRAM FOR MAAS ........................................................................................................... 48

1
1 Introduction
The mobility solutions that currently dominate the market in developed countries have raised global challenges (Caligiuri & Bonache, 2016). More specifically, privately owned motorized vehicles have been adopted in masses to satisfy our mobility needs (Degirmenci & Breitner, 2014a). In turn, this has led to urban issues like traffic congestion, air pollution, and shortage of parking spaces (Willing et al., 2017). These issues are becoming especially troubling in densely populated areas where they reinforce each other. To illustrate, shortage of parking spaces leads to slow-moving traffic in search of a parking spot and less available space for moving traffic, which causes congestion. In turn, congested traffic is inefficient and causes additional pollution (Croxford et al., 1996). It is expected that urbanization will increase to two-thirds of the global population by 2050 (UN, 2018). Hence, the current issues will only become more troublesome with the current approach on mobility (Han et al., 2018). Therefore, new mobility solutions are required to facilitate future transportation (Araghi et al., 2020).
One recent development promising in solving the urban mobility issues is the uptake of the sharing economy (Shaheen et al., 2017). The term ’sharing economy’ refers to a socio-economic system that exploits resource sharing rather than ownership to achieve business objectives, and thereby it prioritizes access over the ownership (Puschmann & Alt, 2016). A frequently mentioned example of a company that exploits sharing economy principles is Airbnb (Hossain, 2020; Reuschl et al., 2021). This company provides a platform for homeowners to offer their property to customers. Customers can access the property of the owner in exchange for monetary compensation. The same sharing principles have recently found their way into the mobility market as ’shared mobility’ (Machado et al., 2018).
Shared mobility refers to the shared utilization of mobility resources, thus providing short-term and on-demand access to vehicles without the burdens of their ownership (Machado et al., 2018). Some shared mobility services have been around for some time and are incumbent in the mobility network. For example, car rental, taxi, and public transport offer short-term and on-demand access without ownership. However, the development of advanced information technologies, electronic services, and electronic devices have enabled innovative business models to be developed (Polydoropoulou et al., 2020). Bike-sharing, scooter-sharing, car-sharing, and e-hailing companies have recently emerged, increasing the number of available urban transport modes (Machado et al., 2018). These service providers are currently experimenting with new business models and operating modes in a fierce competition for market (Howe, 2018). For example, ten scooter-sharing operators were active in Barcelona alone by 2020 (Howe & Jakobsen, 2020), trying to attract new customers by offering pay-as-you-go options, various memberships, and different driving modes 123 . Typically, mobility providers in the sharing market operate via their own platforms. Consequently, the mobility market has become fragmented, and oversight of the mobility offers has become harder to grasp for customers. This issue has led to another innovative concept in the mobility market: Mobility-as-a-Service (MaaS).
MaaS is often defined as an emerging strategy to reorganize transport to tackle mobility and sustainability challenges (Sochor et al., 2018). MaaS companies provide an alternative to traditional mobility solutions, such as car ownership, by enabling travelers to plan, book, and pay mobility services of varying transport modes through a digital platform (Sochor et al., 2018). The main aim of MaaS initiatives is to seamlessly integrate mobility operators of various transport modalities into a single platform and to offer travelers a customizable and optimized mobility option (Aapaoja, Kostiainen, et al., 2017; Wong & Hensher, 2020). Therefore, the main value proposition of MaaS platform providers is to offer travelers a seamless, optimized, and customized traveling experience (Boijens et al., 2021; Turetken et al., 2021). Besides travelers, mobility operators are the second customer type of MaaS platforms, as they can offer their services and reach out to a broader customer base through the platforms. Thus, the MaaS platform
1 Acciona -- Retrieved 06-04-2021, from https://movilidad.acciona.com/en ES/madrid/ 2 Movo -- ¡hola! somos movo, tu sharing de motos y patinetes el ectrico.´ Retrieved 16-05-202, from https://movo.me/es/ 3 Muving -- Prices and packs. Retrieved 06-04-2021, from https://www.muving.com/en/prices-andpacks-2

2
facilitates transactions between the suppliers and customers and exploits platform business model principles (Täuscher & Laudien, 2018).
Enabled by technological advancements, platform-based business models have emerged in recent years and have been very successful (Täuscher & Laudien, 2018). Seven of the ten most valuable companies in 2019 operated with a platform business model (Schenker, 2019). Still, little research has been published on the topic, and there is a lack of understanding about the dynamics between each actor in such business models (Fehrer et al., 2018). More specifically, almost no research has been published covering the application of platform business models in the mobility domain (Polydoropoulou et al., 2020). To fill this knowledge gap, governmental bodies are launching MaaS pilots in search of sustainable business models and appropriate governance. For example, seven pilots, all with different set-ups and learning goals, are planned to run in The Netherlands in the coming years (Verkeersnet, 2020), and the European Union has launched an international project (MaaS4EU) to accelerate MaaS development and to overcome critical challenges4. Additionally, private companies, such as Whim5, Smou6, and CityMapper7 seem to already operate successfully as mobility integrators in cities around Europe.
MaaS business model ecosystems are often complex (Kamargianni & Matyas, 2017) and often described by defining the involved stakeholders. Mulley and Nelson (2020) argue that the key discussions and future research should be directed at the links between the business models of each stakeholder in the MaaS ecosystem and its organizational forms. Additionally, one of the conclusions of the MaaS4EU project was that developing sustainable business models is one of the critical challenges for the proliferation of the MaaS (Kamargianni, 2020). Accordingly, the main objective of this report is defined as follows:
To clarify the business model landscape of MaaS providers to facilitate future business model evaluation and development
To achieve this goal, the business models of various mobility service providers have been identified first, without considering their integration in the MaaS platforms. Since many mobility services are relatively new, this research aims at the most dominant business models, including important actors and corresponding value streams. These business models are then placed into the MaaS business model network to identify the main challenges and opportunities for MaaS.
The rest of this report is outlined as follows. The following section summarizes previous research on business models and operating modes of modern mobility service concept. Additionally, it addresses the previous research on platform-based business models and their application in the mobility domain. Section 3 elaborates on how this research has been designed and conducted. The results for the shared-mobility services are presented in Sections 4, 5, 6, and 7. In Section 8, we offer the findings for MaaS, including challenges and opportunities. Next, the future directions for MaaS platforms are discussed in Section 9.
4 MaaS4EU -- End-to-end approach for mobility-as-a-service tools, business models, enabling framework and evidence for European seamless mobility. Retrieved 25-05-2021, from http://www.maas4eu.eu/ 5 Whim -- Experience the seamless way to move around. Retrieved 11-05-2021, from: https://whimapp.com/helsinki/en/ 6 Smou -- Move easily. move better. Retrieved 11-05-2021, from https://www.smou.cat/en 7 CityMapper -- Citymapper pass. Retrieved 16-05-2021, from https://citymapper.com/pass

3
2 Related Work
This section summarizes the related academic literature. First, previous work on the platform business is considered, and after that, the application of the platform business models in the mobility market is presented. This is followed by a review of the existing literature on shared mobility. Finally, we conclude by identifying the research gap and the main research objectives of this work.
2.1 Platform business models
To correctly identify and describe business models, the concept should be defined first. Many papers have defined the business model concept. However, various researchers point out that there is no unique accepted definition for the term business model (Morris et al., 2005; Weill et al., 2011; Zott et al., 2011). A broad definition as presented by (Teece, 2018) has been adopted in this research: “the business model describes the design or architecture of the value creation, delivery, and capture mechanisms a firm employs” (Teece, 2018). Following this definition, this research describes the actors, their roles, and interactions to understand shared mobility business models. Over the last decades, traditional business models built upon customer-firm relationships have been studied intensively. However, established customer-firm relationships do not apply to two-sided platform businesses (Thomas et al., 2014).
While relatively little attention has been given to platform businesses within the design logic of business models, (Fehrer et al., 2018) introduced a new business model logic highlighting the value processes and properties of platform business models. The authors elaborate that platform business models can be understood as open business models, with varying degrees of openness on three layers: the platform user layer, the platform infrastructure layer, and the platform provider layer (Thomas et al., 2014). Business models in open networks are based on an idea of continuously emerging, non-hierarchical collaboration among various actors (Ketonen-Oksi et al., 2016). They are empowered by advancements in digital technology that enable actors to connect more precisely, speedily, and efficiently than ever before (Parker et al., 2016). For MaaS, openness is frequently perceived at the user level, meaning travelers can use the platform freely, and transport operators can offer their services through the platform (Polydoropoulou et al., 2020).
Smedlund (2012) aims to place the concept of service platform business models in the context of current theories in service science. This is done by first dividing the business models into four types according to their combination of IT investments and introducing a capability-based value co-creation model. Four types of platform business models are distinguished, including the service platform business model. According to the authors, this business model is characterized by a supplier who develops, maintains, and governs the platform’s front end, with which the end-user interacts. The supplier opens the front end for the first customer type to provide its services. These services are then used via the front-end by the second customer type, the end-users. Täuscher and Laudien (2018) have also clustered open-source platform businesses, referred to as marketplaces, by classifying 100 randomly selected companies based on various attributes. Their paper describes business model types for marketplaces and identifies what value creation, delivery, and capture mechanisms characterize these business models. Six clusters of marketplaces are determined based on the transaction content, transaction type, marketplace participants, key activity, and revenue source. Two of these clusters could describe existing mobility platform businesses as their transaction content is characterized by ’offline services’. These business models of the clusters are characterized as ‘on-demand offline services’ and ’peer-to-peer’ offline services. In their work, Adali et al. (2021) adopt a service systems perspective and present a method to identify digital service platform requirements. The method is driven by the value propositions based on the actors’ capabilities in the service exchange networks (Adali, Ozkan, Turetken, Gilsing, et al., 2021).
2.2 Mobility platform business models
Little research directly refers to applying platform-based business models in the mobility domain, specifically MaaS solutions. Sarasini et al. (2017) have claimed that no academic work was published on MaaS business models. Since then, few studies have tried to identify different business models for MaaS
4
platforms based on multiple case studies. For example, Willing et al. (2017) have described the business model landscape of multimodal mobility platforms by examining 15 active solutions available in iOS App Store and Google Play Store online application marketplaces. The identified value propositions include increased coverage of transport modes due to multimodality and increased convenience. Moreover, the research investigates the value propositions and opportunities related to data exploitation based on three real-world examples. The authors conclude that insights are relevant to both mobility providers and platform providers, who can improve their value propositions for the customer and generate more revenue. New opportunities to generate revenue arise by acting as a data broker.
Another value proposition of MaaS platforms that is investigated in more detail relates to environmental concerns. Sarasini et al. (2017) examine how business models for MaaS can generate sustainable value. The authors claim that the sustainable value created by MaaS is delivered to 1) customers through attractive, cost-effective, and convenient mobility service, 2) the environment via lower transport emissions, and 3) society which benefits from lower congestion and improved accessibility.
The key actors involved in MaaS are studied in more detail by Polydoropoulou et al. (2020) through workshops and in-depth interviews in three European metropolitan areas: Budapest, Greater Manchester, and the city of Luxembourg. The key actors are mapped using the business model canvas by Osterwalder (Osterwalder & Pigneur, 2010). The authors’ findings indicate that mobility service providers and other public authorities are the key actors in MaaS. Moreover, the authors claim that public transport authorities are the best-positioned players to act as the MaaS providers (operators) but can often not embody this role due to structural and resource constraints. Kamargianni et al. (2017) also mention transport operators, data providers, technology and platform providers, IT infrastructure, insurance companies, regulatory organizations, universities, and research institutions as actors in the MaaS ecosystem. Cities are also considered essential stakeholders (Boijens et al., 2021).
Previous research on MaaS business models has mainly focused on a small set of case studies, often within a particular geographical region. The paper by Eckhardt et al. (2017) addresses this limitation and aims at developing a European roadmap for MaaS deployment. However, this research selects specific case studies on which the analysis is based rather than studying existing materials on MaaS business models. Other studies focus on particular aspects of MaaS instead of multimodal solutions. For example, Lygnerud et al. (2020) examine business models for ridesharing in rural areas. One of the main findings indicates a digital platform as the essential resource for all four studied cases. Other results include the relevant actors and value propositions for each mobility operator.
2.3 Shared mobility
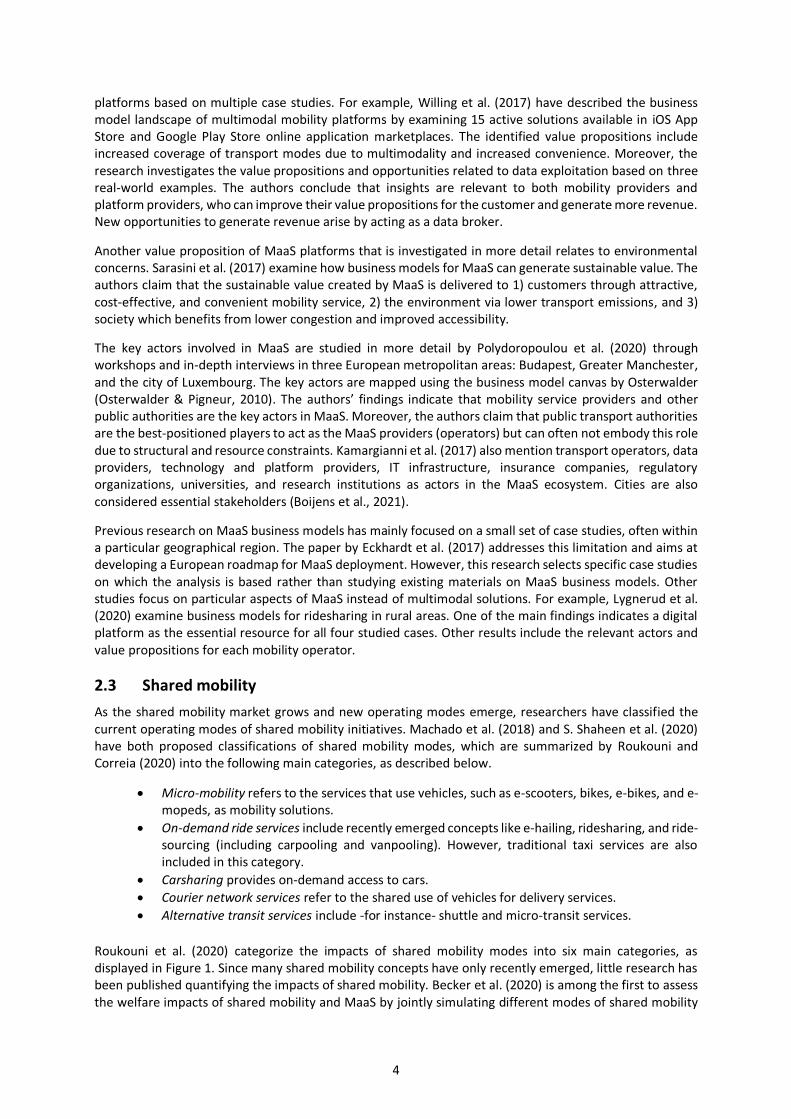
As the shared mobility market grows and new operating modes emerge, researchers have classified the current operating modes of shared mobility initiatives. Machado et al. (2018) and S. Shaheen et al. (2020) have both proposed classifications of shared mobility modes, which are summarized by Roukouni and Correia (2020) into the following main categories, as described below.
• Micro-mobility refers to the services that use vehicles, such as e-scooters, bikes, e-bikes, and e-mopeds, as mobility solutions.
• On-demand ride services include recently emerged concepts like e-hailing, ridesharing, and ride-sourcing (including carpooling and vanpooling). However, traditional taxi services are also included in this category.
• Carsharing provides on-demand access to cars.
• Courier network services refer to the shared use of vehicles for delivery services.
• Alternative transit services include -for instance- shuttle and micro-transit services.
Roukouni et al. (2020) categorize the impacts of shared mobility modes into six main categories, as displayed in Figure 1. Since many shared mobility concepts have only recently emerged, little research has been published quantifying the impacts of shared mobility. Becker et al. (2020) is among the first to assess the welfare impacts of shared mobility and MaaS by jointly simulating different modes of shared mobility

5
in Zurich. The results show that a MaaS scheme with shared mobility allows for increased system efficiency in travel times and costs while substantially reducing energy consumption. Other attempts at quantifying the impacts of shared mobility are specific for single modes. Related work on the most dominant shared mobility modes (bike-sharing, scooter-sharing, car-sharing, and e-hailing) is outlined next in this section.
Figure 1. Key areas of impacts of shared mobility (Roukouni & Correia, 2020)
Research contributions on bike-sharing have increased in the last decade. The study by Fishman et al. (2013) evaluates the state of global bike-sharing research and identifies the main themes that emerge in bike-sharing research. The authors concluded that the peer-reviewed literature on bike-sharing programs is limited and indicates a direction for future research. Since then, more research has been conducted covering various aspects of bike-sharing. Si et al. (2019) have identified the main themes in bike-sharing research by mapping the bike-sharing research published between 2010 and 2018 and found that trends in bike-sharing research moved from the safety and benefits of bike usage to more complex external impacts, system optimization, design, and integration with public transportation. Additionally, an increasing interest in dockless bike-sharing systems is reported. Dockless (free-floating) bike-sharing systems also appear in recent attempts to classify bike-sharing operating modes (Waes et al., 2018).
The concepts of bike-sharing have recently been applied to another transport mode: scooters. Academic research perspectives mainly cover the adoption of scooter-sharing systems and the identification of customer segments (Aguilera-García et al., 2020; Almannaa et al., 2021; Degele et al., 2018; Eccarius & Lu, 2020). While customer-related topics within bike-sharing have been researched extensively, limited literature has been published on scooter-sharing business models (Aguilera-García et al., 2020). Instead, Curtis and Mont (2020) and Shaheen et al. (2020) elaborate on scooter-sharing business model concepts in the context of the sharing economy. The authors identify scooter-sharing as one of the current operating modes of sharing mobility, a subset of the larger sharing economy. There are also market reports that describe the current state of the market, recent developments, and operating modes (Howe, 2018; Howe & Jakobsen, 2020).
More similar to bike-sharing, car-sharing services have been around for over 50 years, and available literature on such services is extensive (Ferrero et al., 2018). However, recent developments in IT have led to the diversification of operating modes and increased popularity. Degirmenci et al. (2014a) and Ferrero et al. (2015) have conducted literature reviews to identify car-sharing's main research topics and indicate

6
research gaps. Both publications agree on the limited attention that has been given to the business models and operating models of car-sharing companies. Since then, various attempts have been made to identify and classify operational business models for car-sharing. For example, Remane et al. (2016) have developed a taxonomy to organize the business models of 94 car-sharing operators into seven categories. More recently, Lagadic et al. (2019) distinguished five main car-sharing business models, and Bocken et al. (2020) divided the Swedish market into three main categories, emphasizing cooperative models. Most research, however, recognizes three dominant business models in the car-sharing market: two-way station-based, one-way free-floating, and peer-to-peer models (Cohen & Kietzmann, 2014b; Degirmenci & Breitner, 2014a; Ferrero et al., 2015; Münzel et al., 2018; Perboli et al., 2018).
Another well-known shared mobility operating mode is the taxi service. The business model has remained virtually unchanged since coachmen operated the service with a horse and a carriage (Darbéra, 2017): the operator owns a vehicle fleet driven by chauffeurs who deliver the door-to-door mobility service to customers for a fee. Hence, this simple model has received little attention from academics. This changed in 2009 when Uber introduced the concept of e-hailing. Uber disrupted the taxi market leveraging the advantages of platform-based business models, enabling it to grow exponentially (Walji & Walji, 2016a). Since then, the public debate about e-hailing has been dominated by issues about regulation, safety, and labor rights (Su & Fang, 2019). Meanwhile, Uber has become an example for academics who describe the platform-based business model or the principles of the sharing economy (Garud et al., 2020; Täuscher & Laudien, 2018; Teece, 2018).
2.4 Research gap
The intensity at which MaaS business models are being researched is picking up. Also, the business models of individual shared mobility operating modes are starting to be studied more extensively. Still, most business model research focuses on operating modes while there is no systematic identification of business model actors and their roles in the business model. Also, the integration of mobility provider business models in MaaS business models remains unidentified in academic sources. Additionally, no research provides an overview of dominant business models in the mobility domain or compares these business models across different modes, leading to meaningful insights. This report aims to address this gap using the methodology as described in the next section.

7
3 Research Design
This report’s primary goal is to describe the business model landscape of MaaS providers to facilitate better understanding and future business model development. Kamargianni and Matyas (2017) have described the business model ecosystem of MaaS by identifying the actors. However, to the author’s knowledge, the role of each actor in the context of operational business models of MaaS providers remains undefined in academic literature. Furthermore, Mulley and Nelson (2020) specifically indicated that key discussions and future research needs to be directed at the links between business models of each stakeholder in MaaS. As MaaS providers operate platform business models, key stakeholders are their suppliers, shared mobility providers (Wong & Hensher, 2020). Hence, to investigate links between stakeholders’ business models and identify MaaS business models, three research questions have been formulated:
1. What are the main operating models for shared mobility modes that frequently interact with MaaS platforms?
2. Which value streams can be identified between each actor in these business models to better understand challenges and opportunities for mobility and MaaS providers in developing sustainable business models?
3. What are possible scenarios and the most promising business models for future MaaS solutions based on challenges and opportunities related to integrating mobility provider businesses into MaaS?
The remainder of this section elaborates upon the methods deployed to answer the research questions.
3.1 Literature review
To answer the research questions, this paper adopts the guidelines for performing systematic literature reviews provided by Kitchenham and Charters (2007)8. Accordingly, the following steps are defined for conducting a systematic literature review:
1. Define the research problem. 2. Define the research objective and questions. 3. Conduct pilot searches. 4. Define the search string. 5. Identify data sources. 6. Define the inclusion and exclusion criteria. 7. Perform the main search. 8. Eliminate duplicates. 9. Read publications by title, abstract, and keywords. 10. Read full-texts and analyze references. 11. Extract and synthesize data.
During the pilot search, it became clear that the yield of a systematic search strategy in academic sources was unsatisfactory for answering the research questions. Hence, the research methodology for the literature review has been tailored for this report. Specifically, it was decided that non-academic sources would be included in the analysis to complement the academic sources. The steps that were followed in this research are displayed in Figure 2.
8 This review method has been adopted by several works in the literature; e.g., (Dikici et al., 2018; Tarhan et al., 2016; Turetken et al., 2020)

8
Figure 2. Literature review process
1. Define research problem: The research problem was defined as a first step. 2. Define research objective and questions: Based on the research problem, the research
objective was defined, and the research questions were formulated, as presented in Sections 1 and 3, respectively.
3. Conduct pilot searches: The third step was to conduct pilot searches to refine search strings and estimate how much literature is available. During this step, some known shared mobility operators and MaaS providers were analyzed via an internet search to get acquainted with their operations.
4. Define scope: Based on the pilot search results, the scope of this literature review was defined. This process is elaborated in more detail in Section 3.2. Five main subjects were included: business models for bike-sharing, scooter-sharing, car-sharing, e-hailing, and MaaS.

9
5. Identify data sources: During the fifth step, three data sources were identified. First, three electronic libraries were searched for academic sources: 1) Scopus9, 2) ScienceDirect10and 3) SpringerLink11. Secondly, Google Scholar12 was used as an additional search engine to increase the yield of the literature review, as it searches across multiple libraries and yields papers that are not in one of the aforementioned electronic libraries. Finally, non-academic sources were obtained via an internet search.
6. Define inclusion and exclusion criteria: Based on the research objective and questions, the inclusion and exclusion criteria to be applied to the resulting publications to identify those relevant to this research were defined. The inclusion and exclusion criteria that were used during this study are listed below:
Inclusion criteria:
1) Publications published in English or Dutch language 2) Publications published in 2015 or later (only for current business model evaluation) 3) Sources published in academic journals and grey literature, including conference
proceedings, white papers, market reports, internet articles, and websites 4) Sources that include business model information for shared mobility and MaaS, as
specified in the scope of this research 5) Exclusion criteria: 6) Publications published in languages other than English or Dutch 7) Publications that do not focus on business models for shared mobility or MaaS.
7. Perform the main search: The main search is divided into four sub-steps, as presented below: a) Search for previous literature reviews. For each of the five main subjects for this paper,
the main search was initialized by searching for previous literature reviews on the topic. If the search yielded results, the references in these literature reviews were used as input for the next step.
b) Search for academic sources. During the search for academic sources, various search strategies were applied. First, the references in literature reviews are used. If none, this step was omitted. Next, the electronic libraries searched for academic sources on shared mobility and MaaS business models. Additionally, cross-referencing was used as a strategy to increase the search yield.
c) Read publications by title, abstract, and keywords. Each publication was reviewed based on the title, abstract, and keywords information. Inclusion and exclusion criteria were applied in this step for selecting relevant publications.
d) Determine research gaps. Consequently, it was determined whether there are specific gaps in the academic literature on business models within the scope of this paper. The identification of these gaps served as input for the next step.
e) Search for grey literature. An additional search was conducted for grey literature to complement the academic sources.
8. Read full-texts and analyze references. The full text of the publications was read. Inclusion and exclusion criteria were re-applied in this step to filter out any non-relevant publications. References in articles are used as input for the cross-referencing search strategy.
9. Extract and synthesize data. For the thorough investigation, the data from publications were extracted and synthesized using two main frameworks: Service-Dominant Business Model Radar (Luftenegger, 2014; Turetken, Grefen, Gilsing, & Adali, 2019; Turetken & Grefen, 2017) and Value Capture Diagram (Gilsing, 2020; Gilsing, Turetken, Ozkan, Slaats, et al., 2020). Section 3.3 elaborates more specifically on this step.
9 https://scopus.com/ 10 https://sciencedirect.com/ 11 https://link.springer.com/ 12 https://scholar.google.nl/
10
Findings for each topic were synthesized during the final step. If results were incompletes, additional research was conducted. Hence, multiple iterations were performed per research topic to increase the quality and completeness of the results.
3.2 Scope
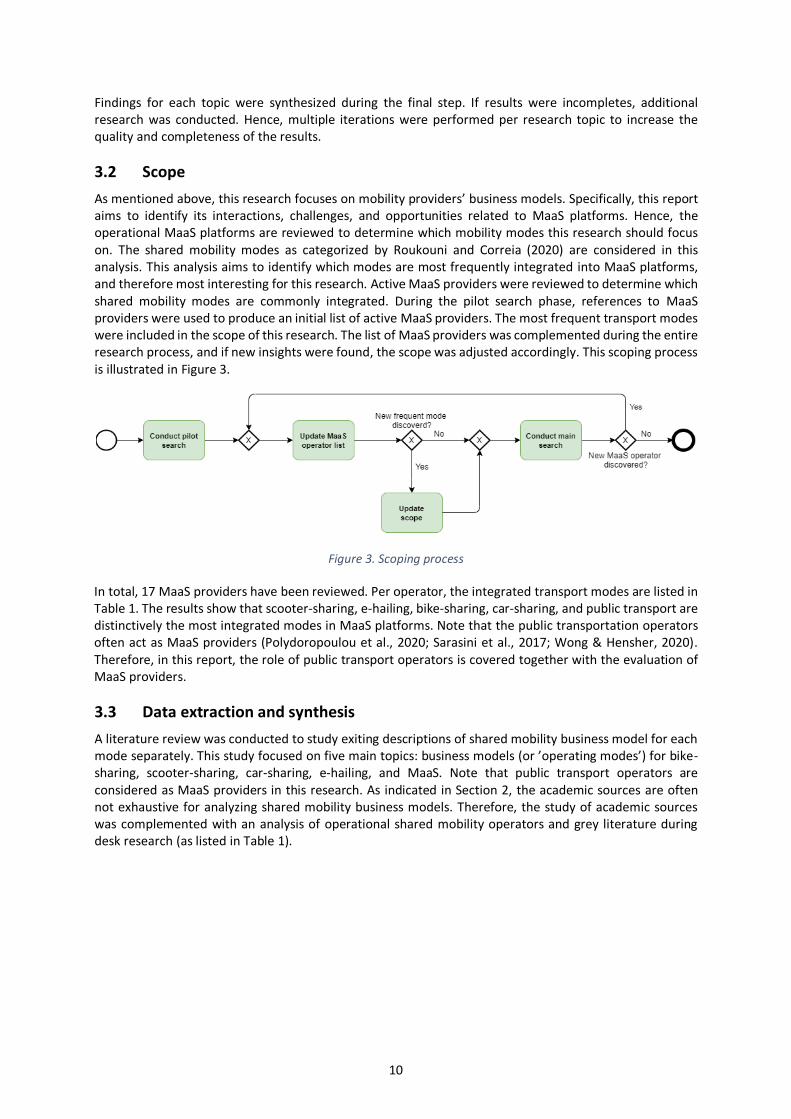
As mentioned above, this research focuses on mobility providers’ business models. Specifically, this report aims to identify its interactions, challenges, and opportunities related to MaaS platforms. Hence, the operational MaaS platforms are reviewed to determine which mobility modes this research should focus on. The shared mobility modes as categorized by Roukouni and Correia (2020) are considered in this analysis. This analysis aims to identify which modes are most frequently integrated into MaaS platforms, and therefore most interesting for this research. Active MaaS providers were reviewed to determine which shared mobility modes are commonly integrated. During the pilot search phase, references to MaaS providers were used to produce an initial list of active MaaS providers. The most frequent transport modes were included in the scope of this research. The list of MaaS providers was complemented during the entire research process, and if new insights were found, the scope was adjusted accordingly. This scoping process is illustrated in Figure 3.
Figure 3. Scoping process
In total, 17 MaaS providers have been reviewed. Per operator, the integrated transport modes are listed in Table 1. The results show that scooter-sharing, e-hailing, bike-sharing, car-sharing, and public transport are distinctively the most integrated modes in MaaS platforms. Note that the public transportation operators often act as MaaS providers (Polydoropoulou et al., 2020; Sarasini et al., 2017; Wong & Hensher, 2020). Therefore, in this report, the role of public transport operators is covered together with the evaluation of MaaS providers.
3.3 Data extraction and synthesis
A literature review was conducted to study exiting descriptions of shared mobility business model for each mode separately. This study focused on five main topics: business models (or ’operating modes’) for bike-sharing, scooter-sharing, car-sharing, e-hailing, and MaaS. Note that public transport operators are considered as MaaS providers in this research. As indicated in Section 2, the academic sources are often not exhaustive for analyzing shared mobility business models. Therefore, the study of academic sources was complemented with an analysis of operational shared mobility operators and grey literature during desk research (as listed in Table 1).

11
Table 1. Integrated transport mode per MaaS provider
MaaS Provider
Sco
ote
r-sh
arin
g
E-h
ailin
g
Rid
e s
har
ing
Bik
e sh
arin
g
Car
sh
arin
g
Co
uri
er s
ervi
ce
Pu
blic
tra
nsp
ort
Alt
ern
ativ
e Se
rvic
es
CityMapper x x x x
CityTrips x x x x x
EMot x x x x x x
Free Now x x x
Gaiyo x x x x
Jelbi x x x x x x
Kyyti x x x
Lyft x x x x x
S’hail x x x x x x
Smou x x x x x x
Turnn x x x x
Tranzer x x x x
UbiGo x x x x
Urbi x x x x
Whim x x x x x
WienMobil x x x x x
Zipster x x x x x x x
Tot 15 13 2 16 16 0 16 4
* Alternative services include parking, ferries, and air travel.
Table 2 presents the number of articles and the number of operators reviewed per topic. Two main frameworks were used to synthesize the data from all sources: the Service-Dominant Business Model Radar and Value Capture Diagram. These frameworks are elaborated upon next.
Table 2. Reviewed sources per topic
Topic Sc. articles Operators
Bike-sharing 14 25
Scooter-sharing 13 22
Car-sharing 20 16
E-hailing 15 13
MaaS 17 17
Total 79 93
3.3.1 Service-Dominant Businesses Model Radar (SDBM/R)
To describe the business model of mobility services, we adopted the service-dominant businesses model radar (SDBM/R), which supports the design of business models for network-based, service-dominant businesses (Luftenegger, 2014; Turetken, Grefen, Gilsing, & Adali, 2019; Turetken & Grefen, 2017). Since the solutions in the mobility domain involve multiple stakeholders to collaborate, SDBM/R is well suited to design such models and has been successfully applied in this domain (Coconea, Mizaras, Turetken, & Grefen, 2019; Coconea, Mizaras, Turetken, Dovinola, et al., 2019; Gilsing et al., 2018; Grefen et al., 2015, 2016; Grefen & Turetken, 2018; Lu et al., 2018; Suratno et al., 2018; Traganos et al., 2015; Turetken et al., 2021; Turetken, Grefen, Gilsing, Adali, et al., 2019; Turetken et al., 2018; van Sambeek et al., 2015).

12
The elements of the SDBM/R are presented in Figure 4. In the center, the co-created value-in-use represents the value proposition observed by the customer. The collaboration of all actors creates this value proposition. The actors are defined in the outer ring. For each actor, the value proposition, co-production activity, and cost and benefits are defined. The actor value proposition represents the part of the central value-in-use contributed by the specific actor, and the co-production activity describes the activities that each actor performs to achieve the co-creation of value. The third frame lists the costs and benefits associated with the co-production activity.
Each segment in the radar represents a specific actor, including the customer, focal organization, core partners, and enriching partners. In the case of the MaaS or sharing mobility services, the customers are often travelers. Thus, the travelers observe the co-created value-in-use. In contrast to non-service-dominant business model logic, the customer contributes to the co-created value-in-use. Next, the focal organization is the organization that initiates the business model setup, e.g., the mobility service providers or MaaS platform providers. Core partners contribute actively to the essentials of the service, while an enriching partner enhances the solution’s added value-in-use. The steps involved in using the SDBM/R include the following:
1) identify the co-created value-in-use and the targeted customer, 2) determine the components of the value-in-use and associated actors, 3) determine the costs and benefits for each actor and 4) determine the high-level activities that realize each actor's value proposition.
The resulting diagram provides an overview of the business model network.
Figure 4. Service-Dominant Business Model Radar (SDBM/R) template
Representing a business model using an SDBM/R blueprint facilitates communication among stakeholders and helps to have effective discussions on concrete aspects of the service. The method also incorporates a qualitative blueprint evaluation for a quick validity, viability, feasibility, and robustness assessment (Gilsing et al., 2021; Gilsing, Turetken, Ozkan, Adali, et al., 2020).
13
3.3.2 Value Capture Diagram (VCD)
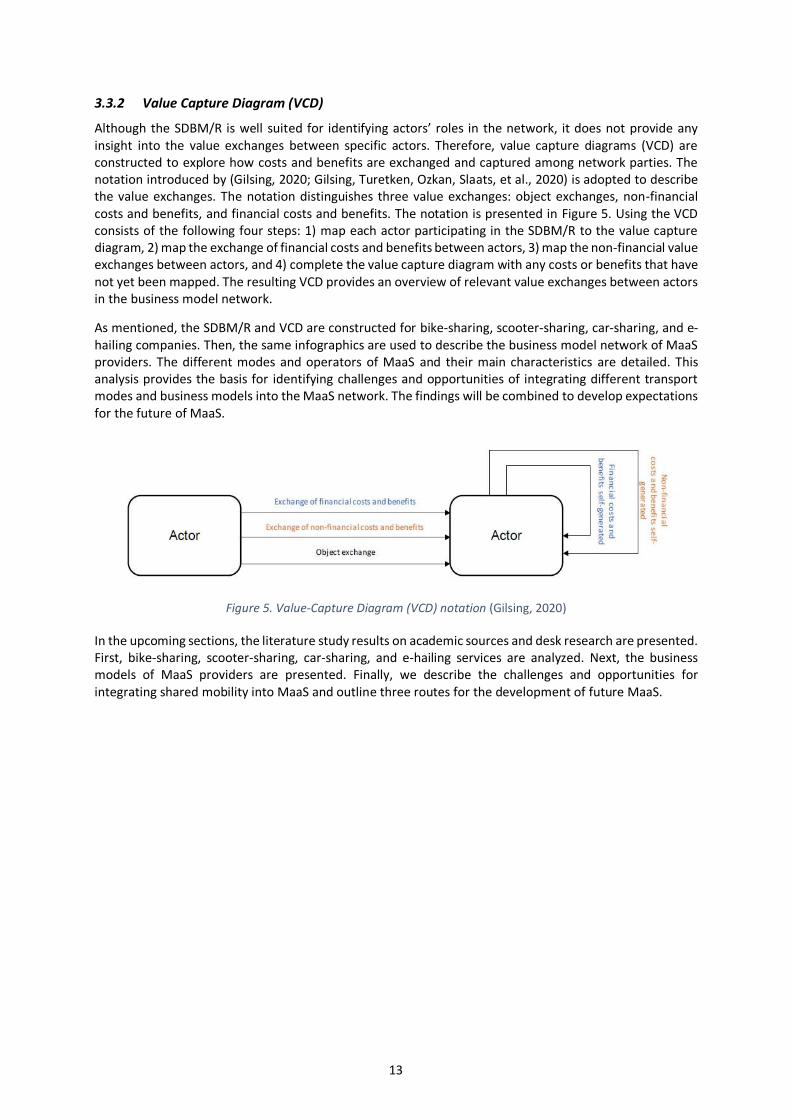
Although the SDBM/R is well suited for identifying actors’ roles in the network, it does not provide any insight into the value exchanges between specific actors. Therefore, value capture diagrams (VCD) are constructed to explore how costs and benefits are exchanged and captured among network parties. The notation introduced by (Gilsing, 2020; Gilsing, Turetken, Ozkan, Slaats, et al., 2020) is adopted to describe the value exchanges. The notation distinguishes three value exchanges: object exchanges, non-financial costs and benefits, and financial costs and benefits. The notation is presented in Figure 5. Using the VCD consists of the following four steps: 1) map each actor participating in the SDBM/R to the value capture diagram, 2) map the exchange of financial costs and benefits between actors, 3) map the non-financial value exchanges between actors, and 4) complete the value capture diagram with any costs or benefits that have not yet been mapped. The resulting VCD provides an overview of relevant value exchanges between actors in the business model network.
As mentioned, the SDBM/R and VCD are constructed for bike-sharing, scooter-sharing, car-sharing, and e-hailing companies. Then, the same infographics are used to describe the business model network of MaaS providers. The different modes and operators of MaaS and their main characteristics are detailed. This analysis provides the basis for identifying challenges and opportunities of integrating different transport modes and business models into the MaaS network. The findings will be combined to develop expectations for the future of MaaS.
Figure 5. Value-Capture Diagram (VCD) notation (Gilsing, 2020)
In the upcoming sections, the literature study results on academic sources and desk research are presented. First, bike-sharing, scooter-sharing, car-sharing, and e-hailing services are analyzed. Next, the business models of MaaS providers are presented. Finally, we describe the challenges and opportunities for integrating shared mobility into MaaS and outline three routes for the development of future MaaS.
14
4 Bike-sharing
Bike-sharing concepts have been researched extensively during the last decade. In their early work, DeMaio (2009) and Shaheen et al. (2010) studied the history of bike-sharing and elaborated their expectations for the future of bike-sharing. In a later study, Shaheen et al. (2014) investigated the state of the bike-sharing business in North America. It introduces four generations of bike-sharing concepts and four distinctive business models. Similar comparative studies are conducted also in China (S. Si et al., 2020).
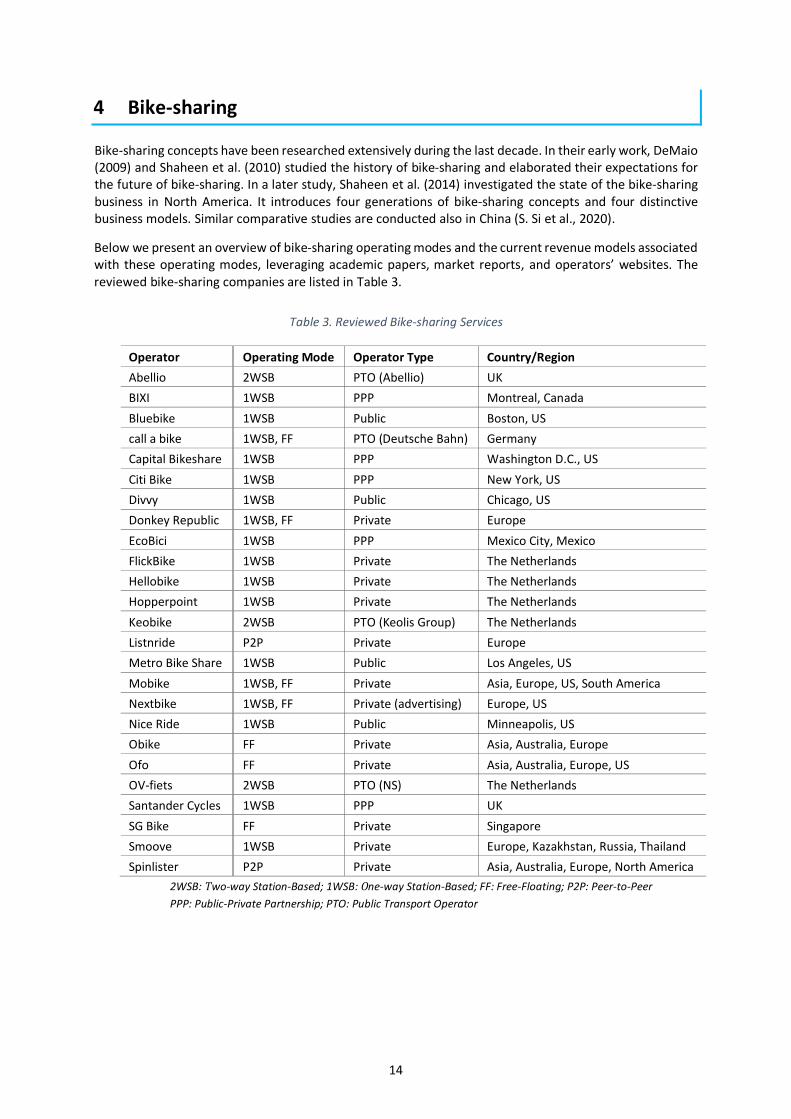
Below we present an overview of bike-sharing operating modes and the current revenue models associated with these operating modes, leveraging academic papers, market reports, and operators’ websites. The reviewed bike-sharing companies are listed in Table 3.
Table 3. Reviewed Bike-sharing Services
Operator Operating Mode Operator Type Country/Region
Abellio 2WSB PTO (Abellio) UK
BIXI 1WSB PPP Montreal, Canada
Bluebike 1WSB Public Boston, US
call a bike 1WSB, FF PTO (Deutsche Bahn) Germany
Capital Bikeshare 1WSB PPP Washington D.C., US
Citi Bike 1WSB PPP New York, US
Divvy 1WSB Public Chicago, US
Donkey Republic 1WSB, FF Private Europe
EcoBici 1WSB PPP Mexico City, Mexico
FlickBike 1WSB Private The Netherlands
Hellobike 1WSB Private The Netherlands
Hopperpoint 1WSB Private The Netherlands
Keobike 2WSB PTO (Keolis Group) The Netherlands
Listnride P2P Private Europe
Metro Bike Share 1WSB Public Los Angeles, US
Mobike 1WSB, FF Private Asia, Europe, US, South America
Nextbike 1WSB, FF Private (advertising) Europe, US
Nice Ride 1WSB Public Minneapolis, US
Obike FF Private Asia, Australia, Europe
Ofo FF Private Asia, Australia, Europe, US
OV-fiets 2WSB PTO (NS) The Netherlands
Santander Cycles 1WSB PPP UK
SG Bike FF Private Singapore
Smoove 1WSB Private Europe, Kazakhstan, Russia, Thailand
Spinlister P2P Private Asia, Australia, Europe, North America
2WSB: Two-way Station-Based; 1WSB: One-way Station-Based; FF: Free-Floating; P2P: Peer-to-Peer
PPP: Public-Private Partnership; PTO: Public Transport Operator

15
4.1 Bike-sharing generations
The principle of bike-sharing is simple: Individuals use bicycles on an as-needed basis without the costs and responsibilities of the bike ownership (Shaheen et al., 2010b). This concept has already been around for more than 50 years. The first bike-sharing program was launched on July 28, 1965, in Amsterdam and was called ”Witte Fietsen” or White Bikes (DeMaio, 2009). In this program, several white bikes were placed throughout the city center of Amsterdam. The bikes were free-floating throughout the area, and usage was free of charge. Hence, no locks were installed on the bicycles. The free systems concept is considered the first of four generations of bike-sharing. The free system was also implemented in Cambridge, the United Kingdom in 1993 and in La Rochelle, France in 1974. Most first-generation bike-sharing programs failed due to frequent theft or damage and hazardous parking of the bicycles. These problems led to the second generation of bike-sharing systems: coin-based systems.
Coin-based bike-sharing systems used designated storage racks where bicycles could be parked. The bikes were unlocked by a coin deposit and refunded on return. Local governments implemented this system in cities like Copenhagen, Sandnes, Helsinki, Bycykel, and Minneapolis in the late ’90 and early ’00. Although the hazardous parking problem was largely solved and damage and theft occurred less frequently, theft remained an issue due to the anonymity of the users. The rise of more advanced information technologies enabled this problem to be solved in the third generation of bike-sharing systems: IT-based systems.
Technologies for bicycle reservations, pickup, drop-off, and information tracking were incorporated in the IT-based bike-sharing systems to prevent destructive behavior and theft. Consequently, the popularity of bike-sharing systems and their prevalence picked up in the last two decades (Fishman et al., 2013). In addition to the new safety measures, the business model of bike-sharing systems also changed as operators began to operate bike-sharing programs commercially. These programs were typically paid for as a membership service, or pay-as-you-go, frequently free for the first specified time interval with gradually increasing costs. Although the program is not commercially operated, an example of a bike-sharing system that started as a free system and has evolved into an IT-based bike-sharing system is operational in La Rochelle under the name Yélo´13. The public transport operators offer various memberships and pay-as-you-go options to use the bike-sharing system.
The fourth-generation bike-sharing is characterized by integrating more complex systems, such as electric bicycles, advanced locking systems, bicycle redistribution, and integration with other services like the public transport (Shaheen et al., 2010b). The section below (4.2) details the most common business models of these modern bike-sharing systems.
4.2 Operating modes
van Waes et al. (2018) classifies the bike-sharing programs into four operating modes: two-way station-based, one-way station-based, peer-to-peer bike-sharing, and free-floating.
Two-way station-based (2WSB) In the two-way station-based system (2WSB), users pick up and return shared bikes to a designated docking station. 2WSB system operators are often public transport agencies and local governments. The operators use the bicycle sharing system to provide a last-mile solution for commuters in addition to the public transport infrastructure. In this case, the bike-sharing system is a complimentary service rather than the provider's core business. To optimize this last-mile solution, docking stations for the bikes are typically placed near train stations, bus stations, and ample parking areas. The main activity for operators in the 2WSB system is maintaining the bicycles. Maintenance is often conducted at the stations, which are typically human-crewed. Other operational activities include bicycle distribution and customer service. An example of a provider for this system is OV-fiets14, a Dutch bike-sharing system.
13 Yélo official website. Retrieved 23-10-2021, from https://yelo.agglo-larochelle.fr 14 NS -- Huur een ov-fiets voor het laatste stukje van je reis. Retrieved 12-05-2021, from https://www.ns.nl/deurtot-deur/ov-fiets
16
OV-fiets is owned by the Dutch railway company NS, and serves as an extension on the existing train network. OV-fiets users can unlock the bicycles at the docking stations using the same IC card, which can be used for other public transport modalities. This IC card is linked to a personal account to track information. Besides personal data, this account holds bank account details required to handle payments. The primary revenue source for OV-fiets is the renting fee paid by the customers. The price depends on the time between pickup and return of the bike. Another revenue source is additional fees that must be paid for returning the bike to a different station than the pickup location, damage to the bike, and theft or loss.
Besides OV-fiets, other examples of 2WSB bike-sharing operators are Keobike15 in The Netherlands and Abellio16 in England. Like NS, the owner of Keobike, Keolis Group, and Abellio exploit train rails in the east Netherlands and around major cities in England, respectively. The operators offer shared bikes as a complementary service to their transportation network. In addition to public transport operators, many cities worldwide operate their bike-sharing programs. In some cases, governments’ or universities’ bike-sharing systems are free for a closed group of consumers. These systems typically are 2WSB systems.
One-way station-based (1WSB) Whereas the two-way station-based system requires customers to return the bike to the same docking station as the pickup station, the customers of the one-way station-based (1WSB) systems can return the bike to any docking station. This changes the main value proposition from last-mile mobility service to mobility between designated locations since this system allows for one-way trips and gives the users additional freedom. 1WSB system also typically has more stations than 2WSB systems. The possibility of one-way trips implicates that the redistribution activities are more dominant in this model to provide bike availability across stations. Additionally, bike maintenance is often conducted at a central location by a 3rd party since the stations are usually small and unmanned.
In this operating mode, customers can often check the availability at specific stations and make reservations through a digital platform. The user has to register to store personal information and payment details on this platform. Like the 2WSB system, the 1WSB system mainly relies on rental fees for its revenue. However, the 1WSB system requires more stations to be effective, which introduces a new opportunity to generate revenue. The docking stations are naturally placed near busy spots in the area. The high visibility of the docking stations makes them attractive for advertisement. Rental fees are either based on pay-as-you-go systems or periodic subscription fees (or a hybrid model, e.g., BIXI17).
Bike-sharing is the core business of most providers in Europe. However, alternative business models exist, where advertising companies deploy bike-sharing services in exchange for advertising space in the city. Examples of such operators are JCDecaux 18 and Clear Channel 19 . Commercial mobility operators are becoming more dominant for the 1WSB system. These operators often rely on public-private partnerships for initial investments and station placement. Examples of such operators are Hopperpoint20, Nextbike21,
and ‘call a bike’22.
In contrast, non-profit organizations predominantly operate bike-sharing services in North America (Parkes et al., 2013). These organizations are often backed by a combination of government funding and grants.
15 Keobike -- Over keobike. Retrieved 12-05-2021, from https://keobike.nl/ 16 Abellio -- Cycling in the uk the abellio way! Retrieved 12-05-2021, from https://www.abellio.com/sites/default/files/downloads/abellio going dutch.pdf 17 BIXI. (2021). The city bike to get around the island. Retrieved 12-05-2021, from https://bixi.com/en 18 JCDeaux. (2021). Supplyingself-servicebikes. Retrieved 29-04-2021, from https://www.jcdecaux.com/partners/supplying-self-service-bikes 19 Clear Channel. (2021). Clear channel- our portfolio. Retrieved 12-05-2021, from https://www.clearchannelinternational.com/our-portfolio/smartbike 20 Hopperpoint. (2021). This is hopperpoint ... the bike you share. Retrieved 12-05-2021, from https://hopperpoint.nl/en 21 Nextbike. (2021b). Our bikesharing systems. Retrieved 27-04-2021, from https://www.nextbike.net/en/adbike/ 22 call a bike. (2021). Call a bike. Retrieved 12-05-2021, from https://www.callabike.de/de
17
Examples of such non-profit organizations are BIXI in Montreal, Nice Ride23 in Minnesota, and Santander Cycles24 in London.
Peer-to-peer (P2P) Free-floating systems have been introduced more recently than station-based systems. Two free-floating bike-sharing systems are distinguished: two-way free-floating systems and one-way free-floating systems. The two-way free-floating essentially is a peer-to-peer (P2P) sharing system, as it utilizes privately-owned bicycles which are shared or rented. Bike owners - individuals or companies-, can offer their bikes through a digital platform. Consequently, customers can rent the bikes via the same platform. Hence, this system leverages value co-creation principles and platform-based business models.
Examples of P2P bike-sharing systems are Listnride25 and Spinlister26. Offerings on the platforms show a niche market focusing on special-purpose bikes such as e-bikes, racing bikes, and mountain bikes (Waes et al., 2018). The marketing strategy indicates that these companies focus on recreational users. Since P2P bike-sharing operators focus on a recreational niche market, the societal benefits of such programs related to urban mobility issues are far less dominant. Therefore, the operators are commercial parties rather than governmental bodies. The core business of these commercial businesses is matching demand and supply. Revenue for the operator is generated from transaction fees, and costs are mainly related to the development and maintenance of the platform and marketing activities. Unlike the other systems discussed, the P2P relies far less on governments and public organizations since no docking stations are required, and the public space is not affected. Also, the platform provider is not responsible for maintenance on the bikes, which eliminates bike maintenance costs.
While P2P bike-sharing operators are less dependent on other actors, the insurance provider is an important actor in this operating mode. Bikes offered at P2P platforms are often relatively valuable compared to more mass-produced bikes, which are frequently used for other bike-sharing operating modes. This implies that the incentive for bike owners to offer their bikes is slimmer than the risk of damage or theft if not insured. The availability of insurance lowers this risk for both bike owners and users. Hence, the availability of insurance reduces the boundary to participate in P2P sharing for both actors. This is crucial for P2P sharing operators, as they leverage network principles, meaning that their value proposition becomes stronger as the use intensifies. The examples above -Listnride and Spinlister- both provide insurance services.
Free-floating (FF) The free-floating (FF) system relies on a network of bicycles within a specified area. Users can take and drop a bike anywhere within this area, which relates to the main value proposition of the system. Key features of this system are a mobile application to find, lock and unlock bicycles and a redistribution service. Additionally, bikes need to be equipped with a GPS tracker to determine their location. Bike-sharing is often the core business of FF bike-sharing providers. According to interviews with bike-sharing operators held by van Waes et al. (2018), maintenance is often outsourced to local social workplaces. A critical process that the provider handles is the relocation of the bicycles. Providers optimize the relocation of bikes by using the geo-data generated by the GPS trackers. This data is used to identify the intensity of the demand at specific locations. Some providers focus on the exploitation of user data as their revenue model. For example, Ofo develops algorithms that display advertisements based on your location and time (Waes et al., 2018). In addition to income via data exploitation, rental fees are an essential revenue source in the one-way free-floating system. However, little information on their revenue models or cost structures is available. None
23 Nice Ride. (2021). More bikes. more scooters. more minneapolis. Retrieved 12-05-2021, from https://www.niceridemn.com/ 24 Santander Cycles. (2021). Santander cycles - transport for london. Retrieved 12-05-2021, from https://tfl.gov.uk/modes/cycling/santander-cycles 25 Listnride. (2021). Boek de perfecte fiets voor unieke ervaringen. Retrieved 12-05-2021, from https://www.listnride.nl/ 26 Spinlister. (2021). Rent a bike anywhere in the world - save money, meet awesome people, and consume less.
Retrieved 12-05-2021, from https://www.spinlister.com/

18
of the FF bike-sharing operators have published financial reports to the best of our knowledge. However, news articles announcing significant investments in these companies are abundant. For example, Mobike raised over $600 million in 2017 (Mobike, 2017) and Ofo raised $866 million in 2018 (Shu, 2018). At the same time, various new articles have been published stating that operators are in financial trouble or that operators are scaling down their operations. For example, Ofo almost went bankrupt only four years after it was founded and raised over $2.2 billion (Bork, 2019). These signs suggest that operators are burning through their cash to expand their operations and gain market share as quickly as possible and that investors are crucial for these operators. Another observation is that the FF bike-sharing market is dominated by large commercial parties, mainly in Asia (e.g., Mobike27 and Donkey Republic28). The business models and actors of each operating mode are elaborated in more detail next.
4.3 Business Model Blueprints of Contemporary Bike-sharing Services
The most important actors of each operating mode of the fourth generation bike-sharing systems, their value propositions, their services, and the costs and benefits associated with the actors’ participation are summarized in Figure 6. For each operating mode, the traveler is the customer who uses the mobility service - the bike-sharing system.
2WSB (Two-way station-based) The main benefit for travelers is mobility. More specifically, the main benefit for the travelers in the 2WSB system is an urban mobility solution for covering the last mile with public transport (Figure 6a). Usually, travelers pay rent as a periodic subscription fee or via a pay-as-you-go system. Providing access to profile and traveling data is also considered a cost for travelers. This data is also the main value proposition of travelers for the system since it can be used to obtain traveling insights, optimize mobility services, and for data exploitation purposes.
The leading service provider in the system is the party that operates the bike-sharing service. In the previous section, five different types of providers have been identified: advertising companies, public transport agencies, local governments, and public authorities, commercial organizations, and non-profit organizations. In the 2WSB operating mode, public transport providers are the most common operator of bike-sharing systems. The main actor-value proposition that this actor contributes to the network is the last-mile (public) transport. The operators have to maintain the bike-sharing system to deliver this value proposition. The maintenance of the system includes the activities such as bike redistribution and customer service. Additionally, the operator often carries out bike maintenance at the stations. The costs associated with these activities are summarized as operational costs in Figure 6a.
Two other important actors in the 2WSB model are the IT provider and local government. As mentioned, all fourth-generation bike-sharing programs rely on IT to some extent. The 2WSB system relies the least on IT compared to the other operating modes. Yet, travelers want to check bike availability and make reservations and payments. The IT solution enables these actions. The IT provider is responsible for maintaining the software system in exchange for an operating fee. In turn, local governments support the bike-sharing program by placing stations and granting funds. The main benefit for governments is the societal value delivered by bike-sharing programs.
27 Mobike. (2021). Join the movement. Retrieved 16-05-2021, from https://mobike.com/global/ 28 Donkey Republic. (2021). Bikes are coming back. let’s make sure we don’t blow it. Retrieved 16-05-2021, from
https://www.donkey.bike/bikes-coming-back-lets-make-sure-dont-blow-time/

19
(a) 2WSB (b) 1WSB
(c) FF (d) P2P
Figure 6. Business models of the fourth generation bike-sharing initiatives
1WSB (One-way station-based) The business model of the 1WSB model is summarized in Figure 6b and is essentially the same as the business model of the 2WSB system. Compared to the 2WSB systems, travelers have slightly more freedom, as the value proposition changes to urban mobility between stations. Also, one difference is that the operators are often commercial companies, non-profit organizations, or local governments rather than public transport operators. Also, the revenues from advertisements are more common. For example, Nextbike 29 , one of the European market leaders, actively promotes advertising on its bikes. Another difference with 2WSB systems is that the bike maintenance is often outsourced to a 3rd party with a workshop since bike stations are usually uncrewed. The bike repair shops maintain the bike fleet to ensure customers experience a hassle-free ride in return for an operating fee. Furthermore, the IT solutions are a little more complex as stations are fully automated.
29 Nextbike. (2021a). The adbike. Retrieved 26-04-2021, from https://www.nextbike.net/en/adbike/

20
FF (Free Floating) The FF business model (Figure 6c) is similar to the 1WSB business model. However, investors are a critical enabling actor due to the heavy competition among operators and the committed significant investments. Currently, the rental fees of commercial bike-sharing operators are too low to make a profit (Lee & Lui, 2018). Instead, large operators like Obike, Ofo, Mobike, SG Bike, and Baicycle are rapidly burning through their venture capital cash in the pursuit of rapid expansion. For example, these operators flooded the streets of Singapore with bikes, which can be rented for about a quarter of the price of its publicly operated equivalent (Lee & Lui, 2018). The strategy of the commercial operators is to grow quickly, acquire as much market share as possible, and worry about profitability later. Since most FF bike-sharing operators have adopted this strategy, investors have become a significant player. The investors provide funding, expecting a return of investment and accepting associated risks. Furthermore, the value proposition for travelers changes to free urban mobility as bikes can be parked anywhere in a given service area. This also implies that this operating mode requires the most advanced IT, such as geo-location trackers, automated locks, and an app that shows (nearly) real-time information.
P2P (Peer-to-peer) The P2P business model, summarized in Figure 6d, is different from the business models of other modes. The operators of the P2P bike-sharing programs do not own a bike fleet. Therefore, they solely operate as platform providers. Maintaining this platform is the main activity to match demand and supply for bicycles. The operators receive transaction costs as a reward for this service. Besides travelers, bike owners are a key actor for P2P systems, as they supply the bikes. Naturally, bike owners receive rent for renting out their bikes. As mentioned in the previous section, insurance companies are also an important actor, as they lower the boundary for bike owners and travelers for participating in bike-sharing programs. The following section outlines the value streams between each of the listed actors to understand bike-sharing business models better.
4.4 Value Capture of Bike-sharing Business Models
The value exchanges between actors and bike-sharing operators in four bike-sharing operating modes are summarized in Figure 7. As explained in Section 3.3.2, black, blue, and orange descriptions represent object-, financial- and non-financial exchanges, respectively.
Traveler The value streams between the traveler and bike-sharing operator are the same for each operating mode: Travelers must register at the operator’s platform and thereby provide access to their mobility and profile data to access the operator’s bicycles. However, other non-material or non-financial value propositions of bike-sharing that apply to travelers are a) a short-distance mobility option, b) a sustainable transport option, and c) reduced transportation costs from modal shifts (Shaheen et al., 2010a).
IT provider IT providers are essential enablers of fourth-generation bike-sharing initiatives, as all operating modes rely on IT solutions to a large extent. IT providers receive an operating fee for delivering and maintaining the IT infrastructure. Since IT is at the core of many bike-sharing systems, many operators also develop and maintain IT solutions in-house, like Nextbike (Nextbike, 2021).
Local government Bike-sharing systems have potential value propositions also for cities. These value propositions include a) reduced traffic congestion, b) increased use of public transit and alternative modes, and c) health benefits (Shaheen et al., 2010a). In summary, bike-sharing systems can improve the liveability of an urban environment. However, bike-sharing should be regulated to prevent problems like oversupply, hazardous parking, and vandalism. Therefore, local governments regularly launch their service or seek partnerships and offer tenders with private operators. In some cases, bike-sharing operators receive financial support from governmental bodies to operate the system and deliver the associated societal benefits. In return, local governments can obtain mobility insights from partnerships with operators.

21
Figure 7. Value-Capture Diagram for Bike-sharing
Bike repair shop The value exchanges between the bike repair shop and the bike-sharing operator are trivial: the bike repair shop maintains the bicycle fleet and repairs broken bikes for an operating fee. Note that bike-sharing operators can also handle these operations on their own. This is often the case for 2WSB systems.
Investor Investors are significant for FF bike-sharing operators. Mainly in Asia, competitors try to capture as much market share as possible and worry about monetizing the business model later.
Bike owner Bike owners are naturally important actors in the P2P model, not in the other operating modes in which the bike-sharing operators own the bicycle fleet. In the P2P model, bike owners rent out their bikes to travelers via the bike-sharing platform. The actual handover of the bicycle happens in person. Rental fees are paid via the bike-sharing operator, which charges a service fee. Additionally, insurance fees are also delivered via the bike-sharing operator. Trust is an essential factor in P2P models. Therefore, travelers can leave reviews for bike owners to establish trust for future users.
Insurance company Like bike owners, insurance companies are essential in the P2P bike-sharing model. In other operating modes, bicycles are standardized and inexpensive. This makes bike insurances redundant, as mikes can be replaced relatively easily. Moreover, the premium would be high due to the high probability of vandalism. In the P2P model, however, bicycles are the private property of bike owners. To establish trust and lower the boundaries for participation in P2P sharing, insurance is crucial, as it reduces the exposure to risk for both bike owners and travelers.

22
4.5 Summary
The ultimate goal of bike-sharing is to expand and integrate cycling into transportation systems, such that it can more readily become a daily transportation mode (Shaheen et al., 2010a). The four business models that parties deploy to achieve this have unique value propositions. However, the systems also have multiple shared value propositions like a) increased mobility options, b) cost savings from modal shifts, c) reduced traffic congestion, d) reduced fuel use, e) increased use of public transit and alternative modes and f) increased health benefits. Five kinds of providers that try to exploit these propositions have been identified: advertising companies, public transport agencies, local government and public authorities, commercial organizations, and non-profit organizations. Their revenue sources are mainly advertising, subscription fees, usage fees, and data exploitation. Usage fees are generally determined by the length of the rental period. The key actors in bike-sharing systems are travelers, operators, local governments, IT providers, and bike repair shops.

23
5 Scooter-sharing
Unlike bike-sharing, scooter-sharing is a relatively new concept. In this paper, scooter-sharing refers to both scooters and mopeds. The essence of scooter-sharing is the same as bike-sharing: One can benefit from the advantages of a private scooter without the costs and burdens of its ownership by sharing the scooters and paying a fee upon usage. One of the first scooter-sharing concept was introduced in San Francisco in 2012 (Aguilera-García et al., 2020). Since then, the uptake has been slow for the first few years, but scooter-sharing has begun to flourish since 2016 (Howe & Bock, 2018). Still, limited research has been published on the topic. Aguilera-García et al. (2020) indicate that contributions to the academic literature have characterized innovative mobility options such as car-sharing or bike-sharing. Still, almost no efforts have been made to explore the use of the moped scooter and scooter-sharing services. To our knowledge, no detailed research has been published on the business models of scooter-sharing services currently active in the market.
This section provides a brief overview of the current state of the scooter-sharing market, based on several market reports, such as Howe and Bock (2018), Schellong et al. (2019), and Howe and Jakobsen (2020a). This is complemented by a desk study of scooter-sharing operators listed in Table 4. Then, we describe the scooter-sharing business models currently dominating the market.
Table 4. Reviewed Scooter-sharing Services
Operator Name Country/Region
Acciona Italy, Spain
Bird Europe, North America
Blinkee Europe
Bolt Europe
Bounce India
Check The Netherlands
CityScoot France, Italy, Spain
eCooltra Italy, Spain, Portugal
Emmy Berlin, Germany
Felix Belgium, Germany, The Netherlands
Go Taiwan
GoSharing The Netherlands
iRent Taiwan
Movo Spain
Muving Spain
Lime Worldwide
Tier Germany
VOGO India
Revel US
Scoot US
WeMo scooter Taiwan
Yego France, Spain
5.1 Scooter-sharing Market
The market reports published by Howe and Bock (2018) and Howe and Jakobsen (2020a) show the recent development of the shared moped scooter market. Figure 8 shows the number of registered mopeds

24
worldwide. The growth in mopeds has been exponential since 2015 and reached 104.000 in 2020. Additionally, the number of registered users grew from 1.87 million in 2018 to 8.7 million in 2020 globally (Howe, 2018; Howe & Jakobsen, 2020). The most significant growth of scooter-sharing concepts is observed in Europe, India, and Taiwan. The Netherlands has seen the largest relative increase of registered mopeds of almost 800% in 2020. The growth of the scooter-sharing market is expected to continue. Schellong et al. (2019) estimate the market’s total value between 40 and 50 billion US Dollars by 2025. Similar to shared bikes, shared scooter concepts are either free-floating or station-based. However, the station-based model, where users access and park their scooter at a rental location, is far less dominant for scooters than for bikes. Specifically, only 1% of the scooter-sharing systems are station-based systems, and over 99% are flee-floating systems (including rare hybrid models) (Howe, 2018).
Figure 8. Number of shared mopeds since 2012 (Howe & Jakobsen, 2020)
Five major market trends are indicated in the aforementioned market reports.
1) First, local governments impose stricter regulations, and tenders are offered for service areas. For example, restricted areas are defined, and a maximum number of scooters and providers are determined for specific areas.
2) Secondly, the business models are becoming more diverse. Operators are experimenting with different revenue models like long-term renting and subscriptions to achieve a more robust and longer relationship with customers.
3) The third trend is that the competition is increasing rapidly. More and more cities have multiple active operators. In Barcelona, as many as ten operators have been active in 2020.
4) Fourth, measures to increase driver awareness are being implemented. For example, new safety measures include in-app safety training, a helmet selfie that riders and their passengers must complete before each ride, an in-app community reporting tool that members and non-members alike can use to report bad behavior, and GPS trackers that detect undesired behavior (like driving in forbidden areas).
5) Finally, the fleets of operators are becoming multimodal. Moped sharing operators are adding kick scooters or bikes, and other shared mobility operators introduce mopeds to their fleets.
The primary enabling tool for the scooter-sharing service is a digital platform. Each provider typically has its own platform to create a personal account that gives access to the service. Note that scooter-sharing operators are not platform businesses since their supply (the scooter fleet) is typically provided by the operator rather than external suppliers. The following section elaborates on the business model for free-floating scooter-sharing services, the dominant operating mode.

25
5.2 Business Model Blueprints of Contemporary Scooter-sharing Services
Scooter-sharing concepts offer their services through a digital platform. Therefore, the platform users (travelers), the mobility provider (operator), and the IT provider are the most important actors in the scooter-sharing business model. Other actors include local governments, investors, and financial institutions.
Traveler: Travelers must register and provide account details at the platform. Registering is almost always free and users usually pay to peruse. In return, the main benefit of scooter-sharing for travelers currently is mobility for short to medium traveling distances in urban areas. Field Schellong et al. (2019) claim that scooters are mainly used for trips between 1 and 5 kilometers, and Howe and Bock (2018) have estimated the typical length for trips with moped scooters between 4 and 5 kilometers. Other benefits that apply to shared-use vehicles systems in general are:
a) the provision of a mobility solution that can be more flexible than public transport and more convenient than a private vehicle,
b) potentially lower transportation costs for users, c) reduced need for parking spaces, and d) improved livability of urban areas through less congestion, better air quality, and reduced noise
(Aguilera-García et al., 2020; Barth & Shaheen, 2002).
The latter applies only to electric scooter fleets. Generally, almost all mopeds have electric engines outside India (Howe & Jakobsen, 2020). Also, note that the final two benefits benefit the region/community rather than the traveler.
Figure 9. Scooter-sharing business model blueprint
Scooter-sharing Service Operator: The mobility providers cover daily operations like charging the batteries, redistribution of scooters, maintenance, and customer service. Additionally, the platform through which the service is offered must be developed and maintained, either in-house or by a third party.

26
IT Provider: As mentioned, IT infrastructure is the backbone of scooter-sharing concepts. Since almost all shared scooters are free-floating, GPS trackers and applications are used to determine the location of scooters and match demand and supply. Moreover, locking and unlocking scooters also requires digital infrastructure since there are no stations with operators. Other crucial aspects of the system, like user and driver’s license verification, payment details, and geo-fences, are enabled by modern IT solutions. Hence, a reliable IT provider is essential unless it is developed and maintained in-house.
Local Government: The introduction of scooter-sharing has not been without hurdles. One of the issues, for example in Spain, has been the oversupply of scooters. In the race to obtain market share, operators filled the streets with scooters, resulting in hindrance for pedestrians and hazardous parking. Local governments are trying to solve this problem by regulating the supply by defining a maximum number of scooters in certain areas or offering tenders to operators. To ensure that the use of e-scooters progresses in a way that supports mobility goals, cities will need to rethink several facets involving the traffic rules, public safety, parking and no-scooter zones, permits, data requirements, and liability (Schellong et al., 2019). The positive impact of scooter-sharing can only be achieved if these issues are adequately addressed in cooperation with the operators. Therefore, the local governments are important actors in the scooter-sharing business model.
Investor: Although scooter-sharing is considered not profitable (yet), the market is growing rapidly (Schellong et al., 2019). The same trend for bike-sharing is observed in this market: Operators have been trying to expand quickly to capture market share and worry about profitability later. In line with this observation, Schellong et al. (2019) indicate four focus points for providers to overcome the profitability issue:
a) optimize operations, b) improve product durability, c) develop a strategy for rapid growth, and d) increase funding.
Scaling up quickly will help companies acquire a customer base and preempt competitors. Moreover, raising large financial reserves will allow companies to finance sufficient production capacity and expand into more cities while buying time to break even. To cover the losses and expand simultaneously, investors who are willing to accept the financial risk for the potential return are crucial.
Financial institution: The transactions are enabled by financial institutions. These institutions typically handle all financial transactions for an operating fee.
5.3 Value capture of Scooter-sharing Business Models
The actors identified in the previous section are mapped in a value capture diagram (Figure 10). The value exchanges between actors in the scooter-sharing business model and the scooter-sharing operator are elaborated in this section.
Traveler: The primary source of revenue for scooter-sharing operators comes from rental fees paid by travelers. Additionally, travelers provide operators with their mobility and profile data, which can potentially be monetized. In essence, the main value propositions for travelers are the same as for bike-sharing: 1) increased (urban) mobility options, 2) flexibility, and 3) reduced transportation costs from modal shifts. To deliver the value, the operating costs for scooter-sharing companies are significant. The scooter-sharing business often is not profitable (Schellong et al., 2019). In 2018, the cost structure per scooter ride of scooter-sharing operator Bird was published by Efrati and Weinberg (2018), based on a copy of an investor presentation. The average revenue per scooter ride for Bird was $3.65. The costs per ride (and percentage of average revenue per ride) were reported as follows: $1.72 (47%) to pay people to charge the scooters, $0.51 (14%) for maintenance and repairs, $0.41 (11%) for payment handling fees, $0.20 (5%) for permit

27
fees, $0.06 (2%) for customer support and $0.05 (1%) for insurance fees. Bird has to cover fixed costs such as its employees and offices and sales and marketing from the remaining $0.70 (19%) per ride. Schellong et al. (2019) have estimated similar figures for scooter-sharing operators in general, estimating the average price per ride at $3.50, leaving a margin of $0.65 after deducting payment handling costs ($0.40), tax and insurance fees ($0.25), costs for scooter maintenance and repairs ($0.50) and operational and charging costs ($1.70). The authors calculate that the time to break even per scooter (assuming five rides a day on average and an average vehicle price of $375) is almost four months. In contrast, the average durability of scooters is only three months. Hence, scooter-sharing companies are operating with losses even without considering fixed costs.
Figure 10. Value-Capture Diagram for Scooter-sharing
Investor: Since the margins per ride are small, operators should handle large volumes to become profitable. Thus, operators are competing for market share to become profitable as the industry grows and matures. Tens of millions are invested in placing scooters at every street corner and becoming the most visible operator (Howe & Bock, 2018). Crowdfunding is used to foster market expansion (e.g., Emmy 30 , Felyx31 , and Blinkee32). In addition to maximizing brand visibility, discounts and initial free rides are offered, and providers try to build a strong brand identity to attract new customers. This rapid growth strategy has led to a market where only a few well-funded companies have a large market share. In fact, 49% of the mopeds were owned by just five operators as of 2020 (Howe & Jakobsen, 2020). Hence, investors could gain large returns on their investments if these operators successfully monetize the business model. Naturally, investments expose the investors to financial risk if the business fails.
In addition to the rapid expansion strategy, operators are experimenting with business models to reduce operating costs and establish more long-term relationships with customers. For example, Felyx31 has
30 Emmy. (2021). Emmy — how much does it cost? prices and fees. Retrieved 24-10-2021, from https://emmy-sharing.de/en/prices/ 31 Felix. (2021). Felix— onze prijzen zijn slimmer geworden. Retrieved 06-04-2021, from https://felyx.com/nl/nl/denhaag/dynamic-pricing 32 Blinkee. (2021). Renting a vehicle for minutes has never been so easy! Retrieved 16-05-2021, from https://blinkee.city/en

28
recently implemented dynamic pricing: rental prices of mopeds in areas with low demand are lower than prices in areas with high demand. This way, the company tries to match the demand and supply across areas better to reduce the need for relocation of scooters and increase revenue at the same time. Other companies like Muving33, Emmy30 and GoSharing34 are offering various memberships in addition to the regular fee per minute. Customers with a membership can use the scooters at a reduced tariff. The goal is to bind the customer to a specific operator. Also, more extended rental periods are offered. For example, the Indian provider Bounce 35 offers daily, weekly, monthly, and annually rental periods. Other diversifications of business models include different driving modes. The Spanish operator Acciona36 offers three modes for speeds up to 50, 80, and 100 kilometers per hour at increasing rates. Their scooters can therefore also be used outside urban areas. Thereby, the operator attempts to expand the value proposition of scooter-sharing outside urban areas alone.
Local Government: Besides differentiating business models, increasing city regulations and tenders is another trend in the scooter-sharing market (Howe & Jakobsen, 2020). Unsurprisingly, cities are concerned about the growth of e-scooters, given the problems such as obstructed sidewalks, vandalism, and hazardous driving, demonstrated by the earlier rise of free-floating bike-sharing systems. In response, cities can penalize or impose limitations on providers that do not abide by existing rules. However, cities can also proactively regulate the service and work together with operators to foster the benefits and bypass the pitfalls (Schellong et al., 2019). To promote the benefits and improve the city livability, local governments and scooter-sharing operators should reach agreements on service areas, the maximum number of mopeds, safety measures, complaint regulations, and integration in mobility applications. Local governments and scooter-sharing operators can even work together to optimize the service. For example, the director of CHECK states in an interview that live dashboards are shared with policymakers to assess the service’s efficiency and that the local government provides access to parking data to facilitate safe parking (Schellong et al., 2019). Such collaborations improve the chances of scooter-sharing to become a sustainable urban mobility solution.
IT Provider: As for all shared mobility operators, the IT platform is an important enabling tool. Therefore, the IT provider is also an important actor in the scooter-sharing business model. Note that the scooter-sharing operators can also develop and maintain their own platform, in which case the IT providers are not a separate actor.
Financial institution: Finally, the financial institution is crucial for handling financial transactions. Naturally, transaction fees can differ depending on specific agreements. A realistic estimation is given earlier in this section, at about $0.40 per transaction.
33 Muving. (2021). Muving — prices and packs. Retrieved 06-04-2021, from https://www.muving.com/en/prices-andpacks-2 34 GoSharing. (2021). Gosharing — prijzen en voordeelpakketten. Retrieved 06-04-2021, from https://nl.gosharing.com/prijzen/ 35 Bounce. (2021). Bounce-a — for the ”atmanirbhar” indian commuter. Retrieved 06-04-2021, from https://bounceshare.com/subscription 36 Acciona. (2021). Acciona — home page. Retrieved 06-04-2021, from https://movilidad.acciona.com/en ES/madrid/

29
6 Car-sharing
Like bike-sharing and scooter-sharing, the principle of car-sharing is that individuals can enjoy the benefits of a car without the costs and responsibilities associated with car ownership. Early attempts at introducing car-sharing services are traced to Sefage, a Swiss cooperative in 1948 (Shaheen et al., 1998), followed by multiple European initiatives in the following years. The motivation behind these efforts was mainly to offer the perks of owning a car to those who could not afford one. However, all early car-sharing initiatives were terminated relatively quickly. It was not until the late 1980s that successful car-sharing initiatives were launched in Switzerland and Germany, motivated by environmental concerns (Münzel et al., 2018). Since then, car-sharing has spread worldwide, and various business models have emerged. However, only recently, the attractiveness of car-sharing for both operators and users has significantly increased, mainly driven by advances in the digital technologies (Remane et al., 2016).
As mentioned in Section 2, the advancements in car-sharing programs have been noticed by researchers, and the number of publications on car-sharing concepts has increased significantly over the last few years. Although relatively little attention has been given to the car-sharing business models (Degirmenci & Breitner, 2014a; Ferrero et al., 2015), some attempts have been made to identify and classify operational business models for car-sharing. For example, Remane et al. (2016) have developed a taxonomy to organize the business models of 94 car-sharing operators into seven categories. More recently, Lagadic et al. (2019) distinguished five main car-sharing business models, and Bocken et al. (2020) divided the Swedish market into three main categories, emphasizing cooperative models. Most research, however, classifies the car-sharing market into these three operating modes: station-based (SB), free-floating (FF), and peer-to-peer (P2P) models (Cohen & Kietzmann, 2014b; Degirmenci & Breitner, 2014a; Ferrero et al., 2015; Jochem et al., 2020; Münzel et al., 2018; Perboli et al., 2018). Together with the most important actors, we summarize these models below as depicted in a single SDBM/R (Figure 11). We are elaborate on the corresponding value streams. The summaries are based on the previously mentioned literature on car-sharing and desk research on the operators listed in Table 5.
Table 5. Reviewed Car-sharing Operators
Operator Operating Mode Country/Region
Amber FF The Netherlands
Car Next Door P2P Australia
Enjoy FF Italy
EvCard FF China
Flinkster SB Germany
Getaround P2P US
Greenwheels SB The Netherlands
Hertz on Demand SB Worldwide
ioGuido FF Italy
JustShareIt P2P US
Modo FF Canada
MyWheels SB The Netherlands
ShareNow FF Europe
Stadtmobil SB Germany
Turo P2P Worldwide
Zipcar SB Worldwide
Note: SB = station-based; FF = free-floating; P2P = peer-to-peer

30
6.1 Operating modes
Station-based (SB) The station-based (SB) sharing system is the earliest business model in the car-sharing industry and appeared in the 1980s (Münzel et al., 2018). In this model, organizations (operating for-profit, e.g., Greenwheels37, or not-for-profit, e.g., Modo38) own a fleet of cars that customers can use. This fleet is stationed at one or more stations. Two variants of the SB sharing system can be distinguished: centralized SB systems and decentralized SB systems. In the centralized model, the provider operates from one or a few large, centralized stations. The operations are often managed from these stations.
On the other hand, decentralized systems utilize many designated stations for one or a few cars, spread around the service area, rather than a few large central stations. Decentralized SB systems are managed from a distance, and operators rely on information technology to manage their fleet. Both decentralized and centralized SB services depend on many assets, such as parking places and vehicles. Other required resources include a service team, a website, and a mobile application or platform.
The main activity for car-sharing operators is car rental. Other key activities that must be performed are vehicle maintenance (e.g., cleaning and fueling), fleet management (vehicle repositioning, delivery confirmation, damage handling, etc.), and customer service. The costs that these activities incur are considerable, especially in decentralized systems. Therefore, providers are experimenting with simplifying the operations and reducing costs. For example, MyWheels39 has introduced a membership where the customers can become car administrators. Car administrators typically live near the car’s fixed position and are responsible for small maintenance, like cleaning, checking the oil level, and checking tire pressure. In return, the car administrators can use the car-sharing service at a reduced tariff. Other operators offer discounts to customers for small services like refueling to reduce operational costs.
The fleet management complexity of traditional (centralized) SB car-sharing services is relatively low compared to other models since the vehicles are returned to the same parking spaces where they were initially rented. Consequently, it provides less flexibility for the users since they must travel to the station. Therefore, this business model is most suitable for occasional usage rather than daily commutes or other routine trips (Perboli et al., 2018). Alternatively, decentralized SB car-sharing systems offer more flexibility to the customer since shared vehicles are often closer and easier to reach. Hence, this model is more suitable for routine trips or commutes.
SB car-sharing companies can either be commercial or non-commercial. An example of a non-commercial party is IoGuido in Italy, a member of the car-sharing initiative ICS (ICS is a national coordination structure promoted and sustained by the Italian Ministry of the Environment with the aim to support local municipalities interested in developing local car-sharing services to create a national car-sharing network). Such public parties benefit from advantages like gratuity for customers to park in the streets while the service is active, designated parking spots in public areas, and the right for its cars to circulate in restricted traffic areas and tax-related benefits (Perboli et al., 2018).
Commercial parties on the other hand, often seek partnerships with local authorities to reach agreements on parking and accessibility rights to lower the boundaries of adoption. In turn, municipalities can stimulate the adoption of car-sharing by engaging in these partnerships. Another method that is being deployed to reach new customers are establishing further partnerships with other parties (e.g., retail stores, shopping malls, and universities), and offer exclusive parking spots in these parking areas and/or other combined agreements and promotions. Additionally, SB car-sharing companies frequently engage in strategic partnerships with suppliers to lower operational costs. Examples of such suppliers are car manufacturers, insurance companies and fuel distributors.
37 Greenwheels. (2021). Een auto wanneer jou het uitkomt. Retrieved 20-05-2021, from https://www.greenwheels.nl/ 38 Modo. (2021). Car-sharing with modo starts at $4/hour. Retrieved 20-05-2021, from https://www.modo.coop/ 39 MyWheels. (2021). Mywheels — meer weten over. Retrieved 06-04-2021, from https://mywheels.nl/help/beheerder/activiteiten/wat-is-een-beheerder-wat-doet-een-beheerder

31
Free-floating (FF) The free-floating (FF) business model has only picked up recently as recent technological advancements mainly enable it. Like FF bike-sharing and scooter-sharing, this model allows travelers to pick up and drop the car at any location within the service area. Despite its short lifespan, the business model has gained significant market share. In North America, for example, 36.3% of the car-sharing fleets were one-way trip capable, and 49.5% of car-sharing program members had access to these fleets as of January 2018 (Shaheen & Cohen, 2020), while the first FF car-sharing operation started in 2008 by Daimler (Münzel et al., 2018). Compared to station-based systems, the FF model offers the customers more flexibility, and therefore the model is better suited for daily commutes or other regular trips.
The operators, however, face a more complex logistic challenge to maintain the fleet since the positioning of the cars is continuously subject to change. Moreover, fleet availability is essential for FF service providers and must be delivered by the car-sharing companies (Perboli et al., 2018). Therefore, the demand imbalance between areas implies that vehicles must be relocated to maintain a certain service level in the entire service area. FF system operators try to reduce the complexity of operations by stimulating users to refuel (or recharge) by offering discounts and by introducing dynamic pricing strategies to balance demand between areas.
As opposed to the SB system, the FF system does not require designated parking spaces for the fleet. However, the elimination of proprietary parking spaces might create difficulties for travelers in areas where it is hard to find available parking spots. This problem is usually addressed by the FF car-sharing companies by assigning designated parking spots in critical areas, such as train stations, metro stations, and shopping centers. Hence, partnerships with public authorities are also important for FF system providers. Like FF bike- and scooter-sharing systems, the FF car-sharing model highly depends on its IT infrastructure and a mobile platform, through which customers can find, book, lock, and unlock vehicles.
Peer-to-peer (P2P) The peer-to-peer (P2P) car-sharing business model appeared around 2010 (Münzel et al., 2018). Similar to FF car-sharing models, the P2P model has recently gained popularity, as it is enabled by developments in information technologies. In this business model, operators provide a platform where private car owners and users can be matched, and additional services like insurances are offered (Shaheen et al., 2012). Therefore, P2P car-sharing can be characterized as a two-sided platform (e.g., Turo), where private car owners act as suppliers and car users act as consumers. The main motive for suppliers to participate is the income from rent. The main benefit for travelers remains the same compared to other models: mobility without the costs and responsibilities associated with car ownership.
Although the benefit remains the same, the P2P model is unique in its viable region. SB and FF models are only viable in urban areas since high utilization is required to cover the costs of maintaining the fleet. In the P2P model, however, car owners can offer their cars at zero marginal costs (or a small subscription fee), and supply occurs at the owner’s location. Thus, the P2P model is viable in both urban and rural regions.
The critical activities of P2P car-sharing operators are developing and maintaining the digital platform. These activities also incur most of the costs in this operating mode. Since the companies solely operate as platform providers and do not own a car fleet, P2P car-sharing operators rely less on assets. Key partnerships are often with insurance companies and financial institutions to handle insurances and transactions. Like P2P bike-sharing, insurance lowers the boundary for participation in car-sharing for both suppliers (car owners) and travelers since both parties are exposed to less financial risk. Unlike the other car-sharing business models, the P2P model does not require much governmental involvement as it only uses existing infrastructure, and no designated parking spaces or charging stations are needed. The downside is that marketing and branding become more complex as P2P models cannot express their brand through the car fleet or advertisements at centrally located parking spaces.
6.2 Business model actors
Figure 11 depicts a reference business model for car-sharing services featuring the most important actors. Below, we elaborate on the role of each actor.
32
Traveler More and more travelers get access to shared vehicles, as the global car-sharing market is growing rapidly, which is expected to continue (Berger, 2018). Still, some car-sharing programs have displayed limited success in the past or have even shut down, which has rendered the dimensions (factors) influencing travelers’ acceptance of car-sharing business models important (Hahn et al., 2020). The following dimensions are considered critical:
a) type of market mediation b) price model c) fleet variety d) mode of drive e) pickup and drop-off mode f) availability g) service level.
The results of the study by Hahn et al. (2020) show that the providers should develop car-sharing business models that feature an electric, free-floating fleet with fast availability to maximize adoption. Additionally, operators should offer an all-in service, low required customer participation, and a pricing model that combines usage-based and monthly fees. The customer target segment that is most open to adoption is a young and highly educated clientele. The ideal model reflects a combination of customers’ desire for flexibility, convenience, predictability, and a good conscience. Another critical request of the customers is that the operators offer an electric car fleet, reflecting the environmental considerations to participate in car-sharing. In addition to customers’ environmental concerns, a survey held by S. Shaheen and Cohen (2007) showed that reduced transportation costs are the primary motivation for travelers to participate in car-sharing. The authors indicate that car ownership costs have increased in recent years due to rising energy prices and scarce parking in many of the world’s largest cities. Shared vehicle use has the potential to lower these costs for travelers.

33
Figure 11. Car-sharing business model
Car-sharing operator Car-sharing programs are run by various types of organizations. Remane et al. (2016) have identified three kinds of organizations that operate car-sharing programs: private companies, cooperatives, and governments. Although some cooperatives (e.g., Modo) and government-run car-sharing programs (e.g., IoGuido) are still operational, most car-sharing companies are private. In fact, a white paper by S. Shaheen and Cohen (2020) describing the North- and South American car-sharing industry indicates that 100% of South American operators are private companies, and in the US, the private companies represented 61.0% of the operators and account for 99.6% of the members and 98.9% of shared vehicles. Car-sharing is often the core business of the service providers.
However, subsidiaries of vehicle suppliers have recently entered the car-sharing market in pursuit of finding new channels to sell their cars (e.g., Daimler, BMW, and FCA group). As of January 2018, four car manufacturers collectively represented 46.7% and 34.1% of the car-sharing membership and fleets deployed in North America, respectively (Shaheen & Cohen, 2020). Besides car manufacturers, car-sharing service providers, and public actors, another type of actor has entered the car-sharing market: traditional car renters. (e.g., Hertz, operating under the name “Hertz on Demand”40, and Avis, operating under the name Zipcar 41 ). Car renters have the advantage of already owning a car fleet and maintenance infrastructure which reduces the costs of entry. Additionally, these established firms have the financial capacity and the client base to launch such a service. As explained in the previous section, the main activity for car-sharing operators is fleet and system management. While the complexity of operations differs across
40 Hertz on Demand. (2021). Hertz 24/6. book. unlock. go. Retrieved 20-05-2021, from https://www.hertz247.com/ 41 Zipcar. (2021). Instantly book cars around you. Retrieved 20-05-2021, from https://www.zipcar.com/
34
operating modes, these activities mainly consist of vehicle repositioning, delivery confirmation, damage handling, vehicle cleaning, refueling, and customer service.
IT provider As in other sharing services, advanced IT infrastructure plays an important role in the car-sharing industry. Whereas traditional car renting has been a manual process for years, new operating modes, such as the FF, decentralized SB, and P2P models have been enabled by advancements in IT. Fully automated systems (i.e., automated reservations, integrated billing, and advanced vehicle-access technologies) are becoming more and more popular in developed regions where labor costs are high and IT solutions help to keep costs down for car-sharing operators (Shaheen & Cohen, 2007). Hence, partnerships with IT providers are crucial for car-sharing operators.
Local government Car-sharing services have the potential to partially address the challenges of urban areas, such as congestion, pollution, and limited parking space. A recent study by Jochem et al. (2020) shows that the FF car-sharing has reduced private car ownership in 11 cities and that a single shared car can replace up to 20 private cars in an optimistic scenario. Therefore, the local governments should embrace car-sharing and develop appropriate policies. The case study in Sydney by Dowling and Kent (2015) reveals that car-sharing’s success is relatively reliant on a series of complex negotiations between public and private actors. For example, the behavior change strategies and public education campaigns may encourage residents to adopt car-sharing. However, these campaigns will not succeed without the appropriate infrastructure in place. Thus, more importantly, local governments can facilitate in providing locally appropriate and financially feasible availability of carshare parking (Dowling & Kent, 2015). Assigning designated parking spaces is especially relevant for decentralized SB systems, and for FF car-sharing companies in critical areas where it is hard to park. The availability of parking serves as an incentive for travelers to participate in car-sharing and therefore helps local governments reach sustainable mobility goals.
Investor Entering the car-sharing industry is capital intensive. The cost structure of car-sharing companies is characterized by a high portion of fixed costs, related to the fleet acquisition and the development of complex information systems to operate the business (Perboli et al., 2018). To break even, providers strive for high utilization of the fleet. Therefore, acquiring a large customer base and increasing the service usage among customers is very important for car-sharing companies (Perboli et al., 2018). This implies that the car-sharing operators need to invest heavily in marketing activities and in their fleet. The required capital typically comes from large investors. For example, Daimler and BMW invested $1.1 billion in urban mobility services, including the car-sharing program ShareNOW in 2019 (Dillet, 2019). Still, to the authors’ knowledge, no private car-sharing operator has published any financial statements or has proven to be profitable, which is in line with the findings of Lagadic et al. (2019). Instead, like the case of scooter-sharing, the providers are accepting losses in the competition for market share to exploit economies of scale in the future. An additional challenge for private companies in regions where public companies are active is that the private companies must reach a minimum target of service hours to break even to be a sustainable business, whereas the public companies must only meet public demand to create the projected positive impacts on traffic, mobility, and the environment (Lagadic et al., 2019).
Financial institution Like bike-sharing and scooter-sharing operators, car-sharing operators require partnerships with financial institutions to handle transactions. These partnerships are especially relevant for fully automated systems.
Insurance company Vehicle insurance is a major operational cost of car-sharing. During the interviews conducted by S. Shaheen and Cohen (2007), twenty-eight experts from countries with current car-sharing operations indicated that the insurance is obtained through private-sector insurance carriers and two experts from Australia and Canada reported that the car-sharing insurance is obtained through governmental policies. In the same interviews, specialists from a few countries mentioned challenges in finding insurance services. These issues were mainly related to securing insurance for young, old, and international drivers. Still, the insurance
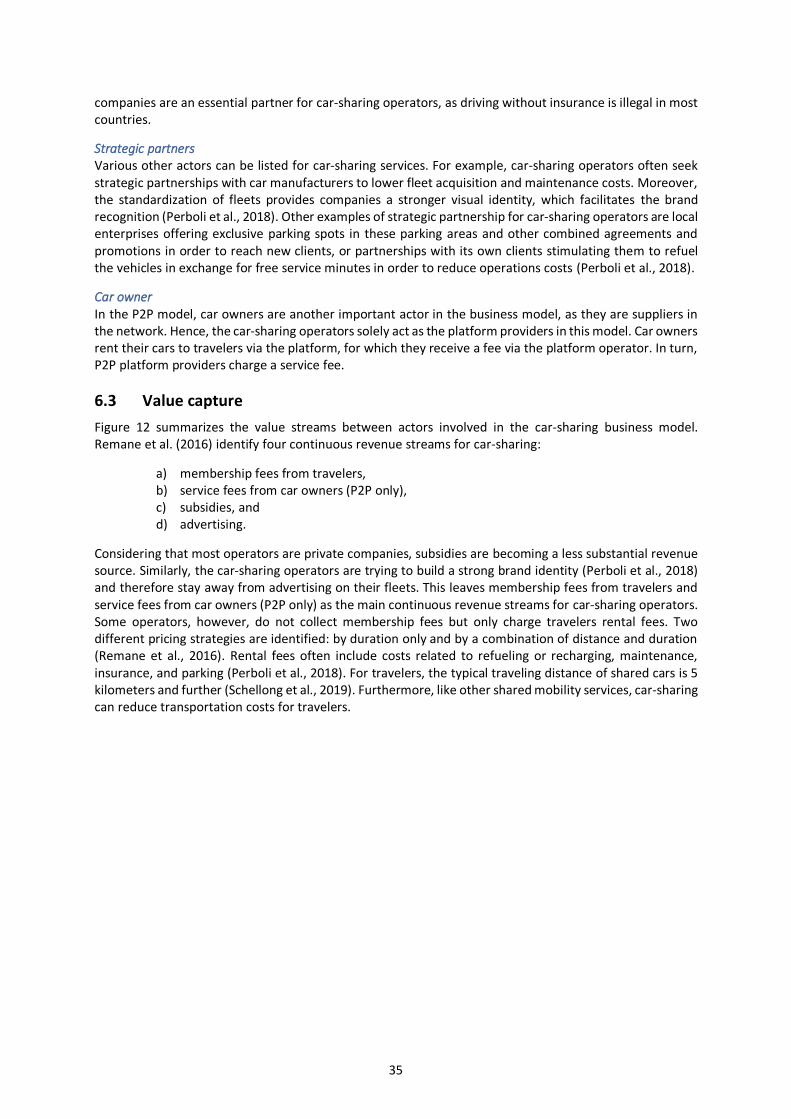
35
companies are an essential partner for car-sharing operators, as driving without insurance is illegal in most countries.
Strategic partners Various other actors can be listed for car-sharing services. For example, car-sharing operators often seek strategic partnerships with car manufacturers to lower fleet acquisition and maintenance costs. Moreover, the standardization of fleets provides companies a stronger visual identity, which facilitates the brand recognition (Perboli et al., 2018). Other examples of strategic partnership for car-sharing operators are local enterprises offering exclusive parking spots in these parking areas and other combined agreements and promotions in order to reach new clients, or partnerships with its own clients stimulating them to refuel the vehicles in exchange for free service minutes in order to reduce operations costs (Perboli et al., 2018).
Car owner In the P2P model, car owners are another important actor in the business model, as they are suppliers in the network. Hence, the car-sharing operators solely act as the platform providers in this model. Car owners rent their cars to travelers via the platform, for which they receive a fee via the platform operator. In turn, P2P platform providers charge a service fee.
6.3 Value capture
Figure 12 summarizes the value streams between actors involved in the car-sharing business model. Remane et al. (2016) identify four continuous revenue streams for car-sharing:
a) membership fees from travelers, b) service fees from car owners (P2P only), c) subsidies, and d) advertising.
Considering that most operators are private companies, subsidies are becoming a less substantial revenue source. Similarly, the car-sharing operators are trying to build a strong brand identity (Perboli et al., 2018) and therefore stay away from advertising on their fleets. This leaves membership fees from travelers and service fees from car owners (P2P only) as the main continuous revenue streams for car-sharing operators. Some operators, however, do not collect membership fees but only charge travelers rental fees. Two different pricing strategies are identified: by duration only and by a combination of distance and duration (Remane et al., 2016). Rental fees often include costs related to refueling or recharging, maintenance, insurance, and parking (Perboli et al., 2018). For travelers, the typical traveling distance of shared cars is 5 kilometers and further (Schellong et al., 2019). Furthermore, like other shared mobility services, car-sharing can reduce transportation costs for travelers.

36
Figure 12. Value Capture Diagram car-sharing
The absence of financial reports obstructs detailed and quantifiable analyses of how actors capture value. Still, some limited sources indicate some value streams. For example, S. Shaheen et al. (2006) estimated that car-sharing insurance costs more than $2,500 per vehicle per year. Note that the actual number is likely to be lower, as car-sharing has become more conventional since then. The estimation was based on prices in North America, where car insurance is typically expensive. Other value exchanges are similar to those of the bike- and scooter-sharing business models, presented in Figure 7 (page 21) and Figure 10 (page 27).

37
7 E-hailing
Early forms of taxi services were operated by coachmen with a horse and a carriage (Darbéra, 2017). Since then, the vehicles have modernized and taxi services have spread around the world while the business models have remained virtually unchanged: The traditional taxi operator owns a fleet of vehicles, which is deployed to serve the customers with a mobility option.
The most disrupting business model change came in 2009 when Uber introduced the e-hailing concept in San Francisco, United States (Walji & Walji, 2016b). The difference between an e-hailing service and the traditional taxi service is that taxi drivers and passengers can be directly connected through third-party mobile phone applications in the former (Su & Fang, 2019). As for other ridesharing modes, the disruption was enabled by technological advancements. More specifically, the mass adoption of smartphones allowed geo-locations to be used by both customers and drivers to match demand and supply more efficiently. In the business model of Uber, the company acts as a two-sided platform that matches riders (supply) and drivers (demand). The platform business model allowed for rapid growth and Uber has become available in over 63 countries covering more than 700 cities by December 201842.
While Uber quickly grew, other companies like Cabify, Lyft and Grab quickly launched similar services to claim a share in the taxi service market. Compared to traditional taxi services, the main competitive advantage of platform-based taxi services include:
a) better adapted to fluctuating demand due to flexible labor, b) cheaper equipment (no need for a radio, colored car, taxi meter, rooftop sign), c) dispatch is cheaper and faster, and d) the optimization with algorithms is more efficient and surge pricing compared to manual
(human) optimization (Darbéra, 2017).
According to Paronda et al. (2017), the most important reasons for travelers to use mobility services like Uber or Grab are convenience, safety, and reliability.
The rise of Uber-like taxi services has also triggered many regulatory issues concerning amongst others protection of existing market, labor rights, licensing and safety (complaints like overcharging rude drivers and reckless driving are common) (Walji & Walji, 2016a). In addition, the surge pricing phenomenon, long work hours, and market competition are also subjects of concern (Su & Fang, 2019). As the market is maturing, governments are fixing these problems, and regulations that protect the traditional taxi businesses are starting to disappear (Wyman, 2017). It is expected that the platform-based business model will become the dominant model in the future due to the scalability of the network and the competitive advantages compared to traditional taxi services (Eckhardt et al., 2017). Additionally, traditional taxi services are often not integrated in the MaaS platforms. The e-haling business model is summarized in Figure 13.
42Uber — bedrijfsinformatie. Retrieved 06-04-2021, from https://www.uber.com/nl/newsroom/bedrijfsinformatie/

38
Figure 13. E-hailing business model
The following section describes the actors and the roles of each actor in e-hailing in more detail, based on the existing research and a desk study of the e-haling operators as listed in Table 6.
Table 6. Reviewed e-hailing operators
Operator Name Country/Region
Arro US
Cabify Spain, Portugal, South America
Curb US
DiDi Worldwide
Easy Taxi Worldwide
Gett Worldwide
Grab Southeast Asia
Lyft US
FreeNow Europe
PideTaxi Spain
Uber Worldwide
Via US
Wingz San Francisco, US

39
7.1 Business model actors
As for any two-sided platform business model, the platform provider, the customers, and the suppliers are the most important actors. In the specific case of e-hailing businesses, these actors are the e-hailing operator, traveler, and driver, respectively. Due to the regulatory challenges triggered by the rise of e-hailing companies, local governments are also considered an important actor in the e-hailing business model.
E-haling operator The primary responsibilities for the operators of the traditional taxi service consist of driver recruitment, driver training, dispatch, record keeping, vehicle ownership, and vehicle maintenance (Darbéra, 2017). In e-hailing, the responsibilities related to vehicle ownership and vehicle maintenance are transferred to the drivers (Darbéra, 2017), as drivers can use their private cars as taxis. Driver recruitment is performed via promotional activities to attract new drivers, while driver training is handled via digital in-app instructions. The main activity of e-hailing companies is to match demand (travelers) with supply (driver) through a mobile application (Paronda et al., 2017), the ’dispatching’ taxis. Additionally, e-hailing companies aim to establish trust between parties through reviews and safety measures. Essentially, the platforms act as private regulators by collecting reviews and banning providers and users who misbehave in the eyes of the platform company (Pelzer et al., 2019).
Existing taxi-hailing apps can be categorized into two categories based on how they operate (Wang et al., 2016). The first type functions as an information platform that distributes customer requests to nearby drivers. In turn, the drivers can determine whether to accept the order or not. This model provides the most freedom for the drivers and is the most favorable. The second type of e-hailing apps operates as a dispatching center. The customer orders are assigned to drivers based on a matching algorithm. In this model, drivers must take the orders. This model sacrifices drivers’ freedom but guarantees a much higher rate of successful matching and is, therefore, more favorable to the customers.
The most well-known e-haling provider is Uber. Uber has started in 2009 and was launched in 2010 in San Francisco43. Since then, their growth has been exponential up until 2016 (Walji & Walji, 2016a). Such growth is possible due to the design of platform business models. Platform businesses like e-haling companies are launched through the internet in the form of an app that anyone can download. This enables a platform company to introduce a new service at almost zero marginal cost and from any remote destination, enabling a particularly aggressive launching strategy (Pelzer et al., 2019). Some argue that this growth is beneficial to both drivers and travelers because passengers benefit when a platform like Uber has large numbers of drivers, and drivers benefit when the platform has a large network of passengers (Wyman, 2017). Although Uber is the largest e-haling provider, new players could enter the app market relatively easily. The fixed costs related to establishing a taxi app are relatively low, and it is not too difficult for passengers and drivers to use multiple platforms (Wyman, 2017). Djangostars (2021) estimates that it takes 2,000 to 2,500 hours to develop an Uber-like app. At a rate of about $60 per hour in the US (Devox, 2020), this comes down to $120k - $150k for the development costs.
Multiple e-hailing companies have entered the market in recent years. They all provide an on-demand taxi service that is claimed to be easy to use (Walji & Walji, 2016a). However, some operators are differentiating their business models. For example, Cabify accepts drivers with VTC licenses, freelancers, and regular cab drivers44. Hence, the company integrates various forms of taxi services into a single platform. The same concept is applied by FreeNow. Additionally, FreeNow offers a multimodal service including scooter-sharing and car rental45. Another differentiation is to target a different customer segment. For example, Gett focuses on corporate clients, offering them tailored traveling policies (e.g., specifying allowed vehicle types,
43 Uber — bedrijfsinformatie. Retrieved 06-04-2021, from https://www.uber.com/nl/newsroom/bedrijfsinformatie/ 44 Cabify. (2021). Verander uw tijd in geld. Retrieved 06-05-2021, from https://cabify.com/es/conductores 45 FreeNow. (2021). Je weg van a naar b. Retrieved 07-05-2021, from https://free-now.com/de/

40
limiting the maximum distance, and setting maximum budgets for their employees). In addition to the taxi service, Gett’s software aggregates existing transportation providers into a single platform46.
Traveler The main value proposition of the e-haling for travelers is a door-to-door service. The results of a survey amongst e-hailing users suggest that over 50% of the respondents identified door-to-door service as a specific reason to use e-hailing rather than the public transport (Mohamed et al., 2020). Other social and economic consequences for travelers of using e-haling services are (1) reduction of search costs particularly on time, effort, and uncertainty of a passenger, and (2) better overview of quality and prices, such as the rating system and the price estimation (Nistal & Regidor, 2016). Moreover, more efficient utilization of assets may result in consumer welfare and efficiency in the transport services (Nistal & Regidor, 2016).
Driver More efficient utilization of resources also applies to drivers. Since drivers can use their private vehicles for e-hailing, they can use their cars for both personal and professional purposes. Since e-hailing drivers usually drive private cars, car maintenance and insurance are also the responsibility of the driver (Darbéra, 2017). For example, Uber-X (standard Uber car) drivers are supposed to register for individual insurance like normal drivers, and Uber-Black (luxury Uber car) drivers are supposed to register for commercial insurance, and accidents are also covered by the individual commercial insurance (Yun et al., 2020). Drivers are generally paid by customers to respond to requests via the platform. Customers use this door-to-door service for a fee, based on traveling time and/or distance, or a pre-arranged fixed price. Variations on this business model are found around the world. For example, in New York, drivers have to buy or lease a medallion from the local government in order to legally operate in the city (Wyman, 2017). In this model, drivers are independent contractors.
Local Government As mentioned, Uber introduced a radical innovation in the taxi business. Such innovation often does not comply with the institutional practices which have been shaped by the past (Kaplan & Tripsas, 2008). Consequently, radical innovations often trigger controversies and regulatory struggles (Pelzer et al., 2019). The rise of e-hailing has been no exception, especially in regions with highly regulated markets. For example, Pelzer et al. (2019) have described regulatory difficulties in the Dutch taxi industry, as a consequence of Uber’s introduction in July 2014. Shortly after its introduction, various institutes claimed that Uber drivers were operating illegally as they allegedly did not comply with taxi law. Additionally, frictions between the e-hailing company and the traditional taxi service even led to incidents involving chasing and even threatening Uber drivers.
To the authors’ knowledge, Wyman (2017) published the first and only article offering a theoretically grounded analysis of the appropriate role of taxi regulation in the age of e-hailing. The study makes two main points about e-haling regulation. First, local governments should establish regulatory standards for e-hailed and traditional taxis as a unit as they are substitutes. Second, e-hailed taxis should be regulated to address market failures such as oversupply and unfair pricing schemes. Furthermore, the author addresses the fairness of compensating license owners in New York specifically, as the value of their investments (New York taxi medallions are worth almost a million US dollars) dropped significantly after the introduction of Uber.
In addition to handling and preventing issues related to fair markets and competition, adequate regulation is also crucial to achieving the societal value of e-hailing. For example, there are reasons to believe that taxis, at least in certain places, might alleviate congestion. Taxis could substitute private cars if there are enough taxis to eliminate the need to own a car. Moreover, Uber, Lyft, and other companies are now offering taxi pooling services in major U.S. cities that enable multiple customers to share a ride4748, further decreasing the number of vehicles on the road (Pelzer et al., 2019). On the other hand, if taxis are cheap
46 Gett. (2021).About gett.Retrieved 07-05-2021, from https://gett.com/uk/about/ 47 Uber — bedrijfsinformatie. Retrieved 06-04-2021, from https://www.uber.com/nl/newsroom/bedrijfsinformatie/ 48 Lyft. (2021). Hop in. crack a window. let’s get back out there. Retrieved 07-05-2021, from https://www.lyft.com/
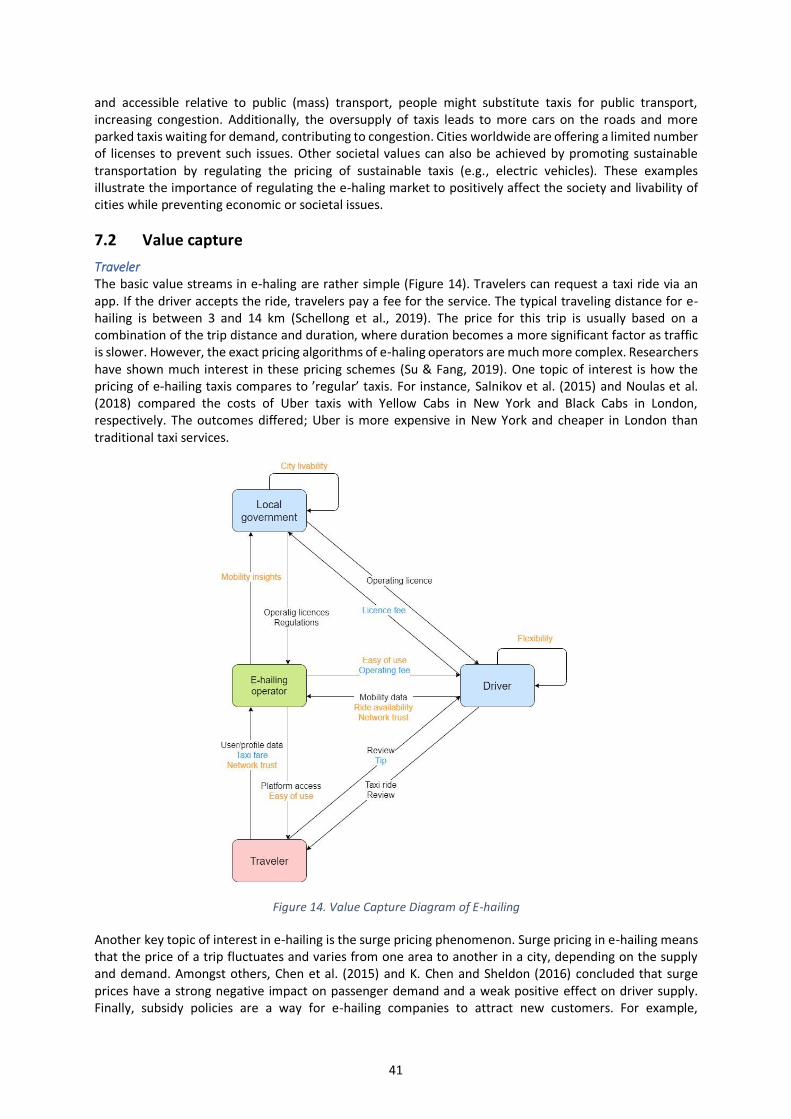
41
and accessible relative to public (mass) transport, people might substitute taxis for public transport, increasing congestion. Additionally, the oversupply of taxis leads to more cars on the roads and more parked taxis waiting for demand, contributing to congestion. Cities worldwide are offering a limited number of licenses to prevent such issues. Other societal values can also be achieved by promoting sustainable transportation by regulating the pricing of sustainable taxis (e.g., electric vehicles). These examples illustrate the importance of regulating the e-haling market to positively affect the society and livability of cities while preventing economic or societal issues.
7.2 Value capture
Traveler The basic value streams in e-haling are rather simple (Figure 14). Travelers can request a taxi ride via an app. If the driver accepts the ride, travelers pay a fee for the service. The typical traveling distance for e-hailing is between 3 and 14 km (Schellong et al., 2019). The price for this trip is usually based on a combination of the trip distance and duration, where duration becomes a more significant factor as traffic is slower. However, the exact pricing algorithms of e-haling operators are much more complex. Researchers have shown much interest in these pricing schemes (Su & Fang, 2019). One topic of interest is how the pricing of e-hailing taxis compares to ’regular’ taxis. For instance, Salnikov et al. (2015) and Noulas et al. (2018) compared the costs of Uber taxis with Yellow Cabs in New York and Black Cabs in London, respectively. The outcomes differed; Uber is more expensive in New York and cheaper in London than traditional taxi services.
Figure 14. Value Capture Diagram of E-hailing
Another key topic of interest in e-hailing is the surge pricing phenomenon. Surge pricing in e-hailing means that the price of a trip fluctuates and varies from one area to another in a city, depending on the supply and demand. Amongst others, Chen et al. (2015) and K. Chen and Sheldon (2016) concluded that surge prices have a strong negative impact on passenger demand and a weak positive effect on driver supply. Finally, subsidy policies are a way for e-hailing companies to attract new customers. For example,
42
competition among e-hailing companies Didi and Kuaidi triggered a fierce subsidy war from January to August of 2014 in China, offering promotion fees to taxi drivers using their apps to serve passengers and giving subsidies to passengers who used their apps to hail taxis (Su & Fang, 2019).
Besides monetary value, travelers also provide trust in e-hailing networks. Trust is essential in markets to fulfill transactions, especially those seeking to facilitate trades between large numbers of dispersed customers and suppliers and where personal safety is a concern (Einav et al., 2016). Therefore, two-sided reviews play an essential role in e-hailing. E-hailing operators use customer reviews to filter out problematic drivers. This creates an incentive for drivers to behave correctly because bad ratings mean the driver might have a harder time finding a ride in the future.
Driver Alternatively, drivers can report the bad behavior of customers, which establishes trust in the e-hailing network via the same principles as mentioned before. Additionally, drivers provide availability (supply) to the network. High availability is beneficial to both drivers and travelers because passengers benefit when a platform has large numbers of drivers, and drivers benefit when the platform has a large network of potential customers (Wyman, 2017). Drivers receive a fee that is about 70% to 80% of the total fee, depending on the region and provider. For instance, Uber drivers receive between 70% and 80% of the total trip price, DiDi-X drivers receive 80% of revenues that the customer paid to DiDiChuxing, and DiDi-Premier drivers receive 74% of revenues (Yun et al., 2020). The remaining 20% to 30% goes to the operator.
Additionally, operators can monetize the mobility data generated by both travelers and drivers. For example, Cabify and Uber also gain revenues from selling data (de-Miguel-Molina et al., 2020). Another possibility is to share mobility insights with external parties rather than selling data. The final revenue source that is identified for e-hailing operators comes from in-app advertisements. Companies that make use of such advertisements are for example, Uber49, Grab50, Curb51, and FreeNow52. The main costs that the operators have to cover from these revenues are costs for offices, employees, maintenance of the website and app, and the marketing (de-Miguel-Molina et al., 2020).
One of the main benefits for e-hailing drivers is the level of flexibility, depending slightly on whether the e-hailing provider operates as an information platform or dispatch center. In either case, drivers can determine their working hours (within national/regional terms of employment). Moreover, drivers can even work for multiple operators at the same time (Su & Fang, 2019). Also, e-hailing operators try to make their offering for drivers more attractive by weekly, daily, or even on-demand pay-outs and making registration as easy as possible495354.
Local government Wyman (2017) claims that regulations for the taxi industry have been lagging since the rise of e-hailing companies. However, highly regulated markets have recently responded by offering licenses and tenders to drivers and e-hailing operators to control supply and protect the market. In addition to regulations, the research has mainly focused on spatio-temporal variations in taxi mobility and operational strategies for taxis. Su and Fang (2019) point out that the societal impact of e-hailing cannot be determined based on the current research. Instead, they argue that more research is needed on the effects of e-haling services on sustainable city development, energy conservation, reductions in emissions, and traffic congestion. Although the exact effects of e-hailing have not been researched extensively, Wyman (2017) claims that there are good reasons to believe that e-hailing has positive societal value through the same principles that apply to other shared mobility modes. Hence, the involvement of local governments is crucial to protect the taxi market and ensure that the positive impacts of e-hailing are achieved.
49 Uber — Bedrijfsinformatie. Retrieved 06-04-2021, from https://www.uber.com/nl/newsroom/bedrijfsinformatie/ 50 Grab —Making every day better. Retrieved 07-05-2021, from https://www.grab.com/sg/ 51 Curb — Products. Retrieved 06-05-2021, from https://gocurb.com/products/ 52 FreeNow —Je weg van a naar b. Retrieved 07-05-2021, from https://free-now.com/de/ 53 Arro —Driver features. Retrieved 06-05-2021, from https://www.drivearro.com/ 54 Lyft —Hop in. crack a window. let’s get back out there. Retrieved 07-05-2021, from https://www.lyft.com/

43
8 MaaS Platforms
In recent years, advances in technology have enabled platform-based businesses (also referred to as marketplaces, or digital business ecosystems) to emerge. These companies, such as Airbnb and Uber, connect previously unmatched demand and supply through a digital platform (Täuscher & Laudien, 2018). In addition to platforms, technological progress has also led to an increase in the type of urban travel services, such as bike-sharing, scooter-sharing, carsharing, and e-hailing. This development potentially contributes to more sustainable urban mobility, but also creates complexity for the customer (Willing et al., 2017). For example, in Barcelona, there are 10 operational scooter-sharing providers, each operating its own platform (as mentioned in Section 5). This fragmentation makes it difficult for travelers to find the optimal offer that matches their needs best.
To address this issue, multimodal mobility platforms have emerged. These platforms aim at simplifying customer offerings, by functioning as marketplaces where customers can purchase integrated multi-modal mobility services from different suppliers. Such platforms are referred to as Mobility-as-a-Service (MaaS) platforms55.
In a topological study, Sochor et al. (2018) conclude that there is little agreement on the definition of MaaS. The authors suggest that the main aspects that define MaaS are as follows:
a) Offering a service with traveler’s needs as the focus, b) Offering mobility rather than transport, and c) Offering integration of transport services, information, booking, payment, and ticketing.
Still, there are various definitions of MaaS. After comparing different definitions, Sakai (2019) gives a definition adopting a user-oriented perspective: “a digital platform with integrated services, including journey planning involving all modes of transport, booking, e-ticketing, and payment, from the starting location up to the destination”.
8.1 MaaS Maturity Stages
To facilitate comparison and evaluation of MaaS, Sochor et al. (2018) propose a topology for MaaS with five levels, as displayed in Figure 15. At Stage-0, there is no MaaS. In this case, the mobility service providers provide single, separate services through their channels. Stage-1 represents the integration of information. Compared to Stage-0, the added value of Stage-1 is that the travelers can use MaaS as a decision support tool for finding the best trip. Since the travelers are typically not prepared to pay for only information, this stage of MaaS has users rather than customers. Mobility service providers contribute by supplying open, standardized data for free. The MaaS provider is not responsible for the quality of the services about which it provides information.
Figure 15. Five stages of MaaS
55 MaaS Alliance -- https://maas-alliance.eu/

44
The second stage of MaaS represents the integration of booking and payment. The added value of Stage-2 for the end-user is easier access to mobility through a one-stop-shop where the user can find, book, and pay for mobility services with the same app. However, it is not guaranteed that travelers are willing to pay for this service as the alternative, using multiple apps, does not require considerable additional effort (although this effort can be significant in certain contexts (Lyons et al., 2019)). Thus, revenue for Stage-2 MaaS providers comes from brokering fees, commissions, or supplier membership fees. Additionally, mobility data might be sold to third parties like local governments for mobility management.
For mobility service providers (transport providers), the main benefit of participating in Stage-2 MaaS is additional customer exposure. On the other hand, transport providers offer their mobility services side-by-side with their competitors. Therefore, it is likely that well-established transport providers will be less interested in participation, as they are less reliant on external channels for their exposure. Stage-2 MaaS providers take responsibility for valid tickets, accurate bookings, and purchases, but not for the actual travel services. The costs related to integrating these services for many suppliers can be high, while margins (from brokering fees or commissions) are likely to be low. Therefore, it could be hard to operate Stage-2 MaaS services as a private business without any support from public authorities.
Stage-3 of MaaS represents the integration of service offers like subscriptions and contracts. For travelers, the main value proposition is an alternative to car ownership that focuses on travelers’ complete mobility needs. For transport providers, the main benefit is that they become more attractive for users than they can be as a single service. Stage-3 MaaS providers focus on offering a complete mobility service (which is a bundle of other services) that attracts customers with larger mobility budgets and willingness to pay for quality and ease of use. At this stage, the MaaS provider takes responsibility for the service delivered to its customers and for its customers towards the suppliers. Therefore, the MaaS provider must work together with transport providers to run a profitable business. MaaS providers buy capacity from operators, which they bundle into service packages. This also migrates risk resulting from uncertain demand towards the MaaS provider. The pricing of individual services is non-transparent. Hence, what travelers pay to the MaaS provider is not directly linked to what the operator pays to the supplier. Additionally, the pricing models of transport providers towards MaaS providers can be different from what the transport operators promote to their customers. Hence, MaaS providers skilled at negotiation and understanding customer needs could achieve higher average margins.
Finally, Stage-4 represents the integration of societal goals. The main benefits of the fourth stage are similar to the societal benefits of single shared mobility modes, like reduced transportation costs, reduced car ownership, fewer congestion, and more efficient usage of resources. Public authorities can create incentives for desired behavior by setting conditions for MaaS providers. For example, the pricing of various modes could be adjusted such that more sustainable transport modes become more attractive. Some MaaS providers like Jelbi promote sustainable movement as the primary value proposition by adding incentives and gamifying the experience (Jelbi, 2021). The value propositions of MaaS providers, as presented in this section, are summarized in Table 7 for travelers and mobility providers.
Table 7. Value propositions of MaaS
Stage Traveler Mobility Service Provider
Stage 0 - -
Stage 1 Decision support Additional exposure
Stage 2 Decision support + convenience Additional exposure
Stage 3 Complete mobility solution Increased attractiveness + less uncertainty
Stage 4 Complete mobility solution + societal goals Increased attractiveness + less uncertainty
The interest in MaaS has spread quickly, mainly across Europe, along with the rapid advances in information and communications technology and the internet of things (IoT) (Sakai, 2019). In addition to the advances in IT, another reason behind the rapid advancement of MaaS in Europe is that the European Commission

45
has continually promoted multi-modal journey planners across the EU for more than a decade, as the realization of Stage-4 MaaS solutions is consistent with the policy directions of the EU member states promoting the use of public transport and other more sustainable ways of transportation (Sakai, 2019). Despite the enthusiasm of governments and companies in the sector, MaaS providers are struggling to successfully launch their services (Essaidi et al., 2020). They face difficulties in:
1. aggregating several mobility services, 2. standardizing of data and interfaces, 3. offering a realtime service, and 4. finding a viable business model.
The outcomes of research commissioned by the EU suggest that finding an appropriate business model is the biggest obstacle in the implementation of MaaS, compared to technology-, end-user- and policy-related difficulties (Kamargianni, 2020).
In the remaining of this section, the business models of MaaS providers are studied in more detail. First, the actors and their roles in the MaaS business model are summarized. Then, the value streams between important actors are mapped.
8.2 Business model actors
M Kamargianni and Matyas (2017) have described the MaaS ecosystem and its actors. Accordingly, the ecosystem features three layers around the MaaS provider/operator, as presented in Figure 16. The core layer includes customers/users, transport operators (mobility service providers), and data providers.
Figure 16. The MaaS ecosystem (Kamargianni & Matyas, 2017)
Turetken et al., (2021) have defined three business models for MaaS providers using the SDBM/R, corresponding to stages of MaaS. The 3rd model represents the business model that integrates societal goals aligned with Stage-4. This business model serves as a reference for the generic MaaS provider business model, as presented in Figure 17.

46
Figure 17. MaaS Business Model in SDBM/R (Adali, Ozkan, Turetken, & Grefen, 2021)
MaaS Provider (Operator) At the center of the ecosystem -the main orchestrator in the business model- is the MaaS provider (or operator. Eckhardt et al. (2017) distinguish three kinds of MaaS providers: commercial operators, public operators, and public-private partnerships. Furthermore, two types of MaaS providers can be distinguished from the point of view of their operation: resellers and integrators. The main activity of resellers is to solely provide a platform at which mobility providers can offer their services to the customers. Such operators are typically offering Stage-2 MaaS solutions, as they do not offer additional services other than functioning as a marketplace for mobility. On the other hand, integrators bundle services from different providers and offer the trip as a single product to the customer, usually as an extension of its own mobility service. Examples of such services include Whim 56 , run by a private company, and UbiGo57 , run by a public organization. These services can be considered to be at Stage-3, as they combine multiple modes of transport and offer additional services, such as customized subscriptions (Sakai, 2019).
Public MaaS providers are often public transport operators which aim to extend their offerings by integrating other transport services. These additional services are typically last-mile transport solutions, such as bike-sharing (as presented in Section 4). Other public operators are local governments like the municipality of Barcelona, Spain, which operates SMOU58. The public-private partnerships are similar to publicly operated modes. An example of such a partnership is the CityTrips59 in Spain, operated by RACC.
56 Whim. (2021) Experience the seamless way to move around. Retrieved 11-05-2021, from https://whimapp.com/helsinki/en/ 57 UbiGo. (2021). Mobility services for you and your family’s journeys, every day. Retrieved 11-05-2021, from https://www.ubigo.me/en/home 58 Smou. (2021). Smou. move easily. move better. Retrieved 11-05-2021, from https://www.smou.cat/en 59 MaaS Alliance. (2021). Maas of the month: Citytrips - the leading maas aggregator in Spain. Retrieved 25-10-2021, from https://maas-alliance.eu/wp-content/uploads/sites/9/2019/09/MaaS-of-the-Month-RACC_FINAL-1.pdf and https://gocitytrips.com

47
Traveler: Travelers are the main customers who benefit from the value delivered by MaaS and are core business partners of MaaS providers. The perceived value of MaaS depends on the stage in which it operates. At Stage-1 and 2, the value offered is relatively limited, as the MaaS provider offers only ease of use, i.e., a better traveling experience. The value propositions of Stages-3 and 4 MaaS solutions are relatively advanced for travelers as they offer a complete mobility solution. Stage-4 also delivers an optimized trip to achieve societal goals. Travelers pay a service fee for this service, either on a pay-as-you-go basis or via subscriptions. Additionally, travelers provide data for the network, such as their account data, mobility data, and reviews, which helps establish trust in the network (Turetken et al., 2021).
Mobility (Service) Provider Other core business partners of MaaS providers, as indicated by Türetken et al. (2020) and Kamargianni and Matyas (2017), are the mobility (service) providers. They act as suppliers of mobility in the platform business of MaaS providers. While most research focuses on the customers (travelers), Willing et al. (2017) also address the value proposition for the suppliers as they benefit from a larger customer base and better customer targeting abilities. Again, the benefits for mobility providers depend on the stage of the MaaS solution. At Stage-1 and 2, mobility providers solely benefit from increased reach, and therefore possibly increased revenue. At Stage-3 and 4, mobility providers become more attractive as they contribute to a complete mobility solution that can replace traditional mobility solutions, such as car ownership. In an advanced stage of MaaS platforms, the transport providers (mobility service providers) can even drop their own digital platform and rely solely on the MaaS platform as its sales channel, which would significantly reduce the complexity and costs associated with their operations. This also facilitates the market entry of small mobility providers as the development costs of the required infrastructure would be reduced significantly.
Traffic authority As for all platform-based business models, the platform provider (MaaS provider), customers (travelers), and suppliers (mobility providers) are the most important actors. Kamargianni and Matyas (2017) also consider the data provider as a core business partner in the MaaS ecosystem, because MaaS relies heavily on interoperable data availability. The authors consider the data provider as a third party that collects and processes the data of the transport operators and a range of other sources, like travelers’ phones and social media. However, the desk study on MaaS providers revealed that establishing partnerships with mobility operators and collecting their data is often one of the main activities of MaaS providers. Therefore, the data providers are not a separate actor in the MaaS business model. Another actor that is considered an important enriching partner in the business model is the traffic authority. Traffic authorities can share real-time traffic data to facilitate the optimization of routes. Additionally, traffic authorities could play a role in validating customer data, such as driver licenses. Reversely, traffic authorities could use the data from MaaS providers to optimize their policies.
Governmental bodies As mentioned, MaaS has the potential to solve urban mobility issues. Evidently, this aligns with the interests of governments and public bodies around the world. Therefore, public actors are actively developing and offering MaaS solutions while there are also private actors trying to capitalize on the market. In any case, municipalities and cities that are exploiting MaaS platforms must ensure that they are accessible and inclusive by involving all the focal stakeholders - from the operators to the citizens-, to avoid a situation where MaaS services only address the most profitable part of the market (Aapaoja, Kostiainen, et al., 2017). Only if MaaS services are inclusive and well-regulated, MaaS can achieve Stage-4 and serve societal goals.
Financial institution The transactions should be handled in a fast and secure way to establish trust in the system. Therefore, a reliable financial institution is important in the business model. Such institutions generally ask for a transaction fee for each transaction or gain revenue via negotiated contracts.

48
8.3 Value capture
Although activities in this field are ongoing, at present, there are no established framework and quantifiable evidence about MaaS costs and benefits (Kamargianni, 2018). Despite the limited literature and examples of MaaS providers, a few different revenue models can be distinguished.
First, the reseller model relies on commissions over transactions (pay-as-you-go) as its primary revenue source. Margins are likely low since resellers only aggregate different modes of transport on a one-stop principle, and using multiple apps results in little additional effort for travelers. For instance, Gaiyo in The Netherlands allows the customer to plan their trip in the app and refers to accounts at transport providers for booking and payment60. Hence, the pay-as-you-go system presents two flawed economic models. Either the MaaS platform negotiates margin sharing with operators to offer an attractive price to users at the expense of the operators’ financial balance, which is sometimes already fragile, or the MaaS platform applies its margin directly on the public ticket prices. However, their tickets are then more expensive and thus less attractive for users than direct purchases from operators (Essaidi et al., 2020).
Figure 18 depicts the value exchange between the MaaS actors.
Figure 18. Value Capture Diagram for MaaS
In the integrator model, providing MaaS is the main business. The MaaS provider offers subscriptions to customers and buys capacity from the transport operators, which can be used to assemble trips into a single package (e.g., Whim and UbiGo). Margins tend to be low in this model since the services of transport operators are also resold in this model. However, the integrator offers more value to travelers and suppliers than the reseller. For travelers, the integrator MaaS provider delivers a complete service that can replace the need for car ownership. For the suppliers, on the other hand, the MaaS provider migrates risk towards itself by buying capacity according to contracts.
60 Gaiyo. (2021). Gaiyo — home page. Retrieved 06-04-2021, from https://gaiyo.com/

49
Additionally, MaaS providers (in collaboration with cities) could negotiate other aspects, like offering exclusivity for certain routes or parking places in certain urban areas, to become more attractive to mobility providers. The MaaS platform could then increase its margins, or be remunerated through a subscription offered to operators, or through a commission on new customers, or even through a commission on the volume of business generated (Essaidi et al., 2020). In both cases, the MaaS provider collects the services fees from customers and redistributes these revenues towards mobility providers.
Additional revenue for MaaS providers could come from data exploitation. In addition, at Stage-4, MaaS providers can potentially benefit from subsidies for promoting mobility options. Table 8 summarizes the revenue sources of MaaS Providers with respect to the stages.
Table 8. Revenue sources for MaaS providers
Stage Revenue Sources Remarks
Stage 0 - -
Stage 1 - Travelers are typically not prepared to pay only for
information
Stage 2 Brokering fees, commissions,
supplier membership fees, data
exploitation
The costs related to integrating these services for many
suppliers can be high while margins are likely to be low
Stage 3 Traveler membership fees,
supplier fees, data exploitation The pricing of individual services is non-transparent
Stage 4 Traveler membership fees,
supplier fees, data exploitation,
subsidies
The pricing of individual services is non-transparent,
and pricing of various modes could be adjusted such
that more sustainable transport modes become more
attractive
The costs incurred by the MaaS providers can be divided into two main categories: operational costs and investment costs. Operational costs include costs related to marketing, legal issues, customer service and support, personnel, platform maintenance and operating fees for partners (Polydoropoulou et al., 2020). The investment costs are mainly related to the platform development, since it is costly to develop a standard and user-friendly platform (Araghi et al., 2020). Like other platform-based business models, the operational costs increase only slightly if volumes get larger. Therefore, both the reseller and integrator model should operate with large volumes to be profitable. Integrators are even more dependent on volumes to efficiently source the acquired services. Other revenue sources that have been identified are advertisements and data exploitation. For example, Moovit offers MaaS solution which includes API- and platform development and the company offers urban mobility insights as additional service (Moovit, 2021). The costs and revenue streams for public and commercial operators are essentially alike. However, the main advantage for public operators over commercial operators is that commercial operators must be profitable to exist, whereas the public operators must deliver only enough societal value relative to the public subsidization.
8.4 Deployment Strategy
While MaaS initiatives are being launched, its future is uncertain. One of the main questions is who is going to be the dominant actor in providing MaaS. As discussed in Section 8.2, three approaches can be followed for MaaS deployment (Eckhardt et al., 2017; Narupiti, 2019; Sakai, 2019; Smith et al., 2017): private, public, and public-private partnership:
a) Private-based MaaS, where MaaS is being developed and marketed by the private/commercial companies,
b) Public-based MaaS, where the city authorities or municipalities setup a MaaS platform to initiate and to stimulate the development of MaaS.

50
c) Public-private partnership-based MaaS, where private and public parties aim to jointly develop and deploy MaaS.
Current deployments pre-dominantly follow the first 2 approaches (Araghi et al., 2020). Below, we elaborate on these deployment approaches.
Private-based (market-driven) MaaS In the first scenario, private/commercial companies lead the development of MaaS. In the mobility domain, companies like Uber notice an opportunity to open new markets. Shared mobility providers, such as Bird, are becoming increasingly multimodal to capture greater value by delivering more extensive services. Besides expanding their own operations, the companies are also seeking partnerships with other providers to quickly expand their offerings. In order to achieve such deals, transport operators will need to 1) make it possible for third-party actors to resell public transport tickets digitally (Li & Voege, 2017), 2) modify the range of PT tickets in order to facilitate bundling with other transport modes (Holmberg et al., 2016) and 3) offer viable and fair deals for third-party resellers. The MaaS provider solely acts as a reseller in this scenario, as the other transport modes are extensions of their own services.
Alternatively, some parties are launching services that fully focus on delivering on MaaS as an integrator, instead of extending their mobility services (e.g., Meep). This is also enabled by cities, such as Lisbon, which have not (yet) been involved in a government-supported initiative. To successfully run such businesses, MaaS providers also need to reach agreements with many transport providers. Additionally, a large critical mass needs to be reached for integrators to be efficient and profitable.
The scenario where the deployment of MaaS is private-based and market-driven is largely based on the argument that private sector actors have higher incentives and better capabilities to develop innovative services that meet customers’ needs, compared to the public sector (Smith et al., 2017). While private companies are often efficient in finding suitable solutions and business models, participation of the private sector within MaaS could also be a reason for concern. Private companies do not always oblige themselves to provide the services at all times. Hence, they may opt for canceling services to some urban areas if they are not profitable. MaaS needs to assure its customers that it can cover a broader scale of urban areas to be relevant for users.
Public-based MaaS Besides private companies being eager to expand their mobility services, there is also much interest in MaaS from the public sector. For example, German local transport providers, such as BVG in Berlin, are deploying the MaaS platform solutions (Araghi et al., 2020). Likewise, the EU has commissioned large-scale pilot projects to develop the initial version of prototype business models for the MaaS (Kamargianni, 2020). The interest from public actors is unsurprising since MaaS aids the transition to more sustainable city transport modes. For instance, MaaS could reduce congestion by making more users switch to public transport or shared mobility services. It may even alleviate the need for car ownership, which implies less demand for parking spaces (Jang et al., 2020). Another driver of public interest in MaaS is that it may have a direct positive impact on pollution levels of urban areas and an indirect impact on climate change and the energy transition.
Besides the potential benefits of MaaS itself, public actors aim to ensure it societal value is achieved. As mentioned, private actors may choose not to serve certain areas if they are not profitable. Additionally, benefits related to reduced car usage are only achieved if MaaS is mostly based on public transport. Private MaaS could promote more profitable modes, such as car-sharing, which may increase car use in urban areas and cause more congestion and pollution. Therefore, it is important for authorities to try to steer the development of the MaaS towards more public transport-based MaaS. Moreover, this gives cities the opportunity to utilize their current transportation network more efficiently. Another benefit of MaaS for public actors is that MaaS could integrate fully subsidized transportation (e.g., school transportation) and social service transportation (e.g., for elderly or disabled). Managing and planning such services via MaaS platforms could significantly cut costs for municipalities.

51
However, the public-controlled development of MaaS might also create some barriers. While public transport operators have much infrastructure in place, public organizations are often rigid and respond slowly to change. For example, in The Netherlands, it takes 6-9 months for a new company to be brought on to the OV-Chipkaart system (the payment system for public transportation) at considerable costs (Araghi et al., 2020). Such inflexibility creates a large barrier for innovative mobility providers to join the MaaS platform. In addition, the critiques of this approach argue that a system led by public actors is biased towards over-favoring public transport and thus not providing a strong cognitive bridge for “car-lovers”. Hence, they propose that a strong carsharing offer should be paired with robust public transport to “convince” car-prone people to stop owning a car as the first step in their transition towards sustainable multimodality.
Public-private partnership MaaS In the third option involves a variety of partnership possibilities between public and private parties. This may include mixed consortiums that tender the services or private initiatives launched in close collaboration with the public sector. In the latter, the public sector enlarges its scope in the personal transport service value chain by absorbing the MaaS integrator role, while the MaaS provider role remains open for private actors. In practice, the public sector contributes to the development of the integration platform, which results in lower investment costs and easier market entrance for MaaS providers, as they do not have to develop an integration platform. Activities like bundling services, negotiating contracts, and providing customer service would be the responsibility of the MaaS provider. An example can be found in Japan where the authorities have developed an integration platform to facilitate MaaS, called MaaS Japan61.
Yet, this scenario is not free of challenges. The first difficulty relates to the fact that public and private actors often have conflicting goals. For instance, private MaaS providers could aim to maximize their profits by selling as many and as expensive trips as possible. In contrast, the public sector strives towards reducing the amount of travel and increasing the modal share of public transportation, which is an inexpensive product compared to -for example- car-sharing (Smith et al., 2017). Without any additional regulation, private companies are not bound to serve societal goals. Table 9 summarizes the pros and cons of the three strategies of MaaS deployment.
Table 9. Strategies for MaaS development
Strategy Pro Con
Private Private sector actors have higher incentives and better capabilities to develop innovative services that meet customers’ needs, compared to the public sector
Private companies do not always oblige themselves to always provide the services
Public Steer the development of MaaS towards the achievement of societal goals (centered around public transport)
Public organizations are often rigid and slow in responding to change (OV-card example). Such inflexibility creates a large barrier for innovative mobility providers
Public-Private Use the innovativeness of the private
sector while keeping some level of
control over the direction of the MaaS
development and operation
Conflicting goals of public and private
sector (e.g., increasing the modal share
of public transport vs. increase revenues
for private operators)
Research suggests that the public-private development of MaaS is the scenario with the most chance at success. In this scenario, the public sector can make use of the innovativeness of the private sector while keeping some level of control over the direction of the MaaS development and operation (Smith et al., 2017). The study by Araghia et al. (2020) argues that policymakers should take the opportunity to develop
61 MaaS Japan. (2021). Maas japan - een open data-infrastructuur die de geest beweegt. Retrieved15-05-2021, from https://www.maasjapan.net/

52
an open and public-based MaaS platform. Within this platform, they can prioritize public transport in highly utilized areas and allow private mobility providers to serve markets that are not covered by public services.
8.5 Challenges and Opportunities
MaaS platforms are considered two-sided platform businesses. Hence, apart from a number of critical stakeholders (such as those discussed in Section 8.2), they have two major types of customers: travelers and mobility (service) providers. As a result, the challenges and opportunities related to each type of customer should be studied separately. Table 10 summarizes such challenges and opportunities that MaaS providers have to address.
In general, the margins in shared mobility are under pressure (Lee & Lui, 2018; Schellong et al., 2019). Operators are trying to outperform their competitors by reducing their prices (Bork, 2019). Moreover, low prices are necessary to attract new customers, as they underestimate the costs for conventional transportation modes such as car ownership. For example, Whim offers a subscription service scheme with a premium of $500 per month and has difficulties in attracting customers (Sakai, 2019). This package is equivalent to the price of car ownership, but car owners underestimate the true costs of car ownership by as much as 50% (Andor et al., 2020). Hence, customers do not yet perceive MaaS as a cheaper, more efficient solution. This perception is especially troublesome since the cost reduction is the best motivator for travelers to start participating in shared mobility, according to the survey results (Shaheen & Cohen, 2007). Additionally, MaaS platforms have a high critical mass that is required in order to run a profitable business since margins are low (Sochor et al., 2018). MaaS platform providers will have to overcome these challenges related to travelers.
Additionally, the current state of the market also causes challenges related to the supply side of the platform, the mobility service providers. As discussed in the sections above, service providers or transport operators of all types are involved in fierce competition for market share. They aim to establish long-term relationships with their customers. This might withhold a service provider from collaborating with MaaS providers that offer other competing services. Besides market protectionism, the technical challenges are also considerable.
In addition, MaaS providers are already facing technical difficulties in aggregating services of different providers, standardizing data and interfaces, and offering a real-time service (Essaidi et al., 2020). The costs associated with the development of technological solutions to address these issues could be considerable (Sochor et al., 2018).
Table 10. Challenges and opportunities for MaaS
Travelers Mobility Service Providers
Challenges 1. Critical mass for efficient operations
2. Costs of car ownership underestimated
3. Costs of MaaS perceived as high
1. Protection of customer base and preserving customer intimacy in changing digital environment
2. Margins under pressure
3. Technical challenges 4. Positioning in changing mobility ecosystem due
to MaaS
Opportunities 1. Reduced transportation costs
2. Alternative for car ownership
3. Societal benefits of shared
mobility
4. Optimized trip
1. Potential for better margins or more customers
(also through increased reach to a broader
range of travellers)
2. More attractive when combined with other
modalities
3. Reduced operating costs
4. Improved competitive positioning compared
to car ownership.

53
On the other hand, there are also many opportunities for future MaaS platforms. As this study shows, the shared mobility market operates with many different business models across various transport modes. Yet, the modes that we analyzed have similarities across various dimensions. For example, the value propositions of each mode include:
1. mobility improvement 2. reduced traveling costs, 3. improved city livability, and 4. environmental benefits.
While the financial benefits may currently be underestimated by travelers, the potential cost reduction by using shared mobility modes is considerable, especially when adoption rates become higher and operating volumes become larger (Roukouni & Correia, 2020) and MaaS can become a true alternative to car ownership (Sochor et al., 2018). Additionally, the societal benefits of shared mobility are evident as they have been stressed throughout this report. In addition, MaaS can potentially offer optimal and customized trips based on individual preferences (Turetken et al., 2021).
The degree of mobility improvement is an important value proposition for mobility service providers. Already in 2007, the researchers considered convenience as one of the most important factors for travelers to use shared mobility services (Shaheen & Cohen, 2007). Therefore, systems that offer easier access to mobility (FF and decentralized SB systems) are gaining market share (Shaheen et al., 2020). Additionally, shared mobility operators are becoming increasingly multimodal to extend their value (Li & Voege, 2017). This trend could be an opportunity for MaaS platforms, as shared mobility providers’ services become multimodal as they integrate into MaaS networks. The services of mobility providers would then become more attractive for travelers (Sochor et al., 2018), and attract new customers. This would help mobility providers to run their services more efficiently.
Besides acquiring a customer base that is large enough to run efficient shared mobility services, MaaS could partially contribute to solving the profitability problem through two mechanisms. First, if the mobility service providers join forces and offer their service through a MaaS platform, they will increase their reach to a broader range of customers with a broadened value proposition. This will potentially increase the utilization rate of their resources. Second, MaaS providers could potentially negotiate better contracts with enabling service providers, such as financial institutions or insurance companies, due to the larger scale of operations. MaaS offering collective insurance could particularly be attractive for car-sharing operators, as most have difficulties ensuring their fleet (Shaheen & Cohen, 2007). The additional margin could then be split between the MaaS providers and mobility providers.
In an advanced stage of MaaS, the idea of cost reduction for mobility service providers can be extended. For example, the MaaS platform can be extended with further functionalities to support the operations of mobility service providers (e.g., operations of mobility assets) and potentially act as the single customer touchpoint for the services of the provider. This would make it possible for the service provider to focus only on the physical assets, and less on the development of their own platform, sales, and customer support channels. This would significantly reduce the complexity of operations and costs for service providers. If competitors agree to offer their services on a common platform, it can provide a mutual benefit and can enable the successful launch of the MaaS (Araghi et al., 2020). In essence, this scenario could be compared to the current e-hailing providers. E-hailing providers reduced the cost of entering the taxi market for small-scale service providers by developing the infrastructure through which taxi drivers can offer their services. Consequently, the costs of market entry have been reduced significantly as taxi drivers do not need to invest -for example- on a taxi meter, a rooftop sign, and a dispatch infrastructure. Similarly, MaaS platforms could provide the sales channel and complimentary services such that mobility service providers can focus on their core business: operating an efficient mobility service.

54
9 Conclusions
This report aims to clarify the business model landscape of MaaS providers to facilitate future business model evaluation and development. Specifically, three main research questions have been formulated. The first question focused on identifying currently operating business models for shared mobility operators that interact with MaaS platforms: bike-sharing, scooter-sharing, car-sharing, and e-hailing services. The most dominant business models for each of these shared mobility modes are summarized in Table 11.
Table 11. Shared mobility business models
Mode Business Model Remarks
Bike-sharing 2WSB, 1WSB, FF, P2P Large differences across regions
Scooter-sharing FF Growing market, still maturing
Car-sharing SB, FF, P2P Growing market, great potential for achieving
societal goals
E-hailing Private and integrator platform Traditional taxi service likely to disappear
MaaS provider Reseller and integrator Struggling to find sustainable business models
2WSB: Two-way Station-Based; 1WSB: One-way Station-Based; FF: Free-Floating; P2P: Peer-to-Peer
PPP: Public-Private Partnership; PTO: Public Transport Operator
Bike-sharing The current bike-sharing solutions are considered fourth-generation and are characterized by the integration of advanced IT systems and the integration in other transport modalities (Shaheen et al., 2010a). Four main operating modes of modern bike-sharing can be identified: two-way station-based (2WSB), one-way station-based (1WSB), peer-to-peer (P2P), and free-floating (FF) modes. Each mode has its key features, and the dominant operating model differs across regions worldwide. For example, the 2WSB system is mainly operated by public transport providers and serves as a last-mile solution for their public transport network. Alternatively, private companies mainly operate the 1WSB system in Europe, whereas non-profit organizations mainly operate the North American equivalents (Parkes et al., 2013). While the P2P bike-sharing market is relatively small and focuses on niches (Waes et al., 2018), the popularity of FF bike-sharing systems has increased significantly over the last few years. Large companies with large investments aiming to capitalize on the market are characterized by the FF bike-sharing systems. This mode is growing fast, particularly in less regulated regions, such as South-East Asia. Considering the rapid expansion strategies, significant investments, and low prices, it is assumed that bike-sharing providers are trying to capture as much market share as possible and worry about monetizing the business later (Lee & Lui, 2018). The ultimate goal of bike-sharing is to expand and integrate cycling into transportation systems, such that it can become a daily transportation mode (Shaheen et al., 2010a).
Scooter-sharing Scooter-sharing is a relatively new mode of shared mobility introduced in 2012. Hence, its business model has received limited attention so far (Aguilera-García et al., 2020), increasing its adoption. Market studies show that the number of shared scooters reached 104,000 in 2020 with over 8.7 million users (Howe & Bock, 2018; Howe & Jakobsen, 2020). Also, the number of operators is increasing rapidly, and this growth is expected to continue (Schellong et al., 2019). Almost all operators adopt the FF (free-floating) model for shared scooters. Even though the operators offer a similar or identical service, we can notice some trends in the market. For example, the operators are experimenting with innovative revenue models and are addressing safety concerns with new measures. Moreover, operators are becoming increasingly multimodal (Howe & Jakobsen, 2020). This trend supports the strategy of scooter-sharing operators to expand rapidly and capture much market share. Because of this strategy, large investments are involved in financing growth while scooter-sharing operators are currently operating under losses (Schellong et al., 2019). While the market is growing, governmental bodies have recently started to pay more attention to regulating the scooter-sharing services to foster the benefits and bypass the pitfalls (Schellong et al., 2019).

55
Car-sharing Like bike-sharing, car-sharing has advanced since the mid-20th century, mainly driven by technological developments. Currently, operating modes can be classified into three main categories: station-based (SB), free-floating (FF), and peer-to-peer (P2P) (Cohen & Kietzmann, 2014a; Degirmenci & Breitner, 2014b; Ferrero et al., 2018; Jochem et al., 2020; Münzel et al., 2018; Perboli et al., 2018). The SB system is a more advanced version of traditional car rental: cars are scattered around urban areas at designated parking spaces, where customers can pick up and drop off the vehicle. The FF system essentially works the same way, the only difference being that vehicles do not have a designated parking spot but can be parked anywhere within a service area. Unlike the other carsharing systems, the P2P model functions as a two-sided platform where car owners are suppliers and travelers are customers.
The carsharing market is growing (Shaheen et al., 2020), and various actors, such as car manufacturers and traditional car renters, are entering the market. The studies that have researched the potential benefits of carsharing stress the environmental and social benefits deriving from such initiatives (Jochem et al., 2020). Like bike-sharing and scooter-sharing, carsharing is presumably not a profitable business yet. Car-sharing operators are struggling to acquire a customer base large enough to reach the vehicle utilization rate required to operate at profits (Perboli et al., 2018). Also, it is a capital-intensive business, and operations are complex (Perboli et al., 2018). To lower the costs of operations, operators are engaging in various strategic partnerships. Examples include partnerships with car manufacturers, local governments, and travelers themselves.
E-hailing E-hailing is a taxi service that connects drivers and customers through a mobile application. The introduction of e-haling in 2009 has radically disrupted the taxi market (Walji & Walji, 2016a). Its platform-based business model allowed for rapid expansion worldwide, triggering responses from conventional taxi service operators and regulatory bodies. As issues are being resolved, it is expected that e-hailing will become the dominant mode in the taxi industry (Eckhardt et al., 2017; Wyman, 2017). Compared to traditional taxi services, the main competitive advantage of platform-based taxi services are 1) better adapted to fluctuating demand due to flexible labor, 2) cheaper equipment, 3) faster and cheaper dispatch, and 4) the service optimization with algorithms is more efficient than manual dispatch (Darbéra, 2017). Furthermore, two kinds of e-hailing platforms were discovered: private platforms that only offer their services (e.g., Uber) and integration platforms that integrate various taxi service providers into a single platform (e.g., Cabify).
MaaS providers The role of MaaS in the mobility market has been identified using five stages of MaaS with different levels of integrated services. The stages range from Stage-0, where there are no MaaS and mobility operators provide their service in silos, to Stage-4, which integrates multiple modalities, complementary services, service offers, and societal goals (Sochor et al., 2018). The main benefit for travelers is that MaaS can offer a seamless traveling experience that inherits societal benefits like reduced transportation costs, reduced car ownership, fewer congestion, and more efficient usage of resources (Sakai, 2019). MaaS has two main benefits for mobility operators: 1) additional exposure to customers and 2) increased attractiveness compared to operating as a single service (Sochor et al., 2018). Furthermore, in the advanced stages of MaaS, mobility operators potentially benefit from reduced operational complexity and increased economic viability.
Despite the potential of MaaS, there are still multiple challenges to overcome. One of the main difficulties that MaaS is facing is finding a viable business model (Kamargianni, 2018). Currently, two primary business models for MaaS can be distinguished: the reseller- and integrator model. Resellers (Stage-1 and Stage-2) operate as mobility marketplaces as they aggregate information and resell services while integrators (Stage-3 and Stage-4) bundle services from different providers and offer the trip as a single product to the customer (Sochor et al., 2018). The main revenue sources are brokering fees and traveler membership fees for resellers and integrators. The ultimate goal of MaaS development is to achieve Stage-4, offering mobility while serving societal goals.

56
Our second research question aims to map the value stream between actors in the described business models to better understand the challenges and opportunities for mobility and MaaS providers in terms of developing sustainable business models. To this end, the value exchanges were mapped using VCDs following steps as defined by Gilsing (2020). For each mode and MaaS platform, the main targeted customers were the traveler. The main value propositions for travelers were summarized from academic literature. In general, the value propositions of shared mobility include 1) mobility improvement, 2) reduced traveling costs, 3) improved city livability, and 4) environmental benefits. Another commonality across each mode is the interactions with governmental bodies. Various research suggests that regulation is essential to unlocking the societal value of shared mobility (Dowling & Kent, 2015; Pelzer et al., 2019; Schellong et al., 2019; Shaheen et al., 2019). By investing in partnerships with shared mobility providers and developing policy, local governments can serve their citizens with benefits such as reduced congestion, better usage of urban space, reduced pollution, and environmental benefits. Other value actors between actors in specific business models are outlined in Section 4.
With the final research question, this report aimed to indicate possible scenarios and the most promising business model for future MaaS solutions, based on challenges and opportunities related to integrating mobility provider businesses into MaaS. Hence, three main strategies for MaaS deployment have been considered: public, private, and public-private development. In general, the private sector is expected to have superior capabilities to develop innovative solutions to tackle existing challenges. However, in line with finding for individual shared mobility modes, public involvement is essential to steer the development of MaaS towards achieving societal goals.
Regions, municipalities, and cities exploiting MaaS and shared-mobility services must ensure that they are accessible and inclusive by involving all the focal stakeholders, from the operators to the citizens. By this, the situation where MaaS services only address the most profitable part of the market (leading to a two-tiered approach to mobility) can potentially be avoided (Aapaoja, Eckhardt, et al., 2017). Moreover, public transport providers are best positioned to provide MaaS due to their existing transportation network (Araghi et al., 2020). On the other hand, mobility service providers are currently leading MaaS development as they are becoming multimodal and are developing their own MaaS platforms (e.g., Lime). Other private operators (e.g., SMOU and UbiGo) focus on providing MaaS and seem to have already developed Stage-3 MaaS platforms. Hence, it is unlikely that only public or private actors will lead MaaS development. More realistically, different MaaS models will coexist, such as consumer applications, or ‘niche’ formats, enterprise applications, private or public models (Essaidi et al., 2020). In this scenario, public and private actors should use their strengths in MaaS development. Public actors provide the regulatory and architectural groundwork upon which private actors can build innovative MaaS solutions.
The business models as described in this paper could facilitate future MaaS business model evaluation and development. The business models of suppliers, which frequently interact with MaaS, as well as the MaaS business models, have been described to facilitate an understanding of their operations. Additionally, the value streams between actors in these business models have been identified, along with associated challenges and opportunities in the shared mobility market. This could serve as a reference for a more detailed analysis in the business model design phase.
9.1 Future work
Multiple researchers have underlined the limited availability of academic research on business models of some shared mobility modes and MaaS business models. For example, Aguilera-García et al. (2020) have indicated that contributions to the academic literature have characterized innovative mobility options such as car-sharing or bike-sharing. Still, almost no efforts have been made to explore the use of moped scooters and scooter-sharing services. Mulley and Nelson (2020) indicated that the key discussions and future research need to be directed at the links between the business models of each stakeholder in MaaS.
Although activities in this field are ongoing, at present, there are no established frameworks and quantifiable evidence about MaaS costs and benefits (Kamargianni, 2018). Consequently, non-academic sources, including white papers, websites, and market reports, were used to define the conceptual business models depicted in this report. As the quality and reliability of such sources could be questioned, future

57
research should aim to build upon recent scientific and empirical studies to evaluate and validate the discovered business models for shared mobility and MaaS.
This report also aimed to summarize shared-mobility models. To that end, the classifications of business models have been adopted from academic sources. It is recognized that other types exist. For example, DeMaio (2009) distinguishes six operating modes for bike-sharing rather than four. Also, Lagadic et al. (2019) identified five car-sharing operating modes, and Bocken et al. (2020) classified car-sharing systems based on the operator type. Future research could investigate whether such a classification could also help describe different business models, as the interests of the focal organization might significantly determine business model elements rather than focusing on operation designs.
The business model landscape of mobility services is highly diversified. Complex organizational structures are common with many collaborating parties (Pelzer et al., 2019). Each provider has different objectives, organizational structures, business models. This makes comparison difficult. There are numerous variations in the business models that are described for each operating mode. Consequently, our analyses might not include actors and value exchanges that are important for specific mobility businesses. For example, Kamargianni and Matyas (2017) mention data providers, technology and platform providers, universities, and research institutions as actors in the MaaS ecosystem, in addition to the actors that are identified as business model actors. Therefore, future work should consider the specific ecosystem of operators for more detailed analyses.
This report discusses the revenue sources for MaaS platforms and shared mobility modes. Although it mentions data exploitation as a possible revenue source, it puts little emphasis on its potential. For instance, Willing et al. (2017) indicates the possibility of data exploitation for platform business models and conclude that the insights are relevant to both mobility providers and platform providers, improving their value propositions for the customer and generating more revenue. Therefore, future research should further investigate the potential of data exploitation in the mobility market. This is particularly relevant as many shared mobility operators presumably have not found sustainable business models (Hahn et al., 2020). Meanwhile, actual MaaS services have just started, and it is believed that the verification of various aspects, such as the effect of promoting the use of public transport, the sustainability of the related systems and services, and the implementation of business models, will progress gradually (Sakai, 2019).

58
Acknowledgments
This work is partially supported by the UMOS/MobilitEU Project funded by EIT UM under Activity 21043. The authors thank project consortium partners for their contributions to this work.
References
Aapaoja, A., Eckhardt, J., & Nykänen, L. (2017). Business models for MaaS. 1st International Conference on Mobility as a Service, 28–29.
Aapaoja, A., Kostiainen, J., Zulkarnain, & Leviäkangas, P. (2017). ITS service platform: In search of working business models and ecosystem. Transportation Research Procedia, 25, 1781–1795. https://doi.org/10.1016/j.trpro.2017.05.143
Adali, O. E., Ozkan, B., Turetken, O., Gilsing, R., & Grefen, P. (2021). Transforming Value Propositions of a Service System into Business Services. ECIS 2021.
Adali, O. E., Ozkan, B., Turetken, O., & Grefen, P. (2021). Identification of Service Platform Requirements from Value Propositions: A Service Systems Engineering Method. 22nd IFIP WG 5.5 Working Conference on VIRTUAL ENTERPRISES, PRO-VE 2021.
Aguilera-García, Á., Gomez, J., & Sobrino, N. (2020). Exploring the adoption of moped scooter-sharing systems in Spanish urban areas. Cities, 96(August 2019), 102424. https://doi.org/10.1016/j.cities.2019.102424
Almannaa, M. H., Ashqar, H. I., Elhenawy, M., Masoud, M., Rakotonirainy, A., & Rakha, H. (2021). A comparative analysis of e-scooter and e-bike usage patterns: Findings from the City of Austin, TX. International Journal of Sustainable Transportation, 15(7), 571–579. https://doi.org/10.1080/15568318.2020.1833117
Andor, M. A., Andreas, G., Kenneth, T. G., & Horvath, M. (2020). Running a car costs much more than people think — stalling the uptake of green travel.
Araghi, Y., Larco, N., Bouma, G. M., Doll, C., Vonk Noordegraaf, D. M., & Krauss, K. (2020). Drivers and Barriers of Mobility-as-a-Service in urban areas. TRA 2020 Helsinki.
Araghim, Y., Larco, N., Bouma, G. M., Doll, C., Noordegraaf, D. M. V., & Krauss, K. (2020). Drivers and Barriers of Mobility-as-a-Service in urban areas. 8th Transport Research Arena TRA.
Barth, M., & Shaheen, S. (2002). Shared-use vehicle systems: Framework for classifying carsharing, station cars, and combined approaches. Transportation Research Record, 1791, 105–112. https://doi.org/10.3141/1791-16
Becker, H., Balac, M., Ciari, F., & Axhausen, K. W. (2020). Assessing the welfare impacts of Shared Mobility and Mobility as a Service (MaaS). Transportation Research Part A: Policy and Practice, 131, 228–243.
Berger, R. (2018). A new breed of cars. Think Act.
Bocken, N., Jonca, A., Södergren, K., & Palm, J. (2020). Emergence of carsharing business models and sustainability impacts in Swedish cities. Sustainability (Switzerland), 12(4). https://doi.org/10.3390/su12041594
Boijens, M., Evers, R., Bartelse, J., & Turetken, O. (2021). Urban Mobility Operating System (UMOS), de oplossing “beyond MaaS”: Is UMOS een bedreiging voor andere MaaS initiatieven of juist een kans? Capgemini Invent, 33–38.
Bork, H. (2019). THE RISE AND FALL OF CHINESE BIKE-SHARING STARTUPS.
Caligiuri, P., & Bonache, J. (2016). Evolving and enduring challenges in global mobility. Journal of World Business,

59
51(1), 127–141. https://doi.org/10.1016/j.jwb.2015.10.001
Chen, K., & Sheldon, M. (2016). Dynamic Pricing in a Labor Market: Surge Pricing and Flexible Work on the Uber Platform. Ec, 455(10.1145), 2940716–2940798.
Chen, L., Mislove, A., & Wilson, C. (2015). Peeking beneath the hood of uber. Proceedings of the 2015 Internet Measurement Conference, 495–508.
Coconea, L., Mizaras, V., Turetken, O., Dovinola, G., & Grefen, P. (2019). Insights on traffic management in the MaaS value chain. 13th ITS European Congress, 3–6.
Coconea, L., Mizaras, V., Turetken, O., & Grefen, P. (2019, May). Traffic Management: the invisible actor in the MaaS value chain. Mobil. TUM 2019.
Cohen, B., & Kietzmann, J. (2014a). Ride on! Mobility business models for the sharing economy. Organization \& Environment, 27(3), 279–296.
Cohen, B., & Kietzmann, J. (2014b). Ride On! Mobility Business Models for the Sharing Economy. Organization and Environment, 27(3), 279–296. https://doi.org/10.1177/1086026614546199
Croxford, B., Penn, A., & Hillier, B. (1996). Spatial distribution of urban pollution: Civilizing urban traffic. Science of the Total Environment, 189–190(96), 3–9. https://doi.org/10.1016/0048-9697(96)05184-4
Curtis, S. K., & Mont, O. (2020). Sharing economy business models for sustainability. Journal of Cleaner Production, 266, 121519. https://doi.org/10.1016/j.jclepro.2020.121519
Darbéra, R. (2017). Business--models for the taxi of the future. International Road Union (IRU).
de-Miguel-Molina, M., de-Miguel-Molina, B., & Catalá-Pérez, D. (2020). The collaborative economy and taxi services: Moving towards new business models in Spain. Research in Transportation Business and Management, August 2019. https://doi.org/10.1016/j.rtbm.2020.100503
Degele, J., Gorr, A., Haas, K., Kormann, D., Krauss, S., Lipinski, P., Tenbih, M., Koppenhoefer, C., Fauser, J., & Hertweck, D. (2018). Identifying E-scooter sharing customer segments using clustering. 2018 IEEE International Conference on Engineering, Technology and Innovation (ICE/ITMC), 1–8.
Degirmenci, K., & Breitner, M. H. (2014a). Carsharing: A literature review and a perspective for information systems research. Tagungsband Multikonferenz Wirtschaftsinformatik 2014, MKWI 2014, 962–979.
Degirmenci, K., & Breitner, M. H. (2014b). Carsharing: A literature review and a perspective for information systems research. MKWI 2014-Multikonferenz Wirtschaftsinformatik, 962–979.
DeMaio, P. (2009). Bike-sharing: History, Impacts, Models of Provision, and Future. Journal of Public Transportation, 12(4), 41–56. https://doi.org/10.5038/2375-0901.12.4.3
Devox. (2020). Software Development Hourly Rate: World-Wide Comparison 2020.
Dikici, A., Turetken, O., & Demirors, O. (2018). Factors influencing the understandability of process models: A systematic literature review. Information and Software Technology, 93, 112–129.
Dillet, R. (2019). Daimler and BMW invest \$1.1 billion in urban mobility services.
Djangostars. (2021). How Much Does it Cost to Build an Uber-like Taxi App in 2020?
Dowling, R., & Kent, J. (2015). Practice and public-private partnerships in sustainable transport governance: The case of car sharing in Sydney, Australia. Transport Policy, 40, 58–64. https://doi.org/10.1016/j.tranpol.2015.02.007
Eccarius, T., & Lu, C. C. (2020). Adoption intentions for micro-mobility – Insights from electric scooter sharing in Taiwan. Transportation Research Part D: Transport and Environment, 84(April), 102327. https://doi.org/10.1016/j.trd.2020.102327

60
Eckhardt, J., Sochor, J., & Aapaoja, A. (2017). Mobility as a Service Mobility as a Service. 12th ITS European Congress, August, 2–4.
Efrati, A., & Weinberg, C. (2018). Inside Bird’s Scooter Economics. The Information.
Einav, L., Farronato, C., & Levin, J. (2016). Peer-to-peer markets. Annual Review of Economics, 8, 615–635.
Essaidi, M., Duthu, C., Tschödrich, S., Douglas, R., & Cordonnier, G. (2020). The future of MaaS - Which model of MaaS wil win through? Capgemini Invent.
Fehrer, J. A., Woratschek, H., & Brodie, R. J. (2018). A systemic logic for platform business models. Journal of Service Management, 29(4), 546–568. https://doi.org/10.1108/JOSM-02-2017-0036
Ferrero, F., Perboli, G., Rosano, M., & Vesco, A. (2018). Car-sharing services: An annotated review. Sustainable Cities and Society, 37(October 2017), 501–518. https://doi.org/10.1016/j.scs.2017.09.020
Ferrero, F., Perboli, G., Vesco, A., Caiati, V., & Gobbato, L. (2015). Car-Sharing Services – Part A Taxonomy and Annotated Review. September, 1–42.
Fishman, E., Washington, S., & Haworth, N. (2013). Bike Share: A Synthesis of the Literature. Transport Reviews, 33(2), 148–165. https://doi.org/10.1080/01441647.2013.775612
Garud, R., Kumaraswamy, A., Roberts, A., & Xu, L. (2020). Liminal movement by digital platform-based sharing economy ventures: The case of Uber Technologies. Strategic Management Journal.
Gilsing, R. (2020). Supporting Service-Dominant Business Model Evaluation in the Context of Business Model Innovation. PhD Thesis. Eindhoven University of Technology.
Gilsing, R., Turetken, O., Grefen, P., & Adali, O. E. (2018). A reference model for the design of Service-Dominant Business Models in the smart mobility domain. International Conference on Information Systems (ICIS 2018).
Gilsing, R., Turetken, O., Ozkan, B., Adali, O. E., & Grefen, P. (2020). A method for qualitative evaluation of service-dominant business models. ECIS 2020 Research Papers. https://aisel.aisnet.org/ecis2020_rp/145
Gilsing, R., Turetken, O., Ozkan, B., Grefen, P., Adali, O. E., Wilbik, A., & Berkers, F. (2021). Evaluating the Design of Service-Dominant Business Models: A Qualitative Method. Pacific Asia Journal of the Association for Information Systems, 13(1), 2. https://doi.org/10.17705/1pais.13102
Gilsing, R., Turetken, O., Ozkan, B., Slaats, F., Adali, O. E., Wilbik, A., Berkers, F., & Grefen, P. (2020). A Method to Guide the Concretization of Costs and Benefits in Service-Dominant Business Models. IFIP Advances in Information and Communication Technology, 598, 61–70. https://doi.org/10.1007/978-3-030-62412-5_5
Grefen, P., & Turetken, O. (2018, April). Achieving business process agility through service engineering in extended business networks. BPTrends, April-2018.
Grefen, P., Turetken, O., & Razavian, M. (2016). Awareness Initiative for Agile Business Models in the Dutch Mobility Sector: An Experience Report. Beta Working Papers, Vol. 505, Eindhoven University of Technology.
Grefen, P., Turetken, O., Traganos, K., Hollander, A. den, & Eshuis, R. (2015). Creating Agility in Traffic Management by Collaborative Service-Dominant Business Engineering. In IFIP International Federation for Information Processing: PRO-VE 2015 Proceedings (Vol. 463, pp. 100–109). https://doi.org/10.1007/978-3-319-24141-8
Hahn, R., Ostertag, F., Lehr, A., Büttgen, M., & Benoit, S. (2020). “I like it, but I don’t use it”: Impact of carsharing business models on usage intentions in the sharing economy. Business Strategy and the Environment, 29(3), 1404–1418.
Han, F., Xie, R., & Lai, M. (2018). Traffic density, congestion externalities, and urbanization in China. Spatial Economic Analysis, 13(4), 400–421. https://doi.org/10.1080/17421772.2018.1459045
Holmberg, P.-E., Collado, M., Sarasini, S., & Williander, M. (2016). Mobility as a Service-MaaS: Describing the
61
framework. Tuesday, February 16, 2016.
Hossain, M. (2020). Sharing economy: A comprehensive literature review. International Journal of Hospitality Management, 87(July 2018). https://doi.org/10.1016/j.ijhm.2020.102470
Howe, E. (2018). Global Scootersharing Market Report 2018. Innoz . Retrieved from Https:// Www.Innoz.de/Sites/Default/Files/Global_scootersharing_market_report_2018.Pdf., November.
Howe, E., & Bock, B. (2018). Global scootersharing market report 2018. InnoZ-Innovation Centre for Mobility and Societal Change (InnoZ) GmbH: Berlin, Germany.
Howe, E., & Jakobsen, F. J. (2020). Global Moped Sharing Market Report 2020. Unu.
Jang, S., Caiati, V., Rasouli, S., Timmermans, H., & Choi, K. (2020). Does MaaS contribute to sustainable transportation? A mode choice perspective. Https://Doi.Org/10.1080/15568318.2020.1783726, 1–13. https://doi.org/10.1080/15568318.2020.1783726
Jelbi. (2021). BVG Jelbi – all urban mobility in one place.
Jochem, P., Frankenhauser, D., Ewald, L., Ensslen, A., & Fromm, H. (2020). Does free-floating carsharing reduce private vehicle ownership? The case of SHARE NOW in European cities. Transportation Research Part A: Policy and Practice, 141(August), 373–395. https://doi.org/10.1016/j.tra.2020.09.016
Kamargianni, M. (2018). End-to-end Approach for Mobility-as-a-Service tools, business models, enabling framework and evidence for European seamless mobility. MaaS4EU.
Kamargianni, M. (2020). Virtual Final Conference - Outcomes, Challenges and Lessons Learned. MaaS4EU.
Kamargianni, M., & Matyas, M. (2017). The Business Ecosystem of Mobility-as-a-Service. 96th Transportation Research Board (TRB) Annual Meeting, Washington DC, 8-12 January 2017, January, 8–12.
Kaplan, S., & Tripsas, M. (2008). Thinking about technology: Applying a cognitive lens to technical change. Research Policy, 37(5), 790–805.
Ketonen-Oksi, S., Jussila, J. J., & Kärkkäinen, H. (2016). Social media based value creation and business models. Industrial Management \& Data Systems.
Kitchenham, B. A., & Charters, S. (2007). Guidelines for performing systematic literature reviews in software engineering. Technical Report, Ver. 2.3 EBSE Technical Report. EBSE, 1, 1–54.
Lagadic, M., Verloes, A., & Louvet, N. (2019). Can carsharing services be profitable? A critical review of established and developing business models. Transport Policy, 77(October 2018), 68–78. https://doi.org/10.1016/j.tranpol.2019.02.006
Lee, H., & Lui, N. (2018). The Economics of Bike Sharing. Singapore Policy Journal.
Li, Y., & Voege, T. (2017). Mobility as a service (MaaS): Challenges of implementation and policy required. Journal of Transportation Technologies, 7(2), 95–106.
Lu, M., Turetken, O., Adali, O. E., Castells, J., Blokpoel, R., & Grefen, P. (2018). Cooperative Intelligent Transport Systems (C-ITS) deployment in Europe: Challenges and key findings. 25th ITS World Congress, EU-TP1076.
Luftenegger, E. (2014). Service-Dominant Business Design PhD Thesis. Eindhoven University of Technology, The Netherlands. Eindhoven University of Technology, The Netherlands.
Lygnerud, K., & Nilsson, A. (2020). Business model components to consider for ridesharing schemes in rural areas – results from four Swedish pilot projects. Research in Transportation Business and Management, xxxx, 100553. https://doi.org/10.1016/j.rtbm.2020.100553
Lyons, G., Hammond, P., & Mackay, K. (2019). The importance of user perspective in the evolution of MaaS. Transportation Research Part A: Policy and Practice, 121, 22–36. https://doi.org/10.1016/J.TRA.2018.12.010

62
Machado, C. A. S., Hue, N. P. M. de S., Berssaneti, F. T., & Quintanilha, J. A. (2018). An overview of shared mobility. Sustainability (Switzerland), 10(12), 1–21. https://doi.org/10.3390/su10124342
Mobike. (2017). Mobike Raises Over \$600 Million in Series E Financing Led By Tencent.
Mohamed, M. J., Rye, T., & Fonzone, A. (2020). The utilisation and user characteristics of Uber services in London. Transportation Planning and Technology, 43(4), 424–441. https://doi.org/10.1080/03081060.2020.1747205
Moovit. (2021). Moovit | Shaping the Future of Mobility with MaaS.
Morris, M., Schindehutte, M., & Allen, J. (2005). The entrepreneur’s business model: toward a unified perspective. Journal of Business Research, 58(6), 726–735.
Mulley, C., & Nelson, J. (2020). How Mobility as a Service Impacts Public Transport Business Models. OECD.
Münzel, K., Boon, W., Frenken, K., & Vaskelainen, T. (2018). Carsharing business models in Germany: characteristics, success and future prospects. Information Systems and E-Business Management, 16(2), 271–291. https://doi.org/10.1007/s10257-017-0355-x
Narupiti, S. (2019). Exploring the possibility of MaaS service in Thailand, implications from the existing conditions and experts’ opinions on “Who should be the MaaS provider in Bangkok?” IATSS Research, 43(4), 226–234.
Nextbike. (2021). The ADbike.
Nistal, P. D., & Regidor, J. R. F. (2016). Comparative study of Uber and regular taxi service characteristics. Proceedings of the 23rd Annual Conference of the Transportation Science Society of the Philippines, Quezon City, Philippines. Available from: Http://Ncts. Upd. Edu. Ph/Tssp/Wp-Content/Upload/2016/08/Paronda-et-Al. Pdf (Accessed August 13, 2017).
Noulas, A., Salnikov, V., Hristova, D., Mascolo, C., & Lambiotte, R. (2018). Developing and deploying a taxi price comparison mobile app in the wild: Insights and challenges. 2018 IEEE 5th International Conference on Data Science and Advanced Analytics (DSAA), 424–433.
Osterwalder, A., & Pigneur, Y. (2010). Business model canvas. Self Published. Last.
Parker, G. G., Van Alstyne, M. W., & Choudary, S. P. (2016). Platform revolution: How networked markets are transforming the economy and how to make them work for you. WW Norton \& Company.
Parkes, S. D., Marsden, G., Shaheen, S., & Cohen, A. (2013). Understanding the diffusion of public bikesharing systems: Evidence from Europe and North America. Journal of Transport Geography, 31, 94–103. https://doi.org/10.1016/j.jtrangeo.2013.06.003
Paronda, A. G. A., Regidor, J. R. F., & Gaabucayan-Napalang, S. (2017). An Exploratory Study on Uber, GrabCar, and Conventional Taxis in Metro Manila. University of the Philippines.
Pelzer, P., Frenken, K., & Boon, W. (2019). Institutional entrepreneurship in the platform economy: How Uber tried (and failed) to change the Dutch taxi law. Environmental Innovation and Societal Transitions, 33, 1–12.
Perboli, G., Ferrero, F., Musso, S., & Vesco, A. (2018). Business models and tariff simulation in car-sharing services. Transportation Research Part A: Policy and Practice, 115(September 2017), 32–48. https://doi.org/10.1016/j.tra.2017.09.011
Polydoropoulou, A., Pagoni, I., Tsirimpa, A., Roumboutsos, A., Kamargianni, M., & Tsouros, I. (2020). Prototype business models for Mobility-as-a-Service. Transportation Research Part A: Policy and Practice, 131(September 2019), 149–162. https://doi.org/10.1016/j.tra.2019.09.035
Puschmann, T., & Alt, R. (2016). Sharing economy. Business & Information Systems Engineering, 58(1), 93–99.
Remane, G., Nickerson, R. C., Hanelt, A., Tesch, J. F., & Kolbe, L. M. (2016). A taxonomy of carsharing business models. 2016 International Conference on Information Systems, ICIS 2016, 1–19.

63
Reuschl, A., Tiberius, V., Filser, M., & Qiu, Y. (2021). Value configurations in sharing economy business models. Review of Managerial Science, 0123456789. https://doi.org/10.1007/s11846-020-00433-w
Roukouni, A., & Correia, G. H. de A. (2020). Evaluation methods for the impacts of shared mobility: Classification and critical review. Sustainability (Switzerland), 12(24), 1–22. https://doi.org/10.3390/su122410504
Sakai, K. (2019). MaaS trends and policy-level initiatives in the EU. IATSS Research, 43(4), 207–209.
Salnikov, V., Lambiotte, R., Noulas, A., & Mascolo, C. (2015). Openstreetcab: Exploiting taxi mobility patterns in new york city to reduce commuter costs. ArXiv Preprint ArXiv:1503.03021.
Sarasini, S., Sochor, J., & Arby, H. (2017). What characterises a sustainable MaaS business model? 1st International Conference on Mobility as a Service (ICOMaaS), November, 15.
Schellong, D., Sadek, P., Schaetzberger, C., & Barrack, T. (2019). The Promise and Pitfalls of E-Scooter Sharing. Boston Consulting Group, 1–14.
Schenker, J. L. (2019). The Plaform Economy. The Innovator.
Shaheen, S., Bansal, A., Chan, N., & Cohen, A. (2017). Mobility and the sharing economy: industry developments and early understanding of impacts. Low Carbon Mobility for Future Cities: Principles and Applications, 213–240. https://doi.org/10.1049/pbtr006e_ch10
Shaheen, S., & Cohen, A. (2007). Growth in worldwide carsharing: An international comparison. Transportation Research Record, 1992(1), 81–89.
Shaheen, S., & Cohen, A. (2020). Innovative Mobility Carsharing Outlook: Carsharing Market Overview, Analysis and Trends. Transportation Sustainability Research Center.
Shaheen, S., Cohen, A., Chan, N., & Bansal, A. (2019). Sharing strategies: Carsharing, shared micromobility (bikesharing and scooter sharing), transportation network companies, microtransit, and other innovative mobility modes. In Transportation, Land Use, and Environmental Planning (Issue 2010). Elsevier Inc. https://doi.org/10.1016/B978-0-12-815167-9.00013-X
Shaheen, S., Cohen, A., Chan, N., & Bansal, A. (2020). Sharing strategies: carsharing, shared micromobility (bikesharing and scooter sharing), transportation network companies, microtransit, and other innovative mobility modes. In Transportation, Land Use, and Environmental Planning (pp. 237–262). Elsevier.
Shaheen, S., Cohen, A., & Roberts, D. (2006). Carsharing in North America: Market growth, current developments, and future potential. Transportation Research Record, 1986(1), 116–124.
Shaheen, S., Guzman, S., & Zhang, H. (2010a). Bikesharing in Europe, the Americas, and Asia: past, present, and future. Transportation Research Record, 2143(1), 159–167.
Shaheen, S., Guzman, S., & Zhang, H. (2010b). Bikesharing in Europe, the Americas, and Asia. Transportation Research Record, 2143, 159–167. https://doi.org/10.3141/2143-20
Shaheen, S., Mallery, M. A., & Kingsley, K. J. (2012). Personal vehicle sharing services in North America. Research in Transportation Business & Management, 3, 71–81.
Shaheen, S., Martin, E. W., Cohen, A., Chan, N., & Pogodzinsk, M. (2014). Public Bikesharing in North America During a Period of Rapid Expansion: Understanding Business Models, Industry Trends & User Impacts. Mineta Transportation Institute Report 12-29, 2–3.
Shaheen, S., Sperling, D., & Wagner, C. (1998). Carsharing in Europe and North American: past, present, and future. Transportation Quarterly, 52(3), 35–52.
Shu, C. (2018). Chinese bike-sharing startup Ofo raises \$866M in new financing led by Alibaba Group.
Si, H., Shi, J. gang, Wu, G., Chen, J., & Zhao, X. (2019). Mapping the bike sharing research published from 2010 to 2018: A scientometric review. Journal of Cleaner Production, 213, 415–427. https://doi.org/10.1016/j.jclepro.2018.12.157

64
Si, S., Chen, H., Liu, W., & Yan, Y. (2020). Disruptive innovation, business model and sharing economy: the bike-sharing cases in China. Management Decision. https://doi.org/10.1108/MD-06-2019-0818
Smedlund, A. (2012). Value Cocreation in Service Platform Business Models. Service Science, 4(1), 79–88. https://doi.org/10.1287/serv.1110.0001
Smith, G., Sochor, J., & Karlssona, M. (2017). Mobility as a Service: Implications for future mainstream public transport.
Sochor, J., Arby, H., Karlsson, I. C. M. A., & Sarasini, S. (2018). A topological approach to Mobility as a Service: A proposed tool for understanding requirements and effects, and for aiding the integration of societal goals. Research in Transportation Business and Management, 27(November), 3–14. https://doi.org/10.1016/j.rtbm.2018.12.003
Su, R., & Fang, Z. (2019). Review of studies on taxi mobility and e-hailing taxi service. Journal of Smart Cities, 4(1), 1–6.
Suratno, B., Ozkan, B., Turetken, O., & Grefen, P. (2018). A Method for Operationalizing Service-Dominant Business Models into Conceptual Process Models. In Shishkov B. (Ed.), Business Modeling and Software Design. BMSD 2018. Lecture Notes in Business Information Processing, vol 319 (pp. 133–148). Springer, Cham. https://doi.org/10.1007/978-3-319-94214-8_9
Tarhan, A., Turetken, O., & Reijers, H. A. (2016). Business process maturity models: A systematic literature review. Information and Software Technology, 75, 122–134. https://doi.org/10.1016/j.infsof.2016.01.010
Täuscher, K., & Laudien, S. M. (2018). Understanding platform business models: A mixed methods study of marketplaces. European Management Journal, 36(3), 319–329. https://doi.org/10.1016/j.emj.2017.06.005
Teece, D. J. (2018). Business models and dynamic capabilities. Long Range Planning, 51(1), 40–49.
Thomas, L. D. W., Autio, E., & Gann, D. M. (2014). Architectural leverage: Putting platforms in context. Academy of Management Perspectives, 28(2), 198–219. https://doi.org/10.5465/amp.2011.0105
Traganos, K., Grefen, P., Hollander, A. den, Turetken, O., & Eshuis, R. (2015). Business Model Prototyping for Intelligent Transport Systems: A Service-Dominant Approach. Beta Working Papers, Vol. 469. Eindhoven University of Technology.
Turetken, O., Evers, R., Ozkan, B., Bartelse, J., Boijens, M., Rottier, T., Roozendaal, L. Van, Gilsing, R., & Adali, O. E. (2021). Concept Design for an Open Mobility Service Platform: UMOS. https://doi.org/10.4324/9780429347153-6
Turetken, O., & Grefen, P. (2017). Designing service-dominant business models. European Conference on Information Systems, ECIS 2017, 2218–2233.
Turetken, O., Grefen, P., Gilsing, R., & Adali, O. E. (2018). Initial Business Models, C-MobILE - Accelerating C-ITS Mobility Innovation and deployment in Europe. Deliverable 2.5.
Turetken, O., Grefen, P., Gilsing, R., & Adali, O. E. (2019). Service-Dominant Business Model Design for Digital Innovation in Smart Mobility. Business & Information Systems Engineering, 61(1), 9–29. https://doi.org/10.1007/s12599-018-0565-x
Turetken, O., Grefen, P., Gilsing, R., Adali, O. E., & Ozkan, B. (2019). Business-model innovation in the smart mobility domain. In L. Meng (Ed.), Cooperative Intelligent Transport Systems: Towards High-Level Automated Driving (pp. 63–86). https://doi.org/https://doi.org/10.1049/PBTR025E_ch4
Turetken, O., Jethefer, S., & Ozkan, B. (2020). Internal audit effectiveness: operationalization and influencing factors. Managerial Auditing Journal, 35(2), 238–271. https://doi.org/10.1108/MAJ-08-2018-1980
UN. (2018). World unbanization prospects 2018. Department of Economic and Social Affairs.
van Sambeek, M., Turetken, O., Ophelders, F., Eshuis, R., Bijlsma, T., Traganos, K., van der Kluit, B., & Grefen, P. (2015). Towards an Architecture for Cooperative-Intelligent Transport System (C-ITS) Applications in the

65
Netherlands. BETA publication: working papers No. 485. https://doi.org/http://dx.doi.org/10.13140/RG.2.2.29780.60806
Verkeersnet. (2020). Eerste twee nationale MaaS-pilots van start.
Waes, A., Farla, J., Frenken, K., de Jong, J. P. J., & Raven, R. (2018). Business model innovation and socio-technical transitions. A new prospective framework with an application to bike sharing. Journal of Cleaner Production, 195, 1300–1312. https://doi.org/10.1016/j.jclepro.2018.05.223
Walji, J., & Walji, J. (2016a). Uber, a disruptive business model of a taxi service. International Journal of Systematic Innovation, 4(2), 23–29.
Walji, J., & Walji, W. (2016b). Uber, a Disruptive Business Model of a Taxi Service. International Journal of Systematic Innovation, 4(2).
Wang, X., He, F., Yang, H., & Gao, H. O. (2016). Pricing strategies for a taxi-hailing platform. Transportation Research Part E: Logistics and Transportation Review, 93, 212–231.
Weill, P., Malone, T. W., & Apel, T. G. (2011). The business models investors prefer. MIT Sloan Management Review, 52(4), 17.
Willing, C., Brandt, T., & Neumann, D. (2017). Electronic mobility market platforms – a review of the current state and applications of business analytics. Electronic Markets, 27(3), 267–282. https://doi.org/10.1007/s12525-017-0257-2
Wong, Y. Z., & Hensher, D. A. (2020). Delivering mobility as a service (MaaS) through a broker/aggregator business model. Transportation, 0123456789. https://doi.org/10.1007/s11116-020-10113-z
Wyman, K. (2017). Taxi Regulation in the Age of Uber. New York University Journal of Legislation and Public Policy, 2(1), 1–100.
Yun, J. H. J., Zhao, X., Wu, J., Yi, J. C., Park, K. B., & Jung, W. Y. (2020). Modelo de negócios, inovação aberta e sustentabilidade na indústria de compartilhamento de automóveis - comparando três economias. Sustainability (Switzerland), 12(6), 27.
Zott, C., Amit, R., & Massa, L. (2011). The business model: recent developments and future research. Journal of Management, 37(4), 1019–1042.