Urban growth in Chengdu, Western China: application of remote sensing to assess planning and policy...
24
1 Introduction China’s rapid urbanization process has generated much attention in recent decades (Ma and Hanten, 1981; Guldin, 1997; Lin, 1998; Yeh and Wu, 1999; Ma, 2002). Following economic and land reforms in 1978, the Chinese government focused its plans for growth on a small number of high-performing cities along the coast. These special economic zones (SEZs) and ‘open cities’ were designed to attract international capital, managerial expertise, and technological knowledge. The reforms, combined with decentralization of administrative and fiscal powers, liberalization of the house- hold registration ( hukou) system, and equitization of state-owned enterprises (SOEs), have resulted in a rise in rural ^ urban migration, considerable increases in GDP (China Statistical Bureau, 2001), and significant conversion of farmland to urban uses (Li,1998; Ji et al, 2001; Seto et al, 2002). High rates of national economic growth, demographic changes, and physical urban expansion are not only drivers but also Urban growth in Chengdu, Western China: application of remote sensing to assess planning and policy outcomes Annemarie Schneiderô Department of Geography and Center for Remote Sensing, Boston University, 675 Commonwealth Avenue, Boston, MA 02215 Karen C Seto Center for Environmental Science and Policy, and Department of Geological and Environmental Sciences, Stanford Institute for International Studies, Stanford University, Stanford, CA 94305, USA; e-mail: [email protected] Douglas R Webster Asia Pacific Research Center, Stanford Institute for International Studies, Stanford University, Stanford, CA 94305; USA; e-mail: [email protected] Received 21 April 2004; in revised form 19 November 2004 Environment and Planning B: Planning and Design 2005, volume 32, pages 323 ^ 345 Abstract. The majority of studies on Chinese urbanization have been focused on coastal areas, with little attention given to urban centers in the west. Western provinces, however, will unquestionably undergo significant urban change in the future as a result of the ‘Go West’ policy initiated in the 1990s. In this paper the authors examine the relationship between drivers of urban growth and land- use outcomes in Chengdu, capital of the western province of Sichuan, China. In the first part of this research, remotely sensed data are used to map changes in land cover in the greater Chengdu area and to investigate the spatial distribution of development with use of landscape metrics along seven urban-to-rural transects identified as key corridors of growth. Results indicate that the urbanized area increased by more than 350% between 1978 and 2002 in three distinct spatial trends: (a) near the urban fringe in all directions prior to 1990, (b) along transportation corridors, ring roads, and near satellite cities after 1990, and, finally, (c) infilling in southern and western areas (connecting satellite cities to the urban core) in the late 1990s. In the second part of this paper the authors connect patterns of growth with economic, land, and housing market reforms, which are explored in the context of urban planning initiatives. The results reveal that, physically, Chengdu is following trends witnessed in coastal cities of China, although the importance of various land-use drivers differs from that in the east (for example, in the low level of foreign direct investment to date). The information provided by the land-use analysis ultimately helped tailor policies and plans for better land management and reduced fragmentation of new development in the municipality. DOI:10.1068/b31142 } Current address: Department of Geography, University of California öSanta Barbara, Santa Barbara, CA 93106, USA; e-mail: [email protected]
Transcript of Urban growth in Chengdu, Western China: application of remote sensing to assess planning and policy...
1 IntroductionChina's rapid urbanization process has generated much attention in recent decades(Ma and Hanten, 1981; Guldin, 1997; Lin, 1998; Yeh and Wu, 1999; Ma, 2002).Following economic and land reforms in 1978, the Chinese government focused itsplans for growth on a small number of high-performing cities along the coast. Thesespecial economic zones (SEZs) and `open cities' were designed to attract internationalcapital, managerial expertise, and technological knowledge. The reforms, combinedwith decentralization of administrative and fiscal powers, liberalization of the house-hold registration (hukou) system, and equitization of state-owned enterprises (SOEs),have resulted in a rise in rural ^ urban migration, considerable increases in GDP(China Statistical Bureau, 2001), and significant conversion of farmland to urbanuses (Li, 1998; Ji et al, 2001; Seto et al, 2002). High rates of national economic growth,demographic changes, and physical urban expansion are not only drivers but also
Urban growth in Chengdu, Western China: application ofremote sensing to assess planning and policy outcomes
Annemarie SchneiderôDepartment of Geography and Center for Remote Sensing, Boston University,675 Commonwealth Avenue, Boston, MA 02215
Karen C SetoCenter for Environmental Science and Policy, and Department of Geological and EnvironmentalSciences, Stanford Institute for International Studies, Stanford University, Stanford, CA 94305,USA; e-mail: [email protected]
Douglas R WebsterAsia Pacific Research Center, Stanford Institute for International Studies, Stanford University,Stanford, CA 94305; USA; e-mail: [email protected] 21 April 2004; in revised form 19 November 2004
Environment and Planning B: Planning and Design 2005, volume 32, pages 323 ^ 345
Abstract. The majority of studies on Chinese urbanization have been focused on coastal areas, withlittle attention given to urban centers in the west. Western provinces, however, will unquestionablyundergo significant urban change in the future as a result of the `Go West' policy initiated in the1990s. In this paper the authors examine the relationship between drivers of urban growth and land-use outcomes in Chengdu, capital of the western province of Sichuan, China. In the first part of thisresearch, remotely sensed data are used to map changes in land cover in the greater Chengdu areaand to investigate the spatial distribution of development with use of landscape metrics along sevenurban-to-rural transects identified as key corridors of growth. Results indicate that the urbanized areaincreased by more than 350% between 1978 and 2002 in three distinct spatial trends: (a) near theurban fringe in all directions prior to 1990, (b) along transportation corridors, ring roads, and nearsatellite cities after 1990, and, finally, (c) infilling in southern and western areas (connecting satellitecities to the urban core) in the late 1990s. In the second part of this paper the authors connectpatterns of growth with economic, land, and housing market reforms, which are explored in thecontext of urban planning initiatives. The results reveal that, physically, Chengdu is following trendswitnessed in coastal cities of China, although the importance of various land-use drivers differs fromthat in the east (for example, in the low level of foreign direct investment to date). The informationprovided by the land-use analysis ultimately helped tailor policies and plans for better land managementand reduced fragmentation of new development in the municipality.
DOI:10.1068/b31142
} Current address: Department of Geography, University of CaliforniaöSanta Barbara, SantaBarbara, CA 93106, USA; e-mail: [email protected]
outcomes of the ongoing urban and periurban transformation in China, unprecedentedin history and unparalleled anywhere else in the world (Pannell, 2002).
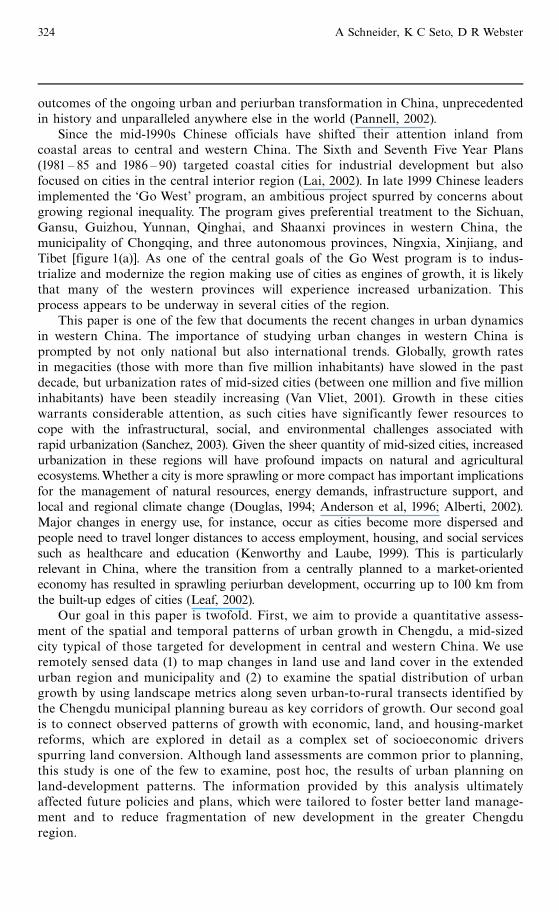
Since the mid-1990s Chinese officials have shifted their attention inland fromcoastal areas to central and western China. The Sixth and Seventh Five Year Plans(1981 ^ 85 and 1986 ^ 90) targeted coastal cities for industrial development but alsofocused on cities in the central interior region (Lai, 2002). In late 1999 Chinese leadersimplemented the `Go West' program, an ambitious project spurred by concerns aboutgrowing regional inequality. The program gives preferential treatment to the Sichuan,Gansu, Guizhou, Yunnan, Qinghai, and Shaanxi provinces in western China, themunicipality of Chongqing, and three autonomous provinces, Ningxia, Xinjiang, andTibet [figure 1(a)]. As one of the central goals of the Go West program is to indus-trialize and modernize the region making use of cities as engines of growth, it is likelythat many of the western provinces will experience increased urbanization. Thisprocess appears to be underway in several cities of the region.
This paper is one of the few that documents the recent changes in urban dynamicsin western China. The importance of studying urban changes in western China isprompted by not only national but also international trends. Globally, growth ratesin megacities (those with more than five million inhabitants) have slowed in the pastdecade, but urbanization rates of mid-sized cities (between one million and five millioninhabitants) have been steadily increasing (Van Vliet, 2001). Growth in these citieswarrants considerable attention, as such cities have significantly fewer resources tocope with the infrastructural, social, and environmental challenges associated withrapid urbanization (Sanchez, 2003). Given the sheer quantity of mid-sized cities, increasedurbanization in these regions will have profound impacts on natural and agriculturalecosystems.Whether a city is more sprawling or more compact has important implicationsfor the management of natural resources, energy demands, infrastructure support, andlocal and regional climate change (Douglas, 1994; Anderson et al, 1996; Alberti, 2002).Major changes in energy use, for instance, occur as cities become more dispersed andpeople need to travel longer distances to access employment, housing, and social servicessuch as healthcare and education (Kenworthy and Laube, 1999). This is particularlyrelevant in China, where the transition from a centrally planned to a market-orientedeconomy has resulted in sprawling periurban development, occurring up to 100 km fromthe built-up edges of cities (Leaf, 2002).
Our goal in this paper is twofold. First, we aim to provide a quantitative assess-ment of the spatial and temporal patterns of urban growth in Chengdu, a mid-sizedcity typical of those targeted for development in central and western China. We useremotely sensed data (1) to map changes in land use and land cover in the extendedurban region and municipality and (2) to examine the spatial distribution of urbangrowth by using landscape metrics along seven urban-to-rural transects identified bythe Chengdu municipal planning bureau as key corridors of growth. Our second goalis to connect observed patterns of growth with economic, land, and housing-marketreforms, which are explored in detail as a complex set of socioeconomic driversspurring land conversion. Although land assessments are common prior to planning,this study is one of the few to examine, post hoc, the results of urban planning onland-development patterns. The information provided by this analysis ultimatelyaffected future policies and plans, which were tailored to foster better land manage-ment and to reduce fragmentation of new development in the greater Chengduregion.
324 A Schneider, K C Seto, D R Webster
Provinces in the`Go West' program
`Open cities'
Special economic zones
(a)
(b)
0 25 km
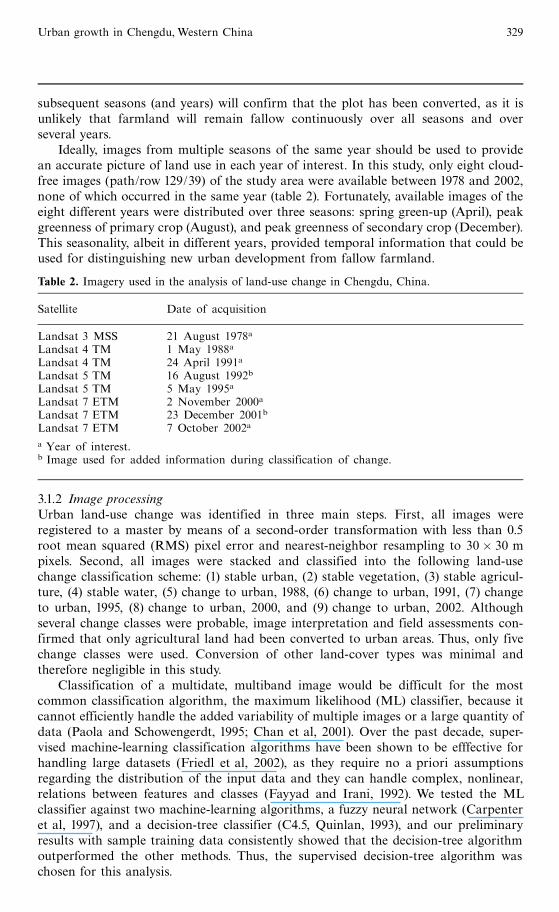
Figure 1. China: (a) provinces and autonomous regions targeted in the `Go West' program,special economic zones, and `open cities' and (b) administrative boundaries of Chengdu munici-pality (counties are shown in white, and districts are shown with hatched lines; urban land use isshown in dark gray). Owing to the lack of satellite image coverage, Dujiangyan, Dayi, Qionglai,and Pujiang counties were omitted from the analysis.
Urban growth in Chengdu,Western China 325

2 Study areaAn ancient city with origins dating back more than 2500 years, Chengdu is theadministrative and cultural center of Sichuan province and the second largest city inthe west after Chongqing [figure 1(b)]. The combination of rich alluvial soils and asubtropical monsoon climate makes the Sichuan plain the most fertile in southwestChina and ideal to support a large variety of crops, including rice, wheat, and rapeseed. Historically, a triple-cropping system has been dominant, with the agriculturalproductivity of the region enhanced over the centuries by elaborate irrigation projects.In addition to a long agricultural legacy, Chengdu has a strong tradition in industryand the arts. In the late 1950s and early 1960s many heavy and military industries weremoved to rural areas near Chengdu for strategic and defense reasons. Subsequently,in the 1970s, many of these industries were moved to Chengdu's periurban area(Webster et al, 2003). With the lowering of strategic threats, modification of themilitary ^ industrial complex to civilian production, and the expansion of the businessand service economy, Chengdu has emerged as one of the most important industrial,service, knowledge, and distribution centers of western China.
The municipality of Chengdu encompasses the city proper as well as twelve addi-tional county-level cities. The `urban core' of Chengdu city covers five districts,although the extent of the urban built-up area has now surpassed the original citydefined by these districts [figure 1(b)]. From 1978 to 2002 the population withinthe city increased by 35% (from 1.7 million to 2.3 million), and the population of themunicipality increased by 25% (from 8 million to 10.1 million), with a significantdemographic shift of the population from rural to urban status (Chengdu StatisticalBureau, 2001). In addition, the city proper is home to a `floating population' estimatedat more than 1.5 million (Webster et al, 2003).
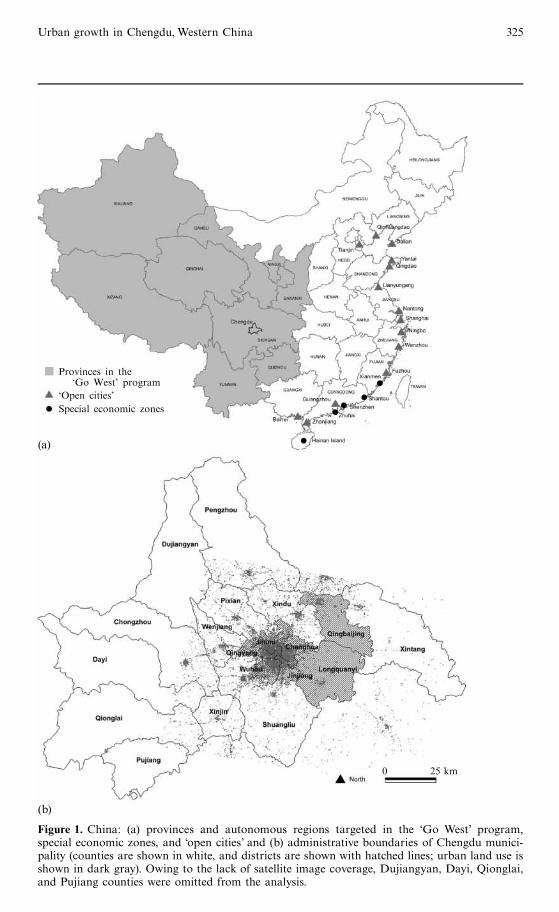
Chengdu has benefited from China's reform policies, which have been a majorfactor in the economic success of the municipality. The city has been targeted byprovincial and national governments as a center for science and technology, high-levelservices, commerce, trade, and finance, as well as a leading hub of transportation andcommunications in southwest China. In 1990 the State Council designated theChengdu High-Tech Development Zone south of the city as the first national-leveldevelopment zone in Sichuan Province, adding a second zone in 1993 in Longquanyito the southeast (South China Morning Post 1993). National status was bestowed on athird high-tech zone in the northwestern suburb of Jinniu in 2000 (figure 2). By inter-national standards, Chengdu's economy has grown at a phenomenal rate since 1980.Over the period 1978 ^ 2002, the GDP of the municipality grew sevenfold, witha restructuring of the economy away from the primary sector to the secondary andtertiary sectors. The composition of the three sectors shifted from 27%, 50%, and 23%in 1980, respectively, to 10%, 45%, and 45% in 2002 (Chengdu Statistical Bureau, 2001).
Authorities in Chengdu Municipality have adopted aggressive strategies for growthin their Ninth (1996 ^ 2001) and Tenth (2001 ^ 06) Five Year Plans, outlining specificstrategies and locations for industrial parks, new towns, tourism, and ecotourism. Theimprovement of transportation infrastructure has also been a key goal. Hundreds ofkilometers of roads have been paved, two additional ring roads have been constructedand arterial highways to Nanchong and Chongqing have been completed, over the pastfive years and the airport has doubled in capacity to become one of China's four majorair hubs, surpassing Kunming as the aviation gateway to western China. Another10 000 km of road development to connect towns and villages to county-level citieshas been planned for the next three years.
Given the lower base from which it started, Chengdu's growth is smaller in scalecompared with that in Shanghai and other large coastal cities, but it is rapid nonetheless.
326 A Schneider, K C Seto, D R Webster
0 10 km
To touristareas
(g)
(f)
High-tech zone
Airport
(e)(d)
High-tech zone
(c)
High-techzone
Industrial cluster
North
(a)
(b)
Military industrycorridor
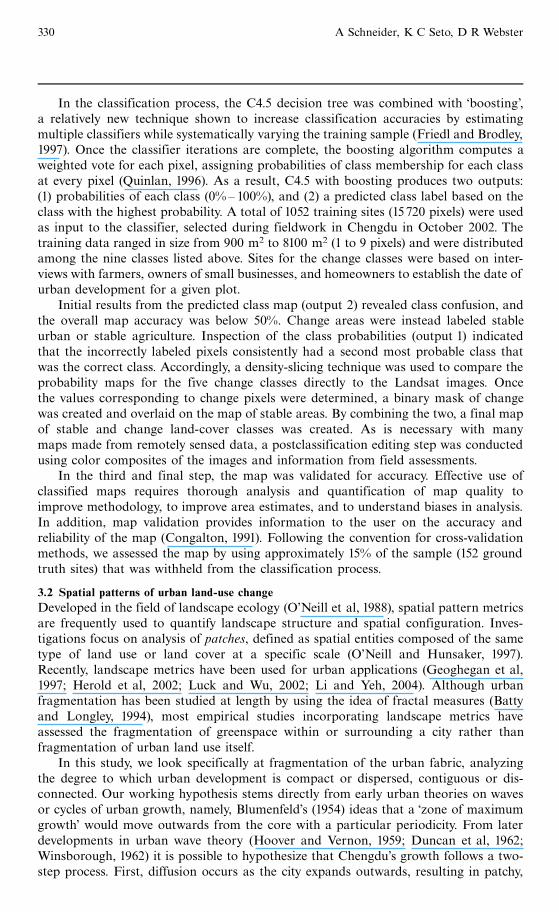
Figure 2. (a) ^ (f ) The seven corridors analyzed for Chengdu, China, determined by using amoving window of spatial pattern metrics (stable urban areas are shown in gray, urban changefrom 1978 to 2002 is shown in black, agriculture and vegetation are shown in white). A sample ofthe economic drivers of land-cover change is illustrated in each corridor. County-level satellitecities are indicated in capital letters.
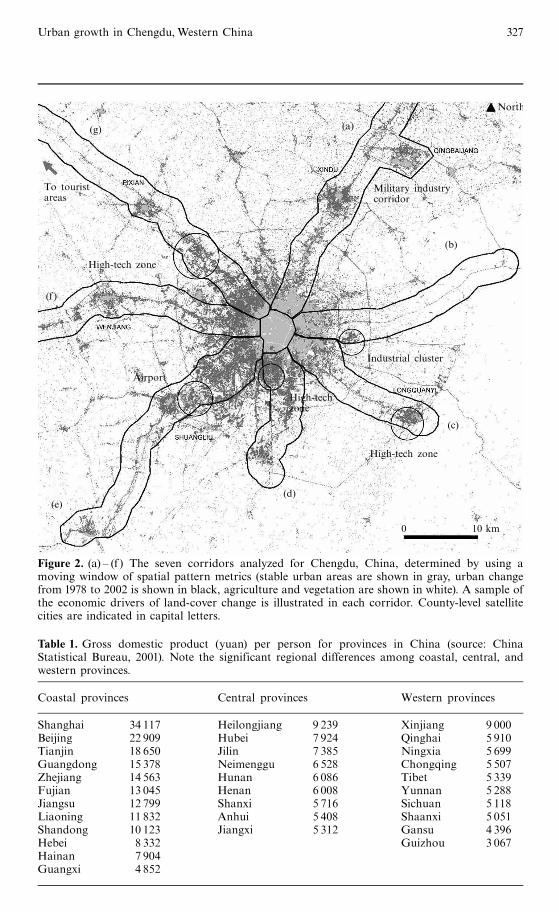
Table 1. Gross domestic product (yuan) per person for provinces in China (source: ChinaStatistical Bureau, 2001). Note the significant regional differences among coastal, central, andwestern provinces.
Coastal provinces Central provinces Western provinces
Shanghai 34 117 Heilongjiang 9 239 Xinjiang 9 000Beijing 22 909 Hubei 7 924 Qinghai 5 910Tianjin 18 650 Jilin 7 385 Ningxia 5 699Guangdong 15 378 Neimenggu 6 528 Chongqing 5 507Zhejiang 14 563 Hunan 6 086 Tibet 5 339Fujian 13 045 Henan 6 008 Yunnan 5 288Jiangsu 12 799 Shanxi 5 716 Sichuan 5 118Liaoning 11 832 Anhui 5 408 Shaanxi 5 051Shandong 10 123 Jiangxi 5 312 Gansu 4 396Hebei 8 332 Guizhou 3 067Hainan 7 904Guangxi 4 852
Urban growth in Chengdu,Western China 327
Open cities along the coast have benefited from much higher levels of foreign directinvestment (FDI), and GDP per capita for coastal provinces is still nearly double thatof central and western provinces (table 1). Although Beijing, Shanghai, and Guangdongprovinces receive the lion's share of FDI, the new wave of industrial estate developmentand joint venture industry (often involving Taiwan and Hong Kong investors) in Chengduindicates significant land development and changes in both city structure and function. AsChina becomes increasingly urban in the next few decades [the urban population of Chinaincreased from 19% in 1980 when reforms commenced to 36% in 2000 (China StatisticalBureau, 2001)], Chengdu serves as a good case study of ongoing land-use changes inmid-sized cities in China.
3 Methodology3.1 Monitoring urban change by means of remote sensing3.1.1 BackgroundRemotely sensed data have been used in numerous studies during the past threedecades to monitor and model urban change (Howarth and Boasson, 1983; Ehlerset al, 1990; Green et al, 1994; Chan et al, 2001; Schneider et al, 2003a). Althoughhistorical maps and aerial photography remain valuable sources of urban land-useinformation, satellite remote sensing offers a tremendous advantage, as it providesrecurrrent and consistent observations over a large geographic area, reveals explicitpatterns of land cover and land use, and presents a synoptic view of the landscape(Jensen and Cowen, 1999). Moreover, for areas with limited data at detailed spatial ortemporal resolution (for example, developing nations, which often lack funds andresources for mapping), remotely sensed imagery can be used to understand the out-comes of land development processes or to evaluate the validity of land-use data fromgovernment statistics (Seto et al, 2000). In Chengdu, as in most rapidly developingcities in Southeast Asia, no current maps or statistics on land use (urban, agricultural,or otherwise) are available.
Despite advances in satellite data and image-processing technology, two commonissues arise in urban change studies: (1) new urban areas and agricultural plots arefrequently confused for one another (unless hyperspectral data are used), and (2)spatial patterns of urban features are difficult to characterize because of the largevariations in scale, size, and shape, which can lead to various `mixtures' within pixels(Seto and Liu, 2003). Agricultural fields introduce an element of change to multidateimages as a result of regular cycles of planting, growth, and harvesting. This issueis further compounded in tropical and subtropical regions where irrigation water isprevalent, because agricultural fields often support multiple crops per year, and thetiming of crops varies among individual fields. At any given time, fallow agriculturalland in and around the city may appear indistinguishable from newly developed urbanareas, as both land-cover types exhibit identical combinations of high visible and highinfrared reflectance in moderate resolution (20 ^ 30 m) imagery. Such is the case in thegreater Chengdu area, where two to three crops per year (with high interyear andintrayear variability) is common.
To overcome these obstacles, multiple images distributed across several seasons canprovide valuable temporal information in addition to the spectral and spatial informa-tion in the images (Brisco and Brown, 1995; Pax-Lenney et al, 1996). For urbananalysis, use of several images can provide added information on whether a givenplot is indeed newly converted to urban use or is still fallow farmland. For instance,if a plot appears as bare ground in May, any subsequent image from additional seasons(for example, August or December) that shows this plot as vegetated will confirm thatit is farmland. Likewise, if the plot is new urban land, the absence of any vegetation in
328 A Schneider, K C Seto, D R Webster
subsequent seasons (and years) will confirm that the plot has been converted, as it isunlikely that farmland will remain fallow continuously over all seasons and overseveral years.
Ideally, images from multiple seasons of the same year should be used to providean accurate picture of land use in each year of interest. In this study, only eight cloud-free images (path/row 129/39) of the study area were available between 1978 and 2002,none of which occurred in the same year (table 2). Fortunately, available images of theeight different years were distributed over three seasons: spring green-up (April), peakgreenness of primary crop (August), and peak greenness of secondary crop (December).This seasonality, albeit in different years, provided temporal information that could beused for distinguishing new urban development from fallow farmland.
3.1.2 Image processingUrban land-use change was identified in three main steps. First, all images wereregistered to a master by means of a second-order transformation with less than 0.5root mean squared (RMS) pixel error and nearest-neighbor resampling to 30� 30 mpixels. Second, all images were stacked and classified into the following land-usechange classification scheme: (1) stable urban, (2) stable vegetation, (3) stable agricul-ture, (4) stable water, (5) change to urban, 1988, (6) change to urban, 1991, (7) changeto urban, 1995, (8) change to urban, 2000, and (9) change to urban, 2002. Althoughseveral change classes were probable, image interpretation and field assessments con-firmed that only agricultural land had been converted to urban areas. Thus, only fivechange classes were used. Conversion of other land-cover types was minimal andtherefore negligible in this study.
Classification of a multidate, multiband image would be difficult for the mostcommon classification algorithm, the maximum likelihood (ML) classifier, because itcannot efficiently handle the added variability of multiple images or a large quantity ofdata (Paola and Schowengerdt, 1995; Chan et al, 2001). Over the past decade, super-vised machine-learning classification algorithms have been shown to be efffective forhandling large datasets (Friedl et al, 2002), as they require no a priori assumptionsregarding the distribution of the input data and they can handle complex, nonlinear,relations between features and classes (Fayyad and Irani, 1992). We tested the MLclassifier against two machine-learning algorithms, a fuzzy neural network (Carpenteret al, 1997), and a decision-tree classifier (C4.5, Quinlan, 1993), and our preliminaryresults with sample training data consistently showed that the decision-tree algorithmoutperformed the other methods. Thus, the supervised decision-tree algorithm waschosen for this analysis.
Table 2. Imagery used in the analysis of land-use change in Chengdu, China.
Satellite Date of acquisition
Landsat 3 MSS 21 August 1978a
Landsat 4 TM 1 May 1988a
Landsat 4 TM 24 April 1991a
Landsat 5 TM 16 August 1992b
Landsat 5 TM 5 May 1995a
Landsat 7 ETM 2 November 2000a
Landsat 7 ETM 23 December 2001b
Landsat 7 ETM 7 October 2002a
a Year of interest.b Image used for added information during classification of change.
Urban growth in Chengdu,Western China 329
In the classification process, the C4.5 decision tree was combined with `boosting',a relatively new technique shown to increase classification accuracies by estimatingmultiple classifiers while systematically varying the training sample (Friedl and Brodley,1997). Once the classifier iterations are complete, the boosting algorithm computes aweighted vote for each pixel, assigning probabilities of class membership for each classat every pixel (Quinlan, 1996). As a result, C4.5 with boosting produces two outputs:(1) probabilities of each class (0% ^ 100%), and (2) a predicted class label based on theclass with the highest probability. A total of 1052 training sites (15720 pixels) were usedas input to the classifier, selected during fieldwork in Chengdu in October 2002. Thetraining data ranged in size from 900 m2 to 8100 m2 (1 to 9 pixels) and were distributedamong the nine classes listed above. Sites for the change classes were based on inter-views with farmers, owners of small businesses, and homeowners to establish the date ofurban development for a given plot.
Initial results from the predicted class map (output 2) revealed class confusion, andthe overall map accuracy was below 50%. Change areas were instead labeled stableurban or stable agriculture. Inspection of the class probabilities (output 1) indicatedthat the incorrectly labeled pixels consistently had a second most probable class thatwas the correct class. Accordingly, a density-slicing technique was used to compare theprobability maps for the five change classes directly to the Landsat images. Oncethe values corresponding to change pixels were determined, a binary mask of changewas created and overlaid on the map of stable areas. By combining the two, a final mapof stable and change land-cover classes was created. As is necessary with manymaps made from remotely sensed data, a postclassification editing step was conductedusing color composites of the images and information from field assessments.
In the third and final step, the map was validated for accuracy. Effective use ofclassified maps requires thorough analysis and quantification of map quality toimprove methodology, to improve area estimates, and to understand biases in analysis.In addition, map validation provides information to the user on the accuracy andreliability of the map (Congalton, 1991). Following the convention for cross-validationmethods, we assessed the map by using approximately 15% of the sample (152 groundtruth sites) that was withheld from the classification process.
3.2 Spatial patterns of urban land-use changeDeveloped in the field of landscape ecology (O'Neill et al, 1988), spatial pattern metricsare frequently used to quantify landscape structure and spatial configuration. Inves-tigations focus on analysis of patches, defined as spatial entities composed of the sametype of land use or land cover at a specific scale (O'Neill and Hunsaker, 1997).Recently, landscape metrics have been used for urban applications (Geoghegan et al,1997; Herold et al, 2002; Luck and Wu, 2002; Li and Yeh, 2004). Although urbanfragmentation has been studied at length by using the idea of fractal measures (Battyand Longley, 1994), most empirical studies incorporating landscape metrics haveassessed the fragmentation of greenspace within or surrounding a city rather thanfragmentation of urban land use itself.
In this study, we look specifically at fragmentation of the urban fabric, analyzingthe degree to which urban development is compact or dispersed, contiguous or dis-connected. Our working hypothesis stems directly from early urban theories on wavesor cycles of urban growth, namely, Blumenfeld's (1954) ideas that a `zone of maximumgrowth' would move outwards from the core with a particular periodicity. From laterdevelopments in urban wave theory (Hoover and Vernon, 1959; Duncan et al, 1962;Winsborough, 1962) it is possible to hypothesize that Chengdu's growth follows a two-step process. First, diffusion occurs as the city expands outwards, resulting in patchy,
330 A Schneider, K C Seto, D R Webster
fragmented, growth. Second, diffusion is followed by a period of coalescence, wherenew land development occurs on vacant land within the partially established areas.This process is often referred to as `infill' (Calthorpe, 1993). The first phase of patchy,fragmented, growth may reduce agricultural productivity, encourage long, energy-intensive commutes, reduce the efficiency of public services, degrade, isolate, or shrinkhabitat patches, impede the movement of goods and services, or degrade the scenicbeauty of open spaces (Platt, 2004). Because of these issues, the infill process is oftenseen as more desirable. However, it remains unclear whether the infill stage can occurwithout the preceding diffusion process (for a review of these theories, see Dietzel et al,2005).
To understand the fragmentation ^ infill process of the city, pattern metrics werecombined with gradient analysis (McDonnell and Pickett, 1990). Rather than applymetrics to the landscape as a whole, the city was partitioned into corridors extendingoutward from the city core. Each corridor became a `minilandscape', offering explicitanalysis along the urban ^ rural gradient and hence a more meaningful view of landdevelopment than summary statistics for the entire urban region. The basic assumptionof the gradient approach is that different levels of economic activity or demographiccomposition create different distributions of built-up land within each corridor. In thisway, patterns of urban growth can be plotted across both space and time, and resultsmay provide empirical evidence to support or refute the diffusion ^ coalescence hypo-thesis. In addition, examination of metrics by corridor can make it easier for one toconnect socioeconomic drivers and processes to the resulting land-cover patterns.
Seven corridors were defined stretching outward from Chengdu's CBD along majortransportation corridors, identified by the Chengdu municipal planning bureau as keyareas of growth (figure 2). Spatial pattern metrics were calculated in a 4� 4 kmmoving window along each corridor for five points in time: 1988, 1991, 1995, 2000,and 2002 (information from 1978 was not included because of the coarser imageresolution). The metrics were applied to binary maps of urban ^ nonurban land thatwere created for each of the dates by applying a crosswalk, or conversion, table to thefinal change map.
Spatial pattern metrics were calculated by means of the public domain softwareFragstats (McGarigal and Marks, 1995) in combination with local moving-windowsoftware. Fragstats reports over 100 different metrics on shape, complexity, and inter-spersion, among other things. However, some authors have reported that very few ofthese metrics contain unique information, and thus the calculation or reporting of allof them is redundant (Gustafson, 1998; Li and Wu, 2004). For urban land-use studies,two metrics are particularly useful: the mean patch size (MPS) and the landscapeshape index (LSI). These metrics were selected for use because of their informationcontent, their simple, straightforward nature and consistency with previous studies,and their ability to detect different types of patchiness meaningful in an urban setting.
MPS conveys the mean size of contiguous area of a given land-cover type (the sumof all patches is divided by the number of patches). As the metric is calculated alongthe corridor, this metric presents an intuitive measure of the contiguity of urban landas one moves outward from the core. If plots of urban land are large in area, such as inCBDs, areas of continuous urban growth, or as infilling occurs, the MPS will be large.In contrast, if urban patches are small and scattered, values of MPS will be small.
The LSI, in contrast, provides a simple measure of shape: the greater the amountof `edge', the more fragmented the growth (the LSI is calculated as the sum of the peri-meter of all patches relative to the amount of edge that would be present in the samelandscape with simple shapes). The shape of new development is less meaningful in urbanstudies (that is, it does not matter whether new urban land is rectangular or square)
Urban growth in Chengdu,Western China 331
but shape is relevant nonetheless for its ability to quantify the complexity of the perimeterand, hence, to quantify fragmentation. An increasing LSI is a clear indicator that urbanareas are becoming more fragmented, whereas a decreasing LSI results as the urban fabricbecomes more continuous (for detailed information on pattern metrics, see McGarigaland Marks, 1995).
3.3 Socioeconomic informationSeveral field visits were made to the study region during 2002 and 2003, which entailedcollective and individual interviews with farmers, owners of small businesses, andworkers, as well as with municipal, county, and district level government officialsand planners (for details on business development, firm, and cluster dynamics, seeWebster et al, 2003). Not only did these interviews provide important informationon the timing and location of conversion of land to urban uses (as described insection 3.1), data collected from interviews were the primary information source foranalysis of the drivers of urban growth. Interview information was also used inconjunction with socioeconomic data collected at the district and county levels(Chengdu Statistical Bureau, 2001).
Although the socioeconomic data were helpful, the scale and position of the countyand district boundaries [figure 1(b)] unfortunately masked important trends in urbangrowth. Expansion of Chengdu's urban edge has far exceeded the original `urban core'definition of the five districts of Jinniu, Chenghua, Jinjiang, Wuhou, and Qingyang.Rather, the majority of new development has occurred in the counties and districtsadjacent to these urban core districts (Xindu, Longquanyi, Shuangliu, Wenjiang, andPixian). Although the economic data do not correspond perfectly to the disaggregatemap data of each corridor, the dynamics of the outer counties can still be roughlyconnected to satellite cities within each corridor that primarily drive new land develop-ment. Corridor (a) extends into Xindu and Qingbaijang (see figure 2), corridors (b) and(c) correspond to Longquanyi, corridors (d) and (e) fall within Shuangliu, and corridors(f ) and (g) extend into Wenjiang and Pixian, respectively. These adjacent counties arelarger in area than the transportation corridors, however, so that important economicdevelopments in portions of the county (for example, areas abutting the urban coredistricts) may be concealed within statistics for the whole county. Shuangliu county, forexample, encompasses portions of two urban ^ rural corridors. To avoid this problem,commonly referred to as the modifiable areal unit problem, socioeconomic data wereprimarily used as context for understanding trends in development.
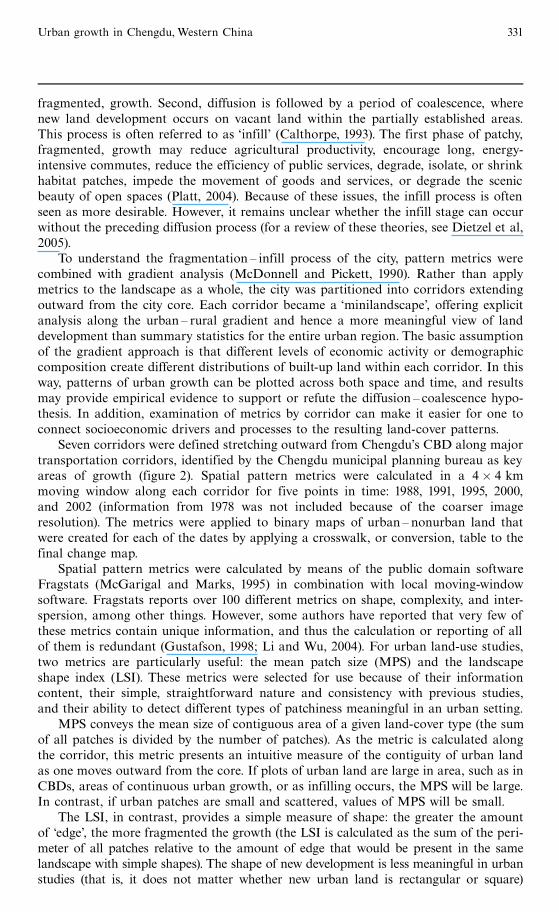
4 ResultsResults of the remote-sensing change-detection analysis are presented in figure 3 forthree time periods: (1) the prereform period, 1978 to 1988; and the postreform perioddivided into (2) 1988 to 1995, and (3) 1995 to 2002. These maps reveal explicit patternsof growth in the south, southwest, and northwest regions of the city. The extent ofurban land increased more than 350% from 1978 to 2002 (table 3, over). It is importantto note that estimates of urban conversion of agricultural land in 1988 could be inflatedbecause of differences in the 1978 and 1988 satellite data. The resolution of the 1970sLandsat MSS imagery is too coarse to differentiate urban features (roads, buildings)from agricultural land within certain pixels. These mixed pixels are often labeled`agriculture', resulting in an overestimation of agricultural land in 1978. As urbanland is consequently underestimated in the early period, urban growth between 1978and 1988 may be overestimated. Results from the 1978 ^ 88 series can aid our under-standing of the overall pattern of urban development but should not be considered asreliable as maps from later years in terms of area estimates.When results for the period
332 A Schneider, K C Seto, D R Webster
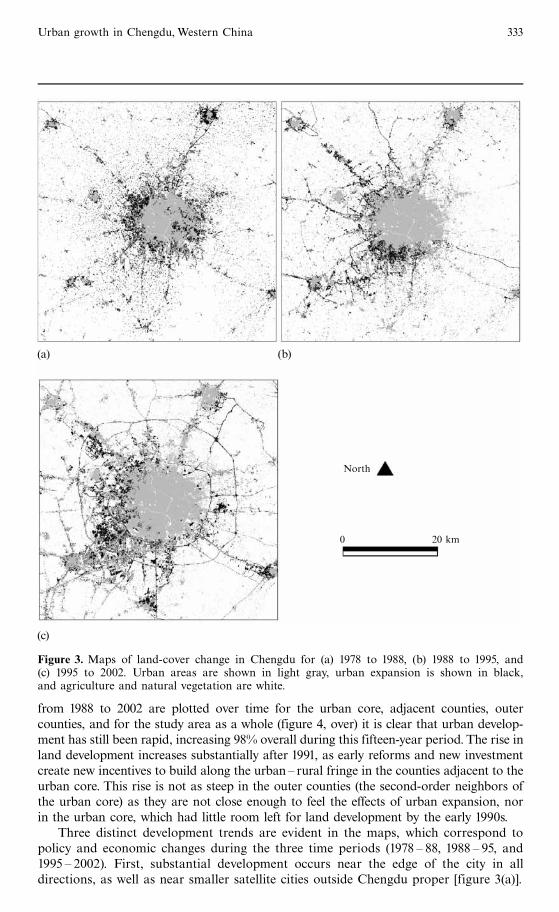
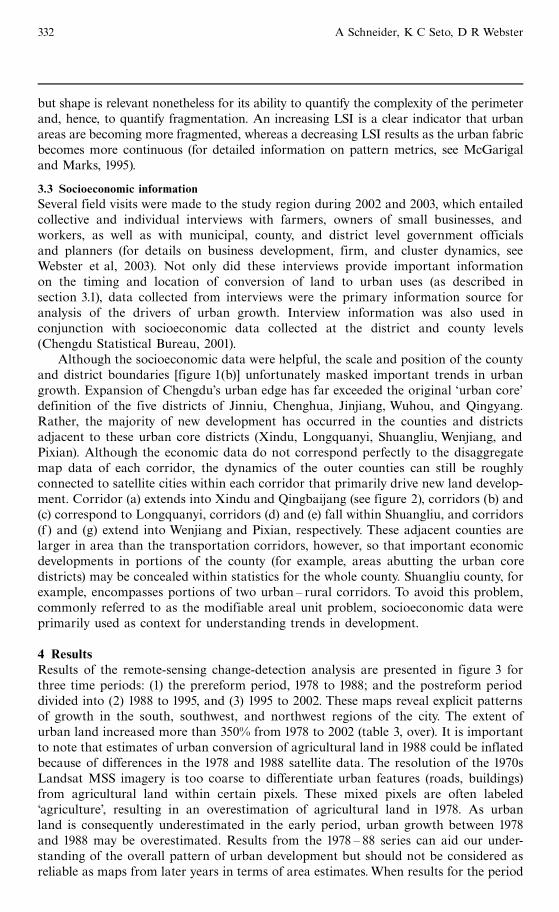
from 1988 to 2002 are plotted over time for the urban core, adjacent counties, outercounties, and for the study area as a whole (figure 4, over) it is clear that urban develop-ment has still been rapid, increasing 98% overall during this fifteen-year period. The rise inland development increases substantially after 1991, as early reforms and new investmentcreate new incentives to build along the urban ^ rural fringe in the counties adjacent to theurban core. This rise is not as steep in the outer counties (the second-order neighbors ofthe urban core) as they are not close enough to feel the effects of urban expansion, norin the urban core, which had little room left for land development by the early 1990s.
Three distinct development trends are evident in the maps, which correspond topolicy and economic changes during the three time periods (1978 ^ 88, 1988 ^ 95, and1995 ^ 2002). First, substantial development occurs near the edge of the city in alldirections, as well as near smaller satellite cities outside Chengdu proper [figure 3(a)].
(a) (b)
(c)
North
0 20 km
Figure 3. Maps of land-cover change in Chengdu for (a) 1978 to 1988, (b) 1988 to 1995, and(c) 1995 to 2002. Urban areas are shown in light gray, urban expansion is shown in black,and agriculture and natural vegetation are white.
Urban growth in Chengdu,Western China 333

334A
Schneider,K
CSeto,
DR
Webster
N:/psfiles/epb3203w
/Table 3. Amount of urban land per political unit (county or district) for six key time points spanning 1978 to 2002.
Distance Urban land (km2) Percentage(km)a
1978 1988 1991 1995 2000 2002change,1978 ± 2002
Chengdu's districtsJinniu 16.3 32.6 (100.0) 33.3 (2.2) 42.6 (28.2) 50.4 (18.2) 53.2 (5.5) 227.0Chenghua 29.2 46.8 (60.3) 47.8 (2.1) 50.3 (5.2) 54.9 (9.3) 56.2 (2.2) 92.3Qingyang 12.5 20.6 (64.4) 20.8 (1.0) 25.9 (24.6) 32.4 (25.0) 35.4 (9.3) 182.8Jinjiang 12.2 17.4 (42.5) 19.3 (11.0) 22.3 (15.6) 26.4 (18.6) 27.6 (4.5) 126.6Wuhou 11.0 24.8 (126.3) 28.8 (15.9) 41.4 (44.0) 55.8 (34.7) 59.1 (5.9) 438.6Total 81.2 142.1 (75.2) 149.9 (5.4) 182.6 (21.8) 220.0 (20.5) 231.5 (5.2) 185.2
Adjacent countiesShuangliu 19.5 6.1 21.6 (253.1) 30.3 (40.2) 42.8 (41.4) 71.9 (67.7) 78.4 (9.1) 1181.9Pixian 25.5 3.5 13.2 (275.4) 14.2 (8.1) 22.8 (60.2) 31.1 (36.5) 35.3 (13.4) 906.3Xindu 18.5 4.5 25.3 (462.1) 26.7 (5.7) 37.0 (38.4) 47.1 (27.4) 48.5 (2.9) 978.6Wenjiang 24.8 3.4 10.3 (200.2) 11.1 (7.7) 19.5 (75.3) 23.6 (21.2) 26.2 (10.8) 661.4
Nearby districtsQingbaijang 21.0 4.3 14.6 (240.0) 15.0 (2.8) 19.7 (31.0) 25.2 (28.1) 25.6 (1.4) 495.1Longquanyi 28.1 2.3 12.2 (425.2) 16.5 (35.5) 16.5 (0.0) 29.5 (78.9) 31.4 (6.6) 1257.1
Outer countiesXintang 39.2 2.9 9.1 (212.4) 9.9 (8.6) 12.1 (22.0) 15.0 (24.2) 15.2 (1.3) 420.5Pengzhou 38.2 2.9 14.0 (375.4) 16.4 (17.7) 25.9 (57.3) 26.8 (3.7) 27.3 (1.7) 827.5Chongzhou 40.3 3.4 11.1 (229.2) 11.7 (5.5) 14.5 (23.9) 20.1 (38.1) 20.9 (4.1) 519.0Xinjin 38.5 3.0 8.0 (163.3) 9.7 (21.7) 9.9 (1.8) 16.0 (62.3) 16.0 (0.0) 429.5
Total study area 117.6 281.4 (139.4) 311.5 (10.7) 403.2 (29.4) 526.3 (30.5) 556.2 (5.7) 373.0
Note: the percentage change from the previous period is shown in parentheses.a Distance from Chengdu city center.

This type of development is mostly infilling among existing low-density development atthe edge of the city. Second, land is developed along transportation corridors extendingoutward from the city center, beginning in 1988 and continuing through 2002 [figures 3(b)and 3(c)]. This development is partly in response to the completion of new roads andhighways as well as to the construction of Shuangliu airport in the southwest corridorand to high-tech zones in the northwestern and southern corridors. Third, additionalcontinguous growth of the urban fabric is visible, especially in the south and west, asinfilling [figure 3(b)]. This trend continues with the addition of a third and fourth ringroad in the late 1990s [figure 3(c)], as infilling occurs within these new roads.
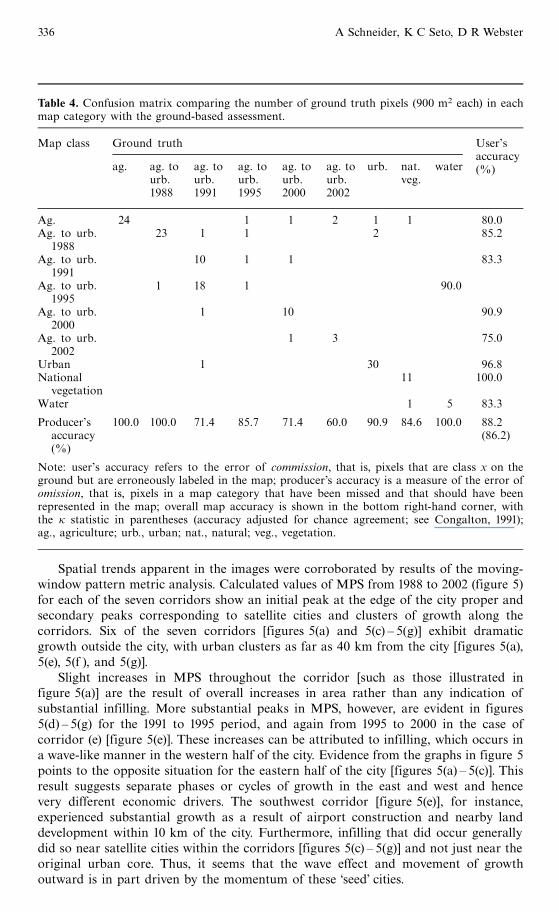
An accuracy assessment of the land-use change map was conducted with indepen-dent data from 152 validation sites collected during fieldwork and in the laboratory.These sites initially ranged in size from 900 m2 to 8100 m2 (1 to 9 pixels); however, onepixel was selected randomly from each site to prevent inflated accuracy statistics arisingfrom autocorrelation effects. These results are summarized in the confusion matrix,which compares the final map with the ground-based observations (table 4, over). Theoverall cross-validation accuracy of the land-use change map is high, at 88.2%, andthe k-value is 86.2%. In addition, the producer's and the user's accuracy for the urbanchange classes are greater than 71%. The exception to this is the c̀hange to urban, 2002'class, where the user's and the producer's accuracy were 75.0% and 60.0%, respectively.These lower values result because of the small number of test pixels used duringvalidation and the nature of the temporal information used during classification. Forprevious dates of urban change (time t ), information from a later image (time t� 1)could confirm whether a pixel was newly converted to urban uses at time t. As there isno image after 2002, some confusion results.
Urbanland(km
2)
500
400
300
200
100
0
Chengdu total
Chengdu urban core
Adjacent counties
Outer counties
98%
168%
63%
88%
1988 1990 1992 1994 1996 1998 2000 2002
Year
Figure 4. Amount of urban land in the Chengdu study area (black line) and in the urban core,adjacent counties, and outer counties (see table 3 for counties included within each division). Thepercentage increase from 1988 to 2002 is indicated near each trend line. Note the rapid rise ofurban land development following initial reforms in the early 1990s.
Urban growth in Chengdu,Western China 335
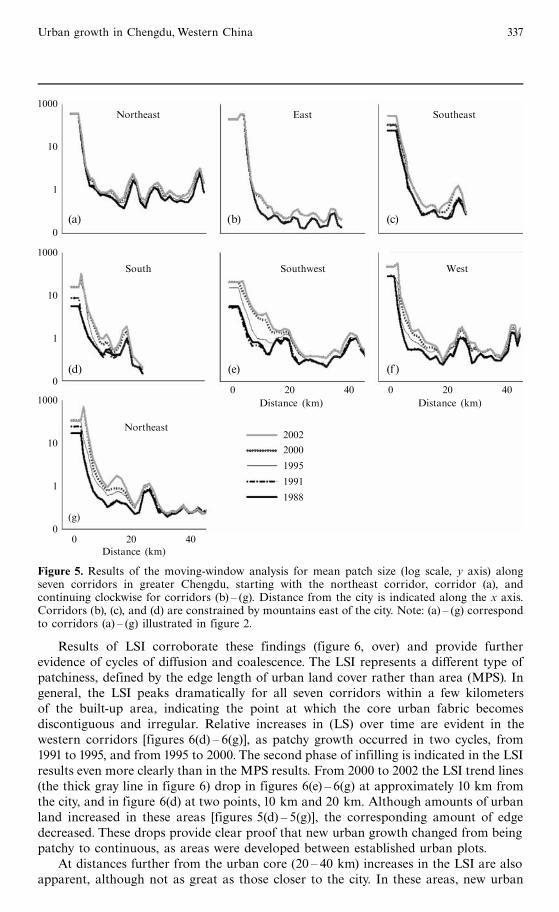
Spatial trends apparent in the images were corroborated by results of the moving-window pattern metric analysis. Calculated values of MPS from 1988 to 2002 (figure 5)for each of the seven corridors show an initial peak at the edge of the city proper andsecondary peaks corresponding to satellite cities and clusters of growth along thecorridors. Six of the seven corridors [figures 5(a) and 5(c) ^ 5(g)] exhibit dramaticgrowth outside the city, with urban clusters as far as 40 km from the city [figures 5(a),5(e), 5(f ), and 5(g)].
Slight increases in MPS throughout the corridor [such as those illustrated infigure 5(a)] are the result of overall increases in area rather than any indication ofsubstantial infilling. More substantial peaks in MPS, however, are evident in figures5(d) ^ 5(g) for the 1991 to 1995 period, and again from 1995 to 2000 in the case ofcorridor (e) [figure 5(e)]. These increases can be attributed to infilling, which occurs ina wave-like manner in the western half of the city. Evidence from the graphs in figure 5points to the opposite situation for the eastern half of the city [figures 5(a) ^ 5(c)]. Thisresult suggests separate phases or cycles of growth in the east and west and hencevery different economic drivers. The southwest corridor [figure 5(e)], for instance,experienced substantial growth as a result of airport construction and nearby landdevelopment within 10 km of the city. Furthermore, infilling that did occur generallydid so near satellite cities within the corridors [figures 5(c) ^ 5(g)] and not just near theoriginal urban core. Thus, it seems that the wave effect and movement of growthoutward is in part driven by the momentum of these `seed' cities.
Table 4. Confusion matrix comparing the number of ground truth pixels (900 m2 each) in eachmap category with the ground-based assessment.
Map class Ground truth User's
ag. ag. to ag. to ag. to ag. to ag. to urb. nat. wateraccuracy
urb. urb. urb. urb. urb. veg.(%)
1988 1991 1995 2000 2002
Ag. 24 1 1 2 1 1 80.0Ag. to urb. 23 1 1 2 85.2
1988Ag. to urb. 10 1 1 83.3
1991Ag. to urb. 1 18 1 90.0
1995Ag. to urb. 1 10 90.9
2000Ag. to urb. 1 3 75.0
2002Urban 1 30 96.8National 11 100.0
vegetationWater 1 5 83.3
Producer's 100.0 100.0 71.4 85.7 71.4 60.0 90.9 84.6 100.0 88.2accuracy (86.2)(%)
Note: user's accuracy refers to the error of commission, that is, pixels that are class x on theground but are erroneously labeled in the map; producer's accuracy is a measure of the error ofomission, that is, pixels in a map category that have been missed and that should have beenrepresented in the map; overall map accuracy is shown in the bottom right-hand corner, withthe k statistic in parentheses (accuracy adjusted for chance agreement; see Congalton, 1991);ag., agriculture; urb., urban; nat., natural; veg., vegetation.
336 A Schneider, K C Seto, D R Webster
Results of LSI corroborate these findings (figure 6, over) and provide furtherevidence of cycles of diffusion and coalescence. The LSI represents a different type ofpatchiness, defined by the edge length of urban land cover rather than area (MPS). Ingeneral, the LSI peaks dramatically for all seven corridors within a few kilometersof the built-up area, indicating the point at which the core urban fabric becomesdiscontiguous and irregular. Relative increases in (LS) over time are evident in thewestern corridors [figures 6(d) ^ 6(g)], as patchy growth occurred in two cycles, from1991 to 1995, and from 1995 to 2000. The second phase of infilling is indicated in the LSIresults even more clearly than in the MPS results. From 2000 to 2002 the LSI trend lines(the thick gray line in figure 6) drop in figures 6(e) ^ 6(g) at approximately 10 km fromthe city, and in figure 6(d) at two points, 10 km and 20 km. Although amounts of urbanland increased in these areas [figures 5(d) ^ 5(g)], the corresponding amount of edgedecreased. These drops provide clear proof that new urban growth changed from beingpatchy to continuous, as areas were developed between established urban plots.
At distances further from the urban core (20 ^ 40 km) increases in the LSI are alsoapparent, although not as great as those closer to the city. In these areas, new urban
2002
2000
1995
1991
1988
1000
10
1
0
1000
10
1
0
1000
10
1
0
Northeast
Northeast East Southeast
South Southwest West
0 20 40 0 20 40
Distance (km) Distance (km)
(a) (b) (c)
(d) (e) (f )
(g)
0 20 40Distance (km)
Figure 5. Results of the moving-window analysis for mean patch size (log scale, y axis) alongseven corridors in greater Chengdu, starting with the northeast corridor, corridor (a), andcontinuing clockwise for corridors (b) ^ (g). Distance from the city is indicated along the x axis.Corridors (b), (c), and (d) are constrained by mountains east of the city. Note: (a) ^ (g) correspondto corridors (a) ^ (g) illustrated in figure 2.
Urban growth in Chengdu,Western China 337
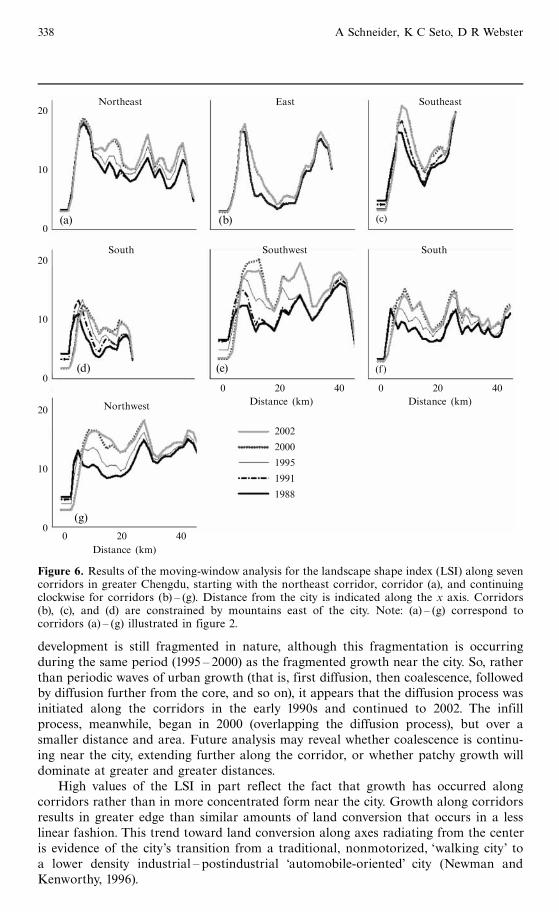
development is still fragmented in nature, although this fragmentation is occurringduring the same period (1995 ^ 2000) as the fragmented growth near the city. So, ratherthan periodic waves of urban growth (that is, first diffusion, then coalescence, followedby diffusion further from the core, and so on), it appears that the diffusion process wasinitiated along the corridors in the early 1990s and continued to 2002. The infillprocess, meanwhile, began in 2000 (overlapping the diffusion process), but over asmaller distance and area. Future analysis may reveal whether coalescence is continu-ing near the city, extending further along the corridor, or whether patchy growth willdominate at greater and greater distances.
High values of the LSI in part reflect the fact that growth has occurred alongcorridors rather than in more concentrated form near the city. Growth along corridorsresults in greater edge than similar amounts of land conversion that occurs in a lesslinear fashion. This trend toward land conversion along axes radiating from the centeris evidence of the city's transition from a traditional, nonmotorized, `walking city' toa lower density industrial ^ postindustrial `automobile-oriented' city (Newman andKenworthy, 1996).
20
10
0
20
10
0
20
10
0
Northwest
Northeast East Southeast
South Southwest South
2002
2000
1995
1991
1988
(g)
0 20 40 0 20 40
Distance (km) Distance (km)
(a) (b) (c)
(d) (e) (f)
0 20 40
Distance (km)
Figure 6. Results of the moving-window analysis for the landscape shape index (LSI) along sevencorridors in greater Chengdu, starting with the northeast corridor, corridor (a), and continuingclockwise for corridors (b) ^ (g). Distance from the city is indicated along the x axis. Corridors(b), (c), and (d) are constrained by mountains east of the city. Note: (a) ^ (g) correspond tocorridors (a) ^ (g) illustrated in figure 2.
338 A Schneider, K C Seto, D R Webster
5 DiscussionUrban land expanded significantly in Chengdu proper and Chengdu municipalityduring the period 1978 ^ 2002. As the maps illustrate, the city has exhibited dramaticgrowth to the south, west, and northwest (figure 3 and table 3). Increasing landconversion is apparent outside the city proper in small towns and satellite cities.Results from spatial pattern metrics provide further evidence of this trend, which isconsistent with theories of changing land-use patterns in Chinese cities. Postreformland-use strategies in China, contrary to Maoist city forms, follow a trend towardincreased spatial and functional specialization. This is the result of a set of strong,interacting drivers, namely, the demise of the danwei (work unit), which kept employmentand residence in close if not coterminous geographic proximity, the development of urbanland markets, the privatization of housing, and increased use of motorized transport. Thistrend is often articulated in two ways: (1) the city reorganizes around multiple sectors andtargeted development zones, and (2) district specialization occurs, including separation ofindustry, services, and housing. Each of these trends has occurred in Chengdu (Webster,2002; Schneider et al, 2003b). In addition, reorganization of the urban area has beenaccompanied by a third trend emerging in Chinese citiesöextended periurban growth.
First, development of multiple nuclei outside the core city is clearly seen in themaps of land-cover change [figures 3(b) and 3(c)] as well as in the pattern metricanalysis (figures 5 and 6). This trend has been documented in several cities in Chinaduring the past decade, including Shenzhen, Guangzhou, Beijing, and Shanghai (Wuand Yeh, 1997; Gaubatz, 1999; Lin, 2001). The presence of nuclei is an indicator of theprogression of Chinese cities to more industrial and postindustrial forms, such as thoseseen in the USA, Canada, Australia, and Europe. These trends have also occurred inpart because planners and governments have shared similar goals: planners see themultinucleated city as good urban form, and the establishment of industrial and serviceclusters allows domestic and foreign investors to take advantage of the benefits ofspatial concentration, including cluster dynamics. In Chengdu, development zoneshave also been attractive to domestic and foreign investors, who prefer newer industrialcomplexes on the periphery for amenities such as improved infrastructure, wider roads,and increased greenspace. Furthermore, contemporary industrial processes increasinglyrequire large amounts of land for single-storey (sometimes just-in-time) production, alsodriving the development of peripheral nuclei.
Second, specialization has occurred in Chengdu as a result of land and housingreforms, changing social patterns, and the creation of targeted development zones withnew flows of domestic and international capital. Prior to 1978 the city was composedof mainly mixed land-use types focused on the danwei, which provided basic goods andservices such as housing, healthcare, food ration tickets, and education. The householdregistration system (hukou) determined the residency status of an individual and waspowerful in controlling rural ^ urban migration. Reforms liberalized hukou restrictions(smaller urban centers and periurban areas were especially affected), and economicchange has weakened the importance of the danwei (work unit), which in effect allowedgreater internal migration. Development of urban land markets during the 1980s and1990s and changes in Chinese policies, laws, and administrative guidelines furtherincreased specialization of urban land within Chinese cities. This has led to theseparation of housing from manufacturing and commercial activities, the developmentof distinct districts associated with specific economic clusters and sectors, as well asincreased spatial social differentiation whereby certain areas are increasingly knownas `better' or `worse' in terms of social standing or class.
Although land-use specialization is not perceptible in remotely sensed images, on-the-ground assessments and interviews confirmed this trend in Chengdu. Specialization has
Urban growth in Chengdu,Western China 339
been articulated in land-use change patterns, however, such as the uneven, rapidgrowth in corridors with high-tech zones [corridor (g) to the northwest, and corridor(d) to the south, for example], and the extensive growth to the west resulting from theresidential boom. This tendency toward specialization is further substantiated bytrends in population movement. Of the reported persons migrating to the Chengduurban core from 1990 to 2000, more than 75% settled into the three western districts(Jinniu, Qingyang, and Wuhou; Chengdu Statistical Bureau, 2001). This figure excludesthe floating population known to migrate daily, weekly, or semipermanently, who workin the city but maintain registration status in rural counties.
As specialization occurred, three new housing patterns emerged: (1) medium-riseand high-rise high-density development, (2) low-density luxury estates, and (3) low-density rural villas. These residential patterns have developed in specialized districtson the edge of Chengdu proper or outside the city along transportation corridors. Thefirst type of residential restructuring, apartment construction, has occurred in the westand northwest, stemming from the historical desire of housing consumers to avoid theindustrialized east side of the city. In addition, apartment complexes are sometimesassociated with, and built near, new industrial and high-tech zones. Although popula-tion fluctuations in the counties and districts mask residential specialization in thewest, the inflated growth in the number of households from 1990 to 2000 corroboratesthis trend. In Pixian [northwest, corridor (g)] and Wenjiang [west, corridor (f )], forinstance, population increase was only 16% and 17%, respectively. For the same period,the number of households increased by 21% and 30%, respectively, in these counties(Chengdu Statistical Bureau, 2001). Apartment construction has, for the most part,been planned and partially subsidized, the subsidies being provided through land-leasepricing by local district governments. Investment in residential apartment complexes inChengdu peaked in 2000, however, and speculative investment has left a large percent-age of buildings empty today. This trend may be reflected in the fact that Chengdu hasthe highest ratio of residential floorspace to people in comparison with all other citiesin China (China Statistical Bureau, 2001).
The second type of residential restructuringöthe creation of luxury housingestatesöhas begun to emerge primarily west of the city proper, with several new areasplanned for construction during 2002. The third typeörebuilt farm houses constructedby newly wealthy market farmers (many of whom are now engaged in urban employ-ment)öis also most apparent to the west of the city proper and, to a limited extent, onthe northwestern and southern fringes of the city. Much of the early patchy growthapparent in western corridors (e) and (f ) resulted from this type of housing develop-ment, and corridor (g) appears to be following the same trend since the establishmentof the high-tech cluster. Private investment in housing in Pixian [corridor (g)] in 2000,for instance, is the highest of all counties and districts in the study area. Although farmvilla construction represents a fairly small share of total housing construction (comparedwith that in coastal cities such as Guangzhou or Hangzhou), a significant portion of thehaphazard, patchy form of urban development in Chengdu can be attributed to thisphenomenon. These two forms of restructuring have been shaped to a significant extentby the private sector (firms, property developers, purchasers of private residences, andindividual farmers), thus creating disparities between the planning objectives of themunicipality and the reality of spatial behavior on the ground.
The third land-use trend, periurbanization, is a dynamic process driven by highlevels of geographically concentrated investment (often investment in manufacturing),whereby rural areas in the vicinity of large established cities become urban in a rapid,unplanned, and piecemeal fashion (Webster, 2002). Total domestic and foreign invest-ment outside Chengdu's urban core increased almost thirteen fold from 1990 to 2000
340 A Schneider, K C Seto, D R Webster

(1.6 billion yuan to 20.6 billion yuan), whereas the city proper witnessed a ninefoldincrease over the same period. These results indicate a dramatic shift toward areas asfar as 40 km from the original city proper, as investment funnels primarily to smallfactories and businesses in these outermost counties. Further incentives for increasedland use in this fashion are provided by a range of preferential policies offering taxbreaks and exemption from land-use fees. Results of the spatial pattern metrics high-light this type of patchy urban land conversion within 2 km of new radial roads,occurring in a leapfrog pattern in nearly all corridors. The effect of this type of growthis acute, both in terms of social changes for rural inhabitants coming directly incontact with urban lifestyles and in terms of environmental impacts such as increasedfragmentation of agricultural and natural lands, increased demand on resources, andinadequate infrastructure to cope with such changes. Adding to the problem is the factthat these developments lie outside the city proper and often outside officially desig-nated urban areas of county-level cities. The nature of this type of settlement meansthat Chengdu's peri-urban area as a whole is managed by multiple governing bodies.
The three spatial phenomena described aboveöland-use specialization, clustering,and periurban developmentöare often not the result of formal planning but rather canbe attributed to the interaction of local, regional, national, and international forces.Private sector actors such as individual firms, farmers, housing developers, and foreigninvestors, acting alone or in tandem, often created the initial spark that initiated muchof the mosaic of discontinuous growth west of the city. Changes west of the city are nota product of any formal planning; in fact, the formal plan for the municipalityencourages urban growth to the east, where agricultural land is poorer and ground-water more abundant (Webster et al, 2003). These spatial trends have also beenwitnessed in coastal cities and have occurred to an even greater extent in Shanghai,Beijing, and Guangzhou, where foreign investment is a significant driver of extendedurban form. It is clear that city planning and, more surprisingly, the land-quota systemare making less of an impact than in prereform periods, when officials easily controlledthe amount and location of new urban land development. In the postreform period,however, patterns of growth are more extensive and fragmented than plans and policyhad intended. For example, prior to the completion of this study, government officialsand urban planners were unaware of the extent of land conversion, the unbalancedgrowth west of the city, or periurban corridor development in the greater Chengdu area(Schneider et al, 2003b). Although the provincial and municipal government can directgrowth (high-tech zones are a key example), it appears that directed growth haslimitations, and other factors such as local government initiatives, uncoordinatedinvestment by external public agencies, private sector housing developments, anddomestic and foreign investment are playing greater roles in driving land developmentand influencing urban form.
Given the large amount of growth and sprawling form of new urban areas it isnecessary to rexamine land policies and the role of planning in Chinese cities.Although the early stages of the `Go West' policy appear to be successful in raisingGDP levels and spurring economic growth, this policy has also increased the rate ofurbanization. Although this growth has occurred at a smaller scale than along the coastand a decade later, mid-sized cities in western China are now encountering similarproblems of urban management, including how to deal with rising unemployment,deficiencies in urban services and infrastructure, and a lack of access to key resources.Moreover, a larger number of cities and a larger percentage of China's population arenow affected than a decade ago. Currently, China has thirty-eight mid-sized cities, withbetween one million and five million inhabitants, of which more than half are located inthe central and western provinces. The combined effect of urban land-use change in such
Urban growth in Chengdu,Western China 341
a large number of cities has the potential to be profound, including local impacts, such asmicroclimatic changes, urban heat-island effects, loss of natural vegetation and agri-cultural land, pollution of water, air, and soils, and overuse of natural resources, as wellas global impacts, such as changes in global circulation and biogeochemistry.
As mid-sized cities continue to grow and contribute to the global economic net-work it is likely that the conversion of productive farmland to urban uses will continue.Loss of farmland and a reduction in multicropping practices in Chengdu is readilyapparent, often as a result of farm workers finding better remuneration from new jobsin the city. In coastal regions such as the Pearl River Delta, loss of agricultural landhas been partly offset by the conversion of natural vegetation or reclamation of theDelta to new farm plots and by increased yields as farmers switch to more intensivefarming techniques and more economically valuable crops. These trends are notapparent in Chengdu but may occur as more land is converted to urban uses.
6 ConclusionsFew quantitative studies of land development of Chinese cities have been made becauseof a lack of detailed data to illustrate land dynamics over time and space. Consideringthe number of mid-sized cities undergoing rapid urbanization processes in westernChina, an understanding of the process, its drivers, and the implications for urbanform is both timely and necessary. We have partially overcome the lack of data by useof remotely sensed imagery and spatial pattern metrics to map and quantify patterns ofurban growth. By exploiting temporal as well as spatial and spectral information fromsatellite imagery, we have mapped land-use changes in Chengdu, China, for the 25-yearperiod 1978 ^ 2002, with an overall accuracy greater than 88%. Spatial pattern metricswere used to examine patchiness and contiguity of urban land over time (1988 ^ 2002)in seven urban ^ rural transects defined by major transportation corridors. These metricsindicate increasing dispersion of the city in the north and west, greater growth ofsmall towns or nuclei outside the city in all directions, and densification and infillingin the southwest.
The emerging spatial patterns, investigated in the context of economic, land, andhousing-market reforms, reveal that the physical development of the extendedChengdu region is following trends witnessed in coastal cities of China, althoughthe importance of various drivers differs from the east (for example, the low level ofFDI to date). New tendencies for spatial clustering, specialization of land uses, andperiurban land development have largely been driven by a growing private sectorand uncoordinated large-scale investment by public agencies, the behavior of whichhas not been internalized into municipal planning processes. The results show thatplanning and policy must be reexamined and new means of urban land-use planningdevised that are more suited to the new Chinese reality. Doing so will facilitate betterresource use and management, provide water, waste, and transportation infrastructure,reduce environmental degradation and loss of agricultural land, as well as promoteurban sustainability.
Acknowledgements. This work was supported by NASA's Earth System Science FellowshipProgram grant NGT5-30401, NASA's New Investigator Program grant NAG5-10534, NationalScience Foundation Career Grant 0348986, and the East Asia Region Infrastructure Operationsunit of the World Bank. The authors gratefully acknowledge the support and assistance of CaiJianming and Luo Binyi of the Beijing Institute of Geographical Sciences and Natural ResourcesResearch, as well as information provided by the Chengdu Economic Information Center. Theauthors also thank three anonymous reviewers for their helpful comments during the preparationof this paper.
342 A Schneider, K C Seto, D R Webster
ReferencesAlberti M, 2002, `̀ The effects of urban patterns on ecosystem function'', New Urbanism and Smart
Growth Research Series, National Institute of Smart Growth,Washington, DCAndersonW, Kanarogulu P S, Miller E J, 1996, `̀ Urban form, energy and the environment: a review
of issues, evidence and policy'' Urban Studies 33 7 ^ 35Batty M, Longley P, 1994 Fractal Cities: A Geometry of Form and Function (Academic Press,
San Diego, CA)Blumenfeld H, 1954, `̀ The tidal wave of metropolitan expansion'' Journal of the American Institute
of Planners 20 3 ^ 14Brisco B, Brown R J, 1995, `̀ Multi-date SAR/TM synergism for crop classification in western
Canada'' Photogrammetric Engineering and Remote Sensing 61 1009 ^ 1014Calthorpe P, 1993 The Next American Metropolis: Ecology, Community and the American Dream
(Princeton Architectural Press, Princeton, NJ)Carpenter G A, Gjaja M N, Gopal S,WoodcockW, 1997, `̀ART neural networks for remote
sensing: vegetation classification from Landsat TM and terrain data'' IEEE Transactions onGeoscience and Remote Sensing 35 308 ^ 325
Chan J CW, Chan K P,Yeh AG O, 2001, `̀ Detecting the nature of change in an urban environment:a comparison of machine learning algorithms'' Photogrammetric Engineering and RemoteSensing 67 213 ^ 225
Chengdu Statistical Bureau, 2001 Statistical Yearbook of Chengdu (China Statistical PublishingHouse, Beijing, China)
China Statistical Bureau, 2001 Statistical Yearbook of China (China Statistical Publishing House,Beijing, China)
Congalton R G, 1991, `̀A review of assessing the accuracy of classifications of remotely senseddata''Remote Sensing of Environment 37 35 ^ 46
Dietzel C, Herold H, Hemphill J J, Clarke K C, 2005, `̀ Spatio-temporal dynamics in California'sCentral Valley: empirical links tourban theory'' International Journal ofGeographic InformationScience 19 175 ^ 195
Douglas I,1994,`̀ Human settlements'', inChanges in LandUseandLandCover: AGlobal PerspectiveEds W B Meyer, B L Turner (Cambridge University Press, New York) pp 350 ^ 375
Duncan B, SabaghG,VanArsdolMD,1962,`̀ Patterns of city growth''American Journal of Sociology67 55 ^ 69
Ehlers M, Jadkowski M A, Howard R R, Brostuen D E, 1990, `̀Application of SPOT data forregional growth analysis and local planning''Photogrammetric Engineeringand Remote Sensing56 175 ^ 180
Fayyad U M, Irani K B, 1992, `̀ On the handling of continuous valued attributes in decision treegeneration''Machine Learning 8 87 ^ 102
Friedl M A, Brodley C E, 1997, `̀ Decision tree classification of land cover from remotely senseddata''Remote Sensing of Environment 61 399 ^ 409
Friedl M A, McIver D K, Hodges J C F, Zhang Y, Muchoney D, Strahler A H,Woodcock C E,Gopal S, Schneider A, Cooper A, Baccini A, Gao F, Schaaf C B, 2002, `̀ Global land covermapping from MODIS: algorithms and early results''Remote Sensing of Environment 83287 ^ 302
Gaubatz P, 1999, `̀ China's urban transformation: patterns and processes of morphological changein Beijing, Shanghai and Guangzhou'' Urban Studies 36 1495 ^ 1521
Geoghegan J,Wainger L A, Bockstael N E, 1997, `̀ Spatial landscape indices in a hedonicframework: an ecological economics analysis using GIS''Ecological Economics 23 251 ^ 264
Green K, Kempka D, Lackey L, 1994, `̀ Using remote sensing to detect and monitor land coverand land use change'' Photogrammetric Engineering and Remote Sensing 60 331 ^ 337
Guldin G E, 1997 Farewell to Peasant China (M E Sharpe, Armonk, NY)Gustafson E J,1998,``Quantifying landscape spatial pattern: what is the state of the art?''Ecosystems
1 143 ^ 156Herold M, Scepan J, Clarke C, 2002, `̀ The use of remote sensing and landscape metrics to describe
structures and changes in urban land uses'' Environment and Planning A 34 1443 ^ 1458Hoover E M,Vernon R, 1959 Anatomy of a Metropolis: The Changing Distribution of People and
Jobs within the NewYork Metropolitan Region (Harvard University Press, Cambridge, MA)Howarth P J, Boasson E, 1983, `̀ Landsat digital enhancements for change detection in urban
environments''Remote Sensing of Environment 13 149 ^ 160Jensen J R, Cowen D C, 1999, `̀ Remote sensing of urban/suburban infrastructure and socioeconomic
attributes'' Photogrammetric Engineering and Remote Sensing 65 611 ^ 622
Urban growth in Chengdu,Western China 343
Ji C Y, Liu Q, Sun D,Wang S, Lin P, Li X, 2001, `̀ Monitoring urban expansion with remotesensing in China'' International Journal of Remote Sensing 22 1441 ^ 1455
Kenworthy J R, Laube F B, 1999, `̀ Patterns of automobile dependence in cities: an internationaloverview of key physical and economic dimensions with some implications for urban policy''Transportation Research Part AöPolicy and Practice 33 691 ^ 723
Lai H H, 2002, `̀ China's western development program: its rationale, implementation andprospects''Modern China 28 432 ^ 466
Leaf M, 2002, `̀ A tale of two villages: globalization and peri-urban change in China and Vietnam''Cities 19 23 ^ 31
Li H,Wu J, 2004, `̀ Use and misuse of landscape metrics'' Landscape Ecology 19 389 ^ 399Li X, 1998, `̀ Measurement of rapid agricultural land loss in the Pearl River Delta with the
integration of remote sensing and GIS'' Environment and Planning B: Planning and Design25 447 ^ 461
Li X,Yeh A G O, 2004, `̀Analyzing spatial restructuring of land use patterns in a fast growingregion using remote sensing and GIS'' Landscape and Urban Planning 69 335 ^ 354
Lin G C S, 1998, `̀ China's industrialization with controlled urbanization: anti-urbanism or urban-biased?'' Issues and Studies 34 98 ^ 116
Lin G C S, 1999, `̀ State policy and spatial restructuring in post-reform China, 1978 ^ 1995''International Journal of Urban and Regional Planning 23 670 ^ 695
Lin G C S, 2001, `̀ Metropolitan development in a transitional socialist economy: spatialrestructuring in the Pearl River Delta, China'' Urban Studies 38 383 ^ 406
Luck M,Wu J, 2002, `̀A gradient analysis of urban landscape pattern: a case study from the Phoenixmetropolitan region, Arizona, USA'' Landscape Ecology 17 327 ^ 329
Ma L J C, 2002, `̀ Urban transformation in China, 1949 ^ 2000: a review and research agenda''Environment and Planning A 34 1545 ^ 1569
Ma L J C M, Hanten EW H, 1981Urban Development in Modern China (Westview Press, Boulder,CO)
McDonnell M J, Pickett S TA, 1990, `̀ Ecosystem structure and function along urban ^ ruralgradients: an unexploited opportunity'' Ecology 71 1232 ^ 1237
McGarigal K, Marks B J, 1995, `̀ Fragstats: spatial pattern analysis program for quantifyinglandscape structure'', Generatl Technical Report PNW-GTR-351, Pacific Northwest ResearchStation, USDA^Forest Service, Portland, OR
Newman P W G, Kenworthy J R, 1996, ``The land use ^ transport connection: an overview'' LandUse Policy 13 1 ^ 22
O'Neill R, Hunsaker C, 1997, `̀ Monitoring environmental quality at the landscape scale''Bioscience47 513 ^ 520
O'Neill R V, Krummel J R, Gardner R H, Sugihara G, Jackson B, DeAngelis D L, Milne B T,Turner M B, Zygmunt B, Christensen SW, DaleV H, Graham R L, 1988, `̀ Indices of landscapepattern'' Landscape Ecology 1 153 ^ 162
Pannell C W, 2002, `̀ China's continuing urban transition'' Environment and Planning A 34 1571 ^ 1589Paola J D, Schowengerdt R A, 1995, `̀A detailed comparison of backpropagation neural network
and maximum likelihood classifiers for urban land use classification'' IEEE Transactions onGeoscience and Remote Sensing 33 981 ^ 996
Pax-Lenney M,Woodcock C E, Collins J B, Hamdi H, 1996, `̀ The status of agricultural lands inEgypt: the use of multi-temporal NDVI features derived from Landsat TM''Remote Sensingof Environment 56 8 ^ 20
Platt R V, 2004, `̀ Global and local analysis of fragmentation in a mountain region of Colorado''Agriculture, Ecosystems and Environment 101 207 ^ 218
Quinlan J R, 1993 C4 5: Programs for Machine Learning (Morgan Kauffman, San Mateo, CA)Quinlan J R, 1996, `̀ Bagging, boosting, and C4 5'', in Proceedings of the 13th National Conference
on Artificial Intelligence (AAAI-96), 4 ^ 8 August, Portland, Oregon (AAAI Press, Menlo Park,CA) pp 725 ^ 730
Sanchez R (Ed.), 2003 Scoping Report on Urbanization and Global Environmental Change(International Human Dimensions Programme on Global Environmental Change, Bonn)
Schneider A, Friedl M A, McIver D K,Woodcock C E, 2003a, `̀ Mapping urban areas by fusingmultiple sources of coarse resolution remotely sensed data'' Photogrammetric Engineeringand Remote Sensing 69 1377 ^ 1386
Schneider A, Seto K,Webster D, Cai J, Luo B, 2003b, `̀ Spatial and temporal patterns of urbandynamics in Chengdu, 1975 ^ 2002'', discussion paper, Urban Dynamics of East Asia Series,Asia Pacific Research Center, Stanford University, Stanford, CA
344 A Schneider, K C Seto, D R Webster
Seto K C, LiuW, 2003, `̀ Comparing ARTMAP neural network with the maximum likelihoodclassifier for detecting urban change'' Photogrammetric Engineering and Remote Sensing 69981 ^ 990
Seto K C, Kaufmann R K,Woodcock C E, 2000, `̀ Landsat reveals China's farmland reservesöbut they're vanishing fast'' Nature 406 page 121
Seto K C,Woodcock C E, Song C, Huang X, Lu J, Kaufmann R K, 2002, `̀ Monitoring land-usechange in the Pearl River Delta using Landsat TM'' International Journal of Remote Sensing23 1985 ^ 2004
South China Morning Post 1993, `̀ Big ambitions for vibrant Chengdu'', 26 September, page 4Van Vliet W (Ed.), 2001Cities in a GlobalizingWorld: Global Report on Human Settlements 2001
United Nations Centre for Human Settlements (Earthscan Publications, Sterling,VA)Webster D R, 2002, `̀ On the edge: shaping the future of peri-urban East Asia'', discussion paper
Urban Dynamics of East Asia Series, Asia Pacific Research Center Publication, StanfordUniversity, Stanford, CA
Webster D R, Cai J, Muller L, Luo B, 2003, `̀ Peri-urbanization in Chengdu,Western China: from`third line' to market dynamics'', discussion paper, Urban Dynamics of East Asia Series, AsiaPacific Research Center Publication, Stanford University, Stanford, CA
Winsborough H H, 1962, `̀ City growth and city structure'' Journal of Regional Science 4 35 ^ 50Wu F,Yeh A G O, 1997, ``Changing spatial distribution and determinants of land development in
Chinese cities in the transition from a centrally planned economy to a socialist market economy:a case study of Guangzhou'' Urban Studies 34 1851 ^ 1879
YehAGO,WuF,1999, `̀ The transformation of the urban planning system in China from a centrally-planned to transitional economy'' Progress in Planning 51 167 ^ 249
Urban growth in Chengdu,Western China 345

ß 2005 a Pion publication printed in Great Britain