Advanced thermal remote sensing
80
Advanced thermal remote sensing Professor Constantinos Cartalis Department of Environmental Physics National and Kapodistrian University of Athens [email protected]
-
Upload
khangminh22 -
Category
Documents
-
view
0 -
download
0
Transcript of Advanced thermal remote sensing

Advanced thermal remote sensingProfessor Constantinos CartalisDepartment of Environmental PhysicsNational and Kapodistrian University of Athens [email protected]

Learning ObjectivesWhat is thermal remote sensing?Which are the laws describing thermal remote sensing?What is the difference between kinetic temperature and radianttemperature?What is emissivity and why is it relevant to thermal remotesensing?How is land surface temperature influenced by the thermalproperties of materials?How to interpret thermal images?How is land surface temperature estimated?Which applications can be supported?

The three basic ways in which energy can be transferred:• Conduction occurs when one body (molecule or atom) transfers its kinetic energyto another by colliding with it. This is how a pan is heated on a stove.
• In convection, the kinetic energy of bodies is transferred from one place toanother by physically moving the bodies. An example is the convectional heating ofair in the atmosphere in the early afternoon.
• The transfer of energy by electromagnetic radiation is of primary interest toremote sensing because it is the only form of energy transfer that can take place in avacuum such as the region between the Sun and the Earth.
Introductory points -1


Optical vs thermal remote sensing

Introductory points - 2
The reason we can use remote sensing devices to detect infrared energy in theseregions is because the atmosphere allows a portion of the infrared energy to betransmitted from the terrain to the detectors.
Regions that pass energy are called atmospheric windows.
Regions that absorb most of the infrared energy are called absorption bands. Watervapor (H2O), carbon dioxide (CO2), and ozone (O3) are responsible for most of theabsorption.

Spectal signature = f (λ)

Introductory points - 3
An object’s internal kinetic heat is converted to radiant energy (often calledexternal or apparent energy).
The electromagnetic radiation exiting an object is called radiant flux and ismeasured in watts. The concentration of the amount of radiant flux exiting (emittedfrom) an object relates to its radiant temperature (Trad).
• There is usually a high positive correlation between the true kinetic temperature ofan object (Tkin) and the amount of radiant flux radiated from the object (Trad).
This is the basis of thermal infrared remote sensing.

Yet, the correlation (and the resulting relationship) is not perfect, with theremote measurement of the radiant temperature always being slightly lessthan the true kinetic temperature of the object.
This is due to a thermal property called emissivity which depends on the typeof the radiating body and the wavelength.
Emissivity, ε, is the ratio between the radiant flux exiting a real-worldselective radiating body (Fr) and a blackbody at the same temperature(Fb ).


Source: Tang and Li, 2008Remote Sensing of Environment

Planck blackbody equation: describes the EM radiation emitted from a blackbody at a certain wavelength as afunction of its absolute temperature
)1(2),( )/(5
2
−= kThce
hcTB λλπλ
http://tes.asu.edu/MARS_SURVEYOR/MGSTES/TES_emissivity.html


TK the kinetic temperature

Kirchhoff’s radiation lawAccording to Kirchoff’s radiation law for a blackbody: αλ = ελ
Thus 1 = rλ + αλ + τλ can be written as 1 = rλ + ελ + τλ
where rλ is spectral hemispherical reflectance by the terrain,
αλ is spectral hemispherical absorptance, and
τλ is spectral hemispherical transmittance
But most real-world materials are usually opaque to thermal radiation meaning that no radiant flux exits from the other side of the terrain element. Therefore, we may
assume transmittance, τλ = 0
Thus: 1 = rλ + ελ
which implies that the higher an object’s reflectance in the thermal infrared region, the lower the emissivity and vice versa.

Important note for thermal analysis Two materials on the ground could have the same true kinetic temperature but havedifferent apparent temperatures when sensed by a thermal radiometer simply becausetheir emissivities are different.
The emissivity of an object may be influenced by a number factors, including:
• color - darker colored objects are usually better absorbers and emitters (i.e. they have ahigher emissivity) than lighter colored objects which tend to reflect more of the incidentenergy.
• surface roughness - the greater the surface roughness of an object relative to the size ofthe incident wavelength, the greater the surface area of the object and potential forabsorption and re-emission of energy.

• moisture content - the more moisture an object contains, the greater its ability to absorbenergy and become a good emitter. Wet soil particles have a high emissivity similar towater.
• compaction - the degree of soil compaction can effect emissivity.
• field-of-view/resolution - the emissivity of a single leaf measured with a very highresolution thermal radiometer will have a different emissivity than an entire tree crownviewed using a coarse spatial resolution radiometer.
• wavelength - the emissivity of an object is generally considered to be wavelengthdependent. It may be constant in one spectral interval, but varying in another (seeSpectral Signature)
• viewing angle - the emissivity of an object can vary with sensor viewing angle.
Estimating LST

Step 1. Develop a data base for your city

Step 2. Define Land cover (and its changes)

Left to right: Land cover, satellite image in the visible, thermal image

Step 3. Choose the appropriate spatial (and temporal) resolution120m resolution 1 km resolution
Source: processing by C.Cartalis

Step 4. Choose the right satellite mission – Merge satellite data
S2 and S3S3

Step 5. What time of the day? (the impact of thermal capacity)
22:32 local time 10:30 local timeSource: processing by C. Cartalis

Source: Wicki, A. and Parlow, E., 2017
Step 6. Which period of the year?

Step 7. Convert and Retrieve

Sentinel -3 Sea and Land Surface TemperatureRadiometer (SLSTR)
The Land Surface Temperature (LST) processing includes a split-window method,using radiances from two channels, the band centres of which are close inwavelength, to determine the effective radiometric temperature of the Earth'ssurface "skin" in the instrument field of view. This method assumes that thelinearity of the relationship between LST and BT results from linearisation of thePlanck function and linearity of the variation of atmospheric transmittance withcolumn water vapor amount. The algorithm is:
where a0, b0 and c0 are classes of coefficients that depend on atmospheric watervapour, satellite viewing angle and land surface emissivity. T11 and T12 representthe brightness temperatures measured at 11 µm and 12 µm respectively.

https://sentinel.esa.int/web/sentinel/technical-guides/sentinel-3-slstr/level-2/lst-processing

*
*split window algorithm

1. Converting the digital number of Landsat TM or ETM+ TIR band into spectral radianceRadiance = 0.0370588 × DN + 3.20 (For Landsat7 ETM+) Radiance = 0.0553760 × DN +1.18 (For Landsat5 TM)
2. Converting the spectral radiance to at satellite brightness temperature (i.e.,blackbody temperature, TB) TB = K2/[ln(K1/Radiance + 1)] Where “ln” is NaturalLogarithm, and K2 and K1 are pre-launch calibration constants (For Landsat7 ETM+,K2=1282.71 K, and K1=666.09 W/(m2 sr um)) (For Landsat5 TM, K2=1260.56 K, andK1=607.76 W/(m2 sr um))
3. Converting the blackbody temperature to land surface temperature (LST) whichinvolves correcting for spectral emissivity according to the nature of land cover.
LST = TB /[(1 + (λ × TB / ρ )×ln(ε)] where: k = wavelength of emitted radiance (λ = 11.5um), ρ = h×c/σ = 1.438×10⁻² m K, σ = Boltzmann constant (1.38×10⁻²³ J/K), h = Planck’sconstant (6.626×10⁻³⁴ J s), and c = velocity of light (2.998×10⁸ m/s).
Land Surface Temperature from Landsat TM images

Retrieval of land surface temperature from the Moderate Resolution Imaging Spectroradiometer
(MODIS)
MODIS has a 36 spectral band spectrometer; its thermal infrared (TIR)bands are used for LST retrieval. The methodology used for the calculationof the LST maps is based on the Split Window Technique (SWT). Using theSWT, LST is calculated as (Ts), (Jiménez-Muñoz et al., 2008):
Ts (land surface temperature) = Ti + c1 (Ti − Tj) + c2 (Ti − Tj) 2 + c0 + (c3 + c4*W) (1 − ε) + (c5 + c6*W) Δε where: Ti and Tj : at-sensor brightness temperatures at the LW bands i and j (in Kelvin) ε: the mean emissivity, ε = 0.5(εi + εj), Δε: the emissivity difference, Δε = (εi − εj), W is the total atmospheric water vapor content (in grams per square centimeter), c0−c6: the SWT coefficients In the case of the MODIS sensors i and j are bands 31 and 32, at 10.780–11.280 μm and 11.770–12.270 μm respectively.

Assessing the thermal environment in urban areas with the use of land cover and land surface emissivity
data of varying spatial resolutions

CLASSIFICATION LANDSAT – 8 IMAGE
Source for Slides 71-79, Remote Sensing andImage Processing Unit ,Univ. of Athens, 2017(G. Giannakogiorgos)

CLASSIFICATION SENTINEL -2 IMAGE

ACCURACY ASSESSMENT
Landsat - 8 68.73% Sentinel -2 73.82%
Accuracy = (sum of elements of principal diagonal /total number)

ASSESSMENT OF EMISSIVITY ON THE BASIS OF LANDSAT -8 (left) and SENTINEL -2 (right) LAND COVER CLASSIFICATION

LST as estimated with the use of land cover deduced from LANDSAT –8 (left) AND SENTINEL – 2 (right)

COMPARISON OF AIR TEMPERATURE AS EXTRACTED FROM LST
STATIONS Tair data(C) Tair Sentinel(C) Tairdata-TSentC) Tair Landsat(C) Tairdata-TLandsat(C)
1 25,3 24,6 0,7 26,1 -0,82 24,4 24,6 -0,2 24,7 -0,33 25 24,5 0,5 24,4 0,64 25,7 25,2 0,5 24,6 1,15 25 24,6 0,4 26,5 -1,56 22,7 21,2 1,5 19,9 2,87 24,4 24,7 -0,3 25,4 -18 24,3 24,4 -0,1 25,4 -1,19 24,9 23,9 1 23,9 1
10 25,2 24,8 0,4 24,5 0,711 23,8 23,5 0,3 25,2 -1,4
12 24,2 25,1 -0,9 25,6 -1,4
(Ta = 1.2104Ts - 17.676)( Stathopoulou and Cartalis, 2005)

Satellite Sensor
Spectral resolution
Spatial resolution
Temporal resolution
Radiometric resolution
what wavelengths do we use
what size can we resolve
how often do we observe
degree of detail observed

The critical balance between spatial and temporal resolution

Temporal to spatial resolution – a delicate (and critical) balance

APPLICATIONS OF THERMAL REMOTE SENSING

Climate Dynamics
Information from Sentinel-3A’s radiometer, which measures radiation emitted from Earth’s surface, reveal how the temperature of Earth’s land changes between July and November 2016. Measurements are in Kelvin.

Land surface temperature
dynamics

Remote sensing and forest firesRemote sensing can contribute to the three phases of firemanagement:
Pre-fire: Fuel conditions and amountActive fires: detection and fire properties (THERMAL)Post-fire: burned area, severity and emissions
Active fires: the thermal signal is discrete, especially when usinginstruments that do not saturate at low temperature. Confusion maybe introduced due to signals from oil refineries and volcaniceruptions.

Wien’s law


Comparing window channels in the thermal infrared
Near infrared (1.6 μm)More adequate for smoke detection than 3.9 μmSmall fires not visibleNo CO2 absorption (higher fire temperature)High sub pixel sensitivity
Middle infrared (3.9 μm)
High temperature sensitivity - major sub pixel effects (hotspots are easily detected)Negligible absorption by atmospheric humidityClose to a CO2 absorption band, 4-7 Kelvin signal reductionBrightness is temperature of the CO2 layer above the fire
Thermal infrared (10.8 μm)
1-2 Kelvin absorption by atmospheric humidityNo signal reduction by CO2Lower temperature sensitivity (small subpixel effects)No risk of sensor blinding by firesLow values compared with 3.9 μm due to semi transparentcloud or smoke

Forest fires northeast of Athens – 14 August 2017 (Sentinel)
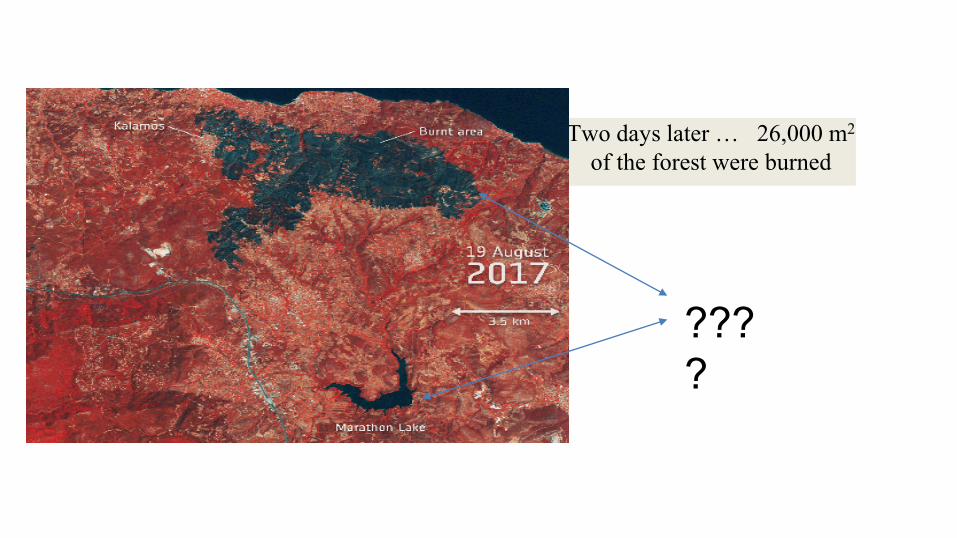
Two days later … 26,000 m2
of the forest were burned
????

http://www.esa.int/var/esa/storage/images/esa_multimedia/images/2017/08/kalamos_fires/17122699-1-eng-GB/Kalamos_fires.gif

LAND SURFACE TEMPERATURE - Heat stress + long term TRENDS
Slides 57-67, Remote Sensing and Image Processing Unit, University of Athens

Geometric and radiometric correction
Split Window Algorithm
Cloud mask
Land Surface Temperature (LST)
Corine Land Cover data
Geolocation
Maps of emissivity (ε) and changes in emissivity (Δε) from
land cover dataPrecipitable water
Long term trends in LST for land surface dynamics

Extraction of ε and change of
ε, depending on land cover
Area Δε Ε
Urban -0.007 0.97
Semi-urban -0.003 0.98
Rural 0 0.989
1990 2000
2006 2012
CORINE LAND COVER

Τ4 = brightness temperature channel 4Τ5 = brightness temperature channel 5ε = mean spectral emissivity for channels 4 and 5
α,β
Precipitablewater
Land surface temperature
12:00 UTC PW (gr/cm2)
July 1.669
SPLIT WINDOW ALGORITHM

1990
2006
Center of Athens

Mean value 325.763 K
Trend 3.1 %Increase 10 K
Center of Athens

Airport since 2001. Previously agricultural/rural areas1990
2006
Landscape change – from natural to built

Mean value 328.320 K
Trend 2.1 %
Increase 6.8 Κ
Landscape change – from natural to built

Forested from 1990 to 2007 Devastating fire – July 2007 Reforestation > 2007
2006
Mountainous area

Mean value 313.694 K
Trend 3.2 %
Increase 10 Κ
Mountainous area

Forested area throughout the study period
2006
Nature reserve (Natura 2000 network)

Mean value 302.224 K
Trend 0.3 %
Increase 0.9 Κ
Nature reserve (Natura 2000 network)

Link LST to air temperatureImportant to simulate energy fluxes. But be careful: local applicability
Source: Agathangelidis and Cartalis, 2016

Cooling degree days (left)and Thermal discomfortIndex (right)

Satellite Remote Sensing and the urban thermal environment

Thermal trajectories


Downscaling LST
1km, 1-2 per day 30 m, 16 days 100 m, 1-2 per day

Thermal hot spot detection


Greenery in the city

Source: Cartalis et al., 2016

Results – Urban parks
Surface Park Cool Island (SPCI) is the difference ΔΤ= Tu - TpTu the average Land Surface Temperature of the urbanfabric around the park at a radius of 500 meters(excluding other parks or areas with water),Tp is the average Land Surface Temperature (LST) inthe parkThe 500 meters zones are depicted in purple colour.
Surface Park Cool Intensity (SPCI) (what kind of parks?)

Results – Urban parksImpact of park area to SPCI: SPCI increases with increasing park size up to sizesaround 20 ha and then becomes asymptotic which implies that no matter how biggerthe size of the park becomes, SPCI remains almost constant. Important to developmany small parks – urban acupuncture
0
1
2
3
4
5
6
0 5 10 15 20
SPC
I (K
)
Park area (ha)
SPCI vs park area (parks up to 16ha)
0
1
2
3
4
5
6
0 20 40 60
SPC
I (K
)
Park area (ha)
SPCI vs park area (all parks)

Working with indicators

Flowchart of the methodology for the estimation of the Urban Heat Exposure (UHeatEx) indicator.

Spatial distribution of the UHeatEx indicator forAthens at 100-meter resolution; scale varying fromlow (0) to high (10) thermal environmental quality.