UQ-SDAAP | DST Analysis
23
The University of Queensland Surat Deep Aquifer Appraisal Project (UQ-SDAAP) Scoping study for material carbon abatement via carbon capture and storage Supplementary Detailed Report DST Analysis 30 April 2019
-
Upload
khangminh22 -
Category
Documents
-
view
1 -
download
0
Transcript of UQ-SDAAP | DST Analysis

The University of Queensland Surat Deep Aquifer
Appraisal Project (UQ-SDAAP)
Scoping study for material carbon abatement via
carbon capture and storage
Supplementary Detailed Report
DST Analysis
30 April 2019
UQ-SDAAP | DST Analysis 2
Authors
Dr Vahab Honari, The University of Queensland
Mr Ahmed Harfoush, The University of Queensland
Prof Jim Underschultz, The University of Queensland
Ms Alexandra Wolhuter, The University of Queensland
Acknowledgements
This working document was prepared for The University of Queensland Surat Deep Aquifer Appraisal Project (UQ-SDAAP), a 3-year, $5.5 million project funded by the Australian Government through the Carbon Capture and Storage Research Development and Demonstration (CCS RD&D) programme, by Coal 21, and The University of Queensland. UQ-SDAAP would like to thank Schlumberger for supplying its Petrel software, ESRI for supplying its ArcMap and IHS Markit for supplying its WellTest software for use by the project.
Citation
Honari V, Harfoush A, Underschultz J & Wolhuter A (2019), DST Analysis, The University of Queensland Surat Deep Aquifer Appraisal
Project – Supplementary Detailed Report, The University of Queensland.
Referenced throughout the UQ-SDAAP reports as Honari et al. 2019a.
Publication details
Published by The University of Queensland © 2019 all rights reserved. This work is copyright. Apart from any use as permitted under
the Copyright Act 1968, no part may be reproduced by any process without prior written permission from The University of Queensland.
ISBN: 978-1-74272-254-2
Disclaimer
The information, opinions and views expressed in this document do not necessarily represent those of The University of Queensland, the Australian Government or Coal 21. Researchers within or working with the UQ-SDAAP are bound by the same policies and procedures as other researchers within The University of Queensland, which are designed to ensure the integrity of research. The Australian Code for the Responsible Conduct of Research outlines expectations and responsibilities of researchers to further ensure independent and rigorous investigations.
UQ-SDAAP | DST Analysis 3
Contents
1. Executive summary........................................................................................................................... 4
2. DST Data Inventory ........................................................................................................................... 4
3. Details of conventional test analysis .............................................................................................. 7
4. Description of DST derived permeability across the Basin ........................................................ 12
4.1 DST Data in the Blocky Sandstone Reservoir .................................................................................. 12
4.2 DST Data in the Transition Zone ....................................................................................................... 12
4.3 DST Data across multiple zones ....................................................................................................... 12
5. References ....................................................................................................................................... 16
6. Appendicies ..................................................................................................................................... 17
6.1 Appendix A: DST inventory table ...................................................................................................... 17
Tables
Table 1 DSTs data inventory, with pressure-time data from DSTs and their estimated k·h, k, skin, P* and rinv values BSR: Blocky Sandstone Reservoir, TZ: Transition Zone, BU: sub-Surat Unconformity, MLP_NORM: facies log, Y: Yes, N: No, Quality Scale: reliable data in green, data to be used with care in yellow and unreliable data in red. Thickness h is based on the DST interval. ........ 17
Figures
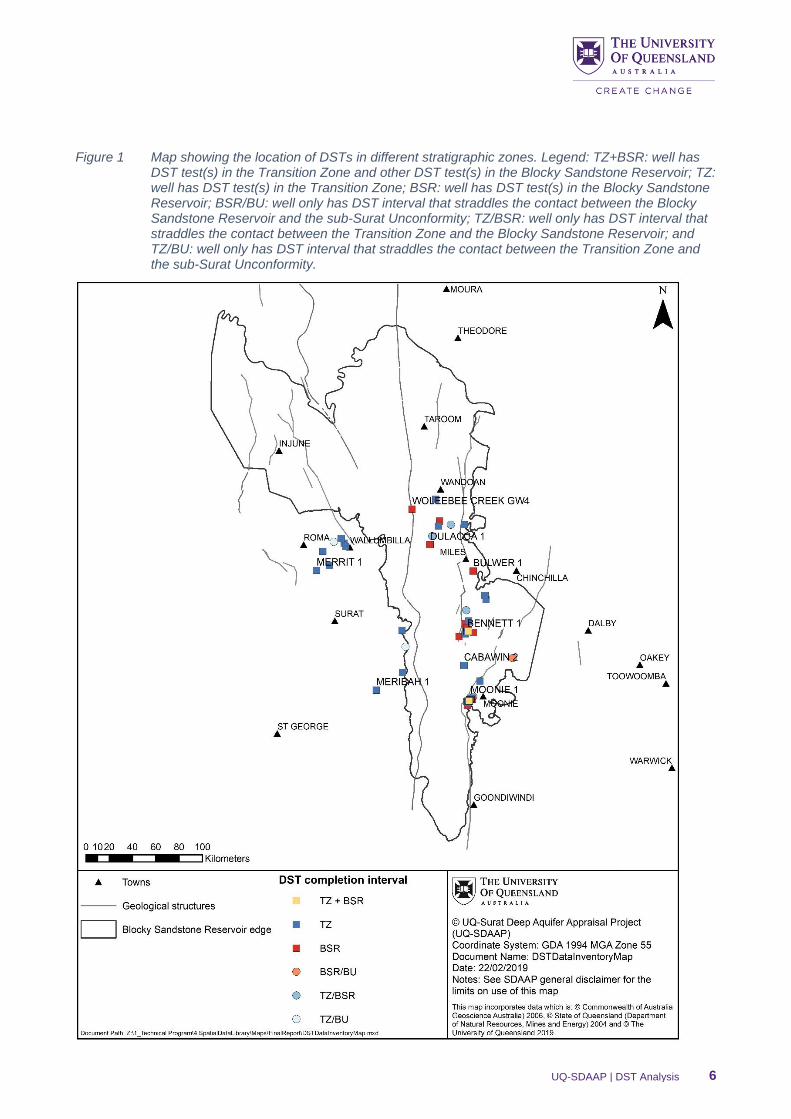
Figure 1 Map showing the location of DSTs in different stratigraphic zones. Legend: TZ+BSR: well has DST test(s) in the Transition Zone and other DST test(s) in the Blocky Sandstone Reservoir; TZ: well has DST test(s) in the Transition Zone; BSR: well has DST test(s) in the Blocky Sandstone Reservoir; BSR/BU: well only has DST interval that straddles the contact between the Blocky Sandstone Reservoir and the sub-Surat Unconformity; TZ/BSR: well only has DST interval that straddles the contact between the Transition Zone and the Blocky Sandstone Reservoir; and TZ/BU: well only has DST interval that straddles the contact between the Transition Zone and the sub-Surat Unconformity. ......................................................................................................... 6
Figure 2 Buildup analysis on the Horner plot highlighting the early time region-ETR (wellbore storage), mid time region-MTR (radial flow) and late time region-LTR (boundary effects) during the test (Figure 1-3 from Stewart (2011)). ................................................................................................. 8
Figure 3 Derivative log-log diagnostic plot showing early, mid and late time region characteristics (Figure 2-14 from Stewart 2011) where natural log of pressure derivative (Ln p’) plotted versus natural log of time (Ln t) ............................................................................................................................ 9
Figure 4 Log-log derivative plots for: the Bennet 1 well with an unreliable dataset (top), the Leichhardt 1 well with average data quality (middle) and the Wingnut 2 well with reliable dataset (bottom). . 11
Figure 1 Isochore map of Blocky Sandstone Reservoir showing values of DST permeability at various well locations (unit: mD). ............................................................................................................. 13
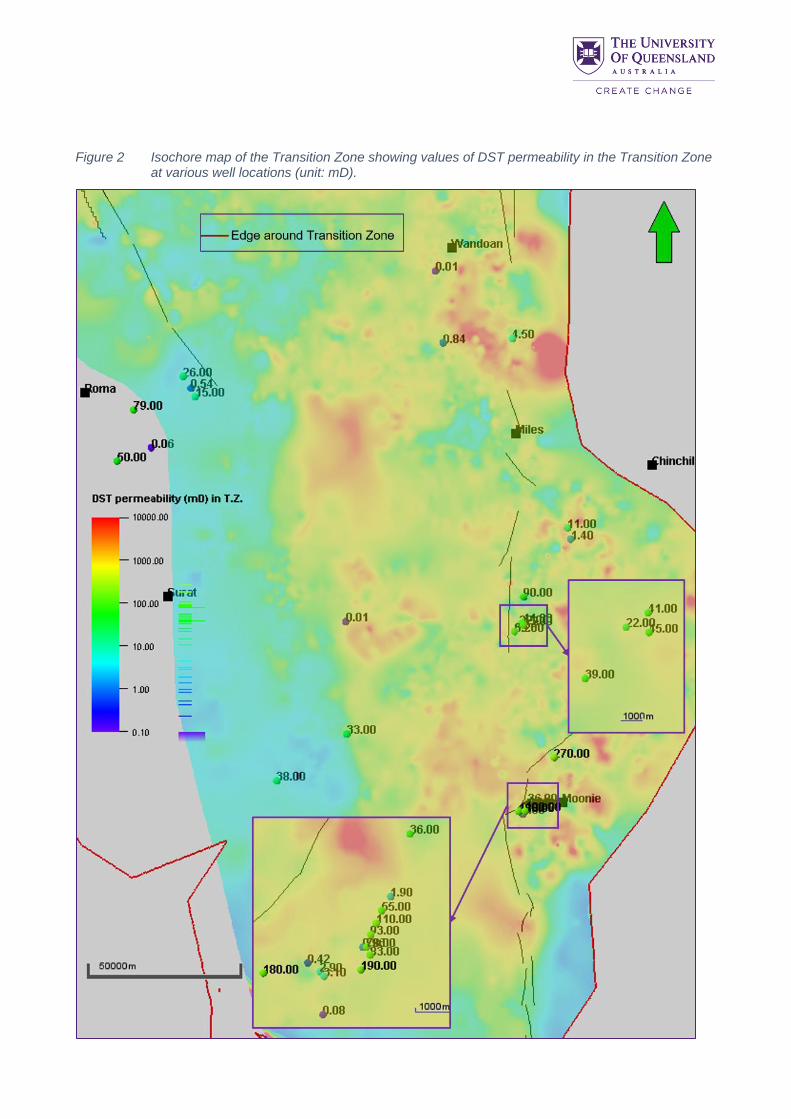
Figure 2 Isochore map of the Transition Zone showing values of DST permeability in the Transition Zone at various well locations (unit: mD). ............................................................................................ 14
Figure 3 Isochore map of Transition Zone with DST permeability values for DSTs that have a completed interval that crosses the boundary between the Blocky Sandstone Reservoir and Transition Zone (unit: mD). .......................................................................................................................... 15

UQ-SDAAP | DST Analysis 4
1. Executive summary
Robust dynamic reservoir modelling highly depends on the quality of formation properties such as initial
reservoir pressure, permeability and well productivity index (PI). The estimation of such properties, especially
at large scales, has been one of the greatest challenges for the UQ-SDAAP research. To obtain an estimate
of these properties, wells are tested by isolating an interval of a formation using a dual-packer assembly (or
a single packer design if at the base of the well), pumping formation fluids out or injecting fluid into the
formation at a constant rate for a short period (~10-30 min) and then shutting-in the assembly for an
extended period (60-240 min) and recording the pressure change over time. To ensure reliability of data and
provide opportunity for the reservoir to clean up, this sequence is usually repeated for each test (initial vs
main flow/shut-in) (Earlougher 1977; Chaudhry 2004).
This procedure has been historically named a Drill Stem Test (DST), however, there are many variations of
well testing that accomplish similar results. DST data can be used to interpret formation fluid (‘PVT
sampling’) properties, reservoir pressure, reservoir temperature, formation permeability, PI, skin factor and
an estimate of lateral distance to reservoir heterogeneity/boundaries (Stewart 2011). PI defines the well
deliverability, showing the flow rate of formation fluid that can be produced from the reservoir per unit
pressure drawdown. Skin factor is a term introduced to account for any deviation from radial flow in the near
well bore region and quantifies the pressure drop (positive skin) near the well bore due to formation damage
induced during drilling operations, or flow improvement (negative skin) because of well stimulation such as
acidisation.
During this study, well test analysis was undertaken by using a pressure transient analysis (PTA) software
(IHS WellTest). The well test software estimates the permeability·thickness product (k·h) and not absolute
permeability. There are three main elements in preparing and analysing test data for PTA:
1. Draw down - build up (DD-BU) rates and pressure versus time are imported into WellTest for any
necessary data editing using the production editor tool in IHS WellTest software;
2. Fluid properties are defined based on the reservoir fluid pressure and temperature; and
3. Conventional test analysis is conducted using both Horner (semi-log) and log-log derivative plots and
the reservoir related properties (i.e. k·h, skin, reservoir pressure and any existing reservoir
boundaries/characteristics) are estimated.
This report presents the findings of the DST analysis (discussed in Section 0), as well as an analysis that
integrated these findings with the petrophysics, focusing mainly on how to best estimate permeability
(section 4). Section 2 shows the available DST data inventory for the UQ-SDAAP project. Section 0 shows
the details of the conventional test analysis.
2. DST Data Inventory
As will be described in section 0, 79 DSTs from 60 different wells were analysed across the UQ-SDAAP
project region and stratigraphy of interest out of these 79 wells:
• 23 DSTs were conducted within the Blocky Sandstone Reservoir
• 40 DSTs were conducted in the Transition Zone
• 10 DSTs were conducted where the interval covered both the bottom of the Transition Zone and the
top of the Blocky Sandstone Reservoir
• Four DSTs were conducted where the interval crossed the sub-Surat Unconformity (Blyth Creek 1,
Marmadua 2, Paloma 1 and Wingnut 2 wells)
• One DST that was completed totally below the sub-Surat Unconformity (the Cherwondah 2 well)

UQ-SDAAP | DST Analysis 5
There is also one DST analysed from the Colgoon1 well some distance to the west of the study area.
However, while the interval was probably within the Transition Zone, there was no clear sequence
stratigraphic interpretation and thus it could not be used.
Figure 1 shows a map displaying the locations of the wells with DSTs, color-coded for wells that have a
completed interval in the Blocky Sandstone Reservoir, the Transition Zone, or both. Note that there is no
DST data in the centre of the basin near the notional injection locations, leading to higher uncertainty
regarding the permeability in this area.
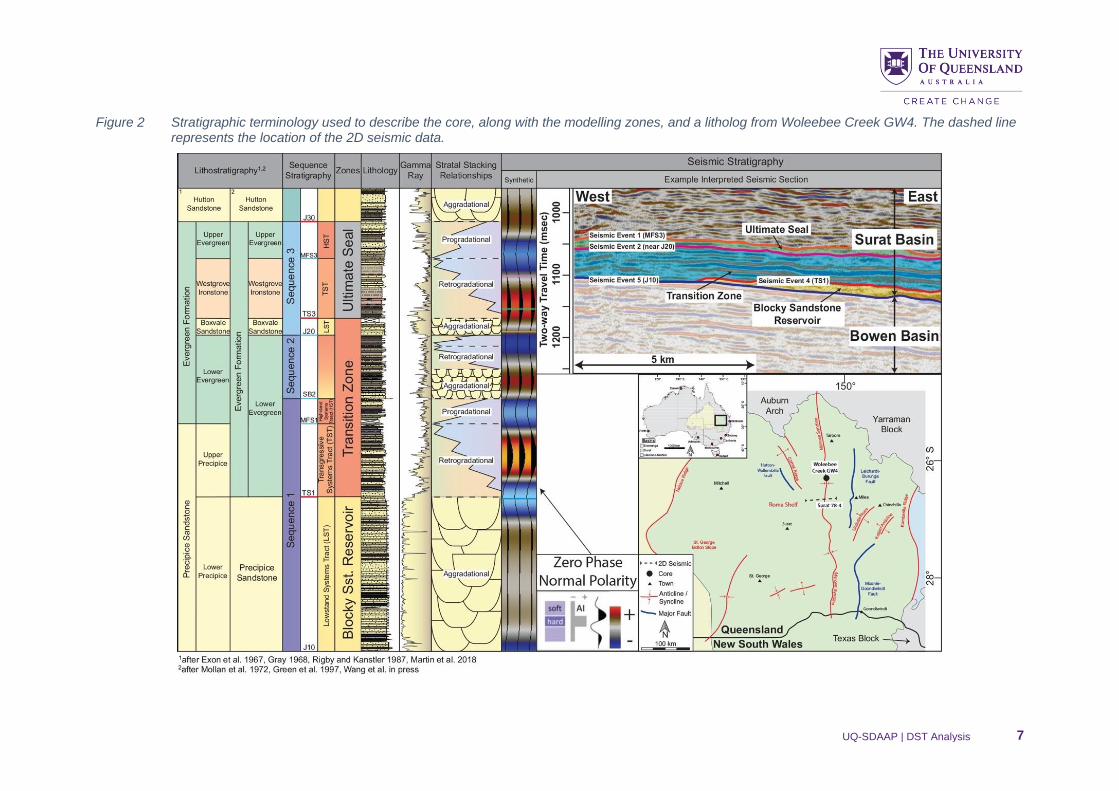
Figure 2, shows the geological naming conventions developed for this project (La Croix et al. 2019b)
Table 1 in Appendix A (section 6) lists the DST data inventory, showing relevant information about the DST’s
interval, quality, and the availability of wireline interpretation and facies predictions for the well. There is one
well, Cabawin 2, for which the wireline logs do not penetrate the stratigraphic line TS1 (La Croix et al. 2019b)
and the DST interval is deeper than the available logs. Based on the sequence stratigraphy of other Cabawin
wells, and based on the permeability value for the DST conducted in Cabawin 2, we assumed that the DST
interval for Cabawin 2 lies in the Transition Zone - specifically the subzone TS1-MFS1 (La Croix et al.
2019b). Log evaluation and facies prediction are mentioned in Table 1 because they play an important role in
comparing the DST data with log permeability (Harfoush et al. 2019c).
The well test analysis and quality control of the DST results are discussed in Section 0. Out of 23 DSTs in
the Blocky Sandstone Reservoir, we have only nine DSTs of good quality (quality scale 4 or 5). Out of 40
DSTs in the Transition Zone, we have 12 DSTs of reliable quality (quality scale 4 or 5). Out of the 10 where
the DST interval covered the bottom of the Transition Zone and the top of the Blocky Sandstone Reservoir,
only one well, Moonie 16, has reliable quality (has a scale of 5).
UQ-SDAAP | DST Analysis 6
Figure 1 Map showing the location of DSTs in different stratigraphic zones. Legend: TZ+BSR: well has DST test(s) in the Transition Zone and other DST test(s) in the Blocky Sandstone Reservoir; TZ: well has DST test(s) in the Transition Zone; BSR: well has DST test(s) in the Blocky Sandstone Reservoir; BSR/BU: well only has DST interval that straddles the contact between the Blocky Sandstone Reservoir and the sub-Surat Unconformity; TZ/BSR: well only has DST interval that straddles the contact between the Transition Zone and the Blocky Sandstone Reservoir; and TZ/BU: well only has DST interval that straddles the contact between the Transition Zone and the sub-Surat Unconformity.
UQ-SDAAP | DST Analysis 7
Figure 2 Stratigraphic terminology used to describe the core, along with the modelling zones, and a litholog from Woleebee Creek GW4. The dashed line represents the location of the 2D seismic data.

UQ-SDAAP | DST Analysis
3. Details of conventional test analysis
An appropriate build-up period is to be selected where radial flow is reached (Figure 3) in order to perform
PTA. Radial flow is a flow regime in which infinite acting character (no reservoir boundary) is observed
(Stewart 2011). In this study, a limited number of wells experienced flow to surface naturally during DST
operations. Thus, the recovered fluid rise in the testing tool strings were measured for the fluid type, volume
and rate.
Figure 3 Buildup analysis on the Horner plot highlighting the early time region-ETR (wellbore storage), mid time region-MTR (radial flow) and late time region-LTR (boundary effects) during the test (Figure 1-3 from Stewart (2011)).
A straight line on the Horner plot is characteristic of radial flow. The Horner plot is generated by plotting
pressure versus log Horner time function, as shown in Figure 3, where Pws is bottomhole shut-in pressure, tp
is the production time, Δt is shut-in time and P* is extrapolated reservoir pressure. Permeability, skin and
initial reservoir pressure can then be calculated from the slope of straight line and its position. The following
equations are used to derive these parameters in SI units (Stewart, 2011):
𝑘ℎ = −𝑞𝐵𝜇
4𝜋𝑚
Where m is the slope of straight line, h is net pay in meters, k is permeability in m2, q is flow rate in m3/s, B is
formation volume factor in m3/sm3 and μ is viscosity in kg/(m·s).
𝑆 =1
2(
𝑃𝑤𝑓(∆𝑡 = 0) − 𝑃∗
𝑚− 𝑙𝑛
𝑘𝑡𝑝
𝜑𝜇𝑐𝑡𝑟𝑤2
− 0.80908)
Where S is skin, Pwf (Δt=0) is flowing bottom hole pressure at the time of shut-in in Pa, P* is extrapolated
reservoir pressure in Pa, tp is production time in sec, φ is porosity, ct is total compressibility in Pa-1 and rw is
wellbore radius in m.
To ensure the beginning of radial flow is correctly identified, a log-log derivative plot for the build-up period is
generated using the natural log of derivative of pressure change after shut-in (P’) versus the natural log of
Agarwal equivalent time (𝛥𝑡𝑒 =𝑡𝑝 𝛥𝑡
𝑡𝑝 + 𝛥𝑡) (Stewart, 2011). As shown in Figure 4, radial flow is indicated by a

UQ-SDAAP | DST Analysis
horizontal straight line in the log-log derivative plot. The reservoir permeability is derived from the vertical
position of a horizontal straight line using the equation below (Stewart, 2011):
𝑃𝐷′ =
2𝜋𝑘ℎ
𝑞𝜇∙ 𝑃′
Where P’D = (𝑑𝑃𝐷
𝑑(𝑙𝑛𝑡𝐷)) and is the dimensionless pressure derivative with a value of 0.5 and P’ = (
𝑑𝑃
𝑑(𝑙𝑛𝑡)) is the
pressure derivative.
Figure 4 Derivative log-log diagnostic plot showing early, mid and late time region characteristics (Figure 2-14 from Stewart 2011) where natural log of pressure derivative (Ln p’) plotted versus natural log of time (Ln t)
Reservoir boundaries or some feature causing a variation of reservoir properties such as a fault, linear
channel boundaries or composite reservoir characteristics can also be identified using log-log derivative plots
(Bourdet, 2002, Stewart, 2011). The radius of investigation (rinv) describes the distance that the pressure
transient effects have travelled into the formation. rinv is the distance from the wellbore to which the pressure
disturbance is observed according to the following equation (Stewart 2011):
𝑟𝑖𝑛𝑣 = √4𝑘𝑡
𝜑𝜇𝑐𝑡
Where rinv is in meters and t is in seconds.
There are over a hundred wells with DST tests conducted in the strata of interest within the last several
decades. Most of these DSTs are associated with exploration/appraisal activities in 1960’s and 1970’s and
therefore the data are generally available in the public domain accessible through the Queensland DNRME
QPED; however, quality is considered to be the main challenge for data interpretation. Most of the tests have
no tabulated record of pressure increment with elapsed time. Often the only data available is a scanned
image of the original DST chart, where the image quality often makes any interpretation impossible.
For the remaining wells with DSTs containing pressure-time tables, there are significant uncertainties associated with the DST data and their respective PTA, which are listed follow:
• Insufficient flow and shut-in time to reach a radial flow regime. This situation is more common for low
permeability formations;

UQ-SDAAP | DST Analysis
• Inadequate flow rate in high permeability formations resulting in insufficient pressure disturbance to
be detectable by gauges. As a result, the BU period consists of a limited number of data points;
• Unclear type of fluid recovered during the DST;
• Uncertain total volume of fluid that had rose in the DST string due to an undefined DST pipe
size/length and the potential for drilling mud existing in the wellbore prior to the test;
• Multiphase fluid flow in some DSTs contributes errors to understanding the flow rate and fluid
properties used during PTA;
• Data points that form a radial flow region in the log-log derivative plot can be noisy in some DSTs,
making it difficult to confidently draw a single horizontal (radial flow characteristic) line to represent
radial flow; and
• Mechanical failure during the DST, such as a packer leakage, causes anomalous features in the
PTA plots.
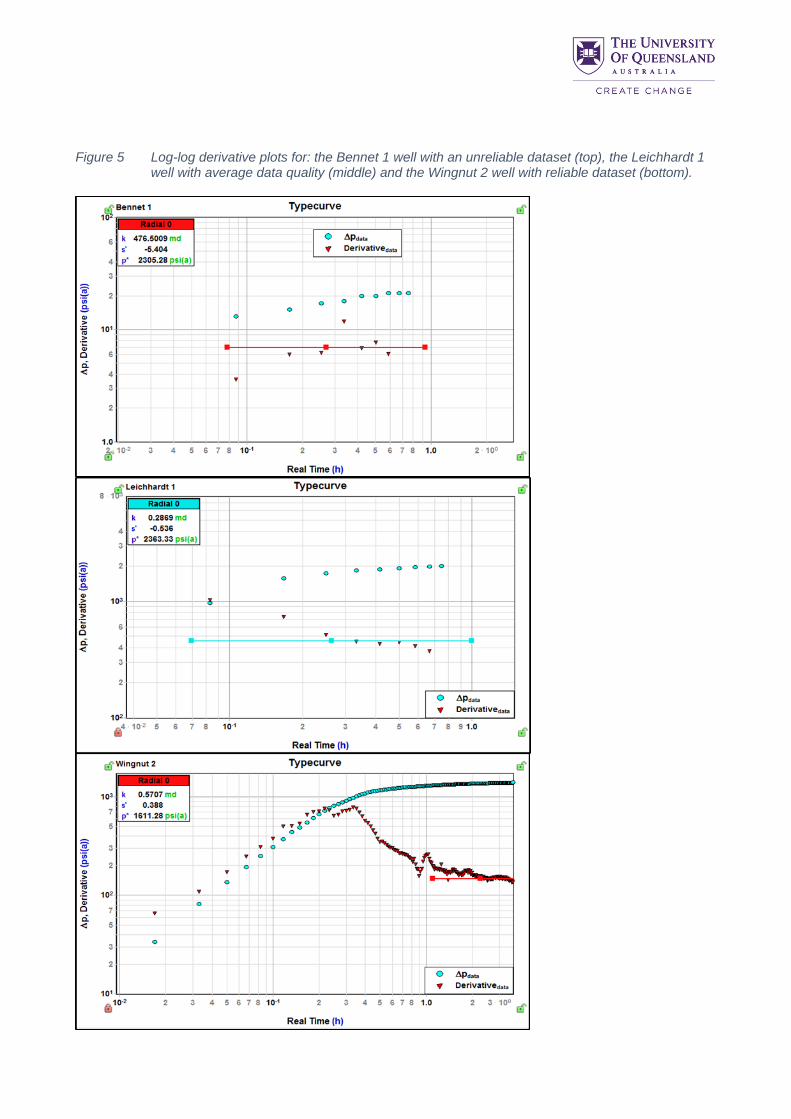
Figure 5 illustrates log-log derivative plots for three well examples with low (the Bennet 1 well), average (the
Leichhardt 1 well) and high (the Wingnut 2 well) DST data quality. The estimated reservoir properties derived
from PTA are considered to be “unreliable” for the Bennet 1 well, “reliable” for the Wingnut 2 well and “to be
used with care” for the Leichhardt 1 well.
UQ-SDAAP | DST Analysis
Figure 5 Log-log derivative plots for: the Bennet 1 well with an unreliable dataset (top), the Leichhardt 1 well with average data quality (middle) and the Wingnut 2 well with reliable dataset (bottom).
UQ-SDAAP | DST Analysis
Out of all wells with DSTs in the strata of interest, 79 DSTs from 60 wells have tabulated pressure-time data
for the calculation of permeability, skin, (extrapolated) initial reservoir pressure and radius of investigation.
The remaining wells had poor data quality rendering them inconclusive and the data needed to be
disregarded. Table 1 in Appendix A summarises the well name, the zone over which the DST was
performed, test interval, estimated k·h, P*, skin, rinv values and data quality.
4. Description of DST derived permeability across the Basin
A key parameter that can be derived from PTA of DST data is the formation bulk permeability. Importantly, a
typical DST samples a larger volume of reservoir rock than is represented by a typical core plug permeability
measurement. Since permeability is scale dependant DST permeability provides critical information in
combination with core plug data that informs the upscaling process required to assign rock properties to
dynamic flow models.
4.1 DST Data in the Blocky Sandstone Reservoir
The Blocky Sandstone Reservoir (Figure 2) represents the notional injection zone. Figure 1 shows DST
permeability values for the Blocky Sandstone Reservoir at well locations on an isochore map of the Blocky
Sandstone Reservoir. Some wells have more than one DST tested within the Blocky Sandstone Reservoir.
In that instance, we displayed the maximum permeability value. The permeability values in the north (MAR
sector area) are generally higher than the permeability in the south (wells around the Leichhardt fault and the
Moonie Field Area). The highest DST permeability is for Woleebee Creek GW4, equal to 2800 mD. The
Leichhardt Fault Area (red rectangle in Figure 1) has the lowest DST permeability values, ranging from 20.00
mD to 170.00 mD. Further south, the Moonie Field shows DST permeability ranging from 51.00 mD to
1400.00 mD, reflecting relatively high heterogeneity for permeability.
The DST permeability values in Figure 1 might be biased due to operators selectively testing the best
reservoir quality. These therefore may not be representing the bulk permeability of the entire Blocky
Sandstone Reservoir thickness. In the case where the DST interval covers an interval with either bad or
good sand quality, the permeability value we displayed in Figure 1 would be under or over estimating the
equivalent bulk permeability for the entire Blocky Sandstone Reservoir thickness.
4.2 DST Data in the Transition Zone
The Transition Zone has the largest number of DSTs within the strata and study area of interest to UQ-
SDAAP. Figure 2 shows Transition Zone DST permeability values at well locations with an isochore map of
the Transition Zone. Some wells have more than one DST tested in the Transition Zone. In that instance, we
displayed the maximum permeability value for those wells.
The DST permeability values in the transition zone vary from 0.01 mD to 270.00 mD. There is uncertainty
regarding the permeability values in the Transition Zone in the centre of the basin due to a lack of well data.
4.3 DST Data across multiple zones
In certain cases, a DST interval may straddle the contact between two stratigraphic layers. In this case the
pressure data and permeability represents some combined response and thus not necessarily representative
of either one individually. Figure 3 shows a map with permeability values from DSTs that have an interval
that goes across the boundary between the Transition Zone and the Blocky Sandstone Reservoir. While the
majority of these DST results are not reliable for other reasons (as per Table 1), some of the values would
suggest the presence of high permeability in the bottom part of the Transition Zone. Examples on these

UQ-SDAAP | DST Analysis
occasions are in the wells Ferrett 1 (660 mD), Bennett 1 (480 mD), Bentley 1 (180 mD), Leichhardt 1 (33
mD), Moonie 3 (90 mD), Moonie 8 (20 mD) and Range 1 (59 mD).
Figure 1 Isochore map of Blocky Sandstone Reservoir showing values of DST permeability at various well locations (unit: mD).
UQ-SDAAP | DST Analysis
Figure 2 Isochore map of the Transition Zone showing values of DST permeability in the Transition Zone at various well locations (unit: mD).

UQ-SDAAP | DST Analysis
Figure 3 Isochore map of Transition Zone with DST permeability values for DSTs that have a completed interval that crosses the boundary between the Blocky Sandstone Reservoir and Transition Zone (unit: mD).

UQ-SDAAP | DST Analysis
5. References
Bourdet D (20020, Well Test Analysis: The Use Of Advanced Interpretation Model, Amsterdam, The
Netherlands, Elsevier Science B.V.
Chaudhry AU (2004), Oil Well Testing Handbook, The United States Of America, Elsevier Inc.
Earlougher RC (1977), Advances In Well Test Analysis, Dallas, The United States Of America.
Harfoush A, Hayes P, La Croix A, Gonzalez S & Wolhuter A (2019), Integrating petrophysics into modelling,
The University of Queensland Surat Deep Aquifer Appraisal Project – Supplementary Detailed Report, The
University of Queensland.
La Croix A, Wang J, Gonzalez S, He J, Underschultz J & Garnett A (2019), Sequence stratigraphy of the
Precipice Sandstone and Evergreen Formation in the Surat Basin, The University of Queensland Surat Deep
Aquifer Appraisal Project – Supplementary Detailed Report, The University of Queensland.
Stewart G (2011), Well Test Design and Analysis, Tulsa, Oklahoma, Pannwell Corporation.

UQ-SDAAP | DST Analysis 17
6. Appendicies
6.1 Appendix A: DST inventory table
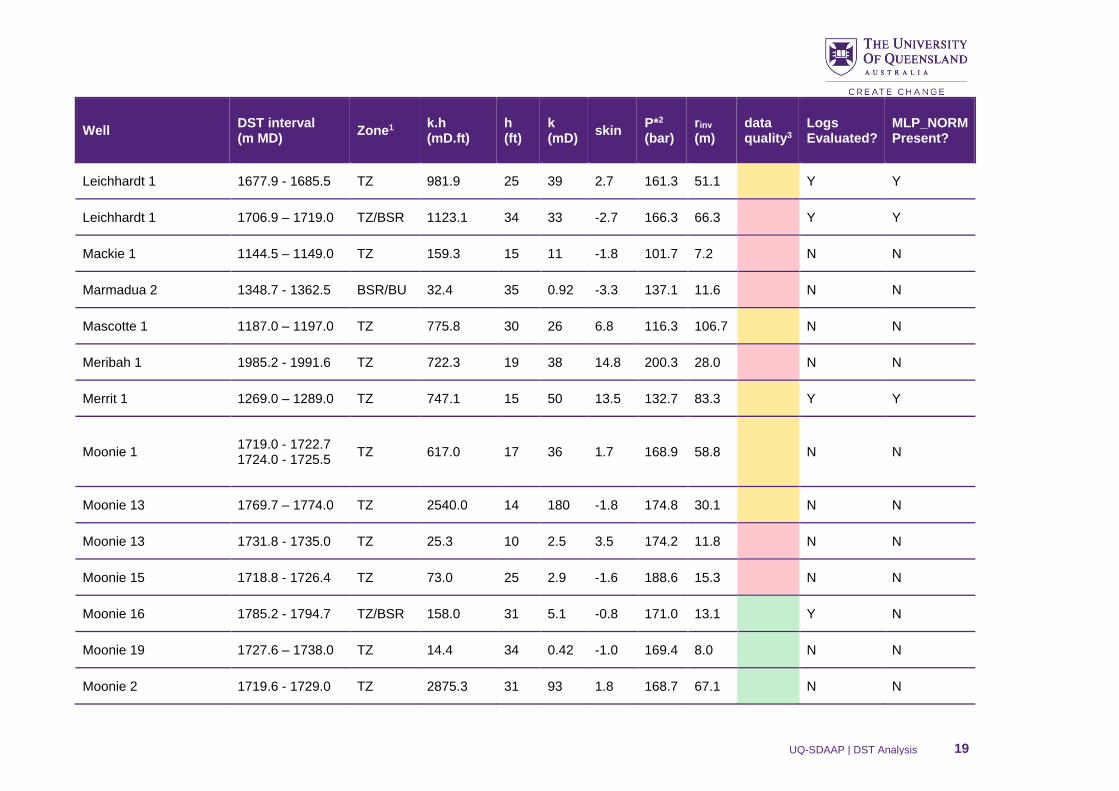
Table 1 DSTs data inventory, with pressure-time data from DSTs and their estimated k·h, k, skin, P* and rinv values BSR: Blocky Sandstone Reservoir, TZ: Transition Zone, BU: sub-Surat Unconformity, MLP_NORM: facies log, Y: Yes, N: No, Quality Scale: reliable data in green, data to be used with care in yellow and unreliable data in red. Thickness h is based on the DST interval.
Well DST interval (m MD)
Zone1 k.h (mD.ft)
h (ft)
k (mD)
skin P*2 (bar)
rinv
(m) data quality3
Logs Evaluated?
MLP_NORM Present?
Arlington 1 2115.5 - 2122.5 BSR 502.3 23 22 -4.2 204.0 87.7 Y Y
Bennett 1 1625.0 – 1632.0 TZ 498.7 23 22 -3.4 144.9 44.9 Y Y
Bennett 1 1651.0 – 1659.0 TZ/BSR 12389.0 26 480 -5.4 159.5 245.2 Y Y
Bennett 2 1616.3 - 1629.8 TZ 335.2 44.3 7.6 -3.2 151.6 32.3 Y Y
Bennett 2 1620.6 - 1625.8 TZ 772.0 17 45 -4.8 149.0 66.1 Y Y
Bennett 2 1649.0 - 1653.8 BSR 923.5 10 92 -2.8 159.1 102.4 Y Y
Bennett 4 1616.0 - 1620.5 TZ 611.3 15 41 -3.3 148.3 46.1 Y Y
Bennett 4 1643.0 - 1646.5 TZ/BSR 2.4 3 0.81 -0.8 155.1 10.1 Y Y
Bennett 4 1650.0 - 1659.3 BSR 491.0 24 20 -1.8 159.7 51.8 Y Y
Bennett North 1 1628.9 – 1638.0 BSR 991.4 17 58 6.5 160.4 72.5 Y Y
Bentley 1 1481.7 - 1521.3 TZ/BSR 1896.9 10.8 180 7.2 142.8 255.3 Y Y

UQ-SDAAP | DST Analysis 18
Well DST interval (m MD)
Zone1 k.h (mD.ft)
h (ft)
k (mD)
skin P*2 (bar)
rinv
(m) data quality3
Logs Evaluated?
MLP_NORM Present?
Blyth Creek 1 1154.0 – 1164.0 TZ 1421.3 18 79 2.5 116.7 58.9 N N
Blyth Creek 1 1165.0 – 1169.0 TZ/BU 210.8 7 30 -1.4 120.5 15.5 N N
Brigalow Creek 1 1676.4 - 1685.5 TZ 4782.6 18 270 -2.5 162.1 141.2 Y N
Bulwer 1 1136.3 - 1141.2 BSR 7030.7 16 440 14.3 108.4 144.8 Y Y
Cabawin 2 2039.0 - 2045.4 TZ 111.9 21 5.3 2.7 191.3 20.4 N N
Cherwondah 2 1200.0 – 1204.0 BU 27.1 8 3.4 1.1 107.0 18.6 N N
Coalbah 1 2209.6 - 2236.9 TZ 0.4 36 0.01 -0.8 216.5 4.3 Y N
Colgoon 1 1432.3 - 1437.1 Unknown 0.5 3 0.15 -0.9 152.0 2.7 N N
Dulacca 1 1584.0 – 1589.0 BSR 1265.9 16 79 4.9 144.5 18.7 Y Y
Ferrett 1 1579.0 - 1582.5 TZ/BSR 7846.5 12 650 -0.8 144.2 48.8 Y Y
Giligulgul 1 1300.0 - 1305.5 BSR 110.8 10 11 15.5 111.5 30.0 N Y
Humbug Creek 1 1646.8 - 1650.8 BSR 488.4 13 38 0.6 158.5 50.1 Y Y
Humbug Creek 1 1646.5 - 1656.6 BSR 1397.8 33 42 -3.3 160.6 65.0 Y Y
Inglestone 1 2185.4 – 2196.0 TZ 1172.0 35 33 -0.3 214.7 97.4 N N
Leichhardt 1 1676.4 – 1681.0 TZ 3.4 15 0.23 -0.5 163.6 3.7 Y Y
UQ-SDAAP | DST Analysis 19
Well DST interval (m MD)
Zone1 k.h (mD.ft)
h (ft)
k (mD)
skin P*2 (bar)
rinv
(m) data quality3
Logs Evaluated?
MLP_NORM Present?
Leichhardt 1 1677.9 - 1685.5 TZ 981.9 25 39 2.7 161.3 51.1 Y Y
Leichhardt 1 1706.9 – 1719.0 TZ/BSR 1123.1 34 33 -2.7 166.3 66.3 Y Y
Mackie 1 1144.5 – 1149.0 TZ 159.3 15 11 -1.8 101.7 7.2 N N
Marmadua 2 1348.7 - 1362.5 BSR/BU 32.4 35 0.92 -3.3 137.1 11.6 N N
Mascotte 1 1187.0 – 1197.0 TZ 775.8 30 26 6.8 116.3 106.7 N N
Meribah 1 1985.2 - 1991.6 TZ 722.3 19 38 14.8 200.3 28.0 N N
Merrit 1 1269.0 – 1289.0 TZ 747.1 15 50 13.5 132.7 83.3 Y Y
Moonie 1 1719.0 - 1722.7 1724.0 - 1725.5
TZ 617.0 17 36 1.7 168.9 58.8 N N
Moonie 13 1769.7 – 1774.0 TZ 2540.0 14 180 -1.8 174.8 30.1 N N
Moonie 13 1731.8 - 1735.0 TZ 25.3 10 2.5 3.5 174.2 11.8 N N
Moonie 15 1718.8 - 1726.4 TZ 73.0 25 2.9 -1.6 188.6 15.3 N N
Moonie 16 1785.2 - 1794.7 TZ/BSR 158.0 31 5.1 -0.8 171.0 13.1 Y N
Moonie 19 1727.6 – 1738.0 TZ 14.4 34 0.42 -1.0 169.4 8.0 N N
Moonie 2 1719.6 - 1729.0 TZ 2875.3 31 93 1.8 168.7 67.1 N N

UQ-SDAAP | DST Analysis 20
Well DST interval (m MD)
Zone1 k.h (mD.ft)
h (ft)
k (mD)
skin P*2 (bar)
rinv
(m) data quality3
Logs Evaluated?
MLP_NORM Present?
Moonie 20 1721.2 - 1733.7 TZ 7805.0 41 190 -3.1 152.2 65.7 N N
Moonie 214 1716.0 - 1734.3 TZ 4.5 60 0.08 0.6 166.7 3.4 Y N
Moonie 234 1774.8 - 1780.7 BSR 1790.0 19 94 -0.8 166.3 34.3 Y N
Moonie 244 1800.0 -1806.0 BSR 27135.0 20 1400 -5.7 170.9 269.4 Y N
Moonie 254 1797.5 - 1803.5 BSR 1011.4 20 51 -4.5 172.2 85.3 Y N
Moonie 264 1767.5 - 1770.3 BSR 562.8 9 63 -2.2 167.7 43.3 N N
Moonie 274 1717.8 – 1727.0 TZ 92.4 30 3.1 0.0 147.7 14.0 Y N
Moonie 284 1723.0 - 1730.3 TZ 23.1 24 0.96 1.8 104.7 9.0 Y N
Moonie 284 1766.2 - 1769.3 BSR 2589.0 10 260 -2.9 165.3 85.3 Y N
Moonie 294 1718.2 - 1723.6 TZ 68.0 18 3.8 -1.0 131.5 13.0 N N
Moonie 294 1723.6 - 1728.2 TZ 1607.5 15 110 -2.6 127.4 31.2 N N
Moonie 3 1778.5 - 1787.7 TZ/BSR 2711.8 30 90 7.3 175.5 202.4 N N
Moonie 314 1728.8 - 1733.4 TZ 28.0 15 1.9 -2.3 156.9 12.9 Y Y
Moonie 324 1728.2 - 1733.7 TZ 985.0 18 55 -4.7 140.5 85.3 N N
Moonie 324 1723.6 - 1728.2 TZ 534.0 15 36 0.2 143.5 52.9 N N

UQ-SDAAP | DST Analysis 21
Well DST interval (m MD)
Zone1 k.h (mD.ft)
h (ft)
k (mD)
skin P*2 (bar)
rinv
(m) data quality3
Logs Evaluated?
MLP_NORM Present?
Moonie 334 1764.1 - 1767.1 BSR 1800.0 10 180 11.5 163.6 73.4 Y Y
Moonie 334 1770.2 - 1773.2 BSR 520.0 10 52 3.3 163.4 74.8 Y Y
Moonie 334 1773.2 - 1776.3 BSR 448.0 10 45 0.1 163.6 63.2 Y Y
Moonie 344 1773.9 - 1776.9 BSR 341.0 10 34 0.0 172.3 58.9 Y Y
Moonie 344 1776.9 – 1780.0 BSR 189.1 10 19 0.0 168.8 48.3 Y Y
Moonie 344 1771.7 - 1774.5 BSR 3747.0 9 420 55.8 164.9 240.8 Y Y
Moonie 384 1720.6 – 1727.0 TZ 1739.2 21 83 -3.6 142.5 89.9 Y N
Moonie 394 1719.0 - 1735.2 TZ 4110.0 53 78 -2.9 121.5 20.7 Y Y
Moonie 8 1774.0 – 1780.0 TZ/BSR 397.5 20 20 4.5 174.5 125.6 N N
Paloma 1 2277.2 - 2338.1 TZ/BU 20.7 20 1 0.2 222.7 12.3 Y Y
Pickanjinnie 10 1244.0 – 1262.0 TZ 337.2 22 15 9.1 97.0 72.5 N N
Pineview 1 1340.2 – 1342.0 TZ 5.0 6 0.84 -1.5 116.9 34.6 Y Y
Range 1 1147.9 - 1165.2 TZ/BSR 3390.4 57 59 1.9 103.1 53.4 N N
Rockwood 1 1143.0 – 1159.0 TZ 54.8 40 1.4 3.1 114.2 21.2 N N
Rockwood 1 1185.0 – 1197.0 TZ/BSR 57.0 20 2.9 14.8 113.7 46.1 N N

UQ-SDAAP | DST Analysis 22
Well DST interval (m MD)
Zone1 k.h (mD.ft)
h (ft)
k (mD)
skin P*2 (bar)
rinv
(m) data quality3
Logs Evaluated?
MLP_NORM Present?
Stakeyard 2 1229.0 - 1248.0 TZ 12.4 23 0.54 18.8 122.4 13.9 N N
Surlick Creek 1 1316.0 – 1335.0 TZ 3.0 52.3 0.06 3.0 137.0 0.4 N N
Tey 1 1566.7 - 1569.7 TZ 896.6 10 90 35.3 151.5 95.6 N N
Tinhut 1 834.0 – 858.0 TZ 358.1 79 4.5 15.0 75.8 3.9 N N
Trelinga 1 982.0 – 1002.0 TZ 0.7 65 0.01 -0.4 92.2 0.8 Y Y
Undulla 1 1693.0 - 1721.2 BSR 15398.8 93 170 6.7 163.8 66.4 N N
Wingnut 2 1136.9 - 1147.6 TZ/BU 11.3 20 0.57 0.4 112.3 18.9 Y Y
Woleebee Creek GW4 1468.0 - 1478.7 BSR 87500.0 35.1
2500 102.4 133.2 189 Y Y
Woleebee Creek GW4 1468.6 - 1573.6 BSR 2800 11.4 140.2 2604 Y Y
1BSR: Blocky Sandstone Reservoir, TZ: Transition Zone, BU: sub-Surat Unconformity.
2P* is the extrapolated reservoir pressure at depth of middle of each testing interval.
3reliable data in green, data to be used with care in yellow and unreliable data in red.
4Post production wells in the Moonie field.

UQ-SDAAP | DST Analysis 23
CRICOS Provider Number 00025B