
Untersuchungen für ein Testverfahren zur Videoanalyse bei ...
45
Bachelorarbeit Medientechnik Untersuchungen für ein Testverfahren zur Videoanalyse bei Consumer-Kameras vorgelegt von Timo Michael Kirsten Mat.-Nr. 11056783 Erstgutachter: Prof. Dr.-Ing. Gregor Fischer (Fachhochschule Köln) Zweitgutachter: Dipl.-Ing. (FH) Uwe Artmann (Image Engineering) April 2013
-
Upload
khangminh22 -
Category
Documents
-
view
3 -
download
0
Transcript of Untersuchungen für ein Testverfahren zur Videoanalyse bei ...
Bachelorarbeit Medientechnik
Untersuchungen für ein Testverfahren zur
Videoanalyse bei Consumer-Kameras
vorgelegt von Timo Michael Kirsten
Mat.-Nr. 11056783
Erstgutachter: Prof. Dr.-Ing. Gregor Fischer (Fachhochschule Köln) Zweitgutachter: Dipl.-Ing. (FH) Uwe Artmann (Image Engineering)
April 2013

Bachelor Thesis
Studies for a test procedure
in video analysis with consumer cameras
submitted by Timo Michael Kirsten
Mat.-Nr. 11056783
First Reviewer: Prof. Dr.-Ing. Gregor Fischer (Cologne University of Applied Sciences) Second Reviewer: Dipl.-Ing. (FH) Uwe Artmann (Image Engineering)
April 2013
Bachelorarbeit Titel: Untersuchungen für ein Testverfahren zur Videoanalyse bei Consumer-Kameras Gutachter:
• Prof. Dr.-Ing. Gregor Fischer (Fachhochschule Köln) • Dipl.-Ing. (FH) Uwe Artmann (Image Engineering, Frechen)
Zusammenfassung: Diese Bachelorarbeit zeigt auf, welche Probleme bei der Verwendung der Videofunktion von digitalen Consumer-Kameras wie Digitalkameras mit Video-funktion, Mobiltelefonen oder Camcordern entstehen können. Auf der Basis dieser Arbeit wird die Firma Image Engineering ein Testverfahren zur Videoanalyse entwickeln. Stichwörter: Videoanalyse, Testverfahren, Consumer-Kameras, Videofehler, Bildfehler Datum: 18.04.2013
Bachelor Thesis Title: Studies for a test procedure in video analysis with consumer cameras Reviewers:
• Prof. Dr.-Ing. Gregor Fischer (Cologne University of Applied Sciences) • Dipl.-Ing. (FH) Uwe Artmann (Image Engineering, Frechen)
Abstract: This Bachelor thesis lists information about video errors including their technical backgrounds with consumer video devices such as digital cameras with a video mode, mobile phones or camcorders common in everyday life. On this base, the company Image Engineering will develop an appropriate test procedure. Keywords: video analysis, test procedure, consumer cameras, video errors, image errors Date: 04/18/2013
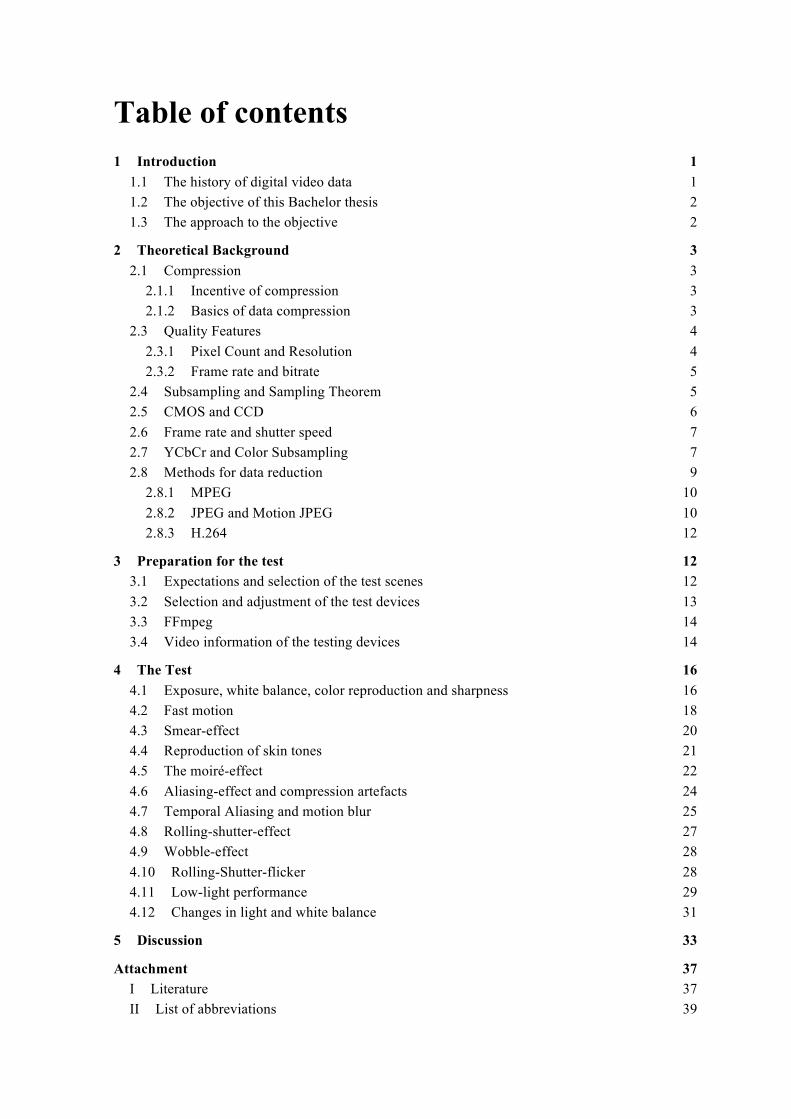
Table of contents 1 Introduction 1
1.1 The history of digital video data 1 1.2 The objective of this Bachelor thesis 2 1.3 The approach to the objective 2
2 Theoretical Background 3 2.1 Compression 3
2.1.1 Incentive of compression 3 2.1.2 Basics of data compression 3
2.3 Quality Features 4 2.3.1 Pixel Count and Resolution 4 2.3.2 Frame rate and bitrate 5
2.4 Subsampling and Sampling Theorem 5 2.5 CMOS and CCD 6 2.6 Frame rate and shutter speed 7 2.7 YCbCr and Color Subsampling 7 2.8 Methods for data reduction 9
2.8.1 MPEG 10 2.8.2 JPEG and Motion JPEG 10 2.8.3 H.264 12
3 Preparation for the test 12 3.1 Expectations and selection of the test scenes 12 3.2 Selection and adjustment of the test devices 13 3.3 FFmpeg 14 3.4 Video information of the testing devices 14
4 The Test 16 4.1 Exposure, white balance, color reproduction and sharpness 16 4.2 Fast motion 18 4.3 Smear-effect 20 4.4 Reproduction of skin tones 21 4.5 The moiré-effect 22 4.6 Aliasing-effect and compression artefacts 24 4.7 Temporal Aliasing and motion blur 25 4.8 Rolling-shutter-effect 27 4.9 Wobble-effect 28 4.10 Rolling-Shutter-flicker 28 4.11 Low-light performance 29 4.12 Changes in light and white balance 31
5 Discussion 33
Attachment 37 I Literature 37 II List of abbreviations 39
1
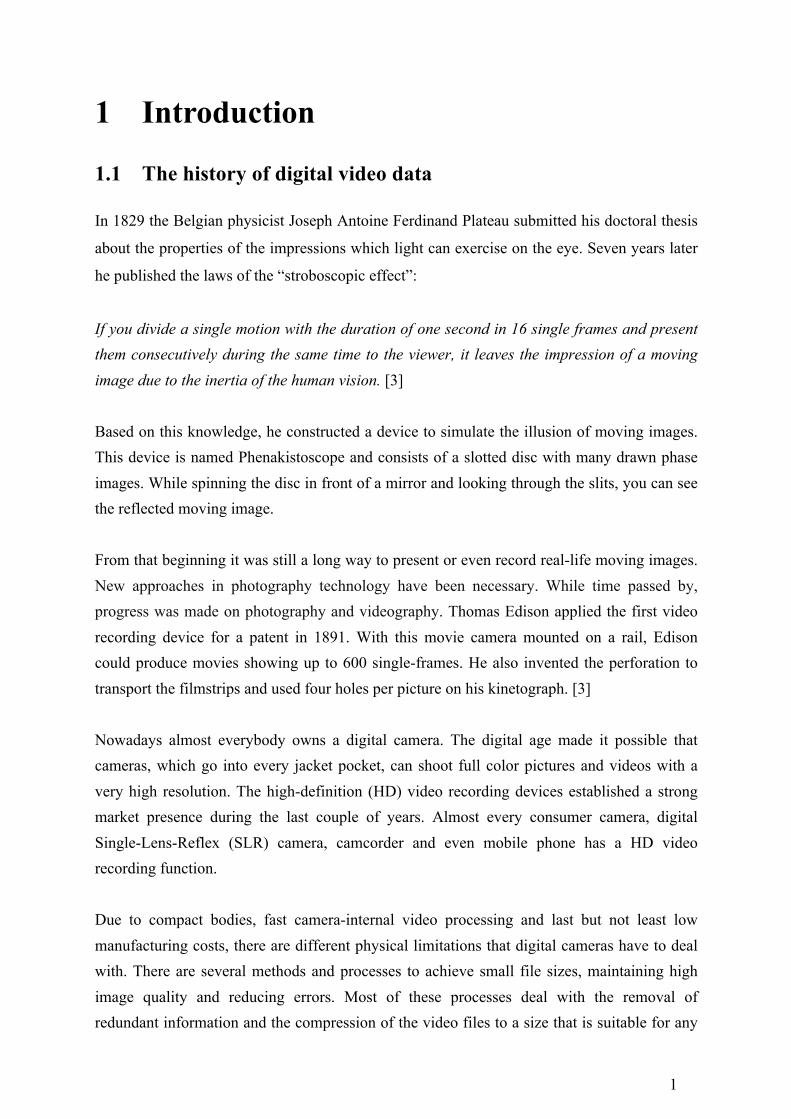
1 Introduction
1.1 The history of digital video data
In 1829 the Belgian physicist Joseph Antoine Ferdinand Plateau submitted his doctoral thesis
about the properties of the impressions which light can exercise on the eye. Seven years later
he published the laws of the “stroboscopic effect”:
If you divide a single motion with the duration of one second in 16 single frames and present them consecutively during the same time to the viewer, it leaves the impression of a moving image due to the inertia of the human vision. [3] Based on this knowledge, he constructed a device to simulate the illusion of moving images. This device is named Phenakistoscope and consists of a slotted disc with many drawn phase images. While spinning the disc in front of a mirror and looking through the slits, you can see the reflected moving image. From that beginning it was still a long way to present or even record real-life moving images. New approaches in photography technology have been necessary. While time passed by, progress was made on photography and videography. Thomas Edison applied the first video recording device for a patent in 1891. With this movie camera mounted on a rail, Edison could produce movies showing up to 600 single-frames. He also invented the perforation to transport the filmstrips and used four holes per picture on his kinetograph. [3] Nowadays almost everybody owns a digital camera. The digital age made it possible that cameras, which go into every jacket pocket, can shoot full color pictures and videos with a very high resolution. The high-definition (HD) video recording devices established a strong market presence during the last couple of years. Almost every consumer camera, digital Single-Lens-Reflex (SLR) camera, camcorder and even mobile phone has a HD video recording function. Due to compact bodies, fast camera-internal video processing and last but not least low manufacturing costs, there are different physical limitations that digital cameras have to deal with. There are several methods and processes to achieve small file sizes, maintaining high image quality and reducing errors. Most of these processes deal with the removal of redundant information and the compression of the video files to a size that is suitable for any
2
mobile device. Every treatment and above all compression of the original video file though requires compromises to the video quality.
1.2 The objective of this Bachelor thesis
The company Image Engineering commissioned this Bachelor thesis in order to get information about different types of errors, which occur while recording video files with mobile consumer devices. Image Engineering is an independent test laboratory located in Frechen, near Cologne in Germany. One of their core competences is the analysis and measurement of digital devices such as digital cameras, camera lenses and mobile phones. In addition, Image Engineering also produces its own test charts, including a sophisticated program for evaluation developed in-house. One of the next projects will be the analysis and measurement of consumer video devices with a new test procedure, especially developed for video evaluation. The objective of this Bachelor thesis is to provide information about video errors occurring while consumers use their video devices in video mode. On this basis, Image Engineering will be able to decide which errors are worth to examine and to develop the above mentioned test procedure.
1.3 The approach to the objective
Manufacturers informed Image Engineering that users complain about a lack of video quality and report visual errors or artefacts produced within video files of their devices. The goal of this thesis is to analyse and compare those errors and to figure out how consumer cameras handle these problems. Therefore it is necessary to test a representative selection of consumer devices according to the reported errors. The result will be an overview of different test scenarios and a conclusion about video quality and error handling of various consumer cameras.
3
2 Theoretical Background
2.1 Compression
2.1.1 Incentive of compression
Continuous media, like video files, contain a large amount of data. For example a 1280 x 720 pixel video with a frame rate of 25 frames per second (fps) and a color depth of 8 Bit per Red-Green-Blue (RGB) channel produces the following amount of data as shown in formula (1):
1280 * 720 * 25 Hz * 8 Bit/channel * 3 channels = 552.960.000 Bit/s = 552,96 Mbit/s (1)
formula 1: Calculation of data amount in video [4]
To persist a five-minute video with above parameters one would need about 19,3 gigabytes of memory space. This huge data volume would make it impossible to process, transfer and save video sequences, especially on mobile devices. Therefore a compression process is essential to store recorded sequences of a certain length on consumer devices, which mostly work with speed- and space-limited Secure Digital (SD) or CompactFlash (CF) cards. There are lots of different algorithms, steps and options of video compression. In the following parts of this thesis an overview of the fundamental processes used within consumer devices is given.
2.1.2 Basics of data compression
The objective of data compression is to save a symbol sequence of an information source using as little storage space as possible. Mainly there are two different types of data compression techniques: Lossless compression only discards redundant information and is completely reversible. It is possible to restore any compressed signal, which was encoded lossless. Lossy compression also filters and discards irrelevant information, which depends on subjective aspects. As a result, lossy compression removes information that does not seem to be interesting or is not noticeable to the viewer. This type of compression is irreversible which implies that the original signal cannot be restored from the compressed data. [6]
4
Considering time aspects and mathematical effort, there are two different types of compression methods. If the effort of compressing and decompressing a video is equal, it is known as a symmetric compression. Most of the methods however are asymmetric because a smooth real-time playback is desirable. The algorithm taking care of the coding of data compression is called coder or encoder while the decoder is in charge of converting this signal back to a movie sequence. The whole procedure of compression is known as codec. The relation of the data sizes between uncompressed and compressed video data is known as compression ratio. This is one of the main characteristics besides image quality when evaluating a codec. Obviously, a codec using lossy compression can reach a compression ratio, which is much higher than a codec working with lossless compression. [5] Of course, it is not very useful to rate the performance of a codec depending only on the compression ratio. In fact it is also important to consider the quality of the reproduced video signal in combination. Every video file has a file- or container-format like Audio Video Interleave (AVI), Moving Picture Experts Group (MPEG) or Quicktime-video (MOV). These files include digital image data, sound data and other information like subtitles. The codec takes take of compressing the video files. Different coded video files can have identical names like DivX or MPEG. For example an AVI-file can be compressed with the H.264 or Digital Video Express (DivX) codec. This means, that the container-format doesn’t necessarily include information about the used codec. [4]
2.3 Quality Features
2.3.1 Pixel Count and Resolution
There are several quality features that classify a video file. First there is the pixel count. This value provides the number of pixel columns in width and height of a video file such as 1280 x 720 pixels. A higher pixel count offers the possibility for a sharper looking image in theory. For instance a Full HD video file (1920x1080 pixels) is able to provide a more detailed looking image than a Video Graphics Array (VGA) video file (640x480 pixels). Actually the term resolution however is even more important than the pixel count, because it reveals the real technical capabilities of a digital device and can only be determined by testing the camera. A higher pixel count does not necessarily result in a higher resolution. The outcome depends on the in-camera-processing of the data provided by the sensor. It should also be
5
noted, that most sensors interpolate their final images because every single pixel on the sensor is only light sensitive for either red, green or blue. As a result the interpolation algorithm can also be a limiting factor. [2][9]
2.3.2 Frame rate and bitrate
The frame rate of a moving image defines the number of frames, which are taken respectively shown per second. The more frames there are per second, the higher is the realized video playback quality. Another attribute is the bit rate of a video file. This value is specified in bits per second (amount of data per second). A higher bit rate indicates a better image quality. Even though there are new codecs, which offer a good compromise between high video quality using low bit rates. [14]
2.4 Subsampling and Sampling Theorem
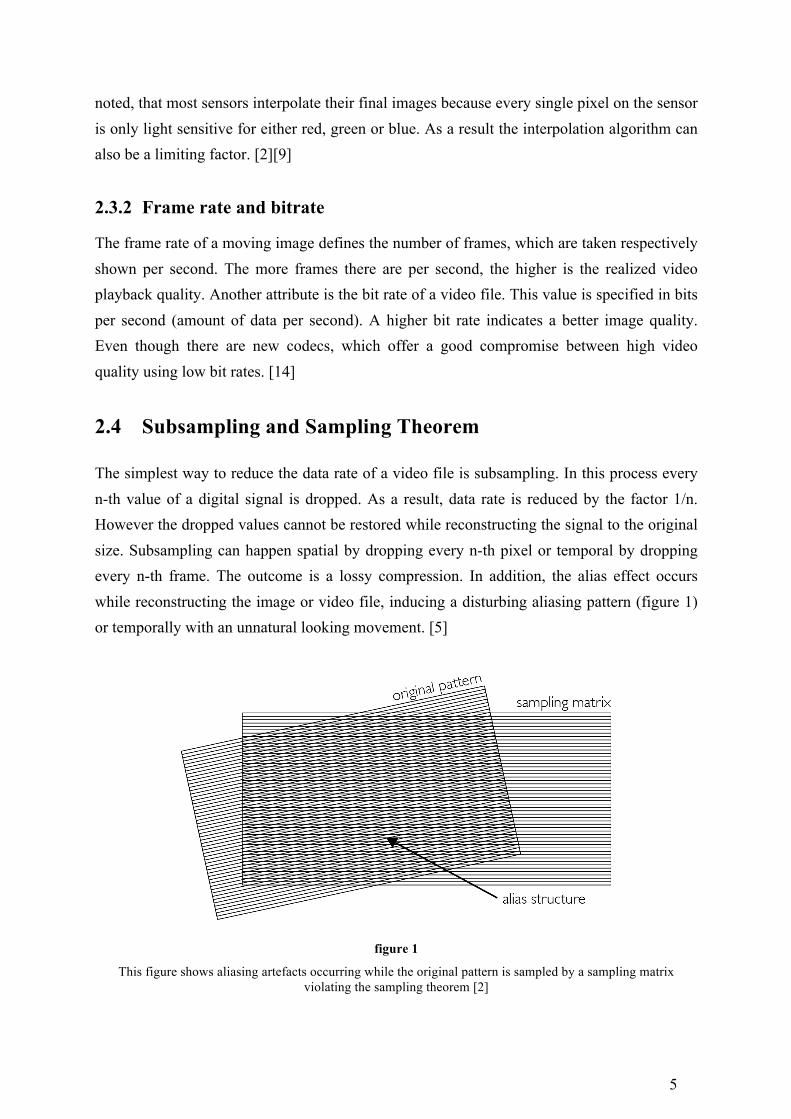
The simplest way to reduce the data rate of a video file is subsampling. In this process every n-th value of a digital signal is dropped. As a result, data rate is reduced by the factor 1/n. However the dropped values cannot be restored while reconstructing the signal to the original size. Subsampling can happen spatial by dropping every n-th pixel or temporal by dropping every n-th frame. The outcome is a lossy compression. In addition, the alias effect occurs while reconstructing the image or video file, inducing a disturbing aliasing pattern (figure 1) or temporally with an unnatural looking movement. [5]
figure 1
This figure shows aliasing artefacts occurring while the original pattern is sampled by a sampling matrix violating the sampling theorem [2]
6
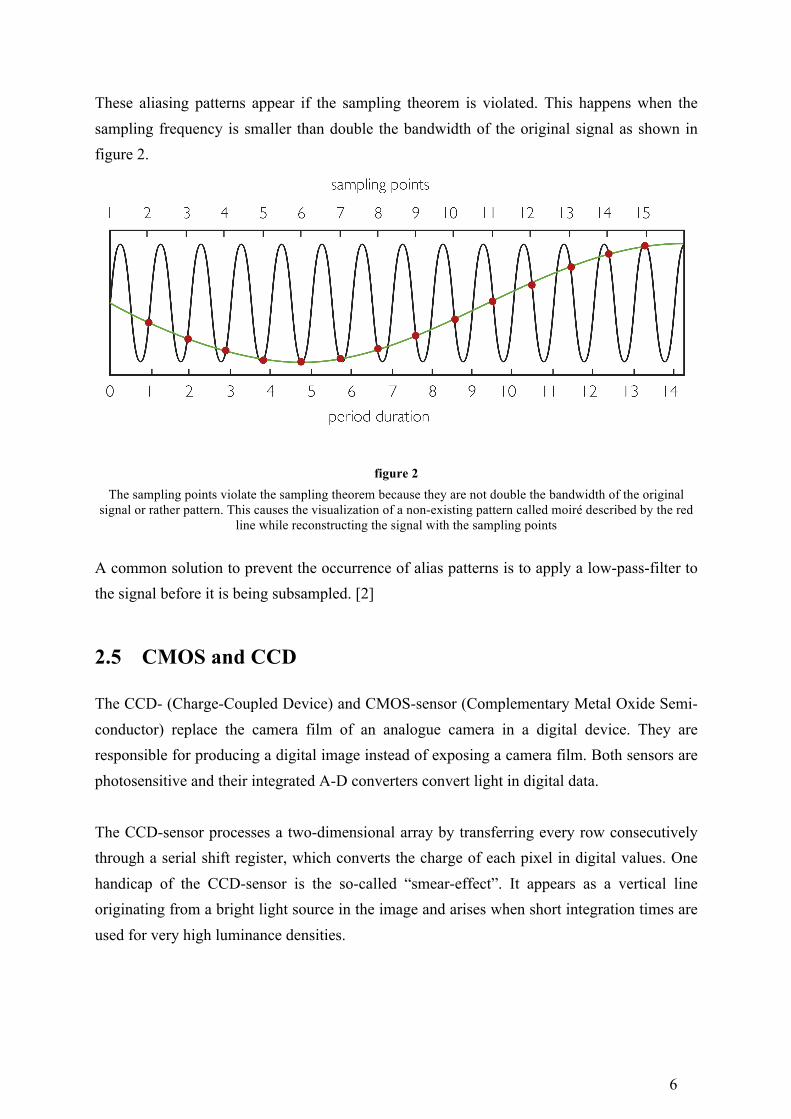
These aliasing patterns appear if the sampling theorem is violated. This happens when the sampling frequency is smaller than double the bandwidth of the original signal as shown in figure 2.
figure 2 The sampling points violate the sampling theorem because they are not double the bandwidth of the original
signal or rather pattern. This causes the visualization of a non-existing pattern called moiré described by the red line while reconstructing the signal with the sampling points
A common solution to prevent the occurrence of alias patterns is to apply a low-pass-filter to the signal before it is being subsampled. [2]
2.5 CMOS and CCD
The CCD- (Charge-Coupled Device) and CMOS-sensor (Complementary Metal Oxide Semi-conductor) replace the camera film of an analogue camera in a digital device. They are responsible for producing a digital image instead of exposing a camera film. Both sensors are photosensitive and their integrated A-D converters convert light in digital data. The CCD-sensor processes a two-dimensional array by transferring every row consecutively through a serial shift register, which converts the charge of each pixel in digital values. One handicap of the CCD-sensor is the so-called “smear-effect”. It appears as a vertical line originating from a bright light source in the image and arises when short integration times are used for very high luminance densities.
7
By contrast, the CMOS-sensor addresses every pixel individually by an x- and y-coordinate and is capable of addressing several pixels simultaneously. This architecture prevents exposure handicaps like the “smear-effect”. On the other hand there is another handicap dealing only with CMOS-sensors, which is called “rolling-shutter-effect”. In most cases of video recording there is no use of a mechanical shutter to avoid this effect. CMOS-sensors record a scene consecutively line-by-line from top to bottom really fast. While recording a fast moving target or panning the device really quick, an effect occurs, which gives the impression that the recorded objects are bending. [6][7]
2.6 Frame rate and shutter speed
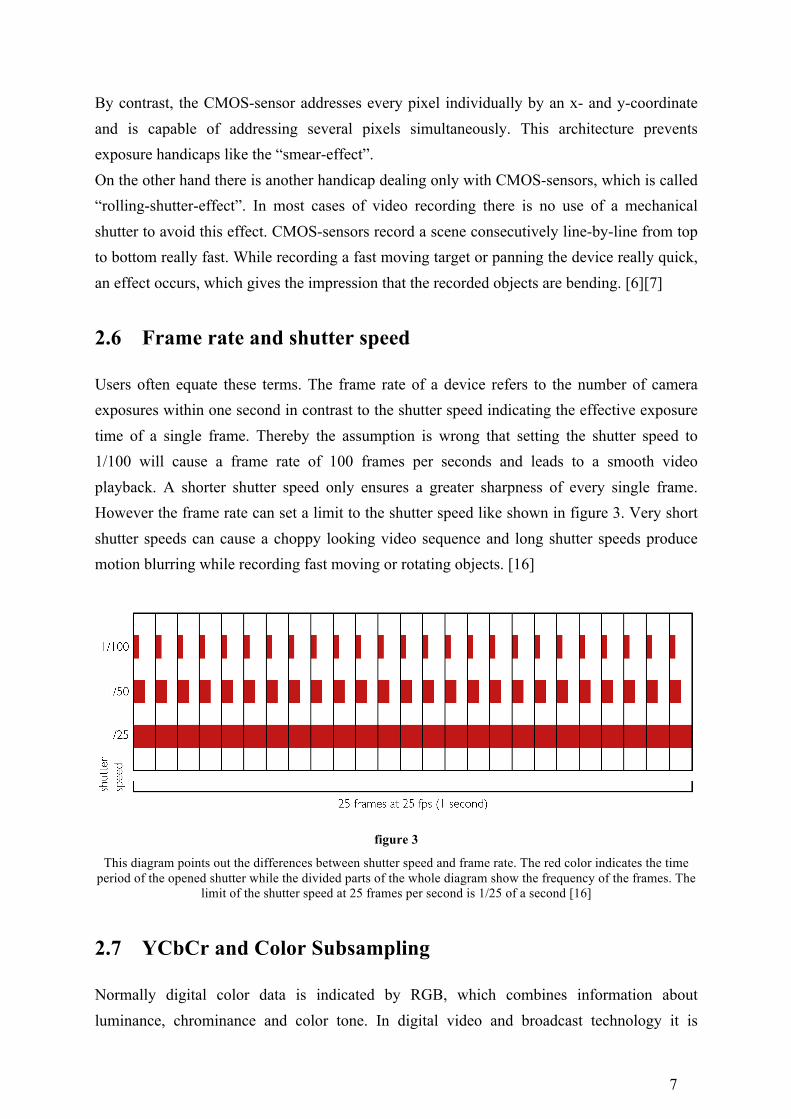
Users often equate these terms. The frame rate of a device refers to the number of camera exposures within one second in contrast to the shutter speed indicating the effective exposure time of a single frame. Thereby the assumption is wrong that setting the shutter speed to 1/100 will cause a frame rate of 100 frames per seconds and leads to a smooth video playback. A shorter shutter speed only ensures a greater sharpness of every single frame. However the frame rate can set a limit to the shutter speed like shown in figure 3. Very short shutter speeds can cause a choppy looking video sequence and long shutter speeds produce motion blurring while recording fast moving or rotating objects. [16]
figure 3
This diagram points out the differences between shutter speed and frame rate. The red color indicates the time period of the opened shutter while the divided parts of the whole diagram show the frequency of the frames. The
limit of the shutter speed at 25 frames per second is 1/25 of a second [16]
2.7 YCbCr and Color Subsampling
Normally digital color data is indicated by RGB, which combines information about luminance, chrominance and color tone. In digital video and broadcast technology it is
8
preferred to split the luminance and the color data within the signal. Luminance (Y) can be calculated using the following formula (2) applied on most digital standard definition formats: [15]
𝑌 = 0,299 𝑅 + 0,87 𝐺 + 0,114 𝐵 (2) Modern HDTV systems however use different coefficients referring to the Rec. 709 standard in formula (3): [13]
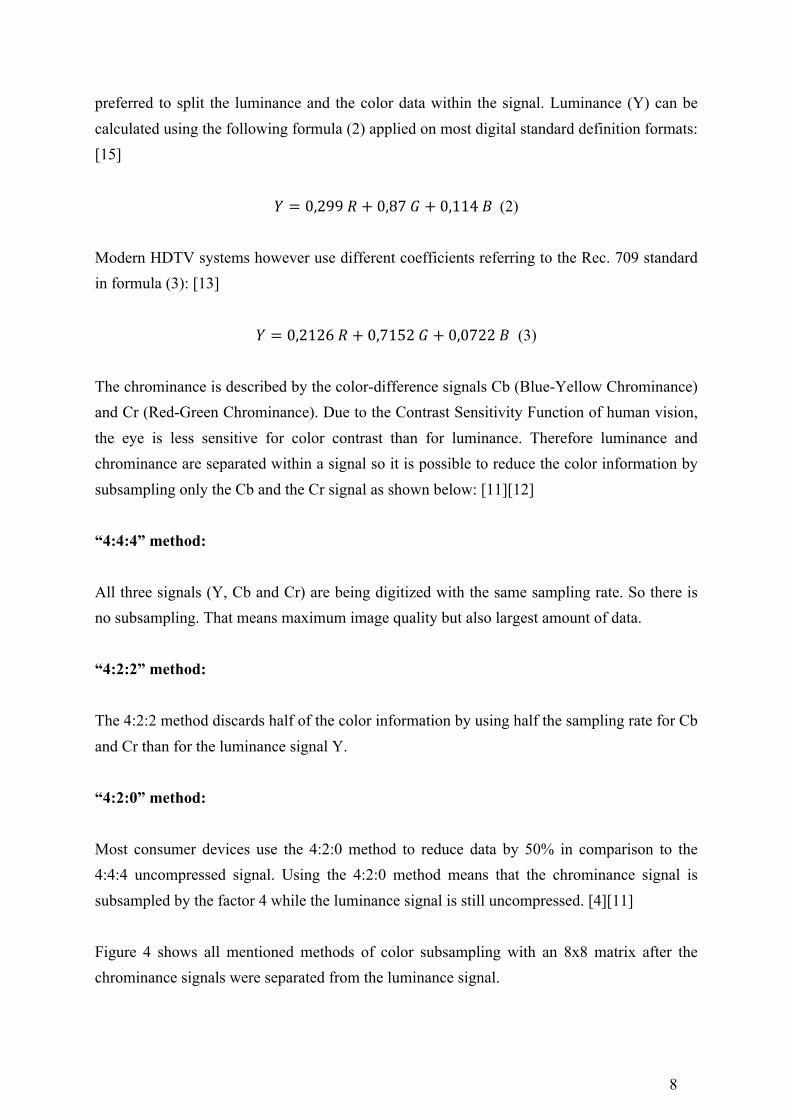
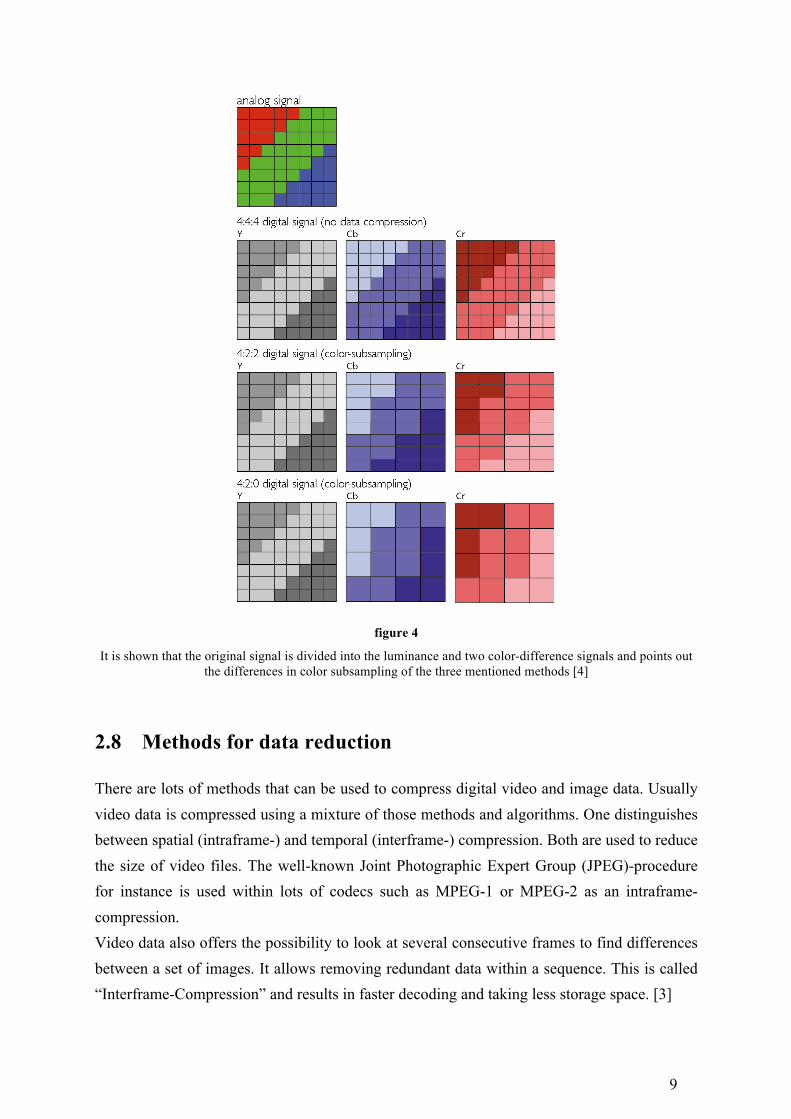
𝑌 = 0,2126 𝑅 + 0,7152 𝐺 + 0,0722 𝐵 (3) The chrominance is described by the color-difference signals Cb (Blue-Yellow Chrominance) and Cr (Red-Green Chrominance). Due to the Contrast Sensitivity Function of human vision, the eye is less sensitive for color contrast than for luminance. Therefore luminance and chrominance are separated within a signal so it is possible to reduce the color information by subsampling only the Cb and the Cr signal as shown below: [11][12] “4:4:4” method: All three signals (Y, Cb and Cr) are being digitized with the same sampling rate. So there is no subsampling. That means maximum image quality but also largest amount of data. “4:2:2” method: The 4:2:2 method discards half of the color information by using half the sampling rate for Cb and Cr than for the luminance signal Y. “4:2:0” method: Most consumer devices use the 4:2:0 method to reduce data by 50% in comparison to the 4:4:4 uncompressed signal. Using the 4:2:0 method means that the chrominance signal is subsampled by the factor 4 while the luminance signal is still uncompressed. [4][11] Figure 4 shows all mentioned methods of color subsampling with an 8x8 matrix after the chrominance signals were separated from the luminance signal.
9
figure 4
It is shown that the original signal is divided into the luminance and two color-difference signals and points out the differences in color subsampling of the three mentioned methods [4]
2.8 Methods for data reduction
There are lots of methods that can be used to compress digital video and image data. Usually video data is compressed using a mixture of those methods and algorithms. One distinguishes between spatial (intraframe-) and temporal (interframe-) compression. Both are used to reduce the size of video files. The well-known Joint Photographic Expert Group (JPEG)-procedure for instance is used within lots of codecs such as MPEG-1 or MPEG-2 as an intraframe-compression. Video data also offers the possibility to look at several consecutive frames to find differences between a set of images. It allows removing redundant data within a sequence. This is called “Interframe-Compression” and results in faster decoding and taking less storage space. [3]
10
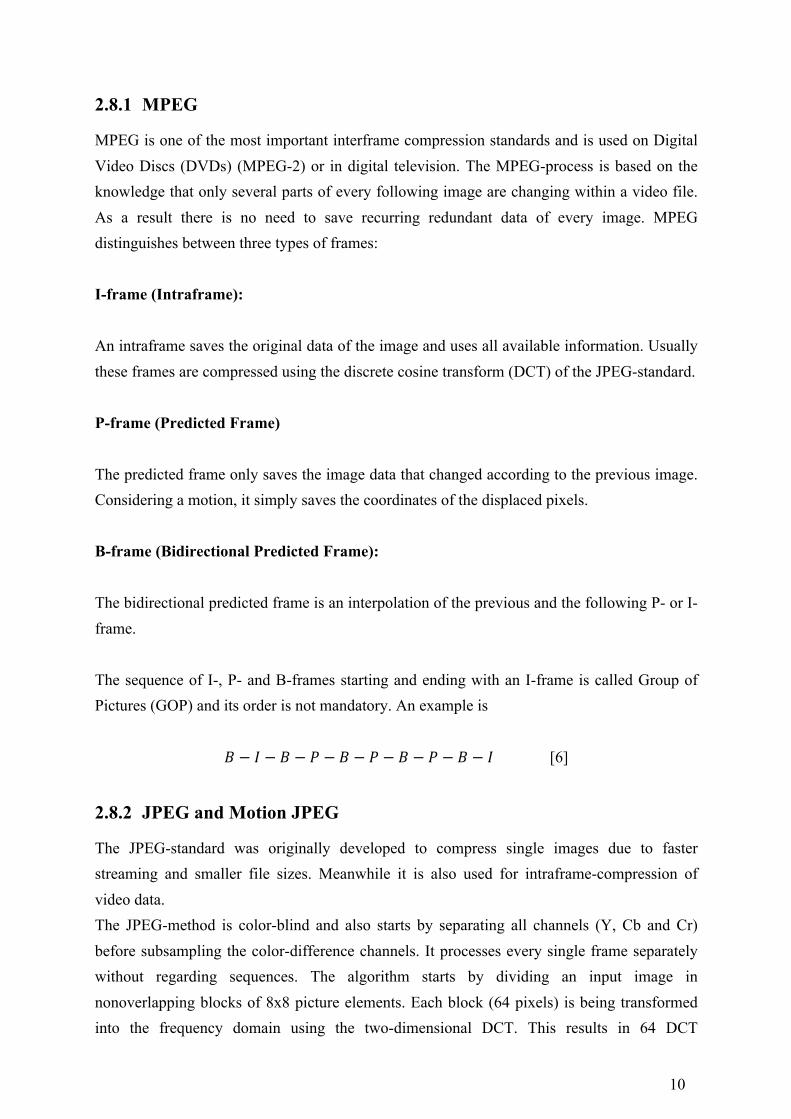
2.8.1 MPEG
MPEG is one of the most important interframe compression standards and is used on Digital Video Discs (DVDs) (MPEG-2) or in digital television. The MPEG-process is based on the knowledge that only several parts of every following image are changing within a video file. As a result there is no need to save recurring redundant data of every image. MPEG distinguishes between three types of frames: I-frame (Intraframe): An intraframe saves the original data of the image and uses all available information. Usually these frames are compressed using the discrete cosine transform (DCT) of the JPEG-standard. P-frame (Predicted Frame) The predicted frame only saves the image data that changed according to the previous image. Considering a motion, it simply saves the coordinates of the displaced pixels. B-frame (Bidirectional Predicted Frame): The bidirectional predicted frame is an interpolation of the previous and the following P- or I-frame. The sequence of I-, P- and B-frames starting and ending with an I-frame is called Group of Pictures (GOP) and its order is not mandatory. An example is
𝐵 − 𝐼 − 𝐵 − 𝑃 − 𝐵 − 𝑃 − 𝐵 − 𝑃 − 𝐵 − 𝐼 [6]
2.8.2 JPEG and Motion JPEG
The JPEG-standard was originally developed to compress single images due to faster streaming and smaller file sizes. Meanwhile it is also used for intraframe-compression of video data. The JPEG-method is color-blind and also starts by separating all channels (Y, Cb and Cr) before subsampling the color-difference channels. It processes every single frame separately without regarding sequences. The algorithm starts by dividing an input image in nonoverlapping blocks of 8x8 picture elements. Each block (64 pixels) is being transformed into the frequency domain using the two-dimensional DCT. This results in 64 DCT

11
coefficients per block representing the spatial frequencies. The first direct current (DC) coefficient is the frequency component “0” for both axes and describes the basic color shade of the 8x8 matrix. The 63 remaining alternating current (AC) coefficients show the frequency components of each block. The resulting coefficients are now quantized and differentiated due to spatial frequencies considering the human visual sensitivity. Additionally, the user or the codec can set the quantization level. This is the only lossy step within the JPEG algorithm, which means, that the operation would be completely reversible without quantization. The next step of the JPEG-method is encoding. The 64 values are sorted and processed in a zigzag sequence from the lower to the higher spatial frequencies. Finally JPEG provides different methods of compressing the resulting image data, like variable-length-integers or the Huffman-algorithm, which will not be further discussed in this bachelor-thesis. Lots of video codecs use a very high quantization interval and a high compression ratio, which results in unattractive compression artefacts. Very often there are even the 8x8 DCT-blocks recognizable like shown in figure 5. [1][2]
figure 5
This figure shows the 100% crop of a video file recorded with the Nikon D5000. The 8x8 DCT-blocks are very striking and point to a very high compression of the video data
Some video devices use the Motion JPEG codec to compress video data and treat every single frame independently, using the JPEG-compression without prediction. The benefit of this method is that a video sequence using only I-frames is capable of a frame-accurate video editing in contrast to MPEG videos. [5]
12
2.8.3 H.264
The development of the H.264 codec started in 1998 and was a joint venture of the Video Coding Expert Group (VCEG) and MPEG. Basically H.264 works like other hybrid coding standards and combines inter- and intraframe compression. However almost every step experienced an improvement in efficiency and performance compared to previous standards. For instance H.264 uses an integer-transformation instead of DCT to get rid of the complex floating-point operations to work more efficient. An option to reduce the block size from 8x8 (High-Profile) to 4x4 was implemented and several enhancements in motion compensation were made. Further on an intraframe prediction was added to predict pixels within one frame. Altogether H.264 was developed to be the new standard for digital video broadcasting and high definition television and video data. It was used in most cameras during this test. [1][14]
3 Preparation for the test 3.1 Expectations and selection of the test scenes
All mentioned compressing methods and sensor architectures involve different compromises and problems with the processed video files, especially with high compressed data. Therefore all selected devices will be tested according to the reported and known errors. Especially sensor-based errors and errors due to a high compression, as well as general performance problems are expected and will be tested. The test consists of the following criteria:
• Exposure, white balancing, color reproduction and sharpness
• Fast motion
• Smear-effect
• Reproduction of skin tones
• Moiré-effect
• Aliasing-effect
• Temporal aliasing and motion blur
• Rolling-shutter-effect
• Wobble-effect
• Rolling-shutter-flicker
• Low light performance
• Changes in light and white balance
13
3.2 Selection and adjustment of the test devices
This thesis is supposed to be the basis for a new test method for consumer cameras in the test laboratory of Image Engineering. Therefore it was important to select different types of cameras in various price spectrums without considering professional devices. In addition, it was useful to compare different codecs, sensors and resolutions. The website of the online retailer “www.amazon.de” was used to estimate the popularity of different models by considering their sales ranking. As a result the following devices were chosen:
• Apple iPhone 4S 16GB (mobile phone) Average price (06/16/2012): 598,31 € [18]
• Olympus VR-310 (compact camera) Average price (06/16/2012): 114,10 € [18]
• Canon PowerShot G12 (bridge camera) Average price (06/16/2012) 389,96 € [18]
• Nikon D5000 with Kit lens (digital SLR) Average price (06/16/2012) 599,01 € [18]
• Sony HDR-CX130 (compact camcorder) Average price (06/16/2012) 346,18 € [18]
All devices are non-professional consumer devices and provide limited setting options. Due to comparability the highest available resolution and video quality was chosen throughout the test on all devices. Most cameras did not offer extended settings like lens aperture or ISO-sensitivity. Therefore the standard or auto settings were applied on all other devices if possible. To get information about low-light performance, the light source was adapted in one of the tests. All videos were taken on a professional tripod for at least 10 seconds and the frames were captured after at least 2 seconds and somewhere in the middle of each recording to avoid blurring errors due to shaking, which can be caused by operating the devices.
14
3.3 FFmpeg
One essential software tool to evaluate the testing was “FFmpeg” [p1]. It is a console-based program and allows extracting single uncompressed frames of all given video files. For examination of the video quality only I-frames were extracted to get information about the original data and image quality without considering the predicted frames. One exception however was the test dealing with I-, P- and B-frames of course. Furthermore it was important to extract the images in the Bitmap-format because it provides uncompressed image data.
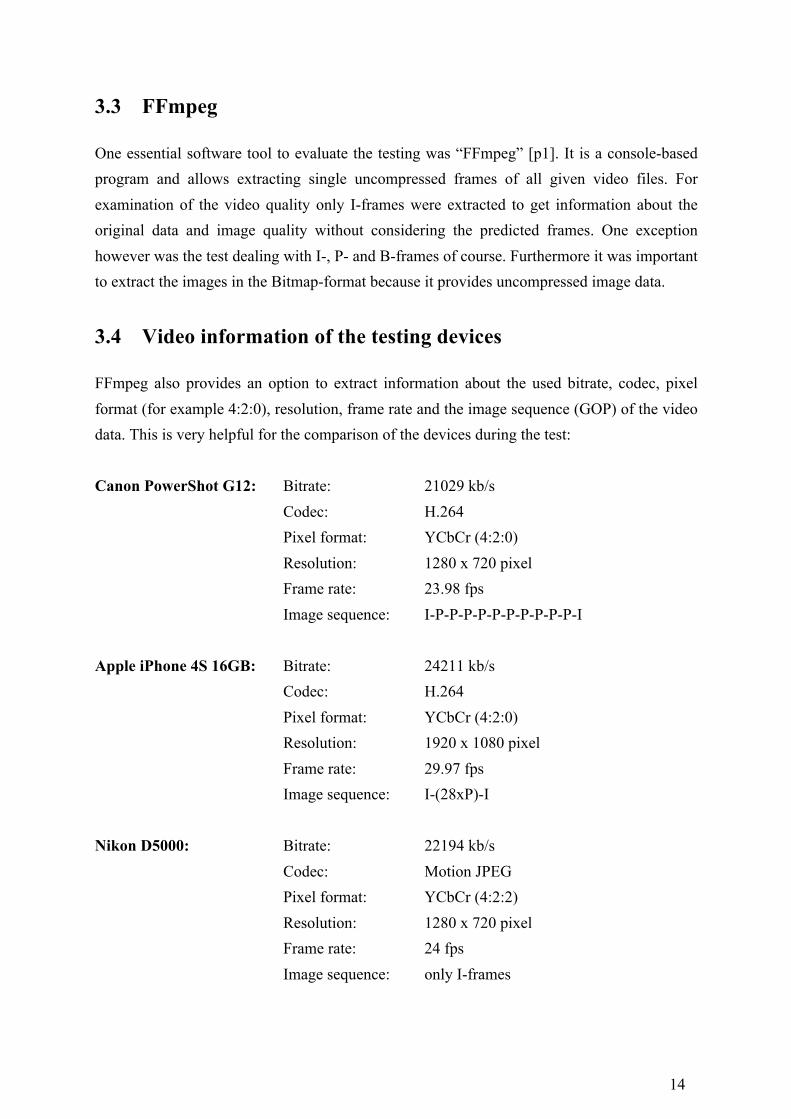
3.4 Video information of the testing devices
FFmpeg also provides an option to extract information about the used bitrate, codec, pixel format (for example 4:2:0), resolution, frame rate and the image sequence (GOP) of the video data. This is very helpful for the comparison of the devices during the test: Canon PowerShot G12: Bitrate: 21029 kb/s
Codec: H.264 Pixel format: YCbCr (4:2:0) Resolution: 1280 x 720 pixel Frame rate: 23.98 fps Image sequence: I-P-P-P-P-P-P-P-P-P-P-I
Apple iPhone 4S 16GB: Bitrate: 24211 kb/s
Codec: H.264 Pixel format: YCbCr (4:2:0) Resolution: 1920 x 1080 pixel Frame rate: 29.97 fps Image sequence: I-(28xP)-I
Nikon D5000: Bitrate: 22194 kb/s
Codec: Motion JPEG Pixel format: YCbCr (4:2:2) Resolution: 1280 x 720 pixel Frame rate: 24 fps Image sequence: only I-frames
15
Olympus VR-310: Bitrate: 33672 kb/s Codec: Motion JPEG
Pixel format: YCbCr (4:2:0) Resolution: 1280 x 720 pixel Frame rate: 30 fps Image sequence: only I-frames
Sony HDR-CX130: Bitrate: 26214 kb/s
Codec: H.264 Pixel format: YCbCr (4:2:0) Resolution: 1920 x 1080 pixel Frame rate: 50 fps Image sequence: I-(33xP)-I
All chosen cameras either went with the H.264 or the Motion JPEG codec. They all show a color subsampling as explained earlier. All devices except the Nikon D5000 even chose the 4:2:0 option, which subsamples both color-difference signals. The bitrate differs from 21029 to 33672 kilobytes per second (kb/s) but this cannot be used as a stand-alone indicator for video quality since it has to be considered in conjunction with all other parameters and options. Especially video data compressed with the Motion JPEG codec using only I-frames depend on higher bitrates than video data using efficient interframe-compression, because the lack of predicted frames induces a larger amount of data. The pixel count of all video files is either 1920 x 1080 pixels (1080p) or 1280 x 720 pixels (720p). Nowadays resolutions lower than 1280 x 720 pixels are no longer remarkable. The frame rate varies from 23.98 to 50 fps. Even though 50 fps should look smoother to the observer, all other video files should provide a fluent playback. Obviously the used codecs work without any B-frames.
16
4 The Test
4.1 Exposure, white balance, color reproduction and sharpness
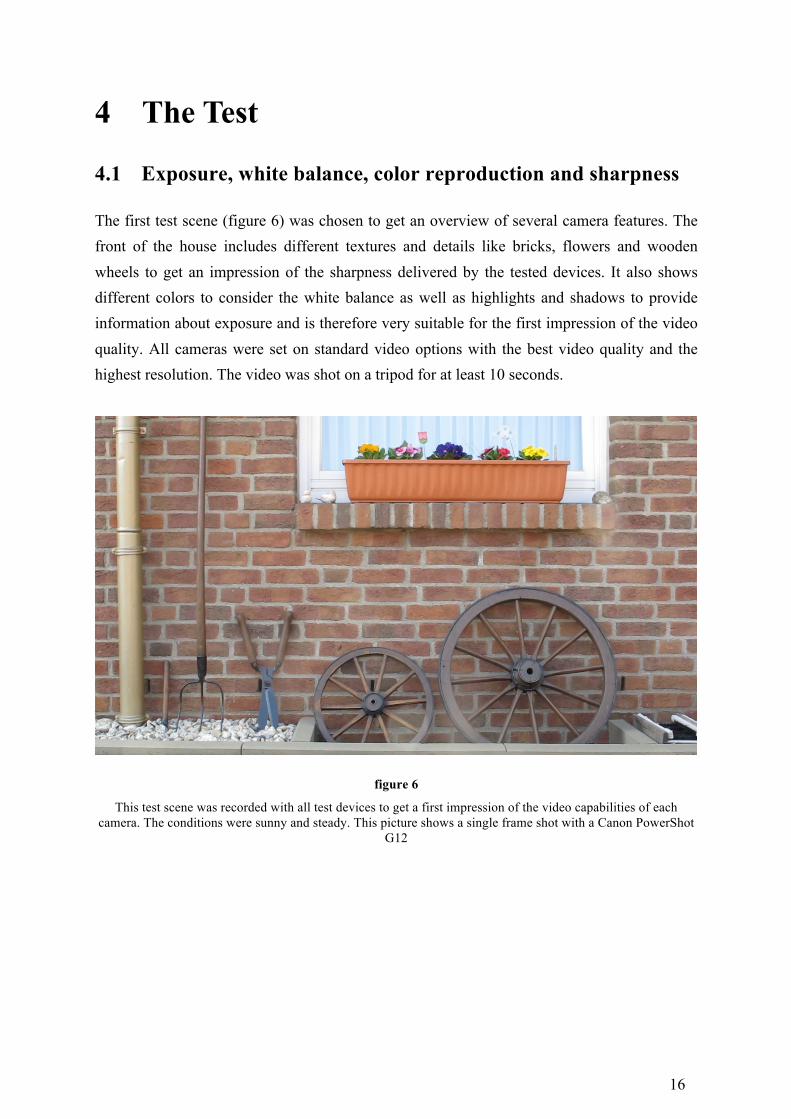
The first test scene (figure 6) was chosen to get an overview of several camera features. The front of the house includes different textures and details like bricks, flowers and wooden wheels to get an impression of the sharpness delivered by the tested devices. It also shows different colors to consider the white balance as well as highlights and shadows to provide information about exposure and is therefore very suitable for the first impression of the video quality. All cameras were set on standard video options with the best video quality and the highest resolution. The video was shot on a tripod for at least 10 seconds.
figure 6
This test scene was recorded with all test devices to get a first impression of the video capabilities of each camera. The conditions were sunny and steady. This picture shows a single frame shot with a Canon PowerShot
G12
17
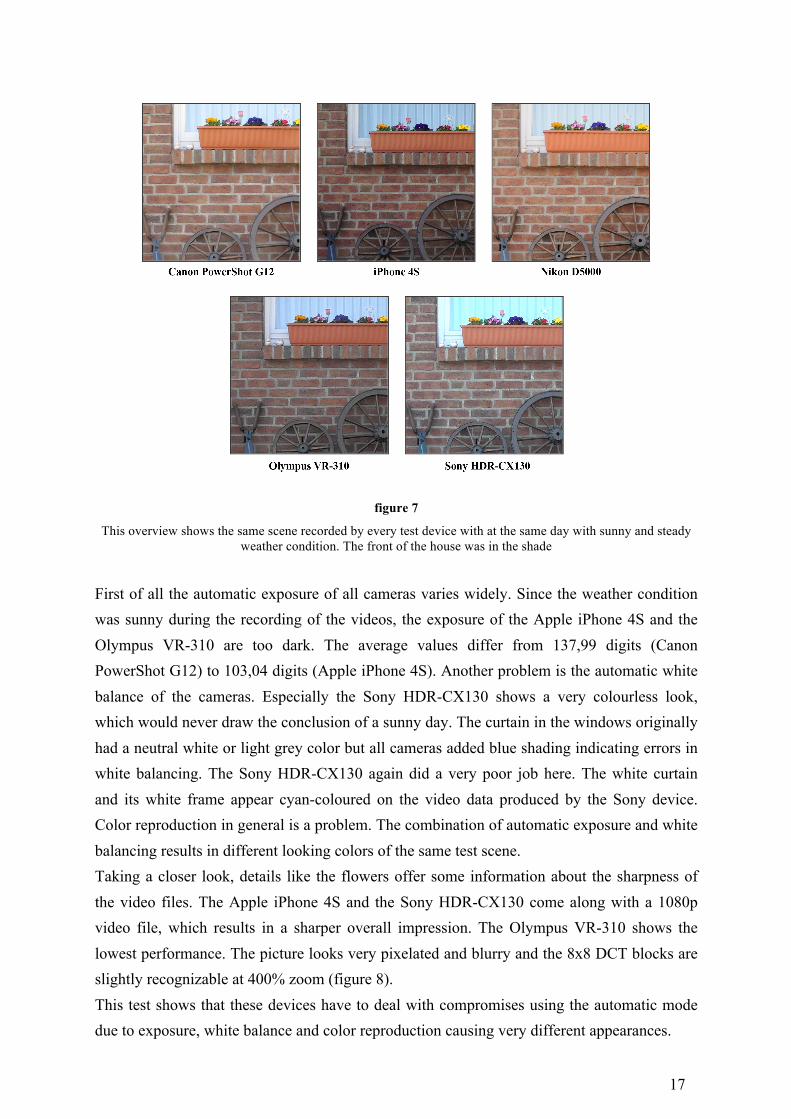
figure 7
This overview shows the same scene recorded by every test device with at the same day with sunny and steady weather condition. The front of the house was in the shade
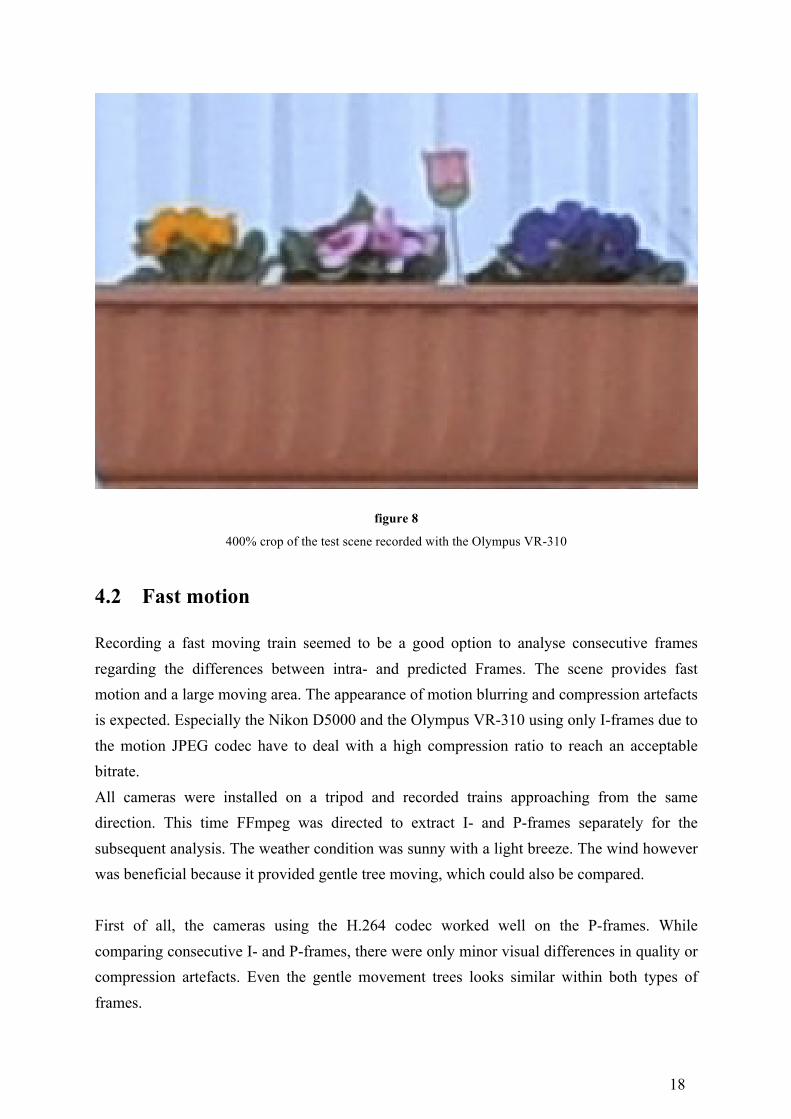
First of all the automatic exposure of all cameras varies widely. Since the weather condition was sunny during the recording of the videos, the exposure of the Apple iPhone 4S and the Olympus VR-310 are too dark. The average values differ from 137,99 digits (Canon PowerShot G12) to 103,04 digits (Apple iPhone 4S). Another problem is the automatic white balance of the cameras. Especially the Sony HDR-CX130 shows a very colourless look, which would never draw the conclusion of a sunny day. The curtain in the windows originally had a neutral white or light grey color but all cameras added blue shading indicating errors in white balancing. The Sony HDR-CX130 again did a very poor job here. The white curtain and its white frame appear cyan-coloured on the video data produced by the Sony device. Color reproduction in general is a problem. The combination of automatic exposure and white balancing results in different looking colors of the same test scene. Taking a closer look, details like the flowers offer some information about the sharpness of the video files. The Apple iPhone 4S and the Sony HDR-CX130 come along with a 1080p video file, which results in a sharper overall impression. The Olympus VR-310 shows the lowest performance. The picture looks very pixelated and blurry and the 8x8 DCT blocks are slightly recognizable at 400% zoom (figure 8). This test shows that these devices have to deal with compromises using the automatic mode due to exposure, white balance and color reproduction causing very different appearances.
18
figure 8
400% crop of the test scene recorded with the Olympus VR-310
4.2 Fast motion
Recording a fast moving train seemed to be a good option to analyse consecutive frames regarding the differences between intra- and predicted Frames. The scene provides fast motion and a large moving area. The appearance of motion blurring and compression artefacts is expected. Especially the Nikon D5000 and the Olympus VR-310 using only I-frames due to the motion JPEG codec have to deal with a high compression ratio to reach an acceptable bitrate. All cameras were installed on a tripod and recorded trains approaching from the same direction. This time FFmpeg was directed to extract I- and P-frames separately for the subsequent analysis. The weather condition was sunny with a light breeze. The wind however was beneficial because it provided gentle tree moving, which could also be compared. First of all, the cameras using the H.264 codec worked well on the P-frames. While comparing consecutive I- and P-frames, there were only minor visual differences in quality or compression artefacts. Even the gentle movement trees looks similar within both types of frames.
19
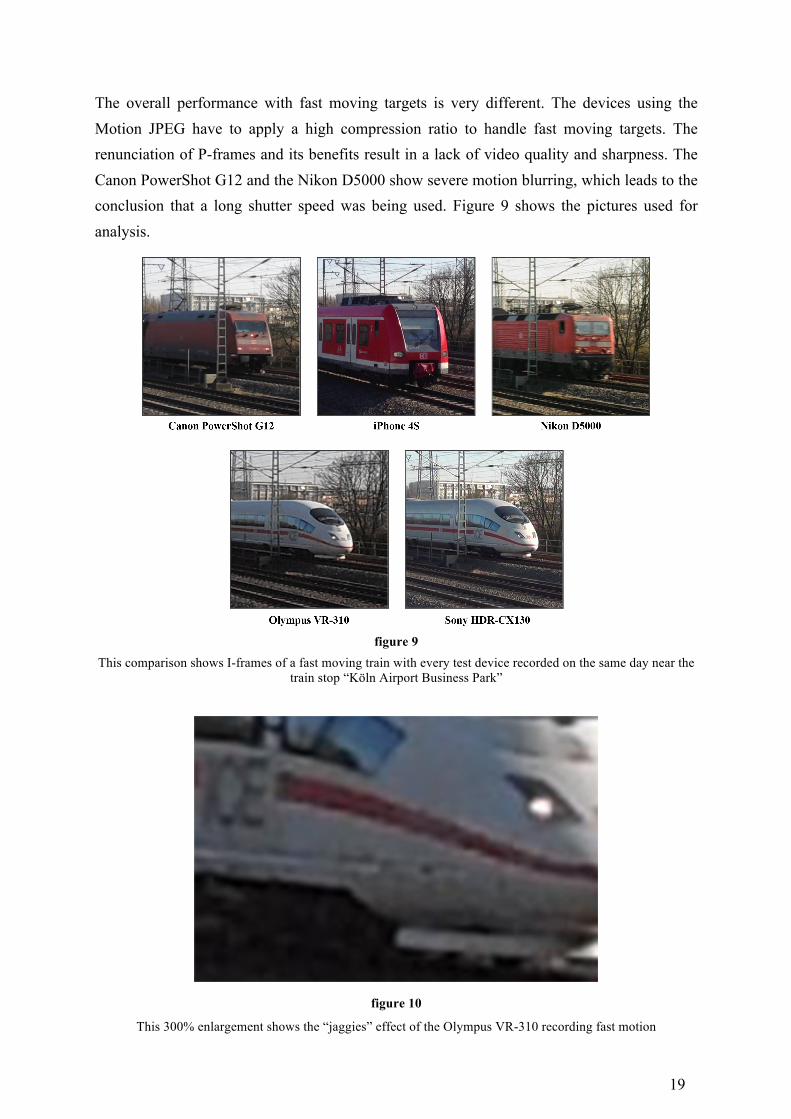
The overall performance with fast moving targets is very different. The devices using the Motion JPEG have to apply a high compression ratio to handle fast moving targets. The renunciation of P-frames and its benefits result in a lack of video quality and sharpness. The Canon PowerShot G12 and the Nikon D5000 show severe motion blurring, which leads to the conclusion that a long shutter speed was being used. Figure 9 shows the pictures used for analysis.
figure 9 This comparison shows I-frames of a fast moving train with every test device recorded on the same day near the
train stop “Köln Airport Business Park”
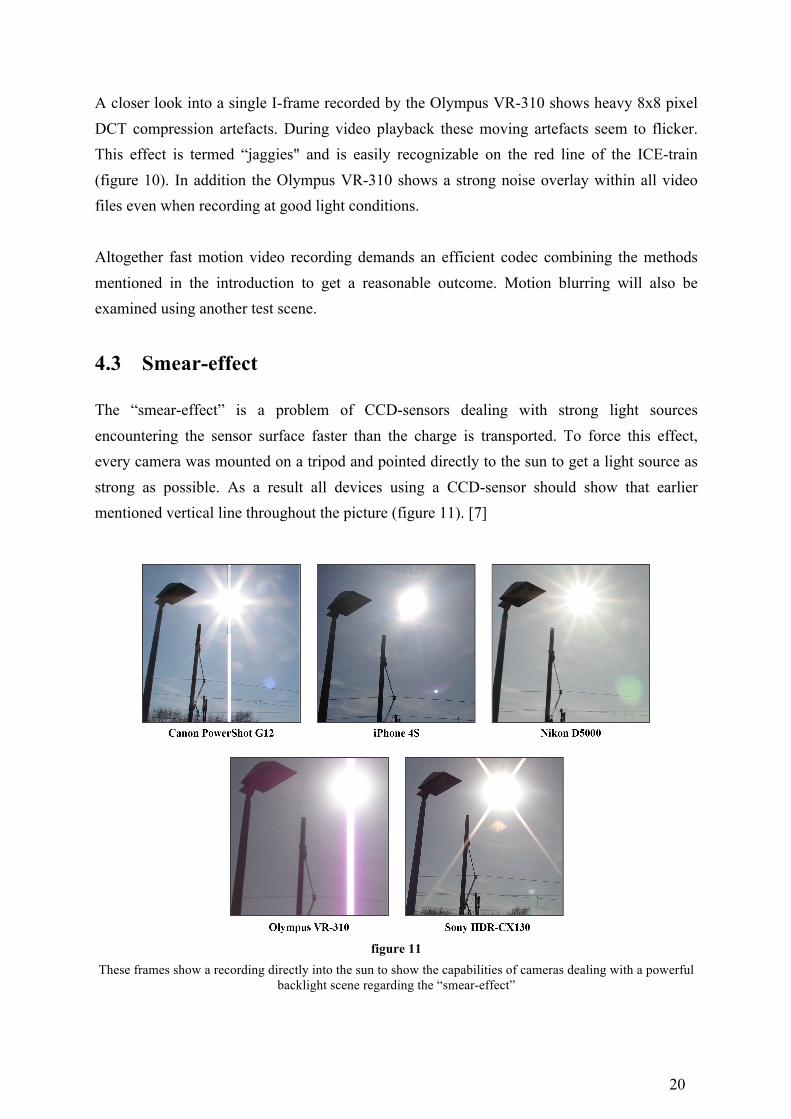
figure 10
This 300% enlargement shows the “jaggies” effect of the Olympus VR-310 recording fast motion
20
A closer look into a single I-frame recorded by the Olympus VR-310 shows heavy 8x8 pixel DCT compression artefacts. During video playback these moving artefacts seem to flicker. This effect is termed “jaggies" and is easily recognizable on the red line of the ICE-train (figure 10). In addition the Olympus VR-310 shows a strong noise overlay within all video files even when recording at good light conditions. Altogether fast motion video recording demands an efficient codec combining the methods mentioned in the introduction to get a reasonable outcome. Motion blurring will also be examined using another test scene.
4.3 Smear-effect
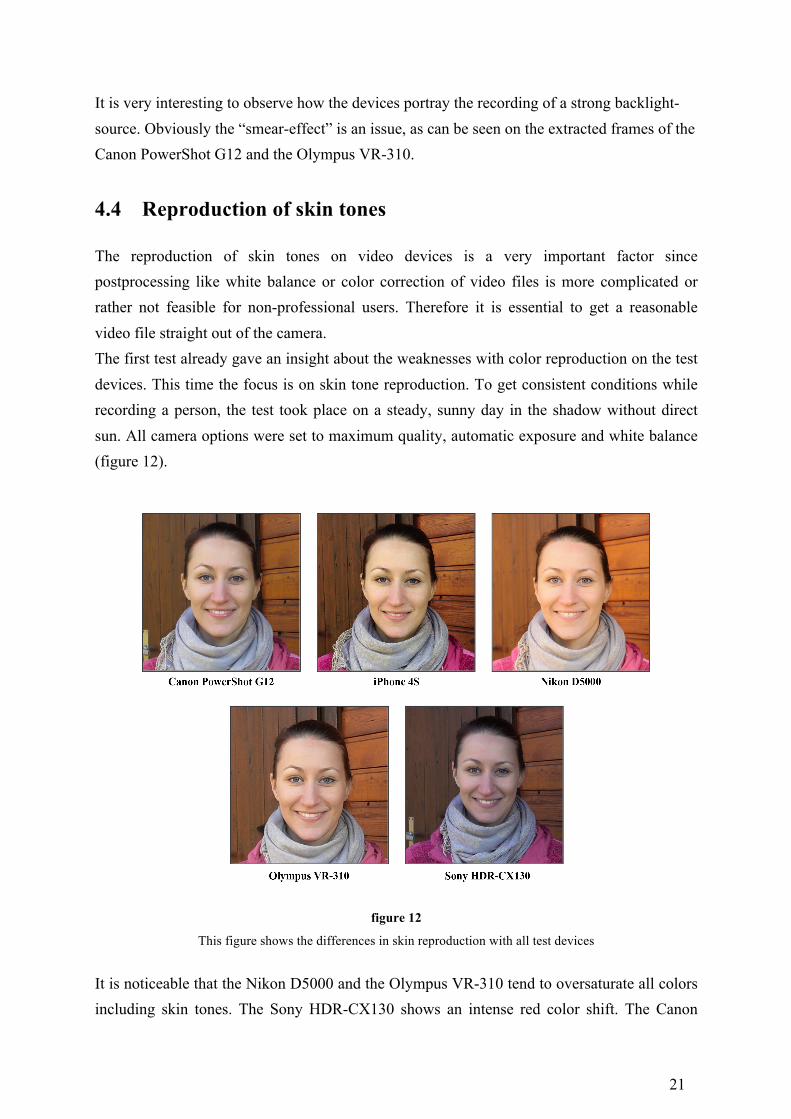
The “smear-effect” is a problem of CCD-sensors dealing with strong light sources encountering the sensor surface faster than the charge is transported. To force this effect, every camera was mounted on a tripod and pointed directly to the sun to get a light source as strong as possible. As a result all devices using a CCD-sensor should show that earlier mentioned vertical line throughout the picture (figure 11). [7]
figure 11 These frames show a recording directly into the sun to show the capabilities of cameras dealing with a powerful
backlight scene regarding the “smear-effect”
21
It is very interesting to observe how the devices portray the recording of a strong backlight-source. Obviously the “smear-effect” is an issue, as can be seen on the extracted frames of the Canon PowerShot G12 and the Olympus VR-310.
4.4 Reproduction of skin tones
The reproduction of skin tones on video devices is a very important factor since postprocessing like white balance or color correction of video files is more complicated or rather not feasible for non-professional users. Therefore it is essential to get a reasonable video file straight out of the camera. The first test already gave an insight about the weaknesses with color reproduction on the test devices. This time the focus is on skin tone reproduction. To get consistent conditions while recording a person, the test took place on a steady, sunny day in the shadow without direct sun. All camera options were set to maximum quality, automatic exposure and white balance (figure 12).
figure 12
This figure shows the differences in skin reproduction with all test devices It is noticeable that the Nikon D5000 and the Olympus VR-310 tend to oversaturate all colors including skin tones. The Sony HDR-CX130 shows an intense red color shift. The Canon

22
PowerShot G12 did the best job and looks very natural. Even if this test focuses on skin tone reproduction it is very striking that there is also a problem dealing with exposure. The difference between the Sony and the Nikon device is severe. The very unequal visualization of the wooden cottage in the background also helps to classify the poor color calibration of most devices. Assuming the recording of Canon PowerShot G12 as neutral, the color distance (∆E) between the Canon and all other devices is calculated with the formula (4): [8]
∆𝐸 = (𝐿!"#$%& − 𝐿!"#)! + (𝑎!"#$%& − 𝑎!"#)! + (𝑏!"#!"# − 𝑏!"#)! (4) with L (Luminance) a (red-green components) b (blue-yellow components) [8]
The color sample was taken on the forehead of the model using Photoshop to get the Lab-values. Substituting the values in the formula it leads to the following results: ∆E (Canon PowerShot G12 and Apple iPhone 4S) = 7,62 ∆E (Canon PowerShot G12 and Nikon D5000) = 12,37 ∆E (Canon PowerShot G12 and Olympus VR-310) = 6,48 ∆E (Canon PowerShot G12 and Sony HDR-CX130) = 15,07 The calculation is supposed to give a brief overview about the color distance between the devices without having a color reference measured at equal light sources in a laboratory.
4.5 The moiré-effect
One problem due to limited resolution and subsampling is the moiré-effect. If very fine patterns within a scene strike the sensor of a camera or video device at a certain angle, there might be a visual effect called moiré. This happens when the sampling theorem is violated. Subsampling within a codec can also cause this effect, which expresses itself by showing non-existing patterns on areas where the sampling-theorem is violated (figure 1). Anti-aliasing filter installed in almost every camera device ensure the reduction of this effect. Every anti-aliasing filter however is a compromise because reducing local resolution by low-passing the picture leads to a blurry impression. A powerful filter will eliminate every moiré-structure within a picture at the expense of resolution. A weak filter on the other hand does not prevent moiré. [6][7] A model wearing a shirt with a fine lengthwise-striped pattern was recorded to force the moiré-effect. Therefore the model was placed at different distances to the devices and instructed to move the upper part of the body in several ways to see the transition of the moiré-pattern. In addition the model was asked to start walking slowly towards the camera
23
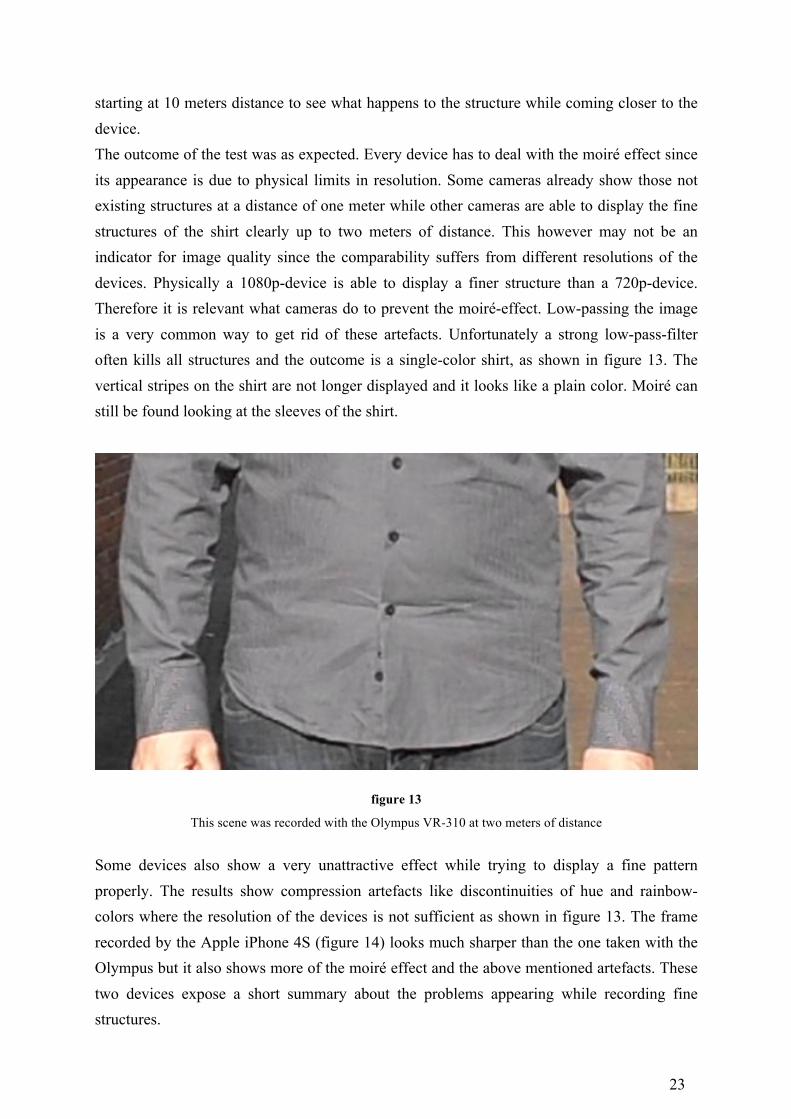
starting at 10 meters distance to see what happens to the structure while coming closer to the device. The outcome of the test was as expected. Every device has to deal with the moiré effect since its appearance is due to physical limits in resolution. Some cameras already show those not existing structures at a distance of one meter while other cameras are able to display the fine structures of the shirt clearly up to two meters of distance. This however may not be an indicator for image quality since the comparability suffers from different resolutions of the devices. Physically a 1080p-device is able to display a finer structure than a 720p-device. Therefore it is relevant what cameras do to prevent the moiré-effect. Low-passing the image is a very common way to get rid of these artefacts. Unfortunately a strong low-pass-filter often kills all structures and the outcome is a single-color shirt, as shown in figure 13. The vertical stripes on the shirt are not longer displayed and it looks like a plain color. Moiré can still be found looking at the sleeves of the shirt.
figure 13
This scene was recorded with the Olympus VR-310 at two meters of distance Some devices also show a very unattractive effect while trying to display a fine pattern properly. The results show compression artefacts like discontinuities of hue and rainbow-colors where the resolution of the devices is not sufficient as shown in figure 13. The frame recorded by the Apple iPhone 4S (figure 14) looks much sharper than the one taken with the Olympus but it also shows more of the moiré effect and the above mentioned artefacts. These two devices expose a short summary about the problems appearing while recording fine structures.

24
figure 14
This scene was recorded with the Apple iPhone 4S at three meters of distance showing moiré
While the moiré-effect with digital still cameras is quite disturbing, video devices have to deal with even more interferences because a recorded video shows some kind of shifting moiré-effect, which really grabs the viewers’ attention. For that reason, lots of cameras eliminate this effect at the expense of local resolution.
4.6 Aliasing-effect and compression artefacts
The aliasing-effect also occurs when the resolution of the device is not high enough to display very fine structures. In contrast to the moiré-effect, aliasing also arises when there is no pattern within the scene but only fine structures, which cannot properly be displayed by the device. Moving details are also vulnerable to the aliasing-effect. Therefore the chosen test scene was a panorama close to the river Rhine. The fast moving water and waves offer enough structures and moving details to push the devices to their limits. The sun generated reflections on the water and provided even more details. [2] Surprisingly most cameras did not show any aliasing artefacts while recording the moving water. Even though there are severe differences in video quality. On the one hand the Olympus VR-310 simply ignores fine details by applying its low-pass-filter to eliminate every alias structure while on the other hand the Apple iPhone 4S profits from its resolution and delivers a clear and sharp video file of the moving water as seen in figure 15. Another method of the Olympus VR-310 is a noise-overlay. Even on daylight scenes, which do not require any
25
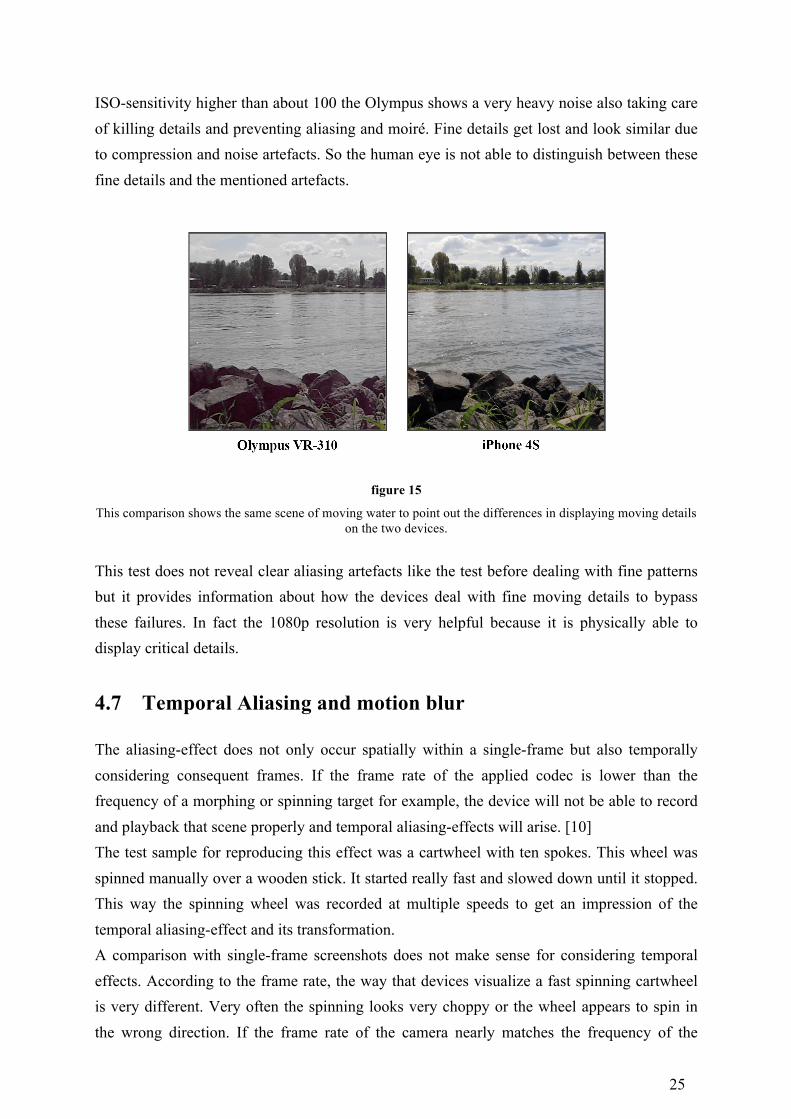
ISO-sensitivity higher than about 100 the Olympus shows a very heavy noise also taking care of killing details and preventing aliasing and moiré. Fine details get lost and look similar due to compression and noise artefacts. So the human eye is not able to distinguish between these fine details and the mentioned artefacts.
figure 15
This comparison shows the same scene of moving water to point out the differences in displaying moving details on the two devices.
This test does not reveal clear aliasing artefacts like the test before dealing with fine patterns but it provides information about how the devices deal with fine moving details to bypass these failures. In fact the 1080p resolution is very helpful because it is physically able to display critical details.
4.7 Temporal Aliasing and motion blur
The aliasing-effect does not only occur spatially within a single-frame but also temporally considering consequent frames. If the frame rate of the applied codec is lower than the frequency of a morphing or spinning target for example, the device will not be able to record and playback that scene properly and temporal aliasing-effects will arise. [10] The test sample for reproducing this effect was a cartwheel with ten spokes. This wheel was spinned manually over a wooden stick. It started really fast and slowed down until it stopped. This way the spinning wheel was recorded at multiple speeds to get an impression of the temporal aliasing-effect and its transformation. A comparison with single-frame screenshots does not make sense for considering temporal effects. According to the frame rate, the way that devices visualize a fast spinning cartwheel is very different. Very often the spinning looks very choppy or the wheel appears to spin in the wrong direction. If the frame rate of the camera nearly matches the frequency of the

26
passing spokes, the wheel seems to spin very slow or even stand still. These effects are unfortunately hard to eliminate because the frame rate of a camera device is a limiting factor. Even the Sony HDR-CX130 being the only camera equipped with a codec capturing 50 frames per second (instead of 24 or 30 like the other devices) does not show a real difference with the spinning object. The reason for this behaviour might be the high number of 33 predicted frames between the Intraframes of the Sony device interpolating the original data. Thereby a comparison of the frame rates between the cameras is of little significance for the playback quality. It rather depends on the number of predicted and bidirectional predicted frames. Another factor, which affects the impression of fast moving or rotating scenes, is motion blurring. It happens when the shutter speed is set too long to freeze a fast movement within one single frame like shown in figure 16.
figure 16
The spinning wheel was recorded by all devices at approximately the same speed (manually operated) The Canon PowerShot G12 shows the most striking motion blurring of the test devices. Comparing the spokes leads to the conclusion that very different shutter speeds are used within the cameras. Besides motion blurring, the rolling-shutter-effect occurs on CCD-sensors.
27
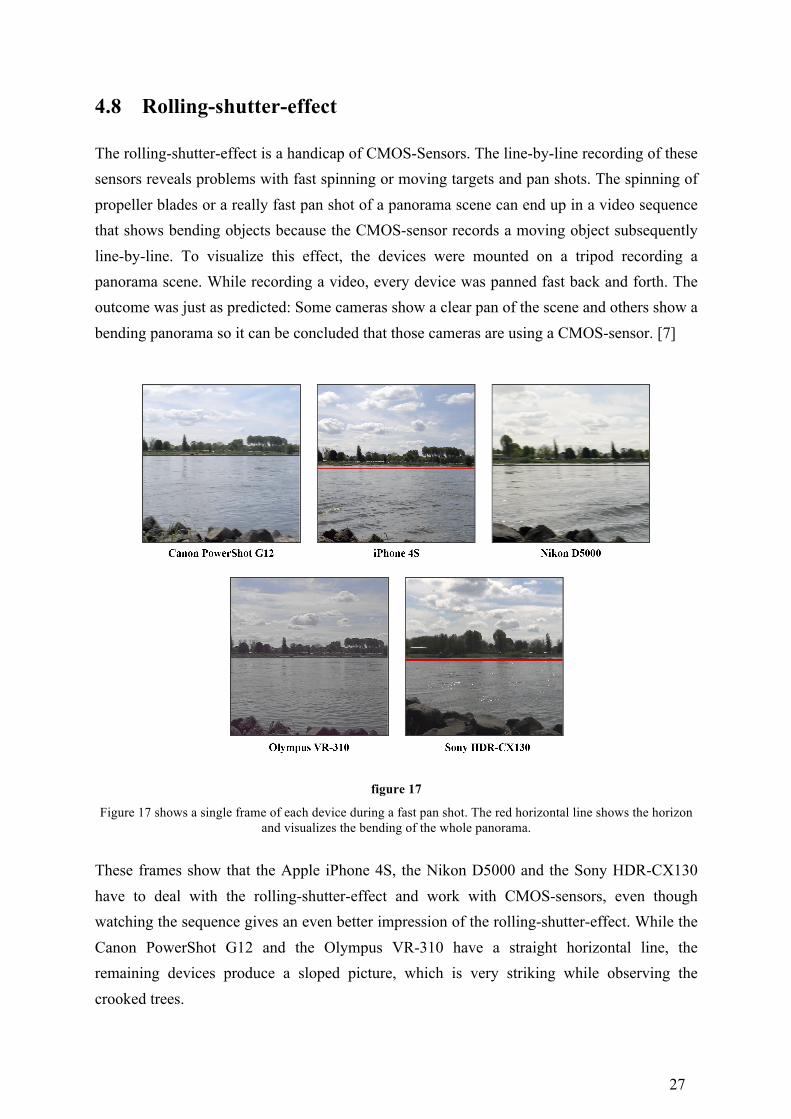
4.8 Rolling-shutter-effect
The rolling-shutter-effect is a handicap of CMOS-Sensors. The line-by-line recording of these sensors reveals problems with fast spinning or moving targets and pan shots. The spinning of propeller blades or a really fast pan shot of a panorama scene can end up in a video sequence that shows bending objects because the CMOS-sensor records a moving object subsequently line-by-line. To visualize this effect, the devices were mounted on a tripod recording a panorama scene. While recording a video, every device was panned fast back and forth. The outcome was just as predicted: Some cameras show a clear pan of the scene and others show a bending panorama so it can be concluded that those cameras are using a CMOS-sensor. [7]
figure 17
Figure 17 shows a single frame of each device during a fast pan shot. The red horizontal line shows the horizon and visualizes the bending of the whole panorama.
These frames show that the Apple iPhone 4S, the Nikon D5000 and the Sony HDR-CX130 have to deal with the rolling-shutter-effect and work with CMOS-sensors, even though watching the sequence gives an even better impression of the rolling-shutter-effect. While the Canon PowerShot G12 and the Olympus VR-310 have a straight horizontal line, the remaining devices produce a sloped picture, which is very striking while observing the crooked trees.
28
4.9 Wobble-effect
Another effect produced by cameras using CMOS-sensors is the wobble-effect. Not only fast pan shots or rotating scenes are an issue but also a high frequent wobble of the device itself leads to unnatural looking video sequences. As expected it affects the same devices like in the previous test. To force this error the devices were mounted on a small flexible tripod (Gorilla Pod) and fixed on a car dashboard right behind the windshield. The car was started and slowly accelerated using a high gear to create a natural shaking scene. The devices using a CCD-sensor reproduce the shaking of the car in the video file while the cameras equipped with CMOS-sensors produce an unnatural oscillation. Unfortunately this effect cannot be visualized by a screenshot of the video so it is important to watch the video data to get a clear impression. Indeed the wobble-effect is an issue while cameras are mounted on shaking or vibrating objects.
4.10 Rolling-Shutter-flicker
According to the configured frame rate by a codec and the shutter speed, which is unfortunately rarely changeable on consumer devices, there is an issue while recording a scene illuminated by a fluorescent tube working with a specific frequency. If the frame rate or the shutter speed of a device interferes with the frequency of a fluorescent tube, which usually works with 50 or 60 Hertz (Hz), a flicker or wave is recognizable in the video. Whether such interferences appear, overlaying the video file, once more depends on the sensor architecture of the camera. Both visual effects have the same origin but express themselves in different ways. The recurring waves from top to bottom can only occur on CMOS-sensors due to the line-by-line recording with long exposure times while the flicker can be assigned to CCD-sensors. [7] The test setup consists of two identical fluorescent light sources located in the basement without any daylight. All cameras were mounted on a tripod and a video was taken with four different light intensities by switching one light source off and covering parts of the remaining light source. This video was taken without having the light sources near the test scene. It was noticeable that the rolling-shutter-flicker appeared more often when the scene is illuminated very well so the cameras use a shorter exposure time. Therefore another video was taken right next to the light source and one more recording the light source itself. The results revealed that every device except the Sony HDR-CX130 shows the rolling-shutter-flicker effect in at least one scene and lighting situation. As expected the effect expresses itself accordingly to the sensor architecture. The Nikon D5000 and the Olympus VR-310 delivered the worst performance. Using these cameras the effect is already clearly
29
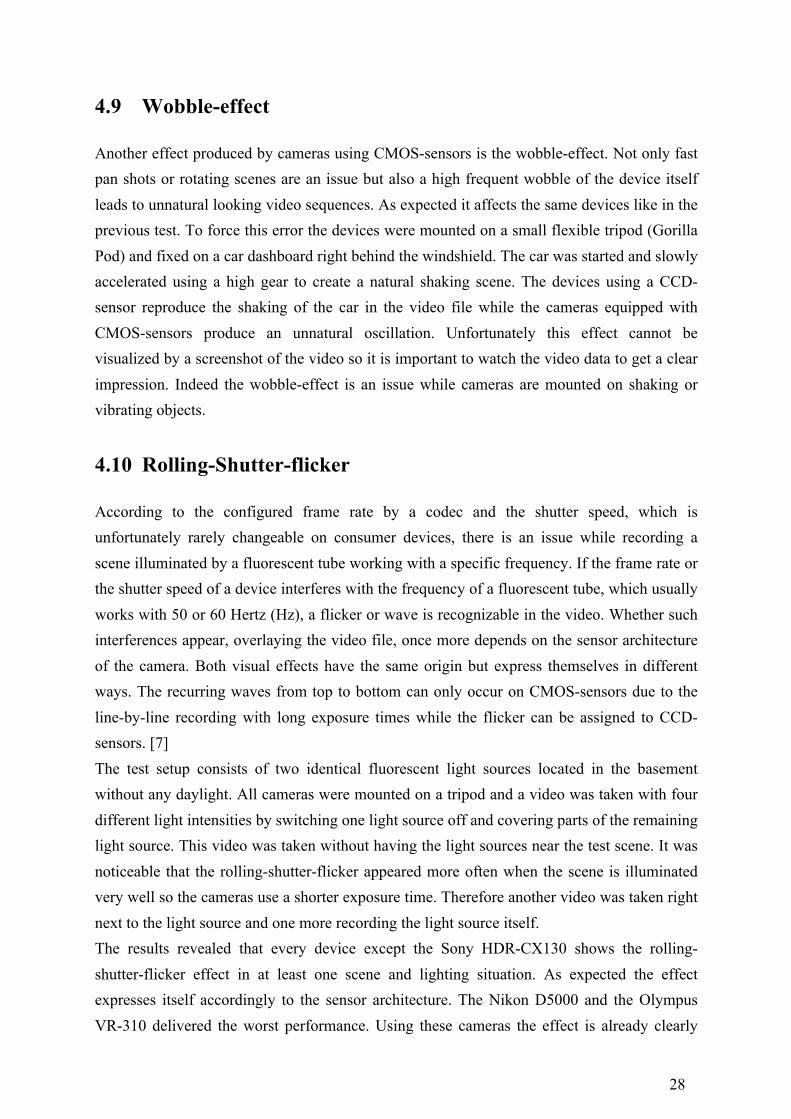
visible with very low light. The Canon PowerShot G12 shows a flicker only if the scene is well lit or if the camera directly pointed into the light source.
figure 18
This extracted frame was recorded with the Apple iPhone 4S, which shows the rolling-shutter-flicker effect only when recording the light source itself. The waves (in this case yellow) are clearly recognizable.
In conclusion almost every device has to deal with the interferences caused by such light sources. However it is noticeable that some devices are more sensitive to this effect while others are able to eliminate the flicker except when recording the light source itself. The Sony HDR-CX130 benefits from its frame rate of 50 frames per second, which prevents the flicker in this scene.
4.11 Low-light performance
An essential part of camera skills is the low light performance. There are many situations with very little light like parties, wedding ceremonies or just some nice scenes during or after sunset. Therefore cameras should be equipped with a sensor featuring a high sensitivity to perform reasonable recording of those kinds of scenes. Unfortunately most consumer devices set the ISO-sensitivity itself and refuse providing information about the applied setting. Nevertheless the amount of noise and the behaviour of the devices with low light conditions are visible. The test scenario was a bathroom with a closed shutter and a dimmable light source to get different light intensities. In addition a model was placed in the room to get better information about the color reproduction while recording low light situations. The first light setting was
30
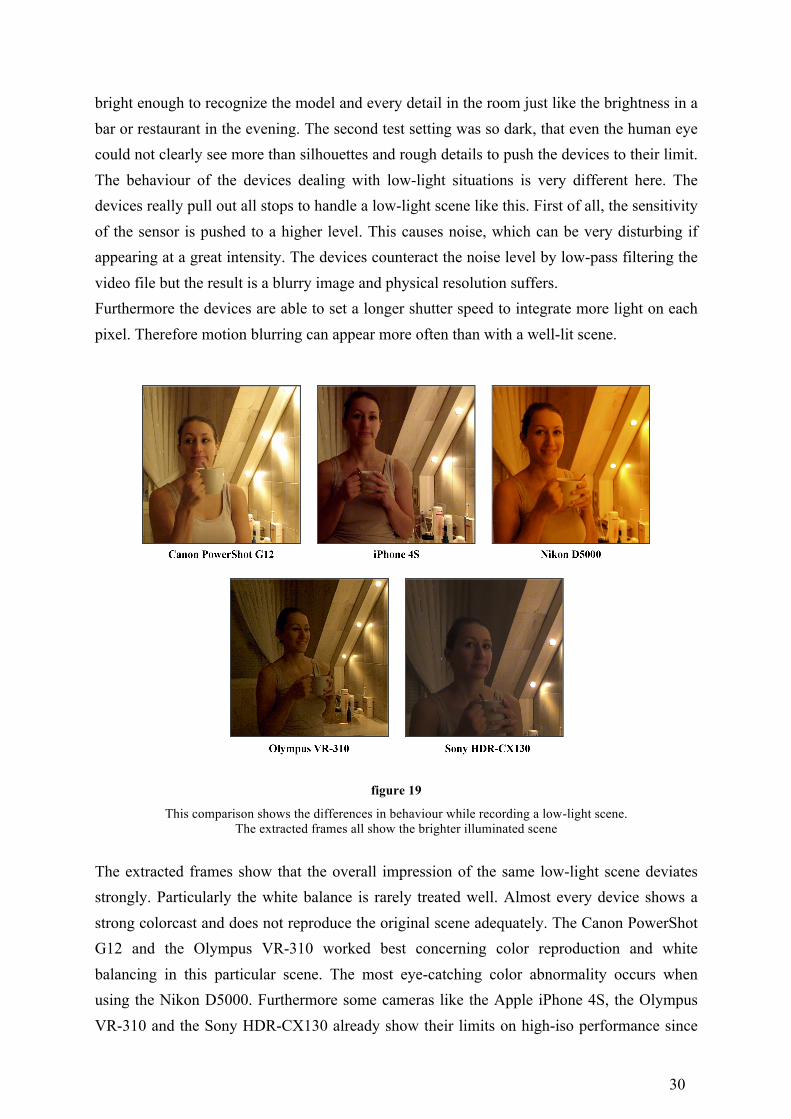
bright enough to recognize the model and every detail in the room just like the brightness in a bar or restaurant in the evening. The second test setting was so dark, that even the human eye could not clearly see more than silhouettes and rough details to push the devices to their limit. The behaviour of the devices dealing with low-light situations is very different here. The devices really pull out all stops to handle a low-light scene like this. First of all, the sensitivity of the sensor is pushed to a higher level. This causes noise, which can be very disturbing if appearing at a great intensity. The devices counteract the noise level by low-pass filtering the video file but the result is a blurry image and physical resolution suffers. Furthermore the devices are able to set a longer shutter speed to integrate more light on each pixel. Therefore motion blurring can appear more often than with a well-lit scene.
figure 19
This comparison shows the differences in behaviour while recording a low-light scene. The extracted frames all show the brighter illuminated scene
The extracted frames show that the overall impression of the same low-light scene deviates strongly. Particularly the white balance is rarely treated well. Almost every device shows a strong colorcast and does not reproduce the original scene adequately. The Canon PowerShot G12 and the Olympus VR-310 worked best concerning color reproduction and white balancing in this particular scene. The most eye-catching color abnormality occurs when using the Nikon D5000. Furthermore some cameras like the Apple iPhone 4S, the Olympus VR-310 and the Sony HDR-CX130 already show their limits on high-iso performance since
31
they are not able to reproduce the brightness of the original scene and show a dark exposure. The noise level is consistently high, even though the Olympus VR-310 did the worst job on this, presenting a heavy intolerable noise level. All video files look blurry and sharpness is missing. After dimming the light even more, all devices reach their limit and only show some silhouettes and the spotlights. Altogether the low-light video recording has to deal with a lot of compromises but the overall performance of the consumer devices is very different.
4.12 Changes in light and white balance
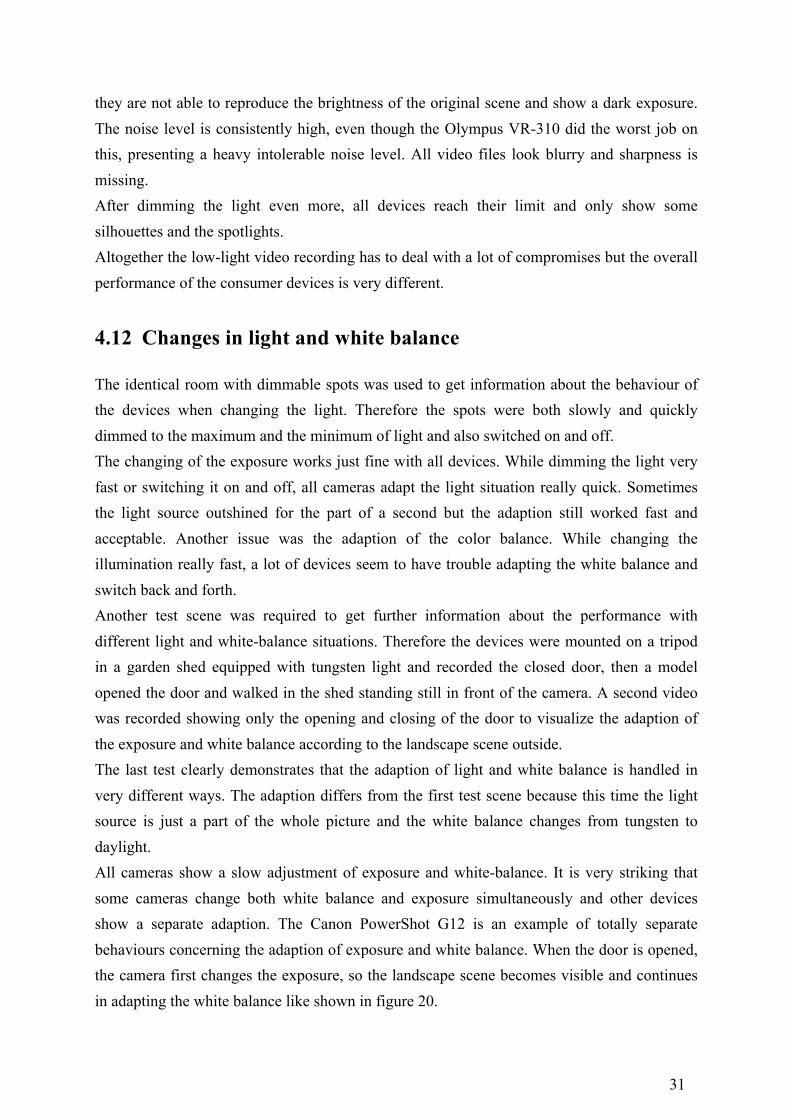
The identical room with dimmable spots was used to get information about the behaviour of the devices when changing the light. Therefore the spots were both slowly and quickly dimmed to the maximum and the minimum of light and also switched on and off. The changing of the exposure works just fine with all devices. While dimming the light very fast or switching it on and off, all cameras adapt the light situation really quick. Sometimes the light source outshined for the part of a second but the adaption still worked fast and acceptable. Another issue was the adaption of the color balance. While changing the illumination really fast, a lot of devices seem to have trouble adapting the white balance and switch back and forth. Another test scene was required to get further information about the performance with different light and white-balance situations. Therefore the devices were mounted on a tripod in a garden shed equipped with tungsten light and recorded the closed door, then a model opened the door and walked in the shed standing still in front of the camera. A second video was recorded showing only the opening and closing of the door to visualize the adaption of the exposure and white balance according to the landscape scene outside. The last test clearly demonstrates that the adaption of light and white balance is handled in very different ways. The adaption differs from the first test scene because this time the light source is just a part of the whole picture and the white balance changes from tungsten to daylight. All cameras show a slow adjustment of exposure and white-balance. It is very striking that some cameras change both white balance and exposure simultaneously and other devices show a separate adaption. The Canon PowerShot G12 is an example of totally separate behaviours concerning the adaption of exposure and white balance. When the door is opened, the camera first changes the exposure, so the landscape scene becomes visible and continues in adapting the white balance like shown in figure 20.
32
figure 20
This timeline is created with single frames extracted out of one video file, recorded with the Canon PowerShot G12. After 20 seconds the white balance of the closed door looks like the first picture.
This timeline points out that the adaption of exposure and white balance can take place separately. In this case it happened very lazy and slow. All devices act in a different way recording this test video. Some adapt exposure and white balance together while others change them separately.

33
5 Discussion It is in fact very insightful to test consumer devices in everyday life test scenes and get an idea of several problems they have to deal with. Many reported errors could be detected just as expected and are due to physical reasons. Additionally the observations allow interesting conclusions about the devices mechanisms to avoid these errors or artefacts. The first test scene, showing a house front with different colors and structures was suitable to get an overview of the camera skills such as exposure, white balancing, color reproduction and sharpness. The most striking differences were found in color reproduction and white balancing even though sharpness also seems to be an issue. Since color correction inn postproduction on video devices is not as simple as on digital still cameras, it is even more important to get proper video data directly out of the device. Image Engineering already developed a test chart named “TE42” (figure 21) for digital still cameras, which is suitable for measuring the Opto-Electronic Conversion Function (OECF), dynamic range, color reproduction quality, white balance, noise, resolution, shading, distortion and kurtosis. [17]
figure 21
This figure shows the test chart “TE42” [17]

34
These quality features are identical for video devices. Therefore this chart can serve extracted single frames out of video data as well. Unfortunately this chart has an aspect ratio of 4:3 while most video data is recorded in 16:9. Consequently, the values for distortion, shading and resolution in the edges will be slightly falsified. The fast motion test indicated that all devices work without any B-frames. The codecs also work quite well on all P-frames since there is no apparent difference between I-, and P-frames. The devices using the Motion JPEG codec had to stick with I-frames and applied a high compression ratio to handle its bitrate. Therefore they show a poor video quality and noticeable compression artefacts. Some devices also show motion blurring when objects are moving fast. A moving target with clear contours moving back and forth horizontally at variable speed could deliver an appropriate test scenario to get information about the differences between I-, P-, and B-frames as well as motion blurring. A very fast moving object containing a straight vertical line is able to visualize the rolling-shutter-effect on CMOS-sensors. Considering a single frame of the recording, the result will be a diagonal line instead of the original vertical line. The delta on the x-axis of this line from top to bottom can be extracted as a valuable indicator. The “smear-effect” indeed is another problem. The vertical line is clearly visible on all devices equipped with a CCD-sensor. The evaluation should be very easy, using a strong dimmable light source pointing directly into the lens of the device. The light intensity at which the smear-effect occurs can be referred to as a valuable indicator. Another aspect is the wideness and intensity of the vertical line. Taking a close look at skin tone reproduction is necessary because most consumer devices do not provide a lot of settings concerning white balancing. The test shows very different color reproductions of the recorded skin tone with the same lighting condition. Fortunately, the test chart TE42 includes a color checker containing skin tones as well as a photograph of models with different skin tones to get an impression about color reproduction. In this case, the color distance (ΔE) for skin tones is very valuable and can serve as an indicator. [17] The moiré-effect and aliasing structures appear more frequently than with digital still cameras since the resolution of video files in general is lower than on still images. Full HD cameras work with about 2 megapixels, while digital still cameras usually provide 6 megapixels or more. Therefore aliasing structures will appear more often while recording fine structures.
35
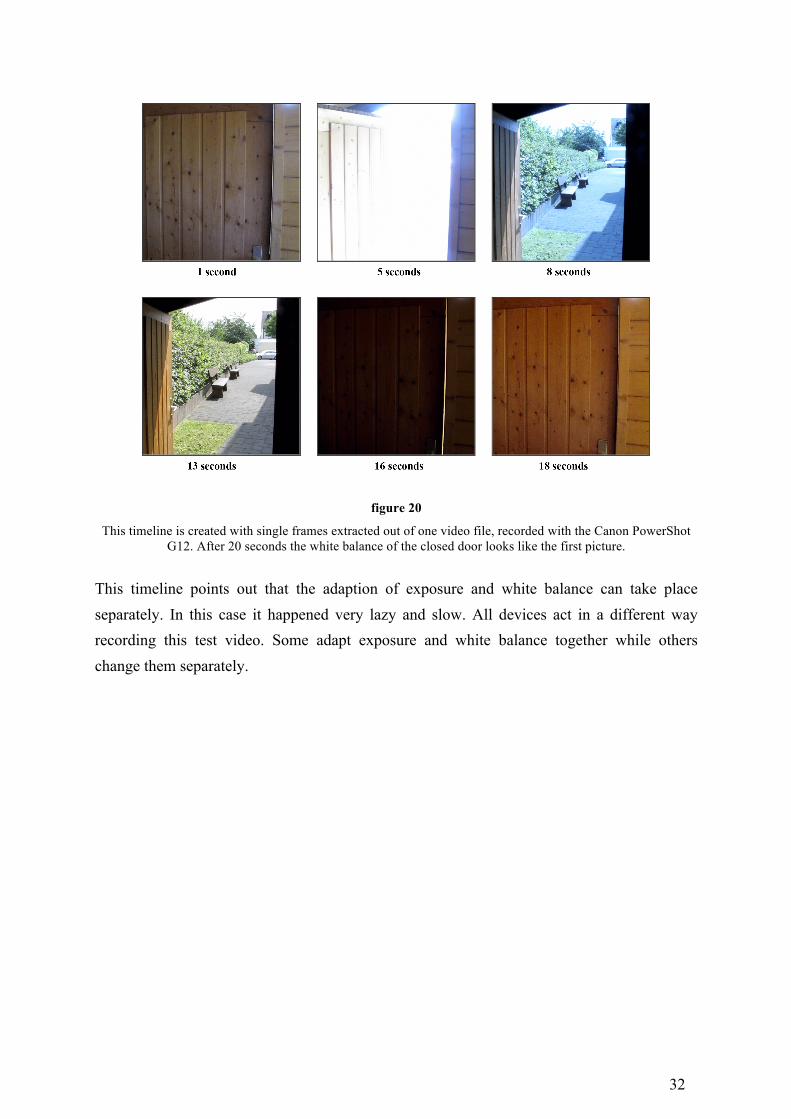
A suitable test scene could be a bricked wall recorded at different angles and distances or a fence with vertical or horizontal bars recorded diagonally to show the behaviour with increasing frequencies. The test chart TE42 although includes Siemens charts in the center and in the edges for a physical resolution measuring but the visualization of the strength of aliasing effects and shifting-moiré while recording a wall or fence would be capable for visual comparison. Spinning objects like a cartwheel, propeller or a even a round test chart able to spin at different speeds are capable to point out differences in motion blurring, temporal aliasing and rolling-shutter as well. The shutter speed can easily be tested by using the light-emitting diode (LED)-panel (figure 22) also developed by Image Engineering. Recording the LED-Panel while it is running at a certain speed (for example 1 millisecond per LED) and extracting a single frame will show multiple bright LEDs. The count of these LEDs will give information about the used shutter speed within a video file.
figure 22
The LED-Panel can be operated at different speeds where the LEDs light up one after another with an accuracy of more than one millisecond [9]
Every CMOS-device also shows the wobble-effect. It is clearly recognizable while mounted on a wobbling platform able to shake vertically at variable high frequencies and recording any
36
desired scene. To distinguish the intensity of this effect it is helpful to provide horizontal lines on the test scene and measure its shift on consecutive frames to get information about the amplitude and the frequency of the line-shift. There are also different lighting conditions that force problems with the testing devices. Recording a scene illuminated with a fluorescent tube can easily reproduce the rolling-shutter-flicker effect. Being able to switch between a 50 Hz and a 60 Hz tube will be interesting tests for different countries. According to the sensor architecture, the visualization of the effect will take place as a wave or a flicker. Almost every tested device showed the rolling-shutter-flicker effect, so this is sure worth testing. The intensity of the flicker can be measured by comparing the overall luminance of consecutive frames. Low-light performance concerning white balancing, noise level and exposure is another issue on all testing devices. Most cameras did not reproduce the low-lit tungsten scene properly. The test chart “TE42” can also give information about low-light performance if recorded with a low illumination. Moreover, it would be helpful to analyse movement and changing light sources to watch the behaviour of the devices according to the adaption of exposure, white balancing or temporal noise. Altogether all devices can be pushed to their limits and unfold their weaknesses in recording the given test scenes. Many errors like the rolling-shutter-effect produced by CMOS-sensors or aliasing effects appeared just as expected. Especially the lack of customizable settings leads to worse results concerning color reproduction and white balancing. Most errors can be tested with the given test charts and equipment already developed by Image Engineering but some video specific issues such as rolling-shutter, rolling-shutter-flicker, wobbling, temporal aliasing and motion blur are worth developing further charts and evaluation algorithms based on the work in this thesis.

37
Attachment
I Literature
[1] Prof. Dr.-Ing. U. Reimers. DVB – Digitale Fernsehtechnik, Datenkompression und
Übertragung. 3. Auflage, Springer-Verlag, Berlin Heidelberg New York, 2007
[2] Prof. Dr. U. Schmidt. Professionelle Videotechnik – Grundlagen, Filmtechnik 5. Auflage, Springer-Verlag, Dordrecht Heidelberg London New York, 2009
[3] J. Webers. Handbuch der Film- & Videotechnik.
8. Auflage, Franzis Verlag GmbH, Poing, 2007
[4] J. Böhringer, P. Bühler, P. Schlaich. Kompendium der Mediengestaltung. 4. Auflage, Springer-Verlag, Berlin Heidelberg, 2008
[5] R. Schmitz, R. Kiefer, J. Maucher, J. Schulze, T. Suchy. Kompendium Medieninformatik. 4. Auflage, Springer-Verlag, Berlin Heidelberg, 2008
[6] J. C. Whitaker, K. Blair Benson, Standard Handbook of Video and Television Engineering, 4th edition, McGraw Hill, New York, 2003
[7] Junichi Nakamura, Image Sensors and Signal Processing for Digital Still Cameras, CRC Press, Boca Raton, 2006
[8] Guarav Sharma, Digital Color Imaging Handbook, CRC Press, Boca Raton, 2002
[9] D. Wueller. Image Engineering digital camera tests. Version 1.0, Image Engineering, Frechen, 2006
[10] C. Poynton. “Motion portrayal, eye tracking, and emerging display technology.” Internet: http://www.poynton.com/PDFs/Motion_portrayal.pdf, Mar. 13, 1998 [March 10, 2012]
[11] C. Poynton. “Chroma subsampling notation.” Internet:
http://www.poynton.com/PDFs/Chroma_subsampling_notation.pdf, Jan. 24, 2008 [March 10, 2012]
[12] K. T. Mullen. (1984, Mar.) „The contrast sensitivity of human colour videon to red-green and blue-yellow chromatic gratings“. The Journal of Physiology. [Print]. 359, 381-400. Available: http://jp.physoc.org/content/359/1/381.full.pdf+html [Mar. 27, 2013]
38
[13] Recommendation ITU-R BT.709-5. „Parameter values for the HDTV standards for production and international programme exchange.“ International Telecommunication Union, 2009
[14] Recommendation ITU-T H.264 „Series H: Audiovisual and Multimedia systems. Infrastructure of ausiovisual services – Coding of moving video“ International Telecommunication Union, 2012
[15] Recommendation ITU-R BT.601-7 „Definition of signals used in the digital coding standards“ International Telecommunication Union, 2011
[16] “Shutter Speed vs Frame Rate.“ Internet:
http://www.mediacollege.com/video/camera/shutter/shutter-vs-fps.html, [March 10, 2012]
[17] “SEVEN IN ONE: The new ’Forty Two’.“ Internet: http://www.image-
engineering.de/index.php?option=com_content&view=article&id=423&Itemid=97, Aug. 9, 2010 [March 13, 2013]
[18] “Geizhals Preisvergleich. Internet: www.geizhals.at” [March 3, 2013] [p1] FFmpeg
http://www.ffmpeg.org
39
II List of abbreviations
[SLR] Single-Lens-Reflex (camera) [RGB] Red-Green-Blue (color channels) [SD] Secure Digital (memory card) [CF] CompactFlash (memory card) [AVI] Audio Video Interleave [MPEG] Moving Picture Experts Group [MOV] File extension of Quicktime-video [DivX] Digital Video Express [VGA] Video Graphics Array [HD] High Definition [CCD] Charge-Coupled Device [CMOS] Complementary Metal Oxide Semiconductor [fps] frames per second [Y] Luminance [Cr] Red-Green Chrominance [Cb] Blue-Yellow Chrominance [JPEG] Joint Photographic Expert Group [DVD] Digital Video Discs [DCT] Discrete cosine transform [I-frame] Intraframe [P-frame] Predicted frame [B-frame] Bidirectional predicted frame [GOP] Group of pictures [DC] direct current

40
[AC] alternating current [VCEG] Video Coding Expert Group [Hz] Hertz [kb/s] kilobytes per second [1080p] 1920 x 1080 pixels [720p] 1280 x 720 pixels [ΔE] Color Difference (here: in “Lab” color space) [OECF] Opto-Electronic Conversion Function [LED] light-emitting diode

Eidesstattliche Erklärung Ich versichere hiermit, die vorgelegte Arbeit in dem gemeldeten Zeitraum ohne fremde Hilfe verfasst und mich keiner anderen als der angegebenen Hilfsmittel und Quellen bedient zu haben. Köln, den 18. April 2013 Unterschrift (Timo Michael Kirsten)