Unsupervised Visual and Textual Information Fusion in CBMIR Using Graph-Based Methods
35
Unsupervised Visual and Textual Information Fusion in Multimedia Retrieval - A Graph-based Point of View * Gabriela Csurka 1 , Julien Ah-Pine 2 , and Stéphane Clinchant 1 1 Xerox Research Centre Europe, 6 chemin de Maupertuis , 38240, Meylan France , [email protected] 2 University of Lyon 2, ERIC Lab, 5, avenue Pierre Mendes France , 69676 Bron Cedex, France, [email protected] Abstract Multimedia collections are more than ever growing in size and diversity. Effective multimedia retrieval systems are thus critical to access these datasets from the end-user perspective and in a scalable way. We are interested in repositories of image/text multimedia objects and we study multimodal information fusion techniques in the context of content based multimedia information retrieval. We focus on graph based methods which have proven to provide state-of-the-art performances. We particularly examine two of such methods : cross-media similarities and random walk based scores. From a theoretical viewpoint, we propose a unifying graph based framework which encompasses the two aforementioned approaches. Our proposal allows us to highlight the core features one should consider when using a graph based technique for the combination of visual and textual information. We compare cross-media and random walk based results using three different real-world datasets. From a practical standpoint, our extended empirical analysis allow us to provide insights and guidelines about the use of graph based methods for multimodal information fusion in content based multimedia information retrieval. 1 Introduction With the continuous growth of communication technologies, the information that we consult, produce and com- municate whatever the communication device we use, has been richer and richer in terms of the media it is composed of. The web has particularly contributed to the production of such multimedia or multimodal data. For instance, web pages from news agencies websites are texts illustrated with pictures or videos; photo sharing websites, such as FlickR, store pictures annotated with tags; video hosting websites, such as Youtube, are again examples of multimedia data repositories. Apart from the web, we have also witnessed the development of new services that rely on digital libraries made of data composed of several media. In museums for example, there are more and more multimedia applications using text, image, video and speech in order to better plunge the visitor into the historical context of the piece of art she is consulting. New generations of television devices now propose on-line interactive media, on-demand streaming media and so on. The ever-growing production of multimodal data has brought the multimedia research community to address the problem of effectively accessing multimedia repositories from the end-user perspective and in a scalable way. Accordingly, multimedia data search has been a very active research domain for the last decades. There are different ways to search a multimedia repository. As for videos or images datasets such as Youtube or FlickR, we typically index those media by means of the title, metadata, tags or text associated to or surrounding them. Then, we search those multimodal objects by using text queries and text based search engines. There are different reasons we use text to retrieve videos or images. Firstly, it is not always possible for the user to query a collection by examples, since the search engine cannot always provide her with videos or images that represent the * An extended version of the paper Visual and Textual Information Fusion in Multimedia Retrieval using Semantic Filtering and Graph based Methods, by J. Ah-Pine, G. Csurka and S. Clinchant, submitted to ACM Transactions on Information Systems. 1 arXiv:1401.6891v1 [cs.IR] 27 Jan 2014
-
Upload
independent -
Category
Documents
-
view
5 -
download
0
Transcript of Unsupervised Visual and Textual Information Fusion in CBMIR Using Graph-Based Methods

Unsupervised Visual and Textual Information Fusion inMultimedia Retrieval - A Graph-based Point of View∗
Gabriela Csurka1, Julien Ah-Pine2, and Stéphane Clinchant1
1Xerox Research Centre Europe, 6 chemin de Maupertuis , 38240, Meylan France ,[email protected]
2University of Lyon 2, ERIC Lab, 5, avenue Pierre Mendes France , 69676 Bron Cedex,France, [email protected]
Abstract
Multimedia collections are more than ever growing in size and diversity. Effective multimedia retrievalsystems are thus critical to access these datasets from the end-user perspective and in a scalable way. Weare interested in repositories of image/text multimedia objects and we study multimodal information fusiontechniques in the context of content based multimedia information retrieval. We focus on graph based methodswhich have proven to provide state-of-the-art performances. We particularly examine two of such methods :cross-media similarities and random walk based scores. From a theoretical viewpoint, we propose a unifyinggraph based framework which encompasses the two aforementioned approaches. Our proposal allows us tohighlight the core features one should consider when using a graph based technique for the combination ofvisual and textual information. We compare cross-media and random walk based results using three differentreal-world datasets. From a practical standpoint, our extended empirical analysis allow us to provide insights andguidelines about the use of graph based methods for multimodal information fusion in content based multimediainformation retrieval.
1 IntroductionWith the continuous growth of communication technologies, the information that we consult, produce and com-municate whatever the communication device we use, has been richer and richer in terms of the media it iscomposed of. The web has particularly contributed to the production of such multimedia or multimodal data.For instance, web pages from news agencies websites are texts illustrated with pictures or videos; photo sharingwebsites, such as FlickR, store pictures annotated with tags; video hosting websites, such as Youtube, are againexamples of multimedia data repositories. Apart from the web, we have also witnessed the development of newservices that rely on digital libraries made of data composed of several media. In museums for example, there aremore and more multimedia applications using text, image, video and speech in order to better plunge the visitorinto the historical context of the piece of art she is consulting. New generations of television devices now proposeon-line interactive media, on-demand streaming media and so on. The ever-growing production of multimodaldata has brought the multimedia research community to address the problem of effectively accessing multimediarepositories from the end-user perspective and in a scalable way. Accordingly, multimedia data search has been avery active research domain for the last decades.
There are different ways to search a multimedia repository. As for videos or images datasets such as Youtubeor FlickR, we typically index those media by means of the title, metadata, tags or text associated to or surroundingthem. Then, we search those multimodal objects by using text queries and text based search engines. There aredifferent reasons we use text to retrieve videos or images. Firstly, it is not always possible for the user to query acollection by examples, since the search engine cannot always provide her with videos or images that represent the∗An extended version of the paper Visual and Textual Information Fusion in Multimedia Retrieval using Semantic Filtering and Graph
based Methods, by J. Ah-Pine, G. Csurka and S. Clinchant, submitted to ACM Transactions on Information Systems.
1
arX
iv:1
401.
6891
v1 [
cs.I
R]
27
Jan
2014

type of items she would like to retrieve. Secondly, videos or images are stored in machines into a computationalrepresentation consisting of low-level features which do not carry by their own the high level semantics. In otherwords, it is a strong challenge to effectively associate low-level features extracted from videos or images withhigh-level features such as keywords or tags without using pre-trained classifiers. This problem is known as thesemantic gap. As a consequence of those two difficulties, we generally use the text media for content basedmultimedia information retrieval (CBMIR) in order to have more relevant search results.
If the text is the core media to use in order to access a multimedia repository effectively, it is however bene-ficial to use other media in addition to the text, during the course of the search process. Indeed, most of researchworks about multimedia information fusion have shown that combining different modalities to address CBMIRtasks, even with simple strategies, is beneficial. In this paper we are interested in this topic. We particularlyaddress the combination of visual and textual information. We thus deal with repositories that are composed ofmultimedia objects made of an image associated with a text. There are different multimedia information fusionmethods and in this paper we are interested in graph based techniques. Such approaches became very popular inthe information retrieval community since the development of techniques like PageRank or Hits [10, 34, 36].
In a nutshell, the goals of this paper are the following ones :
• We discuss the semantic filtering method that seeks to enhance the similarities between multimedia itemswhen they are composed of both a visual and a textual part [16]. We explain how such a filter based on thetext query can better cope with the semantic gap in the case of CBMIR. We propose to use this approachas a first level of the fusion process of visual and textual information in our multimedia relevance model.Indeed, not only the proposed semantic filtering improves the similarity measures between multimediaitems but it also allows reducing the storage and computational complexities of graph based models.
• We study and compare two popular graph based multimedia information fusion methods that were orig-inally proposed in two different research communities. On the one hand, we analyze the cross-mediasimilarity approach initially proposed in [15, 14] for content based image retrieval in the context of Image-CLEF multimedia retrieval tasks. On the other hand, we investigate the random walk approach which wasinitially proposed in [31, 30] and used on several TRECVID tasks for content based video retrieval. Ourmain contribution in that perspective is to show that the two techniques are related. In fact, we propose aunifying framework that generalizes both approaches. This generalization allows us to better compare thetwo techniques, to propose a third approach which amounts to a mix of both latter methods, and it also aimsat examining the main points and settings when using graph based methods for the combination of visualand textual information in CBMIR.
• We analyze two different multimodal search scenarios. In the first scenario, we suppose that the user canonly use a text query in order to retrieve images. Multimedia objects of the repository are indexed usingtheir text part and a text based search engine is used in a first time. In a second time, we use the visualinformation of the (text based) retrieved objects in order to improve the search results. This multimediasearch scenario is referred along this paper as the asymmetric case since the user can only use a text query.In contrast, in the second scenario, the user can use a multimedia query which means that she can enter atext query accompanied with one or several images as examples of her information need. To this secondscenario we refer as the symmetric search scenario.
• We experiment with 3 different image/text datasets which have distinct features. We conduct many tests inorder to have a better analysis of the core points in the use of the graph based methods under study and inthe context of image/text multimedia retrieval. Our experimental results allow us to provide insights andguidelines about how to set the parameters of the unified graph based technique we propose.
The rest of this paper is organized as follows. In section 2 we review the main families of multimodalfusion approaches and their features. We take into consideration both the asymmetric and the symmetric searchscenarios. In section 3, we discuss the use of graph based methods to fuse visual and textual information andwe detail the cross-media similarities and the random walk based techniques which are the techniques understudy in this paper. Next, in section 4, we introduce the semantic filtering method which represents a core stepto refine multimedia similarities from a semantic standpoint, when textual information is available. Such anapproach amounts to a first level of multimedia information fusion and in addition, it also enables reducing thestorage and computational complexities of graph based methods. In section 5, in light of the material exposed in
2

sections 3 and 4, we introduce our multimedia relevance model that relies both on the semantic filtering guidedby the text query and an unifying graph based framework that embodies both cross-media similarities and randomwalks based scores. Then, we describe in section 6, the experimental settings we conducted on three real-worldmultimedia collections in order to validate our work. We introduce the image and text representations and themonomedia similarity matrices we used. In section 7, we present the experimental results we obtained with thedifferent tested fusion strategies in the goal of comparing cross-media similarities and random walk based scores.We finally discuss some other advantages of our proposal in terms of complexity as regard to large collectionsand we provide some guidelines on how to use the generalized graph based approach we propose. In section 8,we summarize our main findings.
2 Families of unsupervised multimedia fusion techniques in CBMIRA good introduction to the multimedia information access domain, its challenges and its basic techniques canbe found in [54] that covers the common topics in multimedia IR such as feature extraction, distance measures,supervised classification also known as automatic tagging and fusion of different experts. In this paper, we areparticularly interested in multimedia fusion techniques and the literature on this topic is very vast. In this sectionwe attempt to depict the main families of fusion methods for visual and textual information. It is important toprecise that we place ourselves in an unsupervised context meaning that we do not use any learning technique inour framework. We can mention at least two research communities that have been addressing this research topicactively. On the one hand, there are the research teams that have participated in the TRECVID workshop seriesand have focused their research efforts on video retrieval [57]. On the other hand, we can quote the researchgroups involved in the ImageCLEF meetings and which have been interested in the tracks related to image andmultimedia retrieval [45]. In the former research community it is usually assumed that the user does not haveany example query and the common way to search a multimedia collection rely solely on textual queries. On thecontrary, in the latter research community, it is generally assumed that the user information need is expressed bya multimedia query composed of an image query and a related text query. We present in the following, broadfamilies of multimedia fusion techniques that have been studied for the two distinct search scenarios.
Despite the fact that we focus on unsupervised multimedia fusion, we also point to some research papers thataddress multimedia fusion techniques from a supervised or a semi-supervised perspective and which show someconnections with our work.
2.1 The symmetric case with an image query and a text queryMost of the techniques developed in this context fall in three different categories : early, late and transmediafusion. We depict these three families of approaches by distinguishing the inherent steps they are composed of.This is summarized in Figure 1. In the following, we assume that the multimedia query can be considered similaras any item of the multimedia collection that is to say an object made of an image part and a text part. Givena multimedia query, the search process consists in measuring a multimedia similarity between the query and themultimedia items in the repository.
The early fusion approach represents the multimedia objects in a multimodal feature space designed via a jointmodel that attempts to map image based features to text based features and vice versa. The simplest early fusionmethod consists in concatenating both image and text feature representations (see e.g. [58, 18, 45]). However,more elaborated joint models such as Canonical Correlation Analysis have been investigated [43, 37, 60, 52].In the same vein, [41] presents an information theoretic framework that could also fit into this family of fusionapproaches.
On the contrary, late fusion and transmedia fusion strategies do not act at the level of the monomedia featurerepresentations but rather at the level of the monomedia similarities [15, 11]. In these contexts, we assume thatwe have effective monomedia similarities and that it is better to combine their respective decisions rather thanattempting to bridge the semantic gap at the level of the features.
Concerning late fusion techniques, they mainly seek to merge the monomedia relevance scores by means ofaggregation functions. In that case, the simplest aggregation technique used is the mean average [25] but moreelaborated approaches have been studied (e.g. [12, 45, 23, 65]).
3

Figure 1: Early, late and transmedia fusion.
As far as transmedia fusion methods are concerned, they act like similarity diffusion processes. The resultingcombination is non linear unlike most of late fusion techniques. These methods generally amount to mixingmonomedia similarity matrices by means of matrix multiplication operations [64, 47, 31, 15]. In that kind ofrelevance models, we usually start the diffusion process using pseudo-relevant items only. In that case, wetypically use the k nearest neighbors according to one monomedia relevance score and thus those methods arealso inspired from the pseudo-relevance feedback mechanism in information retrieval (see e.g. [55]).
It is important to mention that there are other ways to categorize the different multimedia fusion techniques.In the recent survey paper [67] for example, other terms are used. Nevertheless, they basically correspond to thedefinitions given above with the following mappings : early, late and transmedia fusion are named latent spacebased, linear fusion and graph based fusion in [67].
2.2 The asymmetric case with a text query onlyIn addition to the three previously recalled types of fusion methods, [67] cites another category named visualreranking. This fourth family of techniques assumes that multimedia collections are accessed using textual queriessolely. Therefore, in this context, there is an explicit asymmetry between image and text in the multimedia searchscenario.
Visual reranking techniques particularly deals with such a search scenario. They proceed in two steps : usingthe text query, they first use text based similarities in order to find the most relevant objects from a semanticviewpoint; then, they employ the visual similarities between objects of the database in order to refine the textualsimilarities based ranking. Similarly to Figure 1, we depict in Figure 2 the different main steps of visual rerankingapproaches.
The common assumption that all visual reranking techniques make is that visually similar images should havesimilar relevance scores [44]. However, different approaches are used to re-arrange the top retrieved items by thetext similarities in order to take this principle into account. According to [67], we can categorize visual rerankingtechniques into three subcategories : classification based, clustering based and graph based.
In the first case, pseudo-positive and pseudo-negative objects are sampled from the text based ranked list thena learning to rank algorithm is trained on the visual features (see e.g. [39] for a general reference on learning torank methods). Afterward, objects are re-ordered according to the scores provided by the trained classifier. Thecritical point is the sampling method used to select pseudo-training examples. The simplest strategy considers
4

Figure 2: Visual reranking.
items at the top of the list as pseudo-positive and items at the bottom as pseudo-negative but more sophisticatedapproaches have been proposed [59, 66, 44].
As for clustering based visual reranking, the main idea is to cluster the list of text based retrieved items andto re-arrange them such that objects that are visually highly similar and have high initial text retrieval scores arefavored [29, 30].
Graph based methods consider multimedia objects as nodes of a graph and the different types of relationshipsthey share as edges. Examples of weighted edges between objects are visual similarities or textual similaritiesbut depending on the application other types of relations can be considered. Graph analysis techniques are thenemployed in order to infer new features in the goal of re-arranging the text based ranked list of items. One suchmethod, inspired by the well-known PageRank [9, 36, 26] used to rerank web pages by search engines suchas Google, was proposed in [31, 30]. It is based on random walks over a stochastic matrix which is deducedfrom the fusion of visual and textual similarities, and the stationary probability distribution over the nodes is thenadditionally used to rerank the initial retrieved list. In the same vein, [21] proposed a Markov random walk modelwith backward and forward steps. They found out that the best performances were obtained with a long backwardwalk with high self-transition probability.
2.3 Graph based techniques in both search scenariosTransmedia fusion techniques we introduced in paragraph 2.1 are technically similar to graph based methodspresented in the previous paragraph. Indeed, both approaches use similarity matrices to respectively rank or rerankmultimedia items. Graph based methods have proven to be state-of-the-art techniques for many informationretrieval tasks (see e.g. [9, 36, 26]). In CBMIR too, they have demonstrated their advantages over early or latefusion approaches in many research works (see e.g. [45, 67]). We thus focus on such methods in this paper.
Besides, there has been very few research works that address CBMIR in a symmetric search scenario andusing graph based methods. Consequently, in this paper we study the different kinds of search scenarios withsuch techniques in order to have a better comparison between the asymmetric and the symmetric search scenariosin this context.
Before presenting in more details the two graph based fusion techniques we examine in the rest of the paper,we present in the next paragraph some additional references that also tackle multimedia information fusion and/ormultimedia retrieval but in other learning settings.
2.4 Multimedia fusion in a supervised or a semi-supervised contextWe review some related research papers that tackle video and image search from a multimodal perspective butemploying supervised or semi-supervised techniques. In [27] for example, the authors use hypergraph learning
5
to design a joint visual-textual representation of multimedia objects. This method amounts to an early fusionscheme. Another early fusion approach was presented in [46] and which addresses multimedia query expansionfor both the text and the image parts. This work relies on an intermediate representation of multimedia informa-tion in a predefined visual-concept lexicon. Classification models are used to map the queries to the lexicon. Thenbased on pseudo-relevance feedback different query expansion and score reranking methods are proposed. Simi-larly, [53] uses intermediate representation, in their case visual classifiers. To build these classifiers they downloadimages from Google or Bing using query words and represent these images by classemes (attribute-based imagedescriptors). In a second step, images in the web pages are classified using these classifiers and the scores areused to rerank the multimodal documents (in their cases the web pages). The reranking is also supervised as a setof training queries with relevance scores are used to learn the parameters of the latter algorithm.
Other related works that are worth mentioning are the following ones [62, 61, 63]. These papers addressvideo semantic annotation and web image search in a semi-supervised fashion. The general framework usedin these contributions is formulated as an optimization problem that simultaneously deal with the late fusion ofmonomedia similarity matrices and graph semi-supervised learning. The solutions of the optimization problemscan be formulated using normalized graphs Laplacian and iterated algorithms are proposed to infer the relevancescores which are further used for annotating videos or ranking images.
The main differences between these research works and our framework are the following ones : (i) we do notuse any learning models nor external resources (such as a domain ontology or downloaded image set) and weonly rely on the surrounding text of images which is a more general setting; (ii) we emphasize the transmediaprinciple in the diffusion process which mix the monomedia similarity matrices and relevance scores differentlyfrom late fusion; (iii) since no learning phase is required in our case we avoid the annotation burden and also thetime complexity problem underlying such methods.
After having introduced a classification of the most used unsupervised multimedia information fusion strate-gies and discussed some other related works, we introduce in the next section, the graph based fusion methodswe are going to embed in our multimedia relevance model.
3 Cross-media similarities and random walk based scoresWe recall two popular image/text graph based fusion techniques in CBMIR and we consider their use in the twodifferent search scenarios we recall previously. The first approach called cross-media similarities was proposed inthe context of ImageCLEF workshop series while the second method based on random walks and called contextreranking was used in TRECVID tasks.
For convenience, we introduce in Table 1 the notations we will use in the rest of the paper. Note that weassume that the different similarities or scores are all non negative numbers.
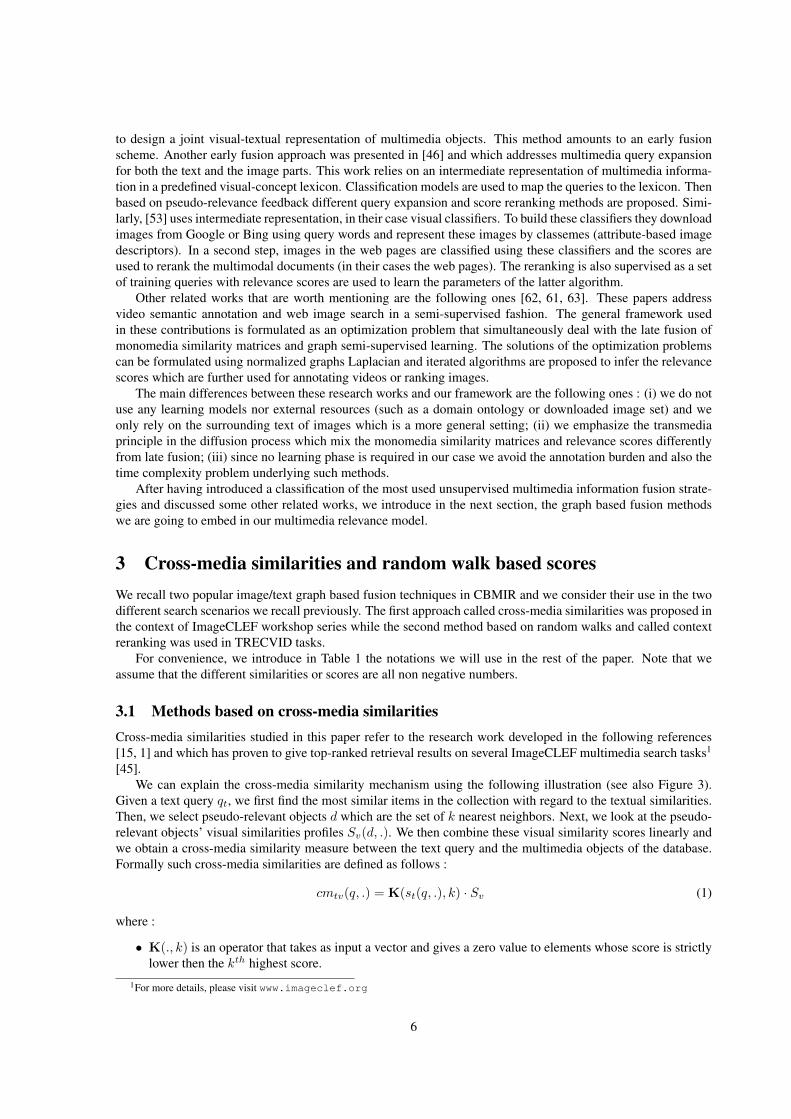
3.1 Methods based on cross-media similaritiesCross-media similarities studied in this paper refer to the research work developed in the following references[15, 1] and which has proven to give top-ranked retrieval results on several ImageCLEF multimedia search tasks1
[45].We can explain the cross-media similarity mechanism using the following illustration (see also Figure 3).
Given a text query qt, we first find the most similar items in the collection with regard to the textual similarities.Then, we select pseudo-relevant objects d which are the set of k nearest neighbors. Next, we look at the pseudo-relevant objects’ visual similarities profiles Sv(d, .). We then combine these visual similarity scores linearly andwe obtain a cross-media similarity measure between the text query and the multimedia objects of the database.Formally such cross-media similarities are defined as follows :
cmtv(q, .) = K(st(q, .), k) · Sv (1)
where :
• K(., k) is an operator that takes as input a vector and gives a zero value to elements whose score is strictlylower then the kth highest score.
1For more details, please visit www.imageclef.org
6

Notations Definitionsv Subscript indicating the visual part of an entityt Subscript indicating the textual part of an entity
q = (qv, qt) Multimedia query (which reduces to q = (qt) in the asymmetric search scenario)d = (dv, dt) Multimedia object in the database
n The number of multimedia objects or documents in the databasesv(q, .) Visual similarities (row) vector of q with all documents of the database (of size 1× n)st(q, .) Textual similarities (row) vector of q (of size 1× n)
l The number of top elements retained from st for semantic filtering.Sv Visual similarity (square) matrix between pairs of documents (of size n× n)St Textual similarity (square) matrix between pairs of documents (of size n× n)
sqt∗ , Sqt∗ Same as above but text query semantically filtered (of size 1× l and l × l)
K(., k) k nearest neighbor thresholding operator acting on a vectorx(i) Diffusion process iteration on the full graph, starting from the text modality (of size 1× n)y(i) Diffusion process iteration on the full graph, starting from the visual modality (of size 1× n)
xqt(i), yqt(i) Same as above but using the graph reduced with the qt based semantic filter (of size 1× l)
cmqttv, cm
qtvt Cross-media similarities corresponding to xqt(1) respectively to yqt(1)
rwqttv, rwqtvt Random walk based scores corresponding to xqt(∞) respectively to yqt(∞), with k = l
gdqttv, gdqtvt Generalized diffusion model corresponding to xqt(∞) respectively to yqt(∞), with k � l.
Table 1: Notations and definitions.
• The · symbol represents the regular matrix multiplication operation.
The previously introduced cross-media similarity, denoted cmtv(q, .), propagates the text similarities ofpseudo-relevant objects to their visual similarities which can be seen as a transmedia pseudo-relevance feed-back mechanism. This operation is non commutative and we can design a cross-media similarity, cmvt(q, .),propagating visual similarities to textual similarities, providing that we are also given an image query qv . Wethen obtain :
cmvt(q, .) = K(sv(q, .), k) · St (2)
These cross-media similarities attempt to bridge the semantic gap between visual and textual informationby enriching one modality by the other using monomedia nearest neighbors as proxies. Once the cross-mediasimilarities are computed we can linearly combine them with monomedia similarities as follows :
rsvcm(q, .) = αtst(q, .) + αvsv(q, .) + αtvcmtv(q, .) + αvtcmvt(q, .) (3)
where αt, αv, αtv, αvt are real parameters that sum to one.The formula given in Eq. 3 encompasses different particular sub-cases :
• αtv = αvt = 0, leads to the classic late fusion technique using a weighted mean as an aggregation function.
• αv = αvt = 0, gives a cross-media based approach to address CBMIR tasks in the context of the asym-metric case.
• αv = αtv = 0, is one particular combination that gave top-ranked results on different ImageCLEF tasks[15, 2, 3]. Indeed, it was already shown that the visual information is particularly beneficial through thecross-media cmvt scores that spread visual information to textual information.
Cross-media similarities draw inspiration from Cross-Media Relevance Models [32] and intermedia feedbackmethods proposed in [42]. For example, from an image query, a first visual similarity is computed and an initialset of (assumed) relevant objects is retrieved. As the objects are multimodal, each image has also a text part, andthis text can feed any text feedback method (other than relevance models). In other words, the modality of data isswitched, from image to text or text to image, during the (pseudo) feedback process. In that sense, cross-mediatechniques generalize the pseudo-feedback idea present in the cross-media relevance model.
7

Figure 3: Given a text query qt the cross-media relevance score can be computed as∑dj∈Nt(q)
st(q, dj) ·Sv(dj , di). Note that the sum is over the nearest neighbors of the “query”, hence the complementary visualinformation of the documents that are close to the query are exploited.
3.2 Methods based on random walksThe PageRank algorithm proposed in [9, 36, 26] has been an important step forward in development and successof search engines such as Google. It is therefore not surprising that multimedia information fusion based ongraph modeling using random walks has been addressed by several researchers [47, 31, 59, 40]. In this paper weparticularly study the method proposed in [31, 30]. In this approach, it is assumed that each image is a node of agraph and two images are linked with a weighted edge if there exists a multimodal contextual similarity betweenthem ((see also Figure 4). Depending on the application, the definition of such multimodal contextual similaritiescan vary. Typically, we assume that they are given by a linear combination of some visual and textual similarities.
The research work described in [31] deals with video retrieval. In the latter paper, the authors propose to usenear-duplicate detection measures as for visual similarities between video stories. Text similarities are derivedfrom automatic speech recognition and machine translation transcripts and measured by a mutual informationapproach.
In our perspective, we are concerned with image/text data and we assume generic image based and textbased similarity matrices which are respectively denoted Sv and St. Using the notations given in Table 1, themultimodal contextual similarity matrix according to [31], that we denote by C, can be interpreted as follows :
C = (1− β)Sv + βSt (4)
where β ∈ [0, 1].We then transform C into a stochastic matrix, denoted by P , by applying the following normalization opera-
tor2 :
P = D · C (5)
where D is the diagonal matrix of size n× n, with general term D(i, i) = 1/∑nj=1 C(i, j) and D(i, j) = 0 for
all i 6= j.The general term P (i, j) is interpreted as the probability to go from “state” i to “state” j where these indices
respectively refer to documents di and dj . We then compute the random walk’s stationary probability distributionover the documents. Such graph based measures are then employed to rerank the list retrieved by the text based
2Note that before normalization, P can be sparsified, i.e. only top pairwise similarities are considered for each document as shown inFigure 4. When P is fully computed, it means that the context of each document is the whole dataset.
8

Figure 4: Given a text query qt the new relevance score can be computed as st(q, di) + st(q, di) +∑dj∈Nv(di)
st(q, dj) · Sv(dj , di). Note that in contrast to the cross-media, the sum is over the nearest neigh-bors of the document di, hence the visual (or multi-modal if P = (1−β)Sv +βSt are considered) context of thedocument di is exploited.
scores. However, to further fuse visual and textual information, the random walk is biased towards documentswith higher textual similarity values with the text query. In other words, we add a prior based on the text scoresin the random walk process. Note that such a prior can also be interpreted as a restart process or a personalizationvector in other information retrieval tasks.
Formally, if we denote by x(i) the row vector of size 1 × n of the state probabilities at iteration i then wehave :
x(i) = (1− γ)x(i−1) · P + γst(q, .) (6)
where γ ∈ [0, 1].In order to obtain the state stationary distribution, we iterate the previous updating equation until convergence
which yields to the following definition :
x∞ = (1− γ)x∞ · P + γst(q, .) (7)
In [31] only the asymmetric search scenario with a text query solely was treated. In this paper, we considerthe extension of this approach when we are also given an image query. Accordingly, we use a similar randomwalk process but with a prior depending on the initial image based scores sv(q, .) and define the related stationarydistribution :
y∞ = (1− γ)y∞ · P + γsv(q, .) (8)
Let us denote rwtv(q, .) = x∞ and rwvt(q, .) = y∞. We can linearly combine these graph based scores withthe initial monomedia similarities and design the following final relevance score :
rsvrw(q, .) = αtst(q, .) + αvsv(q, .) + αtvrwtv(q, .) + αvtrwvt(q, .) (9)
We can consider the following particular cases :
• αvt = αtv = 0, leads to the classic late fusion technique as for cross-media similarities.
• αt = αv = αvt = 0, is a combination that reduces to rwtv . It assumes the asymmetric search scenario andwas tested3 in [31].
3This combination was named FRTP in [31]
9

Figure 5: Top retrieved images with CBIR and CBMIR for the topic 22 at ImageCLEF Wikipedia Challenge2010.
• αv, αvt > 0, is, to our knowledge, a new extension of the method which assumes the symmetric searchscenario.
Before analyzing further the two graph methods we have introduced, we discuss in the sequel, an importantaspect of the combination of visual and textual information in CBMIR. Our multimedia retrieval model, we aregoing to introduce in section 5, results from the materials described both in the present and the next sections.
4 Text query based semantic filtering of multimedia similaritiesWe first underline the particular importance of textual similarities between the text query qt and the text part ofmultimedia items of the database when addressing CBMIR tasks. Our observations lead us to propose the textbased semantic filtering of multimedia similarities that we argue to be a crucial pre-processing step in CBMIR andthus in our multimedia retrieval model. As we shall see, this approach is similar in spirit to the visual rerankingparadigm. However, in our perspective, we generalize the latter concept by applying yhe semantic filtering notonly to the visual similarities between the query and the documents in the collection but also to any similarities weemploy in our fusion model, such as visual or textual similarities between the documents in the collection. Beforeformally stating the text query based semantic filtering method, we provide the rationale of such an approach bydiscussing the semantics conveyed by textual similarities as compared to visual similarities.
When text is used as query, only a few keywords are usually provided. In contrast, when an image is usedas query, “all the information it contains” is provided to the system. It is generally said that “a picture is wortha thousand words” but in the context of information retrieval, which word(s) is meant when an image is used asa query ? Content based image retrieval (CBIR) systems attempt to find similar images of an image query froma visual standpoint but in most cases the user is rather interested in some underlying semantic meanings of theimage query.
To illustrate this ambiguity, let us consider the example given in Figure 5. With regard to this topic, weprovide the results obtained with a CBIR system which only uses an image query and also the ones provided by aCBMIR system which uses both visual and textual information. If we only use the image query, we can see thatthe CBIR system retrieves visually similar images but these latter items are in fact irrelevant to the informationneed of the user. Indeed, the text query associated with this topic is “shark underwater”. The images retrieved bythe CBIR system show a blue background with, most of them, objects with a fish-like shape. However, none ofthese images contains a shark. There is a semantic mismatch between the user’s information need and the imagesretrieved by the CBIR system. On the contrary, the images retrieved by the CBMIR system contain sharks formost of them even if their visual similarity values with the image query are lower than the ones given by theCBIR system. As a result, the list retrieved by the CBMIR system is more relevant because the text query givesthe semantic meaning of the images the user is interested in unlike the CBIR system.
In this paper, we apply the semantic filtering method described in [16]. This filtering operator aims at se-mantically correcting visual similarities between two multimedia items by using their textual similarities and thisapproach already showed to lead to better results in CBMIR. The semantic operator defined in [16] amounts to
10

filtering visual scores as follows :
sqtv (q, d) =
{sv(q, d) if d is in the top l list according to st(q, .)0 otherwise (10)
The number of selected documents we consider (the nearest neighbors) is equal to l = min(nnz(st(q, .)),m)),where nnz(st(q, .)) corresponds to the number of non zero textual scores given the query q, andm is a maximumnumber of documents which are considered to be pseudo-relevant (m = 1, 000 in our experiments).
If image reranking [6, 51] implicitly uses a similar approach, filtering is essentially thought of as a pragmaticway to combine text and image scores, as the text is only used to select the documents to be ranked and the rankingis done by the visual scores. Here, we adopt the view of [16] where the filtering step similarly used to select thedocuments to be considered, but after the visual scores are recombined with the textual scores for a final ranking.This fundamental difference lead [16] to the following method : after having semantically filtered the visualsimilarities sv(q, .) in order to obtain sqtv (q, .), a late fusion approach scheme based upon the weighted meanbetween sqtv (q, .) and st(q, .) was used to rank and it was showed that such an approach outperforms other latefusion methods and also the basic visual reranking method4. Similarly, here we use the filtering to pre-select thedocuments on which we apply our relevance models. We argue that there is an inherent ambiguity when one usevisual query and filtering is thought of as a way to correct visual similarities and to specify an information need.We admit newertheless that this approch has the limitation of ignoring (loosing) relevant visual documents withno textual or irrelevant textual information. Newertheless, note that our textual filtering step uses text retrievaltechniques that goes beyound simple keyword matching (see appendix A) and is able to retrieve documents thathave semantic similarity with the query (usinge.g. lexical entailement and query expansion).
Hence, in this paper, we extend [16] by using the semantic filtering strategy in the context of graph basedmethods. We propose to apply this filtering scheme to any multimedia scores and similarities before employing agraph based relevance model. We thus use the top l list given by st(q, .) to semantically filter all other similaritymatrices and relevance scores. Indeed, we have previously argued that text based relevance scores are usuallybetter in retrieving relevant documents in CBMIR. Therefore, we want to favor the top l list given by st(q, .)in any similarities and relevance scores involved in the fusion process. To this end, we apply the same kind ofsemantic filter given in Eq. 10 not only to sv(q, .) but also to Sv , St and st(q, .) itself. As a consequence, weintroduce the following text query based semantically filtered visual similarities5 :
Sqtv (d, d′) =
{Sv(d, d
′) if d and d′ are in the top l list according to st(q, .)0 otherwise (11)
Similarly, we respectively define text query based semantically filtered sqtt (q, .) and Sqtt as follows :
sqtt (q, d) =
{st(q, d) if d is in the top l list according to st(q, .)0 otherwise (12)
Sqtt (d, d′) =
{St(d, d
′) if d and d′ are in the top l list according to st(q, .)0 otherwise (13)
Therefore, in what follows, the vectors sqtt (q, .) and sqtv (q, .) are sparse and contain only l � n non zeroelements. Similarly, each row of the matrices Sqtt and Sqtv only contains l non zero6
Moreover, since we are only interested in the top l list provided by the text relevance scores, we can alsoremove from Sqtt and Sqtv the rows and columns of items that do not belong to this list. As a consequence, in
4Note that the method proposed in [16] amounts to linearly combining the visual reranking scores and the textual scores, which makesthis method different from the visual reranking techniques presented in paragraph 2.2. Indeed in the latter case the top selected documents areranked based on their visual similarity, while the former ranks the documents based on the fused scores and has been shown to yield a muchbetter retrieval performance.
5Note that while the retrieval process using such similarities is not any more pure visual retrieval, the similarities scores themselvesSqtv (d, d′) are purely visual similarities computed between the visual signatures of d and d′.
6The main idea is that given a query the top l documents are selected from the collection and the rest of the collection is not considered.In terms of matrix representation Sqt
v is a sparsification of Sv where elements (i, j) of the matrix are set to zero except the ones where bothdi and dj are amongst the top l selected ones. The non-zero elements of Sqt
v form an lxl sub-matrix of Sv . In the case of the text the aim isless the semantic alignement but the sparsification makes the computational cost feasible for large scale datasets.
11
practice, in order to alleviate the memory and time complexities of graph based techniques, when we computethe relevance and similarity values with respect to a text query qt, we consider sqtt (q, .) and sqtv (q, .) as vectors ofsize 1× l and St and Sv as matrices of size l × l.
Consequently, the semantic filtering approach not only allows one to better bridge the semantic gap but italso dramatically improves the memory complexity since we only need to store matrices of size O(l2) instead ofO(n2). Furthermore, as we discussed in the previous section, graph based methods rely on diffusion processeswhich, from an algebraic viewpoint, are materialized by matrix multiplication operations. Since this calculationhas a cubic computation complexity with respect to the size of the matrix, the semantically filtered techniqueenables reducing the time complexity of the graph based methods as well, notably from O(n3) to O(l3). Overall,this method makes the graph based techniques scalable for very large multimedia repositories. From a moretheoretical standpoint, we introduce in the sequel our multimedia relevance model which makes use of the textquery based semantic filtering as a core principle and which relies on an unifying framework for graph basedtechniques that encompasses the methods we have detailed in section 3.
5 A unifying framework using semantic filtering and graph based meth-ods
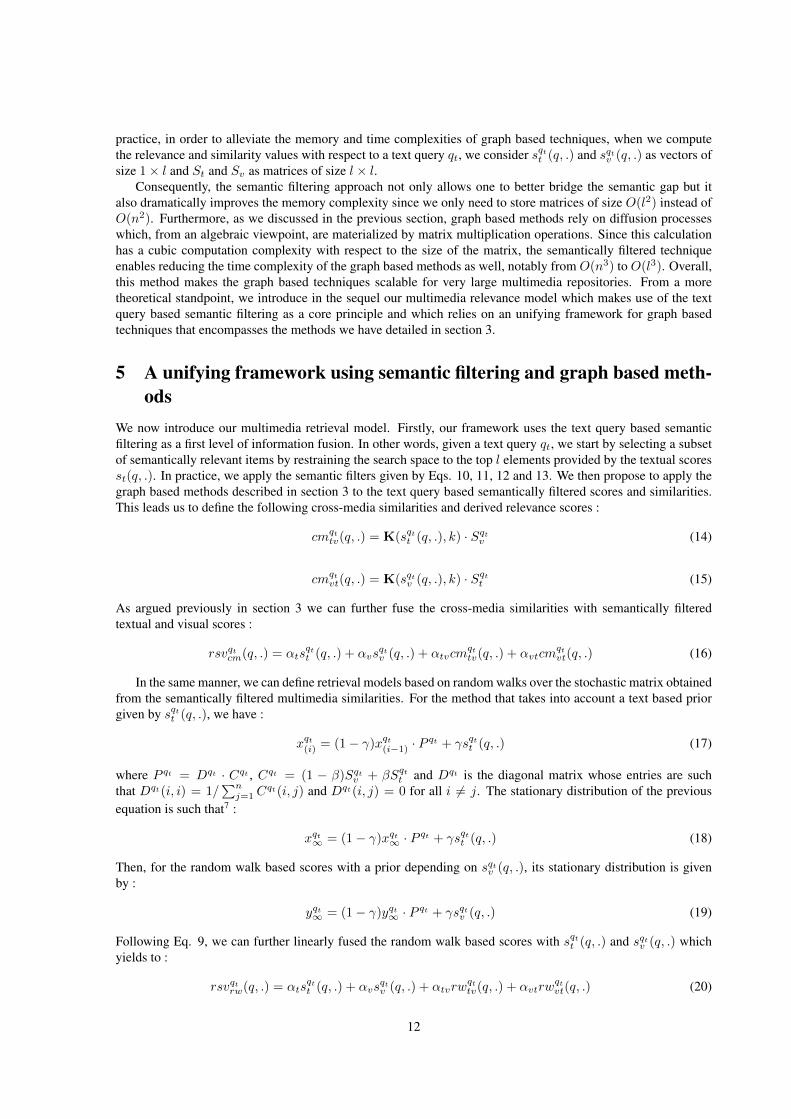
We now introduce our multimedia retrieval model. Firstly, our framework uses the text query based semanticfiltering as a first level of information fusion. In other words, given a text query qt, we start by selecting a subsetof semantically relevant items by restraining the search space to the top l elements provided by the textual scoresst(q, .). In practice, we apply the semantic filters given by Eqs. 10, 11, 12 and 13. We then propose to apply thegraph based methods described in section 3 to the text query based semantically filtered scores and similarities.This leads us to define the following cross-media similarities and derived relevance scores :
cmqttv(q, .) = K(sqtt (q, .), k) · Sqtv (14)
cmqtvt(q, .) = K(sqtv (q, .), k) · Sqtt (15)
As argued previously in section 3 we can further fuse the cross-media similarities with semantically filteredtextual and visual scores :
rsvqtcm(q, .) = αtsqtt (q, .) + αvs
qtv (q, .) + αtvcm
qttv(q, .) + αvtcm
qtvt(q, .) (16)
In the same manner, we can define retrieval models based on random walks over the stochastic matrix obtainedfrom the semantically filtered multimedia similarities. For the method that takes into account a text based priorgiven by sqtt (q, .), we have :
xqt(i) = (1− γ)xqt(i−1) · Pqt + γsqtt (q, .) (17)
where P qt = Dqt · Cqt , Cqt = (1 − β)Sqtv + βSqtt and Dqt is the diagonal matrix whose entries are suchthat Dqt(i, i) = 1/
∑nj=1 C
qt(i, j) and Dqt(i, j) = 0 for all i 6= j. The stationary distribution of the previousequation is such that7 :
xqt∞ = (1− γ)xqt∞ · P qt + γsqtt (q, .) (18)
Then, for the random walk based scores with a prior depending on sqtv (q, .), its stationary distribution is givenby :
yqt∞ = (1− γ)yqt∞ · P qt + γsqtv (q, .) (19)
Following Eq. 9, we can further linearly fused the random walk based scores with sqtt (q, .) and sqtv (q, .) whichyields to :
rsvqtrw(q, .) = αtsqtt (q, .) + αvs
qtv (q, .) + αtvrw
qttv(q, .) + αvtrw
qtvt(q, .) (20)
12

Figure 6: Pre-processing, text query based semantic filtering and normalization.
In Figure 6, we depict the first feature of our multimedia retrieval model which applies the text query basedsemantic filtering to the query and to the multimedia items of the database.
The second feature of our multimedia retrieval model aims at defining a unifying framework for graph basedmethods that encompasses the diffusion processes strategies underlying both the cross-media similarities and therandom walk based scores. Note that in order to embed these two approaches in the same model, we assumethat all similarities have been normalized so that we manipulate probability distributions. Henceforth, we assumethat sqtt (q, .), sqtv (q, .), and rows of Sqtt and the ones of Sqtv have non negative values and that they all sum toone8. This constraint is due to the random walk method but the cross-media approach does not initially requiresuch a normalization and other possibilities exist. We will come back to this point later on in section 7.3. Thenormalization step occurs just after the text query based semantic filtering and just before applying graph basedmethods as depicted in Figure 6.
To establish our unifying graph based model, let us start by studying the random walk approach a little bitdeeper and let us consider the following formula :
xqt∞ = (1− γ)xqt∞ · P qt + γxqt∞ · e · sqtt (q, .) (21)
where e is the l × 1 vector full of 1.In the previous equation, the sub-part xqt∞ ·e reduces to 1 since xqt∞ is a probability distribution. Therefore Eq.
21 and Eq. 18 are strictly equivalent. But, in Eq. 21, we can factorize the term xqt∞ to obtain :
xqt∞ = xqt∞ · [(1− γ)P qt + γe · sqtt (q, .)] (22)
Let us introduce the following matrix of size l × l:
Qqttv = (1− γ)P qt + γe · sqtt (q, .) (23)
Using this matrix, Eq. 22 can be re-written as xqt∞ = xqt∞ · Qqttv . The solution of this equation is the same
as the solution of (xqt∞)> = (Qqttv)> · (xqt∞)> where the right superscript > states for the transpose operation on
vectors and matrices. From the latter relation we see that the stationary probability distribution of the random7Denoted in [31] by PRTP8This amounts to dividing the row vectors by their L1 norms.
13

walk is related to an eigen-decomposition problem [36]. Indeed, xqt∞ is clearly the eigenvector of (Qqttv)> asso-
ciated to the eigenvalue 1. Since Qqttv is a stochastic matrix, 1 is the highest eigenvalue. As a result, xqt∞ is theleading eigenvector of (Qqttv)
>. One efficient way to compute the leading eigenvector of a square matrix is thepower method [36]. Thus, in practice, we iterate the following equation until convergence in order to determinerwqttv(q, .) :
(xqt(i))> = (Qqttv)
> · (xqt(i−1))> (24)
Since xqt(0) is a probability distribution then so are the vectors xqt(i), i > 0 and xqt∞ represents the stationarydistribution which is proportional to the leading eigenvector of Qqttv .
Let us now consider the following general formula :
xqt(i) ∝ K(xqt(i−1), k) · [(1− γ)Dqt · (βSqtt + (1− β)Sqtv ) + γe · sqtt (q, .)] (25)
xqt(0) = sqtt (q, .)
xqt(.) can be interpreted as a generalized diffusion process with a text based prior. From the previous development(Eqs. 23 and 24), we can see that rwqttv(q, .) can be derived from Eq. 25 given by the limit vector xqt∞ when weuse k = l as K(xqt(i−1), l) is equivalent to xqt(i−1) (no operator K is applied). In this case, the random-walk isguaranteed to converge and the limit value does not depend on the initialization.
We can see that the generic case Eq. 25 combines the idea of considering only a few nearest neighbors in thediffusion process as in the case of the cross-media, while doing several iterations (until stability) as in the caseof the random walk. To avoid confusion, we will refer to this approach as the generalized diffusion model anddenote it by gdqttv .
When k < l, we do not have a theoretical guarantee of the convergence of the diffusion process. However, wehave experimentally observed that after several iterations the scores became stable. It seems that the set of top kdocuments remains unchanged throughout the different iterations. In this case, Eq. 25 becomes quasi-equivalentto a power iteration as formalized by Eq. 24 but with the corresponding reduced graph of size k × k. Indeed,we can see that the zeros in K(xqt(i−1), k) will eliminate from Qqttv , the rows corresponding to the documents notselected by the operator K. Concerning the columns corresponding to these documents, while they contribute tocreate xqt(i), the scores corresponding to them will be ignored in the next step when we will apply the operator Kon xqt(i) (note that we assumed that the set of top k documents do not change any more in the iterations).
Note that the generalization of the random walk process with the K operator is new in the literature andwe are not aware of any similar work. It is indeed different from the Link Reduction by k nearest neighbors(PRTP-KNN) proposed in [31], where the k nearest neighbors are considered for each node in the graph. Thiscan be seen as a sparsification of the matrix Sqt where in each row and column only the k highest values are keptnon-zero. We did not considered and tested such sparsification in our experiments, as the best PRTP-KNN yieldsthe same results as PRTP.
On the other hand, let us now consider γ = 0, which cancels the prior given by the text based scores; β = 0,which cancels the text based similarity matrix in the convex combination in Eq. 17; and let us iterate Eq. 25 onlyonce (i = 1). In this particular setting xqt(1) actually corresponds to the cross-media similarity cmqt
tv(q, .) given inEq. 14.
From these previous observations, we have shown that Eq. 25 is a general graph based approach whichgeneralizes both rwqttv(q, .) and cmqt
tv(q, .) methods.Similarly, we propose the following formula that allows us to generalize the symmetric relations rwqtvt(q, .)
and cmqtvt(q, .) :
yqt(i) ∝ K(yqt(i−1), k) · [(1− γ)Dqt · (βSqtv + (1− β)Sqtt ) + γe · sqtv (q, .)] (26)
yqt(0) = sqtv (q, .)
In that case, yqt(.) is a generalized diffusion process with a semantically filtered image based prior. In the rightmember of Eq. 26, what formally changes as compared to Eq. 25, is the substitution of t by v and vice versa.However, as stated in the introduction, this formula allows one to consider the symmetric search scenario that hasbeen less investigated in the context of the random walk approach. In such a case, we suppose not only a textquery but also an image query and we can thus consider using the random walk technique for multimedia fusion
14

Figure 7: Unified view of graph based methods and our multimedia retrieval model.
using a semantically filtered visual based prior. Indeed in Eq. 26, we obtain a random walk based techniquebiased towards sqtv (q, .) that will converge to rwqtvt(q, .) = yqt∞ given by Eq. 19.
As far as the cross-media based approach is concerned, we obtain the already defined cmqtvt(q, .) in Eq. 15
from the Eq. 26 by using γ = 0, which cancels the prior given by the image based scores; β = 1, which cancelsthe image based similarity matrix in the convex combination and we iterate Eq. 26 only once (cmqt
vt(q, .) = yqt(1)).This unifying framework encompasses the cross-media similarities and the random walk based method for
CBMIR. Eq. 25 and Eq. 26 allow us to have a better understanding of the main differences between these twotechniques from a conceptual point of view. However, our proposal suggests more than a simple comparison ofthose two approaches, it invites to a deeper analysis of what are the key points when using graph based techniquesin CBMIR.
We depict in Figure 7 the unified formulation of graph based approaches that we have introduced previouslyaccompanied with the preliminary semantic filtering and normalization steps. Overall, this schema represents themultimedia retrieval model we propose in this paper.
In the following sections, we experiment with the proposed multimedia retrieval model in the case of contentbased image/text multimedia retrieval. We will particularly focus on the comparison of three orientations of ourframework :
• the one that leads to cross-media similarities : cmqttv = xqt(1) and cmqt
vt = yqt(1);
• the one that reduces to random walk based scores : rwqttv = yqt(∞), rwqtvt = yqt(∞) and k = l, meaning that
we do not use the operator K;
• and the generalized diffusion model : gdqttv = yqt(∞), gdqtvt = yqt(∞) and k � l.
6 Experimental settingsFirstly, we describe the real-world datasets we applied the different tested techniques to. Then, we introduce theimage and text representations and similarities we used in our experiments.
15

6.1 DatasetsWe conducted our experiments on real-world collections which are constituted of image/text items. The first twodatasets were used in the ImageCLEF Photo or Wikipedia retrieval tasks9 while the last one was constituted inorder to assess web image search techniques10. We give below the description of these repositories and the tasksthey were meant to address, according to the respective websites that present them.
- The IAPR dataset was used in the context of ImageCLEF 2008 [28]. “The image collection of the IAPR TC-12 Benchmark consists of 20,000 still natural images taken from locations around the world and comprisingan assorted cross-section of still natural images. This includes pictures of different sports and actions,photographs of people, animals, cities, landscapes and many other aspects of contemporary life. Eachimage is associated with a text caption in up to three different languages (English, German and Spanish) .These annotations are stored in a database which is managed by a benchmark administration system thatallows the specification of parameters according to which different subsets of the image collection can begenerated.”
- The Wikipedia collections WIKI10 and WIKI11 were used in ImageCLEF 2010 and 2011 [50]. “TheWikipedia image retrieval task is an ad-hoc image retrieval task. The overall goal of the task is to investigatehow well multi-modal image retrieval approaches that combine textual and visual evidence in order tosatisfy a userâAZs multimedia information need could deal with larger scale image collections that containhighly heterogeneous items both in terms of their textual descriptions and their visual content. The aim is tosimulate image retrieval in a realistic setting, such as the Web environment, where available images coverhighly diverse subjects and have highly varied visual properties, while their accompanying textual metadata(if any) are user-generated and correspond to noisy and unstructured textual descriptions of varying qualityand length.”11. Both collections actually contain the same set of 237,434 images. The difference betweenWIKI10 and WIKI11 is the set of topics used in order to take into account several kinds of multimediainformation needs. WIKI10 consists in 70 topics while WIKI11 contains 50 topics. “The ground truth forthese topics was created by assuming binary relevance (relevant vs. non relevant) and by assessing only theimages in the pools created by the retrieved images contained in the runs submitted by the participants eachyear.”
- The Web Queries (WEBQ) repository was used as a benchmark in order to assess the research work de-scribed in [35]. “The Web Queries dataset contains 71,478 images and meta-data retrieved by 353 webqueries. For each retrieved image the relevance label is available. The relevance labels are obtained bymanual labeling. French query words were used to retrieve the images, but we provide also the Englishtranslation.” Unlike the previous tasks, WEBQ contains only text topics. Thus, it is a case of asymmetricsearch scenario.
Though we use three different collections, our experiments concern four tasks : IAPR, WIKI10, WIKI11 andWEBQ. The tasks are all content based image/text multimedia data retrieval ones. On each topic given in eachtask, we tested different particular cases of the graph based approach introduced in section 5. A topic consists inan image/text query (except for the WEBQ as explained beforehand) and we were also provided with the binaryground truth (relevant vs. non relevant). We used the Mean Average Precision (MAP) in order to compare theobtained rankings and the ground truth in the goal of evaluating the different multimodal fusion techniques. Wealso computed if the results were statistically different using paired t-test at the 95% confidence level.
6.2 Monomodal Representation and SimilaritiesStandard preprocessing techniques were first applied to the textual part of the documents. After stop-word re-moval, words were lemmatized and the collection of documents indexed with Lemur12. We used a standardDirichlet language model on IAPR and the Lexical Entailment (LE) information retrieval model [20] on the
9http://www.imageclef.org/datasets10http://lear.inrialpes.fr/~krapac/webqueries/webqueries.html11This is the description of the dataset as provided at http://www.imageclef.org/wikidata12http://www.lemurproject.org/
16
Wikipedia datasets. These models were chosen to remain consistent with our previously published and state-of-the-art results [4, 2, 5, 24, 17]. In fact, the LE model clearly outperforms standard IR models and give a relativeimprovement of 15% MAP13. Note that the LE retrieval model is briefly introduced in appendix section A andwas recently rediscovered in [33].
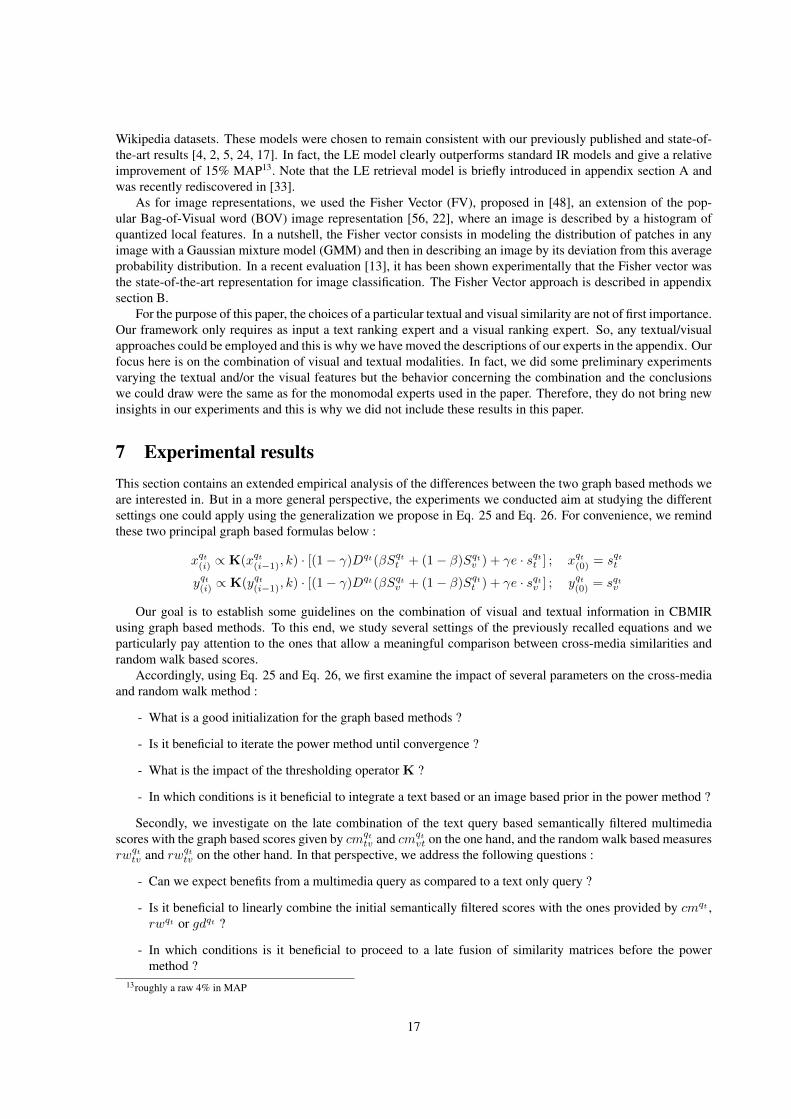
As for image representations, we used the Fisher Vector (FV), proposed in [48], an extension of the pop-ular Bag-of-Visual word (BOV) image representation [56, 22], where an image is described by a histogram ofquantized local features. In a nutshell, the Fisher vector consists in modeling the distribution of patches in anyimage with a Gaussian mixture model (GMM) and then in describing an image by its deviation from this averageprobability distribution. In a recent evaluation [13], it has been shown experimentally that the Fisher vector wasthe state-of-the-art representation for image classification. The Fisher Vector approach is described in appendixsection B.
For the purpose of this paper, the choices of a particular textual and visual similarity are not of first importance.Our framework only requires as input a text ranking expert and a visual ranking expert. So, any textual/visualapproaches could be employed and this is why we have moved the descriptions of our experts in the appendix. Ourfocus here is on the combination of visual and textual modalities. In fact, we did some preliminary experimentsvarying the textual and/or the visual features but the behavior concerning the combination and the conclusionswe could draw were the same as for the monomodal experts used in the paper. Therefore, they do not bring newinsights in our experiments and this is why we did not include these results in this paper.
7 Experimental resultsThis section contains an extended empirical analysis of the differences between the two graph based methods weare interested in. But in a more general perspective, the experiments we conducted aim at studying the differentsettings one could apply using the generalization we propose in Eq. 25 and Eq. 26. For convenience, we remindthese two principal graph based formulas below :
xqt(i) ∝ K(xqt(i−1), k) · [(1− γ)Dqt(βSqtt + (1− β)Sqtv ) + γe · sqtt ] ; xqt(0) = sqtt
yqt(i) ∝ K(yqt(i−1), k) · [(1− γ)Dqt(βSqtv + (1− β)Sqtt ) + γe · sqtv ] ; yqt(0) = sqtv
Our goal is to establish some guidelines on the combination of visual and textual information in CBMIRusing graph based methods. To this end, we study several settings of the previously recalled equations and weparticularly pay attention to the ones that allow a meaningful comparison between cross-media similarities andrandom walk based scores.
Accordingly, using Eq. 25 and Eq. 26, we first examine the impact of several parameters on the cross-mediaand random walk method :
- What is a good initialization for the graph based methods ?
- Is it beneficial to iterate the power method until convergence ?
- What is the impact of the thresholding operator K ?
- In which conditions is it beneficial to integrate a text based or an image based prior in the power method ?
Secondly, we investigate on the late combination of the text query based semantically filtered multimediascores with the graph based scores given by cmqt
tv and cmqtvt on the one hand, and the random walk based measures
rwqttv and rwqttv on the other hand. In that perspective, we address the following questions :
- Can we expect benefits from a multimedia query as compared to a text only query ?
- Is it beneficial to linearly combine the initial semantically filtered scores with the ones provided by cmqt ,rwqt or gdqt ?
- In which conditions is it beneficial to proceed to a late fusion of similarity matrices before the powermethod ?
13roughly a raw 4% in MAP
17

Figure 8: Top retrieved images with pure visual similarity (second row), with semantically filtered visual sim-ilarity sqtv (third row) and with cross-media y(i) using k = 10, γ = 0 and i = 1 (last row), for the topic 9 atImageCLEF Wikipedia Challenge 2010 (shown in first row). Green means relevant, red non-relevant. Note thatthe first two “non-relevant” images in the last row are “non-flying” hot air balloons.
All along these empirical analysis, we also comment on the comparison between the asymmetric and symmet-ric search scenarios. We recall that in the first case, only a text query is assumed in order to search the multimediacollection while in the second case, the user can give an image query in addition to the text query to better expressher information need.
Before answering these questions, let us first illustrate three retrieval models for a single query in Figure 8.This figure shows the beneficial effects of : a) the text based semantic filtering and b) the advocated cross-mediamethod.
7.1 Comparison of cross-media similarities and random walk based scoresFirst of all, let us recall that xqt(i) given in Eq. 25 and yqt(i) given in Eq. 26 are diffusion processes with priors sqttand sqtv respectively. As for the initialization of these iterative equations, xqt(0) and yqt(0) could be typically set touniform distributions. However, some preliminary results showed that such uniform distributions are suboptimalin the case of cross-media and does not affect the classical random walk (without the operator K). As explainedpreviously to encompass the cross-media case we consider as initial distributions sqtt and sqtv respectively andnormalize them to obtain probability distributions.
7.1.1 Impact of the number of iterations i
In our first set of experiments, we vary the number of iterations i in Eq. 25 and Eq. 26 using the followingsetting :
• γ = 0 (no prior)
• β = 0 (no late fusion of similarity matrices)
In Table 2 we show the MAP results we obtained when we set k = l (no nearest neighbor operator). In contrast,in Table 3, the evaluation measures are shown for the best k among {1, . . . , l}. More precisely, for each task,we first look at the value of k that provided the best MAP measure after the first iteration and we then iteratedthe graph based formulas until convergence with this particular value. Best k, denoted k∗, were in a rather smallrange (between 10 and 50) for all tasks (except for WEBQ).
Before focusing on the comparison between cross-media and random walk based results, let us make somepreliminary comments :
18

IAPR WIKI10 WIKI11 WEBQsqtv sqtt27.6 26.3
sqtv sqtt24 26.3
sqtv sqtt18 27.8
sqtt57
i12345
1050∞
yqt(i) xqt(i)28.7 20.823.4† 17.5†
21.1 15.119.4 13.418.7 12.316.8 9.615.4 8.515.4 8.4
yqt(i) xqt(i)18.9 15.717.2† 13.8†
17 13.517 13.517 13.517 13.517 13.517 13.5
yqt(i) xqt(i)12.6 6.911.4† 5.3†
11.3 5.211.3 5.111.3 5.111.3 5.111.3 5.111.3 5.1
xqt(i)69.369.5†68.768.468.468.468.468.4
Table 2: Varying the number of iterations i. Results obtained with k = l (random walk oriented diffusionprocess) and γ = β = 0. The symbol † indicates a statistical difference between i = 1 and i = 2 (which impliesa statistical difference between i = 1 and i > 1).
- From this first set of experiments, we can observe that the graph based scores xqt(i) and yqt(i) generally do notoutperform the initial scores sqtt and sqtv with respect to MAP values. In this first step, we indicate that itis not our goal to show that graph based relevance scores outperform the initial semantically filtered visualor textual scores. Our purpose here is rather to compare cross-media based measures against random walkbased scores.
- Besides, it is interesting to mention that ranking with the semantically filtered visual relevance scores sqtv(given in Table 2 or Table 3), lead to much better results than ranking with pure image scores sv (withoutthe semantic filtering) since the latter rankings give 22.1%, 6.2% and 2.7% for tasks IAPR, WIKI10 andWIKI11 respectively14. As for the WEBQ task, we only have text based queries. The superiority of sqtv oversv is particularly true for the Wikipedia repository. It is true that the direct comparison of the ranking basedon sv which is pure visual with the ranking based on sqtv which is multi-modal is nor fair. However, it showsthat we improving the MAP performance and hence also the performance on the top, which is primordialas the top documents are used by the operator K in the trans-modal pseudo-relevance step. Indeed usingthe textual part of the images in the second row in Figure 8 to enrich the textual part has better chances toimprove the results than the textsfrom the images in the first row.
- Furthermore, when the pure visual scores are reasonably good (such as for the IAPR task), ranking with thesemantically filtered visual relevance scores sqtv (corresponding to the classical visual reranking method)outperforms the text based relevance scores sqtt too. These observations confirm that correcting pure imagebased similarities using text based similarities is beneficial as stated in section 4. However, as we willsee later on, we can further improve the classical visual reranking results by using graph based techniqueswhich provide search results that are complementary.
Let us now analyze Tables 2 and 3 in the goal of comparing the performances of cross-media similarities andrandom walk based scores. Our first core point concerns the number of iterations these two approaches assume.Indeed, we recall that when i = 1, the current setting of the parameters of Eq. 25 and Eq. 26 are respectivelysimilar to cmqt
tv and cmqtvt. In contrast, when the number of iterations i grows, the graph based relevance scores
converge towards rwqttv and rwqtvt which correspond to the case i =∞. The results we obtained enable us to claimthat going further than a single step in the random walk significantly decreases the performances for all tasks,except for WEBQ, where a second step was beneficial before the system begun to degrade. Hence, we concludethat very short walks give better results than walking towards convergence and typically, in our case, a one stepwalk is the default setting. These results are to be contrasted with the ones obtained in [21], where the authors
14Here we refer to the results we obtain when we rank all the documents in the database with the visual scores, i.e. no value in sv is set tozero
19

IAPR WIKI10 WIKI11 WEBQsqtv sqtt27.6 26.3
sqtv sqtt24 26.3
sqtv sqtt18 27.8
sqtt57
i123451050
100∞
yqt(i) xqt(i)35.9 22.432.5† 20.5†
32.3 19.332 18.331.9 17.531.7 16.331.7 15.831.6 15.231.6 15.2
yqt(i) xqt(i)25.7 23.923.9† 21.3†
23.4 20.322.8 19.922.6 19.622.3 19.222.1 19.122.1 19.122.1 19.1
yqt(i) xqt(i)21.4 22.519.1† 18.3†
18 1618 1518.3 14.518.7 14.118.6 1418.6 1418.6 14
xqt(i)69.369.7†69.168.868.868.868.868.868.8
Table 3: Varying the number of iterations i. Results obtained with k∗ (best k obtained for the first step i = 1)(cross-media then generalized oriented diffusion processes) and γ = β = 0. The symbol † indicates a statisticaldifference between i = 1 and i = 2 (which implies a statistical difference between i = 1 and i > 1).
found benefits in using long walks15. Overall, the assumption made by the cross-media method is better than theone underlying the random walk technique.
If we focus on Table 3, we can also compare the cross-media and the generalized diffusion processes. Bothmethods use the same number of nearest neighbors k∗ but the former one makes only one iteration (i = 1) whilethe latter one makes iterations until convergence. We can observe that in that case too, very short walks betterperform than long walks.
However, by comparing the last rows of Table 3 and Table 2, we can conclude that the generalized diffusionprocess also outperforms the random walk method. Accordingly, it is better to take into account a small set ofnearest neighbors in the diffusion process by using the operator K with k � l instead of k = l. These experimentssuggest that it is better to use short walks and small set of nearest neighbors in our multimedia retrieval model.
The results shown in Tables 2 and 3 also allow us to comment on the different search scenarios. Indeed, inthis setting xqt(i) is like having a text query only and the graph based technique propagates textual relevance scoresto visual similarities. This case is the one that has been considered so far in the experiments using random walkbased techniques and in the research works [31, 30] in particular. The results given by yqt(i) are, on the contrary,the case where we are given in addition to the text query an image query. In that case we use the semanticallyfiltered visual relevance scores as a prior and the purpose of Eq. 26 is to propagate the latter measures to textbased similarities. We observe that yqt(i) are superior to xqt(i) in terms of MAP measures. Hence, these resultsconfirm that, as for cross-media similarities, the random walk technique can give better results when the user canexpress her information need by a multimedia query instead of a text query solely.
7.1.2 Impact of the number of nearest neighbor k
In what follows, we study the results provided by different settings using different values of k. Moreover, wefocus on the impact of using a prior or not in Eqs. 25 and 26. Indeed, as suggested in [31], it is important to add aprior in order to avoid the random walk process getting trapped in sub-local optimal solutions independent of thequery. Hence, we consider the following set of parameters :
• k ∈ {10, 30, 50, 100, l} (with or without nearest neighbor operator)
• γ ∈ {0, 0.3, γ∗} (with or without prior, where γ∗ is the parameter value among {0.1, 0.2, . . . , 0.9} thatgave the best performance)
• β = 0 (no late fusion of similarity matrices)
15However, the tasks addressed in [21] are different since the graphs they deal with are sparse.
20

IAPR WIKI10 WIKI11 WEBQsqtv sqtt27.6 26.3
sqtv sqtt24 26.3
sqtv sqtt18 27.8
sqtt57
γ k0 10
0.3 10γ∗ 100 30
0.3 30γ∗ 300 50
0.3 50γ∗ 500 100
0.3 100γ∗ 1000 l
0.3 lγ∗ l
yqt(i) xqt(i)35.5 19.3†
36.5 2536.6 26.9?
34.9 22.2†
35.9 26.435.9 27.1?33.6 22.3†
35.1 26.635.1 26.931.3† 21.7†
33.3 26.233.5 26.528.7† 20.8†
33.4 26.633.4 26.6
yqt(i) xqt(i)24† 23.5†
28.1 29.928.2 29.925.7† 23.7†
27.9 29.828 29.825.7† 23†
28 29.828.2 29.925.2† 21.4†
27.4 29.527.6 29.718.9† 15.7†
25.9 28.325.9 28.3
yqt(i) xqt(i)19.9† 22.5†
22.9 3123.1 3121.4† 19.9†
23.2 30.623.2 30.721.3† 16.4†
23.3 30.223.3 30.218.9† 12.7†
22.1 29.622.3 29.612.6† 6.9†
19.6 27.819.9 28.2
xqt(i)66.1†
66.267.4?
68.3†
6667.9?
68.7†
6668.2?
69.1†
66.168.5?
69.3†66.168.7?
Table 4: Varying the number of nearest neighbors k and the weight of the prior. Results are shown for i = 1,k ∈ {10, 30, 50, 100, l} and γ ∈ {0, 0.3, γ∗}, where γ∗ was the best γ found in the set of {0.1, 0.2, , · · · , 0.9}.Adding a prior always leads to significantly better results, as also shown by the symbol † indicating a statisticaldifference between γ = 0.3 (often best or close to best) and γ = 0. In contrast, there is rarely a statisticaldifference between γ = 0.3 and γ∗ indicated by the symbol ?. Finally, if there is a statistical difference betweenk = 10 and other k values the results of k > 10 are colored in magenta.
The results using these different settings for i = 1 are given in Table 4 and with i =∞ in Table 5. Note that thelast rows with k = l correspond to the classical random walk (rwqt ) while the other rows, with k � l, lead to thegeneralized diffusion model (gdqt ) that integrates the nearest neighbor operator.
Analyzing these results, and excluding the case of WEBQ, we observe the followings :
- Concerning the k value, best or near best results are obtained with k = 10 for any value of γ. When thebest results are achieved with k > 10, the latter parameter is below or equal to 50 and the gain is neitherhigh nor statistically different as compared to k = 10. Accordingly, we conclude that for both the cross-media and the generalized diffusion model using k ≈ 10 could be considered as a default setting of ourmultimedia relevance model.
- When γ = 0, the cmqt approach with i = 1 (shown in Table 4), always yields to much higher performancesthan the gdqt method with i =∞ (shown in Table 5). While this is not always the case when we have γ > 0,the setting γ∗, k = 10 and i = 1 yields to results that are close (and statistically not different) to the bestobtained values. In other words, and as already suggested beforehand, when using graph based techniques,one should favor the cross-media oriented diffusion process along with a relatively small number of nearestneighbors as proxies.
- When we consider the random walk, it generally yields to worse results than cmqt and gdqt for all threedatasets whatever the value of γ.
Note, that in the case of WEBQ, some of these observations seems to be less true, where increasing both kand i improves the search results in terms of MAP. Best results are obtained with k = 50, γ = 0.1 and i = ∞,which again shows that using the operator K(., k) (but this time with a higher k) is a good idea. Concerning thenumber of iterations, we obtain a nice improvement over i = 1 and close to i = ∞ with a single extra step16.
16With γ∗ = 0.1, we obtain that MAP={69.8, 69.9, 69.8, 69.8, 69.7} respectively for k ∈ {10, 30, 50, 100, l}
21
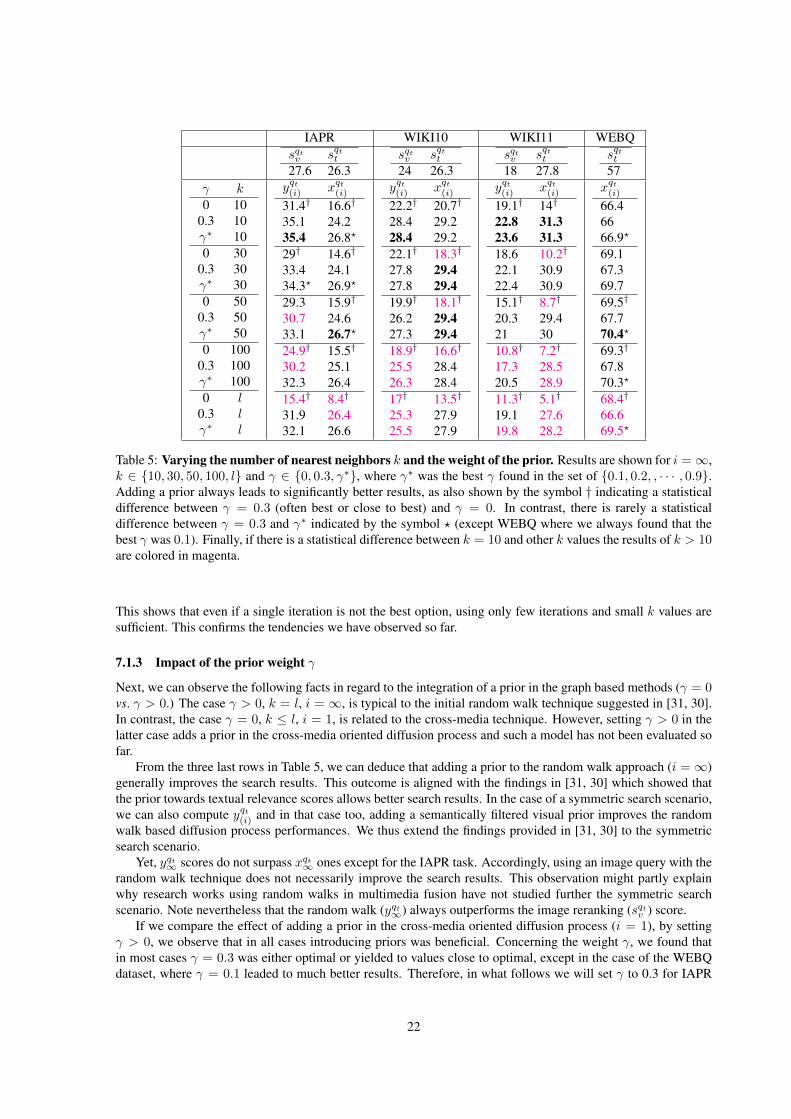
IAPR WIKI10 WIKI11 WEBQsqtv sqtt27.6 26.3
sqtv sqtt24 26.3
sqtv sqtt18 27.8
sqtt57
γ k0 10
0.3 10γ∗ 100 30
0.3 30γ∗ 300 50
0.3 50γ∗ 500 100
0.3 100γ∗ 1000 l
0.3 lγ∗ l
yqt(i) xqt(i)31.4† 16.6†
35.1 24.235.4 26.8?
29† 14.6†
33.4 24.134.3? 26.9?
29.3 15.9†
30.7 24.633.1 26.7?24.9† 15.5†
30.2 25.132.3 26.415.4† 8.4†
31.9 26.432.1 26.6
yqt(i) xqt(i)22.2† 20.7†
28.4 29.228.4 29.222.1† 18.3†
27.8 29.427.8 29.419.9† 18.1†
26.2 29.427.3 29.418.9† 16.6†
25.5 28.426.3 28.417† 13.5†
25.3 27.925.5 27.9
yqt(i) xqt(i)19.1† 14†
22.8 31.323.6 31.318.6 10.2†
22.1 30.922.4 30.915.1† 8.7†
20.3 29.421 3010.8† 7.2†
17.3 28.520.5 28.911.3† 5.1†
19.1 27.619.8 28.2
xqt(i)66.46666.9?
69.167.369.769.5†
67.770.4?69.3†
67.870.3?
68.4†
66.669.5?
Table 5: Varying the number of nearest neighbors k and the weight of the prior. Results are shown for i =∞,k ∈ {10, 30, 50, 100, l} and γ ∈ {0, 0.3, γ∗}, where γ∗ was the best γ found in the set of {0.1, 0.2, , · · · , 0.9}.Adding a prior always leads to significantly better results, as also shown by the symbol † indicating a statisticaldifference between γ = 0.3 (often best or close to best) and γ = 0. In contrast, there is rarely a statisticaldifference between γ = 0.3 and γ∗ indicated by the symbol ? (except WEBQ where we always found that thebest γ was 0.1). Finally, if there is a statistical difference between k = 10 and other k values the results of k > 10are colored in magenta.
This shows that even if a single iteration is not the best option, using only few iterations and small k values aresufficient. This confirms the tendencies we have observed so far.
7.1.3 Impact of the prior weight γ
Next, we can observe the following facts in regard to the integration of a prior in the graph based methods (γ = 0vs. γ > 0.) The case γ > 0, k = l, i = ∞, is typical to the initial random walk technique suggested in [31, 30].In contrast, the case γ = 0, k ≤ l, i = 1, is related to the cross-media technique. However, setting γ > 0 in thelatter case adds a prior in the cross-media oriented diffusion process and such a model has not been evaluated sofar.
From the three last rows in Table 5, we can deduce that adding a prior to the random walk approach (i =∞)generally improves the search results. This outcome is aligned with the findings in [31, 30] which showed thatthe prior towards textual relevance scores allows better search results. In the case of a symmetric search scenario,we can also compute yqt(i) and in that case too, adding a semantically filtered visual prior improves the randomwalk based diffusion process performances. We thus extend the findings provided in [31, 30] to the symmetricsearch scenario.
Yet, yqt∞ scores do not surpass xqt∞ ones except for the IAPR task. Accordingly, using an image query with therandom walk technique does not necessarily improve the search results. This observation might partly explainwhy research works using random walks in multimedia fusion have not studied further the symmetric searchscenario. Note nevertheless that the random walk (yqt∞) always outperforms the image reranking (sqtv ) score.
If we compare the effect of adding a prior in the cross-media oriented diffusion process (i = 1), by settingγ > 0, we observe that in all cases introducing priors was beneficial. Concerning the weight γ, we found thatin most cases γ = 0.3 was either optimal or yielded to values close to optimal, except in the case of the WEBQdataset, where γ = 0.1 leaded to much better results. Therefore, in what follows we will set γ to 0.3 for IAPR
22

IAPR WIKI10 WIKI11sqtv sqtt
27.6 26.3sqtv sqtt24 26.3
sqtv sqtt18 27.8
β i k0 1 100 ∞ 100 ∞ l
0.5 1 100.5 ∞ 100.5 ∞ lβ∗ 1 10β∗ ∞ 10β∗ ∞ l1 1 101 ∞ 101 ∞ l
yqt(i) xqt(i)36.5 2535.1 24.231.9? 26.4?
36.2 27.334 27.230.7? 2636.6 27.334.9 27.231.7? 26.427.7 27.126.3 25.928.1? 26
yqt(i) xqt(i)28.1 29.928.4 29.225.3? 27.9?
27.1 29.327.3 29.224.6? 28?
28.5? 29.9?29.2 29.325.5 2824.5? 26.624.4 26.322.7 26.7
yqt(i) xqt(i)22.9 3122.8 31.319.1? 27.6?
20.5 29.721 29.515.8? 27.8?
23 30.924 31.218.8? 27.8?
16.6 27.215.2† 2711.5? 27.1
Table 6: Combining the similarity matrices. We vary β and show the obtained results for xqt(i) and yqt(i) with theprior γ = 0.3. The symbol † indicates a statistical difference between them. When there is a statistical differencebetween β = 0 and β > 0 (all the other parameters remaining the same), the values of the results given by β > 0are colored in magenta.
and WIKI datasets and to 0.1 for WEBQ, and denote these respective settings by γ.Similarly, adding the prior to the generalized diffusion model gdqt was always beneficial. Besides, while
without the prior (γ = 0) the cmqt models outperform the gdqt ones, this is less true when we set γ > 0. Indeed,if we add a prior to both techniques, we observe that the generalized diffusion models give similar results thanthe cross-media models and in some cases (WIKI11), we can even note some better results.
At this point of our experimental report, we can make the following comments on the proposed multimediaretrieval model :
(i) The results given in Tables 4 and 5 support the fact that graph based methods are effective techniques tocombine visual and textual information in CBMIR as long as the parameters of Eq. 25 and Eq. 26 are setcorrectly since we can obtain much better results than the baselines given by sqtt and sqtv respectively;
(ii) Adding a prior in any of the presented diffusion process improved the results as compared to the ones thatdo not use any prior.
(iii) The diffusion processes using nearest neighbors as proxies (cmqt and gdqt ) outperform the random walkoriented diffusion process for both yqt(i) and xqt(i). We also claim that k ≈ 10 and γ = 0.3 can be consideredas default parameters values for Eq. 25 and Eq. 26.
Finally, Table 4 allows us to further compare the results obtained in an asymmetric search scenario xqt(i) againstthe ones obtained in a symmetric search scenario yqt(i). Interestingly, even if we use the best settings, the MAPmeasures for yqt(i) do not always outperform the ones for xqt(i) (actually it outperforms only for IAPR). However,these observations do not mean that in CBMIR, multimedia queries are not necessarily useful and adding animage query to a text query does not help the search results significantly. Indeed, retrieved lists provided by yqt(i)and xqt(i) should not be considered as in competition with each other. They should be viewed as complementarylists of pseudo-relevant items and in that perspective, sqtv and sqtt too have to be considered as complementarypseudo-relevant top lists of multimedia objects. In the section 7.2, we will thus investigate the combination ofthose different scores in order to analyze to what extent these top lists are mutually complementary.
23

7.1.4 Combining the similarity matrices
We now examine if fusing semantically filtered visual and textual similarity matrices by setting β 6= 0 in Eq. 25and Eq. 26 is beneficial or not. Combining monomedia similarity matrices was indeed suggested in [31, 30] inthe random walk case. Consequently, we study the impact of β in the following experiments. As a result of theprevious experiments, we selected the following parameter values :
• i = 1, k = 10 (cross-media oriented diffusion process)
• i =∞, k = 10 (generalised diffusion model)
• i =∞, k = l (random walk oriented diffusion process)
For each case, we set γ = 0.3 and we varied β ∈ [0, 1], but we only show three particular cases : β = 0, β = 1and β∗ ∈ [0.1, 0.9] which correspond to the values that gave the best results for each model. Table 6 presents thedifferent MAP values we obtained. Note that we do not show the results for the WEBQ task because we did notcompute17 the visual similarity matrix Sqtv in this case. From Table 6 we can make the following observations :
- Adding Sqtv to Sqtt (β > 0) was clearly beneficial only in a few cases, more precisely for cmqttv and gdqttv
in the case of IAPR and for cmqvt and gdqvt in the case of WIKI11. However, in the latter cases, an equal
weighting is far from optimal or even worse and the parameter β has to be properly set. As a consequence,we can say that, in general, β = 0 gives the best or near optimal solutions and adding the similarity matrixof the complementary modality in Eqs. 25 and 26 does not bring any further gain.
- As previously, both the cross-media and the generalized diffusion model results improve over the baselinessqtv and sqtt scores, and remain significantly better than the classical random walk process.
Note that the particular case β = 1 corresponds, either to a semantically filtered “monomodal” pseudo-relevance feedback (i = 1), or to a semantically filtered “monomodal” diffusion process (i = ∞). Compared tothe opposite case, β = 0, which is a transmodal semantically filtered pseudo-relevance feedback, they perform ingeneral worse. This actually shows again the interest of exploiting both modalities using graph based techniqueswith a transmedia principle.
7.2 Combination of different relevance scores and similarities in a late fusion schemeIn the next set of experiments, we follow the research works described in [15, 2, 3, 16] where the authors proposeto combine text based scores, semantically filtered visual scores and graph based scores as for the final relevancescores. In that perspective, we first study the following cases :
rsvqt,tvcm (q, .) = αsqtt (q, .) + (1− α)xqt(1) (27)
rsvqt,vtcm (q, .) = αsqtv (q, .) + (1− α)yqt(1) (28)
rsvqt,tvgd (q, .) = αsqtt (q, .) + (1− α)xqt∞ (29)
rsvqt,vtgd (q, .) = αsqtv (q, .) + (1− α)yqt∞ (30)
7.2.1 Effect of adding the initial semantically filtered scores
Before a comparison between rsvqt,vtcm and rsvqt,tvrw , let us first compare again the case of γ = 0 and γ > 0, butthis time in the context of Eqs. 27 and 28. The results are shown in Table 7 where we varied α between 0 and 1(with a 0.1 step), but we only show the results for α = 0.5 and α∗ (which is the value that outperforms all otherones).
From this table we can draw the following conclusions :
- Adding sqtt to xqt(1) (Eq. 27) is always a winning strategy whether γ = 0 or γ > 0.
17As we shall see, setting β > 0 does not necessarily bring any improvements of the results for IAPR, WIKI10 and WIKI11. Therefore,since the computation of visual similarities in the case of WEBQ is heavy, we did not compute it.
24

IAPR WIKI10 WIKI11 WEBQsqtv sqtt27.6 26.3
sqtv sqtt24 26.3
sqtv sqtt18.1 27.8
sqtt57
k α γ10 0 010 0.5 010 α∗ 010 0 γ10 0.5 γ10 α∗ γ30 0 030 0.5 030 α∗ 030 0 γ30 0.5 γ30 α∗ γ50 0 050 0.5 050 α∗ 050 0 γ50 0.5 γ50 α∗ γl 0 0l 0.5 0l α∗ 0l 0 γl 0.5 γl α∗ γ
rsvqt,vtcm rsvqt,tvcm
35.5 19.3†
35.6 2736.5 2736.5 25†
34.5 2736.6? 2734.9 22.2†
35.1 26.735.8? 26.935.9† 26.433.8 2735.9? 2733.6 22.3†
34.5 26.634.9 26.935.1† 26.6†
33.3 26.935.1? 26.928.7† 20.8†
33.3 25.833.3 26.733.4† 26.631.2 26.633.4? 26.7
rsvqt,vtcm rsvqt,tvcm
24† 23.5†
28 3028.2 3028.1† 29.9†
26.9 28.828.2? 29.9?
25.7† 23.7†
27.8 30.128.2? 30.127.9† 29.8†
26.5 28.627.9? 29.8?
25.7† 23†
27.7 3028.3 3028† 29.8†
26.4 28.528? 29.8?
18.9† 15.7†
25.9 2825.9 28.325.9 28.325.3 27.725.9 28.3
rsvqt,vtcm rsvqt,tvcm
19.9† 22.5†
22.7 30.923.1 30.922.9 31†21.8 3023.1? 31?21.4 19.9†
22.9 30.723.3 30.723.2† 30.6†
21.7 29.623.3? 30.6?
21.3 16.4†
23.1 30.323.5? 30.323.3† 30.2†
21.8 29.323.4? 30.2?
12.6† 6.9†
19.6 26.819.7? 28.2?
19.6 27.819.6 28.219.6 28.2
rsvqt,tvcm
64.4†
66.966.966.9†
66.266.9?
68.367.968.6?
67.9†
66.567.9?
68.7†
68.369?
68.2†
66.668.2?
69.368.969.668.766.968.7
Table 7: Effect of adding the initial semantically filtered scores sqtv and sqtt to the cross-media scores. Weshow the results of rsvqt,vtcm and rsvqt,tvcm with β = 0. The symbol † indicates a statistical difference betweenα = 0.5 and α = 0. and the symbol ? indicates a statistical difference between α∗ and α = 0.5. Finally, whenthere is a statistical difference between corresponding γ = 0 and γ > 0, the results of γ are colored in magenta.
- Adding sqtv to yqt(1) (Eq. 28) is not always beneficial and could be damaging for the search results especiallywith a non optimal α value. However, we have to make the distinction between the cross-media orienteddiffusion process with a prior (γ > 0) and the one without a prior (γ = 0). In the former case, the graphbased scores already benefited from sqtv (used as a prior). As a result, adding the latter semantically filteredvisual relevance score to yqt(1) by means of a late fusion strategy does not bring any improvement or worse,it could hurt the performances which is typically the case for α = 0.5. On the contrary, when we do notuse any prior in the cross-media oriented diffusion process (k ≤ 30, γ = 0), then we always observe adramatic increase of the MAP measures.
- For both Eq. 27 and Eq. 28, γ = 0 is in general better than γ > 0, when α = 0.5 but compared to (the best)α∗, the results are in general very similar (except for WEBQ) and with no statistical difference betweenthem.
- It is difficult to judge between the two following cases : γ = 0, α > 0 on the one hand and γ > 0 andα = 0 on the other hand. As regard to the cross media diffusion process, the former case promotes noprior but a late fusion while the latter case rather supports the integration of a prior in the diffusion processand no further linear combination. If we compare the latter case, γ > 0 and α = 0, to the former onebut with γ = 0 and α = 0.5 (no need to tune the α parameter), we see a slight advantage of the firstsetting over the second one. Therefore in what follows, we will pursue the experiments with the cross-
25

IAPR WIKI10 WIKI11 WEBQsqtv sqtt27.6 26.3
sqtv sqtt24 26.3
sqtv sqtt18.1 27.8
sqtt57
k α10 010 0.510 α∗
30 030 0.530 α∗
50 050 0.550 α∗
l 0l 0.5l α∗
rsvqt,vtgd rsvqt,tvgd
35.1 24.2†
35.1 2736.1 2733.4 24.1†
33.5 26.134.3 26.630.7 24.6†
31.6 26.231.8 26.631.9 26.430.9 26.532? 26.6
rsvqt,vtgd rsvqt,tvgd
28.4 29.227.5 28.728.7? 29.227.8 29.427.6 28.828.2 29.426.2 29.426.7 28.826.8 29.425.3 27.925.1 27.525.4 27.9
rsvqt,vtgd rsvqt,tvgd
22.8 31.322.9 30.423.5 31.4?22.1 30.923 30.223.2 30.920.3 29.421.6 29.421.6 29.519.1 27.619.6 27.919.8 28.1
rsvqt,tvgd
67.4†
66.867.4?
69.7†
68.969.7?
70.4†69.470.4?69.5†
67.969.5?
Table 8: Effect of adding the initial scores sqtv and sqtt to gdqt and rwqt . We show results of rsvqt,vtgd andrsvqt,tvgd with β = 0, i =∞ and varying k. Note that k = l correspond to the rsvqtrw case. The symbol † indicatesa statistical difference between α = 0.5 and α = 0 and the symbol ? indicates a statistical difference betweenα∗ and α = 0.5. Finally when there is a statistical difference between the corresponding cross-media orienteddiffusion process (i = 1 shown in Table 7) obtained with γ, the results are colored in magenta.
media approach with a prior γ > 0 and no late fusion α = 0. Nevertheless the other approach can also beconsidered as a possible multimedia retrieval model. Note that these observations support the fact that thecross-media approach gives search results that are complementary to the initial semantically filtered scoresand this complementarity can be formulated via an early integration of these scores in the diffusion processas priors or via a late integration through a linear combination with the obtained graph based scores.
Accordingly, when using Eqs. 27 and 28 as multimedia retrieval models, we recommend to employ by defaulteither the parameter setting {k = 10, γ = γ, α = 0} or {k = 10, γ = 0, α = 0.5}. These configurations indeedlead to near optimal results on the first three datasets, and significantly better MAP values than the ones obtainedwith sqtv and sqtt for all datasets. Concerning, the WEBQ the best results we obtained were with k = l, γ = 0 andα∗.
In Table 8, we show the performances of the other graph based techniques we are interested in : the general-ized diffusion model and in particular, the random walk process (last three rows with k = l). Hence, comparingTables 7 and 8 allows us to assess Eqs. 27 and 28 against Eqs. 29 and 30. In other words, we again compare thetwo particular cases i = 1 and i =∞ for this new set of experiments. Note that both rsvqtgd and rsvqtrw performedpoorly without the prior so for these models, we did not make any experiment with γ = 0 (instead we take γ > 0).
The comparison between the two cases, rsvqtgd (k � l) and rsvqtrw (k = l), yields to the following observa-tions :
- As we already pointed out in Table 7, adding sqtv and sqtt as priors did not bring any improvement in mostcases and with α = 0.5 we can even observe a decrease in the performances. Hence, when rsvqtgd or rsvqtrware used, it is better to not recombine these scores again with the semantically filtered monomodal scoresbut to use directly gdqt and rwqt as multimedia retrieval models.
- When k = 10 and γ = γ, rsvqtgd (i = ∞) and rsvqtcm (i = 1 shown in Table 7) yield very similar results(except for WEBQ), however for larger k values the rsvqtcm outperforms rsvqtgd showing again that for rsvqtgdit is even more important to use small k values than for rsvqtcm.
- For all datasets, rsvqtgd outperforms rsvqtrw (except WEBQ with k = 10). More interestingly, the resultsobtained with rsvqtrw remain significantly below the results provided by rsvqtcm on the first three datasets.
26

Figure 9: Top retrieved images with textual similarity (second row), with cross-media rsvqt,tvcm using k = 10 andi = 1 (third row) and with random walk rsvqt,tvrw (last row), for the topic 7 at ImageCLEF Wikipedia Challenge2010 (shown in first row). Green means relevant, red non-relevant.
Concerning WEBQ, rsvqt,tvrw is better than rsvqt,tvcm with k ≤ 50, however for k = l the performancesare comparable, especially when we consider γ = 0 for rsvqtcm. We thus state that cross-media orienteddiffusion processes provide search results that are more complementary to sqtt and sqtv than random walkbased diffusion processes since a late fusion (even with equal weighting) gives better results in the formercase than in the latter case. This is further illustrated in Figure 9 on a Wikipedia query.
Finally, these two latter tables enable us to conclude about the asymmetric search scenario. Our experimentalresults show that, when given a text query only, the best multimedia fusion strategies are either to consider thecross-media oriented diffusion process (with or without prior) linearly combined with the initial semanticallyfiltered text relevance scores which leads to the retrieval model rsvqtcm (Eq. 27), or to use instead of rsvqtcm, thegeneralized diffusion model gdqt without recombination with the initial scores. In both cases, it is important touse a relatively small k (e.g. k = 10).
7.2.2 Combining all relevance scores in a late fusion scheme
Finally, we study the combination of both initial relevance scores sqtv and sqtt with both multimedia graph basedscores yqt(i) and xqt(i) in an ultimate linear combination. This is possible in the case of the symmetric searchscenario. We previously presented in section 5, Eq. 16 and Eq. 20 which refer to such combinations. Forconvenience, we recall these latter formulas below :
rsvqtcm(q, .) = αtsqtt (q, .) + αvs
qtv (q, .) + αtvcm
qttv(q, .) + αvtcm
qtvt(q, .)
rsvqtgd(q, .) = αtsqtt (q, .) + αvs
qtv (q, .) + αtvgd
qttv(q, .) + αvtgd
qtvt(q, .)
rsvqtrw(q, .) = αtsqtt (q, .) + αvs
qtv (q, .) + αtvrw
qttv(q, .) + αvtrw
qtvt(q, .)
where cmqttv = xqt(1), cm
qtvt = yqt(1), gd
qttv = xqt∞, gdqtvt = yqt∞ with k � l and rwqttv = xqt∞, rwqtvt = yqt∞ with k = l.
According to the results we underlined previously, we chose the following settings :
• k = 10 (except for rw where k = l)
• β = 0 (no late fusion of similarity matrices).
• γ = 0.3 (using a monomodal prior) or γ = 0 (without monomodal prior).
• α are set to uniform weights or to best performing weights.
27

We show the obtained results in Table 9. In addition, we show the MAP values obtained by the late fusion ofsemantically filtered relevance scores, αvsqtv (q, .) + αts
qtt (q, .), which represents our baseline. From this table,
we can draw the following conclusions :
- In a symmetric search setting, combining initial filtered scores with graph based diffusion processes scoresis beneficial and performs better than the baseline. The graph based measures are thus complementary tothe initial scores.
- rsvqtcm, rsvqtgd provide similar performances and outperform the random walk rsvqtrw method.
IAPR WIKI10 WIKI110.5sv + 0.5st 34.5 35.2 35.4α∗vsv + α∗t st 35.4 35.2 35.4rsvqtcm, (γ = 0) 37.3† 35.9 33.6†
rsvqt∗cm , (γ = 0) 39.4 36.1 35.7rsvqtcm, (γ = 0.3) 37.3† 36.1 36rsvqt∗cm , (γ = 0.3) 39.5 36.1 36rsvqtgd, (γ = 0.3) 37.3† 35.8 35.1rsvqt∗gd , (γ = 0.3) 38.7 36 35.8rsvqtrw, (γ = 0.3) 34.4 35.4 34.2†
rsvqt∗rw , (γ = 0.3) 36.1 35.6 35.4
Table 9: Combining all relevance scores in a late fusion scheme. We show the results of rsvqt with uniformweights and rsvqt∗ corresponding to the best linear combinations of the different scores. We considered k = 10(except for rsvqtrw), β = 0 and γ = 0.3. In addition as we average with the monomodal score, we also showthe case of γ = 0 (no prior) for the cross-media diffusion process. We do not show results with γ = 0 for therandom walk and generalized diffusion model as we have seen that iterating without the prior yields to muchworse results. The symbol † indicates a statistical difference between uniform weights and tuned weights. Wecolored in magenta the values of the results of rsvqt and the ones of rsvqt∗ when there is a statistical differencewith the semantically filtered late fusion (with uniform respectively tuned α weights).
7.3 Advantage of the cross-media oriented diffusion processWith regard to the comparison between the cross-media and the random walk views of the proposed unifiedmultimedia retrieval model, the experiments we conducted favors the former orientation as compared to the latterone. Indeed, all along this current section we have shown that :
(i) Choosing the probability distribution according to the semantically filtered relevance scores sqtt and sqtvas an initialization of the diffusion processes in Eqs. 25 and 26 respectively is better than the uniformdistribution and this also supports the transmedia fusion principle in CBMIR.
(ii) Using a small neighborhood as proxy in the transmedia approach by using K(., k) with k ≈ 10 is in generalbetter than choosing a large neighborhood; this is even more important when we iterate the generalizeddiffusion model;
(iii) One-step or occasionally two-step walks provide better performances than longer walks when we do notuse the initial scores as priors.
(iv) The cross-media oriented diffusion process without the prior is the most complementary to the initial se-mantically filtered relevance scores and yields to better results than the random walk oriented diffusionprocess with or without the prior.
(v) Adding a prior in the diffusion processes is beneficial but using the latter information in a late fusionscheme after having calculated the graph based scores using only a single step gives comparable results.
28

Both solutions can be considered, however, the γ parameter for the former seems to be more stable that thebest α value in the latter case. Concerning the generalized diffusion model it is important to use the priorand preferably not to combine it with the semantically filtered monomodal scores.
(vi) Overall, the best parameter setting we obtained as regard to our multimedia retrieval system is a late fusionbetween semantically filtered scores and cross-media oriented diffusion processes scores, the latter usingthe monomodal scores also as prior.
All these experiments allow us to claim that cross-media diffusion processes give better search results thanrandom walk diffusion processes both for the asymmetric and symmetric search settings as long as the parametersare set correctly and in that perspective, we have also provided sets of parameters values one should use by default.
Below, we further underline and summarize two other important advantages of the cross-media frameworkcompared to the random walk and the generalized diffusion model from the practical standpoint :
- Complexity. Our experimental results have shown that cross-media oriented diffusion processes give betterresults than random walk diffusion processes. As a consequence, we do not need to iterate the diffusionprocess until convergence and we have shown that a single step was sufficient to reach good performances.Hence, the model underlying the cross-media similarities not only provide better results but it also reducesthe computation time. Moreover, when we use the cross-media settings (β = 0, k = 10, i = 1), we employthe nearest neighbor thresholding operator K(., k) on the initial monomodal scores. In that case, we do noteven need to compute the l× l similarity matrices, but only k× l similarity values which correspond to therows of Sqtt and Sqtv associated to the k nearest neighbors (even when using the prior these values are to beadded simply to the corresponding rows). This further reduces the computational cost of the proposed graphbased method. Since image representation and similarities have much higher time and storage complexitiesthan text, overall, our proposal can easily tackle large collections of multimedia objects.
- Score Normalization In order to compare the two methods we have been interested in, we normalized thescores and similarities in order to have probability distributions. This normalization was necessary for therandom walk approach as explained in section 5. However, since we have shown that iterating the diffusionprocess more than once was generally damaging, we concluded that we needed to iterate Eq. 25 and Eq.26 only one time. As a result, it is no more mandatory to have probability distributions as for xqt(i) and yqt(i).We thus computed rsvqtcm using another normalization : we replaced each score or similarity sqt(d, d′) by(sqt(d, d′)−min{sqt(d, .)})/(max{sqt(d, .)}−min{sqt(d, .)}). We show in Table 1018, the performancesof the cross-media oriented diffusion process using this other normalization procedure. This is denoted byrsvqt,nmcm . Overall, we reached even better MAP results. As a consequence, this suggests that our study ofgraph based methods could be further enriched with the impact of other kinds of normalization methods.
IAPR WIKI10 WIKI11 WEBQα∗vsv + α∗t st 35.4 35.2 35.4 57rsvqt∗rw 36.1 35.6 35.4 69.5rsvqt∗gd 38.7 36 35.8 70.4rsvqt∗cm 39.5 36.1 36 69.6rsvqt,nmcm 40.2 36.2 35.6 70.7
Table 10: Results with different score normalization.
8 ConclusionWe have addressed the problem of multimedia information fusion in CBMIR and compared the cross-mediasimilarities to the random walk methods. First of all, we have proposed a unifying framework that integrates the
18Note that for WEBQ, we do not have the image query and we can not provide the final scores rsvqtrw and rsvqtcm given by Eq. 20 andEq. 16 unlike for other tasks. In that case, we show the best values we obtained among all the previous experimental results we presented.Note that we show single step (i = 1) results in the case of rsvqt,nm
cm .
29

text query based semantic filtering of multimedia scores and similarities and which generalizes both graph basedtechniques in a unifying model.
Furthermore, we have extensively studied many factors that impact the performances of these graph basedmethods. One of our goals was to provide some guidelines on how to best use those methods for two differentmultimodal search scenarios : the asymmetric and symmetric cases. Our findings have been validated on threereal-world datasets which are public and accessible to the research community.
All in all, we can summarize our findings about graph based methods as follows :
- The text query based semantic filtering is an efficient fusion method that allows one to restrain the searchspace to multimedia items that are the most semantically related to the text query. We suggest to apply thisfirst level of fusion before moving forward with graph based methods.
- Cross-media similarities and random walk based approaches can be seamlessly embedded into a unifyingframework. The latter general graph based method is defined by Eq. 25 and Eq. 26 which allow one to takeinto account both the asymmetric and the symmetric search scenarios. The unifying framework exhibitstransmedia diffusion processes with or without priors and bring to light the main differences between thetwo types of methods used by the community. But in a more general scope, it allows us to formalize theinteresting features and parameters one should pay attention to when using an unsupervised graph basedapproach in content based image/text multimedia retrieval tasks.
- The experiments we conducted globally show that cross-media oriented diffusion processes outperformrandom walk based methods. Typically, we claim that the default setting for Eq. 25 and Eq. 26 whichyields to near best performances on average are :
• β = 0 (no late fusion between similarity matrices).
• γ = 0.3 (using a prior helps)
• k ≈ 10 (a few nearest neighbors as proxies is better)
• i = 1 (one iteration is sufficient)
We have shown that the cross-media oriented diffusion process being complementary to the initial relevancescores sqtv (q, .) respectively sqtt (q, .) can be successfully combined with them to further improve the re-trieval accuracy. Overall, we obtained the best search results with rsvqtcm(q, .) = αts
qtt (q, .)+αvs
qtv (q, .)+
αtvcmqttv(q, .) + αvtcm
qtvt(q, .) for all real-world tasks we tested especially when we used another normal-
ization than the ones required by the iterative processes. Last but not least, cross-media oriented diffusionprocesses have a lower computational cost compared to both the random walk oriented and generalized dif-fusion models and hence such graph based techniques can tackle large multimedia repositories in a scalableway.
A Text representation and similaritiesStandard pre-processing techniques were first applied to the textual part of the documents. After stop-wordremoval, words were lemmatized and the collection of documents indexed with Lemur19.
We describe here the Lexical Entailment (LE) model used on the Wikipedia dataset as it is a less well-knownmodel. [7] addressed the problem of IR as a statistical translation problem with the well-known noisy channelmodel. This model can be viewed as a probabilistic version of the generalized vector space model. The analogywith the noisy channel is the following one : to generate a query word, a word is first generated from a documentand this word then gets “corrupted” into a query word. The key mechanism of this model is the probability p(v|u)that term u is “translated” by term v. These probabilities enable us to address a vocabulary mismatch, and alsosome kinds of semantic enrichments.
Then, the problem lies in the estimation of such probability models. We refer here to a previous work [20]on LE models to estimate the probability that one term entails another. It can be understood as a probabilisticterm similarity or as a unigram LM associated to a word (rather than to a document or a query). Let u be a termin the corpus, then LE models compute a probability distribution over terms v of the corpus denoted by p(v|u).
19http://www.lemurproject.org/
30

These probabilities can be used in IR models to enrich queries and/or documents and to give a similar effect tothe use of a semantic thesaurus. However, LE is purely automatic, as statistical relationships are only extractedonce from the considered corpus. In practice, a sparse representation of p(v|u) is adopted, where we restrict v tobe one of the 10 terms that are the closest to u using an information gain metric.
More formally, an entailment or similarity between words, expressed by a conditional probability p(v|u), canbe used to rank documents according to the following formula :
st(dt, d′t) = p(dt|d′t) =
∏v∈dt
∑u
p(v|u)p(u|d′t). (31)
where dt (or qt) and d′t are two texts, p(u|v) may be obtained by any of the methods described in [20] and p(u|d′t)is the LM of d′t.
Note that this model was essentially rediscovered in [33] and give substantial improvements compared tostandard retrieval models (language models, divergence from randomness, information models). For instance, theLE model obtains a MAP of 26.3% compared to 22.6% on the 2010 Wikipedia dataset. Similarly, on the 2011dataset, the LE MAP is 27.82% compared to a 24.3% an information based model[19].
B Image representation and similaritiesAs for image representations, we used the Fisher Vector (FV), proposed in [48], an extension of the popular Bag-of-Visual word (BOV) image representation [56, 22], where an image is described by a histogram of quantizedlocal features. The Fisher Vector, similarly to the BOV, is based on an intermediate representation, the visualvocabulary, which is built on the the top of the low-level feature space. In our experiments we used two typesof low-level features, the SIFT-like Orientation Histograms (ORH) and the local color (RGB) statistics (LCS)proposed in [18] and built an independent visual vocabulary for both of them.
The visual vocabulary was modeled by a Gaussian Mixture model (GMM) p(u|λ) =∑Ni=1 wiN (u|µi,Σi),
where λ = {wi, µi,Σi; i = 1, . . . , N} is the set of all parameters of the GMM and each Gaussian corresponds toa visual word. In the case of BOV representation, the low-level descriptors {ut; t = 1, . . . , T} of an image dv ,are transformed into a high-levelN dimensional descriptor, γ(dv), by accumulating over all low-level descriptorsand for each Gaussian, the probabilities of generating a descriptor :
γ(dv) = [
T∑t=1
γ1(ut),
T∑t=1
γ2(ut), . . . ,
T∑t=1
γN (ut)] (32)
where
γi(ut) =wiN (ut|µi,Σi)∑Nj=1 wjN (ut|µj ,Σj)
. (33)
The Fisher Vector [48] extends this BOV representation by going beyond counting measures (0-order statis-tics) and by encoding statistics (up to the second order) about the distribution of local descriptors assigned to eachvisual word. It rather characterizes the low-level features {ut}t=1,...,T of an image dv by its deviation from theGMM distribution :
Gλ(dv) =1
T
T∑t=1
∇λ log
N∑j=1
wjN (ut|µj ,Σj)
(34)
To compare two images dv (or qv) and d′v from two multimedia documents d (or respectively the query q) andd′, a natural kernel on these gradients is the Fisher Kernel [48] :
sv(dv, d′v) = Gλ(dv)
>F−1λ Gλ(d′v), (35)
where Fλ is the Fisher Information Matrix. As F−1λ is symmetric and positive definite, it has a Cholesky decom-position denoted by L>λLλ. Therefore sv(dv, d′v) can be rewritten as a dot-product between normalized vectorsusing the mapping Γλ with :
Γλ(dv) = Lλ ·Gλ(dv) (36)
31

which we refer to as the Fisher Vector (FV) of the image dv .As suggested in [49], we further used a square-rooted and L2 normalized versions of the FV and also built a
spatial pyramid [38]. Regarding this latter point, we repeatedly subdivide the image into 1, 3 and 4 regions : weconsider the FV of the whole image (1x1); the concatenation of 3 FV extracted for the top, middle and bottomregions (1x3) and finally, the concatenation of four FV one for each quadrants (2x2). In other words, the spatialpyramid (SP) we obtained for each image considering both LCS and ORH features is given by 8 + 8 = 16 FV.We used the dot product (linear kernel) to compute the similarity between the concatenation20 of all FV for ORHand LCS.
References[1] J. Ah-Pine, M. Bressan, S. Clinchant, G. Csurka, Y. Hoppenot, and J.M. Renders. Crossing textual and
visual content in different application scenarios. Multimedia Tools and Applications, 42(1):31–56, 2009.
[2] J. Ah-Pine, C. Cifarelli, S. Clinchant, G. Csurka, and J.M. Renders. XRCE’s participation to ImageCLEF2008. In Working Notes of CLEF 2008, September 2008.
[3] J. Ah-Pine, S. Clinchant, G. Csurka, and Yan Liu. XRCE’s participation to ImageCLEF 2009. In WorkingNotes of the 2009 CLEF Workshop, September 2009.
[4] J. Ah-Pine, S. Clinchant, G. Csurka, F. Perronnin, and J-M. Renders. Leveraging image, text and cross-media similarities for diversity-focused multimedia retrieval, chapter 3.4. Volume INRE of etal [45], 2010.
[5] Julien Ah-Pine, Stephane Clinchant, and Gabriela Csurka. Comparison of several combinations of multi-modal and diversity seeking methods for multimedia retrieval. In Multilingual Information Access Evalua-tion, Lecture Notes in Computer Science (LNCS). Springer, 2010.
[6] Joan Benavent, Xaro Benavent, Esther de Ves, Ruben Granados, and Ana Garcia-Serrano. Experiences atImageCLEF 2010 using CBIR and TBIR Mixing Information Approaches. In Braschler et al. [8].
[7] Adam L. Berger and John D. Lafferty. Information retrieval as statistical translation. In Proceedings of the22nd Annual International ACM SIGIR Conference on Research and Development in Information Retrieval,pages 222–229. ACM, 1999.
[8] Martin Braschler, Donna Harman, and Emanuele Pianta, editors. CLEF 2010 LABs and Workshops, Note-book Papers, 22-23 September 2010, Padua, Italy, 2010.
[9] S. Brin and L. Page. The anatomy of a large-scale hypertextual web search engine. Computer Networks andISDN Systems, 30:107–117, 1998.
[10] Sergey Brin and Lawrence Page. The anatomy of a large-scale hypertextual web search engine. Comput.Netw. ISDN Syst., 30(1-7):107–117, April 1998.
[11] Eric Bruno, Nicolas Moënne-Loccoz, and Stéphane Marchand-Maillet. Design of multimodal dissimilarityspaces for retrieval of video documents. PAMI, 30(9):1520–1533, 2008.
[12] Juan C. Caicedo, Jose G. Moreno, Edwin A. Niño, and Fabio A. González. Combining visual features andtext data for medical image retrieval using latent semantic kernels. In Multimedia Information Retrieval,2010.
[13] K. Chatfield, V. Lempitsky, A. Vedaldi, and A. Zisserman. The devil is in the details: an evaluation of recentfeature encoding methods. In BMVC, 2011.
[14] S. Clinchant, J.-M. Renders, and G. Csurka. Trans–media pseudo–relevance feedback methods in multime-dia retrieval. In Advances in Multilingual and Multimodal Information Retrieval, volume 5152 of LectureNotes in Computer Science (LNCS), pages 569–576. Springer, 2008.
20Note that we do not need to explicitly concatenate all these vectors as 〈[u, v], [u′, v′]〉 = 〈u, u′〉+ 〈v, v′〉.
32

[15] S. Clinchant, J.M. Renders, and G. Csurka. XRCE’s participation to ImageCLEF . In CLEF Working Notes,2007.
[16] Stéphane Clinchant, Julien Ah-Pine, and Gabriela Csurka. Semantic combination of textual and visualinformation in multimedia retrieval. In ACM International Conference on Multimedia Retrieval (ICMR),2011.
[17] Stéphane Clinchant, Gabriela Csurka, Julien Ah-Pine, Guillaume Jacquet, Florent Perronnin, Jorge Sánchez,and Keyvan Minoukadeh. Xrce’s participation in wikipedia retrieval, medical image modality classificationand ad-hoc retrieval tasks of imageclef 2010. In CLEF (Notebook Papers/LABs/Workshops), 2010.
[18] Stephane Clinchant, Gabriela Csurka, Florent Perronnin, and Jean-Michel Renders. XRCE’s participationto ImagEval. In ImageEval Workshop at CVIR, 2007.
[19] Stéphane Clinchant and Eric Gaussier. Information-based models for ad hoc IR. In SIGIR. ACM, 2010.
[20] Stéphane Clinchant, Cyril Goutte, and Éric Gaussier. Lexical entailment for information retrieval. InAdvances in Information Retrieval, 28th European Conference on IR Research, ECIR 2006, London, UK,April 10-12, pages 217–228, 2006.
[21] Nick Craswell and Martin Szummer. Random walks on the click graph. In Proceedings of the 30th annualinternational ACM SIGIR conference on Research and development in information retrieval, SIGIR ’07,pages 239–246, New York, NY, USA, 2007. ACM.
[22] G. Csurka, C. Dance, L. Fan, J. Willamowski, and C. Bray. Visual categorization with bags of keypoints. InECCV Workshop on Statistical Learning for Computer Vision, 2004.
[23] Gabriela Csurka and Stéphane Clinchant. An empirical study of fusion operators for multimodal imageretrieval. In CBMI, 2012.
[24] Gabriela Csurka, Stéphane Clinchant, and Adrian Popescu. Xrce’s participation at wikipedia retrieval ofimageclef 2011. In CLEF (Notebook Papers/Labs/Workshop), 2011.
[25] Hugo Jair Escalante, Carlos A. Hernández, Luis Enrique Sucar, and Manuel Montes y Gómez. Late fusionof heterogeneous methods for multimedia image retrieval. In MIR, 2008.
[26] Massimo Franceschet. Pagerank: Standing on the shoulders of giants. Communications of the ACM, 54(6),2011.
[27] Yue Gao, Meng Wang, Zheng-Jun Zha, Jialie Shen, Xuelong Li, and Xindong Wu. Visual-textual jointrelevance learning for tag-based social image search. Image Processing, IEEE Transactions on, 22(1):363–376, 2013.
[28] Michael Grubinger, Paul D. Clough, Henning Müller, and Thomas Deselaers. The IAPR Benchmark: ANew Evaluation Resource for Visual Information Systems. In International Conference on Language Re-sources and Evaluation, Genoa, Italy, 2006.
[29] Winston H. Hsu, Lyndon S. Kennedy, and Shih-Fu Chang. Video search reranking via information bottle-neck principle. In ACM Multimedia, pages 35–44, 2006.
[30] Winston H. Hsu, Lyndon S. Kennedy, and Shih-Fu Chang. Reranking methods for visual search. IEEEMultiMedia, 14(3):14–22, 2007.
[31] Winston H. Hsu, Lyndon S. Kennedy, and Shih-Fu Chang. Video search reranking through random walkover document-level context graph. In ACM Multimedia, pages 971–980, 2007.
[32] J. Jeon, V. Lavrenko, and R. Manmatha. Automatic image annotation and retrieval using cross-mediarelevance models. In Proceedings of the 26th annual international ACM SIGIR conference on Researchand development in informaion retrieval, SIGIR ’03, pages 119–126, New York, NY, USA, 2003. ACM.
33

[33] Maryam Karimzadehgan and ChengXiang Zhai. Estimation of statistical translation models based on mutualinformation for ad hoc information retrieval. In Fabio Crestani, Stéphane Marchand-Maillet, Hsin-Hsi Chen,Efthimis N. Efthimiadis, and Jacques Savoy, editors, SIGIR, pages 323–330. ACM, 2010.
[34] Jon M. Kleinberg. Authoritative sources in a hyperlinked environment. J. ACM, 46(5):604–632, September1999.
[35] Josip Krapac, Moray Allan, Jakob Verbeek, and Frédéric Jurie. Improving web-image search results usingquery-relative classifiers. In IEEE Conference on Computer Vision & Pattern Recognition (CVPR ’10),pages 1094–1101, San Francisco, United States, 2010. IEEE Computer Society.
[36] Amy N. Langville and Carl D. Meyer. A survey of eigenvector methods for web information retrieval. SIAMRev., 47(1):135–161, January 2005.
[37] V. Lavrenko, R. Manmatha, and J. Jeon. A model for learning the semantics of pictures. In NIPS, 2003.
[38] S. Lazebnik, C. Schmid, and J. Ponce. Beyond bags of features: Spatial pyramid matching for recognizingnatural scene categories. In CVPR, 2006.
[39] Tie-Yan Liu. Learning to rank for information retrieval. Found. Trends Inf. Retr., 3(3):225–331, March2009.
[40] Hao Ma, Jianke Zhu, Michael R. Lyu, and Irwin King. Bridging the semantic gap between image contentsand tags. IEEE Transactions on Multimedia, 12(5):462–473, 2010.
[41] João Magalhães and Stefan M. Rüger. An information-theoretic framework for semantic-multimedia re-trieval. ACM Trans. Inf. Syst., 28(4):19, 2010.
[42] Nicolas Maillot, Jean-Pierre Chevallet, and Joo-Hwee Lim. Inter-media pseudo-relevance feedback appli-cation to imageclef 2006 photo retrieval. In Carol Peters, Paul Clough, Fredric C. Gey, Jussi Karlgren,Bernardo Magnini, Douglas W. Oard, Maarten de Rijke, and Maximilian Stempfhuber, editors, CLEF, vol-ume 4730 of Lecture Notes in Computer Science, pages 735–738. Springer, 2006.
[43] Y. Mori, H. Takahashi, and R. Oka. Image–to–word transformation based on dividing and vector quantizingimages with words. 1999.
[44] Nobuyuki Morioka and Jingdong Wang. Robust visual reranking via sparsity and ranking constraints. InACM Multimedia, pages 533–542, 2011.
[45] H. Müller, P. Clough, Th. Deselaers, and B. Caputo, editors. ImageCLEF- Experimental Evaluation inVisual Information Retrieval, volume INRE. Springer, 2010.
[46] Apostol (Paul) Natsev, Alexander Haubold, Jelena Tešic, Lexing Xie, and Rong Yan. Semantic concept-based query expansion and re-ranking for multimedia retrieval. In Proceedings of the 15th internationalconference on Multimedia, MULTIMEDIA ’07, pages 991–1000, New York, NY, USA, 2007. ACM.
[47] Jia-Yu Pan, Hyung-Jeong Yang, Christos Faloutsos, and Pinar Duygulu. Automatic multimedia cross-modalcorrelation discovery. In KDD, pages 653–658, 2004.
[48] F. Perronnin and C. Dance. Fisher Kernels on visual vocabularies for image categorization. In CVPR. IEEE,2007.
[49] F. Perronnin, J. Sánchez, and Thomas Mensink. Improving the Fisher Kernel for large-scale image classifi-cation. In ECCV, 2010.
[50] A. Popescu, T. Tsikrika, and J. Kludas. Overview Of The Wikipedia Retrieval Task At ImageCLEF 2010. InWorking notes of the 11th Workshop of the Cross-Language Evaluation Forum. CLEF-campaign, September2010.
[51] Adrian Popescu. Télécom bretagne at ImageCLEF WikipediaMM 2010. In Braschler et al. [8].
34

[52] Nikhil Rasiwasia, Jose Costa Pereira, Emanuele Coviello, Gabriel Doyle, Gert R. G. Lanckriet, Roger Levy,and Nuno Vasconcelos. A new approach to cross-modal multimedia retrieval. In ACM Multimedia, 2010.
[53] Sergio Rodriguez-Vaamonde, Lorenzo Torresani, and Andrew Fitzgibbon. What can pictures tell us aboutweb pages?: improving document search using images. In Proceedings of the 36th international ACMSIGIR conference on Research and development in information retrieval, SIGIR ’13, pages 849–852, NewYork, NY, USA, 2013. ACM.
[54] Stefan Rueger. Multimedia Information Retrieval. Morgan and Claypool Publishers, 1st edition, 2010.
[55] Ian Ruthven and Mounia Lalmas. A survey on the use of relevance feedback for information access systems.The Knowledge Engineering Review, 18(02):95–145, 2003.
[56] J. S. Sivic and A. Zisserman. Video Google: A text retrieval approach to object matching in videos. InICCV, 2003.
[57] Alan F. Smeaton, Paul Over, and Wessel Kraaij. Evaluation campaigns and TRECVid. In MIR ’06: Pro-ceedings of the 8th ACM International Workshop on Multimedia Information Retrieval, pages 321–330,New York, NY, USA, 2006. ACM Press.
[58] C. G. M. Snoek, M. Worring, and A. W. M. Smeulders. Early versus late fusion in semantic video analysis.In ACM International Conference on Multimedia, pages 399U–402, 2005.
[59] Xinmei Tian, Linjun Yang, Jingdong Wang, Yichen Yang, Xiuqing Wu, and Xian-Sheng Hua. Bayesianvideo search reranking. In ACM Multimedia, pages 131–140, 2008.
[60] A. Vinokourov, D. R. Hardoon, and J. Shawe-Taylor. Learning the semantics of multimedia content withapplication to web image retrieval and classification. 2003.
[61] Meng Wang, Xian-Sheng Hua, Richang Hong, Jinhui Tang, G.-J. Qi, and Yan Song. Unified video annota-tion via multigraph learning. Circuits and Systems for Video Technology, IEEE Transactions on, 19(5):733–746, 2009.
[62] Meng Wang, Xian-Sheng Hua, Jinhui Tang, and Richang Hong. Beyond distance measurement: Construct-ing neighborhood similarity for video annotation. Multimedia, IEEE Transactions on, 11(3):465–476, 2009.
[63] Meng Wang, Hao Li, Dacheng Tao, Ke Lu, and Xindong Wu. Multimodal graph-based reranking for webimage search. Image Processing, IEEE Transactions on, 21(11):4649–4661, 2012.
[64] Xin-Jing Wang, Wei-Ying Ma, Gui-Rong Xue, and Xing Li. Multi-model similarity propagation and itsapplication for web image retrieval. In ACM Multimedia, pages 944–951, 2004.
[65] Peter Wilkins, Alan F. Smeaton, and Paul Ferguson. Properties of optimally weighted data fusion in cb-mir. In Proceedings of the 33rd international ACM SIGIR conference on Research and development ininformation retrieval, SIGIR ’10, pages 643–650, New York, NY, USA, 2010. ACM.
[66] Linjun Yang and Alan Hanjalic. Supervised reranking for web image search. In ACM Multimedia, pages183–192, 2010.
[67] Zheng-Jun Zha, Meng Wang, Jialie Shen, and Tat-Seng Chua. Text mining in multimedia. In Mining TextData, pages 361–384. 2012.
35