
University of Groningen The guarded brain Klerk, Onno ...
189
University of Groningen The guarded brain Klerk, Onno Leonardus de IMPORTANT NOTE: You are advised to consult the publisher's version (publisher's PDF) if you wish to cite from it. Please check the document version below. Document Version Publisher's PDF, also known as Version of record Publication date: 2011 Link to publication in University of Groningen/UMCG research database Citation for published version (APA): Klerk, O. L. D. (2011). The guarded brain: the role of P-glycoprotein at the blood-brain barrier in major psychiatric disorders and antidepressant treatment. s.n. Copyright Other than for strictly personal use, it is not permitted to download or to forward/distribute the text or part of it without the consent of the author(s) and/or copyright holder(s), unless the work is under an open content license (like Creative Commons). The publication may also be distributed here under the terms of Article 25fa of the Dutch Copyright Act, indicated by the “Taverne” license. More information can be found on the University of Groningen website: https://www.rug.nl/library/open-access/self-archiving-pure/taverne- amendment. Take-down policy If you believe that this document breaches copyright please contact us providing details, and we will remove access to the work immediately and investigate your claim. Downloaded from the University of Groningen/UMCG research database (Pure): http://www.rug.nl/research/portal. For technical reasons the number of authors shown on this cover page is limited to 10 maximum. Download date: 24-01-2022
-
Upload
khangminh22 -
Category
Documents
-
view
0 -
download
0
Transcript of University of Groningen The guarded brain Klerk, Onno ...

University of Groningen
The guarded brainKlerk, Onno Leonardus de
IMPORTANT NOTE: You are advised to consult the publisher's version (publisher's PDF) if you wish to cite fromit. Please check the document version below.
Document VersionPublisher's PDF, also known as Version of record
Publication date:2011
Link to publication in University of Groningen/UMCG research database
Citation for published version (APA):Klerk, O. L. D. (2011). The guarded brain: the role of P-glycoprotein at the blood-brain barrier in majorpsychiatric disorders and antidepressant treatment. s.n.
CopyrightOther than for strictly personal use, it is not permitted to download or to forward/distribute the text or part of it without the consent of theauthor(s) and/or copyright holder(s), unless the work is under an open content license (like Creative Commons).
The publication may also be distributed here under the terms of Article 25fa of the Dutch Copyright Act, indicated by the “Taverne” license.More information can be found on the University of Groningen website: https://www.rug.nl/library/open-access/self-archiving-pure/taverne-amendment.
Take-down policyIf you believe that this document breaches copyright please contact us providing details, and we will remove access to the work immediatelyand investigate your claim.
Downloaded from the University of Groningen/UMCG research database (Pure): http://www.rug.nl/research/portal. For technical reasons thenumber of authors shown on this cover page is limited to 10 maximum.
Download date: 24-01-2022

The Guarded Brain
The role of P-glycoprotein at the blood-brain barrier in major
psychiatric disorders and antidepressant treatment
Onno de Klerk

The studies presented in chapters 4 and 8 were financially supported by GGZ Drenthe.
Concerning the NESDA studies (chapter 6 & 7), Funding support was provided by
Center for Medical systems Biology (NWO Genomics); the Geestkracht program of
ZonMW (10-000-1002), and institutes involved in NESDA (VU University Medical
Center, Leiden University Medical Center, GGZ InGeest, Rivierduinen, University
Medical Center Groningen, GGZ Lentis, GGZ Friesland, GGZ Drenthe). The
genotyping of the samples was provided through the Genetic Association Information
Network (GAIN).
Publication of this thesis was financially supported by:
Lundbeck BV
Servier
GGZ Drenthe
University of Groningen
Cover photo: Lighthouse Reef, Belize or ‘Barrier Bank of Belize’ (BBB)
Printed by: Ridderprint, Ridderkerk, the Netherlands
ISBN: 978-90-5335-468-1
Copyright © 2011 Onno de Klerk

RIJKSUNIVERSITEIT GRONINGEN
The Guarded Brain
The role of P-glycoprotein at the blood-brain barrier in major psychiatric disorders and
antidepressant treatment
Proefschrift
ter verkrijging van het doctoraat in de
Medische Wetenschappen
aan de Rijksuniversiteit Groningen
op gezag van de
Rector Magnificus, dr. E. Sterken,
in het openbaar te verdedigen op
woensdag 21 december 2011
om 16.15 uur
door
Onno Leonardus de Klerk
geboren op 19 januari 1967
te Gouda

promotores: prof. dr. J.A. den Boer
prof. dr. R.A.J.O. Dierckx
copromotores: dr. F.J. Bosker
dr. A.T.M. Willemsen
beoordelingscommissie: prof. dr. J. Booij
prof. dr. P.G.M. Luiten
prof. dr. R. Schoevers

paranimfen: Pieter Hoekstra
Christian Hulzebos


Contents
Chapter 1 Introduction 9
Chapter 2 The blood-brain barrier 15
Chapter 3 The role of P-glycoprotein in psychiatric disorders:
a trustful guard of the brain? 27
Chapter 4 Locally increased P-glycoprotein function in major 55
depression. A PET study with [11C]-verapamil as a probe
for P-glycoprotein function in the blood-brain barrier.
Chapter 5 Regional increase in P-glycoprotein function in the 73
A PET study with [11C]-verapamil as a probe for
P-glycoprotein function....
Chapter 6 ABCB1 gene variants may indicate susceptibility in major 89
depressive disorder
Chapter 7 ABCB1 gene variants influence tolerance to selective 103
serotonergic reuptake inhibitors in a large sample of
Dutch cases with major depressive disorder
Chapter 8 Opposite effects of chronic stress and antidepressant 119
treatment on the efflux pump P-glycoprotein at the
blood-brain barrier: an experimental PET study in rats
Chapter 9 Distribution and expression of P-glycoprotein at the 135
blood-brain barrier in different conditions
Chapter 10 General discussion and concluding remarks 147
Nederlandse samenvatting 161
Dankwoord ` 175
List of publications 181
List of abbreviations 185


Chapter 1
Introduction


The brain is the most well protected organ in the body. Externally, the brain is
protected by the bony skull, whereas it is internally protected from blood borne,
potentially toxic substituents by the blood-brain barrier (BBB). The presence of a BBB
has been known since the 1880s when Paul Ehrlich demonstrated its presence through
the use of a vascular dye. Several decades later, it was Spatz,1 who proposed a cerebral
vascular system resembling the contemporary model of the BBB. It was not until the
1960s that Reese and Karnovsky2 and Brightman et al.3 verified this BBB model by
localizing tight junctions in the endothelial cells, with the use of electron microscopy.
Later, the uniqueness of the BBB tight junctions and physiology, relating to capillary
networks of peripheral organs were addressed by Stuart and Wiley.4 They showed that
embryonic quail brain tissue retained its BBB properties when transplanted into
embryonic chick gut tissue. Conversely, capillaries of transplanted quail gut
transplanted into embryonic chick brain were leaky to tryptan blue and did not
maintain BBB characteristics. These elegant experiments supported the belief that the
protective properties of the BBB lie within the endothelial cells and the surrounding
tissue. More recent data have emphasized the characteristics of the BBB as a functional
barrier.5 A major aspect of this functional barrier is the way the transport of molecules
is performed in tight control by protein pumps located at the luminal side of the
capillary wall. Influx is regulated for all molecules, except small, lipophilic and
uncharged molecules can freely pass the BBB. The efflux pump P-glycoprotein (P-gp) is
however capable of extruding many of these molecules. The physiological role of P-gp
presumably involves defence of tissues against xenobiotics or (endogenous) toxic
compounds. In the last decades, the role of the BBB and its components have received
increased attention in psychopathological conditions.
Chapter 2 gives a general review of the blood-brain barrier, including the main
components of the BBB (i.e. endothelial cells, tight junctions, surrounding cells and
neurons). Briefly the main function of separate components are explained and a
concise description of the three main endogenous transport systems is given. One of
these systems is the group of efflux transporters, of which P-glycoprotein (P-gp) is one
of the major efflux proteins, which is shortly introduced. In short, we reflect on the
altered BBB characteristics in neuropathological conditions.
In chapter 3 the localization of P-gp at the BBB and consecutively its function,
structure and transport activity are described. We focus on the relevance of P-gp in
relation to drug disposition of antidepressants and antipsychotics. We discuss the
tentative contribution of P-gp modulation (eg. P-gp as susceptibility factor) in affective
and psychotic disorders and the possible influence of variarion in the coding gene,
ABCB1 (ATP Binding Cassette family, member B1). Other transporters are also
mentioned briefly.
Chapter 4 describes the results of a [11C]-verapamil PET (positron emission
tomography) study in (medicated) patients with a major depressive disorder (MDD).

The same protocol was used to assess the [11C]-verapamil in patients with
schizophrenia, described in Chapter 5. Chapters 6 and 7 are a description of two studies
using the data of the NESDA cohort (NEtherlands Study on Depression and Anxiety).
The effect of variations of the encoding gene for P-gp, ABCB1, on different predictors
of familial aggregation in depression is discussed in chapter 6. This chapter addresses
the possible role of ABCB1 gene variants as susceptibility factor in MDD. In chapter 7
the association between ABCB1 gene variants and the incidence and severity of
reported side effects on antidepressants is discussed. Chapter 8 is a description of an
animal PET study, which is a continuation of the two human studies (chapters 4 and 5)
in which we found a regional increase in P-gp activity. The study was set up to
differentiate between the effects of antidepressant treatment and disease. The effect of
chronic stress on male Wistar rats (as a model for depression) was compared to the
effect of chronic administration of venlafaxine, an antidepressant. The effects were
measured in vivo using [11C]-verapamil as PET tracer. After the PET the rat brains were
collected for western blot analysis and in vitro immunohistochemistry. In the
following chapter (chapter 9) we describe the regional analysis of the effects found in
the animal studies. A reanalysis is done for the PET scans, in order to determine
whether the effects are global or region specific, the latter possibly indicating a disease
specific locus. The results of the in vitro studies has not been finished yet, but may
denote regional or global changes in protein expression. The future perspectives,
relating to further research on the various roles of P-gp may play in psychiatry, are
outlined, including its role in drug disposition and a protective role as part of the BBB.

References
1. Spatz H (1933) Die Bedeutung der vitalen Färbung für die Lehre vom Stoffaustausch zwischen
dem Zentralnervensystem und dem übrigen Körper. Arch f Psychiatr., 101, 267-352.
2. Reese TS, Karnovsky MJ (1967) Fine structural localization of a blood-brain barrier to exogenous
peroxidase. J. Cell Biol., 34, 207-217.
3. Brightman MW, Klatzo I, Olsson Y, Reese TS (1970) The blood-brain barrier to proteins under
normal and pathological conditions. J. Neurol. Sci., 10, 215-239.
4. Stewart PA, Wiley MJ (1981) Developing nervous tissue induces formation of blood-brain barrier
characteristics in invading endothelial cells: A study using quail-chick transplantation chimeras.
Developmental Biology, 84, 183-192.
5. Ohtsuki S (2004) New aspects of the blood-brain barrier transporters; its physiological roles in the
central nervous system. Biol. Pharm. Bull., 27, 1489-1496.


Chapter 2
The blood-brain barrier

Authors:
Onno L. de Klerk1,2
Fokko J. Bosker1
Heidrun Potschka3
1University Center for Psychiatry, University Medical Center Groningen (UMCG), 2GGZ Drenthe, Assen, the Netherlands, 3Inst. of Pharmacology, Toxicology, and Pharmacy, Ludwig-Maximilians-University Munich, Germany
Introduction
The central nervous system requires a perfectly regulated environment, for optimal
activity. The main contribution to this homeostasis is accomplished by the BBB, by
protecting and isolating the nervous tissue from too strong fluctuations in nutrients,
hormones, metabolites, and other solutes. The microenvironment within the brain is
precisely controlled by the BBB, and neuronal transmission is secured in this way.1 It
also protects against the direct influence of potentially harmful endogenous or
exogenous substances. The BBB has to be a stable structure to exert its protective
function, but on the other hand the BBB requires the ability for plastic changes,2 in
order to adapt to fast changing conditions. Several areas, such as the pineal body and
the pituitary, both small endocrine glands in the brain, are not ”behind” the BBB, but
secrete their hormones directly into the systemic circulation.
The protective function of the BBB is exerted in two ways. Until recently the BBB was
largely viewed as an anatomical barrier, preventing the passive diffusion of solutes from
blood to the brain. In addition to being a physical barrier, the BBB is a complex
transport and metabolic barrier due to its highly reactive and dynamic endothelium.
The major components of the anatomical barrier are the specialized non-fenestrated
tightly-joined endothelial cells with tight junctions (see figure 2.1).1,3,4 In the following
paragraphs we will discuss these main components of the BBB.
Components of the BBB
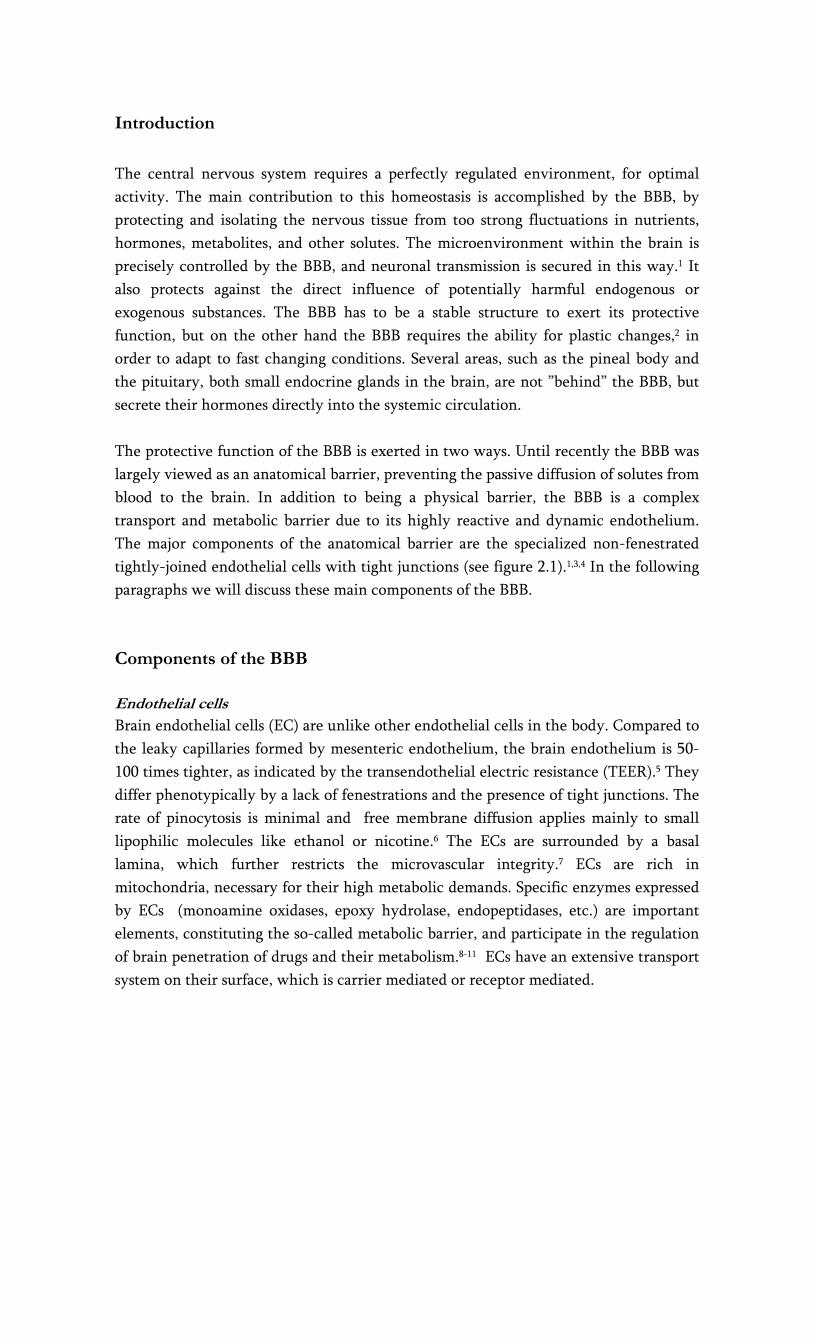
Endothelial cells
Brain endothelial cells (EC) are unlike other endothelial cells in the body. Compared to
the leaky capillaries formed by mesenteric endothelium, the brain endothelium is 50-
100 times tighter, as indicated by the transendothelial electric resistance (TEER).5 They
differ phenotypically by a lack of fenestrations and the presence of tight junctions. The
rate of pinocytosis is minimal and free membrane diffusion applies mainly to small
lipophilic molecules like ethanol or nicotine.6 The ECs are surrounded by a basal
lamina, which further restricts the microvascular integrity.7 ECs are rich in
mitochondria, necessary for their high metabolic demands. Specific enzymes expressed
by ECs (monoamine oxidases, epoxy hydrolase, endopeptidases, etc.) are important
elements, constituting the so-called metabolic barrier, and participate in the regulation
of brain penetration of drugs and their metabolism.8-11 ECs have an extensive transport
system on their surface, which is carrier mediated or receptor mediated.

Tight junctions
Tight junctions are the closely associated areas of two cells whose membranes join
together forming a virtually impermeable barrier to fluid. This is accomplished by their
structure, as it is composed of a branching network of sealing strands, a complex of
transmembrane (junctional adhesion molecule-1, occludin, and claudins) and
cytoplasmic proteins.1,12 Each strand acts independently from the others. Tight
junctions prevent the passage of molecules and ions through the space between cells,
the so called paracellular flux. In order to pass the blood-brain barrier molecules must
enter the endothelial cells. Together with the endothelial cells, the tight junctions play
the most substantial role in maintaining the BBB.13
Astrocytes, microglia and pericytes
Astrocytes, microglia and pericytes surround the endothelial cells, and form the
“second line of defence” in the BBB. Astrocytes are star shaped glia cells, that perform
many functions, including the biochemical support of endothelial cells. Their end-feet,
encircling the endothelial cells aid in the maintenance of the blood-brain barrier, as
they regulate the homeostasis of brain water and electrolytes.1,14 In addition, they
interconnect endothelial cells with surrounding neurons. Astrocytes secrete proteins
that can have an opposite effect on neurons and endothelial cells. For example,
thrombospondin, an astrocyte-derived protein stimulates neurogenesis on the one
hand, while it counteracts the effects of angiogenesis.15 Current in vitro cellular models
for the study of BBB function often incorporate astrocytes with endothelial cells.
Studies have shown that when astrocytes are removed from an in vitro BBB model, an
increased permeability is observed.16 Many transporters (see below) are under the
control of astrocytes.17 In pathological conditions, astrocytes mediate the immune
response, they synthesize proinflammatory cytokines and chemotactic factors, that
eventually trigger the breakdown of the BBB.12 The pericyte, another foremost cell
type in the CNS, intimately embraces the brain endothelial capillary. Less is known
about their role at the BBB, although they seem to stabilize the formation of capillary-
like structures when they are added to a co-culture of astrocytes and endothelial cells.18
Microglia are omnipresent throughout the brain parenchyma. They are the immune
effectors in the CNS, as they can release a large number of immunoregulatory,
inflammatory, and cytotoxic mediators.19 They surround the brain capillaries and stay
in a resting state until they are activated, which can be induced by a variety of
stimuli.20,21 Figure 1 shows the main components of the BBB.

neurons
Neurons lie in close proximity of the brain capillaries and their needs, including
protection and the unrestricted provision of nutrients, are optimally met. Neuronal
tissue needs an abundant supply of oxygen. At rest, 80–92% of its ATP comes from
oxidative metabolism of glucose.22 Given the dynamic nature of neural activity and the
considerable metabolic needs of nervous tissue, the microcirculation of the brain must
be highly responsive to the tissue it supplies. Iadecola found that blood flow was
increased in response to local neuronal activation and proposed a role for nitric oxide as
a messenger between blood and neuronal tissue.23 This "metabolic coupling" of
regional brain activity to blood flow is the basis of functional neuroimaging.24 However,
data from positron emission tomography (PET) and functional MRI studies indicate
that during short-term functional activation, cerebral blood flow and cerebral
metabolism (oxygen consumption) are not directly linked.22,25
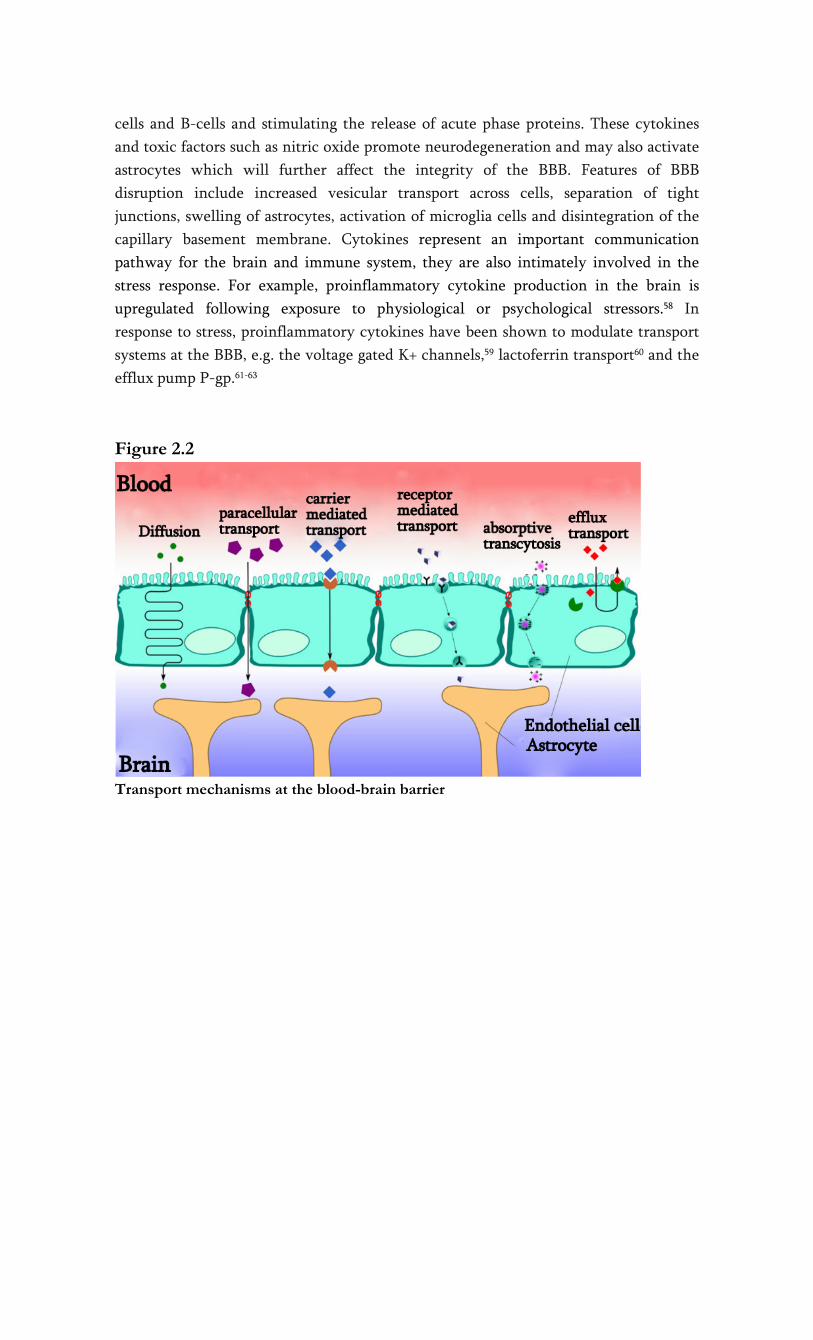
Transport across the BBB
There are two tightly controlled ways of transport for molecules and cells across the
BBB (see figure 2.2). The paracellular route, or junctional route, is restricted by the
interendothelial tight junctions. Tight junctions not only restrict paracellular flux, but
also maintain polarity of enzymes and receptors on luminal (blood) and abluminal
(brain) membrane domains.26,27 Due to the presence of tight junctions, only lipid-
soluble substances or those transported through an active mechanism can cross the
BBB.3,28
The transendothelial route further restricts the passage of molecules by three distinct
transport systems. Small lipid-soluble molecules can penetrate the brain EC through
diffusion, unless their molecular weight exceeds 400-600 Da.29 All other transport to
the brain is via endogenous catalyzed transport systems on the capillary membrane. As
we will describe below, three main transport systems function at the BBB: (1) carrier
mediated transport, which relies on a molecular carrier present on both the luminal
side and the abluminal side of the BBB. (2) receptor-mediated transport for endogenous
large-molecule peptides such as insulin30 or transferrin31 and (3) active efflux
transporters such as P-glycoprotein and many other active efflux transport systems
within the BBB (see figure 2.2).
Carrier mediated transport
Carrier mediated transport is a highly selective form of transport for small molecules
such as ions, glucose and amino acids. Examples of carrier mediated transport systems
include the GLUT1 glucose transporter, the OAT (organic anion transporter) and
organic anion transporting polypeptide family (OATP), the monocarboxylate transport

family and the LAT1 (large neutral amino-acid transporter) 32. This form of BBB
transport is a saturable process which can be unidirectional or bidirectional. Carrier
mediated channels can be gated and can function ion and energy independent, like the
LAT1.33 The membrane spanning pores are highly stereospecific. The substrate forms a
complex with the carrier in order to be translocated to the opposite side of the
membrane.34 L-DOPA is such a drug, that utilizes the LAT1 to enter the brain. Once
transported through the BBB, L-DOPA is reformulated to dopamine.35 Another
example is valproic acid, that is delivered to the brain via a medium-fatty chain
transporter.36 Uptake of valproic acid was reduced in the presence of medium-chain
fatty acids, but not short-chain fatty acids, indicating that valproic acid is taken up by a
transport system for medium-chain fatty acids. The monocarboxylate transport family
also appears to be involved in the transport of valproic acid, possibly as efflux
transporter.32
Figure 2.1
cross section of a brain capillary, depicting the main components -
Receptor mediated transport
Another main transport mechanism at the BBB is receptor-mediated transport, which
involves a vesicular trafficking system of the endothelial cells (fig. 2). The influx of
several brain nutrients like leptin37 and insulin38 occurs by this form of transport.
Circulating molecules are bound to a specific receptor at the plasma membrane, to form
a receptor-ligand complex. When the ligand is bound to the receptor, the process of
invagination is initiated. Dependent on subsequent intracellular processes, the vesicles
are either sent to the basolateral side of the cell, where they are released, or the

complex is dissociated from the ligand in the cell. A similar transport system is called
‘absorptive-mediated transcytosis’ which does not require specific binding to a
receptor. Instead, binding is non-specific, for example to negative charges on the
plasma membrane. The receptor mediated transcytosis offers a promise as drug vector
for drug delivery into the brain.39
Efflux transport
Uncharged, small lipophilic compounds enter the brain much better than other
molecules, because they can diffuse passively across the endothelial cells. However, an
ATP-driven efflux system exists at the luminal wall of the capillary wall, that can
extrude a variety of structurally diverse drugs, drug conjugates and metabolites, and
other compounds from the cell. These efflux proteins involved belong to the
superfamily of ABC (ATP Binding Cassette) transporters, an extensive and functionally
highly diverse family of membrane transporters. Export of these compounds occurs in
an active, ATP-dependent manner, and can take place against a considerable
concentration gradient. 40,41 Thus far, 49 human ABC transporter genes have been
identified.42 They are classified into eight subfamilies (ABCA-ABCH) 43, P-glycoprotein
(P-gp, ABCB1), multidrug resistance protein ABCC subfamily, (formerly denoted as
MRP) ABCC4 and ABCC5 (and possibly ABCC1 and -2, see below)42,44-46 and the breast
cancer related protein (BCRP, ABCG2) have been localized in the apical membrane of
the brain endothelial cell and have a role in efflux at the BBB. Of these, P-gp is the best
studied transport protein. Its most striking property is transport of a wide range of
structurally different substrates, including many CNS drugs. As a consequence, the net
penetration of substrate drugs and other substrate compounds from the blood into the
brain tissue can be dramatically decreased. Various members of the ABCC family show
considerable differences in their tissue distribution, substrate specificity, and proposed
physiological function. These proteins play a role in drug disposition and excretion and
thus are implicated in drug toxicity and drug interactions. ABCC primarily transports
anionic compounds, such as glutathione S- conjugates and oxidized glutathione.47
Furthermore, ABCC transport appears to be dependent upon intracellular glutathione.48
Alteration of BBB permeability in neurodegenerative disorders
Altered BBB integrity is an early event in many neuroinflammatory conditions,
including meningitis, multiple sclerosis, epilepsy and neuropsychiatric disorders.2,49-54
In contrast, Bartels et al. suggested BBB breakdown to be a late event in Parkinson’s
and related diseases.55 Alteration in BBB permeability occurs secondary to cell damage
in trauma, ischemia and stress. An inflammatory response results, with a release of
proinflammatory cytokines such as TNF-α (tumor necrosis factor), IL-1β (interleukine-
1β), IL-6.51,56,57 These three appear to be the main cytokines involved in the regulation
of the acute phase response, by up-regulating cell adhesion molecules, activating T-
cells and B-cells and stimulating the release of acute phase proteins. These cytokines
and toxic factors such as nitric oxide promote neurodegeneration and may also activate
astrocytes which will further affect the integrity of the BBB. Features of BBB
disruption include increased vesicular transport across cells, separation of tight
junctions, swelling of astrocytes, activation of microglia cells and disintegration of the
capillary basement membrane. Cytokines represent an important communication
pathway for the brain and immune system, they are also intimately involved in the
stress response. For example, proinflammatory cytokine production in the brain is
upregulated following exposure to physiological or psychological stressors.58 In
response to stress, proinflammatory cytokines have been shown to modulate transport
systems at the BBB, e.g. the voltage gated K+ channels,59 lactoferrin transport60 and the
efflux pump P-gp.61-63
Figure 2.2
Transport mechanisms at the blood-brain barrier

References
1. Hawkins BT, Davis TP (2005) The blood-brain barrier/neurovascular unit in health and disease.
Pharmacol. Rev., 57, 173-185.
2. Chaudhuri JD (2000) Blood brain barrier and infection. Med. Sci. Monit., 6, 1213-1222.
3. Bernacki J, Dobrowolska A, Nierwinska K, Malecki A (2008) Physiology and pharmacological
role of the blood-brain barrier. Pharmacol. Rep., 60, 600-622.
4. Grant GA, Abbott NJ, Janigro D (1998) Understanding the Physiology of the Blood-Brain
Barrier: In Vitro Models. News Physiol Sci., 13, 287-293.
5. Abbott NJ (1998) In Pardridge WM (ed.), Introduction to the Blood-Barin Barrier. Cambridge
University Press, Cambridge, pp. 345-353.
6. Pardridge WM (2002) Neurotrophins, neuroprotection and the blood-brain barrier. Curr. Opin.
Investig. Drugs, 3, 1753-1757.
7. Hamann GF, Schimrigk K (1995) What is the relevance of the endothelins in subarachnoid
haemorrhage? J. Neurol. Neurosurg. Psychiatry, 58, 392.
8. Henry CB, Duling BR (1999) Permeation of the luminal capillary glycocalyx is determined by
hyaluronan. Am. J. Physiol, 277, H508-H514.
9. Leung JW, Chung SS, Chung SK (2009) Endothelial endothelin-1 over-expression using receptor
tyrosine kinase tie-1 promoter leads to more severe vascular permeability and blood brain
barrier breakdown after transient middle cerebral artery occlusion. Brain Res., 1266, 121-129.
10. Li Q, Bolli R, Qiu Y, Tang XL, Murphree SS, French BA (1998) Gene therapy with extracellular
superoxide dismutase attenuates myocardial stunning in conscious rabbits. Circulation, 98, 1438-
1448.
11. Pardridge WM (2002) Drug and gene delivery to the brain: the vascular route. Neuron, 36, 555-
558.
12. Jiang S, Su C, Ballok D (2008) In Helio TR (ed.), The blood brain barrier. Nova Science
Publishers, New York, pp. 153-168.
13. Banerjee S, Bhat MA (2007) Neuron-glial interactions in blood-brain barrier formation. Annu.
Rev. Neurosci., 30, 235-258.
14. Abbott NJ, Ronnback L, Hansson E (2006) Astrocyte-endothelial interactions at the blood-brain
barrier. Nat. Rev. Neurosci., 7, 41-53.
15. Choi YK, Kim KW (2008) Blood-neural barrier: its diversity and coordinated cell-to-cell
communication. BMB. Rep., 41, 345-352.
16. Hamm S, Dehouck B, Kraus J, Wolburg-Buchholz K, Wolburg H, Risau W, Cecchelli R,
Engelhardt B, Dehouck MP (2004) Astrocyte mediated modulation of blood-brain barrier
permeability does not correlate with a loss of tight junction proteins from the cellular contacts.
Cell Tissue Res., 315, 157-166.
17. Omidi Y, Barar J, Ahmadian S, Heidari HR, Gumbleton M (2008) Characterization and
astrocytic modulation of system L transporters in brain microvasculature endothelial cells. Cell
Biochem. Funct., 26, 381-391.
18. Ramsauer M, Krause D, Dermietzel R (2002) Angiogenesis of the blood-brain barrier in vitro
and the function of cerebral pericytes. FASEB J., 16, 1274-1276.
19. Dheen ST, Kaur C, Ling EA (2007) Microglial activation and its implications in the brain
diseases. Curr. Med. Chem., 14, 1189-1197.
20. Dijkstra IM, Hulshof S, van d, V, Boddeke HW, Biber K (2004) Cutting edge: activity of human
adult microglia in response to CC chemokine ligand 21. J. Immunol., 172, 2744-2747.
21. Guillemin GJ, Brew BJ (2004) Microglia, macrophages, perivascular macrophages, and pericytes:
a review of function and identification. J. Leukoc. Biol., 75, 388-397.
22. Mintun MA, Lundstrom BN, Snyder AZ, Vlassenko AG, Shulman GL, Raichle ME (2001) Blood
flow and oxygen delivery to human brain during functional activity: theoretical modeling and
experimental data. Proc. Natl. Acad. Sci. U. S. A, 98, 6859-6864.
23. Iadecola C (1993) Regulation of the cerebral microcirculation during neural activity: is nitric
oxide the missing link? Trends Neurosci., 16, 206-214.

24. Buxton RB, Frank LR, Wong EC, Siewert B, Warach S, Edelman RR (1998) A general kinetic
model for quantitative perfusion imaging with arterial spin labeling. Magn Reson. Med., 40,
383-396.
25. Fox PT, Raichle ME, Mintun MA, Dence C (1988) Nonoxidative glucose consumption during
focal physiologic neural activity. Science, 241, 462-464.
26. Matter K, Balda MS (2003) Functional analysis of tight junctions. Methods, 30, 228-234.
27. Wolburg H, Lippoldt A (2002) Tight junctions of the blood-brain barrier: development,
composition and regulation. Vascul. Pharmacol., 38, 323-337.
28. O'Kane RL, Martinez-Lopez I, DeJoseph MR, Vina JR, Hawkins RA (1999) Na(+)-dependent
glutamate transporters (EAAT1, EAAT2, and EAAT3) of the blood-brain barrier. A mechanism
for glutamate removal. J. Biol. Chem., 274, 31891-31895.
29. Pardridge WM (2006) Molecular Trojan horses for blood-brain barrier drug delivery. Curr.
Opin. Pharmacol., 6, 494-500.
30. Duffy KR, Pardridge WM (1987) Blood-brain barrier transcytosis of insulin in developing
rabbits. Brain Res., 420, 32-38.
31. Jefferies WA, Brandon MR, Hunt SV, Williams AF, Gatter KC, Mason DY (1984) Transferrin
receptor on endothelium of brain capillaries. Nature, 312, 162-163.
32. Tsuji A (2005) Small molecular drug transfer across the blood-brain barrier via carrier-mediated
transport systems. NeuroRx., 2, 54-62.
33. Smith QR, Stoll J (1998) In Pardridge WM (ed.), Introduction to the BLood-Brain Barrier.
Cambridge University Press, Cambridge, pp. 188-197.
34. Diamond DL, Carruthers A (1993) Metabolic control of sugar transport by derepression of cell
surface glucose transporters. An insulin-independent recruitment-independent mechanism of
regulation. J. Biol. Chem., 268, 6437-6444.
35. Kanai Y, Endou H (2003) Functional properties of multispecific amino acid transporters and
their implications to transporter-mediated toxicity. J. Toxicol. Sci., 28, 1-17.
36. Adkison KD, Shen DD (1996) Uptake of valproic acid into rat brain is mediated by a medium-
chain fatty acid transporter. J. Pharmacol. Exp. Ther., 276, 1189-1200.
37. Ziylan YZ, Baltaci AK, Mogulkoc R (2009) Leptin transport in the central nervous system. Cell
Biochem. Funct., 27, 63-70.
38. Patel MM, Goyal BR, Bhadada SV, Bhatt JS, Amin AF (2009) Getting into the brain: approaches
to enhance brain drug delivery. CNS. Drugs, 23, 35-58.
39. Jones AR, Shusta EV (2007) Blood-brain barrier transport of therapeutics via receptor-
mediation. Pharm. Res., 24, 1759-1771.
40. Borst P, Evers R, Kool M, Wijnholds J (2000) A family of drug transporters: the multidrug
resistance-associated proteins. J. Natl. Cancer Inst., 92, 1295-1302.
41. Schinkel AH, Jonker JW (2003) Mammalian drug efflux transporters of the ATP binding cassette
(ABC) family: an overview. Adv. Drug Deliv. Rev., 55, 3-29.
42. Zhou SF, Wang LL, Di YM, Xue CC, Duan W, Li CG, Li Y (2008) Substrates and inhibitors of
human multidrug resistance associated proteins and the implications in drug development. Curr.
Med. Chem., 15, 1981-2039.
43. Dean M (2009) ABC transporters, drug resistance, and cancer stem cells. J. Mammary. Gland.
Biol. Neoplasia., 14, 3-9.
44. Leslie EM, Deeley RG, Cole SP (2005) Multidrug resistance proteins: role of P-glycoprotein,
MRP1, MRP2, and BCRP (ABCG2) in tissue defense. Toxicol. Appl. Pharmacol., 204, 216-237.
45. Yu XQ, Xue CC, Wang G, Zhou SF (2007) Multidrug resistance associated proteins as
determining factors of pharmacokinetics and pharmacodynamics of drugs. Curr. Drug Metab, 8,
787-802.
46. Zhang Y, Schuetz JD, Elmquist WF, Miller DW (2004) Plasma membrane localization of
multidrug resistance-associated protein homologs in brain capillary endothelial cells. J.
Pharmacol. Exp. Ther., 311, 449-455.

47. Jedlitschky G, Leier I, Buchholz U, Center M, Keppler D (1994) ATP-dependent transport of
glutathione S-conjugates by the multidrug resistance-associated protein. Cancer Res., 54, 4833-
4836.
48. Renes J, de Vries EG, Nienhuis EF, Jansen PL, Muller M (1999) ATP- and glutathione-
dependent transport of chemotherapeutic drugs by the multidrug resistance protein MRP1. Br.
J. Pharmacol., 126, 681-688.
49. Correale J, Villa A (2007) The blood-brain-barrier in multiple sclerosis: functional roles and
therapeutic targeting. Autoimmunity, 40, 148-160.
50. Floris S, Blezer EL, Schreibelt G, Dopp E, van der Pol SM, Schadee-Eestermans IL, Nicolay K,
Dijkstra CD, de Vries HE (2004) Blood-brain barrier permeability and monocyte infiltration in
experimental allergic encephalomyelitis: a quantitative MRI study. Brain, 127, 616-627.
51. Neuwelt EA (2004) Mechanisms of disease: the blood-brain barrier. Neurosurgery, 54, 131-140.
52. Rothermundt M, Arolt V, Bayer TA (2001) Review of immunological and immunopathological
findings in schizophrenia. Brain Behav. Immun., 15, 319-339.
53. Schiepers OJ, Wichers MC, Maes M (2005) Cytokines and major depression. Prog.
Neuropsychopharmacol. Biol. Psychiatry, 29, 201-217.
54. Wichers M, Maes M (2002) The psychoneuroimmuno-pathophysiology of cytokine-induced
depression in humans. Int. J. Neuropsychopharmacol., 5, 375-388.
55. Bartels AL, Willemsen AT, Kortekaas R, de Jong BM, De VR, de KO, van Oostrom JC, Portman
A, Leenders KL (2008) Decreased blood-brain barrier P-glycoprotein function in the progression
of Parkinson's disease, PSP and MSA. J. Neural Transm., 115, 1001-1009.
56. Ho EA, Piquette-Miller M (2006) Regulation of multidrug resistance by pro-inflammatory
cytokines. Curr. Cancer Drug Targets., 6, 295-311.
57. Koprich JB, Reske-Nielsen C, Mithal P, Isacson O (2008) Neuroinflammation mediated by IL-
1beta increases susceptibility of dopamine neurons to degeneration in an animal model of
Parkinson's disease. J. Neuroinflammation., 5, 8.
58. Frank MG, Baratta MV, Sprunger DB, Watkins LR, Maier SF (2007) Microglia serve as a
neuroimmune substrate for stress-induced potentiation of CNS pro-inflammatory cytokine
responses. Brain Behav. Immun., 21, 47-59.
59. Gendelman HE, Ding S, Gong N, Liu J, Ramirez SH, Persidsky Y, Mosley RL, Wang T, Volsky
DJ, Xiong H (2009) Monocyte chemotactic protein-1 regulates voltage-gated K+ channels and
macrophage transmigration. J. Neuroimmune. Pharmacol., 4, 47-59.
60. Fillebeen C, Dehouck B, Benaissa M, Dhennin-Duthille I, Cecchelli R, Pierce A (1999) Tumor
necrosis factor-alpha increases lactoferrin transcytosis through the blood-brain barrier. J.
Neurochem., 73, 2491-2500.
61. Bauer B, Hartz AM, Miller DS (2007) Tumor necrosis factor alpha and endothelin-1 increase P-
glycoprotein expression and transport activity at the blood-brain barrier. Mol. Pharmacol., 71,
667-675.
62. Hartz AM, Bauer B, Fricker G, Miller DS (2006) Rapid modulation of P-glycoprotein-mediated
transport at the blood-brain barrier by tumor necrosis factor-alpha and lipopolysaccharide. Mol.
Pharmacol., 69, 462-470.
63. Hartz AM, Bauer B, Block ML, Hong JS, Miller DS (2008) Diesel exhaust particles induce
oxidative stress, proinflammatory signaling, and P-glycoprotein up-regulation at the blood-brain
barrier. FASEB J., 22, 2723-2733.


Chapter 3
The role of P-glycoprotein in psychiatric disorders:
a trustful guard of the brain?

Authors:
Onno L. de Klerk1,2
Fokko J. Bosker1
Gert Luurtsema3
Ilja M. Nolte4
Rudi A. Dierckx3
Johan A. den Boer1
Heidrun Potschka5
1University Center of Psychiatry, University Medical Center Groningen (UMCG); 2GGZ Drenthe, Assen, 3Dept. of Nuclear Medicine and Molecular Imaging; 4Unit of
Genetics and Bioinformatics, dept. of Epidemiology, University of Groningen; 5Inst. of
Pharmacology, Toxicology, and Pharmacy, Ludwig-Maximilians-University Munich,
Germany
Centr Nerv Syst Agents in Medicinal Chemistry 2011
Accepted for publication

Abstract
A major component in the protection of the brain against blood-borne toxic influences
is the multispecific efflux pump P-glycoprotein. This pump, a 170 kD protein, located at
the luminal side of the capillary endothelial cells, has a large capacity and is capable of
extruding a wide array of structurally divergent substrates. The brain uptake of the
majority of antidepressants and antipsychotics, as well as many other psychotropic
drugs and endogenous compounds is hampered by the activity of P-glycoprotein. In this
review we discuss the current state of knowledge concerning the role of P-glycoprotein
on pharmacokinetics of psychiatric drugs and the impact of modulation of P-
glycoprotein on major psychiatric disorders. Relevant issues in reference to the function
of P-glycoprotein and other efflux pumps in the blood-brain barrier related to mood
disorders and schizophrenia are addressed, such as a possible role of P-glycoprotein as a
susceptibility factor in depressive disorders and psychotic disorders.

Introduction
The central nervous system (CNS) requires a perfectly regulated environment, for
optimal activity. The main contribution to this homeostasis is accomplished by the
blood-brain barrier (BBB), by protecting and isolating the nervous tissue from too
strong fluctuations in nutrients, hormones, metabolites, and other solutes. Due to the
presence of tight junctions, preventing the passage of molecules and ions through the
space between cells, all substances must pass through the endothelial cell before
entering the brain.1,2
Figure 3.Figure 3.Figure 3.Figure 3.1111
Model of substrate transport by P-gp. (A) Substrate (magenta) partitions into the bilayer from outside of the cell to the inner leaflet and enters the internal drug-binding pocket through an open portal. The residues in the drug binding pocket (cyan spheres) interact with a substrate in the inward facing conformation. (B) ATP (yellow) binds to the nucleotide binding domains causing a large conformational change presenting the substrate and drug-binding site(s) to the extracellular space. In this model of P-gp, exit of the substrate to the inner leaflet is sterically occluded providing
unidirectional transport to the outside. Reprinted from Aller et al. with permission12

This transendothelial route further restricts the passage of molecules by distinct and
highly selective transport systems, present on the luminal side of the endothelial cell.
Only small lipid-soluble molecules can penetrate the endothelial cell through diffusion,
unless their molecular weight exceeds 400-600 Da.2
During the last decade it has become clear that multispecific, xenobiotic transporters
play an important role at the blood-brain barrier (BBB). Of all efflux pumps discovered
at the BBB so far, P-gp is the best described. It has been shown that P-gp exerts an
important influence on the penetration of psychoactive drugs at the BBB.3,4 P-gp is
found at the luminal side of the endothelial cells, where it extrudes hydrophobic
compounds from the cell. It was discovered in 1976 in drug-resistant ovary cells from
Chinese hamsters.5 Human P-gp is encoded by the multidrug resistance gene (MDR1),
which is now denoted as ABCB1 (ATP Binding Cassette gene B1). P-gp contains 1280
amino acids and has a molecular weight of 174 kD.6
Localization and function of P-gp
Cerebral P-gp is not only present at the BBB, but also at the blood-CSF barrier.7 Apart
from the CNS, P-gp is present in kidneys, gut and other organs that have an epithelial
lining. Interestingly, while in normal conditions P-gp is not found in neurons,
neuronal P-gp expression was reported in pathological conditions, such as refactory
epilepsy, cortical dysplasia and glioneuronal tumors.8-10 The physiological function of
ABCB1 has not been unambiguously identified yet,6,11 but it involves the protection of
the brain from compounds that have gained access to the circulation. The fact that it is
being expressed in damaged neuronal tissue as well as in malignancies, affirm such a
function.8,9 It needs to be considered that xenobiotic or drug concentrations in the
brain might also be affected by intestinal P-gp limiting oral bioavailability.
Its imposing ability to transport hundreds of structurally divergent drugs, natural
products and peptides, render this protein a fascinating molecule. P-gp is composed of
two transmembrane bound domains, each consisting of 6 transmembrane helices and
two nucleotide binding sites, that hydrolyze ATP, enabling substrate transport (see
figure 1).12 P-gp substrates are known to partition into the lipid bilayers and
accumulate to high concentrations. In the inner leaflet of the lipid bilayer the
compounds can then get in contact with the drug binding pocket of the transporter.11,12
Initiated by ATP binding a conformational change of the transporter molecule then
brings the drug binding site to the outer leaflet or extracellular surface, thereby
promoting unidirectional transport to the extracellular space.
In vivo imaging of P-gp at the BBB
In the last decade considerable effort has been put into gaining further insight into the
role of P-gp under pathophysiological conditions. Different substrates of P-gp have

been radiolabeled and imaged using single-photon emission computed tomography
(SPECT) and positron emission tomography (PET).13
A P-gp tracer that meets the criteria of a useful ligand is a selective substrate for P-gp,
produces a good signal after P-gp blockade and generates few radiolabeled metabolites
that contribute to the PET signal. The principle of PET imaging of P-gp activity
amounts to measure the difference in cerebral uptake of a radiolabeled P-gp substrate
(i.e. radioligand) under two different conditions, for example major depressive disorder
vs. healthy control, or before and after drug inhibition. The function of P-gp can be
quantified by calculating the distribution volume (VT) of the ligand, which inversely
reflects P-gp function.14 VT is an estimate of the brain tissue-blood partition coefficient
of activity of the radiotracer at equilibrium and is defined as the influx rate constant K1
over the efflux rate constant k2. Several radiolabeled P-gp substrates are available for
PET, such as [11C]-verapamil and [11C]-carvedilol, [11C]-loperamide and [11C]-
desmethyl-loperamide.15-17 Of these, the in vivo studies with [11C]-verapamil
outnumber all other ligands and it is the only tracer used in clinical studies. The (R)-
enantiomer of [11C]-verapamil can be considered superior to the racemic mixture.14,15,19
Although the feasibility of in vivo measurement of P-gp function by [11C]-verapamil-
PET (VPM-PET) has been confirmed by several research groups,14,18,19 it is not an ideal
tracer, because its brain uptake is low. The production of several metabolites of the
parent compound [11C]-verapamil does not appear to be a problem, since the main
metabolite is also a P-gp substrate.14 Several strategies have been launched in search of
an optimal tracer, that is capable of detecting subtle changes in function (in particular
increased P-gp activity). The development of a radiotracer that is not a substrate but
works as a pure inhibitor, could bypass this problem, but so far the results of this
strategy are ambiguous, possibly due to the fact that these inhibitors have affinity as a
substrate too.20 Several new imaging strategies may still hold the unfulfilled promise of
a method to study drug interactions with P-gp. For example, radiolabeling of a new
drug candidate after administration of an inhibitor, or a double PET scan to evaluate
the effect of a P-gp modulator. Another strategy that could work is the co
administration of a P-gp inhibitor, that can increase the baseline signal.21
Relevance of P-gp in relation to antidepressants, mood stabilizers and antipsychotics
Different in vitro approaches and in vivo models (ABCB1ab (-/-) knock-out mice) have
been used to assess the impact of P-gp on pharmacokinetics of psychiatric drugs. In
vitro data have indicated that most antidepressants and antipsychotics have affinity for
P-g (table 3.1).22-26 Many of the in vitro data are contrary, which is inherent to the
different methods and materials used.

Most research focusing on the inhibitory effects of antidepressants and antipsychotics
has been done with various cell lines expressing (recombinant) human P-gp. As a
measure of the P-gp-inhibitory potency of the drug a prototypic P-gp substrate, such as
calcein-AM or Rhodamine123, was often used. The concentration needed to displace
50% of the prototypic compound (called IC50 or EC50) was used as measure of the
inhibitory effect on P-gp activity.
For most compounds, the ability to inhibit P-gp has been compared to a typical
comparator, such as verapamil or cyclosporine A. (tables 3.1-3.3). It must be considered
that these inhibitors significantly differ in their potency to affect P-gp transport
function.27 For example, haloperidol appeared to be a weak inhibitor compared to
PSC833,28 whereas it proved to be a much stronger inhibitor in comparison to
verapamil and ivermectin.29
Some antidepressants have only shown inhibition without demonstrated substrate
affinity (i.e. desipramine, imipramine, reboxetine).24,25 Besides, the translation of in
vitro results to the human case could be complicated by differences in substrate
specificity for P-gp across species.30 A more reliable method of studying affinity for P-
gp is based on studies in knock-out mice, which lack the ABCB1ab genes encoding P-
gp. Affinity for P-gp has been demonstrated in knock-out mice for most of the
common antidepressants23,31-35 and antipsychotics (tables 3.1-3.2).31,36-41
Despite the differences in the experimental set-up that partly explain the controversies
regarding the interaction between P-gp and antidepressants and antipsychotics, it is
feasible to say that the majority of the antidepressants and antipsychotics have shown
(mostly weak) affinity as a P-gp substrate and that most have a weak inhibitory effect
on P-gp in vitro. Some authors have argued that the inhibitory effect of antidepressants
on P-gp is clinically irrelevant,25,26,34 since the drug concentrations used in most studies,
necessary for P-gp inhibition were far above the therapeutic dose range. On the other
hand, others have suggested that some antidepressants may be strong inhibitors in
vivo.23,42,43 For antipsychotics comparable differences between the individual drugs have
been described.
The impact of cerebral P-gp in man for the bioavailability of psychoactive drugs cannot
be satisfactorily deducted from the in vitro data. It needs to be considered that
antidepressants and antipsychotics can generally access the brain and therefore can not
be high affinity substrates of P-gp like compounds that do not exhibit any relevant
brain penetration based on its interaction with P-gp. Moreover, CNS active drugs are in
general characterized by a fairly high lipophilicity. Recent data demonstrated that it
can be more difficult to detect an interaction with P-pg, when drugs pass membranes
efficaciously by rapid diffusion due to their lipophilic characteristics.44

Most of the antidepressants and antipsychotics, as well as several mood stabilizers
demonstrated a significantly greater, albeit small brain/plasma ratio in ABCB1a
knockout mice compared to wild type mice (mean = 1.8 for antidepressants; 4.9 for
antipsychotics) (see table 3.1-3.3). The value of the studies using the knock-out mouse
model is limited by the fact that a one dose model is mostly used, representing only the
acute modulatory effect on P-gp. There are only two reports on long term treatment on
P-gp activity in vivo.45,46 For amitriptyline, it was demonstrated that the brain uptake in
WT and KO mice was equal for the parent compound (amitriptyline), whereas a much
higher cerebral concentration was measured for its metabolites in the knock-out mice.
It was suggested that chronic administration of amitriptyline induces up-regulation of
the P-gp pump, thus inhibiting its own access to the brain. In an elaborative study they
refined their results and demonstrated that 4 hours after a single dosis of amitriptyline
the initial differences (present at one hour post injection) in cerebral uptake had
disappeared, in contrast to the metabolites, pleading against an up-regulatory
mechanism.47 Differences in cerebral uptake between the parent compound
(amitriptyline) and its metabolites can also be explained by a differential affinity of P-
gp for the respective molecules. Miura et al. demonstrated that small molecular changes
can turn a strong P-gp substrate into a weak one.48 Another notion is that the effect of a
non-substrate on P-gp activity can apparently vary over time.23
In spite of the findings of the preclinical work on the role of P-gp in the uptake of
drugs used for the major psychiatric disorders, there are arguments pleading against a
significant role for P-gp. For example, antipsychotic drugs like risperidone and
haloperidol may significantly differ in their interaction with P-gp, but have a
comparable clinical efficacy. Because direct evidence for a major role of P-gp in
pharmacokinetics has been lacking, CNS side effects of drugs with potential P-gp
inhibiting effects may erroneously have been attributed to other causes. Cytochrome
P450 3A4, a major drug metabolizing enzyme, shows a striking overlap in substrate
specificity with P-gp.49,50 Several CNS effects have been ascribed to interactions
between drugs concurrently inhibiting Cyp3A4, without notice of a potential
concomitant P-gp inhibiting effect of these drugs in vitro.51-53
Cortisol is a substrate of P-gp as well. Its uptake into the brain is thwarted by P-gp.54,55
It has been well established that depression coincides with dysregulation of the HPA
axis, characterized by negative feedback inhibition and elevated cortisol levels.56 As
some of the in vitro data have suggested that P-gp is inhibited by the action of
antidepressants,57 it has been hypothesized that antidepressants exert their
antidepressant effect partly by the inhibition of P-gp, leading to an intracerebral
cortisol increase and normalization of the HPA axis. However, antidepressants appear
to have an insignificant effect on plasma cortisol levels.58 Besides, cortisol entry to the

brain is not regulated by P-gp only, as Mason et al. found in mice.59 Concluding, data
supporting the hypothesis that P-gp inhibition plays a role in normalisation of a
hyperactive HPA-axis, are lacking.
Mood stabilizers belong to different drug classes. Lithium is the drug of first choice in
the treatment of bipolar disorders. Although lithium itself is not a substrate of P-gp,
lithium shares many properties with magnesium (Mg2+), such as a synergistic effect on
the Na/K ATP-ase.60 Mg2+ appears to play a key role in P-gp mediated efflux through
ATP hydrolysis.61 It may thus be conceived that lithium has a similar impact on the
function of P-gp. Other drugs registered as mood stabilizers include the anti-epileptic
drugs carbamazapine, valproic acid and lamotrigine. These agents appear to have no or
at most a weak affinity for P-gp (see table 3.3). Reports on the effect of different
antiepileptic drugs on P-gp expression in brain capillary cell lines have been
equivocal.62-64
Modulation of P-gp at the BBB by stress (in vitro studies)
An understanding of the physiological regulation of P-gp is key to therapeutic
strategies in the treatment of psychiatric disorders, since most of the drugs used for
depression and psychosis seem to be P-gp substrates. Stress is the hallmark of many
psychiatric diseases, including depression and psychosis, and it appears that all sorts of
stress responses evoked by a variety of environmental stimuli, such as cytotoxic agents,
heat shock, irradiation, genotoxic stress and inflammation are able to influence either
the expression or the activity of P-gp.65 P-gp is regulated at various levels of expression
including DNA, mRNA and protein.
There is increasing evidence for the role of cytokines in the pathogenesis of
depression.66 Proinflammatory cytokines are produced by different immune cells upon
presentation of an antigen and their secretion is believed to be the prime event in the
subsequent neurophysiological responses taking place during immune stimulation.
Several animal models are applied,65,67 and although results of the in vivo studies are
somewhat conflicting, most demonstrated that P-gp expression and activity can be
involved in different ways during an inflammatory episode, the degree and direction of
the change in P-gp activity depending on the model and the inflammatory mediator
used.67,68
Several in vitro studies have tried to extricate the signalling pathways of the involved
cytokines and other chemotactic compounds leading to a functional change of P-gp at
the BBB. Hartz and colleagues define a pathway through which P-gp is acutely
modulated. They describe a sequence of events, starting with TNFα (tumor necrosis
factor), releasing endotheline-1, that in turn activates nitric oxide synthase and then

protein C kinase, ultimately reducing P-gp transport.69,70 The same group showed that
this regulation is biphasic: after an initial rapid decrease of P-gp activity following
exposure to TNF and endotheline-1, an increase in transport activity was found at 6
hours post exposure. Similar data are presented by others. For example, the results by
Tan and colleagues showing an increase in P-gp expression following BBB breakdown
by activated T-cells, suggest both a role in immune cell mediated cytotoxicity and a
counterregulatory role in promoting cell survival and maintaining BBB integrity. They
hypothesize that the latter role may be relevant in later stages of the inflammation.71 In
vivo studies focusing on such a biphasic response in cytokine regulation and in P-gp
activity in depressive or psychotic disorders are warranted and can be best worked out
in animal models.
Depressive disorder, schizophrenia and stress-related disorders and P-gp
A few studies have focused on BBB characteristics in relation to psychological stress.
Rats subjected to perinatal stress had an increased permeability as measured by the
uptake of Evans blue.72 Acute stress (e.g. immobilization stress or forced swim)
increases BBB permeability likewise.73-75 In respect to the effect of chronic stress on
BBB function, studies are lacking, but in major depressive disorder (MDD) BBB
dysfunction has been suggested as potential mechanism.76
If P-gp is a susceptibility factor in stress related disorders, animal models could be used
to demonstrate their modulatory role in stress. To date, evidence is sparse. In one
study, describing the anxiolytic-like effect of tariquidar (a P-gp inhibitor) in mice
sensitized by a mild stressor, it was suggested that P-gp inhibition led to an increase of
corticosteroids, which, in turn would enhance the negative feedback control of the
HPA axis.77
In two PET studies with [11C]-verapamil, an increased function of P-gp at the BBB in
temporal and frontal areas was found both in a group of medicated patients with MDD
and schizophrenia.78,79 Caution in the interpretation of the results of both studies is
justified, since the findings were complicated by the use of either antidepressants or
antipsychotics. The increase in P-gp function might be a result of the disorder itself or
a result of antidepressant treatment. A sequel to these studies was set up to disentangle
the possible contribution of antidepressant therapy and MDD. Rats were either
subjected to chronic stress or to a continuously administered antidepressant. Using
[11C]-verapamil PET as a measure of P-gp activity, an indication was found for
decreased P-gp activity in the stressed rats, whereas venlafaxine appeared to have an
opposite effect on P-gp activity.80 A confirmation study correlating the in vivo results
from both studies to P-gp expression at protein and mRNA level is under way.
Although the in vivo imaging study may provide an indication for a susceptibility role

of P-glycoprotein in depressive disorders, in the light of the limited evidence so far, it is
impossible to interpret the findings without great restrictions.
The role of ageing and neurodegeneration in P-gp functionality
Although the status of both MDD and schizophrenia as neurodegenerative disorders is
tenuous, both disorders have neurodegenerative features. In depression, it has been
hypothesized that neuroinflammation ultimately leads to neurodegeneration.81 The
coincidence of structural brain changes and decreased regional blood flow has been
well established in MDD as well as in schizophrenia. Loss of the integrity of the blood-
brain barrier is a cardinal phenomenon in many neurodegenerative disorders including
Alzheimer dementia. In the PET studies on Parkinson’s disease a role for P-gp in
neurodegeneration has been suggested, but this is based on small differences in tracer
uptake between patients and control group.82
The decline in function of P-gp in old age, which has been indicated by [11C]-
verapamil-PET studies will certainly accentuate the problems encountered in
pharmacotherapy in the elderly.83,84 The decreased P-gp activity might be linked to the
pathology in late-life depression, such as the cognitive changes, but a major role in the
etiology of MDD at old age is refuted by the fact that the incidence of MDD declines
with age.85
Polymorphisms of P-gp and their effect on function.
Since the first report on a polymorphism in the ABCB1 gene, the quest for more
variations in the DNA sequence explaining phenotypical differences has not stopped.
Substantial progress has been made in identifying single nucleotide polymorphisms
(SNPs) in the entire ABCB1 gene. Reports in the literature have particularly focused on
C3435T (non-coding exon 26), after an initial report on altered duodenal P-gp
expression and functionality associated with the TT variant,86 but later on the SNPs
G2677T/A and C1236T have generated interest as well.
Studies within the field of psychiatry have particularly focused on treatment response
to antidepressants or antipsychotics. Other studies refer to side effects and two studies
pertain to the occurrence of ABCB1 polymorphisms in mood disorders and
schizophrenia. In two studies, the diagnosis of depression was found to be associated
with a haplotype of 13 ABCB1 polymorphisms.87 In the other study, mood disorders
were associated with the haplotype of 129-2677-3435 (T-A-C) and with a lower
frequency of ABCB1 alleles at -1517, -41 and -129 and a higher frequency of 2677A.88
In this study no association was found between ABCB1 and schizophrenia.
Most studies on the genetic effects of the SNPs C3435T, G2677T/A and C1236T or
ABCB1 haplotypes showed little or no effect on treatment response (table 3.4A). A

strong effect of a single transporter gene on a phenotypic response in complex disorders
like MDD and schizophrenia is not amenable. A few reports on antipsychotic or
antidepressant related side effects associated with polymorphisms have been published,
and a few groups have communicated on the effect of ABCB1 polymorphisms and
plasma concentrations of antipsychotics or antidepressants (table 3.4B). For risperidone,
displaying high substrate affinity for P-gp, only modest genetic effects were reported in
side effects (weight gain) and in treatment response.89,90
The contradictions in observations for the major polymorphisms of ABCB1, are partly
accountable to differences in methodology and to ethnic differences between study
groups. In most studies the sample size is too small to draw firm conclusions.
Thus, none of the SNPs of ABCB1, nor any of the haplotypes, can definitely be
connected to phenotypical variation, but instead some may serve as biological marker
for pin pointing a disease. In the near future it is to be expected that analysis of SNP
patterns in large patient cohorts with identical phenotypic features will identify SNP
profiles that characterize susceptibility factors. Genome wide association studies
(GWAS) are the type of study designed to identify such a genetic variation. This
strategy may be best worked out in a subset of patients with severe, recurrent and early
onset form of depression, since this group of patients has shown an elevated genetic
contribution.91
Non-P-gp mediated efflux transport at the BBB
Other members of the ABC family that are expressed in the BBB, include multidrug
resistance proteins (MRP1, -2, -4 and -5) (ABCC genes) and breast cancer related
protein (BCRP/ABCG2 gene).92,93 The exact location of some of the MRPs within the
BBB is still debated.93 The reasons for this uncertainty are the differences in transporter
profiles between species as well as inferior antibody specificity. The predominant
location of MRP1 is probably the basolateral membrane.94 Among the non-P-gp efflux
transporters MRP1 and BCRP have the highest expression in the human BBB, which
however is much lower (around 20-fold) than that of P-gp.95
The MRPs transport anionic compounds, including sulphate, glucuronide, and
glutathione (GSH) conjugates.96 Three typical antipsychotics (thioridazine,
chlorprotixene and flupentixol), all carrying a sulphur atom, were found to inhibit
MRP2 in vitro.96 Of the few reports on involvement of MRP1 or MRP2 in the transport
of an antidepressant no significant inhibition was found.97 BCRP appears to be involved
in the efflux of antipsychotics. For the major antipsychotics Wang et al. demonstrated a
similar profile of inhibition to that of P-gp,28 albeit that for most antipsychotics at least
a 5-fold higher concentration was needed to inhibit BCRP (compared to P-gp).98 For

the antidepressants maprotiline and desipramine no significant inhibition of BCRP was
reported.99
Concluding, the clinical relevance of the MRPs in conferring resistance to the major
psychiatric drugs at the BBB is probably negligible in comparison to P-gp, given the
lower substrate affinity and the much lower expression in the BBB. BCRP might exert a
more significant role at the BBB and is probably more subsidiary to P-gp function than
the MRPs.99 Nevertheless, the impact of BCRP in drug disposition at the BBB in vivo is
still uncertain.100
Concluding remarks and future directions
In conclusion, the role that P-gp plays in depressive and psychotic disorders, is far from
clear. Most antidepressant and antipsychotic drugs have a weak to moderate affinity as
a substrate for P-gp, and some may have inhibitory properties as well, which may be
relevant in drug-drug interactions. P-gp may be involved in a depressive or psychotic
episode as well, since evidence exists for a (temporarily) decrease in activity and
expression during a neuroinflammatory event, which characterizes the
pathophysiology of these disorders.
Given the importance of P-glycoprotein in drug transport at the BBB and its
involvement in neuroinflammation, it is comprehensible that the protein is of great
interest in the field of neuroscience. At this time, the understanding of the precise role
in neuropsychiatric disorders and drug disposition is incomplete, but new
developments in neuroimaging, pharmacogenetics and molecular biology are in full
progress and it will be only a matter of time to accomplish this. As outlined above, an
important step forward in the identification of genetic variants has been made, albeit
the complex regulatory pathways involved in P-gp modulation require further
considerations in pharmacogenetic studies. Studies with larger sample size will be
needed to detect modest effects. Progress in PET imaging largely depends on
development of new tracers that approach the unmet needs of an ideal tracer.

Table 3.1
Substrate affinity for P-glycoprotein and inhibitory properties of current antidepressants
substrate
properties
Antidepressant
in
vivo
in
vitro
Inhibition
compared to
typical P-gp
inhibitor*
references
amitriptyline ++ weak 24,25,33,45
bupropion 0 no 43
citalopram + 0 No 25,26
31,35,101
clomipramine no 25
desipramine weak-moderate 24,25
doxepin + weak 24; 35
duloxetine moderate 102
fluoxetine 0/+ no 25,26,31,33
fluvoxamine + 0 weak 26,29,31,33,103
imipramine weak-moderate 24,25
maprotiline weak 24
mirtazapine 0 weak 25,35
nefazodone 0 good 23
nortriptyline + weak 25,31-33
paroxetine + ++ moderate 29,31,101,103
reboxetine weak 25,26
sertraline 0 +++ moderate 31,43
;26
trazodone 0 0 no 23,31
trimipramine + 34
venlafaxine + 0 no 26,31,35,104
Legend (table 3.1-3.3)
substrate affinity in vivo denotes the ratio between in vivo brain uptake in ABCB1a -/-
knock-out vs. wild type (KO-WT) mice: 0: no significant change; +: 1-3; ++: 3-10;
+++:>10.
substrate affinity (in vitro): transport capacity compared to a prototypical P-gp
substrate (mostly expressed as IC50 or EC50, see text): 0: 0-5% ; +: 5-25%; ++: 25-75%;
+++: >75%
Inhibition: good = comparable to comparator inhibitor* (at least 75%) ; moderate: 25-
75% inhibition of comparator; weak: 5-25% inhibition ; no: < 5 % inhibition or non
definable ; *: inhibition (in vitro) is related to a typical comparator inhibitor, either
verapamil, ivermectin, cyclosporine, or PSC833; α P-gp inhibition compared to PSC833 ; ∂significant increase in lamotrigine brain/plasma ratio after administration of a P-gp
inhibitor (verapamil)

Table 3.2
Substrate affinity for P-glycoprotein and inhibitory properties of current antipsychotics
substrate
properties
antipsychotic
in
vivo
in
vitro
Inhibition
compared to
typical P-gp
inhibitor*
references
amisulpiride 0 + Weak 29
aripiprazole ++ ++ 39,46,105
chlorpromazine + +/++ Weak 25,28,31,106
clozapine 0/+ 0/+ Weak 22,25,28,29,31,38,106
fluphenazine + ++ Moderate 24,29,107
flupentixol + Good 29
haloperidol 0/+ 0/+ weakα-good
25,29; 28,106,108; 24,31,37,38
olanzapine + ++ no-weakα
29,106;
28,40
paliperidone +++ ++ No 28,31,36,36,37,41
perospirone Good 109
perphenazine Good 29
quetiapine ++ weakα-good
28,29,106
risperidone +++ +++ weak-moderate 36,106
28,36,37,41,110
Table 3.3 Substrate affinity for P-glycoprotein and inhibitory properties of mood stabilizers
substrate
properties
mood stabilizer
in
vivo
in
vitro
Inhibition
compared to
typical P-gp
inhibitor*
references
carbamazepine 0 0/+ no-weak 22,30,44,62,111-116
lamotrigine 0/+∂ 0/+ no-weak
31, 44, 112,115-117
lithiumcarbonate
valproic acid 0 Weak 44,112,113,116,118

Table 3.4 3.4A: treatment response to antidepressants and antipsychotics related to ABCB1 polymorphisms
Drug
DSMa
diag-
nosis
ABCB1 variant rs-id b
n cases c outcome measure
d-i
refer
ences p-value
j
amitriptyline G2677T/A rs2032583 50 % change in HAMD response after 3 weeks 119
n.s.
Intron 4 rs2235015 133 0.0024 amitriptyline,
venlafaxine
or citalopram
MDD
(C/T) intron 22 rs2032583 132
% change in HAMD-21 score after 4 weeks 120
0.00007
MDD UTR rs17064 % change in HAMD-21 score after 8 weeks n.s.
desipramine
haplotype block 1
272
remission versus non-remission after 8 weeks
87
0.02
(C/T) intron 22 rs2032583 0.024
Intron 4 rs2235015 n.s. MDD
(A/G) intron 21 rs2235040
124 % change in HAMD-21 score after 8 weeks 121
0.028
G2677T/A rs2032583 0.01
C3435T rs1045642 n.s.
C1236T rs1128503 n.s. MDD
Haplotype 3435C-2677G-1236T
68
% change in HAMD response after 6 weeks
122
0.014
MDD G2677T/A rs2032582 n.s.
paroxetine
C3435T rs1045642 127 % change in HAMD response after 6 weeks
123
n.s.
(A/C) (intron 22) rs10280101 238 n.s.
(A/G) (intron 22) rs7787082 237 n.s.
(C/T) intron 22 rs2032583 238 n.s. duloxetine MDD
(A/G) intron 21 rs2235040 239
response after 5 weeks 124
n.s.
C1236T rs1128503 n.s.
G2677T rs2032582 n.s. citalopram MDD
C3435T rs1045642
652 response (395) vs. non-response (257) on (different doses)
after 12 weeks 125
n.s.

C1236T rs1128503 n.s.
C3435T rs1045642 0.045
haplotype block 1 (intron26-27) 0.003 escitalopram MDD
haplotype block 2 (incl. exon13)
100 Remission versus non-remission after 8 weeks 126
n.s.
MDD G1236A rs1128503 n.s.
(T/C) rs10276036 n.s
(T/A) rs2235020 n.s
(C/G) rs2214103
142 % change in HAMD-21 score after 8 weeks
n.s.
haplotype block 1 272 remission versus non-remission after 8 weeks 0.03
fluoxetine
haplotype block 2 272 remission versus non-remission after 8 weeks 0.04
fluoxetine or
desipramine MDD haplotype block 3 272 % change in HAMD-21 score after 8 weeks
87
0.01
nortriptyline MDD C3435T rs1045642 160 MADRAS score after 6 weeks 127
n.s.
C3435T rs1045642 n.s.
G2677T/A rs2032582 0.03 olanzapine S
C1236T rs1128503
41 BPRS change after 6 weeks, related to olanzapine
concentration 128
0.04
G2677T rs2032582 54 n.s. S
C3435T rs1045642 58 > 50% improvement on PANSS score
129
n.s.
C1236T rs1128503 0.021
G2677T rs2032582 n.s.
risperidone
S
C3435T rs1045642
115 % change on BPRS after 8 weeks 90
n.s.

Table 3.4B: side effects of antidepressants and antipsychotics related to ABCB1 polymorphisms
Drug
DSM a
diagnosi
s
ABCB1 variant rs-id b
n
c cases
outcome measure
d-h
referenc
es p –value
h
amitriptyline MDD G2677T/A rs2032582 50 C/D ratio 119
n.s.
C3435T rs1045642 0.046 clozapine S
G2677T/A rs2032582 75 C/D ratio
130
n.s.
fluvoxamine MDD C3435T rs1045642 62 higher C/D ratio in T-genotypes 131
0.026
S C3435T rs1045642 41 weight gain related to olanzapine concentration 128
n.s.
C3435T rs1045642 n.s. S
G2677T/A rs2032582 56 weight gain (> 7% vs < 7% )
89
n.s.
C3435T rs1045642 n.s.
olanzapine
S G2677T rs2032582
122 C/D ratio (variable doses) 132
n.s.
C3435T rs1045642 0.015
G2677T rs2032582 0.031 S
Haplotype 3435T-2677T
47 weight gain (> 7% vs < 7% ) 89
0.033
G2677T rs2032582 higher C/D ratio (active moiety) in TT-genotypes 0.001 S
C3435T rs1045642 83
higher C/D ratio (active moiety) in TT-genotypes
129
0.004
C3435T rs1045642 n.s.
risperidone
S
G2677T/A rs2032582
85 C/D ratio (risperidone and/or 9-OH-risperidone) 133
n.s.
Legend (table 3.4A and 3.4B) a DSM diagnosis: diagnostic statistical manual; MDD = Major depressive disorder; S= schizophrenia; brs-id = reference seauence identity; cn = number; dHAMD(-21) = Hamilton Depression Rating Scale (-21 item version); eMADRAS = Montgomery Asberg Rating Scale; fBPRS
= Brief Psychiatric Rating Scale; gCIT = citalopram ; h C/D = concentration-to-dose; iPANSS = positive and negative symptom scale ; jn.s. = non significant

References
1. Bernacki J, Dobrowolska A, Nierwinska K, Malecki A (2008) Physiology and pharmacological
role of the blood-brain barrier. Pharmacol. Rep., 60, 600-622.
2. Hawkins BT, Davis TP (2005) The blood-brain barrier/neurovascular unit in health and disease.
Pharmacol. Rev., 57, 173-185.
3. Linnet K, Ejsing TB (2008) A review on the impact of P-glycoprotein on the penetration of
drugs into the brain. Focus on psychotropic drugs. Eur. Neuropsychopharmacol., 18, 157-169.
4. Liu X, Chen C, Smith BJ (2008) Progress in brain penetration evaluation in drug discovery and
development. J. Pharmacol. Exp. Ther., 325, 349-356.
5. Juliano RL, Ling V (1976) A surface glycoprotein modulating drug permeability in Chinese
hamster ovary cell mutants. Biochim. Biophys. Acta, 455, 152-162.
6. Sharom FJ (2006) Shedding light on drug transport: structure and function of the P-glycoprotein
multidrug transporter (ABCB1). Biochem. Cell Biol., 84, 979-992.
7. Rao VV, Dahlheimer JL, Bardgett ME, Snyder AZ, Finch RA, Sartorelli AC, Piwnica-Worms D
(1999) Choroid plexus epithelial expression of MDR1 P glycoprotein and multidrug resistance-
associated protein contribute to the blood-cerebrospinal-fluid drug-permeability barrier. Proc.
Natl. Acad. Sci. U. S. A, 96, 3900-3905.
8. Lazarowski A, Massaro M, Schteinschnaider A, Intruvini S, Sevlever G, Rabinowicz A (2004)
Neuronal MDR-1 gene expression and persistent low levels of anticonvulsants in a child with
refractory epilepsy. Ther. Drug Monit., 26, 44-46.
9. Volk HA, Burkhardt K, Potschka H, Chen J, Becker A, Loscher W (2004) Neuronal expression of
the drug efflux transporter P-glycoprotein in the rat hippocampus after limbic seizures.
Neuroscience, 123, 751-759.
10. Aronica E, Gorter JA, Jansen GH, van Veelen CW, van Rijen PC, Leenstra S, Ramkema M,
Scheffer GL, Scheper RJ, Troost D (2003) Expression and cellular distribution of multidrug
transporter proteins in two major causes of medically intractable epilepsy: focal cortical
dysplasia and glioneuronal tumors. Neuroscience, 118, 417-429.
11. Banerjee S, Bhat MA (2007) Neuron-glial interactions in blood-brain barrier formation. Annu.
Rev. Neurosci., 30, 235-258.
12. Aller SG, Yu J, Ward A, Weng Y, Chittaboina S, Zhuo R, Harrell PM, Trinh YT, Zhang Q,
Urbatsch IL, Chang G (2009) Structure of P-glycoprotein reveals a molecular basis for poly-
specific drug binding. Science, 323, 1718-1722.
13. Kannan P, John C, Zoghbi SS, Halldin C, Gottesman MM, Innis RB, Hall MD (2009) Imaging the
Function of P-Glycoprotein With Radiotracers: Pharmacokinetics and In Vivo Applications.
Clin Pharmacol Ther, 86, 368-377.
14. Lubberink M, Luurtsema G, van Berckel BN, Boellaard R, Toornvliet R, Windhorst AD,
Franssen EJ, Lammertsma AA (2007) Evaluation of tracer kinetic models for quantification of P-
glycoprotein function using (R)-[11C]verapamil and PET. J. Cereb. Blood Flow Metab, 27, 424-
433.
15. Elsinga PH, Hendrikse NH, Bart J, van Waarde A, Vaalburg W (2005) Positron Emission
Tomography Studies on Binding of Central Nervous System Drugs and P-Glycoprotein Function
in the Rodent Brain. Molecular Imaging and Biology, 7, 37-44.
16. Hendrikse NH, Schinkel AH, de Vries EG, Fluks E, van der Graaf WT, Willemsen AT, Vaalburg
W, Franssen EJ (1998) Complete in vivo reversal of P-glycoprotein pump function in the blood-
brain barrier visualized with positron emission tomography. Br. J. Pharmacol., 124, 1413-1418.
17. Seneca N, Zoghbi SS, Liow JS, Kreisl W, Herscovitch P, Jenko K, Gladding RL, Taku A, Pike
VW, Innis RB (2009) Human Brain Imaging and Radiation Dosimetry of 11C-N-Desmethyl-
Loperamide, a PET Radiotracer to Measure the Function of P-Glycoprotein. J Nucl Med, 50,
807-813.

18. Lee YJ, Maeda J, Kusuhara H, Okauchi T, Inaji M, Nagai Y, Obayashi S, Nakao R, Suzuki K,
Sugiyama Y, Suhara T (2006) In vivo evaluation of P-glycoprotein function at the blood-brain
barrier in nonhuman primates using [11C]verapamil. J. Pharmacol. Exp. Ther., 316, 647-653.
19. Sasongko L, Link JM, Muzi M, Mankoff DA, Yang X, Collier AC, Shoner SC, Unadkat JD (2005)
Imaging P-glycoprotein transport activity at the human blood-brain barrier with positron
emission tomography. Clin. Pharmacol. Ther., 77, 503-514.
20. Syvanen S, Hammarlund-Udenaes M (2010) Using PET Studies of P-gp Function to Elucidate
Mechanisms Underlying the Disposition of Drugs. Curr. Top. Med Chem..
21. Wagner CC, Bauer M, Karch R, Feurstein T, Kopp S, Chiba P, Kletter K, Loscher W, Muller M,
Zeitlinger M, Langer O (2009) A pilot study to assess the efficacy of tariquidar to inhibit P-
glycoprotein at the human blood-brain barrier with (R)-11C-verapamil and PET. J Nucl Med,
50, 1954-1961.
22. Maines LW, Antonetti DA, Wolpert EB, Smith CD (2005) Evaluation of the role of P-
glycoprotein in the uptake of paroxetine, clozapine, phenytoin and carbamazapine by bovine
retinal endothelial cells. Neuropharmacology, 49, 610-617.
23. Störmer E, von Moltke LL, Perloff MD, Greenblatt DJ (2001) P-glycoprotein interactions of
nefazodone and trazodone in cell culture. J. Clin. Pharmacol., 41, 708-714.
24. Szabo D, Szabo G, Jr., Ocsovszki I, Aszalos A, Molnar J (1999) Anti-psychotic drugs reverse
multidrug resistance of tumor cell lines and human AML cells ex-vivo. Cancer Lett., 139, 115-
119.
25. Weber CC, Kressmann S, Ott M, Fricker G, Muller WE (2005) Inhibition of P-glycoprotein
function by several antidepressants may not contribute to clinical efficacy. Pharmacopsychiatry,
38, 293-300.
26. Weiss J, Dormann SM, Martin-Facklam M, Kerpen CJ, Ketabi-Kiyanvash N, Haefeli WE (2003)
Inhibition of P-glycoprotein by newer antidepressants. J. Pharmacol. Exp. Ther., 305, 197-204.
27. Achira M, Suzuki H, Ito K, Sugiyama Y (1999) Comparative studies to determine the selective
inhibitors for P-glycoprotein and cytochrome P4503A4. AAPS. PharmSci., 1, E18.
28. Wang JS, Zhu HJ, Markowitz JS, Donovan JL, DeVane CL (2006) Evaluation of antipsychotic
drugs as inhibitors of multidrug resistance transporter P-glycoprotein. Psychopharmacology
(Berl), 187, 415-423.
29. El Ela AA, Hartter S, Schmitt U, Hiemke C, Spahn-Langguth H, Langguth P (2004)
Identification of P-glycoprotein substrates and inhibitors among psychoactive compounds--
implications for pharmacokinetics of selected substrates. J. Pharm. Pharmacol., 56, 967-975.
30. Baltes S, Gastens AM, Fedrowitz M, Potschka H, Kaever V, Loscher W (2007) Differences in the
transport of the antiepileptic drugs phenytoin, levetiracetam and carbamazepine by human and
mouse P-glycoprotein. Neuropharmacology, 52, 333-346.
31. Doran A, Obach RS, Smith BJ, Hosea NA, Becker S, Callegari E, Chen C, Chen X, Choo E,
Cianfrogna J, et al. (2005) The impact of P-glycoprotein on the disposition of drugs targeted for
indications of the central nervous system: evaluation using the MDR1A/1B knockout mouse
model. Drug Metab Dispos, 33, 165-174.
32. Ejsing TB, Hasselstrom J, Linnet K (2006) The influence of P-glycoprotein on cerebral and
hepatic concentrations of nortriptyline and its metabolites. Drug Metabol. Drug Interact., 21,
139-162.
33. Uhr M, Steckler T, Yassouridis A, Holsboer F (2000) Penetration of amitriptyline, but not of
fluoxetine, into brain is enhanced in mice with blood-brain barrier deficiency due to mdr1a P-
glycoprotein gene disruption. Neuropsychopharmacology, 22, 380-387.
34. Uhr M, Grauer MT (2003) abcb1ab P-glycoprotein is involved in the uptake of citalopram and
trimipramine into the brain of mice. J. Psychiatr. Res., 37, 179-185.
35. Uhr M, Grauer MT, Holsboer F (2003) Differential enhancement of antidepressant penetration
into the brain in mice with abcb1ab (mdr1ab) P-glycoprotein gene disruption. Biol. Psychiatry,
54, 840-846.

36. Ejsing TB, Pedersen AD, Linnet K (2005) P-glycoprotein interaction with risperidone and 9-
OH-risperidone studied in vitro, in knock-out mice and in drug-drug interaction experiments.
Hum. Psychopharmacol., 20, 493-500.
37. Kirschbaum KM, Henken S, Hiemke C, Schmitt U (2008) Pharmacodynamic consequences of P-
glycoprotein-dependent pharmacokinetics of risperidone and haloperidol in mice. Behavioural
Brain Research, 188, 298-303.
38. Schinkel AH, Wagenaar E, Mol CA, van Deemter L (1996) P-glycoprotein in the blood-brain
barrier of mice influences the brain penetration and pharmacological activity of many drugs. J.
Clin. Invest, 97, 2517-2524.
39. Wang JS, Zhu HJ, Donovan JL, Yuan HJ, Markowitz JS, Geesey ME, DeVane CL (2009)
Aripiprazole brain concentration is altered in P-glycoprotein deficient mice. Schizophr. Res.,
110, 90-94.
40. Wang JS, Taylor R, Ruan Y, Donovan JL, Markowitz JS, Lindsay De Vane C (2003) Olanzapine
Penetration into Brain is Greater in Transgenic Abcb1a P-glycoprotein-Deficient Mice than
FVB1 (Wild-Type) Animals. Neuropsychopharmacology, 29, 551-557.
41. Wang JS, Ruan Y, Taylor RM, Donovan JL, Markowitz JS, DeVane CL (2004) The brain entry of
risperidone and 9-hydroxyrisperidone is greatly limited by P-glycoprotein. The International
Journal of Neuropsychopharmacology, 7, 415-419.
42. Peer D, Dekel Y, Melikhov D, Margalit R (2004) Fluoxetine inhibits multidrug resistance
extrusion pumps and enhances responses to chemotherapy in syngeneic and in human xenograft
mouse tumor models. Cancer Res., 64, 7562-7569.
43. Wang JS, Zhu HJ, Gibson BB, Markowitz JS, Donovan JL, DeVane CL (2008) Sertraline and its
metabolite desmethylsertraline, but not bupropion or its three major metabolites, have high
affinity for P-glycoprotein. Biol. Pharm. Bull., 31, 231-234.
44. Luna-Tortos C, Fedrowitz M, Loscher W (2008) Several major antiepileptic drugs are substrates
for human P-glycoprotein. Neuropharmacology, 55, 1364-1375.
45. Grauer MT, Uhr M (2004) P-glycoprotein reduces the ability of amitriptyline metabolites to
cross the blood brain barrier in mice after a 10-day administration of amitriptyline. J.
Psychopharmacol., 18, 66-74.
46. Kirschbaum KM, Uhr M, Holthoewer D, Namendorf C, Pietrzik C, Hiemke C, Schmitt U (2010)
Pharmacokinetics of acute and sub-chronic aripiprazole in P-glycoprotein deficient mice.
Neuropharmacology, 59, 474-479.
47. Uhr M, Grauer MT, Yassouridis A, Ebinger M (2007) Blood-brain barrier penetration and
pharmacokinetics of amitriptyline and its metabolites in p-glycoprotein (abcb1ab) knock-out
mice and controls. J. Psychiatr. Res., 41, 179-188.
48. Miura M, Uno T, Tateishi T, Suzuki T (2007) Pharmacokinetics of fexofenadine enantiomers in
healthy subjects. Chirality, 19, 223-227.
49. Fromm MF (2004) Importance of P-glycoprotein at blood-tissue barriers. Trends Pharmacol.
Sci., 25, 423-429.
50. Zhou SF, Wang LL, Di YM, Xue CC, Duan W, Li CG, Li Y (2008) Substrates and inhibitors of
human multidrug resistance associated proteins and the implications in drug development. Curr.
Med. Chem., 15, 1981-2039.
51. Gelisse P, Hillaire-Buys D, Halaili E, Jean-Pastor MJ, Vespignan H, Coubes P, Crespel A (2007)
[Carbamazepine and clarithromycin: a clinically relevant drug interaction]. Rev. Neurol. (Paris),
163, 1096-1099.
52. Jover F, Cuadrado JM, Andreu L, Merino J (2002) Reversible coma caused by risperidone-
ritonavir interaction. Clin. Neuropharmacol., 25, 251-253.
53. Sheehan NL, Brouillette MJ, Delisle MS, Allan J (2006) Possible interaction between
lopinavir/ritonavir and valproic Acid exacerbates bipolar disorder. Ann. Pharmacother., 40, 147-
150.
54. Karssen AM, Meijer OC, van dS, I, Lucassen PJ, de Lange EC, de Boer AG, de Kloet ER (2001)
Multidrug resistance P-glycoprotein hampers the access of cortisol but not of corticosterone to
mouse and human brain. Endocrinology, 142, 2686-2694.

55. Ueda K, Okamura N, Hirai M, Tanigawara Y, Saeki T, Kioka N, Komano T, Hori R (1992)
Human P-glycoprotein transports cortisol, aldosterone, and dexamethasone, but not
progesterone. J. Biol. Chem., 267, 24248-24252.
56. Holsboer F (2000) The corticosteroid receptor hypothesis of depression.
Neuropsychopharmacology, 23, 477-501.
57. Pariante CM, Makoff A, Lovestone S, Feroli S, Heyden A, Miller AH, Kerwin RW (2001)
Antidepressants enhance glucocorticoid receptor function in vitro by modulating the membrane
steroid transporters. Br. J. Pharmacol., 134, 1335-1343.
58. Weber CC, Eckert GP, Muller WE (2006) Effects of antidepressants on the brain/plasma
distribution of corticosterone. Neuropsychopharmacology, 31, 2443-2448.
59. Mason BL, Pariante CM, Jamel S, Thomas SA (2010) Central nervous system (CNS) delivery of
glucocorticoids is fine-tuned by saturable transporters at the blood-CNS barriers and nonbarrier
regions. Endocrinology, 151, 5294-5305.
60. Murck H (2002) Magnesium and affective disorders. Nutr. Neurosci., 5, 375-389.
61. Singh P, Kaur J, Kaur P, Kaur S (2009) Search for MDR modulators: design, syntheses and
evaluations of N-substituted acridones for interactions with p-glycoprotein and Mg2+. Bioorg.
Med Chem., 17, 2423-2427.
62. Ambroziak K, Kuteykin-Teplyakov K, Luna-Tortos C, Al-Falah M, Fedrowitz M, Loscher W
(2010) Exposure to antiepileptic drugs does not alter the functionality of P-glycoprotein in brain
capillary endothelial and kidney cell lines. Eur. J Pharmacol, 628, 57-66.
63. Lombardo L, Pellitteri R, Balazy M, Cardile V (2008) Induction of nuclear receptors and drug
resistance in the brain microvascular endothelial cells treated with antiepileptic drugs. Curr.
Neurovasc. Res, 5, 82-92.
64. Yang HW, Liu HY, Liu X, Zhang DM, Liu YC, Liu XD, Wang GJ, Xie L (2008) Increased P-
glycoprotein function and level after long-term exposure of four antiepileptic drugs to rat brain
microvascular endothelial cells in vitro. Neurosci. Lett., 434, 299-303.
65. Sukhai M, Piquette-Miller M (2000) Regulation of the multidrug resistance genes by stress
signals. J. Pharm. Pharm. Sci., 3, 268-280.
66. Schiepers OJ, Wichers MC, Maes M (2005) Cytokines and major depression. Prog.
Neuropsychopharmacol. Biol. Psychiatry, 29, 201-217.
67. McRae MP, Brouwer KL, Kashuba AD (2003) Cytokine regulation of P-glycoprotein. Drug
Metab Rev., 35, 19-33.
68. Roberts DJ, Goralski KB (2008) A critical overview of the influence of inflammation and
infection on P-glycoprotein expression and activity in the brain. Expert. Opin. Drug Metab
Toxicol., 4, 1245-1264.
69. Hartz AM, Bauer B, Fricker G, Miller DS (2004) Rapid regulation of P-glycoprotein at the
blood-brain barrier by endothelin-1. Mol. Pharmacol., 66, 387-394.
70. Hartz AM, Bauer B, Fricker G, Miller DS (2006) Rapid modulation of P-glycoprotein-mediated
transport at the blood-brain barrier by tumor necrosis factor-alpha and lipopolysaccharide. Mol.
Pharmacol., 69, 462-470.
71. Tan KH, Purcell WM, Heales SJ, McLeod JD, Hurst RD (2002) Evaluation of the role of P-
glycoprotein in inflammation induced blood-brain barrier damage. Neuroreport, 13, 2593-2597.
72. Gomez-Gonzalez B, Escobar A (2009) Altered functional development of the blood-brain barrier
after early life stress in the rat. Brain Res. Bull., 79, 376-387.
73. Sinton CM, Fitch TE, Petty F, Haley RW (2000) Stressful Manipulations That Elevate
Corticosterone Reduce Blood-Brain Barrier Permeability to Pyridostigmine in the Rat.
Toxicology and Applied Pharmacology, 165, 99-105.
74. Chandler N, Jacobson S, Esposito P, Connolly R, Theoharides TC (2002) Acute stress shortens
the time to onset of experimental allergic encephalomyelitis in SJL/J mice. Brain, Behavior, and
Immunity, 16, 757-763.
75. Esposito P, Jacobson S, Connolly R, Gheorghe D, Theoharides TC (2001) Non-invasive
assessment of blood-brain barrier (BBB) permeability using a gamma camera to detect
99technetium-gluceptate extravasation in rat brain. Brain Research Protocols, 8, 143-149.

76. Gudmundsson P, Skoog I, Waern M, Blennow K, Palsson S, Rosengren L, Gustafson D (2007)
The relationship between cerebrospinal fluid biomarkers and depression in elderly women. Am.
J. Geriatr. Psychiatry, 15, 832-838.
77. Thoeringer CK, Wultsch T, Shahbazian A, Painsipp E, Holzer P (2009) Multidrug-resistance
gene 1-type p-glycoprotein (MDR1 p-gp) inhibition by tariquidar impacts on neuroendocrine
and behavioral processing of stress. Psychoneuroendocrinology, 32, 1028-1040.
78. de Klerk OL, Willemsen AT, Bosker FJ, Bartels AL, Hendrikse NH, den Boer JA, Dierckx RA
(2010) Regional increase in P-glycoprotein function in the blood-brain barrier of patients with
chronic schizophrenia: a PET study with [(11)C]verapamil as a probe for P-glycoprotein
function. Psychiatry Res, 183, 151-156.
79. de Klerk OL, Willemsen ATM, Roosink M, Bartels AL, Hendrikse NH, Bosker FJ, den Boer JA
(2009) Locally increased P-glycoprotein function in major depression: a PET study with
[11C]verapamil as a probe for P-glycoprotein function in the blood-brain barrier. The
International Journal of Neuropsychopharmacology, 12, 895-904.
80. de Klerk OL, Bosker FJ, Willemsen AT, van Waarde A, Visser AK, de Jager T, Dagyte G, den
Boer JA, Dierckx RA, Meerlo P (2010) Chronic stress and antidepressant treatment have
opposite effects on P-glycoprotein at the blood-brain barrier: an experimental PET study in rat. J
Psychopharmacol., 24, 1237-1242.
81. Maes M, Yirmyia R, Noraberg J, Brene S, Hibbeln J, Perini G, Kubera M, Bob P, Lerer B, Maj M
(2009) The inflammatory & neurodegenerative (I&ND) hypothesis of depression: leads for future
research and new drug developments in depression. Metab Brain Dis., 24, 27-53.
82. Bartels AL, Willemsen AT, Kortekaas R, de Jong BM, De Vries R, de Klerk O, van Oostrom JC,
Portman A, Leenders KL (2008) Decreased blood-brain barrier P-glycoprotein function in the
progression of Parkinson's disease, PSP and MSA. J. Neural Transm., 115, 1001-1009.
83. Bartels AL, Kortekaas R, Bart J, Willemsen AT, de Klerk OL, de Vries JJ, van Oostrom JC,
Leenders KL (2008) Blood-brain barrier P-glycoprotein function decreases in specific brain
regions with aging: A possible role in progressive neurodegeneration. Neurobiol. Aging.
84. Bauer M, Karch R, Neumann F, Abrahim A, Wagner C, Kletter K, M++ller M, Zeitlinger M,
Langer O (2009) Age dependency of cerebral P-gp function measured with (R)-[11C]verapamil
and PET. European Journal of Clinical Pharmacology, 65, 941-946.
85. Kessler RC, Berglund P, Demler O, Jin R, Koretz D, Merikangas KR, Rush AJ, Walters EE, Wang
PS (2003) The epidemiology of major depressive disorder: results from the National Comorbidity
Survey Replication (NCS-R). JAMA, 289, 3095-3105.
86. Hoffmeyer S, Burk O, von Richter O, Arnold HP, Brockmoller J, Johne A, Cascorbi I, Gerloff T,
Roots I, Eichelbaum M, Brinkmann U (2000) Functional polymorphisms of the human
multidrug-resistance gene: multiple sequence variations and correlation of one allele with P-
glycoprotein expression and activity in vivo. Proc. Natl. Acad. Sci. U. S. A, 97, 3473-3478.
87. Dong C, Wong ML, Licinio J (2009) Sequence variations of ABCB1, SLC6A2, SLC6A3, SLC6A4,
CREB1, CRHR1 and NTRK2: association with major depression and antidepressant response in
Mexican-Americans. Mol Psychiatry, 14, 1105-1118.
88. Qian W, Homma M, Itagaki F, Tachikawa H, Kawanishi Y, Mizukami K, Asada T, Inomata S,
Honda K, Ohkohchi N, Kohda Y (2006) MDR1 gene polymorphism in Japanese patients with
schizophrenia and mood disorders including depression. Biol. Pharm. Bull., 29, 2446-2450.
89. Kuzman MR, Medved V, Bozina N, Hotujac L, Sain I, Bilusic H (2008) The influence of 5-
HT(2C) and MDR1 genetic polymorphisms on antipsychotic-induced weight gain in female
schizophrenic patients. Psychiatry Res., 160, 308-315.
90. Xing Q, Gao R, Li H, Feng G, Xu M, Duan S, Meng J, Zhang A, Qin S, He L (2006)
Polymorphisms of the ABCB1 gene are associated with the therapeutic response to risperidone
in Chinese schizophrenia patients. Pharmacogenomics, 7, 987-993.
91. Zhao R, Raub TJ, Sawada GA, Kasper SC, Bacon JA, Bridges AS, Pollack GM (2009) Breast
Cancer Resistance Protein Interacts with Various Compounds in Vitro, but Plays a Minor Role
in Substrate Efflux at the Blood-Brain Barrier. Drug Metab Dispos, 37, 1251-1258.

92. Cooray HC, Blackmore CG, Maskell L, Barrand MA (2002) Localisation of breast cancer
resistance protein in microvessel endothelium of human brain. Neuroreport, 13, 2059-2063.
93. Zhang Y, Schuetz JD, Elmquist WF, Miller DW (2004) Plasma membrane localization of
multidrug resistance-associated protein homologs in brain capillary endothelial cells. J.
Pharmacol. Exp. Ther., 311, 449-455.
94. Warren MS, Zerangue N, Woodford K, Roberts LM, Tate EH, Feng B, Li C, Feuerstein TJ, Gibbs
J, Smith B, et al. (2009) Comparative gene expression profiles of ABC transporters in brain
microvessel endothelial cells and brain in five species including human. Pharmacol Res., 59,
404-413.
95. Slot AJ, Wise DD, Deeley RG, Monks TJ, Cole SP (2008) Modulation of human multidrug
resistance protein (MRP) 1 (ABCC1) and MRP2 (ABCC2) transport activities by endogenous and
exogenous glutathione-conjugated catechol metabolites. Drug Metab Dispos, 36, 552-560.
96. Pedersen JM, Matsson P, Bergstrom CA, Norinder U, Hoogstraate J, Artursson P (2008)
Prediction and identification of drug interactions with the human ATP-binding cassette
transporter multidrug-resistance associated protein 2 (MRP2; ABCC2). J Med Chem., 51, 3275-
3287.
97. Okamura T, Kikuchi T, Okada M, Toramatsu C, Fukushi K, Takei M, Irie T (2009) Noninvasive
and quantitative assessment of the function of multidrug resistance-associated protein 1 in the
living brain. J Cereb. Blood Flow Metab, 29, 504-511.
98. Matsson P, Englund G, Ahlin G, Bergstrom CA, Norinder U, Artursson P (2007) A global drug
inhibition pattern for the human ATP-binding cassette transporter breast cancer resistance
protein (ABCG2). J Pharmacol Exp. Ther., 323, 19-30.
99. Matsson P, Pedersen JM, Norinder U, Bergstrom CA, Artursson P (2009) Identification of novel
specific and general inhibitors of the three major human ATP-binding cassette transporters P-
gp, BCRP and MRP2 among registered drugs. Pharm. Res, 26, 1816-1831.
100. Urquhart BL, Kim RB (2009) Blood-brain barrier transporters and response to CNS-active drugs.
Eur. J Clin Pharmacol, 65, 1063-1070.
101. Rochat B, Baumann P, Audus KL (1999) Transport mechanisms for the antidepressant
citalopram in brain microvessel endothelium. Brain Res., 831, 229-236.
102. Ruike Z, Junhua C, Wenxing P (2010) In vitro and in vivo evaluation of the effects of duloxetine
on P-gp function. Hum. Psychopharmacol., 25, 553-559.
103. Feng B, Mills JB, Davidson RE, Mireles RJ, Janiszewski JS, Troutman MD, de Morais SM (2008)
In vitro P-glycoprotein assays to predict the in vivo interactions of P-glycoprotein with drugs in
the central nervous system. Drug Metab Dispos., 36, 268-275.
104. Oganesian A, Shilling AD, Young-Sciame R, Tran J, Watanyar A, Azam F, Kao J, Leung L (2009)
Desvenlafaxine and venlafaxine exert minimal in vitro inhibition of human cytochrome p450
and p-glycoprotein activities. Psychopharmacol. Bull., 42, 47-63.
105. Wu J, Sha XY, Fang XL (2009) Transport of aripiprazole across Caco-2 monolayer model. Yao
Xue. Xue. Bao., 44, 188-191.
106. Boulton DW, DeVane CL, Liston HL, Markowitz JS (2002) In vitro P-glycoprotein affinity for
atypical and conventional antipsychotics. Life Sci., 71, 163-169.
107. Wang Ej, Lew K, Barecki M, Casciano CN, Clement RP, Johnson WW (2001) Quantitative
Distinctions of Active Site Molecular Recognition by P-Glycoprotein and Cytochrome P450
3A4. Chemical Research in Toxicology, 14, 1596-1603.
108. Iwaki K, Sakaeda T, Kakumoto M, Nakamura T, Komoto C, Okamura N, Nishiguchi K, Shiraki T,
Horinouchi M, Okumura K (2006) Haloperidol is an inhibitor but not substrate for MDR1/P-
glycoprotein. J Pharm. Pharmacol, 58, 1617-1622.
109. Zhou YG, Li KY, Li HD (2008) Effect of the novel antipsychotic drug perospirone on P-
glycoprotein function and expression in Caco-2 cells. Eur. J Clin Pharmacol, 64, 697-703.
110. Zhu HJ, Wang JS, Markowitz JS, Donovan JL, Gibson BB, DeVane CL (2007) Risperidone and
paliperidone inhibit p-glycoprotein activity in vitro. Neuropsychopharmacology, 32, 757-764.
111. Mahar Doan KM, Humphreys JE, Webster LO, Wring SA, Shampine LJ, Serabjit-Singh CJ,
Adkison KK, Polli JW (2002) Passive permeability and P-glycoprotein-mediated efflux

differentiate central nervous system (CNS) and non-CNS marketed drugs. J Pharmacol Exp.
Ther., 303, 1029-1037.
112. Weiss J, Kerpen CJ, Lindenmaier H, Dormann SM, Haefeli WE (2003) Interaction of
antiepileptic drugs with human P-glycoprotein in vitro. J. Pharmacol. Exp. Ther., 307, 262-267.
113. Yang HW, Liu HY, Liu X, Zhang DM, Liu YC, Liu XD, Wang GJ, Xie L (2008) Increased P-
glycoprotein function and level after long-term exposure of four antiepileptic drugs to rat brain
microvascular endothelial cells in vitro. Neurosci. Lett., 434, 299-303.
114. Rizzi M, Caccia S, Guiso G, Richichi C, Gorter JA, Aronica E, Aliprandi M, Bagnati R, Fanelli R,
D'Incalci M, et al. (2002) Limbic seizures induce P-glycoprotein in rodent brain: functional
implications for pharmacoresistance. J Neurosci., 22, 5833-5839.
115. Sills GJ, Kwan P, Butler E, de Lange EC, van den Berg DJ, Brodie MJ (2002) P-glycoprotein-
mediated efflux of antiepileptic drugs: preliminary studies in mdr1a knockout mice. Epilepsy
Behav., 3, 427-432.
116. Rivers F, O'Brien TJ, Callaghan R (2008) Exploring the possible interaction between anti-
epilepsy drugs and multidrug efflux pumps; in vitro observations. Eur. J Pharmacol, 598, 1-8.
117. Potschka H, Fedrowitz M, Loscher W (2002) P-Glycoprotein-mediated efflux of phenobarbital,
lamotrigine, and felbamate at the blood-brain barrier: evidence from microdialysis experiments
in rats. Neurosci. Lett., 327, 173-176.
118. Baltes S, Fedrowitz M, Tortos CL, Potschka H, Loscher W (2007) Valproic acid is not a substrate
for P-glycoprotein or multidrug resistance proteins 1 and 2 in a number of in vitro and in vivo
transport assays. J Pharmacol Exp. Ther., 320, 331-343.
119. Laika B, Leucht S, Steimer W (2006) ABCB1 (P-glycoprotein/MDR1) gene G2677T/a sequence
variation (polymorphism): lack of association with side effects and therapeutic response in
depressed inpatients treated with amitriptyline. Clin. Chem., 52, 893-895.
120. Uhr M, Tontsch A, Namendorf C, Ripke S, Lucae S, Ising M, Dose T, Ebinger M, Rosenhagen M,
Kohli M, et al. (2008) Polymorphisms in the drug transporter gene ABCB1 predict
antidepressant treatment response in depression. Neuron, 57, 203-209.
121. Sarginson JE, Lazzeroni LC, Ryan HS, Ershoff BD, Schatzberg AF, Murphy GM, Jr. (2010)
ABCB1 (MDR1) polymorphisms and antidepressant response in geriatric depression.
Pharmacogenet. Genomics, 20, 467-475.
122. Kato M, Fukuda T, Serretti A, Wakeno M, Okugawa G, Ikenaga Y, Hosoi Y, Takekita Y,
Mandelli L, Azuma J, Kinoshita T (2008) ABCB1 (MDR1) gene polymorphisms are associated
with the clinical response to paroxetine in patients with major depressive disorder. Prog.
Neuropsychopharmacol. Biol. Psychiatry, 32, 398-404.
123. Mihaljevic PA, Bozina N, Sagud M, Rojnic KM, Lovric M (2008) MDR1 gene polymorphism:
therapeutic response to paroxetine among patients with major depression. Prog.
Neuropsychopharmacol. Biol. Psychiatry, 32, 1439-1444.
124. Perlis RH, Fijal B, Dharia S, Heinloth AN, Houston JP (2010) Failure to Replicate Genetic
Associations with Antidepressant Treatment Response in Duloxetine-Treated Patients. Biol.
Psychiatry.
125. Peters EJ, Slager SL, Kraft JB, Jenkins GD, Reinalda MS, McGrath PJ, Hamilton SP (2008)
Pharmacokinetic genes do not influence response or tolerance to citalopram in the STAR*D
sample. PLoS. One., 3, e1872.
126. Lin KM, Chiu YF, Tsai IJ, Chen CH, Shen WW, Liu SC, Lu SC, Liu CY, Hsiao MC, Tang HS, et
al. (2011) ABCB1 gene polymorphisms are associated with the severity of major depressive
disorder and its response to escitalopram treatment. Pharmacogenetics and Genomics April, 21,
163-170.
127. Roberts RL, Joyce PR, Mulder RT, Begg EJ, Kennedy MA (2002) A common P-glycoprotein
polymorphism is associated with nortriptyline-induced postural hypotension in patients treated
for major depression. Pharmacogenomics J, 2, 191-196.
128. Lin YC, Ellingrod VL, Bishop JR, Miller dD (2006) The relationship between P-glycoprotein
(PGP) polymorphisms and response to olanzapine treatment in schizophrenia. Ther. Drug
Monit., 28, 668-672.

129. Jovanovic N, Bozina N, Lovric M, Medved V, Jakovljevic M, Peles AM (2010) The role of
CYP2D6 and ABCB1 pharmacogenetics in drug-naive patients with first-episode schizophrenia
treated with risperidone. Eur. J Clin Pharmacol, 66, 1109-1117.
130. Sirot Jacqenoud EM, Knezevic BM, Morena GPM, Harenberg SP, Oneda BP, Crettol SP,
Ansermot NP, Baumann PP, Eap CBP (2009) ABCB1 and Cytochrome P450 Polymorphisms:
Clinical Pharmacogenetics of Clozapine. Journal of Clinical Psychopharmacology, 29, 319-326.
131. Fukui N, Suzuki Y, Sawamura K, Sugai T, Watanabe J, Inoue Y, Someya T (2007) Dose-
dependent effects of the 3435 C>T genotype of ABCB1 gene on the steady-state plasma
concentration of fluvoxamine in psychiatric patients. Ther. Drug Monit., 29, 185-189.
132. Ghotbi R, Mannheimer B, Aklillu E, Suda A, Bertilsson L, Eliasson E, +ûsby U (2010) Carriers of
the UGT1A4 142T>G gene variant are predisposed to reduced olanzapine exposureΓÇöan impact
similar to male gender or smoking in schizophrenic patients. European Journal of Clinical
Pharmacology, 66, 465-474.
133. Yasui-Furukori N, Mihara K, Takahata T, Suzuki A, Nakagami T, De VR, Tateishi T, Kondo T,
Kaneko S (2004) Effects of various factors on steady-state plasma concentrations of risperidone
and 9-hydroxyrisperidone: lack of impact of MDR-1 genotypes. Br. J. Clin. Pharmacol., 57, 569-
575.


Chapter 4
Locally increased P-glycoprotein function in major depression
A PET study with [11C]-verapamil as a probe for P-glycoprotein function in the blood-brain barrier.

Authors:
Onno L. de Klerk1,6
Antoon T.M. Willemsen2
Meyke Roosink3
Anna L. Bartels4
N. Harry Hendrikse5
Fokko J. Bosker1
Johan A. den Boer1
1University Center of Psychiatry, University Medical Center Groningen (UMCG), 2Dept. of Nuclear Medicine and Molecular Imaging, UMCG, 3Twente University, 4Dept.
of Neurology, UMCG, 5Dept. of Nuclear Medicine and PET research, VU medical
center, 6GGZ Drenthe, Assen.
The International Journal of Neuropsychopharmacology 2009, 12, 895-904.

Abstract
The etiology of depressive disorder remains unknown, although genetic susceptibility
and exposure to neurotoxins are currently being discussed as possible contributors to
this disorder. In normal circumstances, the brain is protected against blood borne toxic
influences by the blood-brain barrier, which includes the molecular efflux pump P-
glycoprotein (P-gp) in the vessel wall of brain capillaries. We hypothesised that P-gp
function in the blood-brain barrier is changed in patients with major depression.
Positron-emission tomography was used to measure brain uptake of [11C]-verapamil,
which is normally expelled from the brain by P-gp. Cerebral volume of distribution
(VT) of [11C]verapamil was used as measure of P-gp function. Both region of interest
(ROI) analysis and voxel analysis using statistical parametric mapping (SPM2) were
performed to assess regional brain P-gp function. We found that patients with a major
depressive episode, using antidepressants, compared to healthy controls showed a
significant decrease of [11C]-verapamil uptake in different areas throughout the brain,
in particular in frontal and temporal regions. The decreased [11C]-verapamil-uptake
correlates with an increased function of the P-gp protein and may be related to chronic
use of psychotropic drugs. Our results may explain why treatment resistant depression
can develop.
Introduction
A large body of evidence gathered during the past decades indicates that brain
monoaminergic systems play a key role in the pathogenesis of affective disorders.
However, not all symptoms of depression can be related to dysfunctions in
monoaminergic systems. For instance, it is now known that stressful events paving the
way to affective disorders, lead to changes in neuroplasticity, impair neurogenesis and
may lead to a neuroinflammatory response in the brain.1 As such, it has been suggested
that a dysfunction of the blood-brain barrier (BBB) and blood-cerebrospinal fluid
barrier may contribute to the pathophysiology of major depressive disorder. Hampel
and colleagues reported that serum/cerebrospinal fluid ratios of several inflammatory
proteins (used as an indirect measure of BBB function) were altered in depression.2,3
Several endogenous substances, such as cortisol, are found in the brain parenchyma in
concentrations in subjects with a major depressive disorder.
The BBB is formed by the brain capillary non-fenestrated polarized endothelial cells
that have high-resistance tight junctions. Besides low passive permeability, the brain is
protected from potentially harmful endogenous and exogenous substances by efflux
transporter proteins, located in the brain capillary wall.
P-glycoprotein (P-gp), a product of the MDR-1 gene, now denoted as ABCB1, in
humans and the MDR-1a and MDR-1b genes in mice, is a major drug efflux
transporter, involved in the efflux of a wide variety of lipophilic drugs and endogenous
substances.4 Attenuation of P-gp function, for example through use of pharmacologic
inhibitors, results in substantial changes in the pharmacokinetics and
pharmacodynamics of various substrates.5-7
Nuclear medicine imaging techniques such as PET (Positron Emission Tomography)
have been evaluated as non-invasive techniques for the evaluation of the BBB, allowing
study of the P-gp pump.8 Using several experimental designs, the applicability of [11C]-
verapamil as PET-tracer has been extensively studied9-11 and has been found to be a
suitable methodology for the in vivo assessment of P-gp functionality in humans, and
allows the quantification of BBB-P-gp function in neurodegenerative diseases.8,10-12
The protective role of P-gp may be negatively influenced in neurodegenerative
diseases. Animal models of neuroinflammation have demonstrated that P-gp is
downregulated by proinflammatory cytokines.13-15 In a recent PET study using [11C]-
verapamil it was found that the function of BBB P-gp was diminished in later stages of
Parkinson’s disease, whereas de novo patients with Parkinson showed a regional
upregulation of P-gp in frontal regions.16 In another [11C]-verapamil PET study in
patients with schizophrenia it was shown that P-gp function was locally increased.17

The authors state that P-gp induction may be a factor of importance in drug resistance
in schizophrenia. P-gp function is possibly under the influence of genetic
polymorphisms.18
To date, no detailed evidence is available for a dysfunction of the Blood-Brain Barrier
through P-glycoprotein modulation in major depressive disorder. It is not known
whether P-gp function or expression is altered during a depressive episode.
In this exploratory study we hypothesized that P-glycoprotein function would be
altered in limbic areas (hippocampus, amygdala) as well in frontotemporal areas (incl.
anterior cingulate cortex) since these areas are known to play a role in depression.19,20
We performed positron emission tomography (PET) brain imaging of P-gp with [11C]-
verapamil as radiotracer in depressed patients and healthy controls. We further
hypothesized that this altered functional activity of P-gp could be connected to a
genetic polymorphism of the ABCB1 gene. To assess these hypothesized changes in P-
gp function, PET brain imaging with [11C]-verapamil as radiotracer was performed in
depressed patients and healthy controls. The distribution volume of [11C]-verapamil
was used as a measure of total P-gp function.
Methods
Subjects
Fourteen patients suffering from depression were recruited and participated in the
study. All underwent a Mini International Neuropsychiatric Interview, (M.I.N.I. plus
5.0.0., Dutch Version, 2000) for DSM-IV and fulfilled the criteria for a major depressive
episode.21 Inclusion criteria for subjects with a major depressive episode were 1) age 40-
80 years; 2) fulfilment of the DSM-IV criteria for major depressive episode; and 3)
capacity to give informed consent. The age range 40-80 years was chosen, because we
expected to find larger differences at a later age in particular, since P-gp function
declines with aging.22 Moreover, the control group was also used in another study.
Exclusion criteria were 1) use of known P-gp modulating agents (cardiovascular drugs,
antimalarial drugs, cyclosporine A, phenothiazines, hormones (eg. tamoxifen), certain
antibiotics such as cefoperazone, ceftriaxone, erythromycine);23 2) any somatic disease
of kidney, liver, heart or brain; 3) history of traumatic brain damage; 4)
electroconvulsive treatment in the past three months; 5) abnormalities at clinical (incl.
neurological) and laboratory examination; 6) pregnancy. This research was approved by
the Ethics Committee of the University Medical Centre Groningen, and all subjects
gave written informed consent according to the Declaration of Helsinki. All patients
had a minimum score of at least 19 on the 17-item Hamilton Depression Rating Scale at
the time of the PET study.24 All patients had a physical examination and laboratory
evaluation. All were in good physical health and none had meaningful laboratory
abnormalities. The healthy controls as well as their first degree relatives were required
to have no history of any psychiatric disease, nor in their first degree relatives. The
other inclusion and exclusion criteria for healthy controls were similar to the patients.
Before the scan, blood was drawn from the venous canula for genotyping. Three
common MDR1 single nucleotide polymorphisms were detected using a PCR analysis.
Radiochemistry
Racemic [11C]-verapamil was produced as previously described.25 The injected
radioactivity of [11C]-verapamil was comparable for the control group and subjects with
a major depressive episode (see Results section). Specific activity for all subjects was at
least 16 GBq/µmol. Following radiotracer injection, subjects underwent a dynamic PET
acquisition protocol as described previously.12
PET procedure
All scans were performed with the use of an ECAT EXACT HR+ position camera
(Siemens/CTI, Knoxville, TN). After the radiotracer injection of [11C]-verapamil serial
dynamic PET scanning was done at escalating time frames and serial arterial blood
sampling for [11C]-verapamil took place during the scan in order to define the input
function. The samples of all subjects were collected with an automated sampling
system, together with 6 manually drawn samples per subject. These samples (collected
at intervals of 10 minutes) were further processed to measure the radioactivity in
plasma and blood. In this way the contribution of the injected activity to the signal
could be calculated. No metabolite analysis was done. Images were reconstructed in
brain mode using an iterative reconstruction (Ordered Subsets - Expectation
Maximization) with 4 iterations and 16 subsets and a Gaussian filter of 4 mm. The scans
were performed in 3D mode.
Data analysis
The PET data were analyzed with both a voxel-wise group analysis using statistical
parametric mapping (SPM2) and a ROI (regions of interest)-based approach. Results
from both methods were used and compared.
First, all images were stereotaxically normalized to MNI space using SPM2 and a [11C]-
verapamil template image that could be used from earlier studies of our group.12,22 The
resulting images were analysed with SPM2 as described below. For the ROI analysis the
following ROIs, based on the literature as cited above, were selected for
analysis: prefrontal cortex, anterior cingulate cortex, temporal lobes, amygdala and

hippocampus. Therefore, predefined ROIs from the Anatomical Automated Labeling
package26 were used to select the appropriate voxels and calculate the corresponding
time-activity curves using in-house developed software. In addition, a whole brain ROI
was manually drawn using Clinical Applications Programming Package software
(CAPP; CTI/Siemens PET Systems, Knoxville, USA).
A graphical analysis according to Logan for quantification of the dynamic PET data was
done with plasma data as input. The Logan plot was started at 5 minutes. With this
method the distribution volume (VT) was estimated. Because the slope (i.e.VT effect)
obtained in the graphical approach may be biased in the presence of noisy data,27 we
verified the VT in a kinetic analysis (i.e. single tissue compartment model). The influx
rate constant (K1) and efflux k2 were derived from this model and on all parameters (i.e.
VT, K1 and k2) the group means (patient group vs. control group) were compared with
each other, using parametric tests. Analysis of covariance was performed in order to
find relevant (clinical) predictors (age, length of present episode, number of previous
episodes, severity of symptoms) of VT or K1. To exclude a possible confounding effect of
subjects without a strict DSM-IV diagnosis (i.e. Diagnostic Statistical Manual, 4th ed.) of
Major Depressive Disorder (MDD), a subanalysis was also done for the group with
MDD only (n=10).
Data were then analyzed with SPM2 (Statistical Parametric Mapping, 2002). To adjust
for differences in individual neuroanatomy and to improve the signal-to-noise ratio, a
12-mm full-width at half-maximum Gaussian smoothing filter was applied to all images.
We first compared the groups by looking at absolute differences in VT, using t-test and
ANCOVA with cofactors (MDR1 allelic variation, age, length of present episode,
number of previous trials, severity of symptoms, injected activity of [11C]-verapamil).
Clusters of 8 or more voxels at a threshold of PFDR<0.05 (false discovery rate) were
considered to be significant. Coordinates were transformed into Talairach space
(Talairach and Tournoux, 1988) using the mni2tal-transformation (http://www.mrc-
cbu.cam.ac.uk/Imaging/).
Results
The mean injected [11C]-verapamil dose was not different for the two groups (control
group: mean = 317 MBq, SD = 119; group with depression: mean = 279 MBq; SD = 179;
t-test: t=-0.344; d.f.=24; p=0.734). Table 4.1 shows the demographic characteristics and
medication use of the patient group. Twelve patients had had a previous depressive
episode, three patients had a bipolar type I disorder, the current episode being
depressive.

Three subjects had a depressive episode with psychotic features. One patient was
excluded from the analysis because the VT was considered an outlier since the
difference to the group mean was 4.6 times the standard deviation of the group, for
unknown reasons. The patient group (6 female/7 males, mean age 54.1 years ± 7.6) was
compared to a sex matched comparison group (6 female and 7 male subjects; mean age
56.3 ± 14.3 years). Patients had a mean score of 25.8 (± 4.8) on the 17-item HAM-D
(range 19-37). Nine patients were currently depressed for more than 12 weeks.
Interestingly, 7 of this group could be considered to be treatment resistant, using
criteria of Dunner).28 Comorbid disorders included post traumatic stress disorder
(PTSD) (n=1) and panic disorder (n = 1). All subjects used an antidepressant or a mood
stabilizer at the time of scanning.
We determined three common MDR1 single nucleotide polymorphisms (SNP) (-129 T
>C (exon 1), 2677 G> T/A (exon 21) and 3435 C> T (exon 26)) in our patient group. For
the SNP 3435 on exon 26 the allele frequencies in the patient group were CC 23%; CT
38% and TT 39%. The allele frequencies of SNP 3435 in our subjects were not different
from the frequency in the population.29
The mean brain time activity curves (after correction for weight and injected dose) for
the whole brain of patient group and control group were compared and the area below
the curve was calculated. No differences in the area below the curve was found. Both
curves overlapped (data not shown). The VT values of the ROI (whole brain) were
calculated with both the Logan analysis and the ‘single tissue compartment model’, in
order to verify that the VT effect measured in the Logan method was concordant with
another method. Pearson’s correlation coefficient (r) was very good, 1.000 (p =0.000).
The Logan curve gave an excellent fit in all cases. The VT in ROI whole brain in the
group of patients (n=13) with depression was lower at a nearly significant level (Z = -
2.008; p=0.055). K1 (whole brain ROI) showed no significant difference between the
groups. (0.48 ± 0.15 (controls) vs. 0.41 ± 0.10 (patients); p = 0.15). Neither did the k2
values (0.71 ± 0.10 (controls) vs. 0.75 ± 0.15 (patients); p=0.46). In the ANCOVA none
of the cofactors (age, length of present episode, number of previous episodes, severity
of symptoms) showed a significant effect on the results. Both groups were compared
with a Student’s t-test for the selected ROIs (prefrontal cortex, anterior cingulate
cortex, temporal lobes, hippocampi, amygdala). Here we found a significantly lower VT
in the patient group for the prefrontal cortex (0.64 ± 0.20 (controls) vs. 0.44 ± 0.15
(patients); p=0.009), the temporal lobes (0.66 ± 0.21 (controls) vs. 0.44 ± 0.19 (patients);
p=0.01), the anterior cingulate cortex (0.53 ± 0.20 (controls) vs. 0.34 ±0.18 (patients);
p=0.016), and for amygdala (0.72 ± 0.30 (controls) vs. 0.49 ± 0.24 (patients); p=0.045)
but not for hippocampus ( 0.55 ± 0.32 (controls) vs. 0.41 ± 0.13 (patients); p= 0.146). VT
differences in prefrontal cortex and temporal lobes were significant after Bonferroni

Table 4.1
Characteristics of subjects with major depressive episode AO: Age of onset; LPE: length of present episode; O=outpatient; DT = day treatment; PC = psychiatric
clinic; M = male; F = female; HAMD = Hamilton Depression Rating Scale; BP-I = Bipolar disorder type I;
D = (current phase) depressive; MDD = Major Depressive Disorder, P = psychotic features; PTSD Post
Traumatic Stress Disorder, PD = panic disorder
Sub
ject
no
Treat-
ment
Settin
g
Gen
der
Age AO LPE
(wk)
DSM-IV HA
M
D
Medication
1 PC M 47 22 20 BP-I,
D,P
22 valproic acid 2000 mg/d (level
79 mg/l); venlafaxine 225
mg/d, risperidone 2 mg/d
2 O F 72 67 12 MDD 20 mirtazapine 30 mg/d,
temazepam 20 mg 1 dd 1;
cetirizine 10 mg/d
3 PC F 71 45 104 MDD 25 imipramine 100mg/d;
lactulose 30 ml/d;
esomeprazol 20 mg/d;
quetiapine 200 mg/d
4 DT F 51 27 26 BP-I,D 22 lithium carbonate 900 mg/d
(level 0·88 mg/l); diclofenac
150 mg/d
5 PC F
52 33 26 MDD,P 37 tranylcypromine 60 mg/d;
olanzapine 15 mg/d
6 PC M
60 60 8 MDD, P 26 citalopram 20 mg/d
7 PC M
56 51 52 MDD
PTSD
31 lithiumcarbonate 1000 mg/d
(level 0·90 mg/L); nortriptyline
100 mg/d
8 PC M
55 23 26 MDD,
PD
25 nortriptyline 100 mg/d
9 PC F
56 31 104 MDD 27 tolderodine 4 mg/d;
temazepam 20 mg/d;
cisordinol 2 mg/d; mirtazapine
30 mg/d
10 O M 41 39 6 MDD 24 citalopram 40 mg/d;
mirtazapine 30 mg/d;
oxazepam 50 mg/d
11 PC F 52 38 12 BP-I 29 valproic acid 1500 mg/d;
temazepam 20 mg/d; asacol;
thyrax 75 µg/d
12 PC M 46 46 20 MDD 24 venlafaxine 150 mg/d
13 PC M 52 44 6 MDD 30 venlafaxine 150 mg/d
14 O F 57 56 12 MDD 19 mirtazapine 30 mg/d;
citalopram 20 mg/d

correction for multiple tests. The mean ± S.D. of VT for each group are shown for each
ROI in figure 1.
A pixel-by pixel t test (without scaling) comparing both groups (13 vs. 13) in SPM2,
showed several clusters, mainly located in temporal and frontal regions, in which the
tracer uptake (VT) was lower in the patient group, Pfdr = 0.028 (see table 4.2). The
largest cluster measured 52 cm3, including predominantly temporal lobes, reaching
from the precentral gyrus to cerebellum and to the parietal lobes. The other large
cluster (36 cm3) included the prefrontal cortex (see fig. 2). The clusters that reached
statistical significance overlapped to a great extent with the area’s found in the ROI-
analysis. Length of present episode (in weeks), HAMD scores, number of previous
episodes, allelic variation of MDR-1 polymorphisms 3435C>T and 2677G>T, diagnosis
and administered verapamil activity as covariates in ANCOVA had no significant effect
as confounder on the results.
Table 4.2
Clustersize
(cm3)
PFDR-corr
T-value
(max)
MNI
coordinates Location
52.8 0.028 3.66 -38 -2 -10 left temporal lobe, gray matter
0.028 3.62 -12 -6 8 left thalamus, ventral anterior nc.
0.028 3.40 28 12 -24 right temporal lobe, superior temporal gyrus
35.6 0.028 3.64 44 26 22 right frontal lobe middle frontal gyrus
3.37 -20 46 22 left frontal lobe, superior frontal gyrus
8.0 0.028 3.37 -42 -52 -18 left cerebellum
1.5 0.028 2.83 -4 -62 4 left occipital lobe, lingual gyrus
4.3 0.028 2.81 -6 -26 48 left frontal lobe, paracentral lobule
characteristics of significant clusters in SPM2 MNI (Montreal Neurological Institute); FDR-corr = corrected false discovery rate

A subanalysis of the 10 patients with major depressive disorder (MDD) was also done.
The subset was compared to a matched subset of our control group both at ROI level
and in a voxelwise analysis in SPM2. The results in the voxelbased approach indicated a
somewhat stronger decrease in VT compared to the control group. A large cluster (240
cm3, PFDR=0.016, T max=4.83) was found, comprising mainly temporal lobes and frontal
cortex (data not shown). The VT in ROI whole brain was also significantly lower than
in the matched control group (0.75 ± 0.25 (controls) vs. 0.55 ±0.08 (MDD); p=0.030).
The results on ROI level for selected are shown in figure 4.1.
Finally, we compared the subgroup of patients with a treatment resistant depressive
episode (n=7) to a matched subset of our control group. This comparison gave
comparable results in both the voxelbased and pixelbased approach to the analysis of
the whole group (n=13), yielding a significant decrease in VT both on ROI level and on
voxel level in the group with a treatment resistant depressive episode (data not shown).
Figure 4.1
T-test comparison of the two groups at selected regions of interest. Distribution Volume (VT) (mean (○) and standard deviation (I) are shown in regions relevant for
depression.... amyg = amygdalae; hipp = hippocampus; cing = anterior cingulate cortex; pfc = prefrontal
cortex; temp = temporal lobes; c = control group; d = patient group with a depressive episode (n=13); MD
= subgroup (n=10) of patients with a major depressive disorder. Both patient groups showed a significant
decrease in VT in all regions but the hippocampus (* = p< 0.05, ** = p<0.05 after Bonferroni correction).

Discussion
This study shows a significantly lowered [11C]-verapamil uptake (distribution volume)
in prefrontal cortex and temporal lobes in patients with a major depressive episode. The
results of different methods of analysis were all in accordance with each other. In
functional imaging studies the prefrontal cortex and temporal lobes have often been
associated with MDD.30,31 To our knowledge this is the first study showing involvement
of P-glycoprotein in medicated patients with major depressive disorder. Seven of the
13 patients studied were considered to be treatment resistant, most patients were
admitted to a psychiatric hospital, indicating either a severe depressive episode or a
chronic course of the illness. Although clinical parameters indicating treatment
resistance or chronicity were not significant cofactors in ANCOVA, a significant
decrease in VT (in temporal and frontal areas) was found in in a subset of patients with
a treatment resistant depressive disorder (compared to a matched control group).
Treatment resistance in depression may in fact be associated with increased P-gp
function. Increased P-gp function may cause low uptake of antidepressants. Similar to
treatment resistant epilepsy where increased expression of P-gp is associated with
resistance to antiepileptics and poor prognosis,32,33 treatment resistance may also have
influenced our results.
Regional differences in VT may reflect localized regions of higher P-gp function, which
may be under the influence of a functional polymorphism of MDR1. The SNP C3435T
has been associated with altered P-gp function, albeit in an intestinal cell line,18 which
does not necessarily reflect the P-gp expression in brain cells. However, the impact of
genetic variations in the MDR1- gene on the course of major depressive disorder or the
response on antidepressants is considered to be moderate or absent, and results are
conflicting.34-38 The frequencies of the determined polymorphism in our study group
did not differ from the frequencies seen in the general population.29,38
Our results may also be explained by a neuroinflammatory process. There is increasing
evidence for the role of cytokines in the pathogenesis of depression. Inflammation
results in the release of proinflammatory cytokines, acting as neuromodulator and
accounting for most of the symptoms in depression.39,40 Experimental animal models of
inflammation show that inflammation can influence P-gp expression and activity in
different ways.14,15,41 Although a decrease in function and expression of P-gp seems to
be the case in acute inflammatory models, the study by Tan and colleagues shows that
P-gp function was increased after the acute inflammatory phase.42 The course of a
depressive episode may be similar in such a way that in the chronic phase P-gp is
upregulated.43 Post mortem studies are warranted to confirm these hypotheses. It is
desirable that further (neuro-imaging) studies are conducted to shed light on the
neuro-inflammatory events in major depressive disorder.

Regional differences in VT might be explained by an increase in atrophy in cortical
brain areas in major depression. However, the most consistent findings in studies using
structural MRI is reduction in hippocampal volume44 and basal ganglia, whereas
atrophy in frontal regions has been found less consistently. In contrast the most robust
reduction in VT, in our study was seen in the temporal lobes for which atrophy has not
been reported. The fact that no differences in VT were found in the hippocampus at
ROI level may be due to spill-in of radioactivity of the adjacent choroid plexus, since is
has been reported that there is a high accumulation of radioactivity in the choroids
plexus.45
A possible limitation of the present study is the fact that patients were treated with
antidepressant medication. The increase in P-gp function in our study could be caused
by the use of medication. Drugs or substances that are known to enhance the P-gp
expression were all excluded in our study (see table 4.1). Many of the antidepressant
and antipsychotic drugs used are substrates for P-gp, but their effect on P-gp activity is
probably not clinically relevant.46-49
Of several antidepressants and anticonvulsants it is known that they inhibit the P-gp
pump in a concentration dependent manner in porcine brain cells.48-51 In in-vitro
studies of antupsychotics inhibition of P-gp was only seen in concentrations above
therapeutically relevant plasma levels, thus suggesting that the inhibitory effect of
antipsychotics may not play a role in clinical practice.46,48 Recently, it was found that
venlafaxine (used by three patients) can induce P-gp in human caco-2 cells.52
Nevertheless, the implication of chronic use of antidepressant and/or antipsychotic
drugs is however not known. It cannot be excluded that antidepressant and/or
antipsychotic agents given for a sustained period lead to an up-regulation of the P-gp
pump. To rule out this possibility, future studies in medication-naive patients are
needed.
In addition to a possible effect on P-gp function, medication may also have influenced
the metabolism of [11C]-verapamil. It is known that anticonvulsants influence [11C]-
verapamil metabolism, probably through induction of cytochrome P450.53 Two of our
patients were on valproic acid. Leaving these 2 patients out of the analysis of difference
to the results. Medication may also have influenced the free fraction of [11C]-verapamil,
leading to a lower VT effect in the patient group. The influx parameter (K1) suggested
no difference between the two groups, due to a large variance. The fact that only
certain areas (i.e. temporal lobes and prefrontal cortex) showed a significant decrease in
VT cannot be explained in this way.

In the present study no analysis of metabolites was performed. Although this can be
seen as another limitation of the study, we assume that the total contribution of
metabolites, that contribute to the PET- signal, but have no affinity for the P-gp pump,
is small. Only the N-demethylated fraction (so called polar fraction) has no affinity for
P-gp.54,55 As Lubberink et al. have shown the “one tissue compartment” model gives an
excellent fit of the data, irrespective of metabolite input.54 Their data indicate that the
contribution of the polar fraction to the brain signal is small. It can however not be
excluded that chronic use of antipsychotic and antidepressant agents may have
influenced the metabolism of [11C]-verapamil, thereby reducing brain uptake of the
radiotracer in patients. However, the fact that a decrease in VT is only seen in specific
areas can probably not be attributed to the metabolites of [11C]-verapamil.
In summary, in our PET study using [11C]-verapamil as a tracer, we have found
evidence for an increased function of P-gp in patients with a major depressive episode
under long term treatment conditions, which for the first time may provide an
explanation for treatment resistance in patients suffering from major depressive
disorder.
Figure 4.2
T-map showing a diminished Distribution Volume of [11C]-verapamil in 13 patients with a depressive episode compared to the healthy control group (n = 13). The clusters that reached statistical significance in a voxel-wise t- test (pFDR < 0�05) (in SPM2) are shown. (A) significant projections on a glass brain. (B) MRI-overlay: a large cluster located in frontal cortex, left and right temporal lobes, as well as subcortical nuclei is shown. (C) results for 10 patients with MDD compared to a matched control group (n-10).

References
1. Trentani A, Kuipers SD, ter Horst GJ, den Boer JA (2003) In Kasper S, den Boer JA, Sitsen JMA
(eds.), Handbook of depression and anxiety. Marcel Dekker, New York, pp. 349-386.
2. Hampel H, Muller-Spahn F, Berger C, Haberl A, Ackenheil M, Hock C (1995) Evidence of
blood-cerebrospinal fluid-barrier impairment in a subgroup of patients with dementia of the
Alzheimer type and major depression: a possible indicator for immunoactivation. Dementia, 6,
348-354.
3. Hampel H, Kotter HU, Moller HJ (1997) Blood-cerebrospinal fluid barrier dysfunction for high
molecular weight proteins in Alzheimer disease and major depression: indication for disease
subsets. Alzheimer Dis. Assoc. Disord., 11, 78-87.
4. Schinkel AH, Smit JJ, van Tellingen O, Beijnen JH, Wagenaar E, van Deemter L, Mol CA, van
der Valk MA, Robanus-Maandag EC, te Riele HP (1994) Disruption of the mouse mdr1a P-
glycoprotein gene leads to a deficiency in the blood-brain barrier and to increased sensitivity to
drugs. Cell, 77, 491-502.
5. Schinkel AH, Wagenaar E, Mol CA, van Deemter L (1996) P-glycoprotein in the blood-brain
barrier of mice influences the brain penetration and pharmacological activity of many drugs. J.
Clin. Invest, 97, 2517-2524.
6. Löscher W, Potschka H (2005) Role of drug efflux transporters in the brain for drug disposition
and treatment of brain diseases. Prog. Neurobiol., 76, 22-76.
7. Cordon-Cardo C, O'Brien JP, Boccia J, Casals D, Bertino JR, Melamed MR (1990) Expression of
the multidrug resistance gene product (P-glycoprotein) in human normal and tumor tissues. J.
Histochem. Cytochem., 38, 1277-1287.
8. Elsinga PH, Hendrikse NH, Bart J, Vaalburg W, van Waarde A (2004) PET Studies on P-
glycoprotein function in the blood-brain barrier: how it affects uptake and binding of drugs
within the CNS. Curr. Pharm. Des, 10, 1493-1503.
9. Elsinga PH, Franssen EJ, Hendrikse NH, Fluks L, Weemaes AM, van der Graaf WT, de Vries EG,
Visser GM, Vaalburg W (1996) Carbon-11-labeled daunorubicin and verapamil for probing P-
glycoprotein in tumors with PET. J. Nucl. Med., 37, 1571-1575.
10. Hendrikse NH, Schinkel AH, de Vries EG, Fluks E, van der Graaf WT, Willemsen AT, Vaalburg
W, Franssen EJ (1998) Complete in vivo reversal of P-glycoprotein pump function in the blood-
brain barrier visualized with positron emission tomography. Br. J. Pharmacol., 124, 1413-1418.
11. Hendrikse NH, de Vries EG, Eriks-Fluks L, van der Graaf WT, Hospers GA, Willemsen AT,
Vaalburg W, Franssen EJ (1999) A new in vivo method to study P-glycoprotein transport in
tumors and the blood-brain barrier. Cancer Res., 59, 2411-2416.
12. Kortekaas R, Leenders KL, van Oostrom JC, Vaalburg W, Bart J, Willemsen AT, Hendrikse NH
(2005) Blood-brain barrier dysfunction in parkinsonian midbrain in vivo. Ann. Neurol., 57, 176-
179.
13. Bauer B, Hartz AM, Fricker G, Miller DS (2005) Modulation of p-glycoprotein transport
function at the blood-brain barrier. Exp. Biol. Med. (Maywood), 230, 118-127.
14. Fernandez C, Buyse M, German-Fattal M, Gimenez F (2004) Influence of the pro-inflammatory
cytokines on P-glycoprotein expression and functionality. J. Pharm. Pharm. Sci., 7, 359-371.
15. McRae MP, Brouwer KL, Kashuba AD (2003) Cytokine regulation of P-glycoprotein. Drug
Metab. Rev., 35, 19-33.
16. Bartels AL, Willemsen AT, Kortekaas R, de Jong BM, De Vries R, de Klerk O, van Oostrom JC,
Portman A, Leenders KL (2008) Decreased blood-brain barrier P-glycoprotein function in the
progression of Parkinson's disease, PSP and MSA. J. Neural Transm.. 115, 1001-1009.
17. de Klerk OL, Willemsen AT, Bosker FJ, Bartels AL, Hendrikse NH, den Boer JA, Dierckx RA
(2010) Regional increase in P-glycoprotein function in the blood-brain barrier of patients with
chronic schizophrenia: a PET study with [(11)C]verapamil as a probe for P-glycoprotein
function. Psychiatry Res., 183, 151-156.

18. Hoffmeyer S, Burk O, von Richter O, Arnold HP, Brockmoller J, Johne A, Cascorbi I, Gerloff T,
Roots I, Eichelbaum M, Brinkmann U (2000) Functional polymorphisms of the human
multidrug-resistance gene: multiple sequence variations and correlation of one allele with P-
glycoprotein expression and activity in vivo. Proc. Natl. Acad. Sci. U. S. A, 97, 3473-3478.
19. Drevets WC (1999) Prefrontal cortical-amygdalar metabolism in major depression. Ann. N. Y.
Acad. Sci., 877, 614-637.
20. Mayberg H (2002) Depression, II: localization of pathophysiology. Am. J. Psychiatry, 159, 1979.
21. Sheehan DV, Lecrubier Y, Sheehan KH, Amorim P, Janavs J, Weiller E, Hergueta T, Baker R,
Dunbar GC (1998) The Mini-International Neuropsychiatric Interview (M.I.N.I.): the
development and validation of a structured diagnostic psychiatric interview for DSM-IV and
ICD-10. J. Clin. Psychiatry, 59 Suppl 20, 22-33.
22. Bartels AL, Kortekaas R, Bart J, Willemsen AT, de Klerk OL, de Vries JJ, van Oostrom JC,
Leenders KL (2008) Blood-brain barrier P-glycoprotein function decreases in specific brain
regions with aging: A possible role in progressive neurodegeneration. Neurobiol. Aging.
23. Matheny CJ, Lamb MW, Brouwer KR, Pollack GM (2001) Pharmacokinetic and
pharmacodynamic implications of P-glycoprotein modulation. Pharmacotherapy, 21, 778-796.
24. Hamilton M (1960) A rating scale for depression. J. Neurol. Neurosurg. Psychiatry, 23, 56-62.
25. Wegman TD, Maas B, Elsinga PH, Vaalburg W (2002) An improved method for the preparation
of [11C]verapamil. Appl. Radiat. Isot., 57, 505-507.
26. Tzourio-Mazoyer N, Landeau B, Papathanassiou D, Crivello F, Etard O, Delcroix N, Mazoyer B,
Joliot M (2002) Automated anatomical labeling of activations in SPM using a macroscopic
anatomical parcellation of the MNI MRI single-subject brain. Neuroimage., 15, 273-289.
27. Abi-Dargham A, Martinez D, Mawlawi O, Simpson N, Hwang DR, Slifstein M, Anjilvel S,
Pidcock J, Guo NN, Lombardo I, et al. (2000) Measurement of striatal and extrastriatal dopamine
D1 receptor binding potential with [11C]NNC 112 in humans: validation and reproducibility. J.
Cereb. Blood Flow Metab, 20, 225-243.
28. Dunner DL (2006) Definitions and clinical characteristics of treatment resistant depression. 159th
Annual Meeting of the American Psychiatric Association, Toronto, Canada. p. 8A.
29. Tan EK, Drozdzik M, Bialecka M, Honczarenko K, Klodowska-Duda G, Teo YY, Tang K, Wong
LP, Chong SS, Tan C, et al. (2004) Analysis of MDR1 haplotypes in Parkinson's disease in a
white population. Neurosci. Lett., 372, 240-244.
30. Brody AL, Barsom MW, Bota RG, Saxena S (2001) Prefrontal-subcortical and limbic circuit
mediation of major depressive disorder. Semin. Clin. Neuropsychiatry, 6, 102-112.
31. Drevets WC (1999) Prefrontal cortical-amygdalar metabolism in major depression. Ann. N. Y.
Acad. Sci., 877, 614-637.
32. Löscher W, Potschka H (2002) Role of multidrug transporters in pharmacoresistance to
antiepileptic drugs. J. Pharmacol. Exp. Ther., 301, 7-14.
33. Sisodiya SM, Lin WR, Squier MV, Thom M (2001) Multidrug-resistance protein 1 in focal
cortical dysplasia. Lancet, 357, 42-43.
34. Eichelbaum M, Fromm MF, Schwab M (2004) Clinical aspects of the MDR1 (ABCB1) gene
polymorphism. Ther. Drug Monit., 26, 180-185.
35. Laika B, Leucht S, Steimer W (2006) ABCB1 (P-glycoprotein/MDR1) gene G2677T/a sequence
variation (polymorphism): lack of association with side effects and therapeutic response in
depressed inpatients treated with amitriptyline. Clin. Chem., 52, 893-895.
36. Mihaljevic-Peles A, Bozina N, Sagud M (2007) Pharmacogenetics in modern psychiatry.
Psychiatr. Danub., 19, 231-233.
37. Qian W, Homma M, Itagaki F, Tachikawa H, Kawanishi Y, Mizukami K, Asada T, Inomata S,
Honda K, Ohkohchi N, Kohda Y (2006) MDR1 gene polymorphism in Japanese patients with
schizophrenia and mood disorders including depression. Biol. Pharm. Bull., 29, 2446-2450.
38. Woodahl EL, Ho RJ (2004) The role of MDR1 genetic polymorphisms in interindividual
variability in P-glycoprotein expression and function. Curr. Drug Metab, 5, 11-19.
39. Raison CL, Capuron L, Miller AH (2006) Cytokines sing the blues: inflammation and the
pathogenesis of depression. Trends Immunol., 27, 24-31.

40. Schiepers OJ, Wichers MC, Maes M (2005) Cytokines and major depression. Prog.
Neuropsychopharmacol. Biol. Psychiatry, 29, 201-217.
41. Monville C, Fages C, Feyens AM, D'Hondt V, Guillet C, Vernallis A, Gascan H, Peschanski M
(2002) Astroglial expression of the P-glycoprotein is controlled by intracellular CNTF. BMC.
Cell Biol., 3, 20.
42. Tan KH, Purcell WM, Heales SJ, McLeod JD, Hurst RD (2002) Evaluation of the role of P-
glycoprotein in inflammation induced blood-brain barrier damage. Neuroreport, 13, 2593-2597.
43. Hartz AM, Bauer B, Fricker G, Miller DS (2006) Rapid modulation of P-glycoprotein-mediated
transport at the blood-brain barrier by tumor necrosis factor-alpha and lipopolysaccharide. Mol.
Pharmacol., 69, 462-470.
44. Videbech P, Ravnkilde B (2004) Hippocampal volume and depression: a meta-analysis of MRI
studies. Am. J. Psychiatry, 161, 1957-1966.
45. Langer O, Bauer M, Hammers A, Karch R, Pataraia E, Koepp MJ, Abrahim A, Luurtsema G,
Brunner M, Sunder-Plassmann R, et al. (2007) Pharmacoresistance in epilepsy: a pilot PET study
with the P-glycoprotein substrate R-[(11)C]verapamil. Epilepsia, 48, 1774-1784.
46. El Ela AA, Hartter S, Schmitt U, Hiemke C, Spahn-Langguth H, Langguth P (2004)
Identification of P-glycoprotein substrates and inhibitors among psychoactive compounds--
implications for pharmacokinetics of selected substrates. J. Pharm. Pharmacol., 56, 967-975.
47. Peer D, Dekel Y, Melikhov D, Margalit R (2004) Fluoxetine inhibits multidrug resistance
extrusion pumps and enhances responses to chemotherapy in syngeneic and in human xenograft
mouse tumor models. Cancer Res., 64, 7562-7569.
48. Weber CC, Kressmann S, Ott M, Fricker G, Muller WE (2005) Inhibition of P-glycoprotein
function by several antidepressants may not contribute to clinical efficacy. Pharmacopsychiatry,
38, 293-300.
49. Weiss J, Dormann SM, Martin-Facklam M, Kerpen CJ, Ketabi-Kiyanvash N, Haefeli WE (2003)
Inhibition of P-glycoprotein by newer antidepressants. J. Pharmacol. Exp. Ther., 305, 197-204.
50. Peer D, Dekel Y, Melikhov D, Margalit R (2004) Fluoxetine inhibits multidrug resistance
extrusion pumps and enhances responses to chemotherapy in syngeneic and in human xenograft
mouse tumor models. Cancer Res., 64, 7562-7569.
51. Weiss J, Kerpen CJ, Lindenmaier H, Dormann SM, Haefeli WE (2003) Interaction of
antiepileptic drugs with human P-glycoprotein in vitro. J. Pharmacol. Exp. Ther., 307, 262-267.
52. Ehret MJ, Levin GM, Narasimhan M, Rathinavelu A (2007) Venlafaxine induces P-glycoprotein
in human Caco-2 cells. Hum. Psychopharmacol., 22, 49-53.
53. Abrahim A, Luurtsema G, Bauer M, Karch R, Lubberink M, Pataraia E, Joukhadar C, Kletter K,
Lammertsma AA, Baumgartner C, et al. (2008) Peripheral metabolism of (R)-[(11)C]verapamil in
epilepsy patients. Eur. J. Nucl. Med. Mol. Imaging, 35, 116-123.
54. Lubberink M, Luurtsema G, van Berckel BN, Boellaard R, Toornvliet R, Windhorst AD,
Franssen EJ, Lammertsma AA (2007) Evaluation of tracer kinetic models for quantification of P-
glycoprotein function using (R)-[11C]verapamil and PET. J. Cereb. Blood Flow Metab, 27, 424-
433.
55. Pauli-Magnus C, von RO, Burk O, Ziegler A, Mettang T, Eichelbaum M, Fromm MF (2000)
Characterization of the major metabolites of verapamil as substrates and inhibitors of P-
glycoprotein. J. Pharmacol. Exp. Ther., 293, 376-382.


Chapter 5
Regional increase in P-glycoprotein function in the blood-brain-barrier of
patients with chronic schizophrenia A PET study with [11C]-verapamil as a probe for P-glycoprotein function

Authors:
Onno L. de Klerk1,2
Antoon T.M. Willemsen3
Fokko J. Bosker1
Anna L. Bartels4
N. Harry Hendrikse5
Rudi A. Dierckx3
Johan A. den Boer1
1Department of Psychiatry, University Medical Center Groningen (UMCG), 2GGZ
Drenthe, 3Dept. of Nuclear Medicine and Molecular Imaging, UMCG, 4Dept. of
Neurology, UMCG, 5Dept. of Nuclear Medicine and PET research, VU medical center.
Psychiatry Research 2010, 183, 151-156.

Abstract
P-glycoprotein (P-gp), a major efflux pump in the Blood-Brain Barrier (BBB) has a
profound effect on entry of drugs, peptides and other substances into the central
nervous system (CNS). The brain permeability can be negatively influenced by
modulation of the transport function of P-gp. Inflammatory mediators play a role in
schizophrenia, and may be able to influence the integrity of the BBB, via P-gp
modulation.
We hypothesized that P-gp function in the BBB is changed in patients with
schizophrenia. Positron-emission tomography was used to measure brain uptake of
[11C]-verapamil, which is normally extruded from the brain by P-gp. We found that
patients with chronic schizophrenia using antipsychotic drugs compared to healthy
controls showed a significant decrease in [11C]-verapamil uptake in temporal cortex,
basal ganglia and amygdalae, and a trend towards a significant decrease was seen
throughout the brain. The decrease of [11C]-verapamil-uptake correlates with an
increased activity of the P-gp pump. Increased P-gp activity may be a factor in drug
resistance in schizophrenia, induced by the use of antipsychotic agents.

Introduction
In schizophrenia, the pathological mechanism, leading to an illness affecting all
domains of behavior, remains unknown. Several authors have tried to correlate the
structural and functional brain abnormalities in schizophrenia with alterations in the
blood-brain barrier (BBB).1-3
In normal circumstances, the BBB is an important factor in the protection of the brain
against harmful environmental influences. The endothelial tissue forming the BBB
exhibits very low permeability and expresses enzymes and efflux pumps, further
limiting the passage of drugs, peptides and proteins.
There are strong indications for an impaired integrity of the BBB in schizophrenia,3
such as increased intracerebral concentrations of the soluble intercellular adhesion
molecule-1 (sICAM-1) and Very Late Antigen-4 (VLA-4) in schizophrenia have been
reported.2 Furthermore, the content of immunoglobulin and albumin is raised in
cerebrospinal fluid in 30% of patients with schizophrenia. The increased permeability
facilitates the penetration of inflammatory cells or the invasion of infectious pathogens,
thus causing damage to the brain.1,4
An important element of the BBB that is increasingly recognised as a gate keeper of the
brain, P-glycoprotein (P-gp), which is an efflux pump, limiting the entrance of many
structurally divergent lipophilic molecules, such as peptides and many of the drugs
used in psychiatry and neurology.5,6 P-gp is encoded by the ABCB1 gene (ATP-binding
cassette, sub-family B, (previously MDR-1, or Multi Drug Resistance gene). Genetic
variants of ABCB1 have been proposed as potential susceptibility factors for
schizophrenia and several brain diseases and as determinants of treatment response to
antipsychotic drugs.7-9 Furthermore, the protective role of the BBB may be
compromised in schizophrenia due to a inflammatory or to a neurodegenerative
process.10 The activity of P-gp may be influenced bidirectionally by inflammatory
reponses.11 Moreover, P-gp function is reported to be decreased in the progression of
neurodegenerative diseases.12 However, no direct evidence is available for a
dysfunction of P-gp in schizophrenia.
The activity of P-gp at the BBB can be studied in vivo by neuroimaging techniques
such as PET with [11C]-verapamil as PET-tracer.13 It appears to be a suitable
methodology for the in vivo assessment of P-gp functionality in humans, and allows
the quantification of BBB-P-gp function in neurodegenerative diseases.14-16 In this
preliminary study we performed positron emission tomography (PET) brain imaging of
P-gp with [11C]-verapamil as radiotracer in schizophrenic patients and healthy controls.
We hypothesized that P-glycoprotein function would be altered in dorsolateral
prefrontal cortex, amygdala, thalamic nuclei, temporal areas as well basal ganglia since
these areas are known to play a role in schizophrenia.17-20 We further hypothesized that

a change in P-gp expression would be associated with a genetic polymorphism of the
ABCB1 gene.
Materials and methods
Subjects
Ten patients suffering from schizophrenia, paranoid type, were recruited and
participated in the study. All underwent a Mini International Neuropsychiatric
Interview (M.I.N.I. plus 5.0.0., Dutch Version, 2000) for DSM-IV and fulfilled the
criteria for schizophrenia, paranoid type.21 Inclusion criteria for subjects with
schizophrenia were 1) age 18-65 years; 2) fulfilment of the DSM-IV criteria for
schizophrenia; and 3) capacity to give informed consent. Exclusion criteria were 1) use
of known P-gp modulating agents (cardiovascular drugs, antimalarial drugs,
cyclosporine A, phenothiazines, hormones (eg. tamoxifen), certain antibiotics such as
cefoperazone, ceftriaxone, erythromycine);22 2) any somatic disease of kidney, liver,
heart or brain; 3) history of traumatic brain damage; 4) electroconvulsive treatment in
the past three months; 5) abnormalities at clinical (incl. neurological) and laboratory
examination; 6) pregnancy. This research was approved by the Ethics Committee of the
University Medical Centre Groningen, and all subjects gave written informed consent
according to the Declaration of Helsinki.
For all patients a PANSS (Positive And Negative Symptom Scale) was done at the time
of the PET study.23 All were in good physical health and none had meaningful
laboratory abnormalities. The inclusion and exclusion criteria for healthy controls were
similar. In addition, the healthy controls as well as their first degree relatives were
required to have no history of any psychiatric disease, nor in their first degree relatives.
Before the scan, blood was drawn from the venous canula for genotyping. Three
common ABCB1 single nucleotide polymorphisms (T129C, G2677T/A and C3435T)
were detected using a PCR-RFLP-method (polymeric chain reaction - restriction
fragment length polymorphism).
Radiochemistry
Racemic [11C]verapamil was produced as previously described.24 The injected
radioactivity of [11C]-verapamil did not differ between control subjects (mean = 382
MBq; SD = 20) and subjects with schizophrenia (mean 385 MBq; SD = 76). In all cases,
specific activity was at least 16 Gbq/µmol.
PET procedure
We used an ECAT EXACT HR+ position camera (Siemens/CTI, Knoxville, TN). After
the radiotracer injection of [11C]-verapamil serial dynamic PET scanning was

performed at escalating time frames over a period of 60 minutes. Continuous arterial
blood sampling to measure the activity of the radiotracer took place during the scan in
order to define the input function. Manual samples (collected at intervals of 10
minutes) were collected to calibrate the plasma and blood time-activity data. No
metabolite analysis was done. Images were reconstructed in brain mode using an
iterative reconstruction (Ordered Subsets - Expectation Maximization) with 4 iterations
and 16 subsets and a Gaussian filter of 4 mm. The scans were performed in 3D mode.
Regions of interest were traced using an computerized brain atlas (Talairach Daemon)
(The Research Image Center UTHSCSA, University of Texas Laboratory, USA).
Data analysis
Image visualization and region of interest (ROI) analyses were performed using Clinical
Applications Programming Package software (CAPP; CTI/Siemens PET Systems,
Knoxville, TN). First, all images were transformed into a stereotaxic standard space.
This normalizing spatial transformation matches each scan to the [11C]-verapamil
template that was available from an earlier study of our group.15 Stereotaxic
normalization of PET images allows comparison of scan data in identical pixels across
different subjects and scans.
The data were analyzed in three ways. First the data for the whole brain were
compared between patients and controls. Then a-priori defined brain regions were
tested with SPM2 and appropriate small volume correction. Finally, a hypothesis
generating test was performed on all voxels using SPM2 and FDR correction. In all
cases the Volume of Distribution (VT) was used as a measure for P-gp function.
The multilinear implementation approach (MA1)25 of the Logan plot26 was used to
determine VT with minimal bias. For the whole brain ROI analyses we additionally
verified VT in a kinetic analysis (i.e. one-tissue compartment model). Finally, using the
one-tissue compartment model, the whole brain influx (K1) was calculated also. VT was
calculated and its difference between patient group and control group was compared
with t-tests and ANCOVA (analysis of covariance) with age as cofactor. Parameters in
the patient group (different scores on PANSS scale, antipsychotic dose in Haloperidol
equivalents (mg), number of previous episodes) were also considered as predictors in a
regression analysis, or their correlation with VT was calculated.
To test the a-priori defined brain regions, the VT images (based on the whole brain
time-activity curve) were then analyzed with SPM2 (Statistical Parametric Mapping,
2002). Based on the literature as cited above, we selected the following regions:
prefrontal cortex, basal ganglia, temporal cortex, amygdalae and thalamic nuclei. These
regions were defined using a single mask image encompassing all selected brain
regions. Then small volume correction was applied to correct for the multiple
comparison in the selected volume only. No scaling or global normalisation was

performed to test absolute differences in VT. To adjust for differences in individual
neuroanatomy and to improve the signal-to-noise ratio, a 12-mm full-width at half-
maximum Gaussian smoothing filter was applied to all images. The group comparison
was made after age correction (ANCOVA). Using the PET model option ‘single
subjects, covariates only’, measurement of a potential confound (number of previous
episodes, antipsychotic dose (Haldol equivalents), PANSS score could also be
determined.
Finally, hypothesis generating tests were performed in SPM2. The same contrasts as
mentioned above tested the main effect between the patient group and the healthy
control group.
Results
The patient group (10 males, mean age 43.9 years ± 16.9) was compared to a sex and age
matched comparison group (mean age 43.0 ± 17.6 years). On the PANSS patients had a
mean score of 12.9 (± 2.6) for positive symptoms 16.4 (±7.9) for negative symptoms and
24 (± 6.2) for general symptoms. All subjects had suffered three or more psychotic
episodes, the last episode within 6 months prior to the PET-scan. None had a comorbid
psychiatric or somatic disorder. All subjects used antipsychotic medication at the time
of scanning. Table 5.1 shows the demographic characteristics and medication use of the
patient group.
The mean brain time activity curves (TAC) (after correction for weight and injected
dose) at brain ROI level of both groups were almost equal, the mean area under the
curve (AUC) was not significantly lower for schizophrenia than for the control group.
The Logan curves of all subjects gave an excellent fit of the observed data. Correlation
of calculated VT between the Logan method and the one tissue compartment model was
excellent: Pearson’s coefficient was 0.906 (p<0.01). The VT over the whole brain was
lower in the patient group (0.47 ± 0.15) than in the control group (0.67 ± 0.26),
although not significantly (t = 2.095; df = 18; p = 0.051); K1 was equal between the
groups (controls: 0.046 ± 0.014; patients: 0.052 ± 0.023; p = 0.47). K2 showed large
variation in the patient group (0.17 ± 0.23) (vs. controls: 0.07 ± 0.0071) and appeared
not to be equally distributed (Levene’s test: F = 5.82; p = 0.027). In a nonparametric test
k2 was significantly higher in the patient group (Kolmogorov-Smirnov Z = 1.565; p =
0.015). None of the parameters (i.e. Haldol equivalents, number of previous episodes,
PANSS scores) correlated with VT or K1 in the patient group, neither a significant effect
in a linear regression model (ANOVA) was found. Additionally, we corrected the data
for age (with ANCOVA), since the age variation in the sample was large. In the age

corrected model, with VT as dependent variable, the significant trend was lost (F=2.25;
p=0.136), age explained 21% of the variance in the sample. No correlation between age
and controls (Pearson ρ=0.05; p=0.89) or patient group (ρ=-0.35; p=0.32) was found,
however.
In SPM2 the a priori hypothesis was performed with ANCOVA (with age as cofactor)
for the selected areas (temporal cortex, prefrontal cortex, amygdala, basal ganglia and
thalami). Significant clusters, showing a lower VT in the patient group, were found in
the temporal cortex (PFDR = 0.032), basal ganglia (PFDR = 0.019), amygdala (PFDR = 0.028),
but not in thalamus (PFDR = 0.108), and prefrontal cortex (PFDR = 0.076). More details are
shown in table 5.2. No significant effect of the cofactors (PANSS, number of previous
episodes, antipsychotic dose) were found in SPM2 (option ‘single subject, covariates
only’). A hypothesis generating analysis (ANCOVA, age as cofactor) comparing both
groups showed 1 large cluster and two clusters of modest size, with a significant trend
at voxel level (PFDR = 0.094), clusters involving many areas throughout the brain, in
particular the temporal lobes, limbic lobes (right temporal lobe, 25.3 cm3 and left
temporal lobe 17.2 cm3), the left parietal lobe (10.2 cm3) basal ganglia, and to less extent
smaller areas in the frontal lobes (see figures 1a and 1b). The areas represent a (trend to
a significant) decrease in VT in the group of patients with schizophrenia.
Figure 5.1
T-map showing a diminished a trend towards a decreased Distribution Volume of [11C]-verapamil in 10 patients with schizophrenia, a depressive episode compared to the healthy control group (n = 13). compared to 10 healthy controls in sagital, coronal and axial directions. The clusters of voxels at PFDR = 0.09 (in SPM2) are shown. (A): projections on a glass brain (B) MRI-overlay: clusters located in (fronto)temporal and parietal lobes, as well as subcortical nuclei are shown.

Table 5.1
Characteristics of subjects with schizophrenia NE = Number of previous Episodes; Rem. (months): number of months in remission since last psychotic
episode; PANSS = Positive and Negative Symptoms Scale (Sheehan et al., 1998); P,N,G = scores on
symptom scales for Positive, Negative, General symptoms; Medication: oral dosis in mg per day. Cloz =
Clozapine; Hal = Haloperidole; Ris = Risperidone; Parox = Paroxetine; Cital = Citalopram; Tem =
Temazepam; Zuclo = Zuclopentixol; Ris IM = Risperidone Intramuscular (dosis in mg per 2 weeks)
Table 5.2
Selected region
search
volume(cm3)
T-value (max) PFDR
Temporal cortex 40.7 2.76 0.032
Thalamus 12.5 2.59 0.108
Basal ganglia 4.6 2.72 0.019
amygdalae 1.4 2.38 0.028
PFC 32.1 3.04 0.076
characteristics of most significant clusters of the selected volumes of interest in SPM2 characteristics of most significant clusters of the selected volumes of interest in SPM2 characteristics of most significant clusters of the selected volumes of interest in SPM2 characteristics of most significant clusters of the selected volumes of interest in SPM2 PFC = prefrontal cortex; PFDR= (false discovery rate) corrected p-value
Subject
No
Age Age of
onset
NE
Rem.
(months)
PANSS
(P,N,G)
Medication
1 44 19 >5 3 14,20,38 Ris IM 50,Cloz 200,
Parox 20
2 45 23 >5 12 16,9,24 Ris 2
3 40 21 >5 4 11,21,20 Cloz 300, Tem 20
4 35 24 5 6 10,6,19 Ris 6
5 40 25 >5 10 12,13,20 Cloz 300
6 23 18 4 8 13,13,21 Olanz 20
7 31 22 >5 3 16,28,22 Olanz 10 Cital 20
8 34 19 5 9 15,27,30 Ris 4, Parox 20
9 34 30 3 6 9,11,21 Olanz 20 Zuclo 20

Genetic Polymorphisms
Three common ABCB1 single nucleotide polymorphisms (SNP) (-129 T >C (exon 1),
2677 G> T/A (exon 21) and 3435 C> T (exon 26)) were determined in the patient group.
For the SNP 3435 on exon 26 the allele frequencies in the patient group were CC 33%;
CT 44% and TT 22%. For the SNP 2677 allele frequencies were 33% GT, 44% GG, 22
% TT. The frequencies of the combination of 2677GG/3435CC was 33%. The allele
frequencies of the SNPs 3435 and 2677 in our subjects were not different from the
frequency in the population.27,28 Of SNP 129T>C the allele frequency was found to be
TT in all cases (n=10), compared to a 96% frequency in the population (n=206).28
Discussion
This study shows regionally decreased [11C]-verapamil uptake in temporal cortex,
amygdalae and basal ganglia in patients with schizophrenia compared to healthy
controls. Our study group consisted of 10 patients with chronic paranoid
schizophrenia, all having suffered at least three psychotic episodes with residual
symptoms. All used antipsychotic drugs. The results of different methods of analysis
were in accordance with each other, showing a trend towards a significant decrease in
VT in patients with schizophrenia, which is interpreted as an increase in P-gp function,
since differences in influx were not found. Moreover, a higher efflux was found at
whole brain ROI level. To date, this is the first time evidence has been obtained
explaining a relationship between a functional change of the efflux pump in medicated
patients with schizophrenia.
Our findings may be of great value since an increase in P-gp function may be relevant
for the clinical course in schizophrenia. Increased P-gp function causes low uptake of
antipsychotic agents and may thus be associated with poor treatment outcome. In
oncology P-gp upregulation is coupled to tumor resistance to chemotherapy and poor
prognosis.29 An increase of P-gp function in the BBB may be correlated with a more
chronic course of schizophrenia. Our results may at least partially explain why often
lower antipsychotic doses suffice in first episode patients. Abnormalities in the
amygdala, basal ganglia and temporal cortex are consistent with available evidence,
that suggests that the pathological process in schizophrenia affects many areas.18 An
open question is how and why P-gp function is regionally increased in schizophrenia,
and what the treatment consequences can be of a regionally increased P-gp function.
A possible association with an increased expression or activity of (cerebral) P-gp in
schizophrenic patients may be a functional polymorphism of ABCB1. The frequencies
of the determined polymorphisms in our study group did however not differ from the
frequencies seen in the general population,28 although no definitive conclusions can be

drawn due to the small sample size. There are reports of great variation in the
expression of P-gp,30,31 but P-gp expression does not necessarily reflect activity.32 The
best studied SNP is C3435T and although it has been associated with altered P-gp
function,33 the results of different studies have been discordant.34 It has been suggested
that ABCB1 haplotypes should be analyzed in stead of SNPs.8,34 However, the impact of
genetic variations in the ABCB1 gene on pharmacokinetics and pharmacodynamics of
P-gp substrates is considered to be moderate.8,35
The local P-gp increase found in our study may also be explained by a
neuroinflammatory or a neurodegenerative process. Studies that focus on cytokine
production in schizophrenia patients show that pro-inflammatory cytokines are
actively involved,36,37 and models of acute neuro-inflammation in cell lines show that
several pro-inflammatory cytokines can reversibly inhibit P-gp function and its
expression.32,38,39 However, P-gp-activity and expression appears to be increased after
the acute phase.11,40 TNF appears to exert both an acute pro-inflammatory as well as a
neuroprotective effect through different receptor subtypes.41,42 A functional change in
P-gp activity may also fit in a neurodegenerative hypothesis of schizophrenia, with
long-term alterations in blood–brain barrier permeability after inflammatory events in
early life.10 Tan et al. demonstrated an up-regulation of P-gp in a human BBB model
following exposure to activated T-lymphocytes.43
Another explanation for the increase in P-gp function in our study could be the use of
medication that induces P-gp-function. All medication known to induce P-gp activity
was excluded in our study.22 All of the patients used antipsychotic agents and three
used an antidepressant as well (see table 5.1). Most of the psychotropic drugs used are
known substrates for the P-gp pump.44-47 On the short term these drugs have shown to
possess weak inhibitory effect on P-gp activity, which is probably clinically
irrelevant.44,46 Although not used by any of the patients, in a [11C]-verapamil PET study
we recently showed that P-gp function at the BBB is increased by chronic
administration of venlafaxine.48 The use of medication is a limitation of the study.
Besides a possible effect on P-gp function, medication may also have influenced the
metabolism of [11C]-verapamil. Anticonvulsives for example are known to influence
[11C]-verapamil metabolism, probably through induction of p450 cytochromes.49 Of
antipsychotic agents this effect is however not known. Medication might also have
influenced the free fraction of [11C]-verapamil, consequently leading to a lower effect
in the patient group. On the other hand, the influx parameter K1 was not different
between the two groups, indicating a comparable influx between the groups. Besides,
the fact that only certain areas show a decrease in radio tracer uptake cannot be
explained in this way.

In our study no analysis of metabolites was done. We assume that the contribution of
radioactive metabolites of [11C]-verapamil to the PET-signal, that has no affinity for the
P-gp pump is small. Only the N-demethylated fraction (so called polar fraction) has no
affinity for P-gp.50,51 The data of Lubberink c.s. indicate that the contribution of the
polar fraction to the brain signal is small. It is however possible that chronic use of
antipsychotic and antidepressant agents has had influence on metabolism of [11C]-
verapamil, thereby reducing brain uptake of the radiotracer in patients. The fact that K1
showed no differences between the groups and the fact that differences are only seen in
specific areas militate against the role of metabolites on the PET data.
In summary, in this [11C]-verapamil-PET study evidence was found for local increase in
P-gp activity in medicated schizophrenia patients. Our results shed new light on the
pharmacokinetics of antipsychotic drugs in schizophrenia and offers an explanation for
the occurrence of drug resistance in schizophrenia. The small study group may limit
the evidential value of our findings. Future studies that focus on the role of P-gp in
different phases of the disease in a larger study group without the confounding
influence of medication are warranted.

References
1. Hanson DR, Gottesman II (2005) Theories of schizophrenia: a genetic-inflammatory-vascular
synthesis. BMC. Med. Genet., 6, 7.
2. Muller N, Riedel M, Hadjamu M, Schwarz MJ, Ackenheil M, Gruber R (1999) Increase in
expression of adhesion molecule receptors on T helper cells during antipsychotic treatment and
relationship to blood-brain barrier permeability in schizophrenia. Am. J. Psychiatry, 156, 634-
636.
3. Rothermundt M, Arolt V, Bayer TA (2001) Review of immunological and immunopathological
findings in schizophrenia. Brain Behav. Immun., 15, 319-339.
4. Gilmore JH, Jarskog LF, Vadlamudi S, Lauder JM (2004) Prenatal infection and risk for
schizophrenia:IL-Iß, IL-6 and TNFα inhibit cortical neuron dendrite development.
Neuropsychopharmacology, 29, 1221-1229.
5. Ambudkar SV, Dey S, Hrycyna CA, Ramachandra M, Pastan I, Gottesman MM (1999)
Biochemical, cellular, and pharmacological aspects of the multidrug transporter. Annu. Rev.
Pharmacol. Toxicol., 39, 361-398.
6. Schinkel AH, Smit JJ, van Tellingen O, Beijnen JH, Wagenaar E, van Deemter L, Mol CA, van
der Valk MA, Robanus-Maandag EC, te Riele HP, . (1994) Disruption of the mouse mdr1a P-
glycoprotein gene leads to a deficiency in the blood-brain barrier and to increased sensitivity to
drugs. Cell, 77, 491-502.
7. Lin YC, Ellingrod VL, Bishop JR, Miller dD (2006) The relationship between P-glycoprotein
(PGP) polymorphisms and response to olanzapine treatment in schizophrenia. Ther. Drug
Monit., 28, 668-672.
8. Sakaeda T, Nakamura T, Okumura K (2004) Pharmacogenetics of drug transporters and its
impact on the pharmacotherapy. Curr. Top. Med. Chem., 4, 1385-1398.
9. Yasui-Furukori N, Mihara K, Takahata T, Suzuki A, Nakagami T, De VR, Tateishi T, Kondo T,
Kaneko S (2004) Effects of various factors on steady-state plasma concentrations of risperidone
and 9-hydroxyrisperidone: lack of impact of MDR-1 genotypes. Br. J. Clin. Pharmacol., 57, 569-
575.
10. Stolp HB, Dziegielewska KM (2009) Review: Role of developmental inflammation and blood-
brain barrier dysfunction in neurodevelopmental and neurodegenerative diseases. Neuropathol.
Appl. Neurobiol., 35, 132-146.
11. Roberts DJ, Goralski KB (2008) A critical overview of the influence of inflammation and
infection on P-glycoprotein expression and activity in the brain. Expert. Opin. Drug Metab
Toxicol., 4, 1245-1264.
12. Bartels AL, Willemsen AT, Kortekaas R, de Jong BM, De Vries R, de Klerk O, van Oostrom JC,
Portman A, Leenders KL (2008) Decreased blood-brain barrier P-glycoprotein function in the
progression of Parkinson's disease, PSP and MSA. J. Neural Transm., 115, 1001-1009.
13. Elsinga PH, Hendrikse NH, Bart J, Vaalburg W, van Waarde A (2004) PET Studies on P-
glycoprotein function in the blood-brain barrier: how it affects uptake and binding of drugs
within the CNS. Curr. Pharm. Des, 10, 1493-1503.
14. Hendrikse NH, de Vries EG, Eriks-Fluks L, van der Graaf WT, Hospers GA, Willemsen AT,
Vaalburg W, Franssen EJ (1999) A new in vivo method to study P-glycoprotein transport in
tumors and the blood-brain barrier. Cancer Res., 59, 2411-2416.
15. Kortekaas R, Leenders KL, van Oostrom JC, Vaalburg W, Bart J, Willemsen AT, Hendrikse NH
(2005) Blood-brain barrier dysfunction in parkinsonian midbrain in vivo. Ann. Neurol., 57, 176-
179.
16. Sasongko L, Link JM, Muzi M, Mankoff DA, Yang X, Collier AC, Shoner SC, Unadkat JD (2005)
Imaging P-glycoprotein transport activity at the human blood-brain barrier with positron
emission tomography. Clin. Pharmacol. Ther., 77, 503-514.

17. Harrison BJ, Yucel M, Shaw M, Brewer WJ, Nathan PJ, Strother SC, Olver JS, Egan GF,
Velakoulis D, McGorry PD, Pantelis C (2006) Dysfunction of dorsolateral prefrontal cortex in
antipsychotic-naive schizophreniform psychosis. Psychiatry Res., 148, 23-31.
18. Honea R, Crow TJ, Passingham D, Mackay CE (2005) Regional deficits in brain volume in
schizophrenia: a meta-analysis of voxel-based morphometry studies. Am. J. Psychiatry, 162,
2233-2245.
19. Pantelis C, Yucel M, Wood SJ, Velakoulis D, Sun D, Berger G, Stuart GW, Yung A, Phillips L,
McGorry PD (2005) Structural brain imaging evidence for multiple pathological processes at
different stages of brain development in schizophrenia. Schizophr. Bull., 31, 672-696.
20. Selemon LD (2001) Regionally diverse cortical pathology in schizophrenia: clues to the etiology
of the disease. Schizophr. Bull., 27, 349-377.
21. Sheehan DV, Lecrubier Y, Sheehan KH, Amorim P, Janavs J, Weiller E, Hergueta T, Baker R,
Dunbar GC (1998) The Mini-International Neuropsychiatric Interview (M.I.N.I.): the
development and validation of a structured diagnostic psychiatric interview for DSM-IV and
ICD-10. J. Clin. Psychiatry, 59 Suppl 20, 22-33.
22. Matheny CJ, Lamb MW, Brouwer KR, Pollack GM (2001) Pharmacokinetic and
pharmacodynamic implications of P-glycoprotein modulation. Pharmacotherapy, 21, 778-796.
23. Kay SR, Fiszbein A, Opler LA (1987) The positive and negative syndrome scale (PANSS) for
schizophrenia. Schizophr. Bull., 13, 261-276.
24. Wegman TD, Maas B, Elsinga PH, Vaalburg W (2002) An improved method for the preparation
of [11C]verapamil. Appl. Radiat. Isot., 57, 505-507.
25. Ichise M, Toyama H, Innis RB, Carson RE (2002) Strategies to improve neuroreceptor parameter
estimation by linear regression analysis. J. Cereb. Blood Flow Metab, 22, 1271-1281.
26. Logan J (2000) Graphical analysis of PET data applied to reversible and irreversible tracers. Nucl.
Med. Biol., 27, 661-670.
27. Pechandova K, Buzkova H, Slanar O, Perlik F (2006) Polymorphisms of the MDR1 gene in the
Czech population. Folia Biol. (Praha), 52, 184-189.
28. Tan EK, Drozdzik M, Bialecka M, Honczarenko K, Klodowska-Duda G, Teo YY, Tang K, Wong
LP, Chong SS, Tan C, et al. (2004) Analysis of MDR1 haplotypes in Parkinson's disease in a
white population. Neurosci. Lett., 372, 240-244.
29. Di NF, Mercer SJ, Knight LA, Gabriel FG, Whitehouse PA, Sharma S, Fernando A, Glaysher S,
Di PS, Johnson P, et al. (2005) Cancer cell adaptation to chemotherapy. BMC. Cancer, 5, 78.
30. Johnson WW (2002) P-glycoprotein-mediated efflux as a major factor in the variance of
absorption and distribution of drugs: modulation of chemotherapy resistance. Methods Find.
Exp. Clin. Pharmacol., 24, 501-514.
31. Lown KS, Mayo RR, Leichtman AB, Hsiao HL, Turgeon DK, Schmiedlin-Ren P, Brown MB, Guo
W, Rossi SJ, Benet LZ, Watkins PB (1997) Role of intestinal P-glycoprotein (mdr1) in
interpatient variation in the oral bioavailability of cyclosporine. Clin. Pharmacol. Ther., 62, 248-
260.
32. Fernandez C, Buyse M, German-Fattal M, Gimenez F (2004) Influence of the pro-inflammatory
cytokines on P-glycoprotein expression and functionality. J. Pharm. Pharm. Sci., 7, 359-371.
33. Hoffmeyer S, Burk O, von Richter O, Arnold HP, Brockmoller J, Johne A, Cascorbi I, Gerloff T,
Roots I, Eichelbaum M, Brinkmann U (2000) Functional polymorphisms of the human
multidrug-resistance gene: multiple sequence variations and correlation of one allele with P-
glycoprotein expression and activity in vivo. Proc. Natl. Acad. Sci. U. S. A, 97, 3473-3478.
34. Woodahl EL, Ho RJ (2004) The role of MDR1 genetic polymorphisms in interindividual
variability in P-glycoprotein expression and function. Curr. Drug Metab, 5, 11-19.
35. Eichelbaum M, Fromm MF, Schwab M (2004) Clinical aspects of the MDR1 (ABCB1) gene
polymorphism. Ther. Drug Monit., 26, 180-185.
36. Arolt V, Rothermundt M, Wandinger KP, Kirchner H (2000) Decreased in vitro production of
interferon-gamma and interleukin-2 in whole blood of patients with schizophrenia during
treatment. Mol. Psychiatry, 5, 150-158.

37. Drzyzga L, Obuchowicz E, Marcinowska A, Herman ZS (2006) Cytokines in schizophrenia and
the effects of antipsychotic drugs. Brain Behav. Immun., 20, 532-545.
38. Bauer B, Hartz AM, Fricker G, Miller DS (2005) Modulation of p-glycoprotein transport
function at the blood-brain barrier. Exp. Biol. Med. (Maywood. ), 230, 118-127.
39. Hartz AM, Bauer B, Fricker G, Miller DS (2006) Rapid modulation of P-glycoprotein-mediated
transport at the blood-brain barrier by tumor necrosis factor-alpha and lipopolysaccharide. Mol.
Pharmacol., 69, 462-470.
40. Bauer B, Hartz AM, Miller DS (2007) Tumor necrosis factor alpha and endothelin-1 increase P-
glycoprotein expression and transport activity at the blood-brain barrier. Mol. Pharmacol., 71,
667-675.
41. Eisel UL (2002) Cytokines in degenerative brain diseases: lessons from transgenic animals. Curr.
Top. Microbiol. Immunol., 265, 49-62.
42. Fontaine V, Mohand-Said S, Hanoteau N, Fuchs C, Pfizenmaier K, Eisel U (2002)
Neurodegenerative and neuroprotective effects of tumor Necrosis factor (TNF) in retinal
ischemia: opposite roles of TNF receptor 1 and TNF receptor 2. J. Neurosci., 22, RC216.
43. Tan KH, Purcell WM, Heales SJ, McLeod JD, Hurst RD (2002) Evaluation of the role of P-
glycoprotein in inflammation induced blood-brain barrier damage. Neuroreport, 13, 2593-2597.
44. El Ela AA, Hartter S, Schmitt U, Hiemke C, Spahn-Langguth H, Langguth P (2004)
Identification of P-glycoprotein substrates and inhibitors among psychoactive compounds--
implications for pharmacokinetics of selected substrates. J. Pharm. Pharmacol., 56, 967-975.
45. Uhr M, Grauer MT, Yassouridis A, Ebinger M (2007) Blood-brain barrier penetration and
pharmacokinetics of amitriptyline and its metabolites in p-glycoprotein (abcb1ab) knock-out
mice and controls. J. Psychiatr. Res., 41, 179-188.
46. Wang JS, Zhu HJ, Markowitz JS, Donovan JL, DeVane CL (2006) Evaluation of antipsychotic
drugs as inhibitors of multidrug resistance transporter P-glycoprotein. Psychopharmacology
(Berl), 187, 415-423.
47. Weber CC, Kressmann S, Ott M, Fricker G, Muller WE (2005) Inhibition of P-glycoprotein
function by several antidepressants may not contribute to clinical efficacy. Pharmacopsychiatry,
38, 293-300.
48. de Klerk OL, Bosker FJ, Willemsen AT, Van Waarde A, Visser AK, de Jager T, Dagyte G, den
Boer JA, Dierckx RA, Meerlo P (2010) Chronic stress and antidepressant treatment have
opposite effects on P-glycoprotein at the blood-brain barrier: an experimental PET study in rats.
J. Psychopharmacol., 24, 1237-1242.
49. Abrahim A, Luurtsema G, Bauer M, Karch R, Lubberink M, Pataraia E, Joukhadar C, Kletter K,
Lammertsma AA, Baumgartner C, et al. (2008) Peripheral metabolism of (R)-[(11)C]verapamil in
epilepsy patients. Eur. J. Nucl. Med. Mol. Imaging, 35, 116-123.
50. Lubberink M, Luurtsema G, van Berckel BN, Boellaard R, Toornvliet R, Windhorst AD,
Franssen EJ, Lammertsma AA (2007) Evaluation of tracer kinetic models for quantification of P-
glycoprotein function using (R)-[11C]verapamil and PET. J. Cereb. Blood Flow Metab, 27, 424-
433.
51. Pauli-Magnus C, von RO, Burk O, Ziegler A, Mettang T, Eichelbaum M, Fromm MF (2000)
Characterization of the major metabolites of verapamil as substrates and inhibitors of P-
glycoprotein. J. Pharmacol. Exp. Ther., 293, 376-382.


Chapter 6
ABCB1 gene variants may indicate susceptibility for major depressive disorder

Authors:
Onno L. de Klerk1,2
Ilja M. Nolte3
Pierre M. Bet4
Fokko J. Bosker1
Harold Snieder3
Johan A. den Boer1
Richard Bruggeman1
Witte J. Hoogendijk5
Brenda W. Penninx1,4
1University Center of Psychiatry, University Medical Center Groningen, The
Netherlands; 2GGZ Drenthe, Assen, The Netherlands;
3Unit of Genetic Epidemiology and
Bioinformatics, Dept. of Epidemiology, University of Groningen, The Netherlands; 4VU
Medical Center, Amsterdam, the Netherlands; 5Dept of psychiatry, Erasmus Medical
Center, Rotterdam, the Netherlands;
submitted

Abstract
Background: P-glycoprotein, an ATP-driven efflux pump in the blood-brain barrier,
has a major impact on the delivery of antidepressant drugs in the brain. Genetic
variants in the gene ABCB1 encoding for P-glycoprotein have inconsistently been
associated with adverse effects. In order to resolve these inconsistencies, we conducted
a study in a large cohort of patients with major depressive disorder with the aim to
unravel the association of ABCB1 variants with adverse effects of antidepressants and
in particular with SSRIs, which display affinity as substrate for P-glycoprotein.
Method: The Netherlands Study of Depression and Anxiety (NESDA) study was used as
a clinical sample. For 424 patients data were available on drug use, side effects. We
selected six ABCB1 gene variants (1236T>C, 2677G>T/A, 3435T>C, rs2032583,
rs2235040, rs2235015) and analyzed them for association with adverse drug effects
using multinomial regression analysis for both single variants and haplotypes.
Results: Number of SSRI-related adverse drug effects was significantly associated with
rs2032583C (p=0.002) and rs2235040A (p=0.001) and a haplotype containing the six
variants (p=0.002). Moreover, both anticholinergic (e.g dry mouth, constipation,
restlessness) and serotonergic effects (sleeplessness, gastrointestinal complaints, sexual
effects, twitching) were significantly predicted by these variants and haplotype
(p=0.002 to 0.011).
Conclusion: Adverse drug effects with SSRI treatment, in particular anticholinergic and
serotonergic effects, are predicted by common polymorphisms of the ABCB1 gene.

Introduction
One of the major problems with pharmacotherapy of major depressive disorder (MDD)
is the lack of predictive clinical variables in the occurrence of unpredictable adverse
drug reactions, often leading to a prolonged treatment course. An important aspect in
this regard is the ability of a drug to pass the blood-brain barrier.
P-glycoprotein (P-gp) is an ATP-driven efflux pump, predominantly located at the
luminal side of the brain capillaries.1 P-gp has an unusually broad capacity to recognize
and expel hundreds of molecules from the brain, including many antidepressant drugs.2
The processes involved often exhibit considerable interindividual variability, which
may be genetically determined. P-gp is a member of the ATP-binding cassette (ABC)
superfamily and is encoded by the ABCB1 gene, formerly denoted as MDR1 (multi-
drug resistance gene 1).
Animal studies have shown that penetration of several antidepressants depends on the
functionality of P-gp at the blood-brain barrier.3-6 By affecting plasma levels and
intracerebral concentration, altered P-glycoprotein function or expression may cause
adverse drug effects and ultimately influence therapeutic response.
Most studies that analyzed the relation of ABCB1 gene variants with antidepressants
have focused on treatment response, with contradictory results.7-13 Analysis of
antidepressants related adverse drug effects in relation to ABCB1 polymorphisms has
not been studied extensively so far. Of the three studies to date, one study focused on a
single drug effect (postural hypotension in nortriptyline use (n= 8) in a relatively small
sample (n = 78).14 In another small sample study (n=55) antidepressant-induced switch
to mania was studied in 26 users of various antidepressants, without taking account of
the differential affinity of antidepressants for the P-gp pump.15 Peters et al. used a large
sample (STAR*D, n=565) of MDD patients using citalopram and found no association
between 3 single nucleotide polymorphisms (SNPs) (3435C>T, 2677G>T or 1236C>T)
and ‘tolerance’ to citalopram. ‘Tolerance’ was considered when subjects continued with
citalopram until the end of study period while patients who left the study at any time
due to side effects, were defined as ‘intolerant’.
Conflicting results may result from small sample sizes and thus limited statistical
power. The present study uses data from a Dutch cohort of 424 depressed patients using
selective serotonin reuptake inhibitor (SSRI), and examines whether related adverse
side effects are associated with ABCB1 gene polymorphisms.

Methods NESDA sample
NESDA is a longitudinal, naturalistic cohort study examining the course and
consequences of depressive and anxiety disorders. The collection and genotyping of the
NESDA sample has been described elsewhere.16 In brief, 2981 participants were
recruited through mental health care organizations (n=807), the community setting
(n=564) and primary care (n=1610). They were assessed using the Composite Interview
Diagnostic Instrument (CIDI) to diagnose depressive and anxiety disorders according to
the Diagnostic and Statistical Manual of Mental Disorders – Fourth Edition (DSM-IV-
TR). The interview also provided information on age of onset, number of MDD
episodes, and specific symptoms of depression. At baseline, detailed assessment was
made of psychopathology using different inventories and scales. Many other data were
collected including sociodemographic data and health indicators.
At the two-year follow up assessment phenotypic data concerning course of the current
or previous depressive episodes were gathered. Medication use was assessed based on
drug container inspection of drugs used and coded using the Anatomical Therapeutic
Chemical (ATC) classification.17 Use of antidepressants was considered when taken at
least 50% of the time and included selective serotonin reuptake inhibitors (ATC-code
N06AB). Antidepressants were categorized into SSRIs with known substrate affinity for
P-glycoprotein (i.e. citalopram, paroxetine, venlafaxine, fluvoxamine, sertrailine). All
other non-SSRI antidepressants were left out of the analysis (i.e. tricyclic
antidepressants, St. John’s Wort, lithium, MAO inhibitors) as well as SSRIs without
affinity for P-gp, or without compelling evidence for the opposite (i.e. fluoxetine,
bupropion, nefazodone, trazodone, mirtazapine, duloxetine,).2,4-6,18-20 Subjects using co-
medication with a strong modulatory effect on P-gp function, such as calcium blocking
agents, protease inhibitors, cardiac glycosides, ketoconazole, methotrexate,
quinidine,21,22 were excluded from the analysis.
Adverse drug effects
The questionnaire on “side effect of psychotropic medication” provided a self-reported
inventory of psychotropic medication (type, frequency, dosage, duration), treatment
response and adverse side effects data. Adverse drug reactions (ADRs) were measured
at the 1-year and 2-year follow-up. ADRs were reported as ‘present’ or ‘absent’. The
ASEC-12 self report questionnaire, a short version of the Antidepressant Side Effect
Checklist, was constructed for NESDA. Recently, the ASEC-21 has been validated
against the UKU Side Effect Rating Scale, a semi-structured interview by a health
professional.23,24 The ASEC-12 specifically asks for the presence of 12 ADRs, which
have been related to antidepressants: sleeplessness, sleepiness during day time,
restlessness, twitching/muscle cramps, dry mouth, transpiration, sexual side effects,

nausea, constipation, diarrhea, weight gain and dizziness). In addition, participants
were asked to add other side effects, not covered in the inventory. Side effects were
also grouped and defined as either ‘anticholinergic’ (i.e. restlessness, constipation, dry
mouth), ‘serotonergic’ (i.e. diarrhea, sexual side effects, twitching, nausea,
sleeplessness) or ‘histaminergic’ (sleepiness during the day, weight gain).
Antidepressants were categorized into SSRIs with known substrate affinity for P-
glycoprotein (i.e. citalopram, paroxetine, venlafaxine, fluvoxamine, sertraline). All
other non-SSRI antidepressants were left out of the analysis (i.e. tricyclic
antidepressants, St. John’s Wort, lithium, MAO inhibitors) as well as SSRI’s without
affinity for P-gp, or without compelling evidence for the opposite (i.e. fluoxetine,
bupropion, nefazodone, trazodone, mirtazapine, duloxetine).2,4-6,18-20 Sertraline was
categorized as a SSRI with P-gp affinity based on high in vitro affinity.20
SNP selection and genotyping
A selection of six single nucleotide polymorphisms (SNPs) was made on the basis of
positive reports in the existing literature8,10,25,26. This included the three common
coding SNPs 3435C>T (rs1045642), 2677G>T/A (rs2032582) and 1236T>C (rs1128503)
and three non-coding SNPs (rs2235015, rs2032583 and rs2235040) that were associated
with treatment response to antidepressants.11,12 The genotypic data were obtained from
the genome-wide association study.27 These data were subjected to rigorous quality
control criteria.28 None of the six SNPs was directly genotyped, but estimated genotype
probabilities were obtained through imputation.29 The quality of imputation was good
(p=0.93) for 3435C>T and excellent (p=0.99-1.00) for the other SNPs. More details are
presented in table 6.1. ‘
Table 6.1
Major characteristics of all single nucleotide polymorphisms * Position from NCBI Genome build 36, release 22
Covariates and exclusion criteria
We excluded 16 participants who used medication with a strong inhibitory effect on P-
gp function (calcium blocking agents, protease inhibitors, cardiac glycosides,
SNP reference
sequence
number
position*
coded/
other
allele
coded
allele
frequency
Imputatio
n quality
role
3435 rs1045642 86976581 C/T 0.444 0.93 coding exon 27
2677 rs2032582 86998554 G/T 0.577 0.99 coding exon 22
1236 rs1128503 87017537 C/T 0.579 1.00 coding exon 13
rs2235015 87037500 G/T 0.793 0.99 Intron 5
rs2235040 87003686 A/G 0.134 0.99 intron boundary
exon 21
rs2032583 86998497 C/T 0.134 1.00 intron 22

ketoconazole, methotrexate, quinidine)21,22 were excluded from the analysis. The group
of subjects using statin drugs (e.g. simvastatin, ATC codes: C10AA01-C10BA02)) (n=42)
was considered large enough to include statin use in all analyses as a covariate. The
variables ‘age’ and ‘gender’ were also included in each analysis as covariates, since these
variables have an impact on the side effect profile of antidepressants.30,31
Statistical analysis
Hardy–Weinberg equilibrium was evaluated by χ2 statistics. No SNPs were found to
violate Hardy-Weinberg equilibrium using a Bonferroni-corrected threshold.
Multinomial logistic regression analysis was conducted for SSRI-related adverse effects
divided in three groups, namely 0, 1-3 and 4-12 adverse effects, with allele dosages of
the SNPs as independent variable.
A multinomial analysis was also done for aggregated groups of adverse drug effects (i.e.
serotonergic, anticholinergic, histaminergic (see above)). Likewise, these variables were
recoded into multinomial variables (0, 1, or 2 or more adverse effects). Furthermore, all
adverse drug effects were tested as dichotomous variable (absent or present) in a
logistic regression analysis, on possible associations with the polymorphisms that had
shown an effect in the multinomial analysis. The analyses were carried out for the
group of SSRI users (SSRIs with affinity for P-gp), as well as for paroxetine and
citalopram separately, since these groups were large enough for analysis. Follow-up
analysis with only the two SNPs that had shown an association in the multinomial
analysis, were carried out for the three aggregated groups (i.e. anticholinergic,
serotonergic and histaminergic) and 12 separate adverse drug effects. The
(multinomial) regression analyses for the variables ‘histaminergic’ and ‘serotonergic’
was done with dichotomous variables, because too few cases (4 and 6) remained in the
2+ group, making the validity of the model uncertain.
Frequencies of the haplotypes containing the six SNPs were estimated using the
following randomization procedure. For each individual and each SNP a genotype was
assigned randomly five times from its imputed genotype probability distribution. Next
for each randomized set the software package PHASE was used to estimate haplotype
probabilities for each individual.32,33 The haplotype probabilities were aggregated and
frequencies of the 64 possible haplotypes were calculated.32,33 For each of the four
haplotypes with a frequency of >10%, haplotype dosage (i.e. the estimated number of
haplotypes in an individual) was determined for every individual using the estimated
haplotype probabilities like is done for Haplotype Trend Regression analysis.34
Haplotype analysis was performed using multinomial or logistic regression analysis
similar to the single SNP analyses described earlier. In addition, we used these
frequencies to estimate linkage disequilibrium (LD) of each pair of SNPs. Given the

strong LD for two SNP pairs (2677G>T/A-1236T>C: r2 = 0.88 and rs2235040-rs2032583:
r2 = 0.98), the significance threshold was set at 0.0125 as a result of a Bonferroni
correction for multiple testing. Statistical analyses were conducted using SPSS software
version 16.0 (SPSS Inc., Chicago, Illinois, USA) and Microsoft Excel® 2003 (Microsoft
corporation, Redmond, Washington, USA).
Results
The sample consisted of 504 SSRI users, of which 347 were current users and 157 had
used an SSRI before. 16 were excluded because of use of comedication with a strong
inhibitory effect on P-gp function. For 64 cases genotype or interview data were
incomplete, and these were also excluded from the analysis. The remaining 424 cases
were used for analysis. Details of the study sample are given in table 6.2.
Adverse side effects
For SSRI use, the most reported side effects were sexual dysfunction (19.0%), dry
mouth (18.8%), sleepiness during the day (18.8%), weight gain (17.7%) and profuse
sweating (14.5%). Gastrointestinal side effects were relatively infrequent: diarrhoea
(3.8%), nausea (10.1%) and constipation (8.9%). Other reported side effects in the
inventory were dizziness (14.1%), sleeplessness (7.5%), restlessness (6.5%) and muscle
spasms or twitching (8.7%). For the SSRI users (n = 424), two SNPs were significantly
associated with the number of side effects (rs2235040A: p = 0.002; OR= 2.32; and
rs2032583C: p = 0.001, OR = 2.41), see table 6.3. Sex and age had no significant effect as
covariate in these analyses. Statin use had no significant effect in any of the analyses.
Of the three groups of aggregated side effects, ‘anticholinergic’ ‘serotonergic’ and
‘histaminergic’, the two SNPs were also significantly associated with both ‘multiple’
anticholinergic effects: rs2235040A (p = 0.010; OR = 1.92), rs2032583C (p = 0.010; OR
= 1.92) and ‘few’ serotonergic effects: rs2235040A (p = 0.005; OR = 1.85), rs2032583C (p
= 0.002; OR = 1.96). Male gender was strongly associated (OR = 1.96; p = 0.004) with
more ‘serotonergic’ effects (containing the variable ‘sexual effects’), but not with
anticholinergic (p = 0.053). No association was found with ‘multiple’ serotonergic
effects, due to the fact that this group contained only 16 subjects. No associations were
found with ‘histaminergic’ effects.
The two SNPs were also evaluated as predictors of each single side effect in adjusted
logistic regression analyses. The variable ‘sleepless’ was strongly associated with

rs2235040A (p = 0.0003; OR = 2.93) and rs2032583C (p = 0.0003; OR = 2.95). The two
SNPs were (after correction for multiple tests) not significantly associated with the
occurrence of ‘constipation’ (rs2235040A: p = 0.047; OR = 1.85 and rs2032583C: p =
0.049: OR= 1.84). Male gender was significantly associated with the occurrence of
SSRI-related sexual side effects (p = 0.0003; OR = 2.63). There was a non significant
association for use of statins (p = 0.064) for the variable ‘weight gain’.
The two mostly used SSRIs in this study, paroxetine (n=151) and citalopram (n = 106),
were separately tested for possible gene related side effects. For paroxetine, we found
nominal significant associations between the two SNPs and ‘multiple’ anticholinergic
effects (for rs2235040A: OR= 3.22; p = 0.034 and for rs2032583: OR = 3.28; p = 0.031),
but these did not withstand multiple testing correction. No effects were found for
citalopram (data not shown).
Table 6.2
Basic characteristics of the study sample
Haplotype analysis
Of the 64 haplotypes, covering the six SNPs used in the analysis (3435C>T-2677G>T/A-
1236T>C-rs2235015-rs2032583-rs2235040), we analyzed the four with a frequency higher
than 10%: T-T-T-G-T-G (39%), T-G-C-G-T-G 14%, C-G-C-T-C-A, 13%, and C-G-C-G-
T-G, 22%. The haplotype C-G-C-T-C-A showed similar p-values for all the significant
associations that we observed earlier for the two SNPs (see table 6.3).
Subjects using an SSRI (with P-gp
affinity) (n) 424
sex (M:F) 133:291
age (mean ± SD) 41.0 ±11.8
citalopram (n) 106
average dose (mg ± SD) 20.3 ± 8.53
paroxetine (n) 151
average dose (mg ± SD) 20.2 ± 5.17
venlafaxine (n) 87
average dose (mg ± SD) 107.0 ± 63.7
fluvoxamine (n) 42
average dose (mg ± SD) 69.7 ± 24.8
sertraline (n) 38
average dose (mg ± SD) 64.3 ± 23.0

Table 6.3
Single locus and haplotype results from multinomial and logistic regression analyses
on SSRI-related side effects Significance was assessed using multinomial and logistic
regression analysis adjusted for sex, age and statin use, and odds ratio’s including p-
values, are shown for minor allele carrier versus non-carrier. Bold values indicate
significant results. n.a. = not analysed because of too low numbers; P-gp = P-
glycoprotein; SSRI = specific serotonergic reuptake inhibitor. * * * * significant sex effect (see
results).
Discussion
Our results suggest that some ABCB1 polymorphisms might predict adverse side effects
related to the SSRIs that have affinity for P-glycoprotein. Of the six SNPs tested, two
intronic SNPs (rs2235040A and rs2032583C) and the haplotype C-G-C-T-C-A were
SSRI N rs2235040A rs2032583C C-G-C-T-C-A
adverse effects (0 vs 1+) 1.61 (p = 0.051) 1.73 (p = 0.028) 1.63 (0.052)
adverse effects (0 vs 2+) 2.32 (p = 0.002) 2.41 (p = 0.001) 2.35 (p = 0.002)
anticholinergic (0 vs 1+) 0.781 (p = 0.41) 0.782 (p = 0.41) 0.813 (p = 0.41)
anticholinergic (0 vs 2+) 1.92 (p = 0.011) 1.92 (p = 0.010) 1.92 (p = 0.011)
serotonergic (0 vs 1+)* 1.85 (p = 0.005)* 1.96 (p = 0.002)* 1.93 (p = 0.005)*
serotonergic (0 vs 2+) 1.88 (p = 0.16) 2.07 (p = 0.12) 2.08 (p = 0.12)
histaminergic (0 vs 1+) 0.855 (p = 0.51) 0.85 (p = 0.50) 0.84 (p = 0.48)
histaminergic (0 vs 2+) 1.88 (p = 0.089) 1.87(p = 0.094) 1.97 (p = 0.075)
constipation 1.54 (p = 0.072) 1.55 (p = 0.66) 1.79 (p = 0.064)
dry mouth 1.62 (0.046) 1.63 (p = 0.042) 1.69 (p = 0.052)
sweating 1.34 (p = 0.27) 1.36 (p = 0.26) 1.33 (p = 0.31)
restlessness 1.34 (p = 0.44) 1.35 (p = 0.43) 1.34 (p = 0.45)
sleepless 2.93 (p = 0.0003) 2.95 (p = 0.0003) 3.12 (p = 0.0003)
sleepiness 1.45(p = 0.12) 1.46 (p = 0.11) 1.53 (p = 0.083)
weight gain 1.01 (p = 0.99) 1.00 (p = 0.99) 1.02 (p = 0.96)
diarrhea 1.18 (p = 0.74) 1.21 (p = 0.71) 1.22 (p = 0.70)
nausea 1.26 (p = 0.48) 1.41 (p = 0.29) 1.41 (p = 0.30)
sexual 1.20 (p = 0.48)* 1.20 (p = 0.46)* 1.19 (p = 0.50)*
twitching 1.48 (p = 0.23) 1.49 (p = 0.21) 1.51 (p = 0.21)
P-gp substrates
(i.e. paroxetine,
venlafaxine,
citalopram,
fluvoxamine,
sertraline)
424
dizziness 1.13 (p = 0.65) 1.23 (p = 0.44) 1.25 (p = 0.42
adverse effects (0 vs 1+) 1.45 (p = 0.36) 1.60 (p = 0.25) 1.45 (p = 0.36)
adverse effects (0 vs 2+) 1.63 (p = 0.34) 1.76 (p = 0.23) 1.66 (p = 0.28)
anticholinergic (0 vs 1+) 0.99 (p = 0.95) 0.98 (p = 0.96) 0.95 (p = 0.95)
anticholinergic (0 vs 2+) 3.22(p = 0.034) 3.28 (p = 0.031) 3.27 (p = 0.033)
serotonergic (0 vs 1+) 1.28 (p = 0.47) 1.36 (p = 0.38) 1.37 (p = 0.45)
serotonergic (0 vs 2+) n.a. n.a. n.a.
histaminergic (0 vs 1+) 0.73 (p = 0.40) 0.76 (p = 0.46) 0.77 (p = 0.43)
paroxetine 151
histaminergic (0 vs 2+) n.a. n.a. n.a.

significant predictors for the number of adverse side effects, and were in particular
associated with serotonergic (especially sleeplessness) and anticholinergic effects.
To date, this is the first study demonstrating a relation between the pharmacokinetic
gene ABCB1 and adverse drug effects in SSRIs. The associations between the SNPs
rs2235040 and rs2032583 and phenotype or clinical response, seem promising. In our
study, the two SNPs were in near complete LD, thus representing the same
information. Both SNPs have been associated with higher treatment response on
antidepressants, that are transported by P-gp, in contrast to mirtazapine, which is not a
substrate for P-gp.11,12 In these studies, the T-carriers of rs2032583 were associated
with poor treatment response, which may correspond with a higher level of adverse
effects, as we found for the rs2032583 C-allele.
Neither our study nor previous ones,11,12,35 found an effect of the SNPs 1236C>T,
2677G>T/A and 3435C>T. These three SNPs have been the focus of many
pharmacokinetic and disease related studies, with contradictory results, since these are
common SNPs in the coding region of the ABCB1 gene.36 However, genetic associations
of these SNPs with clinical phenotypes have largely been inconsistent.9,37 The 1236C-
2677G-3435C haplotype is one of the most frequently observed in most populations.37
In fact, the C-G-C haplotype has been connected to altered P-gp functionality in
several studies, but ABCB1 haplotype association studies have also been inconclusive so
far.9,36 In our study the haplotype containing 1236C-2677G-3435C links to the
rs2032583C and rs2235040A allele and both these single SNPs and the total haplotype
of SNPs were associated with adverse drug effects. This implies that the haplotype
association that was observed previously might be caused by the association of the two
single SNPs rs2032583 and rs2235040, which are in almost complete LD with each
other. The intronic SNPs rs2032583 and rs2235040 are non-coding SNPs, but might be
linked to another functional variant. However, in the absence of replication of the
findings in this report, and in the light of the many controversies on ABCB1 related
gene effects so far, the conclusions need to be interpreted with care.
One of the limitations of this study is the fact we have not controlled for all co-
medication. Many drugs have shown to posses some inhibitory or inductory properties
in vitro, such as statins,38 antipsychotics or antidepressants,6 but their impact on P-gp
function in vivo may be clinically irrelevant.5,6 Therefore, we only excluded co-
medication, for which clear evidence was available, with respect to P-gp inhibitory or
inductory properties of a drug, e.g. antiretroviral or other immunosuppressive agents.39
We controlled for statin use because this group was considered large enough to include
in the analyses as a covariate. In none of the analyses, however, any interaction was
seen. Interaction with other co-medication can however not be excluded. The gene

effect that we found for the SSRIs with affinity for P-gp may not be valid for each SSRI
to the same degree. The selected SSRIs have shown to have comparable substrate
properties2,4-6 and moreover, substrate specific in vivo data on P-gp function is lacking.
We found an association between SNPs in ABCB1 and serotonergic and anticholinergic
activity. With respect to both receptor systems, there is no obvious relation (at least not
for antidepressants) between serotonergic or anticholinergic activity and substrate
affinity for P-gp or P-gp function. An explanation for the association with
anticholinergic activity could be the overrepresentation of paroxetine (>35%) in the
sample. Paroxetine exhibits higher anticholinergic activity than all other SSRIs.40 The
fact that we did not find an association in the subgroup of paroxetine users may be due
to the sample size.
In conclusion, our results suggest that the number of adverse effects related to SSRIs,
transported by P-glycoprotein, in particular serotonergic (especially sleeplessness) and
anticholinergic effects, is associated with two intronic SNPs of the ABCB1 gene
(rs2235040 and rs2032583).
References
1. Chan GN, Bendayan R (2011) Molecular and functional characterization of p-glycoprotein in
vitro. Methods Mol. Biol., 686, 313-336.
2. Doran A, Obach RS, Smith BJ, Hosea NA, Becker S, Callegari E, Chen C, Chen X, Choo E,
Cianfrogna J, et al. (2005) The impact of P-glycoprotein on the disposition of drugs targeted for
indications of the central nervous system: evaluation using the MDR1A/1B knockout mouse
model. Drug Metab Dispos, 33, 165-174.
3. Uhr M, Steckler T, Yassouridis A, Holsboer F (2000) Penetration of amitriptyline, but not of
fluoxetine, into brain is enhanced in mice with blood-brain barrier deficiency due to mdr1a P-
glycoprotein gene disruption. Neuropsychopharmacology, 22, 380-387.
4. Uhr M, Grauer MT, Holsboer F (2003) Differential enhancement of antidepressant penetration
into the brain in mice with abcb1ab (mdr1ab) P-glycoprotein gene disruption. Biol. Psychiatry,
54, 840-846.
5. Weber CC, Kressmann S, Ott M, Fricker G, Muller WE (2005) Inhibition of P-glycoprotein
function by several antidepressants may not contribute to clinical efficacy. Pharmacopsychiatry,
38, 293-300.
6. Weiss J, Dormann SM, Martin-Facklam M, Kerpen CJ, Ketabi-Kiyanvash N, Haefeli WE (2003)
Inhibition of P-glycoprotein by newer antidepressants. J. Pharmacol. Exp. Ther., 305, 197-204.
7. Mihaljevic PA, Bozina N, Sagud M, Rojnic KM, Lovric M (2008) MDR1 gene polymorphism:
therapeutic response to paroxetine among patients with major depression. Prog.
Neuropsychopharmacol. Biol. Psychiatry, 32, 1439-1444.
8. Kato M, Fukuda T, Serretti A, Wakeno M, Okugawa G, Ikenaga Y, Hosoi Y, Takekita Y,
Mandelli L, Azuma J, Kinoshita T (2008) ABCB1 (MDR1) gene polymorphisms are associated
with the clinical response to paroxetine in patients with major depressive disorder. Prog.
Neuropsychopharmacol. Biol. Psychiatry, 32, 398-404.
9. Leschziner GD, Andrew T, Pirmohamed M, Johnson MR (2007) ABCB1 genotype and PGP
expression, function and therapeutic drug response: a critical review and recommendations for
future research. Pharmacogenomics. J., 7, 154-179.
10. Lin KM, Chiu YF, Tsai IJ, Chen CH, Shen WW, Liu SC, Lu SC, Liu CY, Hsiao MC, Tang HS, et
al. (2011) ABCB1 gene polymorphisms are associated with the severity of major depressive
disorder and its response to escitalopram treatment. [Article]. Pharmacogenetics and Genomics
April, 21, 163-170.
11. Sarginson JE, Lazzeroni LC, Ryan HS, Ershoff BD, Schatzberg AF, Murphy GM, Jr. (2010)
ABCB1 (MDR1) polymorphisms and antidepressant response in geriatric depression.
Pharmacogenet. Genomics, 20, 467-475.
12. Uhr M, Tontsch A, Namendorf C, Ripke S, Lucae S, Ising M, Dose T, Ebinger M, Rosenhagen M,
Kohli M, et al. (2008) Polymorphisms in the drug transporter gene ABCB1 predict
antidepressant treatment response in depression. Neuron, 57, 203-209.
13. Perlis RH, Fijal B, Dharia S, Heinloth AN, Houston JP (2010) Failure to replicate genetic
associations with antidepressant treatment response in duloxetine-treated patients. Biol.
Psychiatry, 67, 1110-1113.
14. Roberts RL, Joyce PR, Mulder RT, Begg EJ, Kennedy MA (2002) A common P-glycoprotein
polymorphism is associated with nortriptyline-induced postural hypotension in patients treated
for major depression. Pharmacogenomics J, 2, 191-196.
15. De Luca V, Mundo E, Trakalo J, Wong GW, Kennedy JL (2003) Investigation of polymorphism
in the MDR1 gene and antidepressant-induced mania. Pharmacogenomics. J., 3, 297-299.
16. Penninx BW, Beekman AT, Smit JH, Zitman FG, Nolen WA, Spinhoven P, Cuijpers P, De Jong
PJ, Van Marwijk HW, Assendelft WJ, et al. (2008) The Netherlands Study of Depression and

Anxiety (NESDA): rationale, objectives and methods. Int. J. Methods Psychiatr. Res., 17, 121-
140.
17. World Health Organization (2011). ATC/DDD Index 2010; [update 2009 Oct 27; cited 2009 Dec.
5]. WHO Collaborating Centre for Drug Statistics Methodology, Norwegian Institute of Public
Health
18. Störmer E, von Moltke LL, Perloff MD, Greenblatt DJ (2001) P-glycoprotein interactions of
nefazodone and trazodone in cell culture. J. Clin. Pharmacol., 41, 708-714.
19. Szabo D, Szabo G, Jr., Ocsovszki I, Aszalos A, Molnar J (1999) Anti-psychotic drugs reverse
multidrug resistance of tumor cell lines and human AML cells ex-vivo. Cancer Lett., 139, 115-
119.
20. Wang JS, Zhu HJ, Gibson BB, Markowitz JS, Donovan JL, DeVane CL (2008) Sertraline and its
metabolite desmethylsertraline, but not bupropion or its three major metabolites, have high
affinity for P-glycoprotein. Biol. Pharm. Bull., 31, 231-234.
21. Matheny CJ, Lamb MW, Brouwer KR, Pollack GM (2001) Pharmacokinetic and
pharmacodynamic implications of P-glycoprotein modulation. Pharmacotherapy, 21, 778-796.
22. Löscher W, Potschka H (2005) Role of drug efflux transporters in the brain for drug disposition
and treatment of brain diseases. Prog. Neurobiol., 76, 22-76.
23. Lingjaerde O, Ahlfors UG, Bech P, Dencker SJ, Elgen K (1987) The UKU side effect rating scale.
A new comprehensive rating scale for psychotropic drugs and a cross-sectional study of side
effects in neuroleptic-treated patients. Acta Psychiatr. Scand. Suppl, 334, 1-100.
24. Uher R, Farmer A, Henigsberg N, Rietschel M, Mors O, Maier W, Kozel D, Hauser J, Souery D,
Placentino A, et al. (2009) Adverse reactions to antidepressants. Br. J. Psychiatry, 195, 202-210.
25. Dong C, Wong ML, Licinio J (2009) Sequence variations of ABCB1, SLC6A2, SLC6A3, SLC6A4,
CREB1, CRHR1 and NTRK2: association with major depression and antidepressant response in
Mexican-Americans. Mol Psychiatry, 14, 1105-1118.
26. Qian W, Homma M, Itagaki F, Tachikawa H, Kawanishi Y, Mizukami K, Asada T, Inomata S,
Honda K, Ohkohchi N, Kohda Y (2006) MDR1 gene polymorphism in Japanese patients with
schizophrenia and mood disorders including depression. Biol. Pharm. Bull., 29, 2446-2450.
27. Boomsma DI, Willemsen G, Sullivan PF, Heutink P, Meijer P, Sondervan D, Kluft C, Smit G,
Nolen WA, Zitman FG, et al. (2008) Genome-wide association of major depression: description
of samples for the GAIN Major Depressive Disorder Study: NTR and NESDA biobank projects.
Eur. J. Hum. Genet., 16, 335-342.
28. Sullivan PF, de Geus EJ, Willemsen G, James MR, Smit JH, Zandbelt T, Arolt V, Baune BT,
Blackwood D, Cichon S, et al. (2009) Genome-wide association for major depressive disorder: a
possible role for the presynaptic protein piccolo. Mol. Psychiatry, 14, 359-375.
29. Marchini J, Howie B (2008) Comparing algorithms for genotype imputation. Am. J. Hum.
Genet., 83, 535-539.
30. Barak Y, Swartz M, Levy D, Weizman R (2003) Age-related differences in the side effect profile
of citalopram. Prog. Neuropsychopharmacol. Biol. Psychiatry, 27, 545-548.
31. Sramek JJ, Cutler NR (2011) The Impact of Gender on Antidepressants. Curr. Top. Behav.
Neurosci..
32. Stephens M, Scheet P (2005) Accounting for decay of linkage disequilibrium in haplotype
inference and missing-data imputation. Am. J. Hum. Genet., 76, 449-462.
33. Stephens M, Smith NJ, Donnelly P (2001) A new statistical method for haplotype reconstruction
from population data. Am. J. Hum. Genet., 68, 978-989.
34. Zaykin DV, Westfall PH, Young SS, Karnoub MA, Wagner MJ, Ehm MG (2002) Testing
association of statistically inferred haplotypes with discrete and continuous traits in samples of
unrelated individuals. Hum. Hered., 53, 79-91.
35. Peters EJ, Slager SL, Kraft JB, Jenkins GD, Reinalda MS, McGrath PJ, Hamilton SP (2008)
Pharmacokinetic genes do not influence response or tolerance to citalopram in the STAR*D
sample. PLoS. One., 3, e1872.

36. Hodges LM, Markova SM, Chinn LW, Gow JM, Kroetz DL, Klein TE, Altman RB (2011) Very
important pharmacogene summary: ABCB1 (MDR1, P-glycoprotein). Pharmacogenet.
Genomics, 21, 152-161.
37. Woodahl EL, Ho RJ (2004) The role of MDR1 genetic polymorphisms in interindividual
variability in P-glycoprotein expression and function. Curr. Drug Metab, 5, 11-19.
38. Holtzman CW, Wiggins BS, Spinler SA (2006) Role of P-glycoprotein in statin drug
interactions. Pharmacotherapy, 26, 1601-1607.
39. Weiss J, Haefeli WE (2010) Impact of ATP-binding cassette transporters on human
immunodeficiency virus therapy. Int. Rev. Cell Mol. Biol., 280, 219-279.
40. Chew ML, Mulsant BH, Pollock BG, Lehman ME, Greenspan A, Mahmoud RA, Kirshner MA,
Sorisio DA, Bies RR, Gharabawi G (2008) Anticholinergic activity of 107 medications
commonly used by older adults. J. Am. Geriatr. Soc., 56, 1333-1341.


Chapter 7
ABCB1 gene variants influence tolerance to selective serotonin
reuptake inhibitors in a large sample of Dutch cases with major depressive
disorder

Authors:
Onno L. de Klerk1,2
Ilja M. Nolte3
Pierre M. Bet4
Fokko J. Bosker1
Harold Snieder3
Johan A. den Boer1
Richard Bruggeman1
Witte J. Hoogendijk5
Brenda W. Penninx1,4,6 1University Center of Psychiatry, University Medical Center Groningen, The
Netherlands; 2GGZ Drenthe, Assen, The Netherlands; 3Unit of Genetic Epidemiology and
Bioinformatics, Dept. of Epidemiology, University Medical Center Groningen, University
of Groningen, The Netherlands; 4VU University Medical Center, Amsterdam, the
Netherlands; 5Dept. of Psychiatry, Erasmus Medical Center, Rotterdam, the
Netherlands; 6Dept. of Psychiatry, Leiden University Medical Center, Leiden, the
Netherlands
submitted

Abstract
Background: P-glycoprotein, an ATP-driven efflux in the blood-brain barrier, has a
major impact on the disposition of antidepressant drugs in the brain. Gene variants of
the encoding gene ABCB1 have inconsistently been associated with both treatment
response, side effects and have been suggested as vulnerability factor for depressive
disorders.
Method: Data were from 1601 depressed patients of the Netherlands Study of
Depression and Anxiety (NESDA). We explored a possible role of 6 ABCB1 gene
variants (1236T>C, 2677G>T/A, 3435T>C, rs2032583, rs2235040, rs2235015) as
susceptibility factors in the course of MDD. Susceptibility indicators of MDD (young
age of onset, recurrent episodes, familial aggregation) were tested for their association
with the 6 polymorphisms and haplotypes.
Results: Of the possible susceptibility factors of MDD, ‘young age of onset’ was
negatively associated with three SNPs rs2032583 (p = 0.005), rs2235040 p = 0.005),
rs1045642 (p = 0.0015) and a haplotype (p = 0.006), indicating that the minor allele of
these gene variants protected against early onset depression. Two haplotypes
containing 1236T-2677T-3435T were significantly (p = 0.0065 and p = 0.010)
associated with recurrent episodes.
Conclusion: Some ABCB1 gene variants may indicate susceptibility for early onset and
recurrent MDD.
Introduction
P-glycoprotein (P-gp) is an ATP-driven efflux pump, a product of the ABCB1 gene, and
is located at the luminal side of the brain capillaries. Among efflux transporters at the
blood-brain barrier, P-gp plays a dominating role, since it transports hundreds of
chemically diverse molecules. The physiological role of P-gp at the blood-brain barrier
involves the protection of the brain from blood borne xenobiotics. In major depressive
disorder (MDD), P-gp has a tentative role in the disposition and pharmacokinetics of
antidepressant treatment, as many antidepressants have affinity for this pump.1
A protective role for P-gp in MDD may be less obvious, but its activity appears to
decrease in specific brain regions with age, possibly indicating a role in
neuroprotection.2 Besides, genetic variation may influence the vulnerability for a
disease. For example, ABCB1 gene variants have recently been associated with higher
risk of drug addiction.3
The evidence for the involvement of the ABCB1 gene in MDD as a susceptibility factor
is sparse. To date, two small studies have been published. In the first, a weak
association (not corrected for multiple testing) between the 2677A allele and mood
disorders has been described in a Japanese study of 62 subjects4 and secondly, two
single nucleotide polymorphisms (SNPs) (rs1202184 and rs1922242) were related to
severity of MDD in a Taiwanese study.5
The relative risk for MDD is increased higher for first degree relatives of probands with
MDD,6 but is further increased in probands with an age at onset below 30 years or with
recurrent episodes.6-8 The subgroup with recurrent episodes and early onset is often
considered as a narrow phenotype of MDD, with a higher relative risk for MDD, which
may be 4-5 times higher than non recurrent, late onset MDD.9 The higher relative risk
in probands with a recurrent early onset MDD increases the power to map
susceptibility genes.
With the availability of the NESDA data (Netherlands Study of Depression and
Anxiety), a large study cohort with 1601 participants with a diagnosis of MDD, who
had been selected for genome-wide genotyping, it is possible to examine SNP profiles
within the ABCB1 gene that characterize susceptibility factors in MDD.

Methods NESDA sample
The NESDA is a longitudinal, naturalistic cohort study examining the course and
consequences of depressive and anxiety disorders in 2981 participants. The collection
and genotyping of the NESDA sample has been described elsewhere.10
SNP selection and genotyping
A selection of six single nucleotide polymorphisms (SNPs) was made based on positive
reports in the available literature.4,5,11 This includes the three common coding SNPs
3435C>T (rs1045642), 2677G>T/A (rs2032582) and 1236T>C (rs1128503)12 and three
noncoding SNPs (rs2235015, rs2032583 and rs2235040) that were associated with
treatment response on antidepressants.13,14 The genotype data were obtained from the
original genome-wide association study.15 These data were subjected to a rigorous
quality control criteria.16 None of the six SNPs was genotyped, estimated genotype
probabilities and allele dosages were obtained through imputation.17 The quality of
imputation was good (p=0.93) for 3435C>T and excellent (p=0.99-1.00) for the other
SNPs. Details of the SNPs are presented in table 7.1.
Table 7.1
SNP reference
sequence
Position*
c/o Coded
allele
frequency
HWE
P
Imputation
quality
role
3435 rs1045642 86976581 C/T 0.444 0.22 0.93 coding exon 27
2677 rs2032582 86998554 G/T 0.577 0.61 0.99 coding exon 22
1236 rs1128503 87017537 C/T 0.579 0.71 1.00 coding exon 13
rs2235015 87037500 G/T 0.793 0.79 0.99 Intron 5
rs2032583 86998497 C/T 0.134 0.82 1.00 intron 22
rs2235040 87003686 A/G 0.134 0.82 0.99 intron boundary
exon 21
Major characteristics of all single nucleotide polymorphisms *Position from NCBI Genome build 36, release 22; c/o = coded allele versus other allele;
HWE = Hardy-Weinberg equilibrium (p value)
Baseline and 2-year follow up data, collected between September 2004 and February
2007, were used. 1601 cases with a lifetime MDD were included. Of those, 786 had
experienced one episode and 815 had had more than one episode. For all cases
genotype information was available.
Three presumed indicators of susceptibility in MDD were examined in relation to the
SNPs: ‘age of onset’ (defined as MDD starting before the age of 30)6 and ‘recurrence’,
‘familial risk’ and ‘treatment course’. The variable ‘age of onset’ was analyzed as

dichotomous variable (‘MDD starting before 30 years’ versus ‘starting after 30 years’
and as continuous variable. The variables ‘recurrence’ were (highly) skewed and
therefore a multinomial variable was constructed. ‘Recurrence’ had four values (i.e. 0 (=
first episode), 1, 2 and 3 (three or more recurrences). This classification was chosen,
because three or more depressive episodes is often regarded as chronic depression,
resulting in other treatment algorithms.18 The variable ‘familial risk’ indicated the
number of first degree family members and had three values (0, 1 (1 or 2 family
members) and 2 (≥ 3 family members). We did not construct a multinomial variable
‘age of onset’, because this variable was normally distributed and besides,
differentiation between ‘starting before 30 years’ and ‘starting after 30 years’ seemed
most discriminant.6 Age and sex were used as covariate.
Statistical analysis
For the continuous variable ‘age of onset’ linear regression was used, and the other
variables (dichotomous variable ‘age of onset’, ‘familial risk’ and ‘recurrences’ were
analyzed with multinomial regression analysis with SNPs as independent variables.
Frequencies of the haplotypes containing the all 6 SNPs were estimated using the
following randomization procedure. For each individual and each SNP a genotype was
assigned randomly five times from its imputed genotype probability distribution. Next
for each randomized set the software package PHASE was used to estimate haplotype
probabilities for each individual.19 Finally the haplotype probabilities were aggregated
and dosages of the eight possible haplotypes were calculated (i.e. yielding eight
variables). Haplotype analysis was performed for the three most common haplotypes
with a frequency of >10% using linear or multinomial regression analysis, similar to the
single SNP analyses described earlier. We also determined the haplotype frequencies of
all 6 SNPs20 and used these frequencies to estimate linkage disequilibrium (LD) of each
pair of SNPs.
Given the complete LD for one SNP pair (see results), an adapted approach for multiple
testing was applied,21 and the significance threshold was set at 0.0127. Statistical
analyses were conducted using SPSS software version 16.0 (SPSS Inc., Chicago, Illinois,
USA) and Microsoft Excel® 2003 (Microsoft corporation, Redmond, Washington,
USA).

Results
At baseline, 786 subjects had a first depressive episode and 815 had undergone one or
more recurrences. The sample consisted of 1099 females and 502 males. Mean age of
onset was 27.5 ± 12.3, the average age at the time of the interview was 42.0 ± 12.5. Of
the 1601, 366 had a negative (first degree) family history for MDD, 868 had 1 or 2
affected family members, and 367 had more than 2 family members with MDD.
Susceptibility factors of MDD
‘Age of onset’ was significantly associated with rs2235040A (p = 0.005, beta = -0.070)
and rs2032583C (p = 0.007, beta = -0.067), indicating that these carriers had a higher on
onset of MDD at younger age. The subjects with MDD, who were carrier of 3435C or
rs2235040A had a higher change on onset of MDD starting before 30 years (n = 889).
The Odds ratio (OR) for 3435C carriers was 1.27 (p =0.0015) and for rs2235040A OR:
1.31 (p = 0.01). In both analyses male sex was significantly associated with lower
change on early onset (OR = 0.60; p = 0.00004). For none of the SNPs an association
was found with either ‘recurrences’ or ‘family risk’. Results are presented in table 7.2.
Haplotype analysis
The r2 values between the different SNPs were high for 2677-1236 (r2 = 0.88),
suggesting strong LD. rs2235040 and rs2032583 (r2 = 0.98) demonstrated nearly
complete dependency. The other r2 values ranged from 0.10 to 0.56. Five haplotypes
containing the three most common coding SNPs (1236C>T-2677G>T/A-3435C>T-
rs2235015-rs2032583-rs2235040) and capturing a large proportion of the observed
haplotypes12 had an observed frequency of >5 % and were examined in relation to the
examined variables. The frequencies of the different haplotypes were: C-G-C-G-T-G
(22%), T-T-T-G-T-G (39%), T-G-C-G-T-G (14%), C-G-C-T-T-G (6.4%) and C-G-C-T-
C-A (13%), which (pertaining to the 1236-2677-3435 haplotype) were comparable to
the frequencies reported in the literature.12 The C-G-C-G-T-G and C-G-C-T-T-G
haplotypes appeared significantly associated with ‘recurrence’ (p = 0.010 and p =
0.0065).
No association was found with 2 or more recurrences, which was not related to power,
the numbers of subjects with 1,2 of 3 and more episodes were comparable (1
recurrence: 257; 2 recurrences: 227 and ≥3 recurrences: 328 subjects). Age had a
negligible effect (OR = 1.02; p = 0.002) and sex had no effect. The haplotype C-G-C-T-
C-A was significantly (negatively) associated with continuous age of onset of
depression (beta = -0.068; p = 0.006), as well as with ‘MDD starting before 30 years’
(OR = 1.31; p = 0.012), with lower risk for male gender (OR = 0.60; p = 0.00004). The
haplotypes T-T-T-G-T-G and C-G-C-G-T-G showed a non significant association with

intermediate family risk (p = 0.027) and low familiy risk (p = 0.049), respectively (see
table 7.2).
Discussion
In the present study we found significant associations between several polymorphisms
of the ABCB1 gene and onset of MDD before 30 years (rs2235040A: OR= 1.3, p = 0.01;
3435C: OR = 1.3, p = 0.0015) or onset of MDD at younger age (rs2032583C; beta = -
0.07, p = 0.007; rs2235040A: beta = -0.067, p = 0.007). For the haplotype C-G-C-T-C-A
comparable associations with age of onset were found. Furthermore, the haplotypes C-
G-C-T-T-G (OR = 1.7, p = 0.0065) and C-G-C-G-T-G (OR = 0.71; p = 0.01) were
associated with recurrent MDD. These results suggest that several polymorphisms and
a haplotype of the ABCB1 gene may either predict onset of MDD at younger age (or
before 30 years) and recurrence of MDD.
The differences we found in ABCB1 gene variation between the group with first
episode MDD and those with one recurrence, as well as between those with an early
onset may indicate a relation between the ABCB1 gene and an unfavourable course of
the disorder or severity. It is unknown whether the studied ABCB1 polymorphisms are
also connected to increasing the risk for MDD, since we did not compare between
MDD phenotypes and control cases. In respect to recurrent MDD it is unclear why no
gene effect is seen for the groups with two or more recurrences, but is conceivable that
other (gene) effects interfere with a possible adverse effect of ABCB1 gene variants.
Higher remission percentages for rs2235040A and 2232583C carriers were found for
MDD patients treated with an antidepressant with P-gp substrate properties.13,14 In a
recent study (de Klerk et al., unpublished observations) we found an association
between these SNPs and SSRI-related adverse effects. No effect on treatment response
for these genes was found for duloxetine,22 which is probably not a P-gp substrate. The
results for SNP 3435C>T as predictor of treatment response have been discordant, only
one study describes a higher remission rate in treatment with either paroxetine,
venlafaxine, or (es)citalopram for C-carriers (haplotype including 3435CC).5,11,13,14,23,24
A possible link between early onset of depression, higher level of adverse drug
reactions on SSRIs with P-gp affinity, and higher remission rates on SSRIs could imply
that the SNPs rs2235040 and rs2032583 are associated with decreased function of P-gp
at the blood-brain barrier. A decreased P-gp function may lead to higher net influx of
an antidepressant, thus attributing to higher remission rate, and also to higher (central)

adverse drug reactions. Besides, there are theories suggesting a relation between
vulnerability for neuropsychiatric disorders and a defective blood-brain barrier.
Table 7.2
Single locus and haplotype results for regression analyses on susceptibility factors in
MDD Significance was assessed using multinomial regression analysis, and odds ratio’s including p-
values, are shown for minor allele carrier versus non-carrier. Bold values indicate significant results.
*logistic regression (MDD starting before 30 years versus starting after 30 years) ** linear regression
analysis was used for the continuous variable ‘age of onset’
Furthermore, the suggested gene effect are limited, because the odds ratios are rather
small. Due to the small effects, these polymorphisms are likely not useful as single
indicator in clinical practice. Nevertheless, the uncovering of associations in ABCB1
rs2235040 rs203258
3
rs104564
2
rs20325
82
TTTG
TG
38.9%
TGCG
TG
13.8%
CGCG
TG
22.2%
CGCT
CA
12.9%
0-1 0.90; 0.49 0.91; 0.54 0.86; 0.15 0.92;
0.40
1.02;
0.83
1.7;
0.006
5
0.71;
0.010
0.93;
0.63
0-2 1.00; 0.99 0.99; 0.95 0.97; 0.76 1.11;
0.33
1.09;
0.50
1.11;
0.66
1.00;
0.65
0.99;
0.95
recurren
t
episodes
0-3 0.94; 0.67 0.95; 0.73 0.96; 0.65 1.01;
0.89
0.90;
0.42
1.44;
0.054
0.86;
0.11
0.96;
0.77
*<30 1.32; 0.010 1.29;
0.015
1.27;
0.0015
0.86;
0.085
1.22;
0.023
0.84;
0.25
1.17;
0.078
1.31;
0.012 age of
onset **age
-0.070;
0.005
-0.067;
0.007
-0.062;
0.014
-.0042;
0.092
0.48;
0.057
0.035;
0.17
-
0.020;
0.42
-.068;
0.006
0-1 1.00; 0.99 0.91; 0.99 1.12; 0.16 1.13;
0.14
0.87;
0.087
0.92;
0.62
1.22;
0.049
0.98;
0.89
0-2 1.03; 0.86 1.01; 0.94 1.08; 0.46 1.27;
0.027
0.78;
0.027
1.04;
0.28
1.16;
0.28
1.03;
0.87
Family
risk
0-3 0.89; 0.48 0.89; 0.48 0.97; 0.97 0.98;
0.86
0.74;
0.96
1.17;
0.27
1.17;
0.27
0.86;
0.37
0-1 0.98; 0.87 1.8;
0.012
0.80;
0.15
MDD
with
early
onset
and 2
episodes
0-2 0.72;
0.033
1.6;
0.072
0.59;0
.012

and other genes, each conferring a small effect on the MDD phenotype may help to
point out susceptibility factors in the disorder.
In conclusion, our results suggest that the polymorphisms rs2235040, 2232583 and
3435CC and the haplotypes 1236-2677-3435 T-T-T and T-T-C may be related to altered
susceptibility for MDD.
Acknowledgements
Funding support was provided by Center for Medical systems Biology (NWO
Genomics); the Geestkracht program of ZonMW (10-000-1002), and institutes involved
in NESDA (VU University Medical Center, Leiden University Medical Center, GGZ
Ingeest, Rivierduinen, University Medical Center Groningen, GGZ Lentis, GGZ
Friesland, GGZ Drenthe). The genotyping of the samples was provided through the
Genetic Association Information Network (GAIN). The study sponsors had no
involvement in the study design, in the collection, analysis and interpretation of the
data, nor in the writing of the report; nor in the decision to submit the paper for
publication.

References
1. Doran A, Obach RS, Smith BJ, Hosea NA, Becker S, Callegari E, Chen C, Chen X, Choo E,
Cianfrogna J, et al. (2005) The impact of P-glycoprotein on the disposition of drugs targeted for
indications of the central nervous system: evaluation using the MDR1A/1B knockout mouse
model. Drug Metab Dispos, 33, 165-174.
2. Bartels AL, Kortekaas R, Bart J, Willemsen AT, de Klerk OL, de Vries JJ, van Oostrom JC,
Leenders KL (2008) Blood-brain barrier P-glycoprotein function decreases in specific brain
regions with aging: A possible role in progressive neurodegeneration. Neurobiol. Aging.
3. Benyamina A, Bonhomme-Faivre L, Picard V, Sabbagh A, Richard D, Blecha L, Rahioui H,
Karila L, Lukasiewicz M, Farinotti R, et al. (2009) Association between ABCB1 C3435T
polymorphism and increased risk of cannabis dependence. Prog. Neuropsychopharmacol. Biol.
Psychiatry, 33, 1270-1274.
4. Qian W, Homma M, Itagaki F, Tachikawa H, Kawanishi Y, Mizukami K, Asada T, Inomata S,
Honda K, Ohkohchi N, Kohda Y (2006) MDR1 gene polymorphism in Japanese patients with
schizophrenia and mood disorders including depression. Biol. Pharm. Bull., 29, 2446-2450.
5. Lin KM, Chiu YF, Tsai IJ, Chen CH, Shen WW, Liu SC, Lu SC, Liu CY, Hsiao MC, Tang HS, et
al. (2011) ABCB1 gene polymorphisms are associated with the severity of major depressive
disorder and its response to escitalopram treatment. [Article]. Pharmacogenetics and Genomics
April, 21, 163-170.
6. Sullivan PF, Neale MC, Kendler KS (2000) Genetic epidemiology of major depression: review
and meta-analysis. Am. J. Psychiatry, 157, 1552-1562.
7. Kendler KS, Neale MC, Kessler RC, Heath AC, Eaves LJ (1993) The lifetime history of major
depression in women. Reliability of diagnosis and heritability. Arch. Gen. Psychiatry, 50, 863-
870.
8. Marazita ML, Neiswanger K, Cooper M, Zubenko GS, Giles DE, Frank E, Kupfer DJ, Kaplan BB
(1997) Genetic segregation analysis of early-onset recurrent unipolar depression. Am. J. Hum.
Genet., 61, 1370-1378.
9. Holmans P, Weissman MM, Zubenko GS, Scheftner WA, Crowe RR, Depaulo JR, Jr., Knowles
JA, Zubenko WN, Murphy-Eberenz K, Marta DH, et al. (2007) Genetics of recurrent early-onset
major depression (GenRED): final genome scan report. Am. J. Psychiatry, 164, 248-258.
10. Penninx BW, Beekman AT, Smit JH, Zitman FG, Nolen WA, Spinhoven P, Cuijpers P, De Jong
PJ, Van Marwijk HW, Assendelft WJ, et al. (2008) The Netherlands Study of Depression and
Anxiety (NESDA): rationale, objectives and methods. Int. J. Methods Psychiatr. Res., 17, 121-
140.
11. Kato M, Fukuda T, Serretti A, Wakeno M, Okugawa G, Ikenaga Y, Hosoi Y, Takekita Y,
Mandelli L, Azuma J, Kinoshita T (2008) ABCB1 (MDR1) gene polymorphisms are associated
with the clinical response to paroxetine in patients with major depressive disorder. Prog.
Neuropsychopharmacol. Biol. Psychiatry, 32, 398-404.
12. Hodges LM, Markova SM, Chinn LW, Gow JM, Kroetz DL, Klein TE, Altman RB (2011) Very
important pharmacogene summary: ABCB1 (MDR1, P-glycoprotein). Pharmacogenet.
Genomics, 21, 152-161.
13. Sarginson JE, Lazzeroni LC, Ryan HS, Ershoff BD, Schatzberg AF, Murphy GM, Jr. (2010)
ABCB1 (MDR1) polymorphisms and antidepressant response in geriatric depression
2. Pharmacogenet. Genomics, 20, 467-475.
14. Uhr M, Tontsch A, Namendorf C, Ripke S, Lucae S, Ising M, Dose T, Ebinger M, Rosenhagen M,
Kohli M, et al. (2008) Polymorphisms in the drug transporter gene ABCB1 predict
antidepressant treatment response in depression. Neuron, 57, 203-209.
15. Boomsma DI, Willemsen G, Sullivan PF, Heutink P, Meijer P, Sondervan D, Kluft C, Smit G,
Nolen WA, Zitman FG, et al. (2008) Genome-wide association of major depression: description
of samples for the GAIN Major Depressive Disorder Study: NTR and NESDA biobank projects.
Eur. J. Hum. Genet., 16, 335-342.

16. Sullivan PF, de Geus EJ, Willemsen G, James MR, Smit JH, Zandbelt T, Arolt V, Baune BT,
Blackwood D, Cichon S, et al. (2009) Genome-wide association for major depressive disorder: a
possible role for the presynaptic protein piccolo. Mol. Psychiatry, 14, 359-375.
17. Marchini J, Howie B (2008) Comparing algorithms for genotype imputation. Am. J. Hum.
Genet., 83, 535-539.
18. National Collaborating Centre for Mental Health (2009) National Collaborating Centre for
Mental Health.
19. Stephens M, Smith NJ, Donnelly P (2001) A new statistical method for haplotype reconstruction
from population data. Am. J. Hum. Genet. 68, 978-989.
20. Stephens M, Scheet P (2005) Accounting for decay of linkage disequilibrium in haplotype
inference and missing-data imputation. Am. J. Hum. Genet., 76, 449-462.
21. Nyholt DR (2004) A simple correction for multiple testing for single-nucleotide polymorphisms
in linkage disequilibrium with each other. Am. J. Hum. Genet., 74, 765-769.
22. Perlis RH, Fijal B, Dharia S, Heinloth AN, Houston JP (2010) Failure to Replicate Genetic
Associations with Antidepressant Treatment Response in Duloxetine-Treated Patients. Biol.
Psychiatry.
23. Mihaljevic PA, Bozina N, Sagud M, Rojnic KM, Lovric M (2008) MDR1 gene polymorphism:
therapeutic response to paroxetine among patients with major depression. Prog.
Neuropsychopharmacol. Biol. Psychiatry, 32, 1439-1444.
24. Peters EJ, Slager SL, Kraft JB, Jenkins GD, Reinalda MS, McGrath PJ, Hamilton SP (2008)
Pharmacokinetic genes do not influence response or tolerance to citalopram in the STAR*D
sample. PLoS. One., 3, e1872.


Chapter 8
Chronic stress and antidepressant treatment have
opposite effects on P-glycoprotein at the blood-brain barrier
an experimental PET study in rats

Authors:
Onno L. de Klerk1,2
Fokko J. Bosker1
Antoon T.M. Willemsen3
Aren van Waarde3
Anniek K.D. Visser4
Tim de Jager4
Girstaute Dagyte4
Johan A. den Boer1
Rudi A.J.O. Dierckx3
Peter Meerlo4
1Department of Psychiatry, University Medical Center Groningen (UMCG); 2GGZ
Drenthe, Assen; 3Dept. of Nuclear Medicine and Molecular Imaging; 4Dept. of
Molecular Neurobiology, University of Groningen, The Netherlands
J Psychopharmacology 2010, 24, 1237-1242.

Abstract
Background: The multidrug efflux transporter P-glycoprotein (P-gp) is expressed in
high concentrations at the blood-brain barrier (BBB) and has a major function in the
transport of drugs. In a recent PET-study evidence was found for an increased function
of P-gp at the BBB in medicated patients suffering from major depressive disorder. We
used small-animal PET and [11C]-verapamil to study P-gp function at the BBB of rats,
either being administered venlafaxine, an antidepressant, or subjected to chronic stress,
a factor contributing to the development of depression.
Methods: In a first experiment, male Wistar rats underwent a 3–week footshock
procedure as a model of human depression. In a second experiment, rats were
chronically treated with the antidepressant venlafaxine (25 mg/kg/d via an implanted
osmotic minipump). In both experiments. Thereafter, a [11C]-verapamil PET scan was
performed. Results: In the chronically stressed rats, the distribution volume (VT) of
[11C]-verapamil was significantly increased, whereas treatment with venlafaxine had
the opposite effect and caused a significant reduction in VT. The changes in VT could
not be attributed to the influx rate constant (K1).
Conclusion: Our data suggest that P-gp function at the BBB is inhibited by chronic
stress and increased by chronic administration of venlafaxine.

Introduction
In normal circumstances the blood-brain barrier (BBB) contributes to brain
homeostasis by protecting the brain from potentially harmful endogenous and
exogenous substances.1 This restricted entrance to the brain is mainly established by
active efflux mechanisms at the BBB.2 One of the major efflux transporters is P-
glycoprotein (P-gp), acting as a gate keeper protein for toxic substances at the luminal
side of the brain capillary.3 Due to its localization, potency and broad multispecificity
P-gp is a key determinant of drug entry to the brain.4
P-gp function can be modulated by a wide variety of endogenous and environmental
stimuli,5 including proinflammatory cytokines.6,7 In vitro, the P-gp function at the BBB
is downregulated after short term exposure to inflammation whereas its function is
upregulated following more prolonged exposure.8-10
Depressive disorders have been linked to neuroinflammatory events, wherein
proinflammatory cytokines, acute phase proteins and possible endotoxic substances
easily cross the BBB due to an increased permeability.11,12 Other indications for a loss of
integrity of the BBB in depressive disorders come from studies of the cerebrospinal
fluid (CSF) in depressed patients.13-15
In a PET study with [11C]-verapamil, recently performed by our group,16 we found an
increased function of P-gp at the BBB in a group of medicated patients with a major
depressive disorder (MDD). The interpretation of this finding was complicated by the
heterogeneity in the patient group and the use of antidepressants and other
psychotropic drugs. There are in fact two explanations that could account for the
change in P-gp function we found. First, the increase in P-gp function might be a result
of the depressive disorder itself or a result of some sort of neuronal or physiological
correlate of depression, e.g., chronic neuroinflammation or stress. Second, and opposite
to the first explanation, the increase in P-gp function might be a result of
antidepressant treatment.
Most antidepressants are substrates of the P-gp pump and generally they have a weak
inhibitory effect.17,18 However, so far this effect is only found in vitro with
concentrations that are far above therapeutically relevant levels.19-21
In the present study we aimed to differentiate between the two explanations for the
increase in P-gp function in depressed patients. With laboratory rats as a model species,
we used an experimental approach in a strictly controlled setting to examine changes in
P-gp function in response to: 1) chronic antidepressant treatment, and 2) chronic,
uncontrollable stress, as a potential contributing factor to the development of
depression. We hypothesised that chronic stress would lead to inhibition of P-gp
function and that chronic antidepressant treatment at a therapeutic level would lead to

increased P-gp function. [11C]-verapamil positron emission tomography (PET) has been
found to be a suitable methodology for the in vivo assessment of P-gp function.22,23
[11C]-verapamil is a well characterized PET ligand for evaluating P-gp function at the
BBB; it is a poor substrate for other transporters such as Multi Resistance Protein
(MRP1).23-25
To assess these hypothesized changes in P-gp function, PET brain imaging with [11C]-
verapamil as radiotracer was performed in two study groups, i.e. a chronic stress model
and a continuously administered antidepressant model, and two control groups of male
Wistar rats. The distribution volume of [11C]-verapamil was used as a measure of total
P-gp function.
Methods
Subjects
48 Male Wistar rats (Harlan, Groningen, the Netherlands) weighing 275-300 g at the
time of arrival, were individually housed in cages with food and water ad libitum. The
room was maintained at a temperature of 21 ± 1 °C and on a 12:12 dark/light cycle.
Housing conditions were the same for all rats. Animal experiments were conducted
according to the European Council Directive of November 24, 1986 (86/609/ECC) and
were approved by the Committee on the Ethics of Animal Experiments of Groningen
University.
Induction of stress
The footshock stress procedure was done using a footshock box containing an animal
space placed on a grid floor connected to a shock generator and scrambler. This stress
model was adapted from Trentani et al.26 Stress group rats (n=16) were subjected to a
daily session of footshock stress for 21 consecutive days. During the session in the
footshock box rats received 5 uncontrollable and inescapable footshocks (0.8 mA in
intensity and 8 s in duration). All footshock sessions took place during the light phase.
In order to increase unpredictability and minimize habituation, both duration of
footshock sessions and intervals between shocks within a session varied randomly
(session duration: 15-80 min; shock interval: 1-15 min). Control rats stayed undisturbed
in their home cages throughout the experiment. In the beginning of the light phase,
before the start of daily footshock session, all rats were weighed and the difference in
body weight gain between the groups was used as a read-out of stress effect on animals’
physiology.
Administration of venlafaxine

To study the effects of chronic antidepressant treatment on P-gp function, rats were
subjected to a 3-week treatment on venlafaxine. After 14 days of acclimatization a
group of 8 rats were anesthetized with Isoflurane (2-2.5%). Osmotic minipumps (Alzet
Model 2004, purchased from Charles River) containing 250 mg venlafaxine (kindly
provided by Dr. F.J. Bosker) dissolved in 2 ml saline (0.9 % NaCl) were subcutaneously
implanted. This pump model continuously releases its content at approximately 2.5
μl/hr for 4 weeks. Assuming that the average body weight of the rat is around 360 g
during the procedure, the mean administered dose of venlafaxine is 25 mg/kg/day. We
estimated that this dose would approach the human therapeutical serum level.27,28
Before implantation, all pumps had been placed in a sterile 37°C saline bath for 2 days.
The control group (8 rats) underwent the same procedure, the osmotic minipump
containing saline without an active drug. The active drug or the vehicle was
administered for 21 days.
Radiochemistry
Racemic [11C]-verapamil was produced as previously described.29 The injected
radioactivity of [11C]-verapamil varied between 50-100 MBq with a specific activity of
at least 40 GBq/nmol.
PET procedure
On the day of the PET scan the rats were transported in their home cage to the PET
facility. The transport was at least 4 hours prior to the scan procedure, so that the
animals could habituate to their new environment. Before the PET procedure, the rats
were anesthetized with 2-2.5% isoflurane, whereupon a canula for arterial blood
sampling was inserted into the right femoral artery. All scans were performed with a
Focus 220 microPET camera (Siemens/Concorde Microsystems, Knoxville, USA). After
injection of [11C]-verapamil in the penile vein serial dynamic PET scanning was
performed at escalating time frames and serial arterial blood sampling for [11C]-
verapamil took place during the scan in order to define the input function. Of each
animal 14 samples were manually drawn at t = 15, 30, 45, 60, 75, 90, 120, 180, 300, 450,
600, 900, 1800 and 3600 s. The blood volume of each sample taken, around 0.1 ml, was
partially replaced by saline/heparine, to prevent clotting of the canula.
These samples were further processed to measure the radioactivity in plasma. In this
way the contribution of the injected activity to the PET-signal could be calculated.
Metabolite analysis could not be realized since this would lead to hypovolemia in the
rat during scanning. In each PET scan session two animals were scanned, the first rat
starting at t=0, the second starting at t = 960 s (one control and one experimental rat, in
random order to prevent a scan order effect). The injected dose of [11C]-verapamil at
the moment of injection was similar for both animals to ensure similar counting
statistics. All data were corrected for physical decay to the moment of injection.

Metabolite correction
Determination of metabolites in the rats used in the study was not feasible, because of
the risk of hypovolemia during scanning. Instead, we used metabolite data performed
in three control rats (provided by Dr. G. Luurtsema). Mean percentages of metabolites
and parent compound at four time points were used to construct a standard metabolite
curve, using SigmaPlot (Systat Software Inc., San Jose, USA) (option ‘exponential rise to
max’). This regression curve was used as standard metabolite correction for the plasma
input function in the modelling. Subsequently we manipulated this curve and
constructed a regression curve, reflecting a hypothetical situation of a ‘slow’
metabolism, corresponding to a 5-10% diminution of metabolites formed after 60
minutes of scanning. By using this curve as input in the venlafaxine arm of the study
(the normal metabolite curve as input for the control group), we could make an
estimation of the VT difference across the two groups in case metabolism would be
substantially slowed down through the administration of venlafaxine.
List mode data were reframed into a dynamic sequence of 4 x 60 s, 3 x 120 s, 4 x 300 s, 3
x 600 s frames. Images were reconstructed per time frame employing an interactive
reconstruction algorithm (OSEM2D). The final datasets consisted of 95 slices with a
slice thickness of 0.8 mm, and an in-plane image matrix of 128 x 128 pixels of size 1 x 1
mm2. Data sets were fully corrected for random coincidences, scatter and attenuation.
A separate transmission scan was acquired for attenuation correction. This scan was
performed right before the emission scan. A study-specific template was constructed
onto which the realigned images were spatially normalized.
Data analysis
After conversion to an ECAT7 image file format the microPET images were analyzed
with a ROI-based approach (regions of interest). A whole brain ROI was manually
drawn using Clinical Applications Programming Package software (CAPP5;
CTI/Siemens PET Systems, Knoxville, TN). A graphical analysis according to Logan for
quantification of the dynamic PET data was done with plasma data as input.30 The
Logan plot was started at 5 minutes and the parameter for cerebral blood volume was
fixed at 0.0. With this method the distribution volume (VT) was estimated. Because the
slope (i.e.VT effect) obtained in the graphical approach may be biased in the presence of
noisy data,31 we verified the VT in a kinetic analysis (i.e. single tissue compartment
model). The influx rate constant (K1) and efflux k2 were derived from this model and on
all parameters (i.e. VT, K1 and k2) the group means (experimental group vs. control
group) were compared with each other, using t-tests. Analysis of variance was done to
test for the influence of K1, k2 and body weight gain (or venlafaxine concentration) as a
predictor of VT in the stress group (resp. venlafaxine group).

Results
Effects of chronic stress
The stress procedure was started with 16 rats (35 days, 448.1 g ± 26.3) and 16 rats (416.3
± 32.1) were used as control. Statistics were performed using analysis of variance
(repeated measures) for the body weight gain during the stress procedure. The
chronically stressed rats gained less weight than the control rats; 30.1 ± 14.4 (stress) vs.
60.1 ± 25.2 g (controls); p = 0.004 (t-test), (see figure 8.1). Also, a significant effect of
time was seen (F=93.46; p<0.001).
11 of the controls and 10 stressed rats could be used for the final analysis. The Logan
gave a good fit in all cases. A significant increase in VT was found in the stress group
(VT (stress): 1.40 ± 0.54 versus VT (controls): 1.00 ± 0.30; t= 2.14; p = 0.047) (see figure
8.2). K1 and k2 did not differ across the two groups; K1 was 0.28 ± 0.24 (controls) vs.
0.13 ± 0.06 (stress); p = 0.11 and k2 was 0.21 ± 0.14 (controls) vs. 0.16 ± 0.11 (stress); p =
0.42. A comparison was made between the VT obtained from the Logan method with
the VT from a kinetic analysis (one tissue model). The Pearson’s correlation coefficient
was 0.990 and a nearly equal level of significance was reached when comparing the two
groups in a t-test (p = 0.051). In an analysis of variance, body weight or weight gain had
no significant predictive value for VT.
Figure 8.1
Effect of stress on body weight gain. Chronically stressed rats (n=12) gained less weight than control rats (n=12). The animals were weighed every day starting 4 days before the first stress procedure (day 0, dotted line). Depicted are means ± SEM.

Figure 8.2
Distribution volumes of [11C]-verapamil (VT) for the stress and venlafaxine experiments, showing increased VT in chronically stressed rats, and a significant decrease of VT in rats receiving venlafaxine.
Venlafaxine administration
Eight rats of both groups had an osmotic minipump implanted either venlafaxine or
saline. In one scanned pair a failure in computer software made the results
questionable. The production of [11C]-verapamil failed twice, leaving 5 rats per groups
for analysis, of which 3 ‘venlafaxine rats’ were scanned first. The average plasma
concentration of venlafaxine was 77.6 ± 19.6 μg/l. The Logan fit was good in all cases.
The VT in the venlafaxine group (0.80 ± 0.14) was significantly lower than the VT in the
control group (1.00 ± 0.13), (t-test, p = 0.047) which was comparable to the control
group of the stress experiment (see figure 8.2). The VT in Logan showed a good
correlation with VT measured in a ‘one tissue model’ (Pearson’s = 0.994, p = 0.000-). In
the kinetic model the VT in the venlafaxine group showed a comparable significant
decrease in the t-test compared to the controls (t=-2.55; p = 0.039). K1 and k2 were not
significantly lower in the venlafaxine group, although K1 showed a trend towards
significance: K1 (controls) 0.14 ± 0.08 vs. K1 (venlafaxine) 0.057 ± 0.01; p = 0.085; k2
(controls) 0.17 ± 0.13 vs. k2 (venlafaxine) 0.07 ± 0.02; p = 0.15. The measured
venlafaxine concentration (after scanning) had no predictive value for VT in an analysis
of variance.
Subsequently we tested the differences in VT between the groups. With the
venlafaxine arm with a signicantly slower metabolism (i.e. 5-10% decrease in
metabolites formed after 60 minutes). The VT in the venlafaxine group was still
significantly lower (0.76 ± 0.13) than the control group (1.00 ± 0.13) which was
significant in the Logan analysis (p = 0.036), but not in the kinetic analysis (t-test, p =
0.15).
Discussion
The present study shows that chronic stress in rats significantly increases the VT of
[11C]-verapamil in the brain, whereas a sustained 3-week treatment with the
antidepressant venlafaxine in a ‘therapeutical’ concentration decreases the VT of the
tracer. The increased VT in chronic stress can be interpreted as a decrease in P-gp
function at the BBB, since no differences in influx (K1) were seen between the groups.
For the venlafaxine treated rats the decreased VT may either be explained by an
increase in P-gp activity and/or an increased influx, since K1 showed a nearly
significant decrease in the treatment group.
The chronic footshock stress model used in this study has been previously shown to
induce HPA axis hyperactivity as well as impairments in the mechanisms governing
neuroplasticity in the adult brain.26,32,33 A highly significant difference in body weight
gain between stress and control rats observed in our study has been described
previously and demonstrates a strong stress effect on animals’ physiology. Our results
suggest that chronic stress leads to reduced P-gp function, which in the long run might
leave the brain more vulnerable to the influx of potentially harmful substances. This
reduction in BBB function might be one of the pathways via which stress contributes to
central nervous system malfunction and disease. Our results may thus give new insight
in the pathophysiology of depression
Increased P-gp function in response to venlafaxine administration should result in
enhanced neuroprotection. However, increased pump function also implies reduced
access of venlafaxine to the sites of action within the central nervous system. Chronic
administration of venlafaxine may be related with a decreased pharmacological effect
in the face of therapeutic doses, and consequently contribute to treatment resistance.
The effects of venlafaxine treatment and chronic stress on P-gp are in the opposite
direction. It is a plausible assumption that venlafaxine reduces the effect that chronic
stress has on P-gp. The results suggest that our previous [11C]-verapamil PET-study
showing an increased P-gp function in medicated patients with chronic depression may
thus be ascribed to the use of antidepressants.34
Several authors have demonstrated that antidepressants, can exert an inhibitory effect
on P-gp function, although this has only been shown in vitro, at concentrations in the
range above therapeutic conditions.20,21 Venlafaxine has been shown to have a weak
effect op P-gp, both inhibitory21 and inductive.35 The average serum level of
venlafaxine in the rat was 69 μg/l, which is considered to be within the therapeutic
range in humans.28

Moreover, chronic stress dysregulates the HPA-axis and leads to an increased
glucocorticoid serum level.36 Cortisol is a substrate of P-gp and in case of inhibition of
P-gp its access to the brain is increased.37,38
Elevated levels of intracerebral cortisol are associated with compromised brain function
and with neurochemical and anatomical changes in different brain areas.39,40 An
increased cortisol level also leads to an increased activation of brain glucocorticoid
receptor function and an increased negative feedback on the HPA axis.38 Although this
feedback mechanism is altered in depression, antidepressants decrease HPA-activity in
depression.41 Cortisol may be regulated by P-gp through the inhibiting effect of
antidepressants on P-gp. However, cortisol entry to the brain is probably not regulated
by P-gp only, as Mason et al. found in mice.42
Metabolite measurement in the same animals was not feasible. In the absence of
individually metabolite-corrected plasma input data our data are not entirely reliable,
because a pharmacokinetic effect on verapamil metabolism through e.g. inhibition of
P450 enzymes or an alteration of plasma free fraction cannot be excluded. However,
significant changes in metabolism due to venlafaxine administration are not reasonable
on the basis of the available literature. An effect of venlafaxine on the free fraction of
[11C]-verapamil is theoretically conceivable, although in verapamil metabolism the
fraction is low (around 10%). Usually, the free fraction is not accounted for in
modelling, because it can be assumed that there is an equilibrium is between the
compartments. To date, no reliable method for determination of the free fraction of
[11C]-verapamil has been described.
Venlafaxine is a substrate of cyp2D6 and has a weak inhibitory effect on 2D6, whereas
this iso-enzyme does not play an appreciable role in verapamil metabolism, which is
mainly dependent on cyp3A4 metabolism.43,44 Venlafaxine has no effect on 3A4
metabolism.43,45,46
Thus, although we had no reasons to suspect significant changes in [11C]-verapamil
metabolism through venlafaxine, we have compared the VT between the group in a
hypothetical situation of a significant slower metabolism in the venlafaxine group
We still found a decrease of VT in the venlafaxine group, which was significant in the
Logan analysis (p = 0.036), although this could not be confirmed in the kinetic analysis
(p = 0.15).
In conclusion, our results suggest that chronic stress in rats leads to a loss of integrity of
the blood-brain barrier due to a decreased function of P-glycoprotein. The implication
of this might be an increased brain vulnerability and increased sensitivity to central
nervous system malfunction and disease. This finding supports the hypothesis that

reduced BBB-function might contribute to the pathophysiology of stress related
disorders such as depression. Furthermore, our results suggest that antidepressants may
in part exert their therapeutic effect by normalization of P-gp activity and BBB-
function. Further studies using other antidepressants form different pharmacological
classes are warranted to confirm our findings.
Acknowledgements
The authors thank Jurgen Sijbesma and Janine Doorduin for their assistance with the
PET scanning and data analysis and Folkert Postema for his help with the animal
experiments at the molecular neurobiology department. We thank Gert Luurtsema for
providing metabolite data.

References
1. Neuwelt EA (2004) Mechanisms of disease: the blood-brain barrier. Neurosurgery, 54, 131-140.
2. Kusuhara H, Sugiyama Y (2005) Active efflux across the blood-brain barrier: role of the solute
carrier family. NeuroRx., 2, 73-85.
3. Schinkel AH (1999) P-Glycoprotein, a gatekeeper in the blood-brain barrier. Adv. Drug Deliv.
Rev., 36, 179-194.
4. Begley DJ (2004) Delivery of therapeutic agents to the central nervous system: the problems and
the possibilities. Pharmacol. Ther., 104, 29-45.
5. Sukhai M, Piquette-Miller M (2000) Regulation of the multidrug resistance genes by stress
signals. J. Pharm. Pharm. Sci., 3, 268-280.
6. Bauer B, Hartz AM, Miller DS (2007) Tumor necrosis factor alpha and endothelin-1 increase P-
glycoprotein expression and transport activity at the blood-brain barrier. Mol. Pharmacol., 71,
667-675.
7. McRae MP, Brouwer KL, Kashuba AD (2003) Cytokine regulation of P-glycoprotein. Drug
Metab Rev., 35, 19-33.
8. Bauer B, Hartz AM, Miller DS (2007) Tumor necrosis factor alpha and endothelin-1 increase P-
glycoprotein expression and transport activity at the blood-brain barrier. Mol. Pharmacol., 71,
667-675.
9. Roberts DJ, Goralski KB (2008) A critical overview of the influence of inflammation and
infection on P-glycoprotein expression and activity in the brain. Expert. Opin. Drug Metab
Toxicol., 4, 1245-1264.
10. Tan KH, Purcell WM, Heales SJ, McLeod JD, Hurst RD (2002) Evaluation of the role of P-
glycoprotein in inflammation induced blood-brain barrier damage. Neuroreport, 13, 2593-2597.
11. Maletic V, Robinson M, Oakes T, Iyengar S, Ball SG, Russell J (2007) Neurobiology of
depression: an integrated view of key findings. Int. J. Clin. Pract., 61, 2030-2040.
12. Wichers MC, Koek GH, Robaeys G, Verkerk R, Scharpe S, Maes M (2005) IDO and interferon-
alpha-induced depressive symptoms: a shift in hypothesis from tryptophan depletion to
neurotoxicity. Mol. Psychiatry, 10, 538-544.
13. Gudmundsson P, Skoog I, Waern M, Blennow K, Palsson S, Rosengren L, Gustafson D (2007)
The relationship between cerebrospinal fluid biomarkers and depression in elderly women. Am.
J. Geriatr. Psychiatry, 15, 832-838.
14. Hampel H, Kotter HU, Moller HJ (1997) Blood-cerebrospinal fluid barrier dysfunction for high
molecular weight proteins in Alzheimer disease and major depression: indication for disease
subsets. Alzheimer Dis. Assoc. Disord., 11, 78-87.
15. Raedler TJ, Wiedemann K (2006) CSF-studies in neuropsychiatric disorders. Neuro. Endocrinol.
Lett., 27, 297-305.
16. de Klerk OL, Willemsen ATM, Roosink M, Bartels AL, Hendrikse NH, Bosker FJ, den Boer JA
(2009) Locally increased P-glycoprotein function in major depression: a PET study with
[11C]verapamil as a probe for P-glycoprotein function in the blood-brain barrier. Int.l J.
Neuropsychopharmacology, 12, 895-904.
17. Matheny CJ, Lamb MW, Brouwer KR, Pollack GM (2001) Pharmacokinetic and
pharmacodynamic implications of P-glycoprotein modulation. Pharmacotherapy, 21, 778-796.
18. Uhr M, Grauer MT, Yassouridis A, Ebinger M (2007) Blood-brain barrier penetration and
pharmacokinetics of amitriptyline and its metabolites in p-glycoprotein (abcb1ab) knock-out
mice and controls. J. Psychiatr. Res., 41, 179-188.
19. El Ela AA, Hartter S, Schmitt U, Hiemke C, Spahn-Langguth H, Langguth P (2004)
Identification of P-glycoprotein substrates and inhibitors among psychoactive compounds--
implications for pharmacokinetics of selected substrates. J. Pharm. Pharmacol., 56, 967-975.
20. Weber CC, Kressmann S, Ott M, Fricker G, Muller WE (2005) Inhibition of P-glycoprotein
function by several antidepressants may not contribute to clinical efficacy. Pharmacopsychiatry,
38, 293-300.

21. Weiss J, Dormann SM, Martin-Facklam M, Kerpen CJ, Ketabi-Kiyanvash N, Haefeli WE (2003)
Inhibition of P-glycoprotein by newer antidepressants. J. Pharmacol. Exp. Ther., 305, 197-204.
22. Hendrikse NH, Bart J, de Vries EG, Groen HJ, van der Graaf WT, Vaalburg W (2001) P-
glycoprotein at the blood-brain barrier and analysis of drug transport with positron-emission
tomography. J. Clin. Pharmacol., 41 Suppl, 48S-54S.
23. Sasongko L, Link JM, Muzi M, Mankoff DA, Yang X, Collier AC, Shoner SC, Unadkat JD (2005)
Imaging P-glycoprotein transport activity at the human blood-brain barrier with positron
emission tomography. Clin. Pharmacol. Ther., 77, 503-514.
24. Hendrikse NH, Schinkel AH, de Vries EG, Fluks E, van der Graaf WT, Willemsen AT, Vaalburg
W, Franssen EJ (1998) Complete in vivo reversal of P-glycoprotein pump function in the blood-
brain barrier visualized with positron emission tomography. Br. J. Pharmacol., 124, 1413-1418.
25. Lee YJ, Maeda J, Kusuhara H, Okauchi T, Inaji M, Nagai Y, Obayashi S, Nakao R, Suzuki K,
Sugiyama Y, Suhara T (2006) In vivo evaluation of P-glycoprotein function at the blood-brain
barrier in nonhuman primates using [11C]verapamil. J. Pharmacol. Exp. Ther., 316, 647-653.
26. Trentani A, Kuipers SD, ter Horst GJ, den Boer JA (2002) Selective chronic stress-induced in
vivo ERK1/2 hyperphosphorylation in medial prefrontocortical dendrites: implications for
stress-related cortical pathology? Eur. J. Neurosci., 15, 1681-1691.
27. Ahern TH, Javors MA, Eagles DA, Martillotti J, Mitchell HA, Liles LC, Weinshenker D (2006)
The effects of chronic norepinephrine transporter inactivation on seizure susceptibility in mice.
Neuropsychopharmacology, 31, 730-738.
28. Charlier C, Pinto E, Ansseau M, Plomteux G (2002) Venlafaxine: the relationship between dose,
plasma concentration and clinical response in depressive patients. J. Psychopharmacol., 16, 369-
372.
29. Wegman TD, Maas B, Elsinga PH, Vaalburg W (2002) An improved method for the preparation
of [11C]verapamil. Appl. Radiat. Isot., 57, 505-507.
30. Logan J, Fowler JS, Volkow ND, Wolf AP, Dewey SL, Schlyer DJ, MacGregor RR, Hitzemann R,
Bendriem B, Gatley SJ, . (1990) Graphical analysis of reversible radioligand binding from time-
activity measurements applied to [N-11C-methyl]-(-)-cocaine PET studies in human subjects. J.
Cereb. Blood Flow Metab, 10, 740-747.
31. Abi-Dargham A, Martinez D, Mawlawi O, Simpson N, Hwang DR, Slifstein M, Anjilvel S,
Pidcock J, Guo NN, Lombardo I, et al. (2000) Measurement of striatal and extrastriatal dopamine
D1 receptor binding potential with [11C]NNC 112 in humans: validation and reproducibility. J.
Cereb. Blood Flow Metab, 20, 225-243.
32. Kuipers SD, Trentani A, den Boer JA, ter Horst GJ (2003) Molecular correlates of impaired
prefrontal plasticity in response to chronic stress. J. Neurochem., 85, 1312-1323.
33. Trentani A, Kuipers SD, te Meerman GJ, Beekman J, ter Horst GJ, den Boer JA (2003)
Immunohistochemical changes induced by repeated footshock stress: revelations of gender-
based differences. Neurobiol. Dis., 14, 602-618.
34. de Klerk OL, Willemsen AT, Roosink M, Bartels AL, Harry HN, Bosker FJ, den Boer JA (2009)
Locally increased P-glycoprotein function in major depression: a PET study with
[11C]verapamil as a probe for P-glycoprotein function in the blood-brain barrier. Int. J.
Neuropsychopharmacol., 1-10.
35. Ehret MJ, Levin GM, Narasimhan M, Rathinavelu A (2007) Venlafaxine induces P-glycoprotein
in human Caco-2 cells. Hum. Psychopharmacol., 22, 49-53.
36. de Kloet ER, Joels M, Holsboer F (2005) Stress and the brain: from adaptation to disease. Nat.
Rev. Neurosci., 6, 463-475.
37. Karssen AM, Meijer OC, van dS, I, Lucassen PJ, de Lange EC, de Boer AG, de Kloet ER (2001)
Multidrug resistance P-glycoprotein hampers the access of cortisol but not of corticosterone to
mouse and human brain. Endocrinology, 142, 2686-2694.
38. Pariante CM, Thomas SA, Lovestone S, Makoff A, Kerwin RW (2004) Do antidepressants
regulate how cortisol affects the brain? Psychoneuroendocrinology, 29, 423-447.
39. Brown SM, Henning S, Wellman CL (2005) Mild, short-term stress alters dendritic morphology
in rat medial prefrontal cortex. Cereb. Cortex, 15, 1714-1722.

40. Conrad CD (2006) What is the functional significance of chronic stress-induced CA3 dendritic
retraction within the hippocampus? Behav. Cogn Neurosci. Rev., 5, 41-60.
41. Barden N (2004) Implication of the hypothalamic-pituitary-adrenal axis in the physiopathology
of depression. J. Psychiatry Neurosci., 29, 185-193.
42. Mason BL, Pariante CM, Thomas SA (2008) A revised role for P-glycoprotein in the brain
distribution of dexamethasone, cortisol, and corticosterone in wild-type and ABCB1A/B-
deficient mice. Endocrinology, 149, 5244-5253.
43. Owen JR, Nemeroff CB (1998) New antidepressants and the cytochrome P450 system: focus on
venlafaxine, nefazodone, and mirtazapine. Depress. Anxiety., 7 Suppl 1, 24-32.
44. Tracy TS, Korzekwa KR, Gonzalez FJ, Wainer IW (1999) Cytochrome P450 isoforms involved in
metabolism of the enantiomers of verapamil and norverapamil. Br. J. Clin. Pharmacol., 47, 545-
552.
45. Amchin J, Zarycranski W, Taylor KP, Albano D, Klockowski PM (1998) Effect of venlafaxine on
the pharmacokinetics of terfenadine. Psychopharmacol. Bull., 34, 383-389.
46. Ball SE, Ahern D, Scatina J, Kao J (1997) Venlafaxine: in vitro inhibition of CYP2D6 dependent
imipramine and desipramine metabolism; comparative studies with selected SSRIs, and effects
on human hepatic CYP3A4, CYP2C9 and CYP1A2. Br. J. Clin. Pharmacol., 43, 619-626.


Chapter 9
Distribution and function of P-glycoprotein at the
blood-brain barrier in three animal models

Authors:
Onno L. de Klerk1,2
Anniek K.D. Visser3
Wanda Douwenga4
Janine Doorduin3
Fokko J. Bosker1
1Department of Psychiatry, University Medical Center Groningen (UMCG); 2GGZ
Drenthe, Assen; 3Dept. of Nuclear Medicine and Molecular Imaging; 4Dept. of
Molecular Neurobiology, University of Groningen, the Netherlands
In preparation

Introduction
The blood-brain barrier (BBB) plays an important role in maintaining the internal
milieu of the brain. One important function of the BBB is to restrict the entry of
xenobiotics. P-glycoprotein (P-gp) is a multispecific efflux pump, highly expressed at
the BBB and with the ability to extrude a wide array of unrelated compounds. In
particular, lipophilic molecules, such as antineoplastic agents, immunosuppressants,
cardiac glycosides, but also antidepressants and antipsychotics are substrates for P-gp.1
In humans, P-gp is encoded by a single gene, ABCB1, formerly denoted as MDR1. It
belongs to the superfamily of ATP binding Cassette (ABC) transporters. Rats have two
P-gp genes at the BBB, called mdr1a (or mdr3 or ABCB1a) and mdr1b (or ABCB1b).
Together, these two genes have a comparable tissue distribution as human ABCB1.
ABCB1a knockout mice have no detectable P-glycoprotein in the brain, indicating that
this is the only gene responsible for drug efflux at the BBB.2 ABCB1a encodes two
isoforms of P-gp, both present in the BBB. The 140kDa protein appears to be the main
isoform, it seems to be the immature form, which is not finally processed within the
cell (also called called mdr3) (Potschka, personal communication). The 174 kDa protein
is the functional mature form, which is integrated into the membrane, formerly named
mdr1a.3
There is still some controversy regarding the exact localization of P-gp in the brain.
The majority of studies have shown that its predominant location is at the luminal side
of the endothelial cell,4 but P-gp might also be involved in the regulation of drug
transport at the subcellular level.5
P-gp is present in all BBB-protected regions, which excludes the choroid plexus,
selected circumventricular organs and the posterior pituitary,6 which have leaky
capillaries. Under normal circumstances, P-gp is probably equally distributed
throughout the brain, although the evidence so far is limited. In two recent PET studies
in healthy controls, using R-[11C]-verapamil as probe for P-gp function, regional
differences in tracer uptake were neither seen at baseline nor following P-gp
inhibition.7,8
Assessment of regional differences in P-gp expression and activity is of great interest,
because a regional change in activity might contribute to the pathology of various
neuropsychiatric disorders, but it could also be an indicator of local(ized) pathology. In
PET studies indications were found for regional changes in P-glycoprotein activity
with both psychiatric and neurological disorders.9-11 Although not confirmed in PET
studies, epilepsy and Alzheimer dementia might also be characterized by regional
alterations in P-gp expression or function. Regional decline of P-gp function may also
be related to ageing.12,13
It is now well established that many cortical and subcortical structures are involved in
the psychopathology of major depressive disorder (MDD).14,15 Brain activation studies

show hypoactivity in the frontal and temporal cortex as well as in the insula and
cerebellum with patients suffering from MDD, whereas activity in these regions is
increased during antidepressant treatment. The area and level of brain activation may
depend on the drug of choice.16,17 Cortical and subcortical areas have also been
implicated in schizophrenia, in particular, the dorsolateral prefrontal cortex18 and the
basal ganglia.19
In this study we assessed the P-gp expression and the cerebral distribution patterns in
three different models in male Wistar rats: 1) a depression model (chronic stress
paradigm)20 2) a schizophrenia model (neuroinflammation paradigm)21 and 3) an
antidepressant treatment model20 (3 week chronic administration of venlafaxine). Each
condition might reflect physiological processes or localized pathology. Both P-gp
function in vivo (using [11C]-verapamil PET) and P-gp expression (using western
blotting and immunohistochemistry) were used for comparisons. We have used the
PET data on chronic stress and on chronic administration of venlafaxine and the rat
brain tissue from a previously published animal PET study.20
Materials and methods
Animals
All experiments were performed on male Wistar rats (Harlan, Groningen, the
Netherlands) weighing 275-300 g at the time of arrival. Animals were individually
housed in cages with food and water ad libitum. The room was maintained at a
temperature of 21 ± 1 °C and on a 12:12 dark/light cycle. Housing conditions were the
same for all rats. Animal experiments were conducted according to the European
Council Directive of November 24, 1986 (86/609/ECC) and were approved by the
Committee on the Ethics of Animal Experiments of Groningen University.
Chronic stress procedure
This has been described in our previous publication.20 Briefly, a group of rats ( n=16)
was subjected to a daily session of foot shock stress for 21 consecutive days. During the
session in the foot shock box rats received 5 uncontrollable and inescapable foot
shocks. Control rats (n=16) stayed undisturbed in their home cages throughout the
experiment.
Chronic administration of venlafaxine
This has also been described in the previous study.20 In short, osmotic mini-pumps
were subcutaneously implanted in rats (n=16). These pumps continuously released
either venlafaxine (25 mg/kg/day) (n=8) or saline (n=8) in the control group. The active
drug or the vehicle was administered for 21 days.

Neuroinflammation model (Herpes encephalitis)
On the first day a group of 8 rats was intranasally inoculated with 1x10⁷ PFU of Herpes
Simplex Virus-1, leading to an clinical encephalitis. A control group (n= 8) was
inoculated with PBS. On day 6 both groups underwent a PET scan.
PET procedure and data analysis
The PET procedure has been described elsewhere.20 In brief, before the scan the rats
were habituated to the PET facility. After being anaesthesized the tracer [11C]-
verapamil was injected into the penile vein. 14 arterial samples and metabolite data
were used as input function. A study-specific template was constructed onto which the
realigned images were spatially normalized.
The reconstructed images were analyzed with a ROI-based approach (region of
interest) with the use of a microPET program expanded with addition of Siemens
Inveon Research Workplace (Siemens AG, Erlangen, Germany). This system is a
multimodality image review, fusion, supporting CT and PET formats and it allows
quantitative analysis of the data, using semi-automated region of interest techniques. 16
ROIs were predefined on a template. A graphical analysis according to Logan for
quantification of the dynamic PET data was done with plasma data as input. The Logan
plot was started at 5 minutes and the parameter for cerebral blood volume was fixed at
0.03. With this method the distribution volume (VT) was estimated. Because the slope
(i.e.VT effect) obtained in the graphical approach may be biased in the presence of
noisy data, we verified the VT in a kinetic analysis (i.e. single tissue compartment
model). The influx rate constant (K1) and efflux k2 were derived from this model and on
all parameters (i.e. VT, K1 and k2) the group means (experimental group vs. control
group) were compared with each other, using t-tests.
Brain collection, western blotting and immunohistochemistry
At the end of the PET experiments, rats were still anaesthesized. Brains were dissected
and divided into two hemispheres. The left hemisphere was dissected in three parts,
which were hippoacampus, prefrontal cortex and parietal cortex, and was snap frozen
in liquid nitrogen and conserved at -80˚C. The right hemisphere was fixed in 4%
paraformaldehyde solution and was also cryopreserved.
For western blotting (WB) analysis whole brain tissue was homogenized, and a lysis
buffer (50mM HEPES (pH 7.4), 150mM NaCl, 10mM EDTA, 4 mM EGTA (pH 7.4),
0.2% NP-40, 5 mM b-glycerophosphate, 100 mM sodium fluoride, 5 mM
orthovanadate, 1 mM DTT, 1 mM PMSF and a protease inhibitor) was employed for
cell lysis and protein solubilisation. After centrifugation the pellet and supernatant
were split and both samples were sonificated, Protein concentration was

determined using a Bradford assay, samples were diluted if necessary and stored as
aliquot samples in a sample buffer at -80˚C. The solubilised membrane proteins
were separated by sodium dodecyl sulphate polyacrylamide gel electrophoresis
(SDS-PAGE) and transferred by electroblotting to a Polyvinlidene Difluoride
membrane using Tris-glycine buffer for 2 hr at 25 Volt. Immunoblots were blocked
30 hr with I-block (Tropix) at room temperature. After blocking the blots were
incubated withP-glycoprotein monoclonal antibody (MAb) C219 (Alexis, Enzo life
sciences 1:1000) overnight at 4˚C, a MAb against P-gp. Horseradish peroxidase-
conjugated goat anti mouse gG (1:5000 Santa Cruz) was used as secondary antibody .
Detection was carried out with enhanced chemiluminiscence (ECL Pierce)
according to the manufacturers instructions. and a digital image was analyzed by
quantification of optical density.
For immunohistochemistry (ICH) serial sections of the right hemisphere were cut
using a cryostat into 30μm slices and stored in 0.01M PBS (pH 7.4) with 0.01%
Sodium Azide. The immunostainings were performed on free-floating sections
under continuous mild agitation. Brain sections were washed in 0.01 PBS pH 7.4 and
endogenous peroxidase activity was reduced with 0.3% H2O2 in 0.01M PBS (pH 7.4) for
30 min at room temperature.The brain sections were washed in 0.01M PBS (pH 7.4)
and Preincubated with 5% normal goat serum and 0.1% TritonX-100 in 0.01M PBS (pH
7.4) for 30 min at room temperature, and then incubated with the MAb P-glycoprotein
C219 (1:1000, Alexis, Enzo Life Sciences) overnight at 4˚C. Subsequently, sections were
rinsed in 0.01 M PBS (pH 7.4) and incubated for 2 h at room temperature with the
secondary antibody horseradish peroxidase-conjugated goat anti-mouse (1:400) in
0.01M PBS (pH 7.4) with 0.1% Triton-X 100 and 1% NGS. Then, avidin-biotin
complex (1:500 Vector ABC kit, Vector Laboratories, Burlingame, Ca, USA) was added
for 1.5 hr at room teperature and washed in 0.01M PBS (pH 7.4), after which the
staining was visualized with 1 mg/ml diaminobenzidine and 0.001% H202. Thereafte,
sections were rinsed in 0.01M PBS (pH 7.4), mounted on slides (Superfrost) with 1%
Gelatine and 100 mg potassium chromium III sulfate, dehydrated by the ethanol-xylol
serie and coverslipped for microscopic analysis.
Results Venlafaxine (PET study)
The image files of 5 venlafaxine treated rats and 5 sham were available for analysis
with both a kinetic model (one compartment model) and a graphical approach (logan
analysis) (see figure 9.1). There was good overlap between the two methods, pearson’s ρ
was 0.99 for the controls and 0.88 for the venlafaxine group. ROIs lining extracerebral

structures (i.e. bulbus, frontopolar lobe, pons and medulla) had much higher VT’s than
deeper brain structures, which is due to spill-in activity. The mean VT of controls in all
ROIs was higher than in the venlafaxine group, significantly in 6 ROIs and a significant
trend was seen in 7 ROIs (see table 9.1). When corrected for multiple testing, VT was
not different for any single ROI (see figure 9.1A).
Figure 9.1 A: Mean distribution volumes (VT) of venlafaxine vs. controls for each ROI. B: Mean distribution volumes (VT) of chronic stress vs. controls for each ROI.
The pituitary lies outside the blood-brain barrier and the VT is 2.5 larger than the mean
VT. The bars with an asterix (*) differ significantly in VT. (not corrected for multiple
comparisons)

Stress (PET study)
11 controls and 9 rats from the stress procedure were available for the analyses. Logan
analysis and one compartment kinetic analysis were carried out. The correlation
coefficient ρ for both groups was 1.00. In the kinetic analysis, the VT in 9 ROIs was
significantly higher in the stress group, and in the remaining 8 ROIs a significant trend
was seen (see table 9.1, figure 9.1B). The pituitary, with little or no Pgp expression, was
the only area showing no difference at all between groups (p = 0.47). Again, areas
lining the extracellular structures had a higher VT, caused by spill-in. In none of the
ROIs a significant difference was seen after Bonferroni correction.
Table 9.1
t-tests (logan analysis) for regions of interest (PET)
ROI: region of interest; p = p-values, none is significant after correction for multiple testing
Western immunoblots of hippocampus
We utilized MAb C219 and performed Western immunoblot analysis of extracts of
hippocampus. Three different animal models were compared with control rats: 1)
neuroinflammation model (Herpes Simplex Virus Encephalitis), 2) chronic stress model
and 3) model for chronic administration of an antidepressant. In homogenates from rat
hippocampus two immunoreactive bands were detected , a major band at 140 kDa and
a very weak one at 174 kDa. Both bands represent isoforms of P-gp, the 140 kDa being
the main isoform of P-glycoprotein in the rodent brain,3 The 174 kDa was too weak to
be analyzed with densitometry (figure 9.2A). Therefore comparisons were made on the
ROI venlafaxine stress
p p bulbus 0,011 0,064
frontopolar 0,086 0,036
frontal cortex R 0,060 0,035
frontal cortex L 0,039 0,079
frontal cortex (L + R) 0,048 0,039
striatum 0,086 0,023
right cortex 0,058 0,019
left cortex 0,15 0,023
total cortex 0,091 0,013
amygdala 0,031 0,079
hippocampus 0,55 0,019
hypothalamus 0,16 0,050
thalamus 0,047 0,028
midbrain 0,25 0,058
pons 0,073 0,096
medulla 0,091 0,053
cerebellum 0,030 0,077
pituitary 0,129 0,47

basis of the 140 kDa band (figure 9.2B. It is to note that no actin band was included in
the blots, which is necessary as reference value for comparison. Nevertheless P-gp
expression seems increased with neuroinflammation, and decreased with chronic stress.
The venlafaxine treated rats did not show differences in P-gp expression, however the
bands were of low quality. It is obvious that our preliminary results must be replicated
in a larger sample before drawing any conclusions.
Figure 9.2 Western blot analysis of P-glycoprotein using C219 antibody.
Figure 9.2A showing two bands (stress (S) versus control (C)) that represent the two isoforms of P-gp, found in the BBB. The 174kDa band is the full-length (mature) form. The ‘immature’ form is the main isoform in rodents, and dominates in situations where P-gp is upregulated. The 140 kDa band represents P-gp (mdr3),
Figure 9.2B showing three conditions compared to controls (C): A= neuroinflammation versus controls B = stress versus controls C= chronic administration of venlafaxine versus controls
Discussion
In a previous PET study with rats it was demonstrated that sustained venlafaxine
administration led to an increased P-gp activity at the BBB,20 whereas chronic stress led
to a decreased activity of P-gp.20 This study shows that P-gp is globally affected in both
situations. Immunochemical studies in rats and PET studies in man suggest that P-gp
expression develops synchronously with other BBB components and that P-gp is
present in nearly every region (see introduction) of the brain.7,8,22 The uniform
distribution of P-gp in the brain is a logic explanation for the global changes in P-gp
activity. In depressive disorders and schizophrenia, both stress related disorders,
regional changes in P-gp activity have been reported,10,11 which seem to be in contrast
with the results of regional analysis of the animal PET study. However, only 5 areas in
the PET study on depressive disorders were analyzed, compared to 18 areas in the
animal study. Besides, the methodology in both studies differed. If the same (small
number of) areas had been chosen in the animal study, there would be a trend towards
a significant decrease in P-gp activity in the hippocampus and (total) cortex. A regional
change in P-gp activity in chronic stress can therefore not be excluded on the basis of
these results.
The changes in P-gp activity may reflect changes in protein regulation at various levels.
Although preliminary, the first results of the western blots support the PET results. The
P-gp expression in neuroinflammation seems increased compared to controls, which is
in line with the PET results21 showing an increased P-gp activity throughout the brain
(except in cerebellum and brain stem) in an acute neuroinflammation. In contrast, P-gp
expression might be lower at the BBB, after exposure to chronic stress, which is
contingent with decreased P-gp activity. However, comparison of different samples is
not reliable without an actin band, which serves as reference measure for the amount
of protein in a sample. The quality of the venlafaxine blots was too poor to be
analyzable.
Thus, the preliminary results of this study suggest that changes in P-gp activity due to
chronic antidepressant treatment (venlafaxine) and chronic stress are not confined to
specific regions in the brain, which is in line with the uniform distribution of P-gp in
the brain. Moreover, the changes in P-gp activity may be connected to regulatory
changes in protein level, even after 4 days.
To underpin these preliminary results, the western blot analysis of all samples,
including frontal cortex samples must be finished, and these results must be correlated
to the individual PET measurements. Immunohistochemistry may support the idea of
global downregulation of P-gp in chronic stress in rats, but was not yet performed at
the time of writing of this manuscript.

References
1. Schinkel AH, Jonker JW (2003) Mammalian drug efflux transporters of the ATP binding cassette
(ABC) family: an overview. Adv. Drug Deliv. Rev., 55, 3-29.
2. Schinkel AH (1999) P-Glycoprotein, a gatekeeper in the blood-brain barrier. Adv. Drug Deliv.
Rev., 36, 179-194.
3. Jette L, Pouliot JF, Murphy GF, Beliveau R (1995) Isoform I (mdr3) is the major form of P-
glycoprotein expressed in mouse brain capillaries. Evidence for cross-reactivity of antibody
C219 with an unrelated protein. Biochem. J., 305 ( Pt 3), 761-766.
4. Löscher W, Potschka H (2005) Role of drug efflux transporters in the brain for drug disposition
and treatment of brain diseases. Prog. Neurobiol., 76, 22-76.
5. Bendayan R, Ronaldson PT, Gingras D, Bendayan M (2006) In situ localization of P-
glycoprotein (ABCB1) in human and rat brain. J. Histochem. Cytochem., 54, 1159-1167.
6. Ermisch A, Ruhle HJ, Landgraf R, Hess J (1985) Blood-brain barrier and peptides. J. Cereb.
Blood Flow Metab, 5, 350-357.
7. Eyal S, Ke B, Muzi M, Link JM, Mankoff DA, Collier AC, Unadkat JD (2010) Regional P-
glycoprotein activity and inhibition at the human blood-brain barrier as imaged by positron
emission tomography. Clin. Pharmacol. Ther., 87, 579-585.
8. Bauer M, Karch R, Neumann F, Wagner CC, Kletter K, Muller M, Loscher W, Zeitlinger M,
Langer O (2010) Assessment of regional differences in tariquidar-induced P-glycoprotein
modulation at the human blood-brain barrier. J. Cereb. Blood Flow Metab, 30, 510-515.
9. Bartels AL, Willemsen AT, Kortekaas R, de Jong BM, De Vries R, de Klerk OL, van Oostrom JC,
Portman A, Leenders KL (2008) Decreased blood-brain barrier P-glycoprotein function in the
progression of Parkinson's disease, PSP and MSA. J. Neural Transm., 115, 1001-1009.
10. de Klerk OL, Willemsen AT, Bosker FJ, Bartels AL, Hendrikse NH, den Boer JA, Dierckx RA
(2010) Regional increase in P-glycoprotein function in the blood-brain barrier of patients with
chronic schizophrenia: a PET study with [(11)C]verapamil as a probe for P-glycoprotein
function. Psychiatry Res, 183, 151-156.
11. de Klerk OL, Willemsen ATM, Roosink M, Bartels AL, Hendrikse NH, Bosker FJ, den Boer JA
(2009) Locally increased P-glycoprotein function in major depression: a PET study with
[11C]verapamil as a probe for P-glycoprotein function in the blood-brain barrier. The
International Journal of Neuropsychopharmacology, 12, 895-904.
12. Bartels AL, Kortekaas R, Bart J, Willemsen AT, de Klerk OL, de Vries JJ, van Oostrom JC,
Leenders KL (2008) Blood-brain barrier P-glycoprotein function decreases in specific brain
regions with aging: A possible role in progressive neurodegeneration. Neurobiol. Aging.
13. Bauer M, Karch R, Neumann F, Abrahim A, Wagner C, Kletter K, M++ller M, Zeitlinger M,
Langer O (2009) Age dependency of cerebral P-gp function measured with (R)-[11C]verapamil
and PET. European Journal of Clinical Pharmacology, 65, 941-946.
14. Koolschijn PC, van Haren NE, Lensvelt-Mulders GJ, Hulshoff Pol HE, Kahn RS (2009) Brain
volume abnormalities in major depressive disorder: a meta-analysis of magnetic resonance
imaging studies. Hum. Brain Mapp., 30, 3719-3735.
15. McKinnon MC, Yucel K, Nazarov A, MacQueen GM (2009) A meta-analysis examining clinical
predictors of hippocampal volume in patients with major depressive disorder. J Psychiatry
Neurosci., 34, 41-54.
16. Fitzgerald PB, Laird AR, Maller J, Daskalakis ZJ (2008) A meta-analytic study of changes in
brain activation in depression. Hum. Brain Mapp., 29, 683-695.
17. Kim W, Jin BR, Yang WS, Lee KU, Juh RH, Ahn KJ, Chung YA, Chae JH (2009) Treatment with
selective serotonin reuptake inhibitors and mirtapazine results in differential brain activation by
visual erotic stimuli in patients with major depressive disorder. Psychiatry Investig., 6, 85-95.
18. Weinberger DR, Berman KF, Zec RF (1986) Physiologic dysfunction of dorsolateral prefrontal
cortex in schizophrenia. I. Regional cerebral blood flow evidence. Arch. Gen. Psychiatry, 43,
114-124.

19. Patel NH, Vyas NS, Puri BK, Nijran KS, Al-Nahhas A (2010) Positron emission tomography in
schizophrenia: a new perspective. J. Nucl. Med., 51, 511-520.
20. de Klerk OL, Bosker FJ, Willemsen AT, van Waarde A, Visser AK, de Jager T, Dagyte G, den
Boer JA, Dierckx RA, Meerlo P (2010) Chronic stress and antidepressant treatment have
opposite effects on P-glycoprotein at the blood-brain barrier: an experimental PET study in rats.
J Psychopharmacol., 24, 1237-1242.
21. Doorduin J, Klein H, Dierckx RA, de Vries EF (2010). HSV-1 induced neuroinflammation and
antipsychotic treatment affect P-glycoprotein activity in the rat brain
22. Matsuoka Y, Okazaki M, Kitamura Y, Taniguchi T (1999) Developmental expression of P-
glycoprotein (multidrug resistance gene product) in the rat brain. J. Neurobiol., 39, 383-392.


Chapter 10
General discussion and
concluding remarks


Both MDD and schizophrenia are severe psychiatric disorders, both tending to
chronicity and affecting many people throughout the world. Schizophrenia is often a
debilitating disease, characterized by several relapses with psychotic features, decreased
skills during the life cycle, often leading to elimination of major social activities and
relations. Neurodevelopmental events and genetic factors may contribute in the
pathophysiology.
MDD is considered a heterogeneous condition in which different biologic
abnormalities play a role in the symptomatology. The life time prevalence of MDD in
the Netherlands is around 15%, the one year prevalence was 5.8% in 1998.1 Today,
MDD is worldwide the third leading cause of disease burden.2 Despite intensive
research during the past decades, the neurobiological basis and the pathophysiology of
MDD remain largely unknown, although genetic factors and childhood trauma’s are
known to play a role.
The aim of the present thesis was to investigate the possible role of P-glycoprotein (P-
gp) at the blood-brain barrier (BBB) in major depressive disorder (MDD) and
schizophrenia.
Pertaining to the pathophysiology of both disorders, neuroinflammatory events appear
to play a central role. For instance, it is now known that stressful events paving the
way to stress related disorders, lead to changes in neuroplasticity, impair neurogenesis
and may lead to a neuroinflammatory response in the brain.3 As such, it has been
suggested that neurotoxic processes may contribute to the pathophysiology of
neurodegenerative diseases. An increase or accumulation of toxic substances in the
brain can alter neurotransmission or may damage neurons.4,5Accumulation of toxic
substances can occur as a result of a diminished blood-brain barrier (BBB) function.
Likewise a defective BBB function may cause a hampered outward transport of toxic
waste products, leading to malfunctioning neuronal tissue. the A PET study in
Parkinson’s Disease supported this theory.6 In this study it was found that the function
of P-gp, an important efflux pump in the BBB, was diminished in the midbrain.
The BBB is formed by the brain capillary non-fenestrated polarized endothelial cells
that have high-resistance tight junctions. Besides low passive permeability, the brain is
protected from potentially harmful endogenous and exogenous substances by efflux
transporter proteins, located in the brain capillary wall. P-glycoprotein is a product of
the ABCB1 gene and is most principal drug efflux transporter, involved in the outward
transport of a wide variety of lipophilic drugs and endogenous substances.7 Attenuation
of P-gp function, for example through use of pharmacologic inhibitors, results in

substantial changes in the pharmacokinetics and pharmacodynamics of various
substrates. 8,9
We hypothesized that P-gp function was altered at the BBB by the effects of
neuroinflammation, which appear to play a role in MDD and schizophrenia. In the first
study (chapter 4), P-gp function at the BBB was investigated in 13 patients with MDD,
all using antidepressants, compared to a sex and age matched control group, using [11C]-
verapamil as PET tracer. Cerebral distribution volume (VT) was used as measure for P-
gp function. In addition, three (common) polymorphisms were determined with rt-
PCR and analyzed as covariate of VT. Both region-of-interest (ROI) and voxel analysis
using statistical parametric mapping (SPM2) were performed to assess regional brain P-
gp function. We found a significantly decreased VT (i.e.[11C]-verapamil uptake) in
patients with MDD, with both methods, representing an increased P-gp function,
mainly in prefrontal and temporal regions. A genotype effect was not seen in this small
sized group. In a post hoc analysis it appeared that 7 out of 13 patients were considered
to have a treatment resistant depression (TRD). Comparison between the subgroups
(TRD vs. non-TRD), was not eligible since these groups were not matched. The
question of biased results (increased activity of P-gp) related to TRD could not be
excluded. The study had several limitations. Probably the most serious limitation
concerned the missing of a metabolite analysis. Without this input function it can not
be excluded that the difference between the groups is not related to P-gp function but
to a different rate in metabolism of the tracer. In chapter 4 we have discussed why we
assume metabolism has no major influence on P-gp functionality. Other drawbacks
were the use of several antidepressants and other psychotropics, some of them with an
inconclusive effect on P-gp. In chapter 5 the same protocol is used to assess the in vivo
function of P-gp in 10 schizophrenic patients, compared to a matched control group.
The results were very much comparable to the results in the MDD study, although the
results of the voxel-wise analysis were only significant when small volume correction
was applied. Nevertheless, the results in both studies suggested a regional increase in
P-gp function, which might denote a general disease characteristic (eg. inflammation),
or be related to medication. Although we excluded the use of inhibitors of P-gp at
recruitment, both antidepressants and antipsychotics have shown (low) affinity
(principally in in vitro studies) to P-gp. In addition, some appear to exhibit inhibition
of P-gp activity in vitro.10-13 The in vivo inhibitory effect on P-gp in human is
unknown, and presumed to be negligible, because supratherapeutical doses were
needed to inhibit P-gp in BBB models.12 In a mouse model Grauer and Uhr showed that
long term administration of a weak to moderate P-gp substrate (amitriptyline) does
admittedly not lead to significant differences between Pgp knock-out and wild type
mice, but led to large differences in brain accumulation of its metabolites.14

The effects on P-gp activity of both medication, MDD, schizophrenia and stress we
found (chapters 4,5, and 8) could have been influenced by gene variation as well.
Although we determined three polymorphism in the human PET studies, the sample
was expectedly not adequate to detect small gene effects. The literature on ABCB1
polymorphisms relating gene variation to phenotype is far from conclusive. In the
following chapters 6 and 7 we present the results of the NESDA study, a large
multicenter cohort, investigating the long term outcome of depression (and anxiety) as
it presents in the general population. Based on our previous results (chapters 4,5 and 8),
a decline of P-gp functionality in chronic stress, we hypothesized that ABCB1 might be
a susceptibility factor in depression. Furthermore, we were interested in the relation
between antidepressant related side effects and ABCB1 polymorphisms. Data on dose-
to-plasma concentrations were not available. We examined the possible association of 6
SNPs (single nucleotide polymorphism) (i,e, three common SNPs and 3 SNPs having
shown a positive association on treatment response15,16) with possible susceptibility
factors for depression. Data from meta analyses suggested that familial aggregation in
MDD was particularly related to ‘early onset’ (often defined as ‘beginning before the
age of 30’) and recurrent episodes (i.e. more than 1 episode).17 For two of SNPs that had
shown to be related to faster response to an antidepressant (with affinity for P-gp)15,16 a
negative association was found for the age of onset, amounting to a smaller change on
MDD starting at young age, for those with the mutation (rs2235040, rs2232583,
rs1045642). Furthermore, an association was found between the haplotype 1236T-
2677T-3435C and recurrent episodes. The Odds ratios were small (0.735-0.785), and
the fact that they were found in a large sample (n=1826), indicate that these
polymorphisms will not be not useful as single indicator in clinical practice.
Nevertheless, the uncovering of associations in ABCB1 and other genes, each
conferring a small effect on the MDD phenotype may help to point out susceptibility
factors in the disorder. Another important finding in the NESDA study was the
association of two ABCB1 polymorphisms rs2235040 and rs2032583 with the incidence
and severity of side effects related to SSRI’s (that are P-gp substrates). Also, a
haplotype, containing the three most common coding SNPs (i.e. 1236C>T, 2677G>T,
3435C>T) and the two SNPs rs2235040 and rs2032583 (1236T-2677T-3435T-
rs2235015G-rs2032583T-2235040G) was found to be associated with occurrence of
adverse effects. Occurrence of anticholinergic and serotonergic adverse effects was also
predicted by these SNPs and haplotype. In particular, these SNPs and haplotype were
associated with sleeplessness. Our results suggest that these polymorphisms may predict
the occurrence of (anticholinergic and serotonergic) side effects in patients who use a
SSRI with affinity for P-gp. The linkage of SNP rs2032583 to the haplotype 1236T-
2677T-3435T may act as a marker of a functional haplotype of ABCB1. Of course,
caution must be exercised with the interpretation of these results, as there are many
controversies on ABCB1 related gene effects.

In chapter 8, which is a sequel to the studies described in chapters 4 and 5, a
comparison was made between two of the presumed explanations of increased cerebral
P-gp activity. In male Wistar rats, we compared the effect of chronic stress and the
effect of chronic administration of venlafaxine to control rats. A 3-week foot shock
procedure was used as a model for human depression. [11C]-verapamil-PET was used to
assess P-gp function in vivo. Venlafaxine exhibits weak to moderate affinity as a P-gp
substrate18,19 and does not modulate cyp3A4, the enzyme involved in [11C]-verapamil
metabolism. Although is was not feasible to perform metabolite analysis in the animals
in this study, we corrected for metabolism by using data on [11C]-verapamil metabolism
from another experiment. To test whether the outcome variable (VT) was influenced
significantly by changes in metabolism, we constructed metabolite curves, either
representing slower or faster metabolism and used these as input for the analysis. Only
slight changes were seen, which made an effect due to metabolite changes less
probable. Both groups differed significantly from their control group: chronic
administration of venlafaxine had led an increased activity of P-gp, the whole brain
being the region-of-interest, while chronic stress gave the opposite effect: cerebral P-gp
activity was significantly decreased. Thus, on the one hand, the findings implicate that
chronic stress (as a model for human depression) cause diminished activity of P-gp,
which is in line with the cytokine hypothesis of depression. In such a model depression
is seen as a neuro-inflammatory event, in which proinflammatory cytokines cause
damage to the BBB and elicit P-gp inhibition,20-22 In case of chronic stress, however, a
few (in vitro) studies suggest that P-gp is increased.23,24 To date, there are no in vivo
studies to confirm any modulatory effect by chronic stress. On the other hand, the
results implicate that chronic administration of a P-gp substrate (venlafaxine) causes an
increase in P-gp function. The effects of both venlafaxine and chronic stress on P-gp
may indicate an up-and downregulatory phenomenon respectively. The studies of Uhr
et al. and Grauer and Uhr may support the idea of upregulation of P-gp after chronic
administration of a P-gp substrate, since they registered (in two different studies) a
significantly decreased brain uptake in wild type mice compared to knock-out mice
(acute effect), that was no longer present in mice after long term administration of
amitriptyline (see figure 10.1).14,25
In chapter 9 the results of chapter 8 are further elaborated. We hypothesized that the
difference in VT due to chronic administration of [11C]-venlafaxine, would be global in
stead of regional, which was the case. P-gp activity was equally distributed throughout
the brain, reflecting a homogenous distribution of cerebral P-gp. P-gp was significantly
higher in the pituitary, both in the control group and venlafaxine treated group, which
fits in the supposition that the pituitary lies outside the BBB.26 The effect of spill-in in
regions adjacent to extracerebral structures caused higher VT’s in both groups. When

these regions (i.e. bulbus, frontopolar lobes, cerebellum, pons, medulla) and pituitary
were excluded from the comparison, VT’s, were comparable with the previous study.
We also examined the regional distribution of [11C]-venlafaxine in rats that underwent
chronic stress and compared this to the control group. As we had found a regional
increase in P-gp activity in patients with a depressive episode, using antidepressants,
we hypothesized to find this in the stress experiment too. The decrease in the stress
group was globally, and again, for both groups higher VT’s were seen in regions
neighbouring non cerebral tissue, and in the pituitary. A comparison between the
human study (chapter 4) and these results may be halted for several reasons. Firstly, the
experiment in rats is only a model for human depression, and secondly, there are many
methodological differences between the two experiments. Besides, in the human
study, only 5 regions, related to the pathophysiology of depression, were chosen for
multiple comparisons, in stead of 18 regions in the rats. If we had chosen these regions
for multiple comparison in the rat experiment, a trend towards a significant decrease
would be seen in hippocampus (p = 0.094) and cortex (p = 0.064). On the basis of these
results, it can not be excluded that P-gp activity is regionally changed (decreased).
Chapter 9 also includes the description of western blot and immunohistochemistry
techniques. The rat brains of the experiments described in chapter 8 were collected
after the PET experiment. The hemispheres were divided, the left hemisphere was snap
frozen, the right was fixed in paraformaldehyde and also cryopreserved. Rat brains
from a neuroinflammation experiment were provided (by Janine Doorduin) for
comparison with the other pathological conditions and controls. Western blot is used
to determine the amount of protein (P-glycoprotein) in brain tissue, and the results can
be correlated with the PET results, reflecting the activity of P-gp in vivo. In this way a
differentiation can be made between increased/decreased pump activity due to up- or
downregulation (i.e. increased or decreased amount of protein) or altered pump activity
without a change in the amount of protein. Immunohistochemistry enables
determination of the amount of protein in specific regions. Accordingly, a comparison
between regional P-gp activity and regional amount of P-gp can be made. At this stage,
the in vitro experiments are in full progress, and results are not available yet.
Concluding remarks and future directions
The protection of the brain by the blood-brain barrier has been regarded as a sanctuary
for many decades. Intensive research in the past several decades has contributed to a
better understanding of the way molecules are transported into the CNS. It has become
clear that the transporter P-glycoprotein is involved in the outward transport of many
molecules that play a role in depressive disorders, although its role for certain
compounds (eg. cortisol) is still debated. Besides, it has been shown that P-gpfunction
can be modulated by many factors, which may also play a role in depressive and
psychotic disorders. Our results suggest that P-gp activity at the BBB is decreased when
exposed to chronic stress (as model for MDD), and that administration of an
antidepressant (a P-gp substrate) increases its function. It is however not clear whether
modulation of P-gp is detrimental or has consequences for drug dosing. P-gp function
may be decreased as a required step in the acute stress response, necessary to allow the
passage of proinflammatory proteins. In the recovery period of a depression the activity
of P-gp may then be at another rate. This hypothetical role in different phases during
the course of a depressive episode may tested with new PET studies. In this case it
would be necessary is to perform PET scans, using different radioligands, aimed at
mapping P-gp activity and inflammation. Maybe a more important development in
PET research in respect to P-gp imaging is the development of a tracer or a method to
study the effect of drug interactions with P-gp. New strategies that could be worked
out are, such as radiolabeling of a new drug candidate after administration of an inhibitor,
or a double PET scan to evaluate the effect of a P-gp modulator.
Another finding presented in this thesis, is the fact that the gene encoding for P-gp
may be related to phenotype. In the first place polymorphisms appeared to be
associated with severe side effects on the SSRIs (venlafaxine, citalopram, paroxetine,
fluvoxamine) that have shown affinity to P-gp. If these findings are replicated, it shall
be a further step towards so called personalized medicine, which involves the
avoidance of unnecessary drug trials. Future goals in this regard are the optimalization
of a predicted drug response for each individual.
Secondly, three ABCB1 polymorphisms were associated with a lower change on early
onset MDD. This finding – if replicated - may contribute in the uncovering of a genetic
profile conferring susceptibility for MDD. More large scale genetic studies may help to
shed more light on the associations between MDD phenotype and ABCB1 and other
genes.

Figure 10.1
Concentration of amitriptyline and its metabolites in various organs in abcb1ab-/- mice (black bars) versus wild type mice (grey bars). At the right, Amitriptyline is once administered 3 hours prior to decapitation, resulting in significantly higher intracerebral concentrations for amitriptyline and its metabolites25 At the left, amitriptyline has been administered for 10 consecutive days, resulting in equal intracerebral concentrations for the parent drug, whereas the intracerebral concentration of metabolite E-10-OH-nortriptyline has increased with roughly
250%.14,2514,2514,2514,25

References 1. Bijl RV, Ravelli A, van Zessen G. (1998) Prevalence of psychiatric disorder in the general
population: results of The Netherlands Mental Health Survey and Incidence Study (NEMESIS).
Soc. Psychiatry Psychiatr. Epidemiol., 33, 587-595.
2. (2008) World Health Organisation. Geneva.
3. Trentani A, Kuipers SD, ter Horst GJ, den Boer JA (2003) In Kasper S, den Boer JA, Sitsen JMA
(eds.), Handbook of depression and anxiety. Marcel Dekker, New York, pp. 349-386.
4. Hasegawa T, Ukai W, Jo DG, Xu X, Mattson MP, Nakagawa M, Araki W, Saito T, Yamada T
(2005) Homocysteic acid induces intraneuronal accumulation of neurotoxic Abeta42:
implications for the pathogenesis of Alzheimer's disease. J. Neurosci. Res., 80, 869-876.
5. Mechan A, Yuan J, Hatzidimitriou G, Irvine RJ, McCann UD, Ricaurte GA (2006)
Pharmacokinetic profile of single and repeated oral doses of MDMA in squirrel monkeys:
relationship to lasting effects on brain serotonin neurons. Neuropsychopharmacology, 31, 339-
350.
6. Kortekaas R, Leenders KL, van Oostrom JC, Vaalburg W, Bart J, Willemsen AT, Hendrikse NH
(2005) Blood-brain barrier dysfunction in parkinsonian midbrain in vivo. Ann. Neurol., 57, 176-
179.
7. Schinkel AH, Smit JJ, van Tellingen O, Beijnen JH, Wagenaar E, van Deemter L, Mol CA, van
der Valk MA, Robanus-Maandag EC, te Riele HP, . (1994) Disruption of the mouse mdr1a P-
glycoprotein gene leads to a deficiency in the blood-brain barrier and to increased sensitivity to
drugs. Cell, 77, 491-502.
8. Löscher W, Potschka H (2005) Role of drug efflux transporters in the brain for drug disposition
and treatment of brain diseases. Prog. Neurobiol., 76, 22-76.
9. Schinkel AH, Wagenaar E, Mol CA, van Deemter L (1996) P-glycoprotein in the blood-brain
barrier of mice influences the brain penetration and pharmacological activity of many drugs. J.
Clin. Invest, 97, 2517-2524.
10. El Ela AA, Hartter S, Schmitt U, Hiemke C, Spahn-Langguth H, Langguth P (2004)
Identification of P-glycoprotein substrates and inhibitors among psychoactive compounds--
implications for pharmacokinetics of selected substrates. J. Pharm. Pharmacol., 56, 967-975.
11. Feng B, Mills JB, Davidson RE, Mireles RJ, Janiszewski JS, Troutman MD, de Morais SM (2008)
In vitro P-glycoprotein assays to predict the in vivo interactions of P-glycoprotein with drugs in
the central nervous system. Drug Metab Dispos., 36, 268-275.
12. Weber CC, Kressmann S, Ott M, Fricker G, Muller WE (2005) Inhibition of P-glycoprotein
function by several antidepressants may not contribute to clinical efficacy. Pharmacopsychiatry,
38, 293-300.
13. Weiss J, Dormann SM, Martin-Facklam M, Kerpen CJ, Ketabi-Kiyanvash N, Haefeli WE (2003)
Inhibition of P-glycoprotein by newer antidepressants. J. Pharmacol. Exp. Ther., 305, 197-204.
14. Grauer MT, Uhr M (2004) P-glycoprotein reduces the ability of amitriptyline metabolites to
cross the blood brain barrier in mice after a 10-day administration of amitriptyline. J.
Psychopharmacol., 18, 66-74.
15. Sarginson JE, Lazzeroni LC, Ryan HS, Ershoff BD, Schatzberg AF, Murphy GM, Jr. (2010)
ABCB1 (MDR1) polymorphisms and antidepressant response in geriatric depression
2. Pharmacogenet. Genomics, 20, 467-475.
16. Uhr M, Tontsch A, Namendorf C, Ripke S, Lucae S, Ising M, Dose T, Ebinger M, Rosenhagen M,
Kohli M, et al. (2008) Polymorphisms in the drug transporter gene ABCB1 predict
antidepressant treatment response in depression. Neuron, 57, 203-209.
17. Sullivan PF, Neale MC, Kendler KS (2000) Genetic epidemiology of major depression: review
and meta-analysis. Am. J. Psychiatry, 157, 1552-1562.
18. Doran A, Obach RS, Smith BJ, Hosea NA, Becker S, Callegari E, Chen C, Chen X, Choo E,
Cianfrogna J, et al. (2005) The impact of P-glycoprotein on the disposition of drugs targeted for

indications of the central nervous system: evaluation using the MDR1A/1B knockout mouse
model. Drug Metab Dispos, 33, 165-174.
19. Uhr M, Grauer MT, Holsboer F (2003) Differential enhancement of antidepressant penetration
into the brain in mice with abcb1ab (mdr1ab) P-glycoprotein gene disruption. Biol. Psychiatry,
54, 840-846.
20. Bauer B, Hartz AM, Fricker G, Miller DS (2005) Modulation of p-glycoprotein transport
function at the blood-brain barrier. Exp. Biol. Med. (Maywood. ), 230, 118-127.
21. Schiepers OJ, Wichers MC, Maes M (2005) Cytokines and major depression. Prog.
Neuropsychopharmacol. Biol. Psychiatry, 29, 201-217.
22. Wichers M, Maes M (2002) The psychoneuroimmuno-pathophysiology of cytokine-induced
depression in humans. Int. J. Neuropsychopharmacol., 5, 375-388.
23. Bauer B, Hartz AM, Miller DS (2007) Tumor necrosis factor alpha and endothelin-1 increase P-
glycoprotein expression and transport activity at the blood-brain barrier. Mol. Pharmacol., 71,
667-675.
24. Tan KH, Purcell WM, Heales SJ, McLeod JD, Hurst RD (2002) Evaluation of the role of P-
glycoprotein in inflammation induced blood-brain barrier damage. Neuroreport, 13, 2593-2597.
25. Uhr M, Steckler T, Yassouridis A, Holsboer F (2000) Penetration of amitriptyline, but not of
fluoxetine, into brain is enhanced in mice with blood-brain barrier deficiency due to mdr1a P-
glycoprotein gene disruption. Neuropsychopharmacology, 22, 380-387.
26. Al Hadithy AF, Wilffert B, Bruggeman R, Brouwers JR (2008) The impact of MDR1
polymorphisms on prolactin concentrations in patients treated with risperidone. Prog.
Neuropsychopharmacol. Biol. Psychiatry, 32, 593-594.


Nederlandse samenvatting
algemene discussie en conclusie


Het doel van dit proefschrift is het onderzoek van de mogelijke rol van de eiwitpomp
P-glycoproteïne (P-gp), dat aanwezig is in de bloed-hersenbarrière (BHB) in depressie
en schizofrenie.
Zowel depressie (MDD, Major Depressive Disorder) als schizofrenie zijn ernstige
psychiatrische stoornissen, die wereldwijd voorkomen en gekenmerkt worden door een
chronisch beloop.
Schizofrenie is vaak een invaliderende ziekte, die gekenmerkt wordt door terugkerende
psychotische episoden en afname van cognitieve en sociale vaardigheden. Vaak treedt
er verlies van zowel sociale als maatschappelijke rollen. Afwijkingen in de normale
ontwikkeling van het zenuwstelsel en ook genetische factoren kunnen een rol spelen in
het ontstaan van deze ziekte.
Depressie wordt beschouwd als een heterogene stoornis, waarbij verscheidene
biologische afwijkingen een rol kunnen spelen in het symptomencomplex. De ‘life
time’ prevalentie van depressie in Nederland is ongeveer 15%, terwijl de
eenjaarsprevalentie in 1998 5.8% was.1 Volgens een WHO rapport staat depressie qua
omvang en leed tegenwoordig wereldwijd op de derde plaats.2 Ondanks intensief
wetenschappelijk onderzoek sinds de laatste decennia, zijn kennis over het ontstaan en
oorzaken van de ziekte grotendeels nog onopgehelderd. Wel is bekend dat genetische
factoren en psychotrauma’s in de kinderleeftijd een rol kunnen spelen.
Wat betreft de onderliggende ziekteverschijnselen, geldt voor beide stoornissen dat
sprake is van ontstekingsreacties in het centrale zenuwstelsel. Stressvolle
gebeurtenissen kunnen leiden tot aan stress gerelateerde stoornissen (zoals depressie).
Ook bij schizofrenie speelt stress een belangrijke rol. Ten gevolge van stressreacties
kunnen allerlei veranderingen optreden in het brein, zoals veranderingen in de
plasticiteit van zenuwcellen, afname van nieuwvorming van zenuwweefsel en
ontstekingsverschijnselen in het brein.3 Een mogelijke verklaring voor het ontstaan van
beide ziekten wordt gevormd door de hypothese dat ontstekingsreacties in het brein
ontstaan door schadelijke stoffen die (onder invloed van stress) het brein
binnendringen. Deze kunnen vervolgens bijdragen aan het ontstaan van
neurodegeneratie (stoornissen waarbij sprake is van verlies of achteruitgang van
mentale functies, waartoe zowel depressie als schizofrenie soms worden gerekend).
Ophoping van schadelijke stoffen in het brein kan optreden als gevolg van een
verminderde functie van de BHB.4,5 Een PET-studie (positron emission tomography, dit
is functioneel beeldvormend onderzoek) bij mensen met de ziekte van Parkinson
ondersteunt deze theorie.6 In deze studie vond men een afgenomen pompfunctie van
P-gp, een belangrijke pomp in de BHB, die vanuit het hersenweefsel moleculen

terugpompt in de bloedbaan. Deze verminderde pompfunctie was gelokaliseerd in
hetzelfde hersengebied gelokaliseerd als de ziekte van Parkinson.
De BHB is aanwezig in de kleinste bloedvaatjes van de hersenen (capillairen). Deze
capillairen zijn zo gebouwd dat vrijwel geen enkel molecuul doorgelaten wordt. De
vaatwandcellen hebben nauwelijks openingen en zitten tegen elkaar aangekit door
speciale strengen "tight junctions”). Kleinere moleculen kunnen door diffusie het brein
binnenkomen. Mogelijk schadelijke stoffen, zowel lichaamseigen als lichaamsvreemde,
worden door naar buiten gerichte pompen (effluxpompen) teruggepompt in de
bloedbaan. P-glycoproteïne is de belangrijkste effluxpomp in de BHB. P-gp wordt door
het ABCB1-gen gecodeerd. Deze pomp heeft een enorme capaciteit, maar het meest
opmerkelijke aan deze pomp is dat het talloze geheel verschillende moleculen kan
transporteren.7 Een afgenomen (P-gp)pompfunctie, bijvoorbeeld door een
farmacologische remmer, kan leiden tot een sterk toegenomen hersenopname van
moleculen die door P-gp getransporteerd worden (‘substraten’).8,9
Wij veronderstelden dat de functie van P-gp veranderd zou zijn bij mensen met een
depressie en schizofrenie, mogelijk ten gevolge van de ontstekingsreactie in het brein.
In de eerste studie (hoofdstuk 4) werd de functie van P-gp onderzocht in 13 mensen
met een depressie. Allen gebruikten een antidepressivum. De groep werd vergeleken
met een qua leeftijd en sexe gematchte controlegroep. [11C]-verapamil werd gebruikt
als tracer. Het distributievolume (VT) werd gebruikt als maat voor de activiteit van P-
gp. Er werd bloed afgenomen voor genetisch onderzoek. Eventuele genvariatie van drie
veel voorkomende polymorfismen (van ABCB1) werden als covariaat van het
distributievolume geanalyseerd. Zowel een statische (region-of-interest) als
dynamische analyse (voxelwise analysis) werd gedaan, deze laatste met behulp van het
programma SPM2 (“statistical parametric mapping”), om de regionale P-gp functie te
bepalen. We vonden een significante verlaging van het distributievolume, hetgeen
correspondeert met een toegenomen functie van P-gp. Deze bevinding werd gedaan
met beide methoden, en was met name gelokaliseerd in de prefrontale schors en
temporale kwabben, gebieden die beiden geassocieerd zijn met depressie. We vonden
geen relatie met variatie in genotype, hetgeen ook niet te verwachten was in zo’n
kleine groep. In een posthoc analyse bleek dat 7 patiënten een therapie resistente
depressie (TRD) hadden. Een vergelijking tussen de zo ontstane subgroepen (TRD
versus non-TRD) liet geen verschillen zien, maar was formeel ook niet mogelijk omdat
de groepen niet gematcht waren. Daarmee kon de mogelijkheid van bias van de
resultaten door therapieresistentie niet weerlegd worden. Het was dus mogelijk dat de
toegenomen P-gp activiteit gerelateerd was aan therapieresistentie, hetgeen zeer
belangwekkend zou zijn, aangezien hiermee een verklaring voor therapieresistente
depressie gegeven kon worden: doordat P-gp activiteit toegenomen was, kon het

antidepressivum onvoldoende werkzaam kunnen zijn in de hersenen, omdat het in
versterkte mate uitgepompt werd door P-gp. De studie kende verschillende
tekortkomingen. In de eerste plaats was geen metabolietanalyse verricht, hetgeen de
interpretatie van de resultaten bemoeilijkt. Zonder deze inputfunctie kan niet worden
uitgesloten dat de verschillen tussen de groepen veroorzaakt worden door verschillen
in metabolisme van de tracer. In hoofdstuk 4 beargumenteren we waarom we
aannemen dat metabolisme geen belangrijke invloed heeft gehad op de activiteit van P-
gp. Een andere belangrijke beperking van de studie betrof het gebruik van
verschillende antidepressiva en andere farmaca bij de onderzoeksgroep. Van sommige
farmaca kon niet worden uitgesloten worden dat ze de P-gp activiteit beïnvloedden. In
hoofdstuk 5 werd hetzelfde protocol gebruikt om de in vivo functie van P-gp in
schizofrenie te bepalen. Dit is gedaan in 10 patienten en 10 gematchte
controlepersonen. De resultaten kwamen in sterke mate overeen met de resultaten van
de depressiestudie, al was het resultaat van de dynamische analyse alleen significant
wanneer de analyse alleen de gebieden van potentieel belang betrof (“small volume
corrrection”). De resultaten uit beide studies suggereerden dat sprake was van een
regionale toename van P-gp activiteit, hetgeen theoretisch zou kunnen passen bij de
ziekte, m.a.w. de lokaal verhoogde activiteit van de pomp zou een ziektekenmerk (bijv.
een ontstekingsreactie) kunnen zijn. Ook zou de verhoogde activiteit te verklaren
kunnen zijn door het gebruik van medicatie. We hadden weliswaar het gebruik van
medicatie met een duidelijk remmende werking op P-gp uitgesloten voor deelnemers
aan de studie, zowel antidepressiva als antipsychotica blijken echter in celstudies lage
tot matige activiteit te hebben voor P-gp. Bovendien blijken sommige middelen ook
nog een remmend effect op P-gp te kunnen hebben in zulke celstudies.10-13 Het is niet
bekend of dit effect ook in de mens zal kunnen optreden, en waarschijnlijk is het effect
te verwaarlozen, omdat het remmende effect in deze cellijnen (modellen voor de BHB)
pas optrad bij concentraties die ver boven het therapeutische niveau lagen.12 Toch is
het niet geheel uit te sluiten dat medicatie de verschillen in P-gp activiteit
veroorzaakte. In een diermodel (muizen) toonden Grauer en Uhr aan dat langdurige
toediening van amitriptyline ( een antidepressivum met een zwak tot matige affiniteit
voor P-gp) geen verschil in concentratie gaf in de hersenen bij muizen zonder P-gp in
de hersenen (“knock out” model) ten opzichte van genetisch normale muizen (“wild
type”), terwijl de metabolieten van amitriptyline juist in sterke mate waren opgehoopt
in de hersenen bij het knock out model.14
De gevonden effecten op de activiteit van P-gp door zowel medicatie als depressie,
stress en psychose (zie hoofdstuk 4,5, en 8) kunnen ook beïnvloed zijn door genetische
variatie. Alhoewel we in de humane PET studies geen aanwijzingen vonden voor
genveranderingen in drie polymorfismen (3435T>C, 2677G>T/A, -129T>C), is daarmee
nog geen uitspraak te doen over een relatie tussen de gevonden P-gp veranderingen in

functie en genvariatie, omdat de getoetste sample veel te klein was. De literatuur
betreffende de relatie tussen het ABCB1 gen en fenotype is alles behalve eensluidend.
In de hoofdstukken 6 en 7 presenteren we de resultaten van de NESDA studie
(NEtherlands Study on Depression and Anxiety). DE NESDA studie is een groot
multicenter cohort onderzoek, dat de lange termijn uitkomsten van depressie ( en
angststoornissen) onderzoekt, zoals deze stoornissen zich in de algemene populatie
voordoen. Op basis van de resultaten, gepresenteerd in hoofstuk 4,5 en 8, namelijk dat
sprake is van een verlaagde activiteit van P-gp in depressie, was onze hypothese dat
genetische variatie van het ABCB1 gen geassocieerd zou kunnen zijn met een
verhoogde kwetsbaarhied voor het ontstaan van depressie, ofwel het beloop van
depressie. Verder waren we geïnteresseerd in de mogelijke relatie tussen ABCB1
polymorfismen en bijwerkingen op antidepressiva (P-gp substraten). We onderzochten
de mogelijke associatie van 6 SNPs (single nucleotide polymorphisms) met mogelijke
kwetsbaarheidsfactoren voor depressie. Drie veel voorkomende SNPs en drie
polymorfismen, voor welk een relatie was aangetoond met respons op antidepressieve
behandeling bij depressie25,26 werden geanalyseerd. Data uit meta-analyses hebben laten
zien dat familiair voorkomen van depressie met name voorspeld kan worden door het
voorkomen van recidiverende depressieve episoden (het voorkomen van meer dan een
episode) en een vroeg ontstaan van de ziekte (beginleeftijd voor het 30e jaar).27 Voor 2
van de onderzochte SNPs (rs2235040 en rs 2032583) vonden we een negatieve
associatie met het vroeg ontstaan van depressie, hetgeen impliceert dat een persoon
met het recessieve allel van een van deze SNPs beschermd is tegen het vroeg optreden
van depressie. Voor 3435CC vonden we een zelfde verband, dat niet significant was na
correctie voor het aantal tests. Er werd ook een significant verband gevonden tussen
het haplotype 1236T-2677T-3435C en het aantal recidief depressies. De Odds ratio’s
waren klein (0.735 – 0.785), hetgeen aangeeft dat deze polymorfismen niet bruikbaar
zijn als enkele indicator voor het bepalen van kwetsbaarheid in een individu. De
gevonden verbanden hebben elk afzonderlijk een kleine invloed op het fenotype.
Niettemin is het vinden van dergelijke associaties van groot belang voor het verder in
kaart brengen van kwetsbaarheidsfactoren van de depressieve stoornis.
Een andere belangrijke bevinding in de studie met de NESDA, beschreven in hoofdstuk
7, was de associatie tussen twee ABCB1 polymorfismen (rs2235040 en rs2032583) en
het optreden (incidentie) en de ernst van bijwerkingen gelateerd aan SSRIs (selectieve
serotonine heropnameremmers), die affiniteit hebben voor P-gp. De twee SNPs
voorspelden ook significant de ernst van anticholinerge en serotonerge bijwerkingen.
De relatieve overrepresentatie van paroxetine (>35%) in de sample kan verklaren
waarom een relatie gevonden werd met anticholinerge bijwerkingen. Een
verklaringsmechanisme kon ook voorspeld worden in paroxetine (n=110), een SSRI
met meer anticholinerge bijwerkingen dan andere SSRI’s, hetgeen mede kan verklaren
dat juist op dit middel een verband gevonden wordt. Voor venlafaxine, dat minder

anticholinerge werking heeft dan paroxetine, vonden we een significante trend naar
een verband tussen anticholinerge bijwerkingen en rs2235040 en rs2032583. Voor
citalopram, dat vrijwel geen anticholinerge bijwerkingen heeft, werd geen effect
gevonden. Onze resultaten suggereren een verband tussen het optreden en ernst van
(anticholinerge) bijwerkingen op SSRI’s (indien P-gp substraat) en ABCB1
genpolymorfismen. De vele tegenstrijdige resultaten tot op heden manen tot
voorzichtigheid in de interepretatie van onze bevindingen.
In hoofdstuk 8 wordt een dierstudie beschreven, waarin we zoeken naar de verklaring
van de resultaten beschreven in hoofdstuk 4 en 5. De regionale verhoging van P-gp
activiteit zou verklaard kunnen worden door de stoornis (i.e. stress als
pathofysiologisch mechanisme) of door het gebruik van medicatie. In verschillende
groepen ratten vergeleken we (ten opzichte van een controlegroep) het effect van
chronische stress en het effect van langdurig gebruik van het antidepressivum
venlafaxine. Met een procedure, waarbij ratten gedurende 3 weken werden
blootgesteld aan elektrische schokken, werd een depressie nagebootst. [11C]-verapamil-
PET werd gebruikt om de activiteit van P-gp in vivo te bepalen. Venlafaxine heeft
zwakke tot matige affiniteit voor P-gp15,16 en heeft geen modulerende invloed op
cyp3A4, het enzym dat grotendeels [11C]-verapamil metaboliseert. Alhoewel het niet
mogelijk was in de proefdieren een metabolietanalyse te verrichten, werd in deze
studie gecorrigeerd voor het metabolisme door [11C]-verapamil metabolisme data te
gebruiken van een andere studie. We hebben hierbij gekeken naar eventuele gevolgen
van veranderingen in het metabolisme door de metabolietcurve te manipuleren. Het
bleek dat een iets langzamer of iets sneller metabolisme geen grote veranderingen op
de uitkomstmaat (VT) had, hetgeen het onwaarschijnlijk maakte dat de verschillen
tussen de groepen ratten zouden berusten op verschillen in metabolisme. In beide
experimenten waren significante verschillen tussen de groepen te zien. In de groep
ratten die venlafaxine ontvingen, werd een significante toename van P-gp gezien,
terwijl chronische stress juist leidde tot een significante verlaging van P-gp. De
verschillen werden gezien op ‘whole brain’ niveau. De betekenis van deze bevindingen
is dat chronische stress (als model voor depressie) leidt tot een verminderde
pompfunctie van P-gp, hetgeen ondersteund wordt door de ‘cytokine hypothese’ in
depressie. Hierin wordt depressie gezien als resultante van een ontstekingsreactie in het
centrale zenuwstelsel. Ontstekingsbevorderende eiwitten veroorzaken hierbij schade
aan de BHB en zorgen voor remming van P-gp.17-19 In enkele in vitro studies zijn
aanwijzingen gevonden voor een toename van de P-gp activiteit door chronische
stress.20,21 Er zijn echter geen in vivo studies die deze hypothese kunnen bevestigen.
Onze studie is de eerste in dit opzicht, waarin een verband gezien wordt tussen
chronische stress en verandering van de P-gp activiteit. Aan de veranderde activiteit in
zowel chronische stress en na chronische toediening van venlafaxine kan

respectievelijk een af- of toename van de hoeveelheid P-glycoproteïne ten grondslag
liggen, zgn. down- of upregulatie. De studies van Uhr et al. en Grauer en Uhr
ondersteunen deze gedachte. In twee studies toonden zij aan dat een enkele gift
amitriptyline (een P-gp substraat) in muizen leidde tot een significant verlaagde
hersenopname in genetisch normale muizen (wild type) ten opzichte van muizen die
P-gp misten (‘ABCB1a -/- knock out’ muizen). Wanneer echter gedurende 10 dagen
amitriptyline toegediend werd, werd geen verandering meer gezien tussen beide
groepen in de concentratie amitriptyline in de hersenen (zie figuur 10.1).14,22
In hoofdstuk 9 worden de resultaten van hoofdstuk 8 verder uitgewerkt. We
veronderstelden dat chronische toediening van [11C]-venlafaxine niet zou leiden tot
regionale verschillen in distributievolume (VT) (als maat voor P-gp activiteit, het VT is
omgekeerd evenredig met de P-gp activiteit), maar dat de verschillen alleen globaal
zouden zijn, hetgeen inderdaad het geval was: in alle regio’s werd een vergelijkbare
afname van VT gevonden. Het VT was in de hypofyse veel hoger in beide groepen,
hetgeen een bevestiging is van de veronderstelling dat de hypofyse ‘buiten’ de bloed-
hersen barrière ligt.23 Daarnaast was sprake van toegenomen VT waarden in de
gebieden grenzend aan niet-hersenweefsel, dat niet door verlaagde P-gp activiteit
verklaard werd, maar als gevolg van ‘overstraling’ uit deze gebieden gezien werd.
Wanneer deze perifere gebieden (i.e. bulbus, frontopolaire kwabben, cerebellum, pons,
medulla) niet in de analyse werden meegenomen, waren de distributievolumes
vergelijkbaar met de resultaten zoals in hoofdstuk 8 beschreven.
We onderzochten ook de regionale verdeling van [11C]-venlafaxine in ratten, die
blootsgesteld waren aan chronische stress en vergeleken dit met de controlegroep. Een
regionaal verschil in distributievolume zoals in de depressiestudie werd niet gevonden,
er was sprake van een algemene verhoging van VT (passend bij een verlaging van P-gp
functie) en net als bij de venlafaxinestudie werd er verhoogde activiteit gemeten in de
perifere gebieden en in de hypofyse, die geen P-gp in haar capillairen heeft. Een
vergelijking met de humane (depressie)studie gaat echter op verschillende fronten
mank: ten eerste, is het stressexperiment bij ratten een model voor humane depressie,
en zodoende nooit geheel vergelijkbaar. In de humane studie werden bovendien slechts
5 gebieden (gerelateerd aan psychopathologie) geselecteerd voor vergelijking, in plaats
van de 18 gebieden bij de rat. Als we deze gebieden ook in het rattenexperiment
gekozen hadden voor multipele vergelijking, zou sprake zijn van een trend naar
significante verhoging van VT in hippocampus (p = 0.094) en cortex (p = 0.064). Op
basis van deze studie kan daarom niet uitgesloten worden dat sprake is van een
regionale veranderingen (verlaging) in P-gp activiteit t.g.v. stress.
Hoofdstuk 9 bevat ook een beschrijving van experimenten met het hersenweefsel van
ratten, die na de studie (hoofdstuk 8) getermineerd werden. Het betreft de ‘Western

Blot’, een techniek, waarbij de hoeveelheid eiwit (in dit geval P-glycoproteïne) bepaald
kan worden. Met deze techniek is het mogelijk te onderzoeken of verschil in
pompactiviteit berust op een verschil in het aantal pompjes (up- of downregulatie). Een
andere nog toe te passen techniek is ‘immunohistochemie’, die ook regionale
verschillen in eiwithoeveelheid kan aantonen. In dit stadium zijn de analyses niet
afgerond, en is definitieve bespreking van de resultaten nog voorbarig. Wel kan gezegd
worden dat de voorlopige resultaten de resultaten van de PET analyses ondersteunen:
de veranderde functie van P-gp gaat samen met een veranderde expressie van het eiwit
in het brein.
Concluderende opmerkingen en richting voor verder onderzoek
De bloed-hersen-barrière (BHB) is lange tijd beschouwd als een rigide structuur om het
brein, die passage van vele stoffen onmogelijk maakte. Intensief onderzoek in de laatste
decennia heeft bijgedragen aan een beter inzicht in de manier waarop het transport van
moleculen via de BHB verloopt.
Duidelijk is dat P-glycoproteïne als transporteiwit betrokken is bij het terugwaartse
transport (van brein naar bloedbaan) van vele moleculen, die ook bij depressie een rol
spelen. In sommige gevallen is niet geheel opgehelderd welke rol P-glycoproteïne
speelt bij het transport van een bepaald substraat speelt, zoals bij cortisol bij voorbeeld.
Verder is aangetoond dat de P-gp functie gemoduleerd kan worden door vele factoren,
zoals ook factoren die een rol spelen bij psychotische en depressieve stoornissen. Onze
resultaten wijzen op een verlaging van P-gp activiteit in de BHB bij blootstelling aan
chronische stress in ratten, (als model voor depressie) en toediening van een
antidepressivum ( een P-gp substraat) doet de functie van P-gp toenemen. Het is niet
bekend of zulk een verandering pompfunctie op een of andere manier nadelig is, of dat
het consequenties heeft voor de dosis van een antidepressivum. Het is mogelijk dat
verlaging van de activiteit van P-gp in de acute fase van de stressreactie, zoals bij de
depressieve stoornis, nodig is om passage van pro-inflammatoire eiwitten mogelijk te
maken. In de chronische fase of in de herstelfase van een depressieve episode kan de
activiteit van P-gp anders zijn. Deze hypothetische functie van P-gp in verschillende
fasen van een ziekteproces kan onderzocht worden in nieuwe PET studies, door
gebruik te maken van verschillende liganden, die zowel inflammatie als P-gp activiteit
in kaart kunnen brengen. Nieuwe strategieën kunnen worden uitgewerkt, zoals het
labelen van nieuwe potentiële medicijnen, na toediening van een P-gp remmer, of
dubbele PET scans, voor en na toediening van een modulator.
Een andere belangrijke bevinding die in dit proefschrift wordt gepresenteerd, is de
relatie tussen het depressiefenotype en het gen dat codeert voor P-gp. Ten eerste
bleken ABCB1 polymorfismen geassocieerd te zijn met het optreden en de ernst van
bijwerkingen op SSRIs (venlafaxine, citalopram, paroxetine, fluvoxamine), die
getransporteerd worden door P-gp. Als deze bevindingen gerepliceerd worden, is het

een stapje vooruit in de richting van de zogenaamde gepersonaliseerde geneeskunde,
hetgeen impliceert dat onnodige medicatie trials worden vermeden, en een
medicatiekeuze zoveel mogelijk gebaseerd is op het genetische profiel van de patient.
Toekomstige doelen in dit opzicht zijn optmalisatie van het voorspelde effect van
medicatie voor iedere gebruiker. Ook dienen mogelijke epigenetische veranderingen
in het P-gp molecuul bestudeerd te worden.
Ten tweede, drie ABCB1 polymorfismen waren geassocieerd met een lagere kans op
een vroeg begin van de depressieve stoornis. Een haplotype was geassocieerd met
recidief depressie. Deze bevindingen - mits gerepliceerd - kunnen bijdragen aan
blootleggen van het genetisch profiel dat kwetsbaarheid voor depressie beschrijft. Om
hier meer inzicht in te krijgen, zijn meer grootschalige studies nodig, die licht kunnen
werpen op de relatie tussen het depressiefenotype en ABCB1 en andere genen.

References
1. Bijl RV, Ravelli A, van Zessen G. (1998) Prevalence of psychiatric disorder in the general
population: results of The Netherlands Mental Health Survey and Incidence Study (NEMESIS).
Soc. Psychiatry Psychiatr. Epidemiol., 33, 587-595.
2. (2008) World Health Organisation. Geneva.
3. Trentani A, Kuipers SD, ter Horst GJ, den Boer JA (2003) In Kasper S, den Boer JA, Sitsen JMA
(eds.), Handbook of depression and anxiety. Marcel Dekker, New York, pp. 349-386.
4. Hasegawa T, Ukai W, Jo DG, Xu X, Mattson MP, Nakagawa M, Araki W, Saito T, Yamada T
(2005) Homocysteic acid induces intraneuronal accumulation of neurotoxic Abeta42:
implications for the pathogenesis of Alzheimer's disease. J. Neurosci. Res., 80, 869-876.
5. Mechan A, Yuan J, Hatzidimitriou G, Irvine RJ, McCann UD, Ricaurte GA (2006)
Pharmacokinetic profile of single and repeated oral doses of MDMA in squirrel monkeys:
relationship to lasting effects on brain serotonin neurons. Neuropsychopharmacology, 31, 339-
350.
6. Kortekaas R, Leenders KL, van Oostrom JC, Vaalburg W, Bart J, Willemsen AT, Hendrikse NH
(2005) Blood-brain barrier dysfunction in parkinsonian midbrain in vivo. Ann. Neurol., 57, 176-
179.
7. Schinkel AH, Smit JJ, van Tellingen O, Beijnen JH, Wagenaar E, van Deemter L, Mol CA, van
der Valk MA, Robanus-Maandag EC, te Riele HP, . (1994) Disruption of the mouse mdr1a P-
glycoprotein gene leads to a deficiency in the blood-brain barrier and to increased sensitivity to
drugs. Cell, 77, 491-502.
8. Löscher W, Potschka H (2005) Role of drug efflux transporters in the brain for drug disposition
and treatment of brain diseases. Prog. Neurobiol., 76, 22-76.
9. Schinkel AH, Wagenaar E, Mol CA, van Deemter L (1996) P-glycoprotein in the blood-brain
barrier of mice influences the brain penetration and pharmacological activity of many drugs. J.
Clin. Invest, 97, 2517-2524.
10. El Ela AA, Hartter S, Schmitt U, Hiemke C, Spahn-Langguth H, Langguth P (2004)
Identification of P-glycoprotein substrates and inhibitors among psychoactive compounds--
implications for pharmacokinetics of selected substrates. J. Pharm. Pharmacol., 56, 967-975.
11. Feng B, Mills JB, Davidson RE, Mireles RJ, Janiszewski JS, Troutman MD, de Morais SM (2008)
In vitro P-glycoprotein assays to predict the in vivo interactions of P-glycoprotein with drugs in
the central nervous system. Drug Metab Dispos., 36, 268-275.
12. Weber CC, Kressmann S, Ott M, Fricker G, Muller WE (2005) Inhibition of P-glycoprotein
function by several antidepressants may not contribute to clinical efficacy. Pharmacopsychiatry,
38, 293-300.
13. Weiss J, Dormann SM, Martin-Facklam M, Kerpen CJ, Ketabi-Kiyanvash N, Haefeli WE (2003)
Inhibition of P-glycoprotein by newer antidepressants. J. Pharmacol. Exp. Ther., 305, 197-204.
14. Grauer MT, Uhr M (2004) P-glycoprotein reduces the ability of amitriptyline metabolites to
cross the blood brain barrier in mice after a 10-day administration of amitriptyline. J.
Psychopharmacol., 18, 66-74.
15. Doran A, Obach RS, Smith BJ, Hosea NA, Becker S, Callegari E, Chen C, Chen X, Choo E,
Cianfrogna J, et al. (2005) The impact of P-glycoprotein on the disposition of drugs targeted for
indications of the central nervous system: evaluation using the MDR1A/1B knockout mouse
model. Drug Metab Dispos, 33, 165-174.
16. Uhr M, Grauer MT, Holsboer F (2003) Differential enhancement of antidepressant penetration
into the brain in mice with abcb1ab (mdr1ab) P-glycoprotein gene disruption. Biol. Psychiatry,
54, 840-846.
17. Bauer B, Hartz AM, Fricker G, Miller DS (2005) Modulation of p-glycoprotein transport
function at the blood-brain barrier. Exp. Biol. Med. (Maywood. ), 230, 118-127.
18. Schiepers OJ, Wichers MC, Maes M (2005) Cytokines and major depression. Prog.
Neuropsychopharmacol. Biol. Psychiatry, 29, 201-217.

19. Wichers M, Maes M (2002) The psychoneuroimmuno-pathophysiology of cytokine-induced
depression in humans. Int. J. Neuropsychopharmacol., 5, 375-388.
20. Bauer B, Hartz AM, Miller DS (2007) Tumor necrosis factor alpha and endothelin-1 increase P-
glycoprotein expression and transport activity at the blood-brain barrier. Mol. Pharmacol., 71,
667-675.
21. Tan KH, Purcell WM, Heales SJ, McLeod JD, Hurst RD (2002) Evaluation of the role of P-
glycoprotein in inflammation induced blood-brain barrier damage. Neuroreport, 13, 2593-2597.
22. Uhr M, Steckler T, Yassouridis A, Holsboer F (2000) Penetration of amitriptyline, but not of
fluoxetine, into brain is enhanced in mice with blood-brain barrier deficiency due to mdr1a P-
glycoprotein gene disruption. Neuropsychopharmacology, 22, 380-387.
23. Al Hadithy AF, Wilffert B, Bruggeman R, Brouwers JR (2008) The impact of MDR1
polymorphisms on prolactin concentrations in patients treated with risperidone. Prog.
Neuropsychopharmacol. Biol. Psychiatry, 32, 593-594.
24. Leschziner GD, Andrew T, Pirmohamed M, Johnson MR (2007) ABCB1 genotype and PGP
expression, function and therapeutic drug response: a critical review and recommendations for
future research. Pharmacogenomics. J., 7, 154-179.
25. Sarginson JE, Lazzeroni LC, Ryan HS, Ershoff BD, Schatzberg AF, Murphy GM, Jr. (2010)
ABCB1 (MDR1) polymorphisms and antidepressant response in geriatric depression
2. Pharmacogenet. Genomics, 20, 467-475.
26. Uhr M, Tontsch A, Namendorf C, Ripke S, Lucae S, Ising M, Dose T, Ebinger M, Rosenhagen M,
Kohli M, et al. (2008) Polymorphisms in the drug transporter gene ABCB1 predict
antidepressant treatment response in depression. Neuron, 57, 203-209.
27. Sullivan PF, Neale MC, Kendler KS (2000) Genetic epidemiology of major depression: review
and meta-analysis. Am. J. Psychiatry, 157, 1552-1562.


Dankwoord


Eind 2004 klopte ik bij Hans den Boer aan met een vaag idee iets met cocaïneverslaving
en beeldvorming te doen. Ik stapte de deur uit met een protocol over P-glycoproteine en
raakte al gauw enthousiast. Aanvankelijk deed Meyke Roosink als masterstudente al het
werk en keek ik vooral mee over haar schouder. Vanaf november 2005 werd ik door de
directie van GGZ Drenthe een dag per week vrijgesteld voor onderzoek en vanaf die tijd is
het onderzoek voor mij echt gaan lopen. Nu, 6 jaar later en 6 studies verder, kan ik zeggen
dat het promotietraject me meer dan waard is geweest. Ik kan wel zeggen dat
wetenschappelijk onderzoek mijn hart gestolen heeft. Het heeft me echter veel moeite
gekost om naast het klinische werk en het gezinsleven tot de verdieping te komen die
nodig is voor het analyseren van het onderzoeksmateriaal en het schrijven van artikelen.
Ik besef dat ik het absoluut niet alleen had kunnen voltooien. Ik wil daarom een ieder
bedanken, die geholpen heeft bij de totstandkoming van dit proefschrift.
Allereerst wil ik mijn promotoren Hans den Boer en Rudi Dierckx bedanken. Hans, jij
bent op alle cruciale momenten in het onderzoek aanwezig geweest. Je hebt de weg voor
me geplaveid, zodat ik bij verschillende afdelingen onderzoek kon doen. Dank voor het
vertrouwen en de goede momenten die we hadden. Ik hoop op een voortzetting van onze
samenwerking in de toekomst. Rudi, dank voor de ruimte die je me gaf om bij NGMB
onderzoek te doen. Dank ook voor je interesse en je aanbod in de toekomst een vervolg te
geven aan de studies.
Ook mijn copromotoren Fokko Bosker en Antoon Willemsen wil ik van harte bedanken.
Fokko, jij hebt een ongelofelijk enthousiasme en optimisme. Er zijn heel wat momenten
geweest dat je me hebt weten op te peppen als het tegenzat. Je bent gedurende het hele
onderzoek enorm betrokken geweest. Ik ben je erg gaan waarderen. En je kunt echt
heerlijk koken. Antoon, wat fijn dat jij ook copromotor geworden bent. Ondanks de
eeuwige drukte, wist je de kalmte en rust te bewaren en had je altijd tijd voor me. Ik
bewonder je om je scherpe inzicht en heldere adviezen. Als ik totaal was vastgelopen, wist
jij in een mum van tijd de problemen op te lossen.
Heel veel dank ben ik verschuldigd aan de Raad van Bestuur en de directie van GGZ
Drenthe. Door jullie is de mogelijkheid van promotieonderzoek gecreëerd. In het
bijzonder wil ik Nelie Schouten noemen. Nelie, je draagt onderzoek een warm hart toe. Je
bent steeds vol lof en vertrouwen geweest. Dank daarvoor. Het is een zeer genereus
aanbod geweest, dat gezien de noodzakelijke bezuinigen in de GGZ in de toekomst helaas
(waarschijnlijk) niet meer door collega’s benut kan worden. Dat is te betreuren, omdat
juist binnen de klinische setting onderzoek zo belangrijk is. Ik hoop hier in de toekomst in
GGZ Drenthe hier ook een bijdrage aan te kunnen leveren. De plannen liggen al klaar!
In de humane studies was Meyke Roosink de wegbereider. Dankzij jou had ik een
vliegende start. Ook veel steun heb ik gehad van Anna Bartels, die ervarener was en mij
steeds kon uitleggen hoe ik praktisch te werk moest gaan. De dierstudie was niet mogelijk

geweest zonder de samenwerking met de faculteit biologie. De samenwerking tussen Peter
Meerlo en Aren van Waarde is hierin cruciaal geweest. Anniek Visser en Tim de Jager
hebben het uitvoerende werk gedaan in Haren en bij NGMB. Ook de ondersteuning van
Janine Doorduin en Jurgen Sijbesma op NGMB en van Girste Dagyte en Folkert Postema
in Haren is van groot belang geweest. De inzet en behulpzaamheid van secretaresses en de
MNW-ers, die niet altijd de meest makkelijke patiënten kregen, heb ik steeds
gewaardeerd. Een conclusie van dit proefschrift is ook dat mensen met een depressie
moeilijker te scannen zijn dan mensen schizofrenie. Bij de in vitro studie heeft Wanda
Douwenga de Western Blots voor en met me gedaan. Anniek, nu in de rol van AIO, hielp
me opnieuw met de analyses van Inveon.
Ik heb het vaak lastig gevonden om zo in deeltijd te promoveren, ik kwam te weinig op
het NGMB om er echt te integreren. Ondanks mijn geringe aanwezigheid heb ik me er
altijd heel welkom gevoeld. Als afdeling maken jullie er samen een fantastische sfeer van.
Heel bijzonder te ervaren hoe zo veel mensen van verschillende nationaliteit opgenomen
worden en zich thuis voelen op NGMB. Ik heb door het ‘promoveren in deeltijd’ wel de
verbinding met vakgenoten gemist. De schaarse momenten die er wel waren, zoals een
congresweek met Janine en Anna, zijn me dan ook dierbaar geweest.
Het was een voorrecht gebruik te mogen maken van de grote NESDA dataset voor de
laatste twee studies. Ik heb veel gebruik gemaakt van de kennis en kundigheid van Ilja
Nolte. Brenda heeft haar rol als laatste auteur meer dan waard gemaakt. De NESDA
studies hebben mede dankzij jullie bijdragen twee mooie artikelen opgeleverd. Ik ben
benieuwd waar ze geplaatst zullen gaan worden.
Ook zonder de waarnemers van de kliniek tijdens de onderzoeksdagen was er weinig
terecht gekomen van dit proefschrift. Van maart tot half mei ben ik vrijgesteld van
klinische werkzaamheden en hebben Jalmar de Vries en Claar Mooij mij waargenomen.
Mijn directe collega Hans Kamphuis nam mij iedere onderzoeksdag waar.
De betrokkenheid en interesse van vele vrienden, collega’s en familie heb ik erg
gewaardeerd. Chris en Pieter, fijn dat jullie paranimf zijn. Ik kon bij jullie vaak terecht
voor praktische vragen en tips.
Allen heel veel dank!
Gijs, Sietze en Fransien, ik vind het bijzonder dat jullie op de promotie zullen zijn. Anita,
je hebt me hebt me enorm veel ruimte gegeven en je bent een grote steun voor me
geweest. Laten we onze dromen blijven volgen, samen met onze mooie kinderen. Let’s go
to the Barrier Reef!


List of publications


de Klerk OL, de Vries TW, Sinnige LG. An unusual cause of neonatal seizures in a newborn infant.
Pediatrics 1997 ;100(4):E8.
Bartels AL, Willemsen AT, Kortekaas R, de Jong BM, de Vries R, de Klerk O, van Oostrom JC, Portman
A, Leenders KL. Decreased blood-brain barrier P-glycoprotein function in the progression of Parkinson's
disease, PSP and MSA. J Neural Transm. 2008; 115:1001-9.
Bartels AL, Kortekaas R, Bart J, Willemsen AT, de Klerk OL, de Vries JJ, van Oostrom JC, Leenders KL.
Blood-brain barrier P-glycoprotein function decreases in specific brain regions with aging: a possible role
in progressive neurodegeneration. Neurobiol Aging 2009;30(11):1818-24.
de Klerk OL, Willemsen ATM, Roosink M, Bartels AL, Hendrikse NH, Bosker FJ, den Boer JA. Int J
Neuropsychopharmacol. 2009; 12(7):895-904.
Bartels AL, de Klerk OL, Kortekaas R, de Vries JJ, Leenders KL. 11C-verapamil to assess P-gp function in
human brain during aging, depression and neurodegenerative disease.
Curr Top Med Chem. 2010; 10(17):1775-84.
de Klerk OL, Willemsen AT, Bosker FJ, Bartels AL, Hendrikse NH, den Boer JA, Dierckx RA. Regional
increase in P-glycoprotein function in the blood-brain barrier of patients with chronic schizophrenia: a
PET study with [(11)C]verapamil as a probe for P-glycoprotein function. Psychiatry Res. 2010;
183(2):151-6.
de Klerk OL, Bosker FJ, Willemsen AT, Van Waarde A, Visser AK, de Jager T, Dagyte G, den Boer JA,
Dierckx RA, Meerlo P. Chronic stress and antidepressant treatment have opposite effects on P-
glycoprotein at the blood-brain barrier: an experimental PET study in rats. J Psychopharmacol. 2010;
24(8):1237-42.
de Klerk OL, Bosker FJ, Luurtsema G, Nolte IM, Dierckx RA, den Boer JA, Potschka H. The role of P-
glycoprotein in psychiatric disorders: a reliable guard of the brain? CNS Agents in Medicinal Chemistry
2011; Accepted for publication.
de Klerk OL, Nolte IM, Bet PM, Bosker FJ, Snieder H, den Boer JA, Bruggeman R, Hoogendijk W,
Penninx BW. ABCB1 gene variants may indicate susceptibility for major depressive disorder. Submitted.
de Klerk OL, Nolte IM, Bet PM, Bosker FJ, Snieder H, den Boer JA, Bruggeman R, Hoogendijk W,
Penninx BW. ABCB1 gene variants influence tolerance to selective serotonin reuptake inhibitors in a
large sample of Dutch cases with major depressive disorder. Submitted.


List of abbreviations


ABC: ATP binding cassette
ADR: adverse drug reaction
ANCOVA: analysis of covariance
ASEC: antidepressant side effect checklist
ATC: Anatomical Therapeutical Classification
ATP: Adenosine TriPhosphate
BBB: blood-brain barrier
BCRP: breast cancer resistance protein
CAPP: Clinical Applications Programming Package
CIDI: Composite International Diagnostic Interview
CNS: central nervous system
CSF: cerebrospinal fluid
Cyp: Cytochrome P450
DNA: deoxyribonucleic acid
DSM-IV: Diagnostic Statistical Manual, 4th edition
EC: endothelial cell
EC50: Median Effective Concentration (required to induce a 50% effect)
ET-1: endotheline-1
GWAS: genome wide association study
HAMD: Hamilton depression (rating scale)
HPA axis: hypotuitary-pituary-adrenal (axis)
HSVE: Herpes Simplex Virus Encephalitis
IL: interleukine
kD: kilodalton
KO: knock out
LAT1: large neutral amino-acid transporter
LD: linkage desequilibrium
L-DOPA: L-3,4-dihydroxyphenylalanine
MAO: mono amine oxidase
MBq: megabecquerel
MDR1: multi drug resistance-1
MINI: Mini Neuropsychiatric Interview
MRI: magnetic resonance imaging
MRP: Multi Resistance Protein
NCBI: National Center for Biotechnology Information
NMDA: N-methyl-aspartic acid
OAT: organic anion transporting
OATP: organic anion transporting polypeptide family
OSEM: ordered subsets expectation maximum
PET: positron emission tomography
P-gp: P-glycoprotein
PTSD: posttraumatic Stress disorder
RNA: Ribonucleic acid
ROI: region of interest

SD: standard deviation
sICAM-1: serum Inter-Cellular Adhesion Molecule-1
SNP: single nucleotide polymorphism
SPM2: statistical parametric mapping
SPSS: Statistical Package for the Social Sciences
SSRI: Selective Serotonin Reuptake Inhibitor
TEER: trans endothelial electric resistance
TNFα: tumor necrosis factor α
UKU: Udvalg for Kliniske Undersøgelser (side effects rating scale)
VLA-4: Very Late Antigen-4
VPM-PET: [11C]-verapamil - positron emission tomography
VT: volume of distribution
WB: Western Blot
WT: wild type