
University of Groningen A Study of Household Energy Consumption ...
119
University of Groningen A Study of Household Energy Consumption and Road Trafin Bra_ov, Using West-European Methods Ten Meer, Erwin IMPORTANT NOTE: You are advised to consult the publisher's version (publisher's PDF) if you wish to cite from it. Please check the document version below. Document Version Publisher's PDF, also known as Version of record Publication date: 2006 Link to publication in University of Groningen/UMCG research database Citation for published version (APA): Ten Meer, E. (2006). A Study of Household Energy Consumption and Road Trafin Bra_ov, Using West- European Methods. Copyright Other than for strictly personal use, it is not permitted to download or to forward/distribute the text or part of it without the consent of the author(s) and/or copyright holder(s), unless the work is under an open content license (like Creative Commons). The publication may also be distributed here under the terms of Article 25fa of the Dutch Copyright Act, indicated by the “Taverne” license. More information can be found on the University of Groningen website: https://www.rug.nl/library/open-access/self-archiving-pure/taverne- amendment. Take-down policy If you believe that this document breaches copyright please contact us providing details, and we will remove access to the work immediately and investigate your claim. Downloaded from the University of Groningen/UMCG research database (Pure): http://www.rug.nl/research/portal. For technical reasons the number of authors shown on this cover page is limited to 10 maximum. Download date: 14-01-2022
-
Upload
khangminh22 -
Category
Documents
-
view
0 -
download
0
Transcript of University of Groningen A Study of Household Energy Consumption ...
University of Groningen
A Study of Household Energy Consumption and Road Trafin Bra_ov, Using West-EuropeanMethodsTen Meer, Erwin
IMPORTANT NOTE: You are advised to consult the publisher's version (publisher's PDF) if you wish to cite fromit. Please check the document version below.
Document VersionPublisher's PDF, also known as Version of record
Publication date:2006
Link to publication in University of Groningen/UMCG research database
Citation for published version (APA):Ten Meer, E. (2006). A Study of Household Energy Consumption and Road Trafin Bra_ov, Using West-European Methods.
CopyrightOther than for strictly personal use, it is not permitted to download or to forward/distribute the text or part of it without the consent of theauthor(s) and/or copyright holder(s), unless the work is under an open content license (like Creative Commons).
The publication may also be distributed here under the terms of Article 25fa of the Dutch Copyright Act, indicated by the “Taverne” license.More information can be found on the University of Groningen website: https://www.rug.nl/library/open-access/self-archiving-pure/taverne-amendment.
Take-down policyIf you believe that this document breaches copyright please contact us providing details, and we will remove access to the work immediatelyand investigate your claim.
Downloaded from the University of Groningen/UMCG research database (Pure): http://www.rug.nl/research/portal. For technical reasons thenumber of authors shown on this cover page is limited to 10 maximum.
Download date: 14-01-2022

A Study of Household Energy Consumption and Road Traffic in Bra�ov,
Using West-European Methods
Erwin Ten Meer
IVEM-doctoraalverslag nr. 176 Chemiewinkel Rapport C110
Februari 2006

A Study of Household Energy Consumption and Road Traffic in Bra�ov, Using West-European Methods
Erwin Ten Meer
IVEM-doctoraalverslag nr. 176
Chemiewinkel Rapport C110 Februari 2006
M.Sc. thesis Erwin Ten Meer Supervisors: Dr. H.A.J. Mulder (Chemiewinkel) Prof. Dr. H.C. Moll (IVEM) Dr. C. Draghici (Intermediu Bra�ov) Published by IVEM, Centrum voor Energie en Milieukunde Rijksuniversiteit Groningen Nijenborgh 4 9747 AG Groningen The Netherlands Tel: 050 – 363 4609 (+ 31 50 363 4609) Fax: 050 – 363 7168 (+31 50 363 7168) Homepage: www.rug.nl/ees in co-operation with: Chemiewinkel Rijksuniversiteit Groningen Nijenborgh 4 9747 AG Groningen The Netherlands Tel: 050 – 363 4436 / 4132 (+31 50 363 4436 / 4132) Fax: 050 – 363 7256 (+31 50 363 7256) Homepage: www.rug.nl/wewi and Intermediu Bra�ov Str. Piata Teatrului Nr. 9, Ap. 10 500002-Brasov Romania Tel/Fax: 0268 – 470271 (+40 268 470271) Homepage: www.intermediu.ro
Acknowledgements The number of people who have contributed to making this project a reality is vast and it would not be possible for me to name all of them. That does not mean that I can not try to show my gratitude to all of them, especially those who have had a pivotal role in one or more aspects of this project. First and foremost I would like to thank my three supervisors: Prof. Dr. Henk Moll (IVEM), Dr. Henk Mulder (Science Shop, University of Groningen) and Dr. Camelia Draghici (Intermediunet, Bra�ov). They were the driving forces throughout the project and it is because of their knowledge, insights, and patience that this project and this report came into fruition. They kept supporting me even at times when the going was tough, and for this I am indebted to them. This project was done in cooperation with the Agency for the Energy Management and Environment Protection – Bra�ov (ABMEE). Camelia Ra�a, and the staff of ABMEE participated in every step of this project, and it is only through this cooperation that this project could be managed. In any big project the issue of finance rears its head, and this project was no exception. Therefore, it would not have been possible without the financial support of the Science Shop of University of Groningen, the Socrates/Erasmus Student Exchange Program, and the “Stichting Groninger Universiteits Fonds”. Besides the grants given by these organizations, financial support was also given by the Centre for Energy and Environmental Studies (IVEM), by allowing me access to research reports and computer programs without charge. My project was part of the project “Problem-based learning through science shops in Romania”, which was financed by the Dutch Ministry of Foreign Affairs through their Matra Programme, from 2002-2005. Without their support there would not have been a science shop in Brasov, and my co-operative project would not have been possible. Throughout the project, I had to consult various experts in different fields who volunteered to help me get through some of the most difficult and complicated aspects of the research. These experts include Ir. Arie Fokkink (Green Grid Consultancy) who helped me gain insights in the academic culture of Romania, especially in the first phase of the project, Dr. Rene Benders (IVEM) who taught me the inner workings of the DoMUS program, Ir. Erwin Bezembinder (Goudappel Coffeng) who jump-started the OmniTRANS simulations for me, and Dr. Laurie Hendrickx (IVEM) who made sure I asked the right questions in the survey. These contributions enabled me to elevate the quality of the project in ways that would have been impossible otherwise. When I arrived in Bra�ov I had no knowledge of the city (save for what I had read before my arrival), yet this was not an issue due to the warm welcome I received from the members of the Tutoveanu family. They not only provided me with a place to stay and with meals, but also introduced me to various aspects of the daily Romanian life and culture. They made me feel like a part of the family and made my stay in Bra�ov an unforgettable experience. My stay in Bra�ov was also facilitated by the staff of the Intermediunet Bra�ov and of the chemistry department of the Transilvania University Bra�ov. Mihaela �ica, Dana Perniu and the rest of the group guided me through the maze of the information and made it possible for me to communicate with the students even when the language barrier proved a little too high. The backbone of this project was the work done by the many Romanian students who were involved in it. They either did a small part of a pilot project, or supplied data for the programs. Many of them I only knew by first name, but still want to thank them. These students included Lavinia Ple�oiu, Adina and Marinela who worked on the DoMUS program as part of their diploma project, Petre Iosub who supplied the Romanian construction data for Domus, Maya, Andrei, and Sebi who helped me redesign the ToolSust questionnaire, and Stelian Tarulescu who worked with me on the OnmiTrans program. Other students helped indirectly by discussing with me on the projects, and by giving insights, ideas and tips. These included Andreea Andrei, Ana Necula, Manuela Moru�ano, and many more. Other than students, there were also many university staff that contributed. These include Erika Manole,

with whom I had many conversations and who often came up with simple solutions to seemingly complicated situations, and Prof. Fota and Prof. P�curar who supplied the construction and weather data for DoMUS. During the project I gathered information on many subjects which did not make it into this paper. They often functioned as support or background information for the projects which did get included and are therefore still very valuable. Providers of this information include Mircea Nicoara and Mugurel Rotariu who were involved with the Ia�i master plan, the Traffic and Transportation Section of the Department of Spatial Planning and Economic Matters of the city of Groningen and the Traffic Department of the University of Groningen. In the end phase of writing the paper I also had the help of many friends and students. I therefore want to thank Alina Cuc, Mihaela Voinea, Claudiu Mor�rescu, Hilke Müller, and Allard van der Made for assisting me with the various translations that had to be made to Romanian and Dutch. And in closing I want to thank Marieke van den Berg, Jeanine Molina, Merry Witte and Hilke Müller for the moral support and the motivation in the times when it seemed this project would never get done. I have tried to highlight the people who worked closest with me on this project, yet this list is far from complete. To all the people and organisations that have made contribution to this project and paper: you have my gratitude! Erwin Ten Meer Groningen, Feb 28, 2006
Contents
Chapter 1: Introduction .........................................................................................................19 1.1 Background and Problem Definition......................................................................................19
Background Information about the City of Bra�ov .......................................................................19 ABMEE, the Science Shops, and the Centre for Energy and Environmental Studies ..................20 Problem Definition........................................................................................................................20
1.2 Aims of this study and Main Research Question ...................................................................22 1.3 Methodology...........................................................................................................................22
Stages of the project: .....................................................................................................................23
Chapter 2: Bra�ov and the Agencies .....................................................................................25 2.1 Description of the City of Bra�ov and its Environment-Related Issues .................................25
Geography and Climate.................................................................................................................25 Population and Economy ..............................................................................................................26 Traffic............................................................................................................................................26 Energy Production and Consumption in Bra�ov ...........................................................................27 Environmental Issues ....................................................................................................................29
2.2 ABMEE and the SAVE program............................................................................................30 The Agency for the Energy Management and Environment Protection” – Bra�ov ......................30 About SAVE II..............................................................................................................................31
2.3 The Science Shops and the MATRA Project .........................................................................32 The Science Shops Network .........................................................................................................32 Science Shops in Romania ............................................................................................................33
Chapter 3: Methods and Program Descriptions ..................................................................35 3.1 The Phases of the Project .......................................................................................................35
Phase one: Orientation and Preparation ........................................................................................35 Phase Two: One Site Assessment of Possibilities to Employ Methods ........................................36 Phase Three: Completion of Projects and Dissemination of the Results ......................................37
3.2 The Pilot-Project Methods......................................................................................................37 Pilot Project 1: Household Energy Consumption..........................................................................38 Pilot Project 2: Traffic Modelling .................................................................................................38 Pilot Project 3: Survey on Environmental Awareness and Recycling. .........................................38
3.3 Other Methods Analyzed........................................................................................................39 ASE 2.1 .........................................................................................................................................40 CAR International .........................................................................................................................40 MERLiN........................................................................................................................................40 MURE ...........................................................................................................................................41 PROMIL Spatial............................................................................................................................41 Urbis..............................................................................................................................................42
Chapter 4: Household Energy Consumption .......................................................................43 4.1 Problem Definition, Method Used and Aims .........................................................................43
Problem Definition:.......................................................................................................................43 Method Involved: ..........................................................................................................................44 Aims of this Pilot Project: .............................................................................................................45
4.2 Theoretical and Methodological Background ........................................................................45 4.3 Adaptations Made to the Method: Adapting the Database.....................................................47
Construction Data..........................................................................................................................47 Climate Data..................................................................................................................................47
4.4 Primary Results and Discussion .............................................................................................50 Energy Savings for the Three House Types..................................................................................51 Comparing the Three House Types...............................................................................................53
Reliability of These Results ..........................................................................................................55 4.5 Conclusions ............................................................................................................................56
Chapter 5: Traffic Modelling.................................................................................................57 5.1 Problem Definition, Method Used and Aims .........................................................................57
Problem Definition:.......................................................................................................................57 Aims of this Pilot Project: .............................................................................................................58 Method Involved: ..........................................................................................................................58
5.2 Theoretical and Methodological Background ........................................................................60 The Structure of the Classic and other Transport Models.............................................................60 Continuous Transport Planning.....................................................................................................63
5.3 Adaptations Made to the Method: Determining the Input for the Model. ..............................65 Ora�ul Simplu................................................................................................................................65 Simulating Traffic in Bra�ov.........................................................................................................67
5.4 Primary Results and Discussion .............................................................................................74 Ora�ul Simplu................................................................................................................................74 A Simple Example of a Simulation of Traffic in Bra�ov ..............................................................74
5.5 Conclusions ............................................................................................................................81
Chapter 6: Survey on Environmental Awareness and Recycling ......................................83 6.1 Problem Definition, Method Used and Aims .........................................................................83
Problem Definition........................................................................................................................83 Aims of this Pilot Project: .............................................................................................................83 Method Involved ...........................................................................................................................83
6.2 Theoretical and Methodological Background ........................................................................84 Planning a Survey Questionnaire ..................................................................................................85 Sampling: ......................................................................................................................................87
6.3 Adaptations Made to the Method: Adapting the Questionnaire .............................................87 6.4 Primary Results and Discussion .............................................................................................89
General Questions on Environment [7 questions].........................................................................89 Recycling [8 Questions] ................................................................................................................90 Transportation [4 Questions].........................................................................................................92 Energy Conservation [5 Questions] ..............................................................................................93 Background Information – Respondent: [5 Questions].................................................................94 Background Information – Household [5 Questions] ...................................................................95
6.5 Conclusions ............................................................................................................................95
Chapter 7: Conclusions and Recommendations ..................................................................97 7.1 General Overview...................................................................................................................97 7.2 Conclusions ............................................................................................................................98
Conclusions Regarding Pilot Project I: Household Energy Consumption....................................98 Conclusions Regarding Pilot Project II: Traffic Modelling: .........................................................98 Conclusions Regarding Pilot Project III: Survey on Environmental Awareness and Recycling. .99 Conclusions Regarding the Whole Project:...................................................................................99
7.3 Recommendations ................................................................................................................100 Recommendations for Further Research .....................................................................................100 Recommendations for the Science Shop.....................................................................................101 Recommendations for ABMEE ..................................................................................................101 Reference List ............................................................................................................................103 Appendix I: ABMEE Chestionar privind gradul de constientizare asupra reciclarii si a problemelor de mediu ...............................................................................................................107 Appendix II: Names of the primary streets in Bra�ov. ..........................................................115 Appendix III: List of Internet Pages........................................................................................117
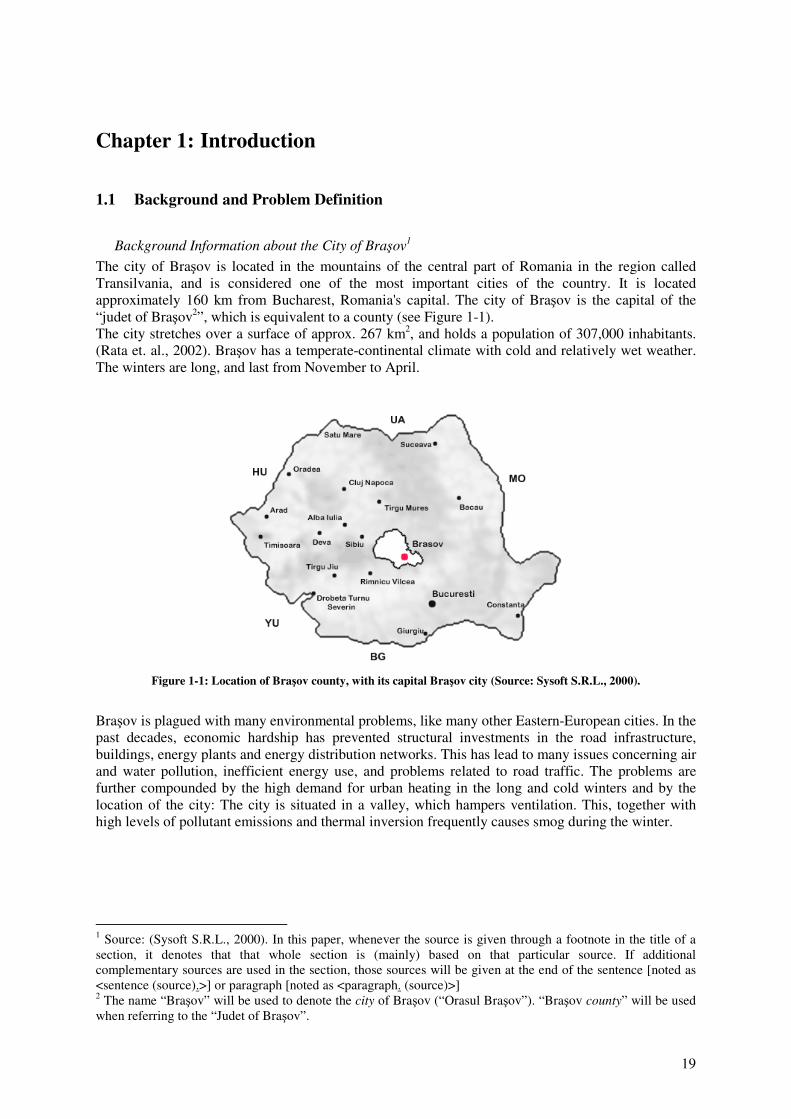
List of Figures Figure 1-1: Location of Bra�ov county, with its capital Bra�ov city (Source: Sysoft S.R.L., 2000). .......................................................................................................................................19
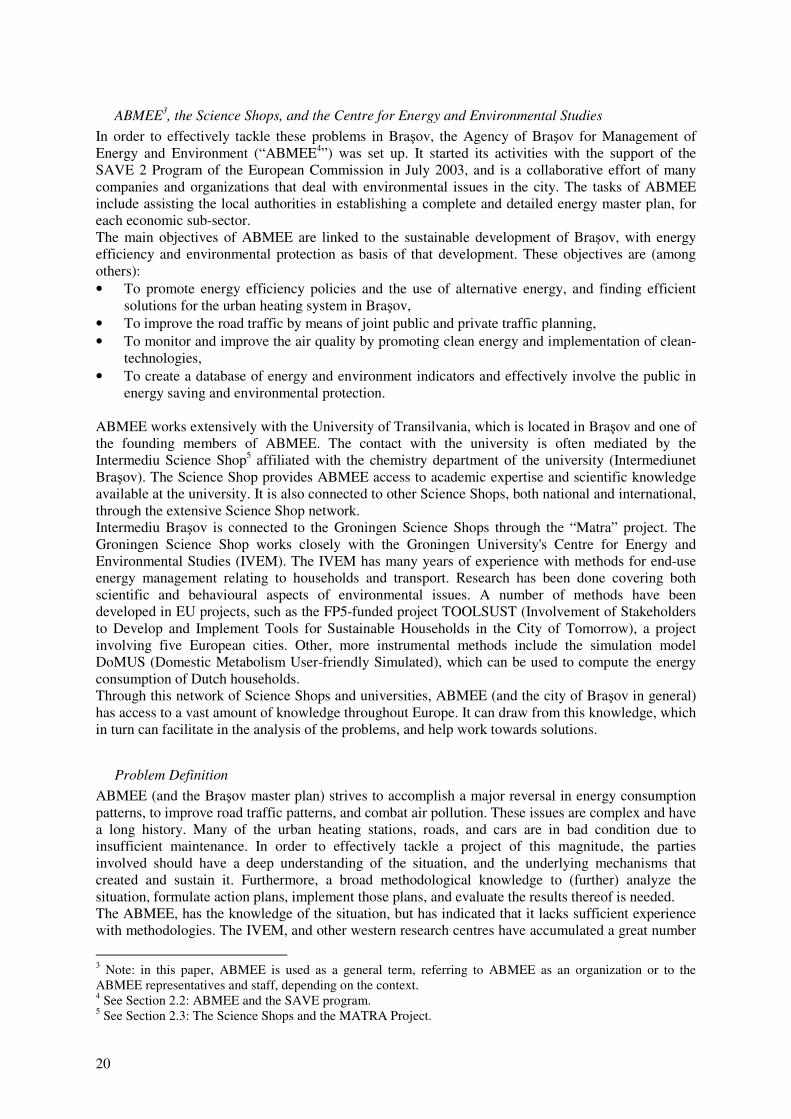
Figure 1-2: Graphical representation of the effect of extensive cooperation on the knowledge available to the various parties. The dark grey areas represent the effective knowledge available to both parties, which can be employed to tackle the situation. The light grey regions represent knowledge available only to one party. Redrawn after examples presented by H. Mulder (Mulder, 2003). ...........................................................................................................21
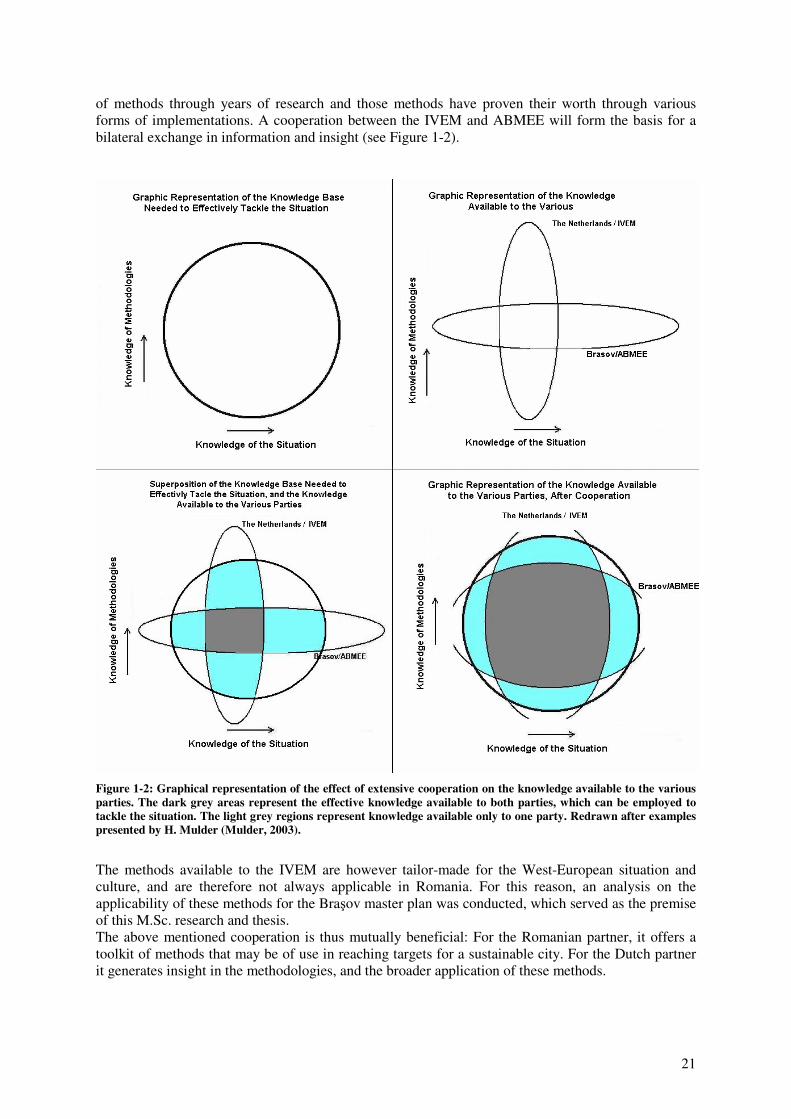
Figure 1-3: The parties involved in this project, and how they relate to one another. The lines indicate a business involvement, while the double arrows (connected to the students) show the various avenues of supervision. ...............................................................................................23
Figure 2-1: The position of Bra�ov in relation to the nation’s main commercial roads (Source: Sysoft S.R.L., 2000).................................................................................................................25
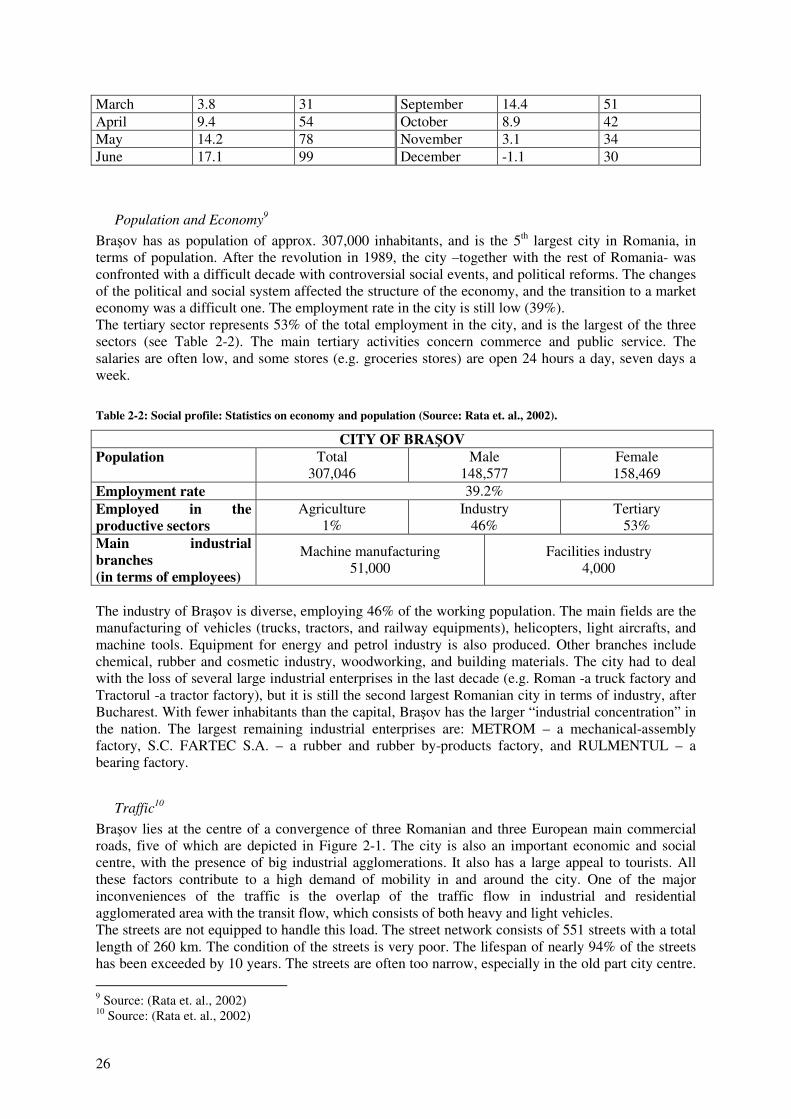
Figure 2-2: Heat production in Bra�ov in 2002 (Source: Rata et. al., 2002). ..........................28
Figure 3-1: Decision tree used to choose which methods are eligible to be used in the pilot projects.....................................................................................................................................35
Figure 4-1: Energy consumption categories as used in DoMUS (Source: Benders et. al., 1998). .......................................................................................................................................45
Figure 4-2: The Heat Balance of a house. The numbers shown are for houses in the Netherlands (Source: Kok, 2003). ...........................................................................................46
Figure 4-3: Graphical view of the adaptation of the weather data. Figure A shows the original data. Figure B shows the interpolation of the maximum and minumum temperatures. Figure C shows the end result for the day-time and night-time temperatures. .......................................49
Figure 4-4: Relative effect of the measures taken in the apartment on the transmission and ventilation losses, and the energy consumption compared to the reference scenario. .............51
Figure 4-5: Relative effect of the measures taken in the detached house on the transmission and ventilation losses, and the energy consumption compared to the reference scenario. ......52
Figure 4-6: Relative effect of the measures taken in the detached house on the transmission and ventilation losses, and the energy consumption compared to the reference scenario .......53
Figure 4-7: Direct energy use of the houses for each scenario ................................................54
Figure 4-8: Energy reduction compared to the reference for each of the measures.................55
Figure 5-1: The position of Bra�ov in relation to the nation’s main commercial roads (Source: Sysoft S.R.L., 2000).................................................................................................................57
Figure 5-2: Schematic structure of OmniTRANS showing the interaction between the processing engine, the database, and the user interface (Source: OmniTrans, 2003). .............59
Figure 5-3: General form of the "classic transport model". Here the four stages of the model (Trip Generation, Distribution, Modal Split, and Assignment) can be seen, together with the preparation and evaluation steps (Source: Ortúzar & Willumsen, 2001). ...............................61
Figure 5-4: A Framework for Rational decision making with model, including the monitoring system (Source: Ortúzar & Willumsen, 2001).........................................................................63
Figure 5-5: Schematic representation of " Ora�ul Simplu". The left part shows the initial situation where all traffic go through the residential areas. To the right is the variant where a highway is built between the two buisness and industrial centres. ..........................................66
Figure 5-6: Map of Bra�ov, showing the main access roads and roads within the city. The map has been rotated 90o counter clock-wise compared to standard compass points. ....................68
Figure 5-7: The basic street network as drawn in OmniTRANS. The left picture shows the network superimposed on the map of Bra�ov. The numbers represent the various zones in the city. The right picture shows the street network with the map. In the results only the street network will be shown. ............................................................................................................69
Figure 5-8: Trip distribution (in 103 vehicles per day) between the zones. The double figures to and from transit zones represent cars/trucks........................................................................70
Figure 5-9: Peak car load in Ora�ul Simplu; the number of cars is given in cars per hour. Left: The basic scenario. The traffic load is very high (higher than 1000 cars per hour) on all the roads. Right: The bypass variant. The traffic load here is highest on the freeway, which has the highest traffic capacity. The traffic in the residential areas is reduced to a minimum.......74
Figure 5-10: VCratio for the car peak, in Ora�ul Simplu; the ratio is given in percentages. Left: the basic variant. the darker regions have a higher congestion, with LOS in category E and F. Right:the bypass variant. The LOS for are roads now fall in the “free flow” or stable flow1 category (A or B)...........................................................................................................74
Figure 5-11: Comparison in the car peak load between the Basic scenario and the Bypass variant. .....................................................................................................................................76
Figure 5-12: Comparison in the truck peak load between the Basic scenario and the Bypass variant. .....................................................................................................................................77
Figure 5-13: Comparison of the VCratio between the Basic scenario and the Bypass variant..................................................................................................................................................77
Figure 5-14: Variant Compare of the Bypass variant. Here one can clearly see where the traffic increases (red area), decreases (green area) and where it stays the same (grey area). ..78
Figure 5-15: Variant Compare Basic and Mall variant............................................................79
Figure 5-16: Comparison of the VCratio between the Basic scenario and the Mall variant....79
Figure 5-17: Comparison of the VCratio between the Basic scenario and the Bypass variant. In this case the mean streets have a capacity of 2000 vehicles per hour (i.e. 33% lower capacity than the scenario given in Figure 5-13) .....................................................................80
Figure 6-1: Overview of the steps needed to design and hold a survey (Source: Walonick, 1997). .......................................................................................................................................85
Figure 6-2: The energy label for white goods. The lower labels (A-B) are given to the more energy efficient goods ..............................................................................................................94
List of Tables
Table 2-1: Monthly long term average temperature and precipitation for Sibiu, a city with climate comparable to Bra�ov (Source: Nellestijn & Dekker, 1998).......................................25
Table 2-2: Social profile: Statistics on economy and population (Source: Rata et. al., 2002). 26
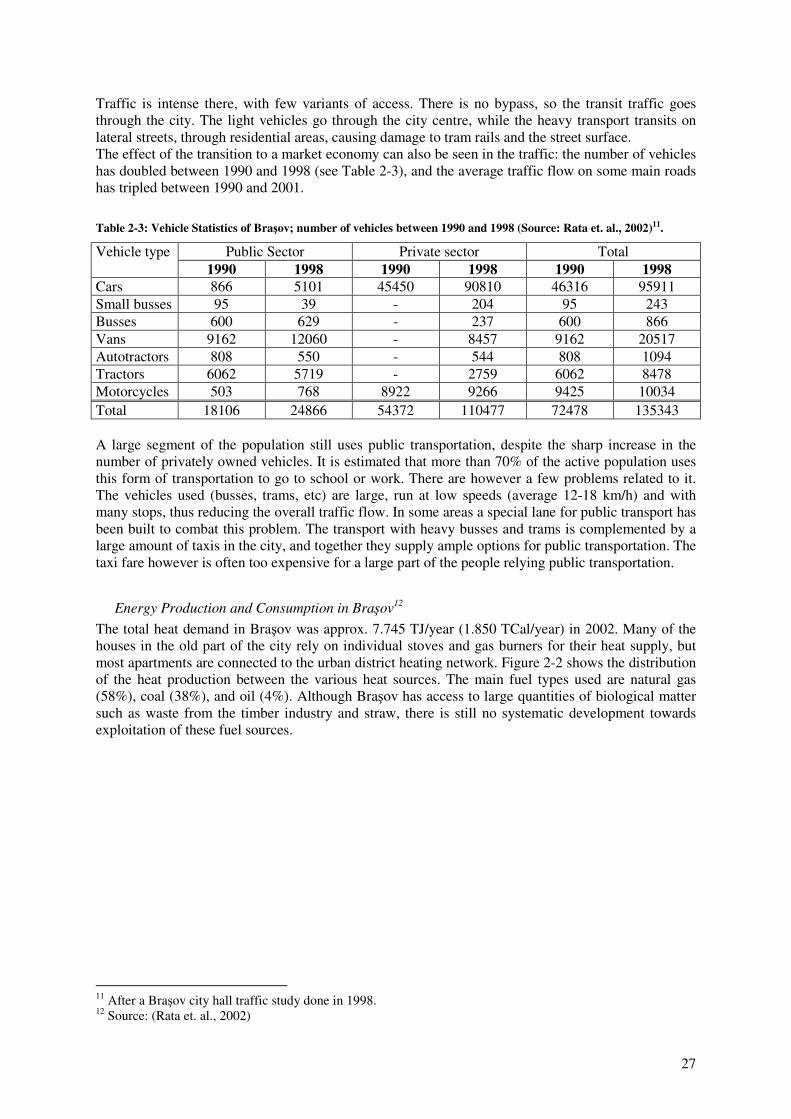
Table 2-3: Vehicle Statistics of Bra�ov; number of vehicles between 1990 and 1998 (Source: Rata et. al., 2002). ....................................................................................................................27
Table 2-4: Decline of household heat consumption between the year 2000 and 2004 (Source: Rata et. al., 2004a). ..................................................................................................................28
Table 2-5: Main sources of pollutants in Romania (Source: Rata et. al., 2002). .....................29
Table 2-6: Road transport contribution to the total transport pollution (Source: Rata et. al., 2002). .......................................................................................................................................30
Table 2-7: Mass pollutants per vehicle (Source: Rata et. al., 2002). .......................................30
Table 3-1: Overview of the specializations and the number students involved in the Pilot Projects.....................................................................................................................................39
Table 4-1: The occurrence of building types used for living in Bra�ov County and Bra�ov City (Source: D.J.S.Bra�ov, 2002)...................................................................................................43
Table 4-2: Percentages of households connected to the sewer, gas, electricity and water system (Source: D.J.S.Bra�ov, 2002).......................................................................................44
Table 4-3: Main characteristics of the three houses, used in DoMUS for the simulations......50
Table 4-4: Variations made in the scenarios for each simulation. ...........................................50
Table 5-1: Vehicle Statistics of Bra�ov; growth of the number of vehicles between 1990 and 1998 (Source: Rata et. al., 2002)..............................................................................................58
Table 5-2: Characteristics of the four zones in Ora�ul Simplu (jobs and residents). Note that Zone1 and two have more businesses, while Zone2 and Zone3 have more residents. ............66
Table 5-3: Production and attraction of cars in Ora�ul Simplu. The table shows the number of cars that leave a certain zone (the production, shown in the rows), and their destinations (the attraction, shown in the columns). ...........................................................................................66
Table 5-4: Production and attraction per zone, for cars and trucks, used by OmniTRANS. ...71
Table 5-5: Relation between the VCratio and the Level of Service (LOS). A high VCratio leads to lower traffic speeds, and more congestion (traffic jams). Note that the VCratios for LOS A and B, and LOS C and D respectively are the same (Source: RPC, 2005, OmniTrans, 2003). .......................................................................................................................................73
Table 5-6: comparison of OmniTRANS vehicle-load results with intersection counts made in May 2002. The figures are given in the number of vehicles per hour. ....................................81

Summary The city of Bra�ov is facing many problems related to environmental issues. These range from traffic congestion and the related air pollution, to inefficient household energy production and use. In September 2003 the Agency for the Energy Management and Environment Protection – Bra�ov (ABMEE), started its activities to combat these problems. In an effort to expand its arsenal of methods to analyze environmental issues, ABMEE participated in a collaborative project with the Science Shops of the University of Groningen (the Netherlands) and the Intermediunet in Bra�ov, and the Centre for Energy and Environmental Studies (IVEM) in Groningen. The scope of this project was the bilateral exchange in information and insights, where the western partners provided methodological knowledge, and the eastern partners provided the cultural context and the data for the methods. The findings of the project formed the basis for this paper. The focus was the adaptation and transfer of western European methods, so that they can be used in Bra�ov and more generally, in Romania. To put this knowledge transfer into practice, three small-scale pilot projects were conducted in Bra�ov, with the help and support of the Romanian students and university staff. The pilot projects were divided in three phases. The first phase dealt with establishing which of the methods available to the IVEM and in the Netherlands that deal with household energy consumption,, road traffic, and measuring environmental awareness were suitable for use in Bra�ov. A number of methods were analyzed, ranging from computer programs, questionnaires and theoretical concepts. Three methods were chosen based on their availability at low costs and flexibility to be adapted to the Romanian conditions. The second phase dealt with the conditions under which these methods were applicable. The most prevalent obstacle encountered in this research was the availability of, and access to data. The focus of the final phase was on determining how the knowledge that was developed together could best be shared. This was the main focus of the pilots and asked for close cooperation with the Romanian partners. During this cooperation, many “hidden” avenues to more information were revealed, as were some unexpected social aspects, which helped the Dutch partners get more insight in the applicability of the methods. The latter is scientifically interesting to the Dutch partners, since it allows them to extend their methods to more general applicability. The first Pilot project dealt with household energy consumption. In the first phase, the program “DoMUS” was chosen as potentially suitable for use in Romania. The aims for the pilot project were to adapt the databases containing the construction-material data and the climate data in the computer program DoMUS so that program is able to better portray the energy use in Romanian households. Furthermore, the program was used to simulate the energy consumption of three house types (detached house, house in a row, and apartment) and to analyze the effects of energy-saving measures on these houses. These calculations showed that the behaviour related to energy use has a clear effect on the energy consumption in a household. Lowering the room temperature at night, or when nobody is home can lead to approx. 20% reduction in energy consumption for each of the house types. Investing in room temperature-controllers could therefore be a relatively cost-effective and efficient way to reduce the energy use. Detached houses consume the most energy due to the large area of exposed wall surface, and would benefit most from wall insulation (approx. 14 % reduction) compared to the other house types. Changing to high-insulation windows can achieve a 15% reduction in detached houses and in houses in a row. Apartments on the other hand consume the least energy due to the small area of exposed wall surface and the fact that they are usually smaller than the other house types. Here, changing the windows is most effective and could lead to approx. 20% reduction of the energy use. The second pilot project dealt with traffic modelling. The aim of this project was to identify the possibilities for using traffic model-platforms to represent and analyze the traffic situation in Bra�ov. This also included determining the level of complexity of such an endeavour, and identifying obstacles that could be encountered. The computer program OmniTrans was chosen to construct a prospective model to calculate the traffic flow of cars and trucks in Bra�ov. Three simplified
scenario’s were considered: a basic scenario portraying the current traffic situation in the city, a bypass variant which analyzed the effect of building a bypass expressway around the city, and a shopping mall variant which highlighted the local effects of building a shopping mall in a city section. The simulations done in the program OmniTrans gave an indication of the effect of both city-wide and area-specific measures on the traffic flow. They showed, even with the simplified scenarios analyzed, that a freeway around the city would reduce the traffic intensity in the city centre. The results also showed however that simply building a freeway would not solve all the traffic problems in the city. Additional measures, such as restricting access to certain roads in the centre, improving the streets, and increasing the quality of cars are also needed. The third pilot project aimed to design and test a questionnaire on environmental awareness and recycling which could be used by ABMEE to test the involvement of the public in a recycling campaign, and to gain insight on the relations between this involvement on the one hand and social-economic factors and environmental awareness [of the public] on the other hand. A questionnaire from the ToolSust project was chosen as a basis and adapted to be used in Bra�ov. By involving Romanian sociology students in the process, a secondary aim was also met, namely assessing the differences in the process of designing a questionnaire between Eastern and Western Europe. The result of the project was a questionnaire adapted and translated to Romanian, which is ready to be used. The lay-out was designed so that the questionnaire can be used both in a mailing survey and in an interview survey. Test trials were run to identify and eliminate possible problems the respondents would encounter while completing the questionnaire. Some of the questions, e.g. those related to finances, touched on delicate subjects, and may prove problematic. These questions were therefore labelled as “optional”. Although the questionnaire addresses some topics only briefly, it can measure the environmental knowledge of the respondent sufficiently to statistically determine the relation thereof with the active involvement in the recycling project. In the end, this project showed the benefits of extensive knowledge exchange between two distinct [academic] cultures, highlighting the win-win characteristics for all the partners. This project also showed the effectiveness of using Science Shops to complement the standard university or college curriculum. Many students participated during this project and this enabled them to put some of the knowledge they got in the classes into practice, while at the same time helping them to develop other skills. These skills include searching for information, formulating research proposal, and communicating about the results both in writing and in presentations. This multi- and interdisciplinary co-production of knowledge has been a valuable exercise for both parties (Dutch and Romanian). The Romanian students were exposed to the Dutch way of doing research and in return gave access to the Romanian context, thus enabling the sharing of knowledge which was the primary aim of this project.
Samenvatting De Roemeense stad Bra�ov kampt met verschillende milieuproblemen. Deze problemen lopen uiteen van files en de daarmee verbonden luchtvervuiling, tot de inefficiënte energieproductie en het inefficiënte energieverbruik in huishoudens. Om deze problemen aan te pakken, werd het Bureau voor Energiemanagement en Milieubescherming Bra�ov (ABMEE) in september 2003 opgezet. Om het aantal beschikbare methodes om milieukundige problemen te analyseren uit te breiden, nam ABMEE deel aan een samenwerkingsproject met het Centrum voor Energie en Milieukunde (IVEM) in Groningen en de wetenschapswinkel van de Rijksuniversiteit Groningen en Intermediu Bra�ov. Het doel van dit project was de bilaterale uitwisseling van informatie en wetenschappelijke inzichten, waarbij de West-Europese partners voor de methodologische kennis zorgden en de Oost-Europese partners de data voor het toepassen en verder ontwikkelen van de methodes en de culturele context aanleverden. De resultaten van dit project vormen de basis voor dit verslag. Het uitgangspunt van dit project was het aanpassen en overdragen van West-Europese methodes, opdat deze gebruikt kunnen worden in Bra�ov en, algemener, in heel Roemenië. Om deze kennisoverdracht te bewerkstelligen, werden drie kleinschalige proefprojecten uitgevoerd in Bra�ov met de medewerking van docenten en studenten van de Transilvania Universiteit van Bra�ov. Deze proefprojecten waren in drie fases verdeeld. In de eerste fase werd bepaald welke methodes bij het IVEM en in Nederland beschikbaar zijn. Hierbij werd gekeken naar methodes die gebruikt kunnen worden om milieubewustzijn te meten en die gebruikt kunnen worden voor het analyseren van het huishoudelijke energieverbruik en het verkeer. Deze methodes werden getoetst op hun geschiktheid om ook in Bra�ov toegepast te worden. Onder de geanalyseerde methodes bevonden zich onder andere computerprogramma’s, vragenlijsten en theoretische concepten. Uiteindelijk werden drie methodes geselecteerd die flexibel genoeg waren om te worden aangepast aan de Roemeense omstandigheden en die tegen lage kosten te verkrijgen waren. In de tweede fase werd bekeken onder welke omstandigheden de geselecteerde methodes konden worden toegepast. Het meest voorkomende knelpunt bij dit onderzoek was de beschikbaarheid van en toegankelijkheid tot gegevens. In de derde fase werd bepaald hoe de kennis die gezamenlijk was opgedaan het best kon worden uitgewisseld. Dit was het voornaamste doel van de proefprojecten en dit vroeg om een nauwe samenwerking met de Roemeense partners. Tijdens deze samenwerking kwamen talrijke “verborgen” manieren om aan informatie te komen boven water, evenals sommige onverwachte sociale aspecten. Hierdoor kregen de Nederlandse partners meer inzicht in de toepasbaarheid van hun methodes. Dit laatste is wetenschappelijk interessant voor de Nederlandse partners omdat het bijdraagt bij het breder toepasbaar maken van de methodes. Het eerste proefproject ging over het huishoudelijke energieverbruik. In de eerste fase werd het computerprogramma “DoMUS” geschikt bevonden voor het gebruik in Roemenië. De doelen van het project waren om de databases van DoMUS met gegevens over bouwmaterialen en klimaatgegevens aan te passen zodat het programma het energieverbruik in Roemeense huishoudens beter kon weergeven. Verder werd het programma gebruikt om het energieverbruik te simuleren in drie verschillende soorten huizen (een vrijstaand huis, een rijtjeshuis en een flat) en om een analyse te maken van het effect van energiebesparende maatregelen op het energieverbruik in deze huizen. Deze berekeningen wezen uit dat bewuster omgaan met de verwarmingsinstellingen een groot effect kan hebben op het energieverbruik in een huishouden. Door de temperatuur ‘s nachts, of als er niemand thuis is, te verlagen, kan dit in alle drie de typen huizen leiden tot een energiebesparing van rond de 20%. Investeringen in thermostaten om de kamertemperatuur te reguleren kan dus leiden tot grote besparingen tegen relatief lage kosten. Vrijstaande huizen verbruiken in vergelijking met de andere soorten huizen de meeste energie. Dit komt door het relatief grote oppervlak aan buitenmuren. Daarom zullen deze huizen het meest gebaat zijn bij het aanbrengen van muurisolatie (ongeveer 14% besparing). Daarnaast kan het energieverbruik van zowel vrijstaande huizen als rijtjeshuizen met 15% verminderd worden door het plaatsen van dubbelglas. Flats daarentegen verbruiken de minste energie door de geringe oppervlakte aan buitenmuren en het feit dat ze over het algemeen kleiner zijn dan de
andere typen huizen. Het vervangen van de ramen is daardoor het effectiefst en kan leiden tot een besparing in het energiegebruik van bijna 20%. Het tweede proefproject ging over verkeerssimulaties. Het doel van dit project was de mogelijkheden voor het gebruik van “model-platforms” bij het weergeven en analyseren van de verkeersomstandigheden in Bra�ov te identificeren. Hierbij werd gekeken naar de mate van complexiteit van een dergelijke onderneming en werden mogelijke obstakels geïdentificeerd. Het computerprogramma “OnmiTrans” werd gekozen om een testmodel te bouwen dat de verkeersstromen van auto’s en vrachtwagens in Bra�ov kan simuleren. Hierbij werden drie versimpelde scenario’s opgezet: een basisscenario dat de huidige situatie beschrijft, een “ringweg- variant” die de effecten van een ringweg rond de stad analyseert en een “winkelcentrum-variant” die de plaatselijke effecten van een nieuw winkelcentrum op de omliggende wijken beschrijft. De simulaties die met OmniTrans werden gedraaid, gaven een indicatie van de effecten op de verkeersstromen van zowel grootschalige ingrepen, met grote gevolgen voor de hele stad, als kleine ingrepen die alleen plaatselijk invloed hebben. De resultaten lieten zelfs bij versimpelde scenario’s zien dat een ringweg rond de stad de verkeersdrukte in het centrum van de stad sterk zou laten afnemen. De resultaten lieten echter ook zien dat een ringweg niet alle verkeersproblemen in de stad zou oplossen. Hiervoor zijn extra maatregelen nodig, zoals het beperken van de toegang tot bepaalde straten en het verbeteren van de kwaliteit van straten en auto’s. Het derde proefproject had als doel een vragenlijst over milieubewustzijn en recycling te ontwerpen en te testen. Deze vragenlijst zou dan door ABMEE gebruikt kunnen worden om de betrokkenheid van de burgers bij een recycling project te meten. Daarnaast zou het inzicht kunnen geven in de relatie tussen deze betrokkenheid enerzijds en sociaal-economische factoren en milieubewustzijn [van de burgers] anderzijds. Een vragenlijst van het Europese ToolSust project werd gekozen als uitgangspunt hiervoor. Deze vragenlijst werd aangepast opdat het in Bra�ov gebruikt kon worden. Door studenten sociale wetenschappen bij dit proces te betrekken, werd een secundair doel ook bereikt, namelijk het vergelijken van de werkwijze van het opstellen van vragenlijsten in West-Europa met die in Oost-Europa. Dit resulteerde in een aangepaste vragenlijst in het Roemeens. De lay-out was zodanig dat het geschikt was voor zowel schriftelijke enquêtes als interviews. De vragenlijst werd getest om eventuele onduidelijkheden die de respondenten tegen kunnen komen tijdens het invullen ervan te identificeren en te corrigeren. Enkele vragen, bijvoorbeeld die aangaande financiële gegevens, behandelen delicate onderwerpen en zouden problemen kunnen veroorzaken bij het invullen. Deze vragen zijn daarom als “optioneel” aangeduid. Hoewel bepaalde onderwerpen slechts oppervlakkig de revue passeren op de vragenlijst, kan de vragenlijst het milieubewustzijn van de respondenten voldoende meten om de statistische relatie met een actieve betrokkenheid tijdens het recycling project te bepalen. Het hierboven beschreven project laat de voordelen van uitgebreide kennisuitwisseling tussen twee verschillende (academische) culturen zien. Daarnaast laat het ook de effectiviteit van het gebruik van wetenschapswinkels ter aanvulling op reguliere curricula in het Hoger Onderwijs zien. Veel studenten hebben aan dit project meegewerkt en kregen hierdoor de kans om hun in colleges opgedane kennis in de praktijk te brengen. Tegelijkertijd konden ze andere competenties oefenen, zoals het zoeken naar informatie, het opstellen van onderzoeksvragen en het schriftelijk en mondeling presenteren van hun resultaten. Deze multi- en interdisciplinair coproductie van kennis is van groot belang voor beide partijen. De Roemeense studenten kwamen in aanraking met de Nederlandse manier van onderzoek doen en gaven tegelijkertijd toegang tot de Roemeense context. Dit maakte kennisuitwisseling, het hoofddoel van dit project, mogelijk.
Sumar Ora�ul Bra�ov se confrunta cu numeroase probleme legate de mediu. Aceasta variaz� de la trafic intens si poluarea atmosferica pana la produc�ia si folosirea ineficiente de energie casnica. In septembrie 2003 Agen�ia de Managementul Energie si de Protec�ie a Mediului – Bra�ov (ABMEE), si-a început activitatea de combatere a acestor probleme. Intr-un efort de extindere a arsenalului de metode de analizare a problemelor de mediu, ABMEE a participat la un proiect de colaborare cu Science Shops ale Universitatii din Groningen (Olanda), Intermediu Bra�ov, si cu Centrul de Energie si Studii de Mediu (IVEM) Groningen. Scopul acestui proiect a fost schimbul bilateral de informa�ii si idei in care partenerii vestici au adus un aport de cuno�tin�e metodologice iar cei estici de context cultural si informa�ii pentru metode. Acest proiect se bazeaz� pe rezultatele acestui proiect. Obiectul a fost adaptarea si transferul metodelor vest-europene astfel ca ele sa fie aplicate in Bra�ov in particular si in România in general. Pentru a pune aceste metode in practica, in Bra�ov au fost organizate trei programe pilot la scara redusa, cu ajutorul studen�ilor romani si a staff-ului universitar. Proiectele pilot au fost organizate in trei faze. Prima etapa a fost de a se stabili care dintre metodele privind consumul casnic de energie, traficul rutier si m�surarea con�tiin�ei asupra mediului de�inute de IVEM si Olanda ar fi cele mai potrivite pentru Bra�ov. A fost analizat un num�r de metode, cuprinzând programe pentru calculator, chestionare si concepte teoretice. Au fost alese trei metode pe baza disponibilit��ii la costuri reduse si adaptabilit��ii la condi�iile din România. A doua faza se referea la condi�iile in care aceste metode erau aplicabile. Cel mai curent obstacol întâlnit in cercetare a fost disponibilitatea si accesul la informa�ie. Obiectul ultimei faze a fost determinarea unei cai de impartasire a cuno�tin�elor acumulate împreuna. Acesta a fost scopul principal al proiectelor pilot, care necesita o colaborare cu partenerii romani. Pe parcursul aceste cooper�ri au fost descoperite multe ‘drumuri ascunse’ sper mai multa informa�ie ca de asemeni si unele aspecte sociale nea�teptate ce i-au ajutat pe partenerii olandezi sa si fac� o idee despre aplicabilitatea metodelor. Cel din urma aspect este interesant pentru partenerii olandezi deoarece le permite sa si extind� metodele spre o aplicare generala. Primul proiect pilot s-a ocupat de ce consumul casnic de energie. In prima faza, programul “DoMUS” a fost ales ca poten�ial program potrivit pentru România. Scopul acestui proiect pilot a fost adaptarea bazei de date con�inând informa�ii despre materialele de construc�ie si climat in programul de calculator DoMUS, astfel incat programul sa poat� face o descriere exacta a folosirii casnice a energiei in România. Mai mult, programul a fost folosit la simularea consumului casnic de energie in trei tipuri de casa (casa izolata, casa f�când parte dintr-un sir si apartament) si la analizarea efectelor m�surii de economizare a energiei la acele case. Calculele au ar�tat ca un anumit comportament privind energia are un efect clar asupra consumului casnic de energie. Sc�derea temperaturii din camera noaptea sau când nimeni nu este acas� poate duce la o reducere de aprox. 20% in consumul de energie in orice tip de casa. Astfel investi�ia in termostate de camera este un mod ieftin si eficient de reducere a consumului de energie. Casele izolate consuma cea mai multa energie din cauza ariei largi de expunere a pere�ilor, si deci ar beneficia cel mai mult de o izolare a pere�ilor (reducere de aprox. 14 %) in compara�ie cu celelalte tipuri de casa. Schimbarea ferestrelor normale cu cele ce ofer� o buna izolare termica poate aduce o reducere de 15% la casele izolate si la cele in sir. Pe de alta parte, apartamentele sunt cele mai mici consumatoare de energie datorita suprafe�ei mici de expunere a pere�ilor si pentru ca sunt mult mai mici decât celelalte tipuri de case. In acest caz, schimbarea ferestrelor este extrem de eficienta ducând la o reducere de aprox. 20% a consumului de energie. Al doilea proiect pilot s-a ocupat de modelarea traficului. Scopul acestui proiect a fost identificarea posibilit��ilor de folosire a unor platforme-model care sa reprezinte si sa analizeze situa�ia traficului din Bra�ov. Acesta includea de asemenea stabilirea nivelului de complexitate a unui proiect atât de
curajos, si identificarea obstacolelor ce pot ap�rea. Programul PC OmniTrans a fost ales pentru construirea unei perspective model pentru calcularea fluxului traficului de automobile si camioane in Bra�ov. Au fost luate in considerare trei scenarii simplificate: un scenariu de baza descriind situa�ia prezenta a traficului din ora�, o varianta de leg�tura care analiza efectul construirii unei autostr�zi de centura in afara ora�ului, si o varianta de mall privind efectele locale ale construirii unui mall intr-o parte a ora�ului. Simul�rile f�cute in cadrul programului OmniTrans au indicat efectele masurilor fluxului de transport atât la nivel de ora� cat si la nivel restrâns, de zona a ora�ului respectiv. Acestea au ar�tat, chiar si in cazul unui scenariu simplu, ca o sosea de centura ar decongestiona traficul in centrul ora�ului. Rezultatele au ar�tat totu�i ca doar prin construirea unei �osele de centura nu se rezolva toate problemele de trafic din centrul ora�ului, ci este nevoie si de masuri adi�ionale cum ar fi restrângerea accesului pe anumite str�zi din centru, imbunatatirea calit��ii str�zilor si a ma�inilor. Al treilea proiect pilot a avut ca scop proiectarea si testarea unui chestionar despre con�tiin�a asupra mediului si reciclare, care ar putea fi folosit de ABMEE pentru testarea implic�rii publice in campanii de reciclare si pentru a ob�ine informa�ii despre rela�iile intre implicarea pe de o parte si factorii economico-sociali si de con�tiin�a de mediu [ a publicului] pe de alta. Ca baza a fost ales un chestionar din proiectul ToolSust si apoi a fost adaptat pentru aplicarea in Bra�ov. Implicând studen�ii romani de la psihologie in acest proces, a fost atins si un scop secundar, si anume evaluarea diferen�elor ce exista intre Europa de Est si cea de Vest in ceea ce prive�te întocmirea unui chestionar. Rezultatul proiectului a fost un chestionar adaptat si trade in limba romana preg�tit pentru a fi folosit. Formatul a fost conceput in a�a fel incat sa poat� fi folosit atât intr-un sondaj prin posta cat si intr-unul direct, fata in fata. Au fost organizate teste in prealabil pentru a se identifica si elimina posibile probleme pe care le-ar putea întâmpina intervieva�ii in momentul complet�rii chestionarului. Unele întreb�ri ca de ex cele relat� de situa�ia financiara au atins subiecte delicate si se pot dovedi problematice. Astfel aceste întreb�ri au purtat men�iunea “op�ional”. De�i chestionarul men�ioneaz� unele subiecte doar superficial, se pot m�sura cuno�tin�ele de mediu ale intervievatului suficient incat sa determine statistic rela�ia acestuia cu implicarea activa in proiectul de reciclare. In cele din urma, acest proiect a ar�tat beneficiile schimbului extensiv de cuno�tin�e dintre doua culturi [academice] diferite, sco�ând in evidenta caracteristicile win-win pentru to�i partenerii. Acest proiect a ar�tat de asemenea eficienta folosirii de Science Shops pentru completarea curriculumului standard universitar sau licean. Mul�i studen�i au participat la acest proiect si asta le-a permis sa pun� in practica unele cuno�tin�e achizi�ionate la cursuri si sa-si dezvolte abilitatele. Aceste abilita�i include c�utarea de informa�ii, formularea cererii de c�utare si comunicarea rezultatelor in scris si in prezent�ri orale. Aceasta co-produc�ie mul�i/interdisciplinara de cuno�tin�e a reprezentat un exerci�iu valoros pentru ambele par�i (Olandeza si Romana). Studen�ii romani au fost expu�i la metoda de cercetare olandeza iar in schimb au permis accesul liber la contextual romanesc, u�urând astfel transferul de cuno�tin�e, scopul principal al acestui proiect.
19
Chapter 1: Introduction 1.1 Background and Problem Definition
Background Information about the City of Bra�ov1 The city of Bra�ov is located in the mountains of the central part of Romania in the region called Transilvania, and is considered one of the most important cities of the country. It is located approximately 160 km from Bucharest, Romania's capital. The city of Bra�ov is the capital of the “judet of Bra�ov2”, which is equivalent to a county (see Figure 1-1). The city stretches over a surface of approx. 267 km2, and holds a population of 307,000 inhabitants. (Rata et. al., 2002). Bra�ov has a temperate-continental climate with cold and relatively wet weather. The winters are long, and last from November to April.
Figure 1-1: Location of Bra�ov county, with its capital Bra�ov city (Source: Sysoft S.R.L., 2000).
Bra�ov is plagued with many environmental problems, like many other Eastern-European cities. In the past decades, economic hardship has prevented structural investments in the road infrastructure, buildings, energy plants and energy distribution networks. This has lead to many issues concerning air and water pollution, inefficient energy use, and problems related to road traffic. The problems are further compounded by the high demand for urban heating in the long and cold winters and by the location of the city: The city is situated in a valley, which hampers ventilation. This, together with high levels of pollutant emissions and thermal inversion frequently causes smog during the winter.
1 Source: (Sysoft S.R.L., 2000). In this paper, whenever the source is given through a footnote in the title of a section, it denotes that that whole section is (mainly) based on that particular source. If additional complementary sources are used in the section, those sources will be given at the end of the sentence [noted as <sentence (source).>] or paragraph [noted as <paragraph. (source)>] 2 The name “Bra�ov” will be used to denote the city of Bra�ov (“Orasul Bra�ov”). “Bra�ov county” will be used when referring to the “Judet of Bra�ov”.
20
ABMEE3, the Science Shops, and the Centre for Energy and Environmental Studies In order to effectively tackle these problems in Bra�ov, the Agency of Bra�ov for Management of Energy and Environment (“ABMEE4”) was set up. It started its activities with the support of the SAVE 2 Program of the European Commission in July 2003, and is a collaborative effort of many companies and organizations that deal with environmental issues in the city. The tasks of ABMEE include assisting the local authorities in establishing a complete and detailed energy master plan, for each economic sub-sector. The main objectives of ABMEE are linked to the sustainable development of Bra�ov, with energy efficiency and environmental protection as basis of that development. These objectives are (among others): • To promote energy efficiency policies and the use of alternative energy, and finding efficient
solutions for the urban heating system in Bra�ov, • To improve the road traffic by means of joint public and private traffic planning, • To monitor and improve the air quality by promoting clean energy and implementation of clean-
technologies, • To create a database of energy and environment indicators and effectively involve the public in
energy saving and environmental protection. ABMEE works extensively with the University of Transilvania, which is located in Bra�ov and one of the founding members of ABMEE. The contact with the university is often mediated by the Intermediu Science Shop5 affiliated with the chemistry department of the university (Intermediunet Bra�ov). The Science Shop provides ABMEE access to academic expertise and scientific knowledge available at the university. It is also connected to other Science Shops, both national and international, through the extensive Science Shop network. Intermediu Bra�ov is connected to the Groningen Science Shops through the “Matra” project. The Groningen Science Shop works closely with the Groningen University's Centre for Energy and Environmental Studies (IVEM). The IVEM has many years of experience with methods for end-use energy management relating to households and transport. Research has been done covering both scientific and behavioural aspects of environmental issues. A number of methods have been developed in EU projects, such as the FP5-funded project TOOLSUST (Involvement of Stakeholders to Develop and Implement Tools for Sustainable Households in the City of Tomorrow), a project involving five European cities. Other, more instrumental methods include the simulation model DoMUS (Domestic Metabolism User-friendly Simulated), which can be used to compute the energy consumption of Dutch households. Through this network of Science Shops and universities, ABMEE (and the city of Bra�ov in general) has access to a vast amount of knowledge throughout Europe. It can draw from this knowledge, which in turn can facilitate in the analysis of the problems, and help work towards solutions.
Problem Definition ABMEE (and the Bra�ov master plan) strives to accomplish a major reversal in energy consumption patterns, to improve road traffic patterns, and combat air pollution. These issues are complex and have a long history. Many of the urban heating stations, roads, and cars are in bad condition due to insufficient maintenance. In order to effectively tackle a project of this magnitude, the parties involved should have a deep understanding of the situation, and the underlying mechanisms that created and sustain it. Furthermore, a broad methodological knowledge to (further) analyze the situation, formulate action plans, implement those plans, and evaluate the results thereof is needed. The ABMEE, has the knowledge of the situation, but has indicated that it lacks sufficient experience with methodologies. The IVEM, and other western research centres have accumulated a great number
3 Note: in this paper, ABMEE is used as a general term, referring to ABMEE as an organization or to the ABMEE representatives and staff, depending on the context. 4 See Section 2.2: ABMEE and the SAVE program. 5 See Section 2.3: The Science Shops and the MATRA Project.
21
of methods through years of research and those methods have proven their worth through various forms of implementations. A cooperation between the IVEM and ABMEE will form the basis for a bilateral exchange in information and insight (see Figure 1-2).
Figure 1-2: Graphical representation of the effect of extensive cooperation on the knowledge available to the various parties. The dark grey areas represent the effective knowledge available to both parties, which can be employed to tackle the situation. The light grey regions represent knowledge available only to one party. Redrawn after examples presented by H. Mulder (Mulder, 2003).
The methods available to the IVEM are however tailor-made for the West-European situation and culture, and are therefore not always applicable in Romania. For this reason, an analysis on the applicability of these methods for the Bra�ov master plan was conducted, which served as the premise of this M.Sc. research and thesis. The above mentioned cooperation is thus mutually beneficial: For the Romanian partner, it offers a toolkit of methods that may be of use in reaching targets for a sustainable city. For the Dutch partner it generates insight in the methodologies, and the broader application of these methods.
22
1.2 Aims of this study and Main Research Question The main problem looked at in this paper is the adaptation and transfer of methods, so that they can be used in Bra�ov and more generally, in Romania. This leads to the formulation of the Main Research Question as: "What type of methodologies applicable to end-use household energy-consumption, environmental awareness, and road-traffic analysis are suitable to apply in Eastern-European cities and households, under which conditions can they be applied, and how can the transfer of this knowledge best take place?” It is clear from this main research question that the process of the knowledge transfer is divided into three steps. The aim of this project is thus tree-fold: • The first aim is to establish, which of the methods6 available to the IVEM and in the Netherlands
are suitable for use in the Bra�ov master plan. The focus will be on methods dealing with end-use household energy consumption, environmental awareness, and road traffic (and related air pollution).
• The second aim is to determine the conditions under which these methods are applicable. • The third aim is to ascertain how the transfer of this knowledge can best take place. The focus here is on the exchange of available knowledge, and the integration of that knowledge within the existing matrix, i.e. to insure that the information is adapted in such a way that it can be used within the new context, location or application. The latter is important, to insure that the methods are tuned to the local needs and system. At the end of this project an overview detailing these methods and the applicability thereof will be presented to ABMEE and the other involved parties (see Figure 1-3) through written reports and oral presentations. 1.3 Methodology The project was conducted as a collaborative effort, in a multidisciplinary approach. The main parties involved were the Chemistry Shop of the University of Groningen, the INTERMEDIU Bra�ov, affiliated to the Transilvania University Bra�ov, ABMEE, and the Centre for Energy and Environmental Studies (IVEM) of the University of Groningen (see Figure 1-3).
6 The term “Methods” is used here in a broad manner. It includes all types of instruments, such as computer programs, questionnaires, and conceptual instruments that can be used for analyzing environmental issues.
23
Figure 1-3: The parties involved in this project, and how they relate to one another. The lines indicate a business involvement, while the double arrows (connected to the students) show the various avenues of supervision.
All the parties involved were consulted intensively during the whole project, with emphasis on continuous feedback between the parties, and an open eye to the demands of these parties.
Stages of the project: The main focus of the project was the “transfer of knowledge”. This was done on various levels: Besides the actual transfer and adaptation of the methods, the cooperation as stated above was another essential part of the knowledge transfer; by involving the Romanian partners (ABMEE, the Intermediu Bra�ov and university teaching staff, and students) throughout the whole project, they got the chance to familiarize themselves not only with the specific methods, but also with the general approach used when working with methods in general. Another essential part of the transfer was the testing of the methods in their practical applications. For this, three small-scale pilot projects were conducted. These pilot projects enabled all the various aims, parties and aspects of this research to be integrated in an elegant way. The project was divided into three phases. Work was done towards achieving the three project aims during all three phases, but the focus changed from phase to phase. Below is a short description of the phases. A more elaborate description of the methodology can be found in chapter 3.
Phase One: Orientation and Preparation: Duration and Location: October 2003 - January 2004, Groningen (The Netherlands). In the first phase of the project, an inventory of the various methods was made, to determine their main characteristics, their use and limitations, and the instruments needed for their application. This was done by conducting a literature study, and by interviewing experts on the various methods. This phase therefore focused mainly on the first aim, to establish which methods showed promise to be used in Bra�ov. A pre-selection of potential methods was made, and these methods were then further examined and used in the second phase.

24
Phase Two: One Site Assessment of Possibilities to Employ Methods: Duration and Location: February 2004- June 2004, Bra�ov (Romania). In the second phase of the project an assessment was made of how the methodologies could be developed and applied in Bra�ov. This was done during an internship in Bra�ov, gathering “first hand” information on cultural and other everyday-live aspects of the city, and with that, the insight how the transition between in the Netherlands and Romania could best be accomplished. This phase focused mainly on the second and the third aims. This involved ascertaining what type of data was available to adapt the methods, choosing the final three programs to be used in the pilot projects, adapting the methods and running the pilot projects in cooperation with the Science Shop staff and students. Again, the involvement of Romanian participants in all the projects was an important part in this phase. The university staff, ABMEE, and students supplied a great number of the data used in the projects, and each pilot project had a number of student participants. During the second phase trips were made back and forth between The Netherlands and Romania when needed, to further consult with experts on the methods and insure that the highest possible efficiency was attained during the pilot-projects.
Phase Three: Completion of Projects and dissemination of results: Duration and location: June 2004 - August 2005, Bra�ov and Groningen. In this phase the results of the pilot projects were further analyzed, and the projects were completed. These results were then shared with the involved and interested parties through oral and written communications (including this thesis). The results were also made available through presentations made by the Romanian students to the university staff, and on the ENVEDU (Ten Meer et. al., 2004a) and INRO (Ten Meer et. al., 2004b) conferences held in June 2004 in Bra�ov.
25
Chapter 2: Bra�ov and the Agencies 2.1 Description of the City of Bra�ov and its Environment-Related Issues
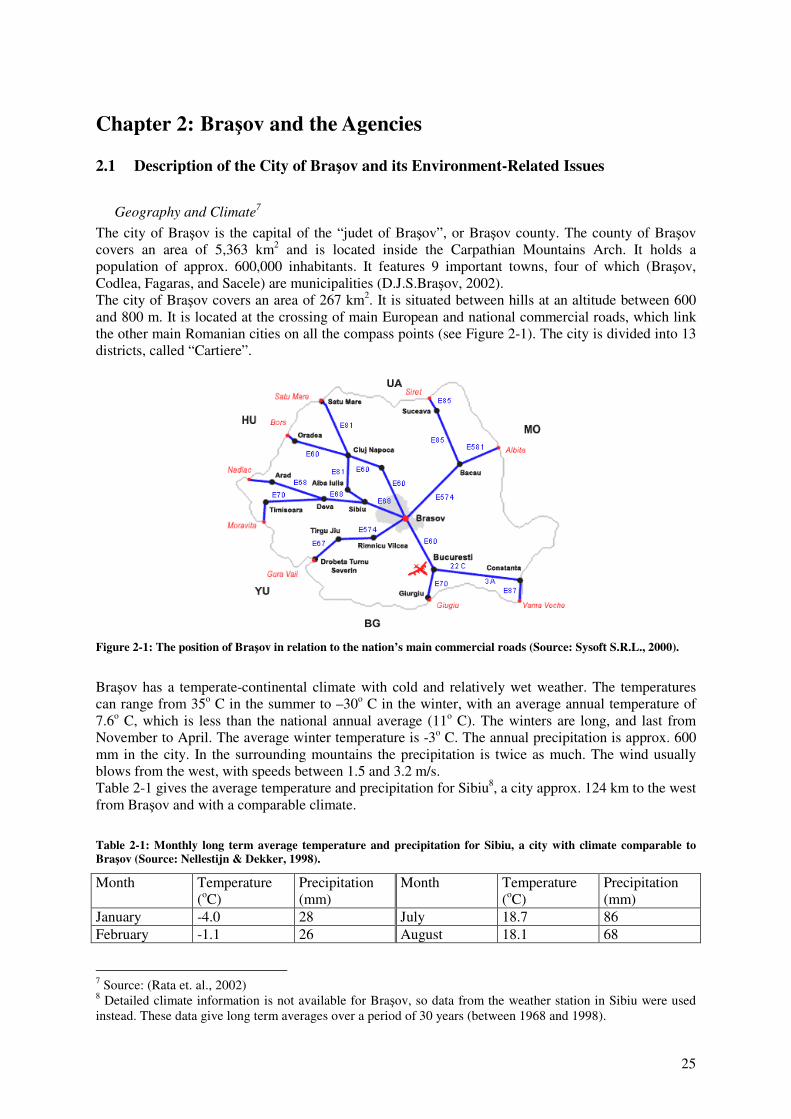
Geography and Climate7 The city of Bra�ov is the capital of the “judet of Bra�ov”, or Bra�ov county. The county of Bra�ov covers an area of 5,363 km2 and is located inside the Carpathian Mountains Arch. It holds a population of approx. 600,000 inhabitants. It features 9 important towns, four of which (Bra�ov, Codlea, Fagaras, and Sacele) are municipalities (D.J.S.Bra�ov, 2002). The city of Bra�ov covers an area of 267 km2. It is situated between hills at an altitude between 600 and 800 m. It is located at the crossing of main European and national commercial roads, which link the other main Romanian cities on all the compass points (see Figure 2-1). The city is divided into 13 districts, called “Cartiere”.
Figure 2-1: The position of Bra�ov in relation to the nation’s main commercial roads (Source: Sysoft S.R.L., 2000).
Bra�ov has a temperate-continental climate with cold and relatively wet weather. The temperatures can range from 35o C in the summer to –30o C in the winter, with an average annual temperature of 7.6o C, which is less than the national annual average (11o C). The winters are long, and last from November to April. The average winter temperature is -3o C. The annual precipitation is approx. 600 mm in the city. In the surrounding mountains the precipitation is twice as much. The wind usually blows from the west, with speeds between 1.5 and 3.2 m/s. Table 2-1 gives the average temperature and precipitation for Sibiu8, a city approx. 124 km to the west from Bra�ov and with a comparable climate.
Table 2-1: Monthly long term average temperature and precipitation for Sibiu, a city with climate comparable to Bra�ov (Source: Nellestijn & Dekker, 1998).
Month Temperature (oC)
Precipitation (mm)
Month Temperature (oC)
Precipitation (mm)
January -4.0 28 July 18.7 86 February -1.1 26 August 18.1 68
7 Source: (Rata et. al., 2002) 8 Detailed climate information is not available for Bra�ov, so data from the weather station in Sibiu were used instead. These data give long term averages over a period of 30 years (between 1968 and 1998).
26
March 3.8 31 September 14.4 51 April 9.4 54 October 8.9 42 May 14.2 78 November 3.1 34 June 17.1 99 December -1.1 30
Population and Economy9 Bra�ov has as population of approx. 307,000 inhabitants, and is the 5th largest city in Romania, in terms of population. After the revolution in 1989, the city –together with the rest of Romania- was confronted with a difficult decade with controversial social events, and political reforms. The changes of the political and social system affected the structure of the economy, and the transition to a market economy was a difficult one. The employment rate in the city is still low (39%). The tertiary sector represents 53% of the total employment in the city, and is the largest of the three sectors (see Table 2-2). The main tertiary activities concern commerce and public service. The salaries are often low, and some stores (e.g. groceries stores) are open 24 hours a day, seven days a week.
Table 2-2: Social profile: Statistics on economy and population (Source: Rata et. al., 2002).
CITY OF BRA�OV Population Total
307,046 Male
148,577 Female 158,469
Employment rate 39.2% Employed in the productive sectors
Agriculture 1%
Industry 46%
Tertiary 53%
Main industrial branches (in terms of employees)
Machine manufacturing 51,000
Facilities industry 4,000
The industry of Bra�ov is diverse, employing 46% of the working population. The main fields are the manufacturing of vehicles (trucks, tractors, and railway equipments), helicopters, light aircrafts, and machine tools. Equipment for energy and petrol industry is also produced. Other branches include chemical, rubber and cosmetic industry, woodworking, and building materials. The city had to deal with the loss of several large industrial enterprises in the last decade (e.g. Roman -a truck factory and Tractorul -a tractor factory), but it is still the second largest Romanian city in terms of industry, after Bucharest. With fewer inhabitants than the capital, Bra�ov has the larger “industrial concentration” in the nation. The largest remaining industrial enterprises are: METROM – a mechanical-assembly factory, S.C. FARTEC S.A. – a rubber and rubber by-products factory, and RULMENTUL – a bearing factory.
Traffic10 Bra�ov lies at the centre of a convergence of three Romanian and three European main commercial roads, five of which are depicted in Figure 2-1. The city is also an important economic and social centre, with the presence of big industrial agglomerations. It also has a large appeal to tourists. All these factors contribute to a high demand of mobility in and around the city. One of the major inconveniences of the traffic is the overlap of the traffic flow in industrial and residential agglomerated area with the transit flow, which consists of both heavy and light vehicles. The streets are not equipped to handle this load. The street network consists of 551 streets with a total length of 260 km. The condition of the streets is very poor. The lifespan of nearly 94% of the streets has been exceeded by 10 years. The streets are often too narrow, especially in the old part city centre. 9 Source: (Rata et. al., 2002) 10 Source: (Rata et. al., 2002)
27
Traffic is intense there, with few variants of access. There is no bypass, so the transit traffic goes through the city. The light vehicles go through the city centre, while the heavy transport transits on lateral streets, through residential areas, causing damage to tram rails and the street surface. The effect of the transition to a market economy can also be seen in the traffic: the number of vehicles has doubled between 1990 and 1998 (see Table 2-3), and the average traffic flow on some main roads has tripled between 1990 and 2001.
Table 2-3: Vehicle Statistics of Bra�ov; number of vehicles between 1990 and 1998 (Source: Rata et. al., 2002)11.
Public Sector Private sector Total Vehicle type 1990 1998 1990 1998 1990 1998
Cars 866 5101 45450 90810 46316 95911 Small busses 95 39 - 204 95 243 Busses 600 629 - 237 600 866 Vans 9162 12060 - 8457 9162 20517 Autotractors 808 550 - 544 808 1094 Tractors 6062 5719 - 2759 6062 8478 Motorcycles 503 768 8922 9266 9425 10034 Total 18106 24866 54372 110477 72478 135343 A large segment of the population still uses public transportation, despite the sharp increase in the number of privately owned vehicles. It is estimated that more than 70% of the active population uses this form of transportation to go to school or work. There are however a few problems related to it. The vehicles used (busses, trams, etc) are large, run at low speeds (average 12-18 km/h) and with many stops, thus reducing the overall traffic flow. In some areas a special lane for public transport has been built to combat this problem. The transport with heavy busses and trams is complemented by a large amount of taxis in the city, and together they supply ample options for public transportation. The taxi fare however is often too expensive for a large part of the people relying public transportation.
Energy Production and Consumption in Bra�ov12 The total heat demand in Bra�ov was approx. 7.745 TJ/year (1.850 TCal/year) in 2002. Many of the houses in the old part of the city rely on individual stoves and gas burners for their heat supply, but most apartments are connected to the urban district heating network. Figure 2-2 shows the distribution of the heat production between the various heat sources. The main fuel types used are natural gas (58%), coal (38%), and oil (4%). Although Bra�ov has access to large quantities of biological matter such as waste from the timber industry and straw, there is still no systematic development towards exploitation of these fuel sources.
11 After a Bra�ov city hall traffic study done in 1998. 12 Source: (Rata et. al., 2002)
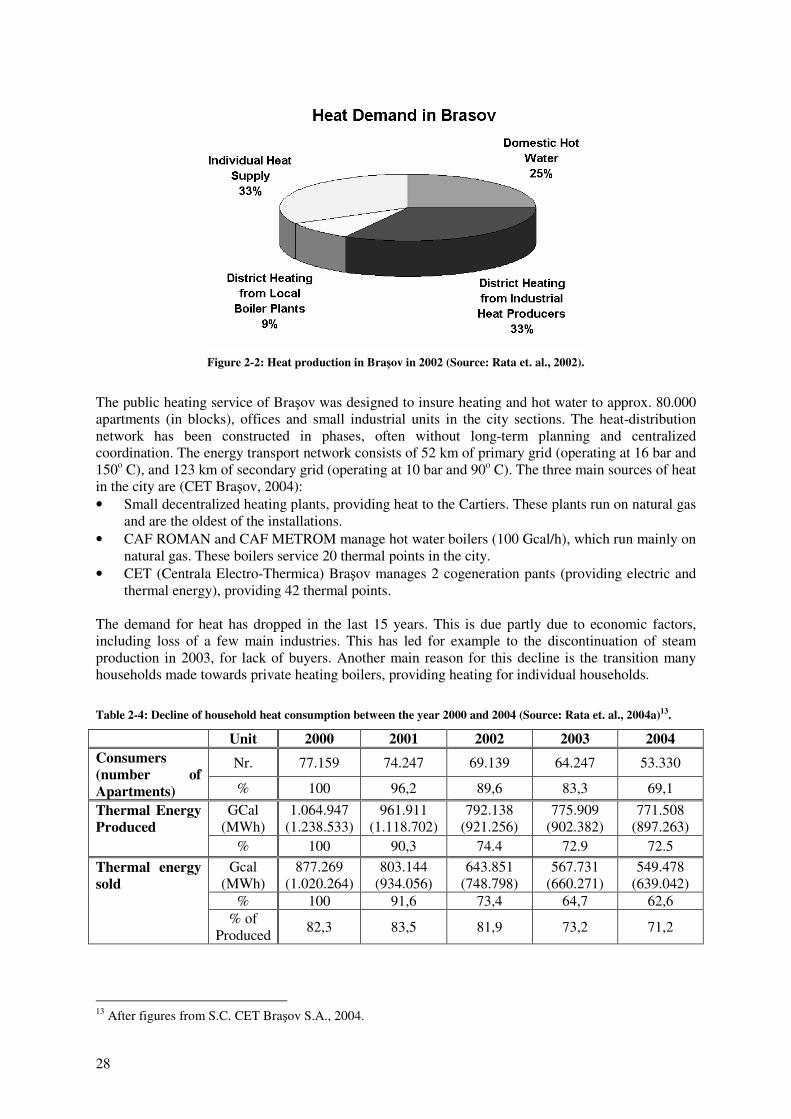
28
Figure 2-2: Heat production in Bra�ov in 2002 (Source: Rata et. al., 2002).
The public heating service of Bra�ov was designed to insure heating and hot water to approx. 80.000 apartments (in blocks), offices and small industrial units in the city sections. The heat-distribution network has been constructed in phases, often without long-term planning and centralized coordination. The energy transport network consists of 52 km of primary grid (operating at 16 bar and 150o C), and 123 km of secondary grid (operating at 10 bar and 90o C). The three main sources of heat in the city are (CET Bra�ov, 2004): • Small decentralized heating plants, providing heat to the Cartiers. These plants run on natural gas
and are the oldest of the installations. • CAF ROMAN and CAF METROM manage hot water boilers (100 Gcal/h), which run mainly on
natural gas. These boilers service 20 thermal points in the city. • CET (Centrala Electro-Thermica) Bra�ov manages 2 cogeneration pants (providing electric and
thermal energy), providing 42 thermal points. The demand for heat has dropped in the last 15 years. This is due partly due to economic factors, including loss of a few main industries. This has led for example to the discontinuation of steam production in 2003, for lack of buyers. Another main reason for this decline is the transition many households made towards private heating boilers, providing heating for individual households.
Table 2-4: Decline of household heat consumption between the year 2000 and 2004 (Source: Rata et. al., 2004a)13.
Unit 2000 2001 2002 2003 2004
Nr. 77.159 74.247 69.139 64.247 53.330 Consumers (number of Apartments) % 100 96,2 89,6 83,3 69,1
GCal (MWh)
1.064.947 (1.238.533)
961.911 (1.118.702)
792.138 (921.256)
775.909 (902.382)
771.508 (897.263)
Thermal Energy Produced
% 100 90,3 74.4 72.9 72.5 Gcal
(MWh) 877.269
(1.020.264) 803.144
(934.056) 643.851
(748.798) 567.731
(660.271) 549.478
(639.042) % 100 91,6 73,4 64,7 62,6
Thermal energy sold
% of Produced 82,3 83,5 81,9 73,2 71,2
13 After figures from S.C. CET Bra�ov S.A., 2004.
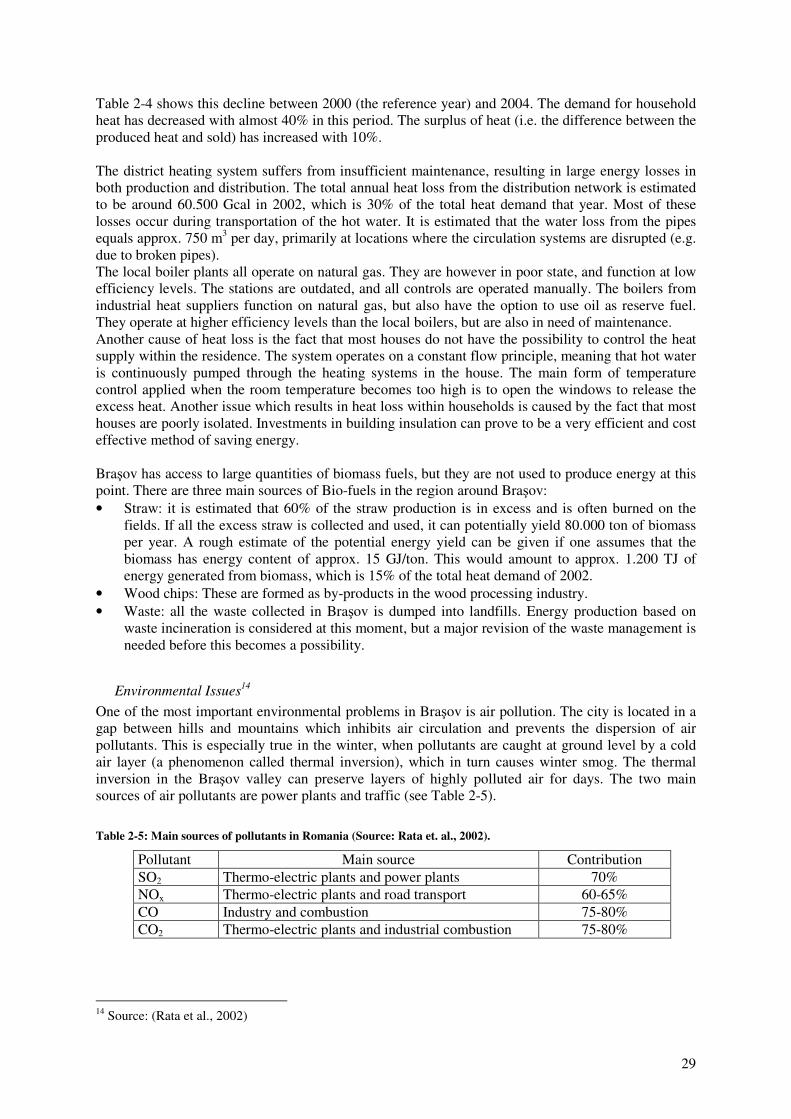
29
Table 2-4 shows this decline between 2000 (the reference year) and 2004. The demand for household heat has decreased with almost 40% in this period. The surplus of heat (i.e. the difference between the produced heat and sold) has increased with 10%. The district heating system suffers from insufficient maintenance, resulting in large energy losses in both production and distribution. The total annual heat loss from the distribution network is estimated to be around 60.500 Gcal in 2002, which is 30% of the total heat demand that year. Most of these losses occur during transportation of the hot water. It is estimated that the water loss from the pipes equals approx. 750 m3 per day, primarily at locations where the circulation systems are disrupted (e.g. due to broken pipes). The local boiler plants all operate on natural gas. They are however in poor state, and function at low efficiency levels. The stations are outdated, and all controls are operated manually. The boilers from industrial heat suppliers function on natural gas, but also have the option to use oil as reserve fuel. They operate at higher efficiency levels than the local boilers, but are also in need of maintenance. Another cause of heat loss is the fact that most houses do not have the possibility to control the heat supply within the residence. The system operates on a constant flow principle, meaning that hot water is continuously pumped through the heating systems in the house. The main form of temperature control applied when the room temperature becomes too high is to open the windows to release the excess heat. Another issue which results in heat loss within households is caused by the fact that most houses are poorly isolated. Investments in building insulation can prove to be a very efficient and cost effective method of saving energy. Bra�ov has access to large quantities of biomass fuels, but they are not used to produce energy at this point. There are three main sources of Bio-fuels in the region around Bra�ov: • Straw: it is estimated that 60% of the straw production is in excess and is often burned on the
fields. If all the excess straw is collected and used, it can potentially yield 80.000 ton of biomass per year. A rough estimate of the potential energy yield can be given if one assumes that the biomass has energy content of approx. 15 GJ/ton. This would amount to approx. 1.200 TJ of energy generated from biomass, which is 15% of the total heat demand of 2002.
• Wood chips: These are formed as by-products in the wood processing industry. • Waste: all the waste collected in Bra�ov is dumped into landfills. Energy production based on
waste incineration is considered at this moment, but a major revision of the waste management is needed before this becomes a possibility.
Environmental Issues14 One of the most important environmental problems in Bra�ov is air pollution. The city is located in a gap between hills and mountains which inhibits air circulation and prevents the dispersion of air pollutants. This is especially true in the winter, when pollutants are caught at ground level by a cold air layer (a phenomenon called thermal inversion), which in turn causes winter smog. The thermal inversion in the Bra�ov valley can preserve layers of highly polluted air for days. The two main sources of air pollutants are power plants and traffic (see Table 2-5).
Table 2-5: Main sources of pollutants in Romania (Source: Rata et. al., 2002).
Pollutant Main source Contribution SO2 Thermo-electric plants and power plants 70% NOx Thermo-electric plants and road transport 60-65% CO Industry and combustion 75-80% CO2 Thermo-electric plants and industrial combustion 75-80%
14 Source: (Rata et al., 2002)
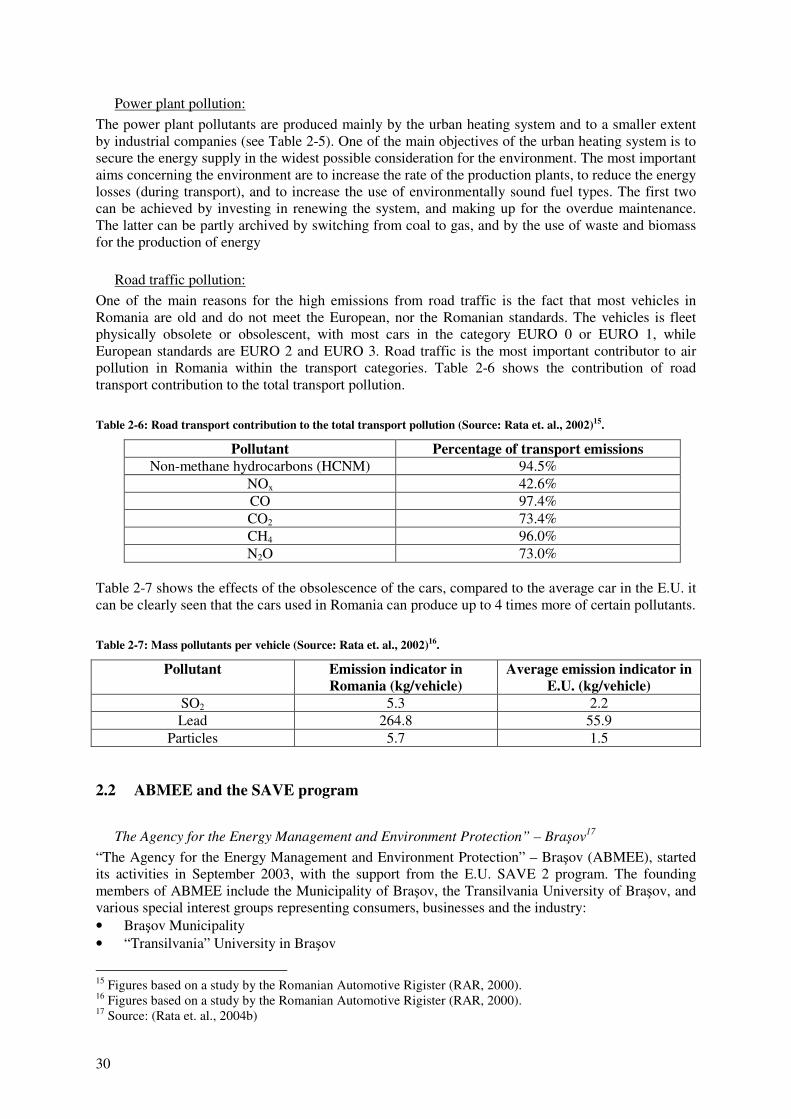
30
Power plant pollution: The power plant pollutants are produced mainly by the urban heating system and to a smaller extent by industrial companies (see Table 2-5). One of the main objectives of the urban heating system is to secure the energy supply in the widest possible consideration for the environment. The most important aims concerning the environment are to increase the rate of the production plants, to reduce the energy losses (during transport), and to increase the use of environmentally sound fuel types. The first two can be achieved by investing in renewing the system, and making up for the overdue maintenance. The latter can be partly archived by switching from coal to gas, and by the use of waste and biomass for the production of energy
Road traffic pollution: One of the main reasons for the high emissions from road traffic is the fact that most vehicles in Romania are old and do not meet the European, nor the Romanian standards. The vehicles is fleet physically obsolete or obsolescent, with most cars in the category EURO 0 or EURO 1, while European standards are EURO 2 and EURO 3. Road traffic is the most important contributor to air pollution in Romania within the transport categories. Table 2-6 shows the contribution of road transport contribution to the total transport pollution.
Table 2-6: Road transport contribution to the total transport pollution (Source: Rata et. al., 2002)15.
Pollutant Percentage of transport emissions Non-methane hydrocarbons (HCNM) 94.5%
NOx 42.6% CO 97.4% CO2 73.4% CH4 96.0% N2O 73.0%
Table 2-7 shows the effects of the obsolescence of the cars, compared to the average car in the E.U. it can be clearly seen that the cars used in Romania can produce up to 4 times more of certain pollutants.
Table 2-7: Mass pollutants per vehicle (Source: Rata et. al., 2002)16.
Pollutant Emission indicator in Romania (kg/vehicle)
Average emission indicator in E.U. (kg/vehicle)
SO2 5.3 2.2 Lead 264.8 55.9
Particles 5.7 1.5 2.2 ABMEE and the SAVE program
The Agency for the Energy Management and Environment Protection” – Bra�ov17 “The Agency for the Energy Management and Environment Protection” – Bra�ov (ABMEE), started its activities in September 2003, with the support from the E.U. SAVE 2 program. The founding members of ABMEE include the Municipality of Bra�ov, the Transilvania University of Bra�ov, and various special interest groups representing consumers, businesses and the industry: • Bra�ov Municipality • “Transilvania” University in Bra�ov
15 Figures based on a study by the Romanian Automotive Rigister (RAR, 2000). 16 Figures based on a study by the Romanian Automotive Rigister (RAR, 2000). 17 Source: (Rata et. al., 2004b)
31
• The County Office for the Consumers’ Protection (IJPC) • The Home Owners’ Association • The ECO PLUS, NGO • The Autonomous Public Transport Company in Bra�ov City (RAT) • Comprest Inc (Waste-management company). • The Romanian Agency for the Conservation of Energy (ARCE) • The Inspectorate for the Protection of Environment (IJPM) • CET Bra�ov • The Brach for the Distribution and Supply of Electric Energy in Bra�ov City (SDFEE) • The National Institute of Motor Vehicles (INAR) ABMEE does not have a decision-making authority. Its focus is on developing projects, conducting studies, and advising the local administration (the decision body). The main objectives of ABMEE are linked to the sustainable development of Bra�ov, with energy efficiency and environmental protection as basis of that development. These objectives are (Rata et. al., 2003): • To promote energy efficiency decisions and the use of alternative energy. • To find efficient solutions for the problems affecting the urban heating system in Bra�ov • To improve the public lighting system and to reduce the energy consumption in this sector. • To improve the road traffic by means of joint public and private traffic-planning • To control and improve the air quality by promoting clean energy, and implementation of clean-
technologies • To create a database of energy and environment indicators which will serve as a basis for
sustainable development programs • To effectively involve the public in energy saving and environmental protection, by promoting
and raising awareness, by disseminating (programs) results, and by implementing other (more specific) measures.
These aims and objectives will be accomplished through: • The drawing up of a complete and detailed energy master plan, for each economic sub-sector
(electric energy, thermal energy, transport and environmental issues) • The implementation of concrete energy efficiency projects • The implementation of research and development projects • Information and training programs, dissemination of results, and other awareness-raising
measures, targeting various groups.
About SAVE II18 The Specific Actions for Vigorous Energy Efficiency Program (SAVE) is the principal focus of the European Community’s non-technological action on energy efficiency. It is the only Union-wide programmed dedicated exclusively to promoting energy efficiency and encouraging energy-saving behaviour through policy measures, information, studies and pilot actions. The SAVE Program contributes to the following objectives of community energy policy as stated in the Energy Framework Program: • To guarantee the security of energy supplies, • To ensure competitiveness, • To promote the compatibility of energy market development with environmental objectives. The SAVE II program aims to promote the rational use of energy within the Community. It is designed to make a significant contribution to the Union objectives for increased energy efficiency and to meeting its Kyoto commitments. The purpose of the program is to create an environment in
18 Source: (SAVE II, 2000)
32
which investments in energy efficiency are accelerated and where energy efficiency is recognized as a market opportunity. It is intended to promote market transformation, and the use and improvement of existing energy efficient technologies which are already on the market, but restricted (geographically, to a niche market, or by a low market share). Moreover, SAVE II has been designed to complement the efforts of the Member States in improving energy efficiency. This means that the program supports cost effective measures and actions which ensure added value for the rational use of energy at European Union level. 2.3 The Science Shops and the MATRA Project
The Science Shops Network19 Science Shops are organizations created as mediators between citizen groups (trade unions, pressure groups, non-profit organizations, environmentalists, consumers, residents association etc.) and research institutions (universities, independent research facilities). Science Shops are important actors in community-based research (CBR). There are many differences in the way Science Shops are organized and operate, as well as some important parallels. These parallels give rise to the working definition of Science Shops: A Science Shop provides independent, participatory research support in response to concerns experienced by civil society. In practice, contact is established between a civil society organization and a Science Shop or CBR centre on a problem in which the civil society organization is seeking research support. In this collective search for a solution new knowledge is generated, or at least existing knowledge is combined and adapted. The mission can be stated as follows: Science Shops use the term 'science' in its broadest sense, incorporating social and human sciences, as well as natural, physical, engineering and technical sciences. Science Shops seek to: • Provide civil society with knowledge and skills through research and education • Provide their services on an affordable basis • Promote and support public access to, and influence on science and technology • Create equitable and supportive partnerships with civil society organizations • Enhance understanding among policymakers, and education and research institutions of the
research and education needs of civil society • Enhance the transferable skills and knowledge of students, community representatives and
researchers Science Shops in general have three criteria for accepting clients: • Clients should have no commercial objectives with their question, and the research results must
become public; • Clients must be able to use the results of the research to achieve their mission. If necessary
clients can also be assisted in applying the results; • Clients may not have the (full) financial means to acquire their research by other means. The European Science Shops are organized in the thematic network ‘Living Knowledge’. The general objective of the Living Knowledge network is to give citizens around Europe better access to scientific information and expertise. The demand-driven approach of Science Shops contributes to this objective and offers citizens a tool to contribute in the science and society debate. Citizens' participation in the dialogue between science and society can be further advanced by sharing the expertise of existing Science Shops and by increasing support for the development of new Science Shops by improving the networking of Science Shops.
19 Source: (ISSNET, 2004)
33
Science Shops in Romania A pilot project “Science Shops in Romanian Moldova” was conducted between 1998 and 2000 in Romania to ascertain whether it was feasible to have Science Shops in a Romanian setting. During the pilot, four Romanian Science Shops were established in the universities of Bacau (Biology), Iasi (Biology and Chemistry) and Galati (Chemistry). The project proved to be successful, and was met with great enthusiasm for Science Shops at the level of the Ministry of Education that was looking for stimulation measures to introduce problem-based learning at universities. (Fokkink & Mulder, 2003) In 2002 the follow-up project “Problem-based learning through Science Shops in Romania” was started. Four new Romanian Science Shops were established in the universities of: Bra�ov (Chemistry), Ploiesti (Chemistry), Bucharest (Chemistry) and Oradea (Biology). Both the pilot project on Science Shops in Romania and the follow-up project were funded by the Netherlands Ministry of Foreign Affairs, through the MATRA Programme. (IntermediuNet, 2004a) The success of Science Shops in Romania can mainly be attributed to the following factors (Fokkink & Mulder, 2003; Fokkink & Mulder, 2004): • They offer tools to reform education by developing and facilitating problem based learning; • They are headed by good local coordinators. • Students are eager to participate in applied projects, which deviate from the mostly theoretical
curricula; • The Science Shops have a good cooperation with, and commitment from host universities; • Both projects were supported by a Dutch team with experience and skills on both Science Shops
and on Romania. The follow-up project was held between September 2002 and September 2005. The focus of the project is to develop further cooperation with other cities (e.g. Ploiesti, Bucharest and Oradea), and to broaden the scope to include more disciplines (increase the multidisciplinary character of the Science Shops) Apart from developing individual shops the project also concentrated on building a national Science Shop network, which will function as a mutual support mechanism for Romanian Science Shops. This network organization was called the “INTERMEDIUNET Romania Association” (INRO). (Fokkink & Mulder, 2003) The goals of the network are (IntermediuNet, 2004a): • To improve the environmental quality, the population’s health status, as well as social conditions • To promote partnerships between universities and civil society groups, with a view to ensure the
sustainable development at local, regional, and national level • To develop and consolidate the Romanian Science Shops • To insure active cooperation and exchange of information within the international network of
Science Shops.

34
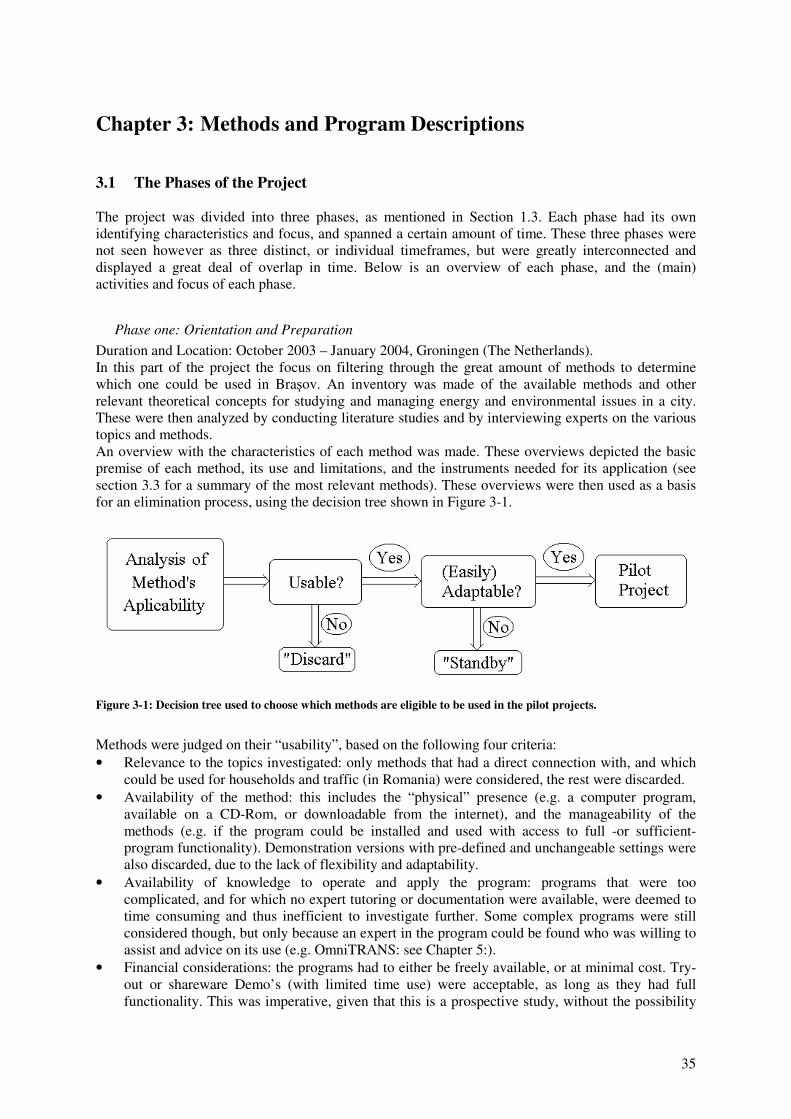
35
Chapter 3: Methods and Program Descriptions 3.1 The Phases of the Project The project was divided into three phases, as mentioned in Section 1.3. Each phase had its own identifying characteristics and focus, and spanned a certain amount of time. These three phases were not seen however as three distinct, or individual timeframes, but were greatly interconnected and displayed a great deal of overlap in time. Below is an overview of each phase, and the (main) activities and focus of each phase.
Phase one: Orientation and Preparation Duration and Location: October 2003 – January 2004, Groningen (The Netherlands). In this part of the project the focus on filtering through the great amount of methods to determine which one could be used in Bra�ov. An inventory was made of the available methods and other relevant theoretical concepts for studying and managing energy and environmental issues in a city. These were then analyzed by conducting literature studies and by interviewing experts on the various topics and methods. An overview with the characteristics of each method was made. These overviews depicted the basic premise of each method, its use and limitations, and the instruments needed for its application (see section 3.3 for a summary of the most relevant methods). These overviews were then used as a basis for an elimination process, using the decision tree shown in Figure 3-1.
Figure 3-1: Decision tree used to choose which methods are eligible to be used in the pilot projects.
Methods were judged on their “usability”, based on the following four criteria: • Relevance to the topics investigated: only methods that had a direct connection with, and which
could be used for households and traffic (in Romania) were considered, the rest were discarded. • Availability of the method: this includes the “physical” presence (e.g. a computer program,
available on a CD-Rom, or downloadable from the internet), and the manageability of the methods (e.g. if the program could be installed and used with access to full -or sufficient- program functionality). Demonstration versions with pre-defined and unchangeable settings were also discarded, due to the lack of flexibility and adaptability.
• Availability of knowledge to operate and apply the program: programs that were too complicated, and for which no expert tutoring or documentation were available, were deemed to time consuming and thus inefficient to investigate further. Some complex programs were still considered though, but only because an expert in the program could be found who was willing to assist and advice on its use (e.g. OmniTRANS: see Chapter 5:).
• Financial considerations: the programs had to either be freely available, or at minimal cost. Try-out or shareware Demo’s (with limited time use) were acceptable, as long as they had full functionality. This was imperative, given that this is a prospective study, without the possibility
36
to support expensive licenses. Once a program has proven its applicability, it may be possible to consider buying a full license, but at this stage this was not possible.
Programs that were considered “usable” were then subjected to the next round of scrutiny, which analyzed the possibilities to adapt the programs to Romanian demands, if needed. This was done mainly in the second phase (See Below), when the necessity to adapt the program, and the degree in which that had to be done was ascertained. Programs which were not easily adaptable, or for which no data was available were put on “standby”, until such time that the option to adapt them became possible. The three most promising methods were selected to be used in the pilot projects.
Phase Two: One Site Assessment of Possibilities to Employ Methods Duration and Location: February 2004- June 2004, Bra�ov (Romania). The second phase of this project was divided into three parts: I) orientation, II) feedback, and III) implementation. Although the objectives of these parts are formulated as thought occurring in separate (discrete) time periods, the activities relating to all three parts occurred simultaneously (parallel), but the focus changed between those three periods.
I) Orientation: 26/01/04 – 25/03/04, Bra�ov The main objectives in this first part was to asses the situation “first hand” in Bra�ov, to build a network of co-operators, and to allow everyone involved [and the Romanian partners specifically] to get more insight into the methods. The time in Bra�ov was spent to get insight in the following matters: • Which stakeholders and [contact] persons are actively involved in ABMEE, and what are the
point of views and general attitudes of those stakeholders towards the project? • What are the main environmental problems in the city, and how do the policymakers and other
stakeholders grade these problems (i.e., which do they find important, and which not?) • What are the main objectives set for the programs conducted by ABMEE? • How is the general “environmental culture” in the city, and what is the prevalent “modus
Operandi” when tackling environmental problems (i.e., how do people go about to address and solve the problem?
• How does the Science Shop in Bra�ov operate on a daily basis, regarding cooperation with the University departments and faculties, and the supervision of students during project? This, in order to identify similarities with, and differences between Bra�ov and Groningen.
• What type of data is available (qualitatively and quantitatively), and how is this data organized (databases)?
• Does this data concur with the demands for the data to be used in the methods analyzed, and if not, what steps should be taken to insure the availability of the right [type of] data?
The above stated questions were used to assess which direction the city wants to take when handling the [specific] environmental problems in the city. This information was obtained primarily by analyzing the available data(bases), working with the Science Shop staff, and through interviews with ABMEE; Part of the information was given in the first phase through documentation provided by ABMEE, but it was also important to get the information first hand. That information was then used [in deliberation with ABMEE and the Science Shop] to ascertain which of the methods analyzed in the first phase had a higher applicability in the city, and should therefore be used in the Pilot Project.
II) Feedback: 25/03/04-25/04/04, Groningen. In this part, the emphasis was on discussing the results from the first part with the involved parties, in both Groningen and Bra�ov. During this time, an outline was made as to how [the results of] this project will best benefit the city of Bra�ov. Gaps in the information about the pilot-project methods were then filled, and experts were again interviewed to gather additional, more specific data on the
37
three methods. This was especially relevant for traffic: information on the use of the OmniTRANS modelling system was gathered, and the basic outline of the model was made, with the help and technical assistance of an expert on the program from Goudappel Coffeng, the consultancy agency which developed the program20.
III) Implementation: 26/04/04-20/06/04, Bra�ov The main aim of this part was to ascertain the practical applicability of the methods, through small-scale projects. The results of the previous two parts were used to set up small projects that would elevate the information out of the theoretical realm, into practical situations. This gave direct feedback on problems that could be encountered in practice (e.g. unavailability of data, lack of cooperation, etc.). It also gave ABMEE a chance to “test” the methods as to get familiar with their use. This was a long process with continuous adaptations to the programs and feedback loops to ABMEE and the other involved. In the end, the following programs were chooses to be used in three mini pilot projects, done in consort with students in Bra�ov: • DoMUS: used to simulate the water and the direct energy consumption of households • OmniTRANS: used to analyze the street networks and related traffic flows. • Questionnaires: on environmental awareness and recycling, as used in the ToolSust project.
Phase Three: Completion of Projects and Dissemination of the Results Duration and location: June 2004 - November 200521, Bra�ov and Groningen. The focus of this phase was on the finalization of the project, and the dissemination of the results. In this phase the pilot projects were wrapped up, and the results were further analyzed and processed. For this the various experts advising on the projects were again consulted, and their contributions were used to finalize the pilot projects. The whole project was then evaluated and recommendations were made for future projects (see Chapter 7:). Another important aspect of this phase was the dissemination of the results. This was done in a number of ways: • Student presentations were made in both Bra�ov and Groningen. These were all part of the final-
project presentations, allowing the students to display the work they did on the projects, and what results they obtained. These presentations were made primarily to university staff.
• Contributions were made to the INRO22 (Ten Meer et. al., 2004b) and the ENVEDU23 (Ten Meer et. al., 2004a) Conferences, held in conferences held in June 2004 in Bra�ov.
• Written and oral communication was maintained with ABMEE and a number of interested parties throughout the project. After the completion of the pilot projects a report containing the aims, methods, results, and conclusions was written for each project. These reports make up Chapter 4:, Chapter 5:, and Chapter 6: of this thesis.
3.2 The Pilot-Project Methods This section gives a short schematic overview of pilot projects. Table 3-1 shows how many students from the different specialization were involved in each of the pilots. An elaborate description for each of the projects is given in chapters 4, 5, and 6.
20 The consultant gave his expertise on a voluntary basis and it mainly concerned writing the routines to generate the results, based on input supplied to him. All interpretations are the responsibility of this author. 21 This period included a year-long breach in the research process. 22 INRO 2004, First National Conference “Towards Sustainable Partnerships between Universities and Society Groups” (Source: IntermediuNet, 2004b). 23 EnvEdu 2004 Conference: Trends in Environmental education (Source: Draghici & Schoonman, 2004).
38
Pilot Project 1: Household Energy Consumption
Background: A large part of the energy consumed in a country can be directly or indirectly attributed to the energy consumption in households. Households use energy for a variety of purposes, such as heating, electrical appliances, or transport, and many goods produced ultimately find their way into households. It is important to have a clear view of the household energy consumption, and to employ energy-saving strategies. For this it is necessary to be able to analyze this energy consumption.
Program: The program DoMUS (Domestic Metabolism User-friendly Simulated) can analyze the household energy consumption. It simulates the energy use in a household and portrays the differences in the energy use before and after energy-saving measures have been taken. The program calculates the energy consumption, using a database, which contains construction data (materials used to build the houses, plus their related physical constants and costs), climate data, the indirect energy (for materials and appliances), and the effects of certain types of behaviour. A second program ASE 2.1 was also used by ABMEE parallel to this research, as part of the Bra�ov master plan to analyze energy consumption in public buildings. The ASE 2.1 program was not used in this pilot project however, given that the focus of the pilot was on households, not public buildings.
Aims: • To adapt the database containing the construction data and the climate data, so that program is
able to better portray the energy use in Romanian households. • To simulate a selection of houses, and analyze the effects of measures on these houses.
Pilot Project 2: Traffic Modelling
Background: Bra�ov lies at the centre of a convergence of three Romanian and three European main commercial roads. The city is also an important economic and social centre, with both industrial and tourists concentration. There is a high demand for mobility in and around the city, but the street network is not equipped to handle it. Especially heavy transit traffic going right through the centre of the city causes many problems. To combat these problems it is necessary to have insight on the traffic flows in the city and to perform strategic traffic planning to reduce these flows to acceptable levels.
Program: The model OmniTRANS is an Integrated Multi-Modal Transportation Planning Package which can analyze traffic flows using the principles of the “classic transport model”. It can be employed to simulate the consequences of traffic measures by comparing different variants with possible solutions. The results can be shown for a number of variables which can give insight in the effects of these measures.
Aims: The Aim of this project was to determine the possibilities for using traffic model-platforms to represent and analyze the traffic situation in Bra�ov. This also includes ascertaining the level of complexity of such an endeavour, and identifying the obstacles (in e.g. data collections) that would be encountered. Given the complex and time-and data consuming nature of such a simulation, only a preliminary or prospective model was constructed.
Pilot Project 3: Survey on Environmental Awareness and Recycling.
Background: In Bra�ov, a pilot project on household garbage recycling has been designed in cooperation with the local waste company (Comprest Inc.). In order to maximize the results of the pilot, ABMEE is conducting an information campaign to support the project. They also want to monitor the effectiveness of the campaign, and gain insight on which factors, views and attitudes contribute to
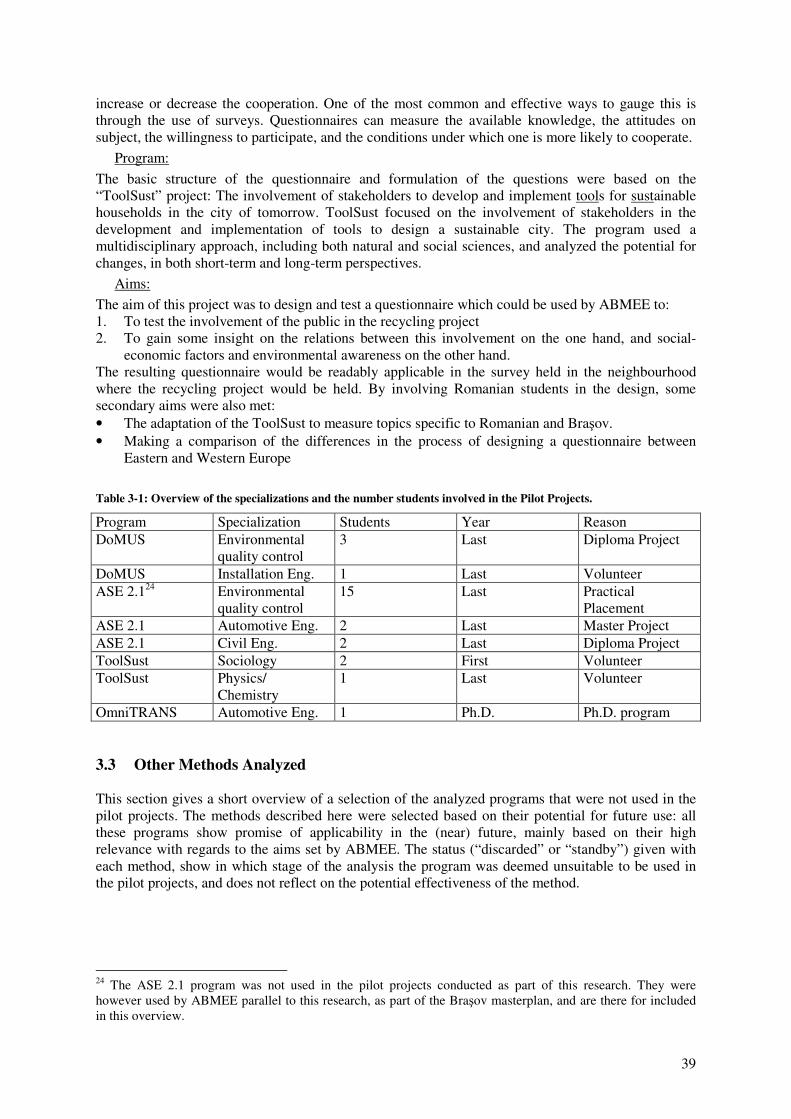
39
increase or decrease the cooperation. One of the most common and effective ways to gauge this is through the use of surveys. Questionnaires can measure the available knowledge, the attitudes on subject, the willingness to participate, and the conditions under which one is more likely to cooperate.
Program: The basic structure of the questionnaire and formulation of the questions were based on the “ToolSust” project: The involvement of stakeholders to develop and implement tools for sustainable households in the city of tomorrow. ToolSust focused on the involvement of stakeholders in the development and implementation of tools to design a sustainable city. The program used a multidisciplinary approach, including both natural and social sciences, and analyzed the potential for changes, in both short-term and long-term perspectives.
Aims: The aim of this project was to design and test a questionnaire which could be used by ABMEE to: 1. To test the involvement of the public in the recycling project 2. To gain some insight on the relations between this involvement on the one hand, and social-
economic factors and environmental awareness on the other hand. The resulting questionnaire would be readably applicable in the survey held in the neighbourhood where the recycling project would be held. By involving Romanian students in the design, some secondary aims were also met: • The adaptation of the ToolSust to measure topics specific to Romanian and Bra�ov. • Making a comparison of the differences in the process of designing a questionnaire between
Eastern and Western Europe
Table 3-1: Overview of the specializations and the number students involved in the Pilot Projects.
Program Specialization Students Year Reason DoMUS Environmental
quality control 3 Last Diploma Project
DoMUS Installation Eng. 1 Last Volunteer ASE 2.124 Environmental
quality control 15 Last Practical
Placement ASE 2.1 Automotive Eng. 2 Last Master Project ASE 2.1 Civil Eng. 2 Last Diploma Project ToolSust Sociology 2 First Volunteer ToolSust Physics/
Chemistry 1 Last Volunteer
OmniTRANS Automotive Eng. 1 Ph.D. Ph.D. program 3.3 Other Methods Analyzed This section gives a short overview of a selection of the analyzed programs that were not used in the pilot projects. The methods described here were selected based on their potential for future use: all these programs show promise of applicability in the (near) future, mainly based on their high relevance with regards to the aims set by ABMEE. The status (“discarded” or “standby”) given with each method, show in which stage of the analysis the program was deemed unsuitable to be used in the pilot projects, and does not reflect on the potential effectiveness of the method.
24 The ASE 2.1 program was not used in the pilot projects conducted as part of this research. They were however used by ABMEE parallel to this research, as part of the Bra�ov masterplan, and are there for included in this overview.
40
ASE 2.125 ASE 2.1 is an energy accounting software, which can be used for comprehensive accounting and analysis of the efficiency of utilization of energy and natural resources by public buildings. The software can keep a city-level database of all public buildings. It allows for two types of energy accounting: 1) based on the bill information and 2) based on the meter data. The software produces a number of reports that could help municipal energy managers in evaluating the efficiency of specific resource utilization, finding a "hot spots" - buildings with excessive energy consumption, or to reveal the buildings, where conditions of comfort do not match the state norms (e.g. norms for interior temperature). ASE 2.1 software could also help municipal authorities in drafting budgets for utilities from the level of specific building to the level of whole city. In 2005 the ASE Energy Accounting software version 2.3 was released.
Status: standby The usability of the program is very high. It can be downloaded from the ASE homepage without additional costs. The Program is already in use by the ABMEE, as part of a campaign to analyze energy and water consumptions in schools. The reason the program was not used in the one of the pilot project is the fact that it can primarily be used for public buildings, while the focus of the projects was on households.
CAR International26 CAR (Calculation of Air Pollution from Road Traffic)-International is a model that calculates air pollution concentrations (including percentiles along roads in built-up and rural areas) from traffic and street characteristics. The model describes the dispersion of the emissions by traffic, influenced by buildings, trees, traffic noise screens and barriers, elevated and sunken roads, etc. It is based on general dispersion theory and aerodynamics, wind tunnel simulations of roads in combination with a variety of obstacles, and on field measurements of roadside air pollution. It has been developed for estimating local concentration and percentiles in cities and is valid for 5 to 30 meter from the road axis, for various road types, including the street canyon. (TRAPOS, 2005). The model can be adapted by local user to their own specific circumstances through the use of common meteorological input data, country-specific emission factors for CO, NOx, Benzene, Lead, Black Smoke as well as existing background concentrations (Stadtklima, 2005).
Status: Standby The usability of the program is medium. The flexibility of the program allows it to be adapted simply by the choice of input, but no fully operational demo version is available. The demonstration version of the model can only be used for a limited number of pre-programmed streets. And older version (CAR) of the program is available, but it only contains data for the Netherlands, and can not be adapted.
MERLiN27 MERLiN (Modelling Energy Resources Limitation in Neighbourhoods) is a program which can be used to quantitatively asses the energy-supply system of a Neighbourhood. It calculates the total demand for energy carrier (Heat, Electricity and methane) on three levels, based on the characteristics of the neighbourhood, and the possibilities of energy production (e.g. heat) and energy storage on each of the tree levels. The three levels are:
25 Developed by the Ukrainian team of the Alliance to Save Energy (ASE) under support of the MUNEE program and funded by USAID (Alliance to Save Energy, 2005). 26 Copyrighted to, and licensed by TNO, the Netherlands. 27 Copyrighted to, and licensed by the Centre for Energy and Environment, University of Groningen. (Benders et. al., 2004)
41
The house. The model can calculate the energy demand for individual houses, using construction parameters such as surface, isolation, orientation (geographical), and ventilation, as well as user parameters such as appliances. Energy gains and production (e.g. internal heat, sun boilers, etc) are also included in the calculation. The Energy Zone. An energy zone is part of a neighbourhood in which only one system for energy production (e.g. boilers in the houses, block heating, cogeneration, etc) is used. It can be a whole neighbourhood, a city block, or an apartment flat. The energy zone used the energy demand from the individual houses to calculate its energy demand. The Neighbourhood. The model uses the data calculated for the energy zones to calculate the demand for a whole neighbourhood. On this level the user can make choices on the number of energy zones and their surface, the fuel and installations used for energy generation, and the distribution network.
Status: Standby The Usability of the program is high given its relevance regarding energy requirements for households and the fact that a full version of the program is available at low cost. The program is accompanied by a report (Benders et. al., 2004) and user manual. These are however in Dutch as is the program, and translation into English is not feasible at this moment. The adaptability of the program is low at this point, given that much of the data needed to adapt it to the Romanian situation in not available.
MURE28 MURE (Mesures d’Utilisation Rationnelle de l’Energie) provides information on energy conservation measures that have been carried out in the original 15 Member States of the European Union, and enables the simulation and comparison at a national level of the potential impact of such measures. The MURE Database is constructed in four separate sections, which contain the energy conservation measures, statistical data and simulation tool relevant to the following sectors: Household, Transport, Industry, and Tertiary. Three main types of data are provided for each of the 15 countries, in each section of the database: 1) Measures, meaning actions or initiatives that have been implemented with the aim of achieving energy savings, 2) Statistical data for the base year 1995, relevant to the energy consumption of the sector, and 3) Technical and cost data to enable the calculation of the energy saving potential and cost of measures and technologies. The database is accompanied by a simulation tool, which allows the user to calculate the potential impact of either measures or technologies.
Status: Standby The usability of the Program is high. The database does not include information for Romania as yet. The databases for each of the sectors can be constructed by collecting data on the sector and by adding it to the program. This can then be used to for comparisons with the other countries, a project ABMEE has indicated to have planned for the (near) future.
PROMIL Spatial29 PROMIL is a software package which can be used for making an inventory of, and the control of environmental data for road networks. The program can help create an environmental-effects map for traffic, which can then be used as a decision making tool, especially in decisions regarding spatial planning. It shows the distribution of for example air and noise pollution as a result of traffic in a region, and the effects of different measures can be saved to individual variants and compared.
28 Designed and developed under co-ordination of ISIS (Institute of System Integration Studies- Rome), within the framework of the DGXVII SAVE program. (MURE, 2005) 29 Copyrighted to, and licensed by Goudappel Coffeng BV, the Netherlands. (PROMIL, 2005)
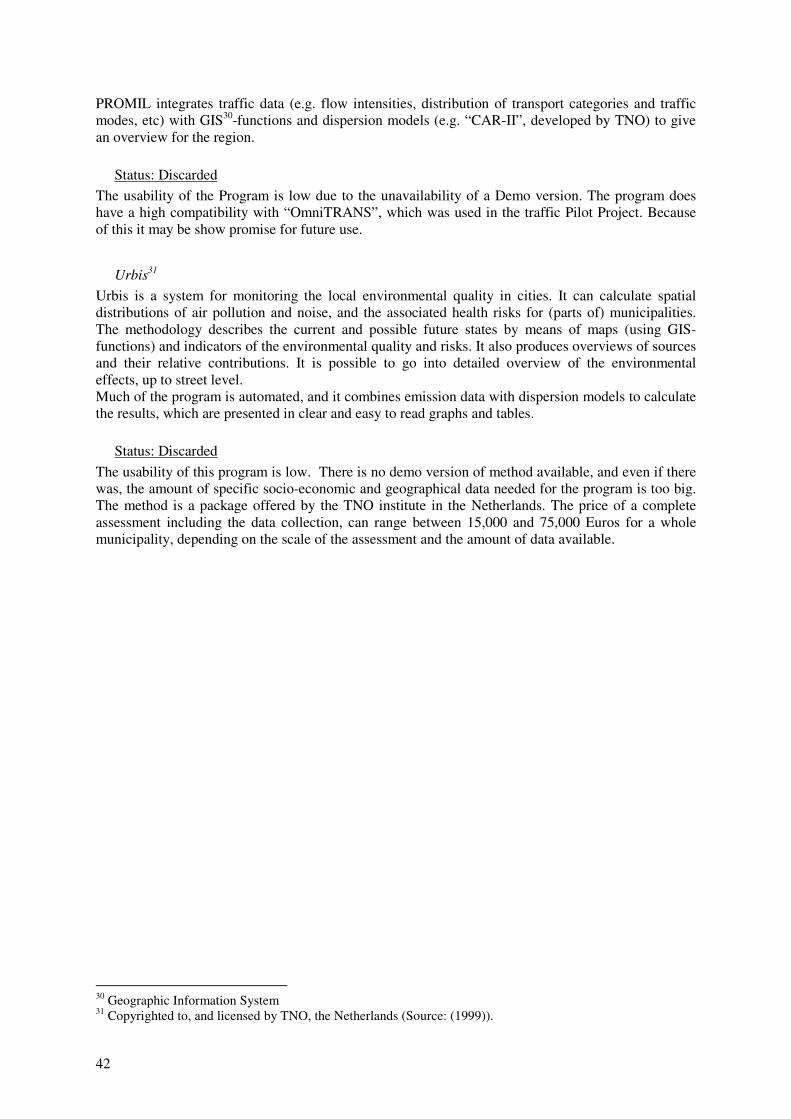
42
PROMIL integrates traffic data (e.g. flow intensities, distribution of transport categories and traffic modes, etc) with GIS30-functions and dispersion models (e.g. “CAR-II”, developed by TNO) to give an overview for the region.
Status: Discarded The usability of the Program is low due to the unavailability of a Demo version. The program does have a high compatibility with “OmniTRANS”, which was used in the traffic Pilot Project. Because of this it may be show promise for future use.
Urbis31 Urbis is a system for monitoring the local environmental quality in cities. It can calculate spatial distributions of air pollution and noise, and the associated health risks for (parts of) municipalities. The methodology describes the current and possible future states by means of maps (using GIS-functions) and indicators of the environmental quality and risks. It also produces overviews of sources and their relative contributions. It is possible to go into detailed overview of the environmental effects, up to street level. Much of the program is automated, and it combines emission data with dispersion models to calculate the results, which are presented in clear and easy to read graphs and tables.
Status: Discarded The usability of this program is low. There is no demo version of method available, and even if there was, the amount of specific socio-economic and geographical data needed for the program is too big. The method is a package offered by the TNO institute in the Netherlands. The price of a complete assessment including the data collection, can range between 15,000 and 75,000 Euros for a whole municipality, depending on the scale of the assessment and the amount of data available.
30 Geographic Information System 31 Copyrighted to, and licensed by TNO, the Netherlands (Source: (1999)).
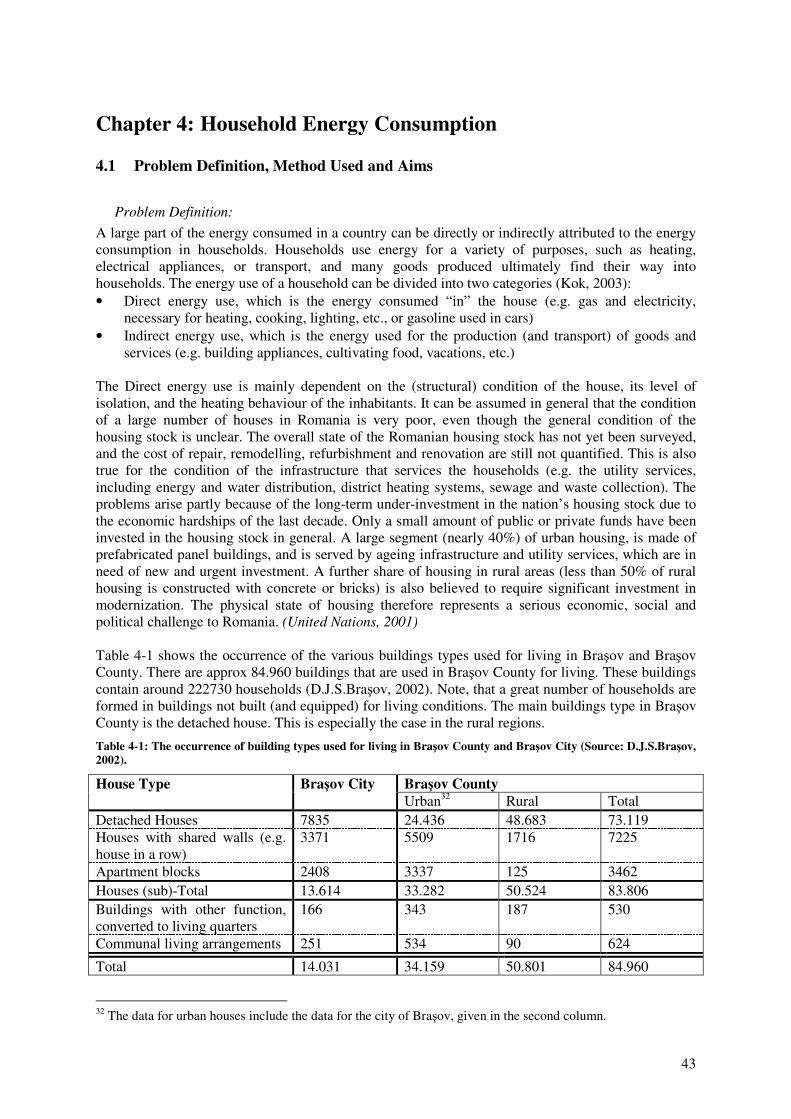
43
Chapter 4: Household Energy Consumption 4.1 Problem Definition, Method Used and Aims
Problem Definition: A large part of the energy consumed in a country can be directly or indirectly attributed to the energy consumption in households. Households use energy for a variety of purposes, such as heating, electrical appliances, or transport, and many goods produced ultimately find their way into households. The energy use of a household can be divided into two categories (Kok, 2003): • Direct energy use, which is the energy consumed “in” the house (e.g. gas and electricity,
necessary for heating, cooking, lighting, etc., or gasoline used in cars) • Indirect energy use, which is the energy used for the production (and transport) of goods and
services (e.g. building appliances, cultivating food, vacations, etc.) The Direct energy use is mainly dependent on the (structural) condition of the house, its level of isolation, and the heating behaviour of the inhabitants. It can be assumed in general that the condition of a large number of houses in Romania is very poor, even though the general condition of the housing stock is unclear. The overall state of the Romanian housing stock has not yet been surveyed, and the cost of repair, remodelling, refurbishment and renovation are still not quantified. This is also true for the condition of the infrastructure that services the households (e.g. the utility services, including energy and water distribution, district heating systems, sewage and waste collection). The problems arise partly because of the long-term under-investment in the nation’s housing stock due to the economic hardships of the last decade. Only a small amount of public or private funds have been invested in the housing stock in general. A large segment (nearly 40%) of urban housing, is made of prefabricated panel buildings, and is served by ageing infrastructure and utility services, which are in need of new and urgent investment. A further share of housing in rural areas (less than 50% of rural housing is constructed with concrete or bricks) is also believed to require significant investment in modernization. The physical state of housing therefore represents a serious economic, social and political challenge to Romania. (United Nations, 2001) Table 4-1 shows the occurrence of the various buildings types used for living in Bra�ov and Bra�ov County. There are approx 84.960 buildings that are used in Bra�ov County for living. These buildings contain around 222730 households (D.J.S.Bra�ov, 2002). Note, that a great number of households are formed in buildings not built (and equipped) for living conditions. The main buildings type in Bra�ov County is the detached house. This is especially the case in the rural regions.
Table 4-1: The occurrence of building types used for living in Bra�ov County and Bra�ov City (Source: D.J.S.Bra�ov, 2002).
Bra�ov County House Type Bra�ov City Urban32 Rural Total
Detached Houses 7835 24.436 48.683 73.119 Houses with shared walls (e.g. house in a row)
3371 5509 1716 7225
Apartment blocks 2408 3337 125 3462 Houses (sub)-Total 13.614 33.282 50.524 83.806 Buildings with other function, converted to living quarters
166 343 187 530
Communal living arrangements 251 534 90 624
Total 14.031 34.159 50.801 84.960
32 The data for urban houses include the data for the city of Bra�ov, given in the second column.
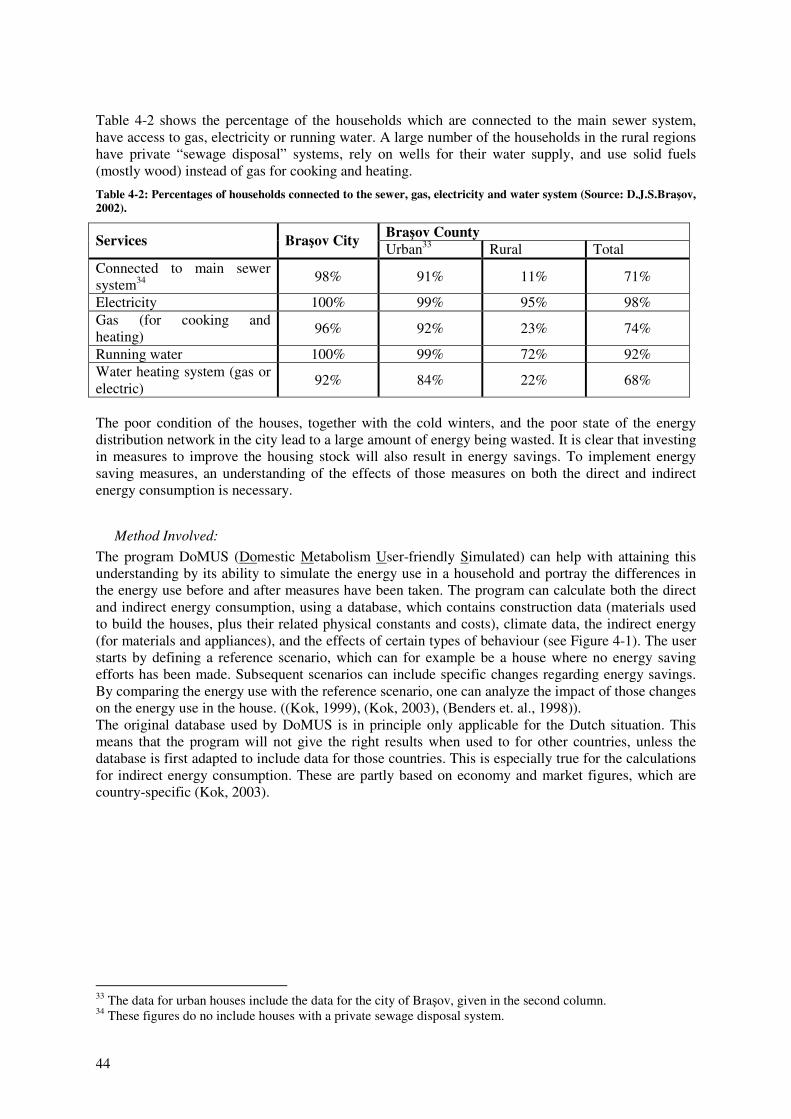
44
Table 4-2 shows the percentage of the households which are connected to the main sewer system, have access to gas, electricity or running water. A large number of the households in the rural regions have private “sewage disposal” systems, rely on wells for their water supply, and use solid fuels (mostly wood) instead of gas for cooking and heating.
Table 4-2: Percentages of households connected to the sewer, gas, electricity and water system (Source: D.J.S.Bra�ov, 2002).
Bra�ov County Services Bra�ov City Urban33 Rural Total Connected to main sewer system34 98% 91% 11% 71%
Electricity 100% 99% 95% 98% Gas (for cooking and heating) 96% 92% 23% 74%
Running water 100% 99% 72% 92% Water heating system (gas or electric) 92% 84% 22% 68%
The poor condition of the houses, together with the cold winters, and the poor state of the energy distribution network in the city lead to a large amount of energy being wasted. It is clear that investing in measures to improve the housing stock will also result in energy savings. To implement energy saving measures, an understanding of the effects of those measures on both the direct and indirect energy consumption is necessary.
Method Involved: The program DoMUS (Domestic Metabolism User-friendly Simulated) can help with attaining this understanding by its ability to simulate the energy use in a household and portray the differences in the energy use before and after measures have been taken. The program can calculate both the direct and indirect energy consumption, using a database, which contains construction data (materials used to build the houses, plus their related physical constants and costs), climate data, the indirect energy (for materials and appliances), and the effects of certain types of behaviour (see Figure 4-1). The user starts by defining a reference scenario, which can for example be a house where no energy saving efforts has been made. Subsequent scenarios can include specific changes regarding energy savings. By comparing the energy use with the reference scenario, one can analyze the impact of those changes on the energy use in the house. ((Kok, 1999), (Kok, 2003), (Benders et. al., 1998)). The original database used by DoMUS is in principle only applicable for the Dutch situation. This means that the program will not give the right results when used to for other countries, unless the database is first adapted to include data for those countries. This is especially true for the calculations for indirect energy consumption. These are partly based on economy and market figures, which are country-specific (Kok, 2003).
33 The data for urban houses include the data for the city of Bra�ov, given in the second column. 34 These figures do no include houses with a private sewage disposal system.
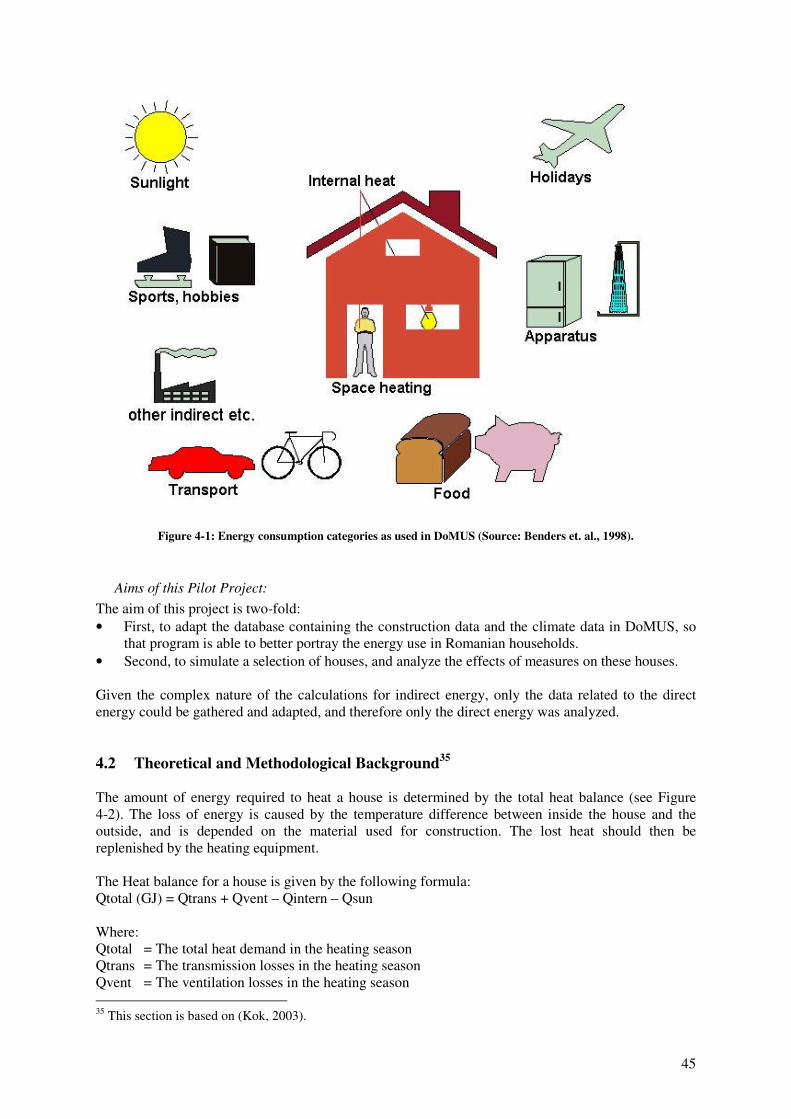
45
Figure 4-1: Energy consumption categories as used in DoMUS (Source: Benders et. al., 1998).
Aims of this Pilot Project: The aim of this project is two-fold: • First, to adapt the database containing the construction data and the climate data in DoMUS, so
that program is able to better portray the energy use in Romanian households. • Second, to simulate a selection of houses, and analyze the effects of measures on these houses. Given the complex nature of the calculations for indirect energy, only the data related to the direct energy could be gathered and adapted, and therefore only the direct energy was analyzed. 4.2 Theoretical and Methodological Background35 The amount of energy required to heat a house is determined by the total heat balance (see Figure 4-2). The loss of energy is caused by the temperature difference between inside the house and the outside, and is depended on the material used for construction. The lost heat should then be replenished by the heating equipment. The Heat balance for a house is given by the following formula: Qtotal (GJ) = Qtrans + Qvent – Qintern – Qsun Where: Qtotal = The total heat demand in the heating season Qtrans = The transmission losses in the heating season Qvent = The ventilation losses in the heating season 35 This section is based on (Kok, 2003).
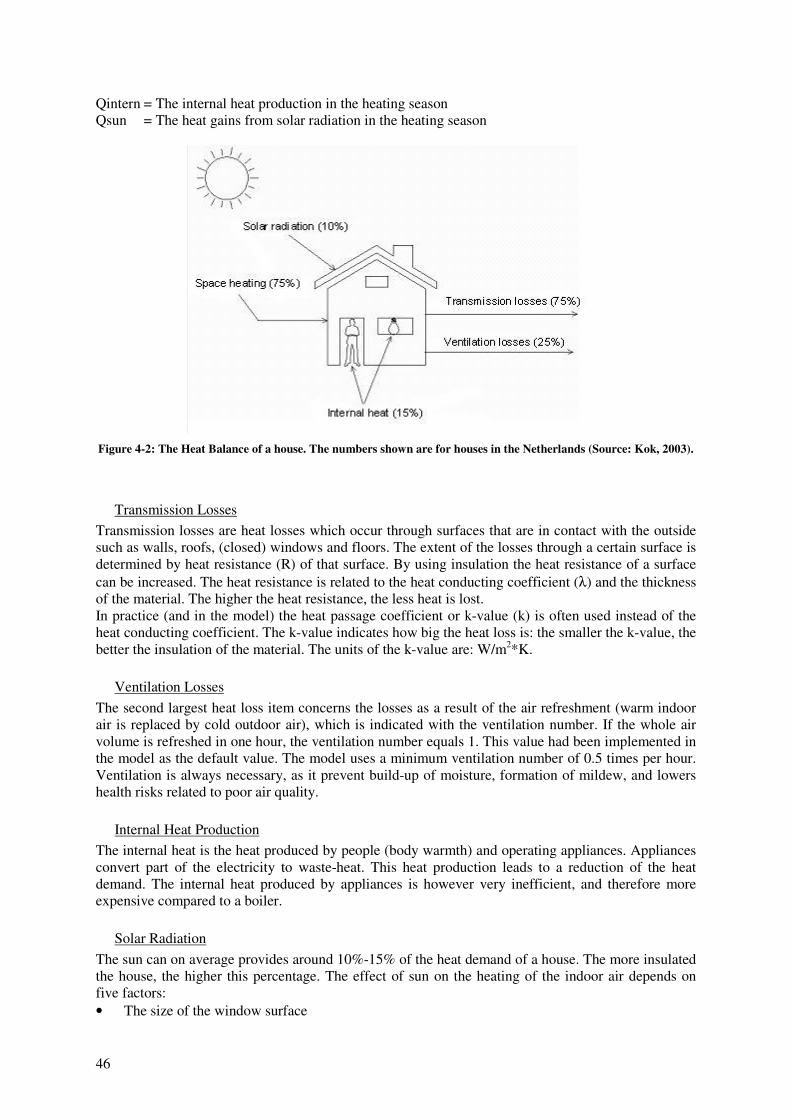
46
Qintern = The internal heat production in the heating season Qsun = The heat gains from solar radiation in the heating season
Figure 4-2: The Heat Balance of a house. The numbers shown are for houses in the Netherlands (Source: Kok, 2003).
Transmission Losses Transmission losses are heat losses which occur through surfaces that are in contact with the outside such as walls, roofs, (closed) windows and floors. The extent of the losses through a certain surface is determined by heat resistance (R) of that surface. By using insulation the heat resistance of a surface can be increased. The heat resistance is related to the heat conducting coefficient (λ) and the thickness of the material. The higher the heat resistance, the less heat is lost. In practice (and in the model) the heat passage coefficient or k-value (k) is often used instead of the heat conducting coefficient. The k-value indicates how big the heat loss is: the smaller the k-value, the better the insulation of the material. The units of the k-value are: W/m2*K.
Ventilation Losses The second largest heat loss item concerns the losses as a result of the air refreshment (warm indoor air is replaced by cold outdoor air), which is indicated with the ventilation number. If the whole air volume is refreshed in one hour, the ventilation number equals 1. This value had been implemented in the model as the default value. The model uses a minimum ventilation number of 0.5 times per hour. Ventilation is always necessary, as it prevent build-up of moisture, formation of mildew, and lowers health risks related to poor air quality.
Internal Heat Production The internal heat is the heat produced by people (body warmth) and operating appliances. Appliances convert part of the electricity to waste-heat. This heat production leads to a reduction of the heat demand. The internal heat produced by appliances is however very inefficient, and therefore more expensive compared to a boiler.
Solar Radiation The sun can on average provides around 10%-15% of the heat demand of a house. The more insulated the house, the higher this percentage. The effect of sun on the heating of the indoor air depends on five factors: • The size of the window surface
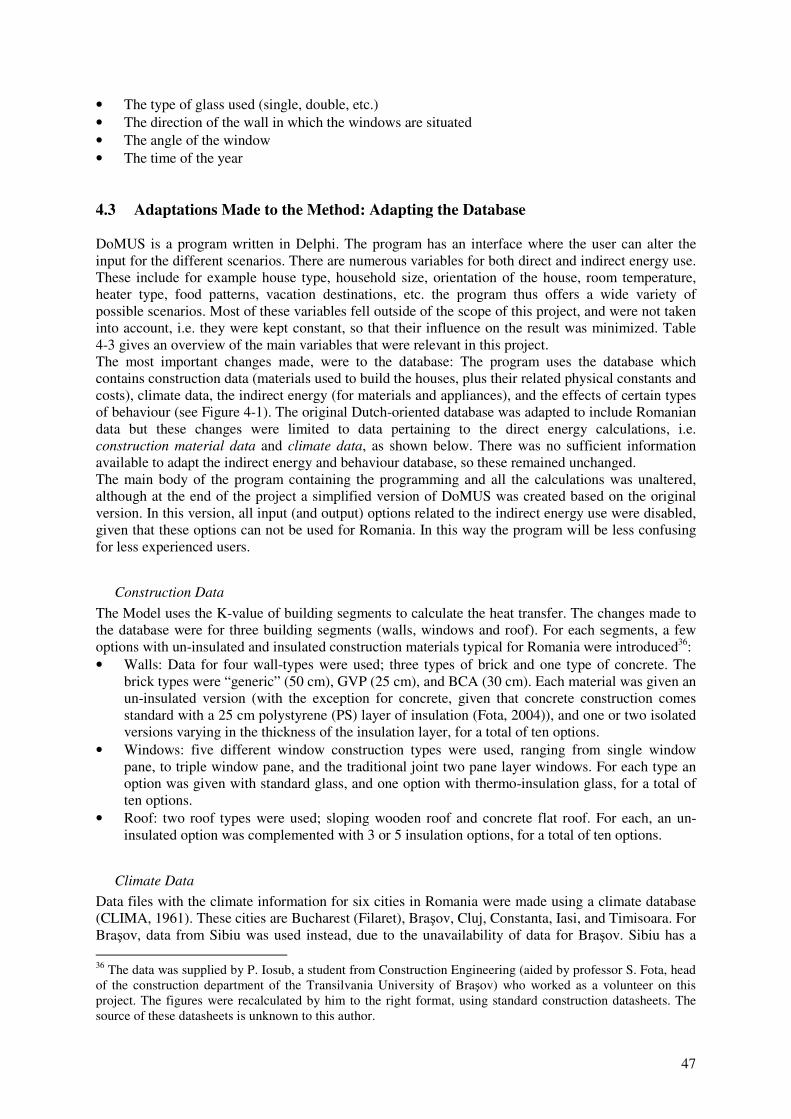
47
• The type of glass used (single, double, etc.) • The direction of the wall in which the windows are situated • The angle of the window • The time of the year 4.3 Adaptations Made to the Method: Adapting the Database DoMUS is a program written in Delphi. The program has an interface where the user can alter the input for the different scenarios. There are numerous variables for both direct and indirect energy use. These include for example house type, household size, orientation of the house, room temperature, heater type, food patterns, vacation destinations, etc. the program thus offers a wide variety of possible scenarios. Most of these variables fell outside of the scope of this project, and were not taken into account, i.e. they were kept constant, so that their influence on the result was minimized. Table 4-3 gives an overview of the main variables that were relevant in this project. The most important changes made, were to the database: The program uses the database which contains construction data (materials used to build the houses, plus their related physical constants and costs), climate data, the indirect energy (for materials and appliances), and the effects of certain types of behaviour (see Figure 4-1). The original Dutch-oriented database was adapted to include Romanian data but these changes were limited to data pertaining to the direct energy calculations, i.e. construction material data and climate data, as shown below. There was no sufficient information available to adapt the indirect energy and behaviour database, so these remained unchanged. The main body of the program containing the programming and all the calculations was unaltered, although at the end of the project a simplified version of DoMUS was created based on the original version. In this version, all input (and output) options related to the indirect energy use were disabled, given that these options can not be used for Romania. In this way the program will be less confusing for less experienced users.
Construction Data The Model uses the K-value of building segments to calculate the heat transfer. The changes made to the database were for three building segments (walls, windows and roof). For each segments, a few options with un-insulated and insulated construction materials typical for Romania were introduced36: • Walls: Data for four wall-types were used; three types of brick and one type of concrete. The
brick types were “generic” (50 cm), GVP (25 cm), and BCA (30 cm). Each material was given an un-insulated version (with the exception for concrete, given that concrete construction comes standard with a 25 cm polystyrene (PS) layer of insulation (Fota, 2004)), and one or two isolated versions varying in the thickness of the insulation layer, for a total of ten options.
• Windows: five different window construction types were used, ranging from single window pane, to triple window pane, and the traditional joint two pane layer windows. For each type an option was given with standard glass, and one option with thermo-insulation glass, for a total of ten options.
• Roof: two roof types were used; sloping wooden roof and concrete flat roof. For each, an un-insulated option was complemented with 3 or 5 insulation options, for a total of ten options.
Climate Data Data files with the climate information for six cities in Romania were made using a climate database (CLIMA, 1961). These cities are Bucharest (Filaret), Bra�ov, Cluj, Constanta, Iasi, and Timisoara. For Bra�ov, data from Sibiu was used instead, due to the unavailability of data for Bra�ov. Sibiu has a 36 The data was supplied by P. Iosub, a student from Construction Engineering (aided by professor S. Fota, head of the construction department of the Transilvania University of Bra�ov) who worked as a volunteer on this project. The figures were recalculated by him to the right format, using standard construction datasheets. The source of these datasheets is unknown to this author.
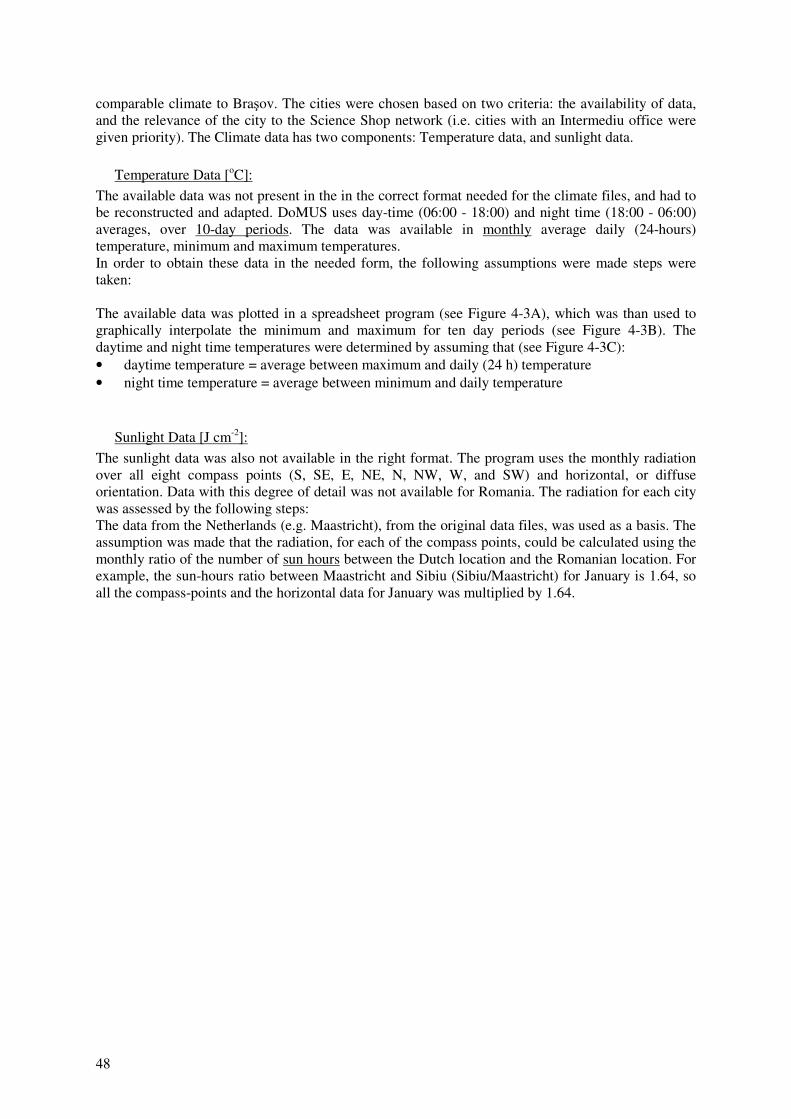
48
comparable climate to Bra�ov. The cities were chosen based on two criteria: the availability of data, and the relevance of the city to the Science Shop network (i.e. cities with an Intermediu office were given priority). The Climate data has two components: Temperature data, and sunlight data.
Temperature Data [oC]: The available data was not present in the in the correct format needed for the climate files, and had to be reconstructed and adapted. DoMUS uses day-time (06:00 - 18:00) and night time (18:00 - 06:00) averages, over 10-day periods. The data was available in monthly average daily (24-hours) temperature, minimum and maximum temperatures. In order to obtain these data in the needed form, the following assumptions were made steps were taken: The available data was plotted in a spreadsheet program (see Figure 4-3A), which was than used to graphically interpolate the minimum and maximum for ten day periods (see Figure 4-3B). The daytime and night time temperatures were determined by assuming that (see Figure 4-3C): • daytime temperature = average between maximum and daily (24 h) temperature • night time temperature = average between minimum and daily temperature
Sunlight Data [J cm-2]: The sunlight data was also not available in the right format. The program uses the monthly radiation over all eight compass points (S, SE, E, NE, N, NW, W, and SW) and horizontal, or diffuse orientation. Data with this degree of detail was not available for Romania. The radiation for each city was assessed by the following steps: The data from the Netherlands (e.g. Maastricht), from the original data files, was used as a basis. The assumption was made that the radiation, for each of the compass points, could be calculated using the monthly ratio of the number of sun hours between the Dutch location and the Romanian location. For example, the sun-hours ratio between Maastricht and Sibiu (Sibiu/Maastricht) for January is 1.64, so all the compass-points and the horizontal data for January was multiplied by 1.64.
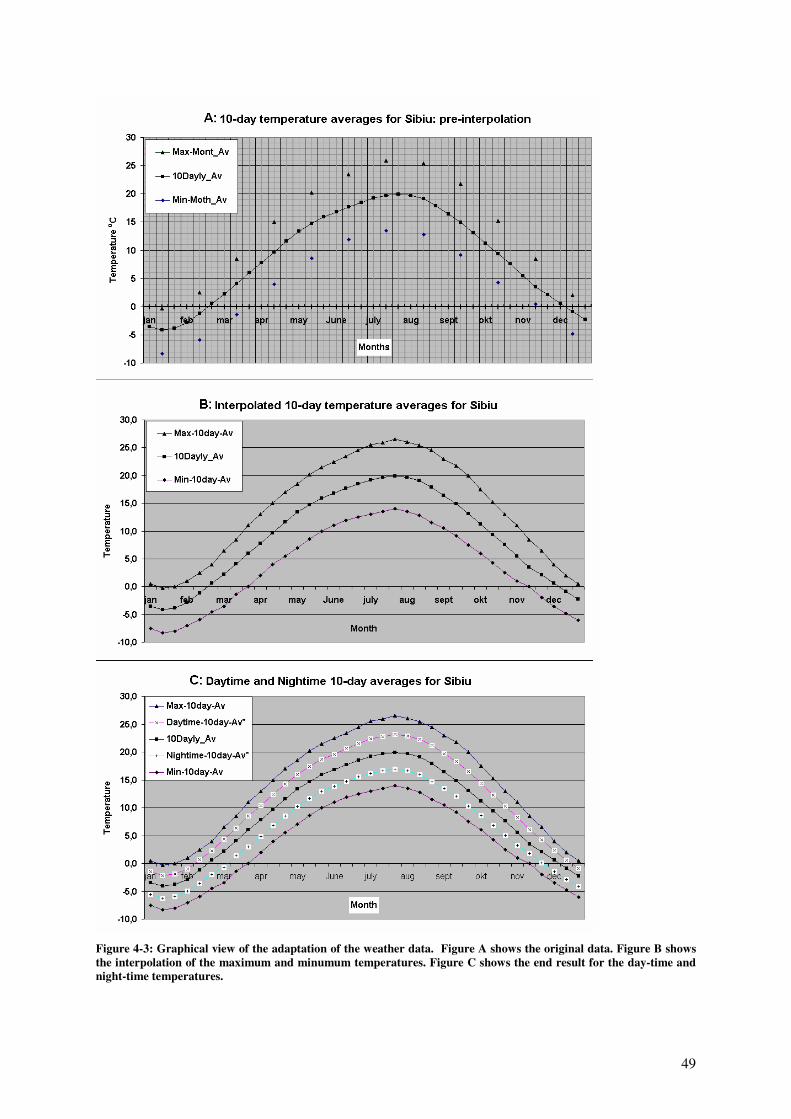
49
Figure 4-3: Graphical view of the adaptation of the weather data. Figure A shows the original data. Figure B shows the interpolation of the maximum and minumum temperatures. Figure C shows the end result for the day-time and night-time temperatures.
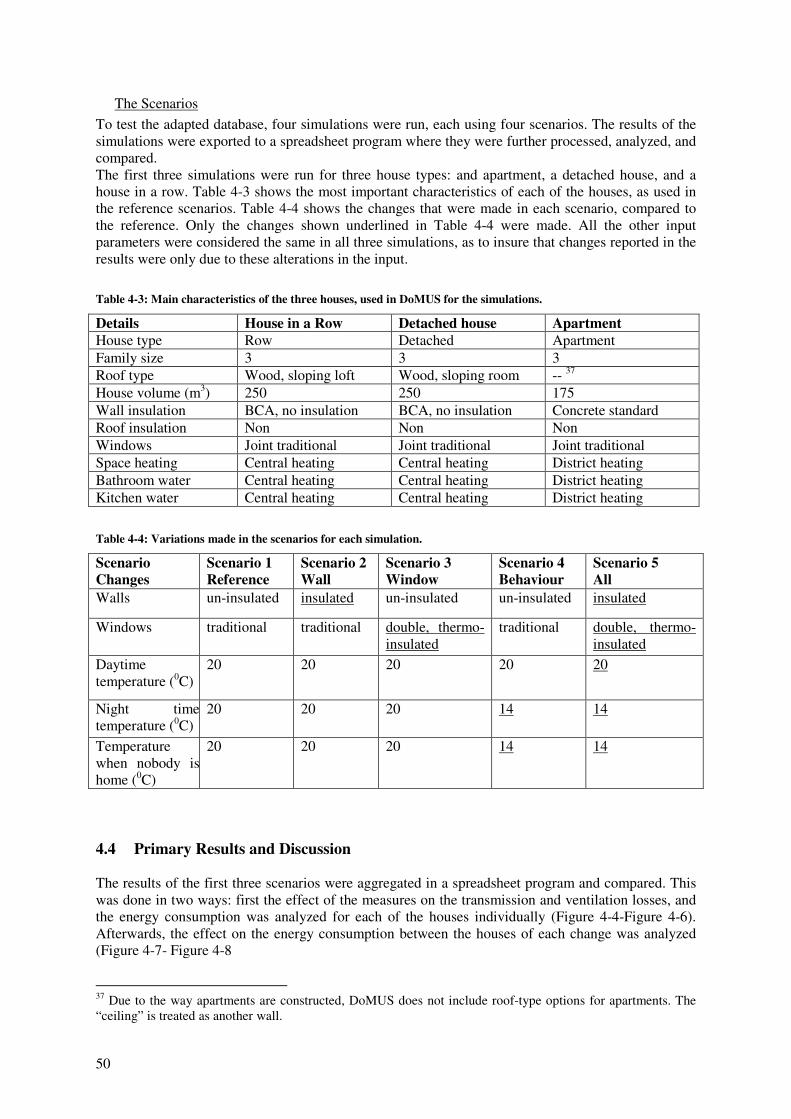
50
The Scenarios To test the adapted database, four simulations were run, each using four scenarios. The results of the simulations were exported to a spreadsheet program where they were further processed, analyzed, and compared. The first three simulations were run for three house types: and apartment, a detached house, and a house in a row. Table 4-3 shows the most important characteristics of each of the houses, as used in the reference scenarios. Table 4-4 shows the changes that were made in each scenario, compared to the reference. Only the changes shown underlined in Table 4-4 were made. All the other input parameters were considered the same in all three simulations, as to insure that changes reported in the results were only due to these alterations in the input.
Table 4-3: Main characteristics of the three houses, used in DoMUS for the simulations.
Details House in a Row Detached house Apartment House type Row Detached Apartment Family size 3 3 3 Roof type Wood, sloping loft Wood, sloping room -- 37 House volume (m3) 250 250 175 Wall insulation BCA, no insulation BCA, no insulation Concrete standard Roof insulation Non Non Non Windows Joint traditional Joint traditional Joint traditional Space heating Central heating Central heating District heating Bathroom water Central heating Central heating District heating Kitchen water Central heating Central heating District heating
Table 4-4: Variations made in the scenarios for each simulation.
Scenario Changes
Scenario 1 Reference
Scenario 2 Wall
Scenario 3 Window
Scenario 4 Behaviour
Scenario 5 All
Walls un-insulated insulated un-insulated un-insulated insulated
Windows traditional traditional double, thermo-insulated
traditional double, thermo-insulated
Daytime temperature (0C)
20 20 20 20 20
Night time temperature (0C)
20 20 20 14 14
Temperature when nobody is home (0C)
20 20 20 14 14
4.4 Primary Results and Discussion The results of the first three scenarios were aggregated in a spreadsheet program and compared. This was done in two ways: first the effect of the measures on the transmission and ventilation losses, and the energy consumption was analyzed for each of the houses individually (Figure 4-4-Figure 4-6). Afterwards, the effect on the energy consumption between the houses of each change was analyzed (Figure 4-7- Figure 4-8 37 Due to the way apartments are constructed, DoMUS does not include roof-type options for apartments. The “ceiling” is treated as another wall.
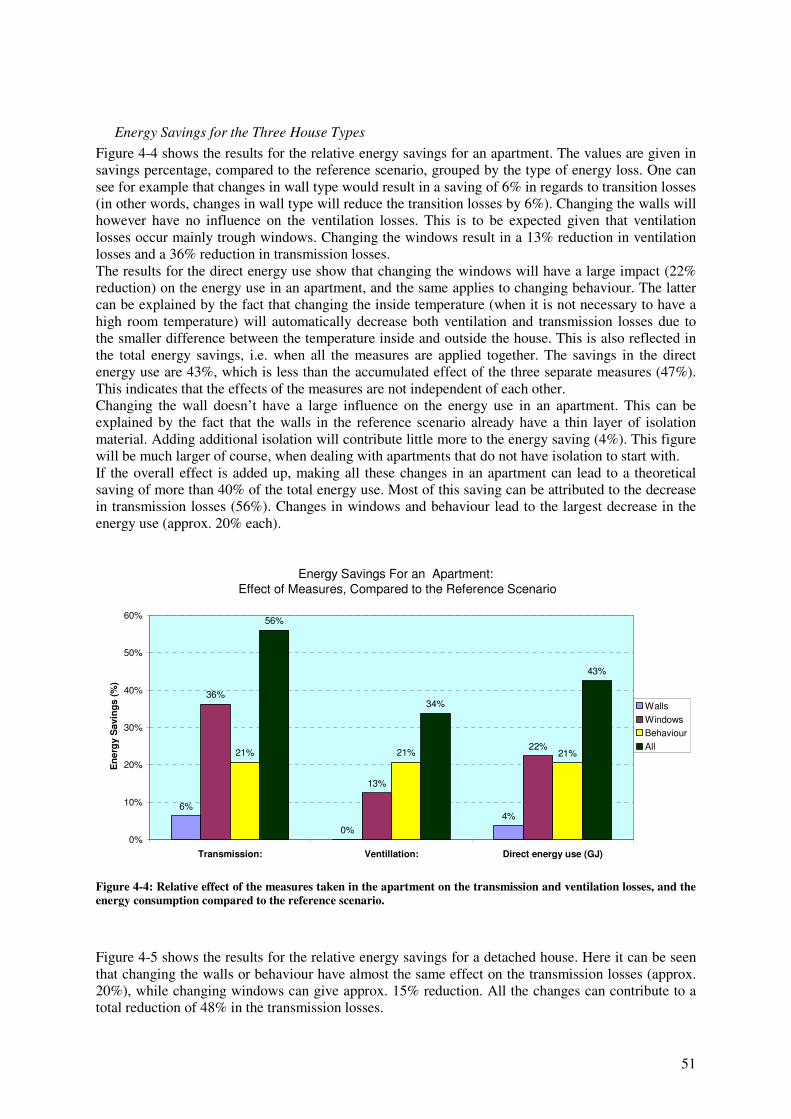
51
Energy Savings for the Three House Types Figure 4-4 shows the results for the relative energy savings for an apartment. The values are given in savings percentage, compared to the reference scenario, grouped by the type of energy loss. One can see for example that changes in wall type would result in a saving of 6% in regards to transition losses (in other words, changes in wall type will reduce the transition losses by 6%). Changing the walls will however have no influence on the ventilation losses. This is to be expected given that ventilation losses occur mainly trough windows. Changing the windows result in a 13% reduction in ventilation losses and a 36% reduction in transmission losses. The results for the direct energy use show that changing the windows will have a large impact (22% reduction) on the energy use in an apartment, and the same applies to changing behaviour. The latter can be explained by the fact that changing the inside temperature (when it is not necessary to have a high room temperature) will automatically decrease both ventilation and transmission losses due to the smaller difference between the temperature inside and outside the house. This is also reflected in the total energy savings, i.e. when all the measures are applied together. The savings in the direct energy use are 43%, which is less than the accumulated effect of the three separate measures (47%). This indicates that the effects of the measures are not independent of each other. Changing the wall doesn’t have a large influence on the energy use in an apartment. This can be explained by the fact that the walls in the reference scenario already have a thin layer of isolation material. Adding additional isolation will contribute little more to the energy saving (4%). This figure will be much larger of course, when dealing with apartments that do not have isolation to start with. If the overall effect is added up, making all these changes in an apartment can lead to a theoretical saving of more than 40% of the total energy use. Most of this saving can be attributed to the decrease in transmission losses (56%). Changes in windows and behaviour lead to the largest decrease in the energy use (approx. 20% each).
Energy Savings For an Apartment: Effect of Measures, Compared to the Reference Scenario
6%
0%4%
36%
13%
22%21% 21% 21%
56%
34%
43%
0%
10%
20%
30%
40%
50%
60%
Transmission: Ventillation: Direct energy use (GJ)
Ene
rgy
Sav
ings
(%)
WallsWindowsBehaviourAll
Figure 4-4: Relative effect of the measures taken in the apartment on the transmission and ventilation losses, and the energy consumption compared to the reference scenario.
Figure 4-5 shows the results for the relative energy savings for a detached house. Here it can be seen that changing the walls or behaviour have almost the same effect on the transmission losses (approx. 20%), while changing windows can give approx. 15% reduction. All the changes can contribute to a total reduction of 48% in the transmission losses.
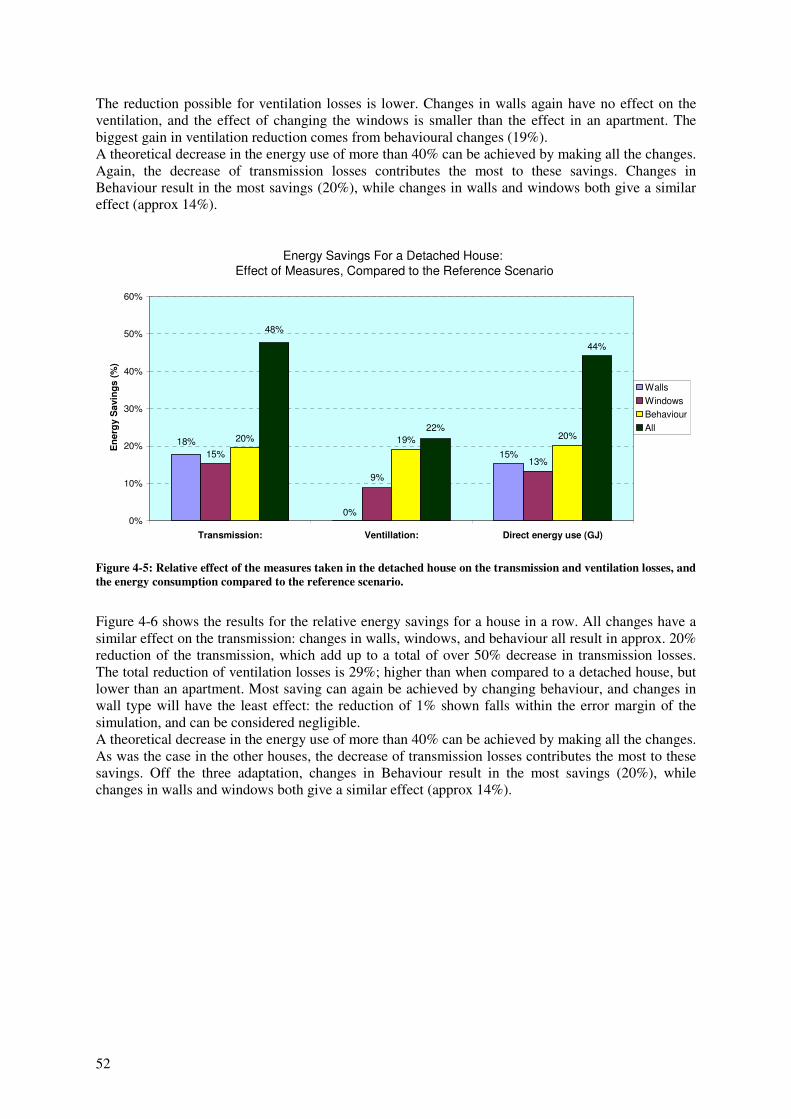
52
The reduction possible for ventilation losses is lower. Changes in walls again have no effect on the ventilation, and the effect of changing the windows is smaller than the effect in an apartment. The biggest gain in ventilation reduction comes from behavioural changes (19%). A theoretical decrease in the energy use of more than 40% can be achieved by making all the changes. Again, the decrease of transmission losses contributes the most to these savings. Changes in Behaviour result in the most savings (20%), while changes in walls and windows both give a similar effect (approx 14%).
Energy Savings For a Detached House: Effect of Measures, Compared to the Reference Scenario
15%15%13%
20% 19% 20%
44%
18%
0%
9%
48%
22%
0%
10%
20%
30%
40%
50%
60%
Transmission: Ventillation: Direct energy use (GJ)
Ene
rgy
Sav
ings
(%)
WallsWindowsBehaviourAll
Figure 4-5: Relative effect of the measures taken in the detached house on the transmission and ventilation losses, and the energy consumption compared to the reference scenario.
Figure 4-6 shows the results for the relative energy savings for a house in a row. All changes have a similar effect on the transmission: changes in walls, windows, and behaviour all result in approx. 20% reduction of the transmission, which add up to a total of over 50% decrease in transmission losses. The total reduction of ventilation losses is 29%; higher than when compared to a detached house, but lower than an apartment. Most saving can again be achieved by changing behaviour, and changes in wall type will have the least effect: the reduction of 1% shown falls within the error margin of the simulation, and can be considered negligible. A theoretical decrease in the energy use of more than 40% can be achieved by making all the changes. As was the case in the other houses, the decrease of transmission losses contributes the most to these savings. Off the three adaptation, changes in Behaviour result in the most savings (20%), while changes in walls and windows both give a similar effect (approx 14%).
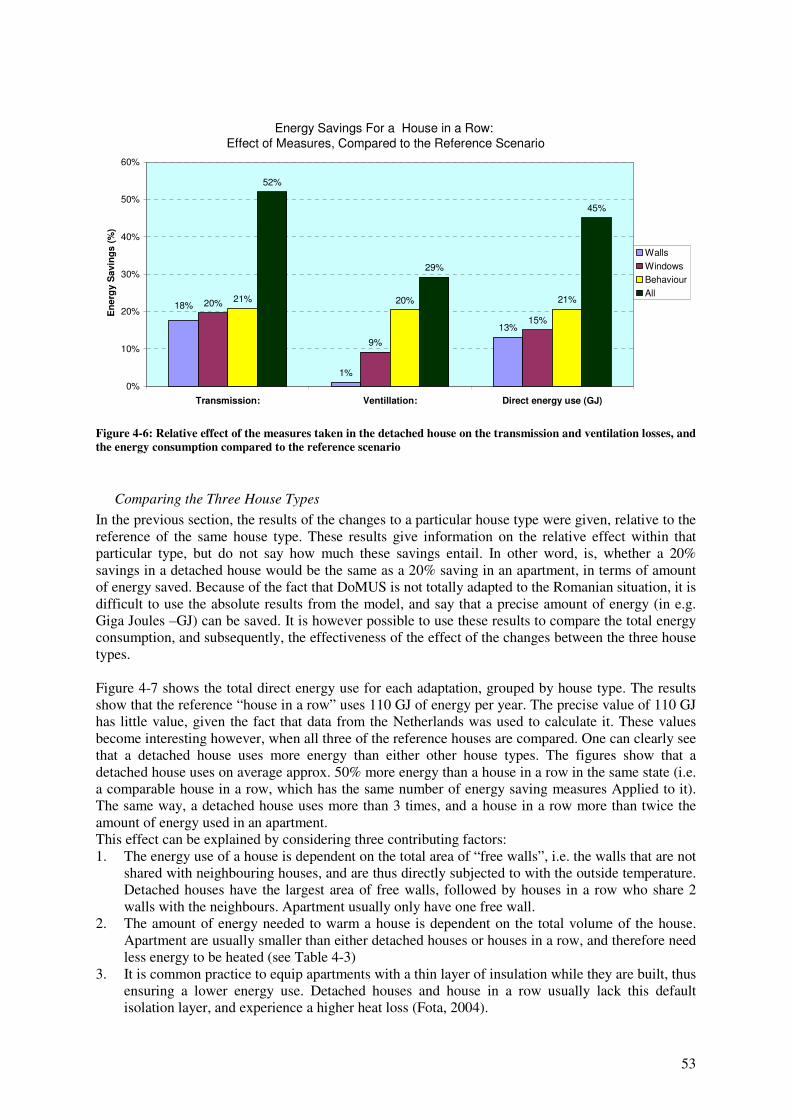
53
Energy Savings For a House in a Row: Effect of Measures, Compared to the Reference Scenario
1%
13%
20%
9%
15%
21% 20% 21%
52%
29%
45%
18%
0%
10%
20%
30%
40%
50%
60%
Transmission: Ventillation: Direct energy use (GJ)
Ene
rgy
Sav
ings
(%)
WallsWindowsBehaviourAll
Figure 4-6: Relative effect of the measures taken in the detached house on the transmission and ventilation losses, and the energy consumption compared to the reference scenario
Comparing the Three House Types In the previous section, the results of the changes to a particular house type were given, relative to the reference of the same house type. These results give information on the relative effect within that particular type, but do not say how much these savings entail. In other word, is, whether a 20% savings in a detached house would be the same as a 20% saving in an apartment, in terms of amount of energy saved. Because of the fact that DoMUS is not totally adapted to the Romanian situation, it is difficult to use the absolute results from the model, and say that a precise amount of energy (in e.g. Giga Joules –GJ) can be saved. It is however possible to use these results to compare the total energy consumption, and subsequently, the effectiveness of the effect of the changes between the three house types. Figure 4-7 shows the total direct energy use for each adaptation, grouped by house type. The results show that the reference “house in a row” uses 110 GJ of energy per year. The precise value of 110 GJ has little value, given the fact that data from the Netherlands was used to calculate it. These values become interesting however, when all three of the reference houses are compared. One can clearly see that a detached house uses more energy than either other house types. The figures show that a detached house uses on average approx. 50% more energy than a house in a row in the same state (i.e. a comparable house in a row, which has the same number of energy saving measures Applied to it). The same way, a detached house uses more than 3 times, and a house in a row more than twice the amount of energy used in an apartment. This effect can be explained by considering three contributing factors: 1. The energy use of a house is dependent on the total area of “free walls”, i.e. the walls that are not
shared with neighbouring houses, and are thus directly subjected to with the outside temperature. Detached houses have the largest area of free walls, followed by houses in a row who share 2 walls with the neighbours. Apartment usually only have one free wall.
2. The amount of energy needed to warm a house is dependent on the total volume of the house. Apartment are usually smaller than either detached houses or houses in a row, and therefore need less energy to be heated (see Table 4-3)
3. It is common practice to equip apartments with a thin layer of insulation while they are built, thus ensuring a lower energy use. Detached houses and house in a row usually lack this default isolation layer, and experience a higher heat loss (Fota, 2004).
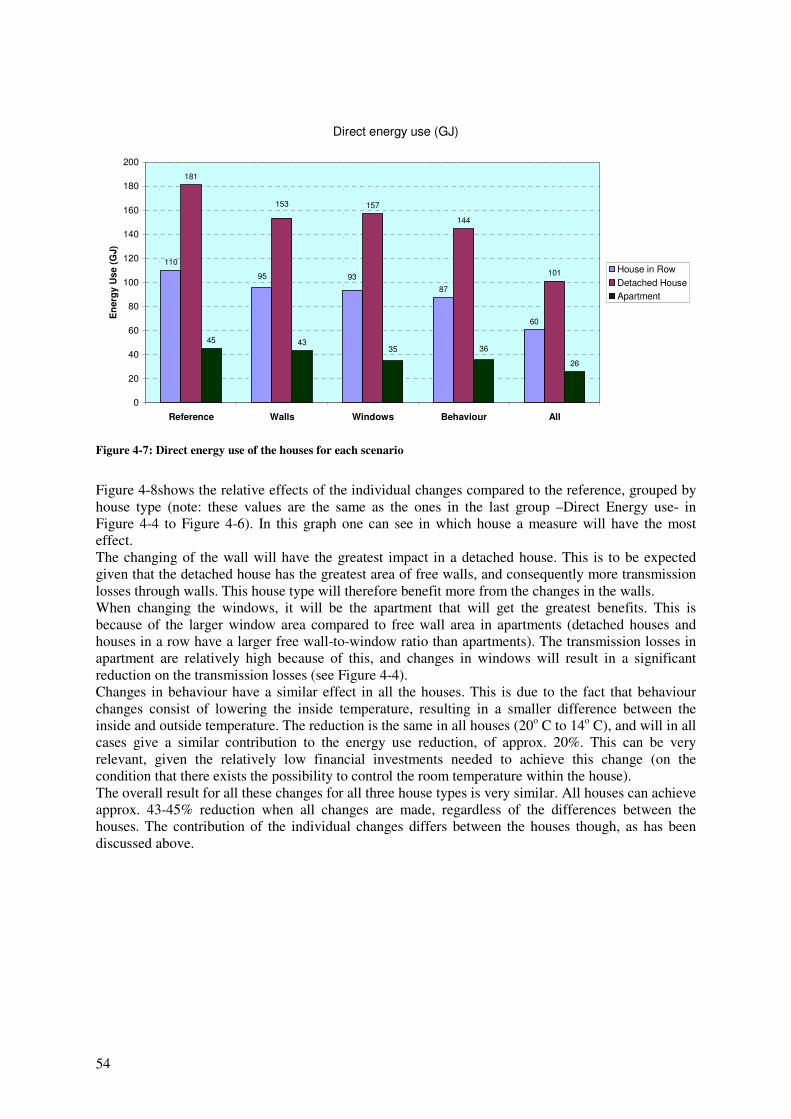
54
Direct energy use (GJ)
110
87
60
181
157
144
101
45 43
26
95 93
153
3635
0
20
40
60
80
100
120
140
160
180
200
Reference Walls Windows Behaviour All
Ene
rgy
Use
(GJ)
House in RowDetached HouseApartment
Figure 4-7: Direct energy use of the houses for each scenario
Figure 4-8shows the relative effects of the individual changes compared to the reference, grouped by house type (note: these values are the same as the ones in the last group –Direct Energy use- in Figure 4-4 to Figure 4-6). In this graph one can see in which house a measure will have the most effect. The changing of the wall will have the greatest impact in a detached house. This is to be expected given that the detached house has the greatest area of free walls, and consequently more transmission losses through walls. This house type will therefore benefit more from the changes in the walls. When changing the windows, it will be the apartment that will get the greatest benefits. This is because of the larger window area compared to free wall area in apartments (detached houses and houses in a row have a larger free wall-to-window ratio than apartments). The transmission losses in apartment are relatively high because of this, and changes in windows will result in a significant reduction on the transmission losses (see Figure 4-4). Changes in behaviour have a similar effect in all the houses. This is due to the fact that behaviour changes consist of lowering the inside temperature, resulting in a smaller difference between the inside and outside temperature. The reduction is the same in all houses (20o C to 14o C), and will in all cases give a similar contribution to the energy use reduction, of approx. 20%. This can be very relevant, given the relatively low financial investments needed to achieve this change (on the condition that there exists the possibility to control the room temperature within the house). The overall result for all these changes for all three house types is very similar. All houses can achieve approx. 43-45% reduction when all changes are made, regardless of the differences between the houses. The contribution of the individual changes differs between the houses though, as has been discussed above.
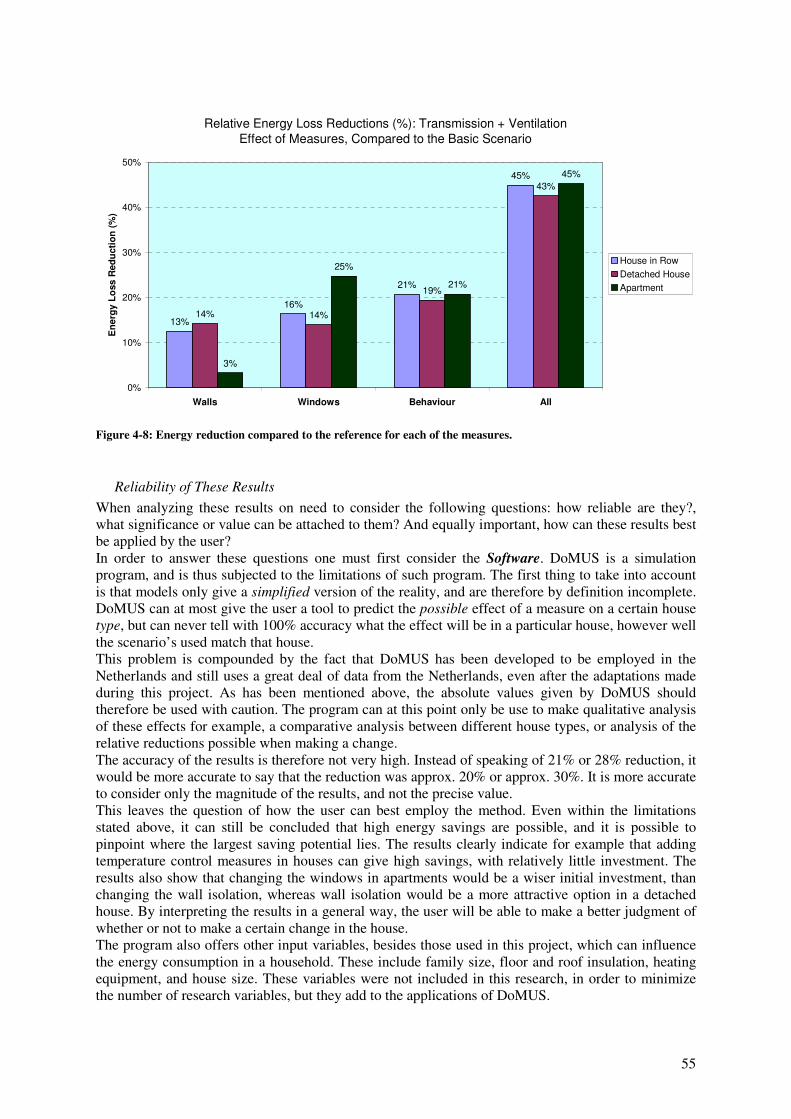
55
Relative Energy Loss Reductions (%): Transmission + VentilationEffect of Measures, Compared to the Basic Scenario
13%
16%
21%
45%
14% 14%
19%
43%
3%
25%
21%
45%
0%
10%
20%
30%
40%
50%
Walls Windows Behaviour All
Ene
rgy
Loss
Red
uctio
n (%
)
House in RowDetached HouseApartment
Figure 4-8: Energy reduction compared to the reference for each of the measures.
Reliability of These Results When analyzing these results on need to consider the following questions: how reliable are they?, what significance or value can be attached to them? And equally important, how can these results best be applied by the user? In order to answer these questions one must first consider the Software. DoMUS is a simulation program, and is thus subjected to the limitations of such program. The first thing to take into account is that models only give a simplified version of the reality, and are therefore by definition incomplete. DoMUS can at most give the user a tool to predict the possible effect of a measure on a certain house type, but can never tell with 100% accuracy what the effect will be in a particular house, however well the scenario’s used match that house. This problem is compounded by the fact that DoMUS has been developed to be employed in the Netherlands and still uses a great deal of data from the Netherlands, even after the adaptations made during this project. As has been mentioned above, the absolute values given by DoMUS should therefore be used with caution. The program can at this point only be use to make qualitative analysis of these effects for example, a comparative analysis between different house types, or analysis of the relative reductions possible when making a change. The accuracy of the results is therefore not very high. Instead of speaking of 21% or 28% reduction, it would be more accurate to say that the reduction was approx. 20% or approx. 30%. It is more accurate to consider only the magnitude of the results, and not the precise value. This leaves the question of how the user can best employ the method. Even within the limitations stated above, it can still be concluded that high energy savings are possible, and it is possible to pinpoint where the largest saving potential lies. The results clearly indicate for example that adding temperature control measures in houses can give high savings, with relatively little investment. The results also show that changing the windows in apartments would be a wiser initial investment, than changing the wall isolation, whereas wall isolation would be a more attractive option in a detached house. By interpreting the results in a general way, the user will be able to make a better judgment of whether or not to make a certain change in the house. The program also offers other input variables, besides those used in this project, which can influence the energy consumption in a household. These include family size, floor and roof insulation, heating equipment, and house size. These variables were not included in this research, in order to minimize the number of research variables, but they add to the applications of DoMUS.
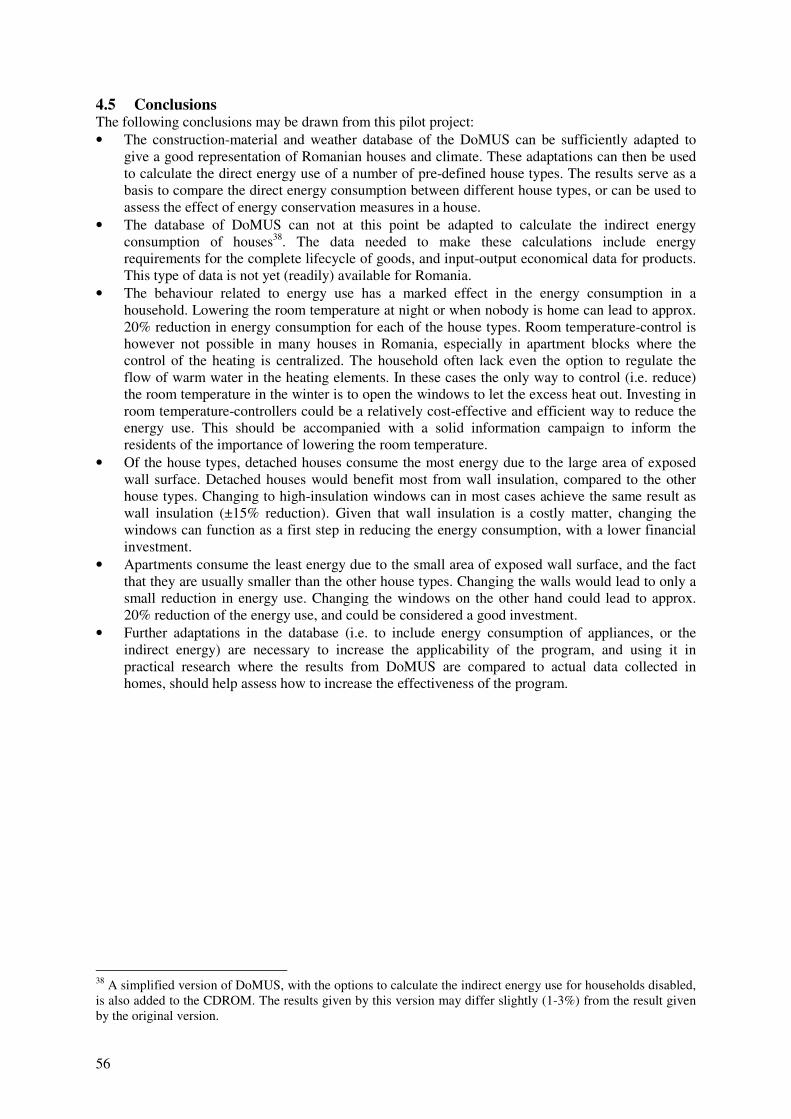
56
4.5 Conclusions The following conclusions may be drawn from this pilot project: • The construction-material and weather database of the DoMUS can be sufficiently adapted to
give a good representation of Romanian houses and climate. These adaptations can then be used to calculate the direct energy use of a number of pre-defined house types. The results serve as a basis to compare the direct energy consumption between different house types, or can be used to assess the effect of energy conservation measures in a house.
• The database of DoMUS can not at this point be adapted to calculate the indirect energy consumption of houses38. The data needed to make these calculations include energy requirements for the complete lifecycle of goods, and input-output economical data for products. This type of data is not yet (readily) available for Romania.
• The behaviour related to energy use has a marked effect in the energy consumption in a household. Lowering the room temperature at night or when nobody is home can lead to approx. 20% reduction in energy consumption for each of the house types. Room temperature-control is however not possible in many houses in Romania, especially in apartment blocks where the control of the heating is centralized. The household often lack even the option to regulate the flow of warm water in the heating elements. In these cases the only way to control (i.e. reduce) the room temperature in the winter is to open the windows to let the excess heat out. Investing in room temperature-controllers could be a relatively cost-effective and efficient way to reduce the energy use. This should be accompanied with a solid information campaign to inform the residents of the importance of lowering the room temperature.
• Of the house types, detached houses consume the most energy due to the large area of exposed wall surface. Detached houses would benefit most from wall insulation, compared to the other house types. Changing to high-insulation windows can in most cases achieve the same result as wall insulation (±15% reduction). Given that wall insulation is a costly matter, changing the windows can function as a first step in reducing the energy consumption, with a lower financial investment.
• Apartments consume the least energy due to the small area of exposed wall surface, and the fact that they are usually smaller than the other house types. Changing the walls would lead to only a small reduction in energy use. Changing the windows on the other hand could lead to approx. 20% reduction of the energy use, and could be considered a good investment.
• Further adaptations in the database (i.e. to include energy consumption of appliances, or the indirect energy) are necessary to increase the applicability of the program, and using it in practical research where the results from DoMUS are compared to actual data collected in homes, should help assess how to increase the effectiveness of the program.
38 A simplified version of DoMUS, with the options to calculate the indirect energy use for households disabled, is also added to the CDROM. The results given by this version may differ slightly (1-3%) from the result given by the original version.
57
Chapter 5: Traffic Modelling 5.1 Problem Definition, Method Used and Aims
Problem Definition: Bra�ov lies at the centre of a convergence of three Romanian and three European main commercial roads, five of which are depicted in Figure 5-1. The city is also an important economic and social centre, with the presence of big industrial agglomerations. It also has a large appeal to tourists. All these factors contribute to a high demand of mobility in and around the city. The traffic has also been affected by the effects of the transition to a market economy. The number of vehicles has doubled between 1990 and 1998 (see Table 5-1), and the average traffic flow in some main roads has tripled. The main inconvenience of the traffic is the overlap of the traffic flow in industrial and residential agglomerated area with the transit flow, which consists of both heavy and light vehicles. (Rata et. al., 2002) The streets are not equipped to handle this load. The street network consists of 551 streets with a total length of 260 km. The condition of the streets is very poor. The lifespan of nearly 94% of the streets has been exceeded by 10 years. The streets are often too narrow, especially in the old part city centre. Traffic is intense there, with few variants of access. There is no bypass, so the transit traffic goes through the city. The light vehicles go through the city centre, while the heavy transport transits on lateral streets, through residential areas, causing damage to tram rails and the street surface. (Rata et. al., 2002))
Figure 5-1: The position of Bra�ov in relation to the nation’s main commercial roads (Source: Sysoft S.R.L., 2000).
A large segment of the population still uses public transportation, despite the sharp increase in the number of privately owned vehicles. It is estimated that more than 70% of the active population uses public transportation to go to school or work. The vehicles (busses, trams, etc) used are old, oversized, and run at low speeds (average 12-18 km/h) with many stops, thus reducing the overall traffic flow. In some areas a special lane for public transport has been built to combat these effects, but these are not enough to solve the problems.
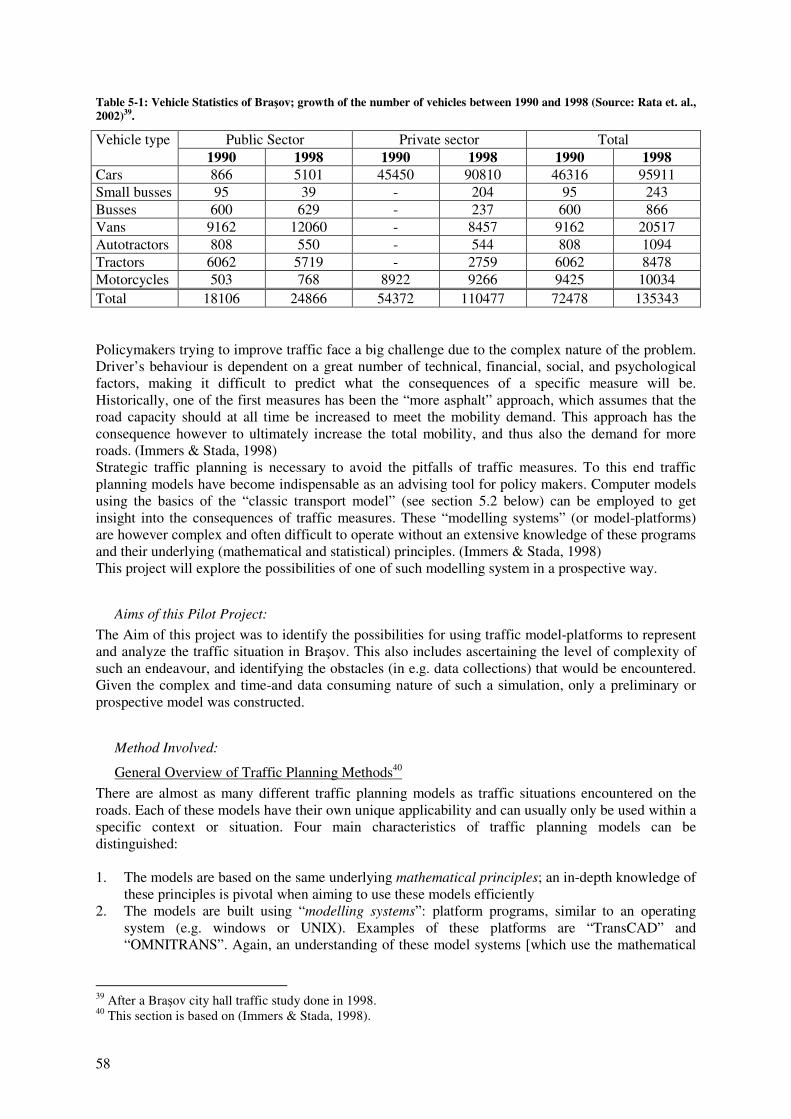
58
Table 5-1: Vehicle Statistics of Bra�ov; growth of the number of vehicles between 1990 and 1998 (Source: Rata et. al., 2002)39.
Public Sector Private sector Total Vehicle type 1990 1998 1990 1998 1990 1998
Cars 866 5101 45450 90810 46316 95911 Small busses 95 39 - 204 95 243 Busses 600 629 - 237 600 866 Vans 9162 12060 - 8457 9162 20517 Autotractors 808 550 - 544 808 1094 Tractors 6062 5719 - 2759 6062 8478 Motorcycles 503 768 8922 9266 9425 10034 Total 18106 24866 54372 110477 72478 135343 Policymakers trying to improve traffic face a big challenge due to the complex nature of the problem. Driver’s behaviour is dependent on a great number of technical, financial, social, and psychological factors, making it difficult to predict what the consequences of a specific measure will be. Historically, one of the first measures has been the “more asphalt” approach, which assumes that the road capacity should at all time be increased to meet the mobility demand. This approach has the consequence however to ultimately increase the total mobility, and thus also the demand for more roads. (Immers & Stada, 1998) Strategic traffic planning is necessary to avoid the pitfalls of traffic measures. To this end traffic planning models have become indispensable as an advising tool for policy makers. Computer models using the basics of the “classic transport model” (see section 5.2 below) can be employed to get insight into the consequences of traffic measures. These “modelling systems” (or model-platforms) are however complex and often difficult to operate without an extensive knowledge of these programs and their underlying (mathematical and statistical) principles. (Immers & Stada, 1998) This project will explore the possibilities of one of such modelling system in a prospective way.
Aims of this Pilot Project: The Aim of this project was to identify the possibilities for using traffic model-platforms to represent and analyze the traffic situation in Bra�ov. This also includes ascertaining the level of complexity of such an endeavour, and identifying the obstacles (in e.g. data collections) that would be encountered. Given the complex and time-and data consuming nature of such a simulation, only a preliminary or prospective model was constructed.
Method Involved:
General Overview of Traffic Planning Methods40 There are almost as many different traffic planning models as traffic situations encountered on the roads. Each of these models have their own unique applicability and can usually only be used within a specific context or situation. Four main characteristics of traffic planning models can be distinguished: 1. The models are based on the same underlying mathematical principles; an in-depth knowledge of
these principles is pivotal when aiming to use these models efficiently 2. The models are built using “modelling systems”: platform programs, similar to an operating
system (e.g. windows or UNIX). Examples of these platforms are “TransCAD” and “OMNITRANS”. Again, an understanding of these model systems [which use the mathematical
39 After a Bra�ov city hall traffic study done in 1998. 40 This section is based on (Immers & Stada, 1998).
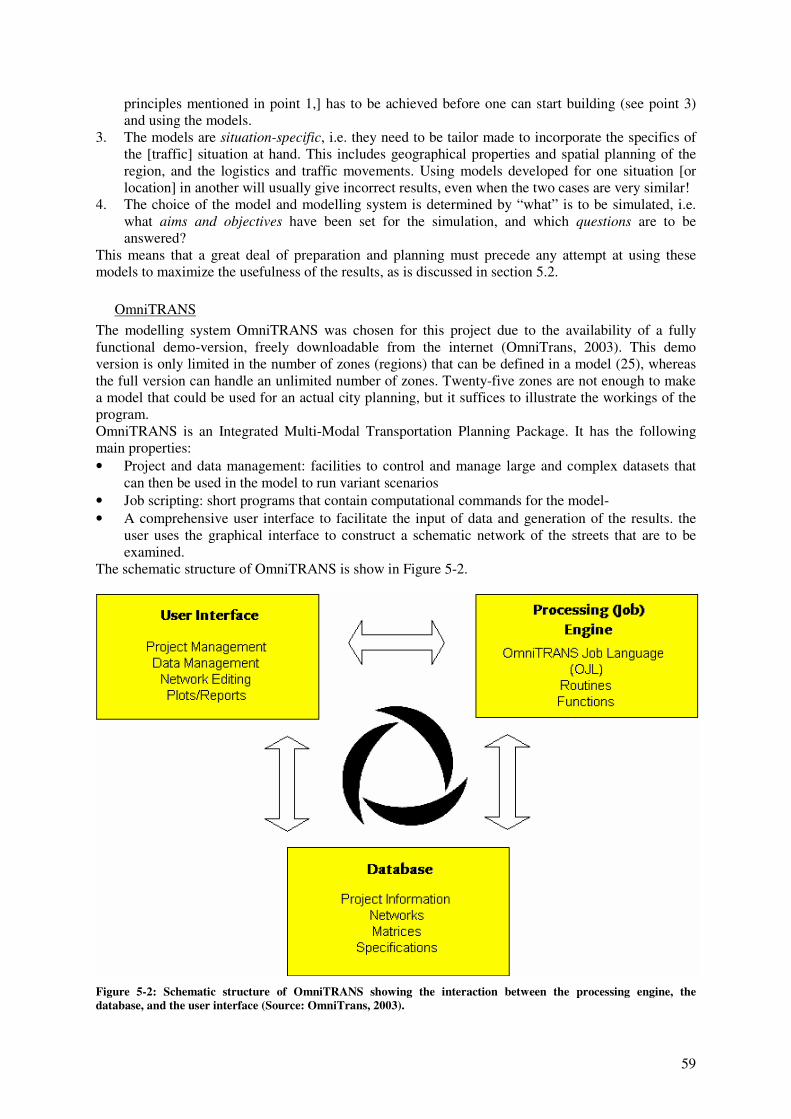
59
principles mentioned in point 1,] has to be achieved before one can start building (see point 3) and using the models.
3. The models are situation-specific, i.e. they need to be tailor made to incorporate the specifics of the [traffic] situation at hand. This includes geographical properties and spatial planning of the region, and the logistics and traffic movements. Using models developed for one situation [or location] in another will usually give incorrect results, even when the two cases are very similar!
4. The choice of the model and modelling system is determined by “what” is to be simulated, i.e. what aims and objectives have been set for the simulation, and which questions are to be answered?
This means that a great deal of preparation and planning must precede any attempt at using these models to maximize the usefulness of the results, as is discussed in section 5.2.
OmniTRANS The modelling system OmniTRANS was chosen for this project due to the availability of a fully functional demo-version, freely downloadable from the internet (OmniTrans, 2003). This demo version is only limited in the number of zones (regions) that can be defined in a model (25), whereas the full version can handle an unlimited number of zones. Twenty-five zones are not enough to make a model that could be used for an actual city planning, but it suffices to illustrate the workings of the program. OmniTRANS is an Integrated Multi-Modal Transportation Planning Package. It has the following main properties: • Project and data management: facilities to control and manage large and complex datasets that
can then be used in the model to run variant scenarios • Job scripting: short programs that contain computational commands for the model- • A comprehensive user interface to facilitate the input of data and generation of the results. the
user uses the graphical interface to construct a schematic network of the streets that are to be examined.
The schematic structure of OmniTRANS is show in Figure 5-2.
Figure 5-2: Schematic structure of OmniTRANS showing the interaction between the processing engine, the database, and the user interface (Source: OmniTrans, 2003).
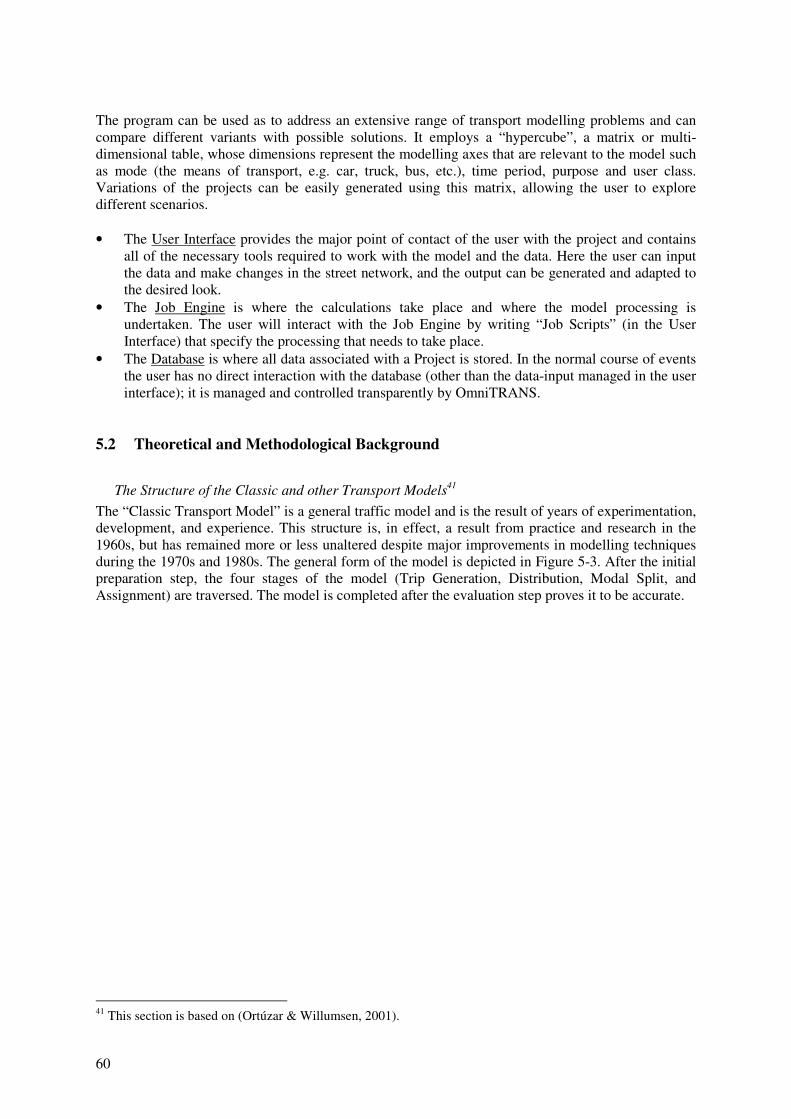
60
The program can be used as to address an extensive range of transport modelling problems and can compare different variants with possible solutions. It employs a “hypercube”, a matrix or multi-dimensional table, whose dimensions represent the modelling axes that are relevant to the model such as mode (the means of transport, e.g. car, truck, bus, etc.), time period, purpose and user class. Variations of the projects can be easily generated using this matrix, allowing the user to explore different scenarios. • The User Interface provides the major point of contact of the user with the project and contains
all of the necessary tools required to work with the model and the data. Here the user can input the data and make changes in the street network, and the output can be generated and adapted to the desired look.
• The Job Engine is where the calculations take place and where the model processing is undertaken. The user will interact with the Job Engine by writing “Job Scripts” (in the User Interface) that specify the processing that needs to take place.
• The Database is where all data associated with a Project is stored. In the normal course of events the user has no direct interaction with the database (other than the data-input managed in the user interface); it is managed and controlled transparently by OmniTRANS.
5.2 Theoretical and Methodological Background
The Structure of the Classic and other Transport Models41 The “Classic Transport Model” is a general traffic model and is the result of years of experimentation, development, and experience. This structure is, in effect, a result from practice and research in the 1960s, but has remained more or less unaltered despite major improvements in modelling techniques during the 1970s and 1980s. The general form of the model is depicted in Figure 5-3. After the initial preparation step, the four stages of the model (Trip Generation, Distribution, Modal Split, and Assignment) are traversed. The model is completed after the evaluation step proves it to be accurate.
41 This section is based on (Ortúzar & Willumsen, 2001).
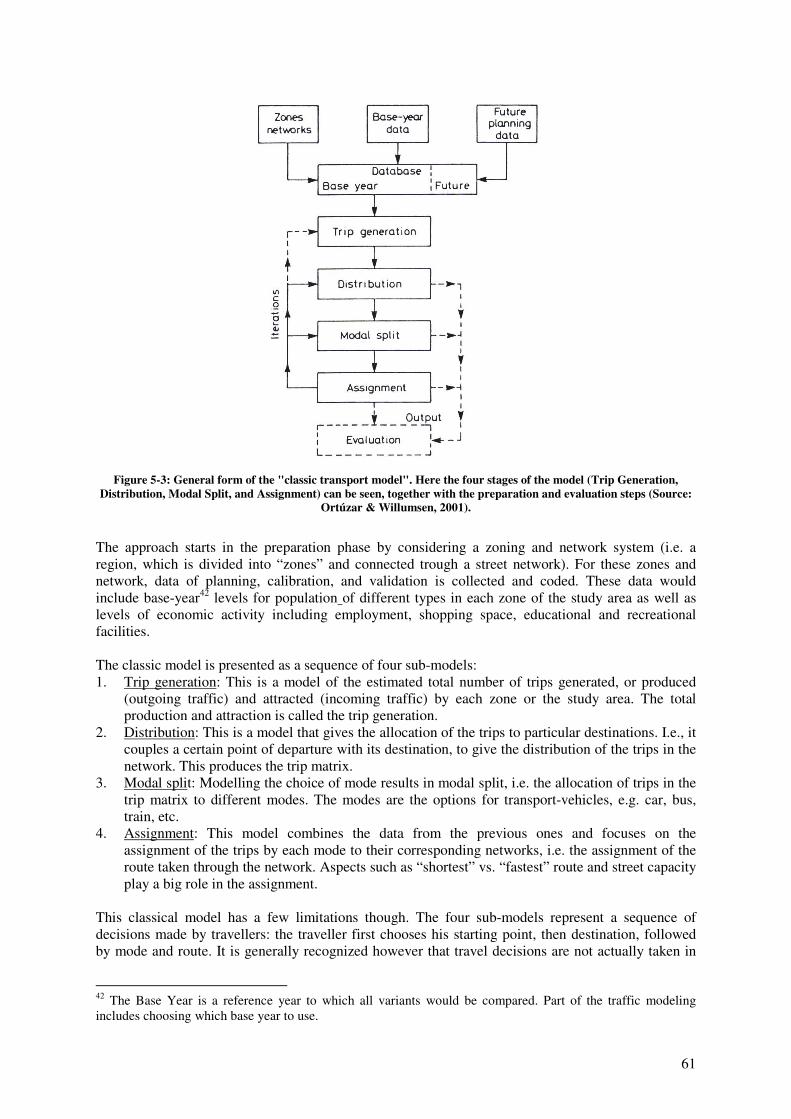
61
Figure 5-3: General form of the "classic transport model". Here the four stages of the model (Trip Generation,
Distribution, Modal Split, and Assignment) can be seen, together with the preparation and evaluation steps (Source: Ortúzar & Willumsen, 2001).
The approach starts in the preparation phase by considering a zoning and network system (i.e. a region, which is divided into “zones” and connected trough a street network). For these zones and network, data of planning, calibration, and validation is collected and coded. These data would include base-year42 levels for population of different types in each zone of the study area as well as levels of economic activity including employment, shopping space, educational and recreational facilities. The classic model is presented as a sequence of four sub-models: 1. Trip generation: This is a model of the estimated total number of trips generated, or produced
(outgoing traffic) and attracted (incoming traffic) by each zone or the study area. The total production and attraction is called the trip generation.
2. Distribution: This is a model that gives the allocation of the trips to particular destinations. I.e., it couples a certain point of departure with its destination, to give the distribution of the trips in the network. This produces the trip matrix.
3. Modal split: Modelling the choice of mode results in modal split, i.e. the allocation of trips in the trip matrix to different modes. The modes are the options for transport-vehicles, e.g. car, bus, train, etc.
4. Assignment: This model combines the data from the previous ones and focuses on the assignment of the trips by each mode to their corresponding networks, i.e. the assignment of the route taken through the network. Aspects such as “shortest” vs. “fastest” route and street capacity play a big role in the assignment.
This classical model has a few limitations though. The four sub-models represent a sequence of decisions made by travellers: the traveller first chooses his starting point, then destination, followed by mode and route. It is generally recognized however that travel decisions are not actually taken in
42 The Base Year is a reference year to which all variants would be compared. Part of the traffic modeling includes choosing which base year to use.
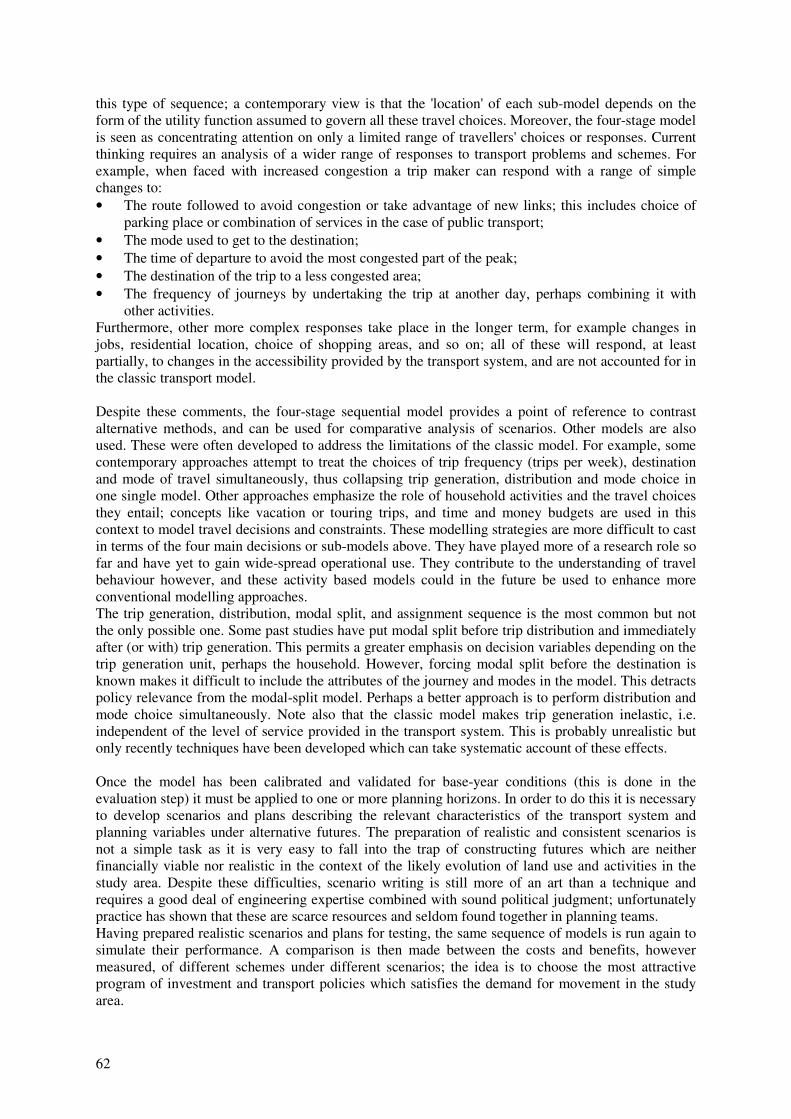
62
this type of sequence; a contemporary view is that the 'location' of each sub-model depends on the form of the utility function assumed to govern all these travel choices. Moreover, the four-stage model is seen as concentrating attention on only a limited range of travellers' choices or responses. Current thinking requires an analysis of a wider range of responses to transport problems and schemes. For example, when faced with increased congestion a trip maker can respond with a range of simple changes to: • The route followed to avoid congestion or take advantage of new links; this includes choice of
parking place or combination of services in the case of public transport; • The mode used to get to the destination; • The time of departure to avoid the most congested part of the peak; • The destination of the trip to a less congested area; • The frequency of journeys by undertaking the trip at another day, perhaps combining it with
other activities. Furthermore, other more complex responses take place in the longer term, for example changes in jobs, residential location, choice of shopping areas, and so on; all of these will respond, at least partially, to changes in the accessibility provided by the transport system, and are not accounted for in the classic transport model. Despite these comments, the four-stage sequential model provides a point of reference to contrast alternative methods, and can be used for comparative analysis of scenarios. Other models are also used. These were often developed to address the limitations of the classic model. For example, some contemporary approaches attempt to treat the choices of trip frequency (trips per week), destination and mode of travel simultaneously, thus collapsing trip generation, distribution and mode choice in one single model. Other approaches emphasize the role of household activities and the travel choices they entail; concepts like vacation or touring trips, and time and money budgets are used in this context to model travel decisions and constraints. These modelling strategies are more difficult to cast in terms of the four main decisions or sub-models above. They have played more of a research role so far and have yet to gain wide-spread operational use. They contribute to the understanding of travel behaviour however, and these activity based models could in the future be used to enhance more conventional modelling approaches. The trip generation, distribution, modal split, and assignment sequence is the most common but not the only possible one. Some past studies have put modal split before trip distribution and immediately after (or with) trip generation. This permits a greater emphasis on decision variables depending on the trip generation unit, perhaps the household. However, forcing modal split before the destination is known makes it difficult to include the attributes of the journey and modes in the model. This detracts policy relevance from the modal-split model. Perhaps a better approach is to perform distribution and mode choice simultaneously. Note also that the classic model makes trip generation inelastic, i.e. independent of the level of service provided in the transport system. This is probably unrealistic but only recently techniques have been developed which can take systematic account of these effects. Once the model has been calibrated and validated for base-year conditions (this is done in the evaluation step) it must be applied to one or more planning horizons. In order to do this it is necessary to develop scenarios and plans describing the relevant characteristics of the transport system and planning variables under alternative futures. The preparation of realistic and consistent scenarios is not a simple task as it is very easy to fall into the trap of constructing futures which are neither financially viable nor realistic in the context of the likely evolution of land use and activities in the study area. Despite these difficulties, scenario writing is still more of an art than a technique and requires a good deal of engineering expertise combined with sound political judgment; unfortunately practice has shown that these are scarce resources and seldom found together in planning teams. Having prepared realistic scenarios and plans for testing, the same sequence of models is run again to simulate their performance. A comparison is then made between the costs and benefits, however measured, of different schemes under different scenarios; the idea is to choose the most attractive program of investment and transport policies which satisfies the demand for movement in the study area.
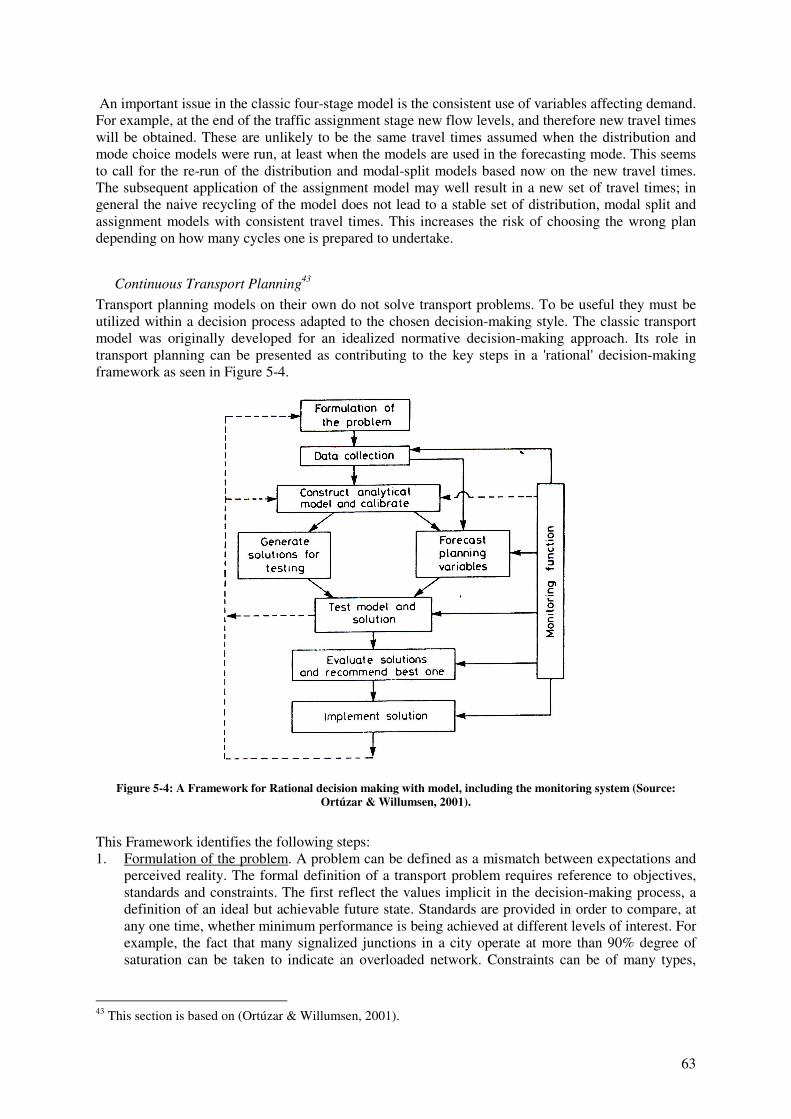
63
An important issue in the classic four-stage model is the consistent use of variables affecting demand. For example, at the end of the traffic assignment stage new flow levels, and therefore new travel times will be obtained. These are unlikely to be the same travel times assumed when the distribution and mode choice models were run, at least when the models are used in the forecasting mode. This seems to call for the re-run of the distribution and modal-split models based now on the new travel times. The subsequent application of the assignment model may well result in a new set of travel times; in general the naive recycling of the model does not lead to a stable set of distribution, modal split and assignment models with consistent travel times. This increases the risk of choosing the wrong plan depending on how many cycles one is prepared to undertake.
Continuous Transport Planning43 Transport planning models on their own do not solve transport problems. To be useful they must be utilized within a decision process adapted to the chosen decision-making style. The classic transport model was originally developed for an idealized normative decision-making approach. Its role in transport planning can be presented as contributing to the key steps in a 'rational' decision-making framework as seen in Figure 5-4.
Figure 5-4: A Framework for Rational decision making with model, including the monitoring system (Source:
Ortúzar & Willumsen, 2001).
This Framework identifies the following steps: 1. Formulation of the problem. A problem can be defined as a mismatch between expectations and
perceived reality. The formal definition of a transport problem requires reference to objectives, standards and constraints. The first reflect the values implicit in the decision-making process, a definition of an ideal but achievable future state. Standards are provided in order to compare, at any one time, whether minimum performance is being achieved at different levels of interest. For example, the fact that many signalized junctions in a city operate at more than 90% degree of saturation can be taken to indicate an overloaded network. Constraints can be of many types,
43 This section is based on (Ortúzar & Willumsen, 2001).
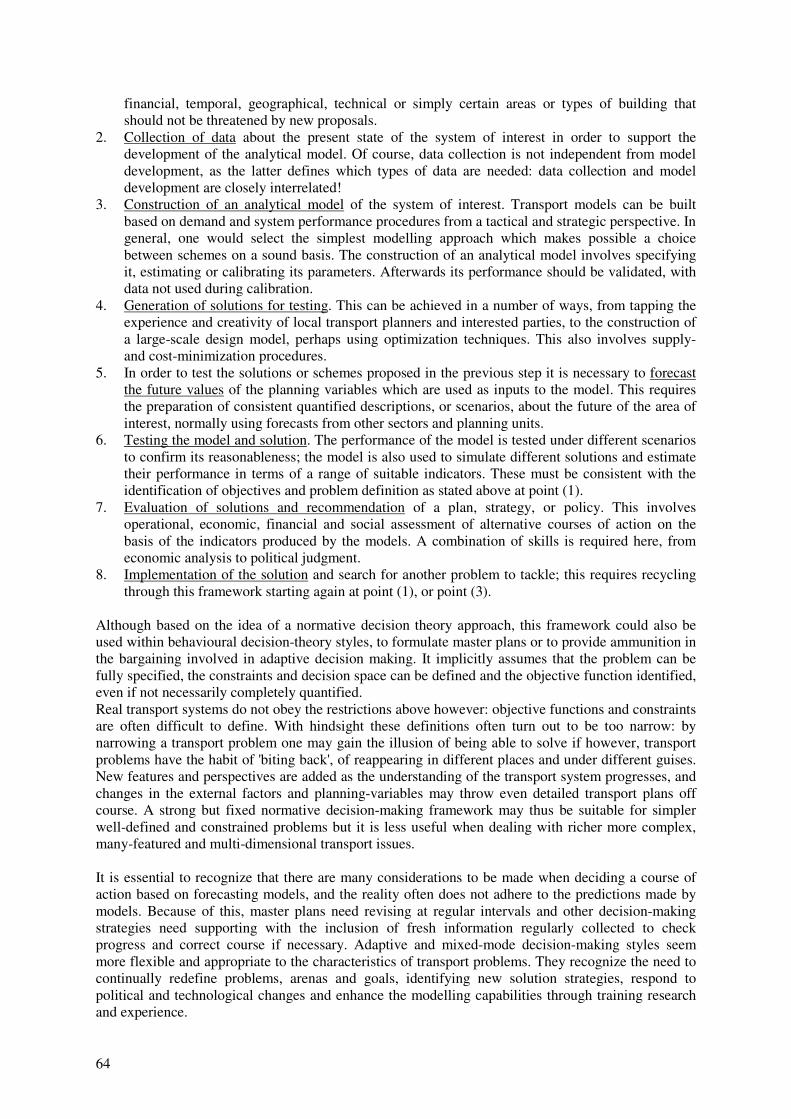
64
financial, temporal, geographical, technical or simply certain areas or types of building that should not be threatened by new proposals.
2. Collection of data about the present state of the system of interest in order to support the development of the analytical model. Of course, data collection is not independent from model development, as the latter defines which types of data are needed: data collection and model development are closely interrelated!
3. Construction of an analytical model of the system of interest. Transport models can be built based on demand and system performance procedures from a tactical and strategic perspective. In general, one would select the simplest modelling approach which makes possible a choice between schemes on a sound basis. The construction of an analytical model involves specifying it, estimating or calibrating its parameters. Afterwards its performance should be validated, with data not used during calibration.
4. Generation of solutions for testing. This can be achieved in a number of ways, from tapping the experience and creativity of local transport planners and interested parties, to the construction of a large-scale design model, perhaps using optimization techniques. This also involves supply- and cost-minimization procedures.
5. In order to test the solutions or schemes proposed in the previous step it is necessary to forecast the future values of the planning variables which are used as inputs to the model. This requires the preparation of consistent quantified descriptions, or scenarios, about the future of the area of interest, normally using forecasts from other sectors and planning units.
6. Testing the model and solution. The performance of the model is tested under different scenarios to confirm its reasonableness; the model is also used to simulate different solutions and estimate their performance in terms of a range of suitable indicators. These must be consistent with the identification of objectives and problem definition as stated above at point (1).
7. Evaluation of solutions and recommendation of a plan, strategy, or policy. This involves operational, economic, financial and social assessment of alternative courses of action on the basis of the indicators produced by the models. A combination of skills is required here, from economic analysis to political judgment.
8. Implementation of the solution and search for another problem to tackle; this requires recycling through this framework starting again at point (1), or point (3).
Although based on the idea of a normative decision theory approach, this framework could also be used within behavioural decision-theory styles, to formulate master plans or to provide ammunition in the bargaining involved in adaptive decision making. It implicitly assumes that the problem can be fully specified, the constraints and decision space can be defined and the objective function identified, even if not necessarily completely quantified. Real transport systems do not obey the restrictions above however: objective functions and constraints are often difficult to define. With hindsight these definitions often turn out to be too narrow: by narrowing a transport problem one may gain the illusion of being able to solve if however, transport problems have the habit of 'biting back', of reappearing in different places and under different guises. New features and perspectives are added as the understanding of the transport system progresses, and changes in the external factors and planning-variables may throw even detailed transport plans off course. A strong but fixed normative decision-making framework may thus be suitable for simpler well-defined and constrained problems but it is less useful when dealing with richer more complex, many-featured and multi-dimensional transport issues. It is essential to recognize that there are many considerations to be made when deciding a course of action based on forecasting models, and the reality often does not adhere to the predictions made by models. Because of this, master plans need revising at regular intervals and other decision-making strategies need supporting with the inclusion of fresh information regularly collected to check progress and correct course if necessary. Adaptive and mixed-mode decision-making styles seem more flexible and appropriate to the characteristics of transport problems. They recognize the need to continually redefine problems, arenas and goals, identifying new solution strategies, respond to political and technological changes and enhance the modelling capabilities through training research and experience.
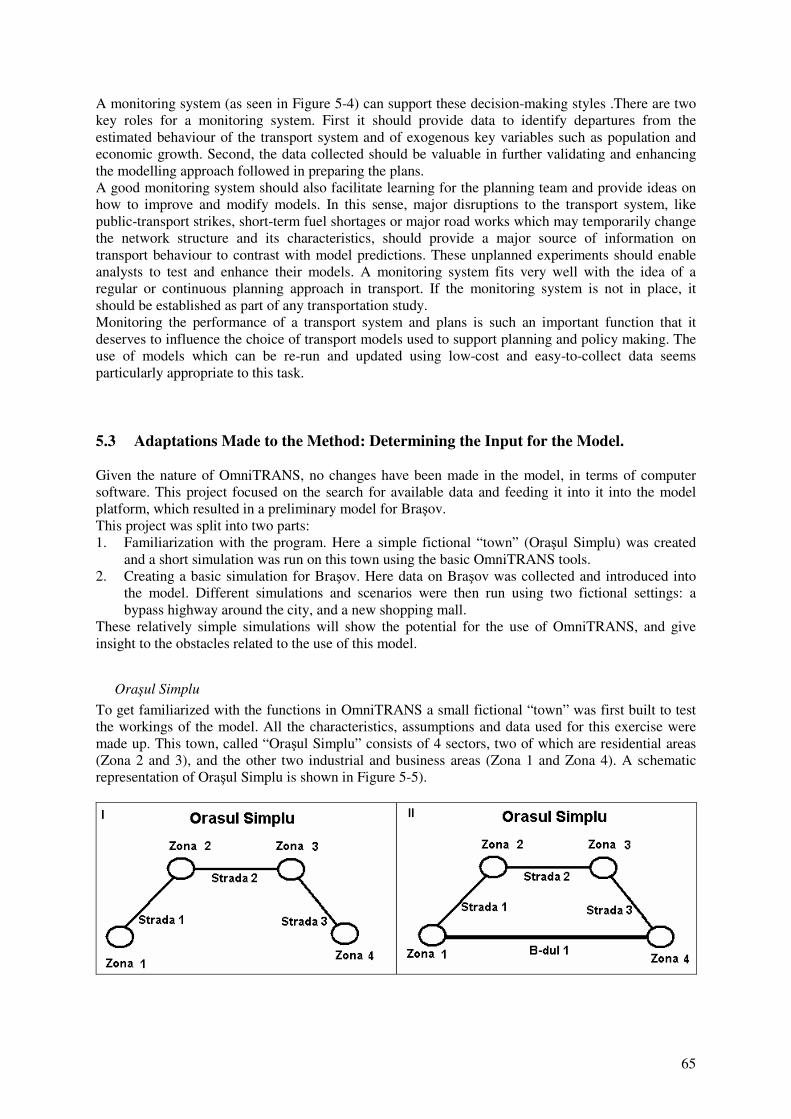
65
A monitoring system (as seen in Figure 5-4) can support these decision-making styles .There are two key roles for a monitoring system. First it should provide data to identify departures from the estimated behaviour of the transport system and of exogenous key variables such as population and economic growth. Second, the data collected should be valuable in further validating and enhancing the modelling approach followed in preparing the plans. A good monitoring system should also facilitate learning for the planning team and provide ideas on how to improve and modify models. In this sense, major disruptions to the transport system, like public-transport strikes, short-term fuel shortages or major road works which may temporarily change the network structure and its characteristics, should provide a major source of information on transport behaviour to contrast with model predictions. These unplanned experiments should enable analysts to test and enhance their models. A monitoring system fits very well with the idea of a regular or continuous planning approach in transport. If the monitoring system is not in place, it should be established as part of any transportation study. Monitoring the performance of a transport system and plans is such an important function that it deserves to influence the choice of transport models used to support planning and policy making. The use of models which can be re-run and updated using low-cost and easy-to-collect data seems particularly appropriate to this task. 5.3 Adaptations Made to the Method: Determining the Input for the Model. Given the nature of OmniTRANS, no changes have been made in the model, in terms of computer software. This project focused on the search for available data and feeding it into it into the model platform, which resulted in a preliminary model for Bra�ov. This project was split into two parts: 1. Familiarization with the program. Here a simple fictional “town” (Ora�ul Simplu) was created
and a short simulation was run on this town using the basic OmniTRANS tools. 2. Creating a basic simulation for Bra�ov. Here data on Bra�ov was collected and introduced into
the model. Different simulations and scenarios were then run using two fictional settings: a bypass highway around the city, and a new shopping mall.
These relatively simple simulations will show the potential for the use of OmniTRANS, and give insight to the obstacles related to the use of this model.
Ora�ul Simplu To get familiarized with the functions in OmniTRANS a small fictional “town” was first built to test the workings of the model. All the characteristics, assumptions and data used for this exercise were made up. This town, called “Ora�ul Simplu” consists of 4 sectors, two of which are residential areas (Zona 2 and 3), and the other two industrial and business areas (Zona 1 and Zona 4). A schematic representation of Ora�ul Simplu is shown in Figure 5-5).
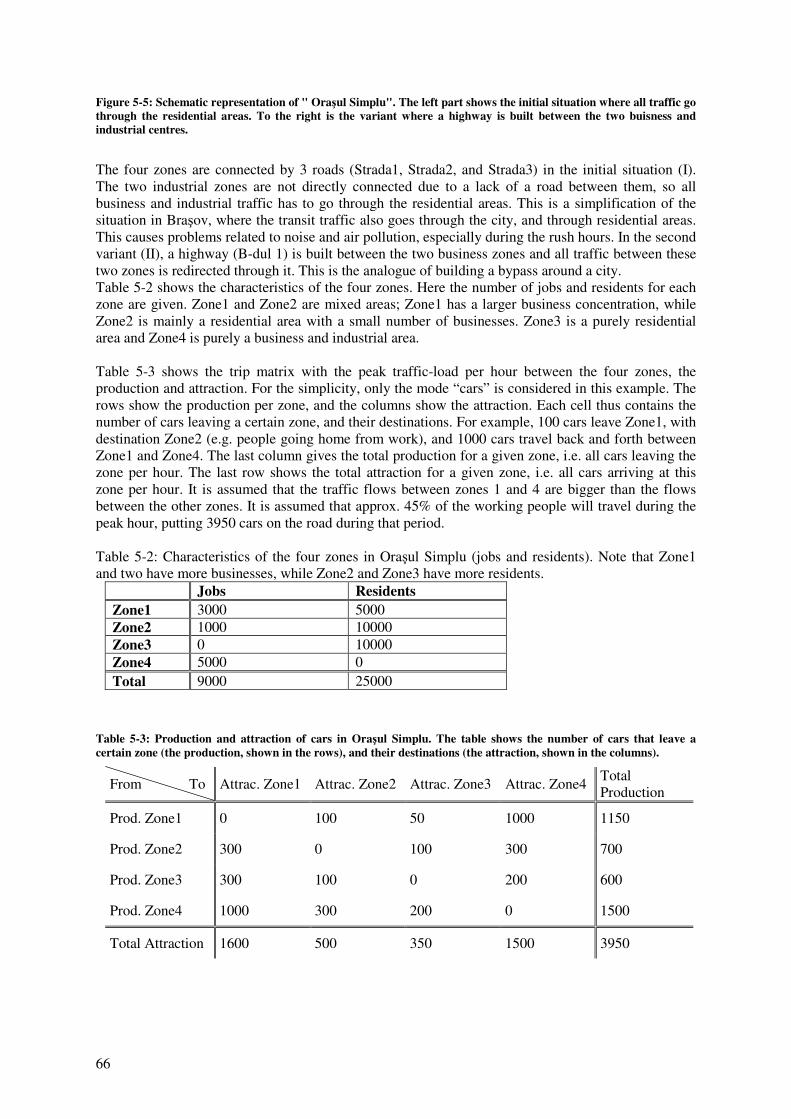
66
Figure 5-5: Schematic representation of " Ora�ul Simplu". The left part shows the initial situation where all traffic go through the residential areas. To the right is the variant where a highway is built between the two buisness and industrial centres.
The four zones are connected by 3 roads (Strada1, Strada2, and Strada3) in the initial situation (I). The two industrial zones are not directly connected due to a lack of a road between them, so all business and industrial traffic has to go through the residential areas. This is a simplification of the situation in Bra�ov, where the transit traffic also goes through the city, and through residential areas. This causes problems related to noise and air pollution, especially during the rush hours. In the second variant (II), a highway (B-dul 1) is built between the two business zones and all traffic between these two zones is redirected through it. This is the analogue of building a bypass around a city. Table 5-2 shows the characteristics of the four zones. Here the number of jobs and residents for each zone are given. Zone1 and Zone2 are mixed areas; Zone1 has a larger business concentration, while Zone2 is mainly a residential area with a small number of businesses. Zone3 is a purely residential area and Zone4 is purely a business and industrial area. Table 5-3 shows the trip matrix with the peak traffic-load per hour between the four zones, the production and attraction. For the simplicity, only the mode “cars” is considered in this example. The rows show the production per zone, and the columns show the attraction. Each cell thus contains the number of cars leaving a certain zone, and their destinations. For example, 100 cars leave Zone1, with destination Zone2 (e.g. people going home from work), and 1000 cars travel back and forth between Zone1 and Zone4. The last column gives the total production for a given zone, i.e. all cars leaving the zone per hour. The last row shows the total attraction for a given zone, i.e. all cars arriving at this zone per hour. It is assumed that the traffic flows between zones 1 and 4 are bigger than the flows between the other zones. It is assumed that approx. 45% of the working people will travel during the peak hour, putting 3950 cars on the road during that period. Table 5-2: Characteristics of the four zones in Ora�ul Simplu (jobs and residents). Note that Zone1 and two have more businesses, while Zone2 and Zone3 have more residents.
Jobs Residents Zone1 3000 5000 Zone2 1000 10000 Zone3 0 10000 Zone4 5000 0 Total 9000 25000
Table 5-3: Production and attraction of cars in Ora�ul Simplu. The table shows the number of cars that leave a certain zone (the production, shown in the rows), and their destinations (the attraction, shown in the columns).
From To Attrac. Zone1 Attrac. Zone2 Attrac. Zone3 Attrac. Zone4 Total Production
Prod. Zone1 0 100 50 1000 1150
Prod. Zone2 300 0 100 300 700
Prod. Zone3 300 100 0 200 600
Prod. Zone4 1000 300 200 0 1500
Total Attraction 1600 500 350 1500 3950
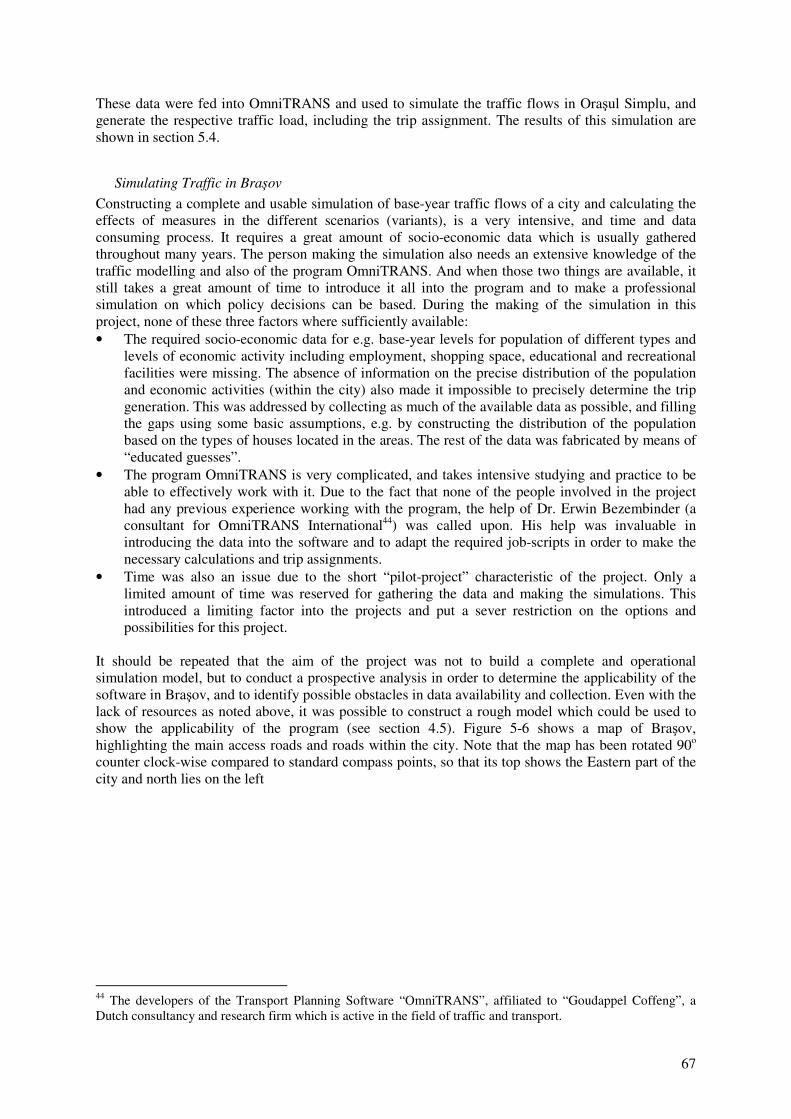
67
These data were fed into OmniTRANS and used to simulate the traffic flows in Ora�ul Simplu, and generate the respective traffic load, including the trip assignment. The results of this simulation are shown in section 5.4.
Simulating Traffic in Bra�ov Constructing a complete and usable simulation of base-year traffic flows of a city and calculating the effects of measures in the different scenarios (variants), is a very intensive, and time and data consuming process. It requires a great amount of socio-economic data which is usually gathered throughout many years. The person making the simulation also needs an extensive knowledge of the traffic modelling and also of the program OmniTRANS. And when those two things are available, it still takes a great amount of time to introduce it all into the program and to make a professional simulation on which policy decisions can be based. During the making of the simulation in this project, none of these three factors where sufficiently available: • The required socio-economic data for e.g. base-year levels for population of different types and
levels of economic activity including employment, shopping space, educational and recreational facilities were missing. The absence of information on the precise distribution of the population and economic activities (within the city) also made it impossible to precisely determine the trip generation. This was addressed by collecting as much of the available data as possible, and filling the gaps using some basic assumptions, e.g. by constructing the distribution of the population based on the types of houses located in the areas. The rest of the data was fabricated by means of “educated guesses”.
• The program OmniTRANS is very complicated, and takes intensive studying and practice to be able to effectively work with it. Due to the fact that none of the people involved in the project had any previous experience working with the program, the help of Dr. Erwin Bezembinder (a consultant for OmniTRANS International44) was called upon. His help was invaluable in introducing the data into the software and to adapt the required job-scripts in order to make the necessary calculations and trip assignments.
• Time was also an issue due to the short “pilot-project” characteristic of the project. Only a limited amount of time was reserved for gathering the data and making the simulations. This introduced a limiting factor into the projects and put a sever restriction on the options and possibilities for this project.
It should be repeated that the aim of the project was not to build a complete and operational simulation model, but to conduct a prospective analysis in order to determine the applicability of the software in Bra�ov, and to identify possible obstacles in data availability and collection. Even with the lack of resources as noted above, it was possible to construct a rough model which could be used to show the applicability of the program (see section 4.5). Figure 5-6 shows a map of Bra�ov, highlighting the main access roads and roads within the city. Note that the map has been rotated 90o counter clock-wise compared to standard compass points, so that its top shows the Eastern part of the city and north lies on the left
44 The developers of the Transport Planning Software “OmniTRANS”, affiliated to “Goudappel Coffeng”, a Dutch consultancy and research firm which is active in the field of traffic and transport.
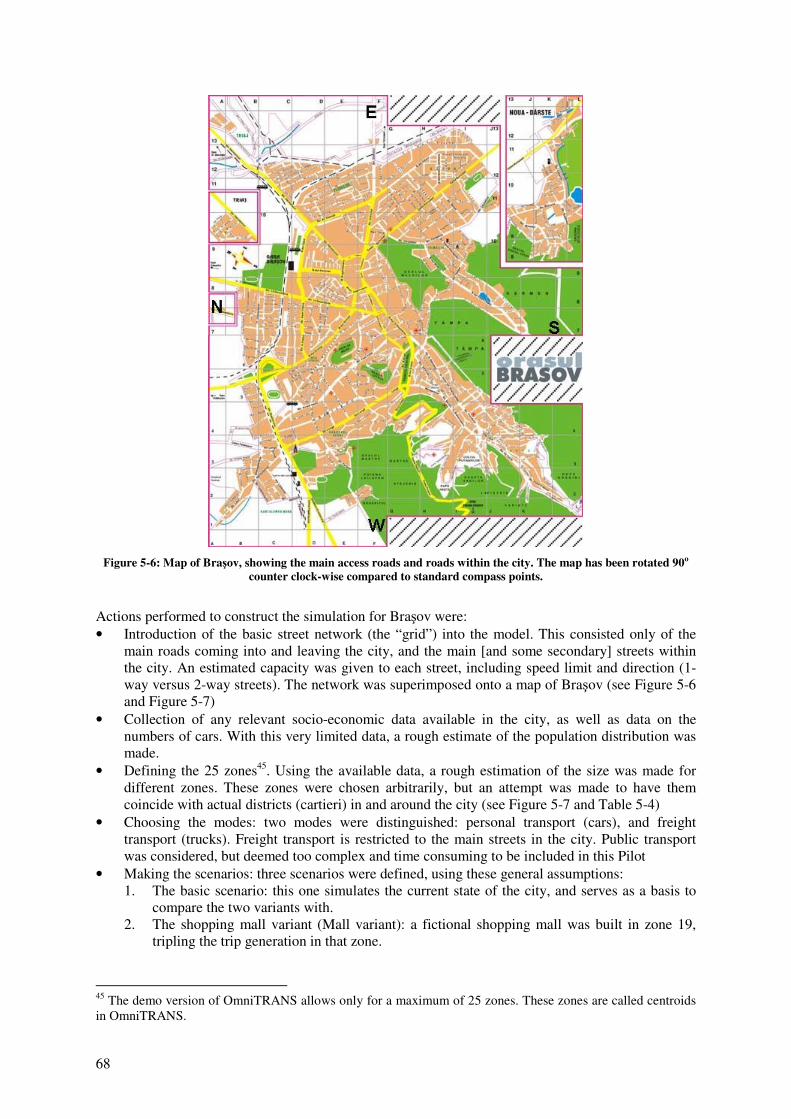
68
Figure 5-6: Map of Bra�ov, showing the main access roads and roads within the city. The map has been rotated 90o
counter clock-wise compared to standard compass points.
Actions performed to construct the simulation for Bra�ov were: • Introduction of the basic street network (the “grid”) into the model. This consisted only of the
main roads coming into and leaving the city, and the main [and some secondary] streets within the city. An estimated capacity was given to each street, including speed limit and direction (1-way versus 2-way streets). The network was superimposed onto a map of Bra�ov (see Figure 5-6 and Figure 5-7)
• Collection of any relevant socio-economic data available in the city, as well as data on the numbers of cars. With this very limited data, a rough estimate of the population distribution was made.
• Defining the 25 zones45. Using the available data, a rough estimation of the size was made for different zones. These zones were chosen arbitrarily, but an attempt was made to have them coincide with actual districts (cartieri) in and around the city (see Figure 5-7 and Table 5-4)
• Choosing the modes: two modes were distinguished: personal transport (cars), and freight transport (trucks). Freight transport is restricted to the main streets in the city. Public transport was considered, but deemed too complex and time consuming to be included in this Pilot
• Making the scenarios: three scenarios were defined, using these general assumptions: 1. The basic scenario: this one simulates the current state of the city, and serves as a basis to
compare the two variants with. 2. The shopping mall variant (Mall variant): a fictional shopping mall was built in zone 19,
tripling the trip generation in that zone.
45 The demo version of OmniTRANS allows only for a maximum of 25 zones. These zones are called centroids in OmniTRANS.
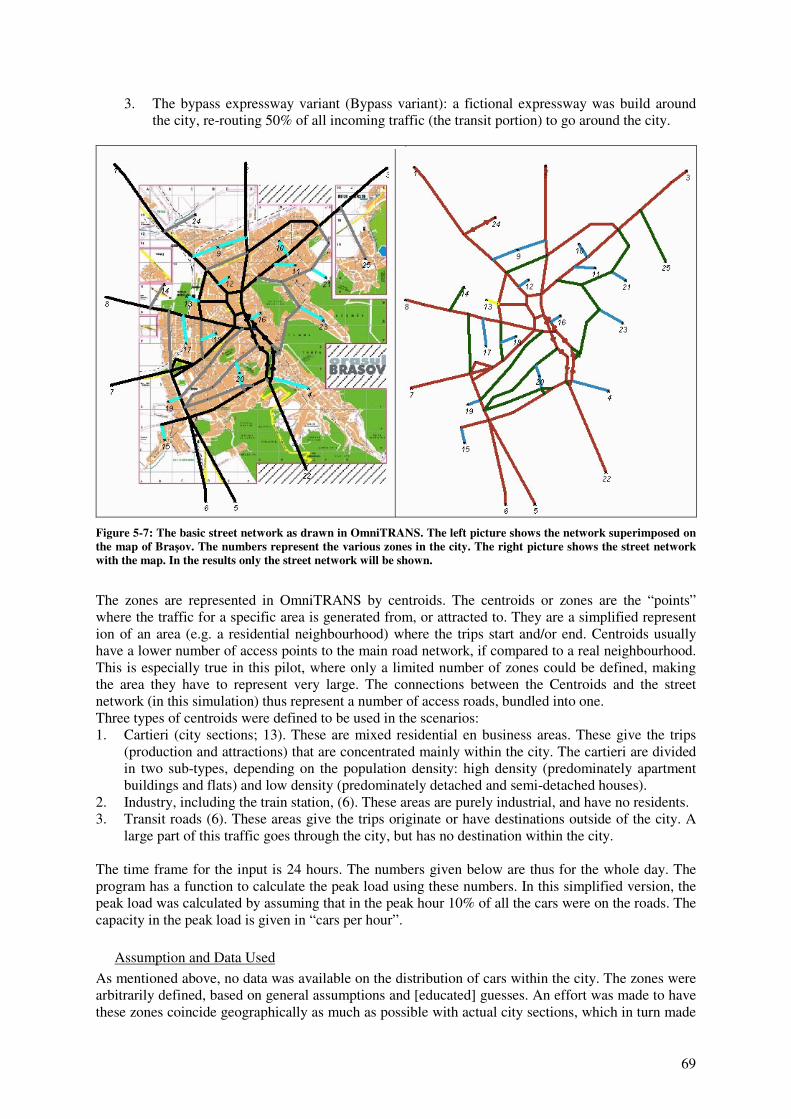
69
3. The bypass expressway variant (Bypass variant): a fictional expressway was build around the city, re-routing 50% of all incoming traffic (the transit portion) to go around the city.
Figure 5-7: The basic street network as drawn in OmniTRANS. The left picture shows the network superimposed on the map of Bra�ov. The numbers represent the various zones in the city. The right picture shows the street network with the map. In the results only the street network will be shown.
The zones are represented in OmniTRANS by centroids. The centroids or zones are the “points” where the traffic for a specific area is generated from, or attracted to. They are a simplified represent ion of an area (e.g. a residential neighbourhood) where the trips start and/or end. Centroids usually have a lower number of access points to the main road network, if compared to a real neighbourhood. This is especially true in this pilot, where only a limited number of zones could be defined, making the area they have to represent very large. The connections between the Centroids and the street network (in this simulation) thus represent a number of access roads, bundled into one. Three types of centroids were defined to be used in the scenarios: 1. Cartieri (city sections; 13). These are mixed residential en business areas. These give the trips
(production and attractions) that are concentrated mainly within the city. The cartieri are divided in two sub-types, depending on the population density: high density (predominately apartment buildings and flats) and low density (predominately detached and semi-detached houses).
2. Industry, including the train station, (6). These areas are purely industrial, and have no residents. 3. Transit roads (6). These areas give the trips originate or have destinations outside of the city. A
large part of this traffic goes through the city, but has no destination within the city. The time frame for the input is 24 hours. The numbers given below are thus for the whole day. The program has a function to calculate the peak load using these numbers. In this simplified version, the peak load was calculated by assuming that in the peak hour 10% of all the cars were on the roads. The capacity in the peak load is given in “cars per hour”.
Assumption and Data Used As mentioned above, no data was available on the distribution of cars within the city. The zones were arbitrarily defined, based on general assumptions and [educated] guesses. An effort was made to have these zones coincide geographically as much as possible with actual city sections, which in turn made
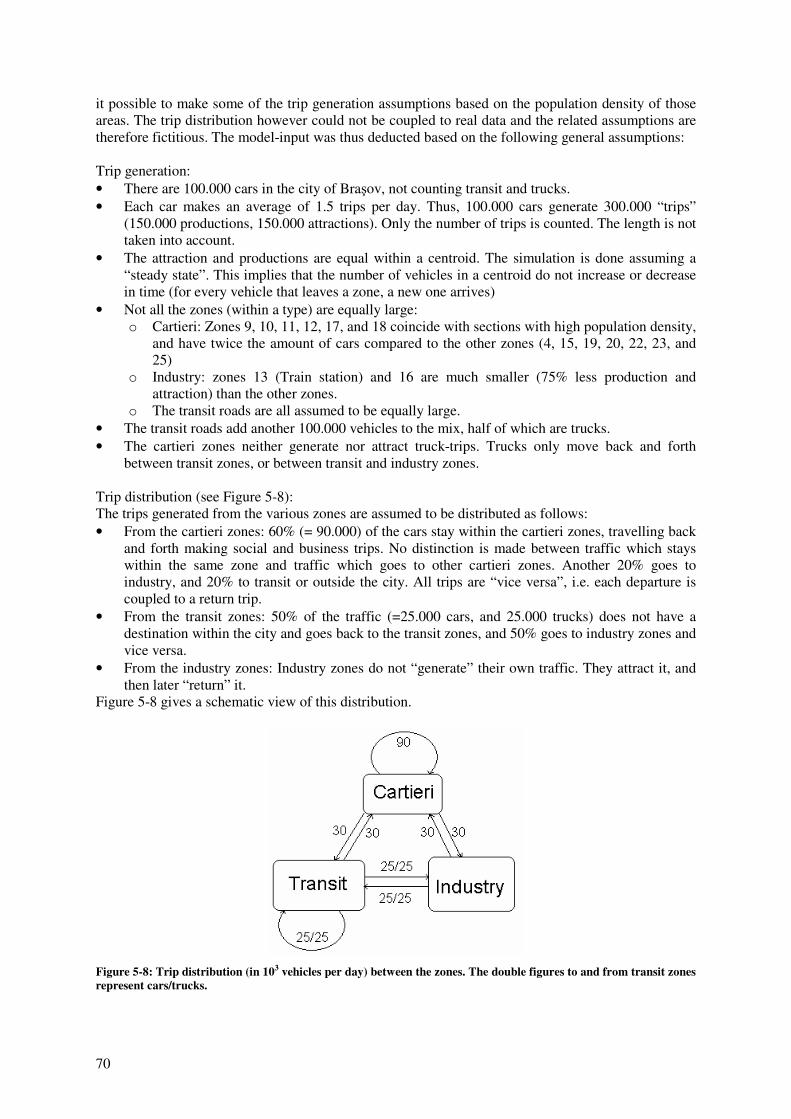
70
it possible to make some of the trip generation assumptions based on the population density of those areas. The trip distribution however could not be coupled to real data and the related assumptions are therefore fictitious. The model-input was thus deducted based on the following general assumptions: Trip generation: • There are 100.000 cars in the city of Bra�ov, not counting transit and trucks. • Each car makes an average of 1.5 trips per day. Thus, 100.000 cars generate 300.000 “trips”
(150.000 productions, 150.000 attractions). Only the number of trips is counted. The length is not taken into account.
• The attraction and productions are equal within a centroid. The simulation is done assuming a “steady state”. This implies that the number of vehicles in a centroid do not increase or decrease in time (for every vehicle that leaves a zone, a new one arrives)
• Not all the zones (within a type) are equally large: o Cartieri: Zones 9, 10, 11, 12, 17, and 18 coincide with sections with high population density,
and have twice the amount of cars compared to the other zones (4, 15, 19, 20, 22, 23, and 25)
o Industry: zones 13 (Train station) and 16 are much smaller (75% less production and attraction) than the other zones.
o The transit roads are all assumed to be equally large. • The transit roads add another 100.000 vehicles to the mix, half of which are trucks. • The cartieri zones neither generate nor attract truck-trips. Trucks only move back and forth
between transit zones, or between transit and industry zones. Trip distribution (see Figure 5-8): The trips generated from the various zones are assumed to be distributed as follows: • From the cartieri zones: 60% (= 90.000) of the cars stay within the cartieri zones, travelling back
and forth making social and business trips. No distinction is made between traffic which stays within the same zone and traffic which goes to other cartieri zones. Another 20% goes to industry, and 20% to transit or outside the city. All trips are “vice versa”, i.e. each departure is coupled to a return trip.
• From the transit zones: 50% of the traffic (=25.000 cars, and 25.000 trucks) does not have a destination within the city and goes back to the transit zones, and 50% goes to industry zones and vice versa.
• From the industry zones: Industry zones do not “generate” their own traffic. They attract it, and then later “return” it.
Figure 5-8 gives a schematic view of this distribution.
Figure 5-8: Trip distribution (in 103 vehicles per day) between the zones. The double figures to and from transit zones represent cars/trucks.
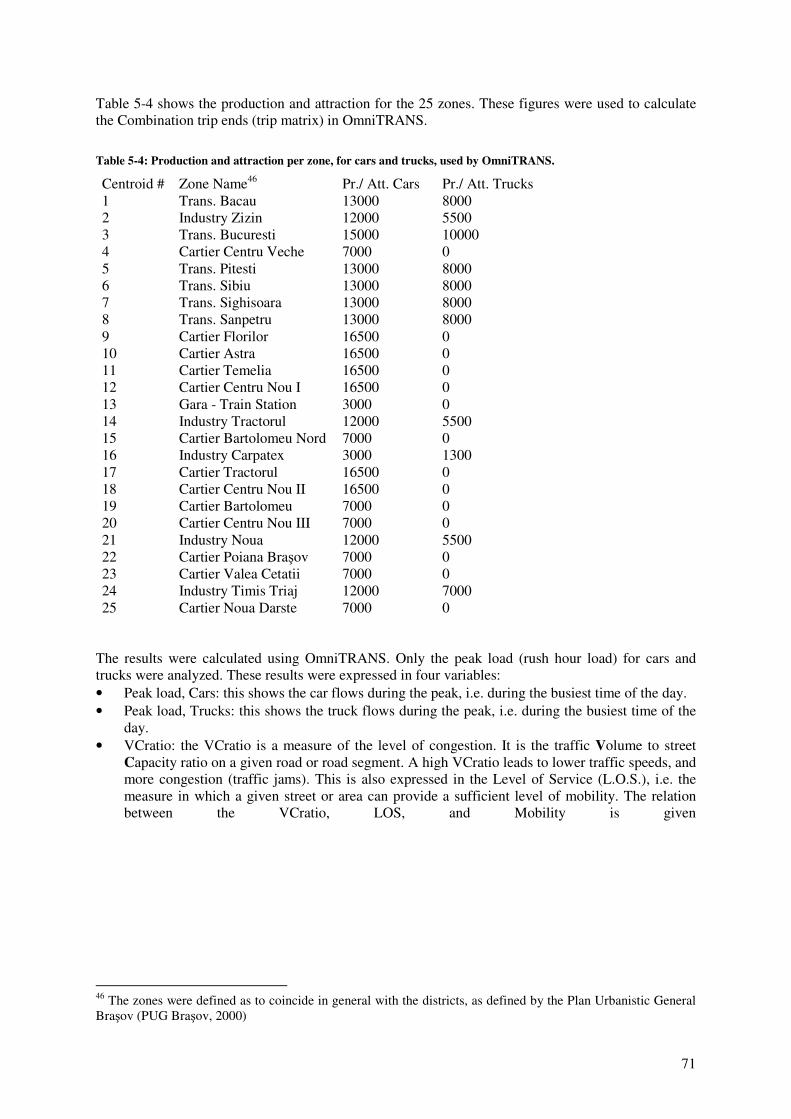
71
Table 5-4 shows the production and attraction for the 25 zones. These figures were used to calculate the Combination trip ends (trip matrix) in OmniTRANS.
Table 5-4: Production and attraction per zone, for cars and trucks, used by OmniTRANS.
Centroid # Zone Name46 Pr./ Att. Cars Pr./ Att. Trucks 1 Trans. Bacau 13000 8000 2 Industry Zizin 12000 5500 3 Trans. Bucuresti 15000 10000 4 Cartier Centru Veche 7000 0 5 Trans. Pitesti 13000 8000 6 Trans. Sibiu 13000 8000 7 Trans. Sighisoara 13000 8000 8 Trans. Sanpetru 13000 8000 9 Cartier Florilor 16500 0 10 Cartier Astra 16500 0 11 Cartier Temelia 16500 0 12 Cartier Centru Nou I 16500 0 13 Gara - Train Station 3000 0 14 Industry Tractorul 12000 5500 15 Cartier Bartolomeu Nord 7000 0 16 Industry Carpatex 3000 1300 17 Cartier Tractorul 16500 0 18 Cartier Centru Nou II 16500 0 19 Cartier Bartolomeu 7000 0 20 Cartier Centru Nou III 7000 0 21 Industry Noua 12000 5500 22 Cartier Poiana Bra�ov 7000 0 23 Cartier Valea Cetatii 7000 0 24 Industry Timis Triaj 12000 7000 25 Cartier Noua Darste 7000 0
The results were calculated using OmniTRANS. Only the peak load (rush hour load) for cars and trucks were analyzed. These results were expressed in four variables: • Peak load, Cars: this shows the car flows during the peak, i.e. during the busiest time of the day. • Peak load, Trucks: this shows the truck flows during the peak, i.e. during the busiest time of the
day. • VCratio: the VCratio is a measure of the level of congestion. It is the traffic Volume to street
Capacity ratio on a given road or road segment. A high VCratio leads to lower traffic speeds, and more congestion (traffic jams). This is also expressed in the Level of Service (L.O.S.), i.e. the measure in which a given street or area can provide a sufficient level of mobility. The relation between the VCratio, LOS, and Mobility is given
46 The zones were defined as to coincide in general with the districts, as defined by the Plan Urbanistic General Bra�ov (PUG Bra�ov, 2000)

72
Table 5-5. A high VCratio leads to lower traffic speeds, and more congestion. L.O.S. levels of D and higher (VCratio higher than 0.90) are generally considered problematic and can lead to traffic jams. (RPC, 2005), (OmniTrans, 2003)
• Variant Compare: here the basic scenario and the adapted variant are compared in one figure. This way the effects of the changes can be clearly seen.
The results of these simulations are shown in section 5.4.
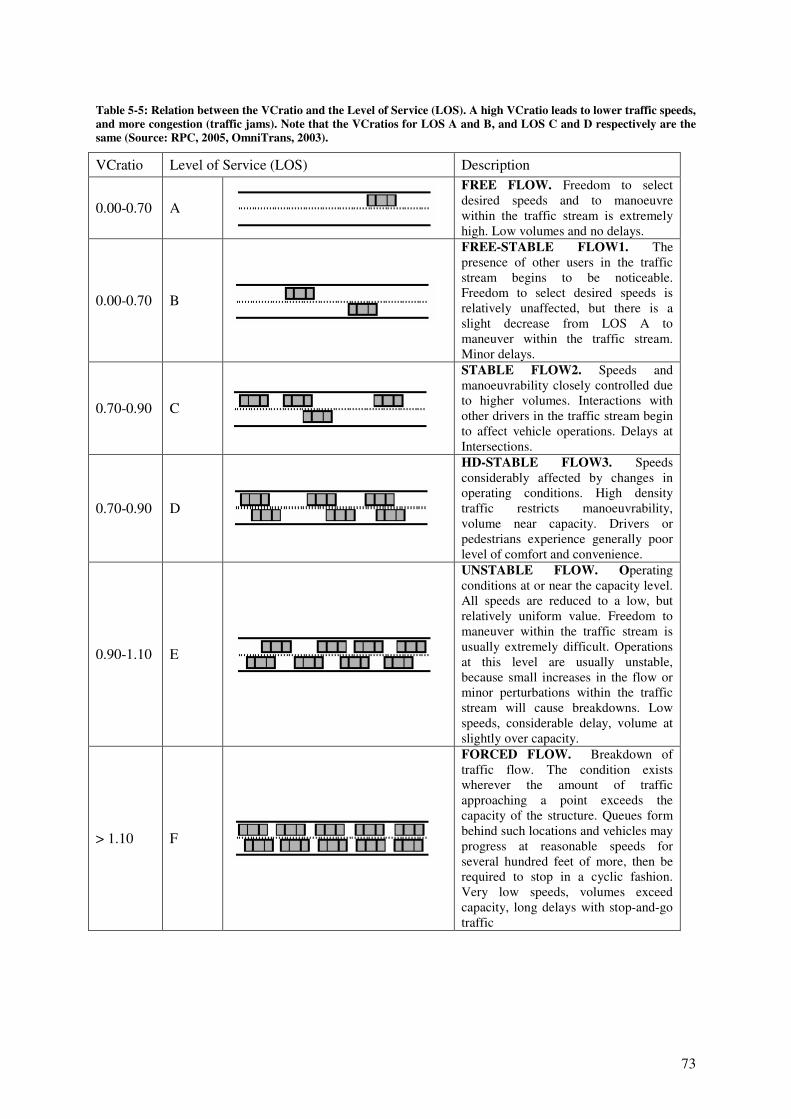
73
Table 5-5: Relation between the VCratio and the Level of Service (LOS). A high VCratio leads to lower traffic speeds, and more congestion (traffic jams). Note that the VCratios for LOS A and B, and LOS C and D respectively are the same (Source: RPC, 2005, OmniTrans, 2003).
VCratio Level of Service (LOS) Description
0.00-0.70 A
FREE FLOW. Freedom to select desired speeds and to manoeuvre within the traffic stream is extremely high. Low volumes and no delays.
0.00-0.70 B
FREE-STABLE FLOW1. The presence of other users in the traffic stream begins to be noticeable. Freedom to select desired speeds is relatively unaffected, but there is a slight decrease from LOS A to maneuver within the traffic stream. Minor delays.
0.70-0.90 C
STABLE FLOW2. Speeds and manoeuvrability closely controlled due to higher volumes. Interactions with other drivers in the traffic stream begin to affect vehicle operations. Delays at Intersections.
0.70-0.90 D
HD-STABLE FLOW3. Speeds considerably affected by changes in operating conditions. High density traffic restricts manoeuvrability, volume near capacity. Drivers or pedestrians experience generally poor level of comfort and convenience.
0.90-1.10 E
UNSTABLE FLOW. Operating conditions at or near the capacity level. All speeds are reduced to a low, but relatively uniform value. Freedom to maneuver within the traffic stream is usually extremely difficult. Operations at this level are usually unstable, because small increases in the flow or minor perturbations within the traffic stream will cause breakdowns. Low speeds, considerable delay, volume at slightly over capacity.
> 1.10 F
FORCED FLOW. Breakdown of traffic flow. The condition exists wherever the amount of traffic approaching a point exceeds the capacity of the structure. Queues form behind such locations and vehicles may progress at reasonable speeds for several hundred feet of more, then be required to stop in a cyclic fashion. Very low speeds, volumes exceed capacity, long delays with stop-and-go traffic
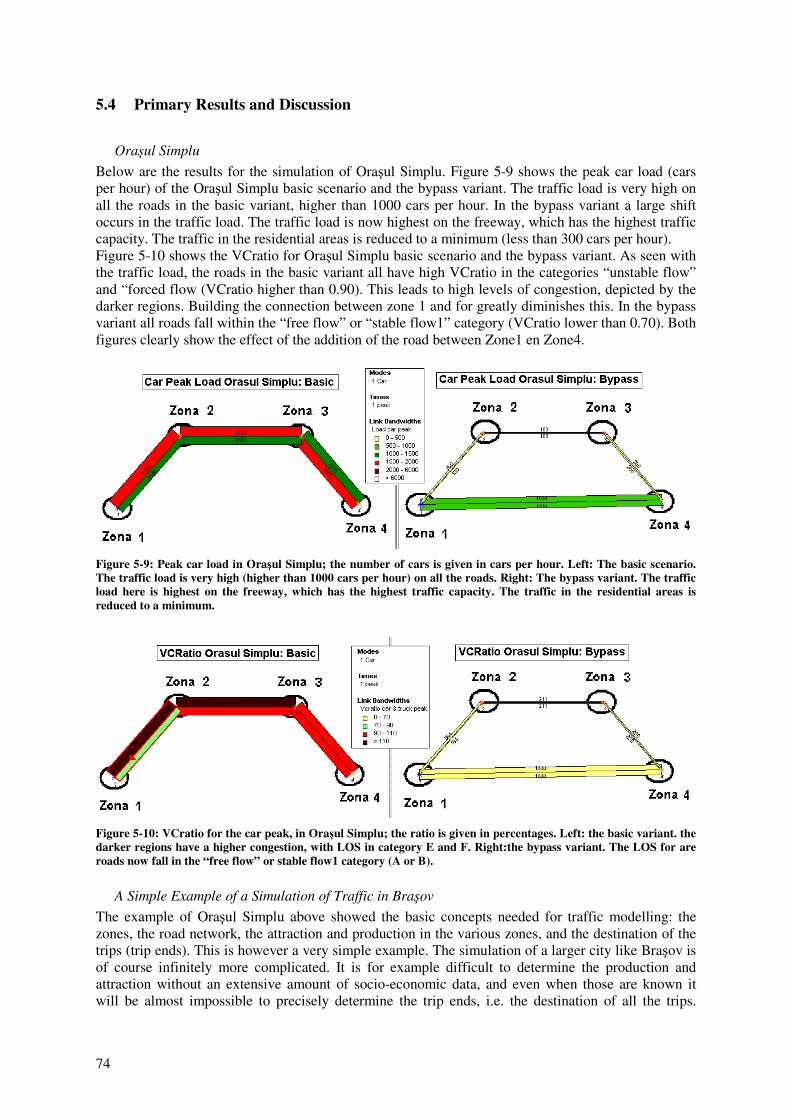
74
5.4 Primary Results and Discussion
Ora�ul Simplu Below are the results for the simulation of Ora�ul Simplu. Figure 5-9 shows the peak car load (cars per hour) of the Ora�ul Simplu basic scenario and the bypass variant. The traffic load is very high on all the roads in the basic variant, higher than 1000 cars per hour. In the bypass variant a large shift occurs in the traffic load. The traffic load is now highest on the freeway, which has the highest traffic capacity. The traffic in the residential areas is reduced to a minimum (less than 300 cars per hour). Figure 5-10 shows the VCratio for Ora�ul Simplu basic scenario and the bypass variant. As seen with the traffic load, the roads in the basic variant all have high VCratio in the categories “unstable flow” and “forced flow (VCratio higher than 0.90). This leads to high levels of congestion, depicted by the darker regions. Building the connection between zone 1 and for greatly diminishes this. In the bypass variant all roads fall within the “free flow” or “stable flow1” category (VCratio lower than 0.70). Both figures clearly show the effect of the addition of the road between Zone1 en Zone4.
Figure 5-9: Peak car load in Ora�ul Simplu; the number of cars is given in cars per hour. Left: The basic scenario. The traffic load is very high (higher than 1000 cars per hour) on all the roads. Right: The bypass variant. The traffic load here is highest on the freeway, which has the highest traffic capacity. The traffic in the residential areas is reduced to a minimum.
Figure 5-10: VCratio for the car peak, in Ora�ul Simplu; the ratio is given in percentages. Left: the basic variant. the darker regions have a higher congestion, with LOS in category E and F. Right:the bypass variant. The LOS for are roads now fall in the “free flow” or stable flow1 category (A or B).
A Simple Example of a Simulation of Traffic in Bra�ov The example of Ora�ul Simplu above showed the basic concepts needed for traffic modelling: the zones, the road network, the attraction and production in the various zones, and the destination of the trips (trip ends). This is however a very simple example. The simulation of a larger city like Bra�ov is of course infinitely more complicated. It is for example difficult to determine the production and attraction without an extensive amount of socio-economic data, and even when those are known it will be almost impossible to precisely determine the trip ends, i.e. the destination of all the trips.
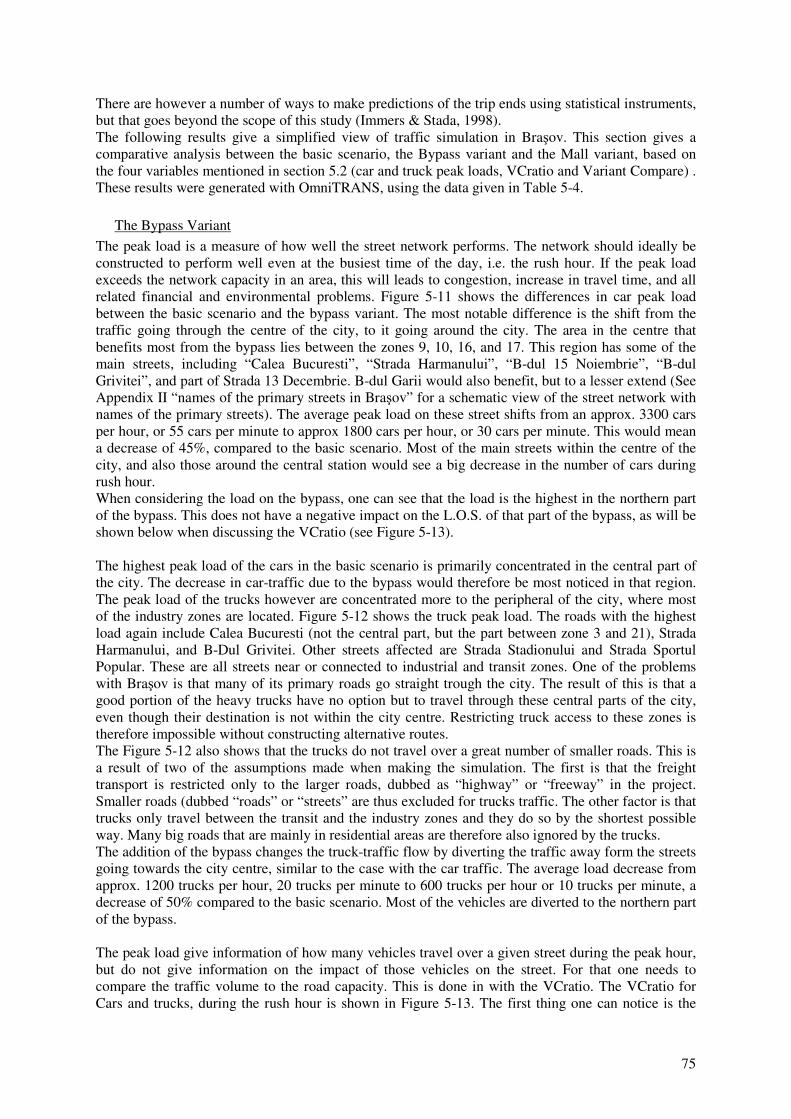
75
There are however a number of ways to make predictions of the trip ends using statistical instruments, but that goes beyond the scope of this study (Immers & Stada, 1998). The following results give a simplified view of traffic simulation in Bra�ov. This section gives a comparative analysis between the basic scenario, the Bypass variant and the Mall variant, based on the four variables mentioned in section 5.2 (car and truck peak loads, VCratio and Variant Compare) . These results were generated with OmniTRANS, using the data given in Table 5-4.
The Bypass Variant The peak load is a measure of how well the street network performs. The network should ideally be constructed to perform well even at the busiest time of the day, i.e. the rush hour. If the peak load exceeds the network capacity in an area, this will leads to congestion, increase in travel time, and all related financial and environmental problems. Figure 5-11 shows the differences in car peak load between the basic scenario and the bypass variant. The most notable difference is the shift from the traffic going through the centre of the city, to it going around the city. The area in the centre that benefits most from the bypass lies between the zones 9, 10, 16, and 17. This region has some of the main streets, including “Calea Bucuresti”, “Strada Harmanului”, “B-dul 15 Noiembrie”, “B-dul Grivitei”, and part of Strada 13 Decembrie. B-dul Garii would also benefit, but to a lesser extend (See Appendix II “names of the primary streets in Bra�ov” for a schematic view of the street network with names of the primary streets). The average peak load on these street shifts from an approx. 3300 cars per hour, or 55 cars per minute to approx 1800 cars per hour, or 30 cars per minute. This would mean a decrease of 45%, compared to the basic scenario. Most of the main streets within the centre of the city, and also those around the central station would see a big decrease in the number of cars during rush hour. When considering the load on the bypass, one can see that the load is the highest in the northern part of the bypass. This does not have a negative impact on the L.O.S. of that part of the bypass, as will be shown below when discussing the VCratio (see Figure 5-13). The highest peak load of the cars in the basic scenario is primarily concentrated in the central part of the city. The decrease in car-traffic due to the bypass would therefore be most noticed in that region. The peak load of the trucks however are concentrated more to the peripheral of the city, where most of the industry zones are located. Figure 5-12 shows the truck peak load. The roads with the highest load again include Calea Bucuresti (not the central part, but the part between zone 3 and 21), Strada Harmanului, and B-Dul Grivitei. Other streets affected are Strada Stadionului and Strada Sportul Popular. These are all streets near or connected to industrial and transit zones. One of the problems with Bra�ov is that many of its primary roads go straight trough the city. The result of this is that a good portion of the heavy trucks have no option but to travel through these central parts of the city, even though their destination is not within the city centre. Restricting truck access to these zones is therefore impossible without constructing alternative routes. The Figure 5-12 also shows that the trucks do not travel over a great number of smaller roads. This is a result of two of the assumptions made when making the simulation. The first is that the freight transport is restricted only to the larger roads, dubbed as “highway” or “freeway” in the project. Smaller roads (dubbed “roads” or “streets” are thus excluded for trucks traffic. The other factor is that trucks only travel between the transit and the industry zones and they do so by the shortest possible way. Many big roads that are mainly in residential areas are therefore also ignored by the trucks. The addition of the bypass changes the truck-traffic flow by diverting the traffic away form the streets going towards the city centre, similar to the case with the car traffic. The average load decrease from approx. 1200 trucks per hour, 20 trucks per minute to 600 trucks per hour or 10 trucks per minute, a decrease of 50% compared to the basic scenario. Most of the vehicles are diverted to the northern part of the bypass. The peak load give information of how many vehicles travel over a given street during the peak hour, but do not give information on the impact of those vehicles on the street. For that one needs to compare the traffic volume to the road capacity. This is done in with the VCratio. The VCratio for Cars and trucks, during the rush hour is shown in Figure 5-13. The first thing one can notice is the
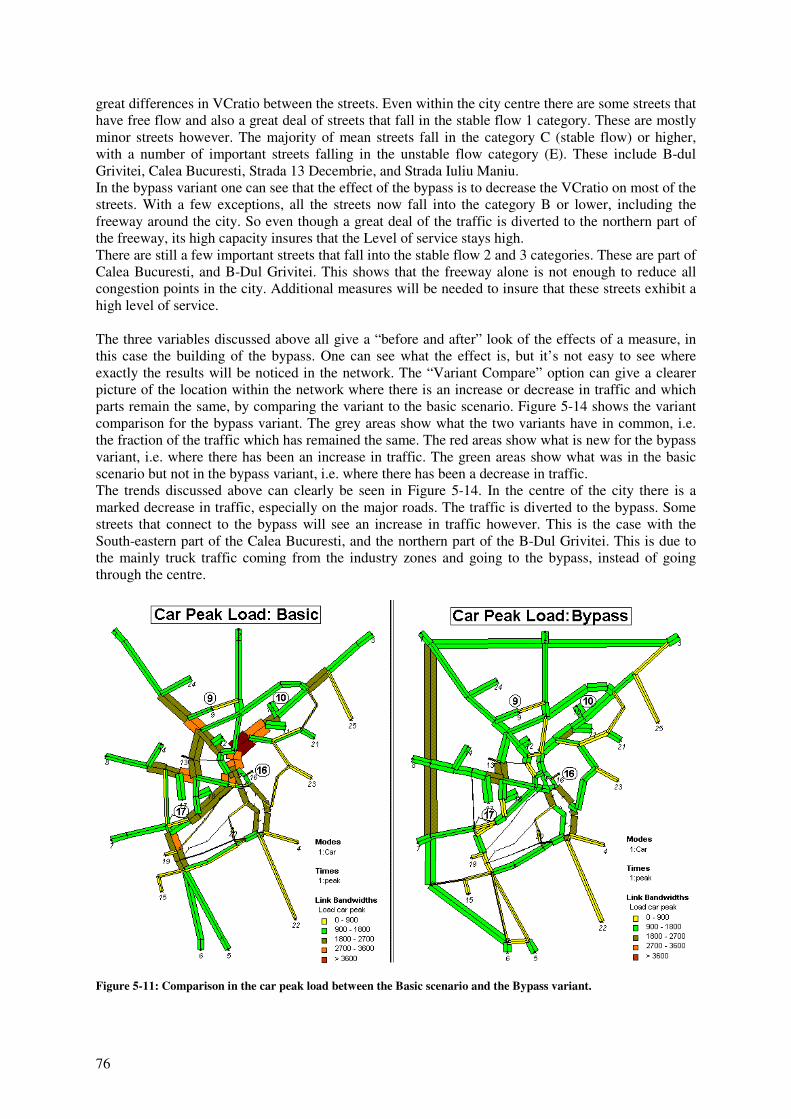
76
great differences in VCratio between the streets. Even within the city centre there are some streets that have free flow and also a great deal of streets that fall in the stable flow 1 category. These are mostly minor streets however. The majority of mean streets fall in the category C (stable flow) or higher, with a number of important streets falling in the unstable flow category (E). These include B-dul Grivitei, Calea Bucuresti, Strada 13 Decembrie, and Strada Iuliu Maniu. In the bypass variant one can see that the effect of the bypass is to decrease the VCratio on most of the streets. With a few exceptions, all the streets now fall into the category B or lower, including the freeway around the city. So even though a great deal of the traffic is diverted to the northern part of the freeway, its high capacity insures that the Level of service stays high. There are still a few important streets that fall into the stable flow 2 and 3 categories. These are part of Calea Bucuresti, and B-Dul Grivitei. This shows that the freeway alone is not enough to reduce all congestion points in the city. Additional measures will be needed to insure that these streets exhibit a high level of service. The three variables discussed above all give a “before and after” look of the effects of a measure, in this case the building of the bypass. One can see what the effect is, but it’s not easy to see where exactly the results will be noticed in the network. The “Variant Compare” option can give a clearer picture of the location within the network where there is an increase or decrease in traffic and which parts remain the same, by comparing the variant to the basic scenario. Figure 5-14 shows the variant comparison for the bypass variant. The grey areas show what the two variants have in common, i.e. the fraction of the traffic which has remained the same. The red areas show what is new for the bypass variant, i.e. where there has been an increase in traffic. The green areas show what was in the basic scenario but not in the bypass variant, i.e. where there has been a decrease in traffic. The trends discussed above can clearly be seen in Figure 5-14. In the centre of the city there is a marked decrease in traffic, especially on the major roads. The traffic is diverted to the bypass. Some streets that connect to the bypass will see an increase in traffic however. This is the case with the South-eastern part of the Calea Bucuresti, and the northern part of the B-Dul Grivitei. This is due to the mainly truck traffic coming from the industry zones and going to the bypass, instead of going through the centre.
Figure 5-11: Comparison in the car peak load between the Basic scenario and the Bypass variant.
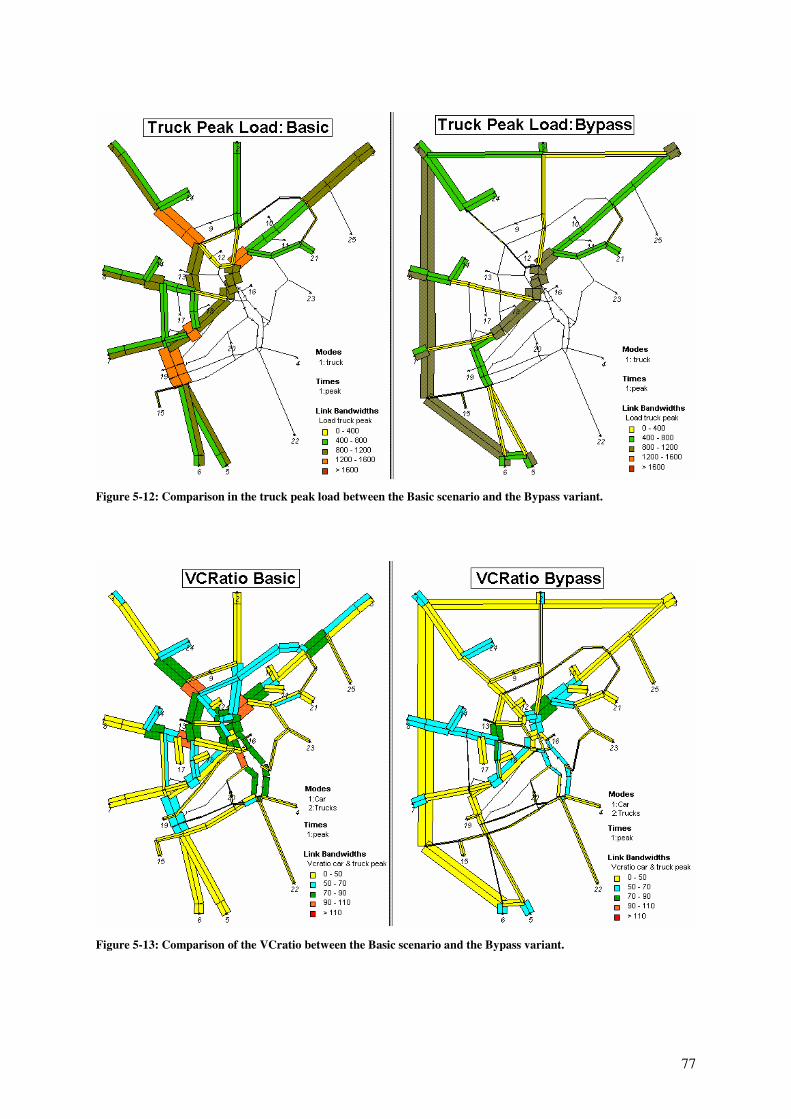
77
Figure 5-12: Comparison in the truck peak load between the Basic scenario and the Bypass variant.
Figure 5-13: Comparison of the VCratio between the Basic scenario and the Bypass variant.
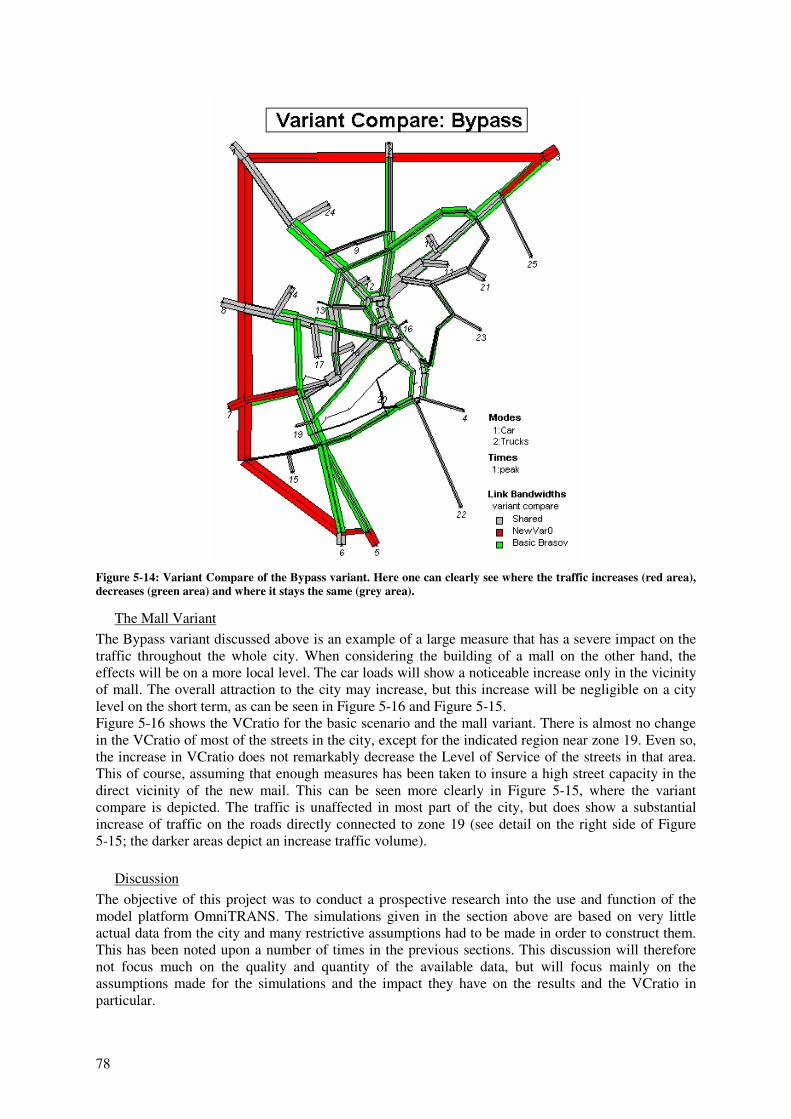
78
Figure 5-14: Variant Compare of the Bypass variant. Here one can clearly see where the traffic increases (red area), decreases (green area) and where it stays the same (grey area).
The Mall Variant The Bypass variant discussed above is an example of a large measure that has a severe impact on the traffic throughout the whole city. When considering the building of a mall on the other hand, the effects will be on a more local level. The car loads will show a noticeable increase only in the vicinity of mall. The overall attraction to the city may increase, but this increase will be negligible on a city level on the short term, as can be seen in Figure 5-16 and Figure 5-15. Figure 5-16 shows the VCratio for the basic scenario and the mall variant. There is almost no change in the VCratio of most of the streets in the city, except for the indicated region near zone 19. Even so, the increase in VCratio does not remarkably decrease the Level of Service of the streets in that area. This of course, assuming that enough measures has been taken to insure a high street capacity in the direct vicinity of the new mail. This can be seen more clearly in Figure 5-15, where the variant compare is depicted. The traffic is unaffected in most part of the city, but does show a substantial increase of traffic on the roads directly connected to zone 19 (see detail on the right side of Figure 5-15; the darker areas depict an increase traffic volume).
Discussion The objective of this project was to conduct a prospective research into the use and function of the model platform OmniTRANS. The simulations given in the section above are based on very little actual data from the city and many restrictive assumptions had to be made in order to construct them. This has been noted upon a number of times in the previous sections. This discussion will therefore not focus much on the quality and quantity of the available data, but will focus mainly on the assumptions made for the simulations and the impact they have on the results and the VCratio in particular.
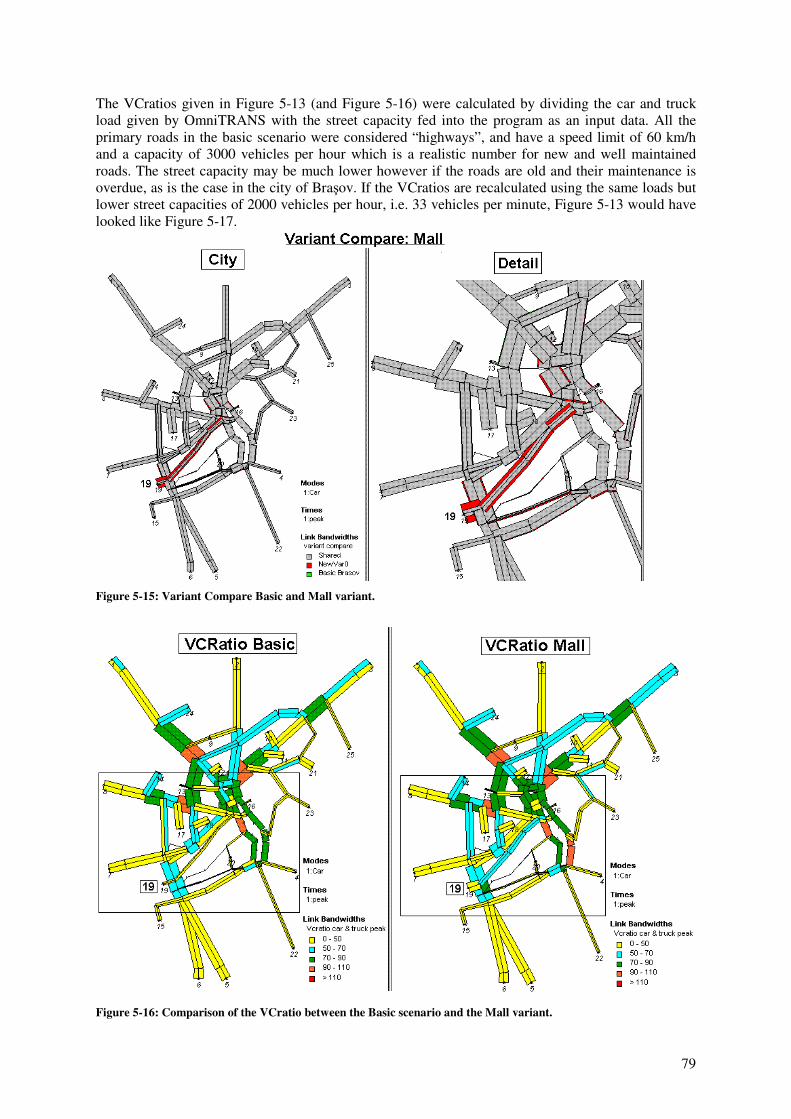
79
The VCratios given in Figure 5-13 (and Figure 5-16) were calculated by dividing the car and truck load given by OmniTRANS with the street capacity fed into the program as an input data. All the primary roads in the basic scenario were considered “highways”, and have a speed limit of 60 km/h and a capacity of 3000 vehicles per hour which is a realistic number for new and well maintained roads. The street capacity may be much lower however if the roads are old and their maintenance is overdue, as is the case in the city of Bra�ov. If the VCratios are recalculated using the same loads but lower street capacities of 2000 vehicles per hour, i.e. 33 vehicles per minute, Figure 5-13 would have looked like Figure 5-17.
Figure 5-15: Variant Compare Basic and Mall variant.
Figure 5-16: Comparison of the VCratio between the Basic scenario and the Mall variant.
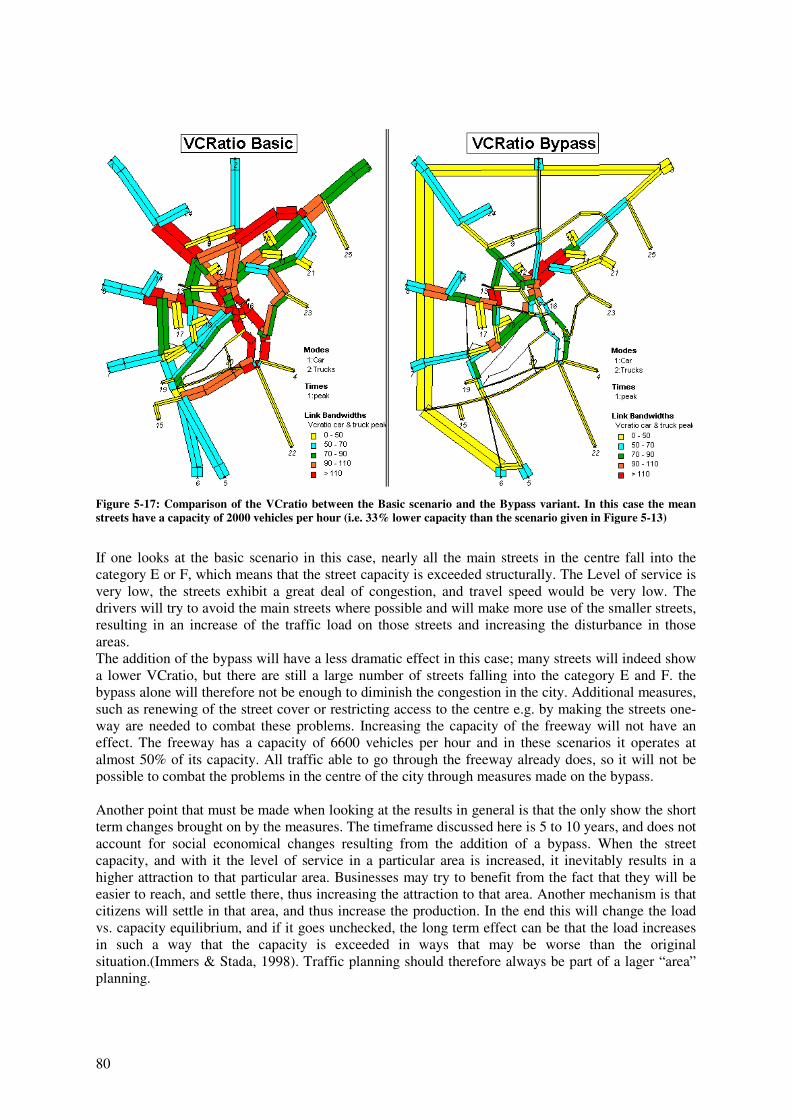
80
Figure 5-17: Comparison of the VCratio between the Basic scenario and the Bypass variant. In this case the mean streets have a capacity of 2000 vehicles per hour (i.e. 33% lower capacity than the scenario given in Figure 5-13)
If one looks at the basic scenario in this case, nearly all the main streets in the centre fall into the category E or F, which means that the street capacity is exceeded structurally. The Level of service is very low, the streets exhibit a great deal of congestion, and travel speed would be very low. The drivers will try to avoid the main streets where possible and will make more use of the smaller streets, resulting in an increase of the traffic load on those streets and increasing the disturbance in those areas. The addition of the bypass will have a less dramatic effect in this case; many streets will indeed show a lower VCratio, but there are still a large number of streets falling into the category E and F. the bypass alone will therefore not be enough to diminish the congestion in the city. Additional measures, such as renewing of the street cover or restricting access to the centre e.g. by making the streets one-way are needed to combat these problems. Increasing the capacity of the freeway will not have an effect. The freeway has a capacity of 6600 vehicles per hour and in these scenarios it operates at almost 50% of its capacity. All traffic able to go through the freeway already does, so it will not be possible to combat the problems in the centre of the city through measures made on the bypass. Another point that must be made when looking at the results in general is that the only show the short term changes brought on by the measures. The timeframe discussed here is 5 to 10 years, and does not account for social economical changes resulting from the addition of a bypass. When the street capacity, and with it the level of service in a particular area is increased, it inevitably results in a higher attraction to that particular area. Businesses may try to benefit from the fact that they will be easier to reach, and settle there, thus increasing the attraction to that area. Another mechanism is that citizens will settle in that area, and thus increase the production. In the end this will change the load vs. capacity equilibrium, and if it goes unchecked, the long term effect can be that the load increases in such a way that the capacity is exceeded in ways that may be worse than the original situation.(Immers & Stada, 1998). Traffic planning should therefore always be part of a lager “area” planning.
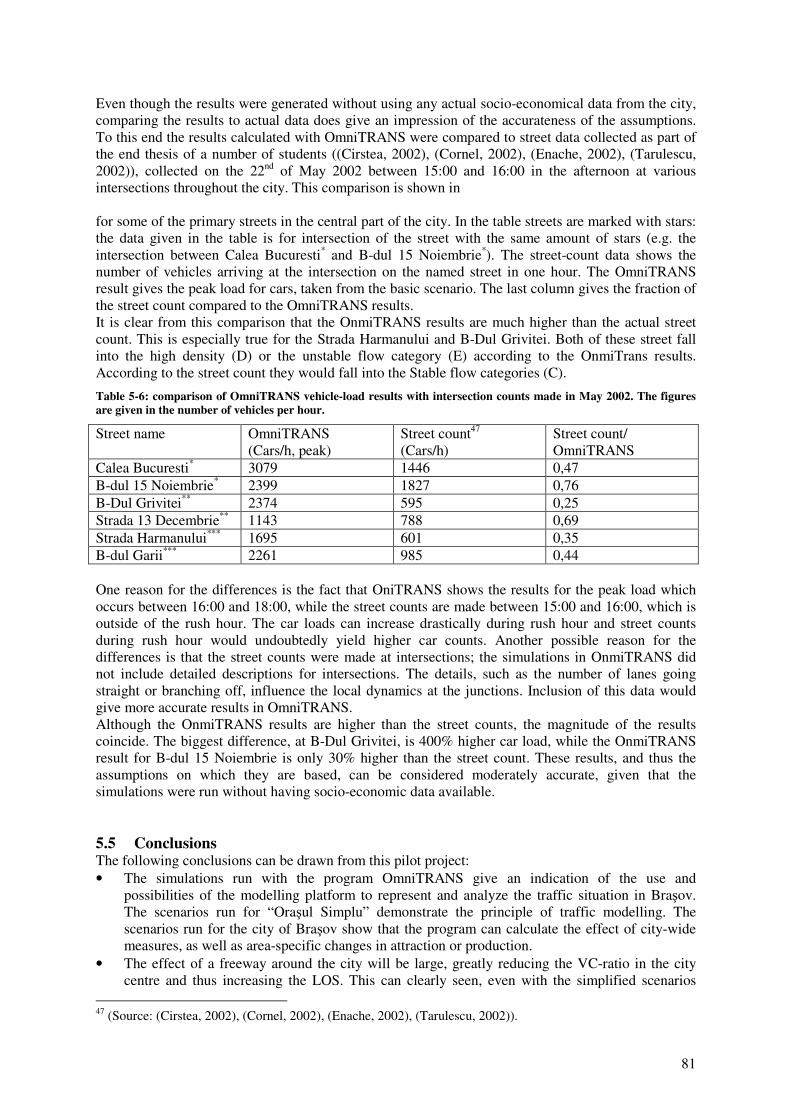
81
Even though the results were generated without using any actual socio-economical data from the city, comparing the results to actual data does give an impression of the accurateness of the assumptions. To this end the results calculated with OmniTRANS were compared to street data collected as part of the end thesis of a number of students ((Cirstea, 2002), (Cornel, 2002), (Enache, 2002), (Tarulescu, 2002)), collected on the 22nd of May 2002 between 15:00 and 16:00 in the afternoon at various intersections throughout the city. This comparison is shown in for some of the primary streets in the central part of the city. In the table streets are marked with stars: the data given in the table is for intersection of the street with the same amount of stars (e.g. the intersection between Calea Bucuresti* and B-dul 15 Noiembrie*). The street-count data shows the number of vehicles arriving at the intersection on the named street in one hour. The OmniTRANS result gives the peak load for cars, taken from the basic scenario. The last column gives the fraction of the street count compared to the OmniTRANS results. It is clear from this comparison that the OnmiTRANS results are much higher than the actual street count. This is especially true for the Strada Harmanului and B-Dul Grivitei. Both of these street fall into the high density (D) or the unstable flow category (E) according to the OnmiTrans results. According to the street count they would fall into the Stable flow categories (C).
Table 5-6: comparison of OmniTRANS vehicle-load results with intersection counts made in May 2002. The figures are given in the number of vehicles per hour.
Street name OmniTRANS (Cars/h, peak)
Street count47 (Cars/h)
Street count/ OmniTRANS
Calea Bucuresti* 3079 1446 0,47 B-dul 15 Noiembrie* 2399 1827 0,76 B-Dul Grivitei** 2374 595 0,25 Strada 13 Decembrie** 1143 788 0,69 Strada Harmanului*** 1695 601 0,35 B-dul Garii*** 2261 985 0,44 One reason for the differences is the fact that OniTRANS shows the results for the peak load which occurs between 16:00 and 18:00, while the street counts are made between 15:00 and 16:00, which is outside of the rush hour. The car loads can increase drastically during rush hour and street counts during rush hour would undoubtedly yield higher car counts. Another possible reason for the differences is that the street counts were made at intersections; the simulations in OnmiTRANS did not include detailed descriptions for intersections. The details, such as the number of lanes going straight or branching off, influence the local dynamics at the junctions. Inclusion of this data would give more accurate results in OmniTRANS. Although the OnmiTRANS results are higher than the street counts, the magnitude of the results coincide. The biggest difference, at B-Dul Grivitei, is 400% higher car load, while the OnmiTRANS result for B-dul 15 Noiembrie is only 30% higher than the street count. These results, and thus the assumptions on which they are based, can be considered moderately accurate, given that the simulations were run without having socio-economic data available. 5.5 Conclusions The following conclusions can be drawn from this pilot project: • The simulations run with the program OmniTRANS give an indication of the use and
possibilities of the modelling platform to represent and analyze the traffic situation in Bra�ov. The scenarios run for “Ora�ul Simplu” demonstrate the principle of traffic modelling. The scenarios run for the city of Bra�ov show that the program can calculate the effect of city-wide measures, as well as area-specific changes in attraction or production.
• The effect of a freeway around the city will be large, greatly reducing the VC-ratio in the city centre and thus increasing the LOS. This can clearly seen, even with the simplified scenarios
47 (Source: (Cirstea, 2002), (Cornel, 2002), (Enache, 2002), (Tarulescu, 2002)).
82
analyzed with the program. The results do also show however that simply building a freeway would not solve all the traffic problems in the city. Additional measures, such as restricting access to certain roads in the centre, improving the streets, and increasing the quality of cars are also needed.
• The results of the simulations are high compared to actual street counts, although one must take the difference between rush hour and non rush-hour into account. Given the “educated guess” nature of the assumption made for this project, the results can nevertheless be considered rather accurate. A better insight into the accurateness of the result will be achieved if they are compared to traffic counts done during the rush hour in the city.
• The program OmniTRANS is a tool which can help policymakers make informed decisions related to traffic management. The model cannot provide solutions on its own, and can only show the effect certain measures will have on the traffic flows within an area. It is however a powerful aid for policymakers to achieve a sound and insightful traffic planning and management.
• OmniTRANS is a complicated program, which requires a great deal of theoretical knowledge on traffic modelling, and practical knowledge on the use and function of the program to be effectively employed. It demands a high level of expertise from the user. This should be taken in to account when deciding to invest in the purchase of this program (see Section 7.3: Recommendations).
• Traffic modelling based on the “classic transport model” (as is the case with OmniTrans) requires a great amount of social-economical data as input. This data was not readily available for Bra�ov during this project.
• The program OmniTRANS offers great possibilities for traffic modelling, but also requires a great deal of expertise and data to be used correctly. These factors should be taken in to account when deciding to invest in the purchase of this program (see Section 7.3: Recommendations).
• Actual counts of cars can help to calibrate the model.
83
Chapter 6: Survey on Environmental Awareness and Recycling 6.1 Problem Definition, Method Used and Aims
Problem Definition Environmental protection has become a major issue for policy makers around the world. A critical factor in most projects concerning the environment is the involvement of the public. One of the problems policymakers face when trying to design and implement large scale projects in which the publics involvement is essential, is that it is often difficult to predict the level of cooperation by the public beforehand. Many personal, social or economic issues may contribute positively or negatively to the level of cooperation. It is also important for these policymakers to realize that the way the project is introduced and information is given, can also play a decisive role in the degree of cooperation. Many western countries therefore invest continuously in information campaigns to educate people on environmental issues and their role in addressing these problems. Even though Environment is considered important in Romanian, involving the public through information campaigns is still not every-day practice. Now that projects on environment are becoming more commonplace, more effort is made to achieve higher involvement of the public. In Bra�ov, a pilot project on household garbage recycling has been designed in cooperation with the local waste company (Comprest Inc.). In order to maximize the results of the pilot, ABMEE is also conducting an information campaign to support the project. They also want to monitor the effectiveness of the campaign, and gain insight on which factors, views and attitudes contribute to increase or decrease the cooperation. One of the most common and effective ways to gauge the views and attitudes of the people is through the use of surveys. Questionnaires can measure the available knowledge, the attitudes on subject, the willingness to participate, and the conditions under which one is more likely to cooperate. They can be powerful tools when used correctly, allowing for effective collecting of data that would otherwise be very difficult to get. For the recycling pilot in Bra�ov, ABMEE planned to hold surveys at the start, during and after the campaign. By comparing the “before and after” results, these surveys should give information on the effectiveness of the information transfer. A survey designed during the ToolSust program (Methi et. al., 2001) was used as a basis for the ABMEE questionnaire.
Aims of this Pilot Project: The aim of this project was to design and test a questionnaire which could be used by ABMEE to: 1. To test the involvement of the public in the recycling project 2. To gain some insight on the relations between this involvement on the one hand, and social-
economic factors and environmental awareness [of the public] on the other hand. The resulting questionnaire would be readably applicable in the survey held in the neighbourhood where the recycling project would be held. By involving Romanian students in the design, some secondary aims were also met: • The adaptation of the ToolSust questionnaire to measure topics specific to Romania and Bra�ov. • Making a comparison of the differences in the process of designing questionnaires between
Eastern and Western Europe
Method Involved48 The basic structure of the questionnaire and formulation of the questions were based on the “ToolSust” project: The involvement of stakeholders to develop and implement tools for sustainable households in the city of tomorrow.
48 Source: (Methi et. al., 2001).
84
The ToolSust Program focused on the involvement of stakeholders in the development and implementation of tools to design a sustainable city. The point of departure of ToolSust was the description of the state of art and the situation for households in five selected European cities. The program used a multidisciplinary approach, including both natural and social sciences. It analyzed the potential for changes, in both short-term and long-term perspectives. The ToolSust program had three main objectives, reflected in five research steps called Work Packages (WP). These aims were: 1) To describe the present situation for households in selected European cities, to discuss which role
households and consumers play in the strategies of sustainable European cities, and to involve stakeholders in this process.
2) To analyze the possibilities and [to design] tools for significant short term changes, linked to three elements: a) The relevance of environmental and consumer information b) The consequences for quality of life (i.e. the effects of these changes on the daily life) c) The importance of the participation of the stakeholders in the decision-making process. The
stakeholders would also take part in the implementation of these tools. 3) To involve relevant stakeholders in the discussion of the potential and need for long term changes
in household behaviour within the framework of factor four and related to the process of European Sustainable Cities.
The selected cities were Fredrikstad in Norway, Groningen in The Netherlands, Padova in Italy, Guildford in United Kingdom and Stockholm/Södermalm in Sweden. These five cities had all to some extent committed themselves to a sustainable development: Some measures had already been taken at the start of the project and others had been planned. As was mentioned above, the ToolSust Questionnaire designed in the first Work Package was used as a basis for the questionnaire in this pilot project. The reason for this is that the ToolSust questionnaire was made by professionals with many years of experience in making questionnaires, and who have put great effort into avoiding the pitfalls associated with the design of questionnaires. By drawing from their experience and expertise, one would maximize the effectiveness of the survey in Bra�ov. This pilot project focused only on the design and testing of the questionnaire on environmental awareness and recycling in Bra�ov. The actual use of the questionnaire and analysis of the results was left to ABMEE. 6.2 Theoretical and Methodological Background A "survey" is a method of gathering information from a sample of individuals. This "sample" is usually just a fraction of the population being studied. They have a wide variety of purposes, and can be conducted in many ways. The most used method to conduct a survey is through a questionnaire: a list of questions pertaining to the topic to be analyzed. The respondents fill in the questionnaires, which can be done over the telephone, by mail, or in an interview. The answers are afterwards processed and the results are analyzed. (Ferber et. al., 1997b) All good surveys have certain characteristics in common (Ferber et. al., 1997b): • Unlike a census, where all members of the population are studied, surveys gather information
from only a portion, called a “sample”, of a population of interest. The size of the sample depends on the purpose of the study.
• The sample is not selected haphazardly or only from persons who volunteer to participate. It is scientifically chosen so that each person in the population will have a measurable chance of selection, and so that the sample will have the same composition as the population. This way, the results can be reliably projected from the sample to the larger population.
• The Information is collected by means of standardized procedures so that every individual is asked the same questions in more or less the same way. The survey's intent is to obtain a composite profile of the population.
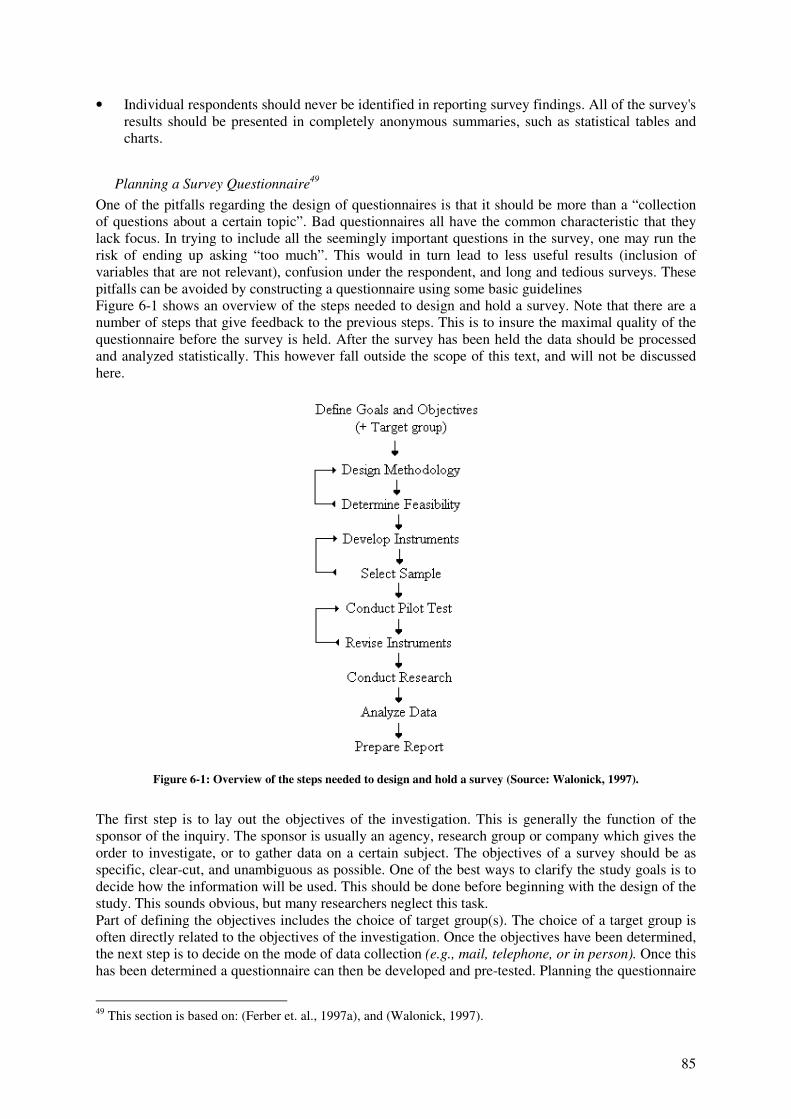
85
• Individual respondents should never be identified in reporting survey findings. All of the survey's results should be presented in completely anonymous summaries, such as statistical tables and charts.
Planning a Survey Questionnaire49 One of the pitfalls regarding the design of questionnaires is that it should be more than a “collection of questions about a certain topic”. Bad questionnaires all have the common characteristic that they lack focus. In trying to include all the seemingly important questions in the survey, one may run the risk of ending up asking “too much”. This would in turn lead to less useful results (inclusion of variables that are not relevant), confusion under the respondent, and long and tedious surveys. These pitfalls can be avoided by constructing a questionnaire using some basic guidelines Figure 6-1 shows an overview of the steps needed to design and hold a survey. Note that there are a number of steps that give feedback to the previous steps. This is to insure the maximal quality of the questionnaire before the survey is held. After the survey has been held the data should be processed and analyzed statistically. This however fall outside the scope of this text, and will not be discussed here.
Figure 6-1: Overview of the steps needed to design and hold a survey (Source: Walonick, 1997).
The first step is to lay out the objectives of the investigation. This is generally the function of the sponsor of the inquiry. The sponsor is usually an agency, research group or company which gives the order to investigate, or to gather data on a certain subject. The objectives of a survey should be as specific, clear-cut, and unambiguous as possible. One of the best ways to clarify the study goals is to decide how the information will be used. This should be done before beginning with the design of the study. This sounds obvious, but many researchers neglect this task. Part of defining the objectives includes the choice of target group(s). The choice of a target group is often directly related to the objectives of the investigation. Once the objectives have been determined, the next step is to decide on the mode of data collection (e.g., mail, telephone, or in person). Once this has been determined a questionnaire can then be developed and pre-tested. Planning the questionnaire
49 This section is based on: (Ferber et. al., 1997a), and (Walonick, 1997).
86
is one of the most critical stages in the survey development process. Most problems with questionnaire analysis can be traced back to the design phase of the project. Questionnaire construction has elements that often appear to be just plain common sense, but, when they are implemented, may involve some subtlety. It is common sense to require that the concepts are clearly defined and the questions unambiguously phrased; otherwise, the resulting data are apt to be misleading. Designing a suitable questionnaire entails more than well-defined concepts and distinct phrasing of questions. Attention must also be given to its length for example. Long questionnaires are apt to induce respondent fatigue and errors arising from inattention, refusals, and incomplete answers. They may also contribute to higher non-response rates in subsequent surveys involving the same respondents. There are other factors to take into account when planning a questionnaire. These include such diverse considerations as the order in which the questions are asked, question’s appearance, or even such things as the questionnaire’s physical size and format. One important way to assure a successful survey is to include other experts and relevant decision-makers in the questionnaire design process. Their suggestions will improve the questionnaire and they will subsequently have more confidence in the results. The questionnaire should be tested on representatives of the target audience before the survey is held. This way, problems with the questionnaire can be quickly identified. If possible, the designers should be present while the test respondents are completing the questionnaire and allow for them to ask for clarification of any item. The questions they ask are indicative of problems in the questionnaire Another often overlooked part of questionnaire design is the so called “Analysis guideline”, i.e. a plan for doing the statistical analysis after all the data has been collected. It should be known upfront how every question will be analyzed and one should be prepared to handle missing data. If it is not possible to specify how to analyze a question or use the information, that question should not be used it in the survey. Another great challenge for survey designers is to ensure a sufficiently high number of responses. The higher the response, the more statistically relevant the results become. If a written questionnaire is used, attention to the following points could increase the quantity and quality of responses: • Making a good first impression. The object is to make the questionnaire stand out from all the
others the respondent receives, and that the respondents take it seriously. This can be done in a number of ways: - Unique envelopes. The best envelopes are coloured, hand-addressed and use a postage
stamp. Envelopes with bulk-mail permits or gummed labels are usually perceived as unimportant
- Well-written cover letter. The importance of this should not be underestimated. It provides a good chance to persuade the respondent to complete the survey.
- A title that is short and meaningful to the respondent. Questionnaires with a title are generally perceived to be more credible than those without.
- Professional production methods for the questionnaire. Using either desktop publishing or typesetting and key lining also increases the credibility.
• Clear, concise and easy to understand instructions on how to complete the questionnaire. Printing the return address on the questionnaire itself is also prudent, since they often get separated from the reply envelopes.
• The questionnaire should start with a few non-threatening and interesting items. People generally look at the first few questions, and will usually not complete the questionnaire if these are too threatening or "boring".
• The use simple and direct language. The questions must be clearly understood by the respondents, so the wording of a question should be simple, brief and to the point. Uncommon words or long sentences should be avoided.
• Emphasis should be put on crucial words in each item by using bold, italics or underlining. This helps to eliminate misunderstandings.
87
• The questionnaire should include adequate space for respondents to make comments. • Providing incentives as a motivation for a properly completed questionnaire is usually effective.
Even small token gifts can greatly improve the response rate. If the information that is being collecting is of interest to the respondent, offering a free summary report is also an excellent motivator.
• The lay-out should be creative, e.g. by using different coloured inks and paper. Again, the object is to make the questionnaire stand out from all the others the respondent receives.
• The participation should be made convenient. The easier it is for the respondent to complete the questionnaire the better. This lowers the “response barrier”. A self-addressed postage-paid envelope should always be included.
Sampling: A critical element in any survey is to “cover” all the members of the population being studied so that they have a chance to be sampled. To achieve this, a list termed a “sampling frame” is usually constructed. In a mail survey for example, a frame could be all of the postal addresses in a certain area. The quality of the sampling frame -whether it is up-to-date and complete- is probably the dominant feature for ensuring adequate coverage of the desired population to be surveyed. The type of sample used depends upon the objectives and scope of the survey. Factors include the nature of potentially available sampling frames, the overall survey budget, the method of data collection, the subject matter, and the kind of respondents needed. Some types of samples are straightforward, requiring little in the way of experience or training e.g. households in a specific area. Others are highly complex and may require many stages of selection e.g. right-handed males with a university degree. Whether simple or complex, the goal of a properly designed sample is that all of the units in the population that is analyzed have a known, positive chance of being selected. The most common type of sampling is the random sampling. Virtually all surveys taken seriously by social scientists and policymakers use some form of random sampling. Methods of random sampling are based on statistical theory and in the theory of probability. Reliable and efficient estimates of needed statistics can be made by surveying a carefully constructed sample of a population. This is provided, of course, that a large proportion of the sample members give the requested information. Larger samples usually give a higher accuracy in the results, but the actual sample size is dependent of the aims of the survey. In the ToolSust survey, a sample size of 500 respondents was set as a minimum. One can assume that this should also be the minimal sample size for the Bra�ov survey. 6.3 Adaptations Made to the Method: Adapting the Questionnaire The questionnaire that was taken as a basis for this project was developed by ToolSust to measure the position of households and consumption in the environmental goals in the cities. It was used in the first step (WP1) in a quantitative survey among consumers. The survey was done by telephone in the 5 cities in February of 2001. In total 2.718 persons were interviewed. The interview contained 36 questions about attitudes and behaviours related to sustainable consumption. The questionnaire included questions on background information on individual and household level. The main themes focused on in the questionnaire were: • Attitudes to environmental problems and important activities related to them. [2 questions] • Behaviour and satisfaction with recycling activities. [3 questions] • Knowledge and use of eco-labels and organic, local, and vegetable foods. [10 questions] • Means of transportation for shopping. [4 questions] • Energy conservation activities [7 questions] • Background information (socio-economic data, household composition, etc.) [10 questions] The ToolSust questions were very specific and addressed environmentally-friendly lifestyles by going into details about topics such as recycling and eco-labelling. Most of these topics were not relevant for
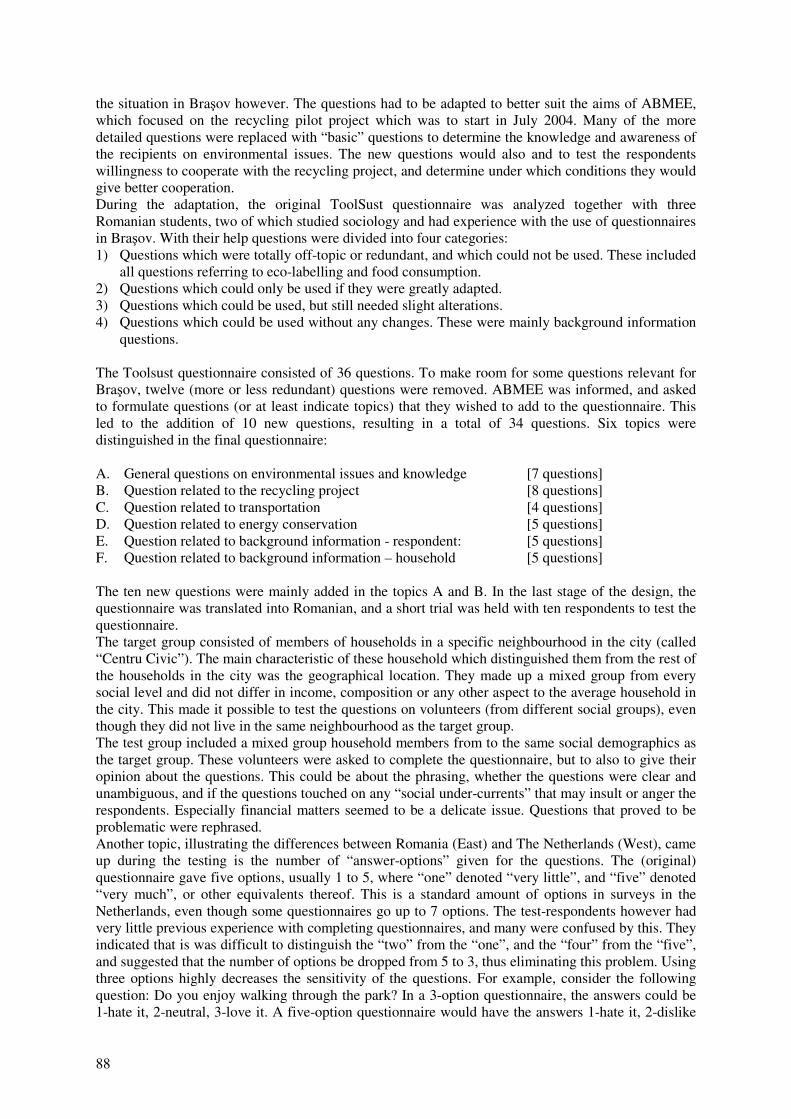
88
the situation in Bra�ov however. The questions had to be adapted to better suit the aims of ABMEE, which focused on the recycling pilot project which was to start in July 2004. Many of the more detailed questions were replaced with “basic” questions to determine the knowledge and awareness of the recipients on environmental issues. The new questions would also and to test the respondents willingness to cooperate with the recycling project, and determine under which conditions they would give better cooperation. During the adaptation, the original ToolSust questionnaire was analyzed together with three Romanian students, two of which studied sociology and had experience with the use of questionnaires in Bra�ov. With their help questions were divided into four categories: 1) Questions which were totally off-topic or redundant, and which could not be used. These included
all questions referring to eco-labelling and food consumption. 2) Questions which could only be used if they were greatly adapted. 3) Questions which could be used, but still needed slight alterations. 4) Questions which could be used without any changes. These were mainly background information
questions. The Toolsust questionnaire consisted of 36 questions. To make room for some questions relevant for Bra�ov, twelve (more or less redundant) questions were removed. ABMEE was informed, and asked to formulate questions (or at least indicate topics) that they wished to add to the questionnaire. This led to the addition of 10 new questions, resulting in a total of 34 questions. Six topics were distinguished in the final questionnaire: A. General questions on environmental issues and knowledge [7 questions] B. Question related to the recycling project [8 questions] C. Question related to transportation [4 questions] D. Question related to energy conservation [5 questions] E. Question related to background information - respondent: [5 questions] F. Question related to background information – household [5 questions] The ten new questions were mainly added in the topics A and B. In the last stage of the design, the questionnaire was translated into Romanian, and a short trial was held with ten respondents to test the questionnaire. The target group consisted of members of households in a specific neighbourhood in the city (called “Centru Civic”). The main characteristic of these household which distinguished them from the rest of the households in the city was the geographical location. They made up a mixed group from every social level and did not differ in income, composition or any other aspect to the average household in the city. This made it possible to test the questions on volunteers (from different social groups), even though they did not live in the same neighbourhood as the target group. The test group included a mixed group household members from to the same social demographics as the target group. These volunteers were asked to complete the questionnaire, but to also to give their opinion about the questions. This could be about the phrasing, whether the questions were clear and unambiguous, and if the questions touched on any “social under-currents” that may insult or anger the respondents. Especially financial matters seemed to be a delicate issue. Questions that proved to be problematic were rephrased. Another topic, illustrating the differences between Romania (East) and The Netherlands (West), came up during the testing is the number of “answer-options” given for the questions. The (original) questionnaire gave five options, usually 1 to 5, where “one” denoted “very little”, and “five” denoted “very much”, or other equivalents thereof. This is a standard amount of options in surveys in the Netherlands, even though some questionnaires go up to 7 options. The test-respondents however had very little previous experience with completing questionnaires, and many were confused by this. They indicated that is was difficult to distinguish the “two” from the “one”, and the “four” from the “five”, and suggested that the number of options be dropped from 5 to 3, thus eliminating this problem. Using three options highly decreases the sensitivity of the questions. For example, consider the following question: Do you enjoy walking through the park? In a 3-option questionnaire, the answers could be 1-hate it, 2-neutral, 3-love it. A five-option questionnaire would have the answers 1-hate it, 2-dislike
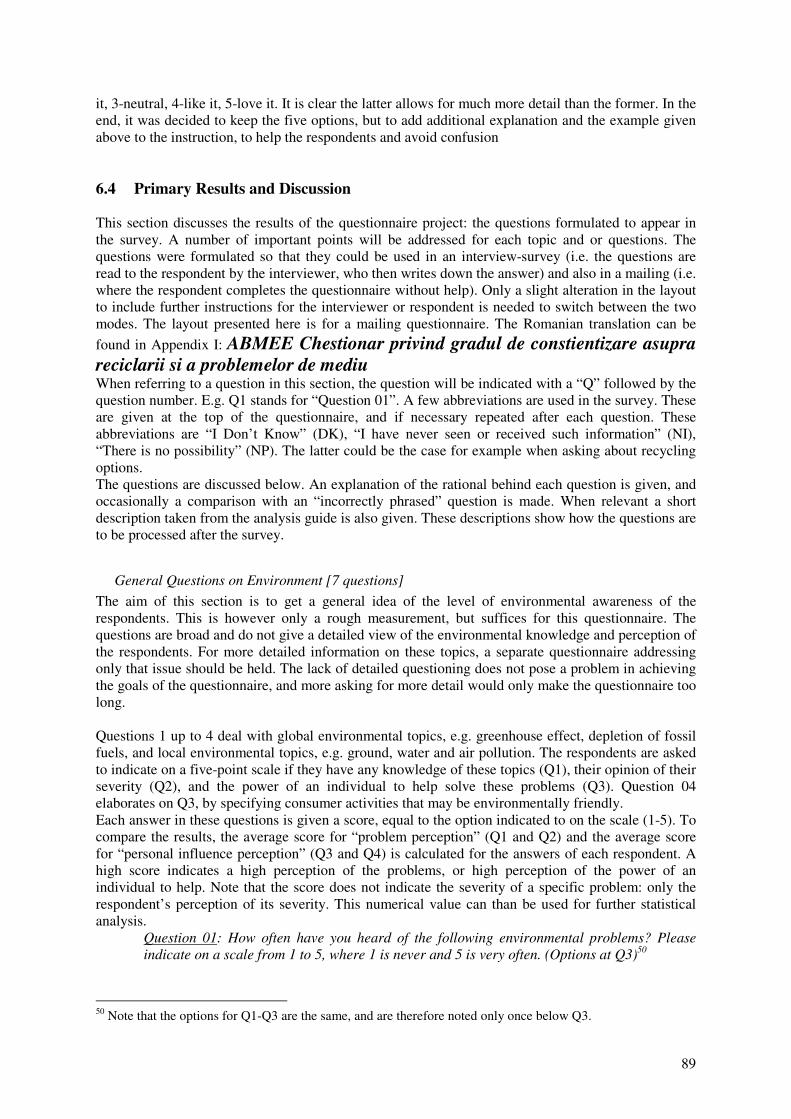
89
it, 3-neutral, 4-like it, 5-love it. It is clear the latter allows for much more detail than the former. In the end, it was decided to keep the five options, but to add additional explanation and the example given above to the instruction, to help the respondents and avoid confusion 6.4 Primary Results and Discussion This section discusses the results of the questionnaire project: the questions formulated to appear in the survey. A number of important points will be addressed for each topic and or questions. The questions were formulated so that they could be used in an interview-survey (i.e. the questions are read to the respondent by the interviewer, who then writes down the answer) and also in a mailing (i.e. where the respondent completes the questionnaire without help). Only a slight alteration in the layout to include further instructions for the interviewer or respondent is needed to switch between the two modes. The layout presented here is for a mailing questionnaire. The Romanian translation can be found in Appendix I: ABMEE Chestionar privind gradul de constientizare asupra reciclarii si a problemelor de mediu When referring to a question in this section, the question will be indicated with a “Q” followed by the question number. E.g. Q1 stands for “Question 01”. A few abbreviations are used in the survey. These are given at the top of the questionnaire, and if necessary repeated after each question. These abbreviations are “I Don’t Know” (DK), “I have never seen or received such information” (NI), “There is no possibility” (NP). The latter could be the case for example when asking about recycling options. The questions are discussed below. An explanation of the rational behind each question is given, and occasionally a comparison with an “incorrectly phrased” question is made. When relevant a short description taken from the analysis guide is also given. These descriptions show how the questions are to be processed after the survey.
General Questions on Environment [7 questions] The aim of this section is to get a general idea of the level of environmental awareness of the respondents. This is however only a rough measurement, but suffices for this questionnaire. The questions are broad and do not give a detailed view of the environmental knowledge and perception of the respondents. For more detailed information on these topics, a separate questionnaire addressing only that issue should be held. The lack of detailed questioning does not pose a problem in achieving the goals of the questionnaire, and more asking for more detail would only make the questionnaire too long. Questions 1 up to 4 deal with global environmental topics, e.g. greenhouse effect, depletion of fossil fuels, and local environmental topics, e.g. ground, water and air pollution. The respondents are asked to indicate on a five-point scale if they have any knowledge of these topics (Q1), their opinion of their severity (Q2), and the power of an individual to help solve these problems (Q3). Question 04 elaborates on Q3, by specifying consumer activities that may be environmentally friendly. Each answer in these questions is given a score, equal to the option indicated to on the scale (1-5). To compare the results, the average score for “problem perception” (Q1 and Q2) and the average score for “personal influence perception” (Q3 and Q4) is calculated for the answers of each respondent. A high score indicates a high perception of the problems, or high perception of the power of an individual to help. Note that the score does not indicate the severity of a specific problem: only the respondent’s perception of its severity. This numerical value can than be used for further statistical analysis.
Question 01: How often have you heard of the following environmental problems? Please indicate on a scale from 1 to 5, where 1 is never and 5 is very often. (Options at Q3)50
50 Note that the options for Q1-Q3 are the same, and are therefore noted only once below Q3.
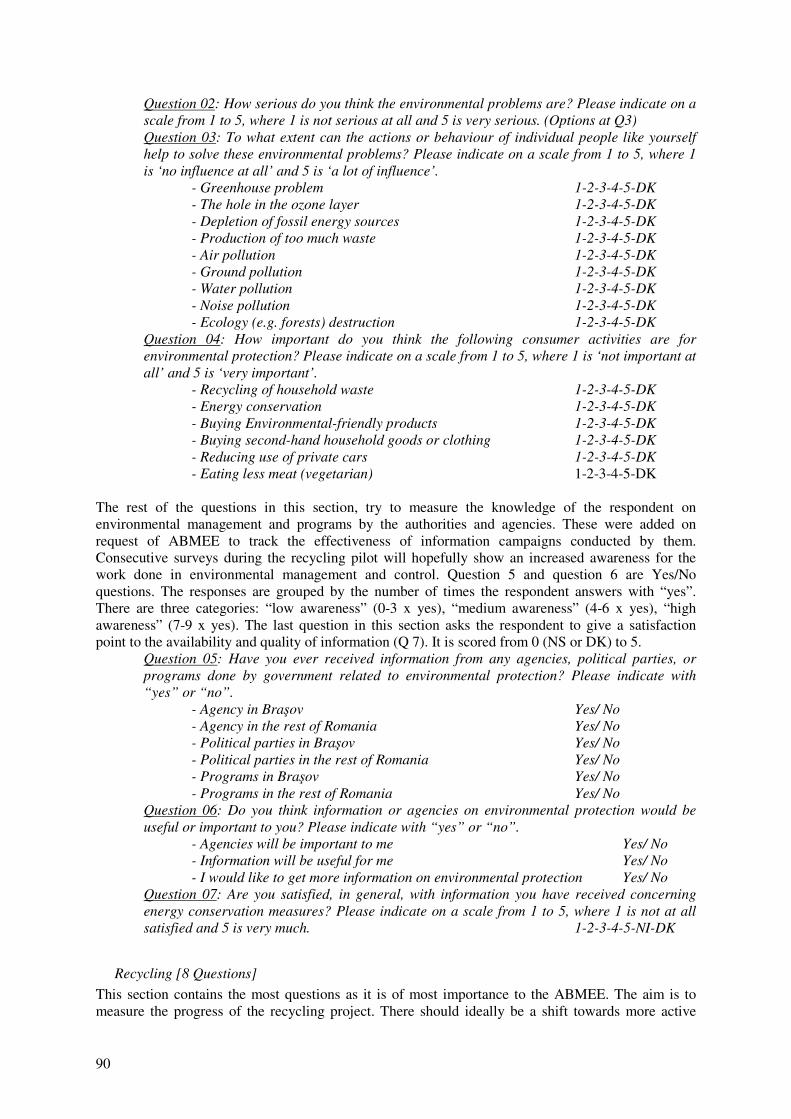
90
Question 02: How serious do you think the environmental problems are? Please indicate on a scale from 1 to 5, where 1 is not serious at all and 5 is very serious. (Options at Q3) Question 03: To what extent can the actions or behaviour of individual people like yourself help to solve these environmental problems? Please indicate on a scale from 1 to 5, where 1 is ‘no influence at all’ and 5 is ‘a lot of influence’.
- Greenhouse problem 1-2-3-4-5-DK - The hole in the ozone layer 1-2-3-4-5-DK - Depletion of fossil energy sources 1-2-3-4-5-DK - Production of too much waste 1-2-3-4-5-DK - Air pollution 1-2-3-4-5-DK - Ground pollution 1-2-3-4-5-DK - Water pollution 1-2-3-4-5-DK - Noise pollution 1-2-3-4-5-DK - Ecology (e.g. forests) destruction 1-2-3-4-5-DK
Question 04: How important do you think the following consumer activities are for environmental protection? Please indicate on a scale from 1 to 5, where 1 is ‘not important at all’ and 5 is ‘very important’.
- Recycling of household waste 1-2-3-4-5-DK - Energy conservation 1-2-3-4-5-DK - Buying Environmental-friendly products 1-2-3-4-5-DK - Buying second-hand household goods or clothing 1-2-3-4-5-DK - Reducing use of private cars 1-2-3-4-5-DK - Eating less meat (vegetarian) 1-2-3-4-5-DK
The rest of the questions in this section, try to measure the knowledge of the respondent on environmental management and programs by the authorities and agencies. These were added on request of ABMEE to track the effectiveness of information campaigns conducted by them. Consecutive surveys during the recycling pilot will hopefully show an increased awareness for the work done in environmental management and control. Question 5 and question 6 are Yes/No questions. The responses are grouped by the number of times the respondent answers with “yes”. There are three categories: “low awareness” (0-3 x yes), “medium awareness” (4-6 x yes), “high awareness” (7-9 x yes). The last question in this section asks the respondent to give a satisfaction point to the availability and quality of information (Q 7). It is scored from 0 (NS or DK) to 5.
Question 05: Have you ever received information from any agencies, political parties, or programs done by government related to environmental protection? Please indicate with “yes” or “no”.
- Agency in Bra�ov Yes/ No - Agency in the rest of Romania Yes/ No - Political parties in Bra�ov Yes/ No - Political parties in the rest of Romania Yes/ No - Programs in Bra�ov Yes/ No - Programs in the rest of Romania Yes/ No
Question 06: Do you think information or agencies on environmental protection would be useful or important to you? Please indicate with “yes” or “no”.
- Agencies will be important to me Yes/ No - Information will be useful for me Yes/ No - I would like to get more information on environmental protection Yes/ No
Question 07: Are you satisfied, in general, with information you have received concerning energy conservation measures? Please indicate on a scale from 1 to 5, where 1 is not at all satisfied and 5 is very much. 1-2-3-4-5-NI-DK
Recycling [8 Questions] This section contains the most questions as it is of most importance to the ABMEE. The aim is to measure the progress of the recycling project. There should ideally be a shift towards more active

91
participation by the respondents, as the recycling project and information campaign progress. The section starts by asking if the respondent know of current (Q8) and future (Q9) recycling options in their neighbourhood.
Question 08: Are there possibilities in your neighbourhood to recycle, at the present? Please indicate with a “yes” or “no”. Yes/ No - DK Question 09: Will there be programs in your neighbourhood that will make it possible to recycle in the future? Please indicate with a “yes” or “no”. Yes/ No – DK
Question 10 is a composite question, which looks at the reasons people recycle or not. The next questions deal with the willingness to help with the project (Q11) and the influencing factors(Q12), the type of garbage separated in the household (Q13), and the satisfaction with the recycling facilities (Q14). All these questions have a scale of zero to five. For each question the average score of the sub-questions is calculated. One should note that these questions (especially Q11) are liable to be influenced by “social biases”. The respondent may answer with what they think should be answered, to appear more actively involved. It is therefore imperative that the respondents be told that there is not “good” or “bad” answer, but that they should be as honest as possible: they will not be judged if they are not actively involved, or they do not want to participate. It is important to know if they don’t. Question 14 addresses this point by asking the reasons they recycle, or why they do not. The last question (Q15) is an open question, where the respondents can give their opinion on how the recycling program can be improved. This was added on request of ABMEE, even though open questions are often avoided due to the difficulties to process the wide variety of answers usually given.
Question 10: Do you recycle? o Yes (please answer question 10a and skip question 10b.) o No (please skip question 10a and answer question 10b.)
Question 10a: If you do recycle, why do you do it? Please indicate the two most important reasons.
o I have been told to do so. o It has become a habit. o It is good for the environment o It is practical o It is fun o I want to be a model for others o I Don’t know o Another reason.
Question 10b: If you do not recycle, why do you do not it? Please indicate the two most important reasons.
o There are no recycling facilities o The recycling facilities near my house do not function properly o It is not necessary o It is too much work o I don’t have the time o I don’t like it o I forget o I Don’t know o Another reason.
Question 11: To what extent does your household sort out the following types of waste for recycling or special treatment? Please indicate on a scale from 1 to 5, where 1 is nothing and 5 is all (Option given with Q12). Question 12: To what extent are you satisfied with the number of the recycling facilities for the following types of waste? Please indicate on a scale from 1 to 5, where 1 is ‘not at all satisfied’ and 5 is very much.
- There is no recycling possibility that I am aware of (NP) - Glass 1-2-3-4-5-NP-DK
92
- Paper. 1-2-3-4-5-NP-DK - Food leftovers /organic waste. 1-2-3-4-5-NP-DK - Clothing. 1-2-3-4-5-NP-DK - Hazardous/toxic waste. 1-2-3-4-5-NP-DK
Question 13: If a recycling program is implemented in your neighbourhood, would you be willing to cooperate in the following ways? Please indicate on a scale from 1 to 5 where 1 is not willing at all and 5 is very willing.
- Separating the household waste within your household 1-2-3-4-5-DK - Helping to organize the program (e.g. information meetings) 1-2-3-4-5-DK - Helping with the spreading of information about the program (e.g. by participating in information rallies, or spreading fliers in the neighbourhood) 1-2-3-4-5-DK
Question 14: Which of the following factors would influence your willingness to cooperate with such a program? Please indicate on a scale from 1 to 5 where 1 is doesn’t influence at all and 5 is influence very much.
- It is good for the environment and city 1-2-3-4-5-DK - There are many facilities (e.g. special bins) to help separate the waste 1-2-3-4-5-DK - The recycling station is close to my house 1-2-3-4-5-DK - There is a financial compensation 1-2-3-4-5-DK
Question 15: If you could organize a recycling program near your house yourself, how do you think the waste should be separated? (Open question; please respond in 2-3 sentences) ………………………………………………………………………………
Transportation [4 Questions] These four questions are about the mode of transportation used to buy groceries and to go to work. This section was first targeted to be removed from the questionnaire, but ABMEE indicated that they are planning to conduct more research on this subject in the future. These questions there for have a prospective nature. Two question deal with the frequency of travel (Q16, Q18). The answers are given a score between one (never) and six (most often); a higher frequency gets a higher score. The mode of transport is addressed in Q17 and Q18. Each answer is assigned a numerical value between one and seven. The two options of question 17 are combined trough the numerical average.
Question 16: How often do you or others in your household buy groceries? o More than five times a week (please go to question 17) o three or four times a week (please go to question 17) o Once or twice a week (please go to question 17) o Once every fortnight or more seldom (please go to question 17) o I have my groceries delivered to my house (please go to question 18) o Never (please go to question 18)
Question 17: Which method of transportation is usually used when buying groceries? In your neighbourhood Outside of your neighbourhood o Car o Motorbike/scooter o Public transport o Walk o Ride a bike/cycle o Other o I don’t buy Groceries in my
neighbourhood
o Car o Motorbike/scooter o Public transport o Walk o Ride a bike/cycle o Other o I don’t buy Groceries outside of my
neighbourhood Question 18: How many times a week do you or others in your household travel to work and back?
o More than seven times a week o Five to seven times a week o Two to four times a week o Once a week
93
o Less then once a week o Never (please skip question 19)
Question 19: Which method of transportation is usually used by you and others in your household to go to work? (See Q17 for options)
Energy Conservation [5 Questions] These questions address energy conservation effort made inside the household of the respondent. The section starts by making an inventory of the age of the house (Q20), because this can give information on the energy consumption in a household. Old houses are more likely to be more energy consuming than newer houses. It was considered to add a question about the house type, since this also determines the energy consumption. This was left out however to keep the number of questions low51.
Question 20: When was your apartment/house built? o Before 1900 o Between 1900 and 1930 o Between 1930 and 1950 o Between 1950 and 1970 o Between 1970 and 1990 o In the 90s o Year 2000 or later
Question 21: Do you think it is necessary to reduce the energy consumption in your household?
o Yes. Please indicate why? (please respond in 1-2 sentences) ……………………………………………………………
o No. Please indicate why not? (please respond in 1-2 sentences) ……………………………………………………………
Question 22 is an interesting question. Romania has recently introduced an energy label for white good (fridges, stoves, freezers, etc), analogues to the label used in Western Europe and the United States ((ARCE, 2004), see Figure 6-2). Most people in Romania are not yet familiar with this label though. It would be interesting to see if this will change in the course the project. ABMEE will not directly give information on this subject however. The last two questions deal with efforts to reduce energy consumption, through investments in energy efficiency measures (Q23) or behaviour (Q24). Question 23 will be given a score based on the number of times a “Yes” is answered. The score of question 24 will be computed into an average value, where a higher average will indicate more energy conscience behaviour.
Question 22 Have you seen the following energy label while buying white goods? (White goods are household appliances, like washing machines, fridge, etc.)
o No (I have not acquired white goods in the last two years)52 o Yes
51 Such a question would also allow for links to be made to the household project using DoMUS, as described in Chapter 4:. Again, the questionnaire length was the reason to not add more questions. 52 In fact, a “no” could also mean I did buy white goods but I did not see such a label; there should be a check for this.
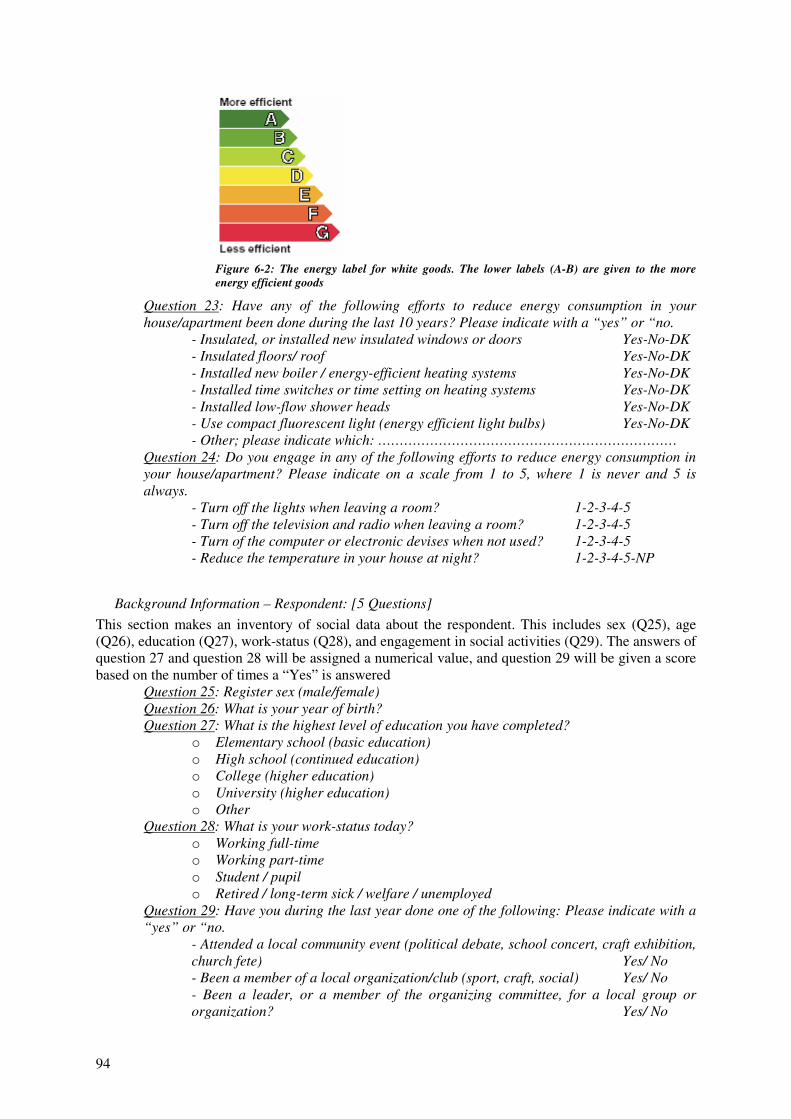
94
Figure 6-2: The energy label for white goods. The lower labels (A-B) are given to the more energy efficient goods
Question 23: Have any of the following efforts to reduce energy consumption in your house/apartment been done during the last 10 years? Please indicate with a “yes” or “no.
- Insulated, or installed new insulated windows or doors Yes-No-DK - Insulated floors/ roof Yes-No-DK - Installed new boiler / energy-efficient heating systems Yes-No-DK - Installed time switches or time setting on heating systems Yes-No-DK - Installed low-flow shower heads Yes-No-DK - Use compact fluorescent light (energy efficient light bulbs) Yes-No-DK - Other; please indicate which: ……………………………………………………………
Question 24: Do you engage in any of the following efforts to reduce energy consumption in your house/apartment? Please indicate on a scale from 1 to 5, where 1 is never and 5 is always.
- Turn off the lights when leaving a room? 1-2-3-4-5 - Turn off the television and radio when leaving a room? 1-2-3-4-5 - Turn of the computer or electronic devises when not used? 1-2-3-4-5 - Reduce the temperature in your house at night? 1-2-3-4-5-NP
Background Information – Respondent: [5 Questions] This section makes an inventory of social data about the respondent. This includes sex (Q25), age (Q26), education (Q27), work-status (Q28), and engagement in social activities (Q29). The answers of question 27 and question 28 will be assigned a numerical value, and question 29 will be given a score based on the number of times a “Yes” is answered
Question 25: Register sex (male/female) Question 26: What is your year of birth? Question 27: What is the highest level of education you have completed?
o Elementary school (basic education) o High school (continued education) o College (higher education) o University (higher education) o Other
Question 28: What is your work-status today? o Working full-time o Working part-time o Student / pupil o Retired / long-term sick / welfare / unemployed
Question 29: Have you during the last year done one of the following: Please indicate with a “yes” or “no.
- Attended a local community event (political debate, school concert, craft exhibition, church fete) Yes/ No - Been a member of a local organization/club (sport, craft, social) Yes/ No - Been a leader, or a member of the organizing committee, for a local group or organization? Yes/ No
95
- Helped out as a volunteer for a local organization or a special event? Yes/ No
Background Information – Household [5 Questions] This section makes an inventory of social data about the household. This includes household size (Q30), composition (Q31), income (Q32), cars (Q33), and if the house is owned or rented (Q34). The answers of question 32 and question 34 will be assigned a numerical value. Question 32 is likely to give the most problems of all the questions in this questionnaire, since it deals with the delicate issue of income. In the Netherlands it is common place for people to give financial information in questionnaires, and people are used to this. In Romania this is still not common practice, and it can be expected that a great number of respondents will be reluctant to answer this question and will eave it blank. This cannot be avoided, but the question is an important one, giving information on social status, and can not be left out. Care should be taken not to needlessly annoy the respondents though: In the case of an interview questionnaire, the person conducting the interview should not press the respondent for an answer if they are reluctant to answer. This will increase the willingness to cooperate with a follow-up survey.
Question 30: How many people, adults and children, live in your household, including yourself? Question 31: How many of the household members are under 14 years of age? Question 32: Please give an estimate of your household’s total income per month after tax and other deductions. (This question is optional; you may skip it if you wish)
o Up to 2.5 million Lei o 2.5 million – 4.5 million Lei o 4.5 million – 6.5 million Lei o 6.5 million – 8.5 million Lei o 8.5 million – 10.5 million Lei o More than 10.5 million Lei o I Don’t know (this is private information)
Question 33 Does your household have a car? o Yes. Please indicate how many: …………………………………………………… o No
Question 34: Do you or your family own or rent your home? o Own a house, outright or on mortgage o Own an apartment, outright or on mortgage o Rent a privately owned house o Rent a privately owned apartment o Rent a Council, Municipal or Corporation house o Rent a Council, Municipal or Corporation apartment o Other (rent a room, live as a lodger, squatter, etc.) o I Don’t know
6.5 Conclusions The following conclusions can be drawn on this pilot project: • The original ToolSust questionnaire has been successfully adapted and translated to Romanian.
The test trial showed that in general the questions are comprehensible, and that the respondents will be able to understand them. The questionnaire is ready to be used.
• The lay-out is thus designed that the questionnaire can be used in a mailing survey. With a few small adaptations, such as adding additional instructions for the interviewer, it can be adapted for an interview survey.
• The measurement of environmental knowledge in the first section of the questionnaire is rudimentary and superficial. A more in-depth measurement is not necessary to achieve the goals of this project. The questions give enough information on environmental knowledge of the respondent to statistically gauge the relation with active involvement in the recycling project.

96
More in-depth measurement on these topics would only result in making the survey needlessly long.
• A number of questions in the questionnaire are prone to be influenced by social biases and what the respondent perceives as a “desirable” answer. This cannot be avoided. Measures to minimize this effect should be taken, e.g. explaining to the respondent that they will not be judge based on their response, and that the correct information is invaluable for the success of the survey.
• Some of the questions, e.g. those related to finances, may touch on delicate subjects, and thus prove problematic. It is imperative to inform the respondents on the importance of this data, but to not press the matter if they are unwilling to answer.
97
Chapter 7: Conclusions and Recommendations 7.1 General Overview The aims of the project were reflected in the research question which was formulated as: "What type of methodologies applicable to end-use household energy-consumption, environmental awareness, and road-traffic analysis are suitable to apply in Eastern-European cities and households, under which conditions can they be applied, and how can the transfer of this knowledge best take place?” This research aimed to benefit all the actors involved by focusing on the exchange of available knowledge. A central part hereof was the integration of that knowledge within the existing network in Bra�ov and Romania, i.e. to insure that the information is adapted in such a way that it can be used within the Romanian context or applications. This question was divided into three parts: 1. What type of methodologies applicable to end-use household energy-consumption and road-
traffic analysis are suitable to apply in Eastern-European cities and households? This first aim deals with establishing which of the methods available to the IVEM and in the Netherlands which deal with household energy consumption and road traffic are suitable for use in Bra�ov. A number of methods were analyzed, ranging from computer programs, questionnaires and theoretical concepts. The methods which proved useful all shared a number of characteristics: they were available at low costs and were flexible enough to be adapted to the Romanian conditions. This is closely tied to the two other aims of the project. 2. Under which conditions can these methods be applied? The second aim deals with the conditions under which these methods are applicable. The most prevalent obstacle encountered in this research was the availability of, and access to data. Once a method proved flexible enough to be adapted in the first place, it was still necessary to find the right type of data to be able use the program in Bra�ov. Many good programs that could be used to evaluate environmental issues on city-scale were rejected as a pilot project due to the vast amount of (socio-economic) data needed to use them. This type of data was either not available, or difficult to access on a short notice. 3. How can the transfer or exchange of this knowledge best take place? The third aim was to ascertain how the transfer of this knowledge can best take place, and is closely entwined with the first two aims. This project, and thus the exchange of knowledge would not have been possible without working closely with the Romanian partners. These include ABMEE and the Science Shop of course, but the cooperation with the Romanian students and other university staff also proved to be invaluable. Without this cooperation, the project would have stayed a “theoretical exercise”. During this cooperation, many “hidden” avenues to more information were revealed, as were some unexpected social aspects. These social factors more often than not proved problematic (e.g. the “taboo” concerning giving financial information), but at the same time added extra challenges to the project which helped the Dutch partners get more insight in the applicability of the methods. The next section gives a more elaborate overview of the conclusions related to the individual pilots and to the project as a whole.
98
7.2 Conclusions
Conclusions Regarding Pilot Project I: Household Energy Consumption In this project the program DoMUS was selected, and used to simulate the energy consumption in households. Other computer programs that were considered but not selected are ASE 2.1, Merlin, and MURE. The following conclusions may be drawn from the discussion given in Chapter 4: • The construction-material and weather database of the DoMUS can be sufficiently adapted to
give a good representation of Romanian houses and climate. These adaptations can then be used to calculate the direct energy use of a number of pre-defined house types. The results serve as a basis to compare the direct energy consumption between different house types, or can be used to assess the effect of energy conservation measures in a house.
• The database of DoMUS can not at this point be adapted to calculate the indirect energy consumption of houses53. The data needed to make these calculations include energy requirements for the complete lifecycle of goods, and input-output economical data for products. This type of data is not yet (readily) available for Romania.
• The behaviour related to energy use has a marked effect in the energy consumption in a household. Lowering the room temperature at night or when nobody is home can lead to approx. 20% reduction in energy consumption for each of the house types. Room temperature-control is however not possible in many houses in Romania. Investing in room temperature-controllers could be a relatively cost-effective and efficient way to reduce the energy use. This should be accompanied with a solid information campaign to inform the residents of the importance of lowering the room temperature.
• Of the three house types analyzed with DoMUS, detached houses proved to consume the most energy due to the large area of exposed wall surface. Detached houses would benefit most from wall insulation, compared to the other house types. Changing to high-insulation windows can in most cases achieve the same result as wall insulation (±15% reduction). Given that wall insulation is a costly matter, changing the windows can function as a first step in reducing the energy consumption, with a lower financial investment.
• Apartments consume the least energy due to the small area of exposed wall surface, and the fact that they are usually smaller than the other house types. Changing the walls would lead to only a small reduction in energy use. Changing the windows on the other hand could lead to approx. 20% reduction of the energy use, and can be considered a good investment.
• Further adaptations in the database (i.e. to include energy consumption of appliances, or the indirect energy) are necessary to increase the applicability of the program, and using it in practical research where the results from DoMUS are compared to actual data collected in homes, should help assess how to increase the effectiveness of the program.
Conclusions Regarding Pilot Project II: Traffic Modelling: In this project the program OmniTrans was selected and used to simulate the road traffic in Bra�ov. Other computer programs that were considered but not selected are Car International, PROMIL, and Urbis. The following conclusions can be drawn from the discussion given in Chapter 5: • The simulations run with the program OmniTRANS give an indication of the use and
possibilities of the modelling platform to represent and analyze the traffic situation in Bra�ov. The scenarios run for “Ora�ul Simplu”, a simple model containing four zones and three roads, demonstrate the principle of traffic modelling. The scenarios run for the city of Bra�ov show that the program can calculate the effect of city-wide measures, as well as area-specific changes in attraction or production.
53 A simplified version of DoMUS, with the options to calculate the indirect energy use for households disabled, is also added to the CDROM. The results given by this version may differ slightly (1-3%) from the result given by the original version.
99
• The effect of a freeway around the city will be large, greatly reducing the Volume to Capacity ratio (VC-Ratio) in the city centre and thus increasing the Level Of Service (LOS). This can clearly seen, even with the simplified scenarios analyzed with the program. The results do also show however that simply building a freeway would not solve all the traffic problems in the city. Additional measures, such as restricting access to certain roads in the centre, improving the streets, and increasing the quality of cars are also needed.
• The program OmniTRANS is a tool which can help policymakers make informed decisions related to traffic management. The model cannot provide solutions on its own, and can only show the effect certain measures will have on the traffic flows within an area. It is however a powerful aid for policymakers to achieve a sound and insightful traffic planning and management.
• OmniTRANS is a complicated program, which requires a great deal of theoretical knowledge on traffic modelling, and practical knowledge on the use and function of the program to be effectively employed. It demands a high level of expertise from the user. This should be taken in to account when deciding to invest in the purchase of this program (see Section 7.3, Recommendations).
• Traffic modelling based on the “classic transport model” (as is the case with OmniTrans) requires a great amount of social-economical data as input. This data was not readily available in Bra�ov. This should be taken in to account when deciding to invest in the purchase of this program (see Section 7.3, Recommendations).
Conclusions Regarding Pilot Project III: Survey on Environmental Awareness and Recycling. In this project the questionnaire used in ToolSust (WP1) was selected, and used as a basis for a questionnaire on Environmental Awareness and Recycling which could be used in during a foreseen recycling program in Bra�ov. No other questionnaires other than ToolSust were considered. The following conclusions can be drawn from the discussion given in Chapter 6: • The original ToolSust questionnaire has been successfully adapted and translated to Romanian.
The test trial showed that in general the questions are comprehensible, and that the respondents will be able to understand them. The questionnaire is ready to be used.
• The lay-out is thus designed that the questionnaire can be used in a mailing survey. With a few small adaptations, such as adding additional instructions for the interviewer, it can be adapted for an interview survey.
• The measurement of environmental knowledge in the first section of the questionnaire is rudimentary and superficial. A more in-depth measurement is not necessary to achieve the goals of this project. The questions give enough information on environmental knowledge of the respondent to statistically gauge the relation with active involvement in the recycling project. More in-depth measurement on these topics would only result in making the survey needlessly long.
• A number of questions in the questionnaire are prone to be influenced by social biases and what the respondent perceives as a “desirable” answer. This cannot be avoided. Measures to minimize this effect should be taken, e.g. explaining to the respondent that they will not be judge based on their response, and that the correct information is invaluable for the success of the survey.
• Some of the questions, e.g. those related to finances, may touch on delicate subjects, and thus prove problematic. It is imperative to inform the respondents on the importance of this data, but to not press the matter if they are unwilling to answer.
Conclusions Regarding the Whole Project: If the project is considered in its totality, the following conclusions can be drawn: • There are a great number of programs and methods that could be used in Romania. Most of these
programs need to be adapted to some degree. This can entail changing the database, adapting the input, or even re-writing part of the program. Also, not all programs can be used. Some are too specific to be changed, or need specific data that is not available.
100
• The programs that can be changed often need a lot of data to be adapted. The availability of the right type of data is one of the crucial aspects in conducting research and is generally considered a stumbling block in research. This project proved to be no different, given that one of the major problems encountered was the lack of data. This was mainly due to the following reasons: - The data does not exist (low availability). This is usually because the data has never been
collected. Reasons for this can be numerous. One of the most prevalent is that data collection can be time consuming and costly. If there is no apparent reason to collect certain information, then it is usually not worth the investment. This issue is compounded by the fact that many programs used for environmental analysis need specific information that can at first look seem unimportant.
- The data exists, but is not accessible (low accessibility). This usually is attributed to the data being classified, or because the data is scattered so that no one knows that it exists or where to find it. This data can sometimes be retrieved through indirect means, i.e. by asking people who may know about it, or may know someone who knows about it. It is imperative that an umbrella database is created to sort out and catalogue this data.
• The data is available and accessible, but not in the format needed for the program. This is usually the case with all the available data. It is not surprising, given that the information was not collected to be specifically used by these programs, so the data is most of the time incomplete. This problem is not specific to Romania and is inherent to the use of data in research. This can often be solved by intra-or extrapolation of available data, by using “educated guesses” or by making “defendable assumptions” to complete the dataset (see Figure 4-3).
• This project shows the effectiveness of using Science Shops to complement the standard university or college curriculum. Many students have participated during this project (see Table 3-1). It enabled them to put some of the knowledge they got in the classes into practice, while at the same time helping them to develop other skills. These include searching for information, formulating research proposal, and communicating about the results both in writing and in presentations. These students were exposed to the Dutch way of doing research and in return gave access to Romanian information, thus enabling the knowledge transfer which was the primary aim of this project.
7.3 Recommendations
Recommendations for Further Research The following suggestions could be used as starting point for further investigations: • Cataloguing of available data into one comprehensive database. There is a great amount of data
and research reports in Romania and Bra�ov that are not being used because their existence is not generally known. Examples of this are “traffic count” studies performed by students as diploma projects. There usually no overview of which counts have been performed and when, increasing the chance of the same count being repeated. Furthermore, the information is often only available to the professors who assisted these students and is thus not easily accessible. Making an inventory would shed light on what type of information is available and where there are hiatuses. This would help facilitate the search for specific types of data, such as those related to socio-economics (e.g. working populations) and demography (e.g. population density) needed for the traffic project. With this information catalogued, future research can benefit from the availability of the data, and one can avoid doing research that has already been done and can focus on bridging the gaps in the data.
• Further analysis of the applications of DoMUS. The program can be employed now that the database has been adapted. But first a database-validation should be conducted, by simulating existing houses and comparing the energy use computed by DoMUS to the actual consumption (this may be done for example in combination with the ASE 2.1 program). This would give a better insight on the error margin in the output of the program
101
• The OmniTRANS project showed the applicability of the program and now further research needs to be done to build a more accurate model for Bra�ov. The traffic department of the university can work on the construction of a larger model, which incorporates further details of the street network. The model can be validated by comparing its results to actual street counts done on regular parts of the street (not only at intersections) and during different hours of the day, including the rush hour. These counts can be carried out by students. The lack of socio-economic data can be addressed through cooperation with sociology department, which can perform the data collection. By working on such project, the traffic department can increase its own expertise in traffic modelling. Support in the process can be gained by cooperating with other universities, or consultancy agencies, e.g. the makers of OmniTRANS (Goudappel Coffeng).
• The questionnaire can be used to conduct a survey in the city. The responses can then analyzed statistically. The results of such analysis can be used to adapt the information campaigns held by ABMEE, and can yield new research questions. One possibility is for example to conduct an elaborate research on the knowledge of environmental issues to ascertain the general environmental awareness of the public. This was briefly addressed in the first part of the survey, and could be expanded to a whole survey. Policymakers can thus gain insight in the level of importance the public attaches to environmental issues.
Recommendations for the Science Shop The Science Shop in Bra�ov has shown how varied the options are for involving university departments, students and society in both projects and educational renewal. There is still a great potential for growth and one of the important facets therein is the expansion and consolidation of the network with the University and society: • The Science Shop has shown that it can offer students the chance to put the (theoretical)
knowledge they learn in their classes to practical use. The advantage of such a setting is that the results of these practical placements can directly benefit society, or organizations that approach the Science Shop for help. At this point the input of students is mostly voluntary. It is therefore desirable that effort be made to include all this practical work in the official curriculum. By consulting with the departments, study time and credits may be reserved for student activities done in the Science Shop. An extra effect of this could be that more staff is allocated from these departments to the Science Shop, which would increase the capacity of the Science Shop to attend to more students.
• Further encourage and formalize the interdisciplinary cooperation. The Science Shop already deals with a number of different departments and faculties. These interactions are often informal however. Most of the formal cooperation is with the chemistry department. By expanding the formal cooperation to other disciplines, the possibilities for the Science Shop could be greatly expanded.
• Part of the success of the Science Shop depends on its “visibility” both within and outside the university. Part of the focus should be put on increasing the Public Relations. This would include profiling the Science Shop to civil organizations who may be interested in the services offered by the Science Shop, but which are not aware of its existence, or do not realize what the Science Shop could offer them. An important aspect here is that the contact with the Science Shop should be facilitated. This can be achieved by having a clear and easily approachable contact point or person.
Recommendations for ABMEE ABMEE cooperates a great deal with the Transilvania University of Bra�ov. This cooperation is still in its early stages and promises great benefits for both parties. The presence of the University is a great asset which should be put in to the best possible use. Some of the possibilities the university has to offer have been shown in this project, but they only constitute a small fraction of the potential. This is a win-win situation for both parties:
102
• Many projects can be conducted by students, especially those doing their diploma project. This could entail small projects such as data collection for the ASE 2.1 program (e.g. chemistry or construction engineering students), or taking the survey (e.g. sociology students). Through its activities, ABMEE can supply many projects that will be challenging for the students and which would teach them many new problem-solving skills and techniques, but which would also give a direct interaction with society. This makes the studies alive, and greatly increases the motivation for the students.
• The university can also be involved in larger projects such as for example the application of OmniTRANS. In such cases, ABMEE can benefit from the fact that the university has access to a great number of sources and knowledge, which ABMEE cannot reach directly. This can in some cases prove to increase the cost-effectiveness, but more importantly it greatly expands the potential to gain insights in all kind of topics and matter.
As has been discussed above, one of the problems most encountered during this project was the lack of data. Two factors, [in]availability and [un]accessibility of data, contributed to many delays in the course of the research. By paying attention to the construction and maintenance of a data-catalogue and library, this problem can be greatly reduced: • This was true especially for social-economical data, e.g. the population distribution within the
city sections, or the number of households and businesses in a given area. Most projects would benefit by the availability of this type of knowledge, since it allows one to better choose the target group of such a project. Some of this data already exists, but is highly inaccessible.
• Another issue that proved to be time consuming was the difficulty to obtain official reports, proposals and other documents to for example European Commission made by the agency. A library containing both printed and digital versions of all these texts would ensure that this information would always be available at moment’s notice.
103
Reference List Alliance to Save Energy, Energy accounting software ASE 2.3, 2005.
ARCE, Regulation of Finding, Notifying and Sanctioning the Infringements to the provisions Law no. 199/2000 regarding the efficient use of energy., 2004.
Benders, R. M. J., Jong de, P., Moll, H. C., Meijer, A., and Eenkhoorn, R., Perspectief op een optimale en duurzame energie-infrastructuur een decentraal niveau., Groningen, Rijksuniversiteit Groningen Centrum voor Energie en Milieukunde (IVEM), 2004.
Benders, R. M. J., Kok, R., and Lensink, S., DoMUS: Domestic Metabolism User-friendly Simulated. 1.0, Groningen, Centre for Energy and Environmental Studies, 1998.
CET Bra�ov, Memoriu Prezentare Privind Rentabilizarea Asigurãrii Cu Energie Termicã în Municipiul Bra�ov., Bra�ov, S.C. Centrala Electrica De Termoficare Bra�ov S.A., 2004.
Cirstea, R. M., Proiect de Diploma: Analiza, Optimizarea Si Proiectarea Traficului Rutier, Bra�ov , Universitatea Transilvania Bra�ov, 2002.
CLIMA, Clima. Republicii Populare Romane, Vol. II. Date Climatologice, Institutul Meteorologic Romana, Bucarest, 1961.
Cornel, V., Proiect de Diploma: Analiza, Optimizarea Si Proiectarea Traficului Rutier, Bra�ov, Universitatea Transilvania Bra�ov, 2002.
D.J.S.Bra�ov, D.J.S.: Recensamant 2002., Bra�ov, Directia Judeteana de Statistica Bra�ov, 2002.
Draghici, C. & Schoonman, J., EnvEdu Bra�ov: Trends in Environmental Education, Bra�ov, TRANSILVANIA University of Bra�ov, 2004.
Enache, S., Proiect de Diploma: Analiza, Optimizarea Si Proiectarea Traficului Rutier, Bra�ov, Universitatea Transilvania Bra�ov, 2002.
Ferber, R., Sheatsley, P., Turner, A., and Waksberg, J., How to Plan a Survey, Alexandria, Virginia, American Statistical Association (ASA), 1997a.
Ferber, R., Sheatsley, P., Turner, A., and Waksberg, J., What Is a Survey?, Alexandria, Virginia, American Statistical Association (ASA), 1997b.
Fokkink, A. & Mulder, H. A. J., Problem based learning through Science Shops in Romania - putting wisdom into practice, paper for 'Education on Sustainable Development' (Materials, Product, Environment) in the New Information and Communication Society, Bramat., Bra�ov, Romania, 2003.
Fokkink, A.J. and Mulder, H. A. J., Curriculum Development Through Science Shops, Environmental Management and Engineering Journal 3, 549-560, 2004.
Fota, S. M., Meeting on Building and Isolation Materials used in Romania., 2004.
Immers, L. H. & Stada, J. E., Verkeersmodellen: Cursus H111, Leuven, Katholieke Universiteit Leuven, 1998.
IntermediuNet, Asociatia INTERMEDIUNET România (INRO), 2004a.
IntermediuNet, INRO 2004, First National Conference "Towards Sustainable Partnerships Between Universities And Society Groups"., 2004b.
ISSNET, Improving Science Shop Networking (ISSNET), 2004.
104
Kok, R., DoMUS - Een computersimulatiemodel voor het huishoudelijk energiegebruik. Handleiding versie 1.0, Groningen, Rijksuniversiteit Groningen Centrum voor Energie en Milieukunde (IVEM), 1999.
Kok, R., DoMUS Tour - English manual, Groningen, Rijksuniversiteit Groningen Centrum voor Energie en Milieukunde (IVEM), 2003.
Methi, N., Stø, E., Throne-Holst, H., and Vittersø, G., ToolSust Deliverable No. 7: Consumption and Environment in Five European Cities, European Report, Lysaker, Norway, National Institute for Consumer Research (SIFO), 2001.
Miedema, H. M. E., Hout v/den, K. D., Fritz, J. B., and Borst, H. C., Urbis: instrument for Local Environmental Surveys, 1999.
Mulder, H. A. J., Progress-Discussion Meeting #3, 14-10-2003.
MURE, MURE: Mesures d'Utilisation Rationnelle de l'Energie, 2005.
Nellestijn, J. & Dekker, J., Wereld Klimaat Informatie WKI versie 2.00, De Bilt, The Netherlands, KNMI - Klimatologische Dienstverlening, 1998.
OmniTrans, Omnitrans, Transport Planning Software, OmniTrans International, 2003.
Ortúzar, J. and Willumsen, L. G., Modelling Transport, John Wiley & Sons, 2001.
PROMIL, PROMIL Spatial: The Integrated Traffic and Environment-Model, Goudappel Coffeng, 2005.
PUG Bra�ov, Cartiere Conform Plan Urbanistic General Bra�ov, Bra�ov, Directia Arhitectura Urbaism, Primaria Municipiului Bra�ov, 2000.
Rata, C., Doiciu, C., and Gaspar, R., Aplication for SAVE Agency status by ABMEE, part B, Bra�ov, Romania, 2002.
Rata, C., Doiciu, C., and Gaspar, R., Energy Efficiency and Environmental Protection Agency Bra�ov, Bra�ov, Romania, 2003.
Rata, C., Doiciu, C., and Gaspar, R., An Overview of Information Concerning Energy Producion and Consumption in Bra�ov., Bra�ov, Romania, 2004a.
Rata, C., Doiciu, C., and Gaspar, R., Inception Report to the European Commission; Project: 4.1031/A/02-003, Bra�ov, Romania, 2004b.
RPC, Definitions of Level of Service (LOS), 2005.
SAVE II, SAVE II PROGRAMME: Guidelines and Application Form for the Submission of Proposals, Directorate-General for Transport and Energy, European Commission, 2000.
Stadtklima, CAR: Calculation of Air Pollution from Road Traffic, 2005.
Sysoft S.R.L., Bra�ov Travel Guide: About Bra�ov., Bra�ov Travel Guide, 2000.
Tarulescu, S., Proiect de Diploma: Analiza, Optimizarea Si Proiectarea Traficului Rutier, Bra�ov, Universitatea Transilvania Bra�ov, 2002.
Ten Meer, E. J., Draghici, C., Mulder, H. A. J., and Moll, H. C., A Study of Household Energy Consumption and Road Traffic in Bra�ov, Using West-European Methods, ENVEDU Bra�ov 2004, 2004a.

105
Ten Meer, E. J., Draghici, C., and Perniu, D., Involvement of Students in Research on Household Energy Consumption and Road Traffic, Including West-East Exchange and Integration of Knowledge, INRO Bra�ov 2004, 2004b.
TRAPOS, Optimization of Modelling Methods for Traffic Pollution in Streets, 2005.
United Nations, Country Profiles on the Housing Sector, Romania, United Nations, 2001.
Walonick, D. S., Survival Statistics, StatPac Inc., Bloomington Minnesota, 1997.

106
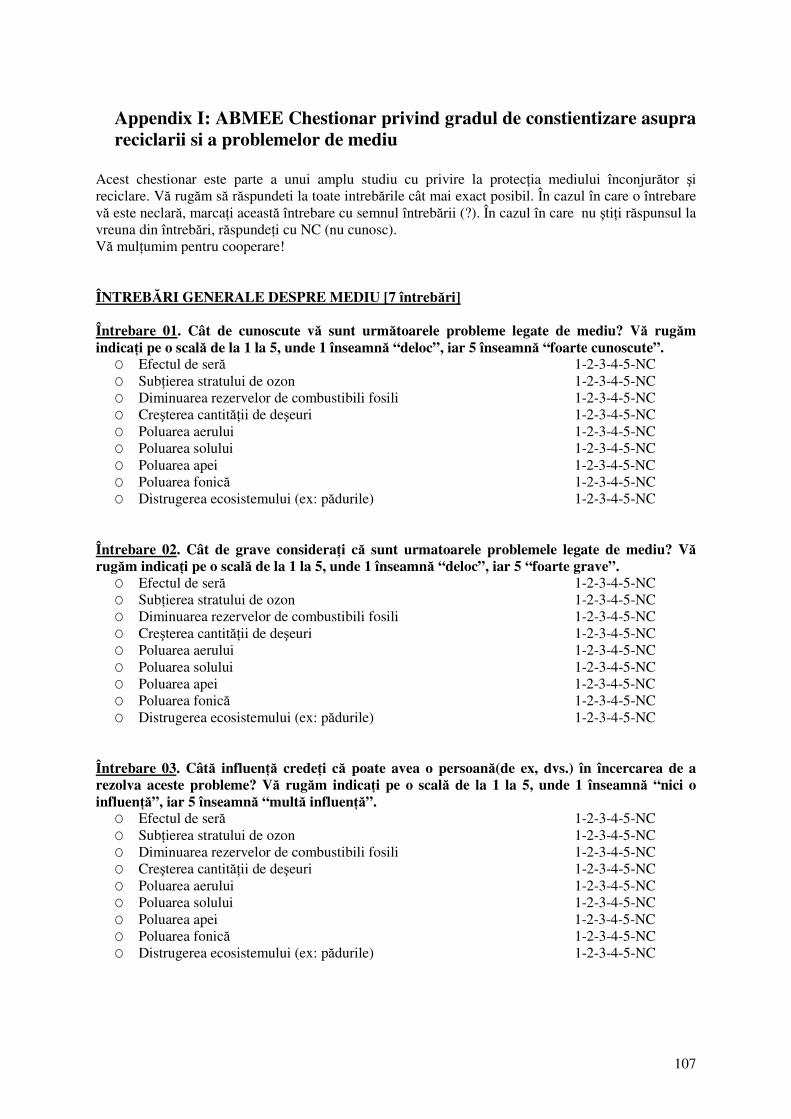
107
Appendix I: ABMEE Chestionar privind gradul de constientizare asupra reciclarii si a problemelor de mediu
Acest chestionar este parte a unui amplu studiu cu privire la protec�ia mediului înconjur�tor �i reciclare. V� rug�m s� r�spundeti la toate intreb�rile cât mai exact posibil. În cazul în care o întrebare v� este neclar�, marca�i aceast� întrebare cu semnul întreb�rii (?). În cazul în care nu �ti�i r�spunsul la vreuna din întreb�ri, r�spunde�i cu NC (nu cunosc). V� mul�umim pentru cooperare! ÎNTREB�RI GENERALE DESPRE MEDIU [7 întreb�ri] Întrebare 01. Cât de cunoscute v� sunt urm�toarele probleme legate de mediu? V� rug�m indica�i pe o scal� de la 1 la 5, unde 1 înseamn� “deloc”, iar 5 înseamn� “foarte cunoscute”.
O Efectul de ser� 1-2-3-4-5-NC O Sub�ierea stratului de ozon 1-2-3-4-5-NC O Diminuarea rezervelor de combustibili fosili 1-2-3-4-5-NC O Cre�terea cantit��ii de de�euri 1-2-3-4-5-NC O Poluarea aerului 1-2-3-4-5-NC O Poluarea solului 1-2-3-4-5-NC O Poluarea apei 1-2-3-4-5-NC O Poluarea fonic� 1-2-3-4-5-NC O Distrugerea ecosistemului (ex: p�durile) 1-2-3-4-5-NC
Întrebare 02. Cât de grave considera�i c� sunt urmatoarele problemele legate de mediu? V� rug�m indica�i pe o scal� de la 1 la 5, unde 1 înseamn� “deloc”, iar 5 “foarte grave”.
O Efectul de ser� 1-2-3-4-5-NC O Sub�ierea stratului de ozon 1-2-3-4-5-NC O Diminuarea rezervelor de combustibili fosili 1-2-3-4-5-NC O Cre�terea cantit��ii de de�euri 1-2-3-4-5-NC O Poluarea aerului 1-2-3-4-5-NC O Poluarea solului 1-2-3-4-5-NC O Poluarea apei 1-2-3-4-5-NC O Poluarea fonic� 1-2-3-4-5-NC O Distrugerea ecosistemului (ex: p�durile) 1-2-3-4-5-NC
Întrebare 03. Cât� influen�� crede�i c� poate avea o persoan�(de ex, dvs.) în încercarea de a rezolva aceste probleme? V� rug�m indica�i pe o scal� de la 1 la 5, unde 1 înseamn� “nici o influen��”, iar 5 înseamn� “mult� influen��”.
O Efectul de ser� 1-2-3-4-5-NC O Sub�ierea stratului de ozon 1-2-3-4-5-NC O Diminuarea rezervelor de combustibili fosili 1-2-3-4-5-NC O Cre�terea cantit��ii de de�euri 1-2-3-4-5-NC O Poluarea aerului 1-2-3-4-5-NC O Poluarea solului 1-2-3-4-5-NC O Poluarea apei 1-2-3-4-5-NC O Poluarea fonic� 1-2-3-4-5-NC O Distrugerea ecosistemului (ex: p�durile) 1-2-3-4-5-NC
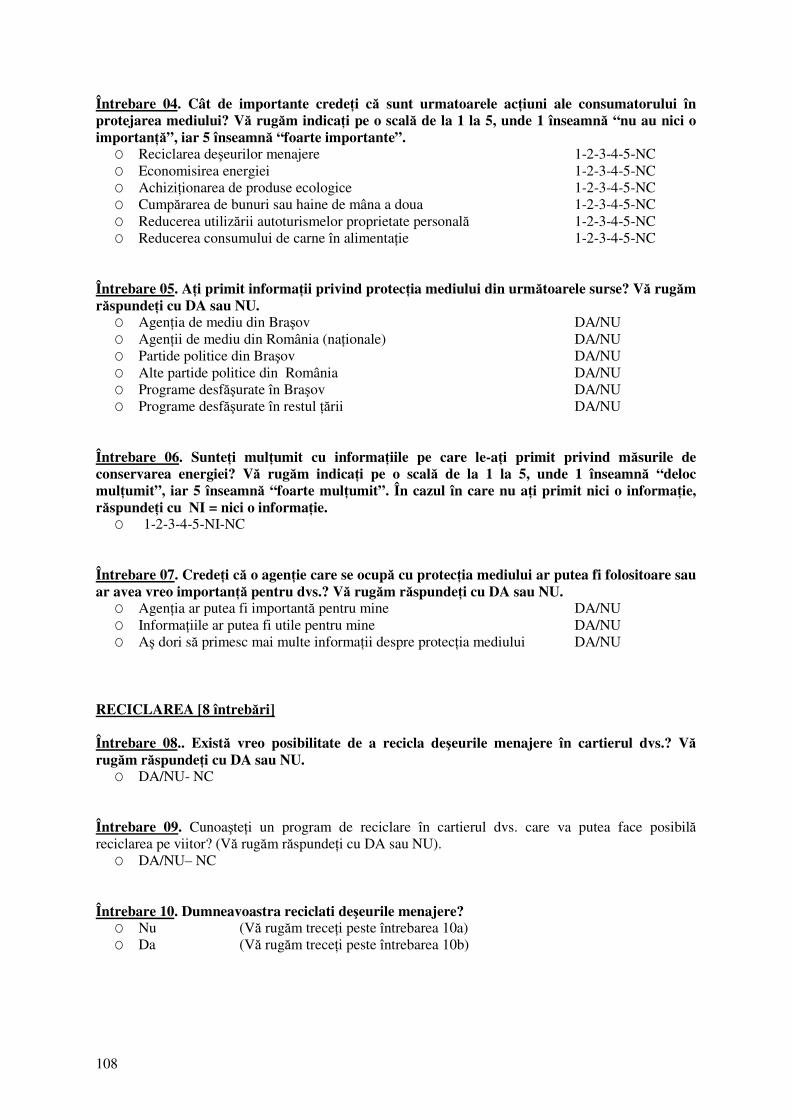
108
Întrebare 04. Cât de importante crede�i c� sunt urmatoarele ac�iuni ale consumatorului în protejarea mediului? V� rug�m indica�i pe o scal� de la 1 la 5, unde 1 înseamn� “nu au nici o importan��”, iar 5 înseamn� “foarte importante”.
O Reciclarea de�eurilor menajere 1-2-3-4-5-NC O Economisirea energiei 1-2-3-4-5-NC O Achizi�ionarea de produse ecologice 1-2-3-4-5-NC O Cump�rarea de bunuri sau haine de mâna a doua 1-2-3-4-5-NC O Reducerea utiliz�rii autoturismelor proprietate personal� 1-2-3-4-5-NC O Reducerea consumului de carne în alimenta�ie 1-2-3-4-5-NC
Întrebare 05. A�i primit informa�ii privind protec�ia mediului din urm�toarele surse? V� rug�m r�spunde�i cu DA sau NU.
O Agen�ia de mediu din Bra�ov DA/NU O Agen�ii de mediu din România (na�ionale) DA/NU O Partide politice din Bra�ov DA/NU O Alte partide politice din România DA/NU O Programe desf��urate în Bra�ov DA/NU O Programe desf��urate în restul ��rii DA/NU
Întrebare 06. Sunte�i mul�umit cu informa�iile pe care le-a�i primit privind m�surile de conservarea energiei? V� rug�m indica�i pe o scal� de la 1 la 5, unde 1 înseamn� “deloc mul�umit”, iar 5 înseamn� “foarte mul�umit”. În cazul în care nu a�i primit nici o informa�ie, r�spunde�i cu NI = nici o informa�ie.
O 1-2-3-4-5-NI-NC Întrebare 07. Crede�i c� o agen�ie care se ocup� cu protec�ia mediului ar putea fi folositoare sau ar avea vreo importan�� pentru dvs.? V� rug�m r�spunde�i cu DA sau NU.
O Agen�ia ar putea fi important� pentru mine DA/NU O Informa�iile ar putea fi utile pentru mine DA/NU O A� dori s� primesc mai multe informa�ii despre protec�ia mediului DA/NU
RECICLAREA [8 întreb�ri] Întrebare 08.. Exist� vreo posibilitate de a recicla de�eurile menajere în cartierul dvs.? V� rug�m r�spunde�i cu DA sau NU.
O DA/NU- NC Întrebare 09. Cunoa�te�i un program de reciclare în cartierul dvs. care va putea face posibil� reciclarea pe viitor? (V� rug�m r�spunde�i cu DA sau NU).
O DA/NU– NC Întrebare 10. Dumneavoastra reciclati de�eurile menajere?
O Nu (V� rug�m trece�i peste întrebarea 10a) O Da (V� rug�m trece�i peste întrebarea 10b)
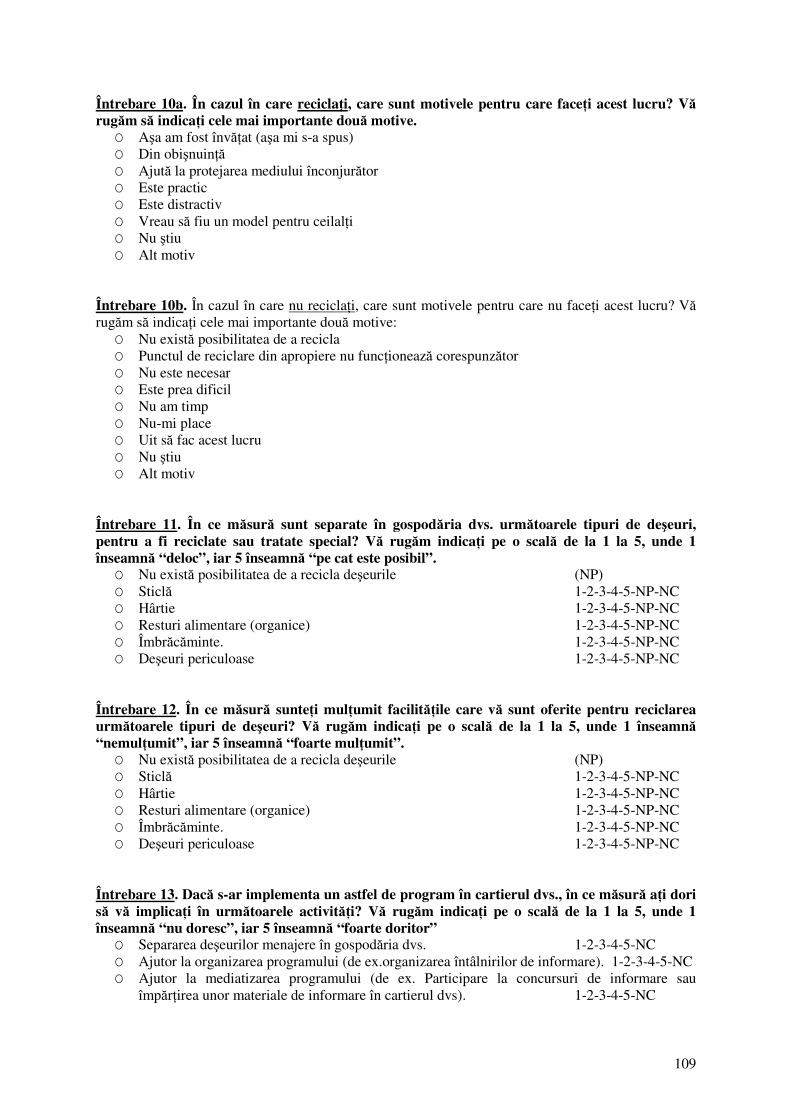
109
Întrebare 10a. În cazul în care recicla�i, care sunt motivele pentru care face�i acest lucru? V� rug�m s� indica�i cele mai importante dou� motive.
O A�a am fost înv��at (a�a mi s-a spus) O Din obi�nuin�� O Ajut� la protejarea mediului înconjur�tor O Este practic O Este distractiv O Vreau s� fiu un model pentru ceilal�i O Nu �tiu O Alt motiv
Întrebare 10b. În cazul în care nu recicla�i, care sunt motivele pentru care nu face�i acest lucru? V� rug�m s� indica�i cele mai importante dou� motive:
O Nu exist� posibilitatea de a recicla O Punctul de reciclare din apropiere nu func�ioneaz� corespunz�tor O Nu este necesar O Este prea dificil O Nu am timp O Nu-mi place O Uit s� fac acest lucru O Nu �tiu O Alt motiv
Întrebare 11. În ce m�sur� sunt separate în gospod�ria dvs. urm�toarele tipuri de de�euri, pentru a fi reciclate sau tratate special? V� rug�m indica�i pe o scal� de la 1 la 5, unde 1 înseamn� “deloc”, iar 5 înseamn� “pe cat este posibil”.
O Nu exist� posibilitatea de a recicla de�eurile (NP) O Sticl� 1-2-3-4-5-NP-NC O Hârtie 1-2-3-4-5-NP-NC O Resturi alimentare (organice) 1-2-3-4-5-NP-NC O Îmbr�c�minte. 1-2-3-4-5-NP-NC O De�euri periculoase 1-2-3-4-5-NP-NC
Întrebare 12. În ce m�sur� sunte�i mul�umit facilit��ile care v� sunt oferite pentru reciclarea urm�toarele tipuri de de�euri? V� rug�m indica�i pe o scal� de la 1 la 5, unde 1 înseamn� “nemul�umit”, iar 5 înseamn� “foarte mul�umit”.
O Nu exist� posibilitatea de a recicla de�eurile (NP) O Sticl� 1-2-3-4-5-NP-NC O Hârtie 1-2-3-4-5-NP-NC O Resturi alimentare (organice) 1-2-3-4-5-NP-NC O Îmbr�c�minte. 1-2-3-4-5-NP-NC O De�euri periculoase 1-2-3-4-5-NP-NC
Întrebare 13. Dac� s-ar implementa un astfel de program în cartierul dvs., în ce m�sur� a�i dori s� v� implica�i în urm�toarele activit��i? V� rug�m indica�i pe o scal� de la 1 la 5, unde 1 înseamn� “nu doresc”, iar 5 înseamn� “foarte doritor”
O Separarea de�eurilor menajere în gospod�ria dvs. 1-2-3-4-5-NC O Ajutor la organizarea programului (de ex.organizarea întâlnirilor de informare). 1-2-3-4-5-NC O Ajutor la mediatizarea programului (de ex. Participare la concursuri de informare sau
împ�r�irea unor materiale de informare în cartierul dvs). 1-2-3-4-5-NC
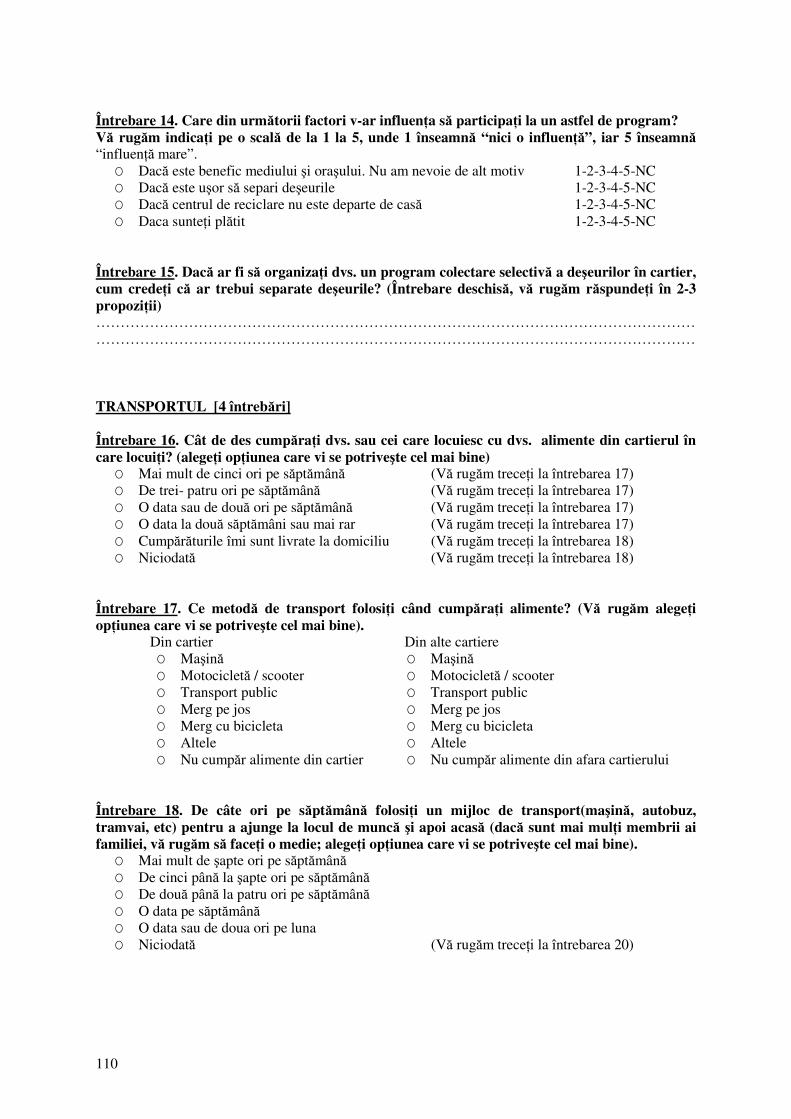
110
Întrebare 14. Care din urm�torii factori v-ar influen�a s� participa�i la un astfel de program? V� rug�m indica�i pe o scal� de la 1 la 5, unde 1 înseamn� “nici o influen��”, iar 5 înseamn� “influen�� mare”.
O Dac� este benefic mediului �i ora�ului. Nu am nevoie de alt motiv 1-2-3-4-5-NC O Dac� este u�or s� separi de�eurile 1-2-3-4-5-NC O Dac� centrul de reciclare nu este departe de cas� 1-2-3-4-5-NC O Daca sunte�i pl�tit 1-2-3-4-5-NC
Întrebare 15. Dac� ar fi s� organiza�i dvs. un program colectare selectiv� a de�eurilor în cartier, cum crede�i c� ar trebui separate de�eurile? (Întrebare deschis�, v� rug�m r�spunde�i în 2-3 propozi�ii) …………………………………………………………………………………………………………… …………………………………………………………………………………………………………… TRANSPORTUL [4 întreb�ri] Întrebare 16. Cât de des cump�ra�i dvs. sau cei care locuiesc cu dvs. alimente din cartierul în care locui�i? (alege�i op�iunea care vi se potrive�te cel mai bine)
O Mai mult de cinci ori pe s�pt�mân� (V� rug�m trece�i la întrebarea 17) O De trei- patru ori pe s�pt�mân� (V� rug�m trece�i la întrebarea 17) O O data sau de dou� ori pe s�pt�mân� (V� rug�m trece�i la întrebarea 17) O O data la dou� s�pt�mâni sau mai rar (V� rug�m trece�i la întrebarea 17) O Cump�r�turile îmi sunt livrate la domiciliu (V� rug�m trece�i la întrebarea 18) O Niciodat� (V� rug�m trece�i la întrebarea 18)
Întrebare 17. Ce metod� de transport folosi�i când cump�ra�i alimente? (V� rug�m alege�i op�iunea care vi se potrive�te cel mai bine).
Din cartier Din alte cartiere O Ma�in� O Motociclet� / scooter O Transport public O Merg pe jos O Merg cu bicicleta O Altele O Nu cump�r alimente din cartier
O Ma�in� O Motociclet� / scooter O Transport public O Merg pe jos O Merg cu bicicleta O Altele O Nu cump�r alimente din afara cartierului
Întrebare 18. De câte ori pe s�pt�mân� folosi�i un mijloc de transport(ma�in�, autobuz, tramvai, etc) pentru a ajunge la locul de munc� �i apoi acas� (dac� sunt mai mul�i membrii ai familiei, v� rug�m s� face�i o medie; alege�i op�iunea care vi se potrive�te cel mai bine).
O Mai mult de �apte ori pe s�pt�mân� O De cinci pân� la �apte ori pe s�pt�mân� O De dou� pân� la patru ori pe s�pt�mân� O O data pe s�pt�mân� O O data sau de doua ori pe luna O Niciodat� (V� rug�m trece�i la întrebarea 20)
111
Întrebare 19. Ce metod� de transport folosi�i când v� deplasa�i la locul de munc�? (V� rug�m alege�i op�iunea care vi se potrive�te cel mai bine).
O Ma�in� O Motociclet� / scooter O Transport public O Merg pe jos O Merg cu bicicleta O Altele
CONSERVAREA ENERGIEI [5 întreb�ri] Întrebare 20. Când a fost construit apartamentul dvs.?
O Înainte de 1900 O Între 1900 �i 1930 O Între 1930 �i 1950 O Între 1950 �i 1970 O Între 1970 �i 1990 O În anii 90 O Anul 2000 sau dup�
Întrebare 21. Crede�i c� este necesar s� reduce�i consumul de energie în gospod�ria dvs.?
O Da. V� rug�m indica�i de ce da. (V� rug�m r�spunde�i în una- dou� fraze) ……………………………………………………………………………………………………… O Nu. V� rug�m indica�i de ce nu. (V� rug�m r�spunde�i în una- dou� fraze) ………………………………………………………………………………………………………
Întrebare 22. Sunte�i familiarizat cu etichetarea produselor pe clase de eficien�� energetic� (produsele etichetate sunt: frigiderul, aragazul, congelatorul etc.)?
O Nu (Nu am achizi�ionat acest tip de produse în ultimii doi ani) O Da.
Întrebare 23. A fost f�cut unul din urm�toarele eforturi de a reduce consumul de energie în ultimii 10 ani? V� rug�m r�spunde�i cu DA sau NU.
O Ferestre sau u�i termoizolante DA/NU – NC O Izola�ii pentru podele sau acoperi� DA/NU – NC O A fost instalat boiler nou sau sistem eficient de înc�lzire DA/NU – NC O Au fost instala�i robinete cu termostat pentru sistemul de înc�lzire DA/NU – NC O Au fost instalate capete de du� cu curgere redus� DA/NU – NC O Au fost utilizate becuri economice (cu consum redus) DA/NU – NC O Altul; v� rug�m indica�i care…………………………………………………….……………
112
Întrebare 24. Vã implica�i în unul din urm�toarele eforturi pentru a reduce consumul de energie în apartamentul/casa dvs. ? V� rug�m indica�i pe o scal� de la 1 la 5, unde 1 înseamn� “niciodat�”, iar 5 înseamn� “întotdeauna”.
O Stinge�i luminile când ie�i�i din camer�? 1-2-3-4-5 O Stinge�i televizorul sau radio când ie�i�i din camer�? 1-2-3-4-5 O Stinge�i computerul sau alt aparat electronic atunci când nu sunt utilizate? 1-2-3-4-5 O Reduce�i temperatura în cas� seara, înainte de culcare? 1-2-3-4-5-NP
INFORMA�II GENERALE - CHESTIONAT: [5 întreb�ri] Întrebare 25. Sex (masculin/feminin)
O M/F Întrebare 26. Anul na�terii? …………………………………………….……………… Întrebare 27. Care este ultima �coal� absolvit�?
O F�r� �coal� O �coal� primar� O �coal� gimnazial� O �coal� profesional�, complementar� sau de ucenici O Liceu O �coal� posliceala sau tehnic� de mai�tri O Studii superioare de scurt� durat� (colegiu) O Studii superioare de lung� durat� O Studii postuniversitare
Întrebare 28. Care este ocupa�ia dvs? (alege�i op�iunea care vi se potrive�te cel mai bine)
O Lucrez cu norm� întreag� O Lucrez jum�tate de norm� O Student/elev O Pensionar/pensionat pe caz de boal� O �omer(primesc ajutor de �omaj) /f�r� loc de munc�
Întrebare 29. În ultimul an a�i f�cut unul din urm�toarele lucruri? V� rug�m r�spunde�i cu DA sau NU.
O A�i luat parte la un eveniment local (dezbatere politic�, concert la �coal�, expozi�ie de art�, meci de fotbal, concert, pies� de teatru) DA/NU
O A�i fost membru al unei organiza�ii (sportive, profesionale, sociale) locale/club DA/NU O A�i fost leader-ul sau membru în vreun comitet de organizare pentru un grup local sau
organiza�ie? DA/NU O A�i participat ca voluntar pentru o organiza�ie sau eveniment special? DA/NU
INFORMA�II GENERALE – FAMILIE [5 întreb�ri] Întrebare 30. Câ�i membrii are familia dvs. (care locuiesc cu dvs.)? ……………………………

113
Întrebare 31. Câ�i membri ai familiei au vîrsta cuprins� sub 14 ani? …………………………… Întrebare 32. V� rug�m estima�i veniturile lunare în familia dvs. (Aceast� întrebare este op�ional�; În cazul în care nu dori�i s� r�spunde�i, alege�i varianta “Nu �tiu“)
O Sub 2.5 milioane Lei O 2.5 milioane – 4.5 milioane Lei O 4.5 milioane – 6.5 milioane Lei O 6.5 milioane – 8.5 milioane Lei O 8.5 milioane – 10.5 milioane Lei O Mai mult de 10.5 milioane Lei O Nu �tiu (aceast� informa�ie este privat�)
Întrebare 33. Ave�i ma�in�?(a familiei)
O Da; v� rug�m indica�i câte…………………………………….……………… O Nu
Întrebare 34. Sta�i în chirie sau sunte�i proprietar?
O Sunt proprietarul unei case O Sunt proprietarul unui apartament O Locuiesc în chirie la cas� O Locuiesc în chirie într-un apartament O Locuiesc într-o cas� închiriat� de la municipalitate sau de la o companie O Locuiesc într-un apartament închiriat de la municipalitate sau de la o companie O Alt� variant� (locuiesc într-o camer� închiriat� etc) O Nu �tiu

114
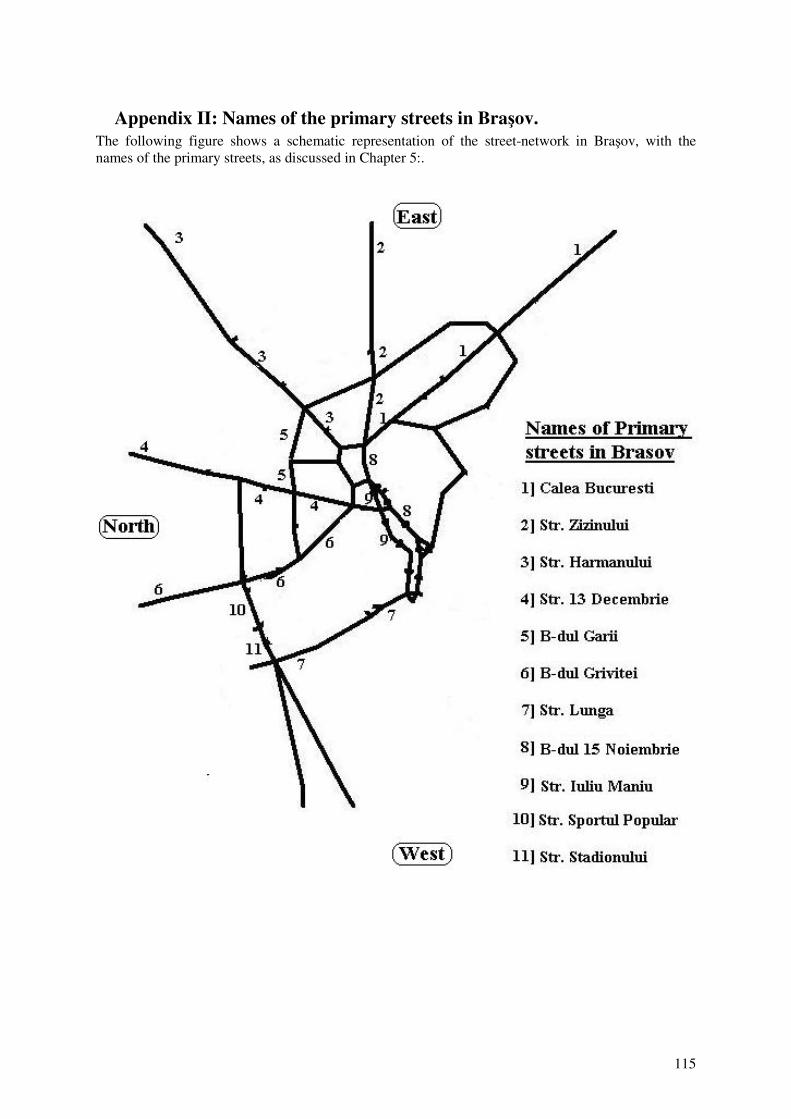
115
Appendix II: Names of the primary streets in Bra�ov. The following figure shows a schematic representation of the street-network in Bra�ov, with the names of the primary streets, as discussed in Chapter 5:.

116
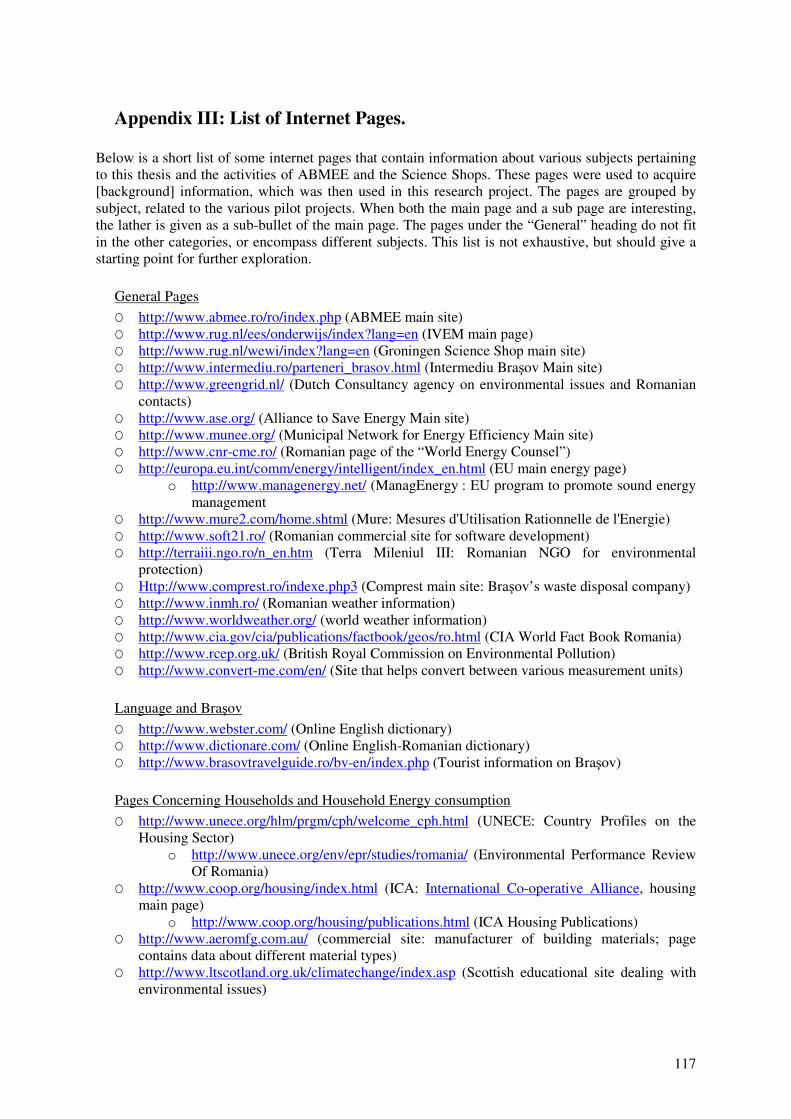
117
Appendix III: List of Internet Pages. Below is a short list of some internet pages that contain information about various subjects pertaining to this thesis and the activities of ABMEE and the Science Shops. These pages were used to acquire [background] information, which was then used in this research project. The pages are grouped by subject, related to the various pilot projects. When both the main page and a sub page are interesting, the lather is given as a sub-bullet of the main page. The pages under the “General” heading do not fit in the other categories, or encompass different subjects. This list is not exhaustive, but should give a starting point for further exploration.
General Pages O http://www.abmee.ro/ro/index.php (ABMEE main site) O http://www.rug.nl/ees/onderwijs/index?lang=en (IVEM main page) O http://www.rug.nl/wewi/index?lang=en (Groningen Science Shop main site) O http://www.intermediu.ro/parteneri_brasov.html (Intermediu Bra�ov Main site) O http://www.greengrid.nl/ (Dutch Consultancy agency on environmental issues and Romanian
contacts) O http://www.ase.org/ (Alliance to Save Energy Main site) O http://www.munee.org/ (Municipal Network for Energy Efficiency Main site) O http://www.cnr-cme.ro/ (Romanian page of the “World Energy Counsel”) O http://europa.eu.int/comm/energy/intelligent/index_en.html (EU main energy page)
o http://www.managenergy.net/ (ManagEnergy : EU program to promote sound energy management
O http://www.mure2.com/home.shtml (Mure: Mesures d'Utilisation Rationnelle de l'Energie) O http://www.soft21.ro/ (Romanian commercial site for software development) O http://terraiii.ngo.ro/n_en.htm (Terra Mileniul III: Romanian NGO for environmental
protection) O Http://www.comprest.ro/indexe.php3 (Comprest main site: Bra�ov’s waste disposal company) O http://www.inmh.ro/ (Romanian weather information) O http://www.worldweather.org/ (world weather information) O http://www.cia.gov/cia/publications/factbook/geos/ro.html (CIA World Fact Book Romania) O http://www.rcep.org.uk/ (British Royal Commission on Environmental Pollution) O http://www.convert-me.com/en/ (Site that helps convert between various measurement units) Language and Bra�ov O http://www.webster.com/ (Online English dictionary) O http://www.dictionare.com/ (Online English-Romanian dictionary) O http://www.brasovtravelguide.ro/bv-en/index.php (Tourist information on Bra�ov)
Pages Concerning Households and Household Energy consumption O http://www.unece.org/hlm/prgm/cph/welcome_cph.html (UNECE: Country Profiles on the
Housing Sector) o http://www.unece.org/env/epr/studies/romania/ (Environmental Performance Review
Of Romania) O http://www.coop.org/housing/index.html (ICA: International Co-operative Alliance, housing
main page) o http://www.coop.org/housing/publications.html (ICA Housing Publications)
O http://www.aeromfg.com.au/ (commercial site: manufacturer of building materials; page contains data about different material types)
O http://www.ltscotland.org.uk/climatechange/index.asp (Scottish educational site dealing with environmental issues)
118
o http://www.ltscotland.org.uk/climatechange/household/household7.asp (Site with general information on building materials, with focus on environmental aspects)
O http://www.knovel.com/knovel2/Toc.jsp?BookID=736 (page from the “Knovel Online Library”, containing PDF files of the “Smithsonian Physical Tables” reference book – requires registration)
O http://community.turi.org/household/project_materials.shtml (Portal site with information on “green” building materials)
O http://www.matweb.com/search/search.asp (Matweb: online searchable database for material Property Information
O http://themes.eea.eu.int/indicators/all_indicators_box (European Environmental Agency: Environmental Indicators)
o http://themes.eea.eu.int/Sectors_and_activities/households (European Environmental Agency: households)
O http://www.energexinstitute.com/home-connect/saving-tips/abs_nonos.htm(Household Energy Saving Tips)
O http://hyperphysics.phy-astr.gsu.edu/hbase/thermo/houseenergy.html (Household energy use) O http://www.eia.doe.gov/emeu/recs/contents.html (Residential Energy Consumption Survey:
home energy uses and costs)
Pages Concerning Traffic O http://www.goudappel.nl/Site/basicsite.nsf (Main site of the Dutch engineering agency
Goudappel Coffeng – Dutch language) o http://www.verkeersmilieukaart.nl/ (site of Promil and dBwegI: programs developed
by Goudappel Coffeng) o http://www.omnitrans.nl/ (Main page of OmniTrans international)
O http://www.eltis.org/Vorlage.phtml?sprache=en (EU: European Local Transport Information service)
O http://www.chcrpa.org/Pages/Transportation/Meetings/MPO%20Package/TPO_2004_Feb_Package/8a%20CMS2_04/CMS_Page_Info.htm (RPA: Regional Planning Agency (American) sub-page with information on Traffic terminology and issues)
O http://www.mep.tno.nl/homepage_eng_BenO.html (TNO: Dutch engineering agency. main energy and environmental site – Dutch and English versions).
o http://www.mep.tno.nl/software/indexen.html (TNO site with link to downloadable computer programs concerning energy and environmental safety)
o http://www.tno.nl/industrie_en_techniek/mobiliteit_en_(transport)/index.xml (TNO: mobility and transport page)
O http://www.verkeerskunde.nl/moxie/software/softwareoverzicht.shtml (Dutch portal site with links to various pages concerning traffic and traffic programs/models)
O http://www.aatraffic.com/TrafficModels.htm (Commercial site: contains papers on traffic models)
O http://www.berkshireplanning.org/ (Site with introduction to traffic an regional planning)
Pages Concerning Questionnaires and the Toolsust Program. O Http://www.whatisasurvey.info/ O Http://Lap.Umd.Edu/Survey_Design/Index.Html (Guide For Designing Web-Surveys) O Http://Www.Statpac.Com/Surveys/Index.Htm#Toc (Survey Tutorial) O Http://Www.Sifo.No/Page/English/Meny_Knapper/10237/10281 (Sifo: Norwegian Institute
for consumer research) O Http://www.statpac.com/statistics-book/index.htm (abstract of book: “survival statistics”) O Http://Www.Toolsust.Org/ (Main Page Of The Toolsust Program)