Household consumption expenditures and the consumer confidence index
14
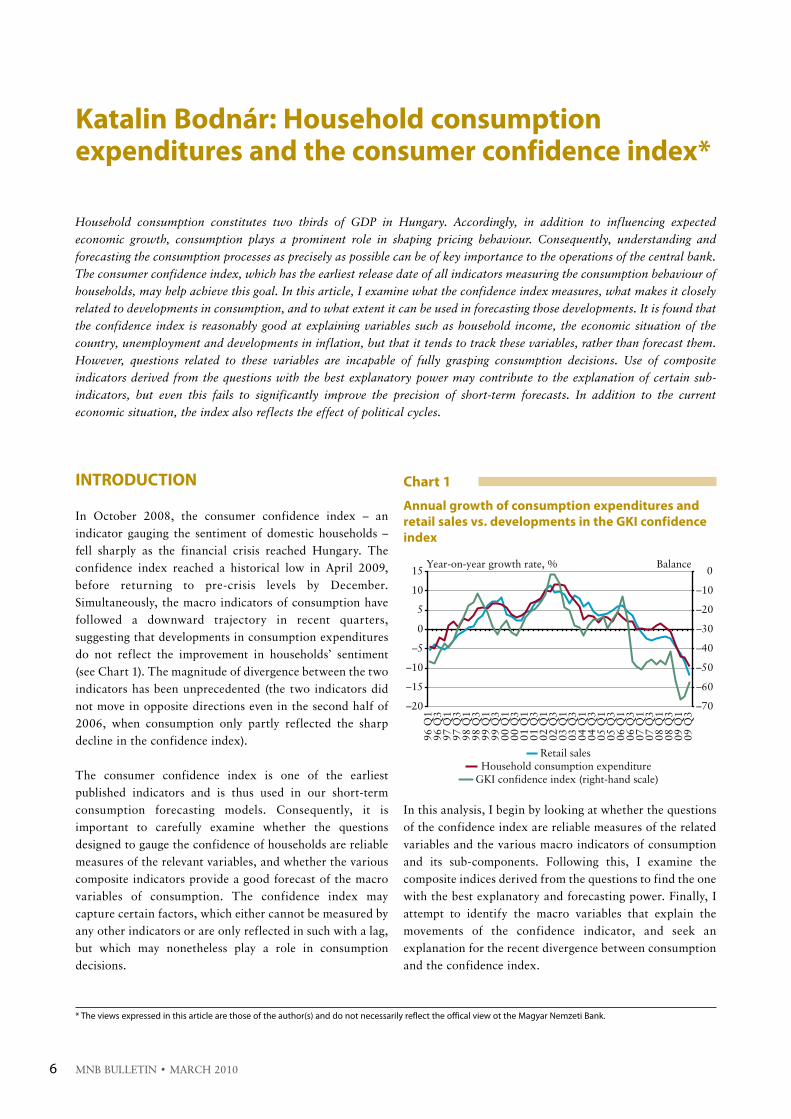
INTRODUCTION in October 2008, the consumer confidence index – an indicator gauging the sentiment of domestic households – fell sharply as the financial crisis reached hungary. the confidence index reached a historical low in april 2009, before returning to pre-crisis levels by december. Simultaneously, the macro indicators of consumption have followed a downward trajectory in recent quarters, suggesting that developments in consumption expenditures do not reflect the improvement in households’ sentiment (see chart 1). the magnitude of divergence between the two indicators has been unprecedented (the two indicators did not move in opposite directions even in the second half of 2006, when consumption only partly reflected the sharp decline in the confidence index). the consumer confidence index is one of the earliest published indicators and is thus used in our short-term consumption forecasting models. consequently, it is important to carefully examine whether the questions designed to gauge the confidence of households are reliable measures of the relevant variables, and whether the various composite indicators provide a good forecast of the macro variables of consumption. the confidence index may capture certain factors, which either cannot be measured by any other indicators or are only reflected in such with a lag, but which may nonetheless play a role in consumption decisions. in this analysis, i begin by looking at whether the questions of the confidence index are reliable measures of the related variables and the various macro indicators of consumption and its sub-components. Following this, i examine the composite indices derived from the questions to find the one with the best explanatory and forecasting power. Finally, i attempt to identify the macro variables that explain the movements of the confidence indicator, and seek an explanation for the recent divergence between consumption and the confidence index. mnb bulletin • march 2010 6 Household consumption constitutes two thirds of GDP in Hungary. Accordingly, in addition to influencing expected economic growth, consumption plays a prominent role in shaping pricing behaviour. Consequently, understanding and forecasting the consumption processes as precisely as possible can be of key importance to the operations of the central bank. The consumer confidence index, which has the earliest release date of all indicators measuring the consumption behaviour of households, may help achieve this goal. In this article, I examine what the confidence index measures, what makes it closely related to developments in consumption, and to what extent it can be used in forecasting those developments. It is found that the confidence index is reasonably good at explaining variables such as household income, the economic situation of the country, unemployment and developments in inflation, but that it tends to track these variables, rather than forecast them. However, questions related to these variables are incapable of fully grasping consumption decisions. Use of composite indicators derived from the questions with the best explanatory power may contribute to the explanation of certain sub- indicators, but even this fails to significantly improve the precision of short-term forecasts. In addition to the current economic situation, the index also reflects the effect of political cycles. Katalin Bodnár: Household consumption expenditures and the consumer confidence index* * The views expressed in this article are those of the author(s) and do not necessarily reflect the offical view ot the Magyar Nemzeti Bank. Chart 1 Annual growth of consumption expenditures and retail sales vs. developments in the GKI confidence index –20 –15 –10 –5 0 5 10 15 96 Q1 96 Q3 97 Q1 97 Q3 98 Q1 98 Q3 99 Q1 99 Q3 00 Q1 00 Q3 01 Q1 01 Q3 02 Q1 02 Q3 03 Q1 03 Q3 04 Q1 04 Q3 05 Q1 05 Q3 06 Q1 06 Q3 07 Q1 07 Q3 08 Q1 08 Q3 09 Q1 09 Q3 Year-on-year growth rate, % –70 –60 –50 –40 –30 –20 –10 0 Balance Retail sales Household consumption expenditure GKI confidence index (right-hand scale)
-
Upload
independent -
Category
Documents
-
view
1 -
download
0
Transcript of Household consumption expenditures and the consumer confidence index
InTroDuCTIon
in October 2008, the consumer confidence index – an indicator gauging the sentiment of domestic households – fell sharply as the financial crisis reached hungary. the confidence index reached a historical low in april 2009, before returning to pre-crisis levels by december. Simultaneously, the macro indicators of consumption have followed a downward trajectory in recent quarters, suggesting that developments in consumption expenditures do not reflect the improvement in households’ sentiment (see chart 1). the magnitude of divergence between the two indicators has been unprecedented (the two indicators did not move in opposite directions even in the second half of 2006, when consumption only partly reflected the sharp decline in the confidence index).
the consumer confidence index is one of the earliest published indicators and is thus used in our short-term consumption forecasting models. consequently, it is important to carefully examine whether the questions designed to gauge the confidence of households are reliable measures of the relevant variables, and whether the various composite indicators provide a good forecast of the macro variables of consumption. the confidence index may capture certain factors, which either cannot be measured by any other indicators or are only reflected in such with a lag, but which may nonetheless play a role in consumption decisions.
in this analysis, i begin by looking at whether the questions of the confidence index are reliable measures of the related variables and the various macro indicators of consumption and its sub-components. Following this, i examine the composite indices derived from the questions to find the one with the best explanatory and forecasting power. Finally, i attempt to identify the macro variables that explain the movements of the confidence indicator, and seek an explanation for the recent divergence between consumption and the confidence index.
mnb bulletin • march 20106
Household consumption constitutes two thirds of GDP in Hungary. Accordingly, in addition to influencing expected economic growth, consumption plays a prominent role in shaping pricing behaviour. Consequently, understanding and forecasting the consumption processes as precisely as possible can be of key importance to the operations of the central bank. The consumer confidence index, which has the earliest release date of all indicators measuring the consumption behaviour of households, may help achieve this goal. In this article, I examine what the confidence index measures, what makes it closely related to developments in consumption, and to what extent it can be used in forecasting those developments. It is found that the confidence index is reasonably good at explaining variables such as household income, the economic situation of the country, unemployment and developments in inflation, but that it tends to track these variables, rather than forecast them. However, questions related to these variables are incapable of fully grasping consumption decisions. Use of composite indicators derived from the questions with the best explanatory power may contribute to the explanation of certain sub-indicators, but even this fails to significantly improve the precision of short-term forecasts. In addition to the current economic situation, the index also reflects the effect of political cycles.
Katalin Bodnár: Household consumption expenditures and the consumer confidence index*
*Theviewsexpressedinthisarticlearethoseoftheauthor(s)anddonotnecessarilyreflecttheofficalviewottheMagyarNemzetiBank.
Chart 1
Annual growth of consumption expenditures and retail sales vs. developments in the GKI confidence index
–20
–15
–10
–5
0
5
10
15
96 Q
196
Q3
97 Q
197
Q3
98 Q
198
Q3
99 Q
199
Q3
00 Q
100
Q3
01 Q
101
Q3
02 Q
102
Q3
03 Q
103
Q3
04 Q
104
Q3
05 Q
105
Q3
06 Q
106
Q3
07 Q
107
Q3
08 Q
108
Q3
09 Q
109
Q3
Year-on-year growth rate, %
–70
–60
–50
–40
–30
–20
–10
0Balance
Retail salesHousehold consumption expenditure
GKI confidence index (right-hand scale)

mnb bulletin • march 2010 7
hOuSehOld cOnSumPtiOn exPenditureS and the cOnSumer cOnFidence...
poSSIBlE ExplAnATIonS For THE Co-MovEMEnT oF THE ConFIDEnCE InDEx AnD ConSuMpTIon
there are several potential explanations for the co-movement between the confidence index and consumption. these can be summarised (cf. Fuhrer, 1993; carroll et al., 1994; ludvigson, 2004; Wilcox, 2008; and Jonsson and lindén, 2009) as follows:
i. regardless of actual changes in income and income expectations, changes in confidence cause changes in consumption. One of the channels of this phenomenon is when, assuming a constant level of income, an increase in confidence (for example, due to a decline in uncertainty anticipated by households) moderates precautionary savings considerations1 and thereby increases actual consumption. in other words, the independent explanatory power of confidence is consistent with a higher degree of consumer ’myopia’, which results in a closer correlation between actual income and consumption (as opposed to the path to be expected from the permanent income hypothesis2).
ii. the confidence index merely measures or forecasts something that causes changes in consumption. this could be
1) the current macroeconomic situation. to the extent that the confidence index simply reflects the current macroeconomic situation, the macro variables and the related questions of the confidence index survey move in tandem, and the confidence index does not have any additional explanatory power with respect to the macro variables. however, if it does give a forecast, it may have additional explanatory power in the short term.
2) households’ specific perceptions or expectations of changes in the macroeconomic situation. households may assess past or expected shocks differently than economists, which may be reflected in their consumption decisions. this is difficult to decipher in macroeconomic variables. a possible reason for this phenomenon is the heterogeneity of the population: if the groups affected differently by macroeconomic shocks exhibit different consumption
behaviour, the confidence index may help to understand consumption changes. according to a hypothesis of Wilcox (2008), the confidence index survey may also reflect the expected effects of shocks, in relation to which no information is available on past experiences. if this assumption holds, households’ responses to macro-oriented questions do not move in conjunction with the variables measured by such questions (such as GdP, consumer price index), but may still help to understand or forecast consumption expenditures.
3) developments in actual consumption expenditures. even though consumers may not be well-informed about the current macroeconomic situation, they probably have a much better grasp of the changes in their own consumption expenditures. consequently (provided that the respondents statistically represent households in the economy), we may assume that there is a relationship between the balance of responses to micro-oriented questions and aggregate consumption. based on this hypothesis, micro-oriented questions may prove to be more helpful in explaining and forecasting consumption expenditures.
the approaches referred to above are not entirely mutually exclusive; thus the confidence index may simultaneously measure current developments in macro variables and actual changes in consumption expenditures. however, one common aspect of each approach is that while the confidence index may be used for a short-term forecast of consumption, it is not expected to determine households’ long-term decisions.
THE GKI ConSuMEr ConFIDEnCE InDEx
in this article, i draw on the results of the confidence index survey conducted by GKi Gazdaságkutató Zrt.,3 which has been available since 1993 and is published by the european commission. the survey is based on a harmonised methodology used across the european union, and consists of 12 monthly questions and 3 quarterly questions, whereby the available time series for the latter is shorter. the questions and the reply options are listed in annex 1.4 the survey is currently conducted by phone with a sample size of 1,000 persons.5
1Precautionarysavingsaregeneratedwhenconsumersreducetheirconsumptionbysavingaportionoftheirincometocoverfuturerisks.2Fordetailsonthepermanentincomehypothesissee,forexample,JakabM.andVadas(2001).3Whileseveralconfidencesurveyscoverdomestichouseholds,duetothelongeravailabletimeseriesandthepossibilityofinternationalcomparison,MNBusesthe
GKIindex.4Further details on the survey can be found on the websites of the European Commission and GKI (http://ec.europa.eu/economy_finance/db_indicators/surveys/
index_en.htm,http://www.gki.hu/hu/konjunkturakutatas/methodology.html).5Thesamplesizewas1,000before2002,1,500between1January2002and31December2008,and1,000onceagainfrom2009on.

maGYar nemZeti banK
mnb bulletin • march 20108
Of the monthly questions, five are related to micro-level decisions or expectations (i.e. individual consumption and saving decisions of households), while seven questions cover a specific macroeconomic process (the economic situation of the country, inflation, unemployment, the reasonability of saving and purchasing durables). Six questions are retrospective or refer to the present time, while six questions refer to the 12 months following the survey. Quarterly questions are forward-looking and refer to micro-level decisions (real estate purchase or construction, home improvement expenditures, motor vehicle purchase). the questions have 3, 4 or 5 possible answers, which are balanced, i.e. they are “distanced” equally from one another (tóth, 2002; european commission, 2007). most reply options are symmetrical (e.g. got a lot worse/got a little worse/remained the same/got a little better/got a lot better), except question 5 and question 6, which enquire about the extent of the consumer price increase.
individual responses are aggregated by means of balances, which are calculated by using the following equation:
Balance = ratio of very positive replies + 0.5* ratio of slightly positive replies – 0.5* ratio of slightly negative replies – ratio of very negative replies.
(except in the case of question 8, which has one positive, one neutral and one negative reply option only).
thus, the weight of the very positive (negative) and slightly positive (negative) replies relative to one another is different in the balance indicator. as respondents make their assessment on the basis of a subjective scale, this solution is ambiguous: we have no way of knowing how a very negative reply of a respondent relates to the same respondent’s slightly negative expectation or to the very negative reply of another household. however, this balance calculation is an attribute that we cannot deviate from. an important consequence of the formula applied in the calculation of the equation is the fact that a decline in the ratio of very negative replies and a simultaneous increase in the ratio of slightly negative replies
will translate into improvement in the confidence index. if the same weight was applied to the ratio of very negative and slightly negative replies, the case would be different.
Of the fifteen questions, only four are included in the composite index (before 2002 the index was constructed from the balance indicator of five, partially different questions), with the same weight. these four questions are the same for all countries covered by the survey. With respect to domestic data, however, Vadas (2001) found that a composite index with a different composition performs better in forecast models. the range of questions used in the aggregated indices is shown in table 1.
chart 2 shows the developments in the confidence indices of the mnb and GKi. the index noticeably tracks political cycles and responds to more severe macroeconomic shocks. in addition, the movements of the two composite indices are evidently similar. On the one hand, this is due to the fact that they are partly composed of the same questions, while on the other hand, it should be noted that all questions of the confidence index are closely correlated, and thus the path of the composite indices derived from such does not exhibit significant differences either.
GKI before 2002 GKI from 2002 MnB
Q1:household’sfinancialsituation,past Q2:household’sfinancialsituation,expected Q3:country’seconomicsituation,past
Q2:household’sfinancialsituation,expected Q4:country’seconomicsituation,expected Q4:country’seconomicsituation,expected
Q3:country’seconomicsituation,past Q7:unemployment,expected Q5:costofliving,past
Q4:country’seconomicsituation,expected Q11:savings,expected Q7:unemployment,expected
Q8:high-valueconsumergoods,present
Table 1 The GKI and the MnB composite indices
Chart 2
GKI and MnB composite indices, political cycles and larger macroeconomic shocks
–70
–60
–50
–40
–30
–20
–10
0
10
93 Q
193
Q3
94 Q
194
Q3
95 Q
195
Q3
96 Q
196
Q3
97 Q
197
Q3
98 Q
198
Q3
99 Q
199
Q3
00 Q
100
Q3
01 Q
101
Q3
02 Q
102
Q3
03 Q
103
Q3
04 Q
104
Q3
05 Q
105
Q3
06 Q
106
Q3
07 Q
107
Q3
08 Q
108
Q3
09 Q
109
Q3
Balance
–70
–60
–50
–40
–30
–20
–10
0
10Balance
MNB composite indicator GKI composite indicator
Bokros package
1994 elections
1998 elections
2002 elections
2006 elections
Gyurcsány package
Financial crisis

mnb bulletin • march 2010 9
hOuSehOld cOnSumPtiOn exPenditureS and the cOnSumer cOnFidence...
EMpIrICAl rESulTS
in the empirical analysis, i first examine whether the individual questions are good measures of the variables to which they refer. next, i explain and forecast consumption and its sub-components using the individual questions as explanatory variables, and subsequently on the various composite indices. Finally, reversing the direction of the analysis, i attempt to explain changes in the confidence index by means of macro variables.
i measure consumption and its sub-components with a number of variables. i examine both the consumption and final consumption of households. although the category directly predicted by the econometric models is the consumption expenditures of households, a longer time series is available for studying final consumption – which also includes the consumption of non-profit institutions serving households as well as government transfers – and the same time series allows for comparability with the findings of Vadas (2001). in addition, i also examine the specific sub-components of consumption expenditures:
retail sales, which account for a significant part of trade in goods; durable sales6 and new motor vehicle purchases. i use real disposable income to approximate the income of households, while financial worth is measured by the stock of financial assets. Since the time horizon of the questions is one year, the estimates include the annual growth rate of the examined macro variables, while in the case of confidence index variables i use their actual levels (unless indicated otherwise). the data used are quarterly data pertaining to the period between 1993 Q1 and 2009 Q4 (certain time series are only available for a shorter period of time). the description of the data is included in annex 2.
InDIvIDuAl ExplAnATory powEr oF InDIvIDuAl quESTIonS
One factor in the relationship between the confidence index and the macro indicators of consumption is whether the individual questions measure the variables to which they refer correctly. therefore, it is expedient to begin an examination with these relationships. table 2 indicates the
6Durablesincludefurnitureandmechanicalequipmentsales,aswellasmotorvehicleandvehiclepartssalesfromthestatisticsofretailsales.
Table 2 Explanatory power of specific questions
question of the confidence index survey Macro variable regressions Cross correlation
Q1:Pastfinancialsituationofthehousehold Realnetwagebill contemporaneous contemporaneous
Q2:Futurefinancialsituationofthehousehold Realnetwagebill contemporaneous,T-1 contemporaneous
Q3:Pasteconomicsituationoftheeconomy GDPgrowth contemporaneous contemporaneous
Q4:Futureeconomicsituationoftheeconomy GDPgrowth contemporaneous contemporaneous
Q5:Pastdevelopmentsinconsumerprices CPI,coreinflation contemporaneous,T-1 contemporaneous
Q6:Futuredevelopmentsinconsumerprices CPI,coreinflation contemporaneous,T-1 T-1(coreinflation),T-2(CPI)
Q7:Futuredevelopmentsinunemployment Changesinunemployment contemporaneous,T-1 contemporaneous
Q8:Isitworthspendingonhigh-valueconsumergoods? Retailanddurablesales - -
Q9:Doyouplantobuyhigh-valueconsumergoodsinthefuture? Retailanddurablesales contemporaneous contemporaneous
Q10:Isthisagoodorbadtimeforsaving? Grossfinancialsavings - -
Q11:Whatistheprobabilityofyourbeingabletosavemoneyinthenext12months?
Grossfinancialsavings - -
Q12:FinancialsituationofhouseholdRealnetwagebill,net
financialsavingscontemporaneous,T-1,T-2
(netsavings)contemporaneous(realnet
wagebill)
Q13:PlanstopurchaseamotorvehiclewithinayearNewcarsales,totalcar
sales- -
Q14:Planstopurchaseahomeoraflatortobuildahousewithinayear
Housinginvestment contemporaneous T-1
Q15:Planstospendasubstantialamountonhomeimprovementwithinthenexttwoyears
Retailanddurablesales - -
Note: the third column shows which lag of the confidence index question proved to be significant in the estimated equations, while the fourth column shows with which lag of the confidence index question the explained variable exhibits the strongest correlation (e.g. T-1 indicates the one-period-lagged value).
maGYar nemZeti banK
mnb bulletin • march 201010
macro variables which are directly comparable to individual questions.
in this analysis, i prepare estimates, the statistics of which are appropriate, and include the contemporaneous or lagged values of a specific question as an explanatory variable, the lagged values of the interpreted variable and/or a lagged income or asset indicator. in addition, using cross correlations7 i also examine the degree of co-movement between the questions of the confidence index and the related macro variable. the main difference between the two approaches is that the cross correlation coefficient reflects the unconditional relationship between two variables, while regressions are used to examine their conditional relationship (in other words, in case of the latter we examine the degree of correlation between two variables if other factors are unchanged). neither method, however, is suitable for the examination of a cause and effect relationship.
based on the regressions and the cross correlations, i find co-movement in the case of questions related to the financial situation and net saving position of households, as well as to consumer prices, unemployment rate and the economic situation of the country (see table 2; detailed results of the estimates are presented in annex 3). as a surprising result, i found that questions related to consumption decisions did not perform very well. While i found explanatory power in the case of the contemporaneous term regarding the question about future spending on durable goods, the retrospective question and the question related to major home improvement expenditures lack explanatory power. in the case of the questions related to housing investment, the one-period-lagged value of the confidence index question exhibited the strongest correlation with the data; however, in the equations the estimated coefficient of the contemporaneous term proved to be significant. the latter equations, however, are rather unstable.
Overall, based on the survey it appears that, in the case of macro variables (such as the economic situation of the country, inflation, unemployment), domestic households answer the relevant questions correctly, and the questions related to their own financial situation also exhibit a strong correlation with the measured income variable. however, we cannot find convincing results for consumption – saving decisions. this suggests that the replies to the questions of
the confidence index react to changes in the macroeconomic situation and measure those changes the best, while questions related to specific consumption items do not perform well.
InDIvIDuAl quESTIonS vS. ConSuMpTIon InDICES
the second step of the examination is to identify the individual questions which have the strongest connection with the five consumption indices listed above. For this i estimate the following equations:
(1)
εγα ++= −=
∑ jtj
jt ZY2
1
(2) εγβα +++= −
==− ∑∑ jt
jj
i
kitjt ZCCIY
2
1
2
0
where Y is the consumption variable to be explained, vector Z contains the one and two-period-lagged values of the explained variable and that of real income and net financial assets, and CCIk is the kth question of the confidence index. the equation contains the latter’s contemporaneous term, as well as its one-period-lagged term and two-period-lagged term.8 the explanatory power of specific questions is demonstrated by the difference between the explanatory power9 of equations (2) and (1), and by the joint significance of the confidence index questions’ coefficients (see table 3).
based on this exercise, i find that the best performers of the confidence index questions are questions 3, 4 and 7: for most consumption variables these questions had additional explanatory power relative to the macro variables. in other words, the best questions to measure the factors affecting the consumption decisions of households are those related to the economic situation of the country and the expected changes in unemployment. Of these, expected changes in unemployment generate the strongest increase in the explanatory power in the case of equations measuring specific variables. these results are consistent with the findings of Vadas (2001), the only exception being the balance indicator of question 5 (past developments in consumer prices) which, in the current analysis, did not prove significant in the equations. in the case of durables
7Thecrosscorrelationexaminesthecorrelationbetweendifferentlaggedandleadingvaluesofthevariables.8I have also estimated another equation form, which contained values with a lag of 1-4 periods; however, lag 3 and lag 4 were never significant, while the
contemporaneousbalanceindicatoroftenexhibitedthestrongestcrosscorrelation.Anotherreasonforkeepingthecontemporaneoustermintheequationisthefactthatthisinformationisreleasedtheearliest.
9Theexplanatorypower ismeasuredbytheadjustedR2 index.TheR2 indexindicatestheproportionofvariability inthedependentvariableaccountedforbytheestimatedequation.TheadjustedR2modifiesthisindicatorbythenumberofvariableswithnosignificantexplanatorypower.

mnb bulletin • march 2010 11
hOuSehOld cOnSumPtiOn exPenditureS and the cOnSumer cOnFidence...
and retail sales, question 12 – which measures the financial position of households – was also able to increase the explanatory power.
CoMpoSITE InDICES AnD ConSuMpTIon
While the individual questions are rather useful in their own right, they merely ask about one consumption item or one factor affecting consumption; therefore, more information can be gained by combining the different
questions. although the correlation of balance indicators received for individual questions is quite high, there may be substantial differences in their explanatory power.
in this analysis, i compare the explanatory and forecasting power of 9 composite indices. in addition to the (GKi) index released by the european commission which combines 4 questions, we also draw on the (mnb) index, the calculation of which is based on the findings in Vadas (2001). however, based on the examination described above, we concluded that past developments in the costs of
FInAl ConSuMpTIonConSuMpTIon ExpEnDITurES
nEw CAr SAlESDurABlES
ConSuMpTIonrETAIl SAlES
Q10.00 0.00 0.04 0.00 0.00
(0.08) (0.20) (0.01) (0.26) (0.12)
Q20.00 0.00 0.01 0.01 0.00
(0.05) (0.30) (0.11) (0.10) (0.36)
Q30.01 0.00 0.01 0.01 0.01
(0.00) (0.24) (0.13) (0.04) (0.03)
Q40.01 0.00 0.02 0.02 0.01
(0.00) (0.19) (0.10) (0.02) (0.04)
Q50.00 0.00 0.01 0.00 –0.01
(0.33) (0.49) (0.12) (0.58) (0.60)
Q60.00 0.00 –0.01 0.00 –0.01
(0.05) (0.47) (0.83) (0.28) (0.80)
Q70.02 0.01 0.02 0.01 0.01
(0.00) (0.07) (0.07) (0.06) (0.06)
Q80.01 0.00 0.01 0.02 0.00
(0.03) (0.28) (0.19) (0.14) (0.17)
Q90.00 0.00 0.01 0.01 –0.01
(0.14) (0.34) (0.14) (0.22) (0.75)
Q100.00 0.00 –0.01 0.01 –0.01
(0.14) (0.91) (0.70) (0.14) (0.40)
Q110.00 0.00 0.01 0.01 –0.01
(0.32) (0.16) (0.21) (0.45) (0.88)
Q120.01 0.00 0.01 0.02 0.02
(0.00) (0.13) (0.21) (0.01) (0.03)
Q130.00 0.02 0.08 0.00 0.02
(0.34) (0.38) (0.06) (0.39) (0.51)
Q140.00 0.02 0.07 0.00 0.01
(0.76) (0.52) (0.10) (0.26) (0.76)
Q150.00 0.02 0.08 –0.01 0.02
(0.51) (0.35) (0.03) (0.62) (0.23)
Table 3 Explanatory power of specific questions in respect of macro indicators of consumption
Note: the numbers in the table indicate the difference between the adjusted R2 of the equations including both macro variables and confidence index questions and equations including only the confidence indices. The p-values of the F-tests measuring the joint significance of confidence index questions are presented in parentheses. Cells with bold numbers indicate that the coefficients of the confidence index proved to be jointly significant.
maGYar nemZeti banK
mnb bulletin • march 201012
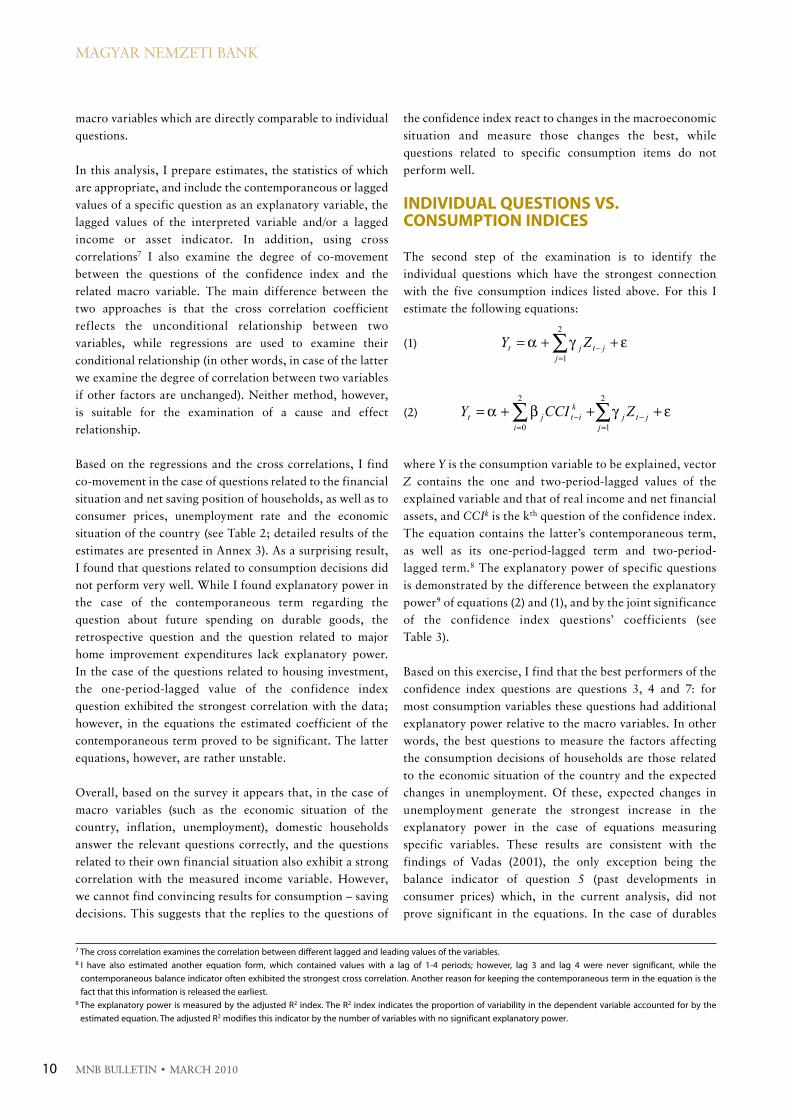
living should not be included here, and thus i exclude this item from my analysis of the efficiency of the composite index (mnbJ). Jonsson and lindén (2009) examined every possible combination of all the questions of the consumer confidence indicator survey for all eu member States, and they identified the best-performing combination both for hungary (huOPt) and for the eu as a whole (euOPt). moreover, i also examine how the composite indices containing exclusively micro-oriented questions (micrO) and those containing exclusively macro-oriented questions (macrO) perform relative to one another, even though on the basis of the previous section it may be assumed that micro-oriented questions do not have significant explanatory power. Finally, a composite index may be compiled from forward-looking questions (Future), as well as questions referring to the past and the present (PreS). examining their explanatory power in pairs and relative to the other indices may yield important information. the composition of specific composite indicators is presented in table 4.
the estimates are identical with those described in the previous analysis, with the exception that instead of individual questions the equations now include the composite indices. First, i examine the extent to which the composite index and its lagged values account for the variance in the macro indicators of consumption in their own right. this test (chart 3) suggests that each composite index explains a significant part of the variance of consumption; however, the GKi index and the two mnb
indices perform the best. the worst-performing indices are those that include questions pertaining to the present and the one that was found best for hungary by Jonsson and lindén (2009). based on the pair-comparison, macro-oriented questions perform better than micro-oriented ones, forward-looking questions are better than retrospective ones; however, the explanatory power of the index found optimal for hungary by Jonsson and lindén (2009) is lower
Table 4 Calculation of the composite indices tested in the study
MnB MnBJ GKI MAKro MIKro FuTurE prES EuopT HuopT
Financialpositionofthehousehold
X X
Expectedfinancialpositionofthehousehold
X X X X
Economicsituationoftheeconomy
X X X X X X
Expectedeconomicsituationoftheeconomy
X X X X X
Inflation,past* X X X
Inflation,future* X X X
Expectedunemployment* X X X X X
Durablepurchase,present X X X
Durablepurchase,future X X X
Savings,present X X
Savings,future X X X
Financialwealthofthehousehold
X X
* Questions 5, 6 and 7 are included in the composite indices with a negative sign, as an increase in the balance indicator in their case points to a deterioration of the factors determining consumption.
Chart 3
Explanatory power of composite indices
0
10
20
30
40
50
60
70
80
90
Final consumption
Consumption expenditures
New car sales
Durable goods
Retail sales
MNB MNBJ GKI MAKRO MIKROFUTURE PRES EUOPT HUOPT
Per cent
Note: the chart indicates the adjusted R2 of the estimated equations. According to the F-tests, the joint coefficients of the composite indices were significant in all equations.
mnb bulletin • march 2010 13
hOuSehOld cOnSumPtiOn exPenditureS and the cOnSumer cOnFidence...
than that of the one found optimal for the eu. at the same time, none of these specific indices was able to outperform the mnb and GKi indices.
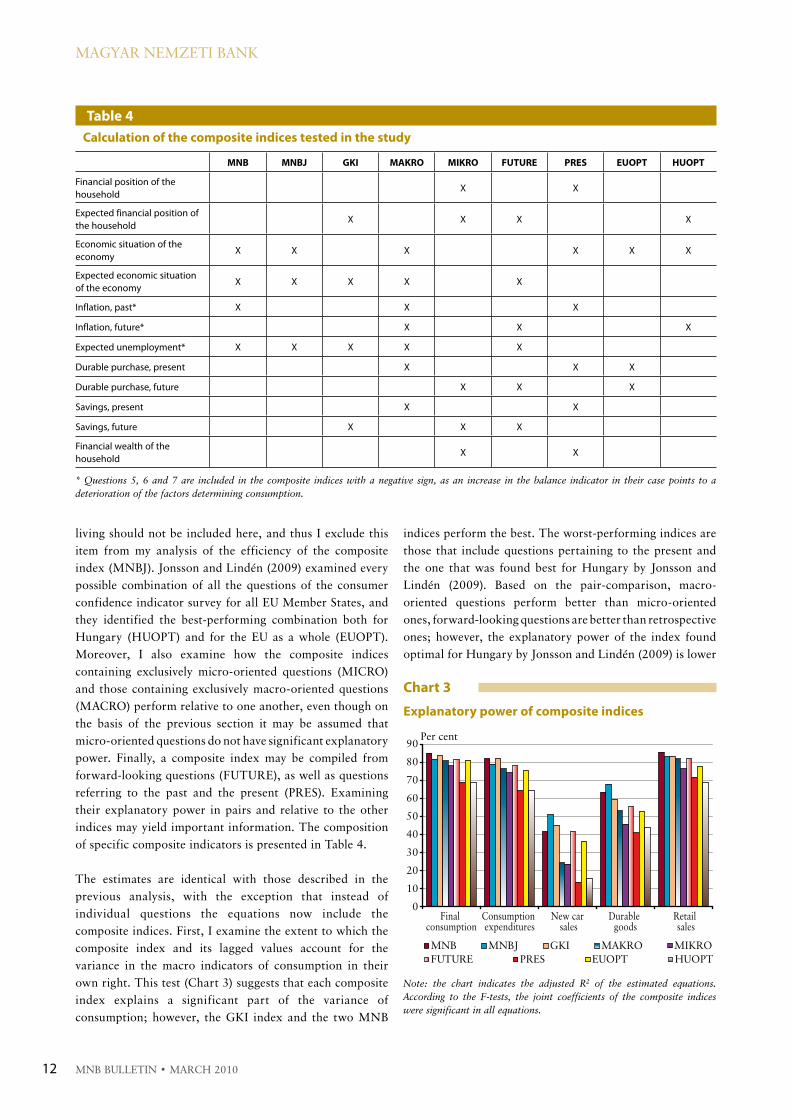
next, based on the methodology described in the previous Section, i examine the extent to which the models including the composite index as well as the macro variables generate incremental explanatory power relative to the models including macro variables only (table 5). While none of the composite indices generated a significant increase in the explanatory power, the mnbJ index – which was derived from the three best-performing questions listed in the previous section – proved to be significant in the case of four of the examined consumption variables, and slightly improved the explanatory power. in addition, the mnb and GKi indices also contributed to the explanation of certain consumption categories. apart from this, only the equation explaining car sales was found to have been improved by the PreS index and the euOPt index, which includes the question about the current financial situation of households and plans for purchasing durable goods, respectively. among the main consumption variables, the composite indices contribute to improving the explanatory power primarily in the case of final consumption, which may be partly ascribed to the fact that social benefits in kind granted by the
government tend to move in tandem with political cycles. accordingly, final consumption, which includes this item, exhibits a closer relationship with the confidence index, and both of them are tangibly influenced by general elections.
For the same nine composite indices, it is a useful exercise to examine the extent to which they can improve the short-term forecasting of variables measuring consumption. this can be revealed by the difference between the forecast errors of the two equations shown above (equations [1] and [2]), i.e. the equation that includes macro variables only, and the one that also includes composite indices.10 as was the case previously, the equations incorporate annual growth rates.11
chart 4 shows the results of the one-quarter and three-quarter rolling forecasts. as illustrated in the chart, the incorporation of confidence indices in the forecast equations does not contribute materially to the accuracy of the forecast: in fact, it often weakens the accuracy of the equations that include macro variables only. it is important to note, that in the period under review (2005–2009) the largest deterioration was observed close to the time of the elections in 2006 for nearly all composite indices in general and in particular for the variables measuring total
Table 5 Additional explanatory power of composite indices vs. equations including macro variables only
Note: the numbers in the cells of the table indicate the difference between adjusted R2 indices of the equations containing both macro variables and confidence index questions and equations containing only the macro variables. The p-values of the F-tests measuring the joint significance of composite indices are presented in parentheses. Cells with bold numbers indicate that the coefficients of the confidence index proved to be jointly significant.
MnB MnBJ GKI MAKro MIKro FuTurE prES EuopT HuopT
Finalconsumption0.00 0.01 0.01 0.00 0.00 0.00 0.00 0.00 0.00
(0.17) (0.02) (0.07) (0.27) (0.26) (0.21) (0.40) (0.20) (0.38)
Consumptionexpenditures
0.00 0.00 0.00 0.00 0.00 0.00 0.00 0.00 0.00
(0.33) (0.14) (0.17) (0.38) (0.22) (0.33) (0.36) (0.19) (0.45)
Newcarsales0.02 0.02 0.01 0.01 0.01 0.01 0.02 0.02 0.00
(0.09) (0.06) (0.13) (0.15) (0.11) (0.21) (0.06) (0.08) (0.29)
Durablesconsumption0.01 0.02 0.01 0.01 0.01 0.01 0.01 0.01 0.01
(0.06) (0.05) (0.11) (0.13) (0.16) (0.09) (0.17) (0.20) (0.11)
Retailsales0.01 0.01 0.00 0.00 0.00 0.00 0.00 0.00 0.00
(0.11) (0.05) (0.30) (0.30) (0.67) (0.46) (0.32) (0.32) (0.40)
10Theforecastwasestimatedout-of-sample,i.e.theequationestimatingtheforecastdidnotincludetheforecastperiod.Asafirststep,Iestimatetheequationfortheperiodbetween1993Q1and2004Q4,andthenpreparedaforecastfor2005Q1.Next,theestimationsampleissupplementedbydatapertainingto2005Q1,andtheequationestimatedonthisbasisisusedtoprepareaforecastfor2005Q2.Thesameexerciseisperformedforalldatesupto2009Q3.Theforecasterrorcanbemeasured by the RMSE index.The RMSE (root mean squared error) index is calculated on the basis of the following formula:
( )∑+
+=
−hT
1Tt
2tt h/yy
, where ^yt is theestimatedvalueofthevariableyt,andperiodsT+1,....T+hindicatetheestimationperiod.Accordingly,inthecaseofaquarterlyforecasttheRMSEistheabsolutevalueofthedifferencebetweentheforecastandtheactualvalue.
11Takingaccountoftheforecastmodels,Ihaveperformedthesametestforthevariablesexpressedindlogformat,withsimilarresults.

maGYar nemZeti banK
mnb bulletin • march 201014
consumption (with further deterioration observed in 2009 Q3). during these periods the forecast prepared on the basis of the composite index overestimated the actual value of the consumption variables, and the extent of the overestimation surpassed that of the equations including only macro variables. at the same time, it is also interesting that the confidence index improved forecast accuracy the most in the one or two quarters following the default of lehman brothers (September 2008, after which the financial turmoil reached hungary); in other words, this is when it exhibited the most substantial additional information content.
Overall, confidence indices have not contributed significantly to forecasting the specific variables of consumption in the past 5 years. in most cases, the GKi index and the two mnb indices performed the best again, and of these indices the revised mnb composite index often outperformed the others. regarding the variables, the composite index can be best employed for forecasting the total consumption expenditures of households. the predictive power of the indices can already be improved for a forecast three quarters ahead. however, the results depend on the period under review.
ExplAInInG MovEMEnTS In THE CoMpoSITE InDEx
in the final part of the analysis, i attempt to explain the movements of the composite confidence index. this may help explore why the confidence index has recently departed from the path of the consumption variables. For the explanation of the composite index i used the contemporaneous values of real disposable income, unemployment and the consumer price index,12 and introduced dummy variables to indicate the quarter of the elections as well as the quarters before and after elections.13 the latter was introduced because – as indicated in chart 1 – prior to political elections the composite index tends to improve significantly, while its forecasting power deteriorates; thus we may assume that even though expectations improve, consumption decisions do not fully reflect this improvement.
the results of this analysis and the effects calculated on the basis of the estimated equation are shown in chart 5. among the examined variables, the primary determinants are real income and the date of political elections. i find that
Chart 4
Additional forecasting power of specific composite indices
–2.0
–1.5
–1.0
–0.5
0.0
0.5
1.0
1.5
MN
BJ
GK
IM
NB
FUT
UR
EM
IKR
OJL
HU
MA
KR
OJL
EU
PRE
S
MN
BJ
GK
IM
IKR
OM
NB
FUT
UR
EJL
HU
PRE
SJL
EU
MA
KR
O
MN
BJ
MN
BPR
ES
GK
IJL
EU
MIK
RO
JLH
UM
AK
RO
FUT
UR
E
MIK
RO
PRE
SJL
EU
MN
BM
AK
RO
FUT
UR
EG
KI
MN
BJ
JLH
U
MN
BJ
MN
BJL
HU
GK
IPR
ES
JLE
UM
AK
RO
FUT
UR
EM
IKR
OFinal
consumptionConsumption expenditures
New car sales
Durablegoods
Retailsales
–2.0
–1.5
–1.0
–0.5
0.0
0.5
1.0
1.5
1 quarter 3 quarters
Note: the Chart indicates changes in the RMSE between the equation including the composite indices as well as macro variables and the equation including only macro variables. A positive figure indicates that the composite index improves the accuracy of the forecast, while a negative figure indicates that it deteriorates it. The calculations are based on a cumulative out-of-sample forecast for the period between 2005 Q1 and 2009 Q3.
12IhavealsoattemptedtouseGDPandtherealnetwagebillinsteadofdisposableincome.However,theseitemsprovedtobelessappropriate.13Dummyvariablesarethosevariableswhichcanonlytakeavalueof0or1.
Chart 5
Estimated effect of macro variables and the date of political elections on the MnB composite index
–50–40–30–20–10
01020304050
95 Q
295
Q4
96 Q
296
Q4
97 Q
297
Q4
98 Q
298
Q4
99 Q
299
Q4
00 Q
200
Q4
01 Q
201
Q4
02 Q
202
Q4
03 Q
203
Q4
04 Q
204
Q4
05 Q
205
Q4
06 Q
206
Q4
07 Q
207
Q4
08 Q
208
Q4
09 Q
2
Balance
–50–40–30–20–10
01020304050
Balance
Third quarter after election (dummy)Second quarter after election (dummy)
Quarter after election (dummy)Quarter of election (dummy)
Quarter prior to election (dummy)Second quarter prior to election (dummy)
CPIUnemployment
IncomeMNB index*
Estimated MNB index*
Note: the estimated constant term was deducted from the actual index and the estimated index shown in the Chart.

mnb bulletin • march 2010 15
hOuSehOld cOnSumPtiOn exPenditureS and the cOnSumer cOnFidence...
confidence improves significantly in the quarter preceding the elections and continues to improve in the following three quarters as well, but the most pronounced effect is observed during the quarter of the elections.
On the basis of the above analysis, i was unable to prove that the departure of the confidence index from consumption in 2009 Q3 resulted from the elections. indeed, in the estimated equations the elections only influence confidence in the two quarters preceding the elections. On the other hand, this may have been the driving force behind the further departure observed in 2009 Q4. according to the indices available (such as retail sales), consumption declined significantly in Q4, while the already released confidence index data pointed to a further improvement in consumer sentiment.
a phenomenon referred by al-eyd et al. (2008) could offer an alternative explanation: at times of tighter liquidity constraints, the confidence index and consumption expenditures may deviate from one another. liquidity constraints (declining wages, rising lending rates, contracting credit supply) – which have been strengthening since autumn 2008 and still appear unrelenting – may have contributed to the opposing developments in consumption and the confidence index.
ConCluSIonS
in this article, i examined the explanatory as well as the forecasting power of the consumer confidence index, and also attempted to explain the confidence index by different factors. based on the examination of individual questions, i arrived at the conclusion that they perform best in explaining the income of households and macro variables, while the questions and the macro variables did not exhibit a close relationship when it came to the consumption and saving decisions of households. correlation and explanatory power appeared the strongest with contemporaneous terms. total consumption as well as its components can be best explained by macro-oriented questions, i.e. those enquiring about the past and future economic situation of the country and unemployment. this may suggest that the confidence index primarily reacts to and reflects the current macro situation, but is less suitable for forecasting it.
in the second part of the analysis, i attempted to estimate the variables measuring consumption using different composite indices. based on this exercise, i found that all the composite indices could in themselves account for a large part of the volatility of macro variables, but when the macro variables were also included in the estimation, the
confidence indices had very little additional explanatory power. in terms of total and additional explanatory power, the index composed of the three individual questions proved to have the strongest explanatory power overall.
data from the past five years indicate that composite indices may have contributed to the accuracy of forecasting consumption indicators, but only to a small extent. at the same time, i found certain periods and certain composite indicators which reduced forecast accuracy. Presumably, including the consumer confidence index – which tends to increase significantly in periods close to political elections – in the equations may result in excessively optimistic consumption forecasts. this assumption is supported by the fact that, in the equations explaining the confidence indices, political cycles appeared to influence changes in the indices significantly: they increased their value during the two quarters preceding, and three quarters following the elections. consequently, this can only partly explain the departure of the confidence index from consumption variables from the second half of 2009. beyond this, strengthening liquidity constraints may have also contributed to the deviation of the variables.
rEFErEnCES
Al-Eyd, Ali, BArrEll, rAy And dAvis, E. PhiliP (2008): Consumer Confidence Indices and Short-Term Forecasting of Consumption, national institute of economic and Social research and brunel university.
CArroll, ChristoPhEr d., FuhrEr, JEFFrEy C. And WilCox, dAvid W. (1994): “does consumer Sentiment Forecast household Spending? if So, Why?” The American Economic Review, Vol. 84. no. 5. pp. 1397-1408.
EuroPEAn Commission dirECtorAtE-GEnErAl For EConomiC And FinAnCiAl AFFAirs (2007): The Joint Harmonised EU Programme of Business and Consumer Surveys, user Guide (updated 4 July 2007).
FurhEr, JEFFrEy C. (1993): “What role does consumer Sentiment Play in the u.S. macroeconomy?” New England Economic Review, January/February 1993.
JAkAB m., Zoltán And vAdAs, GáBor (2001): “Forecasting hungarian household consumption with economic methods”, MNB Background Studies, 2001/1.
Jonsson, AndrEAs And lindén, stAFFAn (2009): “the quest for the best consumer confidence indicator”, European Commission Economic Papers 372.

maGYar nemZeti banK
mnb bulletin • march 201016
ludviGson, sidnEy C. (2004): “consumer confidence and consumer Spending”, Journal of Economic Perspectives, 18:2, pp. 29-50.
tóth, istván János (2002): “business and consumer surveys in hungary”, MNB Working Papers, 2002/1.
vAdAs, GáBor (2001): “beyond macro variables: consumer confidence index and household expenditure in hungary”, MNB Background Studies, 2001/2.
várPAlotAi, viktor (2003): “numerical method for estimating GdP data for hungary”, MNB Working Papers, 2003/2.
WilCox, JAmEs A. (2008): “consumer Sentiment and consumer Spending”, FRBSF Economic Letter, number 2008-19.
AnnEx 1 quESTIonS AnD rEply opTIonS oF THE GKI ConFIDEnCE InDEx SurvEy
Monthly questions
1. How has the financial situation of your household
changed over the last 12 months? It has...
a. got a lot better,b. got a little better,c. stayed the same,d. got a little worse,e. got a lot worse.
2. How do you expect the financial position of your
household to change over the next12 months? It will...
a. get a lot better,b. get a little better,c. stay the same,d. get a little worse,e. get a lot worse.
3. How do you think the general economic situation
in the country has changed over the past 12 months?
It has...
a. got a lot better,b. got a little better,c. stayed the same,d. got a little worse,e. got a lot worse.
4. How do you expect the general economic situation
in this country to develop over the next 12 months? It
will...
a. get a lot better,b. get a little better,c. stay the same,d. get a little worse,e. get a lot worse.
5. How do you think that consumer prices have
developed over the last 12 months? They have…
a. risen a lot,b. risen moderately,c. risen slightly,d. stayed about the same,e. fallen.
6. By comparison with the past 12 months, how do
you expect that consumer prices will develop in the
next 12 months? They will…
a. increase more rapidly,b. increase at the same rate,c. increase at a slower rate,d. stay about the same,e. fall.
7. How do you expect the number of people
unemployed in this country to change over the next
12 months? The number will…
a. increase sharply,b. increase slightly,c. remain the same,d. fall slightly,e. fall sharply.
8. In view of the general economic situation, do you
think that now it is the right moment for people to
make major purchases such as furniture, electrical/
electronic devices, etc.?
a. yes, it is the good moment nowb. it is neither the right moment nor the wrong momentc. no, it is not the right moment now
9. Compared to the past 12 months, do you expect to
spend more or less money on major purchases
(furniture, electrical/electronic devices, etc.) over the
next 12 months? I will spend…

mnb bulletin • march 2010 17
hOuSehOld cOnSumPtiOn exPenditureS and the cOnSumer cOnFidence...
a. much more,b. a little more,c. about the same,d. a little less,e. much less.
10. In view of the general economic situation, do you
think that now is...?
a. a very good moment to save,b. a fairly good moment to save,c. not a good moment to save,d. a very bad moment to save.
11. Over the next 12 months, how likely is it that you
save any money?
a. very likely,b. fairly likely,c. not likely,d. not at all likely.
12. Which of these statements best describes the
current financial situation of your household?
a. we are saving a lot,b. we are saving a little,c. we are just managing to make ends meet on our income,d. we are having to draw on our savings,e. we are running into debt.
quarterly questions:
13. How likely are you to buy a car over the next 12
months?
a. very likelyb. fairly likelyc. not likelyd. not at all likely
14. Are you planning to buy or build a home over the
next 12 months (to live in yourself, for a member of
your family, as a holiday home, to let etc.)?
a. yes, definitelyb. possiblyc. probably notd. no
15. How likely are you to spend any large sums of
money on home improvements or renovations over
the next 12 months?
a. very likelyb. fairly likelyc. not likelyd. not at all likely
AnnEx 2 DESCrIpTIon oF THE InDICATorS uSED
Availability Frequency
QuestionsoftheGKIconfidenceindex 1993–2009Q3Monthly(Threequestionshavequarterlyfrequency)
Finalconsumptionofhouseholdsatconstantprices
1991–2009Q3 Quarterly(dataestimatedbefore1995)
Consumptionexpenditureofhouseholdsatconstantprices
1995–2009Q3 Quarterly
Retailsalesatconstantprices 1998–2009Q3 Monthly
Durableconsumergoodsatconstantprices 1998–2009Q3 Monthly
Newcarpurchasesofhouseholdsatconstantprices
1993–2009Q3 Quarterly,MNBestimate
Housinginvestmentofhouseholdsatconstantprices
1995–2009Q3 Quarterly
Grossandnetfinancialassetsandsavingsofhouseholds(adjustedbyrevaluationeffect)
1989–2009Q3 Quarterly
Realnetwagebillofhouseholds 1995–2009Q3 Monthly
Realdisposableincomeofhouseholds 1995–2009Q3 Quarterly
Unemploymentrate 1995–2009Q3 Monthly
Inflationandcoreinflation 1995–2009Q3 Monthly
Note: all data are seasonally adjusted.

maGYar nemZeti banK
mnb bulletin • march 201018
AnnEx 3 ExplAnATory powEr oF InDIvIDuAl quESTIonS
Table 3-1 results of the estimations
Dependent variable (y)
question C q(T)
q(T–1)
q(T–2)
y(T–1)
drpDI(T–1)
dnFw(T–1)
Adj. r2
number of observations
Realnetwagebill
1
3.69 0.08** – – 0.73*** – – 0.83 54
0.72 – 0.01 – 0.88*** – – 0.81 54
–1.09 – – –0.04 0.97*** – – 0.82 54
2
3.24*** 0.10*** – – 0.68*** – – 0.85 54
3.22*** – 0.09*** – 0.67*** – – 0.84 54
1.78 – – 0.04 0.79*** – – 0.82 54
12
1.44* 0.14 – – 0.80*** – – 0.82 54
0.79 – 0.05 – 0.86*** – – 0.81 54
0.18 – – –0.03 0.92*** – – 0.81 54
CPI
51
–0.14 0.11*** – – 0.32*** – – 0.28 65
–0.15 – 0.11** – 0.26** – – 0.24 65
–0.14 – – 0.004 0.45*** – – 0.17 65
61
–0.12 0.07** – – 0.43*** – – 0.21 65
–0.16 – 0.09** – 0.35*** – – 0.24 65
–0.21 – – 0.09** 0.32** – – 0.26 65
Coreinflation
51
–0.11 0.07** – – 0.46*** – – 0.33 65
–0.10 – 0.05* – 0.45*** – – 0.31 65
–0.10 – – –0.01 0.57*** – – 0.28 65
61
–0.09 0.06** – – 0.55*** – – 0.33 65
–0.13 – 0.06** – 0.47*** – – 0.34 65
–0.13 – – 0.04 0.49*** – – 0.30 65
Unemploymentrate
7
–0.38*** 0.01*** – – – – – 0.28 66
–0.31*** – 0.01*** – – – – 0.17 66
–0.21** – – 0.01** – – – 0.06 66
Durablegoodssales
8
–4.39 –0.04 – – 0.78*** 0.51 0.32 0.70 54
–4.11 – –0.03 – 0.78*** 0.47 0.31 0.69 54
–3.90 – – –0.03 0.78*** 0.44 0.32 0.69 54
9
7.10 0.26* – – 0.74*** –0.30 0.47* 0.71 54
1.47 – 0.13 – 0.75*** 0.09 0.50* 0.70 54
–2.99 – – 0.01 0.79*** 0.35 0.43 0.69 54
15
8.10 0.13 – – 0.92*** 0.19 –0.18 0.87 39
4.06 – 0.08 – 0.96*** 0.16 –0.07 0.87 39
0.92 – – 0.04 0.99*** 0.16 –0.008 0.87 39
Grossfinancialsavings
10
–0.95 –0.01 – – 1.04*** – – 0.91 62
–0.96 – –0.01 – 1.04*** – – 0.90 62
–1.01 – – –0.01 1.04*** – – 0.90 62
11
–0.01 0.01 – – 1.03*** – – 0.90 62
–0.42 – 0.002 – 1.04*** – – 0.90 62
–0.51 – – 0.001 1.04*** – – 0.90 62
Netfinancialsavings
12
0.12 –0.08** – – 0.94*** – – 0.90 62
0.18 – –0.09** – 0.93*** – – 0.91 62
0.25 – – –0.11** 0.91*** – – 0.91 62
Newcarsales 13
–18.09 –0.13 – – 0.97*** 0.88 0.59 0.77 39
–13.21 – –0.07 – 0.91*** 0.80 0.62 0.81 39
–4.73 – – 0.02 0.91*** 0.69 0.48 0.81 38
Retailcarsales 13
–0.18 0.04 – – 0.99*** 0.36 0.16 0.85 39
4.21 – 0.09 – 1.01*** 0.23 0.13 0.86 38
5.15 – – 0.11 1.00*** 0.18 0.18 0.86 37
Note: the columns of the explanatory variables indicate the value of the estimated coefficients. The *, ** and *** symbols denote confidence intervals of 10, 5 and 1 percent. 1 For Question 5 and Question 6 the explanatory variable is not the level of, but the change in the balance indicator.

mnb bulletin • march 2010 19
hOuSehOld cOnSumPtiOn exPenditureS and the cOnSumer cOnFidence...
Table 3-2 Estimates pertaining to the economic situation of the country and housing investment
Note: the columns of the explanatory variables indicate the value of the estimated coefficients. The *, ** and *** symbols denote confidence intervals of 10, 5 and 1 percent.
Dependent variable (y)
ques-tion
C q(T)
q(T–1)
q(T–2)
y(T–1)
y(T–2)
y(T–3)
drpDI(–1)
dnFw(–1)
Adj. r2 number of observations
GDPgrowth
3
0.72 0.01* – – 1.63*** –0.74*** – – – 0.94 52
0.42 – 0.01 – 1.67*** –0.74*** – – – 0.94 52
0.53 – – 0.01 1.70*** –0.78*** – – – 0.94 52
4
0.63* 0.02** – – 1.58*** –0.71*** – – – 0.94 52
0.29 – 0.01 – 1.65*** –0.72*** – – – 0.94 52
0.35 – – 0.01 1.68*** –0.76*** – – – 0.94 52
Housinginvestment*
14
5.86 0.06* – – 2.44*** –2.46*** 1.21*** –0.05 –0.02 0.99 39
2.58 – 0.03 – 2.49*** –2.47*** 1.12*** –0.05 0.004 0.99 38
1.44 – – 0.02 2.46*** –2.38*** 1.03*** –0.05 0.02 0.99 37