
universidade de são paulo - FI-Admin
111
UNIVERSIDADE DE SÃO PAULO FACULDADE DE CIÊNCIAS FARMACÊUTICAS Departamento de Análises Clínicas e Toxicológicas Programa de Pós-Graduação em Farmácia Área Fisiopatologia Análise dos mecanismos regulatórios transcricionais mediados por microRNAs na Síndrome Metabólica Thiago Dominguez Crespo Hirata Tese apresentada para obtenção do título de Doutor em Ciências Orientador: Prof. Dr. Helder Takashi Imoto Nakaya São Paulo 2019
-
Upload
khangminh22 -
Category
Documents
-
view
0 -
download
0
Transcript of universidade de são paulo - FI-Admin
UNIVERSIDADE DE SÃO PAULO
FACULDADE DE CIÊNCIAS FARMACÊUTICAS
Departamento de Análises Clínicas e Toxicológicas
Programa de Pós-Graduação em Farmácia
Área Fisiopatologia
Análise dos mecanismos regulatórios transcricionais mediados por
microRNAs na Síndrome Metabólica
Thiago Dominguez Crespo Hirata
Tese apresentada para obtenção do título de Doutor em Ciências
Orientador: Prof. Dr. Helder Takashi Imoto Nakaya
São Paulo
2019
UNIVERSIDADE DE SÃO PAULO
FACULDADE DE CIÊNCIAS FARMACÊUTICAS
Departamento de Análises Clínicas e Toxicológicas
Programa de Pós-Graduação em Farmácia
Área Fisiopatologia
Análise dos mecanismos regulatórios transcricionais mediados por
microRNAs na Síndrome Metabólica
Thiago Dominguez Crespo Hirata
Versão corrigida
Tese apresentada para obtenção do título de Doutor em Ciências
Orientador: Prof. Dr. Helder Takashi Imoto Nakaya
São Paulo
2019

Thiago Dominguez Crespo Hirata
Análise dos mecanismos regulatórios transcricionais mediados por
microRNAs na Síndrome Metabólica
Comissão Julgadora da
Tese para obtenção do Título de Doutor em Ciências
Prof. Dr. Helder Takashi Imoto Nakaya
Orientador / Presidente
_______________________________________
1 o examinador: Ana Campa
_______________________________________
2 o examinador: Helder Takashi Imoto Nakaya
_______________________________________
3 o examinador: Murilo Vieira Geraldo
_______________________________________
4 o examinador: Pedro Manoel Mendes de Moraes Vieira
São Paulo, 13 de setembro de 2019


Dedication
This Thesis is dedicated to all people who are or have been affected by
Metabolic Syndrome, the study volunteers, and the healthcare professionals who
fight against it.

Acknowledgments
I extend my gratitude to my supervisor Professor Helder T. I. Nakaya, for his
guidance and patience throughout my Ph.D. program. He imparted to me his
knowledge and skills that I am sure will help me tackle future academic challenges.
Most of all, I am grateful to have undertaken my Ph.D. at his laboratory, where I met
the most amazing and supportive people.
It comes as no surprise that I will be forever grateful to all members of the
Computational Systems Biology Laboratory (CSBL): Matheus C. Burger, Pedro de Sá
T. Russo, Lucas E. Cardozo, Fernando M. Passos, Diógenes S. de Lima, Patricia C.
G. D. Carvalho, André Nicolau, André G. C. Martins, Mariana A. Pereira, Felipe
Martins, Viviane Schuch, Leonardo R. Gama, Fabio B. Pohl, Jaqueline Y. T. Wang,
Melissa J. Lever, Cesar A. P. Medina, Mindy S. De Los A. M. Miranda, Gustavo R.
Ferreira, Diogo M. Da Silva, Natalia B. Cruz, and Tiago L. Alves. Thank you guys for
the support, friendship and for the fun times spent in and out of the lab. Also, I am so
honored to have worked alongside such insightful collaborators of CSBL: Christoph
Blohmke, Vinicius Maracaja-Coutinho, Ana C. Tahira, and Frederico M. Ferreira.
I am so pleased to have collaborated with the team from Instituto Dante
Pazzanese de Cardiologia: Gisele M. Bastos, Hui-Tzu L. Wang, Adriana R. Garofalo,
Jessica B. Borges, Elisangela S. Rodrigues, Thais K. A. Afonso, Lara R. de Castro,
Marcelo F. Sampaio, and everybody from Laboratório de Investigação Molecular
Cardiovascular . Thanks to all the LBMAD members at FCF-USP, especially Cristina
M. Fajardo, Magda E. G. Saldarriaga, Aécio A. Braga, Juliana F. Germano, Raul H.
Bortolin, and Renta C. C. Freitas.
I want to thank the University of Sao Paulo, School of Pharmaceutical
Sciences, and the Department of Clinical and Toxicological Analyses for providing the
support of my Ph.D. thesis to be developed. Also, thank you to all students,
employees and especially the professors from whom I was able to learn so much
these last years. I appreciate all the administrative help from Silvia R. de Assis, Ana
M. D. Dantas, Dora, Edna, Elaine, Marilisa, Samantha, and Sueli.

I will be forever grateful to CAPES and FAPESP for providing my Ph.D.
fellowship. This study was financed in part by the Coordenação de Aperfeiçoamento
de Pessoal de Nível Superior - Brasil (CAPES) - Finance Code 001. This study was
financed in part by the grant #2014/24162-2, São Paulo Research Foundation
(FAPESP). Also, I acknowledge the opportunity to undergo an international internship
at QIMR Berghofer Medical Research Institute in Brisbane, Australia, with the
FAPESP’s BEPE grant #2017/17345-1.
I thank Prof. Andreas Suhrbier for his expertise, generosity, support, and
humor throughout my stay at his lab. I much appreciate all the beers, scientific
dinners, and nature expeditions. To all my Aussie friends from Prof. Suhrbier’s
Inflammation Lab at QIMR Berghofer: Dr. Natalie Prow, Dr. Wayne Schroder, Dr. Eri
Nakayama, Dr. Yee-Suan Poo, Bing Tang, Thuy T. Le, Kexin Yan, Jessamine E. G. H.
De La Barra, Wilson Nguyen, and Rocio J. Martinez. To all my mates from QIMR:
Mary Lor, Lu Wang, Yuan Yu, Daniel Rawle, Haran Sivakumaran. Thank you all for
the funny moments together at lunchtime, trade displays, Friday student lectures, and
weekend outings, but mostly for making me feel welcome in your home country.
I want to express my sincerest gratitude and love to my father Mario H. Hirata,
mother Rosario D. C. Hirata and my brother Felipe D. C. Hirata. Thank you for
always being by my side and having faith in me. All of this could not have been
possible without you, and I am eternally grateful for everything you do for me. A
special thanks to Fernando O. Louro and Sueli Olivieri for their joyful support.
Thank you to all my Dominguez, Crespo and Hirata family, for the
encouragement and support even when we were far apart. I am especially grateful
for my abuelos Jesus Vazquez Dominguez and Delia Crespo Duran; aunts Marina
Crespo Dominguez and Isabel Crespo Dominguez for always loving and believing in
me even from far away (Vigo - Spain). I love you all!
For everyone who helped me during this thesis: I could not have done it
without you! If the last few years has taught me anything, it was that science can only
go forward when we collaborate. Oh, and of course when you listen to the people

who are more experienced than you are. Finally, I thank God for giving me the
strength and health to pursue my goals no matter how difficult the path may be.
HIRATA, T. D. C. Análise dos mecanismos regulatórios transcricionais mediados por microRNAs na Síndrome Metabólica. 2019. 110f. Tese (Doutorado) - Faculdade de Ciências Farmacêuticas, Universidade de São Paulo, São Paulo, 2019.
Resumo
A Síndrome Metabólica (MetS) é um conjunto de doenças inter-relacionadas e
associadas ao aumento de mortalidade e risco de eventos cardiovasculares. Entre
os mecanismos moleculares elucidados da MetS, existem muitos genes regulados
por miRNAs - RNAs pequenos não codificadores . O grande número de estudos
transcriptômicos em banco dados públicos integrado a novos métodos de análise
podem gerar novas descobertas. Deste modo, o objetivo deste estudo foi identificar
miRNAs circulantes e genes alvos na MetS usando a abordagem de Biologia de
Sistemas. Para isso, GEO-NCBI foi usado para obter e analisar 26 estudos de
transcriptoma por microarray de MetS e obesidade. Após o pré-processamento,
realizamos análises de expressão diferencial (método LIMMA), co-expressão gênica
(CEMiTool), e enriquecimento (GSEA, Reactome). Identificamos uma assinatura de
expressão gênica do tecido adiposo subcutâneo (SAT) de indivíduos obesos,
composta por 291 genes consistentemente diferencialmente expressos (DEG). Essa
assinatura teve um escore de enriquecimento normalizado (NES) positivo para
ativação de respostas do sistema imune adaptativo, e NES negativo para vias de
metabolismo. A rede consenso de co-expressão do SAT revelou 3 comunidades
(CM) de genes densamente interconectadas. Essas CMs continham muitos genes
regulados positivamente e com consistência de NES positivo entre os estudos. Os
genes co-expressos dessas 3 comunidades pertenciam a vias de a degranulação de
neutrófilos, infiltração de células do sistema imune e processos inflamatórios. Além
disso, uma pequena coorte brasileira (6 indivíduos com MetS e 6 controles) foi
submetida à dosagem sérica de miRNAs por PCR array. Dos 222 miRNAs
detectados no soro, a análise de expressão diferencial identificou 4 miRNAs
regulados positivamente (miR-30c-5p, miR-421, miR-542-5p e miR-574) nos
pacientes com MetS (p<0.01). A análise integrativa miRNAs-mRNAs revelou que os
miRNAs circulantes superexpressos tinham 12 alvos no SAT, 3 alvos no fígado; e

nenhum alvo no músculo e no sangue. Muitos desses alvos são moduladores de
vias pró-inflamatórias. Em conclusão, a utilização da Biologia de Sistemas na análise
de redes gênicas e miRNAs circulantes identificou alguns potenciais mecanismos
moleculares e fisiopatológicos da Síndrome Metabólica. Os miRNAs circulantes
identificados neste trabalho são potenciais biomarcadores e/ou alvos terapêuticos.
Entretanto, mais estudos são necessários para validar esses miRNAs e seus
mRNAs alvos.
Palavras-chave: Síndrome metabólica. Obesidade. MicroRNA. Assinatura gênica.
Co-expressão. mRNA. Biologia de Sistemas. Bioinformática.

HIRATA, T. D. C. Analysis of the transcriptional regulatory mechanisms mediated by microRNAs in Metabolic Syndrome. 2019. 110f. Thesis (Doctoral) - School of Pharmaceutical Sciences, University of São Paulo, São Paulo, 2019.
Abstract
Metabolic Syndrome (MetS) is a combination of diseases interrelated and associated
with increased mortality and risk of cardiovascular events. Among the elucidated
molecular mechanisms of MetS, there are several genes regulated by miRNAs -
small non-coding RNAs. A large number of transcriptomic studies in public databases
integrated with new analysis methods can generate new insights. Therefore, this
study aimed to identify circulating miRNAs and their target genes in MetS using a
Systems Biology approach. For this, we used GEO-NCBI to download and analyse
26 microarray transcriptome studies of MetS and obesity. After preprocessing, the
data underwent differential expression (LIMMA method), gene co-expression
(CEMiTool), and enrichment (GSEA, Reactome) analyses. We retrieved a gene
expression signature for subcutaneous adipose tissue (SAT) for obese individuals
that included 291 consistent differentially expressed genes (DEG). This signature had
a positive normalized enrichment score (NES) for adaptive immune system activation
responses, and negative NES for metabolic pathways. The consensus co-expression
network of SAT revealed 3 communities (CM) of densely interconnected genes.
These CMs had a high number of up regulated genes and a consistent positive NES
among the studies. The co-expressed genes of these 3 CMs were related to
neutrophil degranulation, infiltration of immune system cells, and inflammatory
processes. Also, a small brazillian cohort (6 individuals with MetS and 6 controls)
underwent a seric miRNA profiling using PCR array. From the 222 miRNAs detected
in serum, the differential expression analysis identified 4 upregulated miRNAs
(miR-30c-5p, miR-421, miR-542-5p and miR-574) in MetS patients (p<0.01). The
integrative miRNAs-mRNAs analysis revealed that the circulating upregulated
miRNAs had 12 targets in the SAT, 3 targets in the liver; and no targets in the muscle
and blood. Many of these target genes are known modulators of proinflammatory
pathways. In conclusion, the use of Systems Biology in the analysis of gene networks

and circulating miRNAs identified some potential molecular and pathophysiological
mechanisms of the Metabolic Syndrome. The circulating miRNAs identified in this
study are potential biomarkers and/or therapeutic targets. However, further studies
are needed to validate these miRNAs and their target mRNA.
Keywords: Metabolic Syndrome. Obesity. MicroRNA. Gene signature.
Co-expression. mRNA. Systems Biology. Bioinformatics.
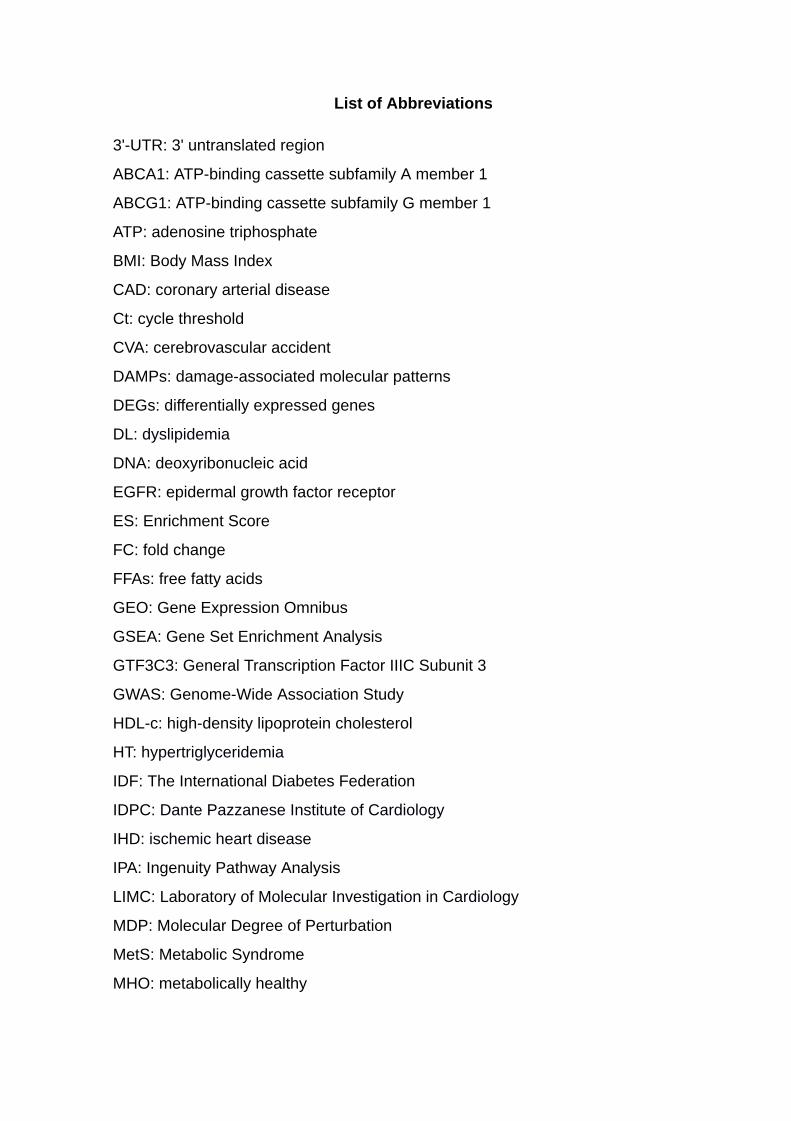
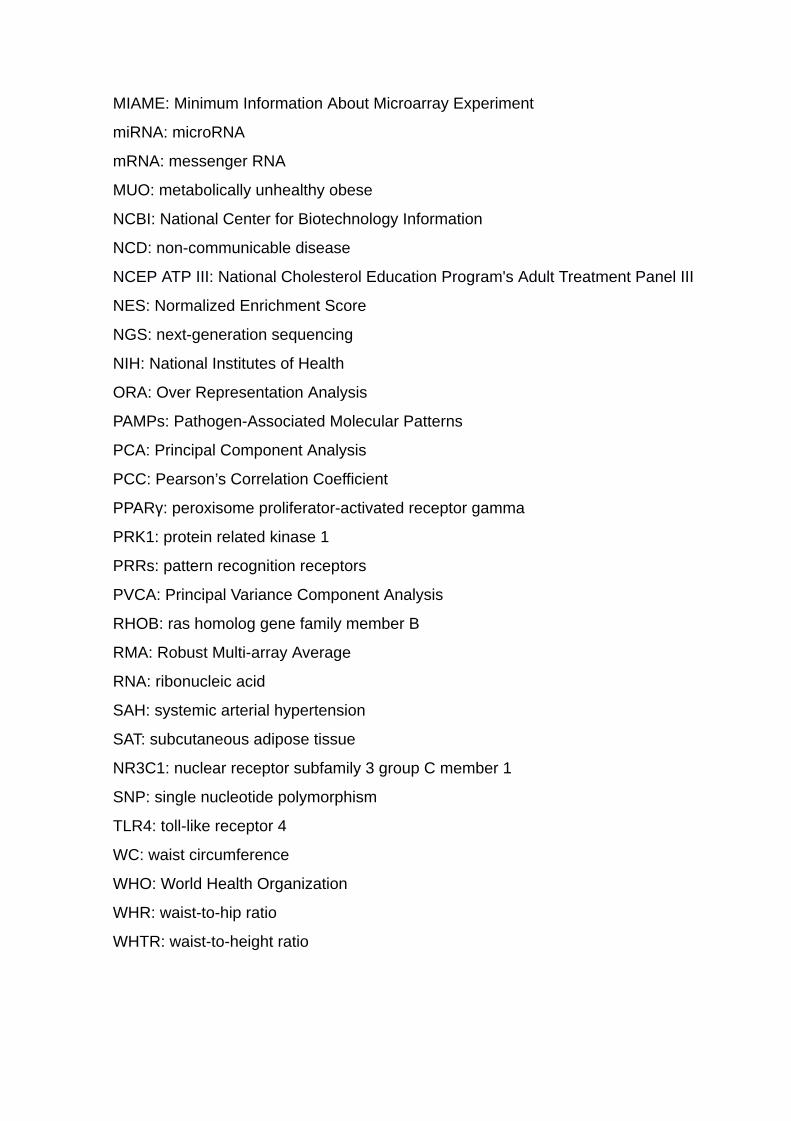
List of Abbreviations
3'-UTR: 3' untranslated region
ABCA1: ATP-binding cassette subfamily A member 1
ABCG1: ATP-binding cassette subfamily G member 1
ATP: adenosine triphosphate
BMI: Body Mass Index
CAD: coronary arterial disease
Ct: cycle threshold
CVA: cerebrovascular accident
DAMPs: damage-associated molecular patterns
DEGs: differentially expressed genes
DL: dyslipidemia
DNA: deoxyribonucleic acid
EGFR: epidermal growth factor receptor
ES: Enrichment Score
FC: fold change
FFAs: free fatty acids
GEO: Gene Expression Omnibus
GSEA: Gene Set Enrichment Analysis
GTF3C3: General Transcription Factor IIIC Subunit 3
GWAS: Genome-Wide Association Study
HDL-c: high-density lipoprotein cholesterol
HT: h ypertriglyceridemia
IDF: The International Diabetes Federation
IDPC: Dante Pazzanese Institute of Cardiology
IHD: ischemic heart disease
IPA: Ingenuity Pathway Analysis
LIMC: Laboratory of Molecular Investigation in Cardiology
MDP: Molecular Degree of Perturbation
MetS: Metabolic Syndrome
MHO: metabolically healthy
MIAME: Minimum Information About Microarray Experiment
miRNA: microRNA
mRNA: messenger RNA
MUO: metabolically unhealthy obese
NCBI: National Center for Biotechnology Information
NCD: non-communicable disease
NCEP ATP III: National Cholesterol Education Program's Adult Treatment Panel III
NES: Normalized Enrichment Score
NGS: next-generation sequencing
NIH: National Institutes of Health
ORA: Over Representation Analysis
PAMPs: Pathogen-Associated Molecular Patterns
PCA: Principal Component Analysis
PCC: Pearson’s Correlation Coefficient
PPARγ: peroxisome proliferator-activated receptor gamma
PRK1: protein related kinase 1
PRRs: pattern recognition receptors
PVCA: Principal Variance Component Analysis
RHOB: ras homolog gene family member B
RMA: Robust Multi-array Average
RNA: ribonucleic acid
SAH: systemic arterial hypertension
SAT: subcutaneous adipose tissue
NR3C1: nuclear receptor subfamily 3 group C member 1
SNP: single nucleotide polymorphism
TLR4: toll-like receptor 4
WC: waist circumference
WHO: World Health Organization
WHR: waist-to-hip ratio
WHTR: waist-to-height ratio
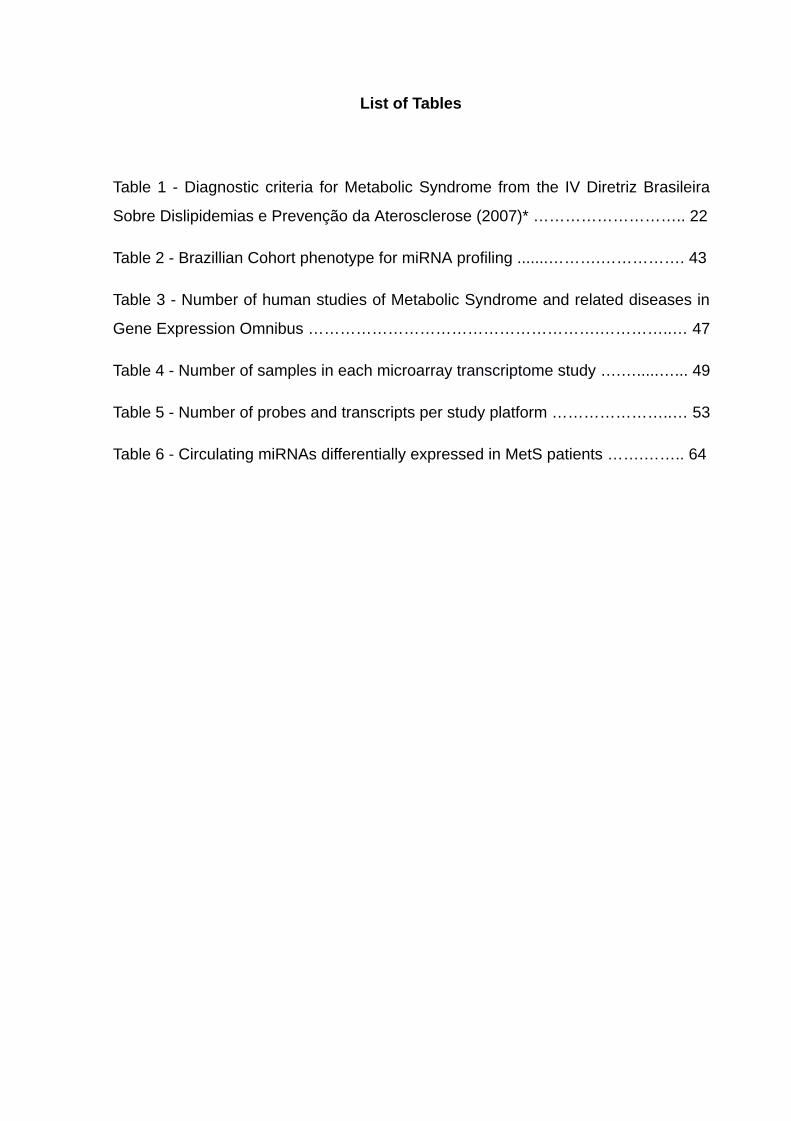
List of Tables
Table 1 - Diagnostic criteria for Metabolic Syndrome from the IV Diretriz Brasileira
Sobre Dislipidemias e Prevenção da Aterosclerose (2007)* ……………………….. 22
Table 2 - Brazillian Cohort phenotype for miRNA profiling .......……….……………. 43
Table 3 - Number of human studies of Metabolic Syndrome and related diseases in
Gene Expression Omnibus ……………………………………………….…………..… 47
Table 4 - Number of samples in each microarray transcriptome study ….….....…... 49
Table 5 - Number of probes and transcripts per study platform …………………..… 53
Table 6 - Circulating miRNAs differentially expressed in MetS patients …….…….. 64
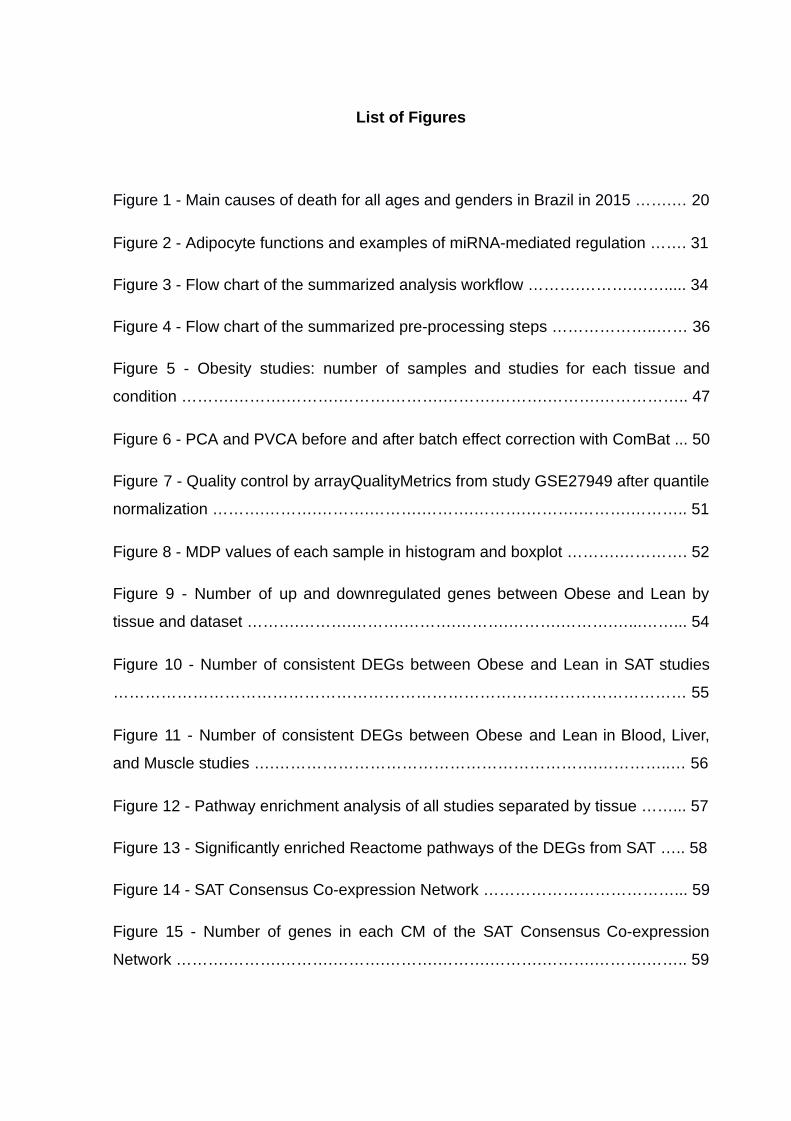
List of Figures
Figure 1 - Main causes of death for all ages and genders in Brazil in 2015 …….… 20
Figure 2 - Adipocyte functions and examples of miRNA-mediated regulation ……. 31
Figure 3 - Flow chart of the summarized analysis workflow ……….……….……..... 34
Figure 4 - Flow chart of the summarized pre-processing steps ………………. .…… 36
Figure 5 - Obesity studies: number of samples and studies for each tissue and
condition ……….……….……….……….……….……….……….……….…………….. 47
Figure 6 - PCA and PVCA before and after batch effect correction with ComBat ... 50
Figure 7 - Quality control by arrayQualityMetrics from study GSE27949 after quantile
normalization ……….……….……….……….……….……….……….……….……….. 51
Figure 8 - MDP values of each sample in histogram and boxplot ……….…………. 52
Figure 9 - Number of up and downregulated genes between Obese and Lean by
tissue and dataset ……….……….……….……….……….……….……….…...……... 54
Figure 10 - Number of consistent DEGs between Obese and Lean in SAT studies
……………………………………………………………………………………………… 55
Figure 11 - Number of consistent DEGs between Obese and Lean in Blood, Liver,
and Muscle studies ….……………………………………………………. …………..… 56
Figure 12 - Pathway enrichment analysis of all studies separated by tissue ……... 57
Figure 13 - Significantly enriched Reactome pathways of the DEGs from SAT ….. 58
Figure 14 - SAT Consensus Co-expression Network ………………………………... 59
Figure 15 - Number of genes in each CM of the SAT Consensus Co-expression
Network ……….……….……….……….……….……….……….……….……….…….. 59
Figure 16 - Functional annotation analysis by ORA and GSEA of SAT Consensus
Co-expression Modules ……….……….……….……….……….………….………….. 61
Figure 17 - The number of DEGs in each CM of the SAT Consensus Co-expression
Network ……….……….……….……….………………………….……….……………. 62
Figure 18 - Determination of normalizing circulating miRNAs ……….………..……. 63
Figure 19 - MiRNAs PCR array quality control and Ct values ……….………..…..... 64
Figure 20 - MiRNA-target regulation from consensus DEGs from SAT ....……….... 65
Figure 21 - MiRNA-target regulation from consensus DEGs from liver .….……….. 65

Summary (Table of Contents)
1. Introduction 20
1.1. Metabolic Syndrome 20
1.2. Investigating Metabolic Syndrome with High-throughput Technologies 2 4
1.3 Microarray technology and GEO-NCBI 2 5
1.4 Gene Co-expression Analysis 2 6
1.5. Systems Biology 2 7
1.6. miRNAs 2 8
2. Aims 3 3
2.1. Main Aim 3 3
2.2. Specific Aims 3 3
3. Material and Methods 3 4
3.1 Study workflow 34
3.2. Selection of mRNA expression microarray studies from a public database 3 5
3.3. The download of mRNA expression data 3 5
3.4. Pre-processing and Reanalysis from GEO Database 3 6
3.4.1. Normalization 3 6
3.4.1.1 Normalization: Pre-processing: Affymetrix platforms 36
3.4.1.2. Normalization: Agilent platforms 3 7
3.4.1.3. Normalization: Illumina platforms 37
3.4.2. Sample quality control 37
3.4.3. Outlier Removal with Molecular Degree of Perturbation 3 8
3.4.4. Annotate and collapse probes 3 8
3.4.5. Sample annotation 38
3.5. Differentially expressed genes related to MetS 3 9

3.5.1. LIMMA 3 9
3.6. Gene co-expression analysis 3 9
3.6.1. Gene Co-expression Analysis with CEMiTool 3 9
3.6.2. Identification of consensus communities between studies 3 9
3.6.3. Protein-protein interaction between genes of modules 40
3.6.4. Identification of pathways related to MetS 40
3.6.5. Gene Set Enrichment Analysis 4 1
3.7. Analysis of miRNAs profile from Metabolic Syndrome patients 4 2
3.7.1. MiRNAs expression profile in MetS patients 4 2
3.7.2. Subjects 42
3.7.3. Biological samples 4 3
3.7.4. Analysis of miRNA expression profile in serum 4 3
3.8. miRNA and target mRNA interactions 4 5
4. Results 4 6
4.1. Selection of public microarrays mRNA expression studies 4 6
4.2. Download and pre-processing of mRNA expression data 4 8
4.3. Differentially expressed genes related to MetS 5 3
4.4. Gene co-expression analysis 5 8
4.4.1. Consensus communities of the co-expression network 5 8
4.4.2. Functional Analysis of the Consensus Co-expression Communities 60
4.5. Analysis of circulating miRNAs in MetS patients 6 2
4.6. miRNA-mRNA Integrated Analysis 6 5
5. Discussion 6 7
6. Conclusions 80
1. Introduction
1.1. Metabolic Syndrome
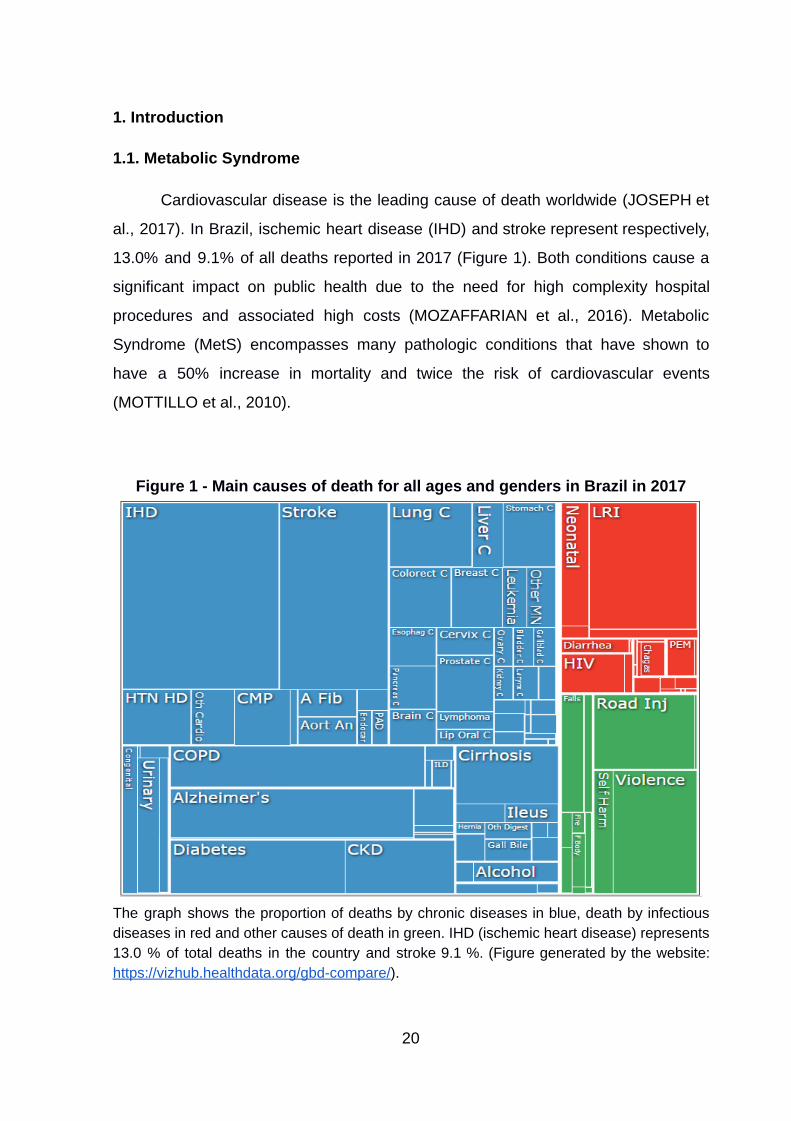
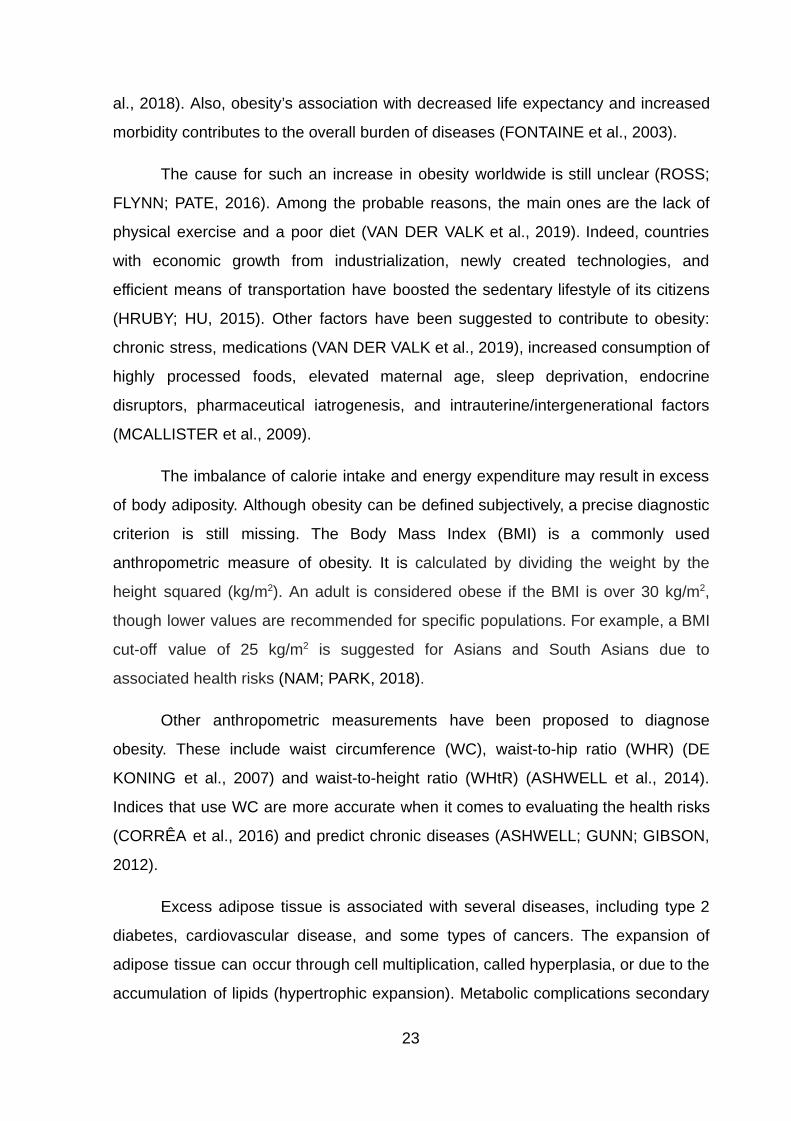
Cardiovascular disease is the leading cause of death worldwide (JOSEPH et
al., 2017) . In Brazil, ischemic heart disease (IHD) and stroke represent respectively,
13.0% and 9.1% of all deaths reported in 2017 (Figure 1). Both conditions cause a
significant impact on public health due to the need for high complexity hospital
procedures and associated high costs (MOZAFFARIAN et al., 2016) . Metabolic
Syndrome (MetS) encompasses many pathologic conditions that have shown to
have a 50% increase in mortality and twice the risk of cardiovascular events
(MOTTILLO et al., 2010) .
Figure 1 - Main causes of death for all ages and genders in Brazil in 2017
The graph shows the proportion of deaths by chronic diseases in blue, death by infectious diseases in red and other causes of death in green. IHD (ischemic heart disease) represents 13.0 % of total deaths in the country and stroke 9.1 %. (Figure generated by the website: https://vizhub.healthdata.org/gbd-compare/ ).
20
Since the description of MetS (REAVEN, 1988) , different clinical definitions
were proposed by the World Health Organi zation (WHO), National Institutes of
Health (NIH), and the International Diabetes Federation (IDF). Divergences between
the formulated guidelines led to the harmonized proposal for the definition of MetS in
2009 (ALBERTI et al., 2009) .
All the MetS diagnostic definitions take into consideration the presence of at
least 3 of the following factors: body measurements (Body Mass Index - BMI, or
abdominal circumference), lipids profile (low levels of HDL-c - High Density
Lipoprotein cholesterol and high levels of triglycerides), blood pressure (Systemic
Arterial Hypertension - SAH), and glycemic profile (Type 2 diabetes, altered fasting
glycemia or glucose intolerance) (MOZAFFARIAN et al., 2016) .
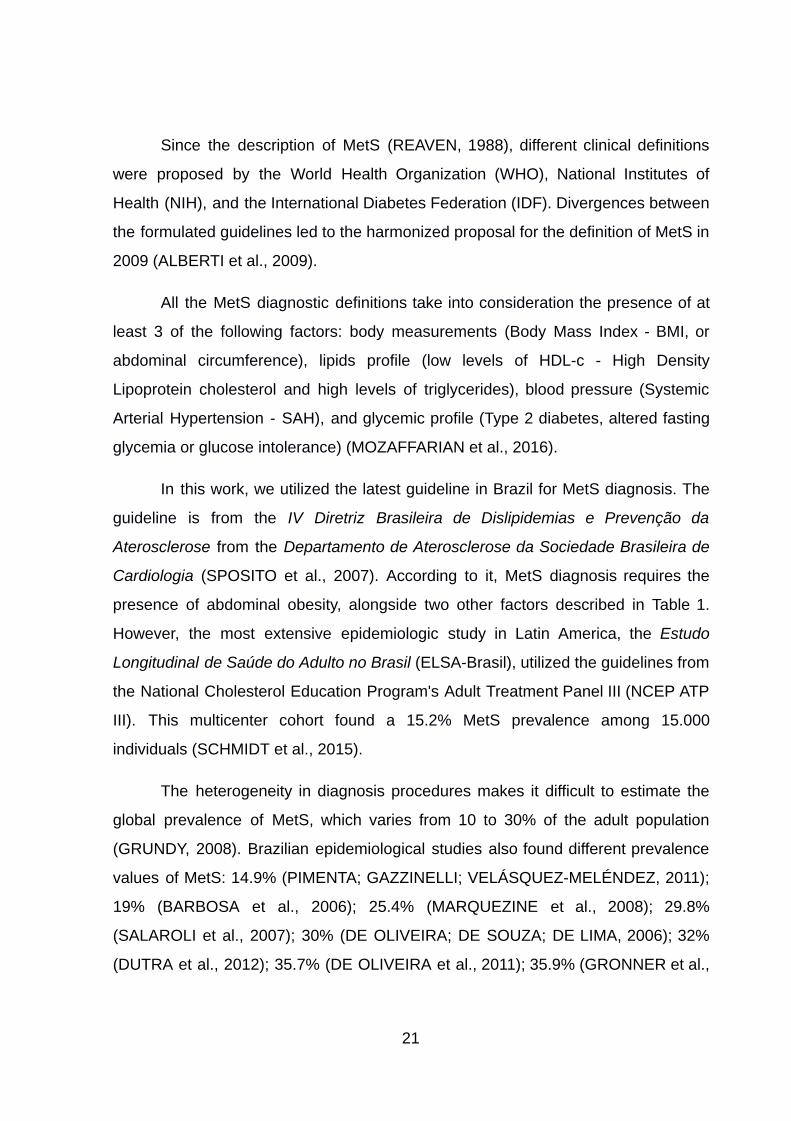
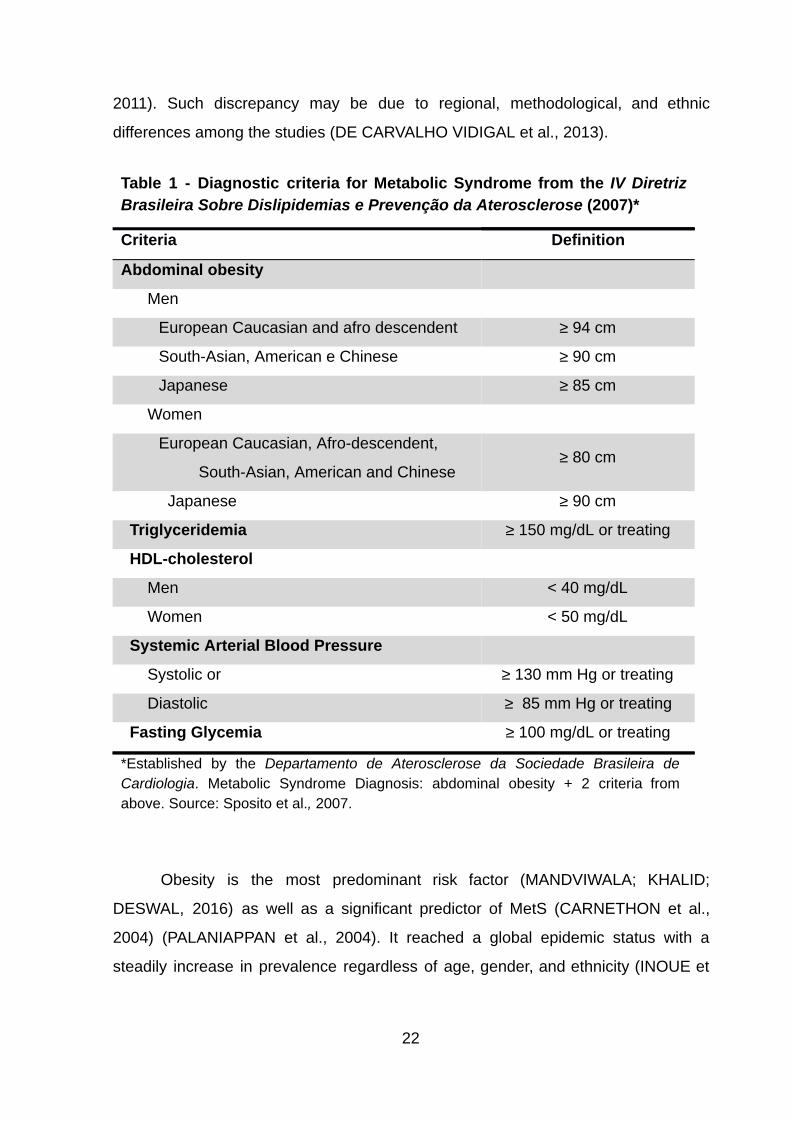
In this work, we utilized the latest guideline in Brazil for MetS diagnosis. The
guideline is from the IV Diretriz Brasileira de Dislipidemias e Prevenção da
Aterosclerose from the Departamento de Aterosclerose da Sociedade Brasileira de
Cardiologia (SPOSITO et al., 2007) . According to it, MetS diagnosis requires the
presence of abdominal obesity, alongside two other factors described in Table 1.
However, the most extensive epidemiologic study in Latin America, the Estudo
Longitudinal de Saúde do Adulto no Brasil (ELSA-Brasil), utilized the guidelines from
the National Cholesterol Education Program's Adult Treatment Panel III (NCEP ATP
III). This multicenter cohort found a 15.2% MetS prevalence among 15.000
individuals (SCHMIDT et al., 2015) .
The heterogeneity in diagnosis procedures makes it difficult to estimate the
global prevalence of MetS, which varies from 10 to 30% of the adult population
(GRUNDY, 2008) . Brazilian epidemiological studies also found different prevalence
values of MetS: 14.9% (PIMENTA; GAZZINELLI; VELÁSQUEZ-MELÉNDEZ, 2011) ;
19% (BARBOSA et al., 2006) ; 25.4% (MARQUEZINE et al., 2008) ; 29.8%
(SALAROLI et al., 2007) ; 30% (DE OLIVEIRA; DE SOUZA; DE LIMA, 2006) ; 32%
(DUTRA et al., 2012) ; 35.7% (DE OLIVEIRA et al., 2011) ; 35.9% (GRONNER et al.,
21
2011) . Such discrepancy may be due to regional, methodological, and ethnic
differences among the studies (DE CARVALHO VIDIGAL et al., 2013) .
Table 1 - Diagnostic criteria for Metabolic Syndrome from the IV Diretriz Brasileira Sobre Dislipidemias e Prevenção da Aterosclerose (2007)*
Criteria Definition
Abdominal obesity
Men
European Caucasian and afro descendent ≥ 94 cm
South-Asian, American e Chinese ≥ 90 cm
Japanese ≥ 85 cm
Women
European Caucasian, Afro-descendent,
South-Asian, American and Chinese ≥ 80 cm
Japanese ≥ 90 cm
Triglyceridemia ≥ 150 mg/dL or treating
HDL-cholesterol
Men < 40 mg/dL
Women < 50 mg/dL
Systemic Arterial Blood Pressure
Systolic or ≥ 130 mm Hg or treating
Diastolic ≥ 85 mm Hg or treating
Fasting Glycemia ≥ 100 mg/dL or treating
*Established by the Departamento de Aterosclerose da Sociedade Brasileira de Cardiologia . Metabolic Syndrome Diagnosis: abdominal obesity + 2 criteria from above. Source: Sposito et al. , 2007.
Obesity is the most predominant risk factor (MANDVIWALA; KHALID;
DESWAL, 2016) as well as a significant predictor of MetS (CARNETHON et al.,
2004) (PALANIAPPAN et al., 2004) . It reached a global epidemic status with a
steadily increase in prevalence regardless of age, gender, and ethnicity (INOUE et
22
al., 2018) . Also, obesity’s association with decreased life expectancy and increased
morbidity contributes to the overall burden of diseases (FONTAINE et al., 2003) .
The cause for such an increase in obesity worldwide is still unclear (ROSS;
FLYNN; PATE, 2016) . Among the probable reasons, the main ones are the lack of
physical exercise and a poor diet (VAN DER VALK et al., 2019) . Indeed, countries
with economic growth from industrialization, newly created technologies, and
efficient means of transportation have boosted the sedentary lifestyle of its citizens
(HRUBY; HU, 2015) . Other factors have been suggested to contribute to obesity:
chronic stress, medications (VAN DER VALK et al., 2019) , increased consumption of
highly processed foods, elevated maternal age , sleep deprivation, endocrine
disruptors, pharmaceutical iatrogenesis, and intrauterine/intergenerational factors
(MCALLISTER et al., 2009) .
The imbalance of calorie intake and energy expenditure may result in excess
of body adiposity. Although obesity can be defined subjectively, a precise diagnostic
criterion is still missing. The Body Mass Index (BMI) is a commonly used
anthropometric measure of obesity. It is calculated by dividing the w eight by the
height squared (kg/m 2 ). An adult is considered obese if the BMI is over 30 kg/m 2 ,
though lower values are recommended for specific populations. For example, a BMI
cut-off value of 25 kg/m 2 is suggested for Asians and South Asians due to
associated health risks (NAM; PARK, 2018) .
Other anthropometric measurements have been proposed to diagnose
obesity. These include waist circumference (WC), waist-to-hip ratio (WHR) (DE
KONING et al., 2007) and waist-to-height ratio (WHtR) (ASHWELL et al., 2014) .
Indices that use WC are more accurate when it comes to evaluating the health risks
(CORRÊA et al., 2016) and predict chronic diseases (ASHWELL; GUNN; GIBSON,
2012) .
Excess adipose tissue is associated with several diseases, including type 2
diabetes, cardiovascular disease, and some types of cancers. The expansion of
adipose tissue can occur through cell multiplication, called hyperplasia, or due to the
accumulation of lipids (hypertrophic expansion). Metabolic complications secondary
23

to obesity, such as insulin resistance, hypertension, and dyslipidemia have a more
significant association to hypertrophy than hyperplasia, primarily when the
accumulation of lipids occurs in the visceral region (SHERLING; PERUMAREDDI;
HENNEKENS, 2017; TUNE et al., 2017) (ARNER, 1998) .
1.2. Investigating Metabolic Syndrome with High-throughput Technologies
Omics technologies have been applied to better understand the genetic
features of the MetS and related conditions. Genome-wide Association Studies
(GWAS) have shown that complex trait diseases are highly polygenic and that each
variant has very small contributions to the phenotype (FALL; INGELSSON, 2014) .
This can be partially explained by the lack of statistical power or the little influence
that genetics alone plays in metabolic disorders (ZHU et al., 2017) . Also, the genes
found in GWAS studies are unable to explain metabolic changes without proper
functional validation (VISSCHER et al., 2017) . Still, several GWAS focused on MetS
have been published to date (AVERY et al., 2011; KRAJA et al., 2011; ZABANEH;
BALDING, 2010) (LEE; KIM; PARK, 2018; ZHU et al., 2017) .
On the other hand, the number of MetS related diseases using transcriptome
techniques is much larger. The literature is, however, very heterogeneous - most
MetS studies focus on one of its components (DAO et al., 2018) , in co-morbidities
(HIRSCH et al., 2010) , or involves some type of intervention or treatment
(KOLEHMAINEN et al., 2012) (HULSMANS et al., 2012) . The main MetS component
found in these transcriptome studies was obesity. However, many of them focused
on interventions (GRACE et al., 2019; TAKAHASHI et al., 2019) , on associated
conditions (SINNOTT et al., 2017) , or on inflammatory processes (TAM et al., 2011) .
Microarray transcriptome studies have been able to unravel various biological
elements and complex pathways of MetS (BAKKER et al., 2018; DAO et al., 2018;
D’AMORE et al., 2018) . Most have tried to discover new molecular mechanisms
(BADOUD et al., 2017) and different phenotypes (WRUCK et al., 2015) . For
example, a co-expression study identified IL-6 and IL1B as highly differentially
24
co-expressed in adipose tissue from obese individuals (KOGELMAN et al., 2016) .
The same group performed a transcription factor co-expression analysis and
detected immune pathways, including the TGF-beta signaling pathway in adipose
tissue from obese patients (SKINKYTE-JUSKIENE; KOGELMAN; KADARMIDEEN,
2018) .
Another co-expression study, with discordant monozygotic twins, uncovered a
co-expression module that had a positive correlation with BMI. This co-expression
module was enriched with several lipid-related pathways, including regulation of
phospholipase activity and cholesterol transporter activity. Also, the authors
identified 32 DEGs from blood samples, and a possible association of NAMPT ,
TLR9 , PTGS2 , HBD , and PCSK1N and obesity (WANG et al., 2017) .
Although informative, the genes reported being associated with a
transcriptomic study overlap very poorly with those reported by another
transcriptomic study. Such discrepancies are frequently observed (MIKLOS;
MALESZKA, 2004) , raising questions about the reproducibility of scientific work.
These inconsistencies can be related to factors such as distinct gene expression
platforms, sample collection (EIN-DOR; ZUK; DOMANY, 2006; RADICH et al.,
2004) , and even small sample sizes causing reduced statistical power (CHOI et al.,
2003) .
A very large number of samples is required to reach a decent level of marker
stability (EIN-DOR; ZUK; DOMANY, 2006) . The ideal solution to overcome this
problem is to compare and integrate data from several studies into a meta-analysis
(CAHAN et al., 2007) , which improves the findings' reliability. Large datasets also
allow for co-expression network analyses, where large sets of genes are positively
correlated, leading to gene co-expression modules that increase the comprehension
and predictive power over mechanisms underlying genetic diseases.
25
1.3. Microarray technology and GEO-NCBI
Microarray technology is based on hybridization between target DNA from
samples and predefined DNA probes fixed on a platform. The technology is able to
measure the expression levels of tens of thousands of transcripts simultaneously in
a single sample. Despite its limitations compared with RNA-Seq technology
(SULTAN et al., 2008) , microarrays are well established in the scientific community
and are still a widely used technology for transcriptome analysis.
In addition, public databases contain data from millions of microarray
samples, allowing their use in large meta-analyses. For example, Kraja et al.
performed a meta-analysis in which single nucleotide polymorphisms (SNPs)
located near the genes COBLL1 , GRB14 and LYPLAL1 were associated with high
concentrations of fasting insulin, waist circumference, and risk for type 2 diabetes
(KRAJA et al., 2014) .
The GEO-NCBI (Gene Expression Omnibus - National Center for
Biotechnology Information) has been the most comprehensive and curated database
in the literature. The database only includes studies that follow strict content
guidelines from the Minimum Information About a Microarray Experiment (MIAME)
(BARRETT et al., 2007) and is accessible at (www.ncbi.nlm.nih.gov/geo/). This
international public repository contains gene expression, DNA methylation, protein,
SNP, and genomic variation studies (CLOUGH; BARRETT, 2016) . The database
also provides query tools to search and download raw and normalized data from
arrays and sequencing-based studies. In 2018, there were over 2.8 million samples,
and a whopping 106.000 studies (series) available in the database.
1.4. Gene Co-expression Analysis
Gene co-expression analysis aims to find genes with similar gene expression
patterns in different biological conditions (ZHANG; HORVATH, 2005) . Using thi s
approach, we can construct a network by computing a similarity (correlation) score
for each pair of genes. If the similarity score is higher than a threshold, then the
26

genes are connected in the graph in an undirected way (because the correlation is
symmetric). Co-expression profiles can provide insight into cellular processes since
they usually encode interacting proteins (BELLOT et al., 2015) .
The Weighted Gene Co-expression Network Analysis (WGCNA) method
considers the relationships between the transcripts by quantifying the correlations
between gene pairs and evaluating the extent to which the genes share the same
interaction neighbor (ZHANG; HORVATH, 2005) . In summary, this method groups
genes in modules according to the gene co-expression variation calculated by the
Pearson correlation coefficient, which makes it possible to ascertain gene
expression profiles between the different experimental conditions (LANGFELDER;
HORVATH, 2008) . These modules possibly contain genes belonging to the same
biological processes (pathways) and regulation. The WGCNA method transforms
thousands of probes from the microarray study into dozens of modules, reducing the
high dimensionality of data and eliminating the need for multiple tests
(LANGFELDER; HORVATH, 2012) .
1.5. Systems Biology
Biological systems involve many types of components (e.g. genes, proteins,
metabolites, etc.) that interact with each other in a complex manner. Analyzing this
network can be challenging and overwhelming (WALPOLE; PAPIN; PEIRCE, 2013) .
Systems biology analysis strategy follows a holistic approach and seeks to
understand, identify the patterns, and quantify the interactions of biological
components by integrating various types of data using computational and statistical
models (KRIETE et al., 2011) .
The development of context-specific gene modules and gene networks of
signaling pathways facilitate the visualization of systems biology results, in addition
to keeping them within a biological context (STEVENS et al., 2014) . Using this
approach, we can apply systems biology tools to all health science areas, such as:
immunology (PRADA-MEDINA et al., 2017) , infectious diseases (KWISSA et al.,
27
2014) , neurology (MORELLO et al., 2018; RUSSELL-BUCKLAND; BARNES;
TACHTSIDIS, 2019) , vaccinology (KAZMIN et al., 2017; NAKAYA; PULENDRAN,
2012) , endocrinology (STEVENS et al., 2014) , oncology (ARCHER et al., 2016) ,
odontology (ADEOLA; PAPAGERAKIS; PAPAGERAKIS, 2019) , and pharmacology
(MA’AYAN et al., 2014; STÉPHANOU et al., 2018) as well as to biomarker discovery
(LIN et al., 2018) .
1.6. miRNAs
miRNAs (microRNAs) are small non-protein-coding RNA molecules that
regulate the gene expression of thousands of mRNAs. They hybridize to
complementary sequences from the 3' untranslated region (3'-UTR) of target
messenger RNA (mRNA), leading to translation inhibition or destabilization and
direct cleavage of the target transcript (BARTEL, 2004) . In addition, miRNAs can
compete for 5' CAP (PESTOVA et al., 2001) , inhibit ribosome assembly
(CHENDRIMADA et al., 2007) , promote target mRNA deadenylation (WAKIYAMA;
YOKOYAMA, 2010) , prematurely disassemble the ribosome (PETERSEN et al.,
2006) , cleave target mRNA (LLAVE et al., 2002) (PALATNIK et al., 2003) or even
promote the deadenylation followed by the removal of 5` CAP (BEHM-ANSMANT;
REHWINKEL; IZAURRALDE, 2006) .
Briefly, the canonical biogenesis of miRNAs begins when RNA polymerase II
transcribes the miRNA gene into its primary miRNA (pri-miRNA). This precursor
molecule has secondary structures called hairpins (SMALHEISER, 2003) that are
cleaved by the RNase III DROSHA-DGCR8 complex (LEE et al., 2003) . The
resulting molecule is about 70 bases and is called a miRNA precursor (pre-miRNA).
Subsequently, a nuclear export receptor-dependent on the Ran-GTP cofactor,
Exportin-5, mediates the displacement of the pre-miRNA into the cytosol (LUND et
al., 2004) . Finally, the mature pre-miRNA is processed by cytoplasmic RNase III
DICER to form the mature miRNA of approximately 18 to 24 nucleotides
(BERNSTEIN et al., 2001) .
miRNAs are non-canonical when their biogenesis bypasses the canonical
biogenesis pathway (ABDELFATTAH; PARK; CHOI, 2014) . Drosha or
28
Dicer-independent pathways can synthesize them. The absence of Drosha and
Gdcr8 does not affect non-canonical miRNA production (RUBY; JAN; BARTEL,
2007) . Although Dicer is required for most miRNA synthesis, there are miRNAs can
mature independently of Dicer. For example, mir-451 matures without the
microprocessor of the Dicer pathway because of its pri-miRNA small size after
Drosha/Dgcr8 cleavage in the nucleus (GEBERT; MACRAE, 2019) .
miRNAs are present in several human tissues (LIANG et al., 2007) , as well as
most biological fluids such as serum (GILAD et al., 2008) , plasma (CHIM et al.,
2008) and urine (MELKONYAN et al., 2008) . Its extracellular stability can increase
when associated with lipid or protein carriers. For instance, the bound with Ago2, a
protein of the RNA-induced silencing complex, protects against endogenous RNAse
(TURCHINOVICH et al., 2011) degradation. Furthermore, lipid carriers such as
extracellular vesicles (exosomes, microparticles, microvesicles) (VICKERS;
REMALEY, 2012) and lipoproteins (VICKERS et al., 2011) allow miRNAs to be
transported throughout the body and exchanged between different cells.
The latest update of the miRBase database (version 22), has identified and
cataloged 1982 precursors of miRNAs and 2694 mature miRNAs from humans
(KOZOMARA; BIRGAOANU; GRIFFITHS-JONES, 2019; KOZOMARA;
GRIFFITHS-JONES, 2014) . Most of these miRNAs can regulate hundreds of
mRNAs, and several miRNAs can target a single mRNA (KREK et al., 2005) .
The immense influence and regulatory activity of miRNAs on the
post-transcriptional mechanisms of mRNAs indicates a potential target in diseases.
Analysis of the expression profile of miRNAs has already provided molecular
markers for the detection of various diseases and may contribute to the discovery of
new therapies (MCGREGOR; CHOI, 2011) .
Associations between MetS and miRNAs have already been established by
Karolina et al. (2012) in the analysis of circulating miRNAs in patients with MetS,
hypercholesterolemia, type 2 diabetes, or systemic arterial hypertension. Groups of
differentially expressed miRNAs in MetS were uncovered for each MetS associated
disease (dyslipidemia, diabetes, and hypertension). They also uncovered miRNAs
29
expression positively correlated with BMI, high blood pressure, and fasting blood
glucose (KAROLINA et al., 2012) .
Increased expression of circulating let-7g and miR-221 was associated with
hyperglycemia and other components of the MetS in women. Also, let-7g was
associated with low HDL cholesterol and hypertension, while miR-221 was not
associated with any risk (WANG et al., 2013b) .
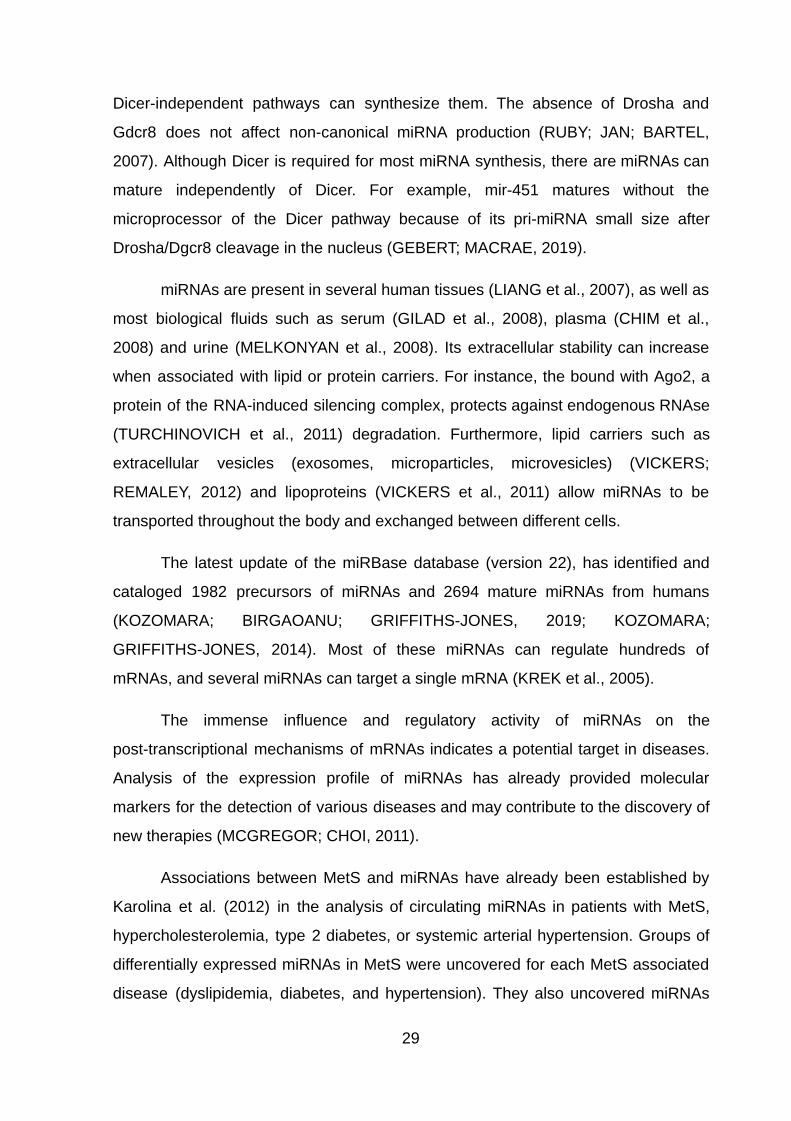
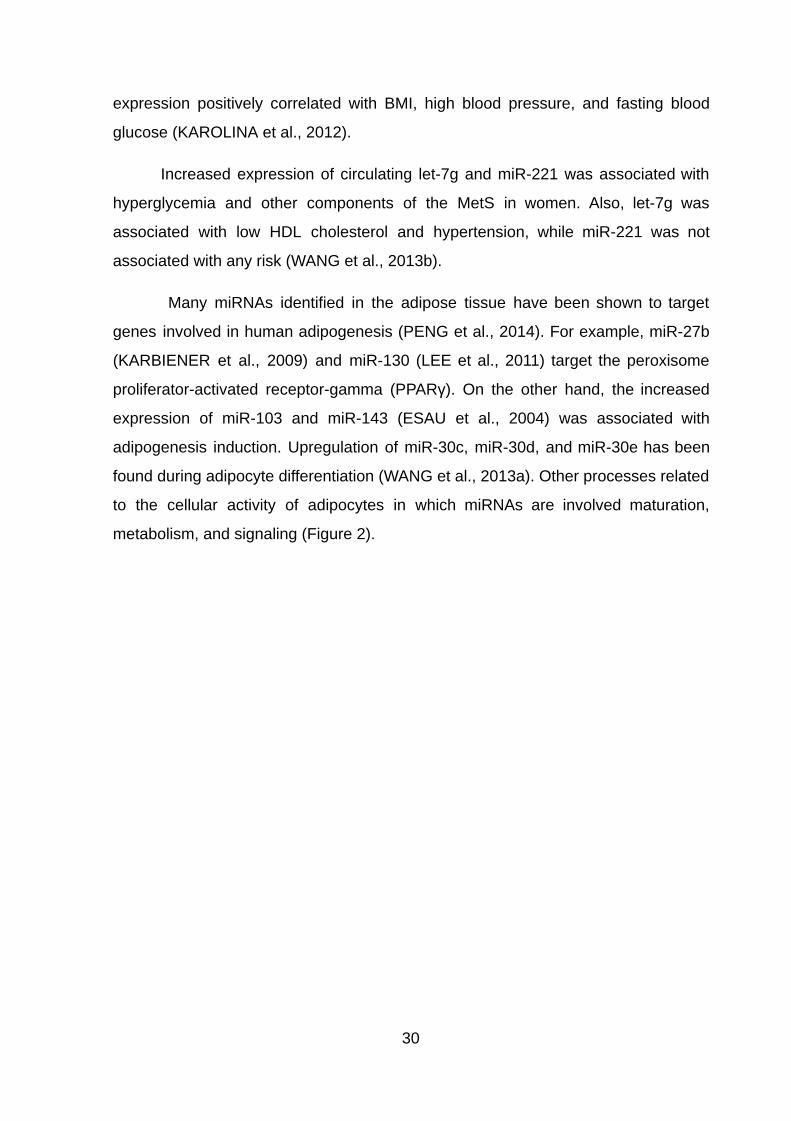
Many miRNAs identified in the adipose tissue have been shown to target
genes involved in human adipogenesis (PENG et al., 2014) . For example, miR-27b
(KARBIENER et al., 2009) and miR-130 (LEE et al., 2011) target the peroxisome
proliferator-activated receptor-gamma (PPARγ). On the other hand, the increased
expression of miR-103 and miR-143 (ESAU et al., 2004) was associated with
adipogenesis induction. Upregulation of miR-30c, miR-30d, and miR-30e has been
found during adipocyte differentiation (WANG et al., 2013a) . Other processes related
to the cellular activity of adipocytes in which miRNAs are involved maturation,
metabolism, and signaling (Figure 2).
30
Figure 2 - Adipocyte functions and examples of miRNA-mediated regulation
Adipocyte processes influenced by miRNAs: glucose uptake (miR-93 and miR-223), lipolysis and β-oxidation (miR-145), triglyceride synthesis (miR-125b), insulin signaling (miR-144), browning (miR-150 and miR-34a), adiponectin synthesis (miR-193b) and inflammation (miR-146b-5p in macrophages). Source: Brandão, Guerra e Mori (2017).
Although miRNAs are an essential part of transcriptomic regulation,
epigenetic factors such as DNA methylation (WILSON et al., 2017; XU et al., 2018) ,
histone modifications (NIE et al., 2017) have shown to contribute to obesity
development. Other MetS components like as insulin resistance (ARNER et al.,
2016) and hypertension (STOLL; WANG; QIU, 2018) have also shown to be
influenced by epigenetics. It comes as no surprise that environmental factors can
positively (ARMENISE et al., 2017) or negatively (MESSAOUDI et al., 2017)
31
influence metabolic diseases. Even the uterine environment can affect fetal
epigenome in the early stages of human development (LING; RÖNN, 2019) .
MetS is a multifactorial disease with a significant epidemiological, economic,
and sociological impact. Even though several GWAS and candidate genes
association studies have found obesity and MetS related genes, there are still
divergences of the relevant genes among the studies. The identification of the MetS
gene expression signature can help understand the role of miRNA in MetS and even
impact the development of diagnostic/prognostic methods. Therefore, the use of a
data-driven holistic method of analysis was proposed to investigate consensus
target genes of miRNAs involved in this complex disease. For this, several
microarray studies were integrated, gene modules associated with MetS were
developed and the interactions of the differentially expressed genes with regulatory
miRNAs were analyzed.
32

2. Aims
2.1. Main Aim
To use systems biology and meta-analysis tools to identify the molecular
signaling pathways in MetS .
2.2. Specific Aims
To identify a consistent gene expression signature for obesity through a
comprehensive meta-analysis of transcriptomic studies.
To identify consistent gene co-expression modules in MetS and obesity.
To reveal genes and signaling pathways not yet described as being related to
MetS and obesity.
To analyze circulating miRNA profiles in patients with MetS using PCR
miRNA array.
To identify potential regulatory miRNAs by integrating gene co-expression
analysis of obesity and miRNAs associated with MetS.
33
3. Material and Methods
3.1. Study workflow
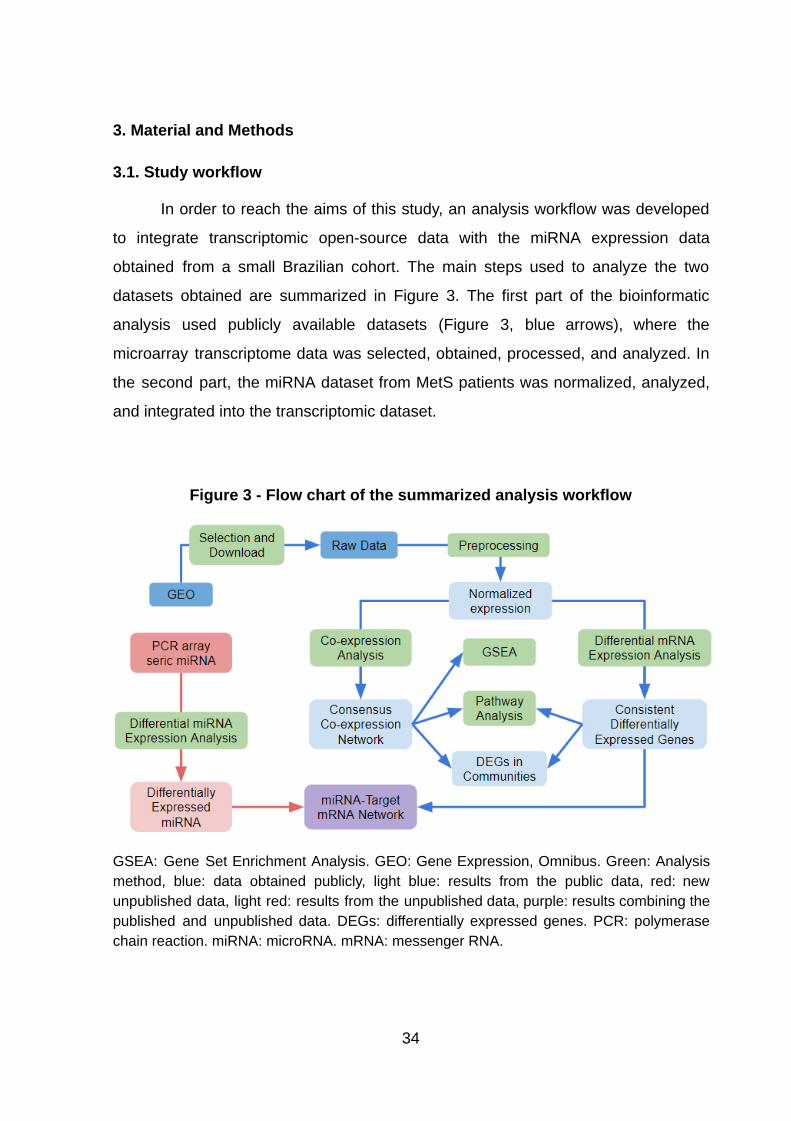
In order to reach the aims of this study, an analysis workflow was developed
to integrate transcriptomic open-source data with the miRNA expression data
obtained from a small Brazilian cohort. The main steps used to analyze the two
datasets obtained are summarized in Figure 3. The first part of the bioinformatic
analysis used publicly available datasets (Figure 3, blue arrows), where the
microarray transcriptome data was selected, obtained, processed, and analyzed. In
the second part, the miRNA dataset from MetS patients was normalized, analyzed,
and integrated into the transcriptomic dataset.
Figure 3 - Flow chart of the summarized analysis workflow
GSEA: Gene Set Enrichment Analysis. GEO: Gene Expression, Omnibus. Green: Analysis method, blue: data obtained publicly, light blue: results from the public data, red: new unpublished data, light red: results from the unpublished data, purple: results combining the published and unpublished data. DEGs: differentially expressed genes. PCR: polymerase chain reaction. miRNA: microRNA. mRNA: messenger RNA.
34

3.2. Selection of mRNA expression microarray studies from a public database
Initially, we performed an online survey of gene expression studies in the
GEO-NCBI on MetS, and related diseases: obesity, hypertension (SAH),
dyslipidemia (DL), hypertriglyceridemia (HT) and insulin resistance. In this study, the
terms used were: metabolic syndrome, obesity, hypertension,
hypoalphalipoproteinemia, low high-density lipoprotein, low HDL, dyslipidemia,
hypertriglyceridemia, and insulin resistance. The search was performed in Mar 2015
and updated in May 2018 with the following filters: “Series” (Entry Type), "Homo
sapiens" (Organism); "Expression profiling by array" (Study Type). In this way, only
studies performed in humans and with transcriptomic data analyzed by microarray
technology were compiled.
In order to ensure correct classification of the microarray studies, the
annotation of each study was performed manually. This annotation involved reading
the GEO-NCBI Summary and Overall design fields and related scientific articles,
identifying studies not consistent with the search criteria, classification according to
disease, processed tissues, analysis platform used and the number of samples.
The following criteria were used to exclude studies from the analysis: no
sample identification; non-human; less than 15 samples in total; derived from cell
culture; derived from cell lineage; other disorders not characteristic of the metabolic
syndrome (cancer, infections, polycystic ovary, autoimmune diseases, etc); and
combination of more than 1 study (Superseries). Also, within the selected studies,
samples collected after intervention or experimental procedures were excluded. A
few examples of intervention were: physical activity, food supplementation, drug
treatments, and surgical procedures.
3.3. The download of mRNA expression data
After study selection, the raw data were obtained from GEO using scripts
developed by our research group at the Computational Laboratory of Systems
Biology (CSBL). One of the scripts uses the Perl language to automatically
35
download the raw expression, sample annotation, and probe annotation files for
each study. Also, when the raw expression file was not available, normalized
expression files provided by the authors were downloaded.
Next, duplicate samples between the studies were identified through a script
that uses the "md5sum" program. The "md5sum" uses the MD5 algorithm to create
a 128-bit code for any input file (RIVEST, 1992). This code works like a compact
fingerprint that changes entirely by changing a single bit of the output file.
3.4. Pre-processing and Reanalysis from GEO Database
3.4.1. Normalization
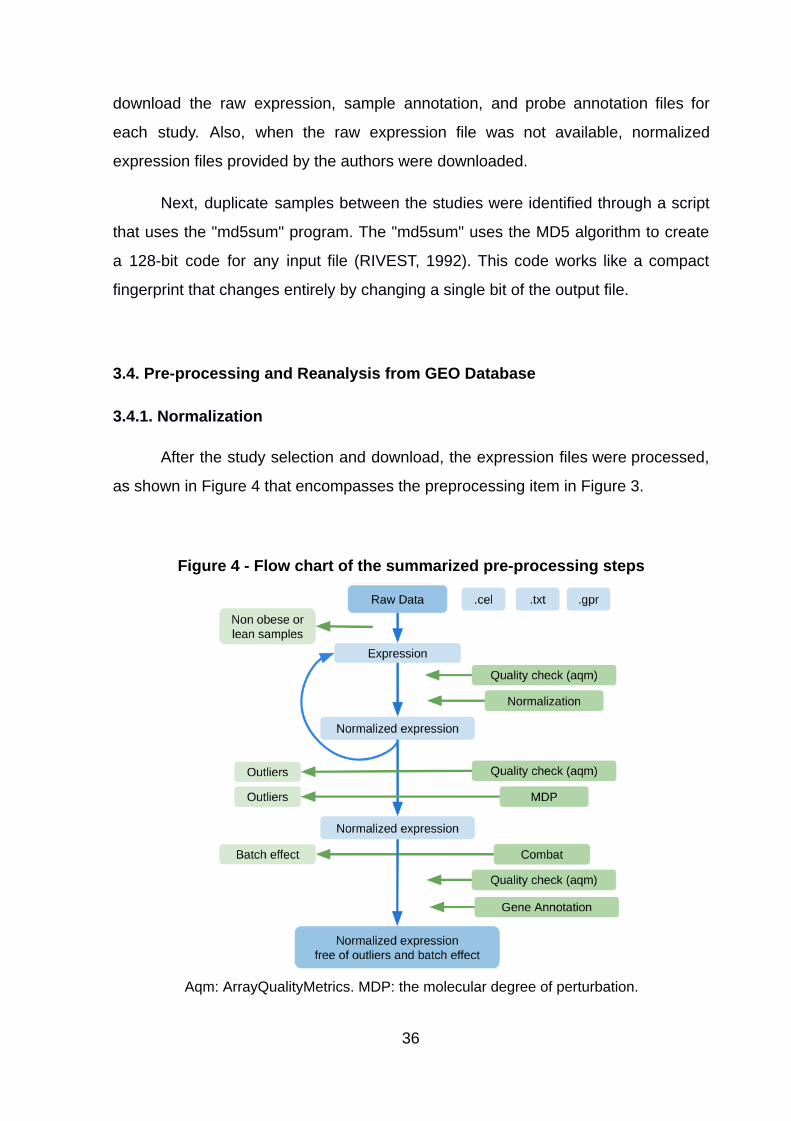
After the study selection and download, the expression files were processed,
as shown in Figure 4 that encompasses the preprocessing item in Figure 3.
Figure 4 - Flow chart of the summarized pre-processing steps
Aqm: ArrayQualityMetrics. MDP: the molecular degree of perturbation.
36
3.4.1.1 Normalization: Pre-processing: Affymetrix platforms
The samples processed by the Affymetrix gene expression platform were
normalized by RMA (Robust Multi-array Average), using the affy version 1.6.0 data
package present in Bioconductor (R language). This process consists of the
following steps: raw reading files “.CEL”, background correction of the gross values
of the fluorescence intensity by whole array adjustment and normalization by
quantile (BOLSTAD et al., 2003).
3.4.1.2. Normalization: Agilent platforms
The raw gene expression files (“.gpr” or “.txt”) from the Agilent platform
normalized using the Linear Models for Microarray (LIMMA, version 3.38.3)
package. This process consists of the following steps: loading the raw files
(read.maimages), background correction (backgroundCorrect) and normalization by
quantile (normalizeBetweenArrays) (BOLSTAD et al., 2003) (see Fig. 2).
3.4.1.3. Normalization: Illumina platforms
The studies obtained from Illumina gene expression platforms did not
undergo normalization. The already normalized data by the authors was obtained
because the upload of raw files in the GEO database is not as standard as the other
microarray platforms.
3.4.2. Sample quality control
After normalization of the gene expression and annotation of the samples,
quality control tests were necessary to evaluate the normalization of the data and
identify batch effects. These tests were done by signal distribution analysis (using
boxplot and histogram representation), Principal Component Analysis (PCA), use of
the arrayQualityMetrics package (version 3.38.0) (KAUFFMAN et al., 2009) and
correlation matrices between the samples. The samples that did not pass 3 or more
out of 5 and had very different signals from the others were discarded. Also, the
potential batch effects were corrected using the ComBat program (JOHNSON; LI;
37
RABINOVIC, 2007), which is part of the surrogate variable analysis (LEEK;
STOREY, 2007).
3.4.3. Outlier Removal with Molecular Degree of Perturbation
Our research group has developed an R package to assess the Molecular
Degree of Perturbation (MDP), which evaluates the heterogeneity of gene
expression samples. In general terms, MDP calculates the degree of perturbation of
each gene relative to the same gene identified in a healthy or control group of
samples. Only with those highly disturbed genes, a representative disturbance score
is set for each sample. Therefore, MDP can identify so-called sound samples that
present some alteration in the transcriptome unidentified by phenotype.
The MDP tool identified outliers samples; in other words, samples in which
the MDP score was outside the interval of the group scores. The outlier removal was
performed by manually checking the ordered MDP values, and removing them with
an R script since the package has not been automated to detect these outlier
samples.
3.4.4. Annotate and collapse probes
The final step of the pre-processing was the annotation of the probe IDs into
gene symbols and probe summarization. The probe annotation was performed using
the most recent annotation file included in the package of each platform. The
summarization of probes was performed using collapseRows from the WGCNA
package (version 1.67). To represent each unique gene symbol, the probe with the
highest average of expression was chosen (method = MaxMean).
3.4.5. Sample annotation
Each sample from all studies was manually classified into the studied
phenotypic groups.
38
3.5. Differentially expressed genes related to MetS
3.5.1. LIMMA
Traditionally, the main focus of transcriptome data analysis is the differential
expressed genes. Finding up or downregulated genes can shed light on driving the
molecular processes and pathways of a specific condition. LIMMA (version 3.38.3) R
package (RITCHIE et al., 2015) was used to detect differentially expressed genes
(DEGs) between obese and non-obese patients for each study and tissue type.
Array probes without gene symbol annotation were filtered out before LIMMA
analysis. Genes were considered up or downregulated genes when fold-change
(FC) was higher or lower than |1.5| and had an adjusted p-value lower than 0.05.
3.6. Gene co-expression analysis
3.6.1. Gene Co-expression Analysis with CEMiTool
The construction of highly correlated gene modules was generated by the
WGCNA method adapted in the CEMiTool (version 1.7.9) R package (RUSSO et al.,
2018) . We developed this package to automate the WGCNA analysis by optimizing
parameters and creating an easy to use Bioconductor package. The most important
automatization is the selection of the beta parameter and consequently, the creation
of the gene co-expression modules. For each study, the same standard parameters
recommended in the package were used, including Pearson’s Correlation Coefficient
(PCC) for the correlation method and the use of automatic gene filtering. For each
study, all the results from the CEMiTool analysis were stored in a cem object,
including the module of co-expressed genes.
3.6.2. Identification of consensus communities between studies
The consensus module detection consisted of storing the cem objects into a
list for each tissue, and applying the cem_overlap function. The resulting network
was then processed to prioritize the edges (correlations between genes) of high
confidence. This consisted of selecting the edges with present in: 1) at least 2
39

studies; 2) 2 studies and a PCC average > 0,8; 3) 3 studies and with a PCC average
> 0,75; 4) 4 studies and with a PCC average > 0,7; 5) 5 studies and with a PCC
average > 0,65; 6) 6 studies and with a PCC average > 0,6; 7) 7 studies and with a
PCC average > 0,55; 8) 8 studies and with a PCC average > 0,5; 9) more than 9
studies with a PCC > 0,45.
The consensus co-expression network was partitioned in communities, dense
interconnected parts of the network (REICHARDT; BORNHOLDT, 2006), using a
method based on the spin-glass algorithm from the igraph package (version 1.2.4.1).
We defined 10 genes as the minimum number of genes in the community. The
communities of the consensus network were represented in a graph using Gephi
software (version 0.9.2) (BATIAN et al., 2009). Next, functional and enrichment
analyses were performed for each co-expression community of the consensus
network. The following items describe both of the aforementioned analyses.
3.6.3. Protein-protein interaction between genes of modules
Protein-protein interaction (PPI) information was obtained from experiments
validated by Western blot, co-immunoprecipitation, two-hybrid, among others
available. For this purpose, the public database GeneMANIA: Multiple Association
Network Integration Algorithm (http://genemania.org/data/) was being used. The
genes pertaining to each module were connected to each other based on the
protein-protein interactions of the above databases.
3.6.4. Identification of pathways related to MetS
In order to identify biological pathways related to each group of genes
(modules or communities), we performed a functional enrichment analysis using the
Over-Representation Analysis (ORA) method with the clusterProfiler package
(version 3.10.1) (YU et al., 2012) . Briefly, this analysis uses the hypergeometric
statistical test to verify if a module overlaps (is enriched) with genes from a given
biological pathway. The significance of the test is adjusted for multiple tests by the
Benjamini-Hochberg method (BENJAMINI, HOCHBERG, 1995).
40
The genes belonging to metabolic pathways, cellular and molecular
processes, were obtained in GMT format from the Reactome
( http://www.reactome.org/ ) database. The adjusted p-values were ordered, and the
pathways with -log10 greater than two were considered statistically significant. The
result of this analysis was stored in a table of adjusted p-values, in which each row
represents a module and each column a possible pathway or biological function
associated with the module.
3.7.5. Gene Set Enrichment Analysis
The groups of co-expressed genes (modules or communities) underwent a
Gene Set Enrichment Analysis (GSEA) to associate with a disease or a healthy
control phenotype. The GSEA method determines if a gene set, or group of genes,
shows statistically significant differences between two biological conditions
(SUBRAMANIAN et al., 2005) . The Lander and Mesirov group developed this
algorithm to determine if the members of a set gene tend to occur in the upper (or
lower) part of a list of genes ordered by degree of association to one of the two
phenotype classes (TIAN et al., 2005) . For this, the method applies the
Kolmogorov-Smirnov test to find asymmetric distributions for defined gene blocks in
the geneset distribution. It is interesting to note that the first article published with
this method compared the gene expression profile of muscle biopsies between
diabetic patients and healthy individuals (MOOTHA et al., 2003) .
The GSEA software ( http://www.broadinstitute.org/gsea ) used in this study
was implemented in the fgsea package (version 3.10.1) from Bioconductor
(SERGUSHICHEV, 2016). The gene sets had the “.GMT” format and the expression
data were passed to the program through 2 files: one containing the phenotype
information of the samples (.CLS format) and the other containing the gene
expression profile of the samples (.GCT format).
The GSEA results are enrichment scores (ES), which reflect how much the
modules are represented at the top (positive value) or the bottom (negative value) of
41
a sorted list of genes. In this case, the lists were composed of genes ordered by
increasing gene expression of each clinical condition.
The normalized enrichment score (NES) is preferred for comparing analyzes
because it takes into account the module size and possible correlations between
modules and gene expression data. Still, statistical significance was estimated by
1,000 permutations of the expression data of the members of the modules, and the
false positive rate was controlled by the False Discovery Rate (FDR) of 0.005.
3.7. Analysis of miRNAs profile form Metabolic Syndrome patients
So far, no studies have performed miRNA profiling of Brazilian patients with
MetS that compares to subjects without MetS. Also, scarce intervention studies are
investigating the role of miRNAs in MetS (MARQUES-ROCHA et al., 2016) . MiRNA
profiling is important to identify possible biomarkers specific to this population.
3.7.1. MiRNAs expression profile in MetS patients
Sample collection, storage, preparation, and miRNA profiling were carried out
by collaborators at the Laboratory of Molecular Investigation in Cardiology (LIMC) of
the Dante Pazzanese Institute of Cardiology (IDPC). The results provided are from a
collaborative project that was approved by the FCF-USP and IDCP Ethics
Committee.
3.7.2. Subjects
Six volunteers who met the criteria of MetS according to IV Brazilian
Guidelines on Dyslipidemias and Prevention of Atherosclerosis of the Department of
Atherosclerosis of the Brazilian Society of Cardiology were selected for this study.
Also, the control group was composed of six healthy volunteers (Table 2).
42
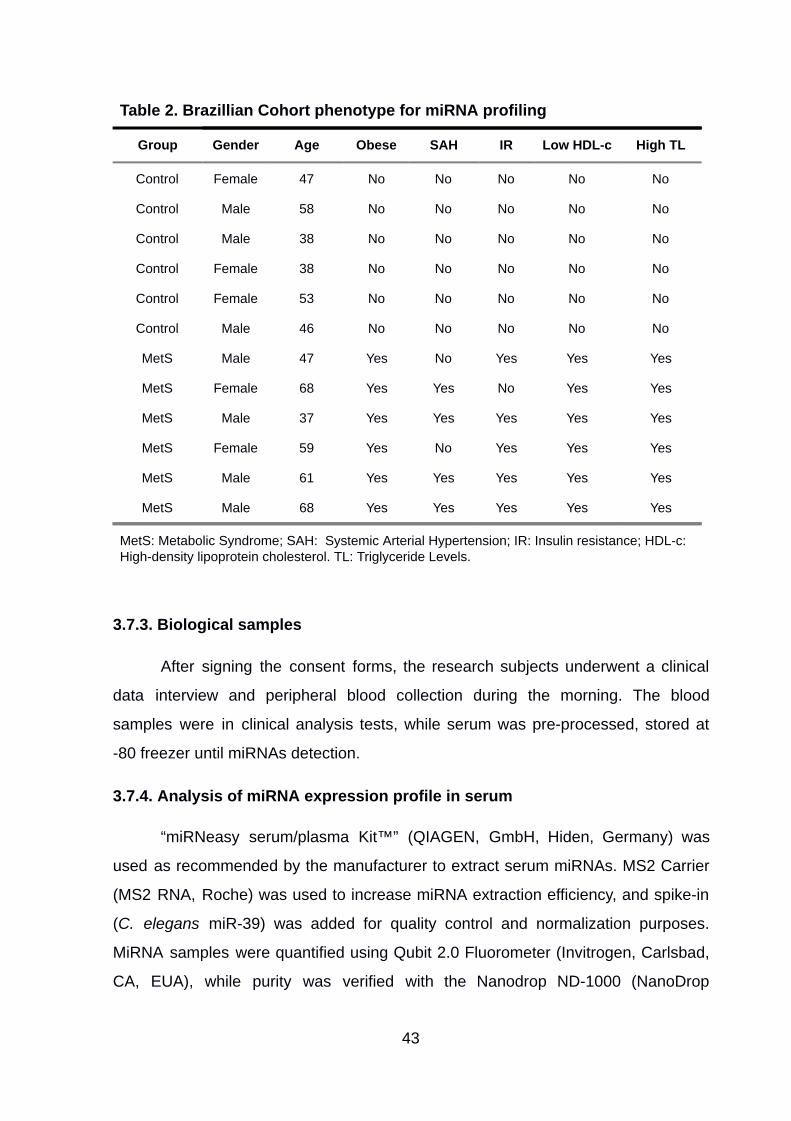
Table 2. Brazillian Cohort phenotype for miRNA profiling
Group Gender Age Obese SAH IR Low HDL-c High TL
Control Female 47 No No No No No
Control Male 58 No No No No No
Control Male 38 No No No No No
Control Female 38 No No No No No
Control Female 53 No No No No No
Control Male 46 No No No No No
MetS Male 47 Yes No Yes Yes Yes
MetS Female 68 Yes Yes No Yes Yes
MetS Male 37 Yes Yes Yes Yes Yes
MetS Female 59 Yes No Yes Yes Yes
MetS Male 61 Yes Yes Yes Yes Yes
MetS Male 68 Yes Yes Yes Yes Yes
MetS: Metabolic Syndrome; SAH: Systemic Arterial Hypertension; IR: Insulin resistance; HDL-c: High-density lipoprotein cholesterol. TL: Triglyceride Levels.
3.7.3. Biological samples
After signing the consent forms, the research subjects underwent a clinical
data interview and peripheral blood collection during the morning. The blood
samples were in clinical analysis tests, while serum was pre-processed, stored at
-80 freezer until miRNAs detection.
3.7.4. Analysis of miRNA expression profile in serum
“miRNeasy serum/plasma Kit™” (QIAGEN, GmbH, Hiden, Germany) was
used as recommended by the manufacturer to extract serum miRNAs. MS2 Carrier
(MS2 RNA, Roche) was used to increase miRNA extraction efficiency, and spike-in
( C. elegans miR-39) was added for quality control and normalization purposes.
MiRNA samples were quantified using Qubit 2.0 Fluorometer (Invitrogen, Carlsbad,
CA, EUA), while purity was verified with the Nanodrop ND-1000 (NanoDrop
43
Tehnologies Inc., Wilmington, EUA). The miRNA was converted to cDNA using the
miScript II Reverse Transcription (Qiagen) and then stored in -20 o C until the
RT-qPCR.
The global miRNA expression analysis was performed by PCR array (Qiagen)
according to the manufacturer's protocol. First, the miRNAs underwent reverse
transcription to complementary DNA (cDNA) with the miScript II RT Kit (QIAGEN,
GmbH, Hiden, Alemanha). The cDNAs were stored at -20ºC until PCR array.
The quality control of cDNA samples was performed with the miScript miRNA
QC PCR array (código MIHS-989ZE-1, QIAGEN GmbH, Hilden, Alemanha) plate
quat contains 4 control miRNAs (cel-miR-39-3p, cel-miR-16-5p, cel-miR-21-5p,
cel-miR-191-5p), 3 non-coding RNA (SNORD 61, SNORD 95, SNORD 96A), miRTC
(reverse transcription control) e PPC (PCR reaction positive control) for each
sample. Only the samples that passed quality control checks were used in the PCR
array.
The miRNA expression was analyzed using commercial miScript miRNA PCR
Array Human miFinder 384HC (código MIHS-3001Z, QIAGEN GmbH, Hilden,
Alemanha). This panel detects 372 miRNAs whose expression is abundant in most
tissues and fluids, and are best characterized in the miRBase database registry
(www.miRBase.org).
The QuantStudio ™ 12K Flex Real-Time PCR System (Thermo Fisher
Scientific, Waltham, MA, USA) system was used for the PCR reaction detection. The
raw “.eds” files were initially processed in Expression Suite Software v1.0.3. This
software allowed to remove the qPCR reactions with more than 2 peaks from the
dissociation curves (TM) and automatically established one threshold for each
miRNA applied to all samples and plaques. The sample Ct values were obtained
and exported to the “.txt” format for the normalization with R written scripts.
The PCR efficiency was accessed if the Ct values of Positive PCR Control
(PPC) comprised between 17 and 21. The reverse transcriptase (RT) inhibition also
verified by subtracting the mean of the miRTC Ct values from the mean of the PPC
Ct values [ mean(Ct miRTC ) - mean(Ct PPC ) ]. The resulting values above 7 may indicate
the presence of sample impurities that inhibit the RT reaction.
44
Variations of the qPCR reaction due to RNA extraction were corrected by the
spike-in-control (cel-miR-39-3p) normalization. This normalization step of the Ct
values was done by calculating the correction factor for each sample, and adding
this factor to the Ct of all the miRNAs in that sample. The correction factor of a
sample was equal to the mean of the Ct cel-miR-39-3p values of all samples
subtracted by the mean of the cell-miR-39-3p of the same sample.
Next, we chose the normalization method based on housekeeping miRNAs.
For this, all miRNAs that had missing Ct values were removed. Then the miRNA
expression set was submitted to the function selectHKgenes implemented in the
SLqPCR package (version 1.50.0). This function implements the geNorm method of
reference transcript selection, in our case, miRNAs. All the miRNAs underwent the
M-value (mean of expression stability) calculation. We chose the 5 most stable
miRNAs, in other words, miRNAs with the lowest M-values, and normalized the all
miRNAs Ct values with the average Ct of the normalizing miRNAs
(VANDESOMPELE et al., 2002) .
The mRNA expression was calculated by the relative quantification method
with the formula 2 -(ΔΔ Ct) , where ΔΔCt = ΔCt Disease - ΔCt Control), and ΔCt = Ct
(each miRNA) – MeanCt (normalizing miRNAs). Differential expression analysis was
performed with a T-test to find out which miRNAs had increased or decreased
expression in the MetS concerning the group of patients not affected by the disease.
The differentially expressed miRNAs were compared with the results of the
bioinformatics analysis of microarray studies.
3.8. miRNA and target mRNA interactions
In order to identify miRNAs that regulate the differentially expressed genes,
experimentally validated miRNA-mRNA interactions from the miRTarBase database
(version 7.0, 15/09/2017 release) were used (CHOU et al., 2018) . The visualization
of the interaction networks of the differentially expressed miRNAs and their target
genes were created either in Gephi (version 0.9.2) or Cytoscape (version 1.8.0)
software.
45
4. Results
4.1. Selection of public microarrays mRNA expression studies
The GEO-NCBI search for gene expression studies of MetS and related
diseases produced a total of 632 studies. However, only 43.35% (274/632) of these
studies were derived from microarray technology. The study annotation and manual
curation of microarray gene expression studies were followed by study removal
according to the established inclusion and exclusion criteria. These criteria removed
an astounding 80.3% (220/274) of the studies.
Most of the studies (45%, 99 studies) were excluded because patients had
other diseases, such as cancer and infectious diseases. In addition, of the 220
excluded studies, 45 studies (20.45%) had less than 14 samples, 29 (13.18%) were
of cell lineage or culture, 15 (6.82%) had no disease, 10 (4.55%) had no information
on the samples, 9 (4.09%) were from non-commercial platforms, 7 (3.18%) were
Superseries, and 6 (2.73%) studies were not from humans.
Of the 54 studies that passed the initial exclusion criteria, 28 studies did not
have a control group, resulting in 26 studies that had patient information about
obesity or MetS (Table 3). Still, some of these studies had patient samples that did
not meet the inclusion criteria. For example, those patients who suffered some type
of intervention (medical or nutritional), who had type 2 diabetes or other diseases
were excluded. In the end, our study had a total of 815 samples, 339 were control
patients, and 476 samples had diseases (Table 4). The studies were categorized
according to the subjects’ tissue samples: subcutaneous adipose tissue (SAT), liver,
muscle, and blood (Figure 5).
Due to all of these issues, were only able to find two studies that had patients
with and without Metabolic Syndrome. Among all of the components of MetS,
obesity had the highest number of studies in the database, the reason why those
studies were chosen. Since the aim was to investigate miRNAs in MetS, we
combined obesity transcriptomic studies with the miRNAs profile from MetS patients.
46
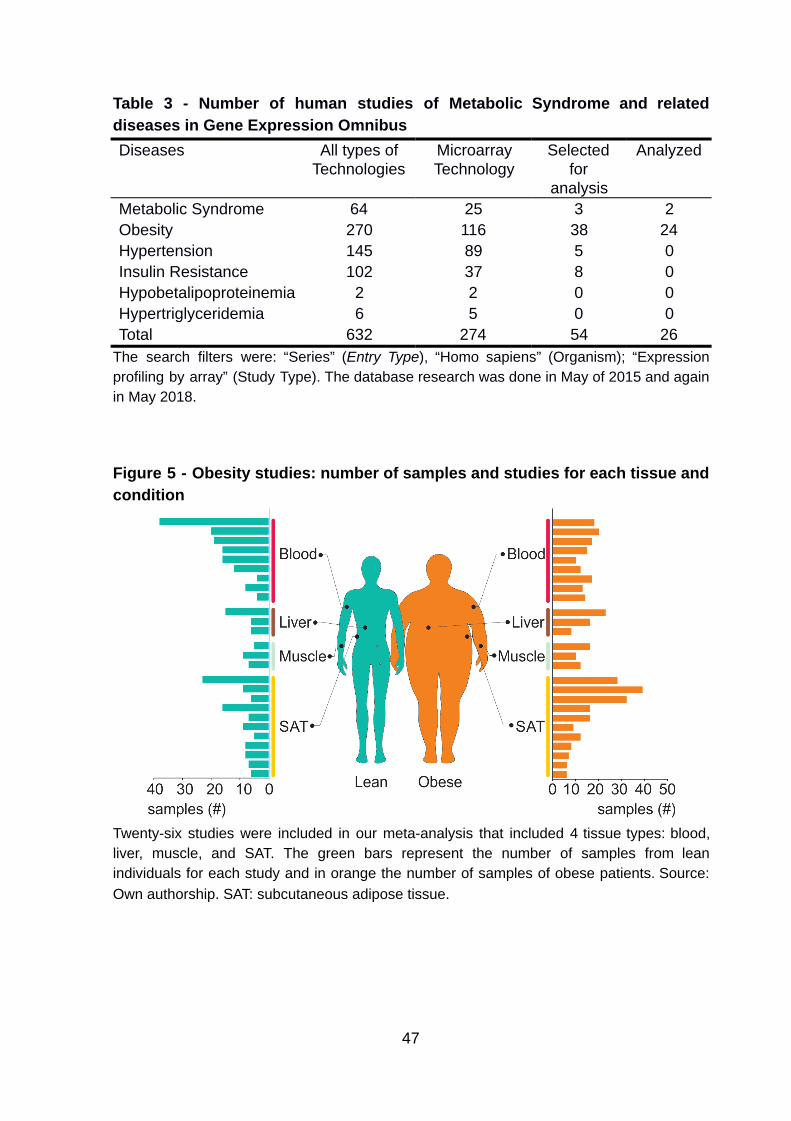
Table 3 - Number of human studies of Metabolic Syndrome and related diseases in Gene Expression Omnibus Diseases All types of
Technologies Microarray Technology
Selected for
analysis
Analyzed
Metabolic Syndrome 64 25 3 2 Obesity 270 116 38 24 Hypertension 145 89 5 0 Insulin Resistance 102 37 8 0 Hypobetalipoproteinemia 2 2 0 0 Hypertriglyceridemia 6 5 0 0 Total 632 274 54 26
The search filters were: “Series” ( Entry Type ), “Homo sapiens” (Organism); “Expression profiling by array” (Study Type). The database research was done in May of 2015 and again in May 2018.
Figure 5 - Obesity studies: number of samples and studies for each tissue and condition
Twenty-six studies were included in our meta-analysis that included 4 tissue types: blood, liver, muscle, and SAT. The green bars represent the number of samples from lean individuals for each study and in orange the number of samples of obese patients. Source: Own authorship. SAT: subcutaneous adipose tissue.
47
4.2 . Download and pre-processing of mRNA expression data
The most time-consuming part of the study was to learn, write, revise, test,
and run all the scripts and code for the file manipulation, sample processing, and
normalization. The majority of the code was written in R language using the Rstudio
software (version 1.1.456) for Linux, and saved at the cloud service Github.
The PCA and PVCA were used to visualize and access the batch effect
influence on the dispersion and variation of microarray expression data. The PCA
plot shows data distribution of principal component (PC) 1 and PC2. In Figure 7 A, it
is clear how the data from the same batch cluster together, whereas after the batch
effect correction with the ComBat package the data did not show the same
clustering (Figure 7 B). The PVCA analysis shows how the batch component
“batch_date” significantly explains the sample variation (Figure 7 C). In contrast to
after the batch effect removal in which the “batch_date” accounts for a small part of
sample variation (Figure 7 D). All studies underwent quality control with
arrayQualitymetrics (exemplified in Figure 6), and only 4 (GSE109597, GSE29718,
GSE44000, GSE48452) studies had batch effects problems.
48
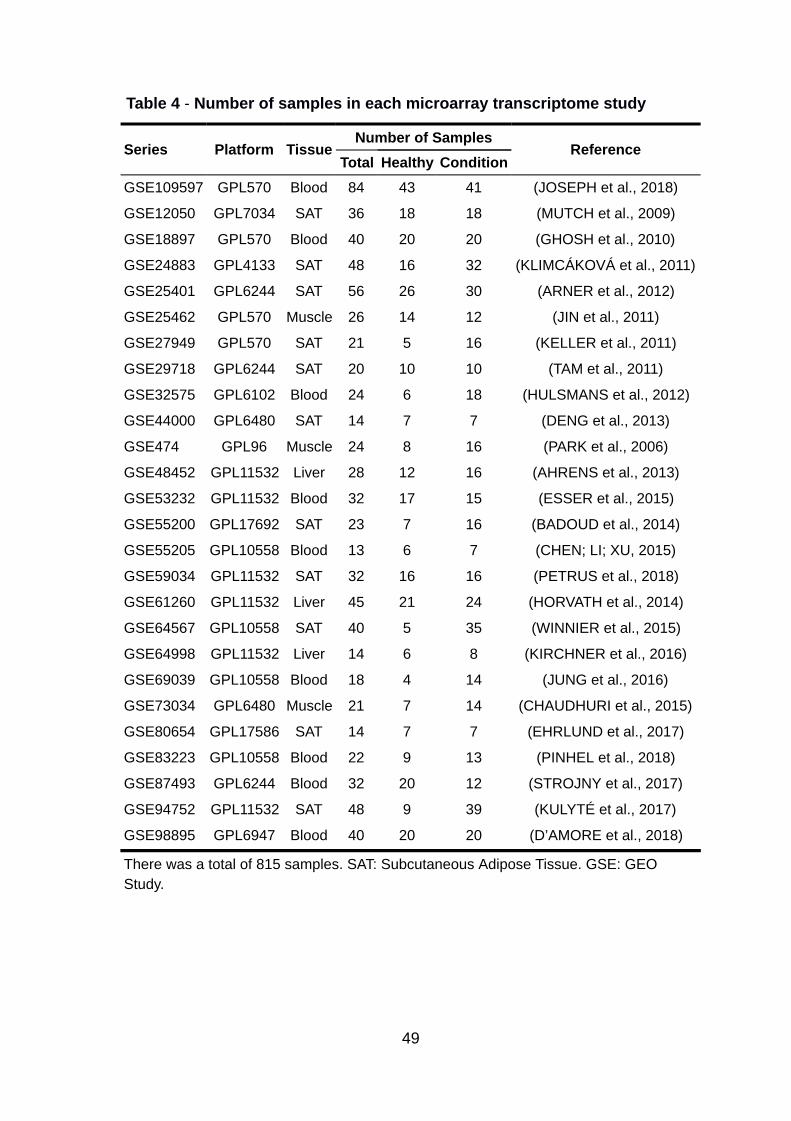
Table 4 - Number of samples in each microarray transcriptome study
Series Platform Tissue Number of Samples
Reference Total Healthy Condition
GSE109597 GPL570 Blood 84 43 41 (JOSEPH et al., 2018)
GSE12050 GPL7034 SAT 36 18 18 (MUTCH et al., 2009)
GSE18897 GPL570 Blood 40 20 20 (GHOSH et al., 2010)
GSE24883 GPL4133 SAT 48 16 32 (KLIMCÁKOVÁ et al., 2011)
GSE25401 GPL6244 SAT 56 26 30 (ARNER et al., 2012)
GSE25462 GPL570 Muscle 26 14 12 (JIN et al., 2011)
GSE27949 GPL570 SAT 21 5 16 (KELLER et al., 2011)
GSE29718 GPL6244 SAT 20 10 10 (TAM et al., 2011)
GSE32575 GPL6102 Blood 24 6 18 (HULSMANS et al., 2012)
GSE44000 GPL6480 SAT 14 7 7 (DENG et al., 2013)
GSE474 GPL96 Muscle 24 8 16 (PARK et al., 2006)
GSE48452 GPL11532 Liver 28 12 16 (AHRENS et al., 2013)
GSE53232 GPL11532 Blood 32 17 15 (ESSER et al., 2015)
GSE55200 GPL17692 SAT 23 7 16 (BADOUD et al., 2014)
GSE55205 GPL10558 Blood 13 6 7 (CHEN; LI; XU, 2015)
GSE59034 GPL11532 SAT 32 16 16 (PETRUS et al., 2018)
GSE61260 GPL11532 Liver 45 21 24 (HORVATH et al., 2014)
GSE64567 GPL10558 SAT 40 5 35 (WINNIER et al., 2015)
GSE64998 GPL11532 Liver 14 6 8 (KIRCHNER et al., 2016)
GSE69039 GPL10558 Blood 18 4 14 (JUNG et al., 2016)
GSE73034 GPL6480 Muscle 21 7 14 (CHAUDHURI et al., 2015)
GSE80654 GPL17586 SAT 14 7 7 (EHRLUND et al., 2017)
GSE83223 GPL10558 Blood 22 9 13 (PINHEL et al., 2018)
GSE87493 GPL6244 Blood 32 20 12 (STROJNY et al., 2017)
GSE94752 GPL11532 SAT 48 9 39 (KULYTÉ et al., 2017)
GSE98895 GPL6947 Blood 40 20 20 (D’AMORE et al., 2018)
There was a total of 815 samples. SAT: Subcutaneous Adipose Tissue. GSE: GEO Study.
49

Figure 6 - PCA and PVCA before and after batch effect correction with ComBat
A B
C D
Principal Component Analysis (PCA) plots before (A) and after (B) ComBat batch effect correction. Each color represents a different batch. The Principal Variance Component Analysis (PVCA) plots before (C), and after (D) shows the percentage (x-axis) that the variables (y-axis) contribute to data variability.
50
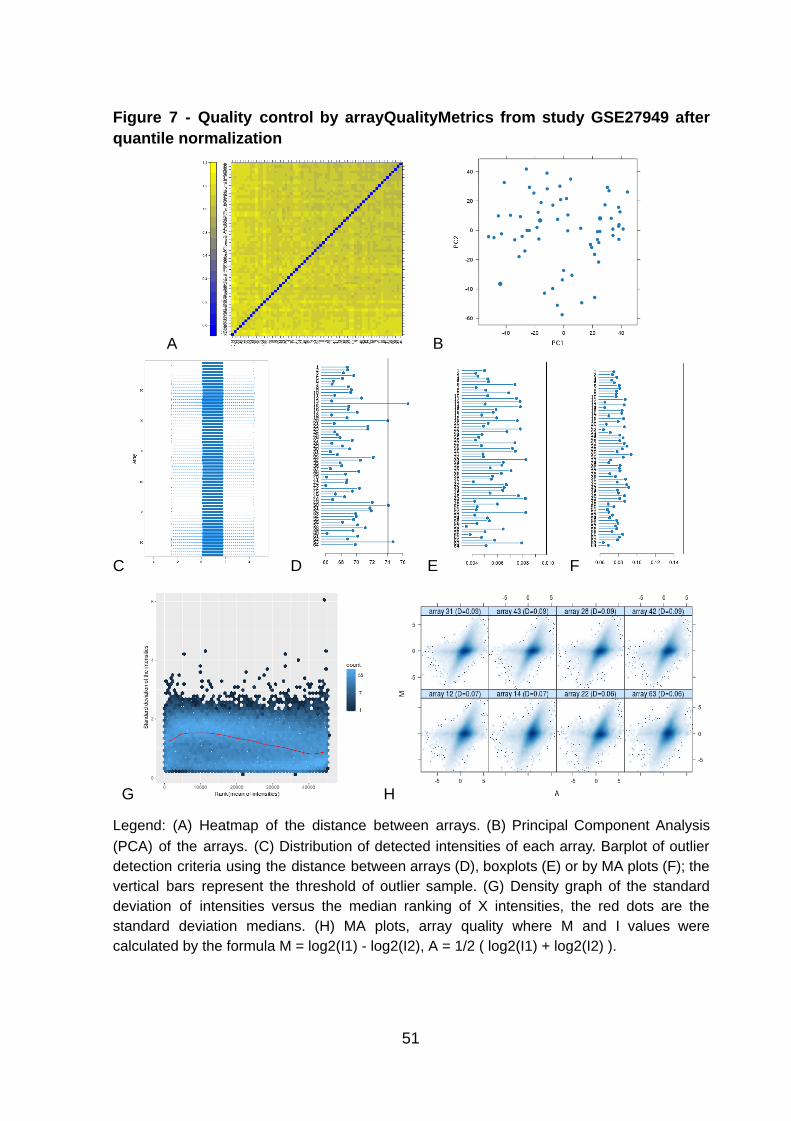
Figure 7 - Quality control by arrayQualityMetrics from study GSE27949 after quantile normalization
A B
C D E F
G H
Legend: (A) Heatmap of the distance between arrays. (B) Principal Component Analysis (PCA) of the arrays. (C) Distribution of detected intensities of each array. Barplot of outlier detection criteria using the distance between arrays (D), boxplots (E) or by MA plots (F); the vertical bars represent the threshold of outlier sample. (G) Density graph of the standard deviation of intensities versus the median ranking of X intensities, the red dots are the standard deviation medians. (H) MA plots, array quality where M and I values were calculated by the formula M = log2(I1) - log2(I2), A = 1/2 ( log2(I1) + log2(I2) ).
51
After sample quality assessment, the MDP analysis was performed to remove
samples with different from their phenotypic group (outliers). In most studies, there
were no samples with MDP values different from their phenotypic group (Figure 8 A).
The studies with discrepant samples had few samples to be removed (Figure 8 B).
Due to the redundant microarray design, in which there is more than 1 probe for
each transcript, the final number of transcripts is significantly reduced after gene
annotation and summarization (Table 5).
Figure 8 - MDP values of each sample in histogram and boxplot
The Molecular Degree of Perturbation (MDP) analysis of study GSE98895 (A), and GSE55205 (B). Each lean (in blue) or obese (green) individual has an MDP value. By sorting the samples by the MDP values, it is possible to identify samples with MDP values different from their phenotype group. No samples were removed from the study GSE98895 (A), but two lean samples were removed from GSE55205 (B) and are highlighted in red.
We came about a few issues during sample annotation. First, not all samples
were classified by the authors as obese or lean. In these cases, we used the BMI
classification when it was available. Furthermore, some studies even classified
obese patients as metabolically healthy (MHO) or metabolically unhealthy (MUO).
However, in this study, we made no distinction between MHO and MUO because
there is still contradictory evidence supporting the absence of cardiovascular
disease risk in MHO patients (ECKEL et al., 2016; STEFAN et al., 2013) .
52
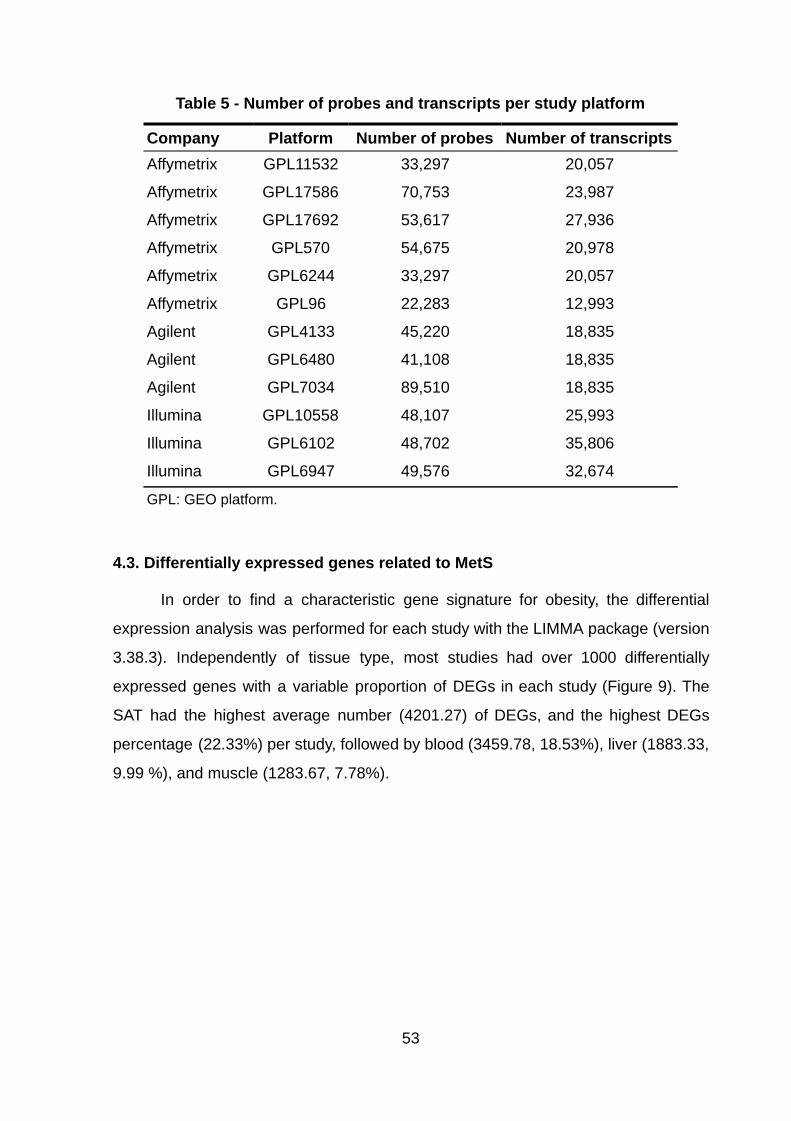
Table 5 - Number of probes and transcripts per study platform
Company Platform Number of probes Number of transcripts Affymetrix GPL11532 33,297 20,057
Affymetrix GPL17586 70,753 23,987
Affymetrix GPL17692 53,617 27,936
Affymetrix GPL570 54,675 20,978
Affymetrix GPL6244 33,297 20,057
Affymetrix GPL96 22,283 12,993
Agilent GPL4133 45,220 18,835
Agilent GPL6480 41,108 18,835
Agilent GPL7034 89,510 18,835
Illumina GPL10558 48,107 25,993
Illumina GPL6102 48,702 35,806
Illumina GPL6947 49,576 32,674
GPL: GEO platform.
4.3. Differentially expressed genes related to MetS
In order to find a characteristic gene signature for obesity, the differential
expression analysis was performed for each study with the LIMMA package (version
3.38.3). Independently of tissue type, most studies had over 1000 differentially
expressed genes with a variable proportion of DEGs in each study (Figure 9). The
SAT had the highest average number (4201.27) of DEGs, and the highest DEGs
percentage (22.33%) per study, followed by blood (3459.78, 18.53%), liver (1883.33,
9.99 %), and muscle (1283.67, 7.78%).
53
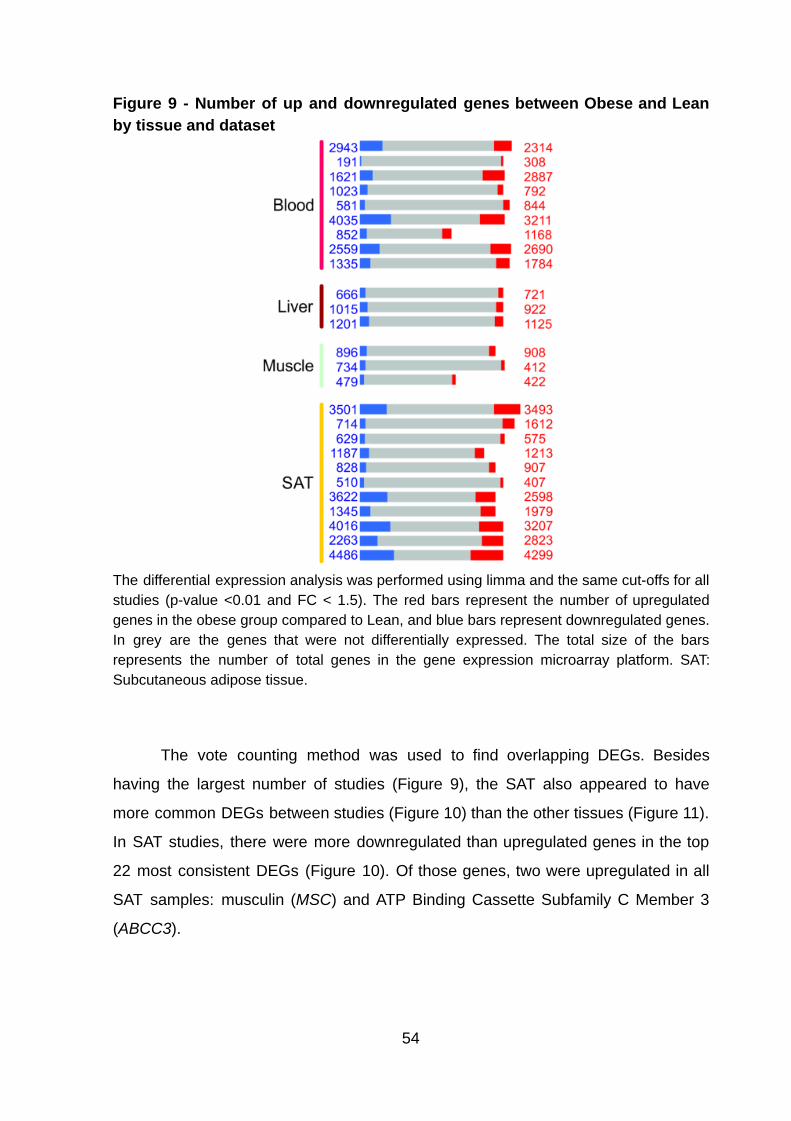
Figure 9 - Number of up and downregulated genes between Obese and Lean by tissue and dataset
The differential expression analysis was performed using limma and the same cut-offs for all studies (p-value <0.01 and FC < 1.5). The red bars represent the number of upregulated genes in the obese group compared to Lean, and blue bars represent downregulated genes. In grey are the genes that were not differentially expressed. The total size of the bars represents the number of total genes in the gene expression microarray platform. SAT: Subcutaneous adipose tissue.
The vote counting method was used to find overlapping DEGs. Besides
having the largest number of studies (Figure 9), the SAT also appeared to have
more common DEGs between studies (Figure 10) than the other tissues (Figure 11).
In SAT studies, there were more downregulated than upregulated genes in the top
22 most consistent DEGs (Figure 10). Of those genes, two were upregulated in all
SAT samples: musculin ( MSC ) and ATP Binding Cassette Subfamily C Member 3
( ABCC3 ).
54
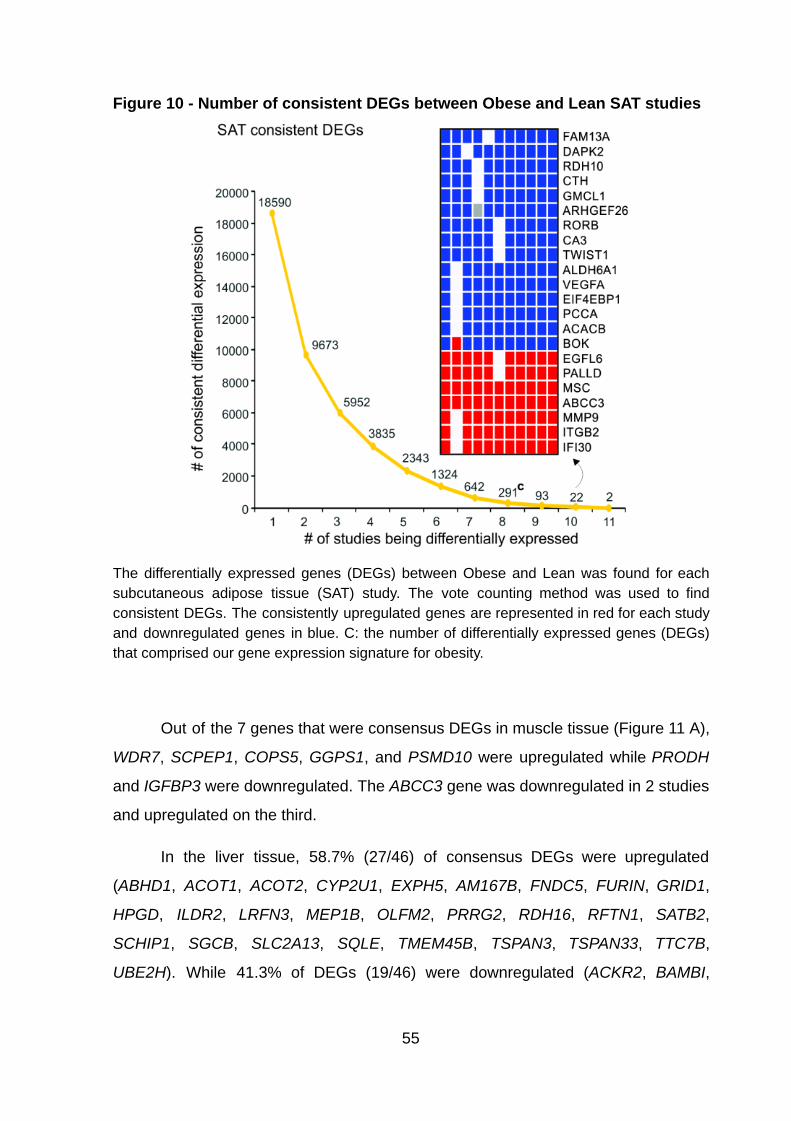
Figure 10 - Number of consistent DEGs between Obese and Lean SAT studies
The differentially expressed genes (DEGs) between Obese and Lean was found for each subcutaneous adipose tissue (SAT) study. The vote counting method was used to find consistent DEGs. The consistently upregulated genes are represented in red for each study and downregulated genes in blue. C: the number of differentially expressed genes (DEGs) that comprised our gene expression signature for obesity.
Out of the 7 genes that were consensus DEGs in muscle tissue (Figure 11 A),
WDR7 , SCPEP1 , COPS5 , GGPS1 , and PSMD10 were upregulated while PRODH
and IGFBP3 were downregulated. The ABCC3 gene was downregulated in 2 studies
and upregulated on the third.
In the liver tissue, 58.7% (27/46) of consensus DEGs were upregulated
( ABHD1 , ACOT1 , ACOT2 , CYP2U1 , EXPH5 , AM167B , FNDC5 , FURIN , GRID1 ,
HPGD , ILDR2 , LRFN3 , MEP1B , OLFM2 , PRRG2 , RDH16 , RFTN1 , SATB2 ,
SCHIP1 , SGCB , SLC2A13 , SQLE , TMEM45B , TSPAN3 , TSPAN33 , TTC7B ,
UBE2H ). While 41.3% of DEGs (19/46) were downregulated ( ACKR2 , BAMBI ,
55

EFCAB1 , EIF3E , GPR88 , GPR89B , IGFBP2 , P4HA1 , PCF11 , RP1 , SCARNA9L ,
SNORD14C, SNORD47 , TAF4B , TCTN2 , ZNF347 , ZNF507 , ZNF600 , ZNF880 ).
Figure 11 - Number of consistent DEGs between Obese and Lean in Blood, Liver, and Muscle studies
The differentially expressed genes (DEGs) between Obese and Lean was found for each study. The vote counting method was used to find common DEGs among the studies of Blood, Liver and Muscle tissues.
Even though studies performed in blood had the second-highest number of
studies, there were not many genes in common higher than 5 out of 9 studies
(Figure 11 B). The only gene to be differentially expressed in most blood studies was
TNIP1 ; it was upregulated in six out of nine studies. There were 34 consensus DEGs
in 5 out of 9 studies with blood, where 41.2% (14/34) were upregulated ( ADNP2 ,
ATXN7L3 , DLGAP4 , GNG5 , HBM , KLHL15 , MUC1 , RABAC1 , RMND5A , SOCS3 ,
TNIP1, TWF1 , VWA5A , ZNF101 ) and 58.8% (20/34) were downregulated ( AASDH ,
CPOX , E2F6 , EARS2 , ERI2 , EXOC1 , GLE1 , HEATR1 , INTS2 , IPP , KLHL24 ,
LRRC40 , LTN1 , POLR3A , RHBDL2 , TDP1 , TMEM38A , TRIM38 , ZC3HC1 ,
ZNF573 ).
In order to see the consistency of the biological pathways and functions of the
differentially expressed genes, a pathway enrichment analysis with GSEA was
performed for each study (Figure 12). The blood tissue presented the least pathway
enrichment consensus between the studies, with only “MHC class II antigen
56
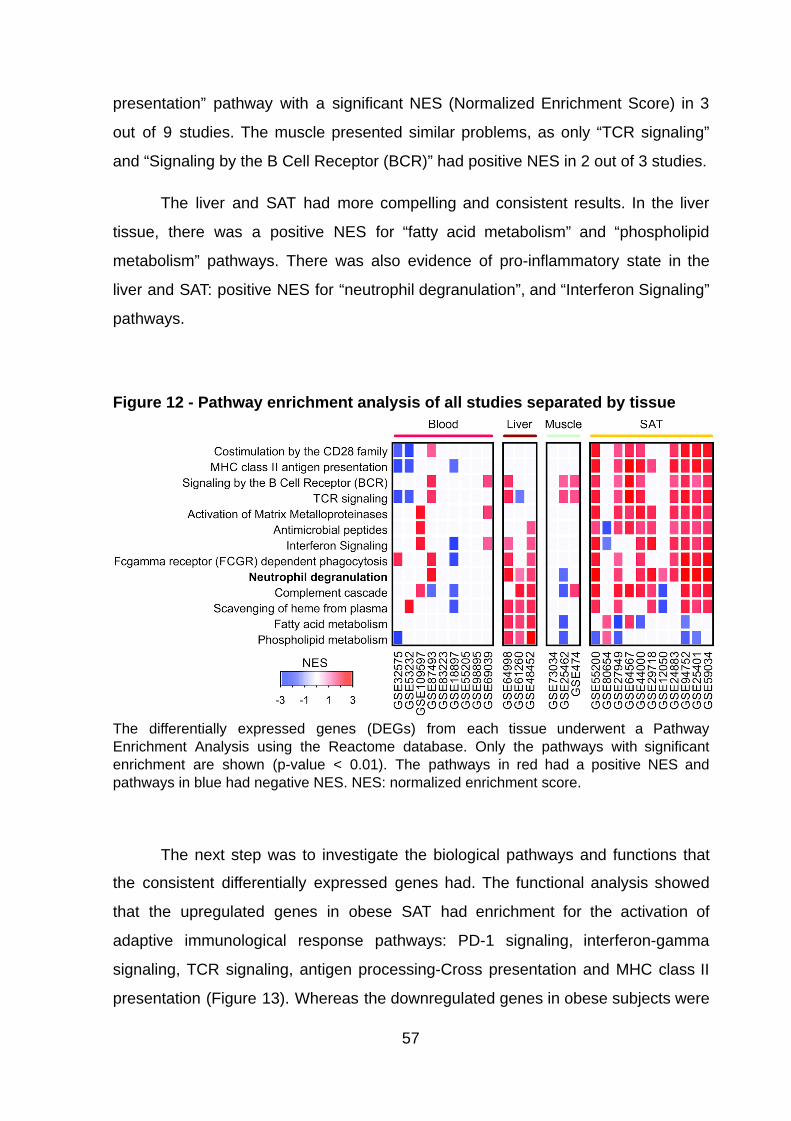
presentation” pathway with a significant NES (Normalized Enrichment Score) in 3
out of 9 studies. The muscle presented similar problems, as only “TCR signaling”
and “Signaling by the B Cell Receptor (BCR)” had positive NES in 2 out of 3 studies.
The liver and SAT had more compelling and consistent results. In the liver
tissue, there was a positive NES for “fatty acid metabolism” and “phospholipid
metabolism” pathways. There was also evidence of pro-inflammatory state in the
liver and SAT: positive NES for “neutrophil degranulation”, and “Interferon Signaling”
pathways.
Figure 12 - Pathway enrichment analysis of all studies separated by tissue
The differentially expressed genes (DEGs) from each tissue underwent a Pathway Enrichment Analysis using the Reactome database. Only the pathways with significant enrichment are shown (p-value < 0.01). The pathways in red had a positive NES and pathways in blue had negative NES. NES: normalized enrichment score.
The next step was to investigate the biological pathways and functions that
the consistent differentially expressed genes had. The functional analysis showed
that the upregulated genes in obese SAT had enrichment for the activation of
adaptive immunological response pathways: PD-1 signaling, interferon-gamma
signaling, TCR signaling, antigen processing-Cross presentation and MHC class II
presentation (Figure 13). Whereas the downregulated genes in obese subjects were
57
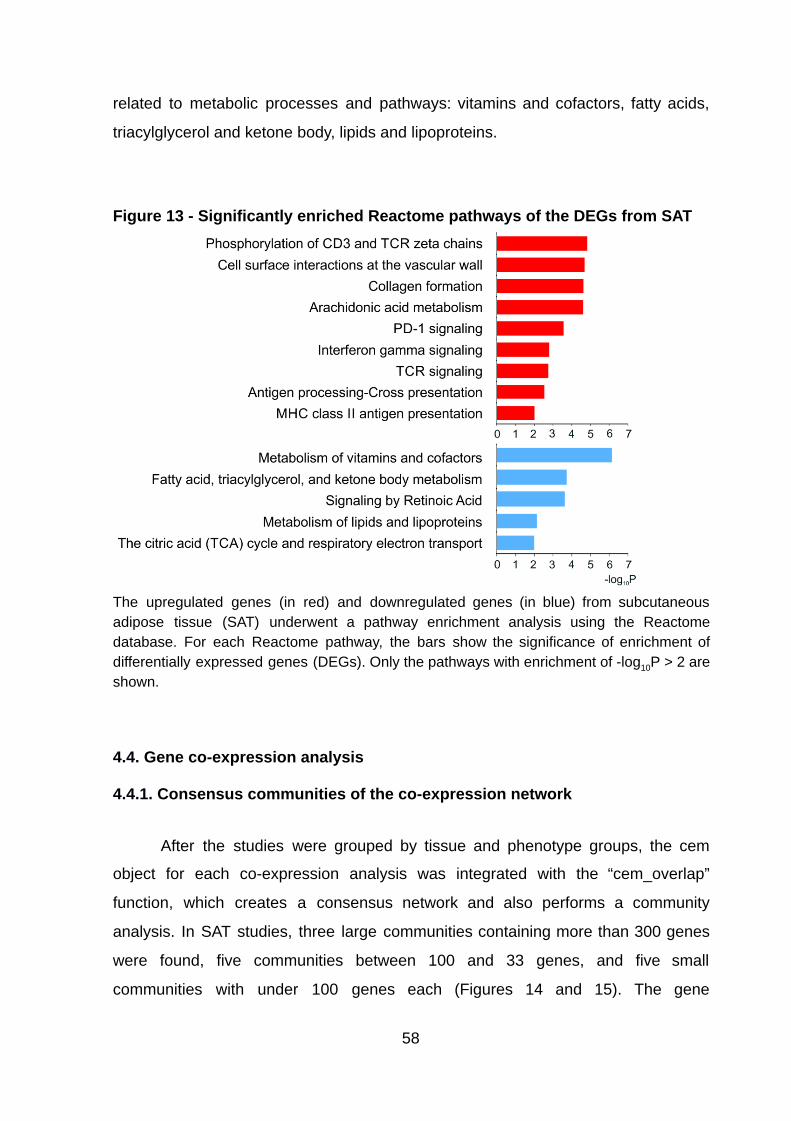
related to metabolic processes and pathways: vitamins and cofactors, fatty acids,
triacylglycerol and ketone body, lipids and lipoproteins.
Figure 13 - Significantly enriched Reactome pathways of the DEGs from SAT
The upregulated genes (in red) and downregulated genes (in blue) from subcutaneous adipose tissue (SAT) underwent a pathway enrichment analysis using the Reactome database. For each Reactome pathway, the bars show the significance of enrichment of differentially expressed genes (DEGs). Only the pathways with enrichment of -log 10 P > 2 are shown.
4.4 . Gene co-expression analysis
4 .4.1. Consensus communities of the co-expression network
After the studies were grouped by tissue and phenotype groups, the cem
object for each co-expression analysis was integrated with the “cem_overlap”
function, which creates a consensus network and also performs a community
analysis. In SAT studies, three large communities containing more than 300 genes
were found, five communities between 100 and 33 genes, and five small
communities with under 100 genes each (Figures 14 and 15). The gene
58

co-expression consensus network uncovered 16 communities for the liver, 14
communities for blood, and four small communities for muscle.
Figure 14 - SAT Consensus Co-expression Network
The consensus co-expression network for Subcutaneous Adipose Tissue (SAT) has 14 communities. Each color represents a different community, a densely interconnected part of the network (REICHARDT; BORNHOLDT, 2006) . We defined the community with a minimum of 10 genes. The graph was created with Gephi software (version 0.9.2). Figure 15 - Number of genes in each CM of the SAT Consensus Co-expression Network
Each color represents a different community (CM) from the Consensus co-expression network for the SAT. The same colors were used for figures 14 and 16. SAT: subcutaneous Adipose Tissue. CM_404: a group of genes that were not part of any community.
59

4.4.2. Functional Analysis of the Consensus Co-expression Communities
The co-expression communities for each tissue underwent functional
annotation analysis and GSEA. The consensus co-expression communities for
blood, muscle, and liver did not show any consistent results for pathway enrichment
analysis or GSEA (data not shown). On the other hand, it was able to find consistent
pathways and genotype enrichment for SAT communities from the consensus
co-expression network (Figure 16).
The SAT had 11 communities with more than ten genes. Eight communities
had enriched pathways, 2 of which had enrichment for neutrophil degranulation.
Many of the pathways shown are related to inflammatory processes that occur in
obesity. For example, interferon-gamma is one of the cytokines of the inflammatory
T cell response associated with obesity-induced by diet (ROCHA et al., 2008) .
The GSEA showed three communities had a positive enrichment in the
majority of the studies with SAT (Figure 16, right). Two of those communities had the
neutrophil degranulation enriched pathways (CM 6 and CM 9).
60
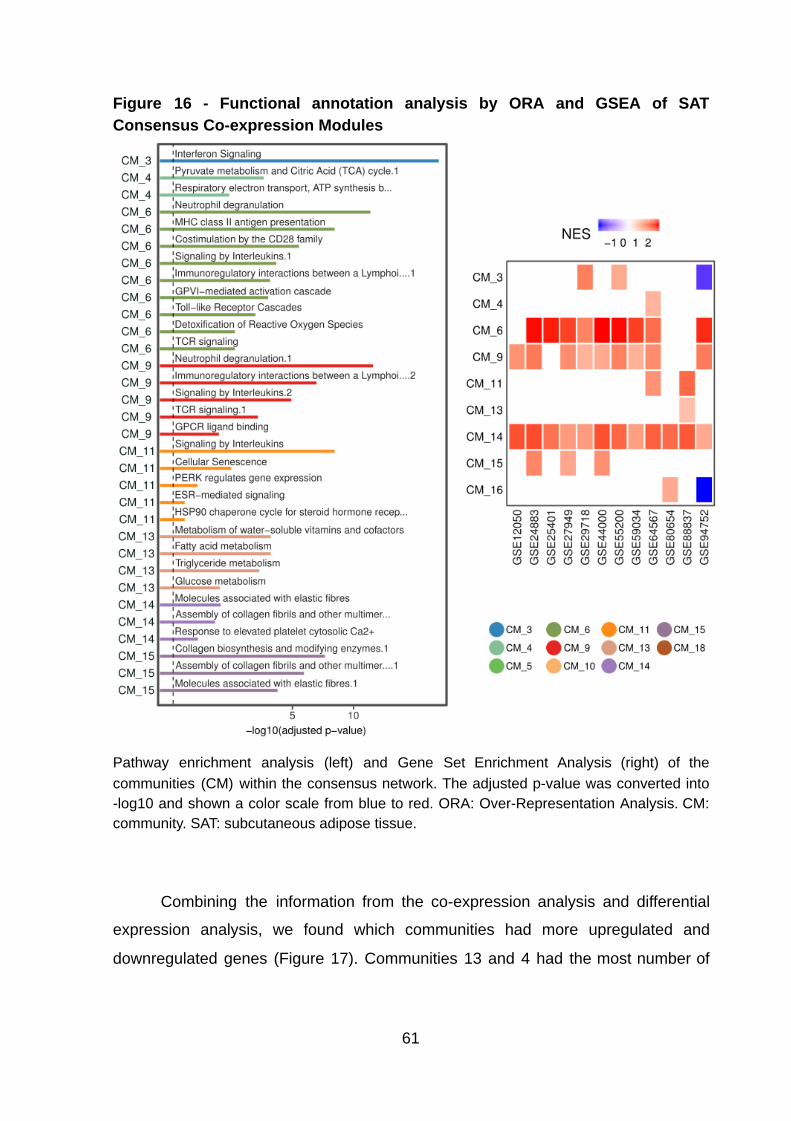
Figure 16 - Functional annotation analysis by ORA and GSEA of SAT Consensus Co-expression Modules
Pathway enrichment analysis (left) and Gene Set Enrichment Analysis (right) of the communities (CM) within the consensus network. The adjusted p-value was converted into -log10 and shown a color scale from blue to red. ORA: Over-Representation Analysis. CM: community. SAT: subcutaneous adipose tissue.
Combining the information from the co-expression analysis and differential
expression analysis, we found which communities had more upregulated and
downregulated genes (Figure 17). Communities 13 and 4 had the most number of
61
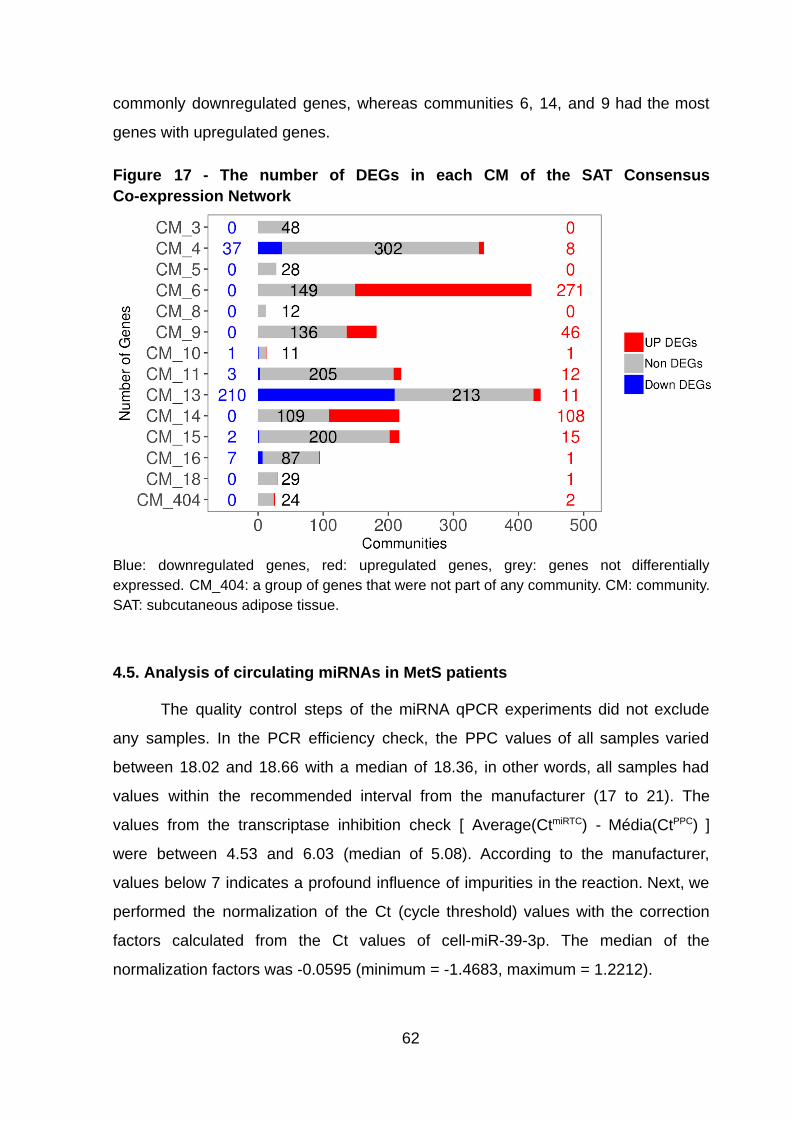
commonly downregulated genes, whereas communities 6, 14, and 9 had the most
genes with upregulated genes.
Figure 17 - The number of DEGs in each CM of the SAT Consensus Co-expression Network
Blue: downregulated genes, red: upregulated genes, grey: genes not differentially expressed. CM_404: a group of genes that were not part of any community. CM: community. SAT: subcutaneous adipose tissue.
4.5. Analysis of circulating miRNAs in MetS patients
The quality control steps of the miRNA qPCR experiments did not exclude
any samples. In the PCR efficiency check, the PPC values of all samples varied
between 18.02 and 18.66 with a median of 18.36, in other words, all samples had
values within the recommended interval from the manufacturer (17 to 21). The
values from the transcriptase inhibition check [ Average(Ct miRTC ) - Média(Ct PPC ) ]
were between 4.53 and 6.03 (median of 5.08). According to the manufacturer,
values below 7 indicates a profound influence of impurities in the reaction. Next, we
performed the normalization of the Ct (cycle threshold) values with the correction
factors calculated from the Ct values of cell-miR-39-3p. The median of the
normalization factors was -0.0595 (minimum = -1.4683, maximum = 1.2212).
62
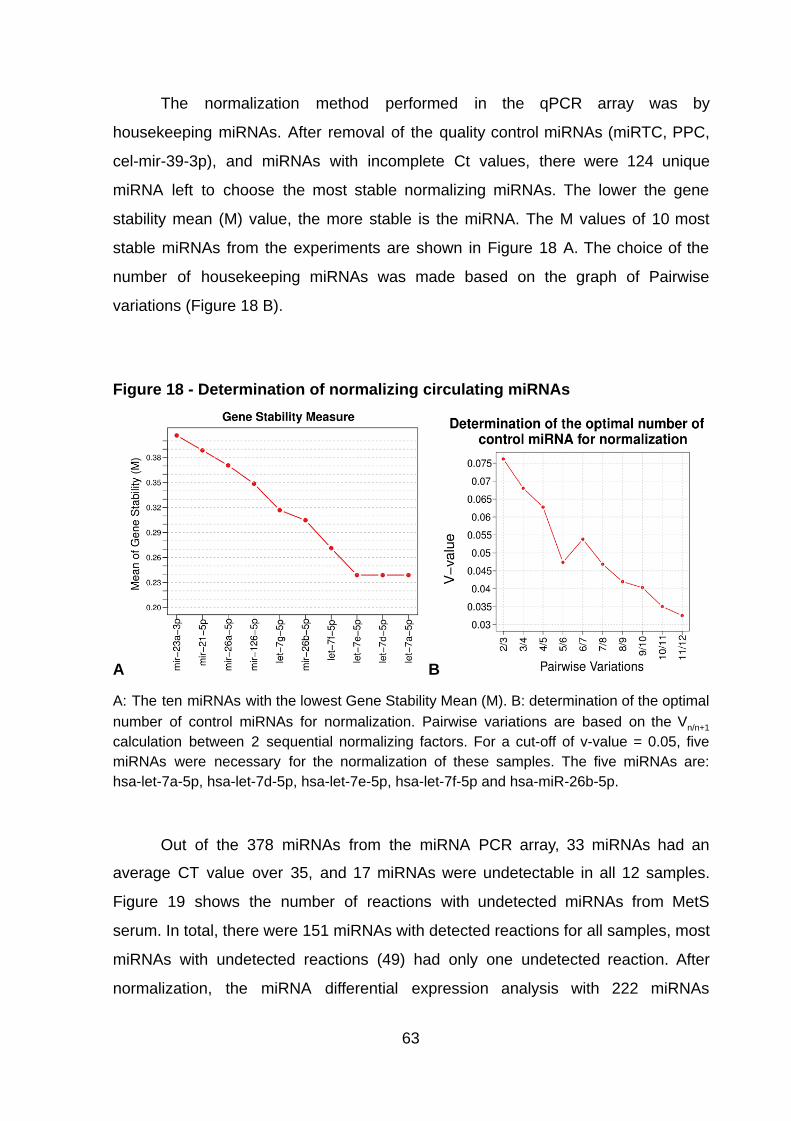
The normalization method performed in the qPCR array was by
housekeeping miRNAs. After removal of the quality control miRNAs (miRTC, PPC,
cel-mir-39-3p), and miRNAs with incomplete Ct values, there were 124 unique
miRNA left to choose the most stable normalizing miRNAs. The lower the gene
stability mean (M) value, the more stable is the miRNA. The M values of 10 most
stable miRNAs from the experiments are shown in Figure 18 A. The choice of the
number of housekeeping miRNAs was made based on the graph of Pairwise
variations (Figure 18 B).
Figure 18 - Determination of normalizing circulating miRNAs
A B
A: The ten miRNAs with the lowest Gene Stability Mean (M). B: determination of the optimal number of control miRNAs for normalization. Pairwise variations are based on the V n/n+1 calculation between 2 sequential normalizing factors. For a cut-off of v-value = 0.05, five miRNAs were necessary for the normalization of these samples. The five miRNAs are: hsa-let-7a-5p, hsa-let-7d-5p, hsa-let-7e-5p, hsa-let-7f-5p and hsa-miR-26b-5p.
Out of the 378 miRNAs from the miRNA PCR array, 33 miRNAs had an
average CT value over 35, and 17 miRNAs were undetectable in all 12 samples.
Figure 19 shows the number of reactions with undetected miRNAs from MetS
serum. In total, there were 151 miRNAs with detected reactions for all samples, most
miRNAs with undetected reactions (49) had only one undetected reaction. After
normalization, the miRNA differential expression analysis with 222 miRNAs
63
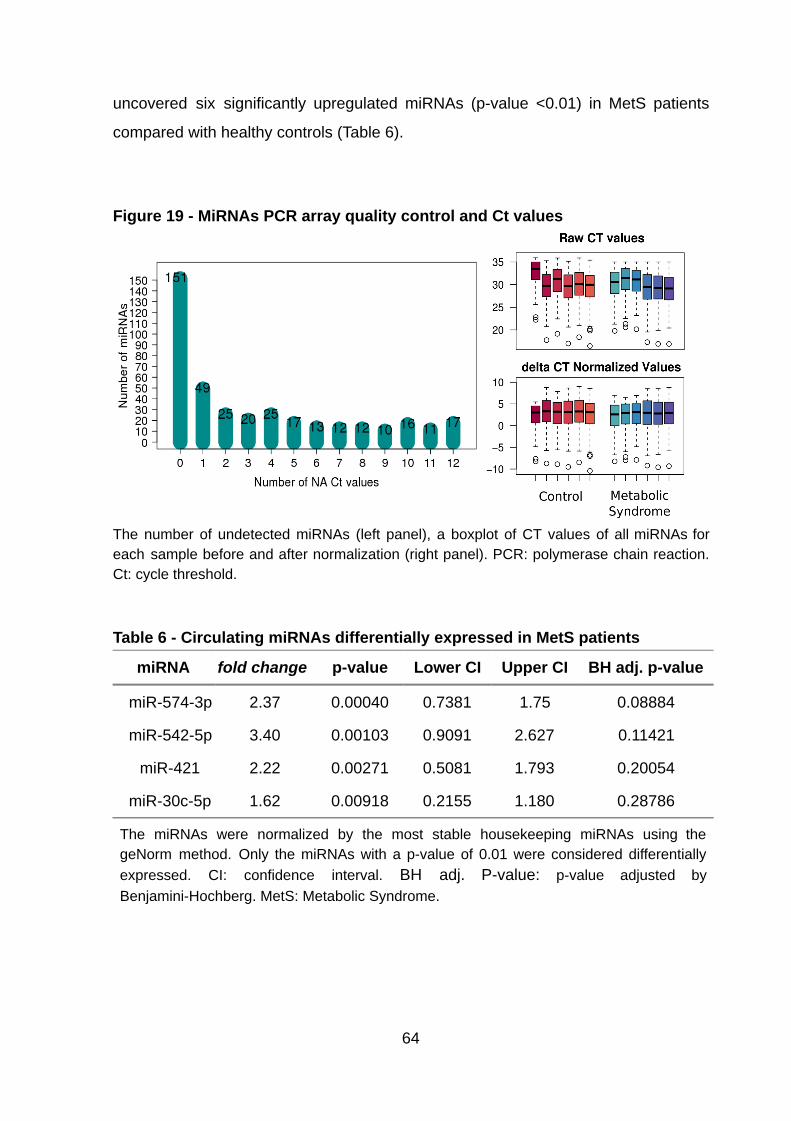
uncovered six significantly upregulated miRNAs (p-value <0.01) in MetS patients
compared with healthy controls (Table 6).
Figure 19 - MiRNAs PCR array quality control and Ct values
The number of undetected miRNAs (left panel), a boxplot of CT values of all miRNAs for each sample before and after normalization (right panel). PCR: polymerase chain reaction. Ct: cycle threshold.
Table 6 - Circulating miRNAs differentially expressed in MetS patients
miRNA fold change p-value Lower CI Upper CI BH adj. p-value
miR-574-3p 2.37 0.00040 0.7381 1.75 0.08884
miR-542-5p 3.40 0.00103 0.9091 2.627 0.11421
miR-421 2.22 0.00271 0.5081 1.793 0.20054
miR-30c-5p 1.62 0.00918 0.2155 1.180 0.28786
The miRNAs were normalized by the most stable housekeeping miRNAs using the geNorm method. Only the miRNAs with a p-value of 0.01 were considered differentially expressed. CI: confidence interval. BH adj. P-value: p-value adjusted by Benjamini-Hochberg. MetS: Metabolic Syndrome.
64
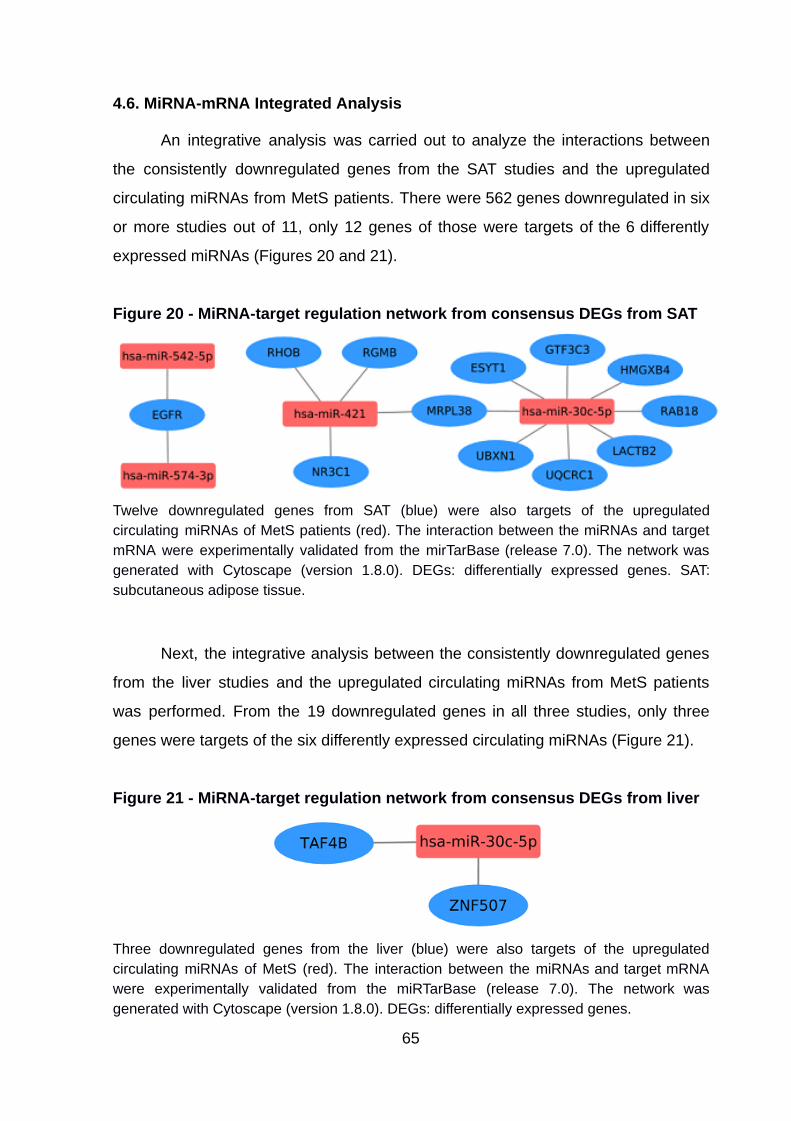
4.6. MiRNA-mRNA Integrated Analysis
An integrative analysis was carried out to analyze the interactions between
the consistently downregulated genes from the SAT studies and the upregulated
circulating miRNAs from MetS patients. There were 562 genes downregulated in six
or more studies out of 11, only 12 genes of those were targets of the 6 differently
expressed miRNAs (Figures 20 and 21).
Figure 20 - MiRNA-target regulation network from consensus DEGs from SAT
Twelve downregulated genes from SAT (blue) were also targets of the upregulated circulating miRNAs of MetS patients (red). The interaction between the miRNAs and target mRNA were experimentally validated from the mirTarBase (release 7.0). The network was generated with Cytoscape (version 1.8.0). DEGs: differentially expressed genes. SAT: subcutaneous adipose tissue.
Next, the integrative analysis between the consistently downregulated genes
from the liver studies and the upregulated circulating miRNAs from MetS patients
was performed. From the 19 downregulated genes in all three studies, only three
genes were targets of the six differently expressed circulating miRNAs (Figure 21).
Figure 21 - MiRNA-target regulation network from consensus DEGs from liver
Three downregulated genes from the liver (blue) were also targets of the upregulated circulating miRNAs of MetS (red). The interaction between the miRNAs and target mRNA were experimentally validated from the miRTarBase (release 7.0). The network was generated with Cytoscape (version 1.8.0). DEGs: differentially expressed genes.
65

No interactions were identified between the two consistently downregulated
genes from the muscle ( PRODH and IGFBP3 ) and the upregulated circulating
miRNAs from MetS patients (from Table 6). For blood, the number of consensus
DEGs was also to low to create a miRNA-mRNA interaction network.
66
5. Discussion
Here we utilized system biology tools to integrate data from a comprehensive
transcriptomic meta-analysis with circulating miRNA of MetS patients. MetS gene
signatures from 4 different tissues were using differential expression analysis, gene
co-expression analysis, gene set enrichment analysis, and network analysis. We
also performed a differential expression analysis of circulating miRNAs from MetS
patients compared to healthy controls. Finally, we integrated both results by
comparing the MetS circulating miRNAs with their tissue-specific targets.
The GEO-NCBI database has over 90,000 transcriptomic studies performed
with a multitude of high-throughput technologies, experimental designs, types of
samples, and for a broad range of biological conditions. The GEO-NCBI search for
microarray studies of MetS and related diseases produced a total of 632 studies.
After careful manual curating, only 4% of studies passed the study selection
exclusion criteria. This high exclusion rate of 93.8% (257/274) is typical in many
kinds of meta-analysis studies (EDINGER; COHEN, 2013) (MANSFIELD et al.,
2016) (ORTEGA-BERNAL et al., 2018) .
We had to manually curate each one of these studies even after using the
available filters of the search tool. The GEO query system only allows the use of
broad terms for sample characterization, study summary and description. The lack of
specific metadata fields makes the search for a specific disease very inefficient, with
a high percentage of the output including unwanted results. The need for a specific
field just for disease classification has recently pushed a researcher team to create a
revamped searchable tool for the GEO database named ReGEO (CHEN et al.,
2019) .
Although most authors follow the MIAME guidelines for the submission of
transcriptome datasets, the authors provide limited clinical information (NOOKAEW
et al., 2013) . In some cases, authors did not even provide basic sample
67
characteristics, making it difficult or even impossible to use the studies (NOOKAEW
et al., 2013) .
Our differential expression analyses between obese and lean subjects of 26
studies in four tissue types (blood, liver, muscle, SAT), retrieved a varying number of
DEGs. SAT analysis showed the highest number and percentage of DEGs per study,
and this may explain the higher number of consistent DEGs. However, in a
multi-tissue study (HAO et al., 2018) , a higher number of DEGs was found in muscle
(584) and liver (367) than adipose tissue (283). This difference was due to a high
percentage of downregulated genes since the number of upregulated genes in the
muscle (79.79%, 466/584, 118 upregulated) and in the liver (65.4%, 240/367, 127
upregulated) and was lower than in the adipose tissue (167 upregulated) (HAO et
al., 2018) . Although we identified many consistent DEGs for SAT and liver, a limited
number of consistent DEGs or no consistent DEGs at all were found in muscle and
blood, respectively.
Two genes MSC and ABCC3 were consistently upregulated in all SAT studies
analyzed. The MSC encodes the musculin protein, which is also known as activated
B-cell factor-1 (ABF-1). This transcriptional repressor is highly expressed in
activated B lymphocytes and capable of binding to an E-box element (ROMAGNANI
et al., 1981) . According to a few transcriptomic experiments from the Expression
Atlas, MSC is highly expressed in adipose tissue (PAPATHEODOROU et al., 2018) .
Hishikawa et al. (2005) have shown that the expression of MSC is inversely
correlated with the expression of Leukemia Inhibitory Factor (LIF), a member of the
interleukin 6 (IL-6) family whose primary function is the inhibition of cell proliferation
(GOUGH et al., 1988) . In a more recent mice study, it was shown that the
hypothalamus inhibition of LIF leads to decreased protection against diet-induced
obesity (FIORAVANTE et al., 2017) . Thus, the upregulation of MSC observed in this
study could lead to inhibition of the LIF and, consequently, to increased susceptibility
to diet-induced obesity.
The ABCC3 encodes the protein canalicular multispecific organic anion
transporter two, also formerly known as multidrug resistance-associated protein 3
68
(MRP3) (ALLIKMETS et al., 1996) . It is a part of a group of efflux proteins that
transports various molecules across cellular membranes. In the liver, ABC proteins
have a role in the absorption, disposition, and distribution of organic anions, such as
xenobiotics and endogenous substances to bile (BELINSKY et al., 1998) . Although
ABCC3 function is not entirely known, its upregulation in blood-derived NK cells may
be associated with a protective cell response to cytotoxic drug treatments (PESSINA
et al., 2016) .
According to the Expression Atlas, ABCC3 is highly expressed in the adrenal
gland, stomach, liver, and small intestine. In contrast, experiments showed a low
expression of ABCC3 in adipose tissue and immune cells (PAPATHEODOROU et
al., 2018) . This may be indicative of inter-tissue regulation, or infiltration of immune
cells with altered ABCC3 expression. Nonetheless, little attention in the literature is
given to its involvement in immune processes and their active secretion of
inflammatory mediators.
We did not find a consensus gene signature in blood for obesity (i.e. no DEGs
were found in at least 70% of the studies containing blood samples). This variability
between studies might be due to the inherent inter-individual differences of blood
cells. According to some authors, the variation of gene expression from blood cells
can come from different sources and confounding signals (EADY et al., 2005) .
These include technical and experimental design, inter-individual (RADICH et al.,
2004) and exposure factors (DUMEAUX et al., 2010; WHITNEY et al., 2003) .
A looser definition of consensus DEGs for blood, in which a gene is identified
as DEG in at least 5 out of 9 studies, results in a group of 34 genes. Among those
genes, TNIP1 , also known as Naf1 or ABIN-1, was the top consistently upregulated.
TNIP1 has the capacity of dampening TNF-α induced NF-κB activity (HEYNINCK et
al., 1999) and acts as a corepressor of ligand-bound PPARs (FLORES et al., 2011) .
The increased expression of TNIP1 rheumatoid arthritis induced by TNF-α
(GALLAGHER et al., 2003) is suggestive of countermeasure against a
pro-inflammatory condition. Furthermore, SNPs reported in TNIP1 has shown to
increase the risk of coronary artery disease in a Chinese cohort (SONG et al., 2017) .
69
The muscle-derived studies showed the lowest percentage of DEGs among
all tissues (7.78%). In an attempt to generate a consensus gene signature for
muscle tissue, only 7 DEGs were detected in all three studies. In this small gene
signature, geranylgeranyl diphosphate synthase 1 ( GGPS1 ) was found consistently
upregulated. The overexpression of GGPS1 has been observed in fat and skeletal
muscle tissues, and further investigated in a knockout model which showed
GGPS1’s mediation of lipid-induced systemic insulin resistance in obese mice (TAO
et al., 2015) .
The liver gene signature had 46 consensus DEGs of which 41.3% was
downregulated. This included genes encoding the bone morphogenetic protein
( BMP ), and the pseudo receptor activin membrane-bound inhibitor ( BAMBI ). In LPS
exposed hepatic stellate cells, transforming growth factor (TGF)-β signaling was
enhanced by TLR4 activation and BAMBI downregulation (SEKI et al., 2007) .
Altered gene expression levels of TGF-β and their antagonists in adipose tissues is
described in obesity (LEE, 2018) .
The TATA-Box binding protein-associated factor 4b gene ( TAF4B ) was also
found consistently downregulated in the liver studies. This gene is involved in the
control of cell proliferation acting as an NF-kB co-activator in response to TNF-α
(YAMIT-HEZI; DIKSTEIN, 1998) , and TGFβ signaling mediator (MENGUS et al.,
2005) of anti-apoptotic genes and pathways. In mice models, diet-induced obesity
has shown to upregulate liver expression of TNF-alpha (BORST; CONOVER, 2005)
and NF-kB (CARLSEN et al., 2009) . NF-κB upregulation can increase
serine/threonine phosphorylation of the insulin receptor substrate 1 (IRS1), which
results in insulin resistance (SAAD et al., 1992) , as well as elevate hepatic
production of proinflammatory cytokines, including TNF-α, IL-6, and interleukin 1
beta (IL-1β).
We performed a co-expression analysis to generate a consensus network of
genes related to MetS and obesity from transcriptome datasets of human tissues.
We used an innovative approach that combines several studies to generate a
70
consensus co-expression network with our recently published package CEMiTool
(RUSSO et al., 2018) .
Some co-expression studies performed on adipose tissue from obese
patients have used a similar meta-analysis approach. However, the authors used a
module preservation method and candidate gene selection based on the
connectivity of the co-expression network (HAAS et al., 2012; HE et al., 2017) .
The integration of co-expression analysis with GWAS findings has found that
pituitary, pancreas, esophagus, nerve, skin, and adipose tissue were a worthy
investigation for obesity pathogenesis. However, with the exception of skin and
adipose tissue, most of these tissues are hard to collect due to significant health
risks (HAO et al., 2018) . Few studies have performed co-expression analysis in
adipose tissue (PRAVENEC et al., 2018) , and in obese patients (WANG et al., 2017)
(HAO et al., 2018) , and one has even integrated co-expression analysis with
miRNA-gene interaction (MIAO et al., 2019) . However, none of these studies
combined multiple studies into a consensus signature and compared it with
differentially expressed miRNAs in circulation.
The co-expression analysis of SAT studies generated 13 densely
interconnected communities. The largest communities containing over 300 genes
were CM 13, CM 6, and CM 4. CM 6 had the highest number of genes found in
different immune system cells. The presence of resident immune cells in the adipose
tissue is well known (CILDIR; AKINCILAR; TERGAONKAR, 2013; SCHIPPER et al.,
2012) . These cells are responsible for apoptotic cell clearance and extracellular
matrix remodeling. Their activation can lead to inflammatory processes, insulin
resistance, and other metabolic complications found in obesity and MetS (FAIN,
2006; HOTAMISLIGIL et al., 1995) .
The pathway most enriched in the immunometabolism co-expression
community (CM 6) of the SAT was neutrophil degranulation. Neutrophils have a
critical effector role in innate and humoral immunity and are part of the first line of
defense against microorganisms and foreign particles (BURG; PILLINGER, 2001) .
Previous studies have shown that patients with elevated adiposity had higher
71
circulating neutrophil counts, and neutrophils degranulation (REYES et al., 2015) .
Even proteins secreted mainly by neutrophil granules, such as plasmatic
myeloperoxidase and calprotectin, have even been found increased in a human
obese study (NIJHUIS et al., 2009) .
The enrichment of the detoxification of reactive oxygen species pathway is
consistent with the oxidative stress and elevated superoxide production associated
with obesity and MetS (FURUKAWA et al., 2004) . This process can be due to the
increase of neutrophils in the adipose tissue. In obese patients, peripheral blood
neutrophils are prone to elevated superoxide production and chemotactic activity
(BROTFAIN et al., 2015) .
Cells from the adaptive immune system were also uncovered in the CM 6.
The pathways of immunoregulatory interactions between a Lymphoid and a
non-lymphoid cell, MHC class II antigen presentation, co-stimulation by the CD28
family, and TCR signaling are evidence of T-lymphocytes presence in SAT. The
CD28 co-stimulation pathway has been shown to aid T-lymphocytes nutrient uptake
by increasing the glycolytic flux and levels of glucose transporters aiding the
activation of T-lymphocytes (FRAUWIRTH et al., 2002) . Also, TCR signaling is
responsible for T-lymphocyte proliferation, differentiation, and effector function (VAN
LEEUWEN; SAMELSON, 1999) .
One of the shortcomings of our analysis is that it was not possible to
distinguish or quantify specific types of lymphocytes present in the SAT. However,
studies have already shown the increased presence of CD8+, CD4+, Th1, Th1:Treg,
Th17 lymphocytes in SAT from obese patients (YANG et al., 2010; ZÚÑIGA et al.,
2010) and also mice (IP; HOGAN; NIKOLAJCZYK, 2015) .
Obesity induces low-grade chronic inflammation, also known as a
meta-inflammatory state (LUMENG; SALTIEL, 2011) . The positive enrichment of the
pathway “Toll-like Receptor Cascades” in the co-expression community CM 6 brings
forth pattern recognition receptors’ (PRRs) role in the inflammatory process. PPRs
can sense different molecules, such as pathogen-associated molecular patterns
(PAMPs) and initiate an innate immune system response. It was shown that some
72
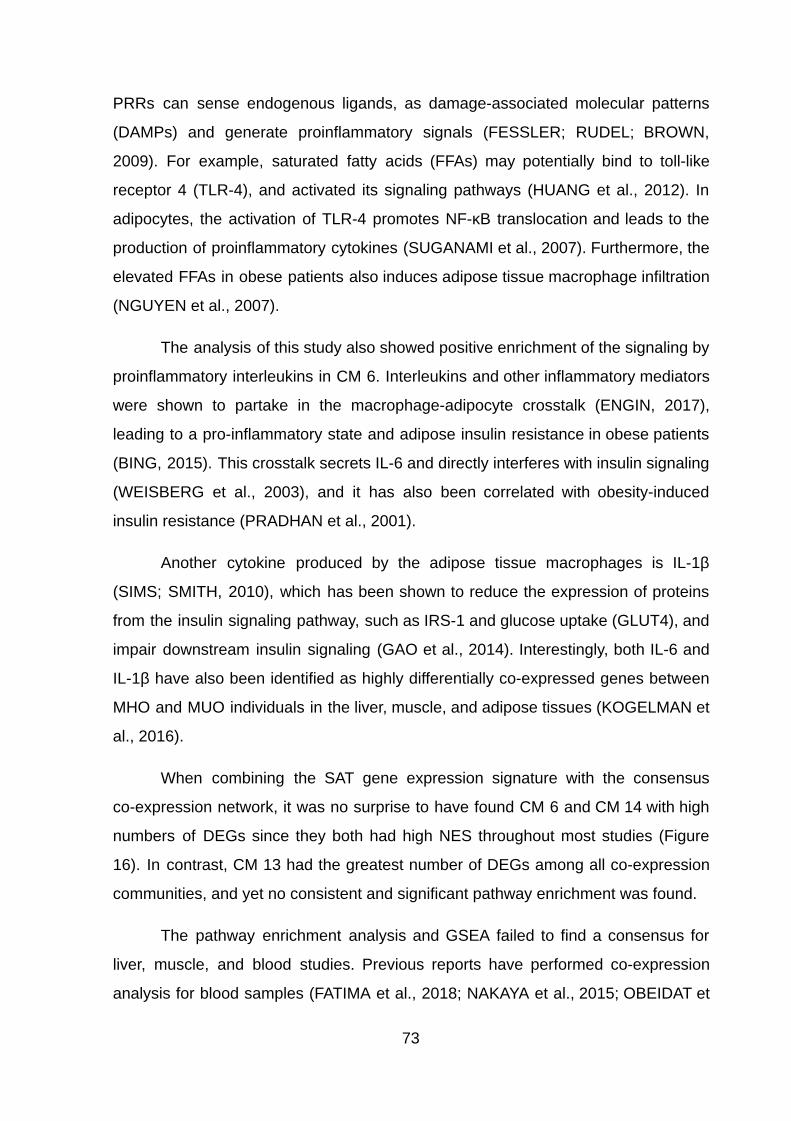
PRRs can sense endogenous ligands, as damage-associated molecular patterns
(DAMPs) and generate proinflammatory signals (FESSLER; RUDEL; BROWN,
2009) . For example, saturated fatty acids (FFAs) may potentially bind to toll-like
receptor 4 (TLR-4), and activated its signaling pathways (HUANG et al., 2012) . In
adipocytes, the activation of TLR-4 promotes NF-κB translocation and leads to the
production of proinflammatory cytokines (SUGANAMI et al., 2007) . Furthermore, the
elevated FFAs in obese patients also induces adipose tissue macrophage infiltration
(NGUYEN et al., 2007) .
The analysis of this study also showed positive enrichment of the signaling by
proinflammatory interleukins in CM 6. Interleukins and other inflammatory mediators
were shown to partake in the macrophage-adipocyte crosstalk (ENGIN, 2017) ,
leading to a pro-inflammatory state and adipose insulin resistance in obese patients
(BING, 2015) . This crosstalk secrets IL-6 and directly interferes with insulin signaling
(WEISBERG et al., 2003) , and it has also been correlated with obesity-induced
insulin resistance (PRADHAN et al., 2001) .
Another cytokine produced by the adipose tissue macrophages is IL-1β
(SIMS; SMITH, 2010) , which has been shown to reduce the expression of proteins
from the insulin signaling pathway, such as IRS-1 and glucose uptake (GLUT4), and
impair downstream insulin signaling (GAO et al., 2014) . Interestingly, both IL-6 and
IL-1β have also been identified as highly differentially co-expressed genes between
MHO and MUO individuals in the liver, muscle, and adipose tissues (KOGELMAN et
al., 2016) .
When combining the SAT gene expression signature with the consensus
co-expression network, it was no surprise to have found CM 6 and CM 14 with high
numbers of DEGs since they both had high NES throughout most studies (Figure
16). In contrast, CM 13 had the greatest number of DEGs among all co-expression
communities, and yet no consistent and significant pathway enrichment was found.
The pathway enrichment analysis and GSEA failed to find a consensus for
liver, muscle, and blood studies. Previous reports have performed co-expression
analysis for blood samples (FATIMA et al., 2018; NAKAYA et al., 2015; OBEIDAT et
73
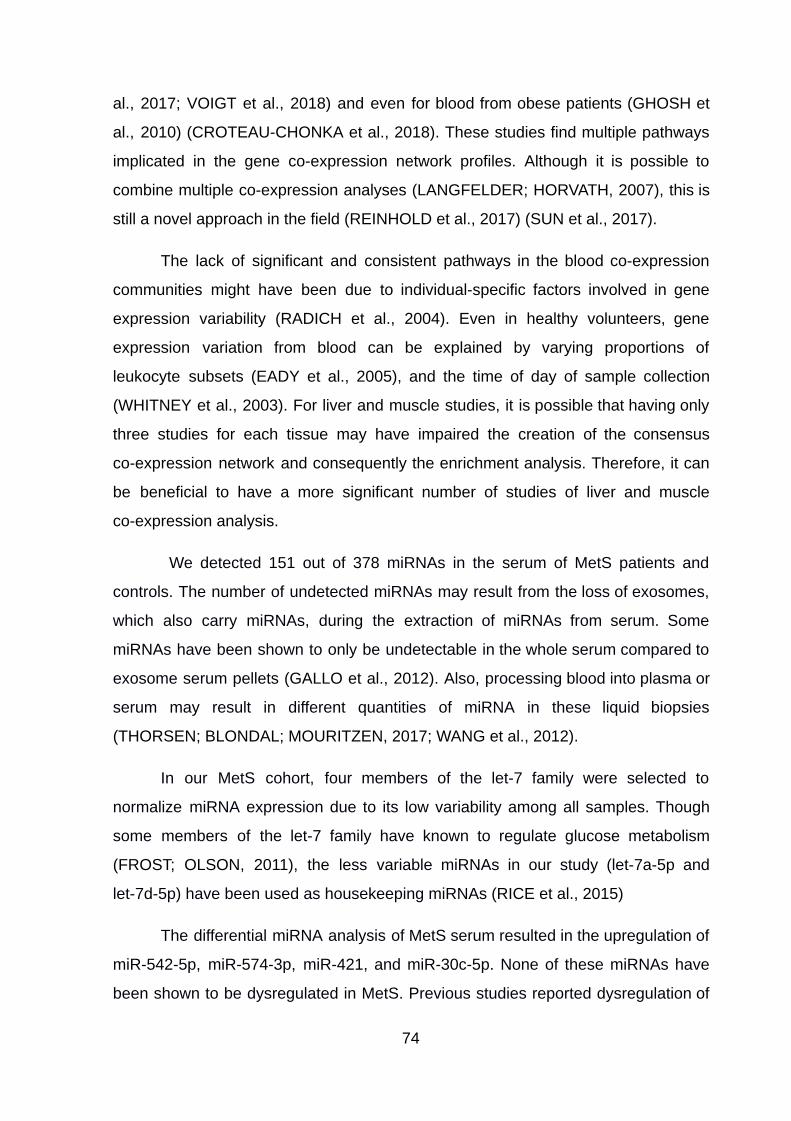
al., 2017; VOIGT et al., 2018) and even for blood from obese patients (GHOSH et
al., 2010) (CROTEAU-CHONKA et al., 2018) . These studies find multiple pathways
implicated in the gene co-expression network profiles. Although it is possible to
combine multiple co-expression analyses (LANGFELDER; HORVATH, 2007) , this is
still a novel approach in the field (REINHOLD et al., 2017) (SUN et al., 2017) .
The lack of significant and consistent pathways in the blood co-expression
communities might have been due to individual-specific factors involved in gene
expression variability (RADICH et al., 2004) . Even in healthy volunteers, gene
expression variation from blood can be explained by varying proportions of
leukocyte subsets (EADY et al., 2005) , and the time of day of sample collection
(WHITNEY et al., 2003) . For liver and muscle studies, it is possible that having only
three studies for each tissue may have impaired the creation of the consensus
co-expression network and consequently the enrichment analysis. Therefore, it can
be beneficial to have a more significant number of studies of liver and muscle
co-expression analysis.
We detected 151 out of 378 miRNAs in the serum of MetS patients and
controls. The number of undetected miRNAs may result from the loss of exosomes,
which also carry miRNAs, during the extraction of miRNAs from serum. Some
miRNAs have been shown to only be undetectable in the whole serum compared to
exosome serum pellets (GALLO et al., 2012) . Also, processing blood into plasma or
serum may result in different quantities of miRNA in these liquid biopsies
(THORSEN; BLONDAL; MOURITZEN, 2017; WANG et al., 2012) .
In our MetS cohort, four members of the let-7 family were selected to
normalize miRNA expression due to its low variability among all samples. Though
some members of the let-7 family have known to regulate glucose metabolism
(FROST; OLSON, 2011) , the less variable miRNAs in our study (let-7a-5p and
let-7d-5p) have been used as housekeeping miRNAs (RICE et al., 2015)
The differential miRNA analysis of MetS serum resulted in the upregulation of
miR-542-5p, miR-574-3p, miR-421, and miR-30c-5p. None of these miRNAs have
been shown to be dysregulated in MetS. Previous studies reported dysregulation of
74
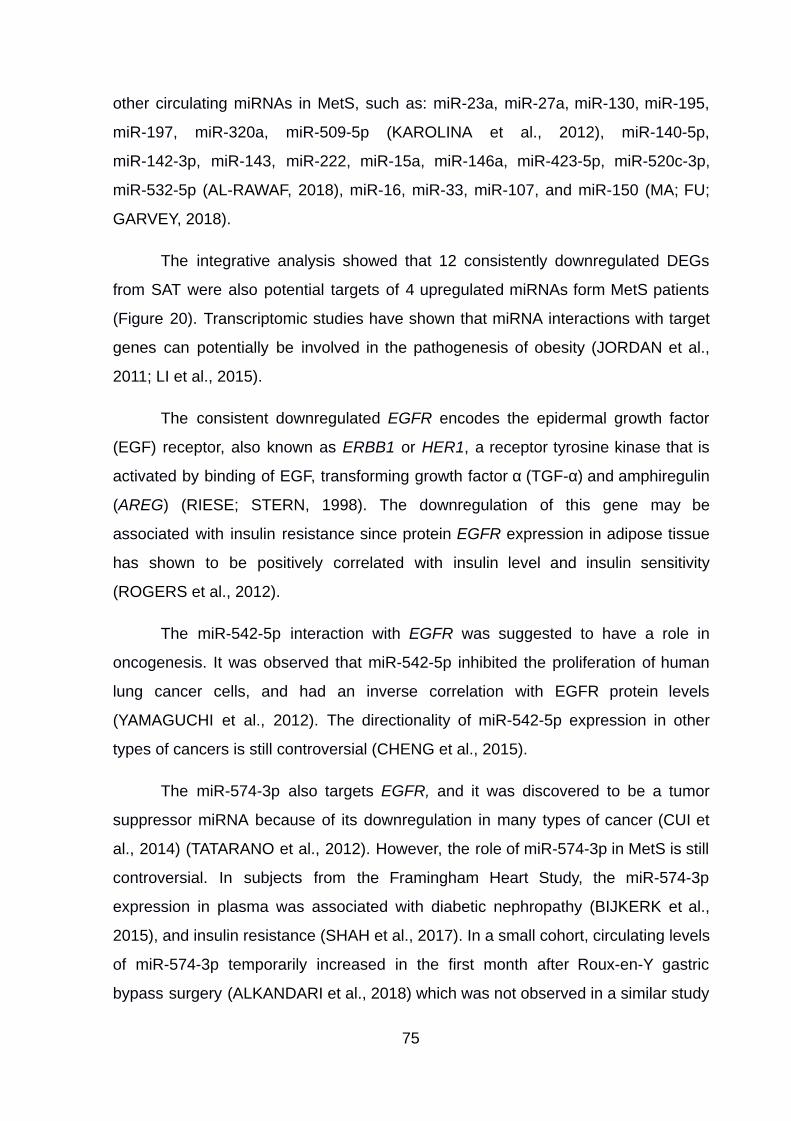
other circulating miRNAs in MetS, such as: miR-23a, miR-27a, miR-130, miR-195,
miR-197, miR-320a, miR-509-5p (KAROLINA et al., 2012) , miR-140-5p,
miR-142-3p, miR-143, miR-222, miR-15a, miR-146a, miR-423-5p, miR-520c-3p,
miR-532-5p (AL-RAWAF, 2018) , miR-16, miR-33, miR-107, and miR-150 (MA; FU;
GARVEY, 2018) .
The integrative analysis showed that 12 consistently downregulated DEGs
from SAT were also potential targets of 4 upregulated miRNAs form MetS patients
(Figure 20). Transcriptomic studies have shown that miRNA interactions with target
genes can potentially be involved in the pathogenesis of obesity (JORDAN et al.,
2011; LI et al., 2015) .
The consistent downregulated EGFR encodes the epidermal growth factor
(EGF) receptor, also known as ERBB1 or HER1 , a receptor tyrosine kinase that is
activated by binding of EGF, transforming growth factor α (TGF-α) and amphiregulin
( AREG ) (RIESE; STERN, 1998) . The downregulation of this gene may be
associated with insulin resistance si nce protein EGFR expression in adipose tissue
has shown to be positively correlated with insulin level and insulin sensitivity
(ROGERS et al., 2012) .
The miR-542-5p interaction with EGFR was suggested to have a role in
oncogenesis. It was observed that miR-542-5p inhibited the proliferation of human
lung cancer cells, and had an inverse correlation with EGFR protein levels
(YAMAGUCHI et al., 2012) . The directionality of miR-542-5p expression in other
types of cancers is still controversial (CHENG et al., 2015) .
The miR-574-3p also targets EGFR, and it was discovered to be a tumor
suppressor miRNA because of its downregulation in many types of cancer (CUI et
al., 2014) (TATARANO et al., 2012) . However, the role of miR-574-3p in MetS is still
controversial. In subjects from the Framingham Heart Study, the miR-574-3p
expression in plasma was associated with diabetic nephropathy (BIJKERK et al.,
2015) , and insulin resistance (SHAH et al., 2017) . In a small cohort, circulating levels
of miR-574-3p temporarily increased in the first month after Roux-en-Y gastric
bypass surgery (ALKANDARI et al., 2018) which was not observed in a similar study
75
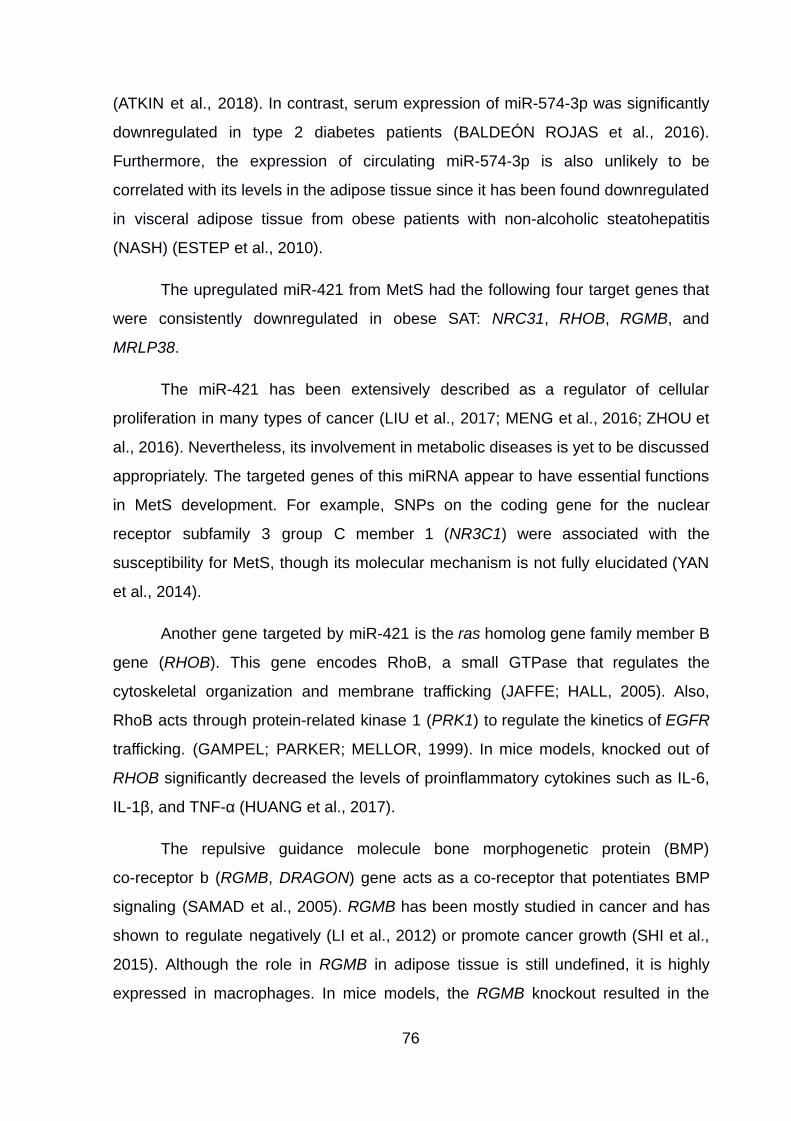
(ATKIN et al., 2018) . In contrast, serum expression of miR-574-3p was significantly
downregulated in type 2 diabetes patients (BALDEÓN ROJAS et al., 2016) .
Furthermore, the expression of circulating miR-574-3p is also unlikely to be
correlated with its levels in the adipose tissue since it has been found downregulated
in visceral adipose tissue from obese patients with non-alcoholic steatohepatitis
(NASH) (ESTEP et al., 2010) .
The upregulated miR-421 from MetS had the following four target genes that
were consistently downregulated in obese SAT: NRC31 , RHOB , RGMB , and
MRLP38 .
The miR-421 has been extensively described as a regulator of cellular
proliferation in many types of cancer (LIU et al., 2017; MENG et al., 2016; ZHOU et
al., 2016) . Nevertheless, its involvement in metabolic diseases is yet to be discussed
appropriately. The targeted genes of this miRNA appear to have essential functions
in MetS development. For example, SNPs on the coding gene for the nuclear
receptor subfamily 3 group C member 1 ( NR3C1 ) were associated with the
susceptibility for MetS, though its molecular mechanism is not fully elucidated (YAN
et al., 2014) .
Another gene targeted by miR-421 is the ras homolog gene family member B
gene ( RHOB ). This gene encodes RhoB, a small GTPase that regulates the
cytoskeletal organization and membrane trafficking (JAFFE; HALL, 2005) . Also,
RhoB acts through protein-related kinase 1 ( PRK1 ) to regulate the kinetics of EGFR
trafficking. (GAMPEL; PARKER; MELLOR, 1999) . In mice models, knocked out of
RHOB significantly decreased the levels of proinflammatory cytokines such as IL-6,
IL-1β, and TNF-α (HUANG et al., 2017) .
The repulsive guidance molecule bone morphogenetic protein (BMP)
co-receptor b ( RGMB , DRAGON ) gene acts as a co-receptor that potentiates BMP
signaling (SAMAD et al., 2005) . RGMB has been mostly studied in cancer and has
shown to regulate negatively (LI et al., 2012) or promote cancer growth (SHI et al.,
2015) . Although the role in RGMB in adipose tissue is still undefined, it is highly
expressed in macrophages. In mice models, the RGMB knockout resulted in the
76
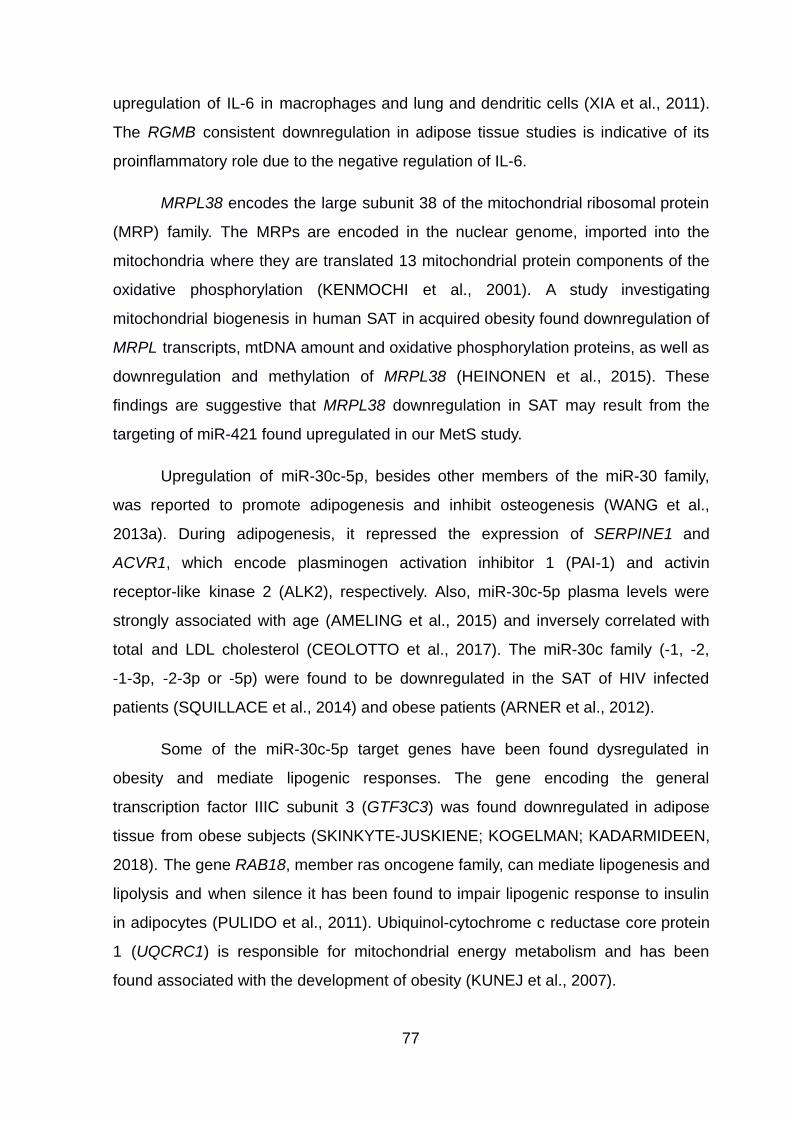
upregulation of IL-6 in macrophages and lung and dendritic cells (XIA et al., 2011) .
The RGMB consistent downregulation in adipose tissue studies is indicative of its
proinflammatory role due to the negative regulation of IL-6.
MRPL38 encodes the large subunit 38 of the mitochondrial ribosomal protein
(MRP) family. The MRPs are encoded in the nuclear genome, imported into the
mitochondria where they are translated 13 mitochondrial protein components of the
oxidative phosphorylation (KENMOCHI et al., 2001) . A study investigating
mitochondrial biogenesis in human SAT in acquired obesity found downregulation of
MRPL transcripts, mtDNA amount and oxidative phosphorylation proteins, as well as
downregulation and methylation of MRPL38 (HEINONEN et al., 2015) . These
findings are suggestive that MRPL38 downregulation in SAT may result from the
targeting of miR-421 found upregulated in our MetS study.
Upregulation of miR-30c-5p, besides other members of the miR-30 family,
was reported to promote adipogenesis and inhibit osteogenesis (WANG et al.,
2013a) . During adipogenesis, it repressed the expression of SERPINE1 and
ACVR1 , which encode plasminogen activation inhibitor 1 (PAI-1) and activin
receptor-like kinase 2 (ALK2), respectively. Also, miR-30c-5p plasma levels were
strongly associated with age (AMELING et al., 2015) and inversely correlated with
total and LDL cholesterol (CEOLOTTO et al., 2017) . The miR-30c family (-1, -2,
-1-3p, -2-3p or -5p) were found to be downregulated in the SAT of HIV infected
patients (SQUILLACE et al., 2014) and obese patients (ARNER et al., 2012) .
Some of the miR-30c-5p target genes have been found dysregulated in
obesity and mediate lipogenic responses. The gene encoding the general
transcription factor IIIC subunit 3 ( GTF3C3 ) was found downregulated in adipose
tissue from obese subjects (SKINKYTE-JUSKIENE; KOGELMAN; KADARMIDEEN,
2018) . The gene RAB18 , member ras oncogene family, can mediate lipogenesis and
lipolysis and when silence it has been found to impair lipogenic response to insulin
in adipocytes (PULIDO et al., 2011) . Ubiquinol-cytochrome c reductase core protein
1 ( UQCRC1 ) is responsible for mitochondrial energy metabolism and has been
found associated with the development of obesity (KUNEJ et al., 2007) .
77
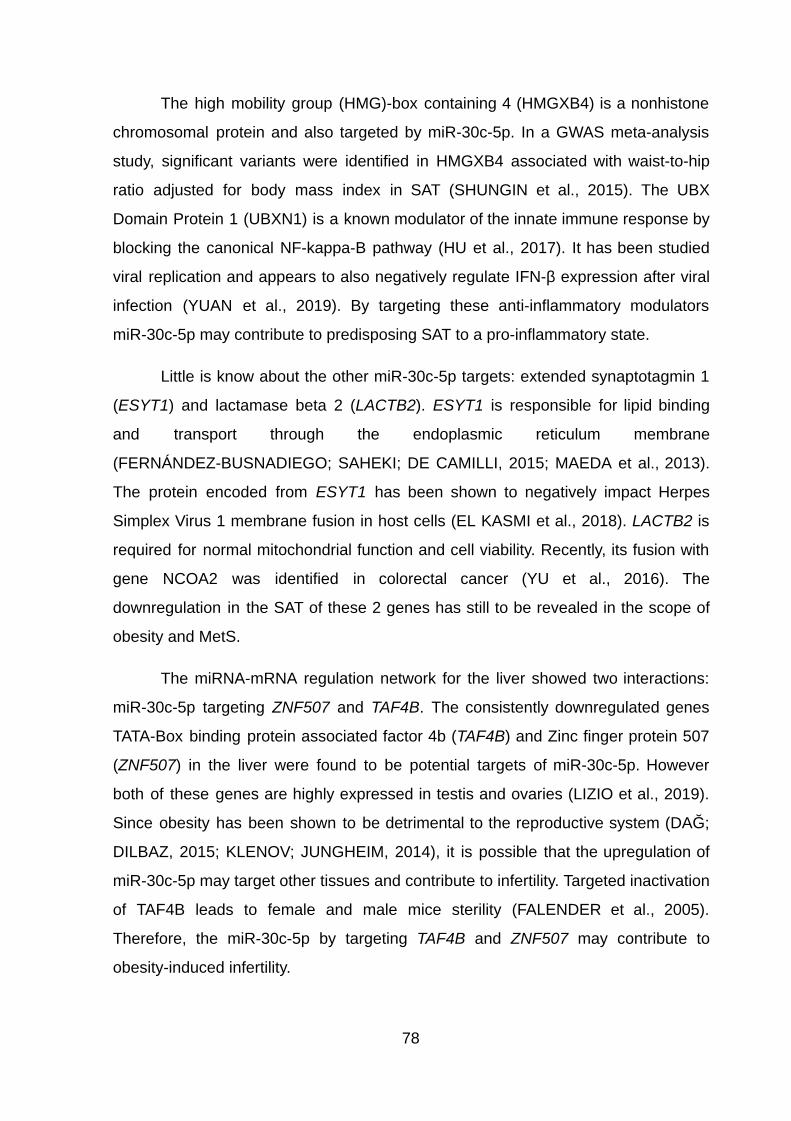
The high mobility group (HMG)-box containing 4 (HMGXB4) is a nonhistone
chromosomal protein and also targeted by miR-30c-5p. In a GWAS meta-analysis
study, significant variants were identified in HMGXB4 associated with waist-to-hip
ratio adjusted for body mass index in SAT (SHUNGIN et al., 2015) . The UBX
Domain Protein 1 (UBXN1) is a known modulator of the innate immune response by
blocking the canonical NF-kappa-B pathway (HU et al., 2017) . It has been studied
viral replication and appears to also negatively regulate IFN-β expression after viral
infection (YUAN et al., 2019) . By targeting these anti-inflammatory modulators
miR-30c-5p may contribute to predisposing SAT to a pro-inflammatory state.
Little is know about the other miR-30c-5p targets: extended synaptotagmin 1
( ESYT1 ) and lactamase beta 2 ( LACTB2 ). ESYT1 is responsible for lipid binding
and transport through the endoplasmic reticulum membrane
(FERNÁNDEZ-BUSNADIEGO; SAHEKI; DE CAMILLI, 2015; MAEDA et al., 2013) .
The protein encoded from ESYT1 has been shown to negatively impact Herpes
Simplex Virus 1 membrane fusion in host cells (EL KASMI et al., 2018) . LACTB2 is
required for normal mitochondrial function and cell viability. Recently, its fusion with
gene NCOA2 was identified in colorectal cancer (YU et al., 2016) . The
downregulation in the SAT of these 2 genes has still to be revealed in the scope of
obesity and MetS.
The miRNA-mRNA regulation network for the liver showed two interactions:
miR-30c-5p targeting ZNF507 and TAF4B . The consistently downregulated genes
TATA-Box binding protein associated factor 4b ( TAF4B ) and Zinc finger protein 507
( ZNF507 ) in the liver were found to be potential targets of miR-30c-5p. However
both of these genes are highly expressed in testis and ovaries (LIZIO et al., 2019) .
Since obesity has been shown to be detrimental to the reproductive system (DAĞ;
DILBAZ, 2015; KLENOV; JUNGHEIM, 2014) , it is possible that the upregulation of
miR-30c-5p may target other tissues and contribute to infertility. Targeted inactivation
of TAF4B leads to female and male mice sterility (FALENDER et al., 2005) .
Therefore, the miR-30c-5p by targeting TAF4B and ZNF507 may contribute to
obesity-induced infertility.
78

In the literature, miR-30c was found to be potentially beneficial in treating
hyperlipidemias as it was discovered to reduce lipid biosynthesis and lipoprotein
secretion (SOH et al., 2013) . A study with the non-alcoholic fatty liver disease found
downregulation of circulating miR-30c (MEHTA et al., 2016) , though no mention was
made of the miRNA type. Furthermore, the liver upregulation of miR-30c-5p in
leptin-deficient mice reduced triglyceride accumulation and hepatic steatosis by
counterbalancing fatty acid biosynthesis (FAN et al., 2017) . Since not all obese
patients have signs of developing hepatic steatosis (BACON et al., 1994) (STEFAN;
HÄRING; CUSI, 2019) , upregulation of miR-30c-5p can be a potential mediator of
this process.
Even though the same differentially expressed miRNAs target distinct tissues,
for example, miR-30c-5p can regulate genes in SAT and Liver, the targeted genes
are different in each tissue. Thus showing the complexity of miRNA’s gene
expression regulation.
In summary, this study provides preliminary research findings regarding the
unique miRNA-gene regulatory network expressed in MetS. However, research is
still needed to characterize the relationship between the miRNA and their target
genes uncovered in our analysis as well as their mechanism of action in the immune
and metabolic pathways.
79
6. Conclusions and Future direction
In this study, bioinformatics analysis was used to determine a gene
expression signature, gene co-expression modules, an integrative miRNA-mRNA
analysis. These methods showed that combining multiple transcriptomic studies can
uncover possible new molecular interactions even in a complex disease as MetS.
A consistent gene expression signature for obesity was found for
subcutaneous adipose tissue and liver. The SAT gene signature showed evidence of
local infiltrating immune cells, including neutrophils, and meta-inflammation
pathways. The liver gene signature uncovered fatty acid and phospholipid
metabolism pathways and neutrophil presence in hepatic tissue.
A consensus co-expression analysis successfully detected consistent
co-expression communities in SAT that were passive of finding meaningful enriched
pathways. These pathways confirm increased immune cells and a pro-inflammatory
environment in SAT. It was not possible to uncover meaningful co-expression
communities from the consensus co-expression networks of blood, liver, and muscle
due to analytical limitations including the number of studies.
The circulating levels of miR-574-3p, miR-542-5p, miR-421, and miR-30c-5p
were found upregulated in serum from MetS patients. Since the first 3
aforementioned miRNAs have not been described in MetS until now, additional
validation in a larger cohort is needed for their potential use as metabolic alteration
biomarkers in obese or MetS patients.
The same miRNA can potentially regulate different tissues through distinct
targets for each tissue. Obese SAT has a distinct proinflammatory signature
compared to the lean SAT as shown through integrative analysis. Thus, proving
possible to integrate transcriptomic data with miRNA profiling for MetS.
The Systems Biology strategy was able to identify dysregulated mRNAs in
four types of tissues that could be under the influence of upregulated circulating
miRNA from MetS patients.
80
7. Bibliography
ABDELFATTAH, A. M.; PARK, C.; CHOI, M. Y. Update on non-canonical microRNAs. Biomolecular concepts , v. 5, n. 4, p. 275–287, Aug. 2014.
ADEOLA, H. A.; PAPAGERAKIS, S.; PAPAGERAKIS, P. Systems biology approaches and precision oral health: A circadian clock perspective. Frontiers in physiology , v. 10, p. 399, 16 Apr. 2019.
AHRENS, M. et al. DNA methylation analysis in nonalcoholic fatty liver disease suggests distinct disease-specific and remodeling signatures after bariatric surgery. Cell Metabolism , v. 18, n. 2, p. 296–302, 6 Aug. 2013.
AL-RAWAF, H. A. Circulating microRNAs and adipokines as markers of metabolic syndrome in adolescents with obesity. Clinical Nutrition , 25 Sep. 2018.
ALBERTI, K. G. M. M. et al. Harmonizing the metabolic syndrome: a joint interim statement of the International Diabetes Federation Task Force on Epidemiology and Prevention; National Heart, Lung, and Blood Institute; American Heart Association; World Heart Federation; International Atherosclerosis Society; and International Association for the Study of Obesity. Circulation , v. 120, n. 16, p. 1640–1645, 20 Oct. 2009.
ALKANDARI, A. et al. Improved physiology and metabolic flux after Roux-en-Y gastric bypass is associated with temporal changes in the circulating microRNAome: a longitudinal study in humans. BMC obesity , v. 5, p. 20, 31 May 2018.
ALLIKMETS, R. et al. Characterization of the human ABC superfamily: isolation and mapping of 21 new genes using the expressed sequence tags database. Human Molecular Genetics , v. 5, n. 10, p. 1649–1655, Oct. 1996.
AMELING, S. et al. Associations of circulating plasma microRNAs with age, body mass index and sex in a population-based study. BMC Medical Genomics , v. 8, p. 61, 14 Oct. 2015.
ARCHER, T. C. et al. Systems approaches to cancer biology. Cancer Research , v. 76, n. 23, p. 6774–6777, 1 Dec. 2016.
ARMENISE, C. et al. Transcriptome profiling from adipose tissue during a low-calorie diet reveals predictors of weight and glycemic outcomes in obese, nondiabetic subjects. The American Journal of Clinical Nutrition , v. 106, n. 3, p. 736–746, Sep. 2017.
ARNER, E. et al. Adipose tissue microRNAs as regulators of CCL2 production in
81
human obesity. Diabetes , v. 61, n. 8, p. 1986–1993, Aug. 2012.
ARNER, P. Not all fat is alike. The Lancet , v. 351, n. 9112, p. 1301–1302, 2 May 1998.
ARNER, P. et al. The epigenetic signature of systemic insulin resistance in obese women. Diabetologia , v. 59, n. 11, p. 2393–2405, 18 Aug. 2016.
ASHWELL, M. et al. Waist-to-height ratio is more predictive of years of life lost than body mass index. Plos One , v. 9, n. 9, p. e103483, 8 Sep. 2014.
ASHWELL, M.; GUNN, P.; GIBSON, S. Waist-to-height ratio is a better screening tool than waist circumference and BMI for adult cardiometabolic risk factors: systematic review and meta-analysis. Obesity Reviews , v. 13, n. 3, p. 275–286, Mar. 2012.
ATKIN, S. L. et al. Changes in Blood microRNA Expression and Early Metabolic Responsiveness 21 Days Following Bariatric Surgery. Frontiers in endocrinology , v. 9, p. 773, 2018.
AVERY, C. L. et al. A phenomics-based strategy identifies loci on APOC1, BRAP, and PLCG1 associated with metabolic syndrome phenotype domains. PLoS Genetics , v. 7, n. 10, p. e1002322, 13 Oct. 2011.
BACON, B. R. et al. Nonalcoholic steatohepatitis: an expanded clinical entity. Gastroenterology , v. 107, n. 4, p. 1103–1109, Oct. 1994.
BADOUD, F. et al. Serum and adipose tissue amino acid homeostasis in the metabolically healthy obese. Journal of Proteome Research , v. 13, n. 7, p. 3455–3466, 3 Jul. 2014.
BADOUD, F. et al. Multi-omics Integrative Investigation of Fatty Acid Metabolism in Obese and Lean Subcutaneous Tissue. Omics : a journal of integrative biology , v. 21, n. 7, p. 371–379, 15 Jun. 2017.
BAKKER, O. B. et al. Integration of multi-omics data and deep phenotyping enables prediction of cytokine responses. Nature Immunology , v. 19, n. 7, p. 776–786, 21 May 2018.
BALDEÓN ROJAS, L. et al. Study on inflammation-related genes and microRNAs, with special emphasis on the vascular repair factor HGF and miR-574-3p, in monocytes and serum of patients with T2D. Diabetology & metabolic syndrome , v. 8, p. 6, 15 Jan. 2016.
BARBOSA, P. J. B. et al. Criteria for central obesity in a Brazilian population: impact on metabolic syndrome. Arquivos brasileiros de cardiologia , v. 87, n. 4, p.
82
407–414, Oct. 2006.
BARRETT, T. et al. NCBI GEO: mining tens of millions of expression profiles--database and tools update. Nucleic Acids Research , v. 35, n. Database issue, p. D760-5, Jan. 2007.
BARTEL, D. P. MicroRNAs: genomics, biogenesis, mechanism, and function. Cell , v. 116, n. 2, p. 281–297, 23 Jan. 2004.
BEHM-ANSMANT, I.; REHWINKEL, J.; IZAURRALDE, E. MicroRNAs silence gene expression by repressing protein expression and/or by promoting mRNA decay. Cold Spring Harbor Symposia on Quantitative Biology , v. 71, p. 523–530, 2006.
BELINSKY, M. G. et al. Characterization of MOAT-C and MOAT-D, new members of the MRP/cMOAT subfamily of transporter proteins. Journal of the National Cancer Institute , v. 90, n. 22, p. 1735–1741, 18 Nov. 1998.
BELLOT, P. et al. NetBenchmark: a bioconductor package for reproducible benchmarks of gene regulatory network inference. BMC Bioinformatics , v. 16, p. 312, 29 Sep. 2015.
BENJAMINI, Y.; HOCHBERG, Y. (controlling the false discovery rate: a practical and powerful approach to multiple testing. J R Stat Soc , Series B, Vol. 57, p. 289–300, 1995.
BERNSTEIN, E. et al. Role for a bidentate ribonuclease in the initiation step of RNA interference. Nature , v. 409, n. 6818, p. 363–366, 18 Jan. 2001.
BIJKERK, R. et al. Circulating microRNAs associate with diabetic nephropathy and systemic microvascular damage and normalize after simultaneous pancreas-kidney transplantation. American Journal of Transplantation , v. 15, n. 4, p. 1081–1090, Apr. 2015.
BING, C. Is interleukin-1β a culprit in macrophage-adipocyte crosstalk in obesity? Adipocyte , v. 4, n. 2, p. 149–152, Jun. 2015.
BORST, S. E.; CONOVER, C. F. High-fat diet induces increased tissue expression of TNF-alpha. Life Sciences , v. 77, n. 17, p. 2156–2165, 9 Sep. 2005.
BROTFAIN, E. et al. Neutrophil functions in morbidly obese subjects. Clinical and Experimental Immunology , v. 181, n. 1, p. 156–163, Jul. 2015.
BURG, N. D.; PILLINGER, M. H. The neutrophil: function and regulation in innate and humoral immunity. Clinical Immunology , v. 99, n. 1, p. 7–17, Apr. 2001.
CAHAN, P. et al. Meta-analysis of microarray results: challenges, opportunities, and recommendations for standardization. Gene , v. 401, n. 1–2, p. 12–18, 15 Oct. 2007.
83
CARLSEN, H. et al. Diet-induced obesity increases NF-kappaB signaling in reporter mice. Genes & Nutrition , v. 4, n. 3, p. 215–222, Sep. 2009.
CARNETHON, M. R. et al. Risk factors for the metabolic syndrome: the Coronary Artery Risk Development in Young Adults (CARDIA) study, 1985-2001. Diabetes Care , v. 27, n. 11, p. 2707–2715, Nov. 2004.
CEOLOTTO, G. et al. miR-30c-5p regulates macrophage-mediated inflammation and pro-atherosclerosis pathways. Cardiovascular Research , v. 113, n. 13, p. 1627–1638, 1 Nov. 2017.
CHAUDHURI, R. et al. Cross-species gene expression analysis identifies a novel set of genes implicated in human insulin sensitivity. npj Systems Biology and Applications , v. 1, n. 1, Dec. 2015.
CHENDRIMADA, T. P. et al. MicroRNA silencing through RISC recruitment of eIF6. Nature , v. 447, n. 7146, p. 823–828, 14 Jun. 2007.
CHENG, D. et al. MiR-542-5p is a negative prognostic factor and promotes osteosarcoma tumorigenesis by targeting HUWE1. Oncotarget , v. 6, n. 40, p. 42761–42772, 15 Dec. 2015.
CHEN, G. et al. Restructured GEO: restructuring Gene Expression Omnibus metadata for genome dynamics analysis. Database: the Journal of Biological Databases and Curation , v. 2019, 1 Jan. 2019.
CHEN, Y.; LI, L.; XU, R. Disease comorbidity network guides the detection of molecular evidence for the link between colorectal cancer and obesity. AMIA Joint Summits on Translational Science proceedings AMIA Summit on Translational Science , v. 2015, p. 201–206, 23 Mar. 2015.
CHIM, S. S. C. et al. Detection and characterization of placental microRNAs in maternal plasma. Clinical Chemistry , v. 54, n. 3, p. 482–490, Mar. 2008.
CHOI, J. K. et al. Combining multiple microarray studies and modeling interstudy variation. Bioinformatics , v. 19 Suppl 1, p. i84-90, 2003.
CHOU, C.-H. et al. miRTarBase update 2018: a resource for experimentally validated microRNA-target interactions. Nucleic Acids Research , v. 46, n. D1, p. D296–D302, 4 Jan. 2018.
CILDIR, G.; AKINCILAR, S. C.; TERGAONKAR, V. Chronic adipose tissue inflammation: all immune cells on the stage. Trends in Molecular Medicine , v. 19, n. 8, p. 487–500, Aug. 2013.
CLOUGH, E.; BARRETT, T. The gene expression omnibus database. Methods in
84
Molecular Biology , v. 1418, p. 93–110, 2016.
CORRÊA, M. M. et al. Performance of the waist-to-height ratio in identifying obesity and predicting non-communicable diseases in the elderly population: A systematic literature review. Archives of Gerontology and Geriatrics , v. 65, p. 174–182, Aug. 2016.
CROTEAU-CHONKA, D. C. et al. Gene Coexpression Networks in Whole Blood Implicate Multiple Interrelated Molecular Pathways in Obesity in People with Asthma. Obesity , v. 26, n. 12, p. 1938–1948, Dec. 2018.
CUI, Z. et al. Hsa-miR-574-5p negatively regulates MACC-1 expression to suppress colorectal cancer liver metastasis. Cancer cell international , v. 14, p. 47, 7 Jun. 2014.
DAĞ, Z. Ö.; DILBAZ, B. Impact of obesity on infertility in women. Journal of the Turkish German Gynecological Association , v. 16, n. 2, p. 111–117, 1 Jun. 2015.
DAO, M. C. et al. A Data Integration Multi-Omics Approach to Study Calorie Restriction-Induced Changes in Insulin Sensitivity. Frontiers in physiology , v. 9, p. 1958, 2018.
DENG, T. et al. Class II major histocompatibility complex plays an essential role in obesity-induced adipose inflammation. Cell Metabolism , v. 17, n. 3, p. 411–422, 5 Mar. 2013.
DE CARVALHO VIDIGAL, F. et al. Prevalence of metabolic syndrome in Brazilian adults: a systematic review. BMC Public Health , v. 13, p. 1198, 18 Dec. 2013.
DE KONING, L. et al. Waist circumference and waist-to-hip ratio as predictors of cardiovascular events: meta-regression analysis of prospective studies. European Heart Journal , v. 28, n. 7, p. 850–856, 2 Apr. 2007.
DE OLIVEIRA, E. P.; DE SOUZA, M. L. A.; DE LIMA, M. DAS D. A. [Prevalence of metabolic syndrome in a semi-arid rural area in Bahia]. Arquivos Brasileiros de Endocrinologia e Metabologia , v. 50, n. 3, p. 456–465, Jun. 2006.
DE OLIVEIRA, G. F. et al. Prevalence of metabolic syndrome in the indigenous population, aged 19 to 69 years, from Jaguapiru Village, Dourados (MS), Brazil. Ethnicity & Disease , v. 21, n. 3, p. 301–306, 2011.
DUMEAUX, V. et al. Deciphering normal blood gene expression variation--The NOWAC postgenome study. PLoS Genetics , v. 6, n. 3, p. e1000873, 12 Mar. 2010.
DUTRA, E. S. et al. Metabolic syndrome in central Brazil: prevalence and correlates in the adult population. Diabetology & metabolic syndrome , v. 4, n. 1, p. 20, 14
85
May 2012.
D’AMORE, S. et al. Identification of miR-9-5p as direct regulator of ABCA1 and HDL-driven reverse cholesterol transport in circulating CD14+ cells of patients with metabolic syndrome. Cardiovascular Research , v. 114, n. 8, p. 1154–1164, 1 Jul. 2018.
EADY, J. J. et al. Variation in gene expression profiles of peripheral blood mononuclear cells from healthy volunteers. Physiological Genomics , v. 22, n. 3, p. 402–411, 11 Aug. 2005.
ECKEL, N. et al. Metabolically healthy obesity and cardiovascular events: A systematic review and meta-analysis. European journal of preventive cardiology , v. 23, n. 9, p. 956–966, 2016.
EDINGER, T.; COHEN, A. M. A large-scale analysis of the reasons given for excluding articles that are retrieved by literature search during systematic review. AMIA Annual Symposium Proceedings , v. 2013, p. 379–387, 16 Nov. 2013.
EHRLUND, A. et al. The cell-type specific transcriptome in human adipose tissue and influence of obesity on adipocyte progenitors. Scientific data , v. 4, p. 170164, 31 Oct. 2017.
EIN-DOR, L.; ZUK, O.; DOMANY, E. Thousands of samples are needed to generate a robust gene list for predicting outcome in cancer. Proceedings of the National Academy of Sciences of the United States of America , v. 103, n. 15, p. 5923–5928, 11 Apr. 2006.
EL KASMI, I. et al. Extended Synaptotagmin 1 Interacts with Herpes Simplex Virus 1 Glycoprotein M and Negatively Modulates Virus-Induced Membrane Fusion. Journal of Virology , v. 92, n. 1, 1 Jan. 2018.
ENGIN, A. B. Adipocyte-Macrophage Cross-Talk in Obesity. Advances in Experimental Medicine and Biology , v. 960, p. 327–343, 2017.
ESAU, C. et al. MicroRNA-143 regulates adipocyte differentiation. The Journal of Biological Chemistry , v. 279, n. 50, p. 52361–52365, 10 Dec. 2004.
ESSER, D. et al. High fat challenges with different fatty acids affect distinct atherogenic gene expression pathways in immune cells from lean and obese subjects. Molecular Nutrition & Food Research , v. 59, n. 8, p. 1563–1572, Aug. 2015.
ESTEP, M. et al. Differential expression of miRNAs in the visceral adipose tissue of patients with non-alcoholic fatty liver disease. Alimentary Pharmacology & Therapeutics , v. 32, n. 3, p. 487–497, Aug. 2010.
86

FAIN, J. N. Release of interleukins and other inflammatory cytokines by human adipose tissue is enhanced in obesity and primarily due to the nonfat cells. Vitamins and Hormones , v. 74, p. 443–477, 2006.
FALENDER, A. E. et al. Maintenance of spermatogenesis requires TAF4b, a gonad-specific subunit of TFIID. Genes & Development , v. 19, n. 7, p. 794–803, 1 Apr. 2005.
FALL, T.; INGELSSON, E. Genome-wide association studies of obesity and metabolic syndrome. Molecular and Cellular Endocrinology , v. 382, n. 1, p. 740–757, 25 Jan. 2014.
FAN, J. et al. MiR-30c-5p ameliorates hepatic steatosis in leptin receptor-deficient (db/db) mice via down-regulating FASN. Oncotarget , v. 8, n. 8, p. 13450–13463, 21 Feb. 2017.
FATIMA, A. et al. Weighted Gene Co-Expression Network Analysis Identifies Gender Specific Modules and Hub Genes Related to Metabolism and Inflammation in Response to an Acute Lipid Challenge. Molecular Nutrition & Food Research , v. 62, n. 2, 2018.
FERNÁNDEZ-BUSNADIEGO, R.; SAHEKI, Y.; DE CAMILLI, P. Three-dimensional architecture of extended synaptotagmin-mediated endoplasmic reticulum-plasma membrane contact sites. Proceedings of the National Academy of Sciences of the United States of America , v. 112, n. 16, p. E2004-13, 21 Apr. 2015.
FESSLER, M. B.; RUDEL, L. L.; BROWN, J. M. Toll-like receptor signaling links dietary fatty acids to the metabolic syndrome. Current opinion in lipidology , v. 20, n. 5, p. 379–385, Oct. 2009.
FIORAVANTE, M. et al. Inhibition of hypothalamic leukemia inhibitory factor exacerbates diet-induced obesity phenotype. Journal of Neuroinflammation , v. 14, n. 1, p. 178, 2 Sep. 2017.
FLORES, A. M. et al. TNIP1 is a corepressor of agonist-bound PPARs. Archives of Biochemistry and Biophysics , v. 516, n. 1, p. 58–66, 1 Dec. 2011.
FONTAINE, K. R. et al. Years of life lost due to obesity. The Journal of the American Medical Association , v. 289, n. 2, p. 187–193, 8 Jan. 2003.
FRAUWIRTH, K. A. et al. The CD28 signaling pathway regulates glucose metabolism. Immunity , v. 16, n. 6, p. 769–777, Jun. 2002.
FROST, R. J. A.; OLSON, E. N. Control of glucose homeostasis and insulin sensitivity by the Let-7 family of microRNAs. Proceedings of the National Academy of Sciences of the United States of America , v. 108, n. 52, p.
87

21075–21080, 27 Dec. 2011.
FURUKAWA, S. et al. Increased oxidative stress in obesity and its impact on metabolic syndrome. Journal of Clinical Investigation , v. 114, n. 12, p. 1752–1761, 15 Dec. 2004.
GALLAGHER, J. et al. Identification of Naf1/ABIN-1 among TNF-alpha-induced expressed genes in human synoviocytes using oligonucleotide microarrays. FEBS Letters , v. 551, n. 1–3, p. 8–12, 11 Sep. 2003.
GALLO, A. et al. The majority of microRNAs detectable in serum and saliva is concentrated in exosomes. Plos One , v. 7, n. 3, p. e30679, 9 Mar. 2012.
GAMPEL, A.; PARKER, P. J.; MELLOR, H. Regulation of epidermal growth factor receptor traffic by the small GTPase rhoB. Current Biology , v. 9, n. 17, p. 955–958, 9 Sep. 1999.
GAO, D. et al. Interleukin-1β mediates macrophage-induced impairment of insulin signaling in human primary adipocytes. American Journal of Physiology. Endocrinology and Metabolism , v. 307, n. 3, p. E289-304, 1 Aug. 2014.
GEBERT, L. F. R.; MACRAE, I. J. Regulation of microRNA function in animals. Nature Reviews. Molecular Cell Biology , v. 20, n. 1, p. 21–37, Jan. 2019.
GHOSH, S. et al. Gene expression profiling in whole blood identifies distinct biological pathways associated with obesity. BMC Medical Genomics , v. 3, p. 56, 1 Dec. 2010.
GILAD, S. et al. Serum microRNAs are promising novel biomarkers. Plos One , v. 3, n. 9, p. e3148, 5 Sep. 2008.
GOUGH, N. M. et al. Molecular cloning and expression of the human homologue of the murine gene encoding myeloid leukemia-inhibitory factor. Proceedings of the National Academy of Sciences of the United States of America , v. 85, n. 8, p. 2623–2627, Apr. 1988.
GRACE, M. S. et al. Acute effects of active breaks during prolonged sitting on subcutaneous adipose tissue gene expression: an ancillary analysis of a randomised controlled trial. Scientific Reports , v. 9, n. 1, p. 3847, 7 Mar. 2019.
GRONNER, M. F. et al. Prevalence of metabolic syndrome and its association with educational inequalities among Brazilian adults: a population-based study. Brazilian Journal of Medical and Biological Research , v. 44, n. 7, p. 713–719, 8 Jul. 2011.
GRUNDY, S. M. Metabolic syndrome pandemic. Arteriosclerosis, Thrombosis, and Vascular Biology , v. 28, n. 4, p. 629–636, Apr. 2008.
88
HAAS, B. E. et al. Adipose co-expression networks across Finns and Mexicans identify novel triglyceride-associated genes. BMC Medical Genomics , v. 5, p. 61, 6 Dec. 2012.
HAO, R. H. et al. Gene expression profiles indicate tissue-specific obesity regulation changes and strong obesity relevant tissues. International Journal of Obesity , v. 42, n. 3, p. 363–369, 2018.
HEINONEN, S. et al. Impaired mitochondrial biogenesis in adipose tissue in acquired obesity. Diabetes , v. 64, n. 9, p. 3135–3145, Sep. 2015.
HEYNINCK, K. et al. The zinc finger protein A20 inhibits TNF-induced NF-kappaB-dependent gene expression by interfering with an RIP- or TRAF2-mediated transactivation signal and directly binds to a novel NF-kappaB-inhibiting protein ABIN. The Journal of Cell Biology , v. 145, n. 7, p. 1471–1482, 28 Jun. 1999.
HE, H. et al. A systems genetics approach identified GPD1L and its molecular mechanism for obesity in human adipose tissue. Scientific Reports , v. 7, n. 1, p. 1799, 11 May 2017.
HIRSCH, H. A. et al. A transcriptional signature and common gene networks link cancer with lipid metabolism and diverse human diseases. Cancer Cell , v. 17, n. 4, p. 348–361, 13 Apr. 2010.
HORVATH, S. et al. Obesity accelerates epigenetic aging of human liver. Proceedings of the National Academy of Sciences of the United States of America , v. 111, n. 43, p. 15538–15543, 28 Oct. 2014.
HOTAMISLIGIL, G. S. et al. Increased adipose tissue expression of tumor necrosis factor-alpha in human obesity and insulin resistance. The Journal of Clinical Investigation , v. 95, n. 5, p. 2409–2415, May 1995.
HRUBY, A.; HU, F. B. The epidemiology of obesity: A big picture. PharmacoEconomics , v. 33, n. 7, p. 673–689, Jul. 2015.
HUANG, G. et al. RhoB regulates the function of macrophages in the hypoxia-induced inflammatory response. Cellular & Molecular Immunology , v. 14, n. 3, p. 265–275, Mar. 2017.
HUANG, S. et al. Saturated fatty acids activate TLR-mediated proinflammatory signaling pathways. Journal of Lipid Research , v. 53, n. 9, p. 2002–2013, Sep. 2012.
HULSMANS, M. et al. Interleukin-1 receptor-associated kinase-3 is a key inhibitor of inflammation in obesity and metabolic syndrome. Plos One , v. 7, n. 1, p. e30414, 17
89
Jan. 2012.
HU, Y. et al. Multiple UBXN family members inhibit retrovirus and lentivirus production and canonical NFκΒ signaling by stabilizing IκBα. PLoS Pathogens , v. 13, n. 2, p. e1006187, 2 Feb. 2017.
INOUE, Y. et al. Epidemiology of obesity in adults: latest trends. Current obesity reports , v. 7, n. 4, p. 276–288, Dec. 2018.
IP, B. C.; HOGAN, A. E.; NIKOLAJCZYK, B. S. Lymphocyte roles in metabolic dysfunction: of men and mice. Trends in Endocrinology and Metabolism , v. 26, n. 2, p. 91–100, Feb. 2015.
JAFFE, A. B.; HALL, A. Rho GTPases: biochemistry and biology. Annual Review of Cell and Developmental Biology , v. 21, p. 247–269, 2005.
JIN, W. et al. Increased SRF transcriptional activity in human and mouse skeletal muscle is a signature of insulin resistance. The Journal of Clinical Investigation , v. 121, n. 3, p. 918–929, Mar. 2011.
JORDAN, S. D. et al. Obesity-induced overexpression of miRNA-143 inhibits insulin-stimulated AKT activation and impairs glucose metabolism. Nature Cell Biology , v. 13, n. 4, p. 434–446, Apr. 2011.
JOSEPH, P. et al. Reducing the global burden of cardiovascular disease, part 1: the epidemiology and risk factors. Circulation Research , v. 121, n. 6, p. 677–694, 1 Sep. 2017.
JOSEPH, P. V. et al. A computational framework for predicting obesity risk based on optimizing and integrating genetic risk score and gene expression profiles. Plos One , v. 13, n. 5, p. e0197843, 24 May 2018.
JUNG, U. J. et al. Differences in metabolic biomarkers in the blood and gene expression profiles of peripheral blood mononuclear cells among normal weight, mildly obese and moderately obese subjects. The British Journal of Nutrition , v. 116, n. 6, p. 1022–1032, 9 Aug. 2016.
KARBIENER, M. et al. microRNA miR-27b impairs human adipocyte differentiation and targets PPARgamma. Biochemical and Biophysical Research Communications , v. 390, n. 2, p. 247–251, 11 Dec. 2009.
KAROLINA, D. S. et al. Circulating miRNA profiles in patients with metabolic syndrome. The Journal of Clinical Endocrinology and Metabolism , v. 97, n. 12, p. E2271-6, Dec. 2012.
KAZMIN, D. et al. Systems analysis of protective immune responses to RTS,S malaria vaccination in humans. Proceedings of the National Academy of
90
Sciences of the United States of America , v. 114, n. 9, p. 2425–2430, 28 Feb. 2017.
KELLER, P. et al. Gene-chip studies of adipogenesis-regulated microRNAs in mouse primary adipocytes and human obesity. BMC endocrine disorders , v. 11, p. 7, 22 Mar. 2011.
KENMOCHI, N. et al. The human mitochondrial ribosomal protein genes: mapping of 54 genes to the chromosomes and implications for human disorders. Genomics , v. 77, n. 1–2, p. 65–70, Sep. 2001.
KIRCHNER, H. et al. Altered DNA methylation of glycolytic and lipogenic genes in liver from obese and type 2 diabetic patients. Molecular metabolism , v. 5, n. 3, p. 171–183, Mar. 2016.
KLENOV, V. E.; JUNGHEIM, E. S. Obesity and reproductive function: a review of the evidence. Current Opinion in Obstetrics & Gynecology , v. 26, n. 6, p. 455–460, Dec. 2014.
KLIMCÁKOVÁ, E. et al. Worsening of obesity and metabolic status yields similar molecular adaptations in human subcutaneous and visceral adipose tissue: decreased metabolism and increased immune response. The Journal of Clinical Endocrinology and Metabolism , v. 96, n. 1, p. E73-82, Jan. 2011.
KOGELMAN, L. J. A. et al. Inter-Tissue Gene Co-Expression Networks between Metabolically Healthy and Unhealthy Obese Individuals. Plos One , v. 11, n. 12, p. e0167519, 1 Dec. 2016.
KOLEHMAINEN, M. et al. Bilberries reduce low-grade inflammation in individuals with features of metabolic syndrome. Molecular Nutrition & Food Research , v. 56, n. 10, p. 1501–1510, Oct. 2012.
KOZOMARA, A.; BIRGAOANU, M.; GRIFFITHS-JONES, S. miRBase: from microRNA sequences to function. Nucleic Acids Research , v. 47, n. D1, p. D155–D162, 8 Jan. 2019.
KOZOMARA, A.; GRIFFITHS-JONES, S. miRBase: annotating high confidence microRNAs using deep sequencing data. Nucleic Acids Research , v. 42, n. Database issue, p. D68-73, Jan. 2014.
KRAJA, A. T. et al. A bivariate genome-wide approach to metabolic syndrome: STAMPEED consortium. Diabetes , v. 60, n. 4, p. 1329–1339, Apr. 2011.
KRAJA, A. T. et al. Pleiotropic genes for metabolic syndrome and inflammation. Molecular Genetics and Metabolism , v. 112, n. 4, p. 317–338, Aug. 2014.
KREK, A. et al. Combinatorial microRNA target predictions. Nature Genetics , v. 37,
91
n. 5, p. 495–500, May 2005.
KRIETE, A. et al. Computational systems biology of aging. Wiley interdisciplinary reviews. Systems biology and medicine , v. 3, n. 4, p. 414–428, Aug. 2011.
KULYTÉ, A. et al. Global transcriptome profiling identifies KLF15 and SLC25A10 as modifiers of adipocytes insulin sensitivity in obese women. Plos One , v. 12, n. 6, p. e0178485, 1 Jun. 2017.
KUNEJ, T. et al. Functional UQCRC1 polymorphisms affect promoter activity and body lipid accumulation. Obesity , v. 15, n. 12, p. 2896–2901, Dec. 2007.
KWISSA, M. et al. Dengue virus infection induces expansion of a CD14(+)CD16(+) monocyte population that stimulates plasmablast differentiation. Cell Host & Microbe , v. 16, n. 1, p. 115–127, 9 Jul. 2014.
LANGFELDER, P.; HORVATH, S. Eigengene networks for studying the relationships between co-expression modules. BMC Systems Biology , v. 1, p. 54, 21 Nov. 2007.
LANGFELDER, P.; HORVATH, S. WGCNA: an R package for weighted correlation network analysis. BMC Bioinformatics , v. 9, p. 559, 29 Dec. 2008.
LANGFELDER, P.; HORVATH, S. Fast R Functions for Robust Correlations and Hierarchical Clustering. Journal of statistical software , v. 46, n. 11, Mar. 2012.
LEE, E. K. et al. miR-130 suppresses adipogenesis by inhibiting peroxisome proliferator-activated receptor gamma expression. Molecular and Cellular Biology , v. 31, n. 4, p. 626–638, Feb. 2011.
LEE, H.-S.; KIM, Y.; PARK, T. New common and rare variants influencing metabolic syndrome and its individual components in a korean population. Scientific Reports , v. 8, n. 1, p. 5701, 9 Apr. 2018.
LEE, M.-J. Transforming growth factor beta superfamily regulation of adipose tissue biology in obesity. Biochimica et biophysica acta. Molecular basis of disease , v. 1864, n. 4 Pt A, p. 1160–1171, Apr. 2018.
LEE, Y. et al. The nuclear RNase III Drosha initiates microRNA processing. Nature , v. 425, n. 6956, p. 415–419, 25 Sep. 2003.
LIANG, Y. et al. Characterization of microRNA expression profiles in normal human tissues. BMC Genomics , v. 8, p. 166, 12 Jun. 2007.
LIN, L.-Y. et al. Systems genetics approach to biomarker discovery: GPNMB and heart failure in mice and humans. G3 (Bethesda, Md.) , v. 8, n. 11, p. 3499–3506, 6 Nov. 2018.
LIU, L. et al. MiR-421 inhibits the malignant phenotype in glioma by directly targeting
92
MEF2D. American journal of cancer research , v. 7, n. 4, p. 857–868, 1 Apr. 2017.
LIZIO, M. et al. Update of the FANTOM web resource: expansion to provide additional transcriptome atlases. Nucleic Acids Research , v. 47, n. D1, p. D752–D758, 8 Jan. 2019.
LI, J. et al. Repulsive guidance molecule B (RGMB) plays negative roles in breast cancer by coordinating BMP signaling. Journal of Cellular Biochemistry , v. 113, n. 7, p. 2523–2531, Jul. 2012.
LI, J. et al. Global correlation analysis for microRNA and gene expression profiles in human obesity. Pathology, Research and Practice , v. 211, n. 5, p. 361–368, May 2015.
LING, C.; RÖNN, T. Epigenetics in human obesity and type 2 diabetes. Cell Metabolism , v. 29, n. 5, p. 1028–1044, 7 May 2019.
LLAVE, C. et al. Cleavage of Scarecrow-like mRNA targets directed by a class of Arabidopsis miRNA. Science , v. 297, n. 5589, p. 2053–2056, 20 Sep. 2002.
LUMENG, C. N.; SALTIEL, A. R. Inflammatory links between obesity and metabolic disease. The Journal of Clinical Investigation , v. 121, n. 6, p. 2111–2117, 1 Jun. 2011.
LUND, E. et al. Nuclear export of microRNA precursors. Science , v. 303, n. 5654, p. 95–98, 2 Jan. 2004.
MAEDA, K. et al. Interactome map uncovers phosphatidylserine transport by oxysterol-binding proteins. Nature , v. 501, n. 7466, p. 257–261, 12 Sep. 2013.
MANDVIWALA, T.; KHALID, U.; DESWAL, A. Obesity and cardiovascular disease: a risk factor or a risk marker? Current Atherosclerosis Reports , v. 18, n. 5, p. 21, May 2016.
MANSFIELD, K. E. et al. A systematic review and meta-analysis of the prevalence of chronic widespread pain in the general population. Pain , v. 157, n. 1, p. 55–64, Jan. 2016.
MARQUES-ROCHA, J. L. et al. Expression of inflammation-related miRNAs in white blood cells from subjects with metabolic syndrome after 8 wk of following a Mediterranean diet-based weight loss program. Nutrition , v. 32, n. 1, p. 48–55, Jan. 2016.
MARQUEZINE, G. F. et al. Metabolic syndrome determinants in an urban population from Brazil: social class and gender-specific interaction. International Journal of Cardiology , v. 129, n. 2, p. 259–265, 26 Sep. 2008.
93
MA, E.; FU, Y.; GARVEY, W. T. Relationship of Circulating miRNAs with Insulin Sensitivity and Associated Metabolic Risk Factors in Humans. Metabolic Syndrome and Related Disorders , v. 16, n. 2, p. 82–89, 23 Jan. 2018.
MA’AYAN, A. et al. Lean Big Data integration in systems biology and systems pharmacology. Trends in Pharmacological Sciences , v. 35, n. 9, p. 450–460, Sep. 2014.
MCALLISTER, E. J. et al. Ten putative contributors to the obesity epidemic. Critical reviews in food science and nutrition , v. 49, n. 10, p. 868–913, Nov. 2009.
MCGREGOR, R. A.; CHOI, M. S. microRNAs in the regulation of adipogenesis and obesity. Current Molecular Medicine , v. 11, n. 4, p. 304–316, Jun. 2011.
MEHTA, R. et al. Circulating miRNA in patients with non-alcoholic fatty liver disease and coronary artery disease. BMJ open gastroenterology , v. 3, n. 1, p. e000096, 26 Jul. 2016.
MELKONYAN, H. S. et al. Transrenal nucleic acids: from proof of principle to clinical tests. Annals of the New York Academy of Sciences , v. 1137, p. 73–81, Aug. 2008.
MENGUS, G. et al. TAF4 inactivation in embryonic fibroblasts activates TGF beta signalling and autocrine growth. The EMBO Journal , v. 24, n. 15, p. 2753–2767, 3 Aug. 2005.
MENG, D. et al. A transcriptional target of androgen receptor, miR-421 regulates proliferation and metabolism of prostate cancer cells. The International Journal of Biochemistry & Cell Biology , v. 73, p. 30–40, Apr. 2016.
MESSAOUDI, I. et al. Long-lasting effect of obesity on skeletal muscle transcriptome. BMC Genomics , v. 18, n. 1, p. 411, 25 May 2017.
MIAO, L. et al. Circulating miR-3659 may be a potential biomarker of dyslipidemia in patients with obesity. Journal of Translational Medicine , v. 17, n. 1, p. 25, 14 Jan. 2019.
MIKLOS, G. L. G.; MALESZKA, R. Microarray reality checks in the context of a complex disease. Nature Biotechnology , v. 22, n. 5, p. 615–621, May 2004.
MOOTHA, V. K. et al. PGC-1alpha-responsive genes involved in oxidative phosphorylation are coordinately downregulated in human diabetes. Nature Genetics , v. 34, n. 3, p. 267–273, Jul. 2003.
MORELLO, G. et al. Copy Number Variations in Amyotrophic Lateral Sclerosis: Piecing the Mosaic Tiles Together through a Systems Biology Approach. Molecular
94
Neurobiology , v. 55, n. 2, p. 1299–1322, 2018.
MOTTILLO, S. et al. The metabolic syndrome and cardiovascular risk a systematic review and meta-analysis. Journal of the American College of Cardiology , v. 56, n. 14, p. 1113–1132, 28 Sep. 2010.
MOZAFFARIAN, D. et al. Heart Disease and Stroke Statistics-2016 Update: A Report From the American Heart Association. Circulation , v. 133, n. 4, p. e38-360, 26 Jan. 2016.
MUTCH, D. M. et al. Needle and surgical biopsy techniques differentially affect adipose tissue gene expression profiles. The American Journal of Clinical Nutrition , v. 89, n. 1, p. 51–57, Jan. 2009.
NAKAYA, H. I. et al. Systems Analysis of Immunity to Influenza Vaccination across Multiple Years and in Diverse Populations Reveals Shared Molecular Signatures. Immunity , v. 43, n. 6, p. 1186–1198, 15 Dec. 2015.
NAKAYA, H. I.; PULENDRAN, B. Systems vaccinology: its promise and challenge for HIV vaccine development. Current Opinion in HIV and AIDS , v. 7, n. 1, p. 24–31, Jan. 2012.
NAM, G. E.; PARK, H. S. Perspective on diagnostic criteria for obesity and abdominal obesity in korean adults. Journal of obesity & metabolic syndrome , v. 27, n. 3, p. 134–142, 30 Sep. 2018.
NGUYEN, M. T. A. et al. A subpopulation of macrophages infiltrates hypertrophic adipose tissue and is activated by free fatty acids via Toll-like receptors 2 and 4 and JNK-dependent pathways. The Journal of Biological Chemistry , v. 282, n. 48, p. 35279–35292, 30 Nov. 2007.
NIE, L. et al. The Landscape of Histone Modifications in a High-Fat Diet-Induced Obese (DIO) Mouse Model. Molecular & Cellular Proteomics , v. 16, n. 7, p. 1324–1334, 27 Apr. 2017.
NIJHUIS, J. et al. Neutrophil activation in morbid obesity, chronic activation of acute inflammation. Obesity , v. 17, n. 11, p. 2014–2018, Nov. 2009.
NOOKAEW, I. et al. Adipose tissue resting energy expenditure and expression of genes involved in mitochondrial function are higher in women than in men. The Journal of Clinical Endocrinology and Metabolism , v. 98, n. 2, p. E370-8, Feb. 2013.
OBEIDAT, M. et al. Network-based analysis reveals novel gene signatures in peripheral blood of patients with chronic obstructive pulmonary disease. Respiratory Research , v. 18, n. 1, p. 72, 24 Apr. 2017.
95
ORTEGA-BERNAL, D. et al. A meta-analysis of transcriptome datasets characterizes malignant transformation from melanocytes and nevi to melanoma. Oncology letters , v. 16, n. 2, p. 1899–1911, Aug. 2018.
PALANIAPPAN, L. et al. Predictors of the incident metabolic syndrome in adults: the Insulin Resistance Atherosclerosis Study. Diabetes Care , v. 27, n. 3, p. 788–793, Mar. 2004.
PALATNIK, J. F. et al. Control of leaf morphogenesis by microRNAs. Nature , v. 425, n. 6955, p. 257–263, 18 Sep. 2003.
PAPATHEODOROU, I. et al. Expression Atlas: gene and protein expression across multiple studies and organisms. Nucleic Acids Research , v. 46, n. D1, p. D246–D251, 4 Jan. 2018.
PARK, J.-J. et al. GRB14, GPD1, and GDF8 as potential network collaborators in weight loss-induced improvements in insulin action in human skeletal muscle. Physiological Genomics , v. 27, n. 2, p. 114–121, 11 Oct. 2006.
PENG, Y. et al. MicroRNAs: emerging roles in adipogenesis and obesity. Cellular Signalling , v. 26, n. 9, p. 1888–1896, Sep. 2014.
PESSINA, S. et al. The multidrug-resistance transporter Abcc3 protects NK cells from chemotherapy in a murine model of malignant glioma. Oncoimmunology , v. 5, n. 5, p. e1108513, May 2016.
PESTOVA, T. V. et al. Molecular mechanisms of translation initiation in eukaryotes. Proceedings of the National Academy of Sciences of the United States of America , v. 98, n. 13, p. 7029–7036, 19 Jun. 2001.
PETERSEN, C. P. et al. Short RNAs repress translation after initiation in mammalian cells. Molecular Cell , v. 21, n. 4, p. 533–542, 17 Feb. 2006.
PETRUS, P. et al. Transforming Growth Factor-β3 Regulates Adipocyte Number in Subcutaneous White Adipose Tissue. Cell reports , v. 25, n. 3, p. 551- 560.e5, 16 Oct. 2018.
PIMENTA, A. M.; GAZZINELLI, A.; VELÁSQUEZ-MELÉNDEZ, G. [Prevalence of metabolic syndrome and its associated factors in a rural area of Minas Gerais State (MG, Brazil)]. Ciencia & saude coletiva , v. 16, n. 7, p. 3297–3306, Jul. 2011.
PINHEL, M. A. DE S. et al. Changes in global transcriptional profiling of women following obesity surgery bypass. Obesity Surgery , v. 28, n. 1, p. 176–186, Jan. 2018.
PRADA-MEDINA, C. A. et al. Systems Immunology of Diabetes-Tuberculosis Comorbidity Reveals Signatures of Disease Complications. Scientific Reports , v. 7,
96
n. 1, p. 1999, 17 May 2017.
PRADHAN, A. D. et al. C-reactive protein, interleukin 6, and risk of developing type 2 diabetes mellitus. The Journal of the American Medical Association , v. 286, n. 3, p. 327–334, 18 Jul. 2001.
PRAVENEC, M. et al. Systems genetic analysis of brown adipose tissue function. Physiological Genomics , v. 50, n. 1, p. 52–66, 1 Jan. 2018.
PULIDO, M. R. et al. Rab18 dynamics in adipocytes in relation to lipogenesis, lipolysis and obesity. Plos One , v. 6, n. 7, p. e22931, 28 Jul. 2011.
RADICH, J. P. et al. Individual-specific variation of gene expression in peripheral blood leukocytes. Genomics , v. 83, n. 6, p. 980–988, Jun. 2004.
REAVEN, G. M. Banting lecture 1988. Role of insulin resistance in human disease. Diabetes , v. 37, n. 12, p. 1595–1607, Dec. 1988.
REICHARDT, J.; BORNHOLDT, S. Statistical mechanics of community detection. Physical Review E , v. 74, n. 1, 18 Jul. 2006.
REINHOLD, D. et al. Meta-analysis of peripheral blood gene expression modules for COPD phenotypes. Plos One , v. 12, n. 10, p. e0185682, 9 Oct. 2017.
REYES, M. et al. Obesity is associated with acute inflammation in a sample of adolescents. Pediatric Diabetes , v. 16, n. 2, p. 109–116, Mar. 2015.
RICE, J. et al. Housekeeping genes for studies of plasma microRNA: A need for more precise standardization. Surgery , v. 158, n. 5, p. 1345–1351, Nov. 2015.
RIESE, D. J.; STERN, D. F. Specificity within the EGF family/ErbB receptor family signaling network. Bioessays: News and Reviews in Molecular, Cellular and Developmental Biology , v. 20, n. 1, p. 41–48, Jan. 1998.
RITCHIE, M. E. et al. limma powers differential expression analyses for RNA-sequencing and microarray studies. Nucleic Acids Research , v. 43, n. 7, p. e47, 20 Apr. 2015.
RIVEST, R. RFC 1321 - The MD5 Message-Digest Algorithm. 1992. Available at: <http://tools.ietf.org/html/rfc1321>. Accessed on February 26 2016.
ROCHA, V. Z. et al. Interferon-gamma, a Th1 cytokine, regulates fat inflammation: a role for adaptive immunity in obesity. Circulation Research , v. 103, n. 5, p. 467–476, 29 Aug. 2008.
ROGERS, C. et al. EGF receptor (ERBB1) abundance in adipose tissue is reduced in insulin-resistant and type 2 diabetic women. The Journal of Clinical
97

Endocrinology and Metabolism , v. 97, n. 3, p. E329-40, Mar. 2012.
ROMAGNANI, S. et al. Surface immunoglobulins are involved in the interaction of protein A with human B cells and in the triggering of B cell proliferation induced by protein A-containing Staphylococcus aureus. Journal of Immunology , v. 127, n. 4, p. 1307–1313, Oct. 1981.
ROSS, S. E.; FLYNN, J. I.; PATE, R. R. What is really causing the obesity epidemic? A review of reviews in children and adults. Journal of sports sciences , v. 34, n. 12, p. 1148–1153, 2016.
RUBY, J. G.; JAN, C. H.; BARTEL, D. P. Intronic microRNA precursors that bypass Drosha processing. Nature , v. 448, n. 7149, p. 83–86, 5 Jul. 2007.
RUSSELL-BUCKLAND, J.; BARNES, C. P.; TACHTSIDIS, I. A Bayesian framework for the analysis of systems biology models of the brain. PLoS Computational Biology , v. 15, n. 4, p. e1006631, 26 Apr. 2019.
RUSSO, P. S. T. et al. CEMiTool: a Bioconductor package for performing comprehensive modular co-expression analyses. BMC Bioinformatics , v. 19, n. 1, p. 56, 20 Feb. 2018.
SAAD, M. J. et al. Regulation of insulin receptor substrate-1 in liver and muscle of animal models of insulin resistance. The Journal of Clinical Investigation , v. 90, n. 5, p. 1839–1849, Nov. 1992.
SALAROLI, L. B. et al. [Prevalence of metabolic syndrome in population-based study, Vitória, ES-Brazil]. Arquivos Brasileiros de Endocrinologia e Metabologia , v. 51, n. 7, p. 1143–1152, Oct. 2007.
SAMAD, T. A. et al. DRAGON, a bone morphogenetic protein co-receptor. The Journal of Biological Chemistry , v. 280, n. 14, p. 14122–14129, 8 Apr. 2005.
SCHIPPER, H. S. et al. Adipose tissue-resident immune cells: key players in immunometabolism. Trends in Endocrinology and Metabolism , v. 23, n. 8, p. 407–415, Aug. 2012.
SCHMIDT, M. I. et al. Cohort Profile: Longitudinal Study of Adult Health (ELSA-Brasil). International Journal of Epidemiology , v. 44, n. 1, p. 68–75, Feb. 2015.
SEKI, E. et al. TLR4 enhances TGF-beta signaling and hepatic fibrosis. Nature Medicine , v. 13, n. 11, p. 1324–1332, Nov. 2007.
SERGUSHICHEV, A. (in press). An algorithm for fast pre-ranked gene set enrichment analysis using cumulative statistic calculation. bioRxiv .
98
doi:10.1101/060012.
SHAH, R. et al. Extracellular rnas are associated with insulin resistance and metabolic phenotypes. Diabetes Care , v. 40, n. 4, p. 546–553, Apr. 2017.
SHERLING, D. H.; PERUMAREDDI, P.; HENNEKENS, C. H. Metabolic Syndrome. Journal of cardiovascular pharmacology and therapeutics , v. 22, n. 4, p. 365–367, 9 Jan. 2017.
SHI, Y. et al. Dragon (repulsive guidance molecule b, RGMb) is a novel gene that promotes colorectal cancer growth. Oncotarget , v. 6, n. 24, p. 20540–20554, 21 Aug. 2015.
SHUNGIN, D. et al. New genetic loci link adipose and insulin biology to body fat distribution. Nature , v. 518, n. 7538, p. 187–196, 12 Feb. 2015.
SIMS, J. E.; SMITH, D. E. The IL-1 family: regulators of immunity. Nature Reviews. Immunology , v. 10, n. 2, p. 89–102, Feb. 2010.
SINNOTT, J. A. et al. Prognostic Utility of a New mRNA Expression Signature of Gleason Score. Clinical Cancer Research , v. 23, n. 1, p. 81–87, 1 Jan. 2017.
SKINKYTE-JUSKIENE, R.; KOGELMAN, L. J. A.; KADARMIDEEN, H. N. Transcription Factor Co-expression Networks of Adipose RNA-Seq Data Reveal Regulatory Mechanisms of Obesity. Current Genomics , v. 19, n. 4, p. 289–299, May 2018.
SMALHEISER, N. R. EST analyses predict the existence of a population of chimeric microRNA precursor-mRNA transcripts expressed in normal human and mouse tissues. Genome Biology , v. 4, n. 7, p. 403, 18 Jun. 2003.
SOH, J. et al. MicroRNA-30c reduces hyperlipidemia and atherosclerosis in mice by decreasing lipid synthesis and lipoprotein secretion. Nature Medicine , v. 19, n. 7, p. 892–900, Jul. 2013.
SONG, Y. et al. Association between TNIP1, MPHOSPH6 and ZNF208 genetic polymorphisms and the coronary artery disease risk in Chinese Han population. Oncotarget , v. 8, n. 44, p. 77233–77240, 29 Sep. 2017.
SPOSITO, A. C. et al. [IV Brazilian Guideline for Dyslipidemia and Atherosclerosis prevention: Department of Atherosclerosis of Brazilian Society of Cardiology]. Arquivos brasileiros de cardiologia , v. 88 Suppl 1, p. 2–19, Apr. 2007.
SQUILLACE, N. et al. Changes in subcutaneous adipose tissue microRNA expression in HIV-infected patients. The Journal of Antimicrobial Chemotherapy , v. 69, n. 11, p. 3067–3075, Nov. 2014.
99

STEFAN, N. et al. Metabolically healthy obesity: epidemiology, mechanisms, and clinical implications. The lancet. Diabetes & endocrinology , v. 1, n. 2, p. 152–162, Oct. 2013.
STEFAN, N.; HÄRING, H.-U.; CUSI, K. Non-alcoholic fatty liver disease: causes, diagnosis, cardiometabolic consequences, and treatment strategies. The lancet. Diabetes & endocrinology , v. 7, n. 4, p. 313–324, Apr. 2019.
STÉPHANOU, A. et al. Systems biology, systems medicine, systems pharmacology: the what and the why. Acta Biotheoretica , v. 66, n. 4, p. 345–365, Dec. 2018.
STEVENS, A. et al. Network analysis: a new approach to study endocrine disorders. Journal of Molecular Endocrinology , v. 52, n. 1, p. R79-93, Feb. 2014.
STOLL, S.; WANG, C.; QIU, H. DNA methylation and histone modification in hypertension. International Journal of Molecular Sciences , v. 19, n. 4, 12 Apr. 2018.
STROJNY, W. et al. Looking for new diagnostic tools and biomarkers of hypertension in obese pediatric patients. Blood pressure monitoring , v. 22, n. 3, p. 122–130, Jun. 2017.
SUBRAMANIAN, A. et al. Gene set enrichment analysis: a knowledge-based approach for interpreting genome-wide expression profiles. Proceedings of the National Academy of Sciences of the United States of America , v. 102, n. 43, p. 15545–15550, 25 Oct. 2005.
SUGANAMI, T. et al. Role of the Toll-like receptor 4/NF-kappaB pathway in saturated fatty acid-induced inflammatory changes in the interaction between adipocytes and macrophages. Arteriosclerosis, Thrombosis, and Vascular Biology , v. 27, n. 1, p. 84–91, Jan. 2007.
SULTAN, M. et al. A global view of gene activity and alternative splicing by deep sequencing of the human transcriptome. Science , v. 321, n. 5891, p. 956–960, 15 Aug. 2008.
SUN, Q. et al. Gene co-expression network reveals shared modules predictive of stage and grade in serous ovarian cancers. Oncotarget , v. 8, n. 26, p. 42983–42996, 27 Jun. 2017.
TAKAHASHI, H. et al. TGF-β2 is an exercise-induced adipokine that regulates glucose and fatty acid metabolism. Nature Metabolism , v. 1, n. 2, p. 291–303, 11 Feb. 2019.
TAM, C. S. et al. An early inflammatory gene profile in visceral adipose tissue in children. International journal of pediatric obesity : IJPO : an official journal of
100
the International Association for the Study of Obesity , v. 6, n. 2–2, p. e360-3, Jun. 2011.
TAO, W. et al. Lipid-induced Muscle Insulin Resistance Is Mediated by GGPPS via Modulation of the RhoA/Rho Kinase Signaling Pathway. The Journal of Biological Chemistry , v. 290, n. 33, p. 20086–20097, 14 Aug. 2015.
TATARANO, S. et al. Novel oncogenic function of mesoderm development candidate 1 and its regulation by MiR-574-3p in bladder cancer cell lines. International Journal of Oncology , v. 40, n. 4, p. 951–959, Apr. 2012.
THORSEN, M.; BLONDAL, T.; MOURITZEN, P. Quantitative RT-PCR for MicroRNAs in Biofluids. Methods in Molecular Biology , v. 1641, p. 379–398, 2017.
TIAN, L. et al. Discovering statistically significant pathways in expression profiling studies. Proceedings of the National Academy of Sciences of the United States of America , v. 102, n. 38, p. 13544–13549, 20 Sep. 2005.
TUNE, J. D. et al. Cardiovascular consequences of metabolic syndrome. Translational Research , v. 183, p. 57–70, 9 Jan. 2017.
TURCHINOVICH, A. et al. Characterization of extracellular circulating microRNA. Nucleic Acids Research , v. 39, n. 16, p. 7223–7233, 1 Sep. 2011.
VANDESOMPELE, J. et al. Accurate normalization of real-time quantitative RT-PCR data by geometric averaging of multiple internal control genes. Genome Biology , v. 3, n. 7, p. RESEARCH0034, 18 Jun. 2002.
VAN DER VALK, E. S. et al. A comprehensive diagnostic approach to detect underlying causes of obesity in adults. Obesity Reviews , v. 20, n. 6, p. 795–804, Jun. 2019.
VAN LEEUWEN, J. E.; SAMELSON, L. E. T cell antigen-receptor signal transduction. Current Opinion in Immunology , v. 11, n. 3, p. 242–248, Jun. 1999.
VICKERS, K. C. et al. MicroRNAs are transported in plasma and delivered to recipient cells by high-density lipoproteins. Nature Cell Biology , v. 13, n. 4, p. 423–433, Apr. 2011.
VICKERS, K. C.; REMALEY, A. T. Lipid-based carriers of microRNAs and intercellular communication. Current opinion in lipidology , v. 23, n. 2, p. 91–97, Apr. 2012.
VISSCHER, P. M. et al. 10 years of GWAS discovery: biology, function, and translation. American Journal of Human Genetics , v. 101, n. 1, p. 5–22, 6 Jul. 2017.
101
VOIGT, E. A. et al. Transcriptomic signatures of cellular and humoral immune responses in older adults after seasonal influenza vaccination identified by data-driven clustering. Scientific Reports , v. 8, n. 1, p. 739, 15 Jan. 2018.
WAKIYAMA, M.; YOKOYAMA, S. MicroRNA-mediated mRNA deadenylation and repression of protein synthesis in a mammalian cell-free system. Progress in Molecular and Subcellular Biology , v. 50, p. 85–97, 2010.
WALPOLE, J.; PAPIN, J. A.; PEIRCE, S. M. Multiscale computational models of complex biological systems. Annual Review of Biomedical Engineering , v. 15, p. 137–154, 29 Apr. 2013.
WANG, J. et al. miR-30e reciprocally regulates the differentiation of adipocytes and osteoblasts by directly targeting low-density lipoprotein receptor-related protein 6. Cell death & disease , v. 4, p. e845, 10 Oct. 2013a.
WANG, K. et al. Comparing the MicroRNA spectrum between serum and plasma. Plos One , v. 7, n. 7, p. e41561, 31 Jul. 2012.
WANG, W. et al. Weighted gene co-expression network analysis of expression data of monozygotic twins identifies specific modules and hub genes related to BMI. BMC Genomics , v. 18, n. 1, p. 872, 13 Nov. 2017.
WANG, Y.-T. et al. Circulating microRNAs have a sex-specific association with metabolic syndrome. Journal of Biomedical Science , v. 20, p. 72, 4 Oct. 2013b.
WEISBERG, S. P. et al. Obesity is associated with macrophage accumulation in adipose tissue. The Journal of Clinical Investigation , v. 112, n. 12, p. 1796–1808, Dec. 2003.
WHITNEY, A. R. et al. Individuality and variation in gene expression patterns in human blood. Proceedings of the National Academy of Sciences of the United States of America , v. 100, n. 4, p. 1896–1901, 18 Feb. 2003.
WILSON, L. E. et al. An epigenome-wide study of body mass index and DNA methylation in blood using participants from the Sister Study cohort. International Journal of Obesity , v. 41, n. 1, p. 194–199, 2017.
WINNIER, D. A. et al. Transcriptomic identification of ADH1B as a novel candidate gene for obesity and insulin resistance in human adipose tissue in Mexican Americans from the Veterans Administration Genetic Epidemiology Study (VAGES). Plos One , v. 10, n. 4, p. e0119941, 1 Apr. 2015.
WRUCK, W. et al. Multi-omic profiles of human non-alcoholic fatty liver disease tissue highlight heterogenic phenotypes. Scientific data , v. 2, p. 150068, 8 Dec. 2015.
102
XIA, Y. et al. Dragon (repulsive guidance molecule b) inhibits IL-6 expression in macrophages. Journal of Immunology , v. 186, n. 3, p. 1369–1376, 1 Feb. 2011.
XU, K. et al. Epigenome-wide association analysis revealed that SOCS3 methylation influences the effect of cumulative stress on obesity. Biological Psychology , v. 131, p. 63–71, 2018.
YAMAGUCHI, G. et al. Isolation of miRNAs that target EGFR mRNA in human lung cancer. Biochemical and Biophysical Research Communications , v. 420, n. 2, p. 411–416, 6 Apr. 2012.
YAMIT-HEZI, A.; DIKSTEIN, R. TAFII105 mediates activation of anti-apoptotic genes by NF-kappaB. The EMBO Journal , v. 17, n. 17, p. 5161–5169, 1 Sep. 1998.
YANG, H. et al. Obesity increases the production of proinflammatory mediators from adipose tissue T cells and compromises TCR repertoire diversity: implications for systemic inflammation and insulin resistance. Journal of Immunology , v. 185, n. 3, p. 1836–1845, 1 Aug. 2010.
YAN, Y.-X. et al. Polymorphisms in NR3C1 gene associated with risk of metabolic syndrome in a Chinese population. Endocrine , v. 47, n. 3, p. 740–748, Dec. 2014.
YUAN, P. et al. UBXN1 interacts with the S1 protein of transmissible gastroenteritis coronavirus and plays a role in viral replication. Veterinary Research , v. 50, n. 1, p. 28, 27 Apr. 2019.
YU, G. et al. clusterProfiler: an R package for comparing biological themes among gene clusters. Omics : a journal of integrative biology , v. 16, n. 5, p. 284–287, May 2012.
YU, J. et al. Disruption of NCOA2 by recurrent fusion with LACTB2 in colorectal cancer. Oncogene , v. 35, n. 2, p. 187–195, 14 Jan. 2016.
ZABANEH, D.; BALDING, D. J. A genome-wide association study of the metabolic syndrome in Indian Asian men. Plos One , v. 5, n. 8, p. e11961, 4 Aug. 2010.
ZHANG, B.; HORVATH, S. A general framework for weighted gene co-expression network analysis. Statistical Applications in Genetics and Molecular Biology , v. 4, p. Article17, 12 Aug. 2005.
ZHOU, S. et al. miR-421 is a diagnostic and prognostic marker in patients with osteosarcoma. Tumour Biology , v. 37, n. 7, p. 9001–9007, Jul. 2016.
ZHU, Y. et al. Susceptibility loci for metabolic syndrome and metabolic components identified in Han Chinese: a multi-stage genome-wide association study. Journal of Cellular and Molecular Medicine , v. 21, n. 6, p. 1106–1116, 30 Mar. 2017.
103

ZÚÑIGA, L. A. et al. IL-17 regulates adipogenesis, glucose homeostasis, and obesity. Journal of Immunology , v. 185, n. 11, p. 6947–6959, 1 Dec. 2010.
104
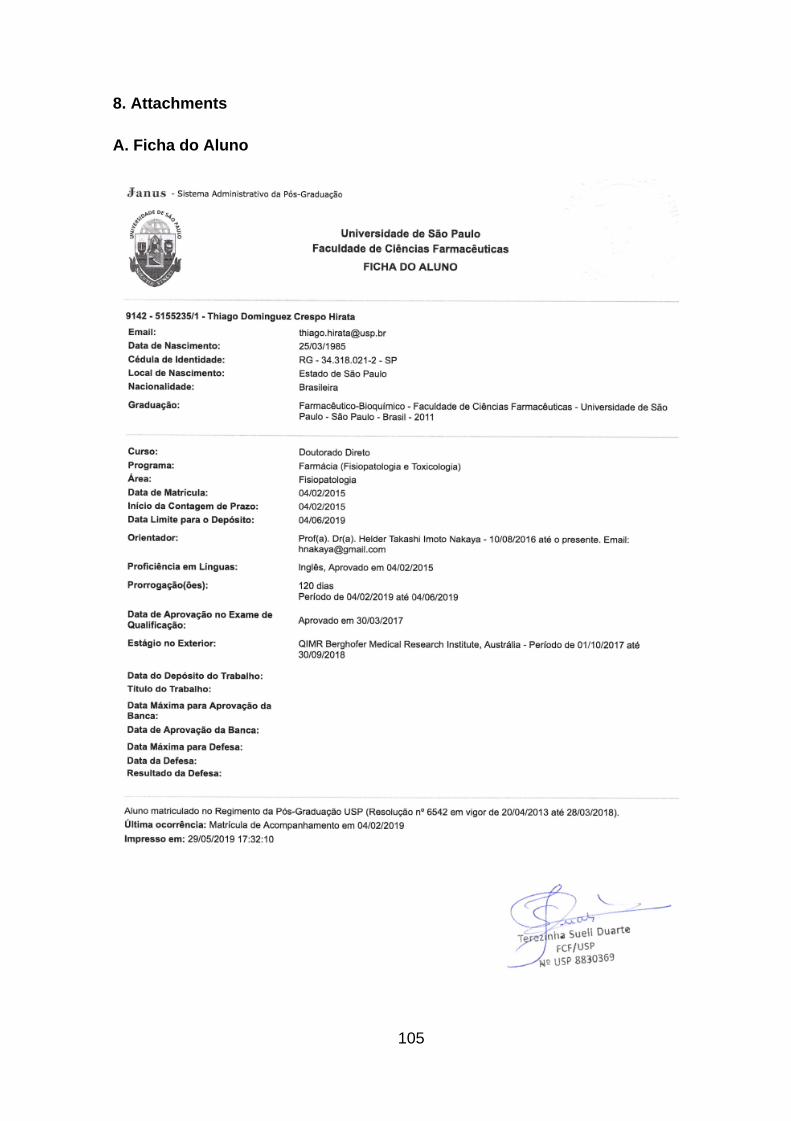
8. Attachments
A. Ficha do Aluno
105
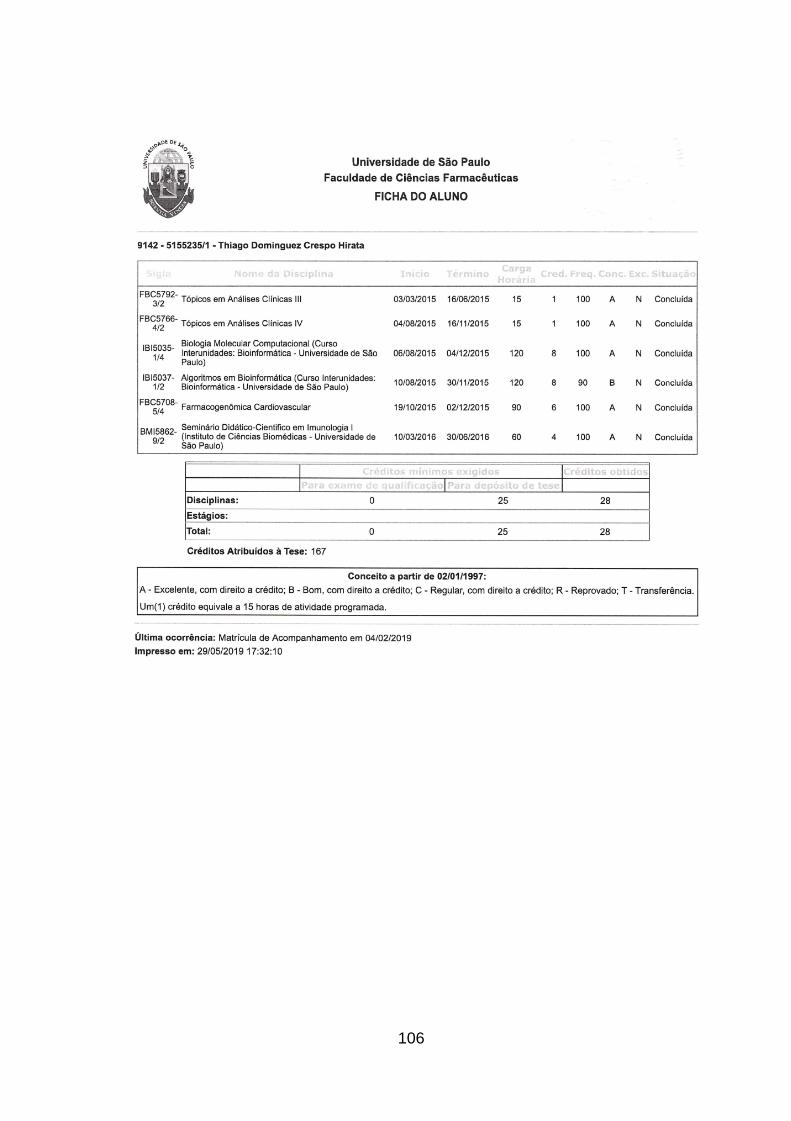
106

B. Curículo Lattes
107

108

109

110