
UNIT – I - Internet of Things – SBS1610 - Sathyabama Institute ...
129
SCHOOL OF COMPUTING DEPARTMENT OF COMPUTER SCIENCE AND ENGINEERING UNIT – I - Internet of Things – SBS1610
-
Upload
khangminh22 -
Category
Documents
-
view
4 -
download
0
Transcript of UNIT – I - Internet of Things – SBS1610 - Sathyabama Institute ...
SCHOOL OF COMPUTING
DEPARTMENT OF COMPUTER SCIENCE AND ENGINEERING
UNIT – I - Internet of Things – SBS1610

UNIT I
M2M to IoT-The Vision-Introduction, From M2M to IoT, M2M towards IoT-the global
context, A use case example, Differing Characteristics.
M2M to IoT _ The Vision
From M2M to IoT
❑ we attempt to describe the move from what is today referred to as Machine-to-
Machine communication towards an emerging paradigm known as the Internet of
Things.
❑ The Internet has undoubtedly had a profound impact across society and industries
over the past two decades. Starting off as ARPANET connecting remote computers
together, the introduction of the TCP/IP protocol suite, and later the introduction of
services like email and the World Wide Web (WWW), created a tremendous growth
of usage and traffic.
❑ In conjunction with innovations that dramatically reduced the cost of semiconductor
technologies and the subsequent extension of the Internet at a reasonable cost via
mobile networks, billions of people and businesses are now connected to the Internet.
❑ Quite simply, no industry and no part of society have remained untouched by this
technical revolution.
❑ At the same time that the Internet has been evolving, another technology revolution
has been unfolding the use of sensors, electronic tags, and actuators to digitally
identify, observe and control objects in the physical world.
❑ Rapidly decreasing costs of sensors and actuators have meant that where such
components previously cost several Euros each, they are now a few cents.
❑ In addition, these devices, through increases in the computational capacity of the
associated chipsets, are now able to communicate via fixed and mobile networks.
❑ As a result, they are able to communicate information about the physical world in
near real-time across networks with high bandwidth at low relative cost
❑ So, while we have seen M2M solutions for quite some time, we are now entering a
period of time where the uptake of both M2M and IoT solutions will increase
dramatically. The reasons for this are three-fold:
1. An increased need for understanding the physical environment in its various forms,
from industrial installations through to public spaces and consumer demands. These

requirements are often driven by efficiency improvements, sustainability objectives,
or improved health and safety (Singh 2012).
2. The improvement of technology and improved networking capabilities.
3. Reduced costs of components and the ability to more cheaply collect and analyze the
data they produce.
M2M communication
❑ M2M refers to those solutions that allow communication between devices of the same
type and a specific application, all via wired or wireless communication networks.
❑ M2M solutions allow end-users to capture data about events from assets, such as
temperature or inventory levels.
❑ Typically, M2M is deployed to achieve productivity gains, reduce costs, and increase
safety or security.
❑ M2M has been applied in many different scenarios, including the remote monitoring
and control of enterprise assets, or to provide connectivity of remote machine-type
devices.
❑ Remote monitoring and control has generally provided the incentive for industrial
applications, whereas connectivity has been the focus in other enterprise scenarios
such as connected vending machines or point-of-sales terminals for online credit card
transactions.
❑ M2M solutions, however, do not generally allow for the broad sharing of data or
connection of the devices in question directly to the Internet.
A typical M2M solution overview
❑ A typical M2M system solution consists of M2M devices, communication networks
that provide remote connectivity for the devices, service enablement and application
logic, and integration of the M2M application into the business processes provided by
an Information Technology (IT) system of the enterprise, as illustrated below in
Figure 1.1.
❑ The M2M system solution is used to remotely monitor and control enterprise assets of
various kinds, and to integrate those assets into the business processes of the
enterprise in question.
❑ The asset can be of a wide range of types (e.g. vehicle, freight container, building, or
smart electricity meter), all depending on the enterprise.

Fig.1.1 . A Generic M2M system solution
❑ The system components of an M2M solution are as follows:
❑ M2M Device. This is the M2M device attached to the asset of interest, and provides
sensing and actuation capabilities. The M2M device is here generalized, as there are a
number of different realizations of these devices, ranging from low-end sensor nodes
to high-end complex devices with multimodal sensing capabilities.
❑ Network. The purpose of the network is to provide remote connectivity between the
M2M device and the application-side servers. Many different network types can be
used, and include both Wide Area Networks (WANs) and Local Area Networks
(LANs), sometimes also referred to as Capillary Networks or M2M Area Networks.
Examples of WANs are public cellular mobile networks, fixed private networks, or
even satellite links.
❑ M2M Service Enablement. Within the generalized system solution outlined above,
the concept of a separate service enablement component is also introduced. This
component provides generic functionality that is common across a number of
different applications. Its primary purpose is to reduce cost for implementation and
ease of application development.
❑ M2M Application. The application component of the solution is a realization of the
highly specific monitor and control process. The application is further integrated into
the overall business process system of the enterprise. The process of remotely
monitoring and controlling assets can be of many different types, for instance, remote
car diagnostics or electricity meter data management.
Key application areas
❑ Existing M2M solutions cover numerous industry sectors and application scenarios.
Various predictions have been made by analyst firms that provide market information
such as key applications, value chains, and market actors, as well as market sizes
(including forecasts) (ABI 2012, Berg 2013).
❑ A selected summary of main cellular M2M application markets is provided in Figure
1.2, and the figures are estimates of deployed numbers of corresponding M2M
devices in the years 2012 and 2016, respectively.
❑ The largest segment is currently Telematics for cars and vehicles. Typical applications
include navigation, remote vehicle diagnostics, pay-as-you-drive insurance schemes,
road charging, and stolen vehicle recovery.

❑ Metering applications, meanwhile, include primarily remote meter management and
data collection for energy consumption in the electricity utility sector, but also for gas
and water consumption.
❑ Remote monitoring is more generalized monitoring of assets, and includes remote
patient monitoring as one prime example.
❑ Fleet management includes a number of different applications, like data logging,
goods and vehicle positioning, and security of valuable or hazardous goods.
❑ Security applications are mainly those related to home alarms and small business
surveillance solutions. The final market segment is Automated
❑ Teller Machines (ATM) and Point of Sales (POS) terminals
Fig.1.2. Summarized cellular M2M market situation
IoT
❑ The IoT is a widely used term for a set of technologies, systems, and design principles
associated with the emerging wave of Internet-connected things that are based on the
physical environment.
❑ In many respects, it can initially look the same as M2M communication connecting
sensors and other devices to Information and Communication Technology (ICT)
systems via wired or wireless networks.
❑ In contrast to M2M, however, IoT also refers to the connection of such systems and
sensors to the broader Internet, as well as the use of general Internet technologies.
❑ In the longer term, it is envisaged that an IoT ecosystem will emerge not dissimilar to
today’s Internet, allowing things and real world objects to connect, communicate, and
interact with one another in the same way humans do via the web today.
❑ No longer will the Internet be only about people, media, and content, but it will also
include all real-world assets as intelligent creatures exchanging information,

interacting with people, supporting business processes of enterprises, and creating
knowledge.
❑ The IoT is not a new Internet, it is an extension to the existing Internet. IoT is about
the technology, the remote monitoring, and control, and also about where these
technologies are applied. IoT can have a focus on the open innovative promises of the
technologies at play, and also on advanced and complex processing inside very
confined and close environments such as
Fig.1.3. An IoT
❑ Looking towards the applications and services in the IoT, we see that the application
opportunities are open-ended, and only imagination will set the limit of what is
achievable.
❑ Starting from typical M2M applications, one can see application domains emerging
that are driven from very diverse needs from across industry, society, and people, and
can be of both local interest and global interest.
❑ Applications can focus on safety, convenience, or cost reduction, optimizing business
processes, or fulfilling various requirements on sustainability and assisted living.
❑ Listing all possible application segments is futile, as is providing a ranking of the
most important ones. We can point to examples of emerging application domains that
are driven by different trends and interests .
❑ As can be seen, they are very diverse and can include applications like urban
agriculture, robots and food safety tracing, and we will give brief explanations of
what these three examples might look like.

Fig.1.4. Emerging IoT Applications
❑ Urban Agriculture. Already today, more than 50% of the world’s population lives in
urban areas and cities. The increased attention on sustainable living includes reducing
transportation, and in the case of food production, reducing the needs for pesticides.
❑ The prospect of producing food at the place where it is consumed (i.e. in urban areas)
is a promising example. By using IoT technologies, urban agriculture could be highly
optimized.
❑ Sensors and actuators can monitor and control the plant environment and tailor the
conditions according to the needs of the specific specimen.
❑ Water supply through a combination of rain collection and remote feeds can be
combined on demand. City or urban districts can have separate infrastructures for the
provisioning of different fertilizers.
❑ Weather and light can be monitored, and necessary blinds that can shield and protect,
as well as create greenhouse microclimates, can be automatically controlled.
❑ Fresh air generated by plants can be collected and fed into buildings, and tanks of
algae that consume waste can generatefertilizers.
❑ Robots. The mining industry is undergoing a change for the future. Production rates
must be increased, cost per produced unit decreased, and the lifetime of mines and
sites must be prolonged.
❑ In addition, human workforce safety must be higher, with fewer or no accidents, and
environmental impact must be decreased by reducing energy consumption and carbon
emissions.
❑ The mining industry answer to this is to turn each mineinto a fully automated and
controlled operation. The process chain of the mine involving blasting, crushing,
grinding, and ore processing will be highly automated and interconnected.
❑ The heavy machinery used will be remotely controlled and monitored, mine sites will
be connected, and shafts monitored in terms of air and gases.
❑ Sensors in the mine can provide information about the location of the machines.
❑ The trend is also that local control rooms will be replaced by larger control rooms at
the corporate headquarters. Sensors and actuators to remotely control both the sites
and the massive robots in terms of mining machines for drilling, haulage, and
processing are the instruments to make this happen.
❑ Food Safety. After several outbreaks of food-related illnesses in the U.S., the U.S.
Food and Drug Administration (USFDA) created its Food Safety and Modernization
Act (FSMA 2011).
❑ The main objective with FSMA is to ensure that the U.S. food supply is safe. Similar
food safety objectives have also been declared by the European Union and the
Chinese authorities.
❑ These objectives will have an impact across the entire food supply chain, from the
farm to the table, and require a number of actors to integrate various parts of their
businesses.
❑ From the monitoring of farming conditions for plant and animal health, registration of
the use of pesticides and animal food, the logistics chain to monitor environmental
conditions as produce is being transported, and retailers handling of food all will be
connected.
❑ Sensors will provide the necessary monitoring capabilities, and tags like radio
frequency identification (RFID) will be used to identify the items so they can be

tracked and traced throughout the supply chain. The origin of food can also be
completely transparent to the consumers.
❑ As can be seen by these very few examples, IoT can target very point and closed
domain-oriented applications, as well as very open and innovation driven
applications.
❑ Applications can stretch across an entire value chain and provide lifecycle
perspectives. Applications can be for businessto-business (B2B) as well as for
business-to-consumer (B2C), and can be complex and involve numerous actors, as
well as large sets of heterogeneous data sources.
M2M towards IoT _ the global context
❑ M2M solutions have been around for decades and are quite common in many
different scenarios. While the need to remotely monitor and control assets personal,
enterprise or other is not new, a number of concurrent things are now converging to
create drivers for change not just within the technology industry, but within the wider
global economy and society.
❑ From constraints on natural resources to a reconfiguration of the world’s economy,
many people are looking to technology to assist with these issues.
❑ Essentially, therefore, a set of megatrends are combining to create needs and
capabilities, which in turn produce a set of IoT Technology and Business Drivers.
This is illustrated in Figure1.5.
❑ A megatrend is a pattern or trend that will have a fundamental and global impact on
society at a macro level over several generations. It is something that will have a
significant impact on the world in the foreseeable future.
❑ We here imply both game changers as challenges, as well as technology and science
to meet these challenges.
❑ For the sake of simplicity, we also provide Table 1.1 as a summary of the main game
changers, technology and science trends, capabilities, and implications for IoT.
Fig.1.6. Megatrends, capabilities, and implications.

Table.1.1. A Summary of Megatrends, Capabilities, and IoT Implications
Game changers
❑ The game changers come from a set of social, economic, and environmental shifts
that create pressure for solutions to address issues and problems, but also
opportunities to reformulate the manner in which our world faces them.
❑ There is an extremely strong emerging demand for monitoring, controlling, and
understanding the physical world, and the game changers are working in conjunction
with technological and scientific advances.

❑ The transition from M2M towards IoT is one of the key facets of the technology
evolution required to face these challenges.
❑ We outline some of these more globally significant game changers below, and their
relationship to IoT:
• Natural Resource Constraints.
❖ The world needs to increasingly do more with less, from raw materials to energy,
water or food, the growing global population and associated economic growth
demands put increasing constraints on the use of resources.
❖ The use of IoT to increase yields, improve productivity, and decrease loss across
global supply chains is therefore escalating.
• Economic Shifts.
❖ The overall economy is in a state of flux as it moves from the post-industrial era to a
digital economy. One example of this is found in the move from product-oriented to
service-oriented economies.
❖ This implies a lifetime responsibility of the product used in the service offering, and
will in many cases require the products to be connected and contain embedded
technologies for gathering data and information. At the same time, there are
fluctuations in global economic leadership.
• Changing Demographics.
❖ With increased prosperity, there will be a shift in the demographic structures around
the world. Many countries will need to deal with an aging population without
increasing economic expenditure.
❖ As a result, IoT will need to be used, for example, to help provide assisted living and
reduce costs in healthcare and emerging “wellcare” systems.
• Socioeconomic Expectations.
❖ The global emerging middle class results in increasing expectations on well-being and
Corporate Social Responsibility.
❖ Lifestyle and convenience will be increasingly enabled by technology as the same
disruption and efficiency practices evident in industries will be applied within
people’s lives and homes as well.
• Climate Change and Environmental Impacts.
❖ The impact of human activities on the environment and climate has been long
debated, but is now in essence scientifically proven.
❖ Technology, including IoT, will need to be applied to aggressively reduce the impact
of human activity on the earth’s systems.

• Safety and Security.
❖ Public safety and national security becomes more urgent as society becomes more
advanced, but also more vulnerable.
❖ This has to do both with reducing fatalities and health as well as crime prevention,
and different technologies can address a number of the issues at hand.
• Urbanization.
❖ We see the dramatic increase in urban populations and discussions about megacities.
❖ Urbanization creates an entirely new level of demands on city infrastructures in order
to support increasing urban populations.
❖ IoT technologies will play a central role in the optimization for citizens and
enterprises within the urban realm, as well as providing increased support for
decision-makers in cities.
General technology and scientific trends
❑ Technological and scientific advances and breakthroughs are occurring across a
number of disciplines at an increasing pace.
❑ Material Science has a large impact across a vast range of industries, from
pharmaceutical and cosmetics to electronics. MicroElectroMechanical Systems
(MEMS) can be used to build advanced micro-sized sensors like accelerometers and
gyroscopes. New materials provide different methods to develop and manufacture a
large range of different sensors and actuators, as well being used in applications for
environmental control, water purification, etc. Additionally, we will see other
innovative uses such as smart textiles that will provide the capability to produce the
next generation of wearable technologies. From an IoT perspective, these advances in
material science will see an increasing range of applications and also a broader
definition of what is meant by a sensor.
❑ Complex and Advanced Machinery refers to tools that are autonomous or semi-
autonomous. Today they are used in a number of different industries; for example,
robots and very advanced machinery is used in different harsh environments, such as
deep-sea exploration, or in the mining industry in solutions such as Rio Tinto’s Mine
of the Futuret (Rio Tinto 2012). Advanced machines have many modalities, and
operate with a combination of local autonomous capabilities as well as remote
control. Sensing and actuation are key technologies, and local monitor-control loops
for routine tasks are required in addition to reliable communications for remote
operations. Often such solutions require real-time characteristics. These systems will
continue to evolve and automate tasks today performed by humans even self-driving
cars have started to make headlines thanks to Google.
❑ Energy Production and Storage is relevant to IoT for two reasons. Firstly, it relates
to the global interest of securing the availability of electricity while reducing climate
and environmental impacts. Smart Grids, for example, imply micro-generation of
electricity using affordable photovoltaic panels. In addition, smart grids also require

new types of energy storage, both for the grid itself and for emerging technologies
such as Electric Vehicles (EVs) that rely on increasingly efficient battery
technologies. Secondly, powering embedded devices in Wireless Sensor Networks
(WSNs) will increasingly rely on different energy harvesting technologies and also
rely on new miniaturized battery technologies and ultra capacitors. As these
technologies improve, IoT will be applicable in a broad range of scenarios that need
long battery life.
Trends in information and communications technologies
❑ Today, sensors, actuators, and tags function as the digital interfaces to the physical
world. Small-scale and cheap sensors and actuators provide the bridge between the
physical realm and ICT systems. Tags using technologies such as RFID provide the
means to put electronic identities on any object, and can be cheaply produced.
❑ Embedded processing is evolving, not only towards higher capabilities and
processing speeds, but also extending towards the smallest of applications. There is a
growing market for small-scale embedded processing such as 8-, 16-, and 32-bit
microcontrollers with on-chip RAM and flash memory, I/O capabilities, and
networking interfaces such as IEEE 802.15.4 that are integrated on tiny System-on-a-
Chip (SoC) solutions. These enable very constrained devices with a small footprint of
a few mm2 and very low power consumption (in the milli- to micro-Watt range), yet
are still capable of hosting an entire TCP/IP stack including a small web server.
❑ Instant access to the Internet is available virtually everywhere today, mainly thanks
to wireless and cellular technologies and the rapid Instant access to the Internet is
available virtually everywhere today, mainly thanks to wireless and cellular
technologies and the rapid deployment of cellular 3G and 4G or Long Term Evolution
(LTE) systems on a global scale.
❑ These systems provide ubiquitous and relatively cheap connectivity with the right
characteristics for many applications, including low latency and the capacity to handle
large amounts of data with high reliability.
❑ Existing technologies can be further complemented with lasthop technologies such as
IEEE 802.15.4, Bluetooth Low Energy, and Power Line Communication (PLC)
solutions to reach even the most costsensitive deployments and tiniest devices.
❑ Software architectures have undergone several evolutions over the past decades, in
particular with the increasing dominance of the web paradigm.
❑ From a simplistic perspective, we can view software development techniques from
what were originally closed environments towards platforms, where Open APIs
provide a simple mechanism for developers to access the functionality of the platform
in question (e.g. Microsoft Windows).
❑ Over time, these platforms, due to the increasing use and power of the Internet, have
become open platforms ones that do not depend on certain programming languages
or lock-in between platform developers and platform owners.

❑ Software development has started applying the web paradigm and using a service-
oriented approach (SOA). By extending the web paradigm to IoT devices, they can
become a natural component of building any application and facilitate an easy
integration of IoT device services into any enterprise system that is based on the SOA
(e.g. that uses web services or RESTful interfaces).
❑ IoT applications can then become technology and programming language
independent. This will help boost the IoT application development market. A key
component in establishing the application development market is Open APIs.
❑ Open APIs, in the same way that they have been critical to the development of the
web, will be just as important to the creation of a successful IoT market, and we can
already see developments in this space. Put simply, Open APIs relate to a common
need to create a market between many companies, as is the case in the IoT market.
Open APIs permit the creation of a fluid industrial platform, allowing components to
be combined together in multiple different ways by multiple developers with little to
no interaction with those who developed the platform, or installed the devices.
❑ Open APIs are the market’s response to this uncertainty; choice of how to combine
components is left to developers who are able to merely pick up the technical
description and combine them together. Without Open APIs, a developer would need
to create contracts with several different companies in order to get access to the
correct data to develop the application. The transaction costs associated with
establishing such a service would be prohibitively expensive for most small
development companies; they would need to establish contracts with each company
for the data required, and spend time and money on legal fees and business
development with each individual company.
❑ Open APIs remove the need to create such contracts, allowing companies to establish
“contracts” for sharing small amounts of data with one another and with developers
dynamically, without legal teams, without negotiating contracts, and without even
meeting one another..
❑ Meanwhile, within ICT, virtualization has many different facets and has gained a lot
of attention in the past few years, even though it has been around for a rather long
time.
❑ The cloud computing paradigm, with different as a Service models, is one of the
greatest aspects of the evolution of ICT for IoT as it allows virtualized and
independent execution environments for multiple applications to reside in isolation on
the same hardware platform, and usually in large data centers.
❑ Cloud computing allows elasticity in deployment of services and enables reaching
long-tail applications in a viable fashion. It can be used to avoid in-house installations
of server farms and associated dedicated IT service operations staff inside companies,
thus enabling them to focus on their core business.
❑ Cloud computing also has the benefit of easing different businesses to interconnect if
they are executing on the same platform. Handling of, for example, Service Level

Agreements (SLAs) is easily facilitated with a high degree of control in a common
virtualized environment.
❑ Closely related to the topic of data centers, data processing and intelligent software
will have an increasing role to play in IoT solutions.
❑ A popular concept now is big data, which refers to the increasing number and size of
data sets that are available for companies and individuals to collect and perform
analysis on.
❑ Built on large-scale computing, data storage, in-memory processing, and analytics,
big data is intended to find insights in the massive data sets produced. Naturally, these
technologies are therefore key enablers for IoT, as they allow the collation and
aggregation of the massive datasets that devices and sensors are likely to produce.
❑ IoT is unique in comparison to other big data applications such as social media
analysis, however, in that even the smallest piece of data can be critical.
❑ Take, for example, a sensor solution implemented to ensure that a largescale
engineering project does not cause subsidence in a residential area while drilling a
tunnel beneath the ground.
❑ The data collected from a vast quantity of sensors will help with the overall
management of the project and ensure the health and safety of those working on it
during the several months that it is ongoing. It might only be a tiny piece of data from
one sensor, however, that indicates a shift due to tunneling that may mean the collapse
of a building on the surface. Whereas the aggregation of the data from all sensors can
be usefully analyzed at intervals, the data related to subsidence and possible collapse
of a building is critical and required in real-time.
❑ Therefore, IoT data typically also involves numerous and very different and
heterogeneous sources, but also numerous and very different usages of the data.
❑ Decision support or even decision-making systems will therefore become very
important in different application domains for IoT, as will the set of tools required to
process data, aggregate information, and create knowledge.
❑ A fundamental addition to the data aspect of IoT is the dimension represented by
actionable services as realized by actuators. There is a duality in sensing and
actuation in terms of fusion and aggregation. Where data analytics is employed to
find insights basically by aggregation, one can consider complex multimodal
actuation services that need to be resolved down to the level of individual atomic
actuation tasks.
❑ The IoT market holds incredible promise for solving big problems for industry,
society, and even individuals. One key thing to note, however, is the tremendous
complexity that such systems need to handle in order to function efficiently and
effectively.
❑ Partnerships and alliances are therefore critical no one company will be able to
produce all the technology and software required to deliver IoT solutions.
❑ Moreover, no one company will be able to house the innovative capacity required to
develop new solutions for this market. IoT solutions bring together devices, networks,
applications, software platforms, cloud computing platforms, business processing
systems, knowledge management, visualization, and advanced data analysis
techniques.
❑ This is quite simply not possible at scale without significant levels of system
integration and standards development.
❑ Capabilities
❑ As illustrated in previous sections, there are several recurring characteristics of ICT
required to develop IoT solutions. These capabilities address several aspects such as
cost efficiency, effectiveness and convenience; being lean and reducing
environmental impact; encouraging innovation; and in general applying technology to
create more intelligent systems, enterprises, and societies.
❑ In the following sections we outline how these required capabilities, driven by global
megatrends, can be met through the use of the enabling technologies.
❑ While M2M today targets specific problems with tailored, siloed solutions, it is clear
that emerging IoT applications will address the much more complex scenarios of
large-scale distributed monitor and control applications.
❑ IoT systems are multimodal in terms of sensing and control,complex in management,
and distributed across large geographical areas.
❑ For example, the new requirements on Smart Grids involve end-to-end management
of energy production, distribution, and consumption, taking into consideration needs
from Demand Response, micro-generation, energy storage, and load balancing.
Industrialized agriculture involving automated irrigation, fertilization, and climate
control is another example.
❑ We see clearly here heterogeneity across sensor data types, actuation services,
underlying communication systems, and the need to apply intelligent software to
reach various Key Performance Indicators (KPI).
❑ Take, for example, Smart City solutions: here there is a clear need for integration of
multiple disparate infrastructures such as utilities, including district heating and
cooling, water, waste, and energy, as well as transportation such as road and rail. Each
of these infrastructures has multiple stakeholders and separate ownership even though
they operate in the same physical spaces of buildings, road networks, and so on.
❑ This integration of multiple infrastructures will drive the need for a horizontal
approach at the various levels of the system, for instance, at the resource level where
data and information is captured by devices, via the information level, up to the
knowledge and decision level.
❑ Meanwhile, advanced remotely operated machinery, such as drilling equipment in
mines or deep sea exploration vessels, will require real-time control of complex
operations, including various degrees of autonomous control systems.
❑ This places new requirements on the execution of distributed application software and
real-time characteristics on both the network itself, as well as a need for flexibility in
where application logic is executed.
❑ IoT will allow more assets of enterprises and organizations to be connected, thus
allowing a tighter and more prompt integration of the assets into business processes
and expert systems.
❑ Simple machines can be used in a more controlled and intelligent manner, often called
“Smart Objects.”
❑ These connected assets will generate more data and information, and will expose
more service capabilities to ICT systems.
❑ Managing the complexity of information and services becomes a growing barrier for
the workforce, and places a high focus on using analytics tools of various kinds to
gain insights. These insights, combined with domain-specific knowledge, can help the
decision process of humans as individuals or professionals via decision support
systems and visualization software.
❑ As society operations involve a large number of actors taking on different roles in
providing services, and as enterprises and industries increasingly rely on efficient
operations across ecosystems, cross value chain and value system integration is a
growing need.
❑ This requires technologies and business mechanisms that enable oper ations and
information sharing across supply chains. Even industry segments that have been
entirely unconnected will connect due to new needs; an example is the introduction
of EVs.
❑ EVs are enabled by the new battery and energy storage technologies, but also require
three separate elements to be connected cars, road infrastructure via charging poles,
and the electricity grid. In addition, there are new charging requirements that are
created by the use of EVs thatneed new means for billing, and in turn placing new
requirements on the electricity grid itself.
❑ These sorts of collaboration scenarios will become increasingly important as
industries, individuals, and government organizations work together to solve complex
problems involving multiple stakeholders.
❑ The open and collaborative nature of IoT means methods are required to publish and
discover data and services, as well as means to achieve semantic interoperability, but
also that care needs to be given to trust, security, and privacy. It also dramatically
increases the required capability of system integration and the management of large-
scale complex systems across multiple stakeholders and multiple organizational
boundaries.
❑ As we come to increasingly rely on ICT solutions to monitor and control assets,
physical properties of the real world require not just increased levels of cybersecurity,
but what can be referred to as cyber-physical security.

❑ In the use of the Internet today, it is possible to exact financial damage via breaking
into information technology (IT) systems of companies or bank accounts of
individuals. Individuals, meanwhile, can face social damages from people hacking
social media accounts. In an IoT, where it is possible to control assets (e.g. vehicles or
moveable bridges), severe damage to property, or even loss of life, is possible. This
raises requirements for trust and security to be correctly implemented in IoT systems.
Implications for IoT
❑ Having gained a better understanding of capabilities needed, as well as how
technology evolution can support these needs, we can note plausible implications on
both the technology and business erspectives.
❑ There is already a trend of moving away from vertically oriented systems, or
application-specific silos, towards a horizontal systems approach.
❑ We see that in the standardization work of the ETSI Technical Committee M2M
(ETSI M2M 2013), and now also in the oneM2M project partnership organization,
both covered in more detail in Part II of this book.
❑ The work in these organizations is primarily based on identifying a common set of
ervice capabilities that are application independent, but they also identify reference
points to underlying communication network services as well as reference points to
M2M devices.
❑ The use of the TCP/IP stack towards IoT devices represents another horizontal point
in an M2M and IoT system solution, and is something driven by organizations like
the IETF and the IP for Smart Objects (IPSO) Alliance.
❑ In the M2M device area, there is an emerging consolidation of technologies where
solutions across different industry segments traditionally rely on legacy and
proprietary technologies.
❑ Currently within industry segments there is technology fragmentation, one example
being Building and Home Automation and Control with legacy technologies like
BACnet, Lonworks, KNX, Z-Wave, and ZigBee.
❑ An example of this consolidation entering the legacy domain is ZigBee IP (ZigBee
Alliance 2013c), where TCP/IP is used in the Smart Energy Profile (SEP) 2.0 (ZigBee
Alliance 2013b).
❑ In such situations, where there is a requirement for integration across multiple
infrastructures and of a large set of different devices, as well as data and information
sharing across multiple domains, there is a clear benefit from a horizontal systems
approach with at least a common conceptual interoperability made available, and a
reduced set of technologies and protocols being used.
❑ As mentioned previously, M2M is point problem-oriented, resulting in point solutions
where devices and applications are highly dedicated to solving a single task.
❑ M2M devices are for this reason many times highly application-specific, and reuse of
devices beyond the M2M application at hand is difficult, if at all possible. With the

increasing requirements to gather information and services from various sources, and
to be able to have greater flexibility and variety in IoT applications, devices can no
longer be application-specific in the same manner as for M2M.
❑ Benefits will be achieved if an existing device can be used in a variety of
applications,and likewise if a specific application can use a number of different
deployed devices. Here we see a shift from application-specific devices towards
application-independent devices.
❑ As also mentioned, clear benefits come from relying on the web services paradigm, as
it allows easy integrationin SOAs and attracts a larger application developer
community.
❑ Even though M2M has been around for many years, recent years have seen a
tremendous interest in M2M across industries, primarily the telecom industry. This
comes from the fact that both devices and connectivity have become viable for many
different applications, and M2M today is centered on devices and connectivity.
❑ For IoT there will be a shift of focus away from device- and connectivity-centricity
towards services, data, and intelligence.
Barriers and concerns
❑ With the explained transformations in moving from M2M towards IoT, which
involves many opportunities, we should not forget that some new concerns and
barriers will also be raised.
❑ With the IoT, the first concern that likely comes to mind is the compromise of privacy
and the protection of personal integrity.
❑ The use of RFID tags for tracing people is a raised concern.
❑ With a massive deployment of sensors in various environments, including in
smartphones, explicit data and information about people can be collected, and using
analytics tools, users could potentially be profiled and identified even from
anonymized data.
❑ The reliability and accuracy of data and information when relying on a large number
of data sources that can come from different providers that are beyond one’s own
control is another concern.
❑ Concepts like Provenance of Data and Quality of Information (QoI) become
important, especially considering aggregation of data and analytics.
❑ As there is a risk of relying on inaccurate or even faulty information in a decision
process, the issue of accountability, and even liability, becomes an interest. This will
require new technology tools; an example effort includes the work on QoI related to
both sensor data and actuation services in the EU FP7project SENSEI (SENSEI
2013).
❑ As has already been mentioned, the topic of security has one added dimension or level
of concern. Not only are today’s economical or social damages possible on the

Internet, but with real assets connected and controllable over the Internet, damage of
property as well as people’s safety and even lives become an issue, and one can talk
about cyber-physical security.
❑ Not a concern, but a perceived barrier for large-scale adoption of IoT is in costs for
massive deployment of IoT devices and embedded technologies.
❑ This is not only a matter of Capital Expenditure (CAPEX), but likely more
importantly a matter of Operational Expenditure (OPEX). From a technical
perspective, what is desired is a high degree of automated provisioning towards zero-
configuration. Not only does this involve configuration of system parameters and
data, but also contextual information such as location (e.g. based on Geographic
Information System (GIS) coordinates or room/building information).
❑ These different concerns and barriers have consequences not only on finding technical
solutions, but are more importantly having consequences also on business and
socioeconomic aspects as well as on legislation and regulation.
A use case example
❑ In order to understand how a specific problem can be addressed with M2M and IoT,
respectively, we provide a fictitious illustrative example.
❑ Our example takes two different approaches towards the solution, namely an M2M
approach and an IoT approach. By that, we want to highlight the potential and
benefits of an IoT-oriented approach over M2M, but also indicate some key
capabilities that will be required going beyond what can be achieved with M2M
❑ Our example is taken from personal well-being and health care. Studies from the U.S.
Department of Health and Human Services have shown that close to 50% of the
health risks of the enterprise workforce are stress related, and that stress was the
single highest risk contributor in a group of factors that also included such risks as
high cholesterol, overweight issues, and high alcohol consumption.
❑ As stress can be a root cause for many direct negative health conditions, there are big
potential savings in human quality of life, as well as national costs and productivity
losses, if the factors contributing to stress can be identified and the right preventive
measures taken.
❑ By performing the steps of stressor diagnosis, stress reliever recommendations,
logging and measuring the impacts of stress relievers for making a stress assessment,
all in an iterative approach, there is an opportunity to significantly reduce the negative
effects of stress.
❑ Measuring human stress can be done using sensors. Two common stress
measurements are heart rate and galvanic skin response (GSR), and there are products
on the market in the form of bracelets that can do such measurements. These sensors
can only provide the intensity of the heart rate and GSR, and do not provide an
answer to the cause of the intensity.
❑ A higher intensity can be the cause of stress, but can also be due to exercise. In order
to analyze whether the stress is positive or negative, more information is needed.

❑ The typical M2M solution would be based on getting sensor input from the person by
equipping him or her with the appropriate device, in our case the aforementioned
bracelet, and using a smartphone as a mobile gateway to send measurements to an
application server hosted by a health service provider.
❑ In addition to the heart rate and GSR measurements, an accelerometer in the
smartphone measures the movement of the person, thus providing the ability to
correlate any physical activity to the excitement measurements.
❑ The application server hosts the necessary functionality to analyze the collected data,
and based on experience and domain knowledge, provides an indication of the stress
level.
❑ The stress information can then be made available to the person or a caregiver via
smartphone application or a web interface on a computer.
❑ The M2M system solution and measured data is depicted in Figure 1.7 As already
pointed out, this type of solution that is limited to a few measurement modalities can
only provide very limited (if any) information about what actually causes the stress or
excitement. Causes of stress in FIGURE 1.7
❑ As already pointed out, this type of solution that is limited to a few measurement
modalities can only provide very limited (if any) information about what actually
causes the stress or excitement. Causes of stress in daily life, such as family situation,
work situation, and other activities cannot be identified.
❑ A combination of the stress measurement log over time, and a caregiver interviewing
the person about any specific events at high levels of measured stress, could provide
more insights, but this is a costly, labor-intensive, and subjective method.
❑ If additional contextual information could be added to the analysis process, a much
more accurate stress situation analysis could potentially be performed.

Fig.1.7. Stress measurement M2M solution.
❑ Approaching the same problem situation from an IoT perspective would be to add
data that provide much deeper and richer information of the person’s contextual
situation.
❑ The prospect is that the more data is available, the more data can be analyzed and
correlated in order to find patterns and dependencies. What is then required is to
capture as much data about the daily activities and environment of the person as
possible.
❑ The data sources of relevance are of many different types, and can be openly available
information as well as highly personal information. The resulting IoT solution is
shown in Figure 1.8 where we see examples of a wide variety of data sources that
have an impact on the personal situation.
❑ Depicted is also the importance of having expert domain knowledge that can mine the
available information, and that can also provide proposed actions to avoid stressful
situations or environments.

Fig.1.8. IoT-oriented stress analysis solution.
❑ The environmental aspects include the physical properties of the specific
environment, and can be air quality and noise levels of the work environment, or the
nighttime temperature of the bedroom, all having impacts on the person’s well-being.
❑ Work activities can include the amount of e-mails in the inbox or calendar
appointments, all potentially having a negative impact on stress. Leisure activities, on
the other hand, can have a very positive impact on the level of excitement and stress,
and can have a more healing effect than a negative effect. Such different negative and
positive factors need to be separated and filtered out; see Figure 1.9 for an example
smartphone application that provides stress analysis feedback.
❑ The stress bracelet is in this scenario is just one component out of many. It should
also be noted that the actual information sources are very independent of the actual
application in mind (i.e. measurement and prevention of negative stress).
❑ By having the appropriate expert knowledge system in place, analytics can be
proactive and preventive. By understanding what factors cause negative stress, the
system can propose actions to be taken, or even initiate actions automatically.
❑ They could be very elementary, such as suggesting to lower the nighttime bedroom
temperature a few degrees, but also be more complex, such as having to deal with an
entire workplace environment.

Fig.1.9. Stress analysis visualization.
❑ As this simple example illustrates, an IoT-oriented solution to solving a particular
problem could provide much more precision in achieving the desired results.
❑ We also observe some of the key features of an IoT solution; in other words, to take
many different data sources into account, relying both on sensor-originated data
sources, but also other sources that have to do with the physical environment, and
then also to rely on both openly available data as well as data that is private and
personal.
❑ The data sources, such as sensor nodes, should also focus on providing the
information and should to the greatest extent be application-independent so that their
reuse can be maximized. We also see the central role of analytics and knowledge
extraction, as well as taking knowledge into actionable services that can involve
controlling the physical environment using actuators.
❑ The increased complexity also comes at a cost. The solutions must ensure security and
protection of privacy, and the need to deal with data and information of different
degrees of accuracy and quality needs to be addressed in order to provide dependable
solutions in the end.

Differing characteristics
❑ To summarize, today’s M2M solutions and deployments share a few common
characteristics. First of all, any M2M solution is generally focused on solving a
problem at a particular point for one company or stakeholder. It
❑ does not typically take a broad perspective on solving a larger set of issues or ones
that could involve several stakeholders.
❑ As a result, most M2M devices are special purpose devices that are application-
specific, often down to the device protocols. M2M solutions are therefore also vertical
siloes with no horizontal integration or connection to adjacent use cases, and are
primarily of a B2B-type of operation.
❑ M2M applications are built by very specialized developers, and deployed inside
enterprises. As M2M has a rather long history, technologies used are very industry-
specific, and especially on the device side, technology use is highly fragmented with
little or no standards across industries.
❑ M2M is also very device- and communication- centric, as both are the two current
cornerstones for remote access to assets.
❑ The transition from M2M towards an IoT is mainly characterized by moving away
from the mentioned closed-silo deployments towards something that is characterized
by openness, multipurpose, and innovation.
❑ This transition consists of a few main transformations, namely: moving away from
isolated solutions to an open environment; the use of IP and web as a technology
toolbox, the current Internet as a foundation for enterprise and government operations;
multimodal sensing and actuation; knowledge-creating technologies; and the general
move towards a horizontal layering of both technology and business.
❑ The main differing characteristics between M2M and IoT highlighted in this chapter
are summarized in Table 1.2.
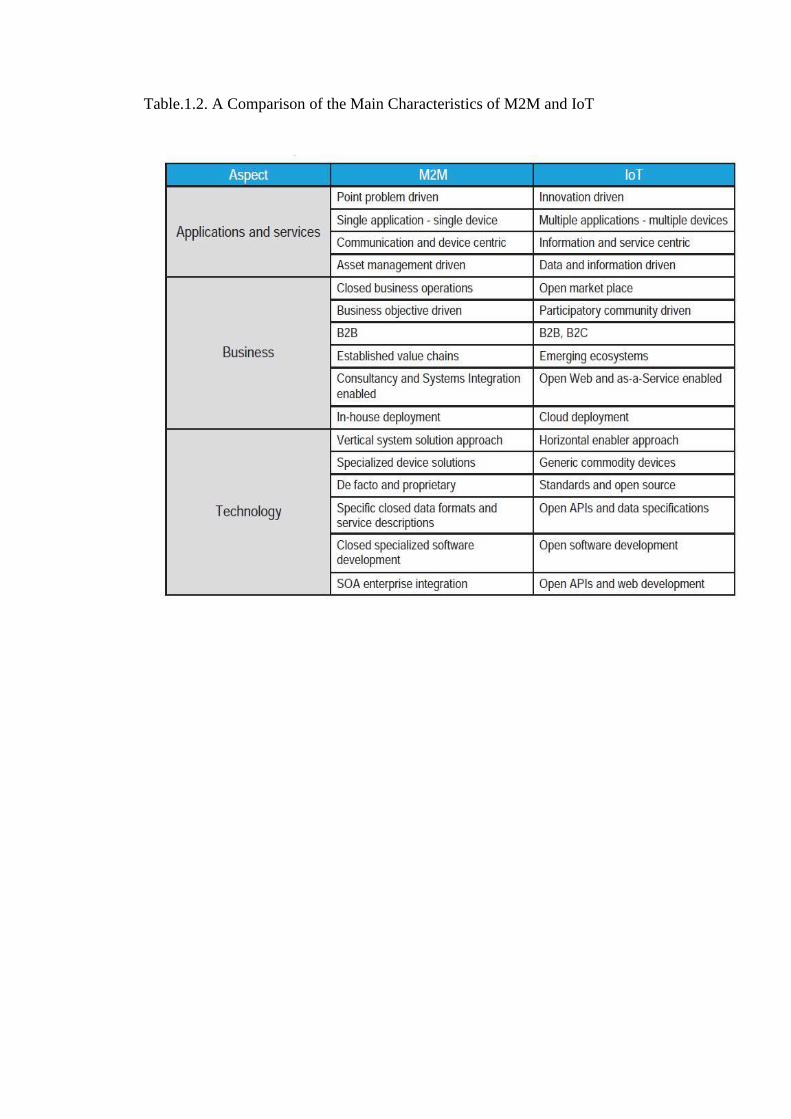
Table.1.2. A Comparison of the Main Characteristics of M2M and IoT

SCHOOL OF COMPUTING
DEPARTMENT OF COMPUTER SCIENCE AND ENGINEERING
UNIT II - Internet of Things – SBS1610

M2M to IoT – A Market Perspective– Introduction, Some Definitions, M2M Value Chains,
IoT Value Chains, An emerging industrial structure for IoT, The international driven global
value chain and global information monopolies. M2M to IoT-An Architectural Overview–
Building an architecture, Main design principles and needed capabilities, An IoT architecture
outline, standards considerations.
M2M to IoT – A market perspective
M2M to IoT
A Market Perspective
The increasing interest in M2M and IoT solutions has been driven by the potential large
market and growth opportunities.
In M2M and IoT, the technology used for these solutions may be very similar, even use the
same base components but the data is managed will be different.
In an M2M solution, data remains within strict boundaries, it is used solely for the purpose.
In IoT, data may be used and reused for many different purposes.
Data can be shared between companies and value chains in internal information
marketplaces.
Data could be publicly exchanged on a public information marketplace.
These marketplaces are based on the exchange of data in order to create information
products.
Definition of M2M
Machine to machine refers to technology that allowed both wireless and wired systems to
communicate with other devices of the same type.
Global value chains
A value chain describes the full range of activities that firms and workers perform to bring a
product from its conception to end use and beyond, including design, production, marketing,
distribution, and support to the final consumer. Analysing an industry from a global value
chain (GVC) perspective permits understanding of the context of globalization on the
activities contained within them by “focusing on the sequences of tangible and intangible
value-adding activities, from conception and production to end use. GVC analysis therefore
provides a holistic view of global industries both from the top down and from the bottom up”.
M2M value chain

Fig 2.1 M2M Value Chain


IoT value chains
Fig 2.2 IoT Value Chain


An emerging industrial structure for IoT
Here are four trends tech leaders might want to consider when architecting their next wireless
infrastructure.
•Hardware Rapid Prototyping
In the industrial world, the challenge of IoT hardware design lies in the bewildering array of
use case requirements. Take temperature sensors as a simple example. Depending on criteria
like accuracy, temperature range, response time and stability, there could be hundreds of
available sensors to choose from. Most likely, there won’t be an out-of-the-box wireless
sensor out there that fully meets your needs or your client’s. And that’s where IoT rapid
prototyping comes in.
Hardware prototyping standards like mikroBUS allow you to build a customized IoT device
prototype in a matter of a few hours and with efficient resources. From a broad portfolio of
ready-to-use, compatible sensor, interface and wireless modules as well as compilers and
development boards, you can create the optimal hardware mix-and-match that caters to your
industrial use case. With rapid prototyping, companies can ratify the technical and business
viability of their IIoT solution in a cost-effective and agile fashion, which lays the
cornerstone for a successful roll-out.
•Retrofit Wireless Connectivity
An average factory operates with legacy industrial systems that are nowhere near being
connected. While these systems employ a number of proprietary communication protocols for
automation purposes, data is captive within discrete control loops, creating numerous data
silos on the factory floor. The lack of interoperability among these protocols further hinders
the implementation of a factory-wide monitoring and control network. Emerging retrofit
wireless connectivity now enables manufacturers to connect and acquire data from their
legacy assets and systems in a simple and cost-effective manner – without costly production
downtime and invasive hardware changes. Through the use of an integration platform,
operational data can be fetched from controllers through wired-based serial and other
industrial protocols then forwarded to a remote control center using long-range wireless
connectivity.

•Software-Defined Radio
As no wireless solution is use-case agnostic, a typical IIoT architecture is likely to
incorporate multiple radio protocols and standards. Plus, many industrial facilities today have
already implemented wireless networks (e.g. Wi-Fi, WirelessHART…) to a certain extent,
and look to deploy new types of connectivity to tap into other high-value use cases. Thus, it’s
critical to create an efficient and backward-compatible IIoT architecture that can
accommodate the co-existence of different wireless technologies, which is why software-
defined radio (SDR) is gaining momentum. SDR refers to a radio communication method
where the majority of signal processing is done using software, as opposed to the traditional
hardware-driven approach. IoT gateways leveraging SDR can incorporate and decode
different protocols concurrently to reduce infrastructure cost and complexity. What’s more,
adjustments or additions of new wireless solutions to the architecture can be achieved with
simple software updates. This allows companies to dynamically adapt to future operational
and technological changes while continuing to support legacy wireless devices in the field.
•Portable, Container-Based IIoT Platform Design
Depending on criteria like security, reliability, data ownership and costs, companies need to
choose among an on-premise, public or private cloud deployment, or even a hybrid approach.
As the IIoT use cases and architecture scale, the decision on the deployment model and/or
cloud vendor is subject to change as well.
An IIoT platform, typically a device management platform, that comes with a portable,
container-based design renders industrial users with full flexibility in selecting their preferred
backend environment. At the same time, it enables a simple migration to another server as
needed without compromising the consistency or functionality of the application. The idea of
a container-based design is that individual applications are packaged and delivered within
discrete, standardized containers called Docker. With this modular architecture, users can
decide which specific platform functions/ applications they want to use and where to deploy
them. Thanks to its flexibility and portability, the container-based design facilitates an
interoperable and future-proof IIoT architecture that keeps up with the industry’s dynamic
needs.
The international driven global value chain and global information monopolies
GVCs make a significant contribution to international development. Value-added trade
contributes about 30% to the GDP of developing countries, significantly more than it does in
developed countries (18%) furthermore the level of participation in GVCs is associated with
stronger levels of GDP per capita growth. GVCs thus have a direct impact on the economy,
employment and income and create opportunities for development. They can also be an
important mechanism for developing countries to enhance productive capacity, by increasing
the rate of adoption of technology and through workforce skill development, thus building the
foundations for long-term industrial upgrading.
However, there are limitations to the GVC approach. Their contribution to the growth may be
limited if the work done in-country is relatively low value adding (ie. contributes only a small
part of the total value added for the product or service). In addition, there is no automatic
process that guarantees diffusion of technology, skill-building and upgrading. Developing
countries thus face the risk of operating in permanently low value-added activities. Finally,

there are potential negative impacts on the environment and social conditions, including: poor
workplace conditions, occupational safety and health, and job security. The relative ease with
which the Value Chain Governors can relocate their production (often to lower cost
countries) also create additional risks.
Countries need to carefully assess the pros and cons of GVC participation and the costs and
benefits of proactive policies to promote GVCs or GVC-led development strategies.
Promoting GVC participation implies targeting specific GVC segments and GVC
participation can only form one part of a country's overall development strategy.
Before promoting GVC participation, policymakers should evaluate their countries’ trade
profiles and industrial capabilities in order to select strategic GVC development paths.
Achieving upgrading opportunities through CVCs requires a structured approach that
includes:
•embedding GVCs in industrial development policies (e.g. targeting GVC tasks and
activities);
•enabling GVC growth by providing the right framework conditions for trade and FDI and by
putting in place the needed infrastructure; and
•developing firm capabilities and training the local workforce.
M2M to IoT-An Architectural Overview
IoT Architecture Overview
IoT can be classified into a four or five-layered architecture which gives you a complete
overview of how it works in real life. The various components of the architecture include the
following:
Four-layered architecture: this includes media/device layer, network layer, service and
application support layer, and application layer.
Five-layered architecture: this includes perception layer, network layer, middleware layer,
application layer, and business layer.
Functions of Each Layer
Sensor/Perception layer: This layer comprises of wireless devices, sensors, and radio
frequency identification (RFID) tags that are used for collecting and transmitting raw data
such as the temperature, moisture, etc. which is passed on to the next layer.
Network layer: This layer is largely responsible for routing data to the next layer in the
hierarchy with the help of network protocols. It uses wired and wireless technologies for data
transmission.
Middleware layer: This layer comprises of databases that store the information passed on by
the lower layers where it performs information processing and uses the results to make
further decisions.

Service and application support layer: This layer involve business process modeling and
execution as well as IoT service monitoring and resolution.
Application layer: It consists of application user interface and deals with various applications
such as home automation, electronic health monitoring, etc.
Business layer: this layer determines the future or further actions required based on the data
provided by the lower layers.
Building an IoT Architecture
BUILDING BLOCKS of IoT
Four things form basic building blocks of the IoT system –sensors, processors, gateways,
applications. Each of these nodes has to have its own characteristics in order to form a useful
IoT system.
Fig 2.3 Simplified block diagram of the basic building blocks of the IoT
Sensors:
These form the front end of the IoT devices. These are the so-called “Things” of the system.
Their main purpose is to collect data from its surroundings (sensors) or give out data to its
surrounding (actuators). These have to be uniquely identifiable devices with a unique IP
address so that they can be easily identifiable over a large network. These have to be active
in nature which means that they should be able to collect real-time data. These can either
work on their own (autonomous in nature) or can be made to work by the user depending on
their needs (user-controlled).
Examples of sensors are gas sensor, water quality sensor, moisture sensor, etc.
Processors:
Processors are the brain of the IoT system. Their main function is to process the data captured
by the sensors and process them so as to extract the valuable data from the enormous amount

of raw data collected. In a word, we can say that it gives intelligence to the data. Processors
mostly work on real-time basis and can be easily controlled by applications. These are also
responsible for securing the data – that is performing encryption and decryption of data.
Embedded hardware devices, microcontroller, etc are the ones that process the data because
they have processors attached to it.
Gateways:
Gateways are responsible for routing the processed data and send it to proper locations for its
(data) proper utilization. In other words, we can say that gateway helps in to and fro
communication of the data. It provides network connectivity to the data. Network
connectivity is essential for any IoT system to communicate.
LAN, WAN, PAN, etc are examples of network gateways.
Applications:
Applications form another end of an IoT system. Applications are essential for proper
utilization of all the data collected. These cloud-based applications which are responsible for
rendering the effective meaning to the data collected. Applications are controlled by users
and are a delivery point of particular services. Examples of applications are home automation
apps, security systems, industrial control hub, etc.
Main design principles of IoT
1. Do your research
When designing IoT-enabled products, designers might make the mistake of forgetting why
customers value these products in the first place. That’s why it’s a good idea to think about
the value an IoT offering should deliver at the initial phase of your design. When getting into
IoT design, you’re not building products anymore. You’re building services and experiences
that improve people’s lives. That’s why in-depth qualitative research is the key to figuring
out how you can do that. Assume the perspective of your customers to understand what they
need and how your IoT implementation can solve their pain points. Research your target
audience deeply to see what their existing experiences are and what they wish was different
about them.
2. Concentrate on value
Early adopters are eager to try out new technologies. But the rest of your customer base
might be reluctant to put a new solution to use. They may not feel confident with it and are
likely to be cautious about using it. If you want your IoT solution to become widely adopted,
you need to focus on the actual tangible value it’s going to deliver to your target audience.
What is the real end-user value of your solution? What might be the barriers to adopting new
technology? How can your solution address them specifically? Note that the features the
early tech adopters might find valuable might turn out to be completely uninteresting for the
majority of users. That’s why you need to carefully plan which features to include and in
what order, always concentrating on the actual value they provide.
3. Don’t forget about the bigger picture

One characteristic trait of IoT solutions is that they typically include multiple devices that
come with different capabilities and consist of both digital and physical touchpoints. Your
solution might also be delivered to users in cooperation with service providers. That’s why
it’s not enough to design a single touchpoint well. Instead, you need to take the bigger picture
into account and treat your IoT system holistically. Delineate the role of every device and
service. Develop a conceptual model of how users will perceive and understand the system.
All the parts of your system need to work seamlessly together. Only then you’ll be able to
create a meaningful experience for your end-users.
4. Remember about the security
Don’t forget that IoT solutions aren’t purely digital. They’re located in the real-world
context, and the consequences of their actions might be serious if something goes wrong. At
the same time, building trust in IoT solutions should be one of your main design drivers.
Make sure that every interaction with your product builds consumer trust rather than breaking
it. In practice, it means that you should understand all the possible error situations that may
be related to the context of its use. Then try to design your product in a way to prevent them.
If error situations occur, make sure that the user is informed appropriately and provided with
help. Also, consider data security and privacy as a key aspect of your implementation. Users
need to feel that their data is safe, and objects located in their workspaces or home can’t be
hacked. That’s why quality assurance and testing the system in the real-world context are so
important.
5. Build with the context in mind
And speaking of context, it pays to remember that IoT solutions are located at the intersection
of the physical and digital world. The commands you give through digital interfaces produce
real-world effects. Unlike digital commands, these actions may not be easily undone. In a
real-world context, many unexpected things may happen. That’s why you need to make sure
that the design of your solution enables users to feel safe and in control at all times. The
context itself is a crucial consideration during IoT design. Depending on the physical context
of your solution, you might have different goals in mind. For example, you might want to
minimize user distraction or design devices that will be resistant to the changing weather
conditions. The social context is an important factor, as well. Don’t forget that the devices
you design for workspaces or homes will be used by multiple users.
6. Make good use of prototypes
IoT solutions are often difficult to upgrade. Once the user places the connected object
somewhere, it might be hard to replace it with a new version – especially if the user would
have to pay for the upgrade. Even the software within the object might be hard to update
because of security and privacy reasons. Make sure that your design practices help to avoid
costly hardware iterations. Get your solution right from the start. From the design
perspective, it means that prototyping and rapid iteration will become critical in the early
stages of the project.
Standards consideration for IoT
Alliances have been formed by many domestic and multinational companies to agree on
common standards and technology for the IoT. However, no universal body has been formed

yet. While organizations such as IEEE, Internet Engineering Task Force (IETF), ITU-T,
OneM2M, 3GPP, etc., are active at international level, Telecommunication Standards
Development Society, India (TSDSI), Global ICT Standardization Forum for India (GISFI),
Bureau of Indian Standards (BIS), Korean Agency for Technology and Standards (KATS),
and so on, are active at national level and European Telecommunications Standards Institute
(ETSI) in the regional level for standardization.

SCHOOL OF COMPUTING
DEPARTMENT OF COMPUTER SCIENCE AND ENGINEERING
UNIT III – Internet of Things – SBS1610

UNIT III
M2M and IoT Technology Fundamentals- Devices and gateways, Local and wide area
networking, Data management, Business processes in IoT, Everything as a Service (XaaS),
M2M and IoT Analytics, Knowledge Management.
M2M and IoT Technology Fundamentals-
Devices and gateways
A device is a hardware unit that can sense aspects of it’s environment and/or actuate, i.e.
perform tasks in its environment.
A device can be characterized as having several properties, including:
• Microcontroller: 8-, 16-, or 32-bit working memory and storage.
• Power Source: Fixed, battery, energy harvesting, or hybrid.
• Sensors and Actuators: Onboard sensors and actuators, or circuitry that allows them to be
connected, sampled, conditioned, and controlled.
• Communication: Cellular, wireless, or wired for LAN and WAN communication.
• Operating System (OS): Main-loop, event-based, real-time, or fullfeatured OS.
• Applications: Simple sensor sampling or more advanced applications.
• User Interface: Display, buttons, or other functions for user interaction.
• Device Management (DM): Provisioning, firmware, bootstrapping, and monitoring.
• Execution Environment (EE): Application lifecycle management and Application
Programming Interface (API).
• For several reasons, one or more of these functions are often hosted on a gateway
instead.
• This can be to save battery power, for example, by letting the gateway handle heavy
functions such as WAN connectivity and application logic that requires a powerful
processor.
• This also leads to reduced costs because these are expensive components.
• Another reason is to reduce complexity by letting a central node (the (the gateway)
handle functionality such as device management and advanced applications, while
letting the devices focus on sensing and actuating.
Device types
There are no clear criteria today for categorizing devices, but instead there is more of a
sliding scale. we group devices into two categories.

• Basic Devices:
✓ Devices that only provide the basic services of sensor readings and/or actuation tasks,
and in some cases limited support for user interaction.
✓ LAN communication is supported via wired or wireless technology, thus a gateway is
needed to provide the WAN connection.
• Advanced Devices:
✓ In this case the devices also host the application logic and a WAN connection.
✓ They may also feature device management and an execution environment for hosting
multiple applications. Gateway devices are most likely to fall into this category.
Deployment scenarios for devices
Deployment can differ for basic and advanced deployment scenarios. Example deployment
scenarios for basic devices include:
• Home Alarms:
✓ Such devices typically include motion detectors, magnetic sensors, and smoke
detectors.
✓ A central unit takes care of the application logic that calls security and sounds an
alarm if a sensor is activated when the alarm is armed.
✓ The central unit also handles the WAN connection towards the alarm central. These
systems are currently often based on proprietary radio protocols.
Smart Meters:
• The meters are installed in the households and measure consumption of, for example,
electricity and gas.

• A concentrator gateway collects data from the meters, performs aggregation, and
periodically transmits the aggregated data to an application server over a cellular
connection.
• By using a capillary network technology e.g. 802.15.4), it’s possible to extend the
range of the concentrator gateway by allowing meters in the periphery to use other
meters as extenders, and interface with handheld devices on the Home Area Network
side.
• Building Automation Systems (BASs): Such devices include thermostats, fans,
motion detectors, and boilers, which are controlled by local facilities, but can also be
remotely operated.
• Standalone Smart Thermostats: These use Wi-Fi to communicate with web
services.
Examples for advanced devices, meanwhile, include:
• Onboard units in cars that perform remote monitoring and configuration over a
cellular connection.
• Robots and autonomous vehicles such as unmanned aerial vehicles that can work
both autonomously or by remote control using a cellular connection.
• Video cameras for remote monitoring over 3G and LTE.
• Oil well monitoring and collection of data points from remote devices.
• Connected printers that can be upgraded and serviced remotely.
• The devices and gateways of today often use legacy technologies such as KNX, Z-
Wave, and ZigBee, but the vision for the future is that every device can have an IP
address and be (in)directly connected to the Internet.
• Some of the examples listed above (e.g. the BAS) require some form of autonomous
mode, where the system operates even without a WAN connection. Also, in these
cases it’s possible to use IoT technologies to form an “Intranet of Things.”
Basic devices
• These devices are often intended for a single purpose, such as measuring air pressure
or closing a valve. In some cases several functions are deployed on the same device,
such as monitoring humidity, temperature, and light level.
• The requirements on hardware are low, both in terms of processing power and
memory.
• The main focus is on keeping the bill of materials (BOM) as low as possible by using
inexpensive microcontrollers with built-in memory and storage, often on an SoC-
integrated circuit with all main components on one single chip (Figure 3.1).
• Another common goal is to enable battery as a power source, with a lifespan of a year
and upwards by using ultra-low energy microcontrollers.
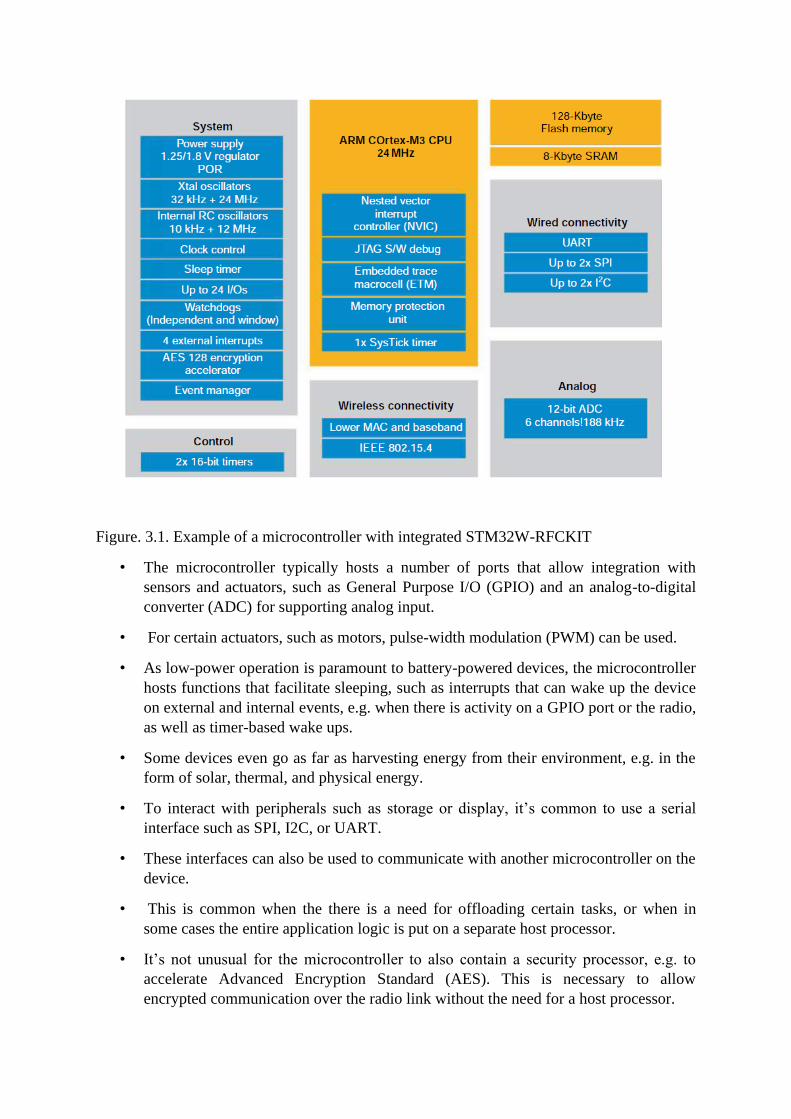
Figure. 3.1. Example of a microcontroller with integrated STM32W-RFCKIT
• The microcontroller typically hosts a number of ports that allow integration with
sensors and actuators, such as General Purpose I/O (GPIO) and an analog-to-digital
converter (ADC) for supporting analog input.
• For certain actuators, such as motors, pulse-width modulation (PWM) can be used.
• As low-power operation is paramount to battery-powered devices, the microcontroller
hosts functions that facilitate sleeping, such as interrupts that can wake up the device
on external and internal events, e.g. when there is activity on a GPIO port or the radio,
as well as timer-based wake ups.
• Some devices even go as far as harvesting energy from their environment, e.g. in the
form of solar, thermal, and physical energy.
• To interact with peripherals such as storage or display, it’s common to use a serial
interface such as SPI, I2C, or UART.
• These interfaces can also be used to communicate with another microcontroller on the
device.
• This is common when the there is a need for offloading certain tasks, or when in
some cases the entire application logic is put on a separate host processor.
• It’s not unusual for the microcontroller to also contain a security processor, e.g. to
accelerate Advanced Encryption Standard (AES). This is necessary to allow
encrypted communication over the radio link without the need for a host processor.

• Because a basic device lacks a WAN interface according to our definition, a gateway
of some form is necessary. The gateway together with the connected devices form a
capillary network.
• The microcontroller contains most of the radio functions needed for communicating
with the gateway and other devices in the same capillary network.
• An external antenna is, however, necessary, and preferably a filter that removes
unwanted frequencies, e.g. a surface acoustic wave (SAW) filter.
• Due to limited computational resources, these devices commonly do not use a typical
OS. It may be something as simple as a single-threaded main-loop or a low-end OS
such as FreeRTOS, Atomthreads, AVIX-RT, ChibiOS/RT, ERIKA Enterprise,
TinyOS, or Thingsquare Mist/Contiki.
• These OSes offer basic functionality, e.g. memory and concurrency model
management, (sensor and radio) drivers, threading, TCP/IP, and higherlevel protocol
stacks.
• A typical task for the application logic is to read values from the sensors and to
provide these over the LAN interface in a semantically correct manner with the
correct units.
• For this class of devices, the constrained hardware and non-standard software limit
third-party development and make development quite costintensive.
Gateways
• A gateway serves as a translator between different protocols, e.g. Between IEEE
802.15.4 or IEEE 802.11, to Ethernet or cellular.
• There are many different types of gateways, which can work on different levels in the
protocol layers. Most often a gateway refers to a device that performs translation of
the physical and link layer, but application layer gateways (ALGs) are also common.
• The latter is preferably avoided because it adds complexity and is a common source of
error in deployments.
• Some examples of ALGs include the ZigBee Gateway Device (ZigBee Alliance
2011), which translates from ZigBee to SOAP and IP, or gateways that translate from
Constrained Application Protocol (CoAP) to HyperText Transfer
Protocol/Representational State Transfer (HTTP/REST).
• For some LAN technologies, such as 802.11 and Z-Wave, the gateway is used for
inclusion and exclusion of devices.
• This typically works by activating the gateway into inclusion or exclusion mode and
by pressing a button on the device to be added or removed from the network. We
cover network technologies in more detail in Section 5.2: Local and wide area
networking.

• For very basic gateways, the hardware is typically focused on simplicity and low cost,
but frequently the gateway device is also used for many other tasks, such as data
management, device management, and local applications.
• In these cases, more powerful hardware with GNU/Linux is commonly used. The
following sections describe these additional tasks in more detail.
Data management
• Typical functions for data management include performing sensor readings and
caching this data, as well as filtering, concentrating, and aggregating the data before
transmitting it to back-end servers.
Local applications
• Examples of local applications that can be hosted on a gateway include closed loops,
home alarm logic, and ventilation control, or the data management function. The
benefit of hosting this logic on the gateway instead of in the network is to avoid
downtime in case of WAN connection failure, minimize usage of costly cellular data,
and reduce latency.
• To facilitate efficient management of applications on the gateway, it’s necessary to
include an execution environment.
• The execution environment is responsible for the lifecycle management of the
applications, including installation, pausing, stopping, configuration, and
uninstallation of the applications.
• The Management Agent can be controlled from, for example, a terminal shell or via a
protocol such as CPE WAN Management Protocol (CWMP).
Device management
• Device management (DM) is an essential part of the IoT and provides efficient means
to perform many of the management tasks for devices:
• Provisioning: Initialization (or activation) of devices in regards to configuration and
features to be enabled.
• Device Configuration: Management of device settings and parameters.
• Software Upgrades: Installation of firmware, system software, and applications on
the device.
• Fault Management: Enables error reporting and access to device status.
• Examples of device management standards include TR-069 and OMA-DM. In the
simplest deployment, the devices communicate directly with the DM server.
• This is, however, not always optimal or even possible due to network or protocol
constraints, e.g. due to a firewall or mismatching protocols.
• In these cases, the gateway functions as mediator between the server and the devices,
and can operate in three different ways:

• If the devices are visible to the DM server, the gateway can simply forward the
messages between the device and the server and is not a visible participant in the
session.
• In case the devices are not visible but understand the DM protocol in use, the gateway
can act as a proxy, essentially acting as a DM server towards the device and a DM
client towards the server.
Advanced devices
• As mentioned earlier, the distinction between basic devices, gateways, and advanced
devices is not cut in stone, but some features that can characterize an advanced device
are the following:
✓ A powerful CPU or microcontroller with enough memory and storage to host
advanced applications, such as a printer offering functions for copying, faxing,
printing, and remote management.
✓ A more advanced user interface with, for example, display and advanced user input
in the form of a keypad or touch screen.
✓ Video or other high bandwidth functions
✓ It’s not unusual for the advanced device to also function as a gateway for local
devices on the same LAN.
✓ By offering a more common and open OS, along with communitystandardized APIs,
software libraries, programming languages, and development tools, the number of
potential developers grows significantly.
Local and wide area networking
The need for networking
• A network is created when two or more computing devices exchange data or
information.
• The ability to exchange pieces of information using telecommunications technologies
has changed the world.
• In modern computing, nodes range from personal computers, servers, and dedicated
packet switching hardware, to smartphones, games consoles, television sets and,
increasingly, heterogeneous devices that are generally characterized by limited
resources and functionalities.
• Limitations typically include computation, energy, memory, communication (range,
bandwidth, reliability, etc.) and application specificity (e.g. specific sensors, actuators,
tasks), etc. Such devices are typically dedicated to specific tasks,such as sensing,
monitoring, and control
• Network links rely upon a physical medium, such as electrical wires, air, and optical
fibers, over which data can be sent from one network node to the next.

• When direct communication between two nodes over a physical medium is not
possible, networking can allow for these devices to communicate over a number of
hops.
• Therefore, if node A wishes to transfer data to node C, it must do so through node B.
Figure. 3.2. Communication between nodes A, B and C
• Beyond the basic ability to transfer data, the speed and accuracy with which data can
be transferred is of critical importance to the application.
• A Local Area Network (LAN) was traditionally distinguishable from a Wide Area
Network (WAN) based on the geographic coverage requirements of the network, and
the need for third party, or leased,c ommunication infrastructure.
• In the case of the LAN, a smaller geographic region is covered, such as a commercial
building, an office block, or a home, and does not require any leased communications
infrastructure.
• WANs provide communication links that cover longer distances, such as across
metropolitan, regional, or by textbook definition, global geographic areas.
• In practice, WANs are often used to link LANs and Metropolitan Area Networks
(MAN)
• Quantitatively, LANs tended to cover distances of tens to hundreds of meters,
whereas WAN links spanned tens to hundreds of kilometers.
• The most popular wired LAN technology is Ethernet. Wi-Fi is the most prevalent
wireless LAN (WLAN) technology.
• The current generation of WWAN technology includes LTE (or 4G) and WiMAX.
• A more intuitive example of a similar device is the wireless access point commonly
found in homes and offices.
• In the home, the “wireless router” typically behaves as a link between the Wi-Fi
(WLAN, and thus connected laptops, tablets, smartphones, etc. commonly found in
the home) and Digital Subscriber Line (DSL) broadband connectivity, traditionally
arriving over telephone lines.
• “DSL” refers to Internet access carried over legacy (wired) telephone networks, and
encompasses numerous standards and variants.
• “Broadband” indicates the ability to carry multiple signals over a number of
frequencies, with a typical minimum bandwidth of 256 kbps.
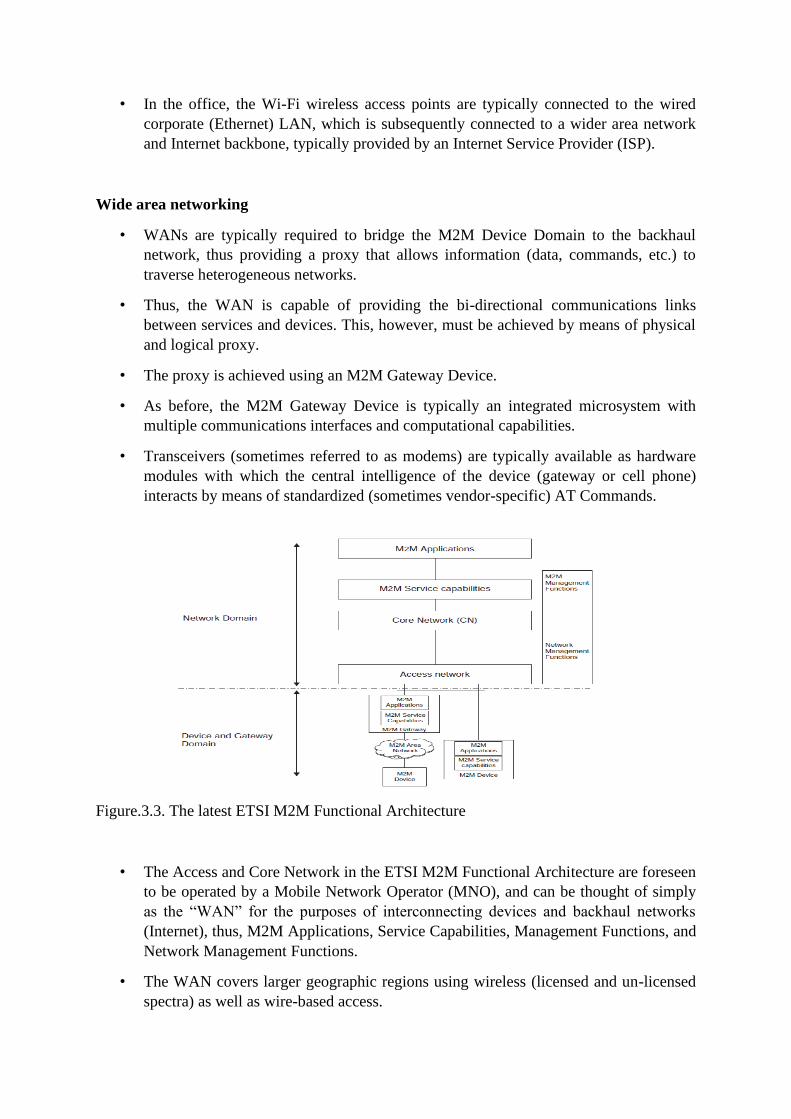
• In the office, the Wi-Fi wireless access points are typically connected to the wired
corporate (Ethernet) LAN, which is subsequently connected to a wider area network
and Internet backbone, typically provided by an Internet Service Provider (ISP).
Wide area networking
• WANs are typically required to bridge the M2M Device Domain to the backhaul
network, thus providing a proxy that allows information (data, commands, etc.) to
traverse heterogeneous networks.
• Thus, the WAN is capable of providing the bi-directional communications links
between services and devices. This, however, must be achieved by means of physical
and logical proxy.
• The proxy is achieved using an M2M Gateway Device.
• As before, the M2M Gateway Device is typically an integrated microsystem with
multiple communications interfaces and computational capabilities.
• Transceivers (sometimes referred to as modems) are typically available as hardware
modules with which the central intelligence of the device (gateway or cell phone)
interacts by means of standardized (sometimes vendor-specific) AT Commands.
Figure.3.3. The latest ETSI M2M Functional Architecture
• The Access and Core Network in the ETSI M2M Functional Architecture are foreseen
to be operated by a Mobile Network Operator (MNO), and can be thought of simply
as the “WAN” for the purposes of interconnecting devices and backhaul networks
(Internet), thus, M2M Applications, Service Capabilities, Management Functions, and
Network Management Functions.
• The WAN covers larger geographic regions using wireless (licensed and un-licensed
spectra) as well as wire-based access.

• WAN technologies include cellular networks (using several generations of
technologies), DSL, WiMAX, Wi-Fi, Ethernet, Satellite, and so forth.
• The WAN delivers a packet-based service using IP as default. However, circuit-based
services can also be used in certain situations.
• In the M2M context, important functions of the WAN include:
• The main function of the WAN is to establish connectivity between capillary
networks, hosting sensors, and actuators, and the M2M service enablement. The
default connectivity mode is packet-based using the IP family of technologies.
• Many different types of messages can be sent and received. These include messages
originating as, for example, a message sent from a sensor in an M2M Area Network
and resulting in an SMS received from the M2M Gateway or Application (e.g. by a
relevant stakeholder with SMS notifications configured for when sensor readings
breach particular sensing thresholds.).
• Use of identity management techniques (primarily of M2M devices)in cellular and
non-cellular domains to grant right-of-use of the WAN resource. The following
techniques are used for these purposes:
• MCIM (Machine Communications Identity Module) for remote provisioning of SIM
targeting M2M devices.
• xSIM (x-Subscription Identity Module), like SIM, USIM, ISIM.
• Interface identifiers, an example of which is the MAC address of the device, typically
stored in hardware.
• Authentication/registration type of functions (device focused).
• Authentication, Authorization, and Accounting (AAA), such as RADIUS services.
• Dynamic Host Configuration Protocol (DHCP), e.g. Employing deployment-specific
configuration parameters specified by device, user, or application-specific parameters
residing in a directory.
• Subscription services (device-focused).
• Directory services, e.g., containing user profiles and various device (s) parameter(s),
setting(s), and combinations thereof. M2M-specific considerations include, in
particular:
• MCIM (cf. 3GPP SA3 work).
• User Data Management (e.g., subscription management).
• Network optimizations (cf. 3GPP SA2 work).
3rd generation partnership project technologies and machine type communications

• Machine Type Communications (MTC) is heavily referred to in the ETSI
documentation. MTC, however, lacks a firm definition, and is explained using a series
of use cases.
• Generally speaking, MTC refers to small amounts of data that are communicated
between machines (devices to back-end services and vice versa) without the need for
any human intervention.
• In the 3rd Generation Partnership Project (3GPP), MTC is used to refer to all M2M
communication (Jain et al. 2012). Thus, they are interchangeable terms.
Local area networking
Figure.3.4. Capillary networks and their inside view
• Capillary networks are typically autonomous, self-contained systems of M2M devices
that may be connected to the cloud via an appropriate Gateway.
• They are often deployed in controlled environments such as vehicles, buildings,
apartments, factories, bodies, etc. in order to collect sensor measurements, generate
events should sensing thresholds be breached, and sometimes control specific features
of interest (e.g. Heart rate of a patient, environmental data on a factory floor, car
speed, air conditioning appliances, etc.).
• There will exist numerous capillary networks that will employ short-range wired and
wireless communication and networking technologies.
• For certain application areas, there is a need for autonomous local operation of the
capillary network. That is, not everything needs to be sent to, or potentially be
controlled via, the cloud.

• In the event that application-level logic is enforceable via the cloud, some will still
need to be managed locally.
• The complexity of the local application logic varies by application. For example, a
building automation network may need local control loop functionality for
autonomous operation, but can rely on external communication for configuration of
control schemas and parameters.
• The M2M devices in a capillary network are typically thought to be low-capability
nodes (e.g. battery operated, with limited security capabilities) for cost reasons, and
should operate autonomously.
• IPv6 will be the protocol of choice for M2M devices that operate a 6LoWPAN-based
stack. IPv4 will still be used for capillary networks operating in non-6LoWPAN IP
stacks (e.g. Wi-Fi capillary networks).
Deployment considerations
• There are increasing numbers of innovative IoT applications (hardware and software)
marketed as consumer products. These range from intelligent thermostats for
effectively managing comfort and energy use in the home, to precision gardening
tools (sampling weather conditions, soil moisture, etc.).
• Scaling up for industrial applications and moving from laboratories into the real world
creates significant challenges that are not yet fully understood.Low-rate, low-power
communications technologies are known to be “lossy.” The reasons for this are
numerous.
• Numerous deployment environments (factories, buildings, roads, vehicles) are
expected in addition to wildly varying application scenarios and operational and
functional requirements of the systems.
• ETSI describes a set of use cases, namely eHealth, Connected Consumer,
Automotive, Smart Grid, and Smart Meter, that only capture some of the breadth of
potential deployment scenarios and environments that are possible.
Key technologies
• Power Line Communication (PLC) refers to communicating over power (or phone,
coax, etc.) lines. This amounts to pulsing, with various degrees of power and
frequency, the electrical lines used for power distribution.
• PLC comes in numerous flavors. At low frequencies (tens to hundreds of Hertz) it is
possible to communicate over kilometers with low bit rates (hundreds of bits per
second).
• Typically, this type of communication was used for remote metering, and was seen as
potentially useful for the smart grid.
• Enhancements to allow higher bit rates have led to the possibility of delivering
broadband connectivity over power lines.

• LAN (and WLAN) continues to be important technology for M2M and IoT
applications. This is due to the high bandwidth, reliability, and legacy of the
technologies. Where power is not a limiting factor, and high bandwidth is required,
devices may connect seamlessly to the Internet via Ethernet (IEEE 802.3) or Wi-Fi
(IEEE 802.11).
• The IEEE 802.11 (Wi-Fi) standards continue to evolve in various directions to
improve certain operational characteristics depending on usage scenario.
• A widely adopted recent release was IEEE 802.11n, which was specifically designed
to enhance throughput (typically useful for streaming multimedia).
• Ongoing work such as IEEE 802.11ac is developing an even higher throughput
version to replace this, focusing efforts in the 5 GHz band.
• IEEE 802.11ah is working on an evolution of the 2007 standard that will allow a
number of networked devices to cooperate in the ,1 GHz (ISM) band.
• The idea is to exploit collaboration (relaying, or networking in other words) to extend
range, and improve energy efficiency (by cycling the active periods of the radio
transceiver).
• The standard aims to facilitate the rapid development of IoT and M2M applications
that could exploit burst-like transmissions, such as in metering applications.
• Bluetooth Low Energy (BLE; “Bluetooth Smart”) is a recent (2010) integration of
Nokia’s Wibree (2006) standard with the main Bluetooth standard (originally
developed and maintained as IEEE 802.15.1 and Bluetooth SIG).
• It is designed for short-range (,50 m) applications in healthcare, fitness, security, etc.,
where high data rates (millions of bits per second) are required to enable application
functionality.
• It is deliberately low cost and energy efficient by design, and has been integrated into
the majority of recent smartphones.
• With IPv6 Networking, attention is paid to the ongoing work to facilitate the use of
IP to enable interoperability irrespective of the physical and link layers (i.e. making
the fact that devices are networked, with or without wires, with various capabilities in
terms of range and bandwidth, essentially seamless).
• 6LoWPAN (IPv6 Over Low Power Wireless Personal Area Networks) was
developed initially by the 6LoWPAN Working Group (WG) of the IETF as a
mechanism to transport IPv6 over IEEE 802.15.4-2003 networks.
• RPL (IPv6 Routing Protocol for Low Power and Lossy Networks) was developed by
the IETF Routing over Low Power and Lossy Networks (RoLL) WG. They defined
Low Power Lossy Networks as those typically characterized by high data loss rates,
low data rates, and general instability.
• CoAP (Constrained Application Protocol) is being developed by the IETF
Constrained RESTful Environments (CoRE) WG as a specialized web transfer

protocol for use with severe computational and communication constraints typically
characteristic of M2M and IoT applications.
Data management
Some of the key characteristics of M2M data include:
• Big Data: Huge amounts of data are generated, capturing detailed aspects of the processes
where devices are involved.
• Heterogeneous Data: The data is produced by a huge variety of devices and is itself highly
heterogeneous, differing on sampling rate, quality of captured values, etc.
• Real-World Data: The overwhelming majority of the M2M data relates to real-world
processes and is dependent on the environment they interact with.
• Real-Time Data: M2M data is generated in real-time and overwhelmingly can be
communicated also in a very timely manner. The latter is of pivotal importance since
many times their business value depends on the real-time processing of the info they
convey.
• Temporal Data: The overwhelming majority of M2M data is of temporal nature,
measuring the environment over time.
• Spatial Data: Increasingly, the data generated by M2M interactions are not only
captured by mobile devices, but also coupled to interactions in specific locations, and
their assessment may dynamically vary depending on the location.
• Polymorphic Data: The data acquired and used by M2M processes may be complex
and involve various data, which can also obtain different meanings depending on the
semantics applied and the process they participate in.
• Proprietary Data: Up to now, due to monolithic application development, a
significant amount of M2M data is stored and captured in proprietary formats.
However, increasingly due to the interactions with heterogeneous devices and
stakeholders, open approaches for data storage and exchange are used.
• Security and Privacy Data Aspects: Due to the detailed capturing of interactions by
M2M, analysis of the obtained data has a high risk of leaking private information and
usage patterns, as well as compromising security.
Managing M2M data
• We see a number of data processing network points between the machine and the
enterprise that act on the datastream (or simply forwarding it) based on their end-
application needs and existing context.

Figure.3.5. M2M data from point of generation to business assessment.
Data generation
• Data generation is the first stage within which data is generated actively or passively
from the device, system, or as a result of its interactions. The sampling of data
generation depends on the device and its capabilities as well as potentially the
application needs.
• Not all data acquired may actually be communicated as some of them may be
assessed locally and subsequently disregarded, while only the result of the assessment
may be communicated.
• Data acquisition deals with the collection of data (actively or passively) from the
device, system, or as a result of its interactions. The data acquisition systems usually
communicate with distributed devices over wired or wireless links to acquire the
needed data, and need to respect security, protocol, and application requirements.
• The nature of acquisition varies, e.g. it could be continuous monitoring, interval-poll,
event-based, etc. The frequency of data acquisition overwhelmingly depends on, or is
customized by, the application requirements (or their common denominator).

Data validation
• Data acquired must be checked for correctness and meaningfulness within the specific
operating context. The latter is usually done based on rules, semantic annotations, or
other logic.
• Data validation in the era of M2M, where the acquired data may not conform to
expectations, is a must as data may be intentionally or unintentionally corrupted
during transmission, altered, or not make sense in the business context.
• As real-world processes depend on valid data to draw business-relevant decisions, this
is a key stage, which sometimes does not receive as much attention as it should.
• Several known methods are deployed for consistency and data type checking; for
example, imposed range limits on the values acquired, logic checks, uniqueness,
correct time-stamping, etc.
• In addition, semantics may play an increasing role here, as the same data may have
different meanings in various operating contexts, and via semantics one can benefit
while attempting to validate them.
• Another part of the validation may deal with fallback actions such as requesting the
data again if checks fail, or attempts to “repair” partially failed data.
• Failure to validate may result in security breaches. Tampered-with data fed to an
application is a well known security risk as its effects may lead to attacks on other
services, privilege escalation, denial of service, database corruption, etc., as we have
witnessed on the Internet over the last decades.
• As full utilization of this step may require significant computational resources, it may
be adequately tackled at the network level (e.g. in the cloud), but may be challenging
in direct M2M interactions, e.g. between two resourceconstrained machines
communicating directly with each other.
Data storage
• The data generated by M2M interactions is what is commonly referred to as “Big
Data.” Machines generate an incredible amount of information that is captured and
needs to be stored for further processing.
• As this is proving challenging due to the size of information, a balance between its
business usage vs. storage needs to be considered; that is, only the fraction of the data
relevant to a business need may be stored for future reference.
• Due to the massive amounts of M2M data, as well as their envisioned processing (e.g.
searching), specialized technologies such as massively parallel processing DBs,
distributed file systems, cloud computing platforms, etc. are needed.

Data processing
• Data processing enables working with the data that is either at rest (already stored) or
is in-motion (e.g. stream data). The scope of this processing is to operate on the data
at a low level and “enhance” them for future needs.
• Typical examples include data adjustment during which it might be necessary to
normalize data, introduce an estimate for a value that is missing, re-order incoming
data by adjusting timestamps, etc.
• Similarly, aggregation of data or general calculation functions may be operated on
two or more data streams and mathematical functions applied on their composition.
• Another example is the transformation of incoming data; for example, a stream can be
converted on the fly (e.g. temperature values are converted from F to C), or
repackaged in another data model, etc.
• Missing or invalid data that is needed for the specific time-slot may be forecasted and
used until, in a future interaction, the actual data comes into the system.
Data remanence
• Even if the data is erased or removed, residues may still remain in electronic media,
and may be easily recovered by third parties often referred to as data remanence.
• Several techniques have been developed to deal with this, such as overwriting,
degaussing, encryption, and physical destruction.
• For M2M, points of interest are not only the DBs where the M2M data is collected,
but also the points of action, which generate the data, or the individual nodes in
between, which may cache it.
• At the current technology pace, those buffers (e.g. on device) are expected to be less
at risk since their limited size means that after a specific time has elapsed, new data
will occupy that space; hence, the window of opportunity is rather small.
• In addition, for large-scale infrastructures the cost of potentially acquiring “deleted”
data may be large; hence, their hubs or collection end-points, such as the DBs who
have such low cost, may be more at risk.
• In light of the lack of crossindustry M2M policy-driven data management, it also
might be difficult to not only control how the M2M data is used, but also to revoke
access to it and “delete” them from the Internet once shared.
Data analysis
• Data available in the repositories can be subjected to analysis with the aim to obtain
the information they encapsulate and use it for supporting decision-making processes.
• The analysis of data at this stage heavily depends on the domain and the context of the
data. For instance, business intelligence tools process the data with a focus on the
aggregation and key performance indicator assessment.

• Data mining focuses on discovering knowledge, usually in conjunction with
predictive goals.
• Statistics can also be used on the data to assess them quantitatively (descriptive
statistics), find their main characteristics (exploratory data analysis), confirm a
specific hypothesis (confirmatory data analysis), discover knowledge (data mining),
and for machine learning, etc.
Business processes in IoT
• A business process refers to a series of activities, often a collection of interrelated
processes in a logical sequence, within an enterprise, leading to a specific result.
• There are several types of business processes such as management, operational, and
supporting, all of which aim at achieving a specific mission objective.
• Managers and business analysis model an enterprise’s processes in an effort to depict
the real way an enterprise operates and subsequently to improve efficiency and
quality.
Figure.3.6. The decreasing cost of information exchange between the real-world and
enterprise systems with the advancement of M2M
• As depicted in Figure we have witnessed a paradigm change with the dramatic
reduction of the data acquisition from the real world; this was attributed mostly to the
automation offered by machines embedded in the real world.
• Initially all these interactions were human-based (e.g. via a keyboard) or human-
assisted (e.g. via a barcode scanner); however, with the prevalence of RFID, WSNs,
and advanced networked embedded devices, all information exchange between the
real-world and enterprise systems can be done automatically without any human
intervention and at blazing speeds.
• In the M2M era, connected devices can be clearly identified, and with the help of
services, this integration leads to active participation of the devices to the business
processes.

• This direct integration is changing the way business processes are modeled and
executed today as new requirements come into play.
• Existing modeling tools are hardly designed to specify aspects of the real world in
modeling environments and capture their full characteristics.
• To this direction, the existence of SOA-ready devices (i.e. devices that offer their
functionalities as a web service) simplifies the integration and interaction as they can
be considered as a traditional web service that runs on a specific device.
• M2M and IoT empower business processes to acquire very detailed data about the
operations, and be informed about the conditions in the real world in a very timely
manner.
IoT integration with enterprise systems
• M2M communication and the vision of the IoT pose a new era where billions of
devices will need to interact with each other and exchange information in order to
fulfill their purpose.
• Much of this communication is expected to happen over Internet technologies
(Vasseur and Dunkels 2010) and tap into the extensive experience acquired with
architectures and experiences in the Internet/Web over the last several decades.
Figure.3.7. A collaborative infrastructure driven by M2M and M2B
• As shown in Figure, cross-layer interaction and cooperation can be pursued:
✓ at the M2M level, where the machines cooperate with each other (machine-focused
interactions), as well as
✓ at the machine-to-business (M2B) layer, where machines cooperate also with
network-based services, business systems (business service focus), and applications.

• As depicted in Figure, we can see several devices in the lowest layer. These can
communicate with each other over short-range protocols (e.g. over ZigBee,
Bluetooth), or even longer distances (e.g. over Wi-Fi, etc.).
• Some of them may host services (e.g. REST services), and even have dynamic
discovery capabilities based on the communication protocol or other capabilities (e.g.
WS-Eventing in DPWS).
• Some of them may be very resource constrained, which means that auxiliary
gateways could provide additional support such as mediation of communication,
protocol translation, etc.
• Independent of whether the devices are able to discover and interact with other
devices and systems directly or via the support of the infrastructure, the M2M
interactions enable them to empower several applications and interact with each other
in order to fulfill their goals.
• Many of the services that will interact with the devices are expected to be network
services available, for example, in the cloud.
Figure.3.8. The Cloud of Things as an enabler for new value-added services &
apps.
• A key motivator is the minimization of communication overhead with multiple
endpoints by, for example, transmission of data to a single or limited number of points
in the network, and letting the cloud do the loadbalancing and further mediation of
communication.

• For instance, as depicted in the figure above, a Content Delivery Network (CDN) can
be used in order to get access to the generated data from locations that are far away
from the M2M infrastructure (geographically, network-wise, etc.).
• To this end, the data acquired by the device can be offered without overconsumption
of the device’s resources, while in parallel, better control and management can be
applied.
• Distributed business processes in IoT
• Today, as seen on the left part of Figure, the integration of devices in business
processes merely implies the acquisition of data from the device layer, its
transportation to the backend systems, its assessment, and once a decision is made,
potentially the control (management) of the device, which adjusts its behavior.
• However, in the future, due to the large scale of IoT, as well as the huge data that it
will generate, such approaches are not viable.
Figure.3.9. Distributed Business Processes in M2M era.
• Transportation of data from the “point of action” where the device collects or
generates them, all the way to the backend system to then evaluate their usefulness,
will not be practical for communication reasons, as well as due to the processing load
that it will incur at the enterprise side; this is something that the current systems were
not designed for. Enterprise systems trying to process such a high rate of non- or
minor-relevancy data will be overloaded.

• As such, the first strategic step is to minimize communication with enterprise systems
to only what is relevant for business. With the increase in resources (e.g.
computational capabilities) in the network, and especially on the devices themselves
(more memory, multi-core CPUs, etc.), it makes sense not to host the intelligence and
the computation required for it only on the enterprise side, but actually distribute it on
the network, and even on the edge nodes (i.e. the devices themselves), as depicted on
the right side of Figure
• Partially outsourcing functionality traditionally residing in backend systems to the
network itself and the edge nodes means we can realize distributed business processes
whose sub-processes may execute outside the enterprise system.
• As devices are capable of computing, they can either realize the task of processing
and evaluating business relevant information they generate by themselves or in
clusters.
• Distributing the computational load in the layers between enterprises and the real-
world infrastructure is not the only reason; distributing business intelligence is also a
significant motivation.
• Business processes can bind during execution of dynamic resources that they discover
locally, and integrate them to better achieve their goals.
• Being in the world of service mash-ups, we will witness a paradigm change not only
in the way individual devices, but also how clusters of them, interact with each other
and with enterprise systems.
• we care about what is provided but not how, as depicted in Figure As such, we can
now model distributed business processes that execute on enterprise systems, in-
network, and on-device.
• The vision (Spiess et al. 2009) is to additionally consider during runtime the
requirements and costs associated with the execution in order to select the best of
available instances and optimize the business process in total according to the
enterprise needs, e.g. for low impact on a device’s energy source, or for highspeed
communication, etc.

Figure.3.10. On-Device and in-network Business Process Composition and runtime
execution.
Everything as a service (XaaS)
• There is a general trend away from locally managing dedicated hardware toward
cloud infrastructures that drives down the overall cost for computational capacity and
storage. This is commonly referred to as “cloud computing.”
• Cloud computing is a model for enabling ubiquitous, on-demand network access to a
shared pool of configurable computing resources (e.g. networks, servers, storage,
applications, and services) that can be provisioned, configured, and made available
with minimal management effort or service provider interaction.
• Cloud computing, however, does not change the fundamentals of software
engineering. All applications need access to three things: compute, storage, and data
processing capacities. With cloud computing, a fourth element is added distribution
services i.e. the manner in which the data and computational capacity are linked
together and coordinated.

Figure.3.11. Conceptual Overview of Cloud Computing.
• Several essential characteristics of cloud computing have been defined by NIST
(2011) as follows:
• On-Demand Self-Service. A consumer can unilaterally provision computing
capabilities, such as server time and network storage, as needed, or automatically,
without requiring human interaction with each service provider.
• Broad Network Access. Capabilities are available over the network and accessed
through standard mechanisms that promote use by heterogeneous thin or thick client
platforms (e.g. mobile phones, tablets, laptops, and workstations).
• Resource Pooling.
• The provider’s computing resources are pooled to serve multiple consumers using a
multi-tenant model, with different physical and virtual resources dynamically
assigned and reassigned according to consumer demand.
• There is a sense of location independence in that the customer generally has no
control or knowledge over the exact location of the provided resources, but may be
able to specify location at a higher level of abstraction (e.g. country, state, or
datacenter). Examples of resources include storage, processing, memory, and network
bandwidth.
• Rapid Elasticity. Capabilities can be elastically provisioned and released, in some
cases automatically, to scale rapidly outward and inward commensurate with demand.
To the consumer, the capabilities available for provisioning often appear to be
unlimited, and can be appropriated in any quantity at any time.
• Measured Service. Cloud systems automatically control and optimize resource use
by leveraging a metering capability, at some level of abstraction, appropriate to the
type of service (e.g. storage, processing, bandwidth, and active user accounts).
Resource usage can be monitored, controlled, and reported, providing transparency
for both the provider and consumer of the utilized service.

• Cloud computing comes in several different service models and deployment options
for enterprises wishing to use it. The three main servicemodels may be defined as
(NIST 2011):
✓ Software as a Service (SaaS): Refers to software that is provided to consumers on
demand, typically via a thin client. The end-users do not manage the cloud
infrastructure in any way. This is handled by an Application Service Provider (ASP)
or Independent Software Vendor (ISV). Examples include office and messaging
software, email, or CRM tools housed in the cloud. The end-user has limited ability to
change anything beyond user-specific application configuration settings.
✓ Platform as a Service (PaaS): Refers to cloud solutions that provide both a
computing platform and a solution stack as a service via the Internet. The customers
themselves develop the necessary software using tools provided by the provider, who
also provides the networks, the storage, and the other distribution services required.
Again, the provider manages the underlying cloud infrastructure, while the customer
has control over the deployed applications and possible settings for the application-
hosting environment (NIST 2011).
✓ Infrastructure as a Service (IaaS): In this model, the provider offers virtual
machines and other resources such as hypervisors (e.g. Xen, KVM) to customers.
Pools of hypervisors support the virtual machines and allow users to scale resource
usage up and down in accordance with their computational requirements. Users install
an OS image and application software on the cloud infrastructure. The provider
manages the underlying cloud infrastructure, while the customer has control over OS,
storage, deployed applications, and possibly some networking components.
Deployment Models:
✓ Private Cloud. The cloud infrastructure is provisioned for exclusive use by a single
organization comprising multiple consumers (e.g.business units). It may be owned,
managed, and operated by the organization, a third party, or some combination of
them, and it may exist on or off premises.
✓ Community Cloud. The cloud infrastructure is provisioned for exclusive use by a
specific community of consumers from organizations that have shared concerns (e.g.
mission, security requirements, policy, and compliance considerations). It may be
owned, managed, and operated by one or more of the organizations in the community,
a third party, or some combination of them, and it may exist on or off premises.
✓ Public Cloud. The cloud infrastructure is provisioned for open use by the general
public. It may be owned, managed, and operated by a business, academic, or
government organization, or some combination thereof. It exists on the premises of
the cloud provider.
✓ Hybrid Cloud. The cloud infrastructure is a composition of two or more distinct
cloud infrastructures (private, community, or public) that remain unique entities, but
are bound together by standardized or proprietary technology that enables data and
application portability (e.g. cloud bursting for load balancing between clouds).
M2M and IoT analytics

✓ M2M data for advanced analytics and business intelligence are very promising. By
transforming raw data into actionable intelligence, it’s possible to improve many
areas, such as enhancement of existing products, cost-savings, service quality, as well
as operational efficiency.
✓ By applying technologies from the Big Data domain, it is possible to store more data,
such as contextual and situational information, and given a more open approach to
data, such as the open-data government initiatives (e.g. Data.gov and Data.gov.uk),
even more understanding can be derived, which can be used to improve everything
from Demand/Response in a power grid to wastewater treatment in a city
✓ Descriptive statistics can take you a long way from raw data to actionable
intelligence. Other opportunities are provided by data mining and machine learning,
with no clear distinction between the three, although data mining can be described as
the automatic or semiautomatic task of extracting previously unknown information
from a large quantity of data, while machine learning is focused on finding models for
specific tasks, e.g. separate spam from non-spam email.
✓ Big Data technologies such as MapReduce for massively parallel analytics, as well as
analytics on online streaming data where the individual data item is not necessarily
stored, will play an important role in the management and analysis of large-scale
M2M data.
✓ Apart from the software and services provided for analytics, a major uptake in
professional services for consultancy within M2M analytics is expected (Figure).
Figure.3.12. M2M Analytics Revenues by Segment, World Market, Forecast: 2012 to 2018.
• The revenues within M2M analytics are expected to grow rapidly for most industry
verticals (Figure).

Figure.3.13. M2M Analytics Revenues by Industry, Vertical World Market, Forecast: 2012 to
2018.
Purposes and considerations
• Regardless of whether you call it statistics, data mining, or machine learning, there
exist a multitude of methods to extract different types of information from data.
• The information can be used in everything from static reports to interactive decision
support systems, or even fully automated real-time systems.
• Some examples of methods and purposes are as follows:
✓ Descriptive Analytics: Use of means, variances, maxima, minima, aggregates, and
frequencies, optionally grouped by selected characteristics.
Create Key Performance Indicators (KPI’s) that enable better understanding of the
performance of complex systems such as cellular networks or oil pipelines.
✓ Predictive Analytics: Use current and historical facts to predict what will happen
next.
❑ Forecast demand and supply in a power grid and train a model to predict how price
affects electric usage to optimize the performance and minimize peaks in the
electricity consumption.
❑ Predictive maintenance on electromechanical equipment in a nuclear power plant by
modeling the relationship between device health characteristics measured by sensors
and historic failures.

✓ Understand how electricity and water consumption relates to regional demographics.
✓ Model the effects of traffic lights on a city’s road network based on data from cars
and sensors in the city to minimize congestion.
• Clustering: Identification of groups with similar characteristics.
✓ Perform customer segmentation or find behavioral patterns in a large set of M2M
devices.
✓ Mine time series data for recurring patterns that can be used in predictive analytics to
detect, for example, fraud, machine failures, or traffic accidents.
• Anomaly Detection:
✓ Detect fraud for smart meters by checking for anomalous electricity consumption
compared to similar customers, or historic consumption for the subscriber.
• M2M data fulfills all the characteristics of Big Data, which is usually described by the
four “Vs”:
✓ Volume: To be able to create good analytical models it’s no longer enough to analyze
the data once and then discard it. Creating a valid model often requires a longer period
of historic data. This means that the amount of historic data for M2M devices is
expected to grow rapidly.
✓ Velocity: Even though M2M devices usually report quite seldom, the sheer number of
devices means that the systems will have to handle a huge number of transactions per
second. Also, often the value of M2Mdata is strongly related to how fresh it is to be
able provide the best actionable intelligence, which puts requirements on the
analytical platform.
✓ Variation: Given the multitude of device types used in M2M, it’s apparent that the
variation will be very high. This is further complicated by the use of different data
formats as well as different configurations for devices of the same type (e.g. where
one device measures temperature in Celsius every minute, another device measures it
in Fahrenheit every hour). The upside is that the data is expected to be semantically
well-defined, which allows for simple transformation rules.
✓ Veracity: It’s imperative that we can trust the data that is analyzed. There are many
pitfalls along the way, such as erroneous timestamps, non-adherence to standards,
proprietary formats with missing semantics, wrongly calibrated sensors, as well as
missing data. This requires rules that can handle these cases, as well as fault-tolerant
algorithms that, for example, can detect outliers (anomalies).

Figure.3.14. Analytics Architectural Overview
• An architecture for analytics needs to take a few basic requirements into account
(Figure). One of these is to serve as a platform for data exploration and modeling by
data scientists and other advanced information consumers performing business
analytics and intelligence.
• As much time is spent on data preparation before any analytics can take place, this is
also an integral part of the architecture to facilitate.
• Finally, efficient means of building and viewing reports, as well as integrating with
back-end systems and business processes, is of importance. These requirements
concern batch analytics, but should also be considered for stream analytics.
• Note that an analytics architecture is not intended for general-purpose data storage,
although sometimes it’s efficient to co-locate these two functions into one
architecture.
• Risks of affecting production must, however, be taken into consideration if this is
done instead of importing the data into an analytics sandbox where analysts can work
on the data independently.
• Another benefit with an analytics sandbox is also that this environment offers a full
suite of analytical tools that normally cannot be found in a traditional database.
• It also offers a development platform with the necessary computing resources
required to perform complex analytics on very big data sets.
• A sandbox for Big Data analytics can be realized in a number of ways, of which the
Hadoop ecosystem is probably the best known.
• Other alternatives include:

✓ Columnar databases such as HP Vertica, Actian ParAccel MPP, SAP Sybase IQ, and
Infobright.
✓ Massively Parallel Processing (MPP) architectures such as Pivotal Greenplum and
Teradata Aster.
✓ In-memory databases such as SAP Hana and QlikView.
✓ All of the above focus on batch-oriented analytics, where all data is available for the
model generation. A complimentary method is to perform analytics on the live data
streams (i.e. stream analytics), which means that the data does not need to be stored
after it has been processed.
✓ This in turn limits the available algorithms to those that can handle incremental model
building.
✓ The most common technologies in this segment are Event Stream Processing (e.g.
Twitter Storm and Apache S4) and Complex Event Processing (e.g. EsperTech Esper
and SAP Sybase Event Stream Processor).
• An analytical architecture should preferably also provide:
✓ Authentication and authorization to access data.
✓ Failover and redundancy features.
✓ Management facilities.
✓ Efficient batch loading of data and support self-service.
✓ Scheduling of batch jobs, such as data import and model training.
✓ Connectors to import data from external sources.
✓ The core of Hadoop is the MapReduce programming model, which allows processing
of large data sets by deploying an algorithm, written as a program, onto a cluster of
nodes.
✓ A MapReduce job reads data from the Hadoop File System (HDFS), and runs on the
same nodes as the deployed algorithm. This allows the Hadoop framework to utilize
data locality as much as possible to avoid unnecessary transfer of data between the
nodes.
✓ MapReduce is batch-oriented and intended for very large jobs that typically take an
hour or more to execute.
✓ The nodes and services in a Hadoop cluster are coordinated by ZooKeeper, which
serves as a central naming and configuration service.
✓ Although it’s not unusual for developers to use MapReduce directly, there exist a
number of technologies that provide further abstraction levels, such as:
✓ HBase: A column-oriented data store that provides real-time read/write access to very
large tables distributed over HDFS.

✓ Mahout: A distributed and scalable library of machine learning algorithms that can
make use of MapReduce.
✓ Pig: A tool for converting relational algebra scripts into MapReduce jobs that can
read data from HDFS and HBase.
✓ Hive: Similar to Pig, but offers an SQL-like scripting language called HiveQL
instead.
✓ Impala: Offers low-latency queries using HiveQL for interactive exploratory
analytics, as compared to Hive, which is better suited for long running batch-oriented
tasks.
Methodology
• Knowledge discovery and analytics can be described as a project methodology,
following certain steps in a process model.
• There exist several process models that include some or all parts of the steps
mentioned above, such as the Knowledge Discovery in Databases (KDD) process, or
the industrial standards Sample, Explore, Modify, Model and Assess (SEMMA), and
Cross Industry Standard Process for Data Mining (CRISP-DM) (Table 5.2). The most
commonly used process model of these is CRISP-DM (Kdnuggets 2007).
• The phases in the CRISP-DM process model are described in Figure, which is
followed by descriptions of each of the phases.

Figure.3.15. CRISP-DM Process Diagram
Business understanding
• The first phase in the process is to understand the business objectives and
requirements, as well as success criteria. This forms the basis for formulating the
goals and plan for the data mining process.
• Many organizations may have a feeling that they are sitting on valuable data, but are
unsure how to capitalize on this. In these cases, it’s not unusual to bring in the help of
an analytics team to identify potential business cases that can benefit from the data.
Predictive maintenance example
• It has been decided to start a project with the main objective to study ways to reduce
the frequency of costly unplanned emergency repair work and downtime in pumping
stations by predicting future pump failures or necessary maintenance work in good
time to allow for organized maintenance to take place
• The project will be determined a success if the study evaluation shows that:
✓ Pump station downtime is reduced by 10%.
✓ Maintenance costs for pump stations is reduced by 15%.
✓ The project is concluded within time and kept on budget.
• These business requirements are translated into more practical data mining goals, such
as evaluating two different approaches to predicting maintenance actions:
✓ Action Forecasting: Train a model that can predict needed maintenance actions
based on vibrations and other pump characteristics. Apply forecasting methods on the
vibration measurement sensors to predict future maintenance actions.

✓ Similar Case Recommendations: Use information about pumps, such as
manufacturer, model, and age, as well as information about working conditions, such
as workload, water corrosiveness, and percentage of sand and grit, to define groups of
similar pumps. Use data from prior pump failures of similar pumps, as well as prior
maintenance decisions, to recommend actions to take.
Data understanding
• The next phase consists of collecting data and gaining an understanding of the data
properties, such as amount of data and quality in terms of inconsistencies,missing
data, and measurement errors.
• The tasks in this phase also include gaining some understanding of actionable
insights contained in the data, as well as to form some basic hypotheses.
• Predictive maintenance example
• Several operations are performed to prepare the data, and three data sets are
constructed:
• Vibration Time Series
• Time series data for the pump vibrations are at the core of the analytical work.
Missing values are estimated and imputed to create complete time series
representations. The measurement values are adjusted to account for incorrectly
calibrated sensors.
• Workload Time Series
• Pump RPM measurements are used to construct a new time series with attributes that
describe the pump workload at a given date e.g. average daily workload, standard
deviation of the workload, maximal daily workload, and workload trend.
• Pump Records
• Information needed for grouping similar pumps is included and joined with the newly
created workload data.
• Action Records
• Trouble reports and work orders are joined to create one action record for each
maintenance task. Some of the data is excluded and transformed to create new
attributes that indicate what kind of action was performed, e.g. bearing replacement,
oil lubrication, or motor replacement.
• The action records are merged with the pump records, as they were at the time the
action was performed.
Modeling
• At the modeling phase, it’s finally time to use the data to gain an understanding of the
actual business problems that were stated in the beginning of the project.

• Various modeling techniques are usually applied and evaluated before selecting which
ones are best suited for the particular problem at hand.
• As some modeling techniques require data in a specific form, it’s quite common to go
back to the data preparation phase at this stage. This is an example of the iterativeness
of CRISP-DM and analytics in general.
• After evaluating a number of models, it’s time to select a set of candidate models to
be methodically assessed. The assessment should estimate the effectiveness of the
results in terms of accuracy, as well as ease of use in terms of interpretation of the
results.
• If the assessment shows that we have found models that meet the necessary criteria,
it’s time for a more thorough evaluation, otherwise the work on finding suitable
models has to continue.
Predictive maintenance example
• Action Prediction Model: The action records are used to create a classification
model that can predict what actions to take given a certain set of input data, e.g. the
pump is vibrating strongly, the water is corrosive, it has been 14 months since it was
serviced, and given prior cases, replacing the bearing and lubricating the pump with
oil are likely to be the best actions.
• A decision tree-based model is selected since the data is highly heterogeneous and
contains many categorical values. An assessment shows that the best performing
model is based on the Random Forests method.
Forecasting Model:
• To be able to predict future failures and needed maintenance in advance, a forecasting
model is applied to the historic vibration sensor measurements.
• Two models, one based on the ARIMA (Autoregressive Integrated Moving Average)
method, and the other on the ETS (ErrorTrendSeasonal) method performs well, and
after assessment, the ETS-based model is selected.
Similar Pump Model:
• To create a model that can be used to determine similarity between pumps, there
exists a number of similarity and clustering techniques, such as k-nearest-neighbor
and k-means. After some reasoning, it is decided to use a k-means-based model.
• These models require the number of clusters to be set as a parameter, and to determine
the most appropriate number of clusters a decision tree is trained to classify which
cluster a pump should belong to. The benefit of this is that trained pump maintenance
experts are able to inspect the decision trees to determine which number of clusters
produces the most realistic decision tree.
Evaluation
• Several variations of the models, with slightly different parameter settings, are
evaluated and studied. Especially the action prediction model is analyzed to find

which version recommends the most correct actions compared to what the experts
would recommend.
The two different approaches are evaluated:
• Action Forecasting: This approach proved to provide stable results that are easily
interpreted by both humans and machines. A discussion was undertaken as to whether this
could be used to automatically create work orders if the forecast was within certain bounds of
confidence.
• Similar Pump Recommendations: This approach was much appreciated since it provided
the staff with empirical data about how pumps under similar conditions have evolved, i.e.
failed or been subjected to early maintenance.
A decision was made to deploy both approaches and combine them in one report.
Deployment
• At this last phase in the project, the models are deployed and integrated into the
organization. This can mean several things, such as writing a report to disseminate the
results, or integrating the model into an automated system.
• This part of the project involves the customer directly, who has to provide the
resources needed for an effective deployment.
• The deployment phase also includes planning for how to monitor the models and
evaluate when they have played out their role or need to be maintained. As last steps,
a final report and project review should be performed.
Predictive maintenance example
• Data from the pump stations is read automatically every day. A new batch job is deployed
that is triggered when all readings have been collected. The batch job performs all the
necessary data transformations and data loading needed before applying the models.
• A new routine was implemented that generates a 30-day forecast for all pumps, and then
evaluates the action prediction model on each pump and its forecasted data.
• For those pumps that have actions predicted, a rule set is evaluated that checks the
results against given thresholds to check for, for example, confidence of predicted
actions. If these checks are positive, similar cases are retrieved and a report is
generated and sent to the right people.
• The case retrieval method is implemented by first looking up the pumps that belong to
the same cluster according to the similar pump model. For each similar pump, a scan
is executed to find matches in time when the vibration characteristics were the same
as the pump currently being evaluated. For each match, a lookup in the action records
is performed to check what kind of actions and failure have occurred within 30 days
after the date of the match. The matches that have logged actions are then added to the
report.
• Another batch job is also implemented, with the tasks of updating the pump and action
records, as well as retraining the models periodically. This job is also responsible for

evaluating the efficiency and correctness of the models as the system evolves over time. If the
models seem to deteriorate, an administrator is notified.
• Finally, it’s decided to inspect the system with the help of experts once a year to evaluate its
performance.
Knowledge management
Figure.3.16. Data, information, and knowledge
Data: Data refers to “unstructured facts and figures that have the least impact on the typical
manager” (Thierauf 1999). With regards to IoT solutions, however, data includes both useful
and irrelevant or redundant facts, and in order to become meaningful, needs to be processed.
Information: Within the context of IoT solutions, information is data that has been
contextualized, categorized, calculated, and condensed (Davenport & Prusak 2000). This is
where data has been carefully curated to provide relevance and purpose (Bali et al. 2009) for
the decisionmakers in question. The majority of ICT solutions can be viewed as either storing
information or processing data to become information.
Knowledge: Knowledge, meanwhile, relates to the ability to understand the information
presented, and using existing experience, the application of it within a certain decision-
making context.

Due to the nature of big data, as we discussed in previous sections, two key issues emerge:
• Managing and storing the temporal knowledge created by IoT solutions. IoT solutions data
will evolve rapidly over time, the temporal nature of the “knowledge” as understood at a
particular point in time
will have large implications for the overall industry. For example, it could affect insurance
claims if the level of knowledge provided by an IoT system could be proven to be inadequate.
• Life-cycle management of knowledge within IoT systems. Closely related to analytics, the
necessity to have a lifecycle plan for the data within a system is a strong requirement.
Figure.3.17. A knowledge management reference architecture
• Figure outlines a high-level knowledge management reference architecture that
illustrates how data sources from M2M and IoT may be combined with other types of
data, for example, from databases or even OSS/BSS data from MNOs.
• There are three levels to the diagram: (1) data sources, (2) data integration, and (3)
knowledge discovery and information access.
• Data sources
Data sources refer to the broad variety of sources that may now be available to build
enterprise solutions.
• Data integration
The data integration layer allows data from different formats to be put together in a manner
that can be used by the information access and knowledge discovery tools.
Staged Data:
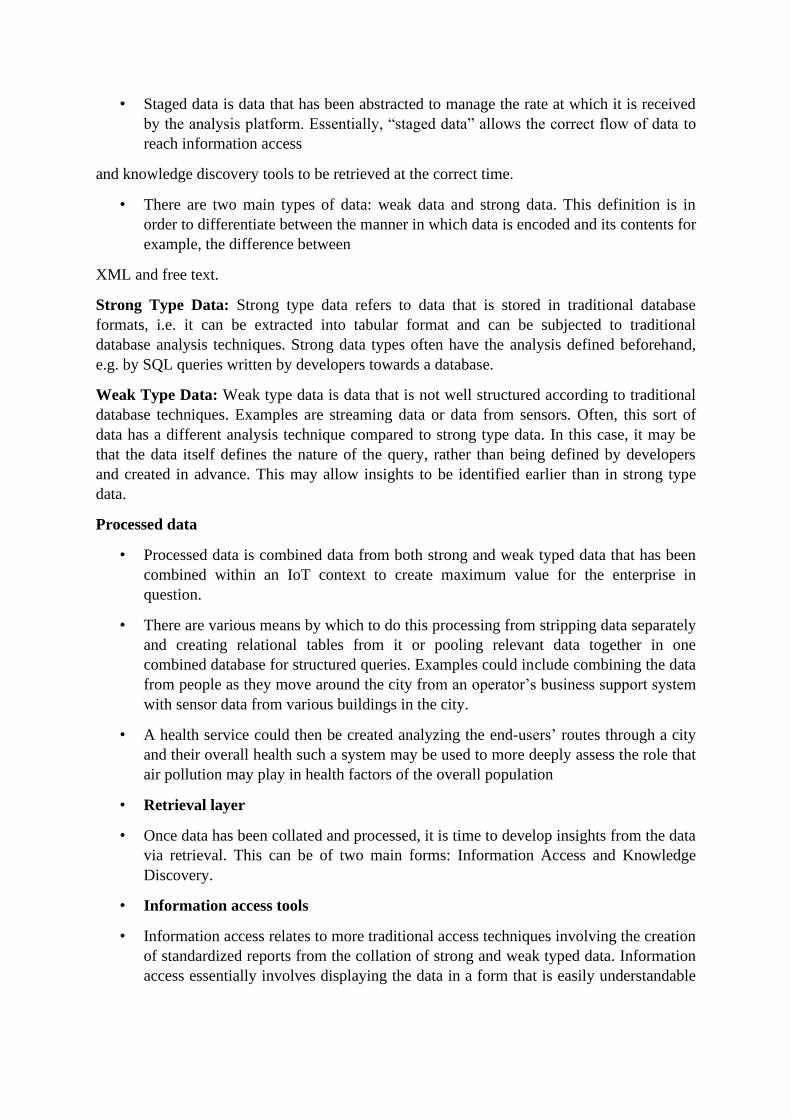
• Staged data is data that has been abstracted to manage the rate at which it is received
by the analysis platform. Essentially, “staged data” allows the correct flow of data to
reach information access
and knowledge discovery tools to be retrieved at the correct time.
• There are two main types of data: weak data and strong data. This definition is in
order to differentiate between the manner in which data is encoded and its contents for
example, the difference between
XML and free text.
Strong Type Data: Strong type data refers to data that is stored in traditional database
formats, i.e. it can be extracted into tabular format and can be subjected to traditional
database analysis techniques. Strong data types often have the analysis defined beforehand,
e.g. by SQL queries written by developers towards a database.
Weak Type Data: Weak type data is data that is not well structured according to traditional
database techniques. Examples are streaming data or data from sensors. Often, this sort of
data has a different analysis technique compared to strong type data. In this case, it may be
that the data itself defines the nature of the query, rather than being defined by developers
and created in advance. This may allow insights to be identified earlier than in strong type
data.
Processed data
• Processed data is combined data from both strong and weak typed data that has been
combined within an IoT context to create maximum value for the enterprise in
question.
• There are various means by which to do this processing from stripping data separately
and creating relational tables from it or pooling relevant data together in one
combined database for structured queries. Examples could include combining the data
from people as they move around the city from an operator’s business support system
with sensor data from various buildings in the city.
• A health service could then be created analyzing the end-users’ routes through a city
and their overall health such a system may be used to more deeply assess the role that
air pollution may play in health factors of the overall population
• Retrieval layer
• Once data has been collated and processed, it is time to develop insights from the data
via retrieval. This can be of two main forms: Information Access and Knowledge
Discovery.
• Information access tools
• Information access relates to more traditional access techniques involving the creation
of standardized reports from the collation of strong and weak typed data. Information
access essentially involves displaying the data in a form that is easily understandable

and readable by end users. A variety of information access tools exist, from SQL
visualization to more advanced visualization tools.
Knowledge discovery tools
• Knowledge Discovery, meanwhile, involves the more detailed use of ICT in order to
create knowledge, rather than just information, from the data in question.
• Knowledge Discovery means that decisions may be able to be taken on such outputs
for example, in the case where actuators (rather than just sensors) are involved,
Knowledge Discovery Systems may be able to raise an alert that a bridge or flood
control system may need to be activated.
SCHOOL OF COMPUTING
DEPARTMENT OF COMPUTER SCIENCE AND ENGINEERING
UNIT IV- Internet of Things – SBS1610

IoT Architecture-State of the Art – Introduction, State of the art, Architecture Reference
Model- Introduction, Reference Model and architecture, IoT reference Model.
IoT Architecture
Introduction
The Internet of Things (IoT) has seen an increasing interest in adaptive frameworks
and architectural designs to promote the correlation between IoT devices and IoT systems.
This is because IoT systems are designed to be categorized across diverse application
domains and geographical locations. It, therefore, creates extensive dependencies across
domains, platforms and services. Considering this interdependency between IoT devices and
IoT systems, an intelligent, connection-aware framework has become a necessity, this is
where IoT architecture comes into play! Imagine a variety of smart IoT systems from sensors
and actuators to internet getaways and Data Acquisition Systems all under the centralized
control of one “brain”! The brain here can be referred to as the IoT architecture, whose
effectiveness and applicability directly correlate with the quality of its building blocks. The
way a system interacts and the different functions an IoT device performs are various
approaches to IoT architecture. Since we can call the architecture the brain, it’s also possible
to say that the key causes of poor integration in IoT systems are the shortage of intelligent,
connection-aware architecture to support interaction in IoT systems.
An IoT architecture is the system of numerous elements that range from sensors,
protocols, actuators, to cloud services, and layers. Besides, devices and sensors the Internet
of Things (IoT) architecture layers are distinguished to track the consistency of a system
through protocols and gateways. Different architectures have been proposed by researchers
and we can all agree that there is no single consensus on architecture for IoT. The most basic
architecture is a three-layer architecture.
State-of-the-art
The IoT can be considered both a dynamic and global networked infrastructure that
manages self-configuring objects in a highly intelligent way. This, in turn, allows the
interconnection of IoT devices that share their information to create new applications and
services which can improve human lives. Originally, the concept of the IoT was first
introduced by Kevin Ashton, who is the founder of MIT auto-identification centre in 1999.
Ashton has said, “The Internet of Things has the potential to change the world, just as the
Internet did. Maybe even more so”. Later, the IoT was officially presented by the
International Telecommunication Union (ITU) in 2005. The IoT has many definitions
suggested by many organizations and researchers. However, the definition provided by ITU
in 2012 is the most common. It stated: “a global infrastructure for the information society,
enabling advanced services by interconnecting (physical and virtual) things based on, existing

and evolving, interoperable information and communication technologies”. In addition,
Guillemin and Friess in have suggested one of the simplest definitions that describe the IoT
in a smooth manner. It stated: “The Internet of Things allows people and things to be
connected Anytime, Anyplace, with anything and anyone, ideally using any path/network and
any service”. Several definitions were suggested by many researchers describing the IoT
system from different perspectives but the important thing that majority or researchers have
agreed on is the IoT is created for a better world for all the human beings. The IoT is a
promising technology that starts to grow significantly. There were already more
objects/things connected to the Internet than people from 2008. Predictions are made that in
the future; the number of Internet-connected devices will reach or even exceed 50 billion. In
addition, the IoT becomes the most massive device market that enables companies to save
billions of dollars. It has added $1.7 trillion in value to the global economy in 2019. This
involves hardware, software, management services, installation costs, and economic value
from realized IoT efficiencies. Nowadays, the IoT notion has evolved to include the
perception of realizing a global infrastructure of interconnected networks of physical and
virtual objects. The huge technological development has expanded the idea of the IoT to
involve other technologies such as Cloud computing and Wireless Sensor Networks (WSNs).
The IoT has become able to connect both humans and things anywhere, and anytime, ideally
using any path/network. The IoT has become one of the interesting topics to many
researchers. According to Google, the number of IoT journal and conference papers has
almost doubled from 2004 to 2010. From 2010, the IoT articles are dramatically increased to
reach about 985 articles in 2015.
Architecture Reference Model
Introduction
A reference model is a division of functionality together with data flow between the
pieces. A reference model is a standard decomposition of a known problem into parts that
cooperatively solve the problem. Arising from experience, reference models are a
characteristic of mature domains. Can you name the standard parts of a compiler or a
database management system? Can you explain in broad terms how the parts work together to
accomplish their collective purpose? If so, it is because you have been taught a reference
model of these applications.
A reference architecture is a reference model mapped onto software elements (that
cooperatively implement the functionality defined in the reference model) and the data flows
between them. Whereas a reference model divides the functionality, a reference architecture
is the mapping of that functionality onto a system decomposition. The mapping may be, but
by no means necessarily is, one to one. A software element may implement part of a function
or several functions. Reference models, architectural patterns, and reference architectures are
not architectures; they are useful concepts that capture elements of an architecture. Each is
the outcome of early design decisions. The relationship among these design elements is
shown in Figure 1

Fig 4.1 The relationships of reference models, architectural patterns, reference architectures,
and software architectures.
IoT Reference Architecture
The reference architecture consists of a set of components. Layers can be realized by
means of specific technologies, and we will discuss options for realizing each component.
There are also some cross-cutting/vertical layers such as access/identity management.
Fig 4.2. IoT Reference Architecture
The layers are
• Client/external communications - Web/Portal, Dashboard, APIs

• Event processing and analytics (including data storage)
• Aggregation/bus layer – ESB and message broker
• Relevant transports - MQTT/HTTP/XMPP/CoAP/AMQP, etc.
• Devices
The cross-cutting layers are
• Device manager
• Identity and access managements
THE DEVICE LAYER
The bottom layer of the architecture is the device layer. Devices can be of various types, but
in order to be considered as IoT devices, they must have some communications that either
indirectly or directly attaches to the Internet. Examples of direct connections are
• Arduino with Arduino Ethernet connection
• Arduino Yun with a Wi-Fi connection
• Raspberry Pi connected via Ethernet or Wi-Fi
• Intel Galileo connected via Ethernet or
Wi-Fi Examples of indirectly connected devices include
• ZigBee devices connected via a ZigBee gateway
• Bluetooth or Bluetooth Low Energy devices connecting via a mobile phone
• Devices communicating via low power radios to a
Raspberry Pi There are many more such examples of each type.
Each device typically needs an identity. The identity may be one of the following:
• A unique identifier (UUID) burnt into the device (typically part of the System-on Chip, or
provided by a secondary chip) •
A UUID provided by the radio subsystem (e.g. Bluetooth identifier, Wi-Fi MAC address)
• An OAuth2 Refresh/Bearer Token (this may be in addition to one of the above)
• An identifier stored in nonvolatile memory such as EEPROM
For the reference architecture we recommend that every device has a UUID (preferably an
unchangeable ID provided by the core hardware) as well as an OAuth2 Refresh and Bearer
token stored in EEPROM. The specification is based on HTTP; however, (as we will discuss
in the communications section) the reference architecture also supports these flows over
MQTT.
COMMUNICATIONS LAYER

The communication layer supports the connectivity of the devices. There are multiple
potential protocols for communication between the devices and the cloud.
The most well-known three potential protocols are
• HTTP/HTTPS (and RESTful approaches on those)
• MQTT 3.1/3.1.1(Message Queuing Telemetry Transport)
• Constrained application protocol (CoAP)
HTTP is well known, and there are many libraries that support it. Because it is a simple text-
based protocol, many small devices such as 8-bit controllers can only partially support the
protocol – for example enough code to POST or GET a resource. The larger 32-bit based
devices can utilize full HTTP client libraries that properly implement the whole protocol.
There are several protocols optimized for IoT use. The two best known are MQTT6 and
CoAP7. MQTT was invented in 1999 to solve issues in embedded systems and SCADA. It
has been through some iterations and the current version (3.1.1) is undergoing standardization
in the OASIS MQTT Technical Committee8. MQTT is a publish-subscribe messaging system
based on a broker model. The protocol has a very small overhead (as little as 2 bytes per
message), and was designed to support lossy and intermittently connected networks. MQTT
was designed to flow over TCP. In addition, there is an associated specification designed for
ZigBee-style networks called MQTT-SN (Sensor Networks). CoAP is a protocol from the
IETF that is designed to provide a RESTful application protocol modeled on HTTP
semantics, but with a much smaller footprint and a binary rather than a text- based approach.
CoAP is a more traditional client-server approach rather than a brokered approach. CoAP is
designed to be used over UDP. For the reference architecture we have opted to select MQTT
as the preferred device communication protocol, with HTTP as an alternative option.
The reasons to select MQTT and not CoAP at this stage are
• Better adoption and wider library support for MQTT;
• Simplified bridging into existing event collection and event processing systems; and
• Simpler connectivity over firewalls and NAT networks
However, both protocols have specific strengths (and weaknesses) and so there will be some
situations where CoAP may be preferable and could be swapped in. In order to support
MQTT we need to have an MQTT broker in the architecture as well as device libraries. We
will discuss this with regard to security and scalability later. One important aspect with IoT
devices is not just for the device to send data to the cloud/ server, but also the reverse. This is
one of the benefits of the MQTT specification: because it is a brokered model, clients connect
an outbound connection to the broker, whether or not the device is acting as a publisher or
subscriber. This usually avoids firewall problems because this approach works even behind
firewalls or via NAT. In the case where the main communication is based on HTTP, the
traditional approach for sending data to the device would be to use HTTP Polling. This is
very inefficient and costly, both in terms of network traffic as well as power requirements.
The modern replacement for this is the WebSocket protocol9 that allows an HTTP
connection to be upgraded into a full two-way connection. This then acts as a socket channel
(similar to a pure TCP channel) between the server and client. Once that has been established,
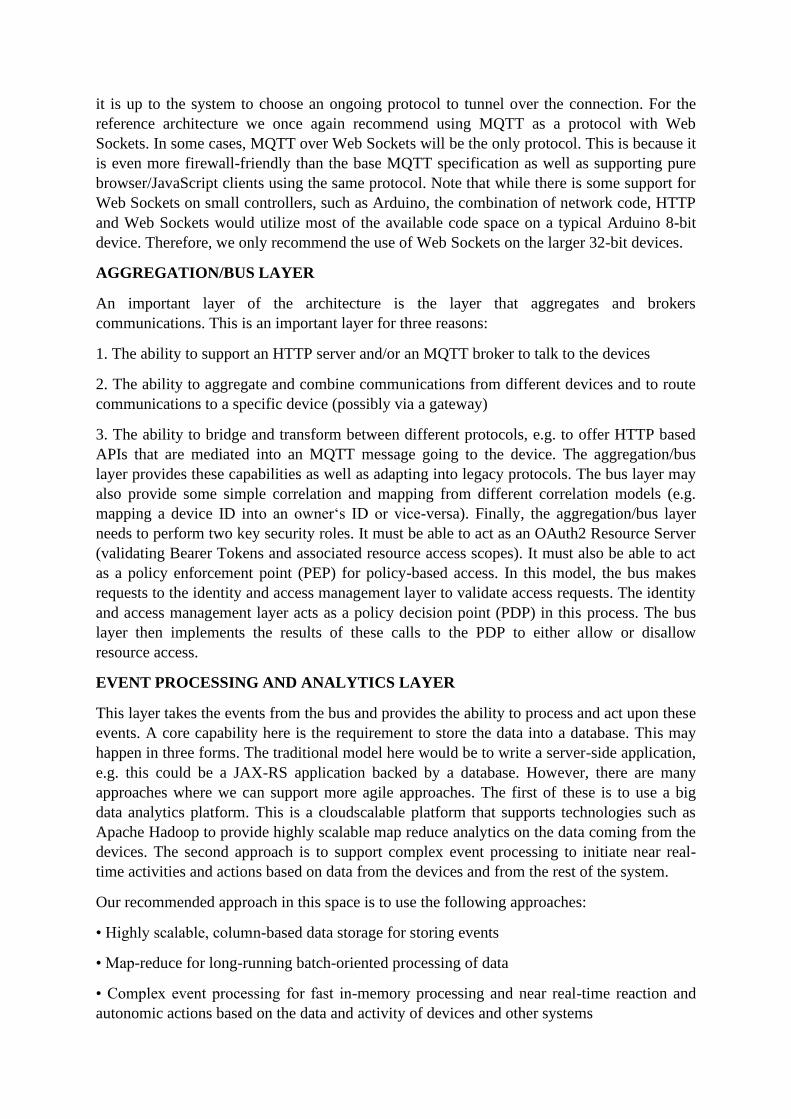
it is up to the system to choose an ongoing protocol to tunnel over the connection. For the
reference architecture we once again recommend using MQTT as a protocol with Web
Sockets. In some cases, MQTT over Web Sockets will be the only protocol. This is because it
is even more firewall-friendly than the base MQTT specification as well as supporting pure
browser/JavaScript clients using the same protocol. Note that while there is some support for
Web Sockets on small controllers, such as Arduino, the combination of network code, HTTP
and Web Sockets would utilize most of the available code space on a typical Arduino 8-bit
device. Therefore, we only recommend the use of Web Sockets on the larger 32-bit devices.
AGGREGATION/BUS LAYER
An important layer of the architecture is the layer that aggregates and brokers
communications. This is an important layer for three reasons:
1. The ability to support an HTTP server and/or an MQTT broker to talk to the devices
2. The ability to aggregate and combine communications from different devices and to route
communications to a specific device (possibly via a gateway)
3. The ability to bridge and transform between different protocols, e.g. to offer HTTP based
APIs that are mediated into an MQTT message going to the device. The aggregation/bus
layer provides these capabilities as well as adapting into legacy protocols. The bus layer may
also provide some simple correlation and mapping from different correlation models (e.g.
mapping a device ID into an owner‘s ID or vice-versa). Finally, the aggregation/bus layer
needs to perform two key security roles. It must be able to act as an OAuth2 Resource Server
(validating Bearer Tokens and associated resource access scopes). It must also be able to act
as a policy enforcement point (PEP) for policy-based access. In this model, the bus makes
requests to the identity and access management layer to validate access requests. The identity
and access management layer acts as a policy decision point (PDP) in this process. The bus
layer then implements the results of these calls to the PDP to either allow or disallow
resource access.
EVENT PROCESSING AND ANALYTICS LAYER
This layer takes the events from the bus and provides the ability to process and act upon these
events. A core capability here is the requirement to store the data into a database. This may
happen in three forms. The traditional model here would be to write a server-side application,
e.g. this could be a JAX-RS application backed by a database. However, there are many
approaches where we can support more agile approaches. The first of these is to use a big
data analytics platform. This is a cloudscalable platform that supports technologies such as
Apache Hadoop to provide highly scalable map reduce analytics on the data coming from the
devices. The second approach is to support complex event processing to initiate near real-
time activities and actions based on data from the devices and from the rest of the system.
Our recommended approach in this space is to use the following approaches:
• Highly scalable, column-based data storage for storing events
• Map-reduce for long-running batch-oriented processing of data
• Complex event processing for fast in-memory processing and near real-time reaction and
autonomic actions based on the data and activity of devices and other systems

• In addition, this layer may support traditional application processing platforms, such as Java
Beans, JAX-RS logic, message-driven beans, or alternatives, such as node.js, PHP, Ruby or
Python.
CLIENT/EXTERNAL COMMUNICATIONS LAYER
The reference architecture needs to provide a way for these devices to communicate outside
of the device-oriented system. This includes three main approaches. Firstly, we need the
ability to create web-based front-ends and portals that interact with devices and with the
event-processing layer. Secondly, we need the ability to create dashboards that offer views
into analytics and event processing. Finally, we need to be able to interact with systems
outside this network using machine-to-machine communications (APIs). These APIs need to
be managed and controlled and this happens in an API management system. The
recommended approach to building the web front end is to utilize a modular front-end
architecture, such as a portal, which allows simple fast composition of useful UIs. Of course,
the architecture also supports existing Web server-side technology, such as Java Servlets/
JSP, PHP, Python, Ruby, etc. Our recommended approach is based on the Java framework
and the most popular Java-based web server, Apache Tomcat. The dashboard is a re-usable
system focused on creating graphs and other visualizations of data coming from the devices
and the event processing layer.
The API management layer provides three main functions:
• The first is that it provides a developer-focused portal (as opposed to the user focused portal
previously mentioned), where developers can find, explore, and subscribe to APIs from the
system. There is also support for publishers to create, version, and manage the available and
published APIs;
• The second is a gateway that manages access to the APIs, performing access control checks
(for external requests) as well as throttling usage based on policies. It also performs routing
and load- balancing;
• The final aspect is that the gateway publishes data into the analytics layer where it is stored
as well as processed to provide insights into how the APIs are used.
DEVICE MANAGEMENT
Device management (DM) is handled by two components. A server-side system (the device
manager) communicates with devices via various protocols and provides both individual and
bulk control of devices. It also remotely manages software and applications deployed on the
device. It can lock and/or wipe the device if necessary. The device manager works in
conjunction with the device management agents. There are multiple different agents for
different platforms and device types. The device manager also needs to maintain the list of
device identities and map these into owners. It must also work with the identity and access
management layer to manage access controls over devices (e.g. who else can manage the
device apart from the owner, how much control does the owner have vs. the administrator,
etc.) There are three levels of device: non-managed, semi-managed and fully managed (NM,
SM, FM). Fully managed devices are those that run a full DM agent.
A full DM agent supports:

• Managing the software on the device
• Enabling/disabling features of the device (e.g. camera, hardware, etc.)
• Management of security controls and identifiers
• Monitoring the availability of the device • Maintaining a record of the device location if
available
• Locking or wiping the device remotely if the device is compromised, etc.
Non-managed devices can communicate with the rest of the network, but have no agent
involved. These may include 8-bit devices where the constraints are too small to support the
agent. The device manager may still maintain information on the availability and location of
the device if this is available. Semi-managed devices are those that implement some parts of
the DM (e.g. feature control, but not software management).
IDENTITY AND ACCESS MANAGEMENT
The final layer is the identity and access management layer. This layer needs to provide the
following services:
• OAuth2 token issuing and validation
• Other identity services including SAML2 SSO and OpenID Connect support for identifying
inbound requests from the Web layer
• XACML PDP
• Directory of users (e.g. LDAP)
• Policy management for access control (policy control point)
The identity layer may of course have other requirements specific to the other identity and
access management for a given instantiation of the reference architecture. In this section we
have outlined the major components of the reference architecture as well as specific decisions
we have taken around technologies. These decisions are motivated by the specific
requirements of IoT architectures as well as best practices for building agile, evolvable,
scalable Internet architectures.
IoT Reference Model
In an IoT system, data is generated by multiple kinds of devices, processed in different ways,
transmitted to different locations, and acted upon by applications. The proposed IoT reference
model is comprised of seven levels. Each level is defined with terminology that can be
standardized to create a globally accepted frame of reference. The IoT Reference Model does
not restrict the scope or locality of its components. For example, from a physical perspective,
every element could reside in a single rack of equipment or it could be distributed across the
world. The IoT Reference Model also allows the processing occurring at each level to range
from trivial to complex, depending on the situation. The model describes how tasks at each
level should be handled to maintain simplicity, allow high scalability, and ensure
supportability. Finally, the model defines the functions required for an IoT system to be

complete. Figure 1 illustrates the IoT Reference model and its levels. It is important to note
that in the IoT, data flows in both directions. In a control pattern, control information flows
from the top of the model (level 7) to the bottom (level 1). In a monitoring pattern, the flow
of information is the reverse. In most systems, the flow will be bidirectional.
Fig 4.3 IoT Reference Model
Level 1: Physical Devices and Controllers
The IoT Reference Model starts with Level 1: physical devices and controllers that might
control multiple devices. These are the “things” in the IoT, and they include a wide range of
endpoint devices that send and receive information. Today, the list of devices is already
extensive. It will become almost unlimited as more equipment is added to the IoT over time.
Devices are diverse, and there are no rules about size, location, form factor, or origin. Some
devices will be the size of a silicon chip. Some will be as large as vehicles. The IoT must
support the entire range. Dozens or hundreds of equipment manufacturers will produce IoT
devices. To simplify compatibility and support manufacturability, the IoT Reference Model
generally describes the level of processing needed from Level 1 devices.
Level 2: Connectivity
Communications and connectivity are concentrated in one level—Level 2.
The most important function of Level 2 is reliable, timely information transmission. This
includes transmissions: ● Between devices (Level 1) and the network ● Across networks

(east-west) ● Between the network (Level 2) and low-level information processing occurring
at Level 3
Traditional data communication networks have multiple functions, as evidenced by the
International Organization for Standardization (ISO) 7-layer reference model. However, a
complete IoT system contains many levels in addition to the communications network. One
objective of the IoT Reference Model is for communications and processing to be executed
by existing networks. The IoT Reference Model does not require or indicate creation of a
different network—it relies on existing networks. However, some legacy devices aren’t IP-
enabled, which will require introducing communication gateways. Other devices will require
proprietary controllers to serve the communication function. However, over time,
standardization will increase. As Level 1 devices proliferate, the ways in which they interact
with Level 2 connectivity equipment may change. Regardless of the details, Level 1 devices
communicate through the IoT system by interacting with Level 2 connectivity equipment
Level 3: Edge (Fog) Computing
The functions of Level 3 are driven by the need to convert network data flows into
information that is suitable for storage and higher-level processing at Level 4 (data
accumulation). This means that Level 3 activities focus on high-volume data analysis and
transformation. For example, a Level 1 sensor device might generate data samples multiple
times per second, 24 hours a day, 365 days a year. A basic tenet of the IoT Reference Model
is that the most intelligent system initiates information processing as early and as close to the
edge of the network as possible. This is sometimes referred to as fog computing. Level 3 is
where this occurs. Given that data is usually submitted to the connectivity level (Level 2)
networking equipment by devices in small units, Level 3 processing is performed on a
packet-by-packet basis. This processing is limited, because there is only awareness of data
units—not “sessions” or “transactions.” Level 3 processing can encompass many examples,
such as:
● Evaluation: Evaluating data for criteria as to whether it should be processed at a higher
level ● Formatting: Reformatting data for consistent higher-level processing
● Expanding/decoding: Handling cryptic data with additional context (such as the origin)
● Distillation/reduction: Reducing and/or summarizing data to minimize the impact of data
and traffic on the network and higher-level processing systems
● Assessment: Determining whether data represents a threshold or alert; this could include
redirecting data to additional destinations
Level 4: Data Accumulation
Networking systems are built to reliably move data. The data is “in motion.” Prior to Level
4, data is moving through the network at the rate and organization determined by the devices
generating the data. The model is event driven. As defined earlier, Level 1 devices do not
include computing capabilities themselves. However, some computational activities could
occur at Level 2, such as protocol translation or application of network security policy.
Additional compute tasks can be performed at Level 3, such as packet inspection. Driving
computational tasks as close to the edge of the IoT as possible, with heterogeneous systems
distributed across multiple management domains represents an example of fog computing.

Fog computing and fog services will be a distinguishing characteristic of the IoT. Most
applications cannot, or do not need to, process data at network wire speed. Applications
typically assume that data is “at rest”—or unchanging—in memory or on disk. At Level 4,
Data Accumulation, data in motion is converted to data at rest.
Level 4 determines:
● If data is of interest to higher levels: If so, Level 4 processing is the first level that is
configured to serve the specific needs of a higher level.
● If data must be persisted: Should data be kept on disk in a non-volatile state or accumulated
in memory for short-term use?
● The type of storage needed: Does persistency require a file system, big data system, or
relational database?
● If data is organized properly: Is the data appropriately organized for the required storage
system?
● If data must be recombined or recomputed: Data might be combined, recomputed, or
aggregated with previously stored information, some of which may have come from non-IoT
sources.
As Level 4 captures data and puts it at rest, it is now usable by applications on a non-real-
time basis. Applications access the data when necessary. In short, Level 4 converts event-
based data to query-based processing. This is a crucial step in bridging the differences
between the real-time networking world and the non-real-time application world.
Level 5: Data Abstraction
IoT systems will need to scale to a corporate—or even global—level and will require
multiple storage systems to accommodate IoT device data and data from traditional enterprise
ERP, HRMS, CRM, and other systems. The data abstraction functions of Level 5 are focused
on rendering data and its storage in ways that enable developing simpler, performance-
enhanced applications.
With multiple devices generating data, there are many reasons why this data may not land in
the same data storage:
● There might be too much data to put in one place.
● Moving data into a database might consume too much processing power, so that retrieving
it must be separated from the data generation process. This is done today with online
transaction processing (OLTP) databases and data warehouses.
● Devices might be geographically separated, and processing is optimized locally.
● Levels 3 and 4 might separate “continuous streams of raw data” from “data that represents
an event.” Data storage for streaming data may be a big data system, such as Hadoop. Storage
for event data may be a relational database management system (RDBMS) with faster query
times.
● Different kinds of data processing might be required.

For example, in-store processing will focus on different things than across-all-stores
summary processing. For these reasons, the data abstraction level must process many
different things. These include:
● Reconciling multiple data formats from different sources
● Assuring consistent semantics of data across sources
● Confirming that data is complete to the higher-level application
● Consolidating data into one place (with ETL, ELT, or data replication) or providing access
to multiple data stores through data virtualization
● Protecting data with appropriate authentication and authorization
● Normalizing or denormalizing and indexing data to provide fast application access
Level 6: Application Level 6
It is the application level, where information interpretation occurs. Software at this level
interacts with Level 5 and data at rest, so it does not have to operate at network speeds. The
IoT Reference Model does not strictly define an application. Applications vary based on
vertical markets, the nature of device data, and business needs. For example, some
applications will focus on monitoring device data. Some will focus on controlling devices.
Some will combine device and non-device data. Monitoring and control applications
represent many different application models, programming patterns, and software stacks,
leading to discussions of operating systems, mobility, application servers, hypervisors, multi-
threading, multi-tenancy, etc. These topics are beyond the scope of the IoT Reference Model
discussion. Suffice it to say that application complexity will vary widely.
Examples include:
● Mission-critical business applications, such as generalized ERP or specialized industry
solutions
● Mobile applications that handle simple interactions
● Business intelligence reports, where the application is the BI server
● Analytic applications that interpret data for business decisions
● System management/control center applications that control the IoT system itself and don’t
act on the data produced by it
If Levels 1-5 are architected properly, the amount of work required by Level 6 will be
reduced. If Level 6 is designed properly, users will be able to do their jobs better.
Level 7: Collaboration and Processes
One of the main distinctions between the Internet of Things (IoT) and IoT is that IoT includes
people and processes. This difference becomes particularly clear at Level 7: Collaboration
and Processes. The IoT system, and the information it creates, is of little value unless it yields
action, which often requires people and processes. Applications execute business logic to
empower people. People use applications and associated data for their specific needs. Often,

multiple people use the same application for a range of different purposes. So, the objective is
not the application—it is to empower people to do their work better. Applications (Level 6)
give business people the right data, at the right time, so they can do the right thing. But
frequently, the action needed requires more than one person. People must be able to
communicate and collaborate, sometimes using the traditional Internet, to make the IoT
useful. Communication and collaboration often require multiple steps. And it usually
transcends multiple applications. This is why Level 7, represents a higher level than a single
application.

SCHOOL OF COMPUTING
DEPARTMENT OF COMPUTER SCIENCE AND ENGINEERING

IoT Reference Architecture- Introduction, Functional View, Information View,
Deployment and Operational View, Other Relevant architectural views. Real-World Design
Constraints- Introduction, Technical Design constraints-hardware is popular again, Data
representation and visualization, Interaction and remote control. Industrial Automation-
Service-oriented architecture-based device integration - Introduction, Case study: phase one-
commercial building automation today, Case study: phase two- commercial building
automation in the future.
IoT Reference Architecture
• Reference Architecture is a starting point for generating concrete architectures and
actual systems. A concrete architecture addresses the concerns of multiple
stakeholders of the actual system, and it is typically presented as a series of views that
address different stakeholder concerns.
• A Reference Architecture, on the other hand, serves as a guide for one or more
concrete system architects. However, the concept of views for the presentation of an
architecture is also useful for the IoT Reference Architecture.
• Views are useful for reducing the complexity of the Reference Architecture blueprints
by addressing groups of concerns one group at a time.
• However, since the IoT Reference Architecture does not contain details about the
environment where the actual system is deployed, some views cannot be presented in
detail or at all; for example, the view that shows the concrete Physical Entities and
Devices for a specific scenario.
• The stakeholders for a concrete IoT system are the people who use the system
(Human Users); the people who design, build, and test the Resources , Services,
Active Digital Artifacts, and Applications; the people who deploy Devices and attach
them to Physical Entities; the people who integrate IoT capabilities of functions with
an existing ICT system (e.g. of an enterprise); the people who operate, maintain, and
troubleshoot the Physical and Virtual Infrastructure; and the people who buy and own
an IoT system or parts thereof (e.g. city authorities).
• In order to address the concerns of mainly the concrete IoT architect, and secondly the
concerns of most of the above stakeholders, we have chosen to present the Reference
Architecture as a set of architectural views .
• Functional View: Description of what the system does, and its main functions.
• Information View: Description of the data and information that the system handles.

• Deployment and Operational View: Description of the main real world components of
the system such as devices, network routers, servers, etc.
Functional view
• The functional view for the IoT Reference Architecture is presented in Figure.5.1 ,
and is adapted from IoT-A .
• It consists of the Functional Groups (FGs) presented earlier in the IoT Functional
Model, each of which includes a set of Functional Components (FCs).
• It is important to note that not all the FCs are used in a concrete IoT architecture, and
therefore the actual system as explained earlier
Fig.5.1 . IoT Functional View
Device and Application functional group
• The Device and Application FGs are already covered in the IoT Functional Model.
For convenience the Device FG contains the Sensing, Actuation, Tag, Processing,
Storage FCs, or simply components.
• These components represent the resources of the device attached to the Physical
Entities of interest. The Application FG contains either standalone applications (e.g.
for iOS, Android, Windows phone), or Business Applications that connect the IoT
system to an Enterprise system.

Communication functional group
The Communication FG contains the End-to-End Communication, Network
Communication, and Hop-by-Hop communication components:
• The Hop-by-Hop Communication is applicable in the case that devices are equipped
with mesh radio networking technologies such as IEEE 802.15.4 for which messages
have to traverse the mesh from node-to-node (hop-by-hop) until they reach a gateway
node which forwards the message (if needed) further to the Internet.
• The hop-by-hop FC is responsible for transmission and reception of physical and
MAC layer frames to/from other devices. This FC has two main interfaces: (a) one
“southbound” to/from the actual radio on the device, and (b) one “northbound”
to/from the Network FC in the Communication FG.
• The Network FC is responsible for message routing & forwarding and the necessary
translations of various identifiers and addresses.
• The translations can be (a) between network layer identifiers to MAC and/or physical
network identifiers, (b) between high-level human readable host/node identifiers to
network layer addresses (e.g. Fully Qualified Domain Names (FQDN) to IP
addresses, a function implemented by a Domain Name System (DNS) server), and (c)
translation between node/service identifiers and network locators in case the higher
layers above the networking layer use node or service identifiers that are decoupled
from the node addresses in the network (e.g.Host Identity Protocol (HIP; Moskovitz
& Nikander 2006) identifiers and IP addresses).
• Potential fragmentation and reassembly of messages due to limitations of the
underlying layers is also handled by the Network FC.
• Finally, the Network FC is responsible for handling messages that cross different
networking or MAC/PHY layer technologies, a function that is typically implemented
on a network gateway type of device.
• The End-to-End Communication FC is responsible for end-to-end transport of
application layer messages through diverse network and MAC/PHY layers.
• In turn, this means that it may be responsible for end-to-end retransmissions of
missing frames depending on the configuration of the FC. For example, if the End-to-
End Communication FC is mapped in an actual system to a component implementing
the Transmission Control Protocol (TCP) protocol, reliable transfer of frames dictates
the retransmission of missing frames.
• Finally, this FC is responsible for hosting any necessary proxy/cache and any protocol
translation between networks with different transport/application layer technologies.
An example of such functionality is the HTTP-CoAP proxy, which performs

transport-layer protocol translation. The End-to- End FC interfaces the Network FC
on the “southbound” direction.
IoT Service functional group
The IoT Service FG consists of two FCs: The IoT Service FC and the IoT Service
Resolution FC:
• The IoT Service FC is a collection of service implementations, which interface the
related and associated Resources. For a Sensor type of a Resource, the IoT Service FC
includes Services that receive requests from a User and returns the Sensor Resource
value in synchronous or asynchronous (e.g. subscription/notification) fashion.
• The services corresponding to Actuator Resources receive User requests for actuation,
control the Actuator Resource, and may return the status of the Actuator after the
action.
• A Tag IoT Service can behave both as a Sensor (for reading the identifier of the Tag),
or as an Actuator (for writing a new identifier or information on the Tag, if possible).
• The IoT Service Resolution FC contains the necessary functions to realize a directory
of IoT Services that allows dynamic management of IoT Service descriptions and
discovery/lookup/resolution of IoT Services by other Active Digital Artifacts.
• The Service descriptions of IoT Services contain a number of attributes as seen earlier
in the IoT Functional Model section. Dynamic management includes methods such as
creation/update/ deletion (CUD) of Service description, and can be invoked by both
the
• IoT Services themselves, or functions from the Management FG (e.g.bulk creation of
IoT Service descriptions upon system start-up).
• The discovery/lookup and resolution functions allow other Services or Active Digital
Artifacts to locate IoT Services by providing different types of information to the IoT
Service Resolution FC.
• By providing the Service identifier (attribute of the Service description) a lookup
method invocation to the IoT Service Resolution returns the Service description,
while the resolution method invocation returns the contact information (attribute of
the service description) of a service for direct Service invocation (e.g. URL).
• The discovery method, on the other hand, assumes that the Service identifier is
unknown, and the discovery request contains a set of desirable Service description
attributes that matching Service descriptions should contain.
Virtual Entity functional group

• The Virtual Entity FG contains functions that support the interactions between Users
and Physical Things through Virtual Entity services.
• An example of such an interaction is the query to an IoT system of the form, “What is
the temperature in the conference room Titan?” The Virtual Entity is the conference
room “Titan,” and the conference room attribute of interest is “temperature.”
• Assuming that the room is actually instrumented with a temperature sensor, if the
User had the knowledge of which temperature sensor is installed in the room (e.g.
TempSensor #23), then the User could re-formulate and re-target this query to, “What
is the value of TempSensor #23?” dispatched to the relevant IoT Service representing
the temperature resource on the TempSensor #23.
• The Virtual Entity interaction paradigm requires functionality such as discovery of
IoT Services based on Virtual Entity descriptions, managing the Virtual Entity-IoT
Service associations, and processing Virtual Entity-based queries. The following FCs
are defined for realizing these functionalities:
• The Virtual Entity Service FC enables the interaction between Users and Virtual
Entities by means of reading and writing the Virtual Entity attributes (simple or
complex), which can be read or written, of course.
• Some attributes (e.g. the GPS coordinates of a room) are static and non-writable by
nature, and some other attributes are non-writable by access control rules.
• In general attributes that are associated with IoT Services, which in turn represent
Sensor Resources, can only be read. There can be, of course, special Virtual Entities
associated with the same Sensor Resource through another IoT Service that allow
write operations.
• An example of such a special case is when the Virtual Entity represents the Sensor
device itself (for management purposes).
• In general, attributes that are associated with IoT Services, which in turn represent
Actuator Resources, can be read and written. A read operation returns the actuator
status, while a write operation results in a command sent to the actuator.
• The Virtual Entity Registry FC maintains the Virtual Entities of interest for the
specific IoT system and their associations.
• The component offers services such as creating/reading/updating/deleting Virtual
Entity descriptions and associations. Certain associations can be static; for example,
the entity “Room #123” is contained in the entity “Floor #7” by construction, while
other associations are dynamic, e.g. entity “Dog” and entity “Living Room” due to at
least Entity mobility. Update and Deletion operations take the Virtual Entity identifier
as a parameter.

• The Virtual Entity Resolution FC maintains the associations between Virtual Entities
and IoT Services, and offers services such as creating/reading/updating/deleting
associations as well as lookup and discovery of associations.
• The Virtual Entity Resolution FC also provides notification to Users about the status
of the dynamic associations between a Virtual Entity and an IoT Service, and finally
allows the discovery of IoT Services provided the certain Virtual Entity attributes.
• The Virtual Entity and IoT Service Monitoring FC includes: (a) functionality to assert
static Virtual EntityIoT Service associations, (b) functionality to discover new
associations based on existing associations or
• Virtual Entity attributes such as location or proximity, and (c) continuous monitoring
of the dynamic associations between Virtual Entities and IoT Services and updates of
their status in case existing associations are not valid any more.
IoT process management functional group
• The IoT Process Management FG aims at supporting the integration of business
processes with IoT-related services. It consists of two FCs:
✓ The Process Modeling FC provides that right tools for modeling a business process
that utilizes IoT-related services.
✓ The Process Execution FC contains the execution environment of the process models
created by the Process Modelling FC and executes the created processes by utilizing
the Service Organization FG in order to resolve high-level application requirements to
specific IoT services.
✓ Service Organization functional group
✓ The Service Organization FG acts as a coordinator between different Services offered
by the system. It consists of the following FCs:
• The Service Composition FC manages the descriptions and execution environment
of complex services consisting of simpler dependent services. An example of a complex
composed service is a service offering the average of the values coming from a number of
simple Sensor Services. The complex composed service descriptions can be wellspecified or
dynamic/flexible depending on whether the constituent services are well-defined and known
at the execution time or discovered on-demand. The objective of a dynamic composed
service can be the maximization of the quality of information achieved by the composition of
simpler Services, as is the case with the example “average” service described earlier.
• The Service Orchestration FC resolves the requests coming from IoT Process
Execution FC or User into the concrete IoT services that fulfill the requirements.
• The Service Choreography FC is a broker for facilitating communication among
Services using the Publish/Subscribe pattern. Users and Services interested in specific IoT-

related services subscribe to the Choreography FC, providing the desirable service attributes
even if the desired services do not exist. The Choreography FC notifies the Users when
services fulfilling the subscription criteria are found.
✓ Security functional group
✓ The Security FG contains the necessary functions for ensuring the security and
privacy of an IoT system. It consists of the following FCs:
• The Identity Management FC manages the different identities of the involved
Services or Users in an IoT system in order to achieve anonymity by the use of multiple
pseudonyms.
• The Authentication FC verifies the identity of a User and creates an assertion upon
successful verification. It also verifies the validity of a given assertion.
• The Authorization FC manages and enforces access control policies. It provides
services to manage policies (CUD), as well as taking decisions and enforcing them regarding
access rights of restricted resources. The term “resource” here is used as a representation of
any item in an IoT system that needs a restricted access. Such an item can be a database entry
(Passive Digital Artifact), a Service interface, a Virtual Entity attribute (simple or complex), a
Resource/Service/Virtual Entity description, etc.
✓ The Key Exchange & Management is used for setting up the necessary security keys
between two communicating entities in an IoT system.
✓ The Trust & Reputation FC manages reputation scores of different interacting entities
in an IoT system and calculates the service trust levels.
✓ Management functional group
✓ The Management FG contains system-wide management functions that may use
individual FC management interfaces. It is not responsible for the management of
each component, rather for the management of the system as
✓ a whole. It consists of the following FCs:
• The Configuration FC maintains the configuration of the FCs and the Devices in an
IoT system (a subset of the ones included in the Functional View). The component collects
the current configuration of all the FCs and devices, stores it in a historical database, and
compares current and historical configurations. The component can also set the system-wide
configuration (e.g. upon initialization), which in turn translates to configuration changes to
individual FCs and devices.
• The Fault FC detects, logs, isolates, and corrects system-wide faults if possible. This
means that individual component fault reporting triggers fault diagnosis and fault recovery
procedures in the Fault FC.

✓ The Member FC manages membership information about the relevant entities in an
IoT system. Example relevant entities are the FGs, FCs Services, Resources, Devices,
Users, and Applications. Membership
✓ information is typically stored in a database along with other useful information such
as capabilities, ownership, and access rules & rights, which are used by the Identity
Management and Authorization FCs.
• The State FC is similar to the Configuration FC, and collects and logs state
information from the current FCs, which can be used for fault diagnosis, performance
analysis and prediction, as well as billing
✓ purposes. This component can also set the state of the other FCs based on system-
wise state information.
• The Reporting FC is responsible for producing compressed reports about the system
state based on input from FCs.
Information view
• The information view consists of (a) the description of the information handled in the
IoT System, and (b) the way this information is handled in the system; in other
words, the information lifecycle and flow (how information is created, processed, and
deleted), and the information handling components.
• Information description
The pieces of information handled by an IoT system complying to an ARM such as
the IoT-A (Carrez et al. 2013) are the following:
• Virtual Entity context information, i.e. the attributes (simple or complex) as
represented by parts of the IoT Information model (attributes that have values and metadata
such as the temperature of a room). This is one
of the most important pieces of information that should be captured by an IoT system,
and represents the properties of the associated Physical Entities or Things.
• IoT Service output itself is another important part of information generated by an
IoT system. For example, this is the information generated by interrogating a Sensor or a Tag
Service.
• Virtual Entity descriptions in general, which contain not only the attributes coming
from IoT Devices (e.g. ownership information).
• Associations between Virtual Entities and related IoT Services.
• Virtual Entity Associations with other Virtual Entities (e.g. Room #123 is on Floor
#7).

• IoT Service Descriptions, which contain associated Resources, interface descriptions,
etc.
• Resource Descriptions, which contain the type of resource (e.g. sensor), identity,
associated Services, and Devices.
• Device Descriptions such as device capabilities (e.g. sensors, radios).
• Descriptions of Composed Services, which contain the model of how a complex
service is composed of simpler services.
• IoT Business Process Model, which describes the steps of a business process utilizing
other IoT-related services (IoT, Virtual Entity,Composed Services).
• Security information such as keys, identity pools, policies, trust models, reputation
scores, etc.
• Management information such as state information from operational FCs used for
fault/performance purposes, configuration snapshots, reports, membership
information, etc.
Information flow and lifecycle
• The presentation of information handling in an IoT system assumes that FCs
exchange and process information. The exchange of information between FCs follows
the interaction patterns below

Fig.5.2. Information exchange patterns.
• Push: An FC A pushes the information to another FC B provided that the contact
information of the component B is already configured in component A, and
component B listens for such information pushes.
• Request/Response: An FC A sends a request to another FC B and receives a
response from B after A serves the request. Typically the interaction is synchronous in
the sense that A must wait for a response from B before proceeding to other tasks, but
in practice this limitation can be realized with parts of component A waiting, and
other parts performing other tasks. Component B may need to handle concurrent
requests and responses from multiple components, which imposes certain
requirements on the capabilities for the device or the network that hosts the FC.
• Subscribe/Notify: Multiple subscriber components (SA, SB) can subscribe for
information to a component C, and C will notify the relevant subscribers when the
requested information is ready. This is typically an asynchronous information request
after which each subscriber can perform other tasks. Nevertheless, a subscriber needs
to have some listening components for receiving the asynchronous response. The
target component C also needs to maintain state information about which subscribers
requested which information and their contact information.
• The Subscribe/Notify pattern is applicable when typically one component is the host
of the information needed by multiple other components. Then the subscribers need
only establish a Subscribe/Notify relationship with one component. If multiple
components can be information producers or information hosts, the Publish/Subscribe
pattern is a more scalable solution from the point of view of the subscribers.

• Publish/Subscribe: In the Publish/Subscribe (also known as a Pub/Sub pattern), there
is a third component called the broker B, which mediates subscription and
publications between subscribers (information consumers) and publishers (or
information producers). Subscribers such as SA and SB subscribe to the broker about
the information they are interested in by describing the different properties of the
information. Publishers publish information and metadata to the broker, and the
broker pushes the published information to (notification) the subscribers whose
interests match the published information.
Fig.5.3.Device, IoT Service, and Virtual Entity Service Interactions.
• In Figure 5.3 we assume that the generated sensed data is pushed by a sensor device
(under Steps 1 and 2) that is part of a multi-hop mesh network such as IEEE 802.15.4
through the Hop-by-Hop, Network, and End-to-End communication FCs towards the
Sensor Resource hosted in the network.
• Please note that the Sensor Resource is not shown in the figure, only the associated
IoT Service. A cached version of the sensor reading on the Device is maintained on
the IoT Service. When User1 (Step 3) requests the sensor reading value from the
specific Sensor Device (assuming User1 provides the Sensor resource identifier), the
IoT Service provides the cached copy of the sensor reading back to the User1
annotated with the appropriate metadata information about the sensor measurement,
for example, timestamp of the last known reading of the sensor, units, and location of
the Sensor Device.
• Also assume that that the Virtual Entity Service associated with the Physical Entity
(e.g. a room in a building) where the specific Sensor Device has been deployed
already contains the IoT Service as a provider of the “hasTemperature” attribute of its
description. The Virtual Entity Service subscribes to the IoT Service for updates of
the sensor readings pushed by the

• Sensor Device (Step 5). Every time the Sensor Device pushes sensor readings to the
IoT Service, the IoT Service notifies (Step 6) the Virtual Entity Service, which
updates the value of the attribute “hasTemperature” with the sensor reading of the
Sensor Device. At a later stage, a User2 subscribing (Step 7) to changes on the Virtual
Entity attribute “hasTemperature” is notified every time the attribute changes value
(Step 8).
Fig.5.4. IoT Service Resolution
• Figure 5.4 depicts the information flow when utilizing the IoT Service Resolution
FC. The IoT Service Resolution implements two main interfaces, one for the CUD of
Service Description objects in the IoT Service Resolution database/store, and one for
lookup/resolution/discovery of IoT Services.
• As a reminder, the lookup and resolution operations provide the Service Description
and the Service locator, respectively, given the Service identifier and the discovery
operation returns a (set of) Service Description(s) given a list of desirable attributes
that matching Service Descriptions should contain.
• The CUD operations can be performed by the IoT Service logic itself or by a
management component (e.g. Member FC in Figure). The lookup/resolution and
discovery operation can be performed by a User as a standalone query or the Service
Orchestration as a part of a Composed Service or an IoT Process.
• If a discovery operation returns multiple matching Service Descriptions, it is upon the
User or the Service Orchestration component to select the most appropriate IoT
Service for the specific task.

• Although the interactions in Figure follow the Request/Response patterns, the
lookup/resolution/discovery operations can follow the Subscribe/Notify pattern in the
sense that a User or the Service Orchestration FC subscribe to changes of existing IoT
Services for lookup/resolution and for the discovery of new Service Descriptions in
the case of a discovery operation.
Fig.5.5.Virtual Entity Service Resolution
• Figure 5.5 describes the information flow when the Virtual Entity Service Resolution
FC is utilized. The Virtual Entity Resolution FC allows the CUD of Virtual Entity
Descriptions, and the lookup and discovery of Virtual Entity Descriptions.
• A lookup operation by a User or the Service Orchestration FC returns the Virtual
Entity Description given the Virtual Entity identity, while the discovery operation
returns the Virtual Entity Description(s) given a set of Virtual Entity attributes (simple
or complex) that matching Virtual Entities should contain.
• Please note that the Virtual Entity Registry is also involved in the information flow
because it is the storage component of Virtual Entity Descriptions, but it is omitted
from the figure to avoid cluttering. The Virtual Entity Resolution FC mediates the
requests/responses/ subscriptions/notifications between Users and the Virtual Entity
Registry, which has a simple create/read/update/delete (CRUD) interface given the
Virtual Entity identity.
• The FCs that could perform CUD operations on the Virtual Entity Resolution FC are
the IoT Services themselves due to internal configuration, the Member Management
FC that maintains the associations as part of the system setup, and the Virtual Entity
and IoT Service Monitoring component whose purpose is to discover dynamic
associations between Virtual Entities and IoT Services.
• It is important to note that the Subscribe/Notify interaction patterns can also be
applicable to the lookup/ discovery operations, the same as the Request/Response
patterns provided the involved FCs implement Subscribe/Notify interfaces.
Deployment and operational view
Fig.5.6.Parking Lot Deployment and Operational View, Devices.
• The Deployment and Operational View depends on the specific actual use case and
requirements, and therefore we present here one way of realizing the Parking Lot
example seen earlier.
• Figure 5.6 depicts the Devices view as Physical Entities deployed in the parking lot,
as well as the occupancy sign. There are two sensor nodes (#1 and #2), each of which
are connected to eight metal/car presence sensors.
• The two sensor nodes are connected to the payment station through wireless or wired
communication. The payment station acts both as a user interface for the driver to
pay and get a payment receipt as well as a communication gateway that connects the
two sensor nodes and the payment interface physical devices (displays, credit card
slots, coin/note input/output, etc.) with the Internet through Wide Area Network
(WAN) technology.
• The occupancy sign also acts as a communication gateway for the actuator node
(display of free parking spots), and we assume that because of the deployment, a
direct connection to the payment station is not feasible (e.g. wired connectivity is too
prohibitive to be deployed or sensitive to vandalism).
• The physical gateway devices connect through a WAN technology to the Internet and
towards a data center where the parking lot management system software is hosted as
one of the virtual machines on a Platform as a Service (PaaS;) configuration.

• The two main applications connected to this management system are human user
mobile phone applications and parking operation center applications. We assume that
the parking operation center manages several other parking lots using similar physical
and virtual infrastructure.
• Figure shows two views superimposed, the deployment and functional views, for the
parking lot example. Please note that several FGs and FCs are omitted here for
simplicity purposes, and certain non-IoT-specific
Fig.5.7.Parking Lot Deployment & Operational View, Resources, Services, Virtual
Entities, Users
• Services appear in the figure 5.7 because an IoT system is typically part of a larger
system. Starting from the Sensor Devices, as seen earlier, Sensor Node #1 hosts
Resource #11#18, representing the sensors for the parking spots #01#08, while earlier
Sensor Node #2 hosts Resource #21#28, representing the sensors for the parking spots
#09#16.
• We assume that the sensor nodes are powerful enough to host the IoT Services
#11#18 and #21#28 representing the respective resources. The two sensor nodes are
connected to the gateway device that also hosts the payment service with the
accompanying sensors and actuators, as seen earlier. The other gateway device hosts
the occupancy sign actuator resource and corresponding service.
• The management system for the specific parking lot, as well as others, is deployed on
a virtual machine on a data center. The virtual machine hosts communication
capabilities, Virtual Entity services for the parking spots #01#16, the Virtual Entity
services for the occupancy sign, a payment business process that involves the

payment station and input from the occupancy sensor services, and the parking lot
management service that provides exposure and access control to the parking lot
occupancy data for the parking operation center and the consumer phone applications.
• As a reminder, the Virtual Entity service of the parking lot uses the IoT Services
hosted on two sensor nodes and performs the mapping between the sensor node
identifiers (#11#18 and #21#28) to parking spot identifiers (spot #01#16).
• The services offered on these parking spots are to read the current state of the parking
spot to see whether it is “free” or “occupied.” The Virtual Entity corresponding to the
occupancy sign contains one writable attribute: the number of free parking spots. A
User writing this Virtual Entity attribute results in an actuator command to the real
actuator resource to change its display to the new value.
Fig.5.8.Mapping IoT Domain Model concepts to Deployment View.
• Figure 5.8 shows an example of mapping an IoT Domain Model and Functional
View to Devices with different capabilities (different alternatives) connecting to a
cloud infrastructure. Alternative 1 shows devices that can host only a simple Sensor
Device and a short-range wired or wireless connectivity technology (Basic Device
#1).
• Such kind of device needs an Advanced Device of type #1 that allows the basic
device to perform protocol adaptation (at least from the short-range wired or wireless

connectivity technology to a WAN technology) so that the Sensor IoT service in the
cloud and the Sensor Resource on the Basic Device #1 can exchange information.
• The Virtual Entity representing the Physical Entity where the Basic Device #1 is
deployed is also hosted in the cloud.
• In alternative 2, Advanced Devices (type #2) can host the Sensor IoT Service
communicating to the Sensor Resource on a Basic Device #1.
• The cloud infrastructure in this case only hosts the Virtual Entity Service
corresponding to the Sensor IoT Service. The difference between alternative 1 and 2
is that the Sensor IoT Service hosted on an Advanced Device #2 should be capable of
responding to requests from Users (cloud services, Applications) with the appropriate
secure mediation of course.
• In alternative 3, the Basic Device #3 is capable of providing the Sensor Resource and
the Sensor IoT Service but still needs an Advanced Device #1 to transport IoT service
requests/responses/subscriptions/
• notifications/publications to the Users in the cloud. According to experience, this kind
of deployment scenario imposes a high burden on a Basic Device, which potentially
makes the Basic Device the weakest link in the information flow
• If malicious Users launch a Denial of Service (DoS) attack on the node, the
probability of the node going down is very high.
• Alternatives 4 and 5 show Advanced Devices offering a WAN interface.In alternative
4, only the Sensor Resource is hosted on the Device, while in alternative 5, even the
IoT Service is hosted on the Device. The Virtual Entity Service is hosted in the cloud.
• Data Representation and Visualization
• IoT Data Visualization is the technique where the raw data is presented into a more
insightful one that is derived from different data streams. It analysis the data and
looks into the certain patterns & behaviours that improves with better business
decision making. It helps to create a viable business strategy.
• The Data Visualization Helps to Unlock Multiple Insightful Values
• Helps to make real-time decisions with the combination of multiple data sources into
a single insightful dashboard with multi-layered visual data.
• Combines the new IoT data transmitted from data sensors with the existing data to
analyse and bring light to new business opportunities.
• Supports to monitor IoT devices and infrastructure for better performance on IoT data
flow.

• Helps to analyse multiple data correlations in real-time.
• Data Visualization Tools for IoT application:
• Grafana Tool:
• Grafana supports various data sources seamlessly like Elasticsearch, MySQL,
PostgreSQL, Graphite, Prometheus and so on.
• Provides time series analytics to monitor, analyze data over a period of time.
• Upbeat of this Grafana tool is it provides on-premises cloud storage or any other
cloud of your choice, which gives complete control of the infrastructure.
• Alert notification can be set up whenever an unfavourable event occurs which gets
prompt notification using any communication platform.
• It has several built-in support features like Graphite, CloudWatch, Elastic Search,
InfluxDB.
• Kibana Tool is an open source data visualization tool for analyzing large volumes of
log data. To work with Kibana tool, it needs two more technological stack which is
Elasticsearch and Logstash. It is popularly known as ELK stack, globally used log
management platform.
• Kibana Tool:
• How does Kibana Tool Work?
• Initially, the logstash is responsible to collect all the data from the various remote
sources
• Next, these data logs are then pushed and sent to the Elasticsearch
• Elasticsearch acts as the database to the kibana tool with all the log information
• Finally, Kibana tool presents these log data in the form of pie charts, bar or line
graphs to the user.
• Highlights of Kibana:
• Canvas visualization gives colorful visual data comprising of different patterns, texts
known as workpad. Kibana also represents data in the form of bar chart, pie chart,
heat map, line graph and so on.
• Contains Interactive dashboards and easily it can be converted into reports for future
references
• Create visualization with the help of several dev tools where you can work with
indexes to add, delete and update the data.

• Timelion, a timeline visualization tool helps to get the historical data and compare
them with current data for getting deeper analysis.
• Supports third-party plugins and to get near to real experience view, it effectively uses
coordinate and region maps
• Power BI Tool for Real-Time Data Visualization
• Microsoft’s product PowerBI is a popular Business Intelligence Tool. Like its
predecessors, Tableau and other BI tools, it provides a detailed analysis reports for
large Enterprises. Power BI comes with a suite of products with Power BI desktop,
mobile Power BI apps and Power BI services for SaaS.
• Power BI Desktop – Helps to create reports
• Power BI Services – Helps to Publish those reports
• Power BI mobile app – Help to Views the reports and dashboards
• How does Power BI work?
• First, the data is collected from the external data sources. With ‘Get Data’ option it
allows you to get information from various sources including Facebook, Google
Analytics, Azure Cloud, Salesforce etc. Also, it provides ODBC connection to get
ODBC data as well.
• Using Power BI, you can create visualization in 2 ways, one is by adding from the
right-side panel to the report canvas which is in a table type visualization format or by
simple drag and drop of value axis under visualization. Once the report is developed,
it can be published to web portal with the help of Power BI service. We can access the
report, export it in pdf, excel or any preferred format.
• Highlights of Power BI:
• Though PowerBI offers paid services, it is comparatively cheaper than other BI tools.
It offers free services upto 1GB storage
• Helps to analyse both streaming and static data
• Provides rich data visualization
• Short learning curve
• Provides IoT integrations
• Industrial Automation

• Industrial automation is all about intelligent process control. The IoT doesn’t depend
on your hardware because you can choose independent control systems, sensors, and
network components. The IoT’s power goes beyond the limited features and
functionalities your device manufacturer or software provider offers. Those who use
the IoT in industrial automation processes can connect multiple sites and locations so
that they operate in harmony. Industrial automation is well-known for diverting
technology from the commercial sphere and adapting it to new ends. The industry’s
widespread IoT adoption builds upon this tested concept in numerous ways:
• Wireless Improvement of Existing Monitoring and Control Systems
• Wireless connectivity makes it simpler to implement complex control systems in
awkward, remote or hazardous environments. For instance, using wired networks to
link remotely controlled cranes, robot arms and other manufacturing devices can be
problematic due to their unique ranges of motion and exposure to harsh fabrication
environments. The IoT’s compatibility with wireless technology lets enterprises
replace standard linkages with fully enclosed mesh radios that perform the same
functions. Even better, these alternatives may be more useful for automation
processes that require fine-tuning or ongoing adjustments. For instance, you don’t
have to replace miles of Ethernet cable to achieve higher transmission speeds with
Wi-Fi.
• Building Factories That Build and Run Themselves
• Growth has decided on the pros and cons. Although few experiences beat the thrill of
taking your organizational training wheels off and cruising along, doing business at a
higher volume introduces unique risks, such as the potential for greater waste should
you take a wrong turn. A company that wanted to conserve resources might use an
industrial sensor system to tell it when to shut down auxiliary production lines. An
enterprise that relies on automated stock machines to transport replacement parts to
workstations could employ a connected framework to initiate new deliveries without
waiting for approval from a line manager. The IoT also makes it possible to create
digital twins. These replicas of existing systems serve as testbeds for new projects and
experiments.
• Managing Communications Whenever the Need Arises
• The IoT enhances traditional automation schemes by making everything on-demand.
When you make a change from a control dashboard, you get to see its effects ripple
outward right away. What you might not expect is that the system also performs the
innumerable tedious tasks that facilitate good digital communication, such as
• • Rerouting traffic to keep data moving no matter how much information happens to
be passing through,
• • Accounting for the effects of network topologies to sustain optimized service
quality,

• • Accommodating vendor-neutral communication protocols and schemes to support a
wider variety of hardware and software,
• • Self-detecting equipment failures and automatically switching to functional network
elements, and
• • Duplicating and storing data as necessary to prevent catastrophic losses.
• Although this kind of work may get overlooked because it goes on in the background,
it’s an essential part of ensuring that automation frameworks behave deterministically.
When your industrial communication systems behave consistently, sound
management practices prove easier to execute.
• Decentralizing Debugging and Maintenance
• There’s no shortage of industrial automation maintenance philosophies to choose
from, so debugging can get confusing. IoT mesh networks help stakeholders handle
maintenance more logically. You can debug, tweak and maintain controllers and
sensors from local network nodes to cut down on overhead and make the best use of
limited bandwidth. Decentralized maintenance is the glue that helps automation
systems stick together and run seamlessly even as they expand. By using the IoT to
program functions at the node level, you can optimize resource usage and slash costs
for a more productive enterprise.
• Investing in the IoT in Industrial Automation Settings
• Internet of Things technologies offer a spectrum of other potential benefits that we
haven’t even covered. There are voice-recognition systems that let factory owners
authenticate themselves and implement complex behaviours without any manual
programming. Embedded and linked networks contribute to improved lifecycle
oversight, demand-specific customization and better cost control, but choosing the
best-equipped IoT layout and technical components can be a tough task. Optimality
isn’t universal. It’s defined by the circumstances, so you need to move forward with
an eye on building something that’s sufficiently flexible yet robust enough to survive
the unexpected.
• Interaction and Remote control
• IoT devices produce many types of information, including telemetry, metadata, state,
and commands and responses. Telemetry data from devices can be used in short
operational timeframes or for longer-term analytics and model building. (For more on
this diversity, read the overview of Internet of Things.)
• Many devices support local monitoring in the form of a buzzer or an alarm panel on-
premises. This type of monitoring is valuable, but has limited scope for in-depth or
long-term analysis. This article instead discusses remote monitoring, which involves
gathering and analysing monitoring information from a remote location using cloud
resources. Operational and device performance data is often in the form of a time
series, where each piece of information includes a time stamp. This data can be
further enriched with dimensional labels (sometimes referred to as tags), such as
labels that identify hardware revision, operating time zone, installation location,
firmware version, and so on.
• Time-series telemetry can be collected and used for monitoring. Monitoring in this
context refers to using a suite of tools and processes that help detect, debug, and
resolve problems that occur in systems while those systems are operating. Monitoring
can also give you insight into the systems and help improve them.
• The state of monitoring IT systems, including servers and services, has continuously
improved. Monitoring tools and practices in the cloud-native world of microservices
and Kubernetes are excellent at monitoring based on time-series metric data. These
tools aren't designed specifically for monitoring IoT devices or physical processes,
but the constituent parts—labelled series of metrics, visualization, and alerts—all can
apply to IoT monitoring.
• Remoteness
• Unlike servers in a cluster, monitored devices might be far from the systems that are
organizing the metric data and providing visualizations. There is debate in the
monitoring community about push-based versus pull-based collection methods for
monitoring telemetry. For IoT devices, push-based monitoring can be more
convenient. But you must consider the trade-offs in the entire stack (including things
like the power of the query language, and the efficiency and cost of the time-series
storage) when you choose which metrics framework to use. For example, do you have
complex query requirements or do you just need visibility of current telemetry?
• In either approach, a remote device might become disconnected from the monitoring
system. No effective monitoring can occur if data isn't flowing. Stale and missing
metrics can hamper the value of a metric series where you might be calculating rates
or other types of values derived over time. When you're monitoring remote devices,
it's also important to recognize that variation in timestamps is possible and to ensure
the best clock synchronization possible. The following diagram shows a schematic of
remote devices, with centralized monitoring compared to cluster-based monitoring.
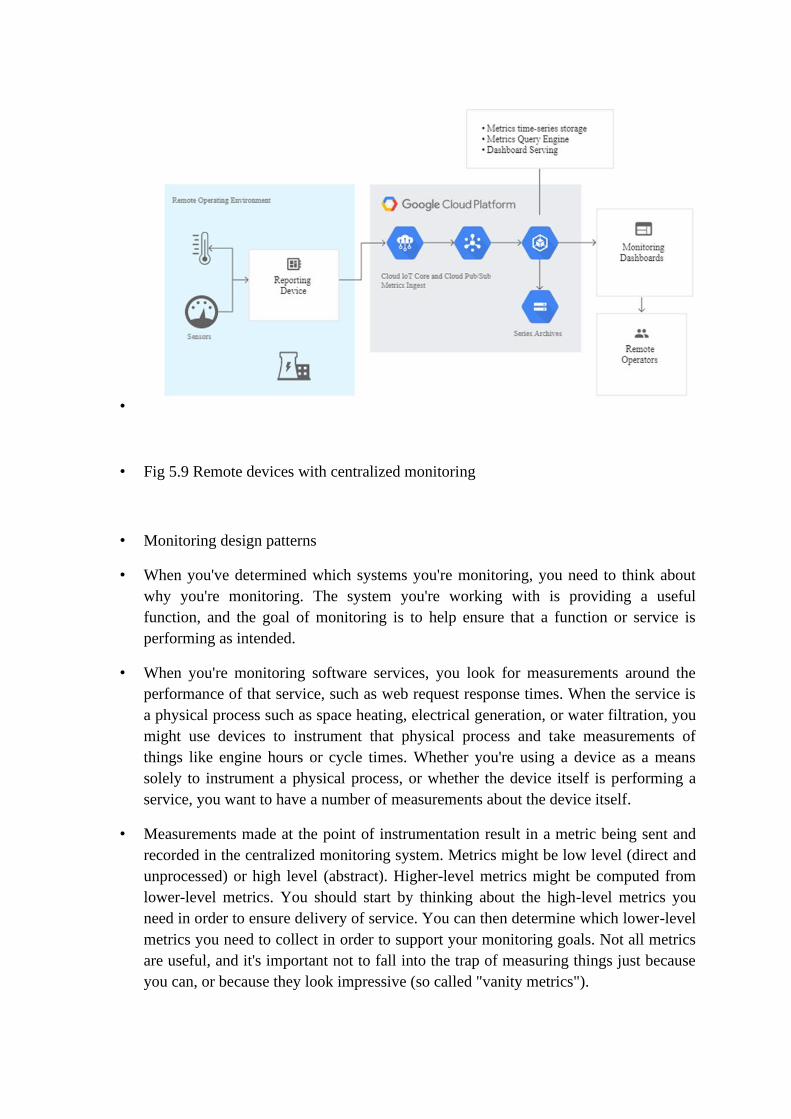
•
• Fig 5.9 Remote devices with centralized monitoring
• Monitoring design patterns
• When you've determined which systems you're monitoring, you need to think about
why you're monitoring. The system you're working with is providing a useful
function, and the goal of monitoring is to help ensure that a function or service is
performing as intended.
• When you're monitoring software services, you look for measurements around the
performance of that service, such as web request response times. When the service is
a physical process such as space heating, electrical generation, or water filtration, you
might use devices to instrument that physical process and take measurements of
things like engine hours or cycle times. Whether you're using a device as a means
solely to instrument a physical process, or whether the device itself is performing a
service, you want to have a number of measurements about the device itself.
• Measurements made at the point of instrumentation result in a metric being sent and
recorded in the centralized monitoring system. Metrics might be low level (direct and
unprocessed) or high level (abstract). Higher-level metrics might be computed from
lower-level metrics. You should start by thinking about the high-level metrics you
need in order to ensure delivery of service. You can then determine which lower-level
metrics you need to collect in order to support your monitoring goals. Not all metrics
are useful, and it's important not to fall into the trap of measuring things just because
you can, or because they look impressive (so called "vanity metrics").

• Good metrics have the following characteristics:
• They're actionable. They inform those who operate or revise the service when they
need to change its behaviour.
• They're comparative. They compare the performance of something over time, or
between groups of devices whose members are in different location or have different
firmware or hardware versions.
• They're understandable and relevant in an operational context. This means that in
addition to raw values like totals, they can provide information like ratios and rates.
• They provide information at the right resolution. You can choose how often you
sample, how often you report, and how you average, bin, and graph your metrics.
These values all need to be chosen in the domain context of the service you're trying
to deliver. For example, providing 1-second reporting on an IoT device's SD card
capacity generates a lot of unnecessary detail and volume. And looking only at CPU
load averaged per hour will absorb and hide short, service-crushing spikes in activity.
There might be periods of troubleshooting where you dial up the fidelity of metrics
for better diagnostics. But the baseline resolution should be appropriate for what you
need in order to meet your monitoring needs.
• They illuminate the difference between symptoms, causes, and correlations across
what you're measuring. Some measurements are leading indicators of a problem, and
you might want to build alerting on those. Other measurements are lagging indicators
and help you understand what has happened; these measurements are often used for
exploratory analysis.
•
• Service Oriented Architecture
• What is Service?
• • A mechanism enabling the provisioning of access to one or more capabilities
described in service description
• • An Interface for the service providing the access to capabilities
• • Has a service description about the capabilities
• • Applications or enterprise can subscribe on selection among number of services
• • A service level agreement (SLA) binds the enterprise application and service
• A collection of self-contained, distinct and reusable components
• • Providing the logically grouped and encapsulated functionalities. Example: Traffic
lights synchronizing service

• Service Oriented Architecture (SOA)
• • Software architecture model consisting of Services, Messages, Operations and
Processes.
• • SOA components distribute over a network or Internet in a high-level business
entity.
• • SOA enables development of new business Applications and Applications
integration architecture in an Enterprise.
• • Models the number of services and interrelationships.
• •Each service initiates on messages from a process or service.
•
•
Fig 5.10 Service Oriented Architecture of cloud based IoT services
• Enterprise Layer in SOA
• •Cmmunicates with business processes sub-layer for Applications Integration
• • Communicates with Service Discovery, Service Selection and Services
Orchestration layer
• Service Discovery, Selection and Orchestration Layer

• •Communicates with (i) web Services, (ii) IoT Services, (iii) Cloud of things and (iv)
Cloud
• •Components select the services for Applications Integration
• • Service Orchestration software coordinates the execution of the number of services,
cloud services, cloud IOT services and web services. Services run in parallel and a
number of processes in sequences.
• Cloud of things sublayer and cloud sublayer communicates with services
• Service Orchestration software sublayer
• •Enables Services run in parallel as well as a number of processes in sequences.
• SOA based device integration
• By extending the web paradigm to IoT devices, they can become a natural component
of building any application and facilitate an easy integration of IoT device services
into any enterprise system that is based on the SOA (e.g., that uses web services or
RESTful interfaces).
• Integration Services
• „ An architectural and implementation approach to integration using Web services
and SOA
• „ Data Integration Service – provides data integration between multiple applications.
Initiated by a legacy system in which data has changed. Frequently implemented as
Publish and Subscribe.
• „ Functional Integration Service – provides shared functionality between multiple
applications. Initiated by the application requiring the functionality.
• „ Integration services provide interface to existing application
• „ Interface granularity influenced by existing applications
• „ Synchronous Invocation is common
• „ ACID Transactions may be required
• „ Not exposed directly to business services
• • These services are wrapped by business components or other services. They hide
internal API’s, data models and application topology. They enhance, modify or
combine existing functionality.
• Case study: phase one-commercial building automation today
• Example 1: LED based lights for grid and off-grid applications

• Description of the ICT technology deployed
• Abundant sunshine in Africa and India is providing a solid basis for low-voltage
solar-powered lighting to serve those with little or no grid access in rural and
mountainous areas. In situations where grid-based power is available, LED lights help
reduce power consumption, while in situations where access to the grid-based power
is not available, LED luminaires connected to solar panels can serve as decentralised,
self-sufficient light sources. Solar-powered lanterns eliminate the hazards (fires,
burns, fumes, spills and explosions) of conventionally fuelled lanterns. In addition,
LED lights also reduce maintenance needs, including primping fuel pumps and
replacing mantles.
• Hyderabad, India-based MIC Electronics Limited designs, develops and manufactures
LED lighting solutions for urban and rural areas. In addition, the company sells LED-
based video displays, text, graphic animation displays, and display services including
LED video walls.
• The company's solar LED Lantern consists of a built-in handle, a 6V, 4AH
rechargeable battery, a 2.5-watt photovoltaic solar panel, and a cluster of diffused
5MM white LED from Japanese manufacturer Nichia Corporation, with a life-span of
100,000 hours. The solar panel collects energy during the daytime and charges the
battery, with an energy conversion efficiency of more than 80%. A dead battery
requires 13 hours of bright sunlight to be fully charged, and a fully charged battery
offers 8 to 12 hours of illumination. Users can expect 500 charges before battery
replacement is necessary. The lantern and solar panel weigh 2.06 pounds. The lantern
is made from ABS Plastic. A 3W solar lantern of MIC gives out about 300 lumens of
output, which enables customers to attend to household works, read and go outdoors.
• The company also produces luminaires for street lights, which can offer 50% energy
savings, low-heat radiation, and improved safety because of low voltage. MIC
Electronics sells solar-powered LED street lighting systems, and solar LED home
lighting systems that include battery storage for non-electrified rural areas and
emergency backup power.
• Detailed description of projects
• MIC has installed solar powered street lights in the village of Serilingampally on the
outskirts of Hyderabad, as well as through partnerships with the Chhattisgarh
Renewable Energy Development Agency, Karnataka Renewable Energy
Development Limited and Haryana Renewable Energy Development Agency.
• On a trial marketing basis, MIC has also supplied grid-based LED indoor and outdoor
lights to Maruti Udyog Limited, Mahindra & Mahindra, ITC Limited, Steel Authority
of India Limited, Singareni Collieries Company Limited, Punjab Energy
Development Agency, Andhra Pradesh Industrial Infrastructure Corporation Limited,
National Institute of Rural Development, TVS Motor Company and CRI Pumps.

• MIC's grid-based street lights are undergoing evaluation in Pittsburgh, Pennsylvania,
and the Blair Athol Community Centre in Campbell, Australia.
• Case 1: Portable Solar Lanterns in rural areas. Public sector enterprise Indian Oil
Corporation (IOC) is engaged in refining, marketing and retailing of petrol and diesel
products across the country through its 17,000 outlets. The government of India,
through companies including IOC, is subsidizing the cost of kerosene, which is one of
the main fuels for cooking and lighting applications of the rural population of the
country. IOC is looking for alternative and renewable sources of energy, and has
helped MIC launch sales of solar powered portable lanterns. MIC has entered into
MOUs with IOC in seven states of India in order to help the government reduce the
cost of the subsidies to kerosene.
• Case 2: LED indoor lights and lanterns for the state of Bihar: Beltron Telecom Green
Energy Systems, a subsidiary of Beltron Telecommunications Limited (BTL), signed
an agreement with MIC in May 2010 to deploy lighting systems in off-grid
applications in rural areas of the state of Bihar. BTL uses biofuel-powered generators
as part of a rural electrification program, using paddy fodder and paddy husk to
provide 3 to 4 hours of electricity a night. MIC's solar powered portable LED lights
are expected to enhance the utility of the lighting systems in rural Bihar by extending
the duration of light availability in the night and also in the early hours of the day. The
LED based lanterns and fixed indoor lights can be charged through solar power
panels, community charging centres, and through biofuel powered generating stations.
These facilities will help reduce end user costs. MIC has signed a Memorandum of
Understanding (MoU) with BTGES to supply solar lanterns in large quantities.
• Case 3: Off-grid applications in railways: Indian Railways, the largest railway
network in the world, decided to replace the luminaires in the railway coaches with
LED lights to reduce the cost of replacing and maintaining the lights, which are
expected to last for 15 years. LED coach lights also reduce the power consumption
from the existing level of 1527 watts to 609 watts, resulting in sizeable savings to
Indian Railways because of the reduction of battery capacities. MIC says it is the only
Indian company to have supplied the full spectrum of coach lights to Indian Railways.
• Cost-benefits analysis
• The government of India is reported to spend about Rs.38,000 crore per year on
kerosene subsidies. Residents can purchase three litres at the subsidized price of Rs.11
per litre, and then four more litres at Rs.33 per litre. A typical rural household needs 6
to 7 litres of kerosene for lighting applications. The distribution deal with IOC enables
MIC to supply portable lanterns with solar panels for an end-user price of about
Rs.2000 per lantern. The battery, which costs around Rs.150, needs to be replaced
every four years. Without subsidies, users can get back their investments within a
year. MIC says the lanterns, when properly taken care of, can be useful for 12 to 15
years.

•
• Example 2: Autonomously-powered, energy harvesting sensors and communication
systems for use in building automation systems
• Description of the ICT technology deployed
• Widespread use of energy-harvesting sensors is still fairly limited, but is expected to
grow. A number of companies are developing technology to address demand for these
sensors in commercial and industrial buildings. This example focuses on projects
done by a German company called EnOcean.
• EnOcean manufactures and markets energy harvesting technology, sensors, and RF
(radio frequency) communication systems. Common applications for EnOcean
components include wireless switches, sensors, actuators, controllers, gateways, and
integrated building management systems. Its products are based on a combination of
miniaturized energy converters, ultra-low-power electronic circuitry, and reliable
wireless links. Its devices use ambient energy, avoiding the need for batteries or other
sources of power, and are capable of transmitting signals up to 300 meters.
• Its battery free sensors and communication platform operates as a single solution for
building and home automation, lighting, industrial, automated meter reading and
environmental applications.
• Detailed description of projects
• Here are a few examples of applications where this kind of ICT technology is in
action:
• BSC Computer GmbH headquarters, Allendorf, Germany: BSC Computer chose to
automate its corporate headquarters in Allendorf, north Hesse. The solution included
window handles based on EnOcean wireless. The status of all sensors is visualized by
BSC BoSe software on a touch panel and by a client at each workstation. BSC BoSe
is also able to control all other devices, for example lights, the entire data processing
installation and other loads such as coffee makers or copiers. Putting the controller PC
on the internet means that all functions can be queried and controlled remotely, by
SMS or e-mail. BSC BoSeMobile, a client for conventional mobile phones, enables
all supervisory and controlling functions to be performed from a cellphone. Also
connected to the BoSe system are IP cameras that transmit single shots and live video
streams by UMTS/GPRS. Access to the system requires authorization, and is
protected by a key. Lighting, heating and ventilation are governed by a step 7
controller, connected to EnOcean components. Building automation is linked on a
BSC BAP (IP gateway) to the S7. These components and the alarm system are
controlled by the BSC software. The use of an air/heat pump with appropriate
insulation together with the new controller cut energy costs in the corporate building
of BSC by about 80%. The investment of -35,000 is estimated to have a payback of
four years.
• Hotel Kempinski, Dubai, UAE: The five-star Kempinski Hotel in Ajman wanted to
retrofit its entrance and bar area. The upgrades desired were a new, comfortable and
energy-efficient lighting system and interior automation. The hotel installed solar-
powered lux sensors and a remote control - for automatic operation and facility
management - based on EnOcean technology, as well as a control system for
dimmers. The existing fittings were replaced by new fittings with a more efficient
aluminum reflector and provided with electronic control for a compact fluorescent
lamp that enabled the wattage in the lobby to be reduced from 80 W to 18 W with an
increase in light output. Furthermore, to increase energy efficiency, a combination of
lux sensor field devices was introduced, enabled by batteryless and wireless EnOcean
communications with centralized phase-dimming controls of the existing lighting
circuits for the halogen areas.
• Retirement home, Bilbao, Spain: EnOcean technology was used to reduce energy
consumption and control the operating costs in a retirement home in the Spanish city
of Bilbao. Next to hospitals, senior and nursing homes rank among the public
buildings with the highest power consumption because of constant occupancy of the
rooms, higher indoor temperatures than in a private household, and special health
requirements of course. To keep proper tabs on their energy and operating costs, the
realty developers of a retirement home in the north-Spanish city of Bilbao decided on
the assistance of EnOcean's wireless technology. This works entirely without
batteries, making it fully service-free and repositioned at any time without building
work. EnOcean-enabled products were installed in all 24 rooms of the retirement
home: solar-powered presence detectors, window contacts, temperature controllers
and EnOcean/LON gateways. The presence sensors ensured that lighting is controlled
to match the occupancy, while wireless window contacts ensure that heating or air-
conditioning are turned off as soon as a window is opened. The air temperature in a
number of rooms, bathrooms for instance, is controlled separately according to
specified times and temperatures by a thermostat.
• Olympic Village, Whistler, Canada: The development was designed to have a flexible
floor plan to accommodate a variety of uses without the expense of retrofits. Whistler
was the host mountain resort of the Vancouver2010 Winter Olympic and Paralympic
Games. Cheakamus Crossing, a residential community located in Whistler,
reconfigured its walls to accommodate the athletes by converting living areas into
bedrooms for the athletes, but afterwards the residences reverted to their original
designs. Unexpected challenges surfaced when the installed wireless lighting controls
failed to function properly-light switches in one unit were turning the lights on and off
in neighboring town homes because there were too few channels available.
Traditional wired solutions were estimated to cost $75,000 ($1,000 for each of the 75
units). The installers then found Echoflex Solutions, which would save 70% of the
installation cost by integrating EnOcean-enabled controls. The development installed
75 self-powered light switches and 75 relay receivers, with unique IDs provided by
EnOcean to correct the misplaced transmission issue. In addition, it was estimated that

the use of EnOcean technology would save money when it came to restoring the town
homes after the Olympics were over because the modellers will be able to remove and
re-mount the switches without having to worry about any wiring.
• Cost-benefits analysis
• This type of technology offers two forms of cost saving: reduced energy consumption,
and cheaper installation than wired devices. At the BSC Computer headquarters in,
Allendorf, Germany, the -35,000 investment in energy efficiency upgrades is
estimated to have a payback of four years. At the Olympic Village in Whistler,
Canada, use of wireless-enabled controls reduced the cost for installing 75 light
switches by 70% compared to traditional wired devices, a savings of $52,000.
•
• Example 3: Smart ballast control for high intensity discharge lighting
• Description of the ICT technology deployed
• HID lighting (high intensity discharge lighting) is used to illuminate large spaces such
as big-box retail stores, factories, and freeways. HID lighting constitutes 22% of
electricity used for lighting applications in the U.S.
• While HID may be challenged in the years ahead by LED and other lighting
advances, it represents a significant installed base of the world's current systems.
Retrofitting these systems to lengthen life and improve energy efficiency is therefore
highly attractive.
• Israeli firm Metrolight has developed such a solution, consisting of a sophisticated
electronic ballast with an integrated communication interface. Utilizing a central
software control, the system monitors the lamp and ballast status, defines schedules
for dimming, and can switch lamps on and off. The product allows for the analog as
well as digital dimming. The company's products range from 20w to 1000w and have
compact form factors to provide for integration into systems.
• Detailed description of projects
• Changi Prison Complex, Singapore, correctional facility case study: The original
Changi Prison was constructed in 1936 as a civilian prison. In 2000, the prison was
demolished and the redevelopment of the Changi Prison Complex (CPC) project
began. The complex has the capacity to accommodate 23,000 inmates. The main
lighting requirements for the streets and fence area of the new cluster at Changi Prison
included reduced maintenance, lighting control and energy saving capabilities. The
prison installed Metro light’s 250w Smart HID electronic ballast, together with a
lighting control and monitoring system. The lighting control system using photocells,
cameras, sensors and motion detectors was operated by one central monitoring station
that communicated with the individual lamps through an Ethernet system. The lamps

were programmed to operate at 40% dimming, except when incidents such as fence
tampering occurred and the lights automatically increased to full power.
• BauMax DIY retail store case study: Baumax AG is one of the leading and fastest
growing DIY chains in the Central Eastern European region, with 130 stores in
Austria and Central Eastern Europe. Several years ago, bauMax began implementing
an energy saving campaign, and found that its annual energy spend was -4.14 million,
with lighting constituting over 50% of energy expenses. BauMax initially deployed
6,000 Metro light systems in 39 stores, later expanding it to 30,000 units across its
stores that could be centrally controlled from the head office. Metro light reduced
lamp power in the stores from 400w to 280w, while allowing control and dimming
capabilities. Metro light’s systems allowed lumens to go unchanged for 20,000 hours
of operation.
• London Borough of Tower Hamlets - West Ferry Circus street lighting case study:
The London Borough of Tower Hamlets council is responsible for the design,
installation and maintenance of streetlights and traffic signals. West ferry Circus has
an underground roundabout that is lit 24/7/365. The underground roundabout lighting
system was originally comprised of 400w magnetic ballasts and 246 luminaires
operating 24 hours a day, 7 days a week, 365 days a year. The annual lighting-related
energy cost was £106,800. The council asked Metro light to introduce energy-saving
lighting solutions to the underground roundabout while also improving the light
quality. Metro light installed 186 of its 400w HPI-T lamps, with ballasts programmed
to operate at 80% of full power.
• AB&I Foundry industrial case study: In 2008, Lockheed Martin's Heavy Industry
Energy Efficiency Program performed a site audit at the AB&I Foundry Oakland
Plant to assess the possibility of improving the efficiency of the lighting system and
evaluate potential energy savings opportunities. The foundry is more than 100 years
old, and its lighting system was not upgraded for the 10-15 years. The foundry's
annual cost of operations was approximately $180,000, with a substantial portion of
costs attributed to continuous lighting in many areas for safety, security and
surveillance monitoring. Its installed lighting consisted of 1,000- and 400-watt metal
halide (MH) high bay fixtures. Metro light’s Electronic HID technology was chosen
for the project. The 1,000- and 400-watt MH fixtures in the production areas, storage
areas and shops were replaced with 450- and 320-watt electronic ballasts MH fixtures.
Additional energy savings were gained through the use of dimming schedules. Using
the internal pre program capabilities of the ballast and an external timer, the input
wattage of the ballasts were further programmed to dim to 269w and 160w according
to a predetermined energy saving schedule.
• Cost-benefit analysis
• Changi Prison Complex, Singapore, correctional facility case study: The solution
provider claimed to have doubled the life of the installed lamps, leading to reduced

maintenance. The lighting system enabled a 44% saving on energy and approximately
a 50% decrease in maintenance costs. The overall project had a payback of 2.8 years.
• BauMax DIY retail store case study: The installations produced a 40% energy savings
and a 50% decrease in maintenance costs, with a payback of 2.5 years. The annual
energy spend was reduced from -4.14 million to -2.47 million, resulting in savings of
-1.6 million. Approximately 15,891,200 kWh of energy use were prevented in total.
• London Borough of Tower Hamlets - West Ferry Circus street lighting case study:
The annual energy cost was reduced to £34,800-a yearly savings of £72,000. Metro
Light estimates total energy savings of 63%, while maintenance costs were reduced
by 50%. The payback for the installation was 2.5 years.
• AB&I Foundry industrial case study: In all, the project represented a total annual
saving of $102,486, or 732,000 kwH/yr, and a simple payback of 1.52 years. The
installation also reduced peak demand by 97.6 kWpeak.
•
• Case study: phase two- commercial building automation in the future.
• Technologies such as Internet of Things (IoT) and Building Automation are playing a
major role in advancing homes of tomorrow, providing spaces that respond intuitively
to occupants’ requirements and automatically adjust to their individual demands.
• As people continue to spend more time indoors, homes have morphed into becoming
the centre of their world, where people live, work and fulfil their entertainment needs.
A fully automated home, integrated with innovative technologies can provide a
complete sense of safety and security.
• Picture walking into this house –
• A facial recognition enabled building entrance followed by a door entry system that
lets you access your apartment without the touch of your finger. As you enter the
living room, the blinds are adjusted according to the weather outside, they go down as
the sun sets and the lights switch to aid better navigation. A smart light control system
that monitors the lights in individual rooms across the entire house, depending on the
movement. As soon as your presence is detected by presence detectors connected to
the building automation system the HVAC system adjusts the temperature for your
comfort. The system also regulates the air by eliminating germs and viruses, thus
making indoor air healthier to breathe. Safe and reliable flow of electricity between all
applications in the building is guaranteed by the protection devices in the electrical
installation, safeguarding people and equipment from any damage.
• This is what buildings of the future will look like - where you would actually be able
to access these features at the touch of a button.

• Automated buildings and digitized intelligent systems are also capable of ensuring the
safety and security of their occupants.
• A presence simulation solution works as a deterrent against burglars and also notifies
the owner about any noise and movement detected indoors or if a window or a door
has been left ajar. For instance, a smart facial recognition solution identifies users
accessing a space. An intelligent building learns from its occupant’s preferences and
behaviour to adjust ventilation, oxygen and temperature, which also helps to increase
energy efficiency. In case of an emergency, the path guidance system is even able to
take over the sign posting of the escape routes.
• Smart buildings can also guide occupants to their destination.
• When the person enters the building, the facial recognition is able to identify and
direct the person to the designated space. Matching to the stored data, the building can
then identify the ideal workspace and reserve it on the calendar. The person is
accordingly guided to their workstation, while the intelligent system sensors
customize the working environment for the user: light, oxygen content and
temperature are adjusted, based on the experiences of the individual preferences from
past working days. The building always learns and continues to optimize the building
automation actions according to personal preferences and behaviour.
• Smart buildings can help achieve sustainability targets by reducing energy
consumption and utility costs.
• Thanks to connecting all applications where energy is consumed to the building
management system facilities and management teams can access, monitor and control
all the major installed building power assets. With that they are able to operational
efficiency by working on data which reveals information on how the building has
performed so far and where network improvements have to be made.
• Internet of Things (IoT) and Building Automation are playing a huge role in creating
well-engineered and automated buildings and homes that offer comfort, relaxation,
security and productivity. And, with these technologies continuously evolving, the
possibilities are endless for both workplaces and homes of the future — systems that
not only make life easier but also help manage costs and reduce carbon footprint.