
Simulating the effect on the energy efficiency of smart grid technologies
Upload
khangminh22Category
view
2download
0
123
Al-Sakib Khan PathanZubair Md. FadlullahMohamed Guerroumi (Eds.)
Smart Gridand Internet of ThingsSecond EAI International Conference, SGIoT 2018Niagara Falls, ON, Canada, July 11, 2018Proceedings
256
Lecture Notes of the Institutefor Computer Sciences, Social Informaticsand Telecommunications Engineering 256
Editorial Board
Ozgur AkanMiddle East Technical University, Ankara, Turkey
Paolo BellavistaUniversity of Bologna, Bologna, Italy
Jiannong CaoHong Kong Polytechnic University, Hong Kong, Hong Kong
Geoffrey CoulsonLancaster University, Lancaster, UK
Falko DresslerUniversity of Erlangen, Erlangen, Germany
Domenico FerrariUniversità Cattolica Piacenza, Piacenza, Italy
Mario GerlaUCLA, Los Angeles, USA
Hisashi KobayashiPrinceton University, Princeton, USA
Sergio PalazzoUniversity of Catania, Catania, Italy
Sartaj SahniUniversity of Florida, Florida, USA
Xuemin Sherman ShenUniversity of Waterloo, Waterloo, Canada
Mircea StanUniversity of Virginia, Charlottesville, USA
Jia XiaohuaCity University of Hong Kong, Kowloon, Hong Kong
Albert Y. ZomayaUniversity of Sydney, Sydney, Australia

More information about this series at http://www.springer.com/series/8197

Al-Sakib Khan Pathan • Zubair Md. FadlullahMohamed Guerroumi (Eds.)
Smart Gridand Internet of ThingsSecond EAI International Conference, SGIoT 2018Niagara Falls, ON, Canada, July 11, 2018Proceedings
123

EditorsAl-Sakib Khan PathanSoutheast UniversityDhaka, Bangladesh
Zubair Md. FadlullahTohoku UniversitySendai, Miyagi, Japan
Mohamed GuerroumiUniversity of Science and TechnologyHouari BoumedieneBab Ezzouar, Algeria
ISSN 1867-8211 ISSN 1867-822X (electronic)Lecture Notes of the Institute for Computer Sciences, Social Informaticsand Telecommunications EngineeringISBN 978-3-030-05927-9 ISBN 978-3-030-05928-6 (eBook)https://doi.org/10.1007/978-3-030-05928-6
Library of Congress Control Number: 2018964131
© ICST Institute for Computer Sciences, Social Informatics and Telecommunications Engineering 2019This work is subject to copyright. All rights are reserved by the Publisher, whether the whole or part of thematerial is concerned, specifically the rights of translation, reprinting, reuse of illustrations, recitation,broadcasting, reproduction on microfilms or in any other physical way, and transmission or informationstorage and retrieval, electronic adaptation, computer software, or by similar or dissimilar methodology nowknown or hereafter developed.The use of general descriptive names, registered names, trademarks, service marks, etc. in this publicationdoes not imply, even in the absence of a specific statement, that such names are exempt from the relevantprotective laws and regulations and therefore free for general use.The publisher, the authors, and the editors are safe to assume that the advice and information in this book arebelieved to be true and accurate at the date of publication. Neither the publisher nor the authors or the editorsgive a warranty, express or implied, with respect to the material contained herein or for any errors oromissions that may have been made. The publisher remains neutral with regard to jurisdictional claims inpublished maps and institutional affiliations.
This Springer imprint is published by the registered company Springer Nature Switzerland AGThe registered company address is: Gewerbestrasse 11, 6330 Cham, Switzerland
Preface
We are very delighted to introduce the proceedings of the second edition of 2018European Alliance for Innovation (EAI) International Conference on Smart Grid andInternet of Things (SGIoT). This conference has attracted and brought togetherresearchers, developers, and practitioners from different parts of the globe, who arecurrently exerting their efforts in developing smart grid and IoT technologies.
The technical program of SGIoT 2018 consisted of 14 full papers, including oneinvited paper in oral presentation sessions in the main conference track and oneworkshop on Applications and Technologies in Big Data (ATBD 2018). In addition tothe high-quality technical paper presentations, the technical program also featured twokeynote speeches. The invited speakers for the keynote speeches were Dr. Salama Ikkifrom Lakehead University, Thunder Bay, Ontario, Canada, and Dr. Andriy Miranskyyfrom Ryerson University, Ontario, Canada. The ATBD workshop in the conferenceaimed to address various aspects of techniques and applications in big data research andprovide a forum for the presentation and discussion of innovative ideas, researchresults, applications, and experience from around the globe as well as highlightactivities in the related areas.
Coordination among the steering chair, Imrich Chlamtac, and the steering members,Al-Sakib Khan Pathan, Zubair Md. Fadlullah, and Salimur Choudhury, was essentialfor the success of the conference. It was also a great pleasure to work with such anexcellent organizing team, all of who did their parts in organizing and supporting theconference. In particular, the contribution of the Technical Program Committeemembers, led by the TPC chairs, Dr. Salimur Choudhury and Dr. Akramul Azim, easedthe paper review and selection process and also helped in preparing the programschedule. We sincerely appreciate all the key members’ sincere support. Last but notthe least, we are also very grateful to the Conference Manager, Radka Pincakova, forher constant support and all the authors who submitted their papers to SGIoT 2018 andtraveled a long distance to present their papers.
We strongly believe that the SGIoT conference provides a good platform for allresearchers, students, developers, and practitioners to discuss all scientific and tech-nological aspects relevant to smart grid and IoT. We also expect that future SGIoTconferences will be as successful and stimulating as indicated by the contributionspresented in this volume.
Al-Sakib Khan PathanZubair Md. FadlullahMohamed Guerroumi

Organization
Steering Committee
Chair
Imrich Chlamtac Bruno Kessler Professor, University of Trento, Italy
Members
Al-Sakib Khan Pathan Southeast University, BangladeshSalimur Choudhury Lakehead University, Thunder Bay, Ontario, CanadaZubair Md. Fadlullah Tohoku University, Japan
Organizing Committee
General Co-chairs
Al-Sakib Khan Pathan Southeast University, BangladeshZubair Md. Fadlullah Tohoku University, Japan
TPC Chair and Co-chair
Salimur Choudhury Lakehead University, Thunder Bay, Ontario, CanadaAkramul Azim University of Ontario Institute of Technology, Canada
Sponsorship and Exhibit Chair
Homero Toral Cruz University of Quintana Roo, Mexico
Local Chair
Salimur Choudhury Lakehead University, Thunder Bay, Ontario, Canada
Workshops Co-chairs
Md. Zakirul Alam Bhuiyan Fordham University, USAMostafa Fouda Benha University, Egypt
Publicity and Social Media Chair
Mubashir Husain Rehmani COMSATS Institute of Information Technology,Wah Cantt, Pakistan
Publications Chair
Mohamed Guerroumi University of Science and Technology HouariBoumediene, Algeria

Web Chair
Rasib Khan Northern Kentucky University, USA
Posters and PhD Track Chair
Nurilla Avazov Inha University, South Korea
Technical Program Committee
Iftekhar Ahmad Edith Cowan University, AustraliaShawkat Ali The University of Fiji, Lautoka, FijiAbdulRahman Alsamman University of New Orleans, USAFarrokh Aminifar University of Tehran, IranVijayan K. Asari University of Dayton, USAMd. Atiqur Rahman Ahad Dhaka University, BangladeshPaolo Bellavista University of Bologna, ItalyJosu Bilbao IK4-IKERLAN, SpainJohn Canning University of Technology Sydney (UTS), AustraliaAbdelouahid Ahmed
DerhabKing Saud University, Saudi Arabia
Khalid Elgazzar Carnegie Mellon University, USAOmar Farooq Aligarh Muslim University, IndiaLim Tiong Hoo Universiti Teknologi Brunei, BruneiMuhammad Khurram Khan King Saud University, Saudi ArabiaQurban Ali Memon UAE University, Al-Ain, UAETamer M. Nadeem Virginia Commonweath University, USAM. A. Rashid Massey University Albany, New ZealandAbdur Razzaque Dhaka University, BangladeshShariful Shaikot Microsoft, USAMohiuddin Ahmed Canberra Institute of Technology, AustraliaShafiullah Khan Kohat University of Science and Technology, PakistanHae Young Lee DuDu IT, South KoreaKaran Singh Jawaharlal Nehru University, IndiaJunaid Chaudhry Security Research Institute, Edith Cowan University,
AustraliaSabu M. Thampi Indian Institute of Information Technology
and Management – Kerala, IndiaHoussem Mansouri University of Ferhat Abbas Setif1, AlgeriaSofiane Hamrioui University of Nantes, FranceYousaf Bin Zikria Yeungnam University, South KoreaAmjad Anvari-Moghaddam Aalborg University, DenmarkM. M. Hafizur Rahman King Faisal University, Saudi ArabiaZahoor Khan Higher Colleges of Technology, UAEChen Chen Argonne National Laboratory, USAMohamed Sellami ISEP, FranceAli Balador Mälardalen University, Sweden
VIII Organization

Contents
Smart Grid and Internet of Things
An Implementation of Harmonizing Internet of Things (IoT) in Cloud. . . . . . 3Md. Motaharul Islam, Zaheer Khan, and Yazed Alsaawy
IoT Big Data Analytics with Fog Computing for Household EnergyManagement in Smart Grids . . . . . . . . . . . . . . . . . . . . . . . . . . . . . . . . . . . 13
Shailendra Singh and Abdulsalam Yassine
Secured Cancer Care and Cloud Services in IoT/WSNBased Medical Systems . . . . . . . . . . . . . . . . . . . . . . . . . . . . . . . . . . . . . . 23
Adeniyi Onasanya and Maher Elshakankiri
Privacy Preserving for Location-Based IoT Services . . . . . . . . . . . . . . . . . . 36Yue Qiu and Maode Ma
Smart Home Security Application Enabled by IoT: Using Arduino,Raspberry Pi, NodeJS, and MongoDB . . . . . . . . . . . . . . . . . . . . . . . . . . . . 46
Chad Davidson, Tahsin Rezwana, and Mohammad A. Hoque
An MQTT-Based Scalable Architecture for Remote Monitoringand Control of Large-Scale Solar Photovoltaic Systems . . . . . . . . . . . . . . . . 57
Salsabeel Shapsough, Mohannad Takrouri, Rached Dhaouadi,and Imran Zualkernan
A Smart Meter Firmware Update Strategy Through Network Codingfor AMI Network . . . . . . . . . . . . . . . . . . . . . . . . . . . . . . . . . . . . . . . . . . 68
Syed Qaisar Jalil, Stephan Chalup, and Mubashir Husain Rehmani
Protected Bidding Against Compromised Information Injectionin IoT-Based Smart Grid . . . . . . . . . . . . . . . . . . . . . . . . . . . . . . . . . . . . . 78
Md Zakirul Alam Bhuiyan, Mdaliuz Zaman, Guojun Wang,Tian Wang, Md. Arafat Rahman, and Hai Tao
A Chain Based Signature Scheme for Uplink and DownlinkCommunications in AMI Networks . . . . . . . . . . . . . . . . . . . . . . . . . . . . . . 85
Samer Khasawneh and Michel Kadoch
Robustness Situations in Cases of Node Failure and Packet CollisionEnabled by TCNet: Trellis Coded Network - A New Algorithmand Routing Protocol. . . . . . . . . . . . . . . . . . . . . . . . . . . . . . . . . . . . . . . . 100
Diogo F. Lima Filho and José R. Amazonas

Applications and Technologies
Effectiveness of Hard Clustering Algorithms for Securing Cyber Space . . . . . 113Sakib Mahtab Khandaker, Afzal Hussain, and Mohiuddin Ahmed
On Data Driven Organizations and the Necessity of Interpretable Models. . . . 121Tony Lindgren
A Multi-factor Authentication Method for Security of Online Examinations . . . 131Abrar Ullah, Hannan Xiao, and Trevor Barker
Evaluation Metrics for Big Data Project Management . . . . . . . . . . . . . . . . . 139Munir Ahmad Saeed and Mohiuddin Ahmed
Author Index . . . . . . . . . . . . . . . . . . . . . . . . . . . . . . . . . . . . . . . . . . . . 143
X Contents

Smart Grid and Internet of Things

An Implementation of HarmonizingInternet of Things (IoT) in Cloud
Md. Motaharul Islam1,2(B), Zaheer Khan3, and Yazed Alsaawy2
1 Department of Computer Science and Engineering, BRAC University,Dhaka, Bangladesh
[email protected] Islamic University of Madinah AlMadinah, Medina, Kingdom of Saudi Arabia
[email protected] Khana-e-Noor University, Pole Mahmood Khan Shash Darak kabul,
Kabul, [email protected]
Abstract. With the evolution of Internet of Things (IoT), everything isgoing to be connected to the Internet and the data produced by IoT, willbe used for different purposes. Since IoT generates huge amount of data,we need some scalable storage to store and compute the data sensed fromthe sensors. To overcome this issue, we need the integration of cloud andIoT so that the data might be stored and computed in a scalable envi-ronment. Harmonization of IoT in Cloud might be a novel solution inthis regard. IoT devices will interact with each other using ConstrainedApplication Protocol (CoAP). All the IoT devices will be assigned IPaddresses for unique identification. In this paper, we have implementedharmonizing IoT in Cloud. We have used CoAP to get things connectedto each other through the Internet. For the implementation we haveused two sensors, fire detector and the sensor attached with the doorwhich is responsible for opening the door. Thus the proposed implemen-tation will be storing and retrieving the sensed data from the cloud. Wehave also compared our implementation with different parameters. Thecomparison shows that our implementation significantly improves theperformance compared to the existing system.
Keywords: Harmonization · Cloud · Internet of ThingsConstrained application protocol · Smart environment · Arduino shield
1 Introduction
Nowadays everything is getting smarter. With the evolution of the Internet ofThings (IoT), the demand for users to use smart things are increased. In order tomake things and environment smarter and connected the researchers are thinkingto assign IP addresses [1] to all the smart devices [2]. These devices will havethe capabilities of sensing and actuating the environment. Since huge amount ofc© ICST Institute for Computer Sciences, Social Informatics and Telecommunications Engineering 2019
Published by Springer Nature Switzerland AG 2019. All Rights Reserved
A.-S. K. Pathan et al. (Eds.): SGIoT 2018, LNICST 256, pp. 3–12, 2019.
https://doi.org/10.1007/978-3-030-05928-6_1

4 M. M. Islam et al.
data is sensed by the sensor from the smart environment we have to store andprocess it for further data analytics. To store the data cloud storage is a verygood and reliable alternative.
Data from sensed environment would be transferred to the storage throughHypertext Transfer Protocol (HTTP) which is designed for the Internet devices.It consumes more time in case of GET and POST method. In this connection,a novel framework has been suggested to cooperate cloud-level IoT services ona smart device with the concept of Intention [3]. Captured data from sensorswere stored in local machines. A repository might be used for storing the statusof the sensors. The sensed data might be stored in the cloud using HTTP ifrequired. In this paper concept of local repository is eliminated. A cloud basedarchitecture is proposed where data will be stored in the cloud. Using cloudstorage instead of physical storage will make it more reliable. If the data isstored in the cloud the aspect of physical damages and security will be enhancedas well. Internet and some gateways [4] might be used to connect the sensors tothe cloud for storing and retrieving the required information. In order to providethe connection between the sensors some well-known protocols might be used.
For sensor-based connections two protocols are preferable Message QueueTelemetry Transport (MQTT) and Constrained Application Protocol (CoAP).In this paper we have introduced CoAP for the connectivity purpose instead ofusing HTTP. Using CoAP protocol in the connectivity area will make the systemfaster. On the other hand, CoAP protocol is designed for resource constraintsmart devices where HTTP was designed for the traditional internet devices. Inthis paper CoAP is used to harmonize sensors with cloud in such a way thatdata taken from one of the sensor is a command towards next sensor in orderto make an alert for smart doors in smart environment. Harmonization is theprocess of joining more than one devices to perform a single task. Harmonizingmeans that input is applied from different sources and output is combined by agroup of sensors. Here, we harmonize two sensors to perform the task of alertingthe doors if fire exists.
In the harmonization process cloud acts as a remote storage and IoT devices(e.g. sensors) act as actuators in the smart environment. The sensed data iscollected from the environment and transferred to the cloud through CoAP inorder to update the status of the sensors in the cloud. In this paper smart doors’sensors checks its’ status in the cloud. If the status’s value is above the definedthreshold. Smart doors will be opened automatically for the fire exit. Two typesof sensors will be used to control this scenario, smoke sensors and the sensorsattached with the smart doors. The smoke sensor will be responsible to detect theexistence of fire. If fire exists, it will send the sensed value to the cloud storage.In the storage the sensor will have a status and the value of its status will beinitialized to the standard value. This value indicates that the temperature up tothis threshold will be normal. If the sensed value passed to the storage is greaterthan defined threshold value then the status will be updated to that sensed value.The sensor attached with the door continuously checks the status of the smoke

An Implementation of Harmonizing Internet of Things (IoT) in Cloud 5
detector sensor. If it figures out that the status value is greater than definedthreshold value, the door sensor will alert the door to be opened urgently.
Since the smart doors are opened automatically it may affect the security ofthe building. To ensure the security sensors may be placed inside the buildingand more specifically inside the room so the smart doors are controlled by thesensors inside the room. No sensor outside the building will be able to controlthe door.
The main contributions of this paper are as follows:
– We have proposed cloud based architecture for harmonizing IoT.– We have implemented the architecture using CoAP.– We have analyzed and compared our implementation with HTTP using dif-
ferent cloud platforms.– We have compared CoAP with MQTT and have shown the suitability of
CoAP over MQTT considering some text comparisons.– We have compared CoAP with HTTP and the comparison shows that by
using CoAP, performance has been increased by 33.76% and 11.45%, 10.83%and 19.98%, 10.52% and 16.92% using GET and POST methods respectivelyfor Google cloud, Thingspeak and 000Webhost.
The rest of the paper is organized as follows. Section 2 reviews related works.System architecture is presented in Sect. 3. Section 4 describes algorithmic analy-sis. Section 5 represents the layered architecture of the proposed system. Section 6shows the way of implementation. Section 7 shows the experimental evaluation.Finally Sect. 8 concludes the paper.
2 Related Works
Seung Woo Kum et. al. proposed IoT device delegate system [3]. This IoT devicedelegate has a database to store the information of devices. Device delegatecreates data channel from the devices so that data can be streamed. An IntentionManager is also proposed. It makes decision for which action will be performedbased on request from the devices. For acquiring data via data channel, theyhave used HTTP.
IoT devices have limited communication and processing capabilities due tothe energy consuming communication, small physical factors, battery operations,and long lifetime expectations. The concept is that, devices transfer data usingsensors for communication between them. There are various types of sensors forvarious purposes. It is difficult to use same protocols for all of them. A multi-protocol receiver is proposed [10]. This receiver retrieves data simultaneouslyfrom different communication technologies like WiFi, ZigBee, and Bluetooth.The data is stored and processed in local database (i.e MySQL). For back endanalysis, they have used cloud and for transferring data to cloud HTTP has beenused. However, the receiver has been used in terms of multi-protocol context.The data was also stored in local machines.

6 M. M. Islam et al.
Cloud Computing and IoT are currently two of the most popular ICTparadigms that are expected to shape the next era of computing. The conver-gence between cloud computing and IoT has become a hot topic over the last fewyears because of the benefits that IoT could have from the distributed natureof cloud computing infrastructures. This paper [13] proposes a new platform forusing cloud computing capacities for provision and support of ubiquitous connec-tivity and real-time applications and services for smart cities’ needs. We presenta framework for data procured from highly distributed, heterogeneous, decen-tralized, real and virtual devices (sensors, actuators, smart devices) that canbe automatically managed, analyzed and controlled by distributed cloud-basedservices.
The authors had proposed IoT and cloud based healthcare system [11]. Thiswas a wearable system. In this system, they had used textile accelerometers,a temperature sensor, a heartbeat chest and Arduino open hardware micro-controller platform called LilyPad. Arduino microcontroller collects data fromsensors and data is passed to android-based mobile phone through Bluetoothinterface. An application is also developed for android that collects data andsends it to cloud.
HTTP is specifically designed for internet devices not for the constraintdevices. In this paper we migrate the local storage to the cloud storage. Theintention is alarming one device based on other device. There is no need ofintention manager. In order to establish the connection between the sensors andthe cloud storage CoAP is used. As devices used (e.g. sensors) are constrained,CoAP is more suited protocol over HTTP. Here multi-protocol receiver systemis not required as we will use single device with a single protocol. Researchersused local database for storing data. Here storage is cloud.
In this paper sensors will be connected through WiFi. The data will bestored and processed in cloud. As the sensor will act on processed data that arebeing sent from cloud intention manager is not required. Additional hardwarerequirements are eliminated (e.g. local storage devices). This reduces the costand helps to prevent hardware revisions. As the data is automatically passingfrom one sensor to another, there is no need of user interaction. Here CoAP isused as an application layer protocol. CoAP is more suited to very small sensordeployments with tiny hardware and completely different security.
3 System Architecture
The proposed architecture is depicted in Fig. 1. The step by step functionalityof the proposed architecture is explained as follows:
i We have used two sensors as shown in the architecture given in the Fig. 1 forfire detection and for controlling the door (i.e. Alerting the door to be openedif fire exists).
ii In order to connect the sensors to the Internet for exchanging the dataArduino is used as an intermediate device. Arduino will be programmed to

An Implementation of Harmonizing Internet of Things (IoT) in Cloud 7
perform the required task. Arduino and the sensors are connected through aWiFi shield.
iii CoAP protocol is used for exchanging data between sensors through cloud.iv The fire/smoke detector will store the sensed data into the cloud storage,
where the status of the sensor is stored to point out the existence of fire.v The sensor attached with the door is responsible to alert the door to be
opened in case the existence of fire. This sensor will be getting the alertinformation regarding fire existence from the cloud storage. The door sensorwill be continuously checking the status of the fire sensor, if it detects thestatus to be on (i.e Indication of existence of fire) immediately smart doorswill be opened for the exit.
vi For Cloud Service there can be several platforms (e.g. Google Cloud, Things-peak, 000Webhost, Amazon, Microsoft Azure etc.). In our work, we will useGoogle cloud for getting the cloud facilities.
Fig. 1. Proposed architecture of harmonizing IoT in Cloud.
4 Algorithmic Analysis
We have proposed two algorithms to show the overall functionality of the system.Algorithm 1 for smoke detector shows the overall responsibility and the func-
tionality of the smoke sensor. The variable sensor status given in Algorithm 1,shows the status of the smoke sensor. This variable is shared between the smokesensor and the sensor attached with the door. As given in the algorithm, the

8 M. M. Islam et al.
sensor is sensing the environment continuously and if the sensor’s sensed valueis greater than defined threshold value (i.e. Indication of fire existence) then itwill update its status (i.e. Shared variable) in the storage.
The Algorithm 2 explains that how the sensor attached with door will getnotification regarding existence of fire. The sensor attached with the door iscontinuously checking the status (i.e. shared variable) of the smoke sensor and ifit finds out that the value of the shared variable is greater than defined thresholdvalue then immediately it will alert the door to be opened for the fire exit.
5 Layered Architecture of the Proposed System
The architecture of IoT as shown in Fig. 2 is considered to be multilayered. Thereare basically three layers with Perception layer, Network layer and Applicationlayer. There are two more layers: Middleware layer and Business layer [7,8].
Perception Layer. Perception layer is the lowest layer of the architecture. Themain task of this layer is to sense the data. At first the object must be identifiedand then collect the data from the objects for example sensors. In our model,fire sensor will continuously sense the environment to figure out the existence offire.
Network Layer. From Perception layer data is passed to network layer. Networklayer gathers data from lower layer and sends it to the Internet. In network layerthere is a gateway, with two interfaces, one connected to the sensor and otherto the Internet [6].

An Implementation of Harmonizing Internet of Things (IoT) in Cloud 9
Fig. 2. Layered architecture of harmonizing IoT.
Application Layer. Application layer is for the user level interaction, it providesthe service for the collected data from the sensors. This layer consists of appli-cation support platform and concrete applications [7]. In our proposed modelthe application layer has been divided into two parts, the application itself andapplication layer support platform.
Application (Alarming the door). This part will provide the service of open-ing the door in case of any emergency exit due to existence of fire in the building.
Application Support Platform. We have used Cloud Server as an applicationsupport platform for the end sensors.
6 Way of Implementation
Data from IoT pass to cloud for being stored and later on the stored data isused in order to perform the desired task (i.e. alerting the door to be openedin case of any fire existence). Source Code for the implementation is written inarduino programming and is installed into a WiFi arduino shield to interact withthe devices. Devices for example sensors produce a lot of data at every moment.It is irrelevant to store all the data as it is not necessary. In order to over-come this problem a smart gateway would help for better utilization of data andcloud resources [4]. There are two types of architecture for web services, REp-resentational State Transfer (REST) and Service-Oriented Architecture (SOA).SOAs are often used to model and realize complex business flows. In this paperREST architecture is used. The RESTful protocols are CoAP and HTTP. HTTPuses HTTP-similar standardized methods. For interacting with things for exam-ple doors and sensors, CoAP is used which is designed for constrained devices.Many commercial and open source platforms are available for IoT and cloudimplementation [5].
10 M. M. Islam et al.
7 Experimental Evaluations
We have done some experiments on both the methods. Comparing CoAP withHTTP using GET and POST methods, CoAP requires less amount of time.The experiment is done on Google cloud storage [15], Thingspeak [16] and000webhost [17].
Figure 3 x-axis and y-axis represents per request and time in millisecondsrespectively. As shown in the graph, HTTP requires more time than CoAP bothin GET and POST methods. Here Google Cloud storage is used to store thedata. In case of GET and POST methods, HTTP requires 554 ms, 1520 ms andCoAP requires 367 ms and 1346 ms respectively.
Figure 4 shows the comparison between HTTP and CoAP when Thingspeakstorage is used. As shown in the graph for GET method, HTTP requires 1902ms where CoAP requires 1696 ms and in case of POST method, HTTP requires1266 ms where CoAP requires 1013 ms.
Fig. 3. Comparison of HTTP and CoAP protocols based on GET and POST methodusing Google Cloud as a Storage.
Fig. 4. Comparison of HTTP and CoAP protocols based on GET and POST methodusing Thingspeak as a Storage.

An Implementation of Harmonizing Internet of Things (IoT) in Cloud 11
Fig. 5. Comparison of HTTP and CoAP protocols based on GET and POST methodusing 000webhost as a Storage.
Figure 5 shows that for GET and POST methods, HTTP requires 2415 ms,1389 ms and CoAP requires 2161 ms, 1154 ms respectively using 000webhost asa storage.
Finally we can say that in each stage of comparison HTTP is more time con-suming while interacting through GET and POST methods. We have introducedthe implementation of our work using CoAP where it requires less time and isfaster than HTTP.
8 Conclusions and Future Works
In this paper we present an idea to harmonize two sensors such that they willinteract with each other and act on output produced by one of the sensor. Oneis to detect the existence of fire and the other one acts on the output of the firedetector sensor. Which is used to control the door in case of existence of fire.Here we have stored the sensed data in the cloud. We do not have local storage.Hence the system becomes cloud based. In our implementation the performancehas been increased compared to the existing system. In our future work, we aregoing to implement and commission the proposed idea in a smart environmentfor commercial uses.
References
1. Islam, M.M., Huh, E.-N.: Sensor proxy mobile IPv6 (SPMIPv6) – a novel schemefor mobility supported IP-WSNs. Sensors 2(11), 1865–1887 (2011)
2. Islam, M.M., Huh, E.-N.: A novel addressing scheme for PMIPv6 based globalIP-WSNs. Sensors 11(9), 8430–8455 (2011)
3. Kum, S.W., Moon, J., Lim, T., Park, J.: A novel design of IoT cloud delegateframework to harmonize cloud-scale IoT services. IEEE International Conferenceon Consumer Electronics (ICCE), pp. 247–248 (2015)

12 M. M. Islam et al.
4. Aazam, M., Hung, P.P.: Cloud of things integrating internet of things and cloudcomputing and the issues involved. In: The proceedings of 11th IEEE InternationalBhurban Conference on Applied Sciences and Technology (IBCAST), pp. 414–419(2014)
5. Botta, A., de Donato, W., Persico, V., Pescape, A.: On the integration of cloudcomputing and internet of things. In: The 2nd International Conference on FutureInternet of Things and Cloud (FiCloud), pp. 23–30 (2014)
6. Chong, G., Zhihao, L., Yifeng, Y.: The research and implement of smart homesystem based on internet of things. In: International Conference on ElectronicsCommunications and Control (ICECC), pp. 2944–2947 (2011)
7. Khan, R., Khan, S.U., Zaheer, R., Khan, S.: Future internet the internet of thingsarchitecture, possible applications and key challenges. In: 10th International Con-ference on Frontiers of Information Technology (FIT), pp. 257–260 (2012)
8. Wu, M., Lu, T.-J., Ling, F.-Y., Sun, J., Du, H.-Y.: Research on the architecture ofInternet of things. In: 3rd International Conference on Advanced Computer Theoryand Engineering (ICACTE), vol. 5, pp. V5–484 (2010)
9. Gunasagarana, R., et al.: Internet of things sensor to sensor communication. In:IEEE Sensors, pp. 1–4 (2015)
10. Su, J.-H., Lee, C.-S., Wu, W.-C.: The design and implementation of a low-cost andprogrammable home automation module. IEEE Trans. Consum. Electron. 52(4),1239–1244 (2006)
11. Leva, T., Mazhelis, O., Suomi, H.: Comparing the cost-efficiency of CoAP andHTTP in Web of Things applications. Decis. Support Syst. 63, 23–38 (2014)
12. Daniel, L., Kojo, M., Latvala, M.: Experimental evaluation of the CoAP, HTTPand SPDY transport services for internet of things. In: Fortino, G., Di Fatta, G., Li,W., Ochoa, S., Cuzzocrea, A., Pathan, M. (eds.) IDCS 2014. LNCS, vol. 8729, pp.111–123. Springer, Cham (2014). https://doi.org/10.1007/978-3-319-11692-1 10
13. Suciu, G., Vulpe, A., Halunga, S., Fratu, O., Todoran, G., Suciu, V.: Smart citiesbuilt on resilient cloud computing and secure internet of things. In: 19th Interna-tional Conference Control Systems and Computer Science (CSCS), pp. 513–518(2013)
14. Zanella, A., Bui, N., Castellani, A., Vangelista, L., Zorzi, M.: Internet of things forsmart cities. IEEE Internet Things J. 1(1), 22–32 (2014)
15. Google Cloud Homepage. https://www.cloud.google.com. Accessed 20 Feb 201816. Thingspeak Homepage. https://www.thingspeak.com. Accessed 20 Feb 201817. 000Webhost Homepage. https://www.000webhost.com. Accessed 20 Feb 201818. Thangavel, D., Ma, X., Valera, A., Tan, H.X., Tan, C.K.: Performance evaluation
of MQTT and CoAP via a common middleware. In: IEEE Ninth InternationalConference on Intelligent Sensors Sensor Networks and Information Processing(ISSNIP), pp. 1–6 (2014)

IoT Big Data Analytics with FogComputing for Household Energy
Management in Smart Grids
Shailendra Singh1 and Abdulsalam Yassine2(B)
1 Department of Electrical and Computer Engineering, Lakehead University,955 Oliver Road, Thunder Bay, ON P7B 5E1, Canada
[email protected] Department of Software Engineering, Lakehead University,
955 Oliver Road, Thunder Bay, ON P7B 5E1, [email protected]
Abstract. Smart homes generate a vast amount of data measurementsfrom smart meters and devices. These data have all the velocity andveracity characteristics to be called as Big Data. Meter data analyticsholds tremendous potential for utilities to understand customers’ energyconsumption patterns, and allows them to manage, plan, and optimizethe operation of the power grid efficiently. In this paper, we propose aunified architecture that enables innovative operations for near real-timeprocessing of large fine-grained energy consumption data. Specifically,we propose an Internet of Things (IoT) big data analytics system thatmakes use of fog computing to address the challenges of complexitiesand resource demands for near real-time data processing, storage, andclassification analysis. The design architecture and requirements of theproposed framework are illustrated in this paper while the analytics com-ponents are validated using datasets acquired from real homes.
Keywords: Internet of Things · Cloud computing · Fog computingBig data analytics · Energy management · Smart grids
1 Introduction
The combination of IoT and big data analytics technology is expected to shapethe decision-making processes in various industries [1]. As IoT systems expandto smart city applications that demand instantaneous actions, processing enor-mous data in near real-time to satisfy the stringent requirements of smart cityfunctions becomes a challenging prospect. One solution is to use cloud-basedsystems since there is an abundance of computing and storage resources for var-ious computationally intensive applications that need processing of high volumeof data on the fly. However, attaining real-time responses from a cloud systemis practically difficult due to the inherited latency of the underlying transportc© ICST Institute for Computer Sciences, Social Informatics and Telecommunications Engineering 2019
Published by Springer Nature Switzerland AG 2019. All Rights Reserved
A.-S. K. Pathan et al. (Eds.): SGIoT 2018, LNICST 256, pp. 13–22, 2019.
https://doi.org/10.1007/978-3-030-05928-6_2

14 S. Singh and A. Yassine
communication network which has significant impact on time-sensitive applica-tions [2–5]. Fog computing fundamentally resolves latency issues by processingand storing data at the edge of the cloud system [3,6]. Furthermore, fog comput-ing nodes are resource-efficient because they are equipped with virtual machinetechnologies capable of continuously processing fresh IoT streams of data andtransfer the processed data to the cloud for further processing. These nodes playa key role in the IoT ecosystem to support the processing of big data for nearreal-time responses. As a result, IoT big data analytics begin to leverage fogcomputing infrastructure to handle the data on the fly, with low latency.
In this paper, we propose a unified architecture that enables innovative opera-tions for near real-time processing of enormous fine-grained data. As a compellingapplication of such architecture, we focus on developing a scalable IoT big dataanalytics with fog computing for processing and analyzing household energyconsumption data for smart grids. Through smart meters and sensor devices,households generate continuous streams of massive amount of data in short timeintervals. A large part of these data is attributed to home appliances and plug-in electric vehicles. Processing and analyzing these data is vital for smart gridenergy management applications that aim at reducing cost and greenhouse gasemissions [7,8]. However, the implementation of home data analytics can bequite costly for a large number of consumers. The total computational effortrequired to perform data analytics for each consumer over time at fine-grainedintervals is enormous. This is extremely challenging for utilities trying to adoptanalytics to find the right consumers for an energy management program, letalone the heterogeneity of consumers’ energy consumption behaviors [12,13]. Tocope with such analytics complexities, several research studies, such as thosein [10,11,15,18] and [19], have proposed IoT platforms with dedicated resourcesfrom fog and edge computing nodes to perform the analytical computations. Themain idea is to be as close as possible to the source where data is generated.While such approaches are genuine, they tackle the latency issue only, but notnecessarily applicable for handling a large volume of incoming data that requiresorchestration of various application requirements. For example, residential Auto-matic Demand Response (ADR) applications require energy consumption dataabout appliances in residential homes to be analyzed in near real-time to engagethem in demand response signals effectively [9]. Other smart grid applicationsthat require predictive analytics need access to historical data which must bestored in a large database that only can be provided by a cloud system [14].
We present an Internet of Things (IoT) big data analytics platform with fogcomputing that is capable of managing, analyzing and transforming householdenergy consumption data into actionable insights. The proposed system, whichacts as a hub for metered consumption and event data originating from house-hold energy systems, is well suited to support huge data and computationally-intensive, always-on applications. It addresses the challenges of complexities andresource demands for near real-time data processing as well as the requirementsof scalability with the growing volume of data and the temporal granularity ofdecision making. The advantages of such a platform lie in the ability of serving

IoT Big Data Analytics with Fog Computing 15
multiple households within a neighborhood at the same time which means thatwe can process multiple home appliances in parallel. Thus allowing us to analyzedata faster and engage home appliances in smart grid applications (e.g. ADR)in a timely manner.
The rest of the paper is organized as follows: In Sect. 2, we present thecomponents of the proposed platform followed by a study case in Sect. 3. Finally,in Sect. 4 we conclude the paper and provide direction for future work.
2 Platform Overview
2.1 Requirements and Functionalities
As mentioned earlier, utility companies are facing simultaneous streams of datafrom multiple household devices and metering systems. The design of an inno-vative platform that is suited to support a huge amount of energy for smart gridenergy management applications posses peculiar requirements, functionalities,and design structures.
– IoT energy metering streams should be handled in a parallel manner to boostthe performance of data analytics and to optimize the smart grid dynamicenergy management operations. Depending on the analytics activity, the spe-cific requirements include elastic resource acquisition, efficient data networkmanagement, data reliability, and functional data abstractions.
– Data processing should make full use of all computational resources to addressperformance challenges of near real-time computation algorithms such as find-ing hidden patterns and produce new, faster and richer knowledge.
– Home appliance data changes over time due to the changing consumptionbehavior of consumers. As a result, an automated data ingestion pipelinemust support dynamic data acquisition at variable rates and volumes andbe adaptive to current data sources and operational needs. This high-speedpipeline should process all incoming time-series data, applies simple datatransformations, and outputs the processed data.
The main challenges for satisfying the above requirements especially for nearreal-time energy management applications are in the development of a platformcapable of processing and analyzing large volume of energy consumption datastreaming from various sources. Next section describes the proposed platform.
2.2 Platform Components
In Fig. 1, we present an IoT big data analytics with fog computing platform thatsupports complex operation of continuous integration, processing and analyticsof multiple household energy consumption data.
16 S. Singh and A. Yassine
Fig. 1. IoT big data analytics with fog computing
The architecture is mainly composed of four sub-systems that enable themanagement of household energy consumption data in near real-time. Thesemodules are as follows:
– IoT data acquisition: In the proposed model, data is acquired from house-hold appliances through data acquisition modules or the smart meter dis-aggregated data services. In either case, IoT protocols such as machine-to-machine (M2M)/Internet of Things (MQTT) are responsible for transportingthe data between home appliances and the IoT gateway. An IoT gateway actsas a broker that connects IoT home devices to the IoT management entitythat bridges the communication to the fog nodes.
– IoT Management and Integration Services: The IoT management ser-vices play a mediating role for transferring data from IoT devices to Fog com-puting nodes and then to the cloud system. They are protocol independentand are mainly responsible for maintaining continuity and flexibility for thewhole IoT ecosystem. The frequency of data transfer is generally applicationspecific. For example, smart meter data are collected in intervals of 15 minwith various resolutions. The integration services provide application pro-gramming interfaces (APIs) with external systems. There are many benefitsfor decoupling the analytical components of the fog nodes from the exter-nal systems. Such decoupling assures security since users would not be ableto have any direct access to the analytical engine. Also, it adds abstractingdata and interoperability by enabling the use of data for various user-specificapplications including mobile and desktop applications.
– Fog Computing Nodes: The fog node is a resource-efficient computationalentity that supports rapid analytics of energy consumption data for nearreal-time smart grid applications. Among the main function of the fog node

IoT Big Data Analytics with Fog Computing 17
is pre-processing collected IoT data and sending the aggregated results tothe cloud or directly to the serviced applications. By doing so, the fog nodesincrease the ability of the platform to manage an integrated array of ana-lytics for smart grid applications in highly automated ways which result insignificant savings for the grid operator. Also, utilities can design and developtheir applications using fog nodes that offer abundance elasticity to enhanceperformance, redundancy and storage devices that make the scaling prob-lem of energy consumption analytics much easier to handle. We should notethat the method of allocating fog nodes to households is beyond the scopeof this paper. However, optimization mechanisms such as those in [16,17]may be employed to determine the optimal distribution and configuration offog nodes while taking into consideration the computational resources andcapability of processing the required data from multiple homes. In the caseof configuring more than one household to a single fog node, privacy andsecurity of information is often considered an issue which can be tackled bymechanisms such as those in [20,21,23,24] and [25] should be considered.
– Cloud System: Household energy consumption management and data ana-lytics is a complex operation that requires continuous integration of multiplesources to a common processing system with easy access to data. In theproposed platform, energy consumption from many fog nodes is aggregatedat the cloud system which provides additional computations for large dataprocessing.
2.3 Data Analytics Engine
The data analytics engine in our platform performs all the short-term analyticsat the edge of the cloud system. Energy consumption time-series data acquiredfrom IoT streams are processed as they arrive at the analytical engine. Theprocessing of this data can be divided into three main stages: pre-processing,pattern mining, and classification.
In pre-processing stage all IoT streams are filtered, parsed and translatedinto a unified data structure for further analysis. At this stage, raw data whichcontains millions of high time-resolution energy records are transformed into apre-defined resolution for each appliance, while recording usage duration, aver-age load, and energy consumption. The decision for determining the resolution(5 min, 15 min, 30 min, etc.) is provided and configured by the user. In the secondstage, frequent pattern mining techniques are conducted on the data to discoverthe occurrence of appliance correlation in a dataset. The main idea here is touncover appliance relationships that affect energy consumption behavior. Fre-quent pattern mining searches for these recurring patterns in a given dataset todetermine associations and correlations among patterns of interest [22]. In ourplatform, the data analytics engine uses both the FP-growth mechanism andthe Apriori algorithm to discover appliance associations in the form of frequentpatterns and association rules, respectively.
18 S. Singh and A. Yassine
In clustering stage, we employ an unsupervised form of classification whichis capable of distinguishing classes of appliances which are learned from the data[22]. There are various clustering approaches such as hierarchical clustering,centroid-based or partitional distribution clustering, distribution-based cluster-ing, and density-based clustering. In our model, we extend the k-means, which isa partitional distribution clustering algorithm, to discover appliance-time asso-ciations. Our goal is to provide a critical analysis of consumer energy consump-tion behavior concerning preferences on time of energy usage. Appliance-timeassociations can be defined with respect to hour of day, time of day, weekday,week, month and/or season. Determining the appliance-time associations, foran appliance, can be considered as a grouping of sufficiently close applianceusage time-stamps, when that appliance has been recorded as active or opera-tional, to form classes or clusters. The clusters or classes constructed will describeappliance-time associations while respective size of clusters, defined as the countof members in the cluster, will establish the relative strength for the clusters.The strength or size of the cluster will indicate how frequently and when agiven appliance has been used by consumer, which indicate personal preferences.Therefore, discovery of appliance-time associations can be translated into clus-tering of appliances’ operating time-stamps into brackets of time-spans, whereeach cluster belongs to an appliance with respective time-stamps (data points)as members of the cluster. Finally, the results of the above mentioned stagesare send to the cloud system which is freed for computationally intensive tasks,especially where the analysis of historical data and large datasets is concerned.
3 Case Study and Analysis
We conducted extensive experiments using household energy consumption datafrom smart meters using the real dataset [26]. We present sample results indica-tive of our observations. Figures 2 and 3 show the energy consumption patternsfor Toaster and Home Theater over hour-of-day, time-of-day, weekday, monthand season. The outcome of the frequent pattern mining is the associationamong appliances that are the result of the simultaneous use of the applianceby occupants. Figure 4 show the result of clustering operation that is part ofpossible behavioral predictive analytics, which can be conducted at fog nodes.The figure exhibit, appliance to hour-of-day associations for Toaster that weredetermined by clustering of the time-stamps where the toaster was registeredoperating. Further, when we compare Figs. 2 and 4, we notice that the outcomeof clustering analysis successfully captures the appliance usage patterns that aredirect reflection of occupants energy consumption behavior. This is in additionto the appliance-to-appliance associations learned through frequent pattern min-ing that comprehensively represent energy usage behavioral traits of occupants.Similar results were obtained for appliance to time-of-day, weekday, month andseason associations. Further, it can be done while taking into account the localenergy generation through renewal sources at individual house or a neighborhoodlevel. By facilitating distributed near real-time smart meter big data analytics at

IoT Big Data Analytics with Fog Computing 19
Fig. 2. Energy consumption pattern - Toaster
Fig. 3. Energy consumption pattern - Home theater
the edge of the cloud using fog computing the proposed platform can aid effectiveand in-time decision making for individual house owners, distribution whereaslarge-scale data analytics in the cloud can facilitate various energy managementprograms at producers level.

20 S. Singh and A. Yassine
Fig. 4. Appliance time of the day associations. It shows the co-utilization of appliancesduring the day
4 Conclusion and Future Work
In this paper, we have discussed a platform to effectively exploit IoT and BigData Analytics towards developing energy management strategies for efficientand effective household energy management. We have described the require-ments and components of this platform and discussed a use case scenario ofreal-life data from actual homes. Further, the proposed platform can be tailoredby domain experts for the evaluation of various smart grid applications of inter-est. Our plan for future work is to refine the platform component and test withdifferent datasets from various homes. This is crucial to validate the applica-bility of the platform and its robustness in dealing with all kind of energy con-sumption measurements. We also plan to conduct predictive analytics for energyconsumption based on real-time streaming of IoT data from smart homes. Thus,enabling the platform to perform short and long term forecasting for smart gridapplications.
References
1. Chhabra, A.S., Choudhury, T., Srivastava, A.V., Aggarwal, A.: Prediction for bigdata and IoT in 2017. In: International Conference on Infocom Technologies andUnmanned Systems (Trends and Future Directions) (ICTUS), Dubai, pp. 181-187(2017)
2. Ge, Y., Liang, X., Zhou, Y.C., Pan, Z., Zhao, G.T., Zheng, Y.L.: Adaptive ana-lytic service for real-time internet of things applications. In: IEEE InternationalConference on Web Services (ICWS), San Francisco, CA, pp. 484–491 (2016)

IoT Big Data Analytics with Fog Computing 21
3. El-Sayed, H., et al.: Edge of Things: The big picture on the integration of edge, IoTand the cloud in a distributed computing environment. IEEE Access 6, 1706–1717(2018)
4. Pouladzadeh, P., Kuhad, P., Peddi, S.V.B., Yassine, A., Shirmohammadi, S.:Mobile cloud based food calorie measurement. In: IEEE International Conferenceon Multimedia and Expo Workshops (ICMEW), Chengdu, pp. 1–6 (2014)
5. Peddi, S.V.B., Kuhad, P., Yassine, A., Pouladzadeh, P., Shirmohammadi, S.,Shirehjini, A.A.N.: An intelligent cloud-based data processing broker for mobilee-health multimedia applications. Future Generat. Comput. Syst. J. 66, 71–86(2017)
6. Mebrek, A., Merghem-Boulahia, L., Esseghir, M.: Efficient green solution for abalanced energy consumption and delay in the IoT-Fog-Cloud computing. In: IEEE16th International Symposium on Network Computing and Applications (NCA),Cambridge, pp. 1-4 (2017)
7. Al-Ali, A.R., Zualkernan, I.A., Rashid, M., Gupta, R., Alikarar, M.: A smart homeenergy management system using IoT and big data analytics approach. IEEETrans. Consum. Electron. 63(4), 426–434 (2017)
8. Berouine, A., Lachhab, F., Malek, Y.N., Bakhouya, M., Ouladsine, R.: A smartmetering platform using big data and IoT technologies. In: 3rd International Con-ference of Cloud Computing Technologies and Applications (CloudTech), Rabat,pp. 1-6 (2017)
9. Yassine, A.: Implementation challenges of automatic demand response for house-holds in smart grids. In: 3rd International Conference on Renewable Energies forDeveloping Countries (REDEC), Zouk Mosbeh, pp. 1–6 (2016)
10. Sultan, M., Ahmed, K.N.: SLASH: self-learning and adaptive smart home frame-work by integrating IoT with big data analytics. In: Computing Conference,London, pp. 530–538 (2017)
11. Yang, S.: IoT stream processing and analytics in the fog. IEEE Commun. Mag.55(8), 21–27 (2017)
12. Singh, S., Yassine, A.: Big data mining of energy time series for behavioral analyticsand energy consumption forecasting. Energies 11, 452 (2018)
13. Singh, S., Yassine, A.: Mining energy consumption behavior patterns for house-holds in smart grid. IEEE Transactions on Emerging Topics in Computing (2017).https://doi.org/10.1109/TETC.2017.2692098
14. Cai, H., Xu, B., Jiang, L., Vasilakos, A.V.: IoT-based big data storage systems incloud computing: perspectives and challenges. IEEE Internet Things J. 4(1), 75–87(2017)
15. He, J., Wei, J., Chen, K., Tang, Z., Zhou, Y., Zhang, Y.: Multi-tier fog computingwith large-scale IoT data analytics for smart cities. IEEE Internet Things J. 5(2),677–686 (2018). https://doi.org/10.1109/JIOT.2017.2724845
16. Taneja, M., Davy, A.: Resource aware placement of IoT application modules in Fog-Cloud Computing Paradigm. In: IFIP/IEEE Symposium on Integrated Networkand Service Management (IM), Lisbon, pp. 1222-1228 (2017)
17. Minh, Q.T., Nguyen, D.T., Van Le, A., Nguyen, H.D., Truong, A.: Toward ser-vice placement on Fog computing landscape. In: 4th NAFOSTED Conference onInformation and Computer Science, Hanoi, pp. 291–296 (2017)
18. Gonzalez, N.M., et al.: Fog computing: data analytics and cloud distributed pro-cessing on the network edges. In: 35th International Conference of the ChileanComputer Science Society (SCCC), Valparaiıso, pp. 1-9 (2016)

22 S. Singh and A. Yassine
19. Cao, H., Wachowicz, M., Cha, S.: Developing an edge computing platform for real-time descriptive analytics. In: IEEE International Conference on Big Data (BigData), Boston, MA, pp. 4546–4554 (2017)
20. Yassine, A., Nazari Shirehjini, A.A., Shirmohammadi, S.: Smart meters big data:game theoretic model for fair data sharing in deregulated smart grids. IEEE Accessvol. 3, no, 2743–2754 (2015)
21. Yassine, A., Shirmohammadi, S.: Measuring user’s privacy payoff using intelligentagents. In: IEEE International Conference on Computational Intelligence for Mea-surement Systems and Applications, CIMSA 2009, pp 169–174 (2009)
22. Han, J., Pei, J., kamber, M.: Mining Frequent Patterns, Associations, and Cor-relations: Basic Concepts and Methods. Data mining: Concepts and techniques,Chap. 6, 3rd edn, pp. 243–278. Morgan Kaufmann, Waltham (2011). http://www.sciencedirect.com/science/book/9780123814791. ISBN: 9780123814791
23. Paverd, A., Martin, A., Brown, I.: Security and privacy in smart grid demandresponse systems. In: Cuellar, J. (ed.) SmartGridSec 2014. LNCS, vol. 8448, pp.1–15. Springer, Cham (2014). https://doi.org/10.1007/978-3-319-10329-7 1
24. Yassine, A., Shirmohammadi, S.: Privacy and the market for private data: a negoti-ation model to capitalize on private data. In: IEEE/ACS International Conferenceon Computer Systems and Applications, Doha, pp. 669-678 (2008)
25. Yassine, A., Shirehjini, A.A., Shirmohammadi, S., Tran, T.: Knowledge-empoweredagent information system for privacy payoff in ecommerce. Knowl. Inf. Syst. 32(2),445–473 (2012)
26. Makonin, S., Ellert, B., Bajic, I.V., Popowich, F.: AMPds2 - Almanac of minutelypower dataset : electricity, water, and natural gas consumption of a residentialhouse in Canada from 2012 to 2014. Sci. Data 3, 1–12 (2015). https://doi.org/10.1038/sdata.2016.37
Secured Cancer Care and Cloud Servicesin IoT/WSN Based Medical Systems
Adeniyi Onasanya(B) and Maher Elshakankiri
Department of Computer Science, University of Regina, Regina, SK S4S 0A2, Canada{Onasanya,Maher.Elshakankiri}@uregina.ca
Abstract. In recent years, the Internet of Things (IoT) has constituteda driving force of modern technological advancement, and it has becomeincreasingly common as its impacts are seen in a variety of applicationdomains, including healthcare. IoT is characterized by the interconnec-tivity of smart sensors, objects, devices, data, and applications. Withthe unprecedented use of IoT in industrial, commercial and domestic, itbecomes very imperative to harness the benefits and functionalities asso-ciated with the IoT technology in (re)assessing the provision and posi-tioning of healthcare to ensure efficient and improved healthcare delivery.In this research, we are focusing on two important services in healthcaresystems, which are cancer care services and business analytics/cloud ser-vices. These services incorporate the implementation of an IoT that pro-vides solution and framework for analyzing health data gathered fromIoT through various sensor networks and other smart devices in orderto improve healthcare delivery and to help health care providers in theirdecision-making process for enhanced and efficient cancer treatment. Inaddition, we discuss the wireless sensor network (WSN), WSN routingand data transmission in the healthcare environment. Finally, some oper-ational challenges and security issues with IoT-based healthcare systemare discussed.
Keywords: IoT · Smart health care system(wireless) Sensor network · Cancer care services · Cloud servicesBusiness analytics
1 Introduction
Internet of Things (IoT) technology presents promising technological, economic,and social benefits to the evolution of data communications and networking facil-ities due to the advanced connectivity of devices, systems, and services beyondmachine-to-machine (M2M) communications. Interestingly, the IoT technologyhas contributed to and supported a wide range of services and applications, suchas smart cities, waste management, home automation, transportation systems,and healthcare. It is also fuelling the development of “smart connected things”– televisions, thermostats, medical devices, cars, wearable technology – clothingand devices [7].c© ICST Institute for Computer Sciences, Social Informatics and Telecommunications Engineering 2019
Published by Springer Nature Switzerland AG 2019. All Rights Reserved
A.-S. K. Pathan et al. (Eds.): SGIoT 2018, LNICST 256, pp. 23–35, 2019.
https://doi.org/10.1007/978-3-030-05928-6_3
24 A. Onasanya and M. Elshakankiri
This research considers two of the various services that are pertinent tohealthcare delivery. Specifically, it is intended to propose the application andimplementation of IoT technology in cancer care health delivery in the con-text of cancer care services along with the incorporation of business analyt-ics and cloud services for cancer care treatments and diagnoses. The combina-tion of these services proffers solution and framework for analyzing health datagathered from IoT through various sensor networks and other smart connecteddevices to help healthcare providers to turn a stream of data into actionableinsights and evidence-based healthcare decision making about the health condi-tions of patients using appropriate analytics tools to improve and enhance cancertreatments.
1.1 Motivation and Related Work
The motivation for this research work has been triggered by the desire to improvethe cancer care in healthcare delivery. Hence, this has prompted the need to(re)assess the provision and positioning of healthcare services to harness thebenefits associated with the use of IoT technology. This relatively new trendin IoT technology will suffice in ensuring interconnectivity and interoperabilityamong the health centres, clinics, and hospitals in various regions through net-work design that will facilitate health region-wide communications. As a result, itis argued that the use of IoT initiative will offer huge benefits such as increasedworkforce productivity, overall cost savings, enhanced Return on Investment(ROI), improved and new business models [12], and improved collaboration withhealth practitioners and patients in every service of healthcare delivery. It is alsoargued that by 2019, about 87% of healthcare organizations would have adoptedIoT technology with about 76% in the healthcare industry [17]. The widespreadapplication of IoT in healthcare domain has been successfully applied in a vari-ety of services, including cancer care and business analytics/cloud services [8],medical system (such as clinical care – drug labelling and administration, bloodtransfusion, real-time ECG monitoring, etc.) [7,10], health and wellness mon-itoring, remote monitoring system [11], rehabilitation system [3], operationalservices system [2,4], emergency services system [4,9], just to mention a few. Inthe course of this research work, we found that most of the papers only men-tioned some of the services listed above but none on the application of IoT incancer care services until a brief version of our initial work [8] has been published.In essence, we have incorporated lots of details and proposed new frameworks,components, and benefits not previously covered in the implementation of IoTand cloud services in cancer care services in this research.
1.2 Background of Smart Healthcare System
Adoption of IoT based healthcare systems in all the operations of health industrywill facilitate enhanced diagnoses/treatments and monitoring, automatic infir-mity and condition detecting and sensing, community health care, location-basedhealth care, rehabilitation, surgery and recovery, imaging services, etc. The IoT
Secured Cancer Care and Cloud Services in IoT-Based Medical Systems 25
devices will be used for communicating between patients and those in the cir-cle of care, and for sharing and interconnecting healthcare network resourcesinto the network as related to the delivery of IoT-based smart healthcare sys-tem. The healthcare resources include physicians, doctors, oncologists, healthproviders, nurses, other health personnel in the circle of care, patients, caregivers,human resources, ambulances, emergency units, medical devices, hospital sites,clinics, community health centres, workstation servers, smart devices or con-nected things (e.g. tablets), sensors, etc. This interconnection of resources canbe achieved through various network industry communication standards suchas wireless (short, medium and long), Ethernet with transmission control pro-tocol/internet protocol (TCP/IP), unique identifier (UID) based identification,and GPS-based location technologies.
The remainder of the paper is organized as follows. Section 2 discusses theframework for IoT solution. Section 3 provides the methodology and analysis ofthe network, which includes design basics and hierarchical architecture basedon the core, distribution, and access layouts, respectively. Also discussed isthe WSN, its routing and data dissemination in the healthcare environment.Section 4 presents the network design solutions for healthcare services using meshhierarchical topology. Section 5 discusses the concluding remarks and recommen-dations for future research.
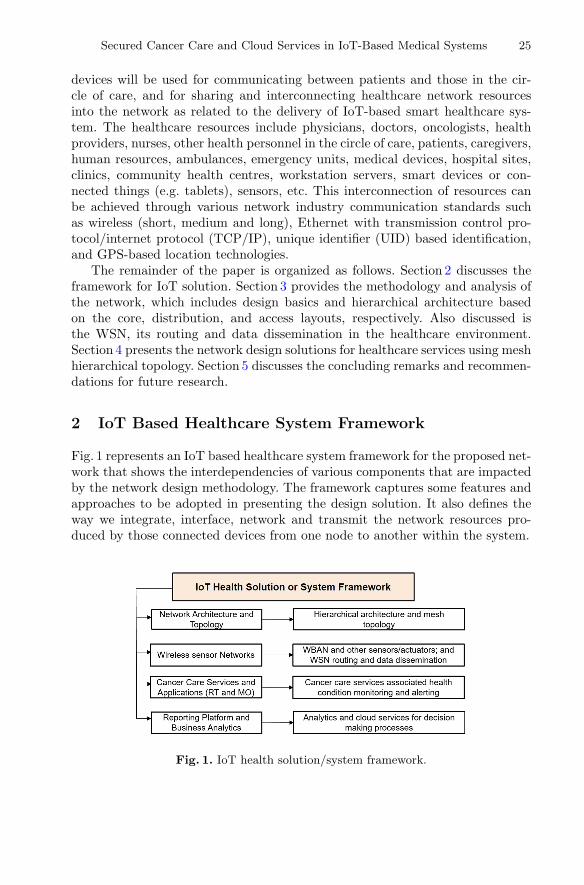
2 IoT Based Healthcare System Framework
Fig. 1 represents an IoT based healthcare system framework for the proposed net-work that shows the interdependencies of various components that are impactedby the network design methodology. The framework captures some features andapproaches to be adopted in presenting the design solution. It also defines theway we integrate, interface, network and transmit the network resources pro-duced by those connected devices from one node to another within the system.
Fig. 1. IoT health solution/system framework.

26 A. Onasanya and M. Elshakankiri
3 Network Methodology and Analysis
3.1 Network Design Basics and Hierarchical Architecture
It should be noted that the success of any network design is crucial to its imple-mentation. This is why we have paid a close attention to the network design toensure flaws are eradicated, especially to project of this nature, in terms of theorganization size and the number of healthcare network resources that are inter-connected. Though, it might be difficult to design a network that is nearly 100%reliable. However, we have thoroughly determined the requirements (i.e. techni-cal and non-technical) in the design of the smart healthcare system in order todecide what is considered a good design, thereby avoiding over complication ofthe network design.
In addition, two categories of network architecture are considered, namely,flat architecture and hierarchical architecture, but the focus here is on the hier-archical architecture. Hierarchical architecture is easier to manage and expand,and any inherent issues are more quickly solved with little or no disruption tooperation. Typically, hierarchical architecture divides the network into three dis-crete layers: (1) Core Layout; (2) Distribution Layout; and (3) Access Layout.Each of these layers provides specific functions that define its role within theoverall network, thereby resulting in a network that provides modularity withthe design goals of scalability (i.e. to meet the demands for additional services),supportability, availability, performance, redundancy, maintainability, security,tolerance, and manageability [5]. The access layer interfaces and controls the enddevices (such as sensors, actuators, and IoT connected/smart devices) and therest of network resources that communicate on the network.
3.2 Wireless Sensor Networks
The combination of the Internet, network communications, information tech-nology, and engineering advances have made provision for a new generation ofinexpensive sensors and actuators, which are capable of achieving a high order ofspatial and temporal resolution and accuracy. Currently, network sensor systemsare seen as an important component of the IoT technology, which has experi-enced rapid growth in various applications [12,15]. According to [12], a sensornetwork is an infrastructure comprising of sensing (measuring), computing, andcommunication elements that gives an administrator the ability to instrument,observe, and react to events and phenomena in a specified environment, wherethe environment can be viewed as physical world, biological system, or an infor-mation technology system. The technology embedded in sensors constitutes abroad range of applications in health care, agriculture, energy, food safety, pro-duction processing, quality of life, and many other fields. All these applicationsinvolve sensing, collecting, and sharing data.
Secured Cancer Care and Cloud Services in IoT-Based Medical Systems 27
3.3 WSN Routing and Data Dissemination in Healthcare
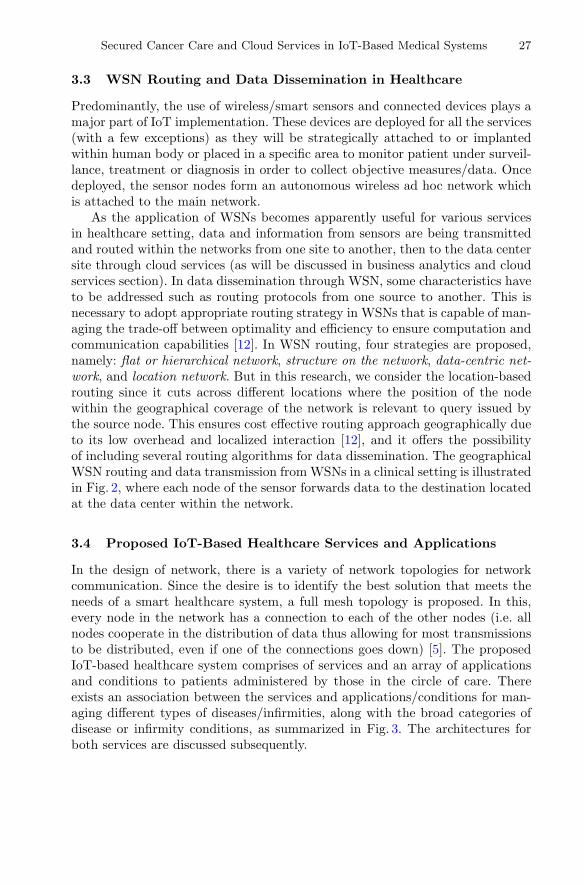
Predominantly, the use of wireless/smart sensors and connected devices plays amajor part of IoT implementation. These devices are deployed for all the services(with a few exceptions) as they will be strategically attached to or implantedwithin human body or placed in a specific area to monitor patient under surveil-lance, treatment or diagnosis in order to collect objective measures/data. Oncedeployed, the sensor nodes form an autonomous wireless ad hoc network whichis attached to the main network.
As the application of WSNs becomes apparently useful for various servicesin healthcare setting, data and information from sensors are being transmittedand routed within the networks from one site to another, then to the data centersite through cloud services (as will be discussed in business analytics and cloudservices section). In data dissemination through WSN, some characteristics haveto be addressed such as routing protocols from one source to another. This isnecessary to adopt appropriate routing strategy in WSNs that is capable of man-aging the trade-off between optimality and efficiency to ensure computation andcommunication capabilities [12]. In WSN routing, four strategies are proposed,namely: flat or hierarchical network, structure on the network, data-centric net-work, and location network. But in this research, we consider the location-basedrouting since it cuts across different locations where the position of the nodewithin the geographical coverage of the network is relevant to query issued bythe source node. This ensures cost effective routing approach geographically dueto its low overhead and localized interaction [12], and it offers the possibilityof including several routing algorithms for data dissemination. The geographicalWSN routing and data transmission from WSNs in a clinical setting is illustratedin Fig. 2, where each node of the sensor forwards data to the destination locatedat the data center within the network.
3.4 Proposed IoT-Based Healthcare Services and Applications
In the design of network, there is a variety of network topologies for networkcommunication. Since the desire is to identify the best solution that meets theneeds of a smart healthcare system, a full mesh topology is proposed. In this,every node in the network has a connection to each of the other nodes (i.e. allnodes cooperate in the distribution of data thus allowing for most transmissionsto be distributed, even if one of the connections goes down) [5]. The proposedIoT-based healthcare system comprises of services and an array of applicationsand conditions to patients administered by those in the circle of care. Thereexists an association between the services and applications/conditions for man-aging different types of diseases/infirmities, along with the broad categories ofdisease or infirmity conditions, as summarized in Fig. 3. The architectures forboth services are discussed subsequently.

28 A. Onasanya and M. Elshakankiri
Fig. 2. WSN routing and data transmission.
Fig. 3. IoT health care services and applications/conditions.
Secured Cancer Care and Cloud Services in IoT-Based Medical Systems 29
4 Network Design Solutions for Services
4.1 Cancer Care Services
Essentially, cancer care services comprise of two sub-services associated with thediagnosis and treatment of cancer, namely, chemotherapy and radiotherapy. Thechemotherapy is associated with medical oncology (MO) while the radiotherapy(RT) is associated with radiation oncology (RO). The use of smart devices andwireless sensors can be applied towards improving the quality of cancer careservices and patient care by seamless and secure integration of those devicesin medical oncology and radiation oncology procedures. This is argued in [16]that patient care (i.e. monitoring, alerting, and following-up) for cancer patientsundergoing chemotherapy can safely be moved into the home.
As pointed out in [8], attaching and embedding WSNs and smart devices topatients can enhance cancer treatments by allowing health practitioners/nursesto monitor and be alerted of any changes, complications, problems, signs, symp-toms, adverse effects, allergies, pains, infections, toxic effects, neutropenic feveroccurrences, missed medications, haemoglobin level issues, drug allergic detec-tion, drug interaction, phlebitis, dermatitis, mucositis, diarrhoea, infection ofupper respiratory tract, emesis, epigastralgia, neutropenic fever, etc. These issuescan automatically be detected, subdued, and blocked, thereby influencing patientcare and attention related to patient treatment and enforcing what controls toput in place to circumvent those changes, issues, effects, and symptoms.
Although, [1] claims that no perfect methodology for identifying the mag-nitude of the adverse effects and issues of chemotherapy, but as alluded by [8],the MO cancer care services can incorporate smart devices that provide assis-tance to cancer patients in the event of any issues/complications through processautomation, remote monitoring, and alert communication. In essence, the IoTtechnologies through WSNs/smart devices can be programmed at certain levelof precision to determine fairly reasonable magnitude deemed fit for the adverseeffects of those characteristics on the body. With this innovation, the level ofcare to patients undergoing such issues can be monitored as shown in Fig. 3.
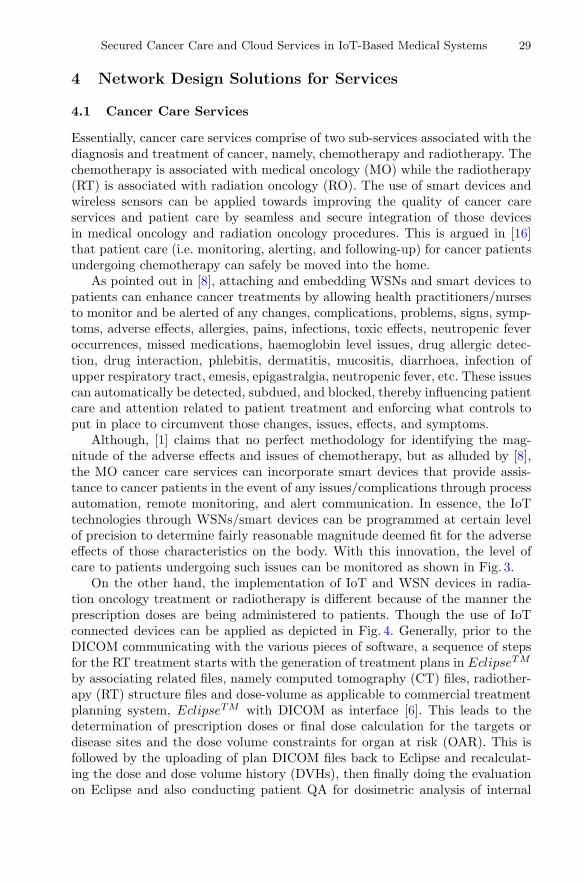
On the other hand, the implementation of IoT and WSN devices in radia-tion oncology treatment or radiotherapy is different because of the manner theprescription doses are being administered to patients. Though the use of IoTconnected devices can be applied as depicted in Fig. 4. Generally, prior to theDICOM communicating with the various pieces of software, a sequence of stepsfor the RT treatment starts with the generation of treatment plans in EclipseTM
by associating related files, namely computed tomography (CT) files, radiother-apy (RT) structure files and dose-volume as applicable to commercial treatmentplanning system, EclipseTM with DICOM as interface [6]. This leads to thedetermination of prescription doses or final dose calculation for the targets ordisease sites and the dose volume constraints for organ at risk (OAR). This isfollowed by the uploading of plan DICOM files back to Eclipse and recalculat-ing the dose and dose volume history (DVHs), then finally doing the evaluationon Eclipse and also conducting patient QA for dosimetric analysis of internal

30 A. Onasanya and M. Elshakankiri
anatomy because emphasis should be placed on the accurate definition for thetargets to ensure precision of protons radiotherapy prior to administering of thedoses to patients [6]. Having discussed above, we have to admit that the use ofinherent smart devices and wireless sensor networks could help achieve intendedresults for patient treatment. Therefore, the use of IoT technology can be ben-eficial for administering radiotherapy to patients as it could help improve themargin, preciseness, and accuracy of the radiotherapy doses to ensure they hitthe targets/disease sites thereby eliminating geometric uncertainties in setup,patient motion, and patient changes. In this case, WSNs or IoT devices can beimplanted or embedded close to the targets, and this will ensure the doses fromthe linear accelerator do not miss their targets. WSNs are perceived to be usefulin achieving better treatment planning results toward appropriate prescriptiondoses.
From Fig. 4, the Health Level-7 (HL7) connectivity utilizes XML technologyfor interoperating two or more systems for data definition and message exchang-ing, sharing and reusing within and between lab centres and clinics. On theother hand, the Digital Imaging and Communications in Medicine (DICOM)connectivity communicates with the various pieces of software for transmissionof diagnostic images while the embedded systems, such as Laboratory InterfaceSystem (LIS), Pathology Interface System (PIS) and Radiology Interface System(RIS), serve as access points for the healthcare providers to access patient infor-mation relating to lab results, malignancy or abnormal (pathology) results, andradiology results. In wrapping up, all these systems along with the pharmacy,medical oncology, and radiation oncology servers allow access to comprehensivepatient chart information from any device (workstations, tablets, etc.) either atthe clinical environment or via remote VPN access from outside the clinic(s). Theunderlying technologies being considered include: Bluetooth Low Energy (BT-LE), Near Field Communication (NFC), Radio Frequency Identification (RFID),and 6LoWPAN/WiFi/ZigBee [8]. Figure 4 illustrates the network architecturefor the proposed cancer care services.
4.2 Business Analytics and Cloud Services
With the growing rate of patient data generated by means of the wireless sen-sor networks (i.e. WBANs, wearables, smart devices, and embedded systems),data, queries and physical characteristics as observed from these devices andequipment are gathered and collected for researching, analyzing and reportingpurposes; gaining intelligence; formulating insights; streamlining operations; andgaining competitive business advantage.
The incorporation of business analytics and cloud services to cancer careservices ensures availability and accessibility of patient data being streamed fromvarious sources on a real-time and continuous basis. This, in turn, enables theever-increasing data to be managed and shared across the healthcare networksystems upon deployment into the cloud. Obviously, streams of data are relayedand generated about patients and for some medical devices (through sensorsand other connected devices) as related to the patients. These data, in form

Secured Cancer Care and Cloud Services in IoT-Based Medical Systems 31
Fig. 4. Cancer care services network architecture.
of multimedia, textual and visual formats, are transmitted through the cloudservices to remote servers (data center). As a result, the volume, velocity, andvariety of health data and information of patients have continually increasedsignificantly, which puts challenges for analysis and interpretation of data fordecision-making purposes using appropriate data analytical tools [8,14].
This architecture also offers reporting capabilities for immediate dashboardsthat facilitate treatment decisions as we will be able to discover patterns fromall the data from various services in order to analyze the quality of care and risk,disease and epidemic pattern, patient/facility monitoring and optimization, etc.This, indeed, will be beneficial to healthcare providers to turn a stream of datainto actionable insights and evidence-based healthcare decisions about the healthconditions of patients, and also for helping the clinical experts and researchgroups to keep up to date with the latest trends and breakthroughs in clinicaloncology practices. The architecture uses the Picture Archiving Communica-tion System (PACS), which comprises of secure computer systems for storage,retrieval, and display of diagnostic images such as X-rays, CT scans, MagneticResonance Imaging (MRIs), etc. The PACS constitutes an important compo-nent, where the diagnostic images are being retrieved and accessed through thebusiness analytics and cloud services as made available on the cloud. In view ofthis, we have proposed an appropriate strategy to gather and analyze data ascollected across the network fabric and communications infrastructure throughsecure transmissions from one end to the other. The details of the network archi-tecture for the business analytics/cloud services are as depicted in Fig. 5, wherethe initial figure in [8] has been modified to include PACS component.

32 A. Onasanya and M. Elshakankiri
Hadoop Deployment in Business Analytics and Cloud Services. Basedon the huge volume of data involved for those services, the Hadoop cluster orframework is viewed as an ideal solution for processing and solving the workloadsassociated with massive amounts of data storage, which ensure transformationsbetween source systems and data warehouses. Hadoop cluster is used for predic-tive analytics through its own machine learning and data mining capabilities.With Hadoop cluster, crucial single point(s) of failure that could bring down theentire Hadoop cluster can be eliminated, and it makes provision for data to benormally triple replicated to ensure availability in the event of failures and dis-asters [10]. Other benefits of Hadoop include its low response time and real timealert capability. In summary, Hadoop is considered for the following featuresand characteristics, as follows [13]: data value; schema; workload ; data sources;availability ; security ; and scalability. The NoSQL databases and Hadoop clustercomponents are suggested for the business analytics and cloud services basicallyfor conducting disease, genomics and epidemic pattern research; patient-diseasetracking and monitoring; patient sentiment analysis; risk and quality of careanalysis; etc. (as shown in Fig. 5).
Fig. 5. Business analytics and cloud services network architecture [8].
4.3 Operational Challenges and Security Issues
In [8], we have outlined the analysis of the operational challenges and secu-rity issues to cancer care services based on IoT, which we will suggest to thereader to read it though additional information is provided here. While usingbusiness analytics on patient data, the issues of confidentiality and privacy havebeen a concern without exposing the patient demographic information to the

Secured Cancer Care and Cloud Services in IoT-Based Medical Systems 33
research group and business experts. As a result, we will ultimately ensure thatpatient-sensitive information is protected and encrypted as this may be a majorthreat and barrier in realizing the potential benefits of business analytics ser-vices in healthcare environment, which could deter business improvements, ifnot addressed.
Since there are various nodes, wireless devices and sensors in the proposedsolutions, then we have to ensure that those devices conform to industry stan-dard (i.e. meeting the service- and operational-level agreements) that guaranteereliability and security. In addition, the reliability of the network system is veryparamount especially due to the nature of the healthcare environment coupledwith the sensitivity of patient information/data. This is one of the reasons whymesh topology is proposed, especially at the distribution layer such that everydata transmitted from the source is accepted at the destination within a reason-able time. It is also to ensure high availability with minimal equipment failureand human intervention.
4.4 Securing IoT Services and Devices
Knowing that the security of patient medical data cannot be underestimatedand jeopardized, then it becomes imperative to talk about securing the variousdevices and services being made available during the design of the IoT basedmedical system in order to avoid leakage of patient information. Hence, some fea-sible security mechanisms as related to this research include but not limited to:security for communication in IoT. For the communication in IoT devices fromone layer to another in the network architecture, the three layouts: core, distribu-tion, and access, should be an utmost consideration in terms of security and pro-tection due to the nature of the healthcare environment; security approaches ormechanisms for WSN, smart connected and remote (RFID) devices. It is equallyparamount to ensure security mechanisms for the WSNs that characterize theIoT solution through securing the routing protocols to prevent attacks that couldaffect the entire network. In addition, the security mechanisms can be extendedto prevent illegal node access, while at the same introduce trust managementand distribution mechanism for the WSN routing for data privacy and locationprivacy of patients within and outside the clinical environment, more so that alarge number of nodes is required coupled with the generation/dissemination ofa large amount of data; security for IPv6 (6LoWPAN). The use of low powerconsumption devices and sensors should be considered especially with long-termdevice or sensory operation coupled with the involvement of human lives (as fordevices that are embedded in the human body or with contact with the humanbody). This will certainly mandate the use of low power IPv6 architecture inthe design of the IoT based solution with low power consumption for securedintegration; and security, privacy, and encryption of actuators/sensors, remotedevices are equally important.
34 A. Onasanya and M. Elshakankiri
5 Conclusions and Future Work
We have proposed the implementation of the IoT based medical system, with ref-erence to cancer care services and business analytics/cloud services, for enhancedtreatment, diagnosis, and monitoring of cancer patients. The healthcare solutionhas been accomplished through the use of WSNs and smart connected devices.This is because WSN plays an important role that allows a number of spa-tially distributed autonomous sensors to be linked to the network fabric basedon geographical routing from source to destination, which facilitate data trans-mission/exchange. We have also delved into business analytics/cloud servicesthat ensure the availability of patient data stream for actionable insights andevidence-based healthcare decisions. Also addressed are the operational and secu-rity challenges associated with the deployment of IoT based medical system dueto the nature of the environment and the sensitivity of patient information. Thisis necessary prior to the go-live phase of the IoT based solution implementationto avoid failure to the entire system and breach of patient data.
In wrapping up, it is worth mentioning that there are various services beingdelivered in healthcare settings but we have only covered the cancer care andbusiness analytics/cloud services. Hence, we will be considering and integratingmore services in our future research work in the same research domain.
References
1. Baena-Canada, J.M., et al.: Use of health-care services during chemotherapy forbreast cancer. Eur. J. Cancer 48, 3328–3334 (2012)
2. Dineshkumar, P., SenthilKumar, R., Sujatha, K., Ponmagal, R.S., Rajavarman,V.N.: Big data analytics of IoT based Health care monitoring system. In: IEEEUttar Pradesh Section International Conference on Electrical, Computer & Elec-tronics Engineering, pp. 55–60 (2016)
3. Fan, Y.J., Yin, Y.H., Xu, L.D., Zeng, Y., Wu, F.: IoT-based smart rehabilitationsystem. IEEE Trans. Industr. Inf. 10(2), 1568–1577 (2014)
4. Lakkis, S., Elshakankiri, M.: IoT based emergency and operational services inmedical care systems. In: 13th CTTE/CMI Conference on Internet of Things -Business Models, Users, & Networks, Denmark (2017)
5. Lewis, W.: LAN Switching and Wireless. CCNA Exploration Companion Guide.Cisco Press, Indianapolis (2009)
6. Liu, W.: Robustness quantification and worst-case robust optimization in intensity-modulated proton therapy. In: Rath, A.K., Sahoo, N. (eds.) Particle Radiother-apy, pp. 139–155. Springer, New Delhi (2016). https://doi.org/10.1007/978-81-322-2622-2 10
7. Lu, D., Liu, T.: The application of IoT in medical system. In: IEEE InternationalSymposium on IT in Medicine and Education, vol. 1, pp. 272–275 (2011)
8. Onasanya, A., Elshakankiri, M.: IoT implementation for cancer care & businessanalytics/cloud services. In: Proceedings of the 10th IEEE/ACM InternationalConference on Utility & Cloud Computing (UCC 2017), pp. 205–206, Austin, TX,(2017). https://doi.org/10.1145/3147213.3149217

Secured Cancer Care and Cloud Services in IoT-Based Medical Systems 35
9. Rahmani, A., Thanigaivelan, N.K., Gia, T.N., Granados, J., Negash, B., Lilje-berg, P., Tenhunen, H.: Smart e-health gateway: bringing intelligence to internet-of-things based ubiquitous healthcare systems. In: 12th Annual IEEE ConsumerCommunications and Networking Conference (CCNC), pp. 826–834 (2015)
10. Riazul Islam, S.M., Kwak, D., Kabir, H., Hossain, M., Kwak, K.S.: The IoT forhealth care: a comprehensive survey. IEEE Access 3, 678–708 (2015)
11. Satija, U., Ramkumar, B., Sabarimalai Manikandan, M.: Real-time signal quality-aware ECG telemetry system for iot-based health care monitoring. IEEE InternetThings J. 4(3), 815–823 (2017)
12. Sohraby, K., Minoli, D., Znati, T.: Wireless Sensor Networks: Technology, Proto-cols, & Applications. John Wiley & Sons Inc., NJ (2007)
13. Stackowiak, R., Licht, A., Mantha, V., Nagode, L.: Big Data and The IoT. Enter-prise Information Architecture for A New Age. Apress, Ontario (2015)
14. Yao, J.T., Onasanya, A.: Recent development of rough computing: a scientometricsview. In: Wang, G., et al. (eds.) Thriving Rough Sets, Studies in ComputationalIntelligence, vol. 708, pp. 21–45 (2017)
15. A Wireless Sensor Networks Bibliography. Autonomous Networks Research Group.http://ceng.usc.edu/∼anrg/SensorNetBib.html#0103. Accessed 25 May 2017
16. IoT project for home cancer care. http://wireless.electronicspecifier.com/around-the-industry/internet-of-things-project-for-home-cancer-care. Accessed 5 June2017
17. State of IoT Healthcare by Aruba, an HP Enterprise company. http://www.arubanetworks.com/iot. Accessed 25 May 2017

Privacy Preserving for Location-BasedIoT Services
Yue Qiu(&) and Maode Ma
School of Electrical and Electronic Engineering,Nanyang Technological University, Singapore, [email protected], [email protected]
Abstract. In recent years, the applications of location-based Internet of Things(IoT) services change the way of people’s lives and works. However, theseapplications may disclose some private location information of users due to lackof privacy protection mechanism, which could result in serious security issues.To protect users’ confidential data, an efficient and secure private proximitytesting (ESPT) scheme is designed for location-based IoT services to improvethe efficiency while maintaining the privacy of the location of the users. Theproposed scheme enables a user to query a service provider whether somepeople are within a given search range without disclosing any private locationinformation of the user. The security analysis and the simulation resultsdemonstrate that the proposed scheme could not only implement a privacy-preserving proximity test, but also has less computational overheads.
Keywords: Bloom filter � Location privacy � Proximity testingSecurity
1 Introduction
In recent years, smartphones, tablets and other wearable devices have become ubiq-uitous due to rapid development of electronic industry. Internet of Things (IoT), whichis going to connect everything in the world, has provided an infrastructure to connectthose mobile devices to make people be able to access various wireless network ser-vices at anytime and anywhere. Among various network services, location-based ser-vice (LBS) has attracted considerable attention, which can be applied into various areasof human life such as social networking applications, healthcare services, financialservices and etc. Users’ locations are the key enabler of the LBS and can be easilymeasured by various mobile IoT devices using Global Positioning System (GPS). Withthe locations information of users, the LBS could provide more valuable services, suchas private proximity test, which enables a user to get the information whether somepeople are within a given geometric range.
Although the LBS is a promising application in IoT and can offer more precise andvaluable services based on the location information of users, it should be cautiouslyused due to privacy concerns [1, 2]. However, most of the applications require users to
© ICST Institute for Computer Sciences, Social Informatics and Telecommunications Engineering 2019Published by Springer Nature Switzerland AG 2019. All Rights ReservedA.-S. K. Pathan et al. (Eds.): SGIoT 2018, LNICST 256, pp. 36–45, 2019.https://doi.org/10.1007/978-3-030-05928-6_4
upload their current locations through different IoT devices without strong privacyprotection. The leakage of the private location information of users may be maliciouslytaken to track users, which could lead to severe consequences.
Motivated by the above-mentioned privacy concerns, many privacy-preservingproximity tests have been proposed to protect users’ locations. A private proximity testusing private equality testing (PET) and location tags has been proposed in [3]. Toimprove the efficiency, a vectorial private equality testing (VPET) with an untrustedserver has been proposed based on linear algebra in [4]. Another privacy-preservingproximity test with an untrusted server using ElGamal encryption has been proposed in[5] to allow users to verify the correctness of test result instead of a LBS server.A private proximity based location sharing scheme, named Near-pri, using Paillierencryption has been proposed in [6] to allow users to maintain their own securitypolicy. Compared to Near-pri, a more efficient and privacy-preserving proximity testingwith differential privacy techniques (EPPD) has been proposed in [7]. Two schemes tosupport location based handshakes and private proximity testing with location tagsusing Bloom filter and Bose-Chaudhuri-Hocquenghem (BCH) code have been pro-posed in [8, 9]. While most schemes only support one coordinate system, a privacy-preserving distance computation and proximity testing has been proposed to supportthree different coordinate systems on earth in [10]. Although the above-mentionedproximity testing can protect the information of users’ locations, most of them onlysupports proximity testing between two parties, which may result in a high computa-tional overhead when deployed in the real world.
In this paper, as our major contribution, an efficient and secure private proximitytesting (ESPT) with location tags is proposed for location-based IoT applications toimprove the efficiency while maintaining privacy of the location information of users.The users’ location information uploaded to an untrusted third party will be protectedby differential privacy techniques for the LBS [7, 11]. The private proximity testing isperformed based on the cloaking location tags, a Bloom filter [12] and a secure dotproduct protocol [13] without disclosing users’ confidential data to adversaries. Thesecurity functionality of the proposal is evaluated by formal verification and its effi-ciency is demonstrated by the simulation results. It can be shown that the ESPT schemecould not only preserve privacy, but also incur less computational overhead.
The remainder of this paper is organized as follows. In Sect. 2, the system model isintroduced. In Sect. 3, the proposed scheme is described in details. The securityanalysis and the performance evaluation of the proposed scheme is presented in Sect. 4.Finally, the paper is concluded in Sect. 5.
2 System Model
The system model under this study is shown in Fig. 1, including many registered users,a service provider and a trusted authority.
Privacy Preserving for Location-Based IoT Services 37

• User: Each user should be registered before accessing the services. After registra-tion, the registered users need to periodically upload the information of their currentlocations through mobile IoT devices. The location information is encrypted andstored in the service provider’s database. A user can initiate a request for searchingother users within a fixed search area by using the proposed ESPT scheme.
• Service Provider (SP): The service provider is responsible for storing users’encrypted location information and providing secure proximity testing based onusers’ locations and search range. The SP is an honest-but-curious entity, whichmeans that although it operates through the defined steps of the protocol, it may becurious about the private information of locations of the users.
• Trusted Authority (TA): The TA, which is responsible for system initialization andassigning key materials to registered users and the SP, is fully trusted by otherentities.
3 Proposed ESPT Scheme
In this section, based on differential privacy techniques for location-based services [7, 11]including a bloom filter [12] and a secure dot product protocol [13], an efficient andsecure private proximity testing (ESPT) scheme is proposed. It consists of three phases:system initialization phase, user location uploading phase and privacy-preservingproximity testing phase.
3.1 System Initialization Phase
Before accessing the services provided by the SP, the TA is responsible for generatingpublic parameters and assigning keys to the users and the SP in the following steps:
• Given a security parameter k1, a large prime p is selected, such that pj j ¼ k1.A cyclic group G of prime order p, in which the discrete logarithm problem(DLP) is hard, is generated. The TA also generates a random generator h 2 G andchooses hash functions H : 0; 1f g�! G.
Fig. 1. The system model
38 Y. Qiu and M. Ma

• Given the parameter � 2 Rþ , the TA transfers the map into a map with many grids.
The side length l of a grid depends on the privacy level used by the system. Whenthe side length becomes longer, the privacy level increases. Each grid has a grid tag,such as tag1i;j ¼ i; jð Þ and each grid is divided into several small grids. The sidelength of them is l and area tag is tag2i0;j0 ¼ i0; j0ð Þ as shown in Fig. 2. The locationx; yð Þ of a user can be mapped into a tag as tagUser ¼ tag1i;j; tag2i0;j0
� �.
• The TA assigns identities to each registered user and the SP, and publishes aparameter list <G, h, p, H, l, l, �> and area information. Based on the publicparameters, the SP selects a random number skSP 2 Z
�p as a private key and compute
pkSP ¼ hskSPmod p. as the corresponding public key. Each user Ui chooses a privatekey ski 2 Z
�p and computes pki ¼ hskimod p as his public key.
3.2 User Location Uploading Phase
Before uploading the location information of the users to the SP, the users need toconvert their GPS locations into the form of xy-coordinates in the Cartesian plane bythe Miller Projection, which is similar as the procedure in the EPPD scheme in [7]. Toprotect the information of the current locations of users from being tracking by theadversaries, each user Ui 2 U periodically uploads his/her cloaking location data to theSP. The detailed steps of the user location uploading phase are described as follows.
• According to geo-indistinguishability [11], Ui computes a cloaking location coor-dinates cxi; cyið Þ based on Ui’s current location coordinates xi; yið Þ as cxi ¼xi þ r cos h and cyi ¼ yi þ r sin h, where r ¼ � 1
� W�1p�1e
� �þ 1� �
, h 2 0; 2p½ Þ andp 2 0; 1½ Þ. After that, Ui maps his/her current location xi; yið Þ into area tagstagx ¼ tag1i;j; tag2i0;j0
� �, and maps the cloaking location cxi; cyið Þ into a cloaking
location tag ctag1Ui .• Ui calculates a symmetric key established with the SP as ki$SP ¼
H pkskiSP IDSPk kIDikH tspð Þ� �, where tsp is a timestamp. The cloaking tag is encrypted
as CTi ¼ ENCki$SP ctag1Ui IDSPk kIDiktspð Þ and will be sent to the SP in themessage <CTi IDij jj jtsp>.
Fig. 2. Grid maps and location tags
Privacy Preserving for Location-Based IoT Services 39

• Upon receiving the uploaded location tag from a user, the SP checks the timestampand calculates the symmetric key kSP$i ¼ H pkskSPi IDSPk kIDikH tspð Þ� �
. CTi can besuccessfully decrypted if kSP$i is correctly computed. The SP stores the informa-tion <ctag1Ui ; IDi; tsp> in its database which will be further used in the privateproximity testing.
3.3 Private Proximity Testing Phase
During the private proximity testing phase, a user Ux sends a test request to the SPincluding the location tag and a search area. The detailed steps are described as follows.
• Step 1: If a user Ux would like to perform a private proximity testing, Ux needs toset a search area SA which can be a rectangle area or an arbitrary area which consistsof different location tags. Then, a bloom filter is generated with the length of m, andthe number of hash functions is k. Ux inserts the location tags to the bloom filter
within the SA. It inserts location tags tagx ¼ tag1xi;xj; tag2xi0;xj0� �
into BFx SAð Þ ¼bx;1; . . .; bx;m� �
. Then, the BFx SAð Þ is encrypted by the secure dot product protocol.Ux chooses two large prime numbers q and a, where qj j ¼ k2 and aj j ¼ k3. A largerandom number s 2 Zq and mþ 3 random numbers ci (i ¼ 1; ::;mþ 3) with jcij ¼k4 are chosen. To encrypt the bloom filter value of BFx SAð Þ, a vector is created asux!¼ BFx SAð Þ;�1ð Þ ¼ bx;1; . . .; bx;m;�1
� � ¼ u1; . . .; umþ 1ð Þ. An encrypted vector
Cx�! ¼ C1; . . .;Cmþ 3ð Þ can be computed as:
Ci ¼ s ui � aþ cið Þmod p; ui 6¼ 0s � ci mod p; ui ¼ 0
�ð1Þ
for each element ui i ¼ 1; . . .;mþ 3ð Þ, where umþ 2 ¼ umþ 3 ¼ 0. The cloakingsearch area SA0 centered at the ctag1Ux is sent to the SP, which can be thesame size as the real search area or bigger than it. Ux computes a session keyas kx$SP ¼ H pkskxSP IDSPk kIDikH tspxð Þ� �
, encrypts the vector as CTx ¼ ENCkx$SP
H q ak k Cx�!� �
IDSPk kIDx SA0k ktspx� �
, and sends the test request <q ak k Cx�!k
CTxkIDSP IDxk kSA0ktspx> to the SP and keep s�1mod q secret.• Step 2: When receiving the request from Ux, the SP first checks if the time interval
is below the defined threshold using the timestamp tspx and the current time. The SPalso computes the session key as kSP$x ¼ H pkskSPx IDSPk kIDxk tspxð Þ� �
, decrypts the
received ciphertext as DECkSP$x CTxð Þ ¼ H q ak k Cx�!� �
IDSPk kIDi SA0k ktspx and
validates the hash value using the received information. According to the Ux’s
uploaded location tag ctagUx , the SP sends the encrypted vector Cx�!
, q and a tousers U� whose location area is within or intersects the search area SA0, and userswhose location tags are neighbors to U�, as shown in Fig. 3.
40 Y. Qiu and M. Ma
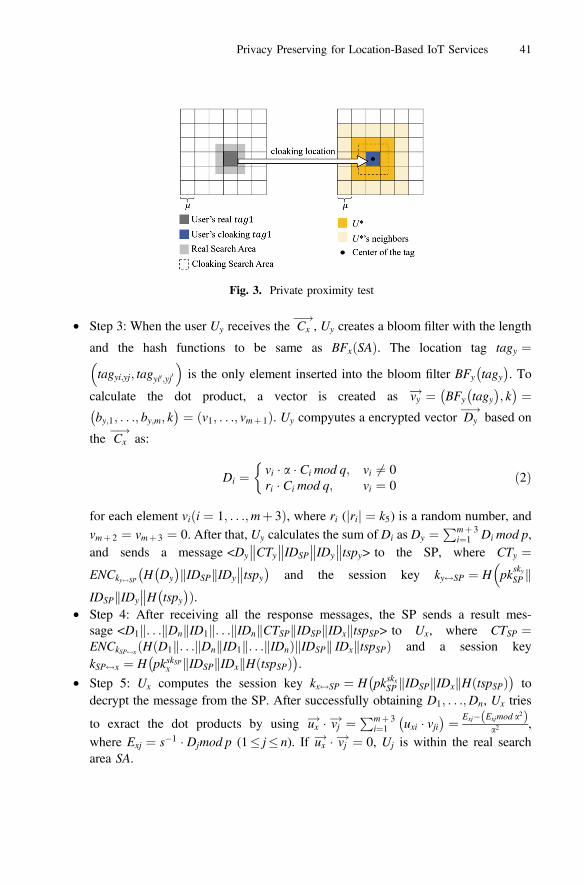
• Step 3: When the user Uy receives the Cx�!
, Uy creates a bloom filter with the length
and the hash functions to be same as BFx SAð Þ. The location tag tagy ¼tagyi;yj; tagyi0;yj0
� �is the only element inserted into the bloom filter BFy tagy
� �. To
calculate the dot product, a vector is created as vy!¼ BFy tagy
� �; k
� � ¼by;1; . . .; by;m; k� � ¼ v1; . . .; vmþ 1ð Þ. Uy compyutes a encrypted vector Dy
�!based on
the Cx�!
as:
Di ¼ vi � a � Ci mod q; vi 6¼ 0ri � Ci mod q; vi ¼ 0
�ð2Þ
for each element vi i ¼ 1; . . .;mþ 3ð Þ, where ri (jrij ¼ k5) is a random number, andvmþ 2 ¼ vmþ 3 ¼ 0. After that, Uy calculates the sum of Di as Dy ¼
Pmþ 3i¼1 Di mod p,
and sends a message <Dy CTy�� ��IDSP IDy
�� ��tspy> to the SP, where CTy ¼ENCky$SP H Dy
� �IDSPk kIDy
��tspy� �and the session key ky$SP ¼ H pkskySP k
�IDSPkIDy
��H tspy� �Þ.
• Step 4: After receiving all the response messages, the SP sends a result mes-sage <D1 . . .k kDn ID1k k. . . IDnk kCTSP IDSPk kIDx tspSPk > to Ux, where CTSP ¼ENCkSP$x H D1 . . .k kDn ID1k k. . . IDnkð Þ IDSPk k IDx tspSPkð Þ and a session keykSP$x ¼ H pkskSPx IDSPk kIDxkH tspSPð Þ� �
.
• Step 5: Ux computes the session key kx$SP ¼ H pkskxSP IDSPk kIDxkH tspSPð Þ� �to
decrypt the message from the SP. After successfully obtaining D1; . . .;Dn, Ux tries
to exract the dot products by using ux!� vj!¼ Pmþ 3
i¼1 uxi � vji� � ¼ Exj� Exjmod a2ð Þ
a2 ,where Exj ¼ s�1 � Djmod p (1� j� n). If ux
!� vj!¼ 0, Uj is within the real searcharea SA.
Fig. 3. Private proximity test
Privacy Preserving for Location-Based IoT Services 41

4 Security and Performance Evaluation
In this section, the security and privacy properties of the proposed ESPT scheme isanalyzed first by using Automated Validation of Internet Security Protocols andApplications (AVISPA). The AVISPA [14] is a formal verification tool that canautomatically validate the network security protocols and applications. There are threebasic roles in the private proximity testing phase of the ESPT, which are the user Ux
who sends a test request, the SP and users Ui who are within the search area. Thesecurity goal defined in AVISPA is that the bloom filter value is kept secret during thetest, and the participants in the protocol can achieve mutual authentication. The pro-posed ESPT protocol is analyzed by on-the-fly model checker (OFMC). The intrudermodel used in the AVISPA is the Dolev-Yao intruder model [15, 16]. The intruderinitially has all the public information, its own public/private key pair and its ownidentity. As shown in Fig. 4, the output result demonstrates that the ESPT is safe underthe goals as specified.
Then, the computational overhead is analyzed by JAVA and conducted on Intel(R)Core(TM) i7-4790 CPU @ 3.60 GHz, 16 GB Ram, Windows 7 (64-bit). The appliedcryptographic algorithms employed in the simulations are hash function, Secure HashAlgorithm-256 (SHA-256), and Advanced Encryption Standard-Cipher BlockChaining-256 (AES-CBC-256). In our simulations, users are uniformly deployed in anarea of 20 km � 20 km. The parameters used in the simulations are � ¼ 2, l ¼ 500,l ¼ 100, k1 ¼ 1024, k2 ¼ 512, k3 ¼ 200, k4 ¼ 128, and k5 ¼ 128.
To compare the efficiency of our proposed ESPT scheme with the EPPD scheme,the average computational cost in the user location uploading phase with differentnumbers of users is presented in Fig. 5(a). The EPPD scheme needs to calculate andupload the cloaking coordinate of each user while the ESPT scheme only uploads the
Fig. 4. AVISPA result
42 Y. Qiu and M. Ma

users’ location tag to the SP, which can largely save the computational time in thelocation uploading process. The average computational time of a single user by theESPT scheme is about 7:27 ms, which shows that the ESPT scheme is more efficientthan the EPPD scheme.
If the size of the Bloom filter is fixed, the number of false positives is proportionalto the number of data inserted. To save the computational time, the size of the BloomFilter m is dynamic with a given probability of false positives p in the ESPT scheme,which can be computed as m ¼ � n ln p
ln pð Þ2 ; and the number of hash functions k is com-
puted as k ¼ � log2 p; where n is the number of inserted elements. In the privateproximity testing phase, the total number of users is set to 10000 and the probability of
(a). Average Computation Cost of User Location Uploading Phase
(b). Average Computation Cost of a Private Proximity Test
Fig. 5. Performance evaluation
Privacy Preserving for Location-Based IoT Services 43

false positives p is set to be 0.01. A user sends private proximity test requests to the SPwith different search range. The advantage of the EPPD scheme is that the search radiuscan be an arbitrary length. Although the ESPT scheme can only search in units oflocation tags, the search area can be different shapes. For the comparison purpose, thesearch range of the EPPD scheme is set as the radius of a circle area while the searchrange of the ESPT scheme is nearly half of the side length of a square area. As shownin Fig. 5(b), the private proximity testing by the proposed ESPT scheme is much moreefficient than that of the EPPD scheme by using the Bloom filter and secure dot productprotocol.
5 Conclusion
In this paper, the ESPT algorithm is proposed to protect the location information ofusers for the LBS of IoT applications. The proposed scheme enables a user to query aSP whether some persons are within a given search range without any location privacydisclosure. The security analysis proves that the ESPT scheme can preserve locationprivacy for all of the users. The performance evaluation performed by JAVAdemonstrates that the proposed scheme could not only implement the privacy-preserving proximity testing, but also significantly improves the efficiency.
Acknowledgment. We appreciate the financial support from Ministry of Education, Singaporethrough the Academic Research Fund (AcRF) Tier 1 for the project of RG20/15.
References
1. Prigg, M.: Privacy warning over app that can track your location even if you turn GPS off onyour phone. http://www.dailymail.co.uk/sciencetech/article-5134219/App-track-location-turn-GPSoff.html. Accessed 10 Dec 2017
2. Chong, Z.: Obike becomes latest victim of global data breach. https://www.cnet.com/news/yellow-bike-sharing-firm-is-new-victim-of-global-data-breach/. Accessed 12 Dec 2017
3. Narayanan, A., Thiagarajan, N., Lakhani, M., Hamburg, M., Boneh, D.: Location privacyvia private proximity testing. In: Proceedings of NDSS 2011 (2011)
4. Saldamli, G., Chow, R., Jin, H., Knijnenburg, B.P.: Private proximity testing with anuntrusted server. In: Proceedings of 6th ACM Conference on Security and Privacy inWireless and Mobile Networks 2013, WISEC 2013, pp. 113–118. ACM (2013)
5. Zhuo, G., Jia, Q., Guo, L., Li, M., Fang, Y.: Privacy-preserving verifiable proximity test forlocation-based services. In: Proceedings of IEEE Global Communications Conference 2015(GLOBECOM 2015), pp. 1–6. IEEE, USA (2015)
6. Novak, E., Li, Q.: Near-PRI: private, proximity based location sharing. In: Proceedings ofIEEE INFOCOM 2014, pp. 37–45. IEEE, Canada (2014)
7. Huang, C., Lu, R., Zhu, H., Shao, J., Alamer, A., Lin, X.: EPPD: efficient and privacy-preserving proximity testing with differential privacy techniques. In: Proceedings of IEEEInternational Conference on Communications 2016 (ICC 2016), pp. 1–6. EEE, Malaysia(2016)
44 Y. Qiu and M. Ma

8. Zheng, Y., Li, M., Lou, W., Hou, Y.T.: SHARP: private proximity test and secure handshakewith cheat-proof location tags. In: Foresti, S., Yung, M., Martinelli, F. (eds.) ESORICS2012. LNCS, vol. 7459, pp. 361–378. Springer, Heidelberg (2012). https://doi.org/10.1007/978-3-642-33167-1_21
9. Zheng, Y., Li, M., Lou, W., Hou, Y.T.: Location based handshake and private proximity testwith location tags. IEEE Trans. Dependable Secure Comput. 14(4), 406–419 (2017)
10. Sedenka, J., Gasti, P.: Privacy-preserving distance computation and proximity testing onearth, done right. In: Proceedings of the 9th ACM Symposium on Information, Computerand Communications Security 2014 (ASIA CCS 2014), pp. 99–110 (2014)
11. Andr´es, M.E., Bordenabe, N.E., Chatzikokolakis, K., Palamidessi, C.: Geo-indistinguishability: differential privacy for location-based systems. In: Proceedings of the2013 ACM SIGSAC Conference on Computer & Communications Security (CCS 2013),pp. 901–914 (2013)
12. Wang, B., Li, M., Wang, H.: Geometric range search on encrypted spatial data. IEEE Trans.Inf. Forensics Secur. 11(4), 704–719 (2016)
13. Lu, R., Zhu, H., Liu, X., Liu, J.K., Shao, J.: Toward efficient and privacy-preservingcomputing in big data era. IEEE Netw. 28(4), 46–50 (2014)
14. The AVISPA Team: AVISPA v1.1 User Manual. http://www.avispa-project.org/package/user-manual.pdf. Accessed 21 Aug 2017
15. Viganò, L.: Automated security protocol analysis with the AVISPA tool. Electron. NotesTheoret. Comput. Sci. 155, 61–86 (2006)
16. Dolev, D., Yao, A.: On the security of public key protocols. IEEE Trans. Inf. Theory 29(2),198–208 (1983)
Privacy Preserving for Location-Based IoT Services 45

Smart Home Security ApplicationEnabled by IoT:
Using Arduino, Raspberry Pi, NodeJS, and MongoDB
Chad Davidson1, Tahsin Rezwana2, and Mohammad A. Hoque2(B)
1 Department of Electrical Engineering and Computer Science,University of Tennessee Knoxville, Knoxville, TN 37996, USA
[email protected] Department of Computing, East Tennessee State University,
Johnson City, TN 37614, USA{rezwana,hoquem}@etsu.edu
Abstract. Recent advances in smartphones and affordable open-sourcehardware platforms have enabled the development of low-cost architec-tures for IoT-enabled home automation and security systems. These sys-tems usually consist of a sensing and actuating layer that is made up ofsensors such as PIR (Passive Infra-red) sensors, also known as motionsensors; temperature sensors; smoke sensors, and web cameras for secu-rity surveillance. These sensors, smart electrical appliances and otherIoT devices connect to the Internet through a home gateway. This paperlays out architecture for a cost effective “smart” door sensor that willinform a user through an Android application, of door open events in ahouse or office environment. The proposed architecture uses an Arduino-compatible Elegoo Mega 2560 microcontroller (MCU) board along withthe Raspberry Pi 2 board for communicating with a web server thatimplements a RESTful API. Several programming languages are used inthe implementation and further applications of the door sensor are dis-cussed as well as some of its shortcomings such as possible interferencefrom other RF (Radio Frequency) devices.
Keywords: Smart home · Security · IoT · Arduino · Raspberry PiNodeJS · MongDB · RF transmission
1 Introduction
Smart home is a section of the Internet of Things (IoT) paradigm that aims tointegrate home automation and security. Enabling objects in a typical householdto be connected to the Internet allows home-owners to remotely monitor andcontrol them. From lamps that are set on timers to turn off at a specific timeof the day, to smart thermostats that will regulate the temperatures in a houseand generate detailed reports about energy usage, smart homes have found it’s
c© ICST Institute for Computer Sciences, Social Informatics and Telecommunications Engineering 2019
Published by Springer Nature Switzerland AG 2019. All Rights Reserved
A.-S. K. Pathan et al. (Eds.): SGIoT 2018, LNICST 256, pp. 46–56, 2019.
https://doi.org/10.1007/978-3-030-05928-6_5
Smart Home Security Application Enabled by IoT 47
niche in the consumer market. The availability of affordable smartphones, micro-controllers and other open-source hardware along with the increasing use of cloudservices, has made it possible to develop low-cost smart home security systems.With families having busier lives than ever, smart home automation and securitysystems can also cater to household members with limited mobility such as thehandicapped and the old.
The purpose of this paper is to present a low-cost architecture using RF basedcommunication in a household to create an IoT-enabled smart home securitysystem. Smart home devices that typically consume low power such as smartbulbs and door or window sensors use RF transceivers to communicate with eachother. In this paper, an inexpensive architecture is proposed for a smart doorsensor that will utilize an Elegoo Mega 2560 microcontroller board, RaspberryPi 2, a web server, and an Android application.
2 Related Work
Prior work in IoT-enabled home security system has proposed architectures thatfocused on the use of low-cost open-source hardware components like the Arduinoand Raspberry Pi MCU boards and a combination of sensors. PIR (PassiveInfrared) sensors are used to detect motion and can work in sync with a webcamthat captures images to alert users of trespassing.
Kodali et al. describe a cost-effective wireless home security and automationsystem based on the TI-CC3200 LaunchPad: a battery-powered microcontrollerunit (MCU) with built-in WiFi connectivity [1]. PIR motion sensors are placedat the entrances to a building and connect to a digital in-out pin of the MCU.The MCU is programmed using Energia IDE (Integrated Development Envi-ronment) and Wi-Fi enabled. Kodali et al.’s configuration allows mobile phoneswithout Internet connectivity to receive security alerts and control IoT devicesconnected to the microcontroller. Tanwar et al. describe an inexpensive homesecurity system that implements a real-time email alert system [2]. The systemuses a PIR module and a Raspberry Pi MCU. Security cameras and PIR sensorsare connected to the Raspberry Pi via USB ports and GPIO (General PurposeInput/Output) pins respectively. The system assumes that homes have Internetaccess; it uses the Internet to send e-mails to the resident in real-time. The sys-tem’s intrusion detection logic identifies motion by comparing signal inputs fromthe PIR sensors with their previous values. When current and previous signalsdiffer, the security camera captures an image that is stored temporarily on theRaspberry Pi and then automatically e-mailed to the resident.
Gupta and Chhabra describe a cost-effective Ethernet-based smart homesystem for monitoring energy consumption, smoke and temperature levels anddetecting trespassing [3]. This system uses the Arduino-certified Intel Galileo2nd generation microcontroller board. Temperature, smoke and PIR sensors areconnected directly to the microcontroller, while four 220 V devices are connectedvia a relay module. An android based mobile app that connects to the IntelGalileo based server over the Internet allows users to toggle switching devices bytap-to-touch or voice commands through Google API speech recognition tools.
48 C. Davidson et al.
Piyare et al. present a Bluetooth-based home automation system where anAndroid cell phone running a Python script communicates with an Arduino BTboard with digital and analog input/output ports to which sensors and appli-ances are connected [4]. The smartphone application has a toggle on and offfeature for each device. However, Bluetooth connectivity between the smart-phone and the Arduino BT board required a range of 50 meters or less within aconcrete building and mobile platforms other than Symbian do not support thePyhton application.
Behera et al. designed and implemented a real-time smart home automationsystem using an Arduino Uno board along with an Arduino Wi-Fi Shield and aPC home server [5]. A PIR or motion sensor, an LDR (Light Dependent Resistor)and an LM35 temperature sensor were used to collect data which was madeavailable on the PC server that also implemented a MATLAB-GUI platform tocontrol the temperature, lights, and fans. The PIR sensor also acted as a securitycomponent by detecting possible intrusions and setting off a buzzer to alert theresidents.
Howedi et al. proposed a low-cost smart home system built upon a similararchitecture using the Arduino Uno board, PIR sensors, DHT11 temperaturesensors, INA219 high side DC current sensor and servo motors that controldoors and windows [6]. The Arduino IDE is used to implement the control andmonitoring module of the system while the MIT App Inventor is used to developa simple Android application.
Panwar et al. implemented the Eyrie smart home automation system usingthe Raspberry Pi 3 MCU as the central hub [7]. Their proposed architecture con-nected several Arduino Nano boards located around the house to various typesof sensors and NRF24L trans-receivers that eliminated the need for Ethernet orWi-Fi connectivity. Mosquito Broker, an open-source message broker used forrelaying messages to the Raspberry Pi 3, operates using the Debian OS. EclipseSmartHome framework was used to implement a web interface and a smartphoneapp for end-users.
In [8], a home automation system with smart task scheduling is developedmaking use of wireless ZigBee to connect appliances and wired X10 technologyto connect light and switch modules to an Arduino microcontroller. An Ethernetshield mounted on the Arduino MCU allows communication between Arduinoand a Web-based Android application which is then used to remotely add andmanage devices and view recommended scheduling.
ShariqSuhail et al. implemented a prototype for smart home security systemthat uses PIR sensors for intrusion detection, MQ2 sensors for detecting smokeand gas leaks, LM35 temperature sensors as input to an Arduino Mega 2560[9]. A buzzer, LCD, LED strip and a GSM module are outputs to this MCUboard while a Raspberry Pi 2 board is used to include a webcam that capturesimages upon motion detection. GSM (Global System for Mobile communication),a wireless technology interfaces with the Arduino Mega to send SMS notificationsand calls to the user’s cell phone whenever potential intrusion, smoke or gas leakis detected.

Smart Home Security Application Enabled by IoT 49
In [10], a similar architecture utilizes an Arduino Mega 2560 board with aWi-Fi module to implement a voice-controlled smart home system. The Ele-chouse V3 voice recognition module allows users to send voice commands toadjust lighting, open or close windows and control a folding bed.
Vineeth’s et al. voice-controlled secure eHome also make use of the V3 voicerecognition module but use an RF module instead of Wi-Fi for wireless commu-nication between an Arduino UNO and Raspberry Pi MCUs [11]. The RaspberryPi supports sensor connectivity to the Internet so all sensory data can be loggedonto a Google spreadsheet. There is no implementation of a mobile or web appthus confining the controlling of this system to the location of the mic.
Sunehra et al. propose two schemes for a speech-based home automation sys-tem [12]. The first scheme uses HC-05 Bluetooth module along with ArduinoBluetooth controller mobile application to control appliances when inside thehouse. GSM/GPRS technology is used to remotely control appliances and receiveSMS alerts for possible intrusion detections. The ARM11 Raspberry Pi boardacts as the central hub for receiving voice commands though the HC-05 Blue-tooth module and connects to a PIR sensor, relays, a Wi-Fi router and a webcam.
3 System Architecture and Design
3.1 Devices and Sensors
– Elegoo Mega 2560 Board (or Arduino)– RF Receiver-Transmitter Pair (433 Hz)– Magnetic Reed Switch– Raspberry Pi 2– Female to Female-Female to Male Jumper Cables– Android phone or emulator
3.2 Schematics
Figures 1 and 2 describe the schematics for wiring the Elegoo Mega and Rasp-berry Pi boards. In Fig. 1, a magnetic reed switch and RF 433 Hz transmitteris attached to the Mega 2560 board. The ordering of the wires do not matterfor the reed switch. One wire leads to ground and for the code located in therepository, pin 2 on the Mega 2560 board is where the other wire will lead.The RF transmitter has leads to ground, a 5 V power supply, and a lead to pin10 on our board. The antenna used for this project is a simple rolled piece ofaluminum foil.
Figure 2 presents a diagram of the pinout of the Raspberry Pi 2 attachedto an RF Receiver. The RF Receiver has leads to ground, a 5 V power supply,and to pin 13 on the Raspberry Pi (used in OpenDoor.cpp in repository). Notethat there is a second Data pin that is not to be utilized in this project and anantenna (not pictured) was formed out of rolled aluminum foil.
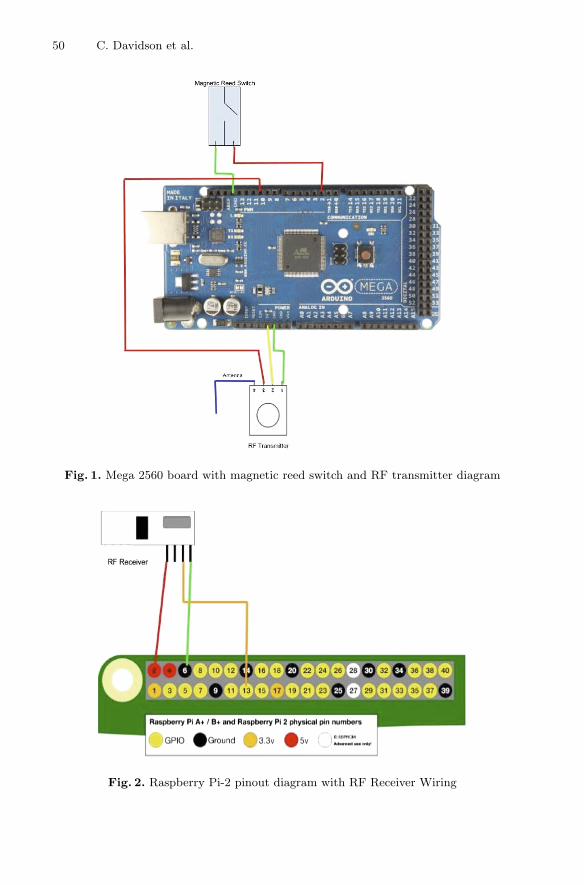
50 C. Davidson et al.
Fig. 1. Mega 2560 board with magnetic reed switch and RF transmitter diagram
Fig. 2. Raspberry Pi-2 pinout diagram with RF Receiver Wiring
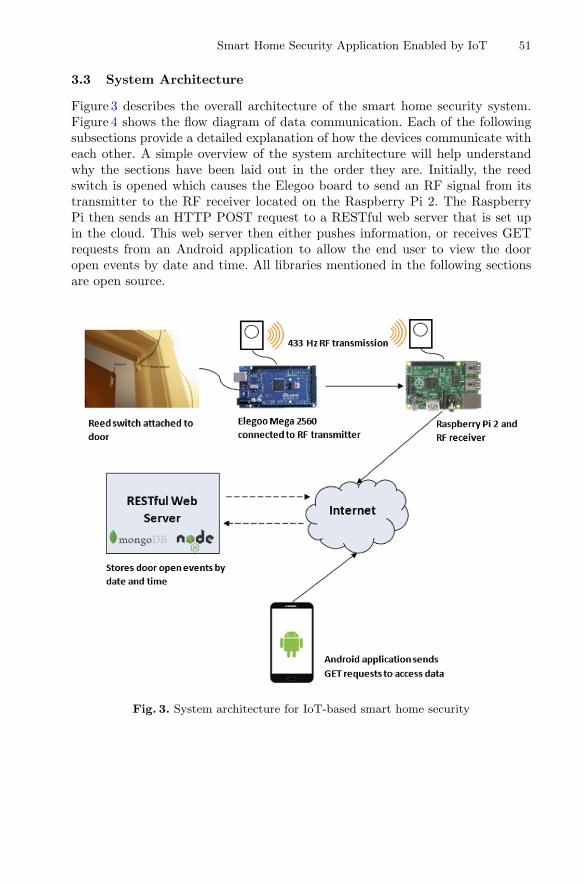
Smart Home Security Application Enabled by IoT 51
3.3 System Architecture
Figure 3 describes the overall architecture of the smart home security system.Figure 4 shows the flow diagram of data communication. Each of the followingsubsections provide a detailed explanation of how the devices communicate witheach other. A simple overview of the system architecture will help understandwhy the sections have been laid out in the order they are. Initially, the reedswitch is opened which causes the Elegoo board to send an RF signal from itstransmitter to the RF receiver located on the Raspberry Pi 2. The RaspberryPi then sends an HTTP POST request to a RESTful web server that is set upin the cloud. This web server then either pushes information, or receives GETrequests from an Android application to allow the end user to view the dooropen events by date and time. All libraries mentioned in the following sectionsare open source.
Fig. 3. System architecture for IoT-based smart home security

52 C. Davidson et al.
Fig. 4. Flowchart representing data flow through the system.
3.4 Communication Between Elegoo and Raspberry Pi-2
The connection between the Elegoo and the Raspberry Pi is the most importantpart as it is where the sensor in the IoT architecture communicates with anotherdevice. Once the door is open and the reed switch is activated, an RF transmis-sion of 433 Hz is sent from the transmitter using the rc-switch library for the
Smart Home Security Application Enabled by IoT 53
Arduino. A binary code is sent to the receiver connected to the Raspberry Piand it is incremented for every subsequent door open event. This enables theRaspberry Pi to keep track of individual door open events. The RF transmissionrange was tested in a 1200 sq. ft apartment. When the reed switch is activated, aconstant stream of binary numbers is transmitted to the receiver attached to theRaspberry Pi. Using a simple piece of aluminum foil as antennae on the receiverand the transmitter, the entire 1200 sq. footage of the house is covered. TheRaspberry Pi utilized the wiringPi library and the 433Utils library to receivethe binary codes. These codes are then sent as a text file output that is read bya Python script that will perform the next step of the communication process.
3.5 Communication Between Raspberry Pi-2 and NodeJS WebServer
When the binary codes have been received and sent as output to a text file, aPython script utilizing the Requests library checks the text file every second fornew updates. When a new code is placed in the text file, a POST request isthen sent to an HTTP web server that is set up with NodeJS and a MongoDBdatabase. This server implements a RESTful API that stores door open eventsby date and time. The data located in this database are accessible via GETrequests that can be performed by the Android application.
3.6 Communication Between Web Server and Android Device
The final step in the communication process is between the web server and theAndroid application written in Java. It is possible to send push notificationswhenever a new door open event is detected by the web server, however, forthe purposes of this project, the Android application makes GET requests tothe server. The Android application uses a variety of libraries that are availablethrough the Android Studio but the library used to make the requests is theVolley library.
4 Future Scope
This design can be used as a reference for further applications to be developedwith the current sensor architecture, and it provides a framework using theRaspberry Pi through which other sensors can be added to the smart homenetwork.
4.1 Reed Switch Applications
The door sensor provides a way of seeing whether or not a door has been opened.The most obvious way to extend this application is to record the amount of timea door is open. While this may be useful to individual end users, there lies apossible business interest in knowing how often the doors to a store are opened

54 C. Davidson et al.
and closed. This information can then be used by businesses to lower their energycosts.
A second future application for this architecture could include connectinga Bluetooth module to the Mega 2560 board to identify individuals enteringthrough the door by pairing with an end users phone. It could also be used byparents to check on a child that may try to leave home at an odd hour.
4.2 Further Raspberry Pi Applications
Since the Raspberry Pi uses an RF receiver it can not only receive the trans-mission from the magnetic reed switch but also be outfitted with the ability toreceive transmissions from other RF-enabled devices in the household. The Rasp-berry Pi could be used as a hub for RF-enabled smart home devices throughoutthe house. The concept can be used to develop a more advanced home secu-rity system that would include PIR motion sensors placed in other areas of thehouse to detect intrusion while homeowners are away. Using, RF-enabled bulbsthe smart home system can be extended to include energy management insidethe house.
The Raspberry Pi can serve as a fog computing device which can store infor-mation locally before sending it to the cloud server. This can be useful whenapplications might need real time support or low latency that cannot be pro-vided by the cloud service.
4.3 Android Application Improvements
The Android application for this project, written in Java, is a basic application.Future work may involve adding time zone support from the device so as notto depend solely on Unix timestamps. Multiple options to view and display thedata located in the MongoDB database, can also be added. A calendar featurecan be integrated so users can have a more robust view of the door open eventsin their household. The system can be enhanced to display alerts to users in theform of SMS or email in the event of trespassing.
5 Limitations
Potential issues may arise through interference on the 433 Hz RF frequency.Many home devices use RF signals to communicate and at a given time theremay be more than one RF receiver trying to send signals to the Raspberry Pi orit could be picking up signals that it wasn’t intended to receive. An interferencetesting with the RF units can be done as a part of future work. In the case ofmultiple transmitters attempting to communicate with the Raspberry Pi, therewould need to be a registration system in place on the Raspberry Pi that kepttrack of incoming signals and their sources. However, the architecture proposedhere does not provide that support.
Smart Home Security Application Enabled by IoT 55
6 Conclusion
This paper presents an architecture that can be used as framework to builda low-cost smart home security system. Using affordable components such asmicrocontrollers from Elegoo and Raspberry Pi and RF signals as a communi-cation channel between these devices, it was possible to develop an IoT systemthat allows users of a household to view when a particular door has been opened.Schematics for connecting the different components have been provided alongwith figures to demonstrate them. The data flow between each of these deviceshave been explained and potential issues that may arise have been discussed.Finally, future work in this area along with potential use cases for this architec-ture have also been discussed.
References
1. Kodali, R.K., Jain, V., Bose, S., Boppana, L.: IoT based smart security and homeautomation system. In: 2016 International Conference on Computing, Communi-cation and Automation (ICCCA), pp. 1286–1289. IEEE, April 2016
2. Tanwar, S., Patel, P., Patel, K., Tyagi, S., Kumar, N., Obaidat, M.S.: An advancedInternet of Thing based security alert system for smart home. In: 2017 InternationalConference on Computer, Information and Telecommunication Systems (CITS),pp. 25–29. IEEE, July 2017
3. Gupta, P., Chhabra, J.: IoT based Smart Home design using power and securitymanagement. In: 2016 International Conference on Innovation and Challenges inCyber Security (ICICCS-INBUSH). IEEE (2016)
4. Piyare, R., Tazil, M.: Bluetooth based home automation system using cell phone.In: 2011 IEEE 15th International Symposium on Consumer Electronics (ISCE),pp. 192–195. IEEE, June 2011
5. Behera, A.R., Devi, J., Mishra, D.S.: A comparative study and implementation ofreal time home automation system. In: 2015 International Conference on EnergySystems and Applications, pp. 28–33. IEEE, October 2015
6. Howedi, A., Jwaid, A.: Design and implementation prototype of a smart house sys-tem at low cost and multi-functional. In: Future Technologies Conference (FTC),pp. 876–884. IEEE, December 2016
7. Panwar, A., Singh, A., Kumawat, R., Jaidka, S., Garg, K.: Eyrie smart homeautomation using Internet of Things. In: Computing Conference, 2017, pp. 1368–1370. IEEE, July 2017
8. Baraka, K., Ghobril, M., Malek, S., Kanj, R., Kayssi, A.: Low cost arduino/android-based energy-efficient home automation system with smart task scheduling. In:2013 Fifth International Conference on Computational Intelligence, Communica-tion Systems and Networks (CICSyN), pp. 296–301. IEEE, June 2013
9. ShariqSuhail, M., ViswanathaReddy, G., Rambabu, G., DharmaSavarni, C.V.R.,Mittal, V.K.: Multi-functional secured smart home. In: 2016 International Confer-ence on Advances in Computing, Communications and Informatics (ICACCI), pp.2629–2634. IEEE (2016)
10. Gunputh, S., Murdan, A.P., Oree, V.: Design and implementation of a low-costArduino-based smart home system. In: 2017 IEEE 9th International Conferenceon Communication Software and Networks (ICCSN), pp. 1491–1495. IEEE, May2017

56 C. Davidson et al.
11. Vineeth, K.S., Vamshi, B., Mittal, V.K.: Wireless voice-controlled multi-functionalsecure ehome. In: 2017 International Conference on Advances in Computing, Com-munications and Informatics (ICACCI), pp. 2235–2240. IEEE, September 2017
12. Sunehra, D., Tejaswi, V.: Implementation of speech based home automation systemusing Bluetooth and GSM. In: 2016 International Conference on Signal Processing,Communication, Power and Embedded System (SCOPES), pp. 807–813. IEEE,October 2016

An MQTT-Based Scalable Architecturefor Remote Monitoring and Control
of Large-Scale Solar Photovoltaic Systems
Salsabeel Shapsough(&), Mohannad Takrouri, Rached Dhaouadi,and Imran Zualkernan
American University of Sharjah, Sharjah, [email protected]
Abstract. This paper presents a novel IoT-based architecture that utilizes IoTcommunication, software, and hardware technologies to enable real-time mon-itoring and management of solar photovoltaic systems at a large scale. Thesystem enables stakeholders to remotely control and monitor the photovoltaicsystems and evaluate the effect of various environmental factors such ashumidity, temperature, and dust. The system was implemented and evaluated interms of network delay and resource consumption. MQTT demonstrated anaverage network delay of less than 1 s, proving the architecture to be ideal forsolar and smart grid monitoring systems. At the hardware, the evaluationshowed the hardware to consume about 3% of the panel’s capacity, while theapplication also utilized a very small percentage of the CPU. This lead to theconclusion that the proposed architecture is best deployed using low-cost con-strained edge devices where a combination of efficient MQTT communicationand low resources consumption makes the system cost-effective and scalable.
Keywords: IoT � Solar photovoltaic monitoring
1 Introduction
Studying the effect of dust and other atmospheric conditions on remote solar photo-voltaic systems has been recognized as key to more efficient solar power generation.While soiling, especially the accumulation of dust particles on panels, is known toreduce solar panel efficiency [1], the cost of periodic cleaning can sometimes exceedthe cost ensued by dust accumulation [2]. It is therefore important to monitor the PVpanels soiling level to optimize the cost of cleaning, especially as the scale increasesfrom few solar panels to solar farms. Similar challenges also exist with other envi-ronmental factors such as haze, moisture, and temperature [3, 4]. Furthermore, the tiltangle of a solar panel array can influence the solar radiance harnessed by the panel PV[5]. Controlling the angle, therefore, can not only maximize the power output, but alsoassist in building a model that predicts the optimal solar array installation in a specificregion. Thus, the ability to remotely monitor and control multiple solar farms has sincebeen recognized to hold the key to optimum solar power generation.
© ICST Institute for Computer Sciences, Social Informatics and Telecommunications Engineering 2019Published by Springer Nature Switzerland AG 2019. All Rights ReservedA.-S. K. Pathan et al. (Eds.): SGIoT 2018, LNICST 256, pp. 57–67, 2019.https://doi.org/10.1007/978-3-030-05928-6_6

1.1 Background
Several designs for solar photovoltaic remote monitoring systems have been previouslyproposed [6]. A noticeable recent trend in the field has been the adoption of Internet ofThings (IoT) concepts and technologies [7] for building such systems. An IoT systemconsists of numerous, geographically spread nodes that interact with their surround-ings, and send information back to a server periodically, based on a certain event, orboth. Information is either provided to stakeholders in real-time or stored to beavailable on demand. The scale of such systems enabled by emergence of new softwareand hardware technologies that cater for low-cost, scalability, reliability, and security.
1.2 The Internet of Things Paradigm
A generic Internet of Things system consists of five layers: perception, network,middleware, application, and business. In a solar PV system, the perception layer isrepresented by sensing and actuating elements at the panel level, while the networklayer is represented by the wireless intranetworking within a solar farm, and theinternetworking between solar farms, remote servers, and stakeholders. The middle-ware layer hosts technologies responsible for translating raw data into intelligibleinformation, as well as storage and dissemination of information. The application andbusiness layers represent interested stakeholders. While interfaces used by clients andresearchers fall under the application layer, operations such as billing and integrationwith smart grid represent the business layer.
1.3 IoT-Aided Solar Monitoring
The value that IoT technologies can bring to remote monitoring of Solar PV systemshas been recognized. Several works have suggested the incorporation of IoT elementsin the field. Most such proposals cater to the edge of the IoT system, low-cost edgesensing and processing technologies such as Raspberry Pi, Arduino, BeagleBones, andothers are used to acquire readings related to solar panel’s power generation efficiency,as well as the surrounding environment [8–10]. Edge devices often act as nodes inmesh networks, connected by short-range wireless technologies such as ZigBee andBluetooth. One shortcoming of the proposed systems is that beyond the edge, large-scale operations such as dissemination and management of data across the wholesystem are still performed either by classic internet technologies which are ill-suited forthis purpose [11]. In this paper, we present a novel architecture for scalable, almost-real-time monitoring of Solar PV systems, based on a complete IoT paradigm thatintegrates IoT technologies across the system.
2 Proposed Architecture
The proposed IoT-based architecture is shown in Fig. 1. The edge device at each panelrepresents the perception element. Each device is equipped with sensors and actuatorsand is capable of data processing and wireless communication. Data is transmitted
58 S. Shapsough et al.

wirelessly to reduce cabling costs. Wireless communication can be provided either byan access point that every group of edge devices can connect to over WiFi, Bluetooth,ZigBee, or Thread, or by connecting a 3G/4G module to each individual edge device.
2.1 System Architecture
The first key middleware element is a messaging broker that supports apublish/subscribe communication protocol like Message Queuing Telemetry Transport(MQTT). As opposed to the HypterText Transfer Protocol (HTTP), -which operates ina one-to-one client-request/server-response architecture, MQTT allows event-based,one-to-many, many-to-one, and many-to-many messaging between remote nodes [12].MQTT also consumes less computational and network resources, while also causingless latency [13]. This makes the protocol an ideal choice for deployment on low-resources edge devices in applications like solar monitoring. The broker keeps a reg-ister of subscribed nodes in order to route any new messages from publishers to theircorrect destinations. In the case of a node going down due to technical issues, thebroker retains messages until the node is available again. Other middleware elements
Fig. 1. System architecture
An MQTT-Based Scalable Architecture 59

are: an application server to manage data and provide a web interface for users, adatabase to store data, and an analytics engine.
2.2 Communication Architecture
The key aspect of an MQTT-Based architecture is that the system supports the optionof distributed servers, allowing load balancing for large-scale systems as moreresources can easily be integrated into the system. Alternatively, different servers canbe developed to host different types of applications, and connect to different analyticsengines, making the system not only highly scalable, but also flexible. On the other endof the architecture, individual solar panels and entire solar farms can easily be addedand removed with minimal disturbance to other part of the system. This is yet anotheradvantage of publish/subscribe architectures, as the subscribers are separated from thepublishers by the broker, which acts as a mediator between the two. Messages frompublishers are delivered to subscribers based on “topics” maintained by the broker.Figure 2 demonstrates message routing at the broker.
Every published message includes a topic following the format of a URL. Forexample, a PV panel located in “Region 1” of the solar farm and identified by the panelID “Panel 1” tags its messages with “/region_1/topic_1”. Subscribers can choose tosubscribe to any topic by sending a one-time subscription request. Subscribers cansubscribe to one panel (/region_1/panel_1), all panels in a region (/region_1/*), or all
Fig. 2. Communication architecture
60 S. Shapsough et al.

panels in the system (/*). The “*” character acts as a wildcard and allows subscribers tosubscribe to numerous publishers with a single request. It is also possible for multiplepanels to publish to one topic, e.g. “region_1/dust”, or for subscribers to subscribe tosensor-related topics, e.g. “/*/dust”. This enables subscribers interested in certaininformation, such as dust accumulation, for example, to receive updates any new panelsadded to the system, without the need to pre-register the panel at the subscribers.
2.3 Proof of Concept
Hardware Implementation. As proof of concept, a prototype of the system includinghardware and software has been implemented and tested over the past few months.Two types of WiFi-connected Raspberry Pi-based edge stations were designed,implemented, and evaluated. The first type is “pv station”, which is a station that isattached to and monitors an individual solar panel. The pv station is equipped with acombination of sensors and actuators to provide different types of monitoring andcontrol. The second type, “c station”, is equipped with a Raspberry Pi camera forsurveillance. It is also possible to use the videos from the “c station” to perform imageprocessing for research on weather and soiling effect on solar panels. The internaltemperature of the Raspberry Pi in all stations is also monitored for troubleshooting.A description of each station’s features is shown in Table 1, while the PV stations areshown in Fig. 3.
The two pv stations are self-sufficient in terms of power in that the batteries that powersthe stations are charged using the solar panel each station monitors. The c station, onthe other hand, is powered through a wall socket. Communication between edge
Table 1. Edge nodes
C station PV station 1 PV station 2 PV station 3
Purpose CCTV Solar irradianceand PV outputmonitoring
Solar irradianceand weathermonitoring
PV output monitoringand IV characteristicsmeasurement
Maincomponents
• RPi Camera• RPi internaltemperaturesensor
• Pyranometer• 3 voltage sensors• 3 current sensors• RPi internaltemperaturesensor
• Pyranometer• Ambienttemperaturesensor
• Humidity sensor• RPi internaltemperaturesensor
• 2 isolatedvoltage + currentsensors
• Temperature sensor• Relay modules• RPi internal temperaturesensor
Reportfrequency
1/minute 1/second 1/minute 1/second
Data type Video stream text text textAveragepacket size
508 Bytes 189 Bytes 346 Bytes
An MQTT-Based Scalable Architecture 61

stations and the rest of the system is carried out over WiFi, while c station is connectedvia Ethernet to improve video streaming quality.
Backend and Web Application Server. The backend server is the main subscriber toreal-time readings. The server was built using NodeJS and Express and is hosted onAmazon Web Services (AWS) which provides a mix of a Platform as a Service (PaaS)and Infrastructure as a Service (IaaS). Readings are stored into DynamoDB, which is adocument-based NoSQL database. The main server’s Express interface exposes fourmain functionalities: a standalone solar irradiance interface (Fig. 4), a real-time mon-itoring, control, and surveillance interface for individual panels (Figs. 5 and 7), ahistory interface that allows access to archived data logs from specific dates and times(Fig. 6), and an analytics interface. Access privilege levels can range from casual userswho can only view the real-time solar irradiance, to high level administrators who areauthorized to send control commands to the panels, view analytics, and access thesurveillance camera.
The importance of the surveillance camera comes from enabling administrators tocompare measured values to actual real-time footage. For example, an irregularity waspreviously noticed in solar irradiance data at around 08:45 am where the irradiancevalue experiences a sudden jump. Reviewing the surveillance video (Fig. 7) revealed
Fig. 3. Edge stations: (a) PV station 1, (b) PV station 2, (c) PV station 3
Fig. 4. Solar irradiance over a full day
62 S. Shapsough et al.
that the shading was due to the sun rising from behind the neighboring buildings.Furthermore, the stored footage provides visual data that can be used along with imageprocessing and machine learning algorithms to perform various studies to predictsoiling levels and study its effect on the solar power output.
Fig. 5. Real-time interface for PV station 2 showing humidity and temperature
Fig. 6. History interface showing solar irradiance readings log from PV station 2 on May 24th,2018
An MQTT-Based Scalable Architecture 63
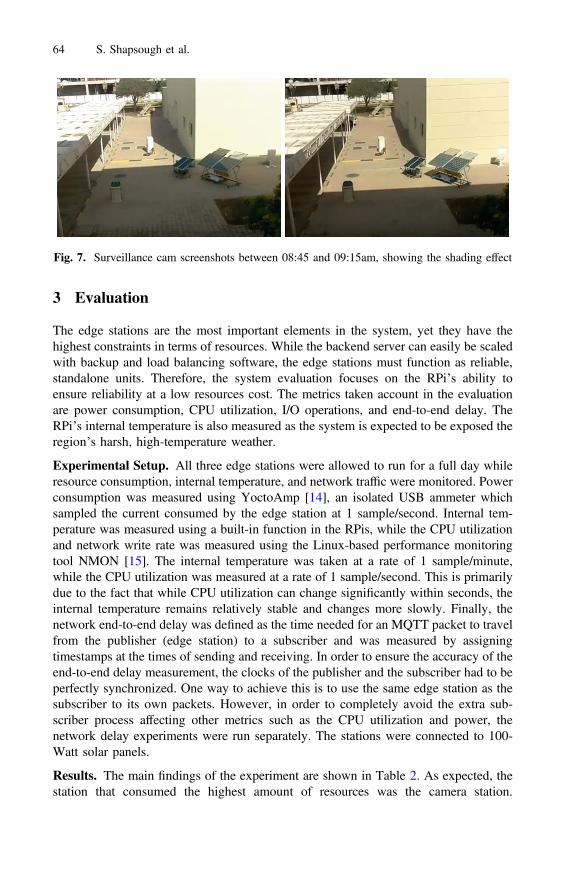
3 Evaluation
The edge stations are the most important elements in the system, yet they have thehighest constraints in terms of resources. While the backend server can easily be scaledwith backup and load balancing software, the edge stations must function as reliable,standalone units. Therefore, the system evaluation focuses on the RPi’s ability toensure reliability at a low resources cost. The metrics taken account in the evaluationare power consumption, CPU utilization, I/O operations, and end-to-end delay. TheRPi’s internal temperature is also measured as the system is expected to be exposed theregion’s harsh, high-temperature weather.
Experimental Setup. All three edge stations were allowed to run for a full day whileresource consumption, internal temperature, and network traffic were monitored. Powerconsumption was measured using YoctoAmp [14], an isolated USB ammeter whichsampled the current consumed by the edge station at 1 sample/second. Internal tem-perature was measured using a built-in function in the RPis, while the CPU utilizationand network write rate was measured using the Linux-based performance monitoringtool NMON [15]. The internal temperature was taken at a rate of 1 sample/minute,while the CPU utilization was measured at a rate of 1 sample/second. This is primarilydue to the fact that while CPU utilization can change significantly within seconds, theinternal temperature remains relatively stable and changes more slowly. Finally, thenetwork end-to-end delay was defined as the time needed for an MQTT packet to travelfrom the publisher (edge station) to a subscriber and was measured by assigningtimestamps at the times of sending and receiving. In order to ensure the accuracy of theend-to-end delay measurement, the clocks of the publisher and the subscriber had to beperfectly synchronized. One way to achieve this is to use the same edge station as thesubscriber to its own packets. However, in order to completely avoid the extra sub-scriber process affecting other metrics such as the CPU utilization and power, thenetwork delay experiments were run separately. The stations were connected to 100-Watt solar panels.
Results. The main findings of the experiment are shown in Table 2. As expected, thestation that consumed the highest amount of resources was the camera station.
Fig. 7. Surveillance cam screenshots between 08:45 and 09:15am, showing the shading effect
64 S. Shapsough et al.
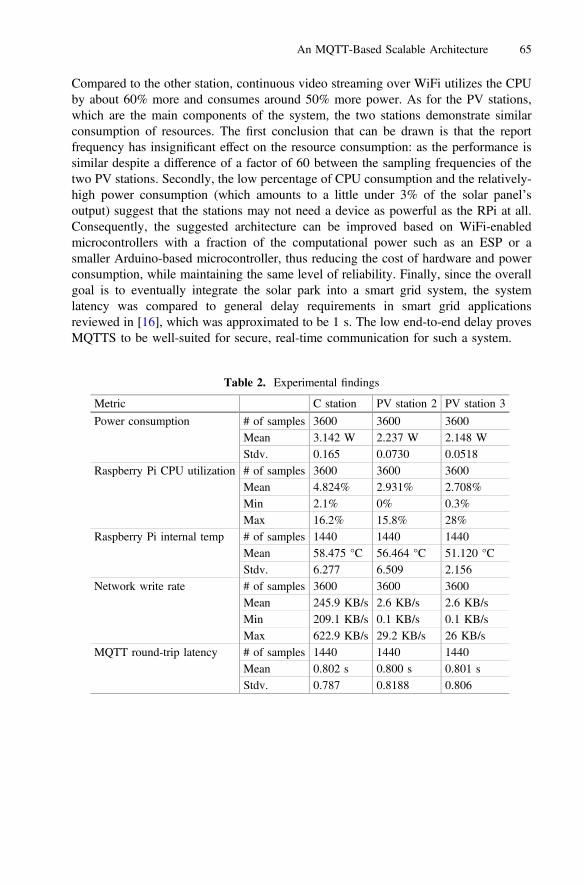
Compared to the other station, continuous video streaming over WiFi utilizes the CPUby about 60% more and consumes around 50% more power. As for the PV stations,which are the main components of the system, the two stations demonstrate similarconsumption of resources. The first conclusion that can be drawn is that the reportfrequency has insignificant effect on the resource consumption: as the performance issimilar despite a difference of a factor of 60 between the sampling frequencies of thetwo PV stations. Secondly, the low percentage of CPU consumption and the relatively-high power consumption (which amounts to a little under 3% of the solar panel’soutput) suggest that the stations may not need a device as powerful as the RPi at all.Consequently, the suggested architecture can be improved based on WiFi-enabledmicrocontrollers with a fraction of the computational power such as an ESP or asmaller Arduino-based microcontroller, thus reducing the cost of hardware and powerconsumption, while maintaining the same level of reliability. Finally, since the overallgoal is to eventually integrate the solar park into a smart grid system, the systemlatency was compared to general delay requirements in smart grid applicationsreviewed in [16], which was approximated to be 1 s. The low end-to-end delay provesMQTTS to be well-suited for secure, real-time communication for such a system.
Table 2. Experimental findings
Metric C station PV station 2 PV station 3
Power consumption # of samples 3600 3600 3600Mean 3.142 W 2.237 W 2.148 WStdv. 0.165 0.0730 0.0518
Raspberry Pi CPU utilization # of samples 3600 3600 3600Mean 4.824% 2.931% 2.708%Min 2.1% 0% 0.3%Max 16.2% 15.8% 28%
Raspberry Pi internal temp # of samples 1440 1440 1440Mean 58.475 °C 56.464 °C 51.120 °CStdv. 6.277 6.509 2.156
Network write rate # of samples 3600 3600 3600Mean 245.9 KB/s 2.6 KB/s 2.6 KB/sMin 209.1 KB/s 0.1 KB/s 0.1 KB/sMax 622.9 KB/s 29.2 KB/s 26 KB/s
MQTT round-trip latency # of samples 1440 1440 1440Mean 0.802 s 0.800 s 0.801 sStdv. 0.787 0.8188 0.806
An MQTT-Based Scalable Architecture 65

4 Conclusion
The proposed system architecture employs a network of distributed edge nodes thatcollect sensor readings from the environment as well as the solar photovoltaic panelsand transmits them back to the main station over WiFi. In addition to maintaining alarge-scale database, the main station hosts an application server that offers monitoringof readings in real time, an overview of historic data, geolocation-based visualization ofconnected solar farms, and big data analytics. The system is used to enable and supportthe study of the effects of environmental factors, on solar farm, such as dust accu-mulation and its effect on power generation efficiency. The system also enablesstakeholders to monitor and control critical operations. This is made possible viaInternet of Things communication, software, and hardware technologies which areinherently designed for large scale distributed ecosystems.
References
1. Burton, P.D., King, B.H.: Application and characterization of an artificial grime forphotovoltaic soiling studies. IEEE J. Photovoltaics 4, 299–303 (2014). https://doi.org/10.1109/JPHOTOV.2013.2270343
2. Zapata, J.W., Perez, M.A., Kouro, S., et al.: Design of a cleaning program for a pv plantbased on analysis of energy losses. IEEE J. Photovoltaics 5, 1748–1756 (2015). https://doi.org/10.1109/JPHOTOV.2015.2478069
3. Liu, H., Nobre, A.M., Yang, D., et al.: The impact of haze on performance ratio and short-circuit current of PV systems in Singapore. IEEE J. Photovoltaics 4, 1585–1592 (2014).https://doi.org/10.1109/JPHOTOV.2014.2346429
4. Huang, P., Zhao, W., Li, A.: The preliminary investigation on the uncertainties associatedwith surface solar radiation estimation in Mountainous Areas. IEEE Geosci. Remote Sens.Lett. 14, 1071–1075 (2017). https://doi.org/10.1109/LGRS.2017.2696973
5. Khoo, Y.S., Nobre, A., Malhotra, R., et al.: Optimal orientation and tilt angle for maximizingin-plane solar irradiation for PV applications in Singapore. IEEE J. Photovoltaics 4, 647–653(2014). https://doi.org/10.1109/JPHOTOV.2013.2292743
6. Rahman, M.M., Selvaraj, J., Rahim, N.A., Hasanuzzaman, M.: Global modern monitoringsystems for PV based power generation: a review. Renew. Sustain. Energy Rev. (2017).https://doi.org/10.1016/j.rser.2017.10.111
7. Degener, S.: The internet of things: enabling intelligent solar assets. Renew. Energy Focus17, 136–137 (2016). https://doi.org/10.1016/j.ref.2016.06.004
8. Adhya, S., Saha, D., Das, A., et al.: An IoT based smart solar photovoltaic remotemonitoring and control unit. In: 2016 2nd International Conference on Control, Instrumen-tation, Energy Communication (CIEC), pp. 432–436 (2016)
9. Jihua, Y., Wang, W.: Research and design of solar photovoltaic power generationmonitoring system based on TinyOS. In: 2014 9th International Conference on ComputerScience Education, pp. 1020–1023 (2014)
10. Liu, G., Qiu, H., Zhu, L., Chen, Y.: Architecture and experiment of remote monitoring andoperation management for multiple scales of solar power plants. In: 2017 IEEE 2ndAdvanced Information Technology, Electronic and Automation Control Conference(IAEAC), pp. 2489–2495 (2017)
66 S. Shapsough et al.

11. Mashal, I., Alsaryrah, O., Chung, T.-Y., et al.: Choices for interaction with things on Internetand underlying issues. Ad Hoc Netw. 28, 68–90 (2015). https://doi.org/10.1016/j.adhoc.2014.12.006
12. Yokotani, T., Sasaki, Y.: Comparison with HTTP and MQTT on required network resourcesfor IoT. In: 2016 International Conference on Control, Electronics, Renewable Energy andCommunications (ICCEREC), pp. 1–6 (2016)
13. Naik, N.: Choice of effective messaging protocols for IoT systems: MQTT, CoAP, AMQPand HTTP. In: 2017 IEEE International Systems Engineering Symposium (ISSE), pp. 1–7(2017)
14. Yocto-Amp - Tiny isolated USB ammeter (AC/DC). http://www.yoctopuce.com/EN/products/usb-electrical-sensors/yocto-amp. Accessed 27 Mar 2017
15. nmon for Linux | Main / HomePage. http://nmon.sourceforge.net/pmwiki.php. Accessed 27Mar 2017
16. Kansal, P., Bose, A.: Bandwidth and latency requirements for smart transmission gridapplications. IEEE Trans. Smart Grid 3, 1344–1352 (2012). https://doi.org/10.1109/TSG.2012.2197229
An MQTT-Based Scalable Architecture 67

A Smart Meter Firmware Update StrategyThrough Network Coding for AMI
Network
Syed Qaisar Jalil1(B), Stephan Chalup1, and Mubashir Husain Rehmani2
1 The University of Newcastle, Callaghan, [email protected]
2 Waterford Institute of Technology (WIT), Waterford, Ireland
Abstract. With the introduction of communication infrastructure intothe traditional power grids, smart power grids are emerging to meet thefuture electricity demands. In smart grid, advanced metering infrastruc-ture (AMI) is one of the main components that enables bi-directionalcommunication between home area networks and utility providers. In anAMI network, one of the crucial operations is to update the firmware ofthe smart meters. In this paper, we propose a new forwarding strategyfor the firmware updates in AMI network. Our simulation results showthat the completion time of the smart meter firmware update processcan be reduced significantly by using the proposed new strategy.
Keywords: Network coding · Firmware updates · Smart gridNeighbourhood area networks · Advanced metering infrastructure
1 Introduction
In traditional power grids, electric power flows only in one direction, i.e. from thepower generating stations to the consumers via large interconnected networks.Information is only monitored in the distribution networks that distribute theelectric power to the individual consumers [1]. These power grids will not beable to support the future electricity demands due to the ageing infrastruc-ture, growing energy demands, emerging renewable energy sources and securityproblems. Smart grid (SG) paradigm has been introduced to meet the futureelectricity demands. SG is envisioned to integrate the bi-directional communica-tion, control technology, and sensing into the power system to achieve significantimprovements in reliability, sustainability, stability and security of the electricalgrid [2].
In SG, AMI is the architecture that enables two-way communication betweenhome area networks and the utility provider [3]. AMI includes smart meters,communication system and a meter data management system. AMI plays asignificant role in the working of SG by measuring, collecting and analysingenergy usage patterns. To provide these functionalities, AMI must support ac© ICST Institute for Computer Sciences, Social Informatics and Telecommunications Engineering 2019Published by Springer Nature Switzerland AG 2019. All Rights ReservedA.-S. K. Pathan et al. (Eds.): SGIoT 2018, LNICST 256, pp. 68–77, 2019.https://doi.org/10.1007/978-3-030-05928-6_7

A Smart Meter Firmware Update Strategy Through Network Coding 69
variety of traffic generated from different sources (utility, data concentratorsand smart meters) along with the constraints like limited bandwidth and time-critical applications [4].
The smart meter is an advanced energy meter that provides functions likedata collection, data storing, load control, display and billing [5]. A smart metercomprises the network interface card (NIC), processor and other electronic partswhich can process the information and communicate it over the communicationnetwork. It has the ability to run TCP/IP suite as well as can use TCP orUDP. Moreover, the operating system of a smart meter can support a rangeof applications which enables it to perform tasks like measurement, databasemanagement and communication [6]. The software which runs on the smartmeter to control, monitor and manipulate the data is known as firmware. Smartmeter vendors develop the firmware and update it regularly to improve thefunctionality, fix the detected bugs, and add new functionality to their smartmeters [7]. Moreover, firmware is also useful for utility companies when theyupdate their applications for functionality improvement, bug fixing or due tothe changes of legal requirements.
Firmware updates are required to have 98% reliability and in some cases,are required to have a latency of 2mins [8]. Such reliability is needed because ofthe fact that if the firmware of the smart meters is compromised, then the real-time monitoring and other functionalities of the SG are compromised too. Also, ifthere is a bug in the smart meters which hinders the process of demand responsemanagement, then the utility provider would want to update the firmware of thesmart meters as soon as possible, otherwise it can lead to the high economic loss.Moreover, there is a considerable security threat involved in the firmware updateprocess. For instance, a terrorist organisation can launch the firmware updatein the SG which cannot only give them access to shut off the electricity to thecustomers but also damage the power generating facilities and SG infrastructure[9]. Therefore, in the event of a malicious code attack, some fallback measuremust be present such that the smart meter vendors or utility companies canrevert all smart meters to the safe mode and this should be done remotely andquickly.
In an AMI network, one of the critical operations is to update the firmwareof the smart meters. However, there are only few publications on updating thefirmware of smart meters, and most of the work in the literature has focusedon the security aspects. Authors in [10] proposed a network service manage-ment system and firmware update management system and they also introducedremote firmware update process in AMI networks. To avoid malicious firmwareupdates, authors in [11] proposed a secure firmware update method based on thepre-defined pattern of changes in the base frequency. In [12], authors have pro-posed an attribute-based multicast-over-broadcast protocol for firmware updatesin AMI network. This protocol makes use of ciphertext-policy attribute-basedsigncryption to provide access control, confidentiality and message authentica-tion. Authors extended their work in [7] by employing random linear network

70 S. Q. Jalil et al.
coding to overcome the issue of reduced reliability imposed by the use of sign-cryption.
In this paper, we propose the firmware update process under a new coop-eration strategy among the smart meters namely: most served neighbour for-warding firmware update (MSNFFU) and most neighbour forwarding firmwareupdate with network coding (MSNFFU-NC). In our strategies, we utilise neigh-bour information and random linear network coding to speed up the process ofthe firmware updates. We compare our strategies with four other cooperationstrategies namely: blind forwarding firmware update (BFFU), blind forwardingfirmware update with network coding (BFFU-NC), selective forwarding firmwareupdate (SFFU) and selective forwarding firmware update with network coding(SFFU-NC).
The organisation of the paper is as follows. Section 2 provides the backgroundinformation about the NAN, AMI and RLNC. Section 3 introduces system modeland problem definition. In Sect. 4, we present the solution and implementationdetails along with different cooperation strategies. Simulation results are alsopresented and discussed in this section. Finally, we summarise our work andconclude the paper in Sect. 5.
Fig. 1. In this figure, generation of the coded packet through RLNC is shown.β1, β2, ..., βm are the random coefficients whereas, p1, p2, ..., pm are the packets(chunks) of the original file of size f. Addition operation (⊕) is used to combine therandom coefficients and chunks. Then, again addition is performed over the combinedpackets to generate the coded packet z.
2 Preliminaries
Neighborhood Area Networks and Advance Metering Infrastructure.Communication in SG can be broken down into following three main networktypes. Firstly, home area network (HAN) which is responsible for the commu-nication of sensors and devices inside the home. Secondly, neighbourhood area

A Smart Meter Firmware Update Strategy Through Network Coding 71
network (NAN) which is responsible for connecting smart homes (smart meters)and concentrators. Finally, wide area network (WAN) which is responsible forthe communication between concentrators and the utility control centres [1].
In NAN, smart meters are connected in a mesh topology along with a con-centrator such that total connectivity is ensured. Smart meters generate datawhich is then collected by the concentrators and forwarded to the control cen-tre using WAN. Moreover, pricing and control messages are delivered in thereverse direction by the concentrators. Since smart meters are nodes, we willuse the term “smart meter” and “node” interchangeably. It is worth mention-ing that NANs consists of thousands of nodes which are deployed in complexand large geographical areas. Therefore, NANs play an essential role in SGcommunication [13].
Random Linear Network Coding (RLNC). Random linear network cod-ing is utilized in the broadcast based communication because it produces close-to-optimal throughput and does not require a centralized controller for encod-ing/decoding operations [14]. In RLNC, data is divided into generations by thedata source for broadcasting. There are m number of packets in a generationdenoted by pk where k = 1, 2, ...,m. Each packet has a size of q bytes. To obtainan encoded packet, a random linear combination of all the packets are computedin a generation. The encoded packet for each generation can be written as
z =m∑
k=1
βkpk (1)
where βk is encoding vector. The encoding process of RLNC is illustrated inFig. 1. In order to decode a packet, an encoding vector is required, which isincluded in every packet. Upon receiving an encoded packet, the receiver checksif the received packet is useful or not by checking the linear dependency of theencoding vector with all other possessed encoded packets. If the linear depen-dency is found then the received packet is discarded. On the other hand, thereceiver keeps the packet (also known as the innovative packet) in the buffer andtries to decode the packets stored in the buffer.
Each entry of the encoding vector β is chosen randomly from Galois fieldGF (2i) where i is a positive integer. It is important to note that the Galois fieldis a finite field which means that the number of elements in it is finite and allthe operations defined in it are closed. Therefore, the resultant of any operationfrom this field on two elements will be in the same field.
3 System Model
We consider a scenario of NANs where n fixed smart meters connected in amesh topology are deployed in a square of area a. Each node has a well definedtransmission radius r. To ensure the total connectivity among nodes, we chosethe values of a, n and r by following the inequality n ≥ 10·a
π·r2 presented in [15].

72 S. Q. Jalil et al.
U lity control center
Concentrator
Base Sta on
Wired Backhaul Network
Smart home equipped with smart meter
Concentrator Concentrator
Base Sta on
Wired connec on
Wireless connec onsBetween BS and
concentratorInter-concentrator
communica onInter-smart meters
communica on
High speed fiber link
Fig. 2. Illustration of the smart grid communication architecture. Smart homesequipped with smart meters are connected in a mesh topology using wireless medium.Some of the smart homes are connected to concentrators that ensure the total connec-tivity of the network. Concentrators are connected to the base stations which in turnare connected to the utility control centre through WAN.
There is a number of ct concentrators in the system which are connected to thecontrol center through WAN. Here, it is important to mention that concentra-tor placement itself is a research problem [16] and this is beyond the scope ofthis paper. Therefore, we have only considered the case of concentrators at theextreme of the area a. The considered network model is illustrated in Fig. 2.
Concentrators have a firmware update patch of size f which is divided into|m| chunks and needs to be disseminated in the system. γ is the available rateat which nodes can transmit file chunks over the wireless medium. The timerequired to download one single chunk and the entire firmware patch at rate bare defined as one round and one unit of time, respectively. Therefore, if thereis a file of size f divided into |m| equivalent chunks then one round will be equalto 1
|m| unit of time.We assume that the utility provider or smart meter vendors can determine the
firmware of smart meters which needs to be updated. In the case of an update,the concentrator(s) will be notified and required to release the firmware updatepatch in the network such that the firmware is updated as soon as possible. Afirmware update is a crucial operation because it might be happening in thecase of a serious bug which, if delayed, can result in enormous economic loss.Therefore, the firmware update process should be performed in a time efficientmanner.
A Smart Meter Firmware Update Strategy Through Network Coding 73
4 AMI Firmware Updates Strategies
We consider six different AMI firmware updates strategies among nodes wherethree of these strategies make use of network coding. We adopted the first fourstrategies from the study [17] where authors have used the network coding forfile sharing application in the wireless mesh network. In the first two strategies,we use the concept of flooding with and without network coding. Whereas, in thelast four strategies, we assume that every node in the network has a neighbourinformation table, i.e. a list of available chunks at neighbours. Considering thatsmart meters have the capability to manage the database [6], and importanceof the firmware updates, it is reasonable to assume such strategies where smartmeters can maintain a table. However, building and maintaining such tablesis beyond the scope of our paper. These strategies will ensure when and hownetwork coding can be used in the process of smart meter firmware updates.
1. Blind Forwarding Firmware Update (BFFU) is a primitive cooperationstrategy which is based on flooding. In this strategy, when a node receivesa chunk, it tries to get access to the wireless medium. Upon getting accessto the wireless medium, a node transmits the chunk to its neighbours with-out considering if any neighbour is interested in this chunk or not. Beforeperforming a single transmission, a node may receive multiple chunks fromthe neighbours due to the shared wireless medium. Moreover, the order ofreception of the chunks determines the transmission sequence of the chunks,i.e. first received chunks will be transmitted first.
2. Blind Forwarding Firmware Update with Network Coding (BFFU-NC) is same as the BFFU, but it uses network coding before transmission.In this strategy, upon receiving a new combination and getting access to thewireless medium, a node generates combination of all chunks (that are in thepossession of this node) and forwards it to the neighbour nodes.
3. Selective Forwarding Firmware Update (SFFU) make use of theassumption that every node contains a table that has information about theneighbours, i.e. the list of chunks available at the neighbours. In this strat-egy, every node checks its table continually, and if it finds a chunk which isrequired by one of its neighbours, then this node transmits that particularchunk.
4. Selective Forwarding Firmware Update with Network Coding(SFFU-NC) is similar to the SFFU but it utilises network coding duringtransmission. Identical to the SFFU, every node checks its table continually,and upon finding a chunk of interest to its neighbour, this node generates thecombination of all the information that it posseses and transmits it.
5. Most Served Neighbour Forwarding Firmware Update (MSNFFU)is similar to the SFFU, i.e. every node has a table which has the informationof available chunks at its neighbours. In this strategy, a node is selected fortransmission based on the number of neighbours it can satisfy, i.e. how manyof its neighbours require a chunk that is available at this node. A priorityqueue of nodes, where the node that can serve most neighbours is first in

74 S. Q. Jalil et al.
the queue, is created in each round. If there are many nodes with the samepriority, then the first from the queue is selected.
6. Most Served Neighbour Forwarding Firmware Update with Net-work Coding (MSNFFU)-NC is similar to the MSNFFU, i.e. every nodehas a table which has the information of available chunks at its neighbours,but it utilises network coding during transmission. Similar to the MSNFFU,a priority queue is created in each round based on the number of neighboursa node can satisfy, but the transmission is different from MSNFFU. Whena node is selected for transmission, it generates the combination of all theinformation that it posseses and transmits it. Pseudo code for MSNFFU-NCis presented in Algorithm 1.
4.1 Implementation Details
The proposed cooperation strategies were implemented in C++. We have takenthe implementation code from [17] and modified it according to our scenario.Here, it is important to mention that the implementation considers a collision-free medium access control (MAC) protocol that gives the same probability toall the competing nodes to access the medium.
As stated earlier, the time-space is divided into rounds which enables us toanalyse the distribution of the firmware patch among the nodes in the network.Transmission can only occur at the beginning of the round. The following foursteps are performed in each round for transmission of chunks among the nodes.
In the first step, nodes which have chunks to send are identified and savedin the candidates list. Initially, only the concentrators have the patch; therefore,they are placed in the candidates list but later on, when the file chunks propagatein the network then other nodes will be added to this list. Assuming the collision-free MAC protocol, transmission can only be performed by some of the nodes inthe candidate list. Therefore, we select the nodes that can perform transmissionin the second step. We begin this step by randomly choosing a node from thecandidates list and place it in a new list called the transmitters list. To ensurecollision-free transmission, we look for the neighbours of the selected node anddelete them from the candidates list. We also remove the neighbours of theneighbours of the selected node to avoid the hidden terminal situation.
It can be seen that the transmission selection criteria are fair and simple andgives the same chance, to all the nodes, to access the medium. The selection ofthe nodes from the candidates list is performed until it becomes empty. Then,in the third step, nodes from transmitter list perform transmission, i.e. transmitone chunk each. Finally, an update of the list of chunks at all nodes is performedin the fourth step. The above mentioned steps are performed continuously untilthe firmware patch is completely disseminated in the network.
4.2 Performance Evaluation
We conducted simulations for randomly created topologies of 100, 200, 300, 400and 500 nodes. In every case, there was one concentrator that was placed at

A Smart Meter Firmware Update Strategy Through Network Coding 75
Algorithm 1. MSNFFU-NCwhile update patch is not disseminated in the network do
for every node in network docheck the neighbors tableif node has chunk(s) required by neighbors then
candidates_list ← nodeend if
end forBased on the number of neighbours a node can serve, sort the candidates_list in
descending orderwhile candidates_list is not empty do
node_ ← select first node from candidates_listdelete neighbors and neighbors of neighbors of selected node_transmitters_list ← node_delete selected node_ from candidates_list
end whilefor every node in transmitter_list do
generate random coefficient from Galois fieldcreate coded packet of all chunksperform transmissionupdate nodes
end forend while
the extreme of area a. The reason for considering different numbers of nodeswith one concentrator is to generalise our results for rural and urban areas, i.e.in urban areas, nodes are deployed more densely compared to rural areas. Wedivided the firmware update patch into 10 chunks. We considered completiontime as a performance metric, i.e. the amount of time required to distribute thefirmware patch in the system. We conducted simulations with 500 runs, andaverage values are shown in Fig. 3.
In Fig. 3, the completion time of different nodes with |m| = 10 for all strate-gies is plotted. We can see that BFFU has the worst completion time comparedto other schemes and the reason is that it is based on flooding. In BFFU, a nodewill transmit the chunks even when none is interested in receiving the chunks;therefore, a lot of useless chunks are forwarded and this makes the process,of disseminating the actually required chunks, slow. When NC is incorporatedin BFFU, its performance gets better. Now, the completion time of SFFU andSFFU-NC shows similar behaviour and the reason is that in SF only those chunksare transmitted by a node which is of interest to any of its neighbours. WhenNC is incorporated in SF, it results in an increased number of neighbours thatare interested in each transmission. The completion time of MSNFFU is betterthan all above strategies because in this strategy nodes are selected for trans-mission based on the number of neighbours they can serve. Therefore, in eachtransmission the maximum number of nodes gets served; hence, the firmwareupdate patch is disseminated quickly. Now, MSNFFU-NC has the most reduced

76 S. Q. Jalil et al.
100 200 300 400 500Number of nodes
6
8
10
12
14
16
18
20
22
Com
plet
ion
time
in u
nits
BFFUBFFU-NCSFFUSFFU-NCMSNFFUMSNFFU-NC
400
8
9
10
Fig. 3. Completion time vs number of nodes, where |m| = 10, r = 5
completion time compared to other strategies. It is even better than MSNFFUbecause, upon getting access to the medium, a node will generate the combina-tion of all the information that it posseses and transmits. Whereas, in MSNFFUa node can only transmit one chunk at a time.
5 Conclusion
In this paper, we proposed a new forwarding strategy for the firmware updates inAMI networks. We compared our proposed approach with other different coop-eration strategies. Through simulation experiments we demonstrated that ourproposed MSNFFU-NC outperforms all other strategies and can reduce smartmeter firmware update process time.
References
1. Khan, A.A., Rehmani, M.H., Reisslein, M.: Cognitive radio for smart grids: surveyof architectures, spectrum sensing mechanisms, and networking protocols. IEEECommun. Surv. Tutor. 18(1), 860–898 (2016)
2. Wang, W., Xu, Y., Khanna, M.: A survey on the communication architectures insmart grid. Comput. Netw. 55(15), 3604–3629 (2011)
3. Mohassel, R.R., Fung, A., Mohammadi, F., Raahemifar, K.: A survey on advancedmetering infrastructure. Int. J. Electr. Power Energy Syst. 63, 473–484 (2014)
4. Ramírez, D.F., Céspedes, S.: Routing in neighborhood area networks: a survey inthe context of ami communications. J. Netw. Comput. Appl. 55, 68–80 (2015)
5. Zheng, J., Gao, D.W., Lin, L.: Smart meters in smart grid: an overview. In: IEEEGreen Technologies Conference (GreenTech), pp. 57–64 (2013)

A Smart Meter Firmware Update Strategy Through Network Coding 77
6. Khalifa, T., Naik, K., Nayak, A.: A survey of communication protocols for auto-matic meter reading applications. IEEE Commun. Surv. Tutor. 13(2), 168–182(2011)
7. Tonyali, S., Akkaya, K., Saputro, N., Cheng, X.: An attribute network coding-based secure multicast protocol for firmware updates in smart grid AMI networks.In: 26th International Conference on Computer Communication and Networks(ICCCN), p. 19, July 2017
8. Khan, A.A., Rehmani, M.H., Reisslein, M.: Requirements, design challenges, andreview of routing and MAC protocols for cr-based smart grid systems. IEEE Com-mun. Mag. 55(5), 206–215 (2017)
9. Kropp, T.: System threats and vulnerabilities (power system protection). IEEEPower Energy Mag. 4(2), 46–50 (2006)
10. Kim, Y., Oh, D., Ko, J., Kim, Y., Kang, S., Choi, S.-H.: A remote firmware upgrademethod of NAN and HAN devices to support AMI’s energy services. In: Lee, G.,Howard, D., Ślęzak, D. (eds.) ICHIT 2011. CCIS, vol. 206, pp. 303–310. Springer,Heidelberg (2011). https://doi.org/10.1007/978-3-642-24106-2_40
11. Katzir, L., Schwartzman, I.: Secure firmware updates for smart grid devices. In:2nd IEEE PES International Conference and Exhibition on Innovative Smart GridTechnologies, pp. 1–5 (2011)
12. Tonyali, S., Akkaya, K., Saputro, N.: An attribute-based reliable multicast-over-broadcast protocol for firmware updates in smart meter networks. In: IEEE Con-ference on Computer Communications Workshops (INFOCOM WKSHPS), pp.97–102, May 2017
13. Meng, W., Ma, R., Chen, H.H.: Smart grid neighborhood area networks: a survey.IEEE Network 28(1), 24–32 (2014)
14. Ho, T., Koetter, R., Medard, M., Karger, D.R., Effros, M.: The benefits of cod-ing over routing in a randomized setting. In: IEEE International Symposium onInformation Theory (2003)
15. Philips, T.K., Panwar, S.S., Tantawi, A.N.: Connectivity properties of a packetradio network model. IEEE Trans. Inf. Theory 35(5), 1044–1047 (1989)
16. Aalamifar, F., Shirazi, G.N., Noori, M., Lampe, L.: Cost-efficient data aggregationpoint placement for advanced metering infrastructure. In: IEEE International Con-ference on Smart Grid Communications (SmartGridComm), pp. 344–349 (2014)
17. Hamra, A.A., Barakat, C., Turletti, T.: Network coding for wireless mesh networks:a case study. In: International Symposium on a World of Wireless, Mobile andMultimedia Networks (WoWMoM 2006), pp. 9-114 (2006)

Protected Bidding Against CompromisedInformation Injection in IoT-Based
Smart Grid
Md Zakirul Alam Bhuiyan1,2 , Mdaliuz Zaman1, Guojun Wang2(B),Tian Wang3, Md. Arafat Rahman4, and Hai Tao5
1 Department of Computer and Information Science,Fordham University, New York City, NY, USA
2 School of Computer Science and Educational Software,Guangzhou University, Guangzhou, China
[email protected] Department of Computer Science and Technology,
Huaqiao University, Xiamen, China4 Faculty of Computer Systems and Software Engineering,
Universiti Malaysia Pahang, Pekan, Malaysia5 Department of Computer Science, Baoji University of Arts and Sciences,
Baoji, Shaanxi, China
Abstract. The smart grid is regarded as one of the important appli-cation field of the Internet of Things (IoT) composed of embedded sen-sors, which sense and control the behavior of the energy world. IoT isattractive for features of grid catastrophe prevention and decrease ofgrid transmission line and reliable load fluctuation control. AutomatedDemand Response (ADR) in smart grids maintain demand-supply stabil-ity and in regulating customer side electric energy charges. An importantgoal of IoT-based demand-response using IoT is to enable a type of DRapproach called automatic demand bidding (ADR-DB). However, com-promised information board can be injected into during the DR processthat influences the data privacy and security in the ADR-DB biddingprocess, while protecting privacy oriented consumer data is in the bid-ding process is must. In this work, we present a bidding approach that issecure and private for incentive-based ADR system. We use cryptogra-phy method instead of using any trusted third-party for the security andprivacy. We show that proposed ADR bidding are computationally prac-tical through simulations performed in three simulation environments.
Keywords: Internet of Things (IoT) · Smart grid · Demand responseSecurity attack · Privacy · Compromised information injection
1 Introduction
Considering Internet of Things (IoT) technologies in smart grid applications isan important method to expedite the informatization of power grid infrastruc-ture. IoT is composed of embedded sensors and actuators, which senses andc© ICST Institute for Computer Sciences, Social Informatics and Telecommunications Engineering 2019
Published by Springer Nature Switzerland AG 2019. All Rights Reserved
A.-S. K. Pathan et al. (Eds.): SGIoT 2018, LNICST 256, pp. 78–84, 2019.
https://doi.org/10.1007/978-3-030-05928-6_8
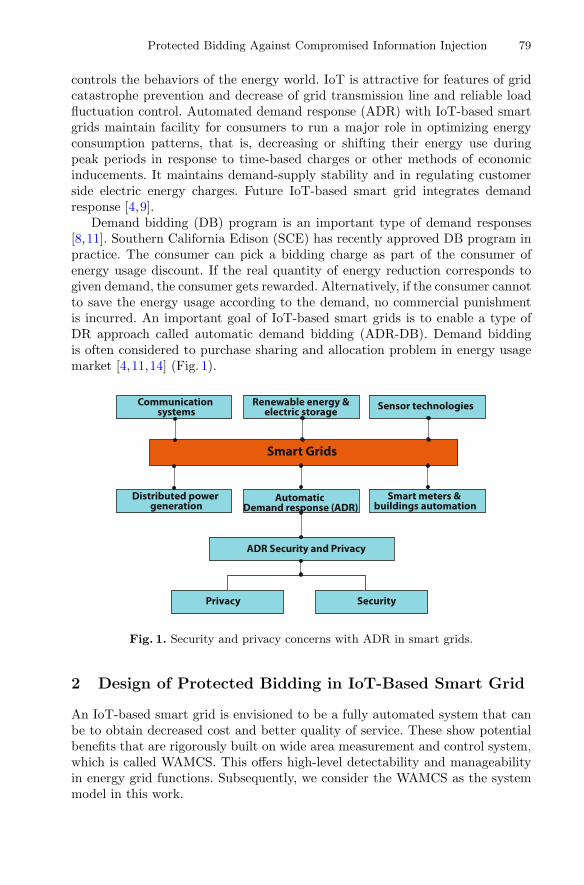
Protected Bidding Against Compromised Information Injection 79
controls the behaviors of the energy world. IoT is attractive for features of gridcatastrophe prevention and decrease of grid transmission line and reliable loadfluctuation control. Automated demand response (ADR) with IoT-based smartgrids maintain facility for consumers to run a major role in optimizing energyconsumption patterns, that is, decreasing or shifting their energy use duringpeak periods in response to time-based charges or other methods of economicinducements. It maintains demand-supply stability and in regulating customerside electric energy charges. Future IoT-based smart grid integrates demandresponse [4,9].
Demand bidding (DB) program is an important type of demand responses[8,11]. Southern California Edison (SCE) has recently approved DB program inpractice. The consumer can pick a bidding charge as part of the consumer ofenergy usage discount. If the real quantity of energy reduction corresponds togiven demand, the consumer gets rewarded. Alternatively, if the consumer cannotto save the energy usage according to the demand, no commercial punishmentis incurred. An important goal of IoT-based smart grids is to enable a type ofDR approach called automatic demand bidding (ADR-DB). Demand biddingis often considered to purchase sharing and allocation problem in energy usagemarket [4,11,14] (Fig. 1).
Privacy
Smart Grids
Security
Sensor technologiesRenewable energy &electric storage
Communication systems
Smart meters & buildings automation
Automatic Demand response (ADR)
Distributed power generation
ADR Security and Privacy
Fig. 1. Security and privacy concerns with ADR in smart grids.
2 Design of Protected Bidding in IoT-Based Smart Grid
An IoT-based smart grid is envisioned to be a fully automated system that canbe to obtain decreased cost and better quality of service. These show potentialbenefits that are rigorously built on wide area measurement and control system,which is called WAMCS. This offers high-level detectability and manageabilityin energy grid functions. Subsequently, we consider the WAMCS as the systemmodel in this work.

80 Md Z. A. Bhuiyan et al.
In smart grid, data is collected by the phasor measurement units (PMU). Thedata collected by PMUs provide the foundation for automatic, effective, and well-organized system management. But there can be cyber enemies or attackers whocan come up with the purpose of interfering or basing the basic system functionsand they can make an effort to introduce false information into the measure-ment data through intentionally deployed suspicious PMUs. Regarding the caseof IoT-based network, collected data can be compromised at the time of datacollection [6,10,12]. Successful false information board attack may compromisethe auspicious functionalities described above. They can also ruin the total smartgrid system functions. There are numerous threat models [2,3,5,7,13] for smartgrid network. We consider that PMUs in the WAMCS, which might be attackedand colluded by the false information board that the attackers can make. Forexample, they can change and recode the programing interface and settings, ormake disconnection in the interface and alter the privacy information board fordata transmission and reception [1]. In the case of IoT-based smart grid net-work, if we consider only one false measurement information board, it might notbe able to cause much influence on smart grid system functions. This reason isthat the system can be enabled to correct minor errors and faults itself in thesubsequent time.
We consider the security and privacy to protection unauthorized informa-tion injection. We explain here how we set the privacy and security features inthe case of ADR-DB system as follows. We also depict the way the system iscontrolled (i.e., in the case of the ease of the consumer information recording,cancellation, and demand provision as the incentives to the bidding winners).(1) Anonymity–a bidder or bid winner can attend the bidding and their infor-mation must not be recognized after bidding process is over by untrustworthyor unauthorized parties. However, the bidder winner’s acceptability and biddinginformation must be certifiable. Also, at the bidding round, it should be main-tained that no entity is noticeable. In this way, the anonymity of the biddercan be maintained: (2) Non-repudiation–participating bidders are able to refusetheir bids after becoming the winning bidders; (3) Non-linkability in a few roundsof bidding: it should be maintained that no individual should be able to haveaccess to the outcome; because this may facilitate a bidder to be recognized inseveral rounds of bidding; (4) privacy–untrustworthy entities can be restrictedwho may find the chance to construct links to the bidding winner and to desig-nated consumers; (5) Forward security: bidding is done with cryptography key,even if the existing bidding key is attacked, the system maintain security so thatinformation board having the previous keys can be disclosed.
Regarding the given system model and threat models above, our objectiveis to design a protected and effective, and privacy-oriented ADR-DB biddingprocess for the IoT-based smart grid.
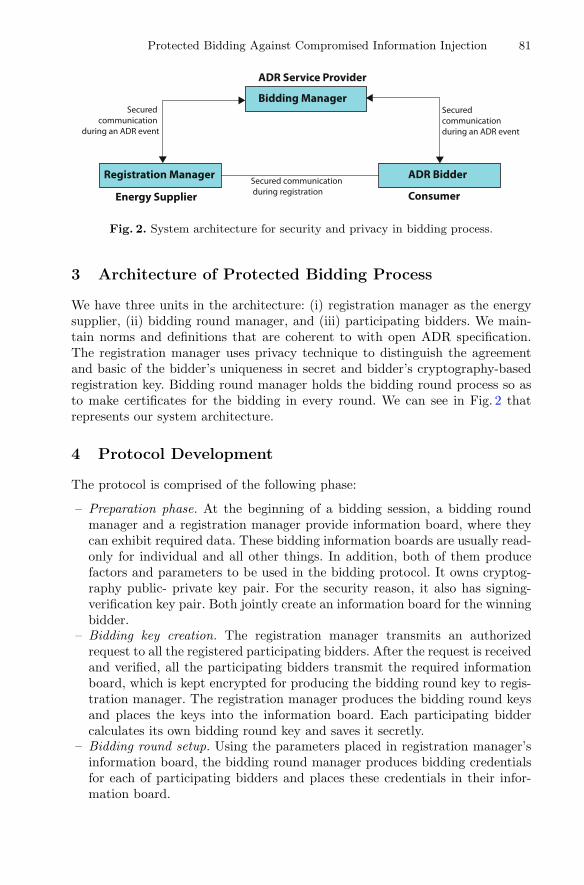
Protected Bidding Against Compromised Information Injection 81
Registration Manager
Energy Supplier
Bidding Manager
ADR Service Provider
ADR Bidder
Consumer
Secured communication
during an ADR event
Secured communication during registration
Secured communication during an ADR event
Fig. 2. System architecture for security and privacy in bidding process.
3 Architecture of Protected Bidding Process
We have three units in the architecture: (i) registration manager as the energysupplier, (ii) bidding round manager, and (iii) participating bidders. We main-tain norms and definitions that are coherent to with open ADR specification.The registration manager uses privacy technique to distinguish the agreementand basic of the bidder’s uniqueness in secret and bidder’s cryptography-basedregistration key. Bidding round manager holds the bidding round process so asto make certificates for the bidding in every round. We can see in Fig. 2 thatrepresents our system architecture.
4 Protocol Development
The protocol is comprised of the following phase:
– Preparation phase. At the beginning of a bidding session, a bidding roundmanager and a registration manager provide information board, where theycan exhibit required data. These bidding information boards are usually read-only for individual and all other things. In addition, both of them producefactors and parameters to be used in the bidding protocol. It owns cryptog-raphy public- private key pair. For the security reason, it also has signing-verification key pair. Both jointly create an information board for the winningbidder.
– Bidding key creation. The registration manager transmits an authorizedrequest to all the registered participating bidders. After the request is receivedand verified, all the participating bidders transmit the required informationboard, which is kept encrypted for producing the bidding round key to regis-tration manager. The registration manager produces the bidding round keysand places the keys into the information board. Each participating biddercalculates its own bidding round key and saves it secretly.
– Bidding round setup. Using the parameters placed in registration manager’sinformation board, the bidding round manager produces bidding credentialsfor each of participating bidders and places these credentials in their infor-mation board.
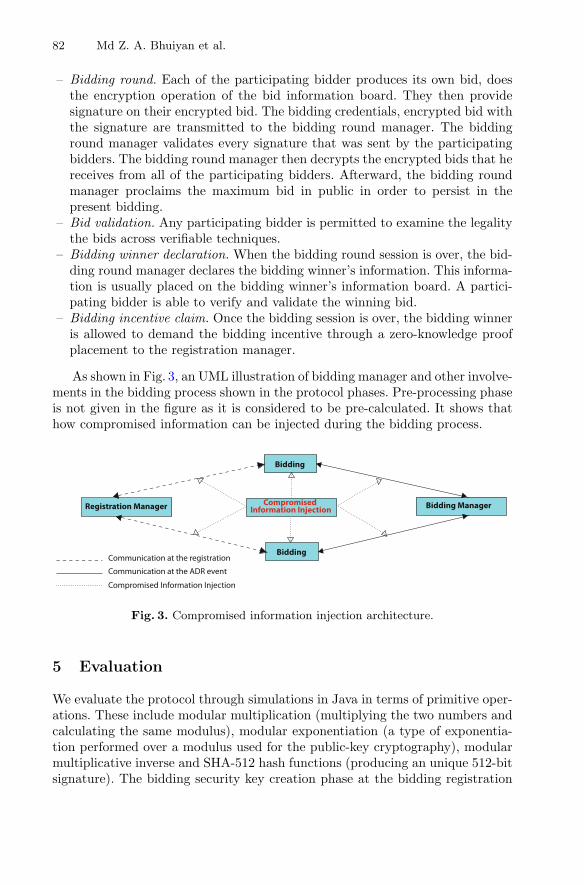
82 Md Z. A. Bhuiyan et al.
– Bidding round. Each of the participating bidder produces its own bid, doesthe encryption operation of the bid information board. They then providesignature on their encrypted bid. The bidding credentials, encrypted bid withthe signature are transmitted to the bidding round manager. The biddinground manager validates every signature that was sent by the participatingbidders. The bidding round manager then decrypts the encrypted bids that hereceives from all of the participating bidders. Afterward, the bidding roundmanager proclaims the maximum bid in public in order to persist in thepresent bidding.
– Bid validation. Any participating bidder is permitted to examine the legalitythe bids across verifiable techniques.
– Bidding winner declaration. When the bidding round session is over, the bid-ding round manager declares the bidding winner’s information. This informa-tion is usually placed on the bidding winner’s information board. A partici-pating bidder is able to verify and validate the winning bid.
– Bidding incentive claim. Once the bidding session is over, the bidding winneris allowed to demand the bidding incentive through a zero-knowledge proofplacement to the registration manager.
As shown in Fig. 3, an UML illustration of bidding manager and other involve-ments in the bidding process shown in the protocol phases. Pre-processing phaseis not given in the figure as it is considered to be pre-calculated. It shows thathow compromised information can be injected during the bidding process.
Registration Manager Bidding ManagerCompromised Information Injection
Bidding
Bidding Communication at the registration
Communication at the ADR event
Compromised Information Injection
Fig. 3. Compromised information injection architecture.
5 Evaluation
We evaluate the protocol through simulations in Java in terms of primitive oper-ations. These include modular multiplication (multiplying the two numbers andcalculating the same modulus), modular exponentiation (a type of exponentia-tion performed over a modulus used for the public-key cryptography), modularmultiplicative inverse and SHA-512 hash functions (producing an unique 512-bitsignature). The bidding security key creation phase at the bidding registration

Protected Bidding Against Compromised Information Injection 83
manager is programmed regarding the primitives such as 5 modular exponenti-ations, 3 modular multiplications and two hashes (referring to the unique hashkey when their hash code is equal). We carry out the simulation of each phase50 times and gather the data. We then calculated the amount of time take inaverage. Figure 4 demonstrate the process of bidding cryptographic key creation.This usually consumes the highest amount of time between all the phases of thebidding registration manager, bidding round setup and bidding round session.
0
100
200
300
400
500
600
700
800
900
1000
Tim
e (m
s)
Fig. 4. Computation time needed for different phases.
6 Conclusion
Dealing with accurate information in the IoT-based smart grid infrastructureis significant regarding attacks situations and their severe consequences in thegrid, hence, ensuring security and privacy is of great importance. Therefore, onekey aim is to provide privacy and security in the ADR in order to prevent com-promised information injection. Towards this, customers and demand responsecontrol should identify any unauthorized entities in the bidding process andreliability of the demand responses. In this paper, we have proposed a privateand secure bidding protocol for incentive-based demand response system of IoT-based smart grids. The limitation of this paper is the performance evaluation ofthe security aspects of IoT based smart grid. Future work includes the detailedimplementation of ADR bidding process in terms of security and privacy aspects.
84 Md Z. A. Bhuiyan et al.
References
1. Bhuiyan, M.Z.A., Wang, T., Hayajneh, T., Weiss, G.M.: Maintaining the balancebetween privacy and data integrity in Internet of Things. In: Proceedings of ACMICMSS 2017, pp. 177–182 (2017)
2. Bhuiyan, M.Z.A., Wu, J.: Collusion attack detection in networked systems. In:Proceedings of IEEE DASC, pp. 1–8 (2016)
3. Liu, H., Xu, M., Wu, Y., Zheng, N., Chen, Y., Bhuiyan, M.Z.A.: Resilient bipartiteconsensus for multi-agent networks with antagonistic interaction. In: Proceedingsof IEEE TrustCom 2018, pp. 1–8 (2018)
4. Liu, Y., Guan, X.: Purchase allocation and demand bidding in electric power mar-kets. IEEE Trans. Power Syst. 18(2), 106–112 (2003)
5. Lu, L., Zhu, X., Zhang, X., Liu, J., Bhuiyan, M.Z.A., Cui, G.: Intrusion detectionmethod based on uniformed conditional dynamic mutual information. In: Proceed-ings of IEEE TrustCom 2018, pp. 1–7 (2018)
6. Luo, E., Bhuiyan, M.Z.A., Wang, G., Rahman, M.A., Wu, J., Atiquzzaman, M.:Privacyprotector: privacy-protected patient data collection in IoT-based healthcaresystems. IEEE Commun. Mag. (COMMAG) 56(2), 163–168 (2018)
7. Rahman, F., Bhuiyan, M.Z.A., Ahamed, S.I.: A privacy preserving framework forRFID based healthcare systems. Futur. Gener. Comput. Syst. (FGCS) 72, 339–352(2017)
8. Rahman, M.S., Basua, A., Kiyomotoa, S., Bhuiyan, M.Z.A.: Privacy-friendly securebidding for smart grid demand-response. Inf. Sci. 379(10), 229–240 (2017)
9. Saleem, Y., Crespi, N., Rehmani, M.H., Copeland, R.: Internet of Things-aided smart grid: technologies, architectures, applications, prototypes, and futureresearch directions. Technical report (2017). https://arxiv.org/ftp/arxiv/papers/1704/1704.08977.pdf
10. Tao, H., Bhuiyan, M.Z.A., Abdalla, A., Hassan, M., Jain, J., Hayajneh, T.: Secureddata collection with hardware-based ciphers for IoT-based healthcare. IEEE Inter-net Things J. (IEEE IoT-J), 1–10 (2018). https://doi.org/10.1109/JIOT.2018.2854714
11. Tarasak, P., Chai, C.C., Kwok, Y.S., Wah, S.: Demand bidding program and itsapplication in hotel energy management. IEEE Trans. Smart Grid 5(2), 821–829(2014)
12. Wang, T., Bhuiyan, M.Z.A., Wang, G., Rahman, M.A., Wu, J., Cao, J.: Big datareduction for smart city’s critical infrastructural health monitoring. IEEE Com-mun. Mag. (COMMAG) 56(3), 128–133 (2018)
13. Wang, T., et al.: Fog-based storage technology to fight with cyber threat. Futur.Gener. Comput. Syst. (FGCS) 83, 208–218 (2018)
14. Weng, Y., Negi, R., Faloutsos, C., Ilic, M.D.: Robust data-driven state estimationfor smart grid. IEEE Trans. Power Syst. 8(4), 1956–1967 (2017)

A Chain Based Signature Scheme for Uplinkand Downlink Communications in AMI
Networks
Samer Khasawneh(&) and Michel Kadoch
Department of Electrical Engineering, École de Technologie Supérieure,University of Quebec, 1100 Rue Notre-Dame O, Montreal, Canada
Abstract. Smart grid is an electric infrastructure that makes extensive use ofcommunication and information technology making it a surface for numerouscyber-security threats. In this research, we propose an authentication scheme fordownlink and uplink communications in the advanced metering infrastructurenetwork. The proposal is based on chain based signature with some modifica-tions to tackle its computation and storage overhead. Besides, the proposalintegrates symmetric encryption with the signature scheme to ensure data pri-vacy and confidentiality. Our analysis proves that the proposed scheme isresilient against numerous known attacks and is efficient in terms of computa-tion cost and ciphertext size.
Keywords: Smart grid � AMI network � Security � Chain based signature
1 Introduction
In the past few years, strong pressure is generated to switch from the power generationthat mostly based on fossil sources towards a modernistic smart system that highlyincorporates renewable forms of energy [1]. The pressure was derived by the stronggrowth in electricity demand in addition to the emerging large quantities of distributedrenewable energy sources.
The main attribute that characterizes the new power grid is integrating moderncommunication and information technology into the grid, making it smarter. The recentadvances in communication and information technology can optimize the power gridperformance by enabling us to generate, monitor, collect, analyze and react to datadescribing the grid’s physical condition. However, it is no surprise that integratingcommunication and information technologies will result in a complex system-of-systems which requires a sophisticated architecture that is inherently Quality-of-Service(QoS) aware. The most widely accepted smart grid architecture viewpoint is the onethat comprises seven domains: market, operations, service provides, bulk generation,transmission, distribution and customer [2], where the later four domains are the classicpower system components.
© ICST Institute for Computer Sciences, Social Informatics and Telecommunications Engineering 2019Published by Springer Nature Switzerland AG 2019. All Rights ReservedA.-S. K. Pathan et al. (Eds.): SGIoT 2018, LNICST 256, pp. 85–99, 2019.https://doi.org/10.1007/978-3-030-05928-6_9
Advanced Metering Infrastructure (AMI) is the architecture that comprises smartmeters at the customer’s premises, data concentrators (gateways) and a supervisory nodethat acts as the AMI headend. Smart meters have multiple communication interfaces andare connected to various devices through a Home Area Network (HAN). It can collectinformation from the connected smart appliances to facilitate real-time billing. Smartmeters can also issue commands to enforce peak demand management. Data concen-trators preprocess the data received from the smart meters before having the datatransmitted to AMI headend. Concentrators are stationed in physically secure locationssuch as substations. The supervisory headend node is located at the utility, within thecompany network. Basically, it acts on the smart meter’s data and can issue severalcontrol commands such as pricing information updates, remote load control and demandresponse project’s announcements. AMI systems enable near real-time pricing infor-mation and load exchange between the smart meters and utility business systems [3].
From the aforementioned description, it could be noted that AMI network realizescomputerized two way communication between the metering network devices (inopposite to the conventional power grid that implements one way communication).Two-way communication is a smart grid feature that promotes implementing newfunctionalities such as Demand-Response, load shedding, peak shaving and self-healing[4]. In this case, QoS, reliability and real-time communication are critical performancefactors.
1.1 Smart Grid Security
Smart grid is expected to optimize energy management, integrate renewable energysources and introduce efficient billing schemes. Attaining such functionalities requiresextensive use of information and communication technologies on a large-scale land-scape. Accordingly, smart grid will be subject to significant cyber-security threats thatwill have negative impact on the grid services. Examples of such possible attacks are:Denial of Service (DoS), spoofing, replay, impersonation, data injection and privacyexposure (invasion) attacks. The degree of the damage caused by a cyber-attackdepends mainly on the attacker skills and resources.
Achieving secure smart grid communication is crucial yet a challenging task for anumber of reasons. First of all, the vast majority of the smart grid devices (especiallythe AMI devices) are equipped with limited storage, processing and communicationcapabilities. For this reason, some data encryption and authentication schemes couldnot be adapted for the smart grid. In addition, the lifetime of the power hardware isexpected to be much longer than the information technology solutions. Therefore, aperfectly secure communication scheme is not expected to function during the wholelifetime of the power hardware. Another issue is the smart grid openness. The smartgrid spans very large geographical areas and utilizes power devices from differentmanufactures which requires extremely high degree of interoperability between the gridsystems and components. Finally, applying security measures may have counterpro-ductive impact on the smart grid goals. For instant, a time critical packet may miss itsdeadline with the advanced authentication and integrity checks in place.
86 S. Khasawneh and M. Kadoch

1.2 Our Contribution
The following are our contributions in this paper:
• We classified the AMI traffic into downlink and uplink traffic and associated thegood transmission mode(s) for each one of them. This enables the network devicesto efficiently generate and share the cryptographic keys without the need to maintainunnecessary keys.
• We have modified the basic chain based signature model to improve its computationand storage overhead. The modified signature scheme is used to propose anauthentication model for downlink and uplink communications in AMI networks.A symmetric encryption is integrated with the signature scheme to ensure dataconfidentiality.
• Security analysis and performance evaluation are carried out to assess the feasibilityof the proposed scheme. The results demonstrate that the proposed scheme isefficient in terms of computation cost and ciphertext size. In addition, it is capable towithstand various security attacks.
The rest of the paper is organized as follow. Section 2 reviews the related work.Section 3 demonstrates the models, design goals and background. The proposedencryption and signature scheme is illustrated in Sect. 4. The performance of theproposed scheme is presented in Sect. 4. Security analysis is presented in Sect. 5.Finally, the paper is concluded in Sect. 6.
2 Related Work
Nowadays, smart grid security is considered one of the most active research areas thatattracted the researcher’s attention. Despite the fact that the problem of security in thesmart grid has not been fully identified, several researches have been proposed in theliterature to address it. A zero-configuration identity-based signcryption for end-to-endcommunication in the advanced Metering Infrastructure (AMI) networks is proposed in[5]. The proposal has two phases of operation: registration phase and data transmissionphase. In the registration phase, a device communicates with a Key Generation Server(KGS) to obtain a private key. The private key is used either to decrypt a receivedmessage or to sign a message before transmitting it. In the transmission phase, thesender calculates the receiver’s public key using information derived from the recei-ver’s identity and encrypts the message using the public key calculated. As the publickeys are generated from information that is derived from the sender identity, thescheme achieves low computation overhead.
Anonymous Key Distribution (AKD) scheme for smart grid networks is proposedin [6]. The scheme is based on identity based elliptic curve cryptography to providesmart meter anonymity and mutual authentication. The scheme has several advantagessuch as: avoiding the need for third trusted party and achieving low computation andcommunication overhead compared to other schemes [7]. The proposal is resilientagainst data and impersonation based attacks.
A Chain Based Signature Scheme for Uplink and Downlink Communications 87

Saxena et al. proposed a signature scheme for delivering authentic critical and non-critical commands in smart grid networks [8]. The proposed scheme is based on a set ofcryptographic hashing functions to generate the message hash code. The code issplitted into several substrings with a predetermined length. The hashing functions arealso used to generate the asymmetric keys (public/private) that will be used for signingthe messages. Despite the fact that the scheme is secure against some authenticationsattacks, it has one major limitation. The authors assume that the signature is onlyconstructed at the supervisory node; thereby alternative nodes such as smart metersdon’t sign their messages. Consequently, customer privacy could not be efficientlypreserved.
An identity based signcryption technique for smart grid residential tree network ispresented in [9]. The model employs bilinear pairing signcryption and destinationconcealing to achieve data integrity, authenticity and to preserve customer privacy. Theproposed technique is designed to secure downlink communication between the controlcenter and smart meters. The control center simultaneously encrypts and signs themessages before forwarding them to the smart meters. The authors show that theproposed technique is efficient in terms of computation cost and ciphertext length whencompared to other schemes such as [10, 11]. However, the functionality of the pro-posed scheme is considered limited as the security measures are applied to messagesgenerated by the control center. The uplink traffic generated by smart meters is notsecured although it usually carries privacy-sensitive information. Further, the modelsupports unicast transmission mode only.
Mahmood et al. proposed a mutual authentication protocol for smart grid devices in[12]. The protocol utilizes elliptic curve cryptography and hashing functions to achievedata authenticity. The authentication protocol depends on the Elliptic Curve DiscreteLogarithmic Problem (ECDLP) to attain prefect forward secrecy. Further, the scheme isconstructed to withstand different attacks such as replay, impersonation and Man-in-the-middle attacks. The authors declare that the proposed authentication procedure islightweighted in terms of computation complexity in addition to communication andmemory overhead. The performance of the proposed scheme in one-to-many com-munication paradigms is suspected.
3 Models, Design Goals and Background
3.1 Network and Communication Model
In our scheme, we assume the AMI network that comprises three devices namely:smart meters (SMs), gateways (GWs) and Supervisory Control Center (SCC) as shownin Fig. 1. SMs are responsible for reporting energy consumption in addition toreceiving billing information, thereby are equipped with limited computation andcommunication power. SCC has unlimited computation and communication powerenabling it to manage the grid operation through performing critical tasks such as loadshedding and demand response handling. Gateways have important rule in routinginformation in bidirectional paths from/to the SCC. The three devices can simultane-ously and asynchronously perform signcryption operations at any time.
88 S. Khasawneh and M. Kadoch

We have examined the communication paradigms that may exist between the threeAMI devices and we have found that a communication in AMI network can fall in oneof two categories:
a) Uplink communication
This communication is carried out when a lower layer device DLL sends message toa higher layer device DHL. For example, a smart meter transmitting to the corre-sponding gateway or a gateway that routes message to SSC. The transmission mode forsuch communication is unicast only.
– Unicast (GWi ! SSC; SMi ! GWiÞFigure 1(a) shows an example of this case when a smart meter is reporting the
customer’s energy consumption to the corresponding gateway.
b) Downlink communication
In this case, a higher layer device DHL sends message to a lower layer device DLL. Itcould be the SCC transmitting to the corresponding gateway(s) or a gateway is routingmessages to the corresponding smart meters(s). The transmission mode for suchcommunication is unicast, multicast or broadcast.
– Unicast (SSC ! GWi;GWi ! SMiÞRemote load control is an example of this communication scheme. The supervisorynode continuously monitors customer’s consumption and can issue special com-mand to enforce peak management.
– Multicast (SSC ! GWi;GWi ! SMiÞi 2 0; 1; . . .lf gl\LAn example of downlink multicast AMI communication is shown in Fig. 1(b). Priceupdating and remote load control commands are triggered by the supervisory nodeand disseminated to certain Demand-Response projects in multicast transmissionmode.
– Broadcast (SSC ! GWi;GWi ! SMiÞi 2 0; 1; . . .Lf g
SMSM SMSM SM SM SM SM SM
GW
SCC
GW GW
…. …. …. SM SM SMSM SM SM SM SM SM
GW
SCC
GW
…. ….
GW
….
(a) (b)
Fig. 1. The AMI communication models assumed in this paper. (a) Unicast uplink commu-nication. (b) Multicast downlink communication
A Chain Based Signature Scheme for Uplink and Downlink Communications 89

This case is similar to the previous one, except having the AMI headend (super-visory node) or gateway transmits the command to all AMI devices. Publishing ofDR projects is an example of this communication style.
3.2 Adversarial Model
In our threat model, we assume an external polynomial time adversary with asufficient knowledge and computation power. The adversary can access the publiccommunication channel and capture network messages. Accordingly, he can eaves-drop, analyze, inject, replay, modify and delete data from the communication channel.Additionally can compromise any smart meter (SMi) or gateway (GWi) and launchidentity theft attacks later on. We assume the supervisory node (SCC) is securely suitedwithin the utility premises and could not be compromised by the attacker.
3.3 Design Goals
Given the aforementioned adversarial model, our goal is to design an efficientencryption and authentication scheme for downlink and uplink communications inAMI networks. The model will be designed to take into consideration the requirementsof each transmission mode for every communication direction. Practically, we aim toachieve the following three goals:
• Authentication and Integrity. The proposed scheme must guarantee that AMImessages injected or modified by the adversary do not go undetected.
• Confidentiality and privacy preservation. Network messages (especially meteringdata) could be disclosed to authorize AMI participants only. The proposal shouldensure that customer privacy never been infringed.
• Efficiency. The proposed encryption and authentication scheme should be light-weighted. It should be competent in terms of computation and communication costcompared to existing schemes.
3.4 Background
Chain based signaturet-time signature schemes could be constructed by combining a tuple of t indepen-
dently generated private keys to form the private key, where the public key is con-structed similarly. Each private/public key is used for a single signature generation/verification. Consequently, t signatures are generated using the tuple of private keys.The upper bound t should be determined in advance during the keys generation pro-cess. Such signature scheme has two main limitations. First, the number of signaturesthat could be constructed before re-invoking the key generation function is bounded.Second, the size of the cryptographic keys is large as each key consists of t individuallygenerated keys. Chain-based signature scheme can achieve better performance in termsof key generation by allowing the signer to generate the cryptographic keys on the flyas needed.
90 S. Khasawneh and M. Kadoch
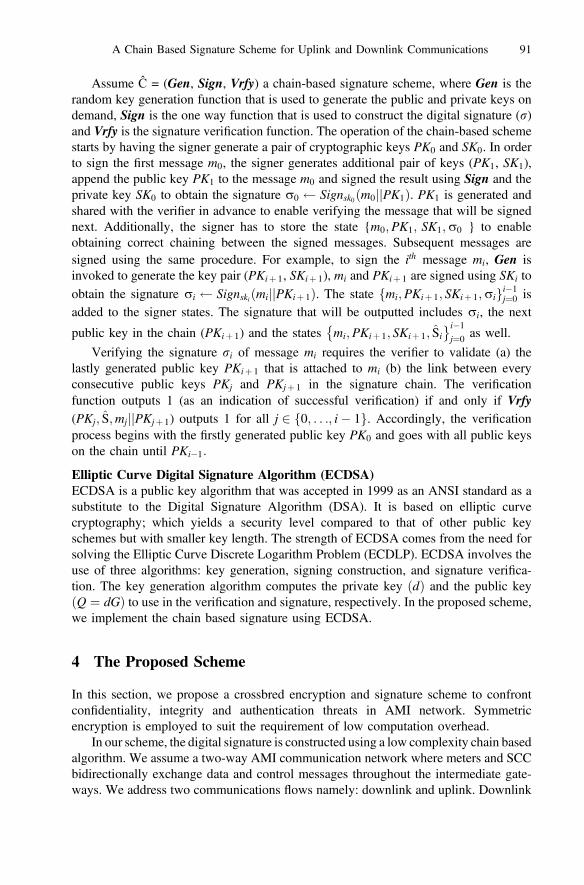
Assume Ĉ = (Gen, Sign, Vrfy) a chain-based signature scheme, where Gen is therandom key generation function that is used to generate the public and private keys ondemand, Sign is the one way function that is used to construct the digital signature (r)and Vrfy is the signature verification function. The operation of the chain-based schemestarts by having the signer generate a pair of cryptographic keys PK0 and SK0. In orderto sign the first message m0, the signer generates additional pair of keys (PK1, SK1),append the public key PK1 to the message m0 and signed the result using Sign and theprivate key SK0 to obtain the signature r0 Signsk0 m0jjPK1ð Þ. PK1 is generated andshared with the verifier in advance to enable verifying the message that will be signednext. Additionally, the signer has to store the state {m0;PK1; SK1;r0 } to enableobtaining correct chaining between the signed messages. Subsequent messages aresigned using the same procedure. For example, to sign the ith message mi, Gen isinvoked to generate the key pair (PKiþ 1, SKiþ 1), mi and PKiþ 1 are signed using SKi toobtain the signature ri Signski mijjPKiþ 1ð Þ. The state mi;PKiþ 1; SKiþ 1;rif gi�1j¼0 isadded to the signer states. The signature that will be outputted includes ri, the next
public key in the chain (PKiþ 1) and the states mi;PKiþ 1; SKiþ 1; Si� �i�1
j¼0 as well.
Verifying the signature ri of message mi requires the verifier to validate (a) thelastly generated public key PKiþ 1 that is attached to mi (b) the link between everyconsecutive public keys PKj and PKjþ 1 in the signature chain. The verificationfunction outputs 1 (as an indication of successful verification) if and only if Vrfy(PKj; S;mjjjPKjþ 1) outputs 1 for all j 2 0; . . .; i� 1f g. Accordingly, the verificationprocess begins with the firstly generated public key PK0 and goes with all public keyson the chain until PKi�1:
Elliptic Curve Digital Signature Algorithm (ECDSA)ECDSA is a public key algorithm that was accepted in 1999 as an ANSI standard as asubstitute to the Digital Signature Algorithm (DSA). It is based on elliptic curvecryptography; which yields a security level compared to that of other public keyschemes but with smaller key length. The strength of ECDSA comes from the need forsolving the Elliptic Curve Discrete Logarithm Problem (ECDLP). ECDSA involves theuse of three algorithms: key generation, signing construction, and signature verifica-tion. The key generation algorithm computes the private key dð Þ and the public keyQ ¼ dGð Þ to use in the verification and signature, respectively. In the proposed scheme,we implement the chain based signature using ECDSA.
4 The Proposed Scheme
In this section, we propose a crossbred encryption and signature scheme to confrontconfidentiality, integrity and authentication threats in AMI network. Symmetricencryption is employed to suit the requirement of low computation overhead.
In our scheme, the digital signature is constructed using a low complexity chain basedalgorithm. We assume a two-way AMI communication network where meters and SCCbidirectionally exchange data and control messages throughout the intermediate gate-ways. We address two communications flows namely: downlink and uplink. Downlink
A Chain Based Signature Scheme for Uplink and Downlink Communications 91

traffic is disseminated by SCC towards the smart meters and could have unicast, multicastor broadcast modes, whereas uplink traffic originated from the meters is unicast. Theproposed scheme runs in two phases that are described in the following subsections.
4.1 Initialization Phase
The phase is demanded when a new smart meter or gateway joins the AMI network.The device initiates the initialization procedure with the corresponding gateway orSCC, respectively. In our scheme, the device that initiates the procedure is the LowerLayer Device DLL, while the device that receives the initialization request is the HigherLayer Device DHL: Consequently, DLL is a smart meter or gateway and DHL is agateway or the SCC. This phase is required to enable DLL and DHL to securely set upthe cryptographic parameters (keys and hash functions) over the inherently insecureAMI channels. DHL assembles the elliptic curve parameters and shares them with DLL
to enabling generating the shared secret key Ksh based on Elliptic Curve Diffie Hellman(ECDH) protocol.
Table 1. Notation guide
Notation Description Notation Description
a; b; q;G; n; h Elliptic curve parameters SignKSi Signature generationfunction
An adversary VrfyPKiSignature verificationfunction
DLL Lower layer device Mt AMI messageDHL Higher layer device Mt Encrypted AMI
messageInitial nonce IDLL ID of Lower Layer
deviceNonce of session t r Digital signature
h1 :ð Þ; h2 :ð Þ Hashing functions l Multicast domain sizeksh DH shared symmetric key L Broadcast domain sizekU ; kM ; kB Symmetric encryption keys for
unicast, multicast, broadcastpointj j Size of elliptic curve
point including x and ycoordinates
KPUD;KPMD;KPBD Public downlink unicast,multicast, broadcast keys forsignature verification
PGen bð Þ1 Asymmetric keygeneration function
KSUD;KSMD;KSBD Private downlink unicast,multicast, broadcast keys forsignature generation
SGen bð Þ1 Symmetric keygeneration function
PKUU Public uplink unicast signatureverification key
SYMM:ENCk Symmetric encryptionalgorithm
SKUU Private uplink unicast,multicast, broadcast keys forsignature verification
SYMM:DECk Symmetric decryptionalgorithm
92 S. Khasawneh and M. Kadoch
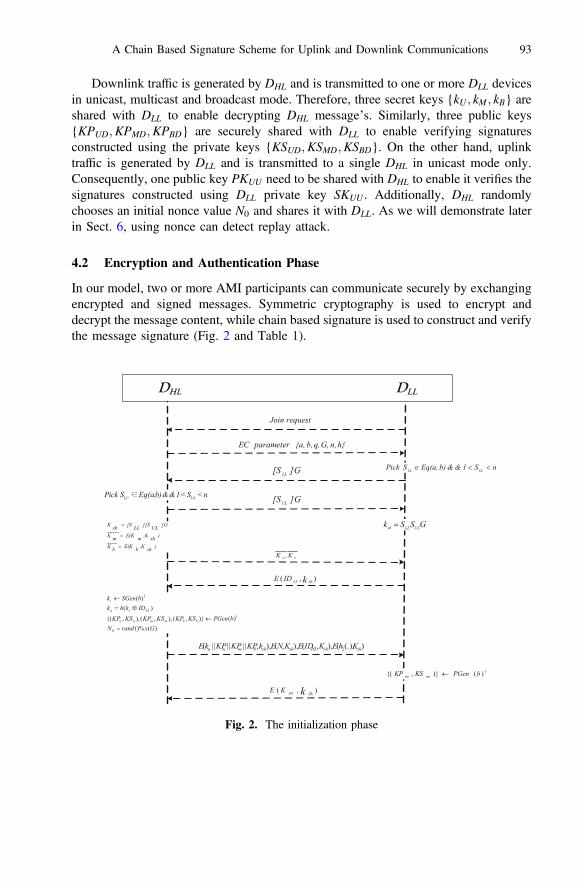
Downlink traffic is generated by DHL and is transmitted to one or more DLL devicesin unicast, multicast and broadcast mode. Therefore, three secret keys {kU ; kM ; kB} areshared with DLL to enable decrypting DHL message’s. Similarly, three public keys{KPUD;KPMD;KPBD} are securely shared with DLL to enable verifying signaturesconstructed using the private keys {KSUD;KSMD;KSBD}. On the other hand, uplinktraffic is generated by DLL and is transmitted to a single DHL in unicast mode only.Consequently, one public key PKUU need to be shared with DHL to enable it verifies thesignatures constructed using DLL private key SKUU . Additionally, DHL randomlychooses an initial nonce value N0 and shares it with DLL. As we will demonstrate laterin Sect. 6, using nonce can detect replay attack.
4.2 Encryption and Authentication Phase
In our model, two or more AMI participants can communicate securely by exchangingencrypted and signed messages. Symmetric cryptography is used to encrypt anddecrypt the message content, while chain based signature is used to construct and verifythe message signature (Fig. 2 and Table 1).
Fig. 2. The initialization phase
A Chain Based Signature Scheme for Uplink and Downlink Communications 93
Now, suppose the multicast domain {DHL1 ! DLLi ;DLLj . . .DLLn } to enable gate-way GW1 delivering a remote load control message securely to the set of connect smartmeters {SMi; SMj; . . .. . .SMng. The communication shall proceed as follows:
Step 1: Message construction Encryption (DHL1 : Mt� �
)In the proposed model, the message to be encrypted has three components: the datacontent D, the nonce value and a public key PK (multicast public keyPKMDtþ 1 in this case). The nonce value is used to keep the parties in sync to ensurewithstanding replay attack. Therefore, the transmitted nonce value is, where
is the nonce used in the previous session. In order toimplement the chain based signature scheme, the public key that will be used by thereceiver to verify the next signature must be sent a priori. Therefore, Asymmetric keygeneration function PGEN is used to generate a pair of keys (PKtþ 1; SKtþ 1). Thepublic key PKMDtþ 1 is attached to tth message. The encrypted message Mt is
.Step 2: Signature construction (DHL1 : rtf g)
As discussed in Sect. 3.4, the chain based signature outputs the statemi;PKiþ 1; SKiþ 1;rif gi�1j¼0 with the signature ri to enable the receiver verifying the
signature. Maintaining and processing such state leads to considerable processing andstorage overhead. In the proposed model, we included the public key that will be usedto verify the signature with each message and in the initialization phase as well. This,in addition to the fact the each AMI device is always communicating with the samedevice(s) eliminate the need for outputting such state with each signature. Accord-ingly, the signature rt is constructed using SKMDt ; h2 :ð Þ and the one way signaturegeneration function Sign as rt ¼ signSKMDt
h2 Mt� �� �
.Step 3: Multicast Transmission ðDHL1 ! DLLi ;DLLj . . .DLLn : Mt; rtf g)
DHL1 transmits the encrypted message Mt along with the signature rt for each DLL 2{DLLi ;DLLj . . .DLLngStep 4: Signature verification (DLLi ;DLLj . . .DLLn : VrfyPk :ð Þ)
Every DLL in the multicast domain {DLLi ;DLLj . . .DLLng that receives the signature willuse the multicast public key PKMDt , the hashing function h2 :ð Þ and the one waysignature verification function Vrfy to verify the signature. The signature is accepted ifand only if VrfyPKMDt
h2 Mt� �
; rt� � ¼ 1, otherwise the signature is rejected and
impersonation attack is reported.Step 5: Message decryption
If the signature rt is accepted, the multicast domain members {DLLi ;DLLj . . .DLLngindividually decrypts Mt using the multicast downlink key kMD to obtainMt ¼ SYMM:DECkMD Mt
� �. Then, the received nonce value is checked to detect if the
message is replayed. Replay attack is detected if and in this case the message isignored and replay attack is reported. Otherwise, the data content D is processed andthe received public key PKMDtþ 1 is stored to enable verifying the message that will bereceived next. is updated with as well.
94 S. Khasawneh and M. Kadoch

Performance EvaluationThe efficiency of the proposed encryption and signature scheme can be evaluated interms of the computation cost and ciphertext length. In this section, we present theperformance of the proposed scheme and compare it with the signcryption modelpresented in [9].
4.3 Computation Cost
According to our scheme, the computation cost is the time overhead required toencrypt-sign the plaintext or verify-decrypt the ciphertext message. We implementedthe chain based signature scheme using ECDSA where the elliptic curve point multi-plication represents the most computation intensive operation. Symmetric cryptogra-phy, on the other hand, is very fast compared to public key cryptography. Therefore,the computation cost of our scheme is determined mainly by the time required toconstruct (sign) or verify a signature using the proposed chain based scheme, wherepoint multiplication dominates ECDSA time.
Table 2 demonstrates a comparison between the computation cost required by ourscheme and the signcryption scheme presented in [9]. The time required to generate theciphertext in our mode is Tsymmþ Tmul compared to 4� Tmulþ Tpair for the signcryptionscheme. Moreover, the time needed to recover the plaintext in our scheme is2� Tmulþ Tsymm compared to Tmulþ 4� Tpair for the signcryption scheme.
In order to show the numerical computation cost, we have done a computer sim-ulation for two AMI networks, one implements our scheme and the another implementsthe signcryption scheme proposed in [9]. The simulation was executed on an IntelPentium IV 3.1-GHz machine with 8 GB RAM. We have chosen AES-128 as thesymmetric cryptography algorithm and SPEC112r1 standard [13] for elliptic curveencryption. The computation overhead of the two schemes is shown in Fig. 3. The totalnumber of concurrent signatures creation or verification is determined by the number ofsmart meters in the AMI network. It is obvious that our scheme achieves lowercomputation cost compared to the signcryption scheme.
Table 2. Computation cost: the proposed model vs. the signcryption scheme [9]
Scheme Symmetriccryptography
EC pointmultiplication (TmulÞ
Pairing computation(TpairÞ
Ourmodel
Model in[9]
Ourmodel
Model in[9]
Ourmodel
Model in[9]
Cipher-textgeneration
Tsymm – 1 4 – 1
Plaint-textrecovering
Tsymm – 2 1 – 4
A Chain Based Signature Scheme for Uplink and Downlink Communications 95

4.4 Ciphertext Size
Ciphertext (C) size is the size of: the encrypted data, signature and any additionalcryptographic parameters attached to enable recovering the plaintext. In the proposedscheme, the ciphertext C ¼ M; r
� �, whereM is the encrypted data and r is the ECDSA
signature.AES encryption does not enlarge data size; therefore M and M both have the same
size. The signature r has two components (as per ECDSA details); hence the signaturesize is twice the length of the elliptic curve. Therefore, the ciphertext size isMj j þ pointj j. On the other hand, the ciphertext produced by the signcryption schemepresented in [9] is C ¼ C;Cenc;Csign
� �. C and Csign are each twice the size of the
Fig. 3. Computation cost of the proposed scheme and the model in [9]
Fig. 4. Ciphertext size for different elliptic curves
96 S. Khasawneh and M. Kadoch
elliptic curve as they are points on the curve. The scheme does not expand encrypteddata too, therefore the size of the plaintext and Cenc are the same. The total length of theciphertext under signcryption scheme will be Mj j þ 2 pointj j. Assuming a plaintext sizeof 16 KB, Fig. 4 illustrates the length of the resulting ciphertext under the proposedscheme and the one in [9] when using different elliptic curve standards.
5 Security Analysis
The proposed scheme provides encryption and authentication for downlink and uplinkcommunication in AMI network. This section demonstrates the security analysis of theproposed scheme under the adversarial model presented in Sect. 3.2 by examining itsresiliency against known attacks.
5.1 Passive Attacks
In order to guarantee data confidentiality, customer and supervisory node packets arenever sent in clear, symmetric encryption algorithm SYMM:ENC (such as AES) is usedto cipher those packets. Supervisory node (SCC) commands are encrypted usingkUD; kMD or kBD depending on the transmission mode, while customer metering data isencrypted using kuu. Adversary who intercepts AMI communication channels will notbe able to collect any useful information concerning customer behavior or usage pattern.He will not be able to identify the remote load commands issued by SCC, as well.
5.2 Impersonation Attack
Adversary can impersonate any DLL or DUL if he manage to forge their signatures.Under the proposed chain based signature scheme, the public keys{PKUD;PKMD;PKBD;PKUU} are used once and they are sent encrypted a priori.Thereby, it will be impossible for the adversary to gather and cryptanalyze combi-nations of legitimate public keys/signatures for the purpose of forging valid signatures.Hence, the proposed scheme withstands impersonation attack.
5.3 Replay Attack
The adversary can capture and store valid network messages for the pur-pose of maliciously replaying them later. Such attack is easily detected in our schemeby using nonce. At any time, the received nonce should be greater than its predecessor;therefore replay attack is detected when . It should be noted that the attackercan’t predict the current nonce value as the initial nonce is generated randomly and issent encrypted.
5.4 Message Modification Attack
ECDSA is a secure public key algorithm because it is computationally infeasible tomodify the message Mt and its signature rt to construct a new message with valid
A Chain Based Signature Scheme for Uplink and Downlink Communications 97

signature. Therefore, VrfyPK h2 Mt� �
; rt� �
function will output zero if the message orthe signature (or both) are altered in transit. Hence, the attached digital signature canserve as a guard against message alteration and the proposed scheme withstand againstmessage modification attack.
6 Conclusion
In this paper, we have proposed a chain based signature scheme to provide authentictwo-way communication in AMI network. The proposed scheme employs symmetriccryptography as well, in order to maintain data confidentiality. For optimal imple-mentation of the proposed scheme, we have classified the AMI traffic into downlinkand uplink, and we examined the transmission mode(s) required by each class. Wehave shown that the proposed scheme can resist various known attacks and is efficientin terms of the computation overhead and the ciphertext length.
References
1. Abdulrahman, Y., Saifur, R.: Smart grid networks: promises and challenges. JCM 7(6), 409–417 (2012)
2. Gungor, V.C., et al.: A survey on smart grid potential applications and communicationrequirements. IEEE Trans. Ind. Inform. 9(1), 28–43 (2013)
3. NIST framework and roadmap for smart grid interoperability standards release 1.0 (2010)4. Massoud, A.: A smart self-healing grid: in pursuit of a more reliable and resilient system [in
my view]. IEEE Power Energy Mag. 12(1), 110–112 (2014)5. Hayden, K.-H. S., Sammy, H.M.K., Edmund, Y.L., King-Shan, L.: Zero-configuration
identity-based signcryption scheme for smart grid. In: IEEE International Conference onSmart Grid Communications, October 2010
6. Debiao, H., Huaqun, W., Muhammad, K.K., Lina, W.: Lightweight anonymous keydistribution scheme for smart grid using elliptic curve cryptography. IET Commun. 10(14),1795–1802 (2016)
7. Jia-Lun, T., Lo, N.-W.: Secure anonymous key distribution scheme for smart grid. IEEETrans. SmartGrid 7, 906–914 (2015)
8. Saxena, N., Grijalva, S.: Efficient signature scheme for delivering authentic controlcommands and alert messages in the smart grid. IEEE Trans. Smart Grid 9, 4323–4334(2017)
9. Alharbi, K., Lin, X.: Efficient and privacy-preserving smart grid downlink communicationusing identity based signcryption. In: 2016 IEEE Global Communications Conference,Washington, DC, pp. 1–6 (2016)
10. Libert, B., Quisquater, J.J.: New identity based signcryption schemes from pairings. In:IEEE Information Theory Workshop, Paris, France (2003)
11. Lal, S., Kushwah, P.: ID based generalized signcryption, Cryptology ePrint Archive http://eprint.iacr.org/2008/84 (2008)
98 S. Khasawneh and M. Kadoch

12. Mahmood, K., Chaudhry, S.A., Naqvi, H., Kumari, S., Li, X., Sangaiah, A.K.: An ellipticcurve cryptography based lightweight authentication scheme for smart grid communication.Future Gener. Comput. Syst. 81, 557–565 (2018). https://doi.org/10.1016/j.future.2017.05.002
13. SEC 2: Recommended Elliptic Curve Domain Parameters, Certicom Research, 20September 2000
A Chain Based Signature Scheme for Uplink and Downlink Communications 99
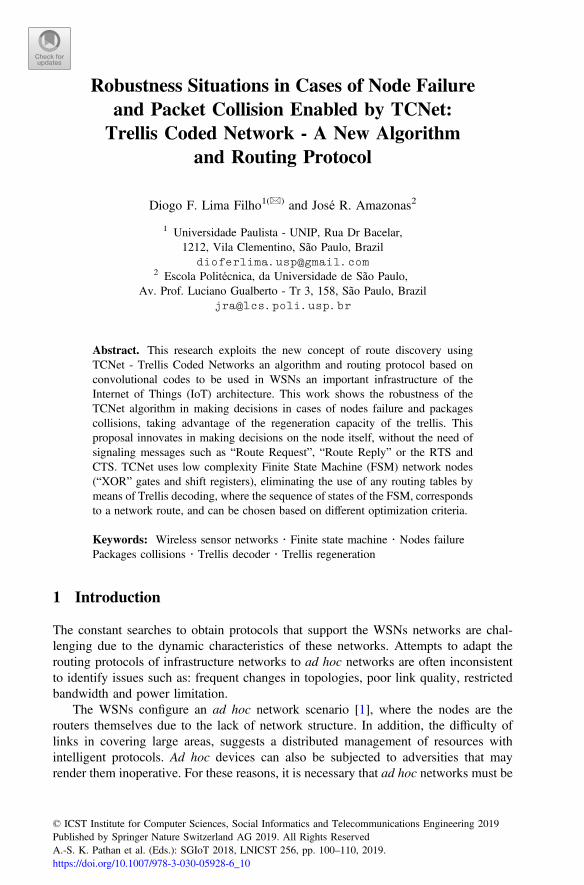
Robustness Situations in Cases of Node Failureand Packet Collision Enabled by TCNet:Trellis Coded Network - A New Algorithm
and Routing Protocol
Diogo F. Lima Filho1(&) and José R. Amazonas2
1 Universidade Paulista - UNIP, Rua Dr Bacelar,1212, Vila Clementino, São Paulo, Brazil
[email protected] Escola Politécnica, da Universidade de São Paulo,
Av. Prof. Luciano Gualberto - Tr 3, 158, São Paulo, [email protected]
Abstract. This research exploits the new concept of route discovery usingTCNet - Trellis Coded Networks an algorithm and routing protocol based onconvolutional codes to be used in WSNs an important infrastructure of theInternet of Things (IoT) architecture. This work shows the robustness of theTCNet algorithm in making decisions in cases of nodes failure and packagescollisions, taking advantage of the regeneration capacity of the trellis. Thisproposal innovates in making decisions on the node itself, without the need ofsignaling messages such as “Route Request”, “Route Reply” or the RTS andCTS. TCNet uses low complexity Finite State Machine (FSM) network nodes(“XOR” gates and shift registers), eliminating the use of any routing tables bymeans of Trellis decoding, where the sequence of states of the FSM, correspondsto a network route, and can be chosen based on different optimization criteria.
Keywords: Wireless sensor networks � Finite state machine � Nodes failurePackages collisions � Trellis decoder � Trellis regeneration
1 Introduction
The constant searches to obtain protocols that support the WSNs networks are chal-lenging due to the dynamic characteristics of these networks. Attempts to adapt therouting protocols of infrastructure networks to ad hoc networks are often inconsistentto identify issues such as: frequent changes in topologies, poor link quality, restrictedbandwidth and power limitation.
The WSNs configure an ad hoc network scenario [1], where the nodes are therouters themselves due to the lack of network structure. In addition, the difficulty oflinks in covering large areas, suggests a distributed management of resources withintelligent protocols. Ad hoc devices can also be subjected to adversities that mayrender them inoperative. For these reasons, it is necessary that ad hoc networks must be
© ICST Institute for Computer Sciences, Social Informatics and Telecommunications Engineering 2019Published by Springer Nature Switzerland AG 2019. All Rights ReservedA.-S. K. Pathan et al. (Eds.): SGIoT 2018, LNICST 256, pp. 100–110, 2019.https://doi.org/10.1007/978-3-030-05928-6_10
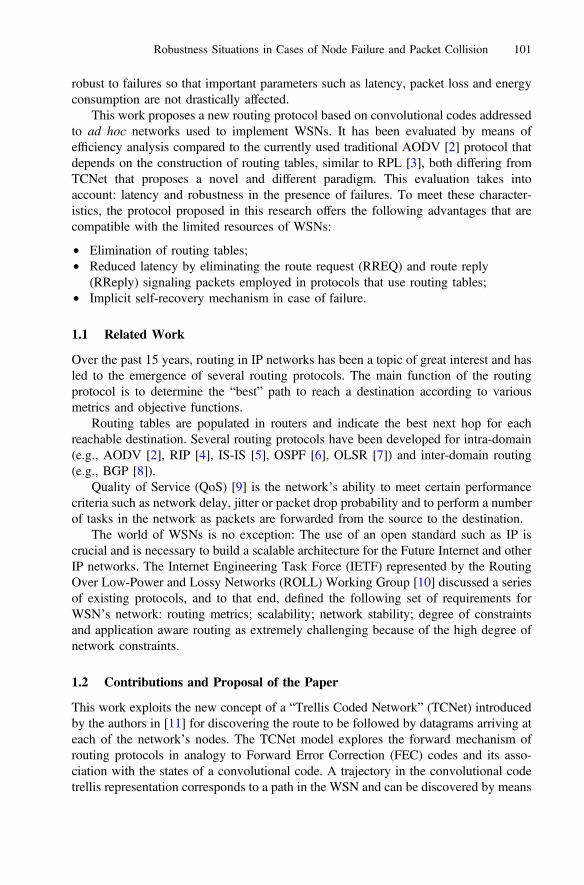
robust to failures so that important parameters such as latency, packet loss and energyconsumption are not drastically affected.
This work proposes a new routing protocol based on convolutional codes addressedto ad hoc networks used to implement WSNs. It has been evaluated by means ofefficiency analysis compared to the currently used traditional AODV [2] protocol thatdepends on the construction of routing tables, similar to RPL [3], both differing fromTCNet that proposes a novel and different paradigm. This evaluation takes intoaccount: latency and robustness in the presence of failures. To meet these character-istics, the protocol proposed in this research offers the following advantages that arecompatible with the limited resources of WSNs:
• Elimination of routing tables;• Reduced latency by eliminating the route request (RREQ) and route reply
(RReply) signaling packets employed in protocols that use routing tables;• Implicit self-recovery mechanism in case of failure.
1.1 Related Work
Over the past 15 years, routing in IP networks has been a topic of great interest and hasled to the emergence of several routing protocols. The main function of the routingprotocol is to determine the “best” path to reach a destination according to variousmetrics and objective functions.
Routing tables are populated in routers and indicate the best next hop for eachreachable destination. Several routing protocols have been developed for intra-domain(e.g., AODV [2], RIP [4], IS-IS [5], OSPF [6], OLSR [7]) and inter-domain routing(e.g., BGP [8]).
Quality of Service (QoS) [9] is the network’s ability to meet certain performancecriteria such as network delay, jitter or packet drop probability and to perform a numberof tasks in the network as packets are forwarded from the source to the destination.
The world of WSNs is no exception: The use of an open standard such as IP iscrucial and is necessary to build a scalable architecture for the Future Internet and otherIP networks. The Internet Engineering Task Force (IETF) represented by the RoutingOver Low-Power and Lossy Networks (ROLL) Working Group [10] discussed a seriesof existing protocols, and to that end, defined the following set of requirements forWSN’s network: routing metrics; scalability; network stability; degree of constraintsand application aware routing as extremely challenging because of the high degree ofnetwork constraints.
1.2 Contributions and Proposal of the Paper
This work exploits the new concept of a “Trellis Coded Network” (TCNet) introducedby the authors in [11] for discovering the route to be followed by datagrams arriving ateach of the network’s nodes. The TCNet model explores the forward mechanism ofrouting protocols in analogy to Forward Error Correction (FEC) codes and its asso-ciation with the states of a convolutional code. A trajectory in the convolutional codetrellis representation corresponds to a path in the WSN and can be discovered by means
Robustness Situations in Cases of Node Failure and Packet Collision 101

of a Viterbi-based algorithm [12] proposed in 1967 for decoding convolutional codesbased on the trellis diagram. TCNet implementation is on the level of proof-of-concept,and it can be easily adapted to work with IoT OSs like ContikiOS, TinyOS, FreeRTOSand others emerging OSs for the IoT [10].
This paper adds contributions to the proposal introduced in the previous work [11],where it will be shown the robustness of the process in case of nodes failures, andproposing solutions in cases of hidden and exposed nodes in WSNs. Briefly, suchproblems may be described as follows [13]:
• The hidden node problem refers to the collision of packets at a receiving node dueto the simultaneous transmission of those nodes that are not within the directtransmission range of the sender, but are within the transmission range of thereceiver, so both nodes transmit packets at the same time without knowing about thetransmission of each other.
• The exposed node problem refers to the inability of the node that is blocked due totransmission by a nearby transmitting node to transmit to another node.
2 TCNet Algorithm Implementation Scenario
For a better understanding of the TCNet decoding mechanism, consider the exampleshown in the previous work [11]. The sink node initializes the frame loading the WSNheader field with the information generated by the MM generator (outn(t) = (c1, c2))and transfers the input sequence ({kn}) to the TCNet label field. Initially all nodes in thesink’s node coverage area receive the request from it, Fig. 1a. Figure 1b shows thedecoding trellis in which we realize that each node can only receive information fromtwo other nodes. For example: node (10) receives information from node (00) whennode (00) generates the code (c1, c2) = (11) and receives information from node (01)when node (01) generates the code (c1, c2) = (00).
Fig. 1. (a) Initialization of the TCNet frame by the sink node: the input sequence {kn} is loadedon the TCNet label field and the output sequence outn(t) = (c1, c2) is loaded on the WSN headerfield; (b) Decoding trellis; (c) Nodes in the sink’s coverage area receive the query.
102 D. F. Lima Filho and J. R. Amazonas

Figure 1c shows the operations performed by each node when they receive theframe sent by the sink. For instance, node (10) evaluates dHam between the codereceived in the WSN header and the codes of the trellis branches, obtaining:
• from node 00ð Þ ) dHam ¼ 0• from node 01ð Þ ) dHam ¼ 2.
The value dHam = 0 indicates that the received frame is for node (10) and it hascome from the sink. Node (10) loads its information (value of the sensed variable) inthe payload. Using the {kn} sequence received in the TCNet label, it determines that thenext code (c1, c2) is (01) and updates the WSN header with that value.
For every other node that receives the frame from the sink, the procedure is per-formed, but none of them produce a value of dHam = 0. Therefore, these other nodeswill not transmit and will wait to receive the next frame. This is a simple example toprove the validity of the concept proposed in this work.
3 TCNet Approach to Solve Node Failure and PackageCollisions
Before introducing the TCNet approach to solve node failure and package collisions,this section starts by introducing the capability of trellis regeneration.
3.1 Network Recovery Capability Using Trellis Regeneration
The ability of TCNet to establish routes on a trellis is associated with the complexity ofthe Mealy machine (MM). The initial scenarios presented in this work use MM con-figuration with rate k/n = 1/2 and hard decision based on Hamming distance dHamð Þ[12] for the purpose of hardware simplifications, with implications in the reduction ofthe branches that leave the nodes, limiting the ability of decision of the trellis, as will beshown later.
An alternative to extend the options of connections between the nodes of a networkis to use smoothing of the Hamming distance, through the concept of soft decisiondecoding, where the soft decision metric uses the concept of free distance dfree
� �[12].
This is possible by changing the inputs and outputs configurations of the MMs com-bined with changes in the quantities of symbols {v} in the input sequence kn tð Þ (whichindicates the route on the trellis), also corresponding to the quantities of connectionsleaving a node (e.g. 2v ¼ 2 output, used with dHam in cases of hard decision). In casesof soft decision the node configurations are extended to 2v ¼ 4 and 2v ¼ 8 output orsettings with more outputs, resulting in more branch options leaving the node, as theexample in Fig. 2.
Robustness Situations in Cases of Node Failure and Packet Collision 103

An example ofMMconfiguration proposed byUngerboek [14] as shown in Fig. 3(a),represents a MM with rate k/n = 2/3, where the sequence kn tð Þ is composed of wordswith v = 2 symbols: u1u2f g moving in the registers of MM with outputs n1n2n3f g,resulting in a increase in the nodes connection capacity as shown by the equivalent trellisof the MM considered, Fig. 3(b). An important result in this configuration is the increasein the ability to establish routes on the trellis and the consequent time reduction of thetrellis stabilization, which means to reach the steady state in fewer steps.
Fig. 2. Configurations of nodes and their respective dfree between the symbols of the sequencekn tð Þ, with d0 [ d1 [ d2. (a) Trellis node corresponding to the sequence set kn tð Þ ¼ 0; 1f g;(b) Trellis node corresponding to the sequence set kn tð Þ ¼ 00; 01; 10; 11f g; (c) Trellis nodecorresponding to the sequence set kn tð Þ ¼ 000; 001; 010; 011; 100; 101; 110; 111f g.
Fig. 3. (a) Configuration of the MM with rate k/n = 2/3, showing detail of node connectioncapacity; (b) The resulting trellis diagram with 2v ¼ 4 branches connecting the nodes of thetrellis and the instant that the trellis reaches the steady state.
104 D. F. Lima Filho and J. R. Amazonas
3.2 Simulation Scenario with Network Nodes Failures Consideringthe Same Coverage Area
The initial scenario uses a MM with rate k/n = 1/2 and a sequence kn tð Þ ¼1 0 1 1 1 0 0 0f g defined by a desired QoS. Shifting the input sequence kn (t) in the
MM enables the reachability in a standard 8 node network, so that comparisons can bemade in situations of nodes failures. In this simulation will be considered the nodesfailures before the trellis reaches the steady state, due to the reasons presented in thefirst steps of trellis construction shown in Fig. 4:
• 1st step: Node (100) is required for the route initialization;• 2nd step: Nodes (010) and (110) are used for trellis initialization, and failure may
occur only in one of the nodes;• 3rd step: Nodes (001), (011), (101) and (111) are also used for trellis initialization
and, only two nodes can fail at the same time.
This work uses as simulation environment the OMNeT++ based on C++ and objectoriented [15]. It has been chosen because it is an open software with applications insimulations and modeling of traffic networks, used as reference for comparisons amongother techniques due to available frameworks.
Fig. 4. Configuration of the trellis generated by the MM with rate k/n = 1/2 showing steadystate after 4 th step.
Robustness Situations in Cases of Node Failure and Packet Collision 105

3.3 Cases of Nodes Failure in a 8 Nodes Network During a Query
The methodology used in this work to measure the efficiency of a network in thepresence of node failures will be shown through latency during route recovery. In orderto obtain the network latency during a query, the following data were normalized:
• Processing time tpn� �
, considered during data displacement in the MM;• Channel delay tcð Þ, propagation time in the wireless communications channel
considered;• Guard band tg
� �, time interval considered by the nodes between the multicasts of
the FRAMES;• Time out toutð Þ, time the network waits for the response of the requested node to
decide to replace it by another network node.
Considering a theoretical scenario, with random distribution of the nodes in acoverage area with the maximum radius distance (dmax = 1000 m), Eq. (1) was usedto evaluate the total latency of the network for the case of node failure:
RTLf ¼ tpn þ tc þ tg þ tout ð1Þ
Fig. 5. Network latency resulting during route recovery, in failure cases: 1 node, 2 nodes and 3 nodes.
106 D. F. Lima Filho and J. R. Amazonas

In the considered scenario of nodes failures, the nodes to fail were chosen amongthose that compromise the trellis recovery. The nodes located in the first steps of thetrellis, region of instability, were the chosen nodes in simulation environment below, asshown in Fig. 4:
• One node failure: node – (010) or {2} in 2 nd step of the trellis path;• Two simultaneous nodes failures: node – (010) or {2} and node – (111) or
{7} located in 3rd and 4th steps of the trellis path;• Three simultaneous nodes failures: node – (010) or {2}, node – (101) or {5}
and node – (111) or {7} in 2nd, 3rd and 4th steps of the trellis path;
Figure 5 shows the latency results to recover routes in cases of node failures, takingas reference a route without node failure as commented below:
• In case of one node failure, it results in a 10% increase in latency in relation to thenetwork without node failure, due mainly to the (tout) considered in the simulation;
• In case of 2 - nodes failures, it results in a 25% increase in latency in relation to thenetwork without node failure;
• In case of 3 - nodes failures, it is important to realize that there was a reduction ofthe network by 50%, and even so the network recovers and completes the querywith 70% of the latency of the network without any node failure.
3.4 Cases of Nodes Failure in Extended Networks During a Query
Considering the basic configuration of MM used in this work (Mealy machine with ratek/n = 1/2, Fig. 1(a)) and progressively adding shift registers and connections in its“XOR” gates, it is possible to generate higher densities networks which can be used tocompare TCNet efficiency measures.
Fig. 6. Latency comparison in route recovery for networks with higher node density, withrespect to the routes without failure considering two cases of increased networks.
Robustness Situations in Cases of Node Failure and Packet Collision 107
The nodes selected for the case of failure in the higher density networks werechosen in the first steps of the trellis, (instability region of trellis). The results shown inFig. 6 refer to the latencies comparison in route recovery, as the nodes densityincreases, with respect to the routes without failure, considering two cases of increasingnetwork density: 64 nodes network and 512 nodes network.
Table 1 shows a progressive reduction of latency during route recovery, using thesimulation environment [15], as the number of nodes increases in the network, con-sidering more cases, making easier the trellis recovery.
3.5 Simulation Scenarios with Packet Collision
The main challenges in designing a routing algorithm for ad hoc networks according to[13], besides the problems related to: randomness of nodes and resource containmentthey are the hidden and exposed terminal. The hidden terminal contributes to thedegradation of the data rate transfer in the network due to collisions caused and theterminal exposed is the existence of nodes belonging to the network but that are outsidethe coverage area. The practice adopted by the conventional protocols to overcome theproblem consists of the Carrier Sense Multiple Access with Collision Avoidance(CSMA/CA) procedure [16] which is summarized with the signaling messages usingthe controls mechanism: Request to Send, Clear to Send, Data, Acknowledgment(RTS, CTS, Data and ACK), representing a complex solution to the limited capacity ofWSNs.
The contribution proposed by TCNet [17] consists of the decision made by thenode itself, in being part of the route, using finite state machines, without the need fornetwork signaling messages as: Route Request or Route Reply. There is still thepossibility of using codes based on diversity as Code Division Multiple Access(CDMA), thus allowing channel sharing by the nodes. Associating the CDMA tech-nique in allowing diversity at the physical layer with the capacity of the TCNet algo-rithm in using strategies that allow the node to decide whether it belongs to a particularroute, results in a combination that contributes to a query at a given time. The Fig. 7(a)shows a classic terminal scenario using CSMA/CA, where nodes A and C transmit atthe same time to node B, occurring packet collision, because nodes A and C are in thehidden state of each other. The channel sharing solution involves the use of diversity atthe physical layer level using Code Division Multiple Access (CDMA) as shown inFig. 7(b). The solution adopted by TCNet uses the decision concept taken by the node
Table 1. Latencies comparison in route recovery, as the nodes density increases.
Network Nodes failure Latency increase
16 nodes n8 & n15 20%32 nodes n16 & n31 18.8%64 nodes n32 & n63 12.5%128 nodes n64 & n127 7.3%256 nodes n128 & n255 5.3%512 nodes n256 & n511 2.7%
108 D. F. Lima Filho and J. R. Amazonas

itself, based on the algorithm of Viterbi explained in [11], decoding the receivedsequence and estimating the minimum Hamming distance between the symbols of thesequence sent by Sink and the weight of the path branches as shown in Fig. 7(c).
Another possible collision scenario in ad hoc networks is the existence of nodesbelonging to the network, but outside the coverage area, thus configuring the case ofthe exposed terminal. The TCNet scenarios are usually applied to hundreds of nodesdistributed over large areas, suggesting in these cases the subdivision of these areas intoclusters. In light of this, we propose in future works, studies of cases where scenarioswith node clusters will be presented in order to solve packet collision.
4 Conclusions and Future Works
In this work it was reviewed the innovative approach of TCNet model introduced bythe authors in [11] which exploits the new concept of route discovery quite advanta-geous for limited resources networks as is the case of WSNs.
It was shown the robustness of the process in case of nodes failures, and proposingsolutions in cases of hidden and exposed nodes due to the packet collision problem inWSNs. In future works we intend to: (i) present results of efficiency of the processusing cluster of nodes to solve packet collision and; (ii) to verify which extensionsshould be incorporated into RPL so that it can work according to the TCNet paradigm.
References
1. Sivalingam, K.M.: Tutorial on wireless sensor network protocols. In: InternationalConference on High Performance Computing 2002, Bangalore, India, December 2002
2. Perkins, C., Belding Royer, E., Das, S.: Ad hoc on - demand distance vector - (AODV)routing, RFC 3561, July 2003. http://www.rfc-editor.org/rfc/rfc3561.txt
3. RPL: IPv6 Routing Protocol for Low - Power and Lossy Networks. https://tools.ietf.org/html/rfc6550. Accessed 8 May 2018
4. Hendric, C.L.: Routing Information Protocol, RFC 1058, June 1988. http://www.rfc-editororg/rfc/rfc1058.txt
5. Oran, D.: OSI IS-IS Intra domain Routing Protocol, RFC 1141, February 1990. http://tools.Ietf.org/html/rfc1142
Fig. 7. (a) Scenario of hidden terminal using decision (CSMA/CA); (b) CDMA enabling themto share the same channel for packages A and C; (c) Mechanism of TCNet decision.
Robustness Situations in Cases of Node Failure and Packet Collision 109

6. Moy, J.: Open Shortest Path First, RFC 2328, April 1988. http://www.rfc-editor.org/rfc/rfc.2328.txt
7. Clausen, T., Jacquet, P.: Optimized Link State Routing Protocol (OLSR), RFC 3626,October 2003. http://www.rfc-editor.org/rfc/rfc3626.txt
8. Rekhter, Y., Li, T., Hares, S.: Border Gateway Protocol, RFC 4271, January 2006. http://www.rfceditor.org/rfc/rfc4271.txt
9. Chen, S., Nahrsted, K.: Distributed quality of service routing in Ad Hoc networks.IEEE J. Sel. Areas Commun. 17(8), 1488–1504 (1999)
10. Vasseur, J.P., Dunkels, A.: Interconnecting Smart Objects with IP The Next internet, 1st edn.Morgan Kaufmann, San Francisco (2010)
11. Lima Filho, D.F., Amazonas, J.R.: A new algorithm and routing protocol based onconvolutional codes using TCNet: Trellis Coded Network. In: The 1st EAI InternationalConference on Smart Grid Assisted Internet of Things – SGIoT/2017. Springer. ISBN 978-1-63190-152-2. http://eudl.eu/proceedings/SGIoT/2017
12. Proakis, J.G., Salehi, M.: Digital Communications, 5th edn. Mc Graw Hill, New York(2008)
13. Fullmer, C.L., Garcia, J.J.: Solutions to hidden terminal problems in wireless netwoks. In:Proceedings of ACM SIGCOMM 1997, pp. 39–49, September 1997
14. Biglieri, E., Divsalar, D., Mclane, P.J., Simon, M.K.: Introduction to Trellis - CodeModulation with Applications. Macmillan Publishing Company, New York (1991)
15. Varga, A.: OMNeT++ Discrete Event Simulation System (2011). http://www.omnetpp16. Nasipuri, A., Zhuang, J., Das, S.R.: A Multi-channel CSMA MAC protocol for multi-hop
wireless networks. In: Proceedings of IEEE WCNC (1999)17. Lima Filho, D.F., Amazonas, J.R: A Trellis Coded Networks-based approach to solve the
hidden and exposed nodes problems in WSNs. In: Segundo Seminário Taller Latinoamer-icano de Instumentación Control y Telecomunicaciones, Proceedings of SICOTEL, p. 297(2014). ISBN 978-958-8593-44-9
110 D. F. Lima Filho and J. R. Amazonas

Applications and Technologies

Effectiveness of Hard ClusteringAlgorithms for Securing Cyber Space
Sakib Mahtab Khandaker1,2(B), Afzal Hussain1,2, and Mohiuddin Ahmed1,2
1 Islamic University of Technology, Gazipur City, Bangladesh{sakibmahtab,afzalhussain}@iut-dhaka.edu,
[email protected] Canberra Institute of Technology, Reid, Australia
Abstract. In the era of big data, it is more challenging than beforeto accurately identify cyber attacks. The characteristics of big data cre-ate constraints for the existing network anomaly detection techniques.Among these techniques, unsupervised algorithms are superior than thesupervised algorithms for not requiring training data. Among the unsu-pervised techniques, hard clustering is widely accepted for deployment.Therefore, in this paper, we investigated the effectiveness of differenthard clustering techniques for identification of a range of state-of-the-artcyber attacks such as backdoor, fuzzers, worms, reconnaissance etc. fromthe popular UNSW-NB15 dataset. The existing literature only providesthe accuracy of identification of the all types of attacks in generic fashion,however, our investigation ensures the effectiveness of hard clustering forindividual attacks. The experimental results reveal the performance ofa number of hard clustering techniques. The insights from this paperwill help both the cyber security and data science community to designrobust techniques for securing cyber space.
Keywords: Network traffic analysis · Cyber attacksUnsupervised clustering · Big data
1 Introduction
Technology have been increasing at breakneck speed and with it the amount ofdata generated thus the word big data has become ubiquitous in both academicand industrial domains. Although it is a relatively new term which was onlycoined in 2008 [2], it became a buzzword after the Mckinsley Global Institutereport [3] but there still remains confusion as to the amount of data denotedby it. Big data is the driving force behind many digital transformation waveslike internet of things, data science and artificial intelligence. The term canproperly be defined using the “5V” – volume (referring to the large amountof data requiring no traditional processing methods), velocity (the high speedat which data is produced), variety (denoting the structured, semi structuredand unstructured form of generated data), veracity (the quality of the data)c© ICST Institute for Computer Sciences, Social Informatics and Telecommunications Engineering 2019
Published by Springer Nature Switzerland AG 2019. All Rights Reserved
A.-S. K. Pathan et al. (Eds.): SGIoT 2018, LNICST 256, pp. 113–120, 2019.
https://doi.org/10.1007/978-3-030-05928-6_11

114 S. M. Khandaker et al.
and value (referring to the added value big data brings) [1]. By reflecting onall existing definitions, Big data has been [4] defined as “Big Data representsthe Information assets characterized by such a High Volume, Velocity and Vari-ety to require specific Technology and Analytical Methods for its transformationinto Value.” Use of big data implies dealing with large amount of structured,unstructured and semi structured data ranging from petabytes, exabytes to evenyotabytes [5]. Big data comes with a cost, it creates information security andprivacy breach but big data analytics on the other hand promises detection andprevention of such cyber attacks. Real time analysis of patterns, outlier detec-tion and attack recognition through correlation and machine learning is wherebig data analysis can play a big role in cyber security. Big data holds the key tosolve information security threat by providing real time actionable insights [6].Extension of traditional security and real time large scale analysis, compassion,anomaly detection of heterogeneous data sets at greater speed have been madepossible with the newer big data technologies like Hadoop ecosystem, streammining, complex-event processing and NoSQL databases [7].
The contribution of this paper lies in the fact that 3 different unsupervisedalgorithms were used here for anomaly detection namely - kmeans, kmedoidsand kmodes. We used them to identify different types of cyber attacks like -analysis, exploits, reconnaissance, worms, backdoor, fuzzers, shellcode, DoS andgeneric attacks. Among the three, kmodes showed the highest accuracy with anoverall accuracy of 69%. It was able to segregate different types of cyber attacksfrom the UNSW-NB15 dataset which is used as a standard for cyber securityresearch. This paper sheds light on the potential of unsupervised algorithms incyber security.
1.1 Roadmap
The Rest of the paper is organized as follows: Sect. 2 discusses about differentnetwork anomaly techniques then Sect. 3 focuses on hard clustering algorithms.In Sect. 4 different types of cyber attacks are described. Finally experimentalresults are highlighted in Sect. 5 and Sect. 6 is where we draw the conclusion.
2 Network Anomaly Detection Techniques
Anomaly detection can be referred to the detection of nonconforming patterns inregular data. These abnormal data are sometimes termed as outliers, exceptions,peculiarities or contaminants in different paradigm. The most common termsused terms are anomaly and outlier. Actionable intelligence anomaly detectionprovides where its most importance lies. Outlier or anomaly detection can bedated back to the 19th century [8]. Some of the challenges which come up whendetecting outliers keeping up with constantly evolving normal behavior, availabil-ity of labeled data for training or validation and often data contains noise whichgives rise to false positives [9]. Compared to statistical approach which focuseson understanding the process of data generation, machine learning focuses on

Effectiveness of Hard Clustering Algorithms for Securing Cyber Space 115
providing the necessary answer based on previous available data thus creating adynamic system with adaptive capability. Now machine learning based anomalydetection can be divided into three categories - supervised, semi supervised andunsupervised.
Supervised anomaly detection presumes that training data set is availablewith labeling denoting normal and anomalous instances. The usual approachfor such a method is build a predictive model of normal vs anomaly. New dataentries are compared with preexisting ones to determine its position among thetwo cases. Sadly this method has drawbacks. Firstly the training data set con-tains fewer anomalous incidents compared to normal ones. Secondly obtainingaccurate and suitable labels especially in case of anomaly is difficult.
Semi supervised techniques work with the presumption that training datahas been labeled for normal instances. As anomalous instances are not labeledhere its add flexibility to their application. There are a few number of semisupervised techniques which assumes availability of anomalous cases [10,11].But these techniques are less used because of the fact that obtaining trainingdata set for all anomalous cases is not possible.
Lastly we have unsupervised anomaly detection technique where there id noneed of a training data set. Such techniques make two implicit assumptions.First, the major part of the data set is constituted of normal cases and onlya small percentage are anomalies and the other assumptions is that anomalouscases are statistically different from normal cases.
Application of unsupervised algorithm for cyber security has gained momen-tum in academic paradigm. The accuracy and effectiveness of fixed width clus-tering, optimized k nearest neighbor support vector machine have been shownin Eskin et al. [12]. Old - meadow et al. showed improvement of cluster accuracywhen the said clusters are adaptive [13]. A two tier novel intrusion detectionsystem was proposed in by Zanero et al. [14]. Phad et al. examines IP head-ers connections to various ports as well as packet headers of Ethernet, IP andtransport layers packet headers [15]. Alad et al. detects anomalies in inboundTCP connections to well known ports on the server [16]. Lerad et al. detectsTCP stream anomalies like alad but uses a learning algorithm to pick good rulesfrom training set rather than using a fixed set of rules [17]. K-mean was used byDragon Research and Nairac for novelty detection [18,19]. Gaddam et al. showeda method to detect anomalous activities using k means clustering [20].
3 Hard Clustering
When it comes to the taxonomy of clustering algorithms we can categorize theminto two broad groups as shown in Fig. 1. Hierarchical clustering algorithms caneither be successive splitting (divisive) or merging (agglomerative) of groups toform a hierarchy based on similarity or a specific measure of distance. Hierarchi-cal algorithms can also be sub classified according to the process the distancesor similarities between objects are updated after splitting or merging groups. Onthe other hand partitional clustering algorithms focus on portioning data based
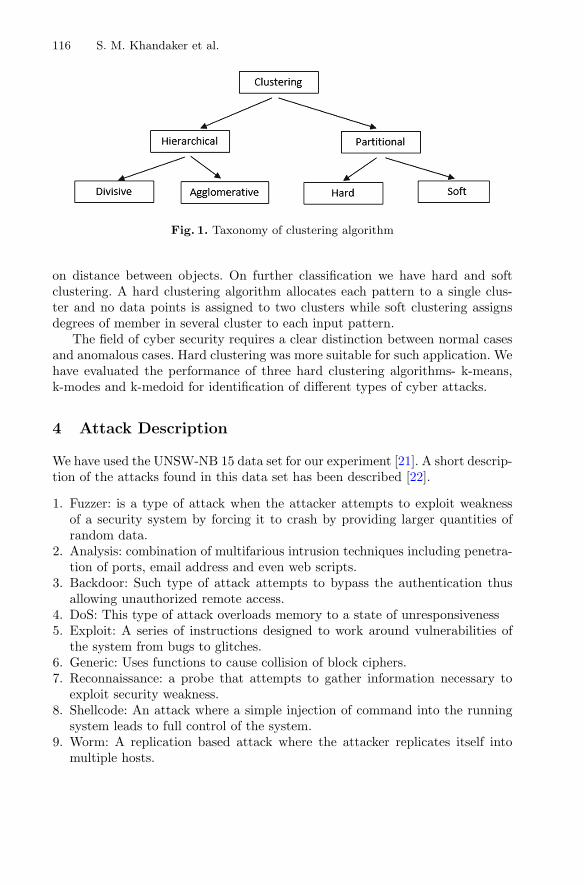
116 S. M. Khandaker et al.
Fig. 1. Taxonomy of clustering algorithm
on distance between objects. On further classification we have hard and softclustering. A hard clustering algorithm allocates each pattern to a single clus-ter and no data points is assigned to two clusters while soft clustering assignsdegrees of member in several cluster to each input pattern.
The field of cyber security requires a clear distinction between normal casesand anomalous cases. Hard clustering was more suitable for such application. Wehave evaluated the performance of three hard clustering algorithms- k-means,k-modes and k-medoid for identification of different types of cyber attacks.
4 Attack Description
We have used the UNSW-NB 15 data set for our experiment [21]. A short descrip-tion of the attacks found in this data set has been described [22].
1. Fuzzer: is a type of attack when the attacker attempts to exploit weaknessof a security system by forcing it to crash by providing larger quantities ofrandom data.
2. Analysis: combination of multifarious intrusion techniques including penetra-tion of ports, email address and even web scripts.
3. Backdoor: Such type of attack attempts to bypass the authentication thusallowing unauthorized remote access.
4. DoS: This type of attack overloads memory to a state of unresponsiveness5. Exploit: A series of instructions designed to work around vulnerabilities of
the system from bugs to glitches.6. Generic: Uses functions to cause collision of block ciphers.7. Reconnaissance: a probe that attempts to gather information necessary to
exploit security weakness.8. Shellcode: An attack where a simple injection of command into the running
system leads to full control of the system.9. Worm: A replication based attack where the attacker replicates itself into
multiple hosts.

Effectiveness of Hard Clustering Algorithms for Securing Cyber Space 117
5 Experimental Analysis
In order to evaluate the performance of the machine learning algorithms wehave used confusion matrix [23]. The confusion matrix has four cells as shownin Table 1, True Positive (TP) which shows the number of attacks detected,True Negative (TN) which shows the number of normal instances detected, FalsePositive (FP) showing false alarms and False Negative (FN) where the algorithmmistakes an attack for normal case.
To find the accuracy we have used the formula:
TN + TF
TN + TF + FP + FN(1)
We have evaluated the accuracy of all three algorithms for each type ofattacks as shown in Table 2.
The dataset used here is the UNSW-15 which was created using an IXIA Per-fectstorm tool in the Cyber Range Lab of the Australian Centre for Cyber Secu-rity (ACCS) to generate a set of realistic normal cyber activities and syntheticcontemporary attack behaviors. Through the use of a tcpdump tool 100 GB ofraw network traffic with a total of 2,540,044 records.
We applied the algorithms on each type of attacks for different split to findaccuracy as shown in Fig. 2. It has been found that among the three algorithmskmodes showed the highest accuracy for all types of attacks with an overallaverage of 70% followed by kmedoid which had an average of 63% for cyberattack detection. The performance of all the algorithms for different split ratioshave also been shown in Fig. 2 for better understanding of their performance.
Table 1. Confusion matrix
Negative Positive
Actual negative TN FP
Actual positive FN TP

118 S. M. Khandaker et al.
Fig. 2. Accuracy of algorithms

Effectiveness of Hard Clustering Algorithms for Securing Cyber Space 119
Table 2. Accuracy of different algorithms
kmedoid kmean kmodes
Analysis 0.74625 0.73125 0.80125
Exploits 0.535 0.51875 0.58375
Reconaisence 0.575 0.56375 0.59875
Worms 0.5525 0.54875 0.745
Backdoor 0.745 0.73625 0.79875
Fuzzers 0.54375 0.5325 0.5775
Shellcode 0.595 0.56125 0.61375
DoS 0.67875 0.66875 0.72
Generic 0.7625 0.755 0.825
Overall avg. 0.637083 0.624028 0.695972
6 Conclusions and Future Research
In this paper, we investigated the performance of unsupervised approaches toidentify different types of network attacks. From our experimental analysis, wecome to a conclusion that the k-modes clustering algorithm outperforms thek-means and k-medoid algorithms in terms of accurately identifying nine dif-ferent types of cyber attacks from the state-of-the-art datasets. We have useddifferent combination to avoid any bias in our investigation and it turns out thatk-modes algorithm consistently performs better than the rest. In future we aregoing to address the issue of automatic centroid calculation and mixed type ofattributes in the datasets.
References
1. Baaziz, A., Quoniam, L.: How to use Big Data technologies to optimize operationsin Upstream Petroleum Industry. Int. J. Innov. 1(1), 19–29 (2013)
2. Editorial: community cleverness required. Nature 455(7209), 1 (2008). http://www.nature.com/news/specials/bigdata/index.html
3. Manyika, J., et al.: Big Data: The Next Frontier for Innovation, Competition, andProductivity. McKinsey Global Institute, New York (2011)
4. De Mauro, A., Greco, M., Grimaldi, M.: What is big data? A consensual definitionand a review of key research topics. In: AIP Conference Proceedings, vol. 1644, pp.97–104. AIP (2015). http://aip.scitation.org/doi/abs/10.1063/1.4907823
5. Akerkar, R.: Big Data Computing, International Standard Book Number 13: 978-1-4665-7838-8
6. Mahmood, T., Afzal, U.: Security analytics: big data analytics for cybersecurity:a review of trends, techniques and tools. In: 2013 2nd National Conference onInformation Assurance (NCIA), Rawalpindi, pp. 129–134 (2013)
7. Alguliyev, R., Imamverdiyev, Y.: Big data: big promises for information security.In: Proceedings of the 2014 8th IEEE International Conference on Application ofInformation and Communication Technology AICT, pp. 1–4, October 2014

120 S. M. Khandaker et al.
8. Edgeworth, F.Y.: On discordant observations. Philosoph. Mag. 23(5), 364–375(1887)
9. Chandola, V., Banerjee, A., Kumar, V.: Anomaly detection. ACM Comput. Sur.41(3), 1–58 (2009). https://doi.org/10.1145/1541880.1541882
10. Dasgupta, D., Andmajumdar, N.: Anomaly detection in multidimensional datausing negative selection algorithm. In: Proceedings of the IEEE Conference onEvolutionary Computation, pp. 1039–1044 (2002)
11. Dasgupta, D., Andnino, F.: A comparison of negative and positive selection algo-rithms in novel pattern detection. Proc. IEEE Int. Conf. Syst. Man Cybernet. 1,125–130 (2000)
12. Eskin, E., Arnold, A., Prerau, M., Portnoy, L., Stolfo, S.: A geometric frameworkfor un-supervised anomaly detection: detecting intrusions in unlabeled data. In:Barbara, D., Jajodia, S. (eds.) Applications of Data Mining in Computer Security,vol. 6. Springer, Boston (2002). https://doi.org/10.1007/978-1-4615-0953-0 4
13. Oldmeadow, J., Ravinutala, S., Leckie, C.: Adaptive clustering for network intru-sion detection. In: Dai, H., Srikant, R., Zhang, C. (eds.) PAKDD 2004. LNCS,vol. 3056, pp. 255–259. Springer, Heidelberg (2004). https://doi.org/10.1007/978-3-540-24775-3 33
14. Zanero, S., Savaresi, S.: Unsupervised learning techniques for an intrusion detectionsystem. In: Proceedings of the ACM Symposium on Applied Computing, SAC 2004.ACM (2004)
15. Mahoney, M.V., Chan, P.K.: PHAD: Packet Header Anomaly Detection for Identi-fying Hostile Network Traffic Department of Computer Sciences, Florida Instituteof Technology, Melbourne, FL, USA, Technical report CS- 2001-4, April 2001
16. Mahoney, M.V., Chan, P.K.: Learning nonstationary models of normal networktraffic for detecting novel attacks. In: Proceedings of the Eighth ACM SIGKDDInternational Conference on Knowledge Discovery and Data Mining, Edmonton,Canada, pp. 376–385 (2002)
17. Mahoney, M.V., Chan, P.K.: Learning Models of Network Traffic for DetectingNovel Attacks Computer Science Department, Florida Institute of Technology CS-2002-8, August 2002
18. Allan, J., Carbonell, J., Doddington, G., Yamron, J., Yang, Y.: Topic detectionand tracking pilot study: final report. In: Proceedings of the DARPA BroadcastNews Transcription and Understanding Workshop (1998)
19. Nairac, A., Townsend, N., Carr, R., King, S., Cowley, P., Tarassenko, L.: A systemfor the analysis of jet system vibration data. Integr. Comput. Aided Eng. 6(1),53–65 (1999)
20. Gaddam, S.R., Phoha, V.V., Balagani, K.S.: K-Means+ID3: a novel method forsupervised anomaly detection by cascading K-means clustering and ID3 decisiontree learning methods. IEEE Trans. Knowl. Data Eng. 19(3), 345–354 (2007)
21. Moustafa, N., Slay, J.: UNSW-NB15 DataSet for Network Intrusion Detection Sys-tems, May 2014. http://www.cybersecurity.unsw.adfa.edu.au/ADFA20NB15
22. Moustafa, N., Slay, J.: The evaluation of Network Anomaly Detection Systems: sta-tistical analysis of the UNSW-NB15 data set and the comparison with the KDD99data set. Inf. Secur. J. Glob. Perspect. 25(1–3), 18–31 (2016)
23. Fawcett, T.: An introduction to ROC analysis. Pattern Recogn. Lett. 27, 861–874(2006). https://doi.org/10.1016/j.patrec.2005.10.010

On Data Driven Organizationsand the Necessity of Interpretable Models
Tony Lindgren(B)
Department of Computer and System Sciences, Stockholm University,Borgarfjordsgatan 12, 164 40 Kista, Sweden
Abstract. It this paper we investigate data driven organizations in thecontext of predictive models, we also reflect on the need for interpretabil-ity of the predictive models in such a context. By investigating a specificuse-case, the maintenance offer from a heavy truck manufacturer, weexplore their current situation trying to identify areas that needs changein order to go from the current situation towards a more data driven andagile maintenance offer. The suggestions for improvements are capturedin a proposed data driven framework for this type of business. The aimof the paper is that the suggested framework can inspire and start fur-ther discussions and investigations into the best practices for creating adata driven organization, in businesses facing similar challenges as in thepresented use-case.
Keywords: Data driven framework · Interpretability · Organization
1 Introduction
As organizations such as governments, corporations, educational institutions(from here on referred to as organizations), start to re-organize their work withthe intent to harness and utilize the data that they are (or could be) in possessionof, they are confronted with different challenges. One can partition the challengesinto two major themes, technical and organizational. The technical challengescan include how to efficiently collect data, how to store it, how to query andanalyze it etc. On the organizational level decisions on which department willdo what and their responsibiltes must be made. Typically, the end goal for anorganization that have initiated change in the above mentioned direction is to“become data driven”. The silent assumption is that a data driven organizationis the pinnacle of efficiency, with very low waste, be it in time, effort or any otherscares resource [10].
One organizational model that subscribes to this data driven organizationalidea is the New Public Management (NPM) [2], which strives to generate feed-back loops which can be used to guide the organization. These feedback loopshave become more common everywhere in society. It can materialize itself inc© ICST Institute for Computer Sciences, Social Informatics and Telecommunications Engineering 2019
Published by Springer Nature Switzerland AG 2019. All Rights Reserved
A.-S. K. Pathan et al. (Eds.): SGIoT 2018, LNICST 256, pp. 121–130, 2019.
https://doi.org/10.1007/978-3-030-05928-6_12
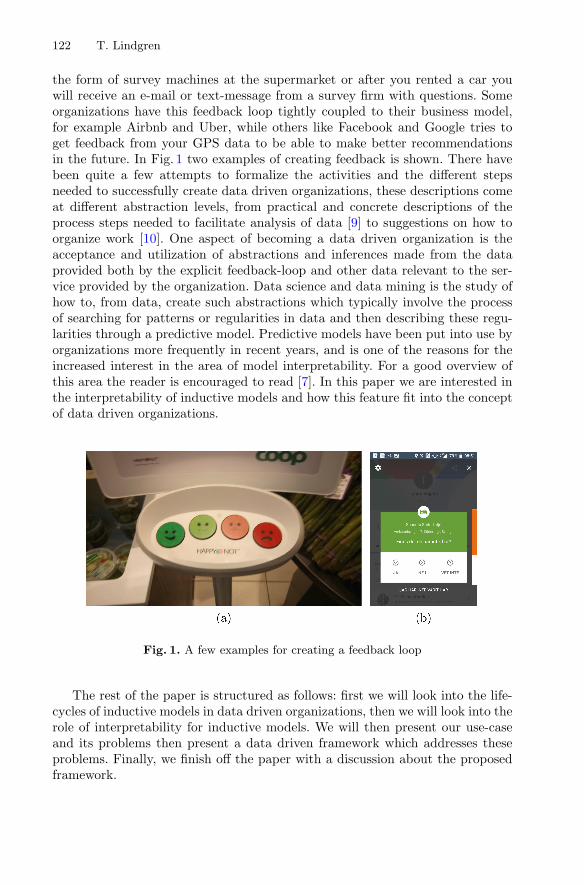
122 T. Lindgren
the form of survey machines at the supermarket or after you rented a car youwill receive an e-mail or text-message from a survey firm with questions. Someorganizations have this feedback loop tightly coupled to their business model,for example Airbnb and Uber, while others like Facebook and Google tries toget feedback from your GPS data to be able to make better recommendationsin the future. In Fig. 1 two examples of creating feedback is shown. There havebeen quite a few attempts to formalize the activities and the different stepsneeded to successfully create data driven organizations, these descriptions comeat different abstraction levels, from practical and concrete descriptions of theprocess steps needed to facilitate analysis of data [9] to suggestions on how toorganize work [10]. One aspect of becoming a data driven organization is theacceptance and utilization of abstractions and inferences made from the dataprovided both by the explicit feedback-loop and other data relevant to the ser-vice provided by the organization. Data science and data mining is the study ofhow to, from data, create such abstractions which typically involve the processof searching for patterns or regularities in data and then describing these regu-larities through a predictive model. Predictive models have been put into use byorganizations more frequently in recent years, and is one of the reasons for theincreased interest in the area of model interpretability. For a good overview ofthis area the reader is encouraged to read [7]. In this paper we are interested inthe interpretability of inductive models and how this feature fit into the conceptof data driven organizations.
Fig. 1. A few examples for creating a feedback loop
The rest of the paper is structured as follows: first we will look into the life-cycles of inductive models in data driven organizations, then we will look into therole of interpretability for inductive models. We will then present our use-caseand its problems then present a data driven framework which addresses theseproblems. Finally, we finish off the paper with a discussion about the proposedframework.

On Data Driven Organizations and the Necessity of Interpretable Models 123
2 Life Cycle of Inductive Models in Data DrivenOrganizations
One of the most commonly referenced process for doing data mining is theCRoss-Industry Standard Process for Data Mining (CRISP-DM) [9]. CRISP-DMdivides the data mining process into six different phases. The phases are: busi-ness understanding, data understanding, data preparation, modelling, (model)evaluation, and (model) deployment. Business understanding include the majorsteps of understanding the business objectives for initializing the data miningeffort and converting this knowledge into a data mining problem and designing aplan to reach the business objectives. Data understanding, data preparation andmodelling are all phases which are instrumental to the specific data mining task.Model evaluation are important as this step checks whether or not the businessobjectives are fulfilled by the inductive model. The next step is to proceed intothe deployment phase, if the objectives are fulfilled. CRISP-DM does not touchupon how work should or could be organized to facilitate the suggested processphases. One can also argue that CRISP-DM put very limited emphasis on thesteps after deployment.
Traditionally organizations have been organized in a hierarchical fashion,where different parallel organizations have had different functions, be it researchand development, production, aftermarket, customer relations etc. Still this wayof organizing work is common. Difficulties which have been identified with sucha structure is that such organizations can be slow to react upon changes in itsenvironment, and that cross functional work can be hindered [1]. This has led tothe advent of organizations which focus on the process or in values streams tomake them explicit and assign the responsibility of certain parts of the processto certain parts in the functional organization [3].
In their article [6], which focus on humans working in data driven orga-nizations, and the impact this has on their working environment. The articleinvestigates two ridesharing organizations, Uber and Lyft, in which the humanjobs are assigned and evaluated by algorithms in a data driven framework. BothLyft and Uber allow for few managers to, via algorithms manage thousands ofdrivers worldwide. In both companies the drivers log in to an application, typ-ically on a mobile device, to signal that they are ready to receive jobs. Exactlyhow the algorithm matches vehicles and customers is secret in both cases butproximity is one of the factors.
Active drivers have a limited time (15 s in case of Uber) to accept a fare ornot. Areas with many customers and few vehicles are signaled in the app, toencouraged drivers to go to this areas, as incentive drivers will receive a highercompensation (pay) for these fares. The drivers can be judged by their customersand the driver can also rate the passengers. The main feedback loop into the datadriven system is the ratings and for drivers the percentage of accepted drivesw.r.t. offered fares. The drivers also get payment promotions (each hour) if theyare active for longer periods. All these variables can cause drivers, who have agood understanding of how the algorithm works to, for example, park betweentwo other uber-cars while having lunch to make sure that they are still online

124 T. Lindgren
but have a small risk of actually receiving a fare. Yet another consequence isthat some drivers who don’t want to take customers from a certain area turnoff their application while passing through that area, to avoid having to pass ona fare.
The main findings in the study indicate that drivers were to some extentfrustrated by the lack of transparency of why they were offered some fares eventhough they were not the closest, or being judged when they passed up fare eventhough they had a good reason for it. The authors of the study suggest thatimproving the transparency of the algorithm most probably would increase theacceptance and trust of the fare assignments, but also might come at the costthat more drivers will “know” how to exploit the algorithm.
Another type of data driven management is NPM, this has received criticismfor just creating more bureaucracy and not have the good effects on steering theorganization which was the original idea. Hoggett [4] provide one description ofthis problem:
“Excessive formalization has proved to be organizationally dysfunctional,creating new layers of bureaucracy engaged in contract specification and moni-toring, quality control, inspection, audit and review and diverting the energiesof professional staff away from service and program delivery into a regime ofform-filling, report writing and procedure following which is arguably even moreextensive than that which existed during the former bureaucratic era.”
The above statement gives a good starting point to reflect on the roots ofNPM which has been inspired by methods used in manufacturing industry forimproving quality. The public sector and other organizations which are conduct-ing more abstract and creative work might not readily adhere to the criteria’sneeded to successfully become data driven, as the tasks are not easily measured,and hence a good feedback loop is hard to envisage. Below follows yet anotherproblem of NPM:
“It might sound paradoxical, but stressed and de-motivated, ‘unable’ and/or‘unwilling’ employees fit quite well into the ideological framework of NPM. Suchaspects underline the necessity of more policies and procedures, of more system-atic performance measurement and appraisal, of more monitoring and advising,of more ‘leadership’ and ‘motivation’ - for the whole arsenal of managerial con-cepts and methods.” in [5].
The two data driven organizations from the former paper, Uber and Lyft,can ignore the problem above as their workers are not employed by them andhence they can skip the motivation part and fire them (or, rather, ban themfrom using their app) if they do not follow their minimum criteria.
We conclude this section with a summary: it exists a lot of driving forces fororganizations to become data driven, efficiency being one of the more importantones. As we have noted by the anecdotal NPM-quotations above, not all taskswithin an organization can be easily transform into a data driven tasks. We willelaborate more upon which criterions are needed and/or sufficient for a successfuldata driven tasks creation in later sections.

On Data Driven Organizations and the Necessity of Interpretable Models 125
3 Interpretability of Inductive Models
Interpretability of inductive models has recently attracted more attention, theremight be many reasons for this, but one of the most important reasons is thatthe (actual or planned) usage of inductive models start to become more commonin organizations. For each organization this can pose new opportunities andraise new questions, as we have seen earlier when models or algorithms manageworkers it can be seen as both cold and in-humane, but it can also be seen asan opportunity as all workers is treated equal.
In his [7] overview paper of the area of interpretability he identifies thatthere is not clear technical definition for interpretability at the moment andthat different researchers do put emphasis on different properties and aspectsrelated to interpretability, be it: trust, causality, transferability, fair and ethicaldecisions. Demand for interpretability can come from the users of the model orby regulatory agencies for example General Data Protection Regulation (GDPR)in the EU, which include, the right for citizens to contest automatic profilingfrom algorithms. This implies that European citizens have the right to knowand understand algorithmic decisions, which in turn, means that an explanationmust be provided for a particular case together with a prediction of a model.
It might then not come as a surprise that new methods for facilitating inter-pretability for particular predictions have been devised lately. These methodstypically produce an explanation for a particular classification by introducinga local explanation model as a mediator between the instance and the globalmodel. One such method is Local Interpretable Model-agnostic Explanations(LIME) [8]. One way LIME present its explanation is by showing the support infavor of and against the prediction.
One example of a method for facilitating interpretability is described in thepaper [11], here the authors aim not only to explain why a certain prediction isgiven on a certain instance, but they also investigate how (with minimal effort)to change the prediction output via features which can be adjusted. This typeof explanation could be very important and one that we often (as humans) takefor granted. For example, let’s imagine that you go to the doctor and get adiagnosis that you will have a heart attack within six months, then you are toldto go home. This information is not sufficient to be helpful for you. After givensuch a diagnosis you want to receive advice on the changeable features, i.e. factoryou can affect to avoid being in the class of patients that you were diagnosed as.
As mentioned already one of the reasons of creating interpretable models isfor establishing trust in the models, here the assumption is that if the modelsare understood then trust will emerge. But is the interpretability of models nec-essary? If we have a model that behaves as an oracle in that it always makes thecorrect prediction, do we then need an explanation for the predictions? I wouldbelieve that most humans eventually would accept the models predictions with-out needing further explanation due to the oracles previous results in successfulpredictions.

126 T. Lindgren
4 Use-Case and Proposed Framework
Here we will describe the use-case we have studied and then present a data drivenframework for supporting the use-case.
4.1 Use-Case
In this case study we will look at the situation at a European based globallypresent manufacturer, OEM, of commercial vehicles. We will in this use-casefocus on the maintenance offer by the OEM and the demands on it. Traditionallymanufacturers of trucks and buses have sold their vehicles to fleet owners andalso offered maintenance contracts for these vehicles. This is still the case, butthere are plans to provide transportation (tonnage/km) or bus (operation/hours)as a service. By using such a service, the fleet owner shifts into a fleet operator. Inthis new business model, the fleet owner has to pay a fee for the transportationservice and is in return guaranteed an uptime percentage, i.e. the time when thetransportation service can be utilized. Downtime, when the transport service isunavailable, can be divided into planned downtime, and un-planned downtime.Minimizing or eliminating the un-planned downtime, i.e. typically when a vehiclehas broken down, is desirable. Planned downtime could for example be whenmaintenance is conducted on the vehicle, if this can be planned in a flexible way,it can often be aligned with a time when the fleet operator does not need thetransport service.
Transport as a service puts high demands on knowing the actual health statusof a particular vehicle to avoid un-planned downtime. With the aim of provid-ing more uptime and only planned downtime, the OEMs maintenance programhave in the last couple of years gone from a fixed interval (km and/or hours)based maintenance program to a data driven maintenance program. In the newprogram, the models for expressing the maintenance needs for particular com-ponents are both induced by machine learning algorithms and created manuallyby experts. While the maintenance models created by experts do not needed tobe interpreted (at least not by the experts them self), there is a need to simu-late the consequences of their manual crafted rules, to be able to validate themon a bigger population. The maintenance experts have a production tool whichsupports creation of expert rules and the functionality to simulate these ruleson the current population before putting them into production.
The models produced by machine learning methods are typically validatedby both their performance metrics and by manual inspection of the models. Thelatter demand has put restrictions on the type of models which can be utilized,typically they should be transparent, i.e. not black boxes, and not too complex.These demands for simple models put limitations on the performance of themachine learning methods. As we have discussed earlier the feedback loops indata driven organizations is essential for these types of organizations to workproperly. At the OEM the main feedback loop was designed to quickly be ableto respond to quality issues w.r.t. sub-series of components etc. But this feedbackloop has not yet been modified to align with the new maintenance program.

On Data Driven Organizations and the Necessity of Interpretable Models 127
The transport service offer that the OEM makes towards potential customersis typically made by experienced sales personnel who together with the potentialcustomer investigate the needs of transport service provided by the OEM. If thecustomer already owns a vehicle from the OEM then the data from previousoperations can be used, for specifying which new product that would suit thecustomer best and also estimate the cost for the transport service offered tothe customer. If the customer changes utilization of the transport service, thecustomer and the OEM needs to re-negotiate the terms of the customer offer.
4.2 Proposed Framework
Given the use-case we will now present a suggestion for a framework that willsupport data driven ambition for the maintenance offer, the framework is shownin Fig. 2. The framework is initialized to the left in the figure with the alignmentof product development with model development. Each model is created for aspecific component and should be able to with a high certainty predict when thecomponent needs maintenance to avoid failure. If the model predicts need formaintenance (maintenance decision) before failure, the model is working correct,but can waste resources, feedback of changed components needs to be analyzedto make sure that components are not changed prematurely. If the model fails topredict correctly and a failure of the component do happen, its cause should beanalyzed (analysis). The outcome of analysis could be: the model is valid, thereis a need to set off the alarm to alert humans that the models needs attention.This might trigger a number of actions, one being the need for analyzing theproblematic cases together with the model to understand the problem and refinethe model by these findings to cope with similar cases in the future. Havingpresented the general framework, we investigate how we can improve the OEMsservice offer using it, the first step is to integrate the creation of a data drivenmodels as a natural step in the product development process (left in the figure),this is not the case at the OEM now. There have been efforts in this directionfor certain components by individual maintenance experts and keen developmentengineers working together, but this work needs to be a mandatory step in theproduct development process. Questions like: Who will have responsibility of themaintenance prediction model over time? Who will create data driven models?When should Machine learning or other modelling techniques be used? Needs tobe answered.
My suggestion is that for each new product development effort at the OEM,create a team of maintenance experts, data science experts and the developmentengineers. The first task of the team is to assess the impact of component fail-ure from different viewpoints, be it road safety, fulfillment of transport service,environmental aspects, etc. These viewpoints would then serve as input into howmuch time, effort and money the team can use for creating prediction models.The most expensive model being a physical model hand-crafted by senior engi-neers and should only be constructed for very critical components. Data drivenmodels are cheaper to create but they rely on historical data of failures. If datadriven models are chosen, a plan for collecting data from test, be it from rigs, to

128 T. Lindgren
Fig. 2. A schematic view of the suggested framework
simulate usage, and later when the component is out in field test before release tocustomers, must be devised. Finally, if the model need not be of highest fidelity,the maintenance experts together with engineers will express their knowledgeby formulating rules for component maintenance in an expert system. Inter-pretability of the data driven models created might show interesting patternsgiven the sensor inputs, i.e. engineers might gain insight to why certain types offailure occur. This is one of the major reasons of supporting interpretability atthis stage. But this need not affect the performance of the model, instead modelagnostic methods for interpretability should be preferred.
Once the predictive maintenance models have been put into production, theyneed to be evaluated and monitored in a smart way (the middle and right part ofthe figure). Typically, new models just put into production needs to be monitoredmore closely, compared to well-known models with known performance. Butalso these well-known models that seem to work well needs to be kept undersurveillance. The question is how often and in what way to monitor the models,one obvious way is to create a feedback loop, one of the keys to becoming datadriven. The feedback in this case should, ideally, contain a measure of how closeto failure the component was and the prediction and confidence of the model.Here confidence is to be understood in the broad sense depending on the type ofmodel we are dealing with. Given the type of component we are talking about,if it is replaced, as for example oil, belts etc. these can be analyzed to identifyits remaining useful life, either directly by technicians or sent to experts. If thecomponent involves interaction with the vehicle but do not render in objectswhich can be sent for analysis, one can use mediators or special instruments.These types of maintenance could for example be lubrication of parts, where amechanic can do an ocular inspection and then report the assessment as feedback.In this case a picture could act as a mediator or we get a score could be given
On Data Driven Organizations and the Necessity of Interpretable Models 129
by the mechanic. An example of special instrument is the instrument used tomeasure the health status of batteries or an oil quality test equipment.
The best feedback loops should (1) be non-intrusive, (2) require no extrawork effort and (3) should be transparent, i.e. the motive of the feedback loopshould be clear for the organization, one motivation for this is to avoid thefrustration that was common with drivers from the study by the ride-sharingcompanies presented earlier. The first two criteria’s can be motivated from ourshort overview of the problems with NPM. If there is need for much paperworkor other manual processes or there is no easy way of measuring the outcome,one should consider abandoning this feedback loop, as it will not probably besuccessful over time.
These criterions can be for example applied to the battery health instrumentused by the mechanics in the OEMs workshops today. This special instrumentgives an answer to the batteries health status, and the mechanic needs to writethe results into a (digital) work order report. It scores fairly high on point 3above, but low on the other two points. If we updated the special instrumentto work in alignment with the work order report (the feedback loop), wherethe value is feed into the work order report once the measurement is done, itwould the score high on all three points, which is a situation to strive for. Dueto the diversity of components needing predictions, feedback loops will haveto be created in many creative ways to be able to evaluate and monitor thepredictive models. The feedback loops serve two major roles, one is to verifythat the models are valid, and also to adjust and refine the model as we gathermore data. Both of these tasks can be automated and decision makers can putthresholds on alarms when human attention is needed, for example if models nolonger can be considered valid.
As the cost for realizing feedback loops varies depending on different compo-nents, establishing a good feedback policy would require a cost analysis togetherwith the already mentioned analysis of criticalness of component and hencemodel. Once such a base policy has been established, it dictates how often feed-back is requested for a given component. The next question is how to best selectwhich cases to sample? Random sampling is not a bad idea, but a fraction ofthe sampling can also be directed towards cases where the model is uncertain.This sampling policy would be mostly beneficial when the model is new andexposure to new cases are more frequent and needed. In general interpretabilityof models is not of big importance, instead other measures of model performanceare needed, be it accuracy or the like. In special cases when the models no longeris valid or if experts need to understand the models for other reason, it wouldbe sufficient to use model agnostic techniques to interpret the models.
The feedback loop could also change the transport service offer to becomemore dynamic, so given how and under which circumstances the customer utilizethe transport service, the price is adjusted in real time.
130 T. Lindgren
5 Conclusions
It this paper a use-case has been investigated for a company that is in thetransportation manufacturing industry which is an industry in transformationfrom only selling hardware to selling different levels of services together with thehardware. The focus has been on the maintenance program, how the program canbecome data driven, and the implications both on the organization and on thebusiness. A framework has been proposed for facilitating the data driven businessmodel w.r.t. aspects such as: Need for interpretability of models; How to createthe necessary feedback loops; Which type of predictive models to use and when.In our framework we also try to draw lessons from what’s been done earlier,like in the presented ride-sharing case and examples from NPM to avoid pitfallswhich a data driven organization are facing. This framework will hopefully serveas an inspirational starting point for other organizations that are facing similarbusiness challenges as the OEM.
References
1. Anderson, C., Brown, C.E.: The functions and dysfunctions of hierarchy. Res.Organ. Behav. 30, 55–89 (2010)
2. Diefenbach, T.: New public management in public sector organizations: the darksides of managerialistic enlightenment. Public Adm. 87(4), 892–909 (2009)
3. Hammer, M.: The process audit. Harvard Bus. Rev. 85, 111–119, 122 (2007)4. Hoggett, P.: New modes of control in the public service. Public Adm. 74(1), 9–32
(1996)5. Karp, T.: Unpacking the mysteries of change: mental modelling. J. Change Manage.
5(1), 87–96 (2005)6. Lee, M.K., Kusbit, D., Metsky, E., Dabbish, L.: Working with machines: the impact
of algorithmic and data-driven management on human workers. In: Proceedings ofthe 33rd Annual ACM Conference on Human Factors in Computing Systems, CHI2015, pp. 1603–1612. ACM, New York (2015)
7. Lipton, Z.C.: The mythos of model interpretability. CoRR, abs/1606.03490 (2016)8. Ribeiro, M.T., Singh, S., Guestrin, C.: “why should i trust you?”: explaining the
predictions of any classifier. In: Proceedings of the 22nd ACM SIGKDD Inter-national Conference on Knowledge Discovery and Data Mining, KDD 2016, pp.1135–1144. ACM, New York (2016)
9. Shearer, C.: The CRISP-DM model: the new blueprint for data mining. J. DataWarehous. 5(4), 13–22 (2000)
10. Srinivasan, V.: The Intelligent Enterprise in the Era of Big Data, 1st edn., Wiley(2017)
11. Tolomei, G., Silvestri, F., Haines, A., Lalmas, M.: Interpretable predictions oftree-based ensembles via actionable feature tweaking. In: Proceedings of the 23rdACM SIGKDD International Conference on Knowledge Discovery and Data Min-ing, KDD 2017, pp. 465–474. ACM, New York (2017)

A Multi-factor Authentication Methodfor Security of Online Examinations
Abrar Ullah1(&), Hannan Xiao2, and Trevor Barker2
1 School of Computing and Management, Cardiff Metropolitan University,Cardiff, UK
[email protected] School of Computer Science, University of Hertfordshire, Hatfield, UK
{H.xiao,T.1.barker}@herts.ac.uk
Abstract. Security of online examinations is the key to success of remoteonline learning. However, it faces many conventional and non-conventionalsecurity threats. Impersonation and abetting are rising non-conventional securitythreats, when a student invites a third party to impersonate or abet in a remoteexam. This work proposed dynamic profile questions authentication to identifythat the person taking an online test is the same who completed the course work.This is combined with remote proctoring to prevent students from taking helpfrom a third party during exam. This research simulated impersonation andabetting attacks in remote online course and laboratory based control simulationto analyse the impact of dynamic profile questions and proctoring. The studyalso evaluated effectiveness of the proposed method. The findings indicate thatdynamic profile questions are highly effective. The security analysis shows thatimpersonation attack was not successful.
Keywords: Security � Authentication � Online examination
1 Introduction
Security is an important non-functional requirement for design and implementation ofweb-based applications. According to Schechter [1], it is a process of securing com-puter hardware, software, and networks against misuse and harm. A harm or misuse is aloss of desired system properties including confidentially, integrity and availability.The application of computer security has a wider scope, including hardware, softwareand network security. The focus of this research is application-level security, whichfalls into the information security context. Online summative assessment faces anumber conventional and non-conventional security threats. The conventional threatsinclude common web application threats. These are prevented and mitigated using thesame approaches adopted for many web applications. However, the non-conventionalthreats are beyond the scope of many conventional security methods. These threatsinclude collusion and impersonation during online assessments. This research proposesthe use of dynamic profile questions and remote proctoring to prevent against imper-sonation and abetting in a remote online examination. This paper reports an empirical
© ICST Institute for Computer Sciences, Social Informatics and Telecommunications Engineering 2019Published by Springer Nature Switzerland AG 2019. All Rights ReservedA.-S. K. Pathan et al. (Eds.): SGIoT 2018, LNICST 256, pp. 131–138, 2019.https://doi.org/10.1007/978-3-030-05928-6_13

study using an online course and laboratory based session where participants simulatedan impersonation and abetting attack in presence of a live proctor.
2 Background
Security is protection of assets. According to Ullah [2], asset is anything that has valuefor an organisation. Tajuddin [3] states that information security is protection ofvaluable “information”. According to ISO/IEC 27002 [4], it is the protection ofinformation from a wide range of threats that ensures business continuity and min-imises business risks. The concept of business can be applied in any commercial ornon-commercial context, such as online learning. The focus and research context of thiswork relates to summative assessment or remote online examinations. The growth inthe use of online learning in higher education has been documented and reported inmany studies [5–9]. It has attracted significant research focus on developing anddelivering secure, efficient and effective learning environments. However, there havebeen many concerns about the security of online learning environments. Withincreasing demand, there are equally increasing concerns for the integrity of thesummative assessment also known as online examinations [10].
The work is part of an ongoing research on security and usability of authenticationby challenge questions. The authors conducted multiple empirical studies to analyseusability and security threats of text-based, image-based and dynamic profile questionsto mitigate impersonation and abetting attacks [11, 12]. In these attacks, a studentinvites a third party to impersonate or abet in an online examination scenario. In theprevious studies, the author proposed and evaluated a text-based challenge questionsapproach [13]. However, these questions were reported with usability and securityissues [14]. In a similar vein, the use of image-based questions revealed improvedusability [15], however, these questions were not sufficient to mitigate impersonationand abetting. In order to address the security issues, the authors proposed dynamicprofile questions [7]. These questions are created in the background when a studentperforms learning activities. Individual student profile is built during the learningprocess. To access an online assessment, the student is presented with a subset ofquestions randomly extracted from his/her profile. In a recent study, the authors con-ducted a focus group study [6] with online programme tutors who recommended theuse of dynamic profile questions [7], remote proctoring [16], and a secure browser tomitigate impersonation and abetting attacks.
The focus group study presented in an earlier study indicates that the use ofdynamic profile questions with a secure browser and proctoring (ProctorU) [16] canpositively influence collusion attacks. As described above, the dynamic profile ques-tions are created non-intrusively and non-distractingly in the background when a stu-dent performs learning activities [7]. Using this method, a student’s profile is built andconsolidated in the background during the learning process. Students are not aware ofwhich questions will be asked for authentication. This attempts to verify that the personwho is taking the online test is the same individual who completed the coursework. Theuse of a secure browser and proctoring monitors an online examination, and attempts toensure that a student is not taking help from the Internet or an abettor sitting close by or
132 A. Ullah et al.
remotely. However, a student may still circumvent the system and share access cre-dentials with an impersonator before the test session. Furthermore, usability attributessuch as effectiveness is also important for secure implementation of authenticationmethods. The effectiveness is an important attribute defined by the InternationalOrganisation for Standards (ISO) which contributes to the usability [17]. In the contextof this study, effectiveness means that students were able to answer dynamic profilequestions correctly with a low error rate. This study will investigate the following:
– The effectiveness of dynamic profile questions in a proctored examination.– Whether a student can share information about learning activities and experience
with a third party impersonator using email, instant messaging, phone, or face-to-face meeting before an online test session, and how successful the impersonator isin answering the dynamic profile questions.
3 Research Methodology
This study was conducted using a real online course followed by a controlled laboratory-based simulation session. The usability test and risk-based security assessment methodswere adopted to evaluate the usability and security of dynamic profile questions. Theusability test method is a usability inspection, which tends to focus on the interactionbetween humans and computers [18]. Using this method, the representative users – i.e.students – work on typical system tasks on an online course and examination, whichimplements dynamic profile questions in a proctored test. In this study, the system taskswere simulated in a laboratory-based environment. The usability evaluation scale wasused to translate the effectiveness analysis. This scale describes the usability of productsin the 90 s as exceptional, 80 s as good, 70 s as acceptable, and anything below 70indicates usability issues that are cause for concern [19].
The risk-based security assessment approach provides rapid quantification ofsecurity level risks associated with processes [20]. This method focuses on the test offeatures and functions of artefacts based on the risk of their failure using abuse casescenarios [21]. An abuse case scenario was simulated to investigate impersonationattacks, when dynamic profile questions are implemented for authentication of studentsin a proctored examination.
This study was conducted in a remote online learning environment and face-to-facesessions involving on-campus students. It was organised into two phases describedbelow i.e. Phase I – online course and Phase II – abuse case simulation.
3.1 Phase I – Online Course and Student Pairing
In Phase I of the study, an online course was conducted to provide learning opportu-nities for students and facilitate the collusion abuse case scenario. The structure ofPhase-I is described below.
A Multi-factor Authentication Method for Security of Online Examinations 133

– PHP & MySQL Course Design: A ‘PHP and MySQL’ online course wasorganised with three weekly modules, which included lessons, forum discussions,assignments, quizzes, grades and student reflection at the end of each week. Thecourse was set up and deployed in the MOODLE Learning Management System(LMS) on a remote web server accessible on the Internet. Students were required toinvest 10 h weekly learning effort for 15 days in a span of three weeks.
– Participants Recruitment: On-campus students from the School of ComputerScience, University of Hertfordshire, were recruited to participate in the study andthe online course. The course was advertised on the StudyNet. To motivate studentsthe course was offered free of charge. Participants were selected on the basis thatthey knew each other already. They were also required to have basic programmingknowledge in order to enrol. A total of 12 students were enrolled and completed thethree-week course. There were 7 (58%) male and 5 (42%) female participants. Theywere also enrolled in BSc/MSc programmes which were helpful in setting up face-to-face meetings to present the study structure and research objectives, and performthe abuse case scenario in a laboratory.
– Presentation and Students Registration: Participants were required to attend aface-to-face 15 min presentation on the course structure and research objectives,before registration. They were also provided detailed information on an imper-sonation abuse case scenario. After the presentation, all participants signed theconsent forms mandated by the University ethics regulations.
– Pairing up of Participants for Impersonation: In order to perform the imper-sonation, each participant was paired up with a fellow student (classmate), whereboth participants confirmed that they were familiar already. All participants con-sented to share learning experience and activities with their pairs. They wereinformed about the format of an impersonation abuse case scenario, which wasconducted towards the end of the course.
– Online Course Work: The instructor-led course was conducted over a period ofthree weeks. Participants were required to submit their weekly assignments in orderto access their weekly quizzes. Each assignment was based on the weekly coursecontent, which ensured participants’ engagement. It was mandatory for each par-ticipant to take their weekly quizzes and provide a ‘reflection feedback’ towards theend of each week.
– Creating Dynamic Profile Questions: Dynamic profile questions were createdmanually during the course for each individual student and stored in a MicrosoftWord file in a secure location. These questions were created on a daily basis foreach participant after access to course content including lessons, assignment sub-mission, assignment grades, quiz completion, feedback and reflection, and forumdiscussion. This helped with creating and consolidating a profile for each partici-pant. A total of 28 dynamic profile questions were created for each participant.Dynamic profile questions created during the coursework were not shown to anyparticipant during the online course until the abuse case scenario described in thefollowing section.
134 A. Ullah et al.

3.2 Phase II – Impersonation Abuse Case Scenario
This phase was performed towards the end of three week online course described inPhase I above. This study simulated the following impersonation abuse case scenario:
1. Participants were paired up before registration as described above in Phase I.2. Dynamic profile questions for each participant were manually created and stored in
their respective profiles. These questions were extracted from student activities on adaily basis, as described above in Phase I.
3. Participants were asked to share their learning experience, learning activities, andcues with their pairs during the course. They were allowed to share this informationusing any communication means, e.g. email, phone, WhatsApp, Skype, face-to-facemeeting, Facebook, Facetime, SMS, printed paper, etc. They were required tomemorise the shared information for simulating impersonation in a proctoredexamination.
4. At the end of week three, participants attended a laboratory-based simulationsession.
5. Participants were informed about the format of simulating the laboratory-basedproctored session. They were required to answer the questionnaire from memoryand were not allowed to use an electronic or printed copy of the information sharedby their pairs for impersonation. Also, they were not allowed to communicate orshare information when answering the two questionnaires in the following order:(a) Questionnaire 1 (Effectiveness): Participants were asked to answer paper-
based Questionnaire 1 with a total of 10 dynamic profile questions randomlyextracted from their own profiles created during the course work in Phase I.
(b) Questionnaire 2 (Impersonation): After answering Questionnaire 1, the par-ticipants were asked to answer a paper-based Questionnaire 2 with a total of5 dynamic profile questions randomly extracted from their pair’s profile tosimulate impersonation.
4 Results
This section aims to evaluate the usability of dynamic profile questions in the presenceof a live proctor. At the end of week three, 12 participants answered 120 dynamicprofile questions which were created during the course. Results of the abuse casescenario is also analysed to determine the outcome of an impersonation attack.
4.1 Effectiveness
The effectiveness is considered to be the degree of accuracy of participants’ responses.It is an important usability factor which indicates a degree of completeness with whichusers achieve a specified task in a certain context [22]. In the context of this study, itmeans that participants were able to provide correct answers to their dynamic profilequestions correctly with a low error rate. It was analysed on the data collected fromparticipants’ answers on paper-based questionnaire 1 in a laboratory-based session.
A Multi-factor Authentication Method for Security of Online Examinations 135

Table 1 column 2 shows the mean of correct answers to dynamic profile questions inorder to analyse effectiveness. The findings show 114 (95%) correct answers, whichindicates positive outcome.
According to the usability scale and letter grades (70%–79% acceptable, 80%–89%good, more than 90% exceptional) described by [17], 95% correct answers is anexceptional effectiveness.
4.2 Impersonation in Presence of Live Proctoring
The abuse case scenario was performed to decide if dynamic profile questions canmitigate impersonation in a proctored exam. In a laboratory-based session, participantsanswered paper-based Questionnaire 2 consisting of five dynamic profile questions onbehalf of their pairs. They memorised the shared information during pairing andanswered the questionnaire from memory. These questions implemented five multiplechoice options and the probability of a correct answer to a random guessing would be1/5th or 20%. In the impersonation abuse case scenario, participants answered 26 (22%)of the questions correctly on behalf of their pairs. These questions were not shown toany participant during the online course and presented at the final stage of the study toevaluate their ability to circumvent the dynamic profile question approach and imper-sonate students in the presence of a live proctor. The findings in Table 1 column 3 showthat the sharing of information associated with individuals’ learning experience led tocorrect answers just above 1/5th of the total questions.
To determine the significance of difference in the means of correct answers todynamic profile questions by a student and a third party impersonator, a one-wayANOVA was performed on the data shown in Table 1 columns 2 and 3, which shows asignificant difference F = 596; p = 0.00 (p < 0.01); eta-squared ☐2 = 0.97..
Table 1. Usability and security analysis
Effectiveness Impersonation
1 10 (100%) 2 (20%)2 10 (100%) 1 (10%)3 9 (90%) 3 (30%)4 9 (90%) 3 (30%)5 10 (100%) 2 (20%)6 9 (90%) 1 (10%)7 10 (100%) 2 (20%)8 9 (90%) 2 (20%)9 9 (90%) 3 (30%)10 9 (90%) 2 (20%)11 10 (100%) 2 (20%)12 10 (100%) 3 (30%)Total 114 (95%) 26 (22%)
136 A. Ullah et al.
An ANOVA test on a small sample size may not produce significant values due toinsufficient power. However, findings of the test here yielded significant value.
In a practical situation, this may fail the authentication and alert the proctor orinvigilator. This shows that students were able to answer their own challenge questionspresented in the previous section; however, collusion between students and imper-sonators was not successful.
5 Conclusion
This study examined the use of dynamic profile questions in a proctored examination.Participants shared information using mobile phones, emails, chat, and face-to-facemeetings at their own convenience before an online examination in pairs. Theymemorised the shared information and answered the questionnaire on dynamic profilequestions on behalf of their pairs in the presence of a proctor. The results showed thatdynamic profile questions decreases impersonation attacks when implemented with liveproctoring. Participants’ sharing helped the impersonators to provide 26 (22%) correctanswers in the impersonation attack, which is just above 20%, which is the percentageof correct answers by chance. There was a significant difference (p < 0.01) in thecorrect answers between a student (114: 95%) and an impersonator (26: 22%). Thisindicates that, dynamic profile questions extracted from course content and submissionsmakes sharing harder for students and could be implemented for secure authentication.However, future work is warranted on a larger sample size.
References
1. Schechter, S.E.: Computer Security Strength & Risk: A Quantitative Approach. HarvardUniversity Cambridge, Massachusetts, Massachusetts (2004)
2. Ullah, A.: Security and Usability of Authentication by Challenge Questions in OnlineExamination. University of Hertfordshire, Hatfield (2017)
3. Tajuddin, S., Olphert, W., Doherty, N.: Relationship between stakeholders’ informationvalue perception and information security behaviour. In: International Conference onIntegrated Information (IC-ININFO 2014): Proceedings of the 4th International Conferenceon Integrated Information 2015. AIP Publishing (2015)
4. Sahibudin, S., Sharifi, M., Ayat, M.: Combining ITIL, COBIT and ISO/IEC 27002 in orderto design a comprehensive IT framework in organizations. In: Modeling & Simulation, 2008AICMS 2008 Second Asia International Conference on 2008. IEEE (2008)
5. Buzzetto-More, N.: Student perceptions of various e-learning components Interdisciplinary.J. E-Learn. Learn. Objects 4(1), 113–135 (2008)
6. Ullah, A., Barker, T., Xiao, H.: A focus group study: usability and security of challengequestion authentication in online examinations. In: International Conference on InformationTechnology and Applications (ICITA). Academic Alliance International, Sydney Australia(2017)
7. Ullah, A., Xiao, H., Barker, T.: A dynamic profile questions approach to mitigateimpersonation in online examinations. J. Grid Comput. (Knowl. Discov.), 1–15 (2018)
A Multi-factor Authentication Method for Security of Online Examinations 137

8. Allen, I.E., Seaman, J.: Online Nation Five Years of Growth in Online learning Needham.Sloan Consortium, Mass (2007)
9. Koohang, A., Riley, L., Smith, T., Schreurs, J.: E-learning and constructivism: from theoryto application Interdisciplinary. J. E-Learn. Learn. Objects 5(1), 91–109 (2009)
10. Watson, G., Sottile, J.: Cheating in the digital age: do students cheat more in online courses?Online J. Distance Learn. Adm. 13(1), n1 (2010)
11. Ullah, A., Xiao, H., Barker, T.: A dynamic profile questions approach to mitigateimpersonation in online examinations. J. Grid Comput. 1–15 (2018)
12. Ullah, A., Xiao, H., Barker, T.: A study into the usability and security implications of textand image based challenge questions in the context of online examination. Educ. Inf.Technol. 1–27 (2018)
13. Ullah, A., Xiao, H., Lilley, M.: Profile based student authentication in online examination.In: International Conference on Information Society 2012. IEEE, London (2012)
14. Ullah, A., Xiao, H., Barker, T., Lilley, M.: Evaluating security and usability of profile basedchallenge questions authentication in online examinations. J. Internet Serv. Appl. 5(1), 2(2014)
15. Ullah, A., Xiao, H., Barker, T., Lilley, M.: Graphical and text based challenge questions forsecure and usable authentication in online examinations. In: The 9th InternationalConference for Internet Technology and Secured Transactions (ICITST) 2014. IEEE,London (2014)
16. Mahmood, N.: Remote Proctoring Software Means Students Can Now Take Exams FromHome. Technological News Portal; 2010 [cited 2011 13/07/2011]. http://thetechjournal.com/science/remote-proctoring-software-means-students-can-now-take-exams-from-home.xhtml
17. Iso9241-11. Ergonomic Requirements for Office Work with Visual Dispaly Terminals, Part11: Guidance on Usability. ISO 9241-11. Geneva1998)
18. Corry, M.D., Frick, T.W., Hansen, L.: User-centered design and usability testing of a website: an illustrative case study. Educ. Technol. Res. Dev. 45(4), 65–76 (1997)
19. Bangor, A., Kortum, P., Miller, J.: Determining what individual SUS scores mean: adding anadjective rating scale. J. Usability Stud. 4(3), 114–123 (2009)
20. Ni, M., Mccalley, J.D., Vittal, V., Tayyib, T.: Online risk-based security assessment. IEEETrans. Power Syst. 18(1), 258–265 (2003)
21. Mcgraw, G.: Software security & privacy. IEEE 2(2), 80–83 (2004)22. Seffah, A., Kececi, N., Donyaee, M.: QUIM: a framework for quantifying usability metrics
in software quality models. In: Quality Software, 2001 Proceedings Second Asia-PacificConference on 2001. IEEE (2001)
138 A. Ullah et al.
Evaluation Metrics for Big DataProject Management
Munir Ahmad Saeed and Mohiuddin Ahmed(B)
Canberra Institute of Technology, Canberra, [email protected], [email protected]
Abstract. In this paper, we investigated the current scenario of bigdata project management followed by success criteria. Our research foundthat, the evaluation metrics are generic and no universal metric availablefor the big data projects. Therefore, we have proposed few evaluationmetrics suitable for big data projects.
Keywords: Big data · Project management · Evaluation metrics
1 Introduction
Though project management started in late 1950 but project success startedattracting the imagination of researchers as project management matured in toan independent discipline since 1980s. Success is a subjective in nature and itmay mean different to different people. However, project management profes-sionals and researchers commonly identified project success evaluation metricsas completing a project within triple constraints such as at cost, time and withinspecifications. With the passage of time various other metrics were added to thewish list and most recently projects benefits realization has been included as keyevaluation metrics for project success. Big data projects are inherently softwareprojects and according to Standish Report 2017, the project success in softwaredevelopment is abysmally low. Big data projects are struggling to convince topmanagements of large organizations for the value of resources spent on suchprojects. Therefore it is pertinent to identify evaluation metrics for big dataprojects success. This paper discusses the current state of big data projects andchallenges faced with regard to success and how to measure success of big dataprojects. It also identifies metrics for the evaluation of the success of big dataprojects.
The rest of the paper is organized as follows. Section 2 discusses big dataproject management. Section 3 defines success in big data projects and Sect. 4outlines the evaluation criteria for such projects followed by the proposed met-rics. Section 5 concludes the paper.
c© ICST Institute for Computer Sciences, Social Informatics and Telecommunications Engineering 2019
Published by Springer Nature Switzerland AG 2019. All Rights Reserved
A.-S. K. Pathan et al. (Eds.): SGIoT 2018, LNICST 256, pp. 139–142, 2019.
https://doi.org/10.1007/978-3-030-05928-6_14
140 M. A. Saeed and M. Ahmed
2 Big Data Project Management
The CHAOS report 2017 by the Standish Group points out that nearly $250Billion were invested on IT applications projects in the US alone but the suc-cess rate has been far less than desirable and only 28% of software projects atsmall size companies were completed on time and cost. Which means rest ofthe projects were either cancelled (31%) or massively (53%)will be over budgetby one hundred-ninety times. The report further states that in the US mediumsize organizations fared well with 16% project success rate, whereas larger cor-porations had an abysmal 9% project success rate. However, the report did notexplain whether the organization size has role to play in project success. Bigdata projects being inherently software applications project are expected to suf-fer from similar challenges experienced by mainstream IT applications projects.As according to Informatica (a reputed software development company), eventhe data analytics proof of concepts, being small projects, fail to complete ontime and budget and subsequently these projects were unsuccessful in meet-ing top management expectations. Big data projects need to convince the topmanagement of the utility of projects and currently in companies, where suchprojects are being implemented only 27% executives consider their data projectsare successful because there are only 13% companies where big data projects arein full scale production. It is found that for project success and subsequent orga-nizational change, top management support (TSM) is one of the most importantcritical success factors. Young and Poon [1] argue that TMS is more critical forproject success than other traditional success factors.
Though the mainstream project management is yet to give due attention tobig data projects. Since big data projects are less known, therefore there is a needfor research to identify the factors behind the success/failure. However, Infor-matica has identified some of the factors that contribute to the failure of big dataproof of concepts such as projects failing to align with the strategic objectives ofsponsoring executives, lack of planning and design, scope creep and ignoring datamanagement. According to Informatica, if projects align to top management’sstrategic plans, it guarantees whole hearted support of organization executives.In order for projects to ensure executives’ support, the projects must align tothe organization strategic objectives by creating value to the organization.
3 Success in Project Management
Traditional project management literature identifies the triple constraint or theIron Triangle of cost, time and specifications as project success criteria [2]. How-ever, as the project management became more popular tool for achieving orga-nizational strategic tool, the success criteria also added various other variables.It is argued that trade literature identifies schedule, budget and customer satis-faction, as the measures of project success. Time and budget are already knowncomponents of iron triangle of project success; however, the customer satisfac-tion has been identified equally important project success measure later on [3].
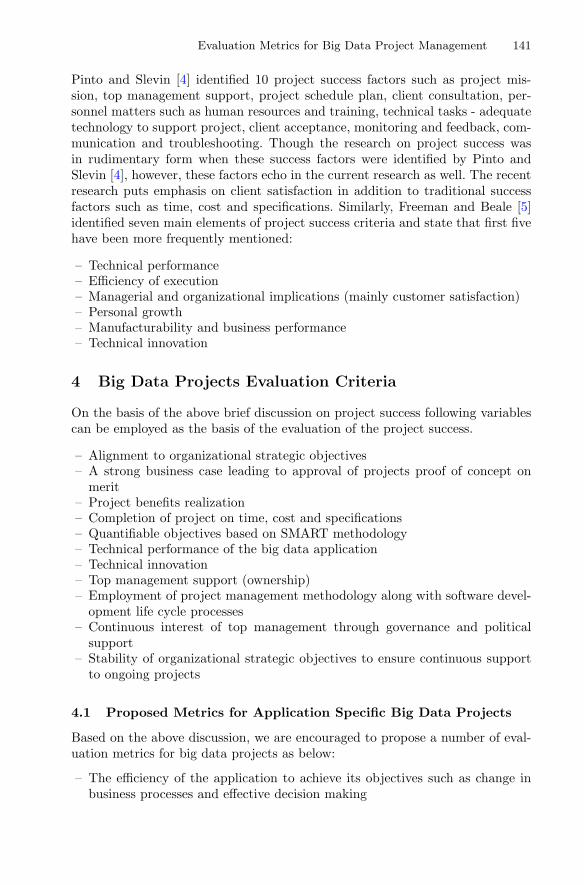
Evaluation Metrics for Big Data Project Management 141
Pinto and Slevin [4] identified 10 project success factors such as project mis-sion, top management support, project schedule plan, client consultation, per-sonnel matters such as human resources and training, technical tasks - adequatetechnology to support project, client acceptance, monitoring and feedback, com-munication and troubleshooting. Though the research on project success wasin rudimentary form when these success factors were identified by Pinto andSlevin [4], however, these factors echo in the current research as well. The recentresearch puts emphasis on client satisfaction in addition to traditional successfactors such as time, cost and specifications. Similarly, Freeman and Beale [5]identified seven main elements of project success criteria and state that first fivehave been more frequently mentioned:
– Technical performance– Efficiency of execution– Managerial and organizational implications (mainly customer satisfaction)– Personal growth– Manufacturability and business performance– Technical innovation
4 Big Data Projects Evaluation Criteria
On the basis of the above brief discussion on project success following variablescan be employed as the basis of the evaluation of the project success.
– Alignment to organizational strategic objectives– A strong business case leading to approval of projects proof of concept on
merit– Project benefits realization– Completion of project on time, cost and specifications– Quantifiable objectives based on SMART methodology– Technical performance of the big data application– Technical innovation– Top management support (ownership)– Employment of project management methodology along with software devel-
opment life cycle processes– Continuous interest of top management through governance and political
support– Stability of organizational strategic objectives to ensure continuous support
to ongoing projects
4.1 Proposed Metrics for Application Specific Big Data Projects
Based on the above discussion, we are encouraged to propose a number of eval-uation metrics for big data projects as below:
– The efficiency of the application to achieve its objectives such as change inbusiness processes and effective decision making
142 M. A. Saeed and M. Ahmed
– Appropriate technology– Completion on time, cost and required scope of functions and features– Effective scope definition and scope change management as Big Data Projects
fail 30% more than IT Project, due to poorly defined scope and uncontrolledscope changes
– Effective Risk and quality management against poor decision making andquality
– Organizational learning and changes as a result of big data applications– Contributing towards the achievement of strategic objectives through benefits
realization– Effective change management of processes as a result of big data application
5 Conclusions
Project success is an old and continuous debate in the mainstream project man-agement literature. Initially the success criteria was based on the iron trianglesof on time, on cost and as per specifications, but later various other variablessuch as customer satisfaction, technical performance and quite recently the real-ization of promised business benefits have been added to the project successcriteria. Big data projects, though different from IT applications, suffer fromsimilar challenges, such as poorly defined scope, scope creep, lack of clarity onproject objectives leading to failure to provide business value. In addition to theapplication a suitable project management methodology thus ensuring properlydefined scope, effective scope change management, big data projects need togive due attention to benefits realization, which means giving more attentionto project outcomes rather than outputs. For this to happen big data projectsshould be managed through Project Management Office (PMO) so that once theproject is complete, it must ensure that promised organizational learning andvalue are harvested to the optimum levels.
References
1. Raymond, Y., Simon, P.: Top management support-almost always necessary andsometimes sufficient for success: findings from a fuzzy set analysis. Int. J. Proj.Manage. 31(7), 943–957 (2013)
2. Atkinson, R.: Project management: cost, time and quality, two best guesses and aphenomenon, its time to accept other success criteria. Int. J. Proj. Manage. 17(6),337–342 (1999)
3. Dragon, M., Peerasit, P.: Standardized project management may increase develop-ment projects success. Int. J. Proj. Manage. 23(3), 181–192 (2005)
4. Pinto, J.K., Slevin, D.P.: Critical success factors across the project life cycle: defi-nitions and measurement techniques. Proj. Manage. J. 19(3), 67–75 (1988)
5. Freeman, M., Beale, P.: Measuring project success. Proj. Manage. J. 23(1), 8–17(1992)

Author Index
Ahmed, Mohiuddin 113, 139Alsaawy, Yazed 3Amazonas, José R. 100
Barker, Trevor 131Bhuiyan, Md Zakirul Alam 78
Chalup, Stephan 68
Davidson, Chad 46Dhaouadi, Rached 57
Elshakankiri, Maher 23
Hoque, Mohammad A. 46Hussain, Afzal 113
Islam, Md. Motaharul 3
Jalil, Syed Qaisar 68
Kadoch, Michel 85Khan, Zaheer 3Khandaker, Sakib Mahtab 113Khasawneh, Samer 85
Lima Filho, Diogo F. 100Lindgren, Tony 121
Ma, Maode 36
Onasanya, Adeniyi 23
Qiu, Yue 36
Rahman, Md. Arafat 78Rehmani, Mubashir Husain 68Rezwana, Tahsin 46
Saeed, Munir Ahmad 139Shapsough, Salsabeel 57Singh, Shailendra 13
Takrouri, Mohannad 57Tao, Hai 78
Ullah, Abrar 131
Wang, Guojun 78Wang, Tian 78
Xiao, Hannan 131
Yassine, Abdulsalam 13
Zaman, Mdaliuz 78Zualkernan, Imran 57
Copyright © 2022 FDOKUMEN