Location matters: Spatial standards for the Internet of Things
Upload
khangminh22Category
view
1download
0
1
SCHOOL OF COMPUTING
DEPARTMENT OF COMPUTER SCIENCE AND ENGINEERING
UNIT – II – Internet of Things – SCSA5301 UNIT – I – Internet of Things – SIT1619

School of Computing 2
UNIT 1
Introduction to IoT, Current technological trends and future prospects, - Evolution
of IoT - IoT and related terms - Business Scope, Relation with embedded system,
Introduction to Arduino and Raspberrypi, Overview of Elements of IoT - Basic
Architecture of an IoT
1. INTRODUCTION TO IOT
It is a network of physical objects or things sending, receiving, or
communicating using the internet or other communication technologies. The
Internet of Things (IoT), as this intelligent interconnectivity between the real and
the digital world is called, will rapidly transform every aspect of how we work and
do business. By connecting apps with their integrated systems, businesses are able
to transform their industry significantly. Today almost 90% of all data generated
by tablets, smartphones or connected appliances is never acted upon. Imagine you
could change that. It seems safe to say that we have never encountered a single
technological platform that combines this much complexity, global reach and
novelty. Since IoT allows devices to be controlled remotely across the internet, thus
it created opportunities to directly connect & integrate the physical world to the
computer-based systems using sensors and internet. The interconnection of these
multiple embedded devices will be resulting in automation in nearly all fields and
enabling advanced applications. This is resulting in improved accuracy, efficiency
and economic benefit with reduced human intervention. It encompasses
technologies such as smart grids, smart homes, intelligent transportation and smart
cities. The major benefits of IoT are:
Improved Customer Engagement – IoT improves customer experience by
automating the action. For e.g. any issue in the car will be automatically
detected by the sensors. The driver, as well as the manufacturer, will be
notified about it. Until the time driver reaches the service station, the

School of Computing 3
manufacturer will make sure that the faulty part is available at the service
station.
Technical Optimization – IoT has helped a lot in improving technologies
and making them better. The manufacturer can collect data from different car
sensors and analyze them to improve their design and make them much more
efficient.
Reduced Waste – Our current insights are superficial, but IoT provides real-
time information leading to effective decision-making & management of
resources. For example, if a manufacturer finds fault in multiple engines, he
can track the manufacturing plant of those engines and can rectify the issue
with manufacturing belt.
2 CURRENT TECHNOLOGICAL TRENDS AND FUTURE PROSPECTS:
Many firms see big opportunity in IoT uses and enterprises start to believe
that IoT holds the promise to enhance customer relationships and drive business
growth by improving quality, productivity, and reliability on one side, and on the
other side reducing costs, risk, and theft.
IoT and Security Attacks
Forrester thinks that the recent DDoS attack that hit a whopping 1600
websites in the United States was just the tip of the iceberg when it comes to the
threat that the connected device poses to the world. That attack confirmed the fear
of vulnerability of IoT devices with a massive distributed denial of service attack
that crippled the servers of services like Twitter, NetFlix, NYTimes, and PayPal
across the U.S. It’s the result of an immense assault that involved millions of
Internet addresses and malicious software. All indications suggest that countless
Internet of Things (IoT) devices that power everyday technology like closed-circuit
cameras and smart-home devices were hijacked by the malware, and used against
the servers.

School of Computing 4
IoT and Mobile Elements
IoT is creating new opportunities and providing a competitive advantage for
businesses in current and new markets. It touches everything—not just the data, but
how, when, where and why you collect it. The technologies that have created the
Internet of Things aren’t changing the internet only, but rather change the things
connected to the internet. More mobile moments (the moments in which a person
pulls out a mobile device to get what he or she wants, immediately and in context)
will appear on the connected device, right from home appliances to cars to
smartwatches and virtual assistants. All these connected devices will have the
potential of offering a rich stream of data that will then be used by product and
service owners to interact with their consumers.
IoT and artificial Intelligence
In an IoT situation, AI can help companies take the billions of data points
they have and boil them down to what’s really meaningful. The general premise is
the same as in the retail applications – review and analyzes the data we’ve
collected to find patterns or similarities that can be learned from so that better
decisions can be made.
IoT and Connectivity
Connecting the different parts of IoT to the sensors can be done by different
technologies including Wi-Fi, Bluetooth, Low Power Wi-Fi, Wi-Max, regular
Ethernet, Long Term Evolution (LTE) and the recent promising technology of Li-
Fi (using light as a medium of communication between the different parts of a
typical network including sensors).
IoT and New Business Models
The bottom line is a big motivation for starting, investing in, and operating
any business, without a sound and solid business models for IoT we will have
another bubble, this model must satisfy all the requirements for all kinds of e-
commerce; vertical markets, horizontal markets, and consumer markets. One key
element is to bundle service with the product, for example, devices like Amazon’s
Alexa will be considered just another wireless speaker without the services
provided like voice recognition, music streaming, and booking Uber service to

School of Computing 5
mention few.
The IoT can find its applications in almost every aspect of our daily life. Below are
some of the examples.
1) Prediction of natural disasters: The combination of sensors and their
autonomous coordination and simulation will help to predict the occurrence
of land-slides or other natural disasters and to take appropriate actions in
advance.
2) Industry applications: The IoT can find applications in industry e.g.,
managing a fleet of cars for an organization. The IoT helps to monitor their
environmental performance and process the data to determine and pick the
one that need maintenance.
3) Water Scarcity monitoring: The IoT can help to detect the water scarcity
at different places. The networks of sensors, tied together with the relevant
simulation activities might not only monitor long term water interventions
such as catchment area management, but may even be used to alert users of a
stream, for instance, if an upstream event, such as the accidental release of
sewage into the stream, might have dangerous implications.
4) Design of smart homes: The IoT can help in the design of smart homes
e.g., energy consumption management, interaction with appliances,
detecting emergencies, home safety and finding things easily, home security
etc.
5) Medical applications: The IoT can also find applications in medical sector
for saving lives or improving the quality of life e.g., monitoring health
parameters, monitoring activities, support for independent living, monitoring
medicines intake etc.
6) Agriculture application: A network of different sensors can sense data,
perform data processing and inform the farmer through communication

School of Computing 6
infrastructure e.g., mobile phone text message about the portion of land that
need particular attention. This may include smart packaging of seeds,
fertilizer and pest control mechanisms that respond to specific local
conditions and indicate actions. Intelligent farming system will help
agronomists to have better understanding of the plant growth models and to
have efficient farming practices by having the knowledge of land conditions
and climate variability. This will significantly increase the agricultural
productivity by avoiding the inappropriate farming conditions.
7) Intelligent transport system design: The Intelligent transportation system
will provide efficient transportation control and management using advanced
technology of sensors, information and network. The intelligent
transportation can have many interesting features such as non-stop electronic
highway toll, mobile emergency command and scheduling, transportation
law enforcement, vehicle rules violation monitoring, reducing environmental
pollution, anti-theft system, avoiding traffic jams, reporting traffic incidents,
smart beaconing, minimizing arrival delays etc.
8) Design of smart cities: The IoT can help to design smart cities e.g.,
monitoring air quality, discovering emergency routes, efficient lighting up of
the city, watering gardens etc.
9) Smart metering and monitoring: The IoT design for smart metering and
monitoring will help to get accurate automated meter reading and issuance of
invoice to the customers. The IoT can be used to design such scheme for
wind turbine maintenance and remote monitoring, gas, water as well as
environmental metering and monitoring.
10) Smart Security: The IoT can also find applications in the field of
security and surveillance e.g., surveillance of spaces, tracking of people and
assets, infrastructure and equipment maintenance, alarming etc.

School of Computing 7
3. EVOLUTION OF IOT AND BUSINESS SCOPE
The term “Internet of Things” (IoT) was first used in 1999 by British
technology pioneer Kevin Ashton to describe a system in which objects in the
physical world could be connected to the Internet by sensors.12 Ashton coined the
term to illustrate the power of connecting Radio- Frequency Identification (RFID)
tags13 used in corporate supply chains to the Internet in order to count and track
goods without the need for human intervention.
Fig 1 IoT Evolution Model
By the late 1970s, for example, systems for remotely monitoring meters on the
electrical grid via telephone lines were already in commercial use.14 In the 1990s,
advances in wireless technology allowed “machine–to–machine” (M2M) enterprise
and industrial solutions for equipment monitoring and operation to become
widespread. Many of these early M2M solutions, however, were based on closed
purpose–built networks and proprietary or industry.
From a broad perspective, the confluence of several technology and market
trends20 is making it possible to interconnect more and smaller devices cheaply
and easily:
Internet of Things - Evolution 7

School of Computing 8
• Ubiquitous Connectivity—Low–cost, high–speed, pervasive network
connectivity, especially through licensed and unlicensed wireless services and
technology, makes almost everything “connectable’’.
• Widespread adoption of IP–based networking— IP has become the dominant
global standard for networking, providing a well–defined and widely implemented
platform of software and tools that can be incorporated into a broad range of
devices easily and inexpensively.
• Miniaturization— Manufacturing advances allow cutting-edge computing and
communications technology to be incorporated into very small objects. Coupled
with greater computing economics, this has fueled the advancement of small and
inexpensive sensor devices, which drive many IoT applications.
• Advances in Data Analytics— New algorithms and rapid increases in computing
power, data storage, and cloud services enable the aggregation, correlation, and
analysis of vast quantities of data; these large and dynamic datasets provide new
opportunities for extracting information and knowledge.
• Rise of Cloud Computing– Cloud computing, which leverages remote,
networked computing resources to process, manage, and store data, allows small
and distributed devices to interact with powerful back-end analytic and control
capabilities.
From this perspective, the IoT represents the convergence of a variety of
computing and connectivity trends that have been evolving for many decades. At
present, a wide range of industry sectors – including automotive, healthcare,
manufacturing, home and consumer electronics, and well beyond -- are considering
the potential for incorporating IoT technology into their products, services, and
operations.
BUSINESS SCOPE

School of Computing 9
Increase Business Opportunities
IoT opens the door for new business opportunities and helps companies benefit
from new revenue streams developed by advanced business models and services.
IoT-driven innovations build strong business cases, reduce time to market and
increase return on investments. IoT has the potential to transform the way
consumers and businesses approach the world by leveraging the scope of the IoT
beyond connectivity.
Enhanced Asset Utilization
IoT will improve tracking of assets (equipment, machinery, tools, etc.) using sensors
and connectivity, which helps organizations benefit from real-time insights.
Organizations could more easily locate issues in the assets and run preventive
maintenance to improve asset utilization.
Efficient Processes
Being connected with a maximum number of devices to the internet, IoT allow
businesses to be smarter with real-time operational insights while reducing
operating costs. The data collected from logistics network, factory floor, and supply
chain will help reduce inventory, time to market and downtime due to
maintenance.
Improved Safety and Security
IoT services integrated with sensors and video cameras help monitor workplace to
ensure equipment safety and protect against physical threats. The IoT connectivity
coordinates multiple teams to resolve issues promptly.

School of Computing 10
Fig 2 Business Scope
Increase Productivity
Productivity plays a key role in the profitability of any business. IoT offers just-in-
time training for employees, improve labor efficiency, and reduce mismatch of
skills while increasing organizational productivity.
Cost Saving
The improved asset utilization, productivity, and process efficiencies can save your
expenditures. For example, predictive analytics and real-time diagnostics drive
down the maintenance costs. IoT has reached the pinnacle of inflated expectations of
emerging technologies. Even though IoT offers great potential value, organizations
must overcome some significant challenges like data and information management
issues, lack of interoperable technologies, security and privacy concerns, and the
skills to manage IoT’s growing complexity. However, a professional IoT service
provider can overcome these challenges and increase your return on investment.

School of Computing 11
Logistics
With IoT sensors, supply chain management and order fulfillment processes
improve markedly to meet customer demand. For example, sensors on delivery
containers and trucks in transit give managers real-time status updates, allowing
them to track their items and ensure they reach the right location at the right time.
Streamlined Industry
IoT also presents automation opportunities for businesses that need to manage and
replenish their stock. When data recorded from IoT devices are tied to your
enterprise resource planning (ERP) system, you can accurately monitor your
inventory, analyze purchase and consumption rates of a particular product, and
automatically reorder items when IoT sensors detect that supply is running low.
This minimizes out-of-stock incidents and prevents excess stock build-up.
Fast Payment
Given how most payments are done electronically via point-of-sale systems or the
internet, IoT has the potential to revolutionize the way businesses process
transactions. We’re already seeing a few examples of this today as Apple Pay not
only allows users to purchase goods and services using smart phone applications,
but through wearable technology as well.Soon enough, IoT devices might even
allow restaurants and retailers to register or charge their customers the moment
they walk through the door.
Market Insight
Businesses that can somehow make sense of IoT-collected data will gain a
competitive edge. Marketers, for example, can gather valuable insight into how
their products are used and which demographic is utilizing them the most. This
information can then inform future marketing efforts and give businesses more
direction on how to improve their products and services for their customers.
Although businesses will certainly face many challenges in implementing the
Internet of Things, those who manage to overcome them will reap all the benefits of

School of Computing 12
this burgeoning technology.
4. RELATIONSHIP WITH EMBEDDED SYSTEMS
Embedded systems are part and parcel of every modern electronic
component. These are low power consumption units that are used to run specific
tasks for example remote controls, washing machines, microwave ovens, RFID
tags, sensors, actuators and thermostats used in various applications, networking
hardware such as switches, routers, modems, mobile phones, PDAs, etc. Usually
embedded devices are a part of a larger device where they perform specific task of
the device. For example, embedded systems are used as networked thermostats in
Heating, Ventilation and Air Conditioning (HVAC) systems, in Home Automation
embedded systems are used as wired or wireless networking to automate and control
lights, security, audio/visual systems, sense climate change, monitoring, etc.
Embedded microcontrollers can be found in practically all machines, ranging from
DVD players and power tools to automobiles and computed tomography scanners.
They differ from PCs in their size and processing power. Embedded systems
typically have a microprocessor, a memory, and interfaces with the external world,
but they are considerably smaller than their PC counterparts. Frequently, the bulk of
the electronic circuitry can be found in a single chip.
Fig 3 Embedded Processing
School of Computing 13
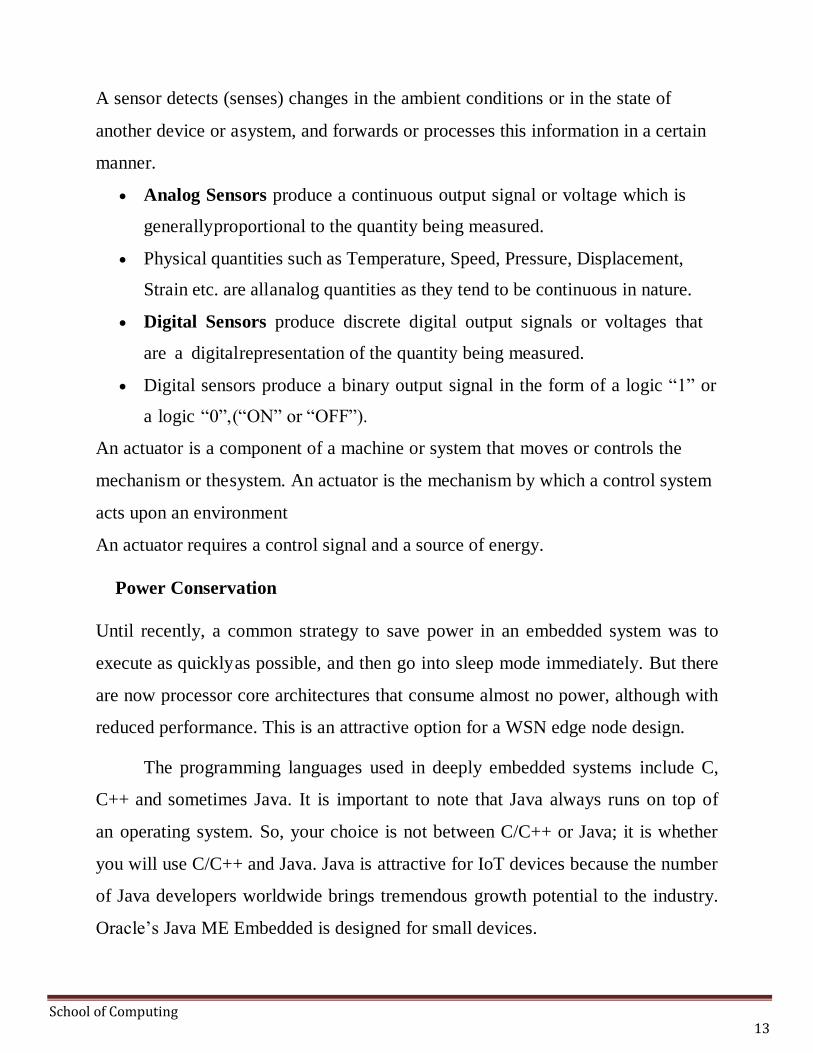
A sensor detects (senses) changes in the ambient conditions or in the state of
another device or a system, and forwards or processes this information in a certain
manner.
Analog Sensors produce a continuous output signal or voltage which is
generally proportional to the quantity being measured.
Physical quantities such as Temperature, Speed, Pressure, Displacement,
Strain etc. are all analog quantities as they tend to be continuous in nature.
Digital Sensors produce discrete digital output signals or voltages that
are a digital representation of the quantity being measured.
Digital sensors produce a binary output signal in the form of a logic “1” or
a logic “0”, (“ON” or “OFF”).
An actuator is a component of a machine or system that moves or controls the
mechanism or the system. An actuator is the mechanism by which a control system
acts upon an environment
An actuator requires a control signal and a source of energy.
Power Conservation
Until recently, a common strategy to save power in an embedded system was to
execute as quickly as possible, and then go into sleep mode immediately. But there
are now processor core architectures that consume almost no power, although with
reduced performance. This is an attractive option for a WSN edge node design.
The programming languages used in deeply embedded systems include C,
C++ and sometimes Java. It is important to note that Java always runs on top of
an operating system. So, your choice is not between C/C++ or Java; it is whether
you will use C/C++ and Java. Java is attractive for IoT devices because the number
of Java developers worldwide brings tremendous growth potential to the industry.
Oracle’s Java ME Embedded is designed for small devices.

School of Computing 14
When cost is not an issue, we can select a single powerful processor to run all the
tasks required of your device. However, a common engineering compromise is to
use two processors in the sensor/actuator device. One low-cost processor (8 or 16
bit) is used for the physical-world interface, and a second 32-bit processor runs the
network interface. This second processor is often placed in a separate module, one
that has already been certified for the protocol and FCC compliance.
Fig 4. IoT Devices with Two Processors
Gateway Design
A gateway connects two dissimilar networks so that data can flow between them.
Usually this is a connection between a proprietary network and the Internet.
Fig 5. Embedded Devices with Gateway

School of Computing 15
Bluetooth is a wireless technology standard for exchanging data over short
distances from fixed and mobile devices, and building personal area networks.
Zigbee wireless technology is specially designed for sensors and control devices
that employ low cost connectivity and widely used for several applications.
Z-Wave is a wireless communications protocol used primarily for home
automation. It is a mesh network using low-energy radio waves to communicate
from appliance to appliance, allowing for wireless control of residential appliances
and other devices, such as lighting control, security systems, thermostats, windows.
Wi-Fi is the name of a popular wireless networking technology that uses radio
waves to provide wireless high-speed Internet and network connections. A
common misconception is that the term Wi-Fi is short for "wireless fidelity.
ISA100.11a is a wireless networking technology standard developed by the
International Society of Automation (ISA). The official description is "Wireless
Systems for Industrial Automation: Process Control and Related Applications.
The EnOcean technology is an energy harvesting wireless technology used
primarily in building automation systems, and is also applied to other applications
in industry, transportation, logistics and smart homes. Modules based on EnOcean
technology combine micro energy converters with ultra low power electronics, and
enable wireless communications between batteryless wireless sensors, switches,
controllers and gateways.
In home automation, different utilities companies may install a wide variety of IoT
devices in your house, each with their own gateway. These can include electricity
or gas, water, phone, Internet, cable/satellite, alarm system, medical devices, and
so on. Some of these gateways may require additional functions, such as local
storage, or a user interface.

School of Computing 16
5. INTRODUCTION TO AUDUINO AND RASPBERRYPI
Arduino is an open-source platform used for building electronics projects.
Arduino consists of both a physical programmable circuit board (often referred to
as a microcontroller) and a piece of software, or IDE (Integrated Development
Environment) that runs on your computer, used to write and upload computer code
to the physical board. Accepts analog and digital signals as input and gives desired
output.
BOARD DETAILS:
Power Supply:
USB or power barrel jack
Voltage Regulator
LED Power Indicator
Tx-Rx LED Indicator
Output power,
Ground
Analog Input Pins
Digital I/O Pin
SET UP:
Power the board by connecting it to a PC via USB cable
Launch the Arduino IDE
Set the board type and the port for the board
TOOLS -> BOARD -> select your board
TOOLS -> PORT -> select your port
ARDUIN0 UN0
Feature Value
OperatingVoltage 5V
ClockSpeed 16MHz
Digital I/O 14
AnalogInput 6
PWM 6
UART 1
Interface USB via ATMega16U2

School of Computing 17
TYPES:
1. Arduino Uno (R3)
2. LilyPad Arduino
3. RedBoard
4. Arduino Mega (R3)
5. Arduino Leonardo
Fig 6 Arduino Board

School of Computing 18
Power (USB / Barrel Jack):
Every Arduino board needs a way to be connected to a power source. The
Arduino UNO can be powered from a USB cable coming from your computer or a
wall power supply (like this) that is terminated in a barrel jack. In the picture above
the USB connection is labeled (1) and the barrel jack is labeled (2). The USB
connection is also how you will load code onto your Arduino board.
NOTE: Do NOT use a power supply greater than 20 Volts as you will overpower
(and thereby destroy) Arduino. The recommended voltage for most Arduino
models is between 6 and 12 Volts.
Pins (5V, 3.3V, GND, Analog, Digital, PWM, AREF):
The pins on your Arduino are the places where you connect wires to construct a
circuit (probably in conjunction with a breadboard and some wire. They usually
have black plastic ‘headers’ that allow you to just plug a wire right into the board.
The Arduino has several different kinds of pins, each of which is labeled on the
board and used for different functions.
GND (3): Short for ‘Ground’. There are several GND pins on the Arduino, any of
which can be used to ground your circuit.
5V (4) & 3.3V (5): As you might guess, the 5V pin supplies 5 volts of power, and
the 3.3V pin supplies 3.3 volts of power. Most of the simple components used with
the Arduino run happily off of 5 or 3.3 volts.
Analog (6): The area of pins under the ‘Analog In’ label (A0 through A5 on the
UNO) are Analog In pins. These pins can read the signal from an analog sensor
(like a temperature sensor) and convert it into a digital value that we can read.

School of Computing 19
Digital (7): Across from the analog pins are the digital pins (0 through 13 on the
UNO). These pins can be used for both digital input (like telling if a button is
pushed) and digital output (like powering an LED).
PWM (8): You may have noticed the tilde (~) next to some of the digital pins (3,
5, 6, 9, 10, and 11 on the UNO). These pins act as normal digital pins, but can also
be used for something called Pulse-Width Modulation (PWM). We have a tutorial
on PWM, but for now, think of these pins as being able to simulate analog output
(like fading an LED in and out).
AREF (9): Stands for Analog Reference. Most of the time you can leave this pin
alone. It is sometimes used to set an external reference voltage (between 0 and 5
Volts) as the upper limit for the analog input pins.
Reset Button
Just like the original Nintendo, the Arduino has a reset button (10). Pushing it will
temporarily connect the reset pin to ground and restart any code that is loaded on the
Arduino. This can be very useful if your code doesn’t repeat, but you want to test it
multiple times. Unlike the original Nintendo however, blowing on the Arduino
doesn’t usually fix any problems.
Power LED Indicator
Just beneath and to the right of the word “UNO” on your circuit board, there’s a
tiny LED next to the word ‘ON’ (11). This LED should light up whenever you plug
your Arduino into a power source. If this light doesn’t turn on, there’s a good
chance something is wrong. Time to re-check your circuit!
TX RX LEDs
TX is short for transmit, RX is short for receive. These markings appear quite a bit

School of Computing 20
in electronics to indicate the pins responsible for serial communication. In our
case, there are two places on the Arduino UNO where TX and RX appear – once by
digital pins 0 and 1, and a second time next to the TX and RX indicator LEDs (12).
These LEDs will give us some nice visual indications whenever our Arduino is
receiving or transmitting data (like when we’re loading a new program onto the
board).
Main IC
The black thing with all the metal legs is an IC, or Integrated Circuit (13). Think of
it as the brains of our Arduino. The main IC on the Arduino is slightly different
from board type to board type, but is usually from the ATmega line of IC’s from
the ATMEL company. This can be important, as you may need to know the IC type
(along with your board type) before loading up a new program from the Arduino
software. This information can usually be found in writing on the top side of the IC.
If you want to know more about the difference between various IC’s, reading the
datasheets is often a good idea.p
Voltage Regulator
The voltage regulator (14) is not actually something you can (or should) interact
with on the Arduino. But it is potentially useful to know that it is there and what it’s
for. The voltage regulator does exactly what it says – it controls the amount of
voltage that is let into the Arduino board. Think of it as a kind of gatekeeper; it will
turn away an extra voltage that might harm the circuit. Of course, it has its limits,
so don’t hook up your Arduino to anything greater than 20 volts.

School of Computing 21
ARDINO IDE OVERVIEW:
Program coded in Arduino IDE is called a SKETCH
1. To create a new sketchFile -> New
To open an existing sketch File -> open ->
There are some basic ready-to-use sketches available in the
EXAMPLES section File -> Examples -> select any program
2. Verify: Checks the code for compilation errors
3. Upload: Uploads the final code to the controller board
4. New: Creates a new blank sketch with basic structure
5. Open: Opens an existing sketch
6. Save: Saves the current sketch
Fig 7. Compilation and
Execution
Serial Monitor: Opens the serial console
All the data printed to the console are displayed here

School of Computing 22
SKETCH STRUCTURE
Fig 8. Structure of SKETCH
A sketch can be divided into two
parts: Setup ()
Loop()
The function setup() is the point where the code starts, just like the main()
function in C and C++
I/O Variables, pin modes are initialized in the Setup() function Loop()
function, as the name suggests, iterates the specified task in the program
DATA TYPES:
Void ,Long, Int ,Char ,Boolean, Unsigned char ,Byte, Unsigned int, Word
,Unsigned long ,Float, Double,Array,String-char array,String-object,Short
Arduino Function libraries
Input/Output Functions:
The arduino pins can be configured to act as input or output pins using the
pinMode() function Void setup ()
pinMode (pin , mode);
Pin- pin number on the Arduino board Mode-
INPUT/OUTPUT digitalWrite() : Writes a HIGH or

School of Computing 23
LOW value to a digital pin
analogRead() : Reads from the analog input pin i.e., voltage applied across the pin
Character functions such as isdigit(), isalpha(), isalnum(), isxdigit(), islower(),
isupper(), isspace() return 1(true) or 0(false)
Delay() function is one of the most common time manipulation function used to
provide a delay of specified time. It accepts integer value (time in miliseconds)
EXAMPLE BLINKING LED:
Requirement:
Arduino controller board, USB connector, Bread board, LED, 1.4Kohm
resistor, connecting wires, Arduino IDE
Connect the LED to the Arduino using the Bread board and the
connecting wires Connect the Arduino board to the PC using the
USB connector
Select the board type and port Write the sketch in the editor, verify and upload
Connect the positive terminal of the LED to digital pin 12 and the negative terminal
to the ground pin (GND) of Arduino Board
void setup()
pinMode(12, OUTPUT); // set the pin mode
void loop()
digitalWrite(12, HIGH); // Turn on the LED
delay(1000); digitalWrite(12, LOW); //Turn of
the LED delay(1000);
Set the pin mode as output which is connected to the led, pin 12 in
this case. Use digitalWrite() function to set the output as HIGH and
LOW

School of Computing 24
Delay() function is used to specify the delay between HIGH-LOW transition of the output
Connect he board to the
PC Set the port and
board type Verify the
code and upload,
notice the TX – RX led in the board starts flashing as the code is uploaded.
RASPBERRY PI:
Raspberry Pi is a credit card sized micro processor available in different
models with different processing speed starting from 700 MHz. Whether you have
a model B or model B+, or the very old version, the installation process remains the
same. People who have checked out the official Raspberry Pi website, But using
the Pi is very easy and from being a beginner, one will turn pro in no time. So, it's
better to go with the more powerful and more efficient OS, the Raspbian. The main
reason why Raspbian is extremely popular is that it has thousands of pre built
libraries to perform many tasks and optimize the OS. This forms a huge advantage
while building applications.
Fig 9 Raspberry Pi Elements

School of Computing 25
Specifications and performance
As for the specifications, the Raspberry Pi is a credit card-sized computer
powered by the Broadcom BCM2835 system-on-a-chip (SoC). This SoC includes
a 32-bit ARM1176JZFS processor, clocked at 700MHz, and a Videocore IV GPU.
It also has 256MB of RAM in a POP package above the SoC. The Raspberry Pi is
powered by a 5V micro USB AC charger or at least 4 AA batteries (with a bit of
hacking).
While the ARM CPU delivers real-world performance similar to that of a 300MHz
Pentium 2, the Broadcom GPU is a very capable graphics core capable of hardware
decoding several high definition video formats. The Raspberry Pi model available
for purchase at the time of writing — the Model B — features HDMI and composite
video outputs, two USB 2.0 ports, a 10/100 Ethernet port, SD card slot, GPIO
(General Purpose I/O Expansion Board) connector, and analog audio output
(3.5mm headphone jack). The less expensive Model A strips out the Ethernet port
and one of the USB ports but otherwise has the same hardware.
Raspberry pi 3 model B Raspberry pi 2 model B Raspberry Pi zero
RAM 1GB SDRAM 1GB SDRAM 512 MB SDRAM
CPU Quad cortex
Quad cortex
A53@900MHz
ARM 11@ 1GHz
GPU 400 MHz video core IV 250 MHz video core IV 250 MHz video
core
IV Ethernet 10/100 10/100 None
Wireless 802.11/Bluetooth 4.0 None None
Video output HDMI/Composite HDMI/Composite HDMI/Composite
GPIO 40 40 40
Fig 10. Configuration

School of Computing 26
Raspberry Pi Basics: installing Raspbian and getting it up and running
1 .Downloading Raspbian and Image writer.
You will be needing an image writer to write the downloaded OS into the SD card
(micro SD card in case of Raspberry Pi B+ model). So download the "win32 disk
imager" from the website.
2 .Writing the image
Insert the SD card into the laptop/pc and run the image writer. Once open, browse
and select the downloaded Raspbian image file. Select the correct device, that is
the drive representing the SD card. If the drive (or device) selected is different
from the SD card then the other selected drive will become corrupted. SO be
careful.
After that, click on the "Write" button in the bottom. As an example, see the image
below, where the SD card (or micro SD) drive is represented by the letter "G:\"
Fig 11. OS Installation
Once the write is complete, eject the SD card and insert it into the Raspberry Pi
and turn it on. It should start booting up.
3. Setting up the Pi
Please remember that after booting the Pi, there might be situations when the user

School of Computing 27
credentials like the "username" and password will be asked. Raspberry Pi comes
with a default user name and password and so always use it whenever it is being
asked. The credentials are:
login: pi
password: raspberry
When the Pi has been booted for the first time, a configuration screen called the
"Setup Options" should appear and it will look like the image below.
Fig 12. Raspberry Configuration
If you have missed the "Setup Options" screen, its not a problem, you can always
get it by typing the following command in the terminal.
sudo raspi-config
Once you execute this command the "Setup Options" screen will come up as
shown in the image above.
Now that the Setup Options window is up, we will have to set a few things. After
completing each of the steps below, if it asks to reboot the Pi, please do so. After
the reboot, if you don't get the "Setup Options" screen, then follow the command
given above to get the screen/window.

School of Computing 28
The first thing to do:
select the first option in the list of the setup options window, that is select the
"Expand Filesystem" option and hit the enter key. We do this to make use of
all the space present on the SD card as a full partition. All this does is, expand
the OS to fit the whole space on the SD card which can then be used as the
storage memory for the Pi
The second thing to do:
Select the third option in the list of the setup options window, that is select the
"Enable Boot To Desktop/Scratch" option and hit the enter key. It will take
you to another window called the "choose boot option" window that looks like
the image below.
Fig 13 Boot Options
In the "choose boot option window", select the second option, that is, "Desktop
Log in as user 'pi' at the graphical desktop" and hit the enter button. Once done
you will be taken back to the "Setup Options" page, if not select the "OK" button
at the bottom of this window and you will be taken back to the previous window.
We do this because we want to boot into the desktop environment which we are
familiar with. If we don't do this step then the Raspberry Pi boots into a terminal

School of Computing 29
each time with no GUI options. Once, both the steps are done, select the "finish"
button at the bottom of the page and it should reboot automatically. If it doesn't,
then use the following command in the terminal to reboot.
Sudo reboot
Updating the firmware
After the reboot from the previous step, if everything went right, then you will end
up on the desktop which looks like the image below.
Fig 14. Raspberry Desktop
Once you are on the desktop, open a terminal and enter the following command
to update the firmware of the Pi.
Sudo rpi-update
Updating the firmware is necessary because certain models of the Pi might not have
all the required dependencies to run smoothly or it may have some bug. The latest
firmware might have the fix to those bugs, thus its very important to update it in the
beginning itself.

School of Computing 30
5 Conclusion
So, we have covered the steps to get the Pi up and running. This method works on
all the different models of Raspberry Pi (model A, B, B+ and also RPi 2) as
Raspbain was made to be supported on all models. However, while installing other
software or libraries, the procedure might change a bit while installing depending on
the model of the Pi or the version of Raspbian itself. The concept of Raspberry is to
keep trying till you get the result or build that you want. This might involve a lot of
trial and error but spending the time will be worth it. The actual usage doesn't end
here. This is just the beginning. It is up to you to go ahead to build something
amazing out of it.
Fig 15. GPIO Pins
GPIO:
Act as both digital output and digital input.
Output: turn a GPIO pin high or low.
Input: detect a GPIO pin high or low
Installing GPIO library:
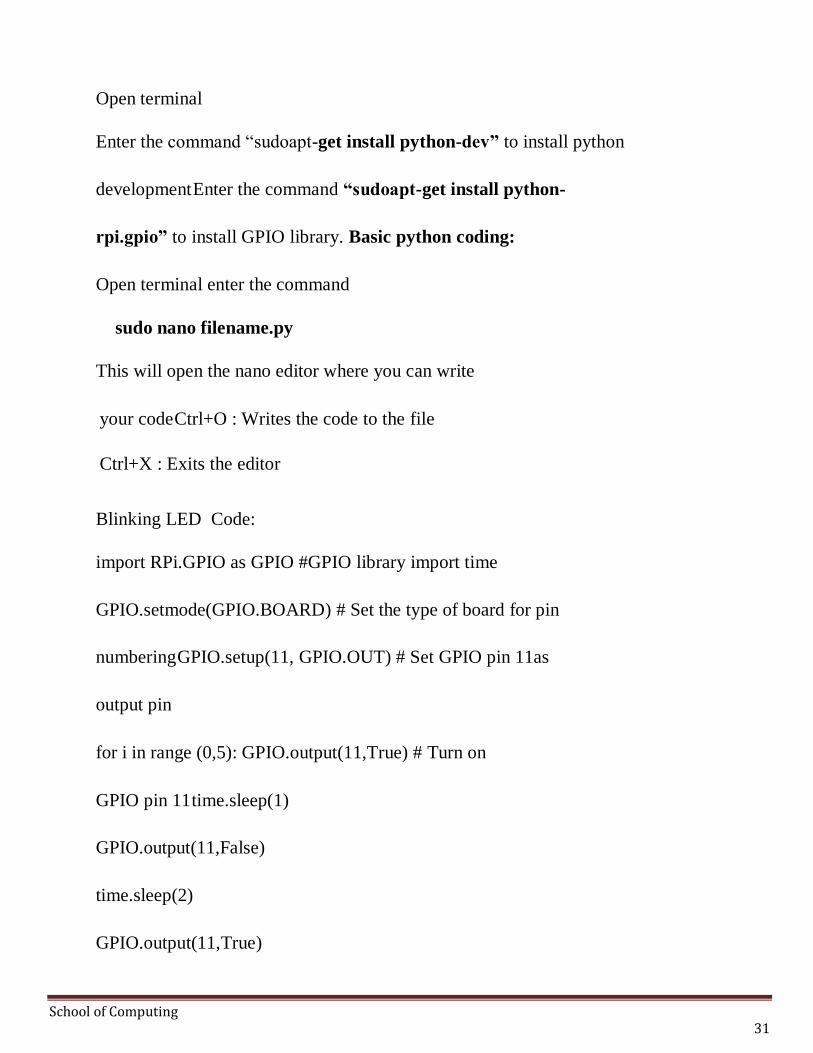
School of Computing 31
Open terminal
Enter the command “sudoapt-get install python-dev” to install python
development Enter the command “sudoapt-get install python-
rpi.gpio” to install GPIO library. Basic python coding:
Open terminal enter the command
sudo nano filename.py
This will open the nano editor where you can write
your code Ctrl+O : Writes the code to the file
Ctrl+X : Exits the editor
Blinking LED Code:
import RPi.GPIO as GPIO #GPIO library import time
GPIO.setmode(GPIO.BOARD) # Set the type of board for pin
numbering GPIO.setup(11, GPIO.OUT) # Set GPIO pin 11as
output pin
for i in range (0,5): GPIO.output(11,True) # Turn on
GPIO pin 11 time.sleep(1)
GPIO.output(11,False)
time.sleep(2)
GPIO.output(11,True)
School of Computing 32
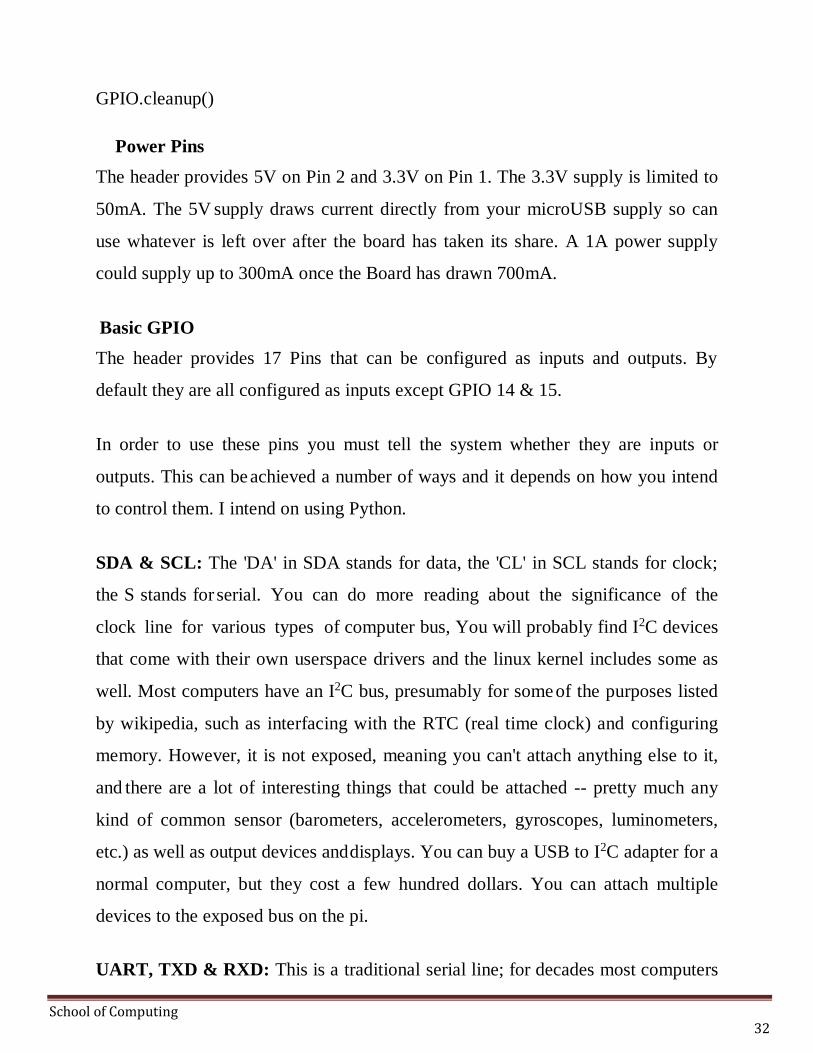
GPIO.cleanup()
Power Pins
The header provides 5V on Pin 2 and 3.3V on Pin 1. The 3.3V supply is limited to
50mA. The 5V supply draws current directly from your microUSB supply so can
use whatever is left over after the board has taken its share. A 1A power supply
could supply up to 300mA once the Board has drawn 700mA.
Basic GPIO
The header provides 17 Pins that can be configured as inputs and outputs. By
default they are all configured as inputs except GPIO 14 & 15.
In order to use these pins you must tell the system whether they are inputs or
outputs. This can be achieved a number of ways and it depends on how you intend
to control them. I intend on using Python.
SDA & SCL: The 'DA' in SDA stands for data, the 'CL' in SCL stands for clock;
the S stands for serial. You can do more reading about the significance of the
clock line for various types of computer bus, You will probably find I2C devices
that come with their own userspace drivers and the linux kernel includes some as
well. Most computers have an I2C bus, presumably for some of the purposes listed
by wikipedia, such as interfacing with the RTC (real time clock) and configuring
memory. However, it is not exposed, meaning you can't attach anything else to it,
and there are a lot of interesting things that could be attached -- pretty much any
kind of common sensor (barometers, accelerometers, gyroscopes, luminometers,
etc.) as well as output devices and displays. You can buy a USB to I2C adapter for a
normal computer, but they cost a few hundred dollars. You can attach multiple
devices to the exposed bus on the pi.
UART, TXD & RXD: This is a traditional serial line; for decades most computers

School of Computing 33
have had a port for this and a port for parallel.1 Some pi oriented OS distros such as
Raspbian by default boot with this serial line active as a console, and you can plug
the other end into another computer and use some appropriate software to
communicate with it. Note this interface does not have a clock line; the two pins
may be used for full duplex communication (simultaneous transmit and receive).
PCM, CLK/DIN/DOUT/FS: PCM is is how uncompressed digital audio is
encoded. The data stream is serial, but interpreting this correctly is best done with a
separate clock line (more lowest level stuff).
SPI, MOSI/MISO/CE0/CE1: SPI is a serial bus protocol serving many of the
same purposes as I2C, but because there are more wires, it can operate in full
duplex which makes it faster and more flexible.
Raspberry Pi Terminal Commands
[sudo apt-get update] - Update Package Lists
[sudo apt-get upgrade] - Download and Install Updated
Packages [sudo raspi-config] - The Raspberry Pi
Configuration Tool
[sudo apt-get clean] - Clean Old
Package Files [sudo reboot] - Restart
your Raspberry Pi [sudo halt] - Shut
Down your Raspberry Pi
6. KEY ELEMENTS OF IOT
1. Sensing
The first step in IoT workflow is gathering information at a “point of activity.”
This can be information captured by an appliance, a wearable device, a wall
mounted control or any number of commonly found devices. The sensing can be
biometric, biological, environmental, visual or audible (or all the above). The
unique thing in the context of IoT is that the device doing the sensing is not one that

School of Computing 34
typically gathered information in this way. Sensing technology specific to this
purpose is required.
2. Communication
This is where things start to get interesting. Many of the new IoT devices we are
seeing today are not designed for optimal communication with cloud services.
IoT devices require a means for transmitting the information sensed at the device
level to a Cloud-based service for subsequent processing. This is where the great
value inherent in IoT is created. This requires either WiFi (wireless LAN based
communications) or WAN (wide area network… i.e. cellular) communications. In
addition, depending on the need short range communication, other capabilities may
also be needed. These could include Bluetooth, ZigBee, Near-field or a range of
other short range communication methods. For positioning, GPS is often required
as well.
3. Cloud Based Capture & Consolidation
Gathered data is transmitted to a cloud based service where the information
coming in from the IoT device is aggregated with other cloud based data to
provide useful information for the end user. The data being consolidated can be
information from other internet sources as well as from others subscribing with
similar IoT devices. Most often, there will be some data processing required to
provide useful information that is not necessarily obvious in the raw data.
4. Delivery of Information
The last step is delivery of useful information to the end user. That may be a
consumer, a commercial or an industrial user. It may also be another device in the
M2M workflow. The goal in a consumer use case is to provide the information in
as simple and transparent a method as possible. It requires execution of a well
thought out, designed and executed user interface that provides an optimized
experience across multiple device platforms – tablets, smartphones, desktop

School of Computing 35
– across multiple operating systems – iOS, Android, Windows, etc.
7.REFERENCE ARCHITECTURE OF IOT:
The reference architecture consists of a set of components. Layers can be realized by
means of specific technologies, and we will discuss options for realizing each
component. There are also some cross-cutting/vertical layers such as access/identity
management.
Fig 16 Reference architecture for
IoT
The layers are
• Client/external communications - Web/Portal, Dashboard, APIs
• Event processing and analytics (including data storage)
• Aggregation/bus layer – ESB and message broker
• Relevant transports - MQTT/HTTP/XMPP/CoAP/AMQP, etc.

School of Computing 36
• Devices
The cross-cutting layers are
• Device manager
• Identity and access managements
THE DEVICE LAYER
The bottom layer of the architecture is the device layer. Devices can be of various
types, but in order to be considered as IoT devices, they must have some
communications that either indirectly or directly attaches to the Internet. Examples
of direct connections are
• Arduino with Arduino Ethernet connection
• Arduino Yun with a Wi-Fi connection
• Raspberry Pi connected via Ethernet or Wi-Fi
• Intel Galileo connected via Ethernet or
Wi-Fi Examples of indirectly connected
device include
• ZigBee devices connected via a ZigBee gateway
• Bluetooth or Bluetooth Low Energy devices connecting via a mobile phone
• Devices communicating via low power radios to a
Raspberry Pi There are many more such examples of
each type.
Each device typically needs an identity. The identity may be one of the following:
• A unique identifier (UUID) burnt into the device (typically part of the System-on-
Chip, or provided by a secondary chip)
• A UUID provided by the radio subsystem (e.g. Bluetooth identifier, Wi-Fi MAC address)
• An OAuth2 Refresh/Bearer Token (this may be in addition to one of the above)
• An identifier stored in nonvolatile memory such as EEPROM
For the reference architecture we recommend that every device has a UUID
(preferably an unchangeable ID provided by the core hardware) as well as an
OAuth2 Refresh and Bearer token stored in EEPROM.
School of Computing 37
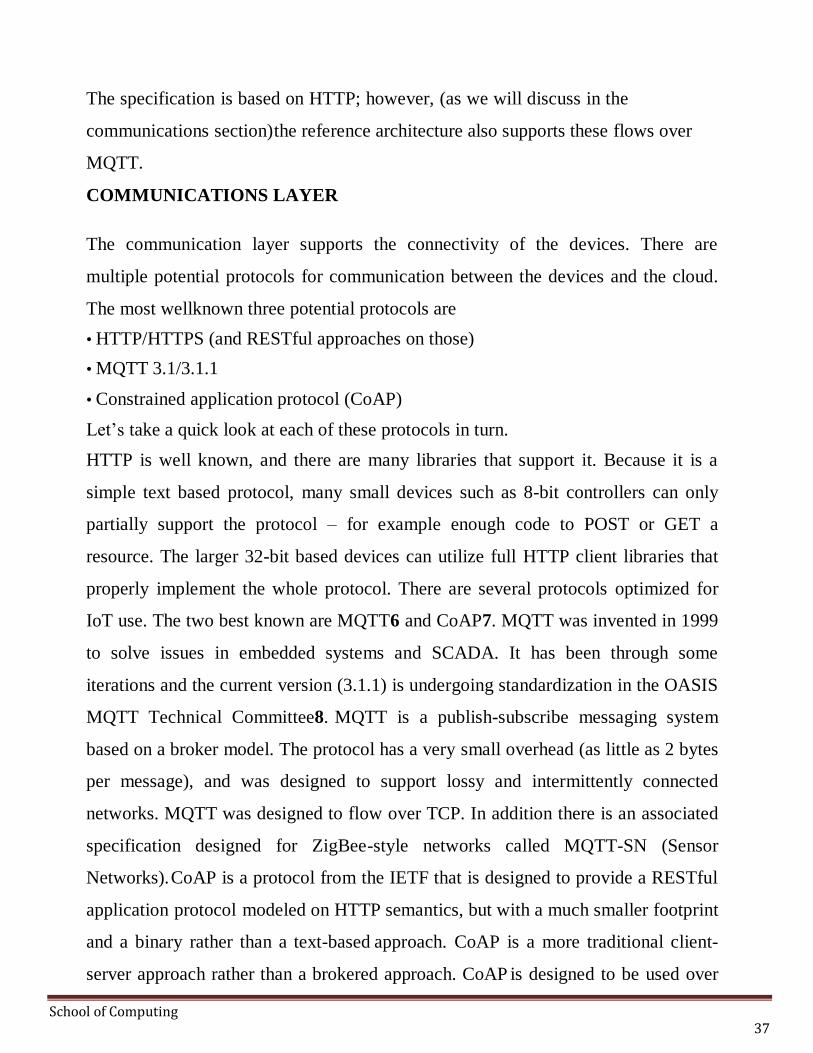
The specification is based on HTTP; however, (as we will discuss in the
communications section) the reference architecture also supports these flows over
MQTT.
COMMUNICATIONS LAYER
The communication layer supports the connectivity of the devices. There are
multiple potential protocols for communication between the devices and the cloud.
The most wellknown three potential protocols are
• HTTP/HTTPS (and RESTful approaches on those)
• MQTT 3.1/3.1.1
• Constrained application protocol (CoAP)
Let’s take a quick look at each of these protocols in turn.
HTTP is well known, and there are many libraries that support it. Because it is a
simple text based protocol, many small devices such as 8-bit controllers can only
partially support the protocol – for example enough code to POST or GET a
resource. The larger 32-bit based devices can utilize full HTTP client libraries that
properly implement the whole protocol. There are several protocols optimized for
IoT use. The two best known are MQTT6 and CoAP7. MQTT was invented in 1999
to solve issues in embedded systems and SCADA. It has been through some
iterations and the current version (3.1.1) is undergoing standardization in the OASIS
MQTT Technical Committee8. MQTT is a publish-subscribe messaging system
based on a broker model. The protocol has a very small overhead (as little as 2 bytes
per message), and was designed to support lossy and intermittently connected
networks. MQTT was designed to flow over TCP. In addition there is an associated
specification designed for ZigBee-style networks called MQTT-SN (Sensor
Networks). CoAP is a protocol from the IETF that is designed to provide a RESTful
application protocol modeled on HTTP semantics, but with a much smaller footprint
and a binary rather than a text-based approach. CoAP is a more traditional client-
server approach rather than a brokered approach. CoAP is designed to be used over

School of Computing 38
UDP.
For the reference architecture we have opted to select MQTT as the preferred device
communication protocol, with HTTP as an alternative option.
The reasons to select MQTT and not CoAP at this stage are
• Better adoption and wider library support for MQTT;
• Simplified bridging into existing event collection and event processing systems; and
• Simpler connectivity over firewalls and NAT networks
However, both protocols have specific strengths (and weaknesses) and so there
will be some situations where CoAP may be preferable and could be swapped in. In
order to support MQTT we
need to have an MQTT broker in the architecture as well as device libraries. We will
discuss this with regard to security and scalability later.
One important aspect with IoT devices is not just for the device to send data to the
cloud/ server, but also the reverse. This is one of the benefits of the MQTT
specification: because it is a brokered model, clients connect an outbound connection
to the broker, whether or not the device is acting as a publisher or subscriber. This
usually avoids firewall problems because this approach works even behind firewalls
or via NAT. In the case where the main communication is based on HTTP, the
traditional approach for sending data to the device would be to use HTTP Polling.
This is very inefficient and costly, both in terms of network traffic as well as power
requirements. The modern replacement for this is the WebSocket protocol9 that
allows an HTTP connection to be upgraded into a full two-way connection. This
then acts as a socket channel (similar to a pure TCP channel) between the server and
client. Once that has been established, it is up to the system to choose an ongoing
protocol to tunnel over the connection. For the reference architecture we once again
recommend using MQTT as a protocol with WebSockets. In some cases, MQTT
over WebSockets will be the only protocol. This is because it is even more firewall-
friendly than the base MQTT specification as well as supporting pure
School of Computing 39
browser/JavaScript clients using the same protocol. Note that while there is some
support for WebSockets on small controllers, such as Arduino, the combination of
network code, HTTP and WebSockets would utilize most of the available code space
on a typical Arduino 8-bit device. Therefore, we only recommend the use of
WebSockets on the larger 32-bit devices.
AGGREGATION/BUS LAYER
An important layer of the architecture is the layer that aggregates and brokers
communications. This is an important layer for three reasons:
1. The ability to support an HTTP server and/or an MQTT broker to talk to the devices
2. The ability to aggregate and combine communications from different devices
and to route communications to a specific device (possibly via a gateway)
3. The ability to bridge and transform between different protocols, e.g. to offer
HTTP based APIs that are mediated into an MQTT message going to the device.
The aggregation/bus layer provides these capabilities as well as adapting into legacy
protocols. The bus layer may also provide some simple correlation and mapping
from different correlation models (e.g. mapping a device ID into an owner’s ID or
vice-versa). Finally the aggregation/bus layer needs
to perform two key security roles. It must be able to act as an OAuth2 Resource
Server (validating Bearer Tokens and associated resource access scopes). It must
also be able to act as a policy enforcement point (PEP) for policy-based access. In
this model, the bus makes requests to the identity and access management layer to
validate access requests. The identity and access management layer acts as a policy
decision point (PDP) in this process. The bus layer then implements the results of
these calls to the PDP to either allow or disallow resource access.

School of Computing 40
EVENT PROCESSING AND ANALYTICS LAYER
This layer takes the events from the bus and provides the ability to process and act
upon these events. A core capability here is the requirement to store the data into a
database. This may happen in three forms. The traditional model here would be to
write a server side application, e.g. this could be a JAX-RS application backed by a
database. However, there are many approaches where we can support more agile
approaches. The first of these is to use a big data analytics platform. This is a cloud-
scalable platform that supports technologies such as Apache Hadoop to provide
highly scalable map reduce analytics on the data coming from the devices. The
second approach is to support complex event processing to initiate near real-time
activities and actions based on data from the devices and from the rest of the system.
Our recommended approach in this space is to use the following approaches:
• Highly scalable, column-based data storage for storing events
• Map-reduce for long-running batch-oriented processing of data
• Complex event processing for fast in-memory processing and near real-time
reaction and autonomic actions based on the data and activity of devices and other
systems
• In addition, this layer may support traditional application processing platforms, such
as Java Beans, JAX-RS logic, message-driven beans, or alternatives, such as node.js,
PHP, Ruby or Python. CLIENT/EXTERNAL COMMUNICATIONS LAYER
The reference architecture needs to provide a way for these devices to communicate
outside of the device-oriented system. This includes three main approaches. Firstly,
we need the ability to create web-based front-ends and portals that interact with
devices and with the event-processing layer.

School of Computing 41
Secondly, we need the ability to create dashboards that offer views into analytics
and event processing. Finally, we need to be able to interact with systems outside this
network using machine- to-machine communications (APIs). These APIs need to be
managed and controlled and this happens in an API management system. The
recommended approach to building the web front end is to utilize a modular front-
end architecture, such as a portal, which allows simple fast composition of useful UIs.
Of course the architecture also supports existing Web server-side technology, such as
Java Servlets/ JSP, PHP, Python, Ruby, etc. Our recommended approach is based on
the Java framework and the most popular Java-based web server, Apache Tomcat.
The dashboard is a re- usable system focused on creating graphs and other
visualizations of data coming from the devices and the event processing layer.
The API management layer provides three main functions:
• The first is that it provides a developer-focused portal (as opposed to the user
focused portal previously mentioned), where developers can find, explore, and
subscribe to APIs from the system. There is also support for publishers to create,
version, and manage the available and published APIs;
• The second is a gateway that manages access to the APIs, performing access
control checks (for external requests) as well as throttling usage based on policies. It
also performs routing and load- balancing;
• The final aspect is that the gateway publishes data into the analytics layer where it is
stored as well as processed to provide insights into how the APIs are used.
DEVICE MANAGEMENT
Device management (DM) is handled by two components. A server-side system (the
device manager) communicates with devices via various protocols and provides both
individual and bulk control of devices. It also remotely manages software and
applications deployed on the device. It can lock and/or wipe the device if necessary.
The device manager works in conjunction with the device management agents.
There are multiple different agents for different platforms and device types. The

School of Computing 42
device manager also needs to maintain the list of device identities and map these
into owners. It must also work with the identity and access management layer to
manage access controls over devices (e.g. who else can manage the device apart
from the owner, how much control does the owner have vs. the administrator, etc.)
There are three levels of device: non-managed, semi-managed and fully managed
(NM, SM, FM). Fully managed devices are those that run a full DM agent. A full
DM agent supports:
• Managing the software on the device
• Enabling/disabling features of the device (e.g. camera, hardware, etc.)
• Management of security controls and identifiers
• Monitoring the availability of the device
• Maintaining a record of the device’s location if available
• Locking or wiping the device remotely if the device is compromised, etc.
Non-managed devices can communicate with the rest of the network, but have no
agent involved. These may include 8-bit devices where the constraints are too small
to support the agent. The device manager may still maintain information on the
availability and location of the device if this is available.
Semi-managed devices are those that implement some parts of the DM (e.g. feature
control, but not software management).
IDENTITY AND ACCESS MANAGEMENT
The final layer is the identity and access management layer. This layer needs
to provide the following services:
• OAuth2 token issuing and validation
• Other identity services including SAML2 SSO and OpenID Connect support
for identifying inbound requests from the Web layer
• XACML PDP
• Directory of users (e.g. LDAP)
• Policy management for access control (policy control point)

School of Computing 43
The identity layer may of course have other requirements specific to the other
identity and access management for a given instantiation of the reference
architecture. In this section we have outlined the major components of the reference
architecture as well as specific decisions we have taken around technologies. These
decisions are motivated by the specific requirements of IoT architectures as well as
best practices for building agile, evolvable, scalable Internet architectures. Of
course there are other options, but this reference architecture utilizes proven
approaches that are known to be successful in real-life IoT projects we have
worked on.

1
SCHOOL OF COMPUTING
DEPARTMENT OF COMPUTER SCIENCE AND ENGINEERING
UNIT – II – Internet of Things – SCSA5301

2
ELEMENTS OF IOT
Application Sensors & Actuators - Edge Networking (WSN) – Gateways - IoT
Communication Model – WPAN & LPWA, IoT platform for available applications,
Hardware Devices: Arduino, Raspberry pi and Smartwifi, etc, Wearable Development
Boards, Softwares, Programs and Stacks available for building IoT applications, Installation
of various packages necessary for project and list of tools.
1.SENSORS AND ACTUATORS
A transducer is any physical device that converts one form of energy into another. So,
in the case of a sensor, the transducer converts some physical phenomenon into an
electrical impulse that can then be interpreted to determine a reading. A microphone is a
sensor that takes vibration energy (sound waves), and converts it to electrical energy in a
useful way for other components in the system to correlate back to the original sound.
Another type of transducer that we will encounter in many IoT systems is an actuator. In
simple terms, an actuator operates in the reverse direction of a sensor. It takes an electrical
input and turns it into physical action. For instance, an electric motor, a hydraulic system,
and a pneumatic system are all different types of actuators.
Examples of actuators
Digital micromirror device
Electric motor
Electroactive polymer
Hydraulic cylinder
Piezoelectric actuator
Pneumatic actuator
Screw jack
Servomechanism
Solenoid
Stepper motor
In typical IoT systems, a sensor may collect information and route to a control center
where a decision is made and a corresponding command is sent back to an actuator in
response to that sensed input. There are many different types of sensors. Flow sensors,
temperature sensors, voltage sensors, humidity sensors, and the list goes on. In addition,
there are multiple ways to measure the same thing. For instance, airflow might be measured
by using a small propeller like the one you would see on a weather station. Alternatively, as
in a vehicle measuring the air through the engine, airflow is measured by heating a small

3
element and measuring the rate at which the element is cooling.
We live in a World of Sensors. You can find different types of Sensors in our homes,
offices, cars etc. working to make our lives easier by turning on the lights by detecting our
presence, adjusting the room temperature, detect smoke or fire, make us delicious coffee,
open garage doors as soon as our car is near the door and many other tasks.
The example we are talking about here is the Autopilot System in aircrafts. Almost all
civilian and military aircrafts have the feature of Automatic Flight Control system or
sometimes called as Autopilot. An Automatic Flight Control System consists of several
sensors for various tasks like speed control, height, position, doors, obstacle, fuel and many
more. A Computer takes data from all these sensors and processes them by comparing them
with pre-designed values. The computer then provides control signal to different parts like
engines, flaps, rudders etc. that help in a smooth flight.
All the parameters i.e. the Sensors (which give inputs to the Computers), the Computers (the
brains of the system) and the mechanics (the outputs of the system like engines and motors)
are equally important in building a successful automated system. Sensor as an input device
which provides an output (signal) with respect to a specific physical quantity (input). Sensor
means that it is part of a bigger system which provides input to a main control system (like a
Processor or a Microcontroller).
S.No Sensor Applications Technology
1.
Inertial sensors
Industrial machinery,
automotive, human
activity
MEMS and
Gyroscope
2. Speed Measuring
Sensor
Industrial machinery,
automotive, human activity Magnetic, light
3. Proximity sensor
Industrial machinery,
automotive, human
activity
Capacitive,
Inductive, Magnetic,
Light,
Ultrasound
4. Occupancy sensor Home/office monitoring
PassiveIR,
Ultrasound most
common
5. Temperature/humidity
sensor
Home/office HVAC control,
automotive, industrial
Solid state,
thermocouple
6.
Light sensor Home/office/industrial
lighting control
Solid state, photocell,
Photo
resistor,
photodiode

4
7.
Power
(current)
sensor
Home/office/industrial
powermonitoring/control
Technology
Coil (Faraday‘s law),
Hall effect
8. Air/fluid pressure
sensor
Industrial
monitoring/control,
automotive, agriculture
Capacitive, Resistive
9. Acoustic sensor Industrial monitoring/control,
human interface
Diaphragm
condenser
10. Strain sensor Industrial monitoring/control,
civil infrastructure
Resistive thin films
In the first classification of the sensors, they are divided in to Active and Passive. Active
Sensors are those which require an external excitation signal or a power signal. Passive
Sensors, on the other hand, do not require any external power signal and directly generates
output response. The other type of classification is based on the means of detection used in
the sensor. Some of the means of detection are Electric, Biological, Chemical, Radioactive
etc.
The next classification is based on conversion phenomenon i.e. the input and the output.
Some of the common conversion phenomena are Photoelectric, Thermoelectric,
Electrochemical, Electromagnetic, Thermo-optic, etc. The final classification of the sensors
are Analog and Digital Sensors. Analog Sensors produce an analog output i.e. a continuous
output signal with respect to the quantity being measured.
Digital Sensors, in contrast to Analog Sensors, work with discrete or digital data. The data
in digital sensors, which is used for conversion and transmission, is digital in nature.
5
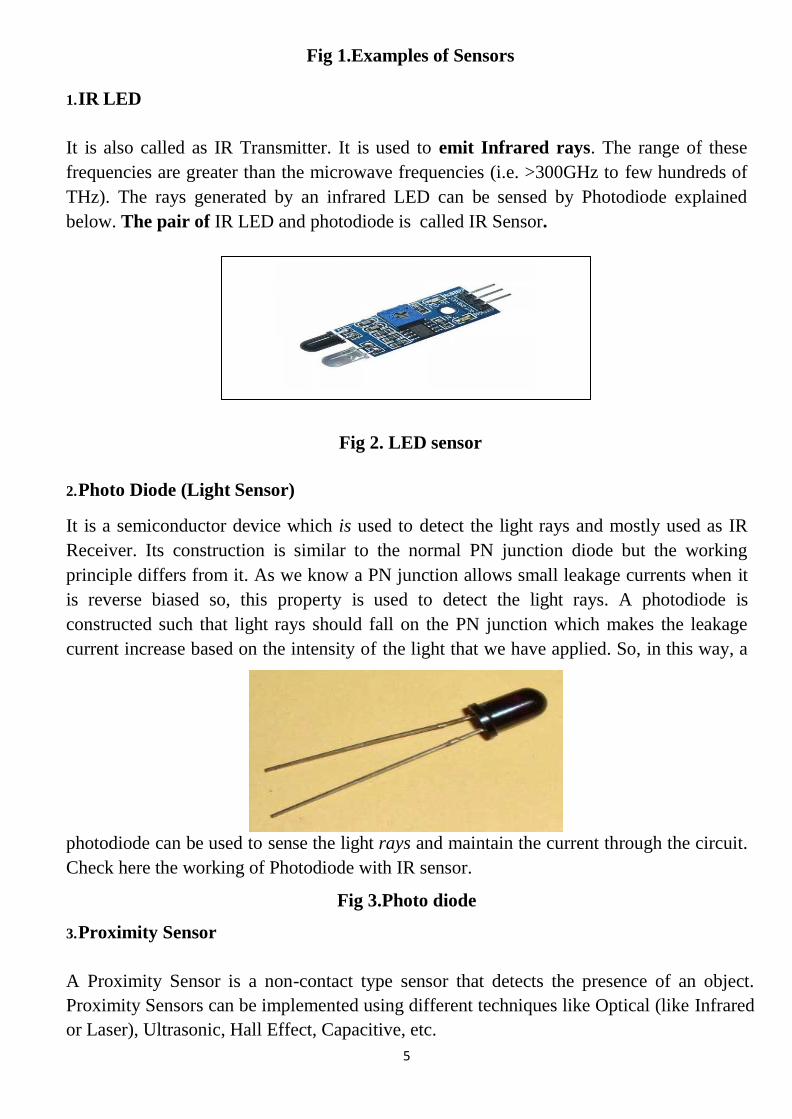
Fig 1.Examples of Sensors
1. IR LED
It is also called as IR Transmitter. It is used to emit Infrared rays. The range of these
frequencies are greater than the microwave frequencies (i.e. >300GHz to few hundreds of
THz). The rays generated by an infrared LED can be sensed by Photodiode explained
below. The pair of IR LED and photodiode is called IR Sensor.
Fig 2. LED sensor
2. Photo Diode (Light Sensor)
It is a semiconductor device which is used to detect the light rays and mostly used as IR
Receiver. Its construction is similar to the normal PN junction diode but the working
principle differs from it. As we know a PN junction allows small leakage currents when it
is reverse biased so, this property is used to detect the light rays. A photodiode is
constructed such that light rays should fall on the PN junction which makes the leakage
current increase based on the intensity of the light that we have applied. So, in this way, a
photodiode can be used to sense the light rays and maintain the current through the circuit.
Check here the working of Photodiode with IR sensor.
Fig 3.Photo diode
3. Proximity Sensor
A Proximity Sensor is a non-contact type sensor that detects the presence of an object.
Proximity Sensors can be implemented using different techniques like Optical (like Infrared
or Laser), Ultrasonic, Hall Effect, Capacitive, etc.

6
Fig 4.Proximity sensor
Some of the applications of Proximity Sensors are Mobile Phones, Cars (Parking Sensors),
industries (object alignment), Ground Proximity in Aircrafts, etc. Proximity Sensor in
Reverse Parking is implemented in this Project: Reverse Parking Sensor Circuit.
4. LDR (Light Dependent Resistor)
As the name itself specifies that the resistor that depends upon the light intensity. It works
on the principle of photoconductivity which means the conduction due to the light. It is
generally made up of Cadmium sulfide. When light falls on the LDR, its resistance
decreases and acts similar to a conductor and when no light falls on it, its resistance is
almost in the range of MΩ or ideally it acts as an open circuit. One note should be
considered with LDR is that it won‘t respond if the light is not exactly focused on its
surface.
Fig 5.LDR
With a proper circuitry using a transistor it can be used to detect the availability of light. A
voltage divider biased transistor with R2 (resistor between base and emitter) replaced with
an LDR can work as a light detector.
5. Thermistor (Temperature Sensor)
A thermistor can be used to detect the variation in temperature. It has a negative

7
temperature coefficient that means when the temperature increases the resistance
decreases. So, the thermistor‘s resistance can be varied with the rise in temperature which
causes more current flow through it. This change in current flow can be used to determine
the amount of change in temperature. An application for thermistor is, it is used to detect
the rise in temperature and control the leakage current in a transistor circuit which helps in
maintaining its stability. Here is one simple application for Thermistor to control the DC
fan automatically.
Fig 6.Thermistor
6. Thermocouple (Temperature Sensor)
Another component that can detect the variation in temperature is a thermocouple. In its
construction, two different metals are joined together to form a junction. Its main principle
is when the junction of two different metals are heated or exposed to high temperatures a
potential across their terminals varies. So, the varying potential can be further used to
measure the amount of change in temperature.
Fig 7.Thermo couple

8
7. Strain Gauge (Pressure/Force Sensor)
A strain gauge is used to detect pressure when a load is applied. It works on the principle
of resistance, we know that the resistance is directly proportional to the length of the wire
and is inversely proportional to its cross-sectional area (R=ρl/a). The same principle can be
used here to measure the load. On a flexible board, a wire is arranged in a zig-zag manner
as shown in the figure below. So, when the pressure is applied to that particular board, it
bends in a direction causing the change in overall length and cross- sectional area of the
wire. This leads to change in resistance of the wire. The resistance thus obtained is very
minute (few ohms) which can be determined with the help of the Wheatstone bridge. The
strain gauge is placed in one of the four arms in a bridge with the remaining values
unchanged. Therefore, when the pressure is applied to it as the resistance changes the
current passing through the bridge varies and pressure can be calculated.
Strain gauges are majorly used to calculate the amount of pressure that an airplane wing
can withstand and it is also used to measure the number of vehicles allowable on a
particular road etc.
Fig 8.Strain Guage
8. Load Cell (Weight Sensor)
Load cells are similar to strain gauges which measure the physical quantity like force and
give the output in form of electrical signals. When some tension is applied on the load cell
it structure varies causing the change in resistance and finally, its value can be calibrated

9
using a Wheatstone bridge. Here is the project on how to measure weight using Load cell.
Fig 9.Load Cell
9. Potentiometer
A potentiometer is used to detect the position. It generally has various ranges of resistors
connected to different poles of the switch. A potentiometer can be either rotary or linear type.
In rotary type, a wiper is connected to a long shaft which can be rotated. When the shaft has
rotated the position of the wiper alters such that the resultant resistance varies causing the
change in the output voltage. Thus the output can be calibrated to detect the change its
position.
Fig 10.Potentiometer
10. Encoder
To detect the change in the position an encoder can also be used. It has a circular rotatable
disk-like structure with specific openings in between such that when the IR rays or light
rays pass through it only a few light rays get detected. Further, these rays are encoded into
a digital data (in terms of binary) which represents the specific position.
Fig 11.Encoder
11 Hall Sensor
The name itself states that it is the sensor which works on the Hall Effect. It can be defined
as when a magnetic field is brought close to the current carrying conductor (perpendicular
to the direction of the electric field) then a potential difference is developed across the

10
given conductor. Using this property a Hall sensor is used to detect the magnetic field
and gives output in terms of voltage. Care should be taken that the Hall sensor can detect
only one pole of the magnet.
Fig 12.Hall sensor
The hall sensor is used in few smartphones which are helpful in turning off the screen
when the flap cover (which has a magnet in it) is closed onto the screen. Here is one
practical application of Hall Effect sensor in Door Alarm.
12. Flex Sensor
A FLEX sensor is a transducer which changes its resistance when its shape is changed or
when it is bent. A FLEX sensor is 2.2 inches long or of finger length. Simply speaking the
sensor terminal resistance increases when it‘s bent. This change in resistance can do no
good unless we can read them. The controller at hand can only read the changes in
voltage and nothing less, for this, we are going to use voltage divider circuit, with that
we can derive the resistance change as a voltage change.
Fig 13. Flex sensor
13. Microphone (Sound Sensor)
Microphone can be seen on all the smartphones or mobiles. It can detect the audio signal
and convert them into small voltage (mV) electrical signals. A microphone can be of many
types like condenser microphone, crystal microphone, carbon microphone etc. each type of
microphone work on the properties like capacitance, piezoelectric effect, resistance
respectively. Let us see the operation of a crystal microphone which works on the

11
piezoelectric effect. A bimorph crystal is used which under pressure or vibrations produces
proportional alternating voltage. A diaphragm is connected to the crystal through a drive
pin such that when the sound signal hits the diaphragm it moves to and fro, this movement
changes the position of the drive pin which causes vibrations in the crystal thus an
alternating voltage is generated with respect to the applied sound signal. The obtained
voltage is fed to an amplifier in order to increase the overall strength of the signal.
Fig 14.Microphone
14. Ultrasonic sensor
Ultrasonic means nothing but the range of the frequencies. Its range is greater than audible
range (>20 kHz) so even it is switched on we can‘t sense these sound signals. Only specific
speakers and receivers can sense those ultrasonic waves. This ultrasonic sensor is used to
calculate the distance between the ultrasonic transmitter and the target and also used to
measure the velocity of the target.
Ultrasonic sensor HC-SR04 can be used to measure distance in the range of 2cm-400cm
with an accuracy of 3mm. Let‘s see how this module works. The HCSR04 module
generates a sound vibration in ultrasonic range when we make the ‗Trigger‘ pin high for
about 10us which will send an 8 cycle sonic burst at the speed of sound and after striking
the object, it will be received by the Echo pin. Depending on the time taken by sound
vibration to get back, it provides the appropriate pulse output. We can calculate the
distance of the object based on the time taken by the ultrasonic wave to return back to the
sensor.
Fig 15.Utrasonic sensor

12
There are many applications with the ultrasonic sensor. We can make use of it avoid
obstacles for the automated cars, moving robots etc. The same principle will be used in the
RADAR for detecting the intruder missiles and airplanes. A mosquito can sense the
ultrasonic sounds. So, ultrasonic waves can be used as mosquito repellent.
15. Touch Sensor
In this generation, we can say that almost all are using smartphones which have widescreen
that too a screen which can sense our touch. So, let‘s see how this touchscreen works.
Basically, there are two types of touch sensors resistive based and a capacitive based
touch screens. Let‘s know about working of these sensors briefly.
The resistive touch screen has a resistive sheet at the base and a conductive sheet under the
screen both of these are separated by an air gap with a small voltage applied to the sheets.
When we press or touch the screen the conductive sheet touches the resistive sheet at that
point causing current flow at that particular point, the software senses the location and
relevant action is performed.
Fig 16.Touch sensor
16. PIR sensor
PIR sensor stands for Passive Infrared sensor. These are used to detect the motion of
humans, animals or things. We know that infrared rays have a property of reflection. When
an infrared ray hits an object, depending upon the temperature of the target the infrared ray
properties changes, this received signal determines the motion of the objects or the living
beings. Even if the shape of the object alters, the properties of the reflected infrared rays
can differentiate the objects precisely. Here is the complete working or PIR sensor.

13
Fig 17.PIR Sensor
17. Accelerometer (Tilt Sensor)
An accelerometer sensor can sense the tilt or movement of it in a particular direction. It
works based on the acceleration force caused due to the earth‘s gravity. The tiny internal
parts of it are such sensitive that those will react to a small external change in position. It
has a piezoelectric crystal when tilted causes disturbance in the crystal and generates
potential which determines the exact position with respect to X, Y and Z axis.
Fig 18.Accelerometer
These are commonly seen in mobiles and laptops in order to avoid breakage of processors
leads. When the device falls the accelerometer detects the falling condition and does
respective action based on the software.
18. Gas sensor
In industrial applications gas sensors plays a major role in detecting the gas leakage. If no
such device is installed in such areas it ultimately leads to an unbelievable disaster. These
gas sensors are classified into various types based on the type of gas that to be detected.
Let‘s see how this sensor works. Underneath a metal sheet there exists a sensing element
which is connected to the terminals where a current is applied to it. When the gas particles
hit the sensing element, it leads to a chemical reaction such that the resistance of the
elements varies and current through it also alters which finally can detect the gas.

14
Fig 19.Gas Sensor
So finally, we can conclude that sensors are not only used to make our work simple to
measure the physical quantities, making the devices automated but also used to help living
beings with disasters.
19. Resistive Sensors
Resistive sensors, such as the potentiometer, have three terminals: power input, grounding
terminal, and variable voltage output. These mechanical devices have varied resistance that
can be changed through movable contact with its fixed resistor. Output from the sensor
varies depending on whether the movable contact is near the resistor's supple end or
ground end. Thermistors are also variable resistors, although the resistance of the sensor
varies with temperature
Fig 20 Resistive Sensors
20. Voltage generating sensors
Voltage-generating sensors, such as piezo electrics, generate electricity by pressure with
types of crystals like quartz. As the crystal flexes or vibrates, AC voltage is produced.
Knock sensors utilize this technology by sending a signal to an automobile's on-board
computer that engine knock is happening. The signal is generated through crystal vibration
within the sensor, which is caused by cylinder block vibration. The computer, in turn,
reduces the ignition timing to stop the engine knock.
21. Switch
Sensors
.
Fig 21.Voltage Generating Sensors

15
Switch sensors are composed of a set of contacts that open when close to a magnet. A reed
switch is a common example of a switch sensor and is most commonly used as a speed or
position sensor. As a speed sensor, a magnet is attached to the speedometer cable and spins
along with it. Each time one of the magnet's poles passes the reed switch, it opens and then
closes. How fast the magnet passes allows the sensor to read the vehicle's speed.
Fig 22.Switch Sensors
2.Edge Networking
Embedded systems are already playing a crucial role in the development of the
IoT. In broad strokes, there are four main components of an IoT system:
1. The Thing itself (the device)
2. The Local Network; this can include a gateway, which translates proprietary
communication protocols to Internet Protocol
3. The Internet
4. Back-End Services; enterprise data systems, or PCs and mobile devices
Fig 23.Embedded Point of View
We can also separate the Internet of Things in two broad categories:
.
1. Industrial IoT, where the local network is based on any one of many different
technologies. The IoT device will typically be connected to an IP network to
the global Internet.
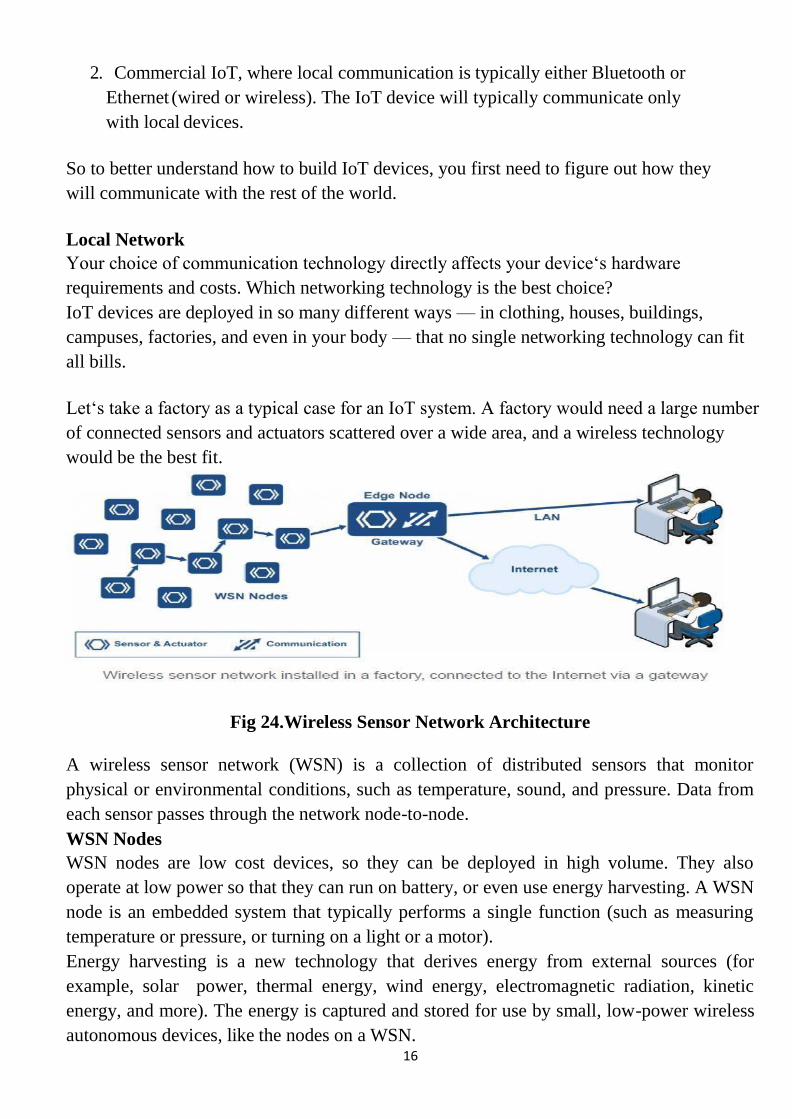
16
2. Commercial IoT, where local communication is typically either Bluetooth or
Ethernet (wired or wireless). The IoT device will typically communicate only
with local devices.
So to better understand how to build IoT devices, you first need to figure out how they
will communicate with the rest of the world.
Local Network
Your choice of communication technology directly affects your device‘s hardware
requirements and costs. Which networking technology is the best choice?
IoT devices are deployed in so many different ways — in clothing, houses, buildings,
campuses, factories, and even in your body — that no single networking technology can fit
all bills.
Let‘s take a factory as a typical case for an IoT system. A factory would need a large number
of connected sensors and actuators scattered over a wide area, and a wireless technology
would be the best fit.
Fig 24.Wireless Sensor Network Architecture
A wireless sensor network (WSN) is a collection of distributed sensors that monitor
physical or environmental conditions, such as temperature, sound, and pressure. Data from
each sensor passes through the network node-to-node.
WSN Nodes
WSN nodes are low cost devices, so they can be deployed in high volume. They also
operate at low power so that they can run on battery, or even use energy harvesting. A WSN
node is an embedded system that typically performs a single function (such as measuring
temperature or pressure, or turning on a light or a motor).
Energy harvesting is a new technology that derives energy from external sources (for
example, solar power, thermal energy, wind energy, electromagnetic radiation, kinetic
energy, and more). The energy is captured and stored for use by small, low-power wireless
autonomous devices, like the nodes on a WSN.
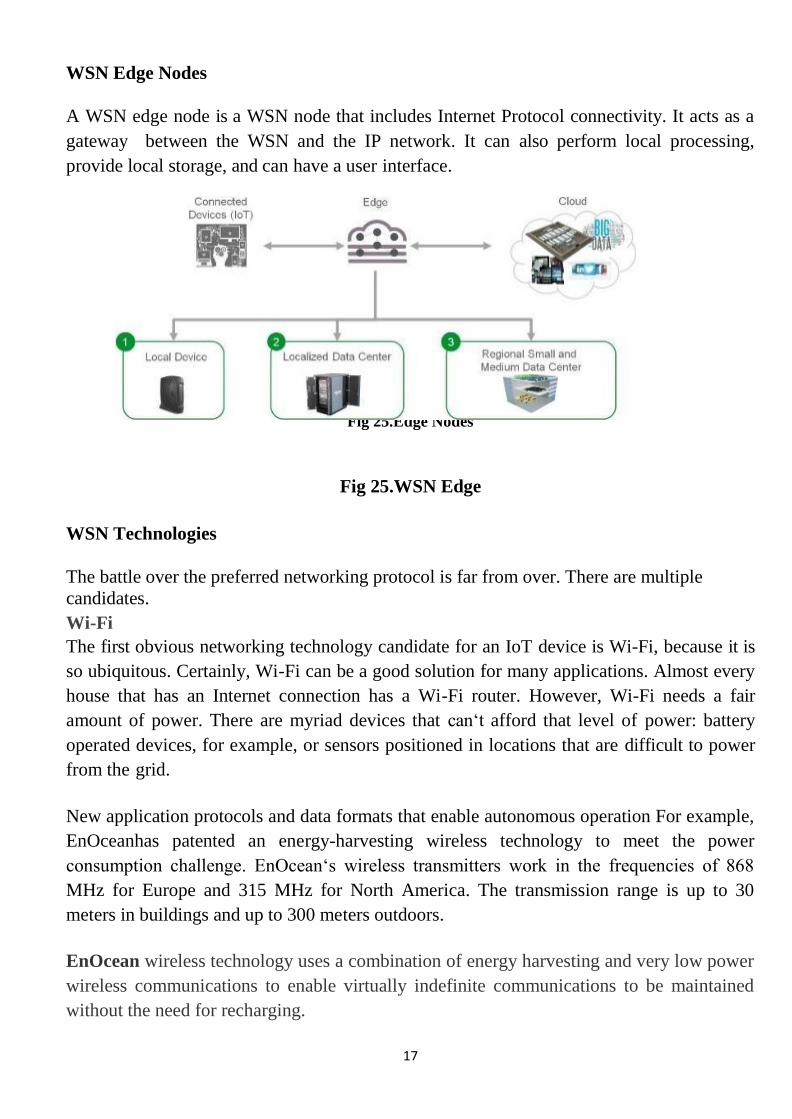
17
Fig 25.Edge Nodes
WSN Edge Nodes
A WSN edge node is a WSN node that includes Internet Protocol connectivity. It acts as a
gateway between the WSN and the IP network. It can also perform local processing,
provide local storage, and can have a user interface.
Fig 25.WSN Edge
WSN Technologies
The battle over the preferred networking protocol is far from over. There are multiple
candidates.
Wi-Fi
The first obvious networking technology candidate for an IoT device is Wi-Fi, because it is
so ubiquitous. Certainly, Wi-Fi can be a good solution for many applications. Almost every
house that has an Internet connection has a Wi-Fi router. However, Wi-Fi needs a fair
amount of power. There are myriad devices that can‘t afford that level of power: battery
operated devices, for example, or sensors positioned in locations that are difficult to power
from the grid.
New application protocols and data formats that enable autonomous operation For example,
EnOceanhas patented an energy-harvesting wireless technology to meet the power
consumption challenge. EnOcean‘s wireless transmitters work in the frequencies of 868
MHz for Europe and 315 MHz for North America. The transmission range is up to 30
meters in buildings and up to 300 meters outdoors.
EnOcean wireless technology uses a combination of energy harvesting and very low power
wireless communications to enable virtually indefinite communications to be maintained
without the need for recharging.

18
The EnOcean technology is used for wireless sensors, controllers and gateways.
One of the key issues with small machines is the need for ensuring that batteries are
maintained charged. In traditional systems, either mains power was required, or batteries
needed to be replaced, even if only infrequently. The use of EnOcean removes the need for
power to be directly applied thereby reducing the cost of the system operation.
IEEE 802.15.4 Low-Rate Wireless Personal Area Networks (LR-WPANs)
One of the major IoT enablers is the IEEE 802.15.4 radio standard, released in
2003.Commercial radios meeting this standard provide the basis for low-power systems.
This IEEE standard was extended and improved in 2006 and 2011 with the 15.4e and 15.4g
amendments. Power consumption of commercial RF devices is now cut in half compared to
only a few years ago, and we are expecting another 50% reduction with the next generation
of devices.
6LoWPAN
Devices that take advantage of energy-harvesting must perform their tasks in the shortest
time possible, which means that their transmitted messages must be as small as possible.
This requirement has implications for protocol design.
3. Internet of Things Communications Models
From an operational perspective, it is useful to think about how IoT devices
connect and communicate in terms of their technical communication models. In
March 2015, the Internet Architecture Board (IAB) released a guiding architectural
document for networking of smart objects which outlines a framework of four
common communication models used by IoT devices. The discussion below
presents this framework and explains key characteristics of each model in the
framework.
Device-to-Device Communications
The device-to-device communication model represents two or more devices that
directly connect and communicate between one another, rather than through an
intermediary application server. These devices communicate over many types of
networks, including IP networks or the Internet. Often, however these devices use
protocols like Bluetooth, Z-Wave, or ZigBee to establish direct device-to-device
communications, as shown in Figure 26.

19
Manufacturer B Bluetooth,Z+Wave,ZigBee Manufacturer A
Light Switch
Wireless Network
Light Bulb
Fig 26.Example of device-to-device communication model
These device-to-device networks allow devices that adhere to a particular
communication protocol to communicate and exchange messages to achieve their
function. This communication model is commonly used in applications like home
automation systems, which typically use small data packets of information to
communicate between devices with relatively low data rate requirements. Residential
IoT devices like light bulbs, light switches, thermostats, and door locks normally send
small amounts of information to each other (e.g. a door lock status message or turn on
light command) in a home automation scenario.
From the user‘s point of view, this often means that underlying device-to-device
communication2 protocols are not compatible, forcing the user to select a family of
devices that employ a common protocol. For example, the family of devices using the
Z-Wave protocol is not natively compatible with the ZigBee family of devices. While
these incompatibilities limit user choice to devices within a particular protocol family,
the user benefits from knowing that products within a particular family tend to
communicate well.
Device-to-Cloud Communications
In a device-to-cloud communication model, the IoT device connects directly to an
Internet cloud service like an application service provider to exchange data and
control message traffic. This approach frequently takes advantage of existing
communications mechanisms like traditional wired Ethernet or Wi-Fi connections
to establish a connection between the device and the IP network, which ultimately
connects to the cloud service. This is shown in Figure 27.

20
Fig 27.Device-to-cloud communication model diagram.
This communication model is employed by some popular consumer IoT devices
like the Nest Labs Learning Thermostat and the Samsung SmartTV. In the case of
the Nest Learning Thermostat, the device transmits data to a cloud database where
the data can be used to analyze home energy consumption.
Further, this cloud connection enables the user to obtain remote access to their
thermostat via a smartphone or Web interface, and it also supports software updates
to the thermostat. Similarly, with the Samsung SmartTVtechnology, the television
uses an Internet connection to transmit user viewing information to Samsung for
analysis and to enable the interactive voice recognition features of the TV. In these
cases, the device-to-cloud model adds value to the end user by extending the
capabilities of the device beyond its native features.
However, interoperability challenges can arise when attempting to integrate devices
made by different manufacturers. Frequently, the device and cloud service are from
the same vendor. If proprietary data protocols are used between the device and the
cloud service, the device owner or user may be tied to a specific cloud service,
limiting or preventing the use of alternative service providers. This is commonly
referred to as ―vendor lock-in‘‘, a term that encompasses other facets of the
relationship with the provider such as ownership of and access to the data. At the
same time, users can generally have confidence that devices designed for the
specific platform can be integrated.
Device-to-Gateway Model
In the device-to-gateway model, or more typically, the device-to-application-layer
gateway (ALG) model, the IoT device connects through an ALG service as a
conduit to reach a cloud service. In simpler terms, this means that there is
Monoxide Temperature
Device with
Carbon Devicewith
CoAP
DTLS
UDP
IP
Application Service
Provider
HTTP
TLS
TCP
IP

21
application software operating on a local gateway device, which acts as an
intermediary between the device and the cloud service and provides security and
other functionality such as data or protocol translation.
Several forms of this model are found in consumer devices. In many cases, the local
gateway device is a Smartphone running an app to communicate with a device and
relay data to a cloud service. model employed with popular consumer items like
personal fitness trackers. These devices do not have the native ability to connect
directly to a cloud service, so they frequently rely on Smartphone app software to
serve as an intermediary gateway to connect the fitness device to the cloud.
The other form of this device-to-gateway model is the emergence of ―hub‖
devices in home automation applications. These are devices that serve as a local
gateway between individual IoT devices and a cloud service, but they can also bridge
the interoperability gap between devices themselves. For example, the Smart Things
hub is a stand-alone gateway device that has Z-Wave and Zigbee transceivers
installed to communicate with both families of devices. It then connects to the Smart
Things cloud service, allowing the user to gain access to the devices using a
Smartphone app and an Internet connection. The evolution of systems using the
device-to-gateway communication model and its larger role in addressing
interoperability challenges among IoT devices is still unfolding.
Fig 28.Device-to-gateway communication model diagram.
IEEE 802.15.4 (LRDWPAN)
Device with
Carbon
Monoxide
Sensor
Layer 1 Protocol Bluetooth Smart
IEEE 802.11 (WiDFi)
Device with
Temperature
Sensor
CoAP
DTLS
UDP
IPv6
Local Gateway
HTTP
TLS
TCP
IPv6
Protocol Stack
IPv4/IPv6
Application Service
Provider

22
Back-End Data-Sharing Model
The back-end data-sharing model refers to a communication architecture that enables
users to export and analyze smart object data from a cloud service in combination
with data from other sources. This architecture supports ―the [user‘s] desire for
granting access to the uploaded sensor data to third parties. This approach is an
extension of the single device-to-cloud communication model, which can lead to
data silos where ―IoT devices upload data only to a single application
service provider‘‘. A back-end sharing architecture allows the data collected from
single IoT device data streams to be aggregated and analyzed.
For example, a corporate user in charge of an office complex would be interested in
consolidating and analyzing the energy consumption and utilities data produced by
all the IoT sensors and Internet-enabled utility systems on the premises. Often in
the single device-to-cloud model, the data each IoT sensor or system produces sits
in a stand-alone data silo. An effective back-end data sharing architecture would
allow the company to easily access and analyze the data in the cloud produced by
the whole spectrum of devices in the building. Also, this kind of architecture
facilitates data portability needs. Effective back-end data- sharing architectures
allow users to move their data when they switch between IoT services, breaking
down traditional data silo barriers.
The back-end data-sharing model suggests a federated cloud services approach or
cloud applications programmer interfaces (APIs) are needed to achieve
interoperability of smart device data hosted in the cloud. A graphical representation
of this design is shown in Fig 29.

23
Fig 29.Back-end data sharing model
diagram Internet of Things Communications Models Summary
The four basic communication models demonstrate the underlying design
strategies used to allow IoT devices to communicate. Aside from some technical
considerations, the use of these models is largely influenced by the open versus
proprietary nature of the IoT devices being networked. And in the case of the
device-to-gateway model, its primary feature is its ability to overcome proprietary
device restrictions in connecting IoT devices. This means that device
interoperability and open standards are key considerations in the design and
development of internetworked IoT systems.
From a general user perspective, these communication models help illustrate the
ability of

24
networked devices to add value to the end user. By enabling the user to achieve
better access to an IoT device and its data, the overall value of the device is
amplified. For example, in three of the four communication models, the devices
ultimately connect to data analytic services in a cloud computing setting. By
creating data communication conduits to the cloud, users, and service providers
can more readily employ data aggregation, big data analytics, data visualization,
and predictive analytics technologies to get more value out of IoT data than can be
achieved in traditional data-silo applications. In other words, effective
communication architectures are an important driver of value to the end user by
opening possibilities of using information in new ways. It should be noted,
however, these networked benefits come with trade-offs. Careful consideration
needs to be paid to the incurred cost burdens placed on users to connect to cloud
resources when
4. Low Power Wide Area Networks: An Overview
Low Power Wide Area (LPWA) networks represent a novel communication
paradigm, which will complement traditional cellular and short range wireless
technologies in addressing diverse requirements of IoT applications. LPWA
technologies offer unique sets of features including wide- area connectivity for low
power and low data rate devices, not provided by legacy wireless technologies.
LPWA networks are unique because they make different tradeoffs than the
traditional technologies prevalent in IoT landscape such as short-range wireless
networks e.g., Zig- Bee, Bluetooth, Z-Wave, legacy wireless local area networks
(WLANs) e.g., Wi-Fi, and cellular networks e.g. Global Sys- tem for Mobile
Communications (GSM), Long-Term Evolution (LTE) etc. The legacy non-cellular
wireless technologies are not ideal to connect low power devices distributed over
large geographical areas. The range of these technologies is limited to a few hundred
meters at best. The devices, therefore, cannot be arbitrarily deployed or moved
anywhere, a requirement for many applications for smart city, logistics and personal
health The range of these technologies is extended using a dense deployment of
devices and gateways connected using multihop mesh networking. Large
deployments are thus prohibitively expensive. Legacy WLANs, on the other hand, are
characterized by shorter coverage areas and higher power consumption for machine-
type communication (MTC).
A wide area coverage is provided by cellular networks, a reason of a wide adoption of
second generation (2G) and third generation (3G) technologies for M2M
communication. How- ever, an impending decommissioning of these technologies[5],
as announced by some mobile network operators (MNOs),will broaden the
technology gap in connecting low-power devices. In general, traditional cellular

25
technologies do not achieve energy efficiency high enough to offer ten years of
battery lifetime. The complexity and cost of cellular devices is high due to their
ability to deal with complex waveforms, optimized for voice, high speed data
services, and text. For low-power MTC, there is a clear need to strip complexity to
reduce cost. Efforts in this direction are underway for cellular networks by the Third
Generation Partnership Project and are covered as
Fig 30.Applications of LPWA technologies across
different sectors
Key Objective Of LPWA Technologies
A. Long range
LPWA technologies are designed for a wide area coverage and an excellent signal
propagation to hard-to-reach indoor places such as basements. The physical layer
compromises on high data rate and slows downs the modulation rate to put more
energy in each transmitted bit (or symbol). Due to this reason, the receivers can
decode severely attenuated signals correctly. Typical sensitivity of state of the art
LPWA receivers reaches as low as -130 dBm.
B. Ultra low power operation
Ulra-low power operation is a key requirement to tap into the huge business
opportunity provided by battery-powered IoT/M2M devices. A battery lifetime of
10 years or more with AA or coin cell batteries is desirable to bring the
maintenance cost down.
C. Topology

26
While mesh topology has been extensively used to extend the coverage of short
range wireless networks, their high deployment cost is a major disadvantage in con-
necting large number of geographically distributed devices. Further, as the traffic is
forwarded over multiple hops towards a gateway, some nodes get more congested
than others depend- ing on their location or network traffic patterns. Therefore, they
deplete their batteries quickly, limiting overall network lifetime to only a few
months to years .On the other hand, a very long range of LPWA technologies
overcomes these limitations by connecting end devices directly to base stations,
obviating the need for the dense and expensive deployments of relays and gateways
altogether. The resulting topology is a star that is used extensively in cellular
networks and brings huge energy saving advantages. As opposed to the mesh
topology, the devices need not to waste precious energy in busy-listening to other
devices that want to relay their traffic through them. An always-on base
station provides convenient and quick access when required by the end-devices.
D. Duty Cycling: Low power operation is achieved by opportunistically turning off
power hungry components of M2M/IoT devices e.g., data transceiver. Radio duty
cycling allows LPWA end devices to turn off their transceivers, when not required. Only
when the data is to be transmitted or received, the transceiver is turned on.
E. Lightweight Medium Access Control: Most-widely used Medium Access Control
(MAC) rotocols for cellular net- works or short range wireless networks are too complex
for LPWA technologies. For example, cellular networks synchro- nize the base stations
and the user equipment (UE) accurately to benefit from complex MAC schemes that
exploit frequency.
CHALLENGES AND OPEN RESEARCH DIRECTIONS LPWA
On the business side, the proprietary solution providers are in a rush to bring their
services to the market and capture their share across multiple verticals. In this race,
it is easy but counter- productive to overlook important challenges faced by LPWA
technologies. In this section, we highlight these challenges and some research
directions to overcome them and improve performance in long-term.
1. Scaling networks to massive number of devices
LPWA technologies will connect tens of millions of devices transmitting data at an
unprecedented scale over limited and often shared radio resources. This complex
resource allocation problem is further complicated by several other factors. First, the
device density may vary significantly across different geographical areas, creating

27
the so called hot-spot problem. These hot-spots will put the LPWA base stations to a
stress test. Second, cross-technology interference can severely de- grade the
performance of LPWA technologies.
2. Interoperability between different LPWA technologies
Given that market is heading towards an intense competition between different
LPWA technologies, it is safe to assume that several may coexist in future.
Interoperability between these heterogeneous technologies is thus crucial to their
long- term profitability. With little to no support for interoperability between
different technologies, a need for standards that glue them together is strong.
Interoperability is a still an open challenge. Test beds and open-source tool chains
for LPWA technologies are not yet widely available to evaluate interoperability
mechanisms.
3. Localization
LPWA networks expect to generate significant revenue from logistics, supply
chain management, and personal IoT applications, where location of mobile
objects, vehicles, humans, and animals may be of utmost interest. An accurate
localization support is thus an important feature for keeping track of valuables,
kids, elderly, pets, shipments, vehicle fleets, etc. In fact, it is regarded as an
important feature to enable new applications.
4. Link optimizations and adaptability
If a LPWA technology permits, each individual link should be optimized for high
link quality and low energy consumption to maximize overall network capacity.
Every LPWA technology allows multiple link level configurations that introduce
tradeoffs between different performance metrics such as data rate, time-on-air,
area coverage, etc. This motivates a need for adaptive techniques that can monitor
link quality and then read just its parameters for better performance. However for
such techniques to work, a feedback from gateway to end devices is usually
required over down link.
5. LPWA test beds and tools
LPWA technologies enable several smart city applications. A few smart city test
beds e.g. Smart Santander have emerged in recent years. Such test beds
incorporate sensors equipped with different wireless technologies such as Wi-Fi,
IEEE 802.15.4 based networks and cellular networks. How- ever, there are so far
no open test beds for LPWA networks. Therefore, it is not cost-effective to
widely design LPWA systems and compare their performance at a metropolitan
scale. At the time of writing, only a handful of empirical studies compare two
our more LPWA technologies under same conditions. In our opinion, it is a
significant barrier to entry for potential customers. Providing LPWA

28
technologies as a scientific instrumentation for general public through city
governments can act as a confidence building measure.
6. Authentication, Security, and Privacy
Authentication, security, and privacy are some of the most important features of
any communication system. Cellular networks provide proven authentication,
security, and privacy mechanisms. Use of Subscriber Identity Modules (SIM)
simplifies identification and authentication of the cellular devices. LPWA
technologies, due to their cost and energy considerations, not only settle for
simpler communication protocols but also depart from SIM based authentication.
Techniques and protocols are thus required to provide equivalent or better
authentication support for LPWA technologies. Further to assure that end devices
are not exposed to any security risks over prolonged duration, a support for over-
the-air (OTA) updates is a crucial feature. A lack of adequate support for OTA
updates poses a great security risk to most LPWA technologies.
7. Mobility and Roaming
Roaming of devices between different network operators is a vital feature
responsible for the commercial success of cellular networks. Whilst some LPWA
technologies do not have the notion of roaming (work on a global scale such as
SIGFOX), there are others that do not have support for roaming as of the time of
this writing. The major challenge is to provide roaming without compromising the
lifetime of the devices. To this effect, the roaming support should put minimal
burden on the battery powered end-devices. Because the end-devices duty cycle
aggressively, it is reasonable to assume that the low power devices cannot receive
downlink traffic at all times. Data exchanges over the uplink should be exploited
more aggressively. Network assignment is to be resolved in backend systems as
opposed to the access network. All the issues related to agility of roaming process
and efficient resource management have to bead dressed.

29
5. Wireless Personal Area Network (WPAN)
WPANs are used to convey information over short distances among a private,
intimate group of participant devices. Unlike a WLAN, a connection made through a
WPAN involves little or no infrastructure or direct connectivity to the world outside the
link. This allows small, power-efficient, inexpensive solutions to be implemented for a
wide range of device.
Applications
Short-range (< 10 m) connectivity for multimedia applications
PDAs, cameras, voice (hands free devices)
High QoS, high data rate (IEEE 802.15.3)
Industrial sensor applications
Low speed, low battery, low cost sensor networks (IEEE 802.15.4)
Common goals
Getting rid of cable connections
Little or no infrastructure
Device interoperability
WPAN Topologies:
Fig 31 WPAN Topologies
IEEE 802.15 WPAN Standards:
1. IEEE 802.15.2- Co existence of Bluetooth and 802.11b
2. IEEE 802.15.3- High Rate WPAN
Low power and low cost applications for digital imaging and multimedia applications.
3. IEEE 802.15.4- Low Rate WPAN
Industrial ,Medical and agriculture applications.
Bluetooth ≈ IEEE 802.15.1
A widely used WPAN technology is known as Bluetooth (version 1.2 or version 2.0).
The IEEE
standard specifies the architecture and operation of Bluetooth devices, but only as

30
far as physical layer and medium access control (MAC) layer operation is concerned
(the core system architecture)
.Higher protocol layers and applications defined in usage profiles are standardized by the
Bluetooth SIG. Bluetooth is the base for IEEE Std 802.15.1-2002 (rev. 2005).Data rate of 1
Mbps (2 or 3 Mbps with enhanced data rate).
Piconets
Bluetooth enabled electronic devices connect and communicate wirelessly through
short-range, ad hoc networks known as piconets. Piconets are established
dynamically and automatically as Bluetooth enabled devices enter and leave radio
proximity. Up to 8 devices in one piconet (1 master and up to 7 slave devices)
Max range is 10 m. The piconet master is a device in a piconet whose clock and
device address are used to define the piconet physical channel characteristics.All
other devices in the piconet are called piconet slaves.All devices have the same
timing and frequency hopping sequence. At any given time, data can be transferred
between the master and one slave.
The master switches rapidly from slave to slave in a round-robin fashion. Any
Bluetooth device can be either a master or a slave. Any device may switch the
master/slave role at any time.
Scatternet
Any Bluetooth device can be a master of one piconet and a slave of another piconet at the
same time (scatternet). Scatternet is formed by two ormore Piconets. Master of one piconet
can participate as a slave in another connected piconet. No time or frequency
synchronization between piconets
Bluetooth Protocol
Stack Radio Layer
The radio layer specifies details of the air interface, including the usage of the frequency
hopping sequence, modulation scheme, and transmit power. The radio layer FHSS
operation and radio parameters
Baseband Layer
The baseband layer specifies the lower level operations at the bit and packet levels. It
supports Forward Error Correction (FEC) operations and Encryption, Cyclic
Redundancy Check (CRC) calculations. Retransmissions using the Automatic Repeat
Request (ARQ) Protocol.

31
Fig 32 Bluetooth Protocol Stack
Link Manager layer
The link manager layer specifies the establishment and release links, authentication, traffic
scheduling, link supervision, and power management tasks. Responsible for all the physical
link resources in the system. Handles the control and negotiation of packet sizes used when
transmitting data.Sets up, terminates, and manages baseband connections between devices.
L2CAP layer
The Logical Link Control and Adaptation Protocol (L2CAP) layer handles the
multiplexing of higher layer protocols and the segmentation and reassembly (SAR) of
large packets The L2CAP layer provides both connectionless and connection-oriented
services
L2CAP performs 4 major functions
Managing the creation and termination of logical links for each connection through
channel structures. Adapting Data, for each connection, between application (APIs) and
Bluetooth Baseband formats through Segmentation and Reassembly (SAR). Performing
Multiplexing to support multiple concurrent connections over a single common radio
interface (multiple apps. using link between two devices simultaneously). L2CAP
segments large packets into smaller baseband manageable packets. Smaller received
baseband packets are reassembled coming back up the protocol stack.
RFCOMM
Applications may access L2CAP through different support protocols Service Discovery
Protocol (SDP) RFCOMM Telephony Control Protocol Specification (TCS) TCP/IP based

32
applications, for instance information transfer using the Wireless Application Protocol
(WAP), can be extended to Bluetooth devices by using the Point-to-Point Protocol (PPP) on
top of RFCOMM.
OBEX Protocol
The Object Exchange Protocol (OBEX) is a sessionlevel protocol for the exchange of
objects This protocol can be used for example for phonebook, calendar or messaging
synchronization, or for file transfer between connected devices.
TCSBIN Protocol
The telephony control specification - binary (TCS BIN) protocol defines the call-control
signaling for the establishment of speech and data calls between Bluetooth devices In
addition, it defines mobility management procedures for handling groups of Bluetooth
devices.
Service Discovery Protocol
The Service Discovery Protocol (SDP) can be used to access a specific device (such as a
digital camera) and retrieve its capabilities, or to access a specific application (such as a print
job) and find devices that support this application.
6. Smart Wi-Fi module
Smart Wi-Fi is an IoT-enabler tool. The applications it can cater to are only limited by
the imagination of makers. The very basic applications could be for smart homes or smart
offices. This module can be used for data logging, data monitoring and more, and provides
very good support for product development. It also has all features to act as a full-fledged
product. Platforms such as ThingSpeak add to the benefits and provide support for testing
and development of an IoT product. Smart Wi-Fi enables making a product quickly and
reliably. With open software resources and hardware data, moving to the final product after
the proof of concept is also easy.
7. IoT platform
The purpose of any IoT device is to connect with other IoT devices and applications
(cloud-based mostly) to relay information using internet transfer protocols.
The gap between the device sensors and data networks is filled by an IoT Platform. Such a
platform connects the data network to the sensor arrangement and provides insights using
backend applications to make sense of plethora of data generated by hundreds of sensors.
While there are hundreds of companies and a few startups venturing into IoT platform
development, players like Amazon and Microsoft are way ahead of others in the
competition. Read on to know about top 10 IoT platforms you can use for your applications.

33
IoT platform: Amazon Web Services (AWS) IoT
Last year Amazon announced the AWS IoT platform at it s Re:Invent conference.
Main features of AWS IoT platform are:
Registry for recognizing devices
Software Development Kit for devices
Device Shadows
Secure Device Gateway
Rules engine for inbound message evaluation
According to Amazon, their IoT platform will make it a lot easier for developers to connect
sensors for multiple applications ranging from automobiles to turbines to smart home light
bulbs.
Taking the scope of AWS IoT to the next level, the vendor has partnered with hardware
manufacturers like Intel, Texas Instruments, Broadcom and Qualcomm to create starter kits
compatible with their platform.
IoT Platform: Microsoft Azure IoT
Microsoft is very much interested in bringing up products for internet of things. For
the initiative the Microsoft Azure cloud services compatible IoT platform, the Azure IoT
suite is on the offer. Features included in this platform are:
Device shadowing
A rules engine
Identity registry
Information monitoring
For processing the massive amount of information generated by sensors Azure IoT suite
comes with Azure Stream Analytics to process massive amounts of information in real-time.
Top IoT Platforms-Google Cloud Platform (New)
Google can make things happen. With its end-to-end platform, Google cloud is among the
best IoT platforms we have currently. With the ability to handle the vast amount of data
using Cloud IoT Core,

34
Google stands out from the rest. You get advanced analytics owing to Google‘s Big Query
and Cloud Data Studio.
Some of the features of the Google Cloud platform are:-
Accelerate your Business
Speed up your devices
Cut Cost with Cloud Service.
Partner Ecosystem
IoT Platform: ThingWorx IoT Platform
In vendor‘s own words, ―ThingWorx is the industry‘s leading Internet of Things
(IoT) technology platform. It enables innovators to rapidly create and deploy game-
changing applications, solutions and experiences for today‘s smart, connected world.”
Thingsworx is an IoT platform which is designed for enterprise application development. It
offers features like:
Easy connectivity of devices to the platform
Remove complexity from IoT application development
Sharing platform among developers for rapid development
Integrated machine learning for automating complex big data analytics
Deploy cloud, embedded or on-premise IoT solutions on the go
IoT platform: IBM Watson
We can never expect the Big Blue to miss on the opportunity to making a mark in the
internet of things segment. IBM Watson is an IoT platform which is pretty much taken
among developers already. Backed by IBM‘s hybrid cloud PaaS (platform as a service)
development platform, the Bluemix, Watson IoT enables developers to easily deploy IoT
applications.
Users of IBM Watson get:
Device Management
Secure Communications
Real Time Data Exchange
Data Storage
Recently added data sensor and weather data service
Top IoT Platforms-Artik
(New):samsung IoT Platform:
Cisco IoT Cloud Connect
Top IoT Platforms-Universal of Things (IoT) Platform
(New) :HP Top IoT Platforms-Datav by Bsquare (New)
IoT platform: Salesforce IoT Cloud
Top IoT Platforms-Mindsphere by

35
Siemens (New) Top IoT Platforms-Ayla
Network by Ayla (New) Top IoT
Platforms-Bosch IoT Suite(New)
IoT Platform: Carriots
IoT Platform: Oracle Integrated
Cloud IoT Platform: General
Electric‘s Predix
Top IoT Platforms-MBED IoT Device platform(New)
Top IoT Platforms-Mosaic (LTI)
(New) IoT Platform: Kaa
AWS IoT Core is a managed cloud platform that lets connected devices easily and securely
interact with cloud applications and other devices. AWS IoT Core can support billions of
devices and trillions of messages, and can process and route those messages to AWS
endpoints and to other devices reliably and securely. With AWS IoT Core, your
applications can keep track of and communicate with all your devices, all the time, even
when they aren‘t connected.
AWS IoT Core makes it easy to use AWS services like AWS Lambda, Amazon
Kinesis, Amazon S3, Amazon Machine Learning, Amazon DynamoDB, Amazon
CloudWatch, AWS CloudTrail, and Amazon Elasticsearch Service with built-in Kibana
integration, to build IoT applications that gather, process, analyze and act on data generated
by connected devices, without having to manage any infrastructure.
AWS IoT provides secure, bi-directional communication between Internet-connected
devices such as sensors, actuators, embedded micro-controllers, or smart appliances and the
AWS Cloud. This enables you to collect telemetry data from multiple devices, and store and
analyze the data. You can also create applications that enable your users to control these
devices from their phones or tablets.
AWS IoT Components
AWS IoT consists of the following components:
A. Device gateway
Enables devices to securely and efficiently communicate with AWS IoT.
B. Message broker
Provides a secure mechanism for devices and AWS IoT applications to publish and receive
messages from each other. You can use either the MQTT protocol directly or MQTT over
WebSocket to publish and subscribe. You can use the HTTP REST interface to publish.

36
C. Rules engine
Provides message processing and integration with other AWS services. You can use an
SQL-based language to select data from message payloads, and then process and send the
data to other services, such as Amazon S3, Amazon DynamoDB, and AWS Lambda. You
can also use the message broker to republish messages to other subscribers.
D. Security and Identity service:
Provides shared responsibility for security in the AWS Cloud. Your devices must keep their
credentials safe in order to securely send data to the message broker. The message broker
and rules engine use AWS security features to send data securely to devices or other AWS
services.
E. Registry
Organizes the resources associated with each device in the AWS Cloud. You register your
devices and associate up to three custom attributes with each one. You can also associate
certificates and MQTT client IDs with each device to improve your ability to manage and
troubleshoot them.
F. Group registry
Groups allow you to manage several devices at once by categorizing them into groups.
Groups can also contain groups—you can build a hierarchy of groups. Any action you
perform on a parent group will apply to its child groups, and to all the devices in it and in
all of its child groups as well. Permissions given to a group will apply to all devices in the
group and in all of its child groups.
G. Device shadow
A JSON document used to store and retrieve current state information for a device.
H. Device Shadow service
Provides persistent representations of your devices in the AWS Cloud. You can publish
updated state information to a device's shadow, and your device can synchronize its state
when it connects. Your devices can also publish their current state to a shadow for use by
applications or other devices.
I. Device Provisioning service
Allows you to provision devices using a template that describes the resources required for
your device: a thing, a certificate, and one or more policies. A thing is an entry in the
registry that contains attributes that describe a device. Devices use certificates to
authenticate with AWS IoT. Policies determine which operations a device can perform in
AWS IoT.
The templates contain variables that are replaced by values in a dictionary (map). You can
use the same template to provision multiple devices just by passing in different values for
37
the template variables in the dictionary.
J. Custom Authentication service
You can define custom authorizers that allow you to manage your own authentication and
authorization strategy using a custom authentication service and a Lambda function.
Custom authorizers allow AWS IoT to authenticate your devices and authorize operations
using bearer token authentication and authorization strategies. Custom authorizers can
implement various authentication strategies and must return policy documents which are
used by the device gateway to authorize MQTT operations.
K. Jobs Service
Allows you to define a set of remote operations that are sent to and executed on one or more
devices connected to AWS IoT. For example, you can define a job that instructs a set of
devices to download and install application or firmware updates, reboot, rotate certificates,
or perform remote troubleshooting operations.To create a job, you specify a description of
the remote operations to be performed and a list of targets that should perform them. The
targets can be individual devices, groups or both.
Accessing AWS IoT
AWS IoT provides the following interfaces to create and interact with your devices:
AWS Command Line Interface (AWS CLI)—Run commands for AWS IoT on
Windows, macOS, and Linux. These commands allow you to create and manage
things, certificates, rules, and policies. To get started, see the AWS Command Line
Interface User Guide. For more information about the commands for AWS IoT, see
iot in the AWS CLI Command Reference.
AWS IoT API—Build your IoT applications using HTTP or HTTPS requests. These
API actions allow you to programmatically create and manage things, certificates,
rules, and policies. For more information about the API actions for AWS IoT, see
Actions in the AWS IoT API Reference.
AWS SDKs—Build your IoT applications using language-specific APIs. These
SDKs wrap the HTTP/HTTPS API and allow you to program in any of the supported
languages.
AWS IoT Device SDKs—Build applications that run on devices that send messages
to and receive messages from AWS IoT.

38
Related Services
AWS IoT integrates directly with the following AWS services:
Amazon Simple Storage Service—Provides scalable storage in the AWS Cloud. For
more information, see Amazon S3.
Amazon DynamoDB—Provides managed NoSQL databases. For more information,
see Amazon DynamoDB.
Amazon Kinesis—Enables real-time processing of streaming data at a massive scale.
For more information, see Amazon Kinesis.
AWS Lambda—Runs your code on virtual servers from Amazon EC2 in response to
events. For more information, see AWS Lambda.
Amazon Simple Notification Service—Sends or receives notifications. For more
information, see Amazon SNS.
Amazon Simple Queue Service—Stores data in a queue to be retrieved by
applications. For more information, see Amazon SQS.
Benefits
Connect and Manage Your Devices
AWS IoT Core allows you to easily connect devices to the cloud and to other devices. AWS
IoT Core supports HTTP, WebSockets, and MQTT, a lightweight communication protocol
specifically designed to tolerate intermittent connections, minimize the code footprint on
devices, and reduce network bandwidth requirements. AWS IoT Core also supports other
industry-standard and custom protocols, and devices can communicate with each other even
if they are using different protocols
Fig 33. IOT Device Management

39
Secure Device Connections and Data
AWS IoT Core provides authentication and end-to-end encryption throughout all points of
connection, so that data is never exchanged between devices and AWS IoT Core without
proven identity. In addition, you can secure access to your devices and applications by
applying policies with granular permissions
Fig 34.Secure
Connection PROCESS AND ACT UPON DEVICE
DATA
With AWS IoT Core, you can filter, transform, and act upon device data on the fly, based
on business rules you define. You can update your rules to implement new device and
application features at any time. AWS IoT Core makes it easy to use AWS services like
AWS Lambda, Amazon Kinesis, Amazon S3, Amazon Machine Learning, Amazon
DynamoDB, Amazon CloudWatch, and Amazon Elasticsearch Service for even more
powerful IoT applications
Fig 35. Process And Act Upon
Device Data Read and set device state at any time
AWS IoT Core stores the latest state of a device so that it can be read or set at anytime,
making the device appear to your applications as if it were online all the time. This means
that your application can read a device‘s state even when it is disconnected, and also allows
you to set a device state and have it implemented when the device reconnects

40
Fig 36. Read and set device state at any time
7. PROGRAMS for Arduino,
Raspberry pi PIR motion sensor
The passive infra red sensor or simply PIR sensor is integrated with an arduino uno
board and we can get serial data through it. The PIR sensor basically works on the thermal
radiation which are being emitted by the body of humans as well as animals.
The parts needed for this build are given as
1.Arduino uno or clone
2. PIR Sensor
3.breadboard
4.led(any
colour)
5.buzzer
The following fig 26 shows the pin description of PIR sensor.
Fig 37.Arduino Board
Features and Electrical Specification
Compact size (28 x 38 mm)
Supply current: DC5V-20V(can design DC3V-24V)
Current drain :< 50uA (Other choice: DC0.8V-4.5V; Current drain: 1.5mA-0.1mA)
Voltage Output: High/Low level
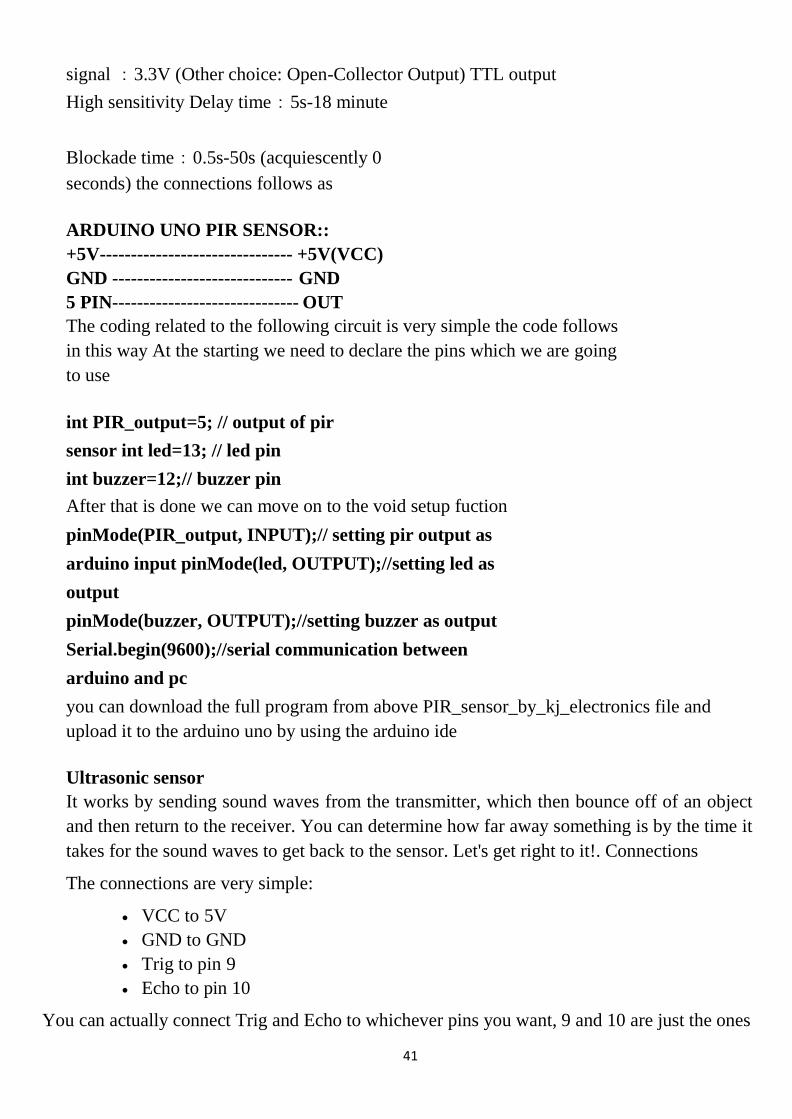
41
signal :3.3V (Other choice: Open-Collector Output) TTL output
High sensitivity Delay time:5s-18 minute
Blockade time:0.5s-50s (acquiescently 0
seconds) the connections follows as
ARDUINO UNO PIR SENSOR::
+5V ------------------------------- +5V(VCC)
GND ----------------------------- GND
5 PIN------------------------------ OUT
The coding related to the following circuit is very simple the code follows
in this way At the starting we need to declare the pins which we are going
to use
int PIR_output=5; // output of pir
sensor int led=13; // led pin
int buzzer=12;// buzzer pin
After that is done we can move on to the void setup fuction
pinMode(PIR_output, INPUT);// setting pir output as
arduino input pinMode(led, OUTPUT);//setting led as
output
pinMode(buzzer, OUTPUT);//setting buzzer as output
Serial.begin(9600);//serial communication between
arduino and pc
you can download the full program from above PIR_sensor_by_kj_electronics file and
upload it to the arduino uno by using the arduino ide
Ultrasonic sensor
It works by sending sound waves from the transmitter, which then bounce off of an object
and then return to the receiver. You can determine how far away something is by the time it
takes for the sound waves to get back to the sensor. Let's get right to it!. Connections
The connections are very simple:
VCC to 5V
GND to GND
Trig to pin 9
Echo to pin 10
You can actually connect Trig and Echo to whichever pins you want, 9 and 10 are just the ones

42
const int trigPin = 9;
const int echoPin = 10;
void setup()
pinMode(trigPin, OUTPUT);
pinMode(echoPin, INPUT);
Serial.begin(9600);
I'm using.
Fig 38.Ultra Sonic Sensor
Code:
we define the pins that Trig and Echo are connected to.
Then we declare 2 floats, duration and distance, which will hold the length of the sound wave and how
far away the object is.
float duration, distance;
Next, in the setup, we declare the Trig pin as an output, the Echo pin as an input, and start
Serial communications.
Now, in the loop, what we do is first set the trigPin low for 2 microseconds just to make
sure that the pin in low first. Then, we set it high for 10 microseconds, which sends out an
8 cycle sonic burst from the transmitter, which then bounces of an object and hits the
receiver(Which is connected to t he Echo Pin).
void loop()
digitalWrite(trigPin,
LOW);
delayMicroseconds(2);

43
duration = pulseIn(echoPin, HIGH);
digitalWrite(trigPin,
HIGH);
delayMicroseconds(10);
digitalWrite(trigPin,
LOW);
When the sound waves hit the receiver, it turns the Echo pin high for however long the
waves were traveling for. To get that, we can use a handy Arduino function called
pulseIn(). It takes 2 arguments, the pin you are listening to(In our case, the Echo pin), and
a state(HIGH or LOW). What the function does is waits for the pin to go whichever sate
you put in, starts timing, and then stops timing when it switches to the other state. In our
case we would put HIGH since we want to start timing when the Echo pin goes high. We
will store the time in the duration variable. (It returns the time in microseconds)
Now that we have the time, we can use the equation speed = distance/time, but we will make it time x
speed = distance because we have the speed. What speed do we have? The speed of sound,
of course! The speed of sound is approximately 340 meters per second, but since the
pulseIn() function returns the time in microseconds, we will need to have a speed in
microseconds also, which is easy to get. A quick Google search for "speed of sound in
centimeters per microsecond" will say that it is .0343 c/μS. You could do the math, but
searching it is easier. Anyway, with that information, we can calculate the
distance! Just multiply the duration by .0343 and the divide it by 2(Because the sound
waves travel to the object AND back). We will store that in the distance variable.
distance = (duration*.0343)/2;
The rest is just printing out the results to the Serial
Monitor. Serial.print("Distance: ");
Serial.println(distan
ce); delay(100);
Temperature Sensor
Connecting to a Temperature Sensor
These sensors have little chips in them and while they're not that delicate, they do need to
be handled properly. Be careful of static electricity when handling them and make sure the

44
power supply is connected up correctly and is between 2.7 and 5.5V DC - so don't try to use
a 9V battery!
They come in a "TO-92" package which means the chip is housed in a plastic hemi-
cylinder with three legs. The legs can be bent easily to allow the sensor to be plugged
into a breadboard. You can also solder to the pins to connect long wires.
Reading the Analog Temperature Data
Unlike the FSR or photocell sensors we have looked at, the TMP36 and friends doesn't
act like a resistor. Because of that, there is really only one way to read the temperature
value from the sensor, and that is plugging the output pin directly into an Analog (ADC)
input.
Remember that you can use anywhere between 2.7V and 5.5V as the power supply. For
this example I'm showing it with a 5V supply but note that you can use this with a 3.3v
supply just as easily. No matter what supply you use, the analog voltage reading will
range from about 0V (ground) to about 1.75V.
If you're using a 5V Arduino, and connecting the sensor directly into an Analog pin, you
can use these formulas to turn the 10-bit analog reading into a temperature:
Voltage at pin in milliVolts = (reading from ADC) * (5000/1024)
This formula converts the number 0-1023 from the ADC into 0-5000mV (= 5V) If you're
using a 3.3V Arduino, you'll want to use this:
Voltage at pin in milliVolts = (reading from ADC) * (3300/1024)
This formula converts the number 0-1023 from the ADC into 0-3300mV (= 3.3V) Then, to
convert millivolts into temperature, use this formula:
Centigrade temperature = [(analog voltage in mV) - 500] / 10

45
Fig 50 Temperature Sensor
Fig 39.Temperature Sensor
Arduino Sketch - Simple Thermometer
This example code for Arduino shows a quick way to create a temperature sensor, it
simply prints to the serial port what the current temperature is in both Celsius and
Fahrenheit.
For better results, using the 3.3v reference voltage as ARef instead of the 5V will be more
precise and less
noisy
int sensorPin = 0;
* setup() - this function runs once when you turn your
Arduino on void setup()
Serial.begin(9600); //Start the serial connection with the computer
//to view the result open the serial monitor
void loop() // run over and over again
//getting the voltage reading from the temperature
sensor int reading = analogRead(sensorPin);
// converting that reading to voltage, for 3.3v arduino
use 3.3 float voltage = reading * 5.0;
voltage /= 1024.0;
// print out the voltage
Serial.print(voltage); Serial.println(" volts");
// now print out the temperature
float temperatureC = (voltage - 0.5) * 100 ; //converting from 10 mv per degree wit 500 mV
offset
//to degrees ((voltage - 500mV) times 100)
Serial.print(temperatureC); Serial.println(" degrees C");

46
// now convert to Fahrenheit
float temperatureF = (temperatureC * 9.0 / 5.0)
+ 32.0; Serial.print(temperatureF);
Serial.println(" degrees F"); delay(1000);
//waiting a
second
PYTHON CODE :
PIR sensor code
import RPi.GPIO as GPIO #Import GPIO
library import time #Import time library
GPIO.setmode(GPIO.BOARD) #Set GPIO pin
numbering pir = 26 #Associate pin 26 to pir
GPIO.setup(pir, GPIO.IN) #Set pin as GPIO in
print "Waiting for sensor to settle"
time.sleep(2) #Waiting 2 seconds for the sensor to
initiate print "Detecting motion"
while True:
if GPIO.input(pir): #Check whether pir is
HIGH print "Motion Detected!"
time.sleep(2) #D1- Delay to avoid multiple detection
time.sleep(0.1) #While loop delay should be less than detection(hardware)
delay
Ultrasonic
import RPi.GPIO as
GPIO import time
GPIO.setmode(GPIO.B
CM)
TRIG = 23
ECHO = 24
print "Distance Measurement In Progress"
GPIO.setup(TRIG,GPIO.
OUT)
GPIO.setup(ECHO,GPIO.
IN)
GPIO.output(TRIG, False)

47
print "Waiting For Sensor To
Settle" time.sleep(2)
GPIO.output(TRIG, True)
time.sleep(0.00001)
GPIO.output(TRIG, False)
while
GPIO.input(ECHO)==0:
pulse_start = time.time()
while GPIO.input(ECHO)==1:
pulse_end = time.time()
pulse_duration = pulse_end -
pulse_start distance =
pulse_duration * 17150 distance =
round(distance, 2)
"Distance:",distance,"cm"
GPIO.cleanup()
8. WERABLE DEVELOPMENT BOARDS
Wearable devices are creating great buzz in the market and has become the trend of the
day. Innovations are more focused on body-borne computers (also referred as wearables)
which are miniature electronic devices that are worn on face, wrist, clothes or even shoes!
Eco-system of wearable devices involves extensive product development knowledge and
expertise in technology areas from hardware design to cloud applications to mobile
application development. Specifically, for developing wearable devices one requires
following technology expertise:
Hardware / electronic design and development expertise for developing products with
minimum form factor size. Moreover, power management expertise is a must-have to
ensure that devices can last several days / weeks / months on a single battery charge.

48
BSP / firmware development expertise ensuring memory optimized driver
development with minimum footprint, enhanced power management and highest
performance in spite of low-end microcontroller.
Smartphone application development on Android and iPhone platforms to allow
connectivity with the wearable device.
Cloud / web application for enabling M2M (machine-to-machine) / IoT (Internet of
things) for remote monitoring and control.
Challenges
Having end-to-end expertise for product development is tough ask and there are very few
organizations which can ensure quality end-to-end product development. In order to
achieve seamless communication, all the components of wearable devices from hardware to
cloud to smartphones need to be closely knit. Integration is key and experience of native
operating system primitives is a must to extract maximum performance with minimum
code! Here are some basic skills required:
Complex hardware designing abilities smaller sized form factor development.
Knowledge of choosing the right components for size and efficient power
management.
Certifications to ensure radiations do not affect human body.
Expertise in driver development for developing optimized drivers for new types of
sensors.
Ability to develop code that fits on lower capacity RAM / flash.
Domain knowledge for efficient application development.
Ability to develop iPhone / Android / Windows applications.
Ability to develop Cloud / web / smartphone connectivity applications.
Input wearables are devices which get input from something and transmit it to the server,
for example health monitoring devices. Maven has experience in medical electronics
coupled with remote communication capabilities that can be used for developing such type
of applications.
Output wearables are device those provide you some information like a smart watch or
smart glasses. Maven has already worked on smart watch technology based on Pebble
platform.
BSP / firmware / operating system development services
Developing firmware for microcontrollers from Microchip, TI, Atmel, Cypress,
Freescale, NXP etc.
Firmware is a software program permanently etched into a hardware device such

49
as a keyboards, hard drive, BIOS, or video cards. It is programmed to give
permanent instructions to communicate with other devices and perform functions
like basic input/output tasks. Firmware is typically stored in the flash ROM (read
only memory) of a hardware device. Firmware was originally designed for high
level software and could be changed without having to exchange the hardware for
a newer device. Firmware also retains the basic instructions for hardware devices
that make them operative. Without firmware, a hardware device would be non-
functional.
Development Boards for IoT
Driver development for various sensors such as accelerometers, gyroscopes, motion
sensors, proximity sensors, magnetometers etc.
Driver development for communication interfaces like BLE 4.0, NFC, RF and even
using the 3.5 mm audio headphone jack.
Development of power management algorithms.
Power management by using the right components and critical designs.
Embedded / real-time application development services
Key aspects of application development include:
Developing algorithms based on various type of sensors such as using combination of
accelerometer, gyrometer and magnetometer for determining relative positions,
sudden falls, acceleration, angle and so on.
Development of fast and intelligent data transfer protocols with minimum overheads
considering both wired and wireless data transfer mechanisms
Development of over the air firmware upgrade / remote diagnostics and health
monitoring protocols.
Integrating with smartphones.

50
Smart phone application development services
Usability, rich user interface and performance are the key parameters for application
development. Some of the aspects of smartphone application development include:
Developing communication protocols over BLE, NFC and 3.5 mm jack for getting
data from the wearable devices.
Intelligence to take decisions based on the data, such as send event / alarm
notifications over SMS, transferring data to the server.
Integrating navigation applications to give direction on an output type of wearable
device such as a smart watch.
Cloud / web application development services
With applications hosted on platforms like Amazon, Microsoft and similar, availability and
uptimes are assured. Development expertise include:
Developing applications in HTML5, Dot Net and Java with database servers such as
SQL, Oracle, PostgreSQL, MySQL and application servers such as IIS, Tomcat and
JBOSS.
Building applications for displaying real-time parameters, historical trends.
1. C.H.I.P
CHIP is the new kid on the block. It comes with a powerful 1GHz processor powered by
Allwinner R8. The best thing about CHIP is that it comes with embedded Bluetooth 4.0 and
WiFi radios, providing out- of-the-box connectivity. The board has 4GB of high-speed
storage to run a special Linux distribution based on Debian. You don‘t need a separate SD
Card to install and run the OS. With 8 GPIO pins, CHIP can be connected to a variety of
sensors. The board also supports PWM, UART, I2C for connecting motors and other
actuators. One of the key advantages of CHIP is the cost and the form-factor. Developers
can SSH into the Linux OS and install required packages.
Fig 40. CHIP

51
2. Mediatek Linkit One
Fig 41. Linkit
Based on the smallest SOC, the Linkit One board comes with compatible Arduino pinout
features. The chipset is based on with 260MHz speed. Regarding connectivity, Linkit One
has the most comprehensive collection of radios – GPS, GSM, GPRS, WiFi, and Bluetooth.
One of the unique features of Linkit One is the rich API that can be used from Arduino IDE.
The SDK comes with libraries to connect the board to AWS and PubNub. Because it
supports the Arduino pinout, multiple shields from the Arduino ecosystem can be used with
the board.
3.Particle Photon
Fig 42.Particle Photon
Photon is one of the smallest prototyping boards available in the market. It comes with the
same Broadcom BCM43362 Wi-Fi chip that powers Next, LiFX, and Amazon Dash
buttons. Powered by the STM32F205 120Mhz ARM Cortex M3 processor, Photon has
1MB flash and 128KB RAM. Once configured, the board is accessible from the Internet,
which makes it an ideal prototyping platform to build connected applications. The board
comes with five analog pins and eight digital pins for connecting various sensors and
actuators. The official iOS and Android Apps that Particle has published come handy in
controlling these pins directly. The powerful web-based IDE lets you write sketches that are
compatible with Arduino
3.Tessel

52
Tessel 2 is a solid development board for serious developers. It comes with a choice of
sensors and actuators that can be directly connected to the module ports. The board is
powered by a 580MHz MediaTek MT7620n processor for faster execution. It has 64 MB
DDR2 RAM & 32 MB Flash, which is more than sufficient for running complex code. The
Micro-USB port is used for both powering the board as well as connecting to the PC. The
embedded Wi-Fi and Ethernet ports bring connectivity to Tessel. It has a wide collection of
sensors and actuators that come along with the required libraries. Based on JavaScript and
Node.js, it is easy to get started with the platform. Developers looking for a rapid
prototyping platform can go for Tessel 2.

53
3. Adafruit Flora
It‘s a wearable electronic platform based on the most popular Arduino
microcontroller. Flora‘s size makes it an ideal choice for embedded it in clothes and
apparel. It comes with a thin, sewable, conductor thread which acts as the wire that connects
the power and other accessories. The latest version of Flora ships with a micro-USB and
Neopixel LEDs for easy programmability and testing.
Adafruit Flora is based on Atmega 32u4 microcontroller, which powers Arduino Mega and
Leonardo. There is an onboard polarized 2 JST battery connector with protection Schottky
diode for use with external battery packs from 3.5v to 9v DC. Given its compatibility with
Arduino, most of the sketches would run without modifications. You can use the same
Arduino IDE with that you may already be familiar.
Fig 44.Adafruit Flora
4. LightBlue Bean
LightBlue Bean is an Arduino-compatible microcontroller board that ships with embedded
Bluetooth Low Energy (BLE), RGB LED, temperature sensor, and an accelerometer. Bean+
is the successor to the already popular, which includes a rechargeable LiPo battery along
with a couple of Grove connectors. The board comes with a coin-cell battery, which further
helps it to maintain the small form factor. It can be paired with Android or iOS devices for
remote connectivity and control. It also comes with a software called BeanLoader for
programming from Windows or Mac equipped with BLE. BeanLoader installs an Arduino
IDE add-on for programming the Bean platform. LightBlue Bean / Bean+ is powered by an
ATmega328p microcontroller with 32KB Flash memory and 2KB SRAM. With 8 GPIO
pins, two analog pins, four PWM pins, and an I2C port, Bean is perfect for quickly
prototyping BLE-based IoT projects.

54
Fig 45.Light blue Bean

55
5. Udoo Neo
Udoo Neo is a full-blown computer that also has an Arduino-compatible microcontroller.
It‘s positioned as the combination of Raspberry Pi and Arduino. The board has the same
pinout as Arduino Uno. Neo embeds two cores on the same processor – a powerful 1GHz
ARM Cortex-A9, and an ARM Cortex-M4 I/O real-time co-processor. It packs a punch
with an embedded 9-axis motion sensors and a Wi-Fi + Bluetooth 4.0 module. You can
install Android Lollipop or a customized flavor of Debian Linux called UDOObuntu,
which is compatible with Ubuntu 14.04 LTS.
When it comes to the power-packed features and specifications, Udoo NEO is nothing short
of a desktop computer. With a Freescale i.MX 6SoloX applications processor with an
embedded ARM Cortex-A9 core and a Cortex-M4 Core, Neo comes with 1GB RAM. The
Micro HDMI port can be connected to an external display and audio sources. The standard
Arduino pin layout is compatible with Arduino shields. You can install Node.js, Python,
and even Java on Udoo Neo.
Fig 46.Udoo neo
6. Intel Edison
Trust Intel to deliver the most powerful single-board computer for advanced IoT projects.
Intel Edison is a high-performance, dual-core CPU with a single core micro-controller that
can support complex data collection. It has an integrated Wi-Fi certified in 68 countries,
Bluetooth® 4.0 support, 1GB DDR and 4GB flash memory. Edison comes with two
breakout boards – one that‘s compatible with Arduino and the other board designed to be a
smaller in size for easy prototyping. The Arduino breakout board has 20 digital input/output
pins, including four pins as PWM outputs, Six analog inputs, one UART (Rx/Tx), and one
I2C pin. Edison runs on a distribution of embedded Linux called Yocto. It‘s one of the few
boards to get certified by Microsoft, AWS, and IBM for cloud connectivity.
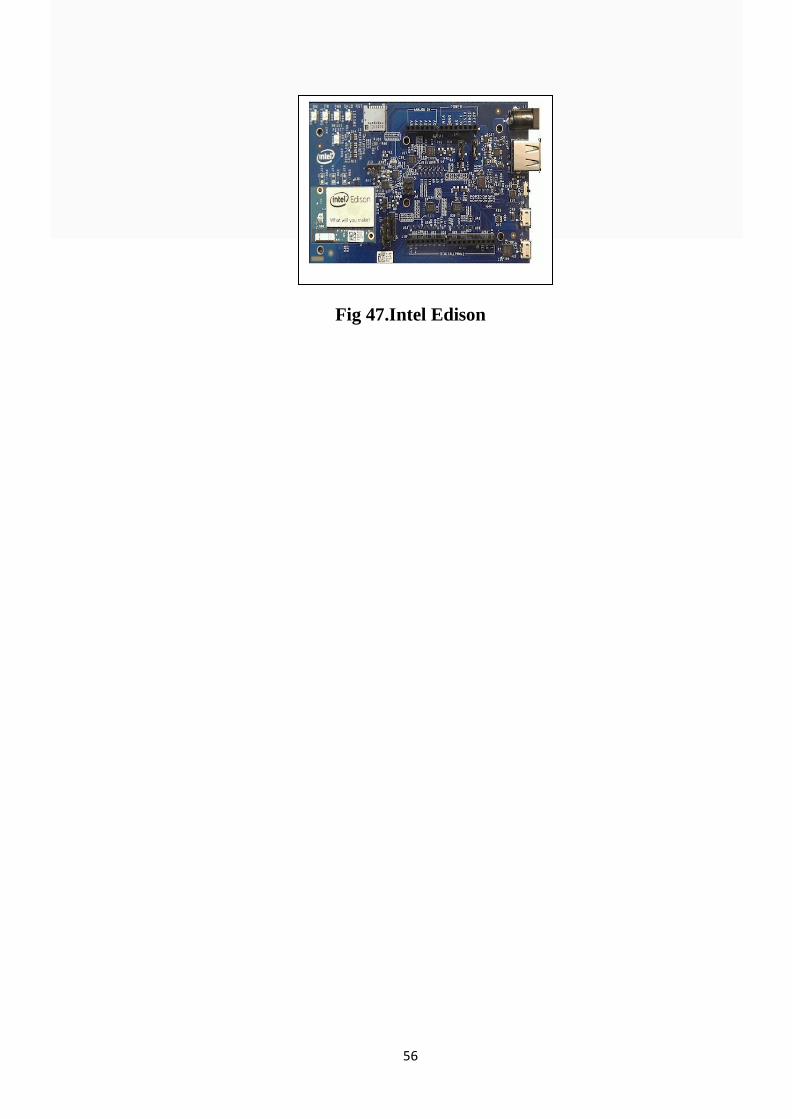
56
Fig 47.Intel Edison

57
7. Raspberry Pi
Raspberry Pi is undoubtedly the most popular platform used by many hobbyists and
hackers. Even non- technical users depend on it for configuring their digital media systems
and surveillance cameras. The recently launched Raspberry Pi 3 included built-in WiFi and
Bluetooth making it the most compact and standalone computer. Based on a Broadcom
BCM2837 SoC with a 1.2 GHz 64-bit quad-core ARM Cortex-A53 processor and 1GB
RAM, the Pi is a powerful platform. The Raspberry Pi 3 is equipped with
2.4 GHz WiFi 802.11n and Bluetooth 4.1 in addition to the 10/100 Ethernet port. The
HDMI port makes it further easy to hook up A/V sources.
Raspberry Pi runs on a customized Debian Linux called Raspbian, which provides an
excellent user experience. For developers and hackers, it offers a powerful environment to
install a variety of packages including Node.js, the LAMP stack, Java, Python and much
more. With four USB ports and 40 GPIO pins, you can connect many peripherals and
accessories to the Pi.
Fig 48.RaspBerry pi There are third party breakout boards to connect various Arduino shields to the Pi. At a
throwaway price of $35, Raspberry Pi 3 is certainly the most affordable and powerful
computing platform.
8. Arduino Uno
Arduino Uno remains to be the top favorite of absolute beginners and experts. Considered
to be one of the first microcontroller-based development boards, the Arduino Uno R3 is
simplest yet the most powerful prototyping environment. It is based on the ATmega328P
which has 14 digital input/output pins and six analog inputs. Though it comes with just 32
KB of Flash memory, it can accommodate code that deals with complex logic and
operations.Arduino enjoys the best community participation and support.
From sensors to actuators to libraries, it has a thriving ecosystem. The board layout has
become almost the gold standard for microcontrollers. Almost every prototyping

58
environment tries to be compatible with the Arduino pin breakout. The open source IDE to
develop sketches is another reason for its popularity. With a simple syntax based on ‗C‘
language, the code is easy to learn. If you are eager to learn basics of electronics and IoT,
look no further. Do yourself a favor and get an Arduino Uno R3.
9. Programs and Stack for Constrained
Devices Sensors and Actuators
The ―Thing‖ in the IoT is the starting point for an IoT solution It is typically the originator
of the data, and it interacts with the physical world Things are often very constrained in
terms of size or power supply; therefore, they are often programmed using microcontrollers
(MCU) that have very limited capabilities The microcontrollers powering IoT devices are
specialized for a specifc task and are designed for mass production and low cost
The software running on MCU-based devices aims at supporting specifc tasks. The key
features of the software stack running on a device may include
1. IoT Operating System – many devices will run with ‗bare metal‘, but some will have
embedded or real- time operating systems that are particularly suited for small constrained
devices, and that can provide Io T- specifc capabilities.
2. Hardware Abstraction – a software layer that enables access to the hardware features of
the MCU, such as fash memory, GPIOs, serial interfaces, etc
3. Communication Support – drivers and protocols allowing to connect the device to a
wired or wireless protocol like Bluetooth, Z-Wave, Thread, CAn bus, MQTT, CoAP, etc ,
and enabling device communication 4 Remote Management – the ability to remotely
control the device to upgrade its frmware or to monitor its battery level.
Fig 50.Software Stack for devices

59
Stack for Gateways
Connected and Smart
Things
The IoT gateway acts as the aggregation point for a group of sensors and actuators to
coordinate the connectivity of these devices to each other and to an external network An
IoT gateway can be a physical piece of hardware or functionality that is incorporated
into a larger ―Thing‖ that is connected to the network For example, an industrial
machine might act like a gateway, and so might a connected automobile or a home
automation appliance
An IoT gateway will often processing of the data ―at the edge‖ and storage
capabilities to deal with network latency and reliability For device to device connectivity,
an IoT gateway deals with the interoperability issues between incompatible devices A
typical IoT architecture would have many IoT gateways supporting masses of devices
IoT gateways are becoming increasingly dependant on software to implement the core
functionality The key features of a gateway software stack include
1 Operating System – typically a general purpose operating system such as Linux
2 Application Container or Runtime Environment – IoT gateways will often have the ability
to run application code, and to allow the applications to be dynamically updated For
example, a gateway may have support for Java, Python, or node js
3 Communication and Connectivity – IoT gateways need to support different connectivity
protocols to connect with different devices (e.g. Bluetooth, Wi-Fi, Z-Wave, ZigBee). IoT
gateways also need to connect to different types of networks (e g Ethernet, cellular, Wi-Fi,
satellite, etc …) and ensure the reliability, security, and confidentiality of the
communications.
4 Data Management & Messaging – local persistence to support network latency, ofine
mode, and real- time analytics at the edge, as well as the ability to forward device data in a
consistent manner to an IoT Platform
5 Remote Management – the ability to remotely provision, configure, startup/shutdown
gateways as well as the applications running on the gateways

60
Fig 51. Software Stack for Gateway
Stack for IoT Cloud Platforms
The IoT Cloud Platform represents the software infrastructure and services required to
enable an IoT solution An IoT Cloud Platform typically operates on a cloud infrastructure
(e g OpenShift, AWS, Microsoft Azure, Cloud Foundry) or inside an enterprise data center
and is expected to scale both horizontally, to support the large number of devices
connected, as well as vertically to address the variety of IoT solutions The IoT Cloud
Platform will facilitate the interoperability of the IoT solution with existing enterprise
applications and other IoT solutions The core features of an IoT Cloud Platform include
1. Connectivity and Message Routing – IoT platforms need to be able to interact with very
large numbers of devices and gateways using diferent protocols and data formats, but then
normalize it to allow for easy integration into the rest of the enterprise
2. Device Management and Device Registry – a central registry to identify the
devices/gateways running in an IoT solution and the ability to provision new software
updates and manage the devices
3 . Data Management and Storage – a scalable data store that supports the volume and
variety of IoT data Software stack for gateways Software stack for IoT Cloud Platforms 7
The Three Software Stacks Required for IoT Architectures IOT ARCHITECTURES
4 Event Management, Analytics & UI – scalable event processing capabilities, ability to
consolidate and analyze data, and to create reports, graphs, and dashboards
5 Application Enablement – ability to create reports, graphs, dashboards, … and to use API
for application integration.
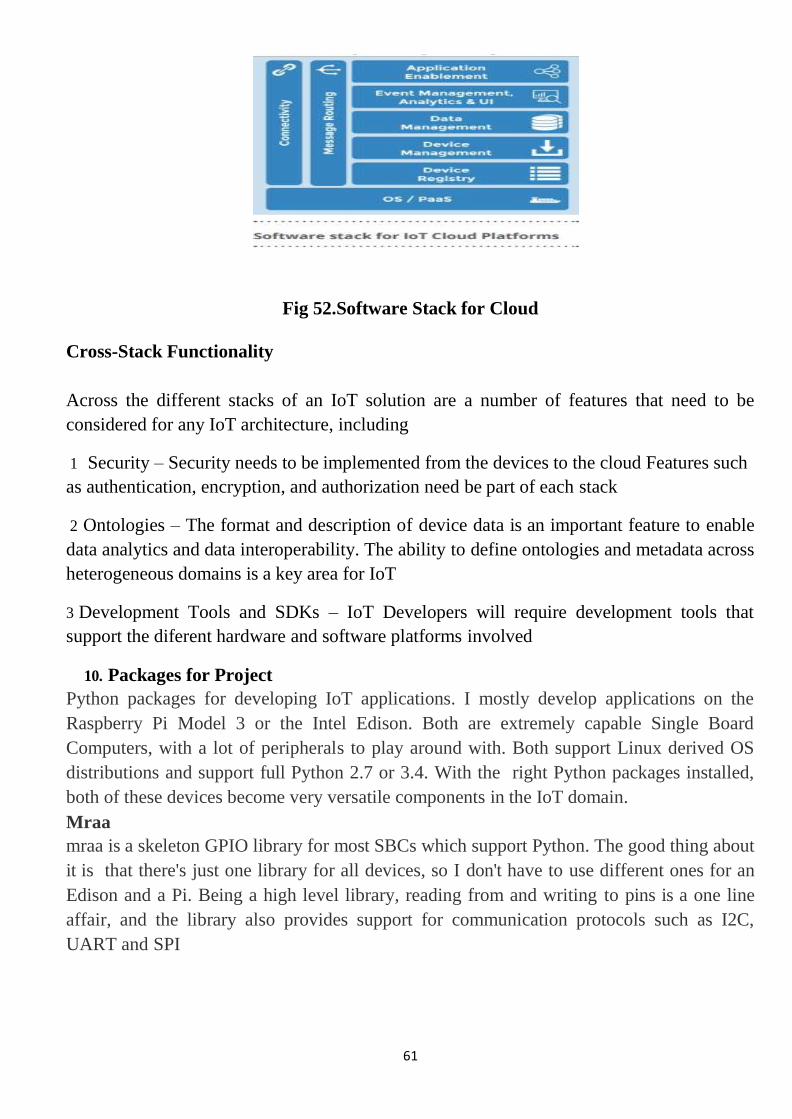
61
Fig 52.Software Stack for Cloud
Cross-Stack Functionality
Across the different stacks of an IoT solution are a number of features that need to be
considered for any IoT architecture, including
1 Security – Security needs to be implemented from the devices to the cloud Features such
as authentication, encryption, and authorization need be part of each stack
2 Ontologies – The format and description of device data is an important feature to enable
data analytics and data interoperability. The ability to define ontologies and metadata across
heterogeneous domains is a key area for IoT
3 Development Tools and SDKs – IoT Developers will require development tools that
support the diferent hardware and software platforms involved
10. Packages for Project
Python packages for developing IoT applications. I mostly develop applications on the
Raspberry Pi Model 3 or the Intel Edison. Both are extremely capable Single Board
Computers, with a lot of peripherals to play around with. Both support Linux derived OS
distributions and support full Python 2.7 or 3.4. With the right Python packages installed,
both of these devices become very versatile components in the IoT domain.
Mraa
mraa is a skeleton GPIO library for most SBCs which support Python. The good thing about
it is that there's just one library for all devices, so I don't have to use different ones for an
Edison and a Pi. Being a high level library, reading from and writing to pins is a one line
affair, and the library also provides support for communication protocols such as I2C,
UART and SPI

62
Sockets
sockets is a package which facilitates networking over TCP/IP and UDP using Python. It
provides access to Berkeley socket APIs to access the Internet. Both TCP/IP and UDP being
Transport layer protocols, are ideal for communication with devices on the same WiFi
network. One of the more interesting uses of sockets, in my experience is that one can build
their own communication protocol using this package as the base
.
Fig 53.Socket
Mysqldb
A database is a no-brainer when it comes to most IoT applications. For something whose
sole purpose is to send data to the internet, there should be a database, at least a remote one
which stores all this generated data. MySQL is the go-to relational database for most
developers. In this regard, mysqldb is a very convenient little tool which circumvents the
need to execute shell commands within a Python script to read and write to a database.
Numpy
Having used MatLab extensively during my undergraduate studies, I've grown accustomed
to dealing with arrays. Python, on the other hand, deals with lists as a substitute for the
array which is the same as having a birch tree replace your Rottweiler as the guardian of the
house. It just doesn't work. Thankfully, numpy is there to help you out. It is, in essence, a
package for scientific computing using Python, very similar to MatLab, but much lighter.
The feature I use most is to read sensor data in bulk from my databases and work on them
using the inbuilt functions.

63
Fig 54.numpy
Matplotlib
Data visualization is one of the most fundamental operations that can be performed. It looks
pretty impressive when you convert a huge list of numbers to a concise graph which can be
understood intuitively. It's also very useful if you happen to be an academician. You know
how important those graphs can be in a publication. matplotlib provides a number of
different styles of graphs that can be plotted using local data. If you're a data scientist, this is
althemore useful to you. Personally, matplotlib is a very usefultool to quickly give me
insight to the data I have at my disposal.
Fig 55. Matplot
Pandas
Another library for data scientists, pandas is a package dedicated towards data analysis. It is
in essence, a local alternative to using SQL databases which is more suited to dealing with
data as it is built on numpy. It has many advantages over the former, such as a more
streamlined approach to data handling and analysis, direct operations on local datasets and
the ability to handle heterogeneous and unordered data

64
Openv
The big brother of signal processing, image processing, was traditionally the domain of high
performance, custom built hardware. Although such devices still carry out the job much
faster than their single board counterparts, it is at the very least, a possibility. And, in
situations where mobility and connectivity are prioritized over speed, this may just be the
solution for those rare times. Opencv is a Python port of the very successful C library for
image processing. It contains high-level variants of familiar image processing functions
which make photo analysis much easier.
Fig 57. Opencv
tkinter
Although this library does come preinstalled with all installations of Python, its still worthy
of a mention. Tkinter is a GUI development library which comes bundled in with all
distributions of Python. For people who are more comfortable with a stab wound rather than
object oriented programming, learning how to use this package may be a bit daunting at
first, but the rewards more than make up for the effort. Every aspect of your Python script
can be controlled via a completely ad hoc GUI. This is extremely useful in situations such as
functionality testing or repeated executions of the same code.
Fig58. Tkinter
Tensorflow
Tensorflow is a package for numerical computations for machine learning. It utilizes a
different mathematical representation called data flow graphs which use nodes as
mathematical operations and edges as data arrays. This is a very useful library to have if
you deal with a lot of non linear datasets or work extensively with decision trees and neural
networks.
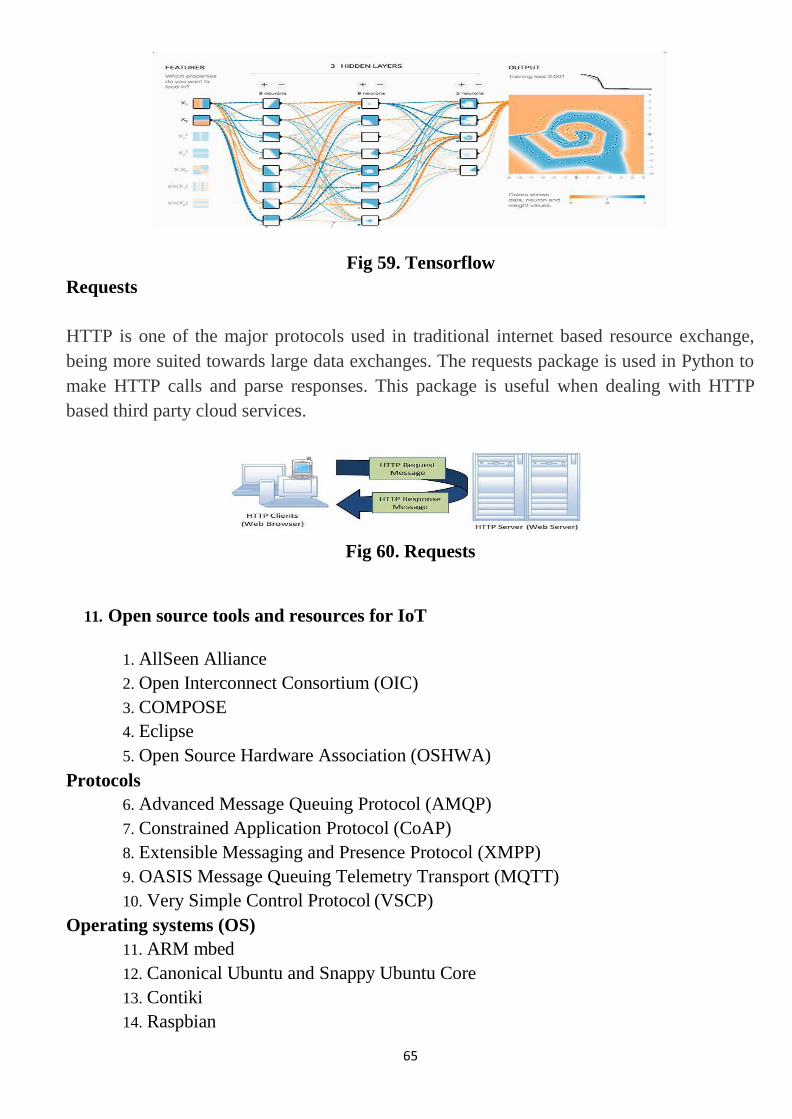
65
Fig 59. Tensorflow
Requests
HTTP is one of the major protocols used in traditional internet based resource exchange,
being more suited towards large data exchanges. The requests package is used in Python to
make HTTP calls and parse responses. This package is useful when dealing with HTTP
based third party cloud services.
Fig 60. Requests
11. Open source tools and resources for IoT
1. AllSeen Alliance
2. Open Interconnect Consortium (OIC)
3. COMPOSE
4. Eclipse
5. Open Source Hardware Association (OSHWA)
Protocols
6. Advanced Message Queuing Protocol (AMQP)
7. Constrained Application Protocol (CoAP)
8. Extensible Messaging and Presence Protocol (XMPP)
9. OASIS Message Queuing Telemetry Transport (MQTT)
10. Very Simple Control Protocol (VSCP)
Operating systems (OS)
11. ARM mbed
12. Canonical Ubuntu and Snappy Ubuntu Core
13. Contiki
14. Raspbian
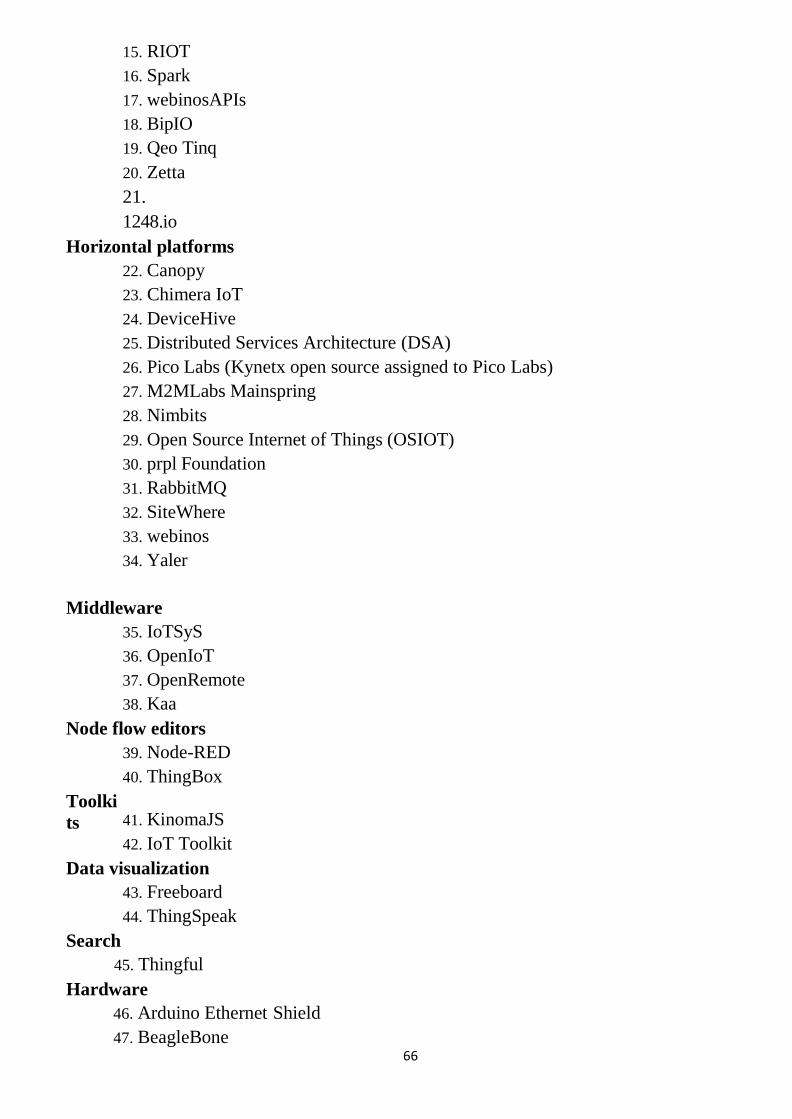
66
15. RIOT
16. Spark
17. webinosAPIs
18. BipIO
19. Qeo Tinq
20. Zetta
21.
1248.io
Horizontal platforms
22. Canopy
23. Chimera IoT
24. DeviceHive
25. Distributed Services Architecture (DSA)
26. Pico Labs (Kynetx open source assigned to Pico Labs)
27. M2MLabs Mainspring
28. Nimbits
29. Open Source Internet of Things (OSIOT)
30. prpl Foundation
31. RabbitMQ
32. SiteWhere
33. webinos
34. Yaler
Middleware
35. IoTSyS
36. OpenIoT
37. OpenRemote
38. Kaa
Node flow editors
39. Node-RED
40. ThingBox
Toolki
ts
41. KinomaJS
42. IoT Toolkit
Data visualization
43. Freeboard
44. ThingSpeak
Search
45. Thingful
Hardware
46. Arduino Ethernet Shield
47. BeagleBone

67
48. Intel Galileo
49. openPicus FlyportPro
50. Pinoccio
51. WeIO
52. WIZnet
In-memory data grids
53. Ehcache
54. Hazelcast
Home automation
55. Home Gateway Initiative (HGI)
56. Ninja Blocks
57. openHAB
58. Eclipse SmartHome
59. PrivateEyePi
60. RaZberry
61. The Thing System
Robotics
62. Open Source Robotics Foundation
Mesh networks
63. Open Garden
64. OpenWSN
Health
65. e-Health Sensor Platform
Air pollution
66. HabitatMap Airbeam
Water
67. Oxford Flood Network

1
SCHOOL OF COMPUTING
DEPARTMENT OF COMPUTER SCIENCE AND ENGINEERING
UNIT – II – Internet of Things – SCSA5301 UNIT – III – Internet of Things – SIT1619

SCHOOL OF COMPUTING Page 2
UNIT III
COMMUNICATION AND CONNECTIVE TECHNOLOGIES
IoT Communication Model, Cloud computing in IoT, IoT in cloud architecture,
Logging on to cloud, Selecting and Creating cloud service ,Managing Cloud Account
Credentials and Generating Key Pair, Creating IoT Cloud Service.
1. IoT Communication Model
2. Cloud computing in IoT
3. IoT in cloud architecture
4. Logging on to cloud, Selecting and Creating cloud service , Managing
Cloud Account Credentials and Generating Key Pair
5. Creating IoT Cloud Service
1. IoT Communication Model
The term of internet of things (IoT) communication offered by Internet
protocols . Many of the devices often called as smart objects operated by
humans as components in buildings or vehicles, or are spread out in the
environment.
Communication types
1. Device-to-Device Communications
2. Device-to-Cloud Communications
Device-to-Device Communications:
The device-to-device communication model represents two or more
devices that directly connect and communicate between one another, rather
than through an intermediary application server. These devices communicate
over many types of networks, including IP networks or the Internet.
Often,however these devices use protocols like Bluetooth-Wave, or ZigBee to

SCHOOL OF COMPUTING Page 3
establish direct device-to-device communications.
Attack Surfaces on Device to Device Communication:
Credentials stealing from the firmware
Sensitive information disclosure
No proper updating mechanism of firmware
DoS Attacks
Buffer-overflow
attacks
A buffer is a temporary area for data storage. When more data gets placed by a
program or system process, the extra data overflows. It causes some of that data
to leak out into other buffers, which can corrupt or overwrite whatever data they
were holding. In a buffer- overflow attack, the extra data sometimes holds
specific instructions for actions intended by a hacker or malicious user; for
example, the data could trigger a response that damages files, changes data or
unveils private information.
Best Practices for securing Device to Device Communication:
Evaluate hardware components, firmware, software, communications protocols
Try to Make the signed Firmware, software and hash your binaries.
Implement the machine to machine authentication securely.
Get the feedback from the clients to improve the device security levels
Device-to-Cloud Communications
In a device to cloud communication model, the IoT device connects
directly to an Internet cloud service like an application service provider to

SCHOOL OF COMPUTING Page 4
exchange data and control message traffic. This approach frequently takes
advantage of existing communications mechanisms like traditional wired
Ethernet or Wi-Fi connections to establish a connection between the device
and the IP network, which ultimately connects to the cloud service.
Figure 1: Device to Cloud Communication
Device to Cloud protocols . Below table 1 explains the details about the
protocols :
Protocols AMQP MQT
T
XMPP CoAP
Transport TCP/IP TCP/I
P
TCP/IP UDP/I
P
Message
pattern
Publish
—
Subscrib
e
Publish
—
Subscrib
e
Point —
Point
Publish
–
Subscri
be
Request
–
Respons
e
The Advanced Message Queuing Protocol (AMQP) and the MQTT
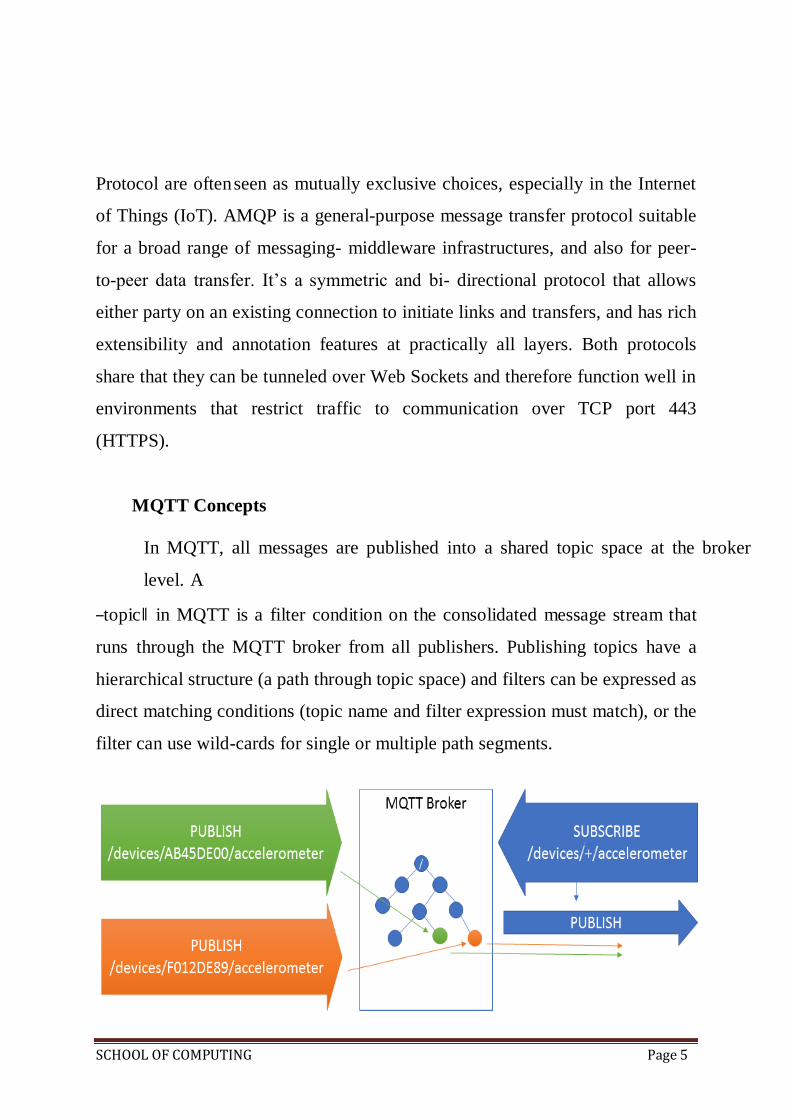
SCHOOL OF COMPUTING Page 5
Protocol are often seen as mutually exclusive choices, especially in the Internet
of Things (IoT). AMQP is a general-purpose message transfer protocol suitable
for a broad range of messaging- middleware infrastructures, and also for peer-
to-peer data transfer. It’s a symmetric and bi- directional protocol that allows
either party on an existing connection to initiate links and transfers, and has rich
extensibility and annotation features at practically all layers. Both protocols
share that they can be tunneled over Web Sockets and therefore function well in
environments that restrict traffic to communication over TCP port 443
(HTTPS).
MQTT Concepts
In MQTT, all messages are published into a shared topic space at the broker
level. A
―topic‖ in MQTT is a filter condition on the consolidated message stream that
runs through the MQTT broker from all publishers. Publishing topics have a
hierarchical structure (a path through topic space) and filters can be expressed as
direct matching conditions (topic name and filter expression must match), or the
filter can use wild-cards for single or multiple path segments.
SCHOOL OF COMPUTING Page 6
Figure 2: MQTT Protocol
Every published message from any publisher is eligible for delivery into
any client session where a subscription exists with a matching topic filter.
MQTT is very suitable for fast and ―online‖ dispatch and distribution of
messages to many subscribers in scenarios where it’s feasible for the entirety
of the consolidated published message stream to be inspected on behalf of all
concurrent subscribers.
MQTT’s ―subscribe‖ gesture is much lighter weight. It establishes a filter
context and simultaneously initiates and unbounded receive operation on that
context. If session recovery is used, to scope of undelivered messages is that
individual filter context. Subscribing is receiving. In some brokers, such an
MQTT subscription context may indeed be backed by a volatile queue to allow
leveling between fast and slow subscribers and to allow for caching of messages
while a subscriber is temporarily disconnected and if session recovery is
supported; but that’s an implementation detail, not an explicit construct. The
trouble with MQTT is that it uses TCP connections to a MQTT broker. Having
an always-on connection will limits the time the devices can be put to sleep.
This can be somewhat mitigated by using MQTT-S, which works with UDP
instead of TCP. But MQTT also lacks encryption since the protocol was
intended to be lightweight and encryption would add significant overhead.
Advanced Message Queuing Protocol (AMQP) is an open source published
standard for asynchronous messaging by wire. AMQP enables encrypted and
interoperable messaging between organizations and applications. The protocol
is used in client/server messaging and in IoT device management. AMPQ is

SCHOOL OF COMPUTING Page 7
efficient, portable, multichannel and secure. The messaging protocol is fast and
features guaranteed delivery with acknowledgement of received messages.
AMPQ works well in multi-client environments and provides a means for
delegating tasks and making servers handle immediate requests faster. Because
AMPQ is a streamed binary messaging system with tightly mandated messaging
behavior, the interoperability of clients from different vendors is assured.
AMQP allows for various guaranteed messaging modes specifying a message be sent:
At-most-once(sent one time with the possibility of being missed).
At-least-once (guaranteeing delivery with the possibility of duplicated messages).
Exactly-once (guaranteeing a one-time only delivery).
eXtensible Messaging and Presence Protocol (XMPP) is a TCP protocol based
on XML. It enables the exchange of structured data between two or more
connected entities, and out of the box it supports presence and contact list
maintenance (since it started as a chat protocol). Because of the open nature of
XML, XMPP can be easily extended to include publish- subscribe systems,
making it a good choice for information that is handed to a central server and
then distributed to numerous IoT devices at once. It is decentralized, and
authentication can be built in by using a centralized XMPP server. The
downsides of XMPP for IoT is that it lacks end-to-end encryption. It also doesn’t
have quality-of-service functionality, which can be a real deal-breaker
depending on the application.
Constrained Application Protocol (CoAP) is a protocol specifically
developed for resource- constrained devices. It uses UDP instead of TCP, and
developers can work with CoAP the same way they work with REST-based
APIs. Since it uses minimal resources, it is a good option or low-power sensors.

SCHOOL OF COMPUTING Page 8
Since it uses UDP, it also can run on top of packet-based technologies such as
SMS, and messages can be marked confirmable or nonconfirmable to work with
QoS. Datagram Transport Layer Security (DTLS) can be used for encryption.
The downside of CoAP is that it is a one-to-one protocol, so broadcast
capabilities are not native to the protocol.
Attack Surfaces on Device to Cloud Communication
1. SQL injection , Cross-site scripting , Cross-site Request Forgery possible
attacks on cloud application interfaces.
SQL Injection (SQLi) refers to an injection attack wherein an attacker can
execute malicious SQL statements (also commonly referred to as a malicious
payload) that control a web application’s database server (also commonly
referred to as a Relational Database Management System – RDBMS). Since an
SQL Injection vulnerability could possibly affect any website or web
application that makes use of an SQL-based database, the vulnerability is one of
the oldest, most prevalent and most dangerous of web application
vulnerabilities.
2. Cross-site Scripting (XSS) refers to client-side code injection attack
wherein an attacker can execute malicious scripts (also commonly
referred to as a malicious payload) into a legitimate website or web
application. XSS is amongst the most rampant of web application
vulnerabilities and occurs when a web application makes use of
unvalidated or unencoded user input within the output it generates. By
leveraging XSS, an attacker does not target a victim directly. Instead, an
attacker would exploit a vulnerability within a website or web application
that the victim would visit, essentially using the vulnerable website as a

SCHOOL OF COMPUTING Page 9
vehicle to deliver a malicious script to the victim’s browser.
3. Username and password enumeration attacks
4. MITM attacks
Man-in-the-middle attack (MITM) is an attack where the attacker secretly
relays and possibly alters the communication between two parties who believe
they are directly communicating with each other. One example of man-
in-the-middle attacks is active eavesdropping, in which the attacker makes
independent connections with the victims and relays messages between them to
make them believe they are talking directly to each other over a private
connection, when in fact the entire conversation is controlled by the
attacker. The attacker must be able to intercept all relevant messages passing
between the two victims and inject new ones.
5. Man in the Cloud (MiTC) attacks
Man in the cloud (MitC) attacks are interesting, and worrying, as they do
not require any exploits or the running malicious code in order to get a
grip during the initial infection stage. Instead they rely upon the type of
common file synchronization service that we have all become used to,
the likes of DropBox or Google Drive for example, to be the
infrastructure providing command and control, data exfiltration and
remote access options. Man in the cloud attacks are interesting, and
worrying, as they do not require any exploits or the running malicious
code .Simply by reconfiguring these cloud services, without end user
knowledge and without the need for plaintext credential compromise to
have occurred. It is hard for common security measures to detect as the
synchronization protocol being used makes it all but impossible to

SCHOOL OF COMPUTING Page 10
distinguish between malicious and normal traffic.
Best Practices for securing Device to Cloud Security:
Check all cloud interfaces are reviewed for security vulnerabilities
(e.g. API interfaces and cloud-based web interfaces)
Make sure cloud-based web interface not having weak passwords
Ensure that any cloud-based web interface has an account lockout mechanism
Implement two-factor authentication for cloud-based web interfaces
Maintain transport encryption
Ensure that any cloud-based web interface has been tested for XSS,
SQLi and CSRF vulnerabilities.
2. IoT in Cloud
The advent of cloud computing has acted as a catalyst for the development
and deployment of scalable Internet-of-Things business models and
applications. Therefore, IoT and cloud are nowadays two very closely affiliated
future internet technologies, which go hand-in-hand in non-trivial IoT
deployments.
Cloud computing is the next evolutionary step in Internet-based computing,
which provides the means for delivering ICT resources as a service. The ICT
resources that can be delivered through cloud computing model include
computing power, computing infrastructure (e.g., servers and/or storage
resources), applications, business processes and more. Cloud computing
infrastructures and services have the following characteristics, which typically
differentiate them from similar (distributed computing) technologies:
Elasticity and the ability to scale up and down: Cloud computing

SCHOOL OF COMPUTING Page 11
services can scale upwards during high periods of demand and downward
during periods of lighter demand. This elastic nature of cloud computing
facilitates the implementation of flexibly scalable business models, e.g.,
through enabling enterprises to use more or less resources as their business
grows or shrinks.
Self-service provisioning and automatic deprovisioning: Contrary to
conventional web-based Application Service Providers (ASP) models (e.g.,
web hosting), cloud computing enables easy access to cloud services without
a lengthy provisioning process. In cloud computing, both provisioning and de-
provisioning of resources can take place automatically.
Application programming interfaces (APIs): Cloud services are
accessible via APIs, which enable applications and data sources to
communicate with each other.
Billing and metering of service usage in a pay-as-you-go model: Cloud
services are associated with a utility-based pay-as-you-go model. To this end,
they provide the means for metering resource usage and subsequently issuing
bills.
Performance monitoring and measuring: Cloud computing
infrastructures provide a service management environment along with an
integrated approach for managing physical environments and IT systems.
Security: Cloud computing infrastructures offer security functionalities
towards safeguarding critical data and fulfilling customers’ compliance
requirements.
The two main business drivers behind the adoption of a cloud computing model
and associated services including:
Business Agility: Cloud computing alleviates tedious IT procurement
processes, since it facilitates flexible, timely and on-demand access to

SCHOOL OF COMPUTING Page 12
computing resources (i.e. compute cycles, storage) as needed to meet business
targets.
Depending on the types of resources that are accessed as a service, cloud
computing is associated with different service delivery models.
Infrastructure as a Service (IaaS): IaaS deals with the delivery of
storage and computing resources towards supporting custom business
solutions. Enterprises opt for an IaaS cloud computing model in order to
benefit from lower prices, the ability to aggregate resources, accelerated
deployment, as well as increased and customized security. The most
prominent example of IaaS service Amazon’s Elastic Compute Cloud (EC2),
which uses the Xen open-source hypervisor to create and manage virtual
machines.
Platform as a Service (PaaS): PaaS provides development environments
for creating cloud-ready business applications. It provides a deeper set of
capabilities comparing to IaaS, including development, middleware, and
deployment capabilities. PaaS services create and encourage deep ecosystem
of partners who commit to this environment. Typical examples of PaaS
services are Google’s App Engine and Microsoft’s Azure cloud environment,
which both provide a workflow engine, development tools, a testing
environment, database integration functionalities, as well as third-party tools
and services.
Software as a Service (SaaS): SaaS services enable access to purpose-
built business applications in the cloud. Such services provide the pay-go-go,
reduced CAPEX and elastic properties of cloud computing infrastructures.
Cloud services can be offered through infrastructures (clouds) that are publicly
accessible (i.e. public cloud services), but also by privately owned

SCHOOL OF COMPUTING Page 13
infrastructures (i.e. private cloud services). Furthermore, it is possible to offer
services supporting by both public and private clouds, which are characterized
as hybrid cloud services.
IoT/Cloud Convergence
Internet-of-Things can benefit from the scalability, performance and pay-
as-you-go nature of cloud computing infrastructures. Indeed, as IoT
applications produce large volumes of data and comprise multiple
computational components (e.g., data processing and analytics algorithms), their
integration with cloud computing infrastructures could provide them with
opportunities for cost-effective on-demand scaling. As prominent examples
consider the following settings:
A Small Medium Enterprise (SME) developing an energy management
IoT product, targeting smart homes and smart buildings. By streaming the
data of the product (e.g., sensors and WSN data) into the cloud it can
accommodate its growth needs in a scalable and cost effective fashion.
A smart city can benefit from the cloud-based deployment of its IoT
systems and applications. A city is likely to deploy many IoT applications,
such as applications for smart energy management, smart water management,
smart transport management, urban mobility of the citizens and more. These
applications comprise multiple sensors and devices, along with computational
components. Furthermore, they are likely to produce very large data volumes.
Cloud integration enables the city to host these data and applications in a cost-
effective way. Furthermore, the elasticity of the cloud can directly support
expansions to these applications, but also the rapid deployment of new ones
without major concerns about the provisioning of the required cloud

SCHOOL OF COMPUTING Page 14
computing resources.
A cloud computing provider offering pubic cloud services can extend
them to the IoT area, through enabling third-parties to access its infrastructure
in order to integrate IoT data and/or computational components operating over
IoT devices. The provider can offer IoT data access and services in a pay-as-
you-fashion, through enabling third-parties to access resources of its
infrastructure and accordingly to charge them in a utility-based fashion.
One of the earliest efforts has been the famous Pachube.com infrastructure (used
extensively for radiation detection and production of radiation maps during
earthquakes in Japan). Pachube.com has evolved (following several evolutions
and acquisitions of this infrastructure) to Xively.com, which is nowadays one
of the most prominent public IoT clouds. Nevertheless, there are tens of
other public IoT clouds as well, such as ThingsWorx, ThingsSpeak,
Sensor-Cloud, Realtime.io and more. The list is certainly non- exhaustive.
These public IoT clouds offer commercial pay-as-you-go access to end-users
wishing to deploying IoT applications on the cloud. Most of them come with
developer friendly tools, which enable the development of cloud applications,
thus acting like a PaaS for IoT in the cloud.
Similarly to cloud computing infrastructures, IoT/cloud infrastructures and
related services can be classified to the following models:
Infrastructure-as-a-Service (IaaS) IoT/Clouds: These services provide
the means for accessing sensors and actuator in the cloud. The associated
business model involves the IoT/Cloud provide to act either as data or sensor
provider. IaaS services for IoT provide access control to resources as a
prerequisite for the offering of related pay-as-you-go services.
Platform-as-a-Service (PaaS) IoT/Clouds: This is the most widespread

SCHOOL OF COMPUTING Page 15
model for IoT/cloud services, given that it is the model provided by all public
IoT/cloud infrastructures outlined above. As already illustrate most public IoT
clouds come with a range of tools and related environments for applications
development and deployment in a cloud environment. A main characteristic
of PaaS IoT services is that they provide access to data, not to hardware. This
is a clear differentiator comparing to IaaS.
Software-as-a-Service (SaaS) IoT/Clouds: SaaS IoT services are the
ones enabling their uses to access complete IoT-based software applications
through the cloud, on- demand and in a pay-as-you-go fashion. As soon as
sensors and IoT devices are not visible, SaaS IoT applications resemble very
much conventional cloud-based SaaS applications.
The benefits of integrating IoT into Cloud are discussed in this section as follows.
1. Communication
The Cloud is an effective and economical solution which can be used to
connect, manage, and track anything by using built-in apps and customized
portals . The availability of fast systems facilitates dynamic monitoring and
remote objects control, as well as data real-time access. It is worth declaring
that, although the Cloud can greatly develop and facilitate the IoT
interconnection, it still has weaknesses in certain areas. Thus, practical
restrictions can appear when an enormous amount of data needs to be
transferred from the Internet to the Cloud.
2. Storage
As the IoT can be used on billions of devices, it comprises a huge number of
information sources, which generate an enormous amount of semi-structured or
non-structured data . This is known as Big Data, and has three characteristics :
variety (e.g. data types), velocity (e.g. data generation frequency), and volume
(e.g. data size). The Cloud is considered to be one of the most cost-effective and
SCHOOL OF COMPUTING Page 16
suitable solutions when it comes to dealing with the enormous amount of data
created by the IoT. Moreover, it produces new chances for data integration,
aggregation, and sharing with third parties.
3. Processing capabilities
IoT devices are characterized by limited processing capabilities which prevent
on-site and complex data processing. Instead, gathered data is transferred to
nodes that have high capabilities; indeed, it is here that aggregation and
processing are accomplished. However, achieving scalability remains a
challenge without an appropriate underlying infrastructure. Offering a solution,
the Cloud provides unlimited virtual processing capabilities and an on- demand
usage model . Predictive algorithms and data-driven decisions making can be
integrated into the IoT in order to increase revenue and reduce risks at a lower
cost .
4. Scope
With billions of users communicating with one another together and a variety of
information being collected, the world is quickly moving towards the Internet of
Everything (IoE) realm - a network of networks with billions of things that
generate new chances and risks . The Cloud-based IoT approach provides new
applications and services based on the expansion of the Cloud through the IoT
objects, which in turn allows the Cloud to work with a number of new real
world scenarios, and leads to the emergence of new services .
5. New abilities
The IoT is characterised by the heterogeneity of its devices, protocols, and
technologies. Hence, reliability, scalability, interoperability, security,
availability and efficiency can be very hard to achieve. Integrating IoT into the
Cloud resolves most of these issues. It provides other features such as easeof-

SCHOOL OF COMPUTING Page 17
use and ease-of-access, with low deployment costs .
6. New Models
Cloud-based IoT integration empowers new scenarios for smart objects,
applications, and services. Some of the new models are listed as follows:
• SaaS (Sensing as a Service) , which allows access to sensor data;
• EaaS (Ethernet as a Service), the main role of which is to provide ubiquitous
connectivity to control remote devices;
• SAaaS (Sensing and Actuation as a Service), which provides control logics
automatically.
• IPMaaS (Identity and Policy Management as a Service) , which provides
access to policy and identity management.
• DBaaS (Database as a Service), which provides ubiquitous database management;
• SEaaS (Sensor Event as a Service) , which dispatches messaging services that
are generated by sensor events;
• SenaaS (Sensor as a Service) , which provides management for remote sensors;
• DaaS (Data as a Service), which provides ubiquitous access to any type of data.
3. Cloud Architecture
The cloud components of IoT architecture are positioned within a
three-tier architecture pattern comprising edge, platform and enterprise
tiers, as described in the Industrial Internet Consortium Reference
Architecture . The edge-tier includes Proximity Networks and Public
Networks where data is collected from devices and transmitted to devices.
Data flows through the IoT gateway or optionally directly from/to the
device then through edge services into the cloud provider via IoT
transformation and connectivity. The Platform tier is the provider cloud,

SCHOOL OF COMPUTING Page 18
which receives, processes and analyzes data flows from the edge tier and
provides API Management and Visualization. It provides the capability to
initiate control commands from the enterprise network to the public
network as well. The Enterprise tier is represented by the Enterprise
Network comprised of Enterprise Data, Enterprise User Directory, and
Enterprise Applications. The data flow to and from the enterprise network
takes place via a Transformation and Connectivity component. The data
collected from structured and non-structured data sources, including real-
time data from stream computing, can be stored in the enterprise data.
One of the features of IoT systems is the need for application logic
and control logic in a hierarchy of locations, depending on the timescales
involved and the datasets that need to be brought to bear on the decisions
that need to be made. Some code may execute directly in the devices at the
very edge of the network, or alternatively in the IoT Gateways close to the
devices. Other code executes centrally in the provider cloud services or in
the enterprise network. This is sometimes alternatively called ―fog
computing‖ to contrast with centralised ―cloud computing‖, although
fog computing can also contain one or more layers below the cloud that
each could potentially provide capabilities for a variety of services like
analytics.
Aspects of the architecture include:
The user layer is independent of any specific network domain.
It may be in or outside any specific domain.
The proximity network domain has networking capabilities that
typically extend the public network domain. The devices

SCHOOL OF COMPUTING Page 19
(including sensor/actuator, firmware and management agent) and
the physical entity are part of the proximity network domain. The
devices communicate for both data flow and control flow either
via an IoT Gateway and edge services or directly over the public
network via edge services.
The public network and enterprise network domains contain data sources
that feed the entire architecture. Data sources include
traditional systems of record from the enterprise as well as new
sources from Internet of Things (IoT). The public network
includes communication with peer clouds.
The provider cloud captures data from devices, peer cloud
services and other data sources (for example Weather services). It
can use integration technologies or stream processing to
transform, filter and analyse this data in real time and it can store
the data into repositories where further analytics can be
performed. This processing, which can be augmented with the
use of Cognitive and Predictive analytics, is used to generate
Actionable Insights. These insights are used by users and
enterprise applications and can also be used to trigger actions to
be performed by IoT Actuators. All of this needs to be done in a
secure and governed environment.

SCHOOL OF COMPUTING Page 20
The following figure 3 shows the capabilities and relationships for
supporting IoT using cloud computing.
Figure 3: Cloud Components for IoT
User Layer - contains IoT users and their end user applications.
IoT User (people/system) - a person or alternatively an automated

SCHOOL OF COMPUTING Page 21
system that makes use of one or more end user applications to achieve
some goal. The IoT User is one of the main beneficiaries of the IoT
solution.
End User Application - domain specific or device specific application.
The IoT user may use end user applications that run on smart phones,
tablets, PCs or alternatively on specialised IoT devices including control
panels.
Proximity Network - contains the physical entities that are at the heart of
the IoT system, along with the devices that interact with the physical
entities and connect them to the IoT system.
Physical Entity - the physical entity is the real-world object that is of
interest – it is subject to sensor measurements or to actuator behavior. It is
the ―thing‖ in the Internet of Things. This architecture distinguishes
between the physical entities and the IT devices that sense them or act on
them. For example, the thing can be the ocean and the device observing is
it a water temperature thermometer.
Device - contains sensor(s) and/or actuator(s) plus a network connection
that enables interaction with the wider IoT system. There are cases where
the device is also the physical entity being monitored by the sensors – such
as an accelerometer inside a smart phone.
Sensor/Actuator - senses and acts on physical entities. A sensor is a
component that senses or measures certain characteristics of the real
world and converts them into a digital representation. An actuator is a
component that accepts a digital command to act on a physical entity in

SCHOOL OF COMPUTING Page 22
some way.
Agent - provides remote management capabilities for the device,
supporting a device management protocol that can be used by the Device
Management service or IoT management system.
Firmware - software that provides control, monitoring and data
manipulation of engineered products and systems. The firmware
contained in devices such as consumer electronics provides the low-level
control program for the devices.
Network Connection - provides the connection from the device to the
IoT system. This is often a local network that connects the device with an
IoT gateway – low power and low range in many cases to reduce the
power demands on the device.
User Interface - allows users to interact with applications, agents,
sensors and actuators (optional – some devices have no user interface
and all interaction takes place from remote applications over the
network).
IoT Gateway - acts as a means for connecting one or more devices to the
public network (typically the Internet). It is commonly the case that devices
have limited network connectivity – they may not be able to connect
directly to the Internet. This can be for a number of reasons, including the
limitation of power on the device, which can restrict the device to using a
low-power local network. The local network enables the devices to
communicate with a local IoT Gateway, which is then able to communicate
with the public network. The IoT Gateway contains the following
components:

SCHOOL OF COMPUTING Page 23
App Logic - provides domain specific or IoT solution specific logic that
runs on the IoT Gateway. For IoT systems that have Actuators which act
on physical entities, a significant capability of the app logic is the
provision of control logic which makes decisions on how the actuators
should operate, given input from sensors and data of other kinds, either
held locally or held centrally.
Analytics - provides Analytics capability locally rather than in the
provider cloud.
Agent - allows management of the IoT Gateway itself and can also
enable management of the attached devices by providing a
connection to the provider cloud layer's Device
Management.service via the device management protocol.
Device Data Store - stores data locally. Devices may generate a large
amount of data in real time it may need to be stored locally rather than
being transmitted to a central location. Data in the device data store
can be used by the application logic and analytics capability in the
IoT Gateway.
Public Network - contains the wide area networks (typically the internet),
peer cloud systems, the edge services.
Peer Cloud - a 3rd party cloud system that provides services to bring data
and capabilities to the IoT platform. Peer clouds for IoT may contribute to
the data in the IoT system and may also provide some of the capabilities
defined in this IoT architecture. For example an IoT for Insurance solution
may use services from partners, such as weather data.

SCHOOL OF COMPUTING Page 24
Edge Services - services needed to allow data to flow safely from the
internet into the provider cloud and into the enterprise. Edge services also
support end user applications. Edge services include:
Domain Name System Server - resolves the URL for a particular web
resource to the TCP-IP address of the system or service that can deliver that
resource.
Content Delivery Networks (CDN) - support end user applications by
providing geographically distributed systems of servers deployed to
minimize the response time for serving resources to geographically
distributed users, ensuring that content is highly available and provided to
users with minimum latency. Which servers are engaged will depend on
server proximity to the user, and where the content is stored or cached.
Firewall - controls communication access to or from a system
permitting only traffic meeting a set of policies to proceed and
blocking any traffic that does not meet the policies. Firewalls can be
implemented as separate dedicated hardware, or as a component in
other networking hardware such as a load-balancer or router or as
integral software to an operating system.
Load Balancers - provides distribution of network or application traffic
across many resources (such as computers, processors, storage, or
network links) to maximize throughput, minimize response time,
increase capacity and increase reliability of applications. Load balancers
can balance loads locally and globally. Load balancers should be highly
available without a single point of failure. Load balancers are
sometimes integrated as part of the provider cloud analytical system
components like stream processing, data integration, and repositories.

SCHOOL OF COMPUTING Page 25
Provider Cloud - provides core IoT applications and associated services
including storage of device data; analytics; process management for the
IoT system; create visualizations of data. Also hosts components for
device management including a device registry.
A cloud computing environment provides scalability and elasticity to cope
with varying data volume, velocity and related processing requirements.
Experimentation and iteration using different cloud service configurations
is a good way to evolve the IoT system, without upfront capital investment.
IoT Transformation and Connectivity - enables secure connectivity to
and from IoT devices. This component must be able to handle and
perhaps transform high volumes of messages and quickly route them to
the right components in the IoT solution. The Transformation and
Connectivity component includes the following capabilities:
Secure Connectivity - provides the secured connectivity which
authenticates and authorizes access to the provider cloud.
Scalable Messaging - provides messaging from and to IoT devices.
Scalability of the messaging component is essential to support high data
volume applications and applications with highly variable data rates,
like weather.
Scalable Transformation - provides transformation of device IoT data
before it gets to provider cloud layer, to provide a form more suitable for
processing and analysis. This may include decoding messages that are
encrypted, translating a compressed formatted message, and/or
normalizing messages from varying devices.

SCHOOL OF COMPUTING Page 26
Application Logic - The core application components, typically
coordinating the handling of IoT device data, the execution of other
services and supporting end user applications. An Event based
programming model with trigger, action and rules is often a good way to
write IoT application logic. Application logic can include workflow.
Application logic may also include control logic, which determines how to
use actuators to affect physical entities, for those IoT systems that have
actuators.
Visualization - enables users to explore and interact with data from the
data repositories, actionable insight applications, or enterprise
applications. Visualization capabilities include End user UI, Admin UI &
dashboard as sub components.
End User UI - allows users to communicate and interact with
Enterprise applications, analytics results, etc. This also includes internal
or customer facing mobile user interfaces.
Admin UI - enables administrators to access metrics, operation data, and
various logs.
Dashboard - allows users to view various reports. Admin UI and
Dashboard are internal facing user interfaces.
Analytics - Analytics is the discovery and communication of meaningful
patterns of information found in IoT data, to describe, to predict, and to
improve business performance.
Process Management - activities of planning, developing, deploying
and monitoring the performance of a business process. For IoT

SCHOOL OF COMPUTING Page 27
systems, real-time process management may provide significant
benefits.
Device Data Store - stores data from the IoT devices so that the data can
be integrated with processes and applications that are part of the IoT
System. Devices may generate a large amount of data in real time calling
for the Device Data Store to be elastic and scalable.
API Management - publishes catalogues and updates APIs in a wide
variety of deployment environments. This enables developers and end
users to rapidly assemble solutions through discovery and reuse of existing
data, analytics and services.
Device Management - provides an efficient way to manage and connect
devices securely and reliably to the cloud platform. Device management
contains device provisioning, remote administration, software updating,
remote control of devices, monitoring devices. Device management may
communicate with management agents on devices using management
protocols as well as communicate with management systems for the IoT
solutions.
Device Registry - stores information about devices that the IoT system
may read, communicate with, control, provision or manage. Devices may
need to be registered before they can connect to and or be managed by the
IoT system. IoT deployments may have a large number of devices therefore
scalability of the registry is important.
Device Identity Service - ensures that devices are securely identified
SCHOOL OF COMPUTING Page 28
before being granted access to the IoT systems and applications. In the IoT
systems, device identification can help address threats that arise from fake
servers or fake devices.
Transformation and Connectivity - enables secure connections to
enterprise systems and the ability to filter, aggregate, or modify data or its
format as it moves between cloud and IoT systems components and
enterprise systems (typically systems of record). Within the IoT reference
architecture the transformation and connectivity component sits between
the cloud provider and enterprise network. However, in a hybrid cloud
model these lines might become blurred. The Transformation and
Connectivity component includes the following capabilities:
Enterprise Secure Connectivity - integrates with enterprise data
security systems to authenticate and authorize access to enterprise
systems.
Transformation - transforms data going to and from enterprise systems.
Enterprise Data Connectivity - enables provider cloud components to
connect securely to enterprise data. Examples include VPN and
gateway tunnels.
Enterprise Network - host a number of business specific enterprise
applications that deliver critical business solutions along with supporting
elements including enterprise data. Typically, enterprise applications have
sources of data that are extracted and integrated with services provided by the
cloud provider. Analysis is performed in the cloud computing environment,
with output consumed by the enterprise applications.
SCHOOL OF COMPUTING Page 29
Enterprise Data - includes metadata about the data as well as systems of
record for enterprise applications. Enterprise data may flow directly to
data integration or the data repositories providing a feedback loop in the
analytical system for IoT. IoT systems may store raw, analyzed, or
processed data in appropriate Enterprise Data elements. Enterprise Data
includes:
Enterprise User Directory - stores user information to support authentication,
authorization, or profile data. The security services and edge services use this
to control access to the enterprise network, enterprise services, or enterprise
specific cloud provider services.
Enterprise Applications - Enterprise applications consume cloud provider data
and analytics to produce results that address business goals and objectives.
Enterprise applications can be updated from enterprise data or from IoT
applications or they can provide input and content for enterprise data and
Security and Privacy - Security and Privacy in IoT deployments must address
both information technology (IT) security as well as operations technology (OT)
security elements. Furthermore, the level of attention to security and the topic
areas to address varies depending upon the application environment, business
pattern, and risk assessment. A risk assessment will take into account multiple
threats and attacks along with an estimate of the potential costs associated with
such attacks. In addition to security considerations, the connecting of IT systems
with physical systems also brings with it the need to consider the impact to
safety that the IoT system may have. IoT systems must be designed, deployed,
and managed such that they can always bring the system to a safe operating

SCHOOL OF COMPUTING Page 30
state, even when disconnected from communications with other systems that are
part of the deployment. Identity and Access Management- As with any
computing system, there must be strong identification of all participating
entities – users, systems, applications, and, in the case of IoT, devices and the
IoT gateways through which those devices communicate with the rest of the
system. Device identity and management necessarily involves multiple entities,
starting with chip and device manufacturers, including IoT platform providers,
and also including enterprise users and operators of the devices. In IoT solutions
it is often the case that multiple of these entities will continue to communicate
and address the IoT devices throughout their operational lifetime.
Data Protection -Data in the device, in flight throughout the public network,
provider cloud, and enterprise network, as well as at rest in a variety of locations
and formats must be protected from inappropriate access and use. Multiple
methods can be utilized, and indeed, in many cases, multiple methods are
applied simultaneously to provide different levels of protection of dataagainst
different types ofthreatsor isolation from different entities supporting the system.
4. AWS IoT
AWS IoT provides secure, bi-directional communication between
Internet-connected devices such as sensors, actuators, embedded micro-
controllers, or smart appliances and the AWS Cloud. This enables you to collect
telemetry data from multiple devices, and store and analyze the data. You can
also create applications that enable your users to control these devices from their
phones or tablets.

SCHOOL OF COMPUTING Page 31
AWS IoT consists of the following components:
Device gateway -Enables devices to securely and efficiently communicate with
AWS IoT. Message broker-Provides a secure mechanism for devices and
AWS IoT applications to publish and receive messages from each other. You
can use either the MQTT protocol directly or MQTT over WebSocket to
publish and subscribe. You can use the HTTP REST interface to publish.
Rules engine-Provides message processing and integration with other AWS
services. You can use an SQL-based language to select data from message
payloads, and then process and send the data to other services, such as Amazon
S3, Amazon DynamoDB, and AWS Lambda. You can also use the message
broker to republish messages to other subscribers.
Security and Identity service-Provides shared responsibility for security in the
AWS Cloud. Your devices must keep their credentials safe in order to securely
send data to the message broker. The message broker and rules engine use AWS
security features to send data securely to devices or other AWS services.
Registry-Organizes the resources associated with each device in the AWS
Cloud. You register your devices and associate up to three custom attributes
with each one. You can also associate certificates and MQTT client IDs with
each device to improve your ability to manage and troubleshoot them.
Group registry-Groups allow you to manage several devices at once by
categorizing them into groups. Groups can also contain groups—you can build a
hierarchy of groups. Any action you perform on a parent group will apply to its
child groups, and to all the devices in it and in all of its child groups as well.
Permissions given to a group will apply to all devices in the group and in all of
its child groups.
Device shadow-A JSON document used to store and retrieve current state
information for a device.

SCHOOL OF COMPUTING Page 32
Device Shadow service-Provides persistent representations of your devices in
the AWS Cloud. You can publish updated state information to a device's
shadow, and your device can synchronize its state when it connects. Your
devices can also publish their current state to a shadow for use by applications
or other devices.
Device Provisioning service- Allows you to provision devices using a template
that describes the resources required for your device: a thing, a certificate, and
one or more policies. A thing is an entry in the registry that contains attributes
that describe a device. Devices use certificates to authenticate with AWS IoT.
Policies determine which operations a device can perform in AWS IoT.
Custom Authentication service- You can define custom authorizers that allow
you to manage your own authentication and authorization strategy using a
custom authentication service and a Lambda function. Custom authorizers allow
AWS IoT to authenticate your devices and authorize operations using bearer
token authentication and authorization strategies. Custom authorizers can
implement various authentication strategies (for example:
JWT verification, OAuth provider call out, and so on) and must return policy
documents which are used by the device gateway to authorize MQTT
operations.
Jobs Service- Allows you to define a set of remote operations that are sent to
and executed on one or more devices connected to AWS IoT. For example, you
can define a job that instructs a set of devices to download and install
application or firmware updates, reboot, rotate certificates, or perform remote
troubleshooting operations. To create a job, you specify a description of the
remote operations to be performed and a list of targets that should perform
them. The targets can be individual devices, groups or both.

SCHOOL OF COMPUTING Page 33
Accessing AWS IoT
AWS IoT provides the following interfaces to create and interact with your devices:
AWS Command Line Interface (AWS CLI)—Run commands for
AWS IoT on Windows, macOS, and Linux. These commands allow you
to create and manage things, certificates, rules, and policies. To get
started, see the AWS Command Line Interface User Guide.
AWS IoT API—Build your IoT applications using HTTP or HTTPS
requests. These API actions allow you to programmatically create and
manage things, certificates, rules, and policies.
AWS SDKs—Build your IoT applications using language-specific APIs.
These SDKs wrap the HTTP/HTTPS API and allow you to program in
any of the supported languages.
AWS IoT Device SDKs—Build applications that run on devices that
send messages to and receive messages from AWS IoT.
Related Services
AWS IoT integrates directly with the following AWS services:
Amazon Simple Storage Service—Provides scalable storage in the AWS
Cloud.
Amazon DynamoDB—Provides managed NoSQL databases.
Amazon Kinesis—Enables real-time processing of streaming data at a
massive scale. AWS Lambda—Runs your code on virtual servers from

SCHOOL OF COMPUTING Page 34
Amazon EC2 in response to events.
Amazon Simple Notification Service—Sends or receives notifications.
Amazon Simple Queue Service—Stores data in a queue to be retrieved
by applications.
Working of AWS IoT
AWS IoT enables Internet-connected devices to connect to the AWS
Cloud and lets applications in the cloud interact with Internet-connected
devices. Common IoT applications either collect and process telemetry
from devices or enable users to control a device remotely.
Devices report their state by publishing messages, in JSON format, on
MQTT topics. Each MQTT topic has a hierarchical name that identifies
the device whose state is being updated. When a message is published on
an MQTT topic, the message is sent to the AWS IoT MQTT message
broker, which is responsible for sending all messages published on an
MQTT topic to all clients subscribed to that topic.
Communication between a device and AWS IoT is protected through the
use of X.509 certificates. AWS IoT can generate a certificate for you or
you can use your own. In either case, the certificate must be registered
and activated with AWS IoT, and then copied onto your device. When
your device communicates with AWS IoT, it presents the certificate to
AWS IoT as a credential.
We recommend that all devices that connect to AWS IoT have an entry in
the registry. The registry stores information about a device and the
certificates that are used by the device to secure communication with
AWS IoT.
You can create rules that define one or more actions to perform based on
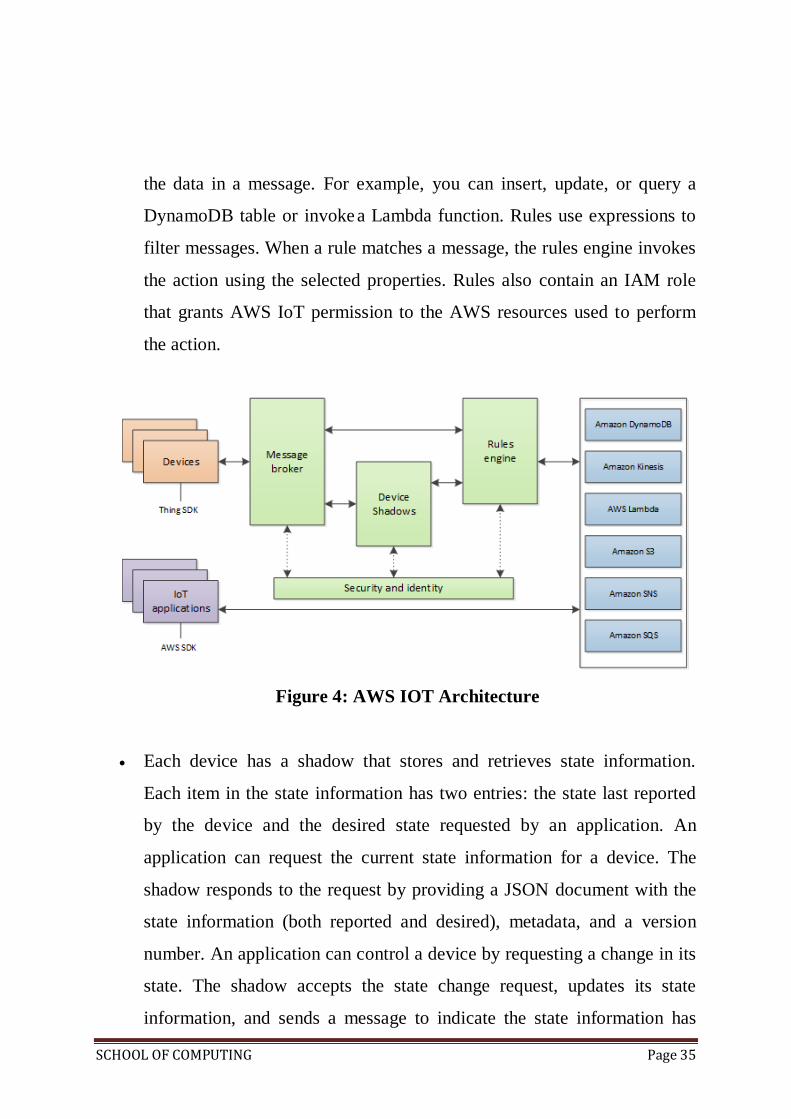
SCHOOL OF COMPUTING Page 35
the data in a message. For example, you can insert, update, or query a
DynamoDB table or invoke a Lambda function. Rules use expressions to
filter messages. When a rule matches a message, the rules engine invokes
the action using the selected properties. Rules also contain an IAM role
that grants AWS IoT permission to the AWS resources used to perform
the action.
Figure 4: AWS IOT Architecture
Each device has a shadow that stores and retrieves state information.
Each item in the state information has two entries: the state last reported
by the device and the desired state requested by an application. An
application can request the current state information for a device. The
shadow responds to the request by providing a JSON document with the
state information (both reported and desired), metadata, and a version
number. An application can control a device by requesting a change in its
state. The shadow accepts the state change request, updates its state
information, and sends a message to indicate the state information has

SCHOOL OF COMPUTING Page 36
been updated. The device receives the message, changes its state, and
then reports its new state.
5. Managing Cloud Account Credentials
If you do not have an AWS account, create one.
To create an AWS account:
1. Open the AWS home page and choose Create an AWS Account.
2. Follow the online instructions. Part of the sign-up procedure involves
receiving a phone call and entering a PIN using your phone's keypad.
3. Sign in to the AWS Management Console and open the AWS IoT console.
4. On the Welcome page, choose Get started.
Register a Device in the Registry
Devices connected to AWS IoT are represented by things in the registry.
The registry allows you to keep a record of all of the devices that are connected
to your AWS IoT account. The fastest way to start using your AWS IoT Button
is to download the mobile app for iOS or Android. The mobile app creates the
required AWS IoT resources for you, and adds an event source to your button
that uses a Lambda blueprint to invoke a new AWS Lambda function of your
choice. If you are unable to use the mobile apps, follow these instructions.
1. On the Welcome to the AWS IoT Console page, in the left navigation
pane, choose Manage to expand the choices, and then choose Things.

SCHOOL OF COMPUTING Page 37
Figure 6: Register a Thing
2. On the page that says You don't have any things yet, choose Register a thing.
3. On the Creating AWS IoT things page, choose Create a single thing.
4. On the Create a thing page, in the Name field, type a name for your
device, such as MyIoTButton. Choose Next to add your device to the
registry.

SCHOOL OF COMPUTING Page 38
Create and Activate a Device Certificate
Communication between your device and AWS IoT is protected through the
use of
X.509 certificates. AWS IoT can generate a certificate for you or you can use your
own
X.509 certificate. AWS IoT generates the X.509 certificate for you.
Certificates must be activated prior to use.
1. Choose Create certificate.
Figure 7: Certificate Creation
2. On the Certificate created! page, choose Download for the certificate,
private key, and the root CA for AWS IoT (the public key need not be
downloaded). Save each of them to your computer, and then choose
Activate to continue.Be aware that the downloaded filenames may be
different than those listed on the Certificate created! page. For

SCHOOL OF COMPUTING Page 39
example:
2a540e2346-certificate.pem.crt.txt
2a540e2346-private.pem.key
2a540e2346-public.pem.key
Note
Although it is unlikely, root CA certificates are subject to expiration
and/or revocation. If this should occur, you must copy new a root
CA certificate onto your device.
3. Choose the back arrow until you have returned to the main AWS
IoT console screen.
Create an AWS IoT Policy
X.509 certificates are used to authenticate your device with AWS IoT. AWS
IoT policies are used to authorize your device to perform AWS IoT operations,
such as subscribing or publishing to MQTT topics. Your device will presents its
certificate when sending messages to AWS IoT. To allow your device to
perform AWS IoT operations, you must create an AWS IoT policy and attach it
to your device certificate.
1. In the left navigation pane, choose Secure, and then Policies. On the You
don't have a policy yet page, choose Create a policy.
2. On the Create a policy page, in the Name field, type a name for the
policy (for example,MyIoTButtonPolicy). In the Action field,
type iot:Connect. In the Resource ARN field, type *. Select the

SCHOOL OF COMPUTING Page 40
Allow checkbox. This allows all clients to connect to AWS IoT.
You can restrict which clients (devices) are able to connect by specifying a client
ARN as the resource. The client ARNs follow this format:
arn:aws:iot:your-region:your-aws-account:client/<my-client-id>
Finally, select the Allow check box. This allows your device to publish
messages to the specified topic.After you have entered the information for your
policy, choose Create.
Attach an AWS IoT Policy to a Device Certificate
Now that you have created a policy, you must attach it to your device
certificate. Attaching an AWS IoT policy to a certificate gives the device the
permissions specified in the policy.
1. In the left navigation pane, choose Secure, and then Certificates.
Figure 8: Attach Certificate

SCHOOL OF COMPUTING Page 41
2. In the box for the certificate you created, choose ... to open a drop-down
menu, and then choose Attach policy.
3. In the Attach policies to certificate(s) dialog box, select the check box
next to the policy you created in the previous step, and then choose
Attach.
Attach a Certificate to a Thing
A device must have a certificate, private key and root CA certificate to
authenticate with AWS IoT. We recommend that you also attach the device
certificate to the thing that represents your device in AWS IoT. This allows you
to create AWS IoT policies that grant permissions based on certificates attached
to your things. For more information. see Thing Policy Variables
1. In the box for the certificate you created, choose ... to open a drop-down
menu, and then choose Attach thing.
2. In the Attach things to certificate(s) dialog box, select the check box
next to the thing you registered, and then choose Attach.
3. To verify the thing is attached, select the box representing the certificate.
4. On the Details page for the certificate, in the left navigation pane, choose
Things.
5. To verify the policy is attached, on the Details page for the certificate,
in the left navigation pane, choose Policies.

SCHOOL OF COMPUTING Page 42
Configure Your Device and Button
Configuring your device allows it to connect to your Wi-Fi network.
Your device must be connected to your Wi-Fi network to install required files
and send messages to AWS IoT. All devices must install a device certificate,
private key, and root CA certificate in order to communicate with AWS IoT.
The easiest way to configure your AWS IoT button is to use the AWS IoT
button smart phone app. You can download it from the Apple App Store or
the Google Play Store. If you are unable to use the smart phone app, follow
these directions to configure your button.
Turn on your device
1. Remove the AWS IoT button from its packaging, and then press and hold
the button until a blue blinking light appears. (This should take no longer
than 15 seconds.)
2. The button acts as a Wi-Fi access point, so when your computer searches
for Wi-Fi networks, it will find one called Button ConfigureMe - XXX
where XXX is a three- character string generated by the button. Use your
computer to connect to the button's Wi-Fi access point.

SCHOOL OF COMPUTING Page 43
Configure a Different Device
Consult your device's documentation to connect to it and copy your
device certificate, private key, and root CA certificate onto your device. You
can use the AWS IoT MQTT client to better understand the MQTT messages
sent by a device. Devices publish MQTT messages on topics. You can use the
AWS IoT MQTT client to subscribe to these topics to see these messages.
To view MQTT messages:
1. In the AWS IoT console, in the left navigation pane, choose Test.
Figure 9: MQTT Messages
2. Subscribe to the topic on which your thing publishes. In the case of the

SCHOOL OF COMPUTING Page 44
AWS IoT button, you can subscribe to iotbutton/+ (note that + is the
wildcard character). In Subscribe to a topic, in the Subscription topic
field, type iotbutton/+, and then choose Subscribe to topic. Choosing
Subscribe to topic above, results in the topic iotbutton/+ appearing in
theSubscriptions column.
3. Press your AWS IoT button, and then view the resulting message in the
AWS IoT MQTT client. If you do not have a button, you will simulate a
button press in the next step.
4. To use the AWS IoT console to publish a message:
On the MQTT client page, in the Publish section, in the Specify a topic
and a message to publish… field, type iotbutton/ABCDEFG12345. In
the message payload section, type the following JSON:
Choose Publish to topic. You should see the message in the AWS IoT
MQTT client (choose iotbutton/+ in the Subscription column to see the
message).
Configure and Test Rules
The AWS IoT rules engine listens for incoming MQTT messages that
match a rule. When a matching message is received, the rule takes some action
with the data in the MQTT message (for example, writing data to an Amazon S3
"serialNumber":
"ABCDEFG12345",
"clickType": "SINGLE",
"batteryVoltage": "2000 mV"

SCHOOL OF COMPUTING Page 45
bucket, invoking a Lambda function, or sending a message to an Amazon SNS
topic). In this step, you will create and configure a rule to send the data received
from a device to an Amazon SNS topic. Specifically, you will:
Create an Amazon SNS topic.
Subscribe to the Amazon SNS topic using a cell phone number.
Create a rule that will send a message to the Amazon SNS topic when a
message is received from your device.
Test the rule using your AWS IoT button or an MQTT client.
6. Microsoft Azure
Millions of developers know how to create applications using the
Windows Server programming model. Yet applications written for Windows
Azure, don’t exactly use this familiar model. While most of a Windows
developer’s skills still apply, Windows Azure provides its own programming
model. Many vendors’ cloud platforms do just this, providing virtual
machines (VMs) that act like on-premises VMs. This approach, commonly
called Infrastructure as a Service (IaaS), certainly has value, and it’s the
right choice for some applications.
Instead of IaaS, Windows Azure offers a higher-level abstraction that’s
typically categorized as Platform as a Service (PaaS). While it’s similar in
many ways to the on- premises Windows world, this abstraction has its own
programming model meant to help developers build better applications.
Applications built using the Windows Azure programming model can be
easier to administer, more available, and more scalable (up or

SCHOOL OF COMPUTING Page 46
down) than those built on traditional Windows servers.
Figure 10: Microsoft Azure Architecture
Administration
In PaaS, the platform itself handles most of the administrative tasks. With
Windows Azure, this means that the platform automatically takes care of
things such as applying Windows patches and installing new versions of
system software. The goal is to reduce the effort and the cost of administering
the application environment.
Availability
Whether planned or not, today’s applications usually have down time for
patches, application upgrades, hardware failures, and other reasons. With
cloud platforms there is no need for any downtime. The Windows Azure
programming model is designed to let applications be continuously available,

SCHOOL OF COMPUTING Page 47
even in the face of software upgrades and hardware failures.
Scalability
The kinds of applications that people want to host in the cloud are often
meant to handle lots of users. Yet the traditional Windows Server
programming model wasn’t explicitly designed to support Internet-scale
applications. The Windows Azure programming model, however, was
intended from the start to do this. Created for the cloud era, it’s designed to let
developers build the scalable applications that massive cloud data centres can
support. Just as important, it also allows applications to scale down when
necessary, letting them use just the resources they need and pay for only the
computing resources used.
Windows Azure has three core components: Compute, Storage and Fabric. As
the names suggest, Compute provides a computation environment with Web
Role and Worker Role while Storage focuses on providing scalable storage
(Blobs, Tables, Queue and Drives) for large-scale needs.
Fabric Controller
Windows Azure is designed to run in data centres containing lots of
computers. Accordingly, every Windows Azure application runs on multiple
machines simultaneously. All the computers in a particular Windows Azure
data centre are managed by an application called the fabric controller. The
fabric controller is itself a distributed application that runs across multiple
computers. When a developer gives Windows Azure an application to run, he
provides the code for the application’s roles together with the service
definition and service configuration files for this application. Among other
things, this information tells the fabric controller how many instances of each

SCHOOL OF COMPUTING Page 48
role it should create. The fabric controller chooses a physical machine for each
instance, then creates a VM on that machine and starts the instance running.
The role instances for a single application are spread across different
machines within this data centre. Once it’s created these instances, the fabric
controller continues to monitor them. If an instance fails for any reason—
hardware or software—the fabric controller will start a new instance for that
role. While failures might cause an application’s instance count to temporarily
drop below what the developer requested, the fabric controller will always
start new instances as needed to maintain the target number for each of the
application’s roles.
Windows Azure programming model:
A Windows Azure application is built from one or more roles.
A Windows Azure application runs multiple instances of each role.
A Windows Azure application behaves correctly when any role instance fails.
Azure storage
Windows Azure offers blobs, tables, queues etc., as data storage options.
They are a new type of data storage, they are fast and they are non-relational.
Storage must be external to role instances. This is to ensure if a role
instance fails, any data it contains is not lost. So Windows Azure stores data
persistently outside role instances. This way another role instance can now
access data that otherwise would have been lost if that data

SCHOOL OF COMPUTING Page 49
had been stored locally on a failed instance. Storage is replicated. Just as a
Windows Azure application runs multiple role instances to allow for failures,
Windows Azure storage provides multiple copies of data. Without this, a
single failure would make data unavailable, something that’s not acceptable
for highly available applications.
Storage must be able to handle very large amounts of data. Traditional
relational systems aren’t necessarily the best choice for very large data sets.
Since Windows Azure is designed in part for massively scalable applications,
it must provide storage mechanisms for handling data at this scale. We can
use blobs for storing binary data and tables for storing large structured data
sets.
Windows Azure Application Deployment
When we deploy the application, you can select the subregion (which at
the moment determines the data centre) where you want to host the
application. You can also define affinity groups that you can use to group
inter-dependent Azure applications and storage accounts together in order to
improve performance and reduce costs. Performance improves because
Windows Azure co-locates members of the affinity group in the same data
centre. This reduces costs because data transfers within the same data centre
do not incur bandwidth charges. Affinity groups offer a small advantage
over simply selecting the same subregion for your hosted services,
because Windows Azure makes a ―best effort‖ to optimise the location of
those services.

SCHOOL OF COMPUTING Page 50
Identity Management
All applications and services must manage user identity. This is
particularly important in cloud-based scenarios that can potentially serve a
very large number of customers and each of these customers may have their
own identity framework. The ideal solution is a solution that takes advantage
of the customers existing on-premises or federated directory service to enable
single sign on (SSO) across their local and all external hosted services. This
reduces the development effort of building individual and separate identity
management systems. SSO allows users to access the application or service
using their existing credentials.
Windows Azure - One or more instances of web roles and worker roles: Every
Windows Azure application consists of one or more roles. When it executes,
an application that conforms to the Windows Azure programming model must
run at least two copies—two distinct instances—of each role it contains. Each
instance runs as its own VM. Every instance of a particular role runs the exact
same code. In fact, with most Windows Azure applications, each instance is
just like all of the other instances of that role—they’re interchangeable. For
example, Windows Azure automatically load balances HTTP requests

SCHOOL OF COMPUTING Page 51
across an application’s Web role instances.
This load balancing doesn’t support sticky sessions, so there’s no way to
direct all of a client’s requests to the same Web role instance. Storing client-
specific state, such as a shopping cart, in a particular Web role instance won’t
work, because Windows Azure provides no way to guarantee that all of a
client’s requests will be handled by that instance. Instead, this kind of state
must be stored externally, for example in SQL Azure. An application that
follows the Windows Azure programming model must be built using roles,
and it must run two or more instances of each of those roles. A Windows
Azure application behaves correctly when any role instance fails. If all
instances of a particular role fail, an application will stop behaving as it
should—this can’t be helped. The requirement to work correctly during partial
failures is fundamental to the Win
1
SCHOOL OF COMPUTING
DEPARTMENT OF COMPUTER SCIENCE AND ENGINEERING
UNIT – II – Internet of Things – SCSA5301 UNIT – IV – Internet of Things – SIT1619

SCHOOL OF COMPUTING Page 2
UNIT IV
DATA ANALYTICS AND IOT PLATFORM
Big Data Analytics – Data Exploration, Data Visualization, Visualization tools for IoT
1. Big Data Analytics
2. Architecture
3. Big Data Analytical Tools Classification
4. Data Exploration
5. Data Visualization and Visualization tools for IoT
1. Big Data Analytics
Big Data Analytics is “the process of examining large data sets containing a variety
of data types – i.e., Big Data – to uncover hidden patterns, unknown correlations, market
trends, customer preferences, and other useful information.” Companies and enterprises
that implement Big Data Analytics often reap several business benefits, including more
effective marketing campaigns, the discovery of new revenue opportunities, improved
customer service delivery, more efficient operations, and competitive advantages.
Companies implement Big Data Analytics because they want to make more informed
business decisions. Big Data Analytics gives analytics professionals, such as data scientists
and predictive modelers, the ability to analyze Big Data from multiple and varied sources,
including transactional data
Characteristics

SCHOOL OF COMPUTING Page 3
Big Data is often defined in terms of "3V's" i.e.
Volume - the amount of data generated, stored and analysed. The amount of data stored
determines the level of insight that can be obtained from that data;
Variety - type and nature of data. Historically data was structured and from a single source
- in which case it would fit readily into 'columns' and 'rows'. Increasingly data is sourced
from a variety of sources with many different formats;
Velocity - the speed at which data is generated and processed. Where historically data
could reasonably be expected to be uploaded via a daily 'batch' process now data is
measured in thousands or even millions of transactions per minute.
In addition, other "V's" may be added including:
Variability - Variations in the data sets. For example is a temperature measured in degrees
Celsius, Fahrenheit or Kelvin;
Veracity - Quality of the captured data. Where decisions are being made on data you need
to be sure that the data is correct.
Analytics
Analytics is the scientific process of discovering and communicating the meaningful
patterns which can be found in data.
It is concerned with turning raw data into insight for making better decisions. Analytics
relies on the application of statistics, computer programming, and operations research in
order to quantify and gain insight to the meanings of data. It is especially useful in areas
which record a lot of data or information.
Types
"Descriptive: A set of techniques for reviewing and examining the data set(s) to

SCHOOL OF COMPUTING Page 4
understand the data and analyze business performance.
Diagnostic: A set of techniques for determine what has happened and why
Predictive: A set of techniques that analyze current and historical data to determine what is
most likely to (not) happen
Prescriptive: A set of techniques for computationally developing and analyzing
alternatives that can become courses of action – either tactical or strategic – that may
discover the unexpected
Decisive: A set of techniques for visualizing information and recommending courses of
action to facilitate human decision-making when presented with a set of alternatives
Challenges for IoT Big Data
Some of the key challenges for IoT Big Data, which have a bearing on the design of
architectures suitable for service delivery include
1. The number of IoT devices: With forecasted growth in the number of connected
"things" expected into the billions world-wide there will be masses of devices which may
be a data source, and which may be subject to third party control;
2. The variety of IoT devices: There will be enormous variety in the devices which
may provide data, even in the case of similar devices e.g. an electronic thermostat. Data
from any individual device manufacturer or model may be quite dissimilar from that of
nominally identical devices in such areas as field names, units, and data structures;
3. Intelligence of IoT devices: IoT devices have more and more compute resources and
integrate several technologies like Graphics Processing Unit (GPU) and Solid State Drive
(SSD) storage. Simple sensors are evolving to autonomous systems which will be able to

SCHOOL OF COMPUTING Page 5
manage their own analytics and be part of large analytics networks;
4. Risk of IoT device malfunction: With a great number of IoT devices and
manufacturers it is reasonable to assume there will be many occasions where IoT devices
malfunction in various ways. In the most drastic situations devices will fail completely but
it should be expected that more subtle malfunctions will occur which might result in
aberrations of data coming from those devices, or a failure of the device to perform a
required control function;
5. Update frequency: Though some devices (e.g. remote sensors) will produce data
reports at a low frequency there may be substantial quantities of data streaming from more
sophisticated Internet connected things such as cars;
6. Historical data: It is expected that many Big Data insights will derive from historical
data recorded from IoT devices. This may be processed alone to derive analytics/
intelligence or considered alongside current data particularly to enable smart monitoring
and control;
7. Context data: Much IoT data will make more sense when put in context with other
data. Context data might be generally "static" (or at least with a slow update period) such
as geographical data, or could be more dynamic e.g. weather forecast data. Another
important source of context data can be information gathered from the mobile networks
themselves e.g. mobile user location or usage dynamics;
8. Privacy issues: With so many expected IoT devices acquiring data there could be a
substantial risk relating to the disclosure of data which is considered personal to end users.
When IoT data is stored in a Big Data system and made available to third parties there is a
need to implement strong safeguards to ensure end users remain in control of their
personal information. Mobile Network Operators (MNOs) are in a strong position to help
users remain in control of their data and to make data available in the best way via consent,

SCHOOL OF COMPUTING Page 6
aggregation or anonymisation.
General Architecture for IoT Big Data
Context Data Layer
This functional unit is concerned with obtaining external non IoT data ("Context
data") which is either available to the third party application or used during the processing
of IoT data e.g. "mashing up" IoT data with context data. The Context Data Layer is also
able to communicate with the external data sources, e.g. to start and stop data feeds.
Examples of context data might include geographic/ mapping information, weather
forecasts, schedules
e.g. for transportation, or information generated from mobile networks/ users. This allows
IoT data to be associated with further context data e.g. a moisture sensor reports the
current moisture level whilst a weather forecast for the same geographical area identifies
whether rain is predicted - allowing a decision to be made as to whether to water a crop.
Context data might be received in different ways e.g. via Hypertext Transfer Protocol
(HTTP) based APIs which request data from external servers, information received within
an email, via batch file by making an outgoing File Transfer Protocol (FTP) request or by
a batch file being deposited via FTP, or data received using removable media. This unit is
principally concerned with implementing the relevant adapters in order to receive the
various types of context data.

SCHOOL OF COMPUTING Page 7
The diagram below shows the general architecture for delivery of IoT Big Data
services. This is explained in the following narrative.
Figure 1: General Architecture for IoT Big
Data

SCHOOL OF COMPUTING Page 8
IoT Service Layer
The IoT service layer is concerned with handling the device specific interactions
required for obtaining data from IoT devices and sending control commands (where
relevant) to those IoT devices. Therefore this layer is required to handle bi-directional
communications both to IoT devices and to the upper layers of the architecture.
The IoT Service Layer is expected to handle the lower level interactions with IoT
devices. Those devices might be connected using a variety of protocols and low level
communication technologies including (but not limited to) oneM2M [3], Hypercat [4],
Constrained Application Protocol (CoAP), MQ Telemetry Transport (MQTT), Real Time
Streaming Protocol (RTSP), or device specific interfaces such as JavaScript Object
Notation (JSON)/Extensible Markup Language (XML) over HTTP.
The IoT Service Layer is expected to handle authentication and security aspects regarding
the interfacing with IoT devices.
Data and Protocol Mediator
The Data and Protocol Mediator is responsible for ingesting information from IoT
devices as well as other external sources ("context data"). It ensures that data is
transformed to the Harmonised Entity Definition before being stored and published by the
Data & Control Broker. The harmonisation process itself may be partially implemented in
the 'Context Data Layer' function or the 'IoT Service Layer' function but the Data &
Protocol Mediator will ensure that harmonisation is complete before data is exposed to the
higher level parts of the architecture.
The harmonisation process includes:
Conversion of payload encoding e.g. converting between an XML format payload
of the IoT or context data and the JSON based structures defined in the Harmonised
SCHOOL OF COMPUTING Page 9
Entity Definitions;
Mapping of the data structures and data fields between the lower level IoT device
structures and fields and the Harmonised Entity Definitions e.g. the IoT device might
store a temperature value in a field named 'temp' whereas the Harmonised Entity
Definition in a field named 'currentTemperature';
Unit conversion from the values and ranges of the lower level IoT
devices to the Harmonised Entity Definition e.g.
o The Harmonised Entity Definition might represent a switch as the Boolean true or
false value whereas the IoT device could represent as the integer 1 or 0 respectively;
o The Harmonised Entity Definition might represent a temperature in degrees
Centigrade as a double precision float whereas the IoT device might record in degrees
Fahrenheit.
Data quality verification e.g. identifying a situation where an IoT sensor is
apparently faulty such as delivering a sensor reading which is outside of the expected
range. For example an outdoor temperature sensor transmitting a value which is
significantly outside of the normal weather temperature range;
Combining ("mash up") or linking relevant context data with IoT data e.g.
associating a specific IoT sensor with its geographic location or weather forecast data
to form a richer entity definition;
Cross referencing related entity data e.g. different sensors with say the car to which
they belong.
The Data & Protocol Mediator will also enable control requests to be processed -
performing broadly a 'reverse' process compared with data harmonisation:
Verifying the control request to make sure that the request is valid e.g.

SCHOOL OF COMPUTING Page 10
Refers to a valid IoT device;
o The control action is relevant to that IoT device e.g. a fixed position sensor
cannot be asked to move to a different position;
o The control action is valid according to the current state of the device/ system
(which should be maintained by the control broker);
o The parameter values supplied in the request are valid both in terms of individual
parameter range and in combination.
Transforming the high level control request into the equivalent device specific
request payload
e.g. generating an XML format payload if that is required by the IoT device;
Mapping of the data structures and data fields in the control request between the
high level structures and fields of the Harmonised Entity Definitions and the lower
level IoT device structures and fields;
Data & Control Broker
The Data & Control Broker is responsible for enabling third party application access
to harmonised data entities through a query and subscribe API, allowing applications to
gain access to such data in a standard way. The broker may store data in the short to
medium term, coming from multiple devices and data sources via the Data and Protocol
Mediator. This function also transforms control requests coming from the application layer
to be passed onwards to the Data & Protocol Mediator.
The control process itself may be partially implemented in the 'IoT Service Layer'
function but the Data & Control Broker in collaboration with the Data & Protocol Mediator

SCHOOL OF COMPUTING Page 11
will ensure responsibility for providing third party application access to control services in
a consistent (harmonised) and controlled way. Control brokering will perform broadly a
'reverse' process compared with data harmonisation, receiving high level control requests
from the third party application - normally formatted as a JSON based request
communicated over HTTPS, and adapting this through the Data & Protocol Mediator and
IoT Service Layer.
The Data & Control Broker is expected to have access to a data store which may act as a
short to medium term buffer space for control actions or a short to medium term store for
harmonised data entities. The expected use of this is:
Retention of current instances of harmonised data entities processed from IoT
devices and external sources (context data);
Storage of control requests and any status information relevant to the request;
Storage of a window of historical harmonised data entities that may be queried directly
via the third party application. Note that it is expected that such a data store would be
for short to medium term harmonised data entities, whereas longer term storage of
harmonised data entities would be provided in the "IoT Big Data Store”;
Storage of any results of Analytics and Intelligence results which become additional
context data that can be queried or mashed up with other IoT data or external data
sources.
It should be noted that the Data & Control Broker has the option of using its own internal
database for data storage or the defined IoT Big Data Store function defined in this
architecture i.e. some of the logically separate elements of the defined architecture may be
physically implemented together.

SCHOOL OF COMPUTING Page 12
Peer API Access Management
The Peer API Access Management function is responsible for interfacing with its
peers in other organisations to receive and publish additional relevant harmonised IoT and
context data. The policies applied to these trusted interfaces may be different to those
applied to the main developer interface provided by the Developer API Access
Management function. For example, organisations may be willing to share certain
sensitive data with each other but require this sensitive data to be anonymised before
being offered to third party developers. See sections 4.2.6 and 4.2.7 on I6 and I7 interfaces
for more details.
Developer API Access Management
The Developer API Access Management function controls access to harmonised
data entities, covering both IoT and context data, as well as control services to third party
applications. It implements authentication, authorisation and access control using industry
standards to ensure privacy and security around the harmonised data. This function is
mainly concerned with managing the privacy and security aspects of the data access by
external parties. It is expected that this layer does not perform any actual IoT and context
data processing or storage but is ensuring that data and control services from lower layers
of the architecture are delivered in a properly managed way. It is assumed that any data
processing/ complex queries/ analytics/ intelligence is the responsibility of the third party
application.
The Developer API Access Management function access control for the harmonised data,
it is expected to perform the following:
Be responsible for presenting data & control services to third party applications

SCHOOL OF COMPUTING Page 13
via a RESTful based API over http3. This interface shall use JSON based encoding of
data using the Harmonised Entity Definitions for both data and control and use the
NGSIv2 interface to support entity retrieval/ simple queries;
Implement API access control (i.e. application level security) to ensure only
known/ approved applications have access to IoT and context data and control
services. Access control should be provided on a per application basis allowing
granularity over which application should be able to access what IoT and context data
and control functions;
Implement any usage policies against applications accessing the APIs e.g.
applying IP address based access rules or throttling rules to ensure there is relevant fair
usage of the platform;
Provide access to a publish/ subscribe service so that IoT and context data can be
pushed to the third party application server as new data is received;
Log API usage information e.g. number of API calls made by an application,
number and type of entity data retrieved, number and type of control requests received.
IoT Big Data Store
The provision of Big Data Analytics and Intelligence is dependent on having access
to the relevant mass of data from which the various insights can be obtained. This function
provides data storage for this massive data and it may also provide short to medium term
storage capabilities for use by the Data & Control Broker, depending on the specific
implementation.
For IoT Big Data usage it is considered that the Data Store must be able to handle a
data set greater than 50TB in size. For small scale deployments/ prototypes a Relational
Database such as MySQL may support IoT data storage. However realistically a NoSQL or

SCHOOL OF COMPUTING Page 14
'graph' database is considered more suitable for commercial 'Big Data' deployment
particularly because the graph data model is richer and more versatile.
"Big Data" databases address needs such as:
The need to store vast amounts of data (orders of magnitude higher than
Relational Databases reasonably work to);
Insights are obtained when exploring ad-hoc relationships between data;
Data is arriving at such a rate that it is impossible to maintain an indexing process;
Data are not tightly constrained into fixed table/ column formats.
The "Big Data" database is expected to be used to store the harmonised data entities
received from the IoT devices and/or the external data sources. As it is expected there
could be many millions of IoT devices generating data frequently, the required storage
space may be vast (i.e. of the order of many terabytes to many petabytes of data). It is
expected the "Big Data" database could be implemented using products such as Apache
Cassandra, Apache Hadoop, MongoDB, Neo4j, Titan or DynamoDB. To achieve high
performance the database component may employ substantial quantities of memory to
hold copies of data that is persistently stored on "hard disk".4
IoT Big Data Processing
The processing of stored IoT data to perform analytics and intelligence is identified
as the responsibility of the IoT Big Data Processing function. The IoT Big Data Processing
function also provides related Developer API Access Management to control access to the
intelligence and analytics by implementing authentication, authorisation and access control
to ensure privacy and security. A broad division is made between analytics and

SCHOOL OF COMPUTING Page 15
intelligence. In practice both analytics and intelligence will be processing subsets of the
mass of IoT data retained in the IoT Big Data Store. The main difference is
Analytics - principally involves relatively conventional methods (by human analysts
and normal programming techniques) of exploring links and statistical relationships
between data and then the analytics engine will produce its output based on the execution
of a defined process;
Intelligence - encompassing machine learning / artificial intelligence, it would be
expected that algorithms 'adapt' to the observed data and the match between predicted and
desired outcomes.
The outputs from Analytics and Intelligence are expected to be in a wide range of different
formats, many of which will not conform to a uniform 'API' based approach e.g. the
generation of a PDF report or the generation of a data set to be FTP'd to the third party
developer's platform.
Relevant products for Analytics & Intelligence provision include:
Apache Spark
Apache Spark15 is a powerful data processing system based upon Cassandra or Hadoop16
for the data storage component and provides several powerful tools for building
applications around it such as an SQL interface, graph data library and a job server.
Spark is not a complete solution out of the box, but does provide a powerful big data
platform with great performance. Spark is considered the leading solution for high
performance Big Data analytics.
A Spark solution could be delivered over a RESTful interface or a websockets connection

SCHOOL OF COMPUTING Page 16
(for better notification and real time services). More usually however developers would
use the standard programming interfaces available to Java, Python, Scala and R
programming languages.
Apache TinkerPop3 + Titan + Elastic Search + Gremlin
Titan provides Casandra backends, integration with Elastic search17, Apache Lucene18 /
Solr19, Spark and others which allows it to support Geo searches, full text searches, graph
traversals and regular 'SQLesque' queries making it ideal for the IoT Big Data project.
Apache TinkerPop320 is a graph computing framework which is seeing a rapid adoption in
data driven applications. Many projects are seeking to incorporate the TinkerPop
specification into their interfaces for interoperability in graph databases and servers. There
are several implementations of graph databases which expose a Gremlin21 querying
interface which makes it easier to query the graph database. Two such databases are Titan
and Google Cayley.
Apache Mahout
Mahout22 is designed for the development of high performance and scalable machine
learning applications. It builds for example on top of Apache Spark / Hadoop and supports
a range of machine learning algorithms. Uses include
Collaborative filtering – mines user behaviour and makes product recommendations (e.g.
Amazon recommendations);
Clustering – takes items in a particular class (such as web pages or newspaper articles)
and organizes them into naturally occurring groups, such that items belonging to the same

SCHOOL OF COMPUTING Page 17
group are similar to each other;
Classification – learns from existing categorizations and then assigns unclassified items to
the best category;
Frequent itemset mining – analyses items in a group (e.g. items in a shopping cart or terms
in a query session) and then identifies which items typically appear together.
Tensorflow
Another open source set of tools for machine learning - developed originally by the
Google Brain Team to support advances in search ranking algorithms as well as other
Google research activities.
Tensorflow23 could be used for example in IoT applications such as developing high
accuracy automated number plate recognition algorithms based on images captured from
CCTV cameras. This can then be applied in the IoT Big Data system to applications such
as security, congestion or traffic planning.
Tensorflow can also be coupled with Apache Spark which is used to obtain the select the
data from the IoT Big Data store to use with the tensorflow algorithms.
Big Data Analytical Tools Classification
Data Storage and Management
Data Cleaning
Data Mining
Data Analysis

SCHOOL OF COMPUTING Page 18
Data Storage and Management
Hadoop
Apache Hadoop6 is a highly scalable storage platform designed to process very large data
sets across hundreds to thousands of computing nodes that operate in parallel. It provides a
very cost effective storage solution for large data volumes with no particular format
requirements. MapReduce [6] is the programming paradigm that allows for this massive
scalability, is at the heart of Hadoop. The term MapReduce refers to two separate and
distinct tasks that Hadoop programs perform. Hadoop has two main components - HDFS
and YARN.
HDFS7 – the Hadoop Distributed File System is a distributed file system designed to run
on commodity hardware. It differs from other distributed file systems in that HDFS is
highly fault- tolerant and is designed to be deployed on low-cost hardware. HDFS
provides high throughput access to application data and is suitable for applications that
have large data sets.
YARN8 - YARN is a large-scale, distributed operating system for big data applications
that runs on top of HDFS. It provides a framework for job scheduling and cluster resource
management.
Cassandra
Cassandra5 is a scalable database for large scale data storage from the Apache foundation
and is used by many of the world‟s leading tech companies including github, Netflix,
Apple and Instagram. The largest known deployment of Cassandra contains 75000 nodes
(cloud servers) and stores over 10PB (Petabytes) of data. Cassandra is a NoSQL data store,
which provides a robust means of storing data which spans many nodes, however it does
not provide a very powerful query interface; it's highly inefficient to query on anything

SCHOOL OF COMPUTING Page 19
other than Cassandra's equivalent of a 'primary key'. Several solutions can be combined
with Cassandra to provide a more powerful query interface. Apache Spark is one of the
most powerful of these.
Cloudera
Cloudera is essentially a brand name for Hadoop with some extra services stuck on. They
can help your business build an enterprise data hub, to allow people in your organization
better access to the data you are storing. While it does have an open source element,
Cloudera is mostly and enterprise solution to help businesses manage their Hadoop
ecosystem. Essentially, they do a lot of the hard work of administering Hadoop for you.
They will also deliver a certain amount of data security, which is highly important if
you‟re storing any sensitive or personal data.
MongoDB
MongoDB9 is a hybrid open source and closed source database, where the core of the
database is available freely on an open source license, although some features which may
be required on larger commercial deployments are commercially supported add-ons. This
model has made MongoDB arguably one of the most popular document oriented databases
in use today. A 'document' in MongoDB is a 'binary' representation of a JSON document.
This allows arbitrary JSON encoded data to be stored in the database and then queried
using a rich JSON based querying interface.
2.1.4 Graph Databases
Other databases such as Neo4J10 or Titan11 are a powerful way for structuring data which
allows for easily traversing relationships as well as retrieving attributes about a particular

SCHOOL OF COMPUTING Page 20
node. It is worth clarifying that a Graph Database works efficiently where there are ad-hoc
relationships between data whereas a Relational Database is efficient for more structured
relationships between data. The key strength of these systems is that they're very well
adapted for traversing different data types to perform ad-hoc mash-ups.
Data Cleaning Tool
OpenRefine
OpenRefine (formerly GoogleRefine) is an open source tool that is dedicated to cleaning
messy data. You can explore huge data sets easily and quickly even if the data is a little
unstructured. As far as data softwares go, OpenRefine is pretty user-friendly. Though, a
good knowledge of data cleaning principles certainly helps. The nice thing about
OpenRefine is that it has a huge community with lots of contributors meaning that the
software is constantly getting better and better.
Data Cleaner
DataCleaner recognises that data manipulation is a long and drawn out task. Data
visualization tools can only read nicely structured, “clean” data sets. DataCleaner does the
hard work for you and transforms messy semi-structured data sets into clean readable data
sets that all of the visualization companies can read. DataCleaner also offers data
warehousing and data management services. The company offers a 30- day free trial and
then after that a monthly subscription fee.

SCHOOL OF COMPUTING Page 21
Data Mining Tool
IBM SPSS Modeler
The IBM SPSS Modeler offers a whole suite of solutions dedicated to data mining. This
includes text analysis, entity analytics, decision management and optimization. Their five
products provide a range of advanced algorithms and techniques that include text
analytics, entity analytics, decision management and optimization. SPSS Modeler is a
heavy-duty solution that is well suited for the needs of big companies. It can run on
virtually any type of database and you can integrate it with other IBM SPSS products such
as SPSS collaboration and deployment services and the SPSS Analytic server.
Oracle data mining
Another big hitter in the data mining sphere is Oracle. As part of their Advanced Analytics
Database option, Oracle data mining allows its users to discover insights, make predictions
and leverage their Oracle data. You can build models to discover customer behavior, target
best customers and develop profiles. The Oracle Data Miner GUI enables data analysts,
business analysts and data scientists to work with data inside a database using a rather
elegant drag and drop solution. It can also create SQL and PL/SQL scripts for automation,
scheduling and deployment throughout the enterprise.
FramedData
If you‟re after a specific type of data mining there are a bunch of startups which specialize
in helping businesses answer tough questions with data. If you‟re worried about

SCHOOL OF COMPUTING Page 22
user churn, we recommend FramedData, a startup which analyzes your analytics and
tell you which customers are about to abandon your product.
Data Analysis Tool
Qubole
Qubole simplifies, speeds and scales big data analytics workloads against data stored on
AWS, Google, or Azure clouds. They take the hassle out of infrastructure wrangling. Once
the IT policies are in place, any number of data analysts can be set free to collaboratively
“click to query” with the power of Hive, Spark, Presto and many others in a growing list
of data processing engines. Qubole is an enterprise level solution. They offer a free trial
that you can sign up to at this page.The flexibility of the program really does set it apart
from the rest as well as being the most accessible of the platforms.
BigML
BigML is attempting to simplify machine learning. They offer a powerful Machine
Learning service with an easy-to-use interface for you to import your data and get
predictions out of it. You can even use their models for predictive analytics. A good
understanding of modeling is certainly helpful, but not essential, if you want to get the
most from BigML. They have a free version of the tool that allows you to create tasks that
are under 16mb as well as having a pay as you go plan and a virtual private cloud that
meet enterprise-grade requirements.
Statwing
Statwing takes data analysis to a new level providing everything from beautiful visuals to

SCHOOL OF COMPUTING Page 23
complex analysis. They have a particularly cool blog post on NFL data! It‟s so simple to
use that you can actually get started with Statwing in under 5 minutes. This allows you to
use unlimited datasets of up to 50mb in size each. There are other enterprise plans that
give you the ability to upload bigger datasets.
3 Data Exploration
Data exploration is an informative search used by data consumers to form true analysis
from the information gathered. Often, data is gathered in a non-rigid or controlled manner
in large bulks. For true analysis, this unorganized bulk of data needs to be narrowed down.
This is where data exploration is used to analyze the data and information from the data to
form further analysis.
Data often converges in a central warehouse called a data warehouse. This data can come
from various sources using various formats. Relevant data is needed for tasks such as
statistical reporting, trend spotting and pattern spotting. Data exploration is the process of
gathering such relevant data.
Below are the steps involved to understand, clean and prepare your data for building your
predictive model:
1. Variable Identification
2. Univariate Analysis
3. Bi-variate Analysis
4. Missing values treatment
5. Outlier treatment
6. Variable transformation
7. Variable creation

SCHOOL OF COMPUTING Page 24
Variable Identification
First, identify Predictor (Input) and Target (output) variables. Next, identify the data type
and category of the variables. Let‟s understand this step more clearly by taking an
example.
Example:- Suppose, we want to predict, whether the students will play cricket or not (refer
below data set). Here you need to identify predictor variables, target variable, data type of
variables and category of variables.
Below, the variables have been defined in different category:
Figure 2: Variable Identification

SCHOOL OF COMPUTING Page 25
Univariate Analysis
At this stage, we explore variables one by one. Method to perform uni-variate analysis will
depend on whether the variable type is categorical or continuous. Let‟s look at these
methods and statistical measures for categorical and continuous variables individually:
Continuous Variables:- A continuous variable is a variable that has an infinite number
of possible values. In other words, any value is possible for the variable.
Categorical Variables:- A categorical variable (sometimes called a nominal variable) is
one that has two or more categories, but there is no intrinsic ordering to the categories. For
example, gender is a categorical variable having two categories (male and female) and
there is no intrinsic ordering to the categories. Hair color is also a categorical variable
having a number of categories (blonde, brown, brunette, red, etc.) and again, there is no
agreed way to order these from highest to lowest.
Bi-variate Analysis
Bi-variate Analysis finds out the relationship between two variables. Here, we look for
association and disassociation between variables at a pre-defined significance level. We
can perform bi-variate analysis for any combination of categorical and continuous
variables. The combination can be: Categorical & Categorical, Categorical & Continuous
and Continuous & Continuous. Different methods are used to tackle these combinations
during analysis process.
Continuous & Continuous: While doing bi-variate analysis between two continuous
variables, we should look at scatter plot. It is a nifty way to find out the relationship
between two variables. The pattern of scatter plot indicates the relationship between

SCHOOL OF COMPUTING Page 26
variables. The relationship can be linear or non-linear.
Figure 3: Scatter plot indicates Relationship
Scatter plot shows the relationship between two variable but does not indicates the strength
of relationship amongst them. To find the strength of the relationship, we use Correlation.
Correlation varies between -1 and +1.
-1: perfect negative linear correlation
+1:perfect positive linear correlation and
0: No correlation
Correlation can be derived using following formula:
Correlation = Covariance(X,Y) / SQRT( Var(X)* Var(Y))
Various tools have function or functionality to identify correlation between variables. In
Excel, function CORREL() is used to return the correlation between two variables and
SAS uses procedure PROC CORR to identify the correlation.

SCHOOL OF COMPUTING Page 27
These function returns Pearson Correlation value to identify the relationship between two
variables:
Figure 4: Correlation
Categorical & Categorical: To find the relationship between two categorical variables, we
can use following methods:
Two-way table: We can start analyzing the relationship by creating a two-way table
of count and count%. The rows represents the category of one variable and the columns
represent the categories of the other variable. We show count or count% of observations
available in each combination of row and column categories.
Stacked Column Chart: This method is more of a visual form of Two-way table.
Figure 5: Two-way table and Stacked
Column Chart

SCHOOL OF COMPUTING Page 28
Chi-Square Test: This test is used to derive the statistical significance of
relationship between the variables. Also, it tests whether the evidence in the sample is
strong enough to generalize that the relationship for a larger population as well. Chi-
square is based on the difference between the expected and observed frequencies in one
or more categories in the two-way table. It returns probability for the computed chi-square
distribution with the degree of freedom.
Categorical & Continuous: While exploring relation between categorical and continuous
variables, we can draw box plots for each level of categorical variables. If levels are small
in number, it will not show the statistical significance. To look at the statistical
significance we can perform Z-test, T-test or ANOVA.
Z-Test/ T-Test:- Either test assess whether mean of two groups are statistically
different from each other or not.
Example: Suppose, we want to test the effect of five different exercises. For this, we
recruit 20 men and assign one type of exercise to 4 men (5 groups). Their weights are
recorded after a few weeks. We need to find out whether the effect of these exercises on
them is significantly different or not. This can be done by comparing the weights of the 5
groups of 4 men each. Till here, we have understood the first three stages of Data
Exploration, Variable Identification, Uni-Variate and Bi-Variate analysis. We also looked
at various statistical and visual methods to identify the relationship between variables.
Now, we will look at the methods of Missing values Treatment. More importantly, we will
also look at why missing values occur in our data and why treating them is necessary.

SCHOOL OF COMPUTING Page 29
Missing Value Treatment
Missing data in the training data set can reduce the power / fit of a model or can lead
to a biased model because we have not analysed the behavior and relationship with other
variables correctly. It can lead to wrong prediction or classification.
Figure 6: Missing Value Treatment
Notice the missing values in the image shown above: In the left scenario, we have not
treated missing values. The inference from this data set is that the chances of playing
cricket by males is higher than females. On the other hand, if you look at the second table,
which shows data after treatment of missing values (based on gender), we can see that
females have higher chances of playing cricket compared to males. Now, let‟s identify the
reasons for occurrence of these missing values. They may occur at two stages:
1. Data Extraction: It is possible that there are problems with extraction process. In
such cases, we should double-check for correct data with data guardians. Some hashing
procedures can also be used to make sure data extraction is correct. Errors at data
SCHOOL OF COMPUTING Page 30
extraction stage are typically easy to find and can be corrected easily as well.
2. Data collection: These errors occur at time of data collection and are harder to
correct. They can be categorized in four types:
o Missing completely at random: This is a case when the probability of missing
variable is same for all observations. For example: respondents of data collection process
decide that they will declare their earning after tossing a fair coin. If an head occurs,
respondent declares his / her earnings & vice versa. Here each observation has equal
chance of missing value.
o Missing at random: This is a case when variable is missing at random and missing
ratio varies for different values / level of other input variables. For example: We are
collecting data for age and female has higher missing value compare to male.
o Missing that depends on unobserved predictors: This is a case when the missing
values are not random and are related to the unobserved input variable. For example: In a
medical study, if a particular diagnostic causes discomfort, then there is higher chance of
drop out from the study. This missing value is not at random unless we have included
“discomfort” as an input variable for all patients.
o Missing that depends on the missing value itself: This is a case when the
probability of missing value is directly correlated with missing value itself. For example:
People with higher or lower income are likely to provide non-response to their earning.
Methods to treat missing values
1. Deletion: It is of two types: List Wise Deletion and Pair Wise Deletion.
o In list wise deletion, we delete observations where any of the variable is missing.
Simplicity is one of the major advantage of this method, but this method reduces the power
of model because it reduces the sample size.

SCHOOL OF COMPUTING Page 31
o In pair wise deletion, we perform analysis with all cases in which the variables of
interest are present. Advantage of this method is, it keeps as many cases available for
analysis. One of the disadvantage of this method, it uses different sample size for different
variable
Figure 7: List Wise Deletion and Pair Wise
Deletion
o Deletion methods are used when the nature of missing data is “Missing completely at
random” else non random missing values can bias the model output.
2. Mean/ Mode/ Median Imputation: Imputation is a method to fill in the missing
values with estimated ones. The objective is to employ known relationships that can be
identified in the valid values of the data set to assist in estimating the missing values.
Mean / Mode / Median imputation is one of the most frequently used methods. It consists
of replacing the missing data for a given attribute by the mean or median (quantitative
attribute) or mode (qualitative attribute) of all known values of that variable. It can be of

SCHOOL OF COMPUTING Page 32
two types:-
Generalized Imputation: In this case, we calculate the mean or median for all non
missing values of that variable then replace missing value with mean or median. Like in
above table, variable “Manpower” is missing so we take average of all non missing
values of “Manpower” (28.33) and then replace missing value with it.
Similar case Imputation: In this case, we calculate average for gender “Male”
(29.75) and “Female” (25) individually of non missing values then replace the missing
value based on gender. For “Male“, we will replace missing values of manpower with
29.75 and for “Female” with 25.
3. Prediction Model: Prediction model is one of the sophisticated method for
handling missing data. Here, we create a predictive model to estimate values that will
substitute the missing data. In this case, we divide our data set into two sets: One set with
no missing values for the variable and another one with missing values. First data set
become training data set of the model while second data set with missing values is test
data set and variable with missing values is treated as target variable. Next, we create a
model to predict target variable based on other attributes of the training data set and
populate missing values of test data set.We can use regression, ANOVA, Logistic
regression and various modeling technique to perform this. There are 2 drawbacks for this
approach:
1. The model estimated values are usually more well-behaved than the true values
2. If there are no relationships with attributes in the data set and the attribute with
missing values, then the model will not be precise for estimating missing values.

SCHOOL OF COMPUTING Page 33
KNN Imputation: In this method of imputation, the missing values of an attribute
are imputed using the given number of attributes that are most similar to the attribute
whose values are missing. The similarity of two attributes is determined using a distance
function. It is also known to have certain advantage & disadvantages.
Techniques of Outlier Detection and Treatment
Outlier is a commonly used terminology by analysts and data scientists as it needs close
attention else it can result in wildly wrong estimations. Simply speaking, Outlier is an
observation that appears far away and diverges from an overall pattern in a sample.
Let‟s take an example, we do customer profiling and find out that the average annual
income of customers is $0.8 million. But, there are two customers having annual income
of $4 and $4.2 million. These two customers annual income is much higher than rest of the
population. These two observations will be seen as Outliers.
Figure 8: outlier

SCHOOL OF COMPUTING Page 34
Types of Outliers
Outlier can be of two types: Univariate and Multivariate. Above, we have discussed
the example of univariate outlier. These outliers can be found when we look at
distribution of a single variable. Multi-variate outliers are outliers in an n-dimensional
space. In order to find them, you have to look at distributions in multi-dimensions.
Let us understand this with an example. Let us say we are understanding the relationship
between height and weight. Below, we have univariate and bivariate distribution for
Height, Weight. Take a look at the box plot. We do not have any outlier (above and below
1.5*IQR, most common method). Now look at the scatter plot. Here, we have two values
below and one above the average in a specific segment of weight and height.
Figure 9: Types of outliers
Data Entry Errors:- Human errors such as errors caused during data collection,
recording, or entry can cause outliers in data. For example: Annual income of a customer
is $100,000. Accidentally, the data entry operator puts an additional zero in the figure.
Now the income becomes $1,000,000 which is 10 times higher. Evidently, this will be the
outlier value when compared with rest of the population.

SCHOOL OF COMPUTING Page 35
Measurement Error: It is the most common source of outliers. This is caused
when the measurement instrument used turns out to be faulty. For example: There are 10
weighing machines. 9 of them are correct, 1 is faulty. Weight measured by people on the
faulty machine will be higher / lower than the rest of people in the group. The weights
measured on faulty machine can lead to outliers.
Experimental Error: Another cause of outliers is experimental error. For example:
In a 100m sprint of 7 runners, one runner missed out on concentrating on the „Go‟ call
which caused him to start late. Hence, this caused the runner‟s run time to be more than
other runners. His total run time can be an outlier.
Intentional Outlier: This is commonly found in self-reported measures that
involves sensitive data. For example: Teens would typically under report the amount of
alcohol that they consume. Only a fraction of them would report actual value. Here actual
values might look like outliers because rest of the teens are under reporting the
consumption.
Data Processing Error: Whenever we perform data mining, we extract data from
multiple sources. It is possible that some manipulation or extraction errors may lead to
outliers in the dataset.
Sampling error: For instance, we have to measure the height of athletes. By
mistake, we include a few basketball players in the sample. This inclusion is likely to cause
outliers in the dataset.
Natural Outlier: When an outlier is not artificial (due to error), it is a natural
outlier. For instance: In my last assignment with one of the renowned insurance company,
I noticed that the performance of top 50 financial advisors was far higher than rest of the
population. Surprisingly, it was not due to any error. Hence, whenever we perform any
data mining activity with advisors, we used to treat this segment separately.

SCHOOL OF COMPUTING Page 36
Detect Outliers
Most commonly used method to detect outliers is visualization. We use various
visualization methods, like Box-plot, Histogram, Scatter Plot (above, we have used box
plot and scatter plot for visualization). Some analysts also various thumb rules to detect
outliers. Some of them are:
Any value, which is beyond the range of -1.5 x IQR to 1.5 x IQR
Use capping methods. Any value which out of range of 5th and 95th percentile can be
considered as outlier
Data points, three or more standard deviation away from mean are considered outlier
Outlier detection is merely a special case of the examination of data for influential
data points and it also depends on the business understanding
Remove Outliers
Most of the ways to deal with outliers are similar to the methods of missing values like
deleting observations, transforming them, binning them, treat them as a separate group,
imputing values and other statistical methods. Here, we will discuss the common
techniques used to deal with outliers:
Deleting observations: We delete outlier values if it is due to data entry error, data
processing error or outlier observations are very small in numbers. We can also use
trimming at both ends to remove outliers.
Transforming and binning values: Transforming variables can also eliminate outliers.
Natural log of a value reduces the variation caused by extreme values. Binning is also a

SCHOOL OF COMPUTING Page 37
form of variable transformation. Decision Tree algorithm allows to deal with outliers well
due to binning of variable. We can also use the process of assigning weights to different
observations.
Imputing: Like imputation of missing values, we can also impute outliers. We can use
mean, median, mode imputation methods. Before imputing values, we should analyse if it
is natural outlier or artificial. If it is artificial, we can go with imputing values. We can
also use statistical model to predict values of outlier observation and after that we can
impute it with predicted values.
Treat separately: If there are significant number of outliers, we should treat them
separately in the statistical model. One of the approach is to treat both groups as two
different groups and build individual model for both groups and then combine the output.
Feature engineering is the science (and art) of extracting more information from existing
data. You are not adding any new data here, but you are actually making the data you
already have more useful. For example, let‟s say you are trying to predict foot fall in a
shopping mall based on dates. If you try and use the dates directly, you may not be able to
extract meaningful insights from the data. This is because the foot fall is less affected by
the day of the month than it is by the day of the week. Now this information about day of
week is implicit in your data. You need to bring it out to make your model better.
Variable Transformation
In data modelling, transformation refers to the replacement of a variable by a function. For
instance, replacing a variable x by the square / cube root or logarithm x is a

SCHOOL OF COMPUTING Page 38
transformation. In other words, transformation is a process that changes the distribution or
relationship of a variable with others.
Let’s look at the situations when variable transformation is useful.
Methods of Variable Transformation
There are various methods used to transform variables. As discussed, some of them
include square root, cube root, logarithmic, binning, and reciprocal and many others.
Let’s look at these methods in detail by highlighting the pros and cons of these
transformation methods.
Logarithm: Log of a variable is a common transformation method used to change
the shape of distribution of the variable on a distribution plot. It is generally used for
reducing right skewness of variables. Though, It can’t be applied to zero or negative
values as well.
Square / Cube root: The square and cube root of a variable has a sound effect on
variable distribution. However, it is not as significant as logarithmic transformation. Cube
root has its own advantage. It can be applied to negative values including zero. Square root
can be applied to positive values including zero.
Binning: It is used to categorize variables. It is performed on original values,
percentile or frequency. Decision of categorization technique is based on business
understanding. For example, we can
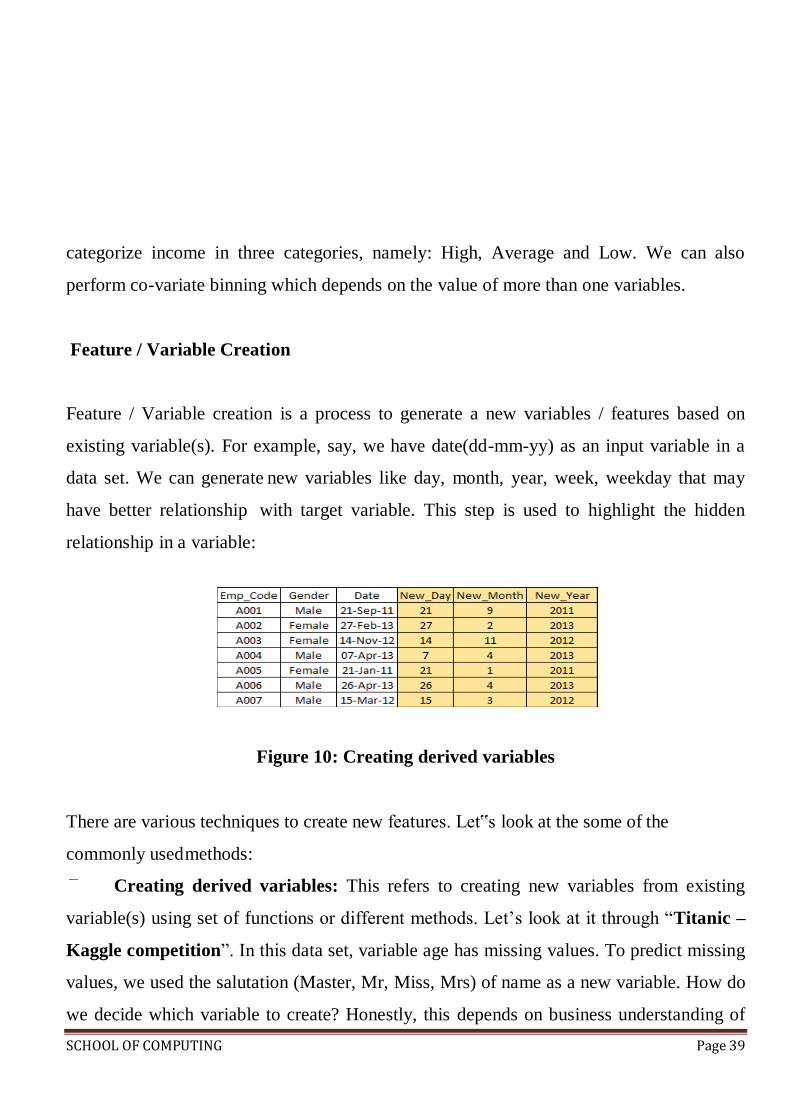
SCHOOL OF COMPUTING Page 39
categorize income in three categories, namely: High, Average and Low. We can also
perform co-variate binning which depends on the value of more than one variables.
Feature / Variable Creation
Feature / Variable creation is a process to generate a new variables / features based on
existing variable(s). For example, say, we have date(dd-mm-yy) as an input variable in a
data set. We can generate new variables like day, month, year, week, weekday that may
have better relationship with target variable. This step is used to highlight the hidden
relationship in a variable:
Figure 10: Creating derived variables
There are various techniques to create new features. Let‟s look at the some of the
commonly used methods:
Creating derived variables: This refers to creating new variables from existing
variable(s) using set of functions or different methods. Let’s look at it through “Titanic –
Kaggle competition”. In this data set, variable age has missing values. To predict missing
values, we used the salutation (Master, Mr, Miss, Mrs) of name as a new variable. How do
we decide which variable to create? Honestly, this depends on business understanding of

SCHOOL OF COMPUTING Page 40
the analyst, his curiosity and the set of hypothesis he might have about the problem.
Methods such as taking log of variables, binning variables and other methods of variable
transformation can also be used to create new variables.
Creating dummy variables: One of the most common application of
dummy variable is to convert categorical variable into numerical variables. Dummy
variables are also called Indicator Variables. It is useful to take categorical variable as a
predictor in statistical models. Categorical variable can take values 0 and 1. Let‟s take a
variable „gender‟. We can produce two variables, namely, “Var_Male” with values 1
(Male) and 0 (No male) and “Var_Female” with values 1 (Female) and 0 (No Female).
We can also create dummy variables for more than two classes of a categorical variables
with n or n-1 dummy variables.
Figure 11: Creating dummy variables
4 Data Visualization
Data visualization is the visual and interactive exploration and graphic representation of
data of any size, type (structured and unstructured) or origin. Visualizations help people
see things that were not obvious to them before.

SCHOOL OF COMPUTING Page 41
Even when data volumes are very large, patterns can be spotted quickly and easily.
Visualizations convey information in a universal manner and make it simple to share ideas
with others.
It‟s a way to get fast insights through visual exploration, robust reporting and flexible
information sharing. It helps a wide variety of users to make sense of the increasing
amount of data within your organization. It‟s a way to present big data in a way business
users can quickly understand and use. Data visualization brings the story of your data to
life.
Data visualization can be used for different purposes.
Some examples:
To create and share meaningful reports with anyone anywhere
To forecast and quickly identify opportunities and anticipate future trends
To optimize corporate processes & to drive innovation
To give anyone in the organization the power to visually explore and analyze all
available data.
Data visualization was created to visually explore and analyze data quickly. It‟s designed
for anyone in your organization who wants to use and derive insights from data regardless
of analytic skill level – from influencers, decision makers and analysts to statisticians and
data scientists. It also offers IT an easy way to protect and manage data integrity and
security. The amount of data will continue to grow while often time and resources to
interpret the data continue to decrease. Data visualization will become one of the few tools
able to help us win that challenge.

SCHOOL OF COMPUTING Page 42
Data visualization helps uncover insights buried in your data and discover trends within
your business and the market that affect your bottom line. Insights in your data can
provide competitive advantage and the opportunity to differentiate.
Data visualization lets you read your market intelligently, compare your overall position
with the industry trend, define the most appreciated features of your products and adapt
development accordingly, combine information about sales with consumer preferences
and much more.
Data visualization allows you to spot market trends and grow your business Data
visualization allows you now your market‟s dynamics like never before Knowing your
customer better leads to more effective sales and marketing actions and enhances customer
experience. Data visualization allows you to know your customers‟ needs and act on it.
Data visualization provides information that is easy to understand and to share. Company
KPIs are always under control. Data from a variety of internal and external sources is
channeled into one single, shared source of information.
Big Data visualization tool must be able to deal with semi-structured and unstructured data
because big data usually have this type of format. It is realized that to cope with such
huge amount of data there is need for immense parallelization, which is a challenge in
visualization. The challenge in parallelization algorithm is to break down the
problem into such independent task that they can run independently. The task of big
data visualization is to recognize interesting patterns and correlations. We need to
carefully choose the dimensions of data to be visualized, if we reduce dimensions to
make our visualization low then we may end up losing interesting patterns but if we
use all the dimensions we may end up having visualization too dense to be useful
to the users.

SCHOOL OF COMPUTING Page 43
For example: “Given the conventional displays ( 1.3 million pixels), visualizing
every data point can lead to over-plotting, overlapping and may overwhelm user‟s
perceptual and cognitive capacities
Due to vast volume and high magnitude of big data it becomes difficult to visualize.
Most of the current visualization tool have low performance in scalability,
functionality and response time
.Methods have been proposed which not only visualizes data but processes at the same
time. These methods use Hadoop and storage solution and R programming language
as compiler environment in the model
Visualization Tools
Various tools have emerged to help us out from the above pointed problems. The most
important feature that a visual- ization must have is that it should be interactive, which
means that user should be able to interact with the visualization. Visualization must
display relevant information when hovered over it, zoom in and out panel should be
there, visualization should adapt itself at runtime if we select subset or superset of
data. We reviewed some of the most popular visualization tools.
Tableau
Tableau is interactive data visualization tool which is focused on Business
Intelligence. Tableau provides very wide range of visualization options. It provides
option to create custom visualization. It is fast and flexible. It supports mostly all the
data format and connection to various servers right from the Amazon Aurora to
Cloudera Hadoop and Salesforce. User interface is intuitive, wide variety of charts
are available.

SCHOOL OF COMPUTING Page 44
For simple calculations and statistics one does not require any coding skills but for
heavy analytics we can run models in R and then import the results into Tableau. This
requires quite a bit of programming skill based upon the task we need to perform.
Some other important big data visualization problems are as follows
Visual noise: Most of the objects in dataset are too relative to each other. It becomes
very difficult to separate them.
Information loss: To increase the response time we can reduce data set visibility, but
this leads to information loss.
Large image perception: Even after achieving desired me- chanical output we are
limited by our physical perception.
Microsoft Power BI
Power BI is a powerful cloud-base business analytics service. Visualization are
interactive and rich. Power BI consists of 3 elements, Power BI Desktop, Service
(SaaS), Apps. Every service is available to us that is why it makes Power BI flexible
and persuasive. With more than 60 types of source integration you can start creating
visualization in matter of minutes. Power BI combines the familiar Microsoft tools
like Office, SharePoint and SQL Server. The feature that it distinguishes from other
tools is that you can use natural language to query the data. You don’t require
programming skills for this tool but there is option available to run your R script. You
can merge multiple data sources and create models, which comes in handy. Fig. 12
represents 3 visualizations in 3 coordinates, i.e. left, bottom and right. Left represents
profit by county and market, bottom represents profit by region and right coordinate
represents all over sales and profit.
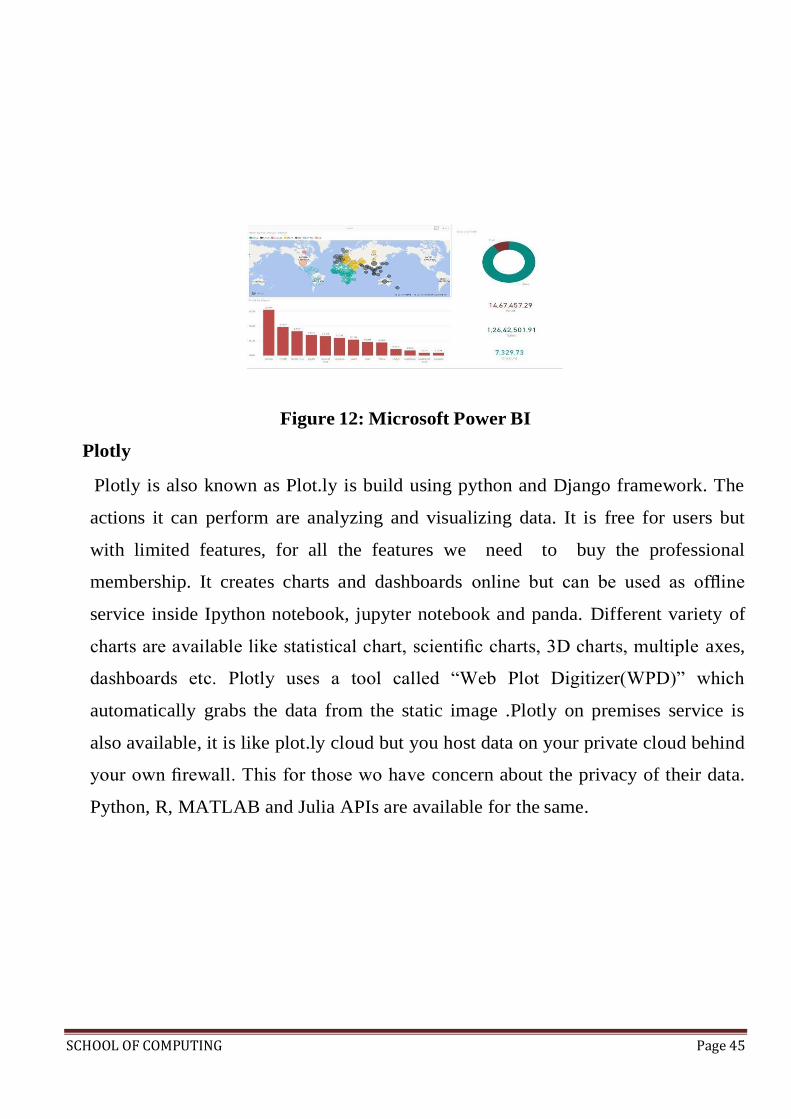
SCHOOL OF COMPUTING Page 45
Figure 12: Microsoft Power BI
Plotly
Plotly is also known as Plot.ly is build using python and Django framework. The
actions it can perform are analyzing and visualizing data. It is free for users but
with limited features, for all the features we need to buy the professional
membership. It creates charts and dashboards online but can be used as offline
service inside Ipython notebook, jupyter notebook and panda. Different variety of
charts are available like statistical chart, scientific charts, 3D charts, multiple axes,
dashboards etc. Plotly uses a tool called “Web Plot Digitizer(WPD)” which
automatically grabs the data from the static image .Plotly on premises service is
also available, it is like plot.ly cloud but you host data on your private cloud behind
your own firewall. This for those wo have concern about the privacy of their data.
Python, R, MATLAB and Julia APIs are available for the same.

SCHOOL OF COMPUTING Page 46
Figure 13: Plotly
Gephi
Gephi is open-source network analysis tool writ- ten in Java and OpenGL. It is
used to handle very large and complex datasets. The network analysis includes
• Social Network Analysis
• Link Analysis
• Biological Network Analysis
With its dynamic data exploration Gephi stands out rest of its competition for graph
analysis. No programming skills are required to run thin tools but a good knowledge
in graphs is necessary. It uses GPU 3D render engine to accelerate the performance
and give real time analysis

SCHOOL OF COMPUTING Page 47
Figure 14: Gephi
Excel 2016
Microsoft Excel is a spreadsheet developed by Microsoft. It can not only be used for
Big Data and statistical analysis but it is also a powerful visualization tool. Using
power query excel can connect to most of the services like HDFS, SaaS etc and is
capable of managing Semi- Structured data. Combined with visualization techniques
like ”Conditional Formatting” and interactive graphs makes Excel 2016 a good
contender in the ocean of Big Data visualization tools.

SCHOOL OF COMPUTING Page 48
Figure 15: Excel
Oracle Visual Analyzer
Introduced in 2015, this web-based tool within the Oracle Business Intelligence Cloud
Service claimed a spot at the Magic Quadrant Business Intelligence and Analytics
Platform report by Gartner. Interactive visuals and highly advanced analysis clubbed with
a customizable dashboard are some of the key features of Oracle Visual Analyzer. Being
highly scalable, this data visualization tool is very suitable for enterprises with large-scale
deployments where deep insights and well curated reports are essential.
Every bit of data carries a story with it and these data visualization tools are the gateway to
fathom the story it tries to tell us. It helps us to understand about the current statistics and
the future trends of the market.
Datawrapper
Datawrapper is a data visualization tool that‟s gaining popularity fast, especially among
media companies which use it for presenting statistics and creating charts. It has an easy to
navigate user interface where you can easily upload a csv file to create maps, charts and
visualizations that can be quickly added to reports. Although the tool is primarily aimed at
journalists, it‟s flexibility should accommodate a host of applications apart from media

SCHOOL OF COMPUTING Page 49
usage.
Google Chart
Google is an obvious benchmark and well known for the user-friendliness offered by
its products and Google chart is not an exception. It is one of the easiest tools for
visualizing huge data sets. Google chart holds a wide range of chart gallery, from a simple
line graph to complex hierarchical tree-like structure and you can use any of them that fits
your requirement. Moreover, the most important part while designing a chart is
customization and with Google charts, it‟s fairly Spartan. You can always ask for some
technical help if you want to dig deep. It renders the chart in HTML5/SVG format and it is
cross- browser compatible. Added to this, it also has adopted VML for supporting old IE
browsers and that‟s also cross-platform compatible, portable to iOS and the new release of
Android. The chart data can be easily exported to PNG format.
Qlikview
Qlik is one of the major players in the data analytics space with their Qlikview tool which
is also one of the biggest competitors of Tableau. Qlikview boasts over 40,000 customers
spanning across over 100 countries. Qlik is particularly known for its highly customizable
setup and a host of features that help create the visualizations much faster. However, the
available options could mean there would be a learning curve to get accustomed with the
tool so as to use it to its full potential.
Apart from its data visualization prowess, Qlikview also offers analytics, business
intelligence and enterprise reporting features. The clean and clutter-free user experience is
one of the notable aspects of Qlikview. Qliksense is a sister package of Qlikview which is
often used alongside the former to aid in data exploration and discovery. Another
advantage of using Qlikview is the strong community of users and resources which will
help you get started with the tool.
1
SCHOOL OF COMPUTING
DEPARTMENT OF COMPUTER SCIENCE AND ENGINEERING
UNIT – II – Internet of Things – SCSA5301 UNIT – V – Internet of Things – SIT1619

School of Computing Page 2
UNIT V
Hands-On Projects
DIY Kits – Soil moisture monitoring, Weather monitoring, Air quality Monitoring, Movement
Detection, etc, IFTTT and other apps
Hands-On Projects
1. DIY Kits – Soil moisture monitoring
2. Weather monitoring
3. Air quality Monitoring
4. Movement Detection
5. Uploading data in Thingspeak website
6. IFTTT
1. Soil Moisture Monitoring
Soil moisture sensors measure the volumetric water content in soil.
Since the direct gravimetric measurement of free soil moisture requires removing,
drying, and weighting of a sample, soil moisture sensors measure the volumetric
water content indirectly by using some other property of the soil, such as
electrical resistance, dielectric constant, or interaction with neutrons, as a proxy
for the moisture content. The relation between the measured property and soil
moisture must be calibrated and may vary depending on environmental factors
such as soil type, temperature, or electric conductivity. Reflected microwave
radiation is affected by the soil moisture and is used for remote sensing in
hydrology and agriculture.
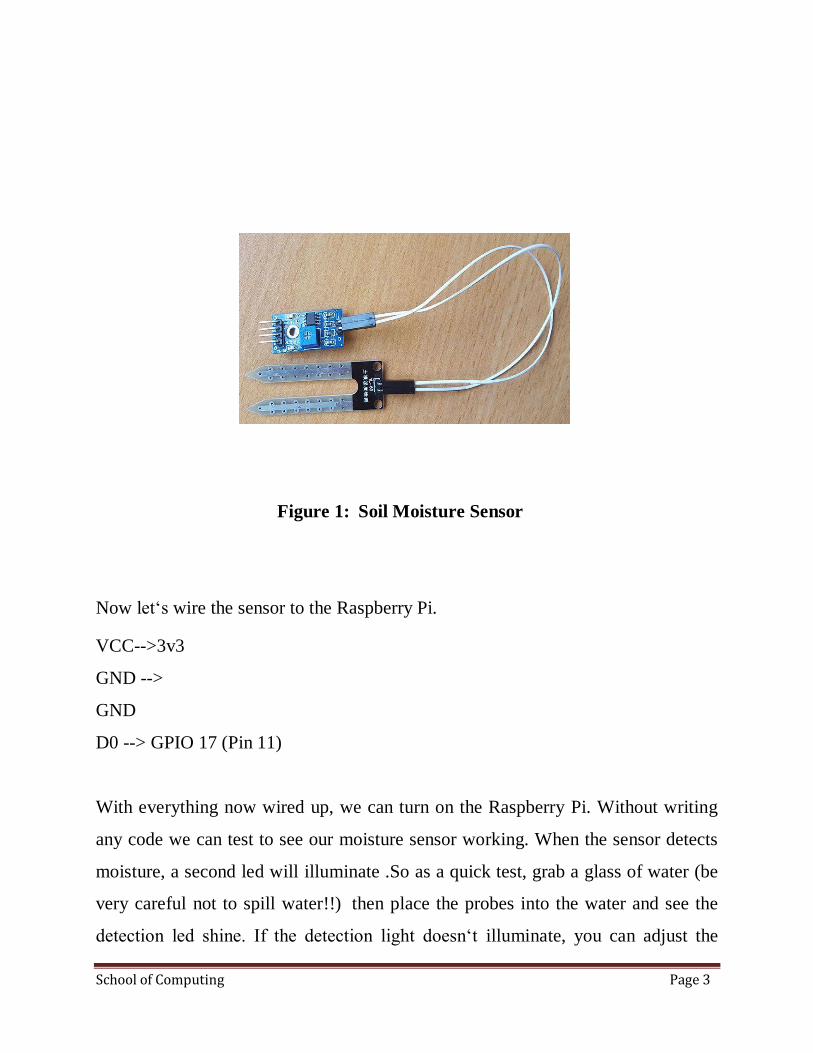
School of Computing Page 3
Figure 1: Soil Moisture Sensor
Now let‘s wire the sensor to the Raspberry Pi.
VCC-->3v3
GND -->
GND
D0 --> GPIO 17 (Pin 11)
With everything now wired up, we can turn on the Raspberry Pi. Without writing
any code we can test to see our moisture sensor working. When the sensor detects
moisture, a second led will illuminate .So as a quick test, grab a glass of water (be
very careful not to spill water!!) then place the probes into the water and see the
detection led shine. If the detection light doesn‘t illuminate, you can adjust the

School of Computing Page 4
potentiometer on the sensor which allows you to change the detection threshold
(this only applies to the digital output signal). In this example we want to monitor
the moisture levels of our plant pot. So we want to set the detection point at a level
so that if it drops below we get notified that our plant pot is too dry and needs
watering. Our plant here, is a little on the dry side, but ok for now, if it gets any
drier it‘ll need watering.
Figure 2: Experimental Setup
To run the script simply run the following command from the same directory
as the script: sudo python moisture.py

School of Computing Page 5
1.1 Code
import RPi.GPIO as
GPIO import smtplib
import time
smtp_username = "enter_username_here" # This is the username used to login to
your SMTP provider
smtp_password = "enter_password_here" # This is the password used to login to your
SMTP provider
smtp_host = "enter_host_here" # This is the host of the SMTP
provider smtp_port = 25 # This is the port that your SMTP
provider uses smtp_sender = "[email protected]" # This is the
FROM email address smtp_receivers = ['[email protected]'] #
This is the TO email address message_dead = """From: Sender
Name <[email protected]>
To: Receiver Name <[email protected]>
Subject: Moisture Sensor Notification
# This is the message that will be sent when moisture IS
detected again message_alive = """From: Sender Name

School of Computing Page 6
To: Receiver Name <[email protected]>
Subject: Moisture Sensor
Notification # This is our
sendEmail function
def sendEmail(smtp_message):
try:
smtpObj = smtplib.SMTP(smtp_host, smtp_port)
smtpObj.login(smtp_username, smtp_password) # If you don't need to
login to your smtp provider, simply remove this line
smtpObj.sendmail(smtp_sender, smtp_receivers,
smtp_message) print "Successfully sent email"
except smtplib.SMTPException:
print "Error: unable to send email"
# This is our callback function, this function will be called every time there is a
change on the specified GPIO channel, in this example we are using 17
def callback(channel):

School of Computing Page 7
if GPIO.input(channel):
print "LED off"
sendEmail(message_d
ead)
else:
print "LED on"
sendEmail(message_al
ive)
# Set our GPIO numbering to
BCM
GPIO.setmode(GPIO.BCM)
# Define the GPIO pin that we have our digital output from our sensor
connected to channel = 17
# Set the GPIO pin to an input
GPIO.setup(channel, GPIO.IN)
# This line tells our script to keep an eye on our gpio pin and let us know when the
pin goes HIGH or LOW
GPIO.add_event_detect(channel, GPIO.BOTH, bouncetime=300)
# This line assigns a function to the GPIO pin so that when the above line tells us

School of Computing Page 8
there is a change on the pin, run this function
GPIO.add_event_callback(channel, callback)
# This is an infinte loop to keep our script
running while True:
# This line simply tells our script to wait 0.1 of a second, this is so the script
doesnt hog all of the CPU
time.sleep(0.1)
2. Weather Monitoring
The DHT11 is a low-cost temperature and humidity sensor. It isn‘t the
fastest sensor around but its cheap price makes it useful for experimenting or
projects where you don‘t require new readings multiple times a second. The
device only requires three connections to the Pi.
+3.3v, ground and one GPIO pin.
DHT11 Specifications
The device itself has four pins but one of these is not used. You can buy the 4-pin
device on its own or as part of a 3-pin module. The modules have three pins and
are easy to connect directly to the Pi‘s GPIO header.
Humidity : 20-80% (5% accuracy)
Temperature : 0-50°C (±2°C accuracy)

School of Computing Page 9
Hardware Setup
Figure 3: Humidity and Temperature Sensor
The 4-pin device will require a resistor (4.7K-10K) to be placed between Pin 1
(3.3V) and Pin 2 (Data). The 3-pin modules will usually have this resistor included
which makes the wiring a bit easier. The 3 pins should be connected to the Pi as
shown in the table below :
DHT Pin Signal Pi Pin
1 3.3V 1
2 Data/Out 11 (GPIO17)
3 not used –
4 Ground 6 or 9

School of Computing Page 10
Your data pin can be attached to any GPIO pin you prefer. In my example I am
using physical pin 11 which is GPIO 17. Here is a 4-pin sensor connected to the
Pi‘s GPIO header. It has a 10K resistor between pin 1 (3.3V) and 2 (Data/Out).
Python Library
The DHT11 requires a specific protocol to be applied to the data pin. In
order to save time trying to implement this yourself it‘s far easier to use the
Adafruit DHT library. The library deals with the data that needs to be exchanged
with the sensor but it is sensitive to timing issues. The Pi‘s operating system may
get in the way while performing other tasks so to compensate for this the library
requests a number of readings from the device until it gets one that is valid. To
start with update your package lists and install a few Python libraries:
sudo apt-get update
sudo apt-get install build-essential python-dev
Then clone the Adafruit library from their repository :
Git clone
https://github.com/adafruit Cd
Adafruit_Python_DHT
Then install the library for Python 2 and
Python 3 sudo python setup.py install
sudo python3 setup.py
install python
AdafruitDHT.py 11 17

School of Computing Page 11
The example script takes two parameters. The first is the sensor type so is set to
―11‖ to represent the DHT11. The second is the GPIO number so for my example
I am using ―17‖ for GPIO17. You can change this if you are using a different
GPIO pin for your data/out wire. You should see an output similar to this :
Temp=22.0*Humidity=68.0%
import Adafruit_DHT
# Set sensor type : Options are DHT11,DHT22 or
AM2302 sensor=Adafruit_DHT.DHT11
# Set GPIO sensor is
connected to gpio=17
# Use read_retry method. This will retry up to 15 times to
# get a sensor reading (waiting 2 seconds between each retry).
humidity, temperature = Adafruit_DHT.read_retry(sensor, gpio)
# Reading the DHT11 is very sensitive to timings and occasionally
# the Pi might fail to get a valid reading. So check if readings
are valid. if humidity is not None and temperature is not
None:
print('Temp=0:0.1f*C Humidity=1:0.1f%'.format(temperature,
humidity)) else:
print('Failed to get reading. Try again!')

School of Computing Page 12
3. Air Pollution Monitoring
Air pollution is a major problem in urban centers as well as rural set-up. The
major pollutants of concern are primarily carbon monoxide, nitrogen oxides,
hydrocarbons and particulate matter (PM10, PM2.5). Ozone, PAN and PBN are
other secondary pollutants generated as a result of the photochemical reactions
of the primary pollutants. These pollutants affect human health as well as
environment. Therefore, air pollution monitoring is necessary to keep a check
on the concentration of these pollutants in ambient air. The grove sensors, grove
DHT (for temperature and humidity), grove gas sensor modules like dust, MQ-5
(for smoke), MQ-7 (for CO) and MQ-135 (for CO2) are interfaced to this shield
for monitoring in our proposed.
Adafruit CCS811 is a gas sensor that can detect a wide range of Volatile
Organic Compounds (VOCs) and is intended for indoor air quality monitoring.
When connected to your microcontroller (running our library code) it will return a
Total Volatile Organic Compound (TVOC) reading and an equivalent carbon
dioxide reading (eCO2) over I2C. There is also an on- board thermistor that can be
used to calculate the approximate local ambient temperature.

School of Computing Page 13
Figure 4: Gas Sensor
Power Pins
Vin - this is the power pin. Since the sensor uses 3.3V, we have included an
onboard voltage regulator that will take 3-5VDC and safely convert it
down. To power the board, give it the same power as the logic level of
your microcontroller - e.g. for a 5V micro like Arduino, use 5V
3Vo - this is the 3.3V output from the voltage regulator, you can grab up to
100mA from this if you like
GND - common ground for power and logic
Logic pins
SCL - this is the I2C clock pin, connect to your microcontrollers I2C
clock line. There is a 10K pullup on this pin and it is level shifted so you
can use 3 - 5VDC.

School of Computing Page 14
SDA - this is the I2C data pin, connect to your microcontrollers I2C data
line. There is a 10K pullup on this pin and it is level shifted so you can use
3 - 5VDC.
INT - this is the interrupt-output pin. It is 3V logic and you can use it to
detect when a new reading is ready or when a reading gets too high or too
low.
WAKE - this is the wakeup pin for the sensor. It needs to be pulled to
ground in order to communicate with the sensor. This pin is level shifted
so you can use 3- 5VDC logic.
RST - this is the reset pin. When it is pulled to ground the sensor resets
itself. This pin is level shifted so you can use 3-5VDC logic.
Raspberry Pi Wiring & Test
The Raspberry Pi also has an I2C interface that can be used to communicate with
this sensor. Once your Pi is all set up, and you have internet access set up, lets
install the software we will need. First make sure your Pi package manager is up to
date
Next, we will install the Raspberry Pi library and Adafruit_GPIO which is
our hardware interfacing layer
1. sudo apt-get update

School of Computing Page 15
Next install the adafruit CCS811 python library.
Enable I2C
We need to enable the I2C bus so we can communicate with the sensor.
Once I2C is enabled, we need to slow the speed way down due to constraints of
this particular sensor.
1. sudo apt-get install -y build-essential python-pip python-dev python-smbus git
2. git clone https://github.com/adafruit/Adafruit_Python_GPIO.git 3. cd Adafruit_Python_GPIO
4. sudo python setup.py install
1. sudo pip install Adafruit_CCS811
1. sudo raspi-config
1. sudo nano /boot/config.txt

School of Computing Page 16
add this line to the file
press Ctrl+X, then Y, then enter to save and exit. Then run sudo shutdown -h
now to turn off the Pi and prepare for wiring.
Wiring Up Sensor
With the Pi powered off, we can wire up the sensor to the Pi Cobbler like this:
Connect Vin to the 3V or 5V power supply (either is fine)
Connect GND to the ground pin on the Cobbler
Connect SDA to SDA on the Cobbler
Connect SCL to SCL on the Cobbler
Connect Wake to the ground pin on the Cobbler
Now you should be able to verify that the sensor is wired up correctly by asking the
Pi to detect what addresses it can see on the I2C bus:
Run example code
At long last, we are finally ready to run our example code
1. dtparam=i2c_baudrate=10000
1. sudo i2cdetect -y 1
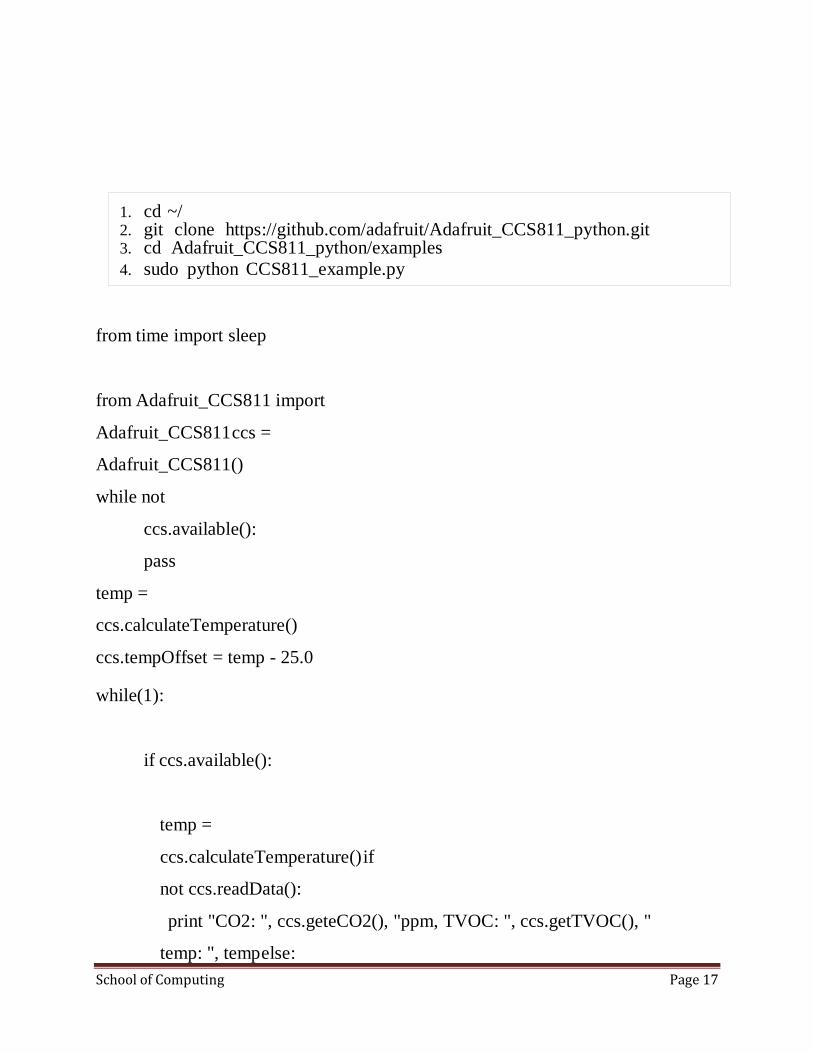
School of Computing Page 17
from time import sleep
from Adafruit_CCS811 import
Adafruit_CCS811 ccs =
Adafruit_CCS811()
while not
ccs.available():
pass
temp =
ccs.calculateTemperature()
ccs.tempOffset = temp - 25.0
while(1):
if ccs.available():
temp =
ccs.calculateTemperature() if
not ccs.readData():
print "CO2: ", ccs.geteCO2(), "ppm, TVOC: ", ccs.getTVOC(), "
temp: ", temp else:
1. cd ~/ 2. git clone https://github.com/adafruit/Adafruit_CCS811_python.git 3. cd Adafruit_CCS811_python/examples
4. sudo python CCS811_example.py

School of Computing Page 18
"ERROR!"
while(1):
pas
s sleep(2)
4. Movement Detection
PIR stands for passive infrared. This motion sensor consists of a fresnel lens, an
infrared detector, and supporting detection circuitry. The lens on the sensor focuses
any infrared radiation present around it toward the infrared detector. Our bodies
generate infrared heat, and as a result, this heat is picked up by the motion sensor.
The sensor outputs a 5V signal for a period of one minute as soon as it detects the
presence of a person. It offers a tentative range of detection of about 6–7 meters
and is highly sensitive. When the PIR motion sensor detects a person, it outputs a
5V signal to the Raspberry Pi through its GPIO and we define what the Raspberry
Pi should do as it detects an intruder through the Python coding. Here we are just
printing "Intruder detected".

School of Computing Page 19
Figure 5: Working of PIR
Sensor
Working Mechanism
All living beings radiate energy to the surroundings in the form of infrared
radiations which are invisible to human eyes. A PIR (Passive infrared) sensor can
be used to detect these passive radiations. When an object (human or animal)
emitting infrared radiations passes through the field of view of the sensor, it detects
the change in temperature and therefore can be used to detect motion.HC-SR501
uses differential detection with two pyroelectric infrared sensors. By taking a
difference of the values, the average temperature from the field of view of a sensor
is removed and thereby reducing false positives.

School of Computing Page 20
import RPi.GPIO as GPIO
import time #Import time
library
GPIO.setmode(GPIO.BOARD) #Set GPIO pin
numbering pir = 26 #Associate pin 26 to pir
GPIO.setup(pir, GPIO.IN) #Set pin as GPIO in print "Waiting for sensor to
settle" time.sleep(2) #Waiting 2 seconds for the sensor to initiate print
"Detecting motion"
while True:
if GPIO.input(pir): #Check whether pir is HIGH print "Motion
Detected!" time.sleep(2) #D1- Delay to avoid multiple detection
time.sleep(0.1) #While loop delay should be less than detection(hardware) delay
5. Upload Your Raspberry Pi Sensor Data to Thingspeak Website
Things needed
1. Raspbeery Pi
2. Power Cable
3. Wifi adapter or LAN connection to Raspbeery Pi
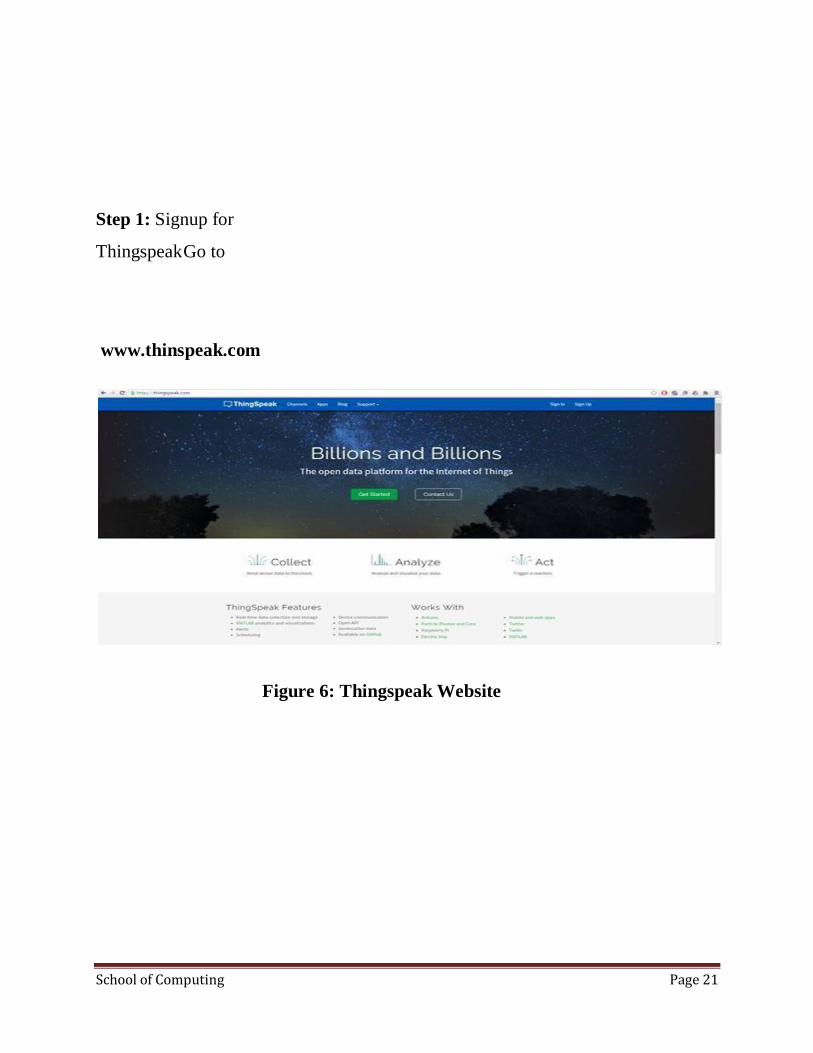
School of Computing Page 21
Step 1: Signup for
Thingspeak Go to
www.thinspeak.com
Figure 6: Thingspeak Website

School of Computing Page 22
Click on ―Sign Up‖ option and complete the details
Figure7: Create user
account Step 2: Create a Channel for Your Data
Once you Sign in after your account activation, Create a new channel by
clicking ―New Channel‖ button
Figure 8: Creating New Channel

School of Computing Page 23
After the ―New Channel‖ page loads, enter the Name and Description of the
data you want to upload. You can enter the name of your data (ex: Temperature)
in Field1. If you want more Fields you can check the box next to Field option and
enter the corresponding name of your data.
Figure 9: New Channel settings
Click on ―Save Channel‖ button to save all of your settings.

School of Computing Page 24
We created two Fields, one is CPU Memory and one for CPU Temperature
Figure 10: Creating field charts to display data

School of Computing Page 25
Step 3: Get an API Key
To upload our data, we need an API key, which we will later include in a piece of
python code to upload our sensor data to Thingspeak Website.
Click on ―API Keys‖ tab to get the key for uploading your sensor data.
Figure 11: Copy the Write API Key of the channel
The advantage of using Thingspeak compared to Xively or any other websites is
that the convenience of using Matlab Analysis and Matlab Visualizations. Once
you have the ―Write API Key‖. We are almost ready to upload our data, except for
the python code.

School of Computing Page 26
Step 4: Modifying the Python Code
Go to
https://github.com/sriharshakunda/Thingspeak_CPU_Python-
Code Download the code into your Raspberry Pi Home folder.
Open the CPU_Python.py file in a
notepad. Code:
import httplib, urllib
import time
sleep = 60 # how many seconds to sleep between posts to the channel
key = 'Put your Thingspeak Channel Key here' # Thingspeak channel to update
#Report Raspberry Pi internal temperature to Thingspeak
Channel def thermometer():
while True:
#Calculate CPU temperature of Raspberry Pi in Degrees C
temp = int(open('/sys/class/thermal/thermal_zone0/temp').read()) / 1e3 # Get
Raspberry Pi CPU temp
params = urllib.urlencode('field1': temp, 'key':key )
headers = "Content-typZZe": "application/x-www-form-
urlencoded","Accept": "text/plain"
conn =
httplib.HTTPConnection("api.thingspeak.com:80
") try:

School of Computing Page 27
conn.request("POST", "/update", params,
headers) response = conn.getresponse()
print temp
print response.status,
response.reason data =
response.read()
conn.close
() except:
print "connection
failed" break
#sleep for desired amount of
time if name == " main
":
while True:
thermometer()
time.sleep(sle
ep)
Edit the line 19 by using CPU_Temp instead of temp.
Use your Write API Key to replace the key with your API Key
Use your Write API Key to replace the key with your API Key
Save the file to overwrite changes
Step 5: Assuming you have python 2.7 and proper python libraries, go to the folder

School of Computing Page 28
where you copied the CPU_Python.py file
Type python2.7 CPU_Python.py file
If the code runs properly you should see ―200 ok‖ and something like ―58.30‖ (CPU
temperature value)
In case if there are any errors uploading the data, you will receive ―connection failed‖
message
Step 6: Check Thinspeak API and Confirm data transfer
Open your channel and you should see the temperature uploading into thinspeak
website.
Figure: 12 CPU Temperature data displayed in Field
Chart
School of Computing Page 29
6. IFTTT
IFTTT – short for ‗If This Then That‘ – is a free online service that lets you
automate specific tasks. It lets you trigger actions on other apps, web services and
devices automatically every time certain conditions are met. These trigger >
action relationships used to be called
‗recipes‘, but will now be known as Applets. The trigger and action relationships
have always been known as ‗recipes‘, but that‘s all changing. From now on, they
will be dubbed ‗Applets‘. There are no major changes to the way things work, but
there are a few differences worth being aware of. Each Applet you enable will still
trigger an ‗if this then that‘ action when the relevant conditions are met, but now
Applets can trigger multiple actions, instead of just one. Once the first action is
completed, a second, third, fourth, etc, can also be triggered.
"Channel" is IFTTT parlance for a Web service or other action. IFTTT currently
supports 67 different channels spanning a wide range of popular services, and it
can perform basic actions such as calling or texting a phone, or sending you an
email. Here's a list of all the available IFTTT channels. You may recognize some
of them: Craigslist, Dropbox, Evernote, Facebook, Flickr, Foursquare, Instagram,
SkyDrive, Twitter, YouTube, and a wide range of Google services are just the tip of
the iceberg. A newly released iPhone IFTTT app even adds channels for your
phone's Reminders, Contacts, and Photos apps. Once you've gone through and
activated some channels—basically, granting IFTTT access to your various
services or providing it with personal details—you're ready to start crafting.

School of Computing Page 30
Services
A service is just what it sounds like, a tool, application, or facility that works with
IFTTT. The brilliant thing about IFTTT is that its variety of channels allows it to
offer something to everybody. The list of available services is enormous and more
are added all the time. Some of the most popular services include Facebook,
Twitter, Instagram, YouTube, SoundCloud, Dropbox, Evernote, and Pocket.
Applets
Applets are what make IFTTT worth your time. Basically, they are the
combination of services that use a trigger and an action. When something happens
on one service, it triggers an action on another.
Create an Applet
The first step is to click My Applets and then New Applet. Next, click the word
This.

School of Computing Page 31
Figure13: Login Page
For this example, we will select the Instagram trigger, which will then ask us
to activate Instagram just this once. Having done that, we will choose a
trigger action:
Figure 14: Service

School of Computing Page 32
Figure 15: Trigger
Figure 16: Action Service
After doing this, we will be greeted by the second batch of actions. We‘ll select the
first one and be asked to complete the fields. In this case, it‘s asking us where to
grab the photos, how to name them and where it should put them. All you have to
do is click on the Add ingredient, make your selection from the drop-down box,
and hit the Create Action button. Finally, you will be asked to review your Applet.
You can optionally enable notifications when the Applet runs. Then, click Finish.

School of Computing Page 33
Pre-Made Applets
We can browse other people‘s Applets, view options by category, check out
collections, look at recommendations, or do a search if you are looking for
something specific. And, using existing Applets is easier than creating your own.
Figure 17: Pre Made Applets
Just click on an Applet to review the details, and move the slider to turn it on.
Depending on the Applet you choose, you may be asked to connect an account
like Facebook or configure pieces of the Applet like date and time. But, this is all
very simple and self-explanatory as you move through the process.

School of Computing Page 34
Top 7 Applets
Applet #1 – Daily SMS Weather Forecast
You get IFTTT to send an SMS each morning telling you what the weather
conditions are going to be for the day.
Applet #2 – Wake Up Call
You get a call at a time of your preference with an automated message.
Applet #3 – Starred Emails in Gmail to Evernote
When you mark an email with a star on Gmail, a copy of it is sent to your Evernote
account.
Applet #4 – NASA’s Image of the Day
NASA is well-known for many things, not the least of which is their stunning
photographs of our galaxy. Set this up and you‘ll get an amazing photo in your
email every day.
Applet #6 – Email For a Call to Find a Lost Phone
We‘ve all lost our phone before. With this Applet you get a call when you send an
email to the specified address, helping you hear where it is.
Applet #7 – Timed Daily Tweet
Your account sends a tweet every day at a time you choose.
Copyright © 2022 FDOKUMEN