Transport Accessibility and Tourism Development Prospects ...
Upload
independentCategory
view
5download
0
World Symposium on Transport and Land Use Research, Whistler Canada, 28-30 July 2011
1
Understanding spatial variations in the impact of accessibility on land value using geographically weighted regression
Dr Hongbo Du Principal transport planner, Dongguan institute of urban planning and construction [email protected] Professor Corinne Mulley1
Chair of Public Transport, Institute of Transport and Logistics Studies, The University of Sydney, Australia [email protected] 1corresponding author
ABSTRACT This paper aims to understand the spatial variability in house prices and accessibility. The motivation for understanding the connection between accessibility and house prices stem from the increasing attention given in recent years to the potential for funding transport infrastructure by land value capture policies. Establishing whether there is identifiable land value uplift and further quantifying this uplift is a pre-requisite to sensible discussion on the potential for land value capture. There has been substantial recent research in the US, but, in the UK, not only have there been fewer studies but these have concentrated on London. London, as a capital city, is different in many respects to other cities. Large conurbations such as Manchester, Sheffield and Tyne and Wear are more typical of British cities. This study focuses on the Tyne and Wear area which has an extensive public transport system with a light rail system, the Tyne and Wear Metro, forming the backbone of the public transport system. The investigation reported in this paper is underpinned by the use of Geographically Weighted Regression (GWR) methodology with property prices as the dependent variable which in turn is explained by independent variables designed to standardise for household features, spatially defined factors including the transport accessibility of the house location. This methodology allows the estimation of the importance of transport accessibility in determining house prices.
The empirical results show that on average the internal factors of the property and the socio-economic classification of its location are dominant determinants of property prices but that transport accessibility variables are also significant. However, the local model approach of GWR shows significant spatially varying relationship between property prices and transport accessibility to be identified.
This study contributes both to a quantification of the impact of accessibility on house prices. Moreover, the paper demonstrates the application of a relatively new methodology in the transport field that elegantly takes account of the spatial nature of the data required in this process.
Keywords: accessibility, public transport, land value, land value capture
1. INTRODUCTION Public transport investments improve accessibility for locations where users are served directly by this investment or use this investment as part of the public transport network. In general, improvements in accessibility are translated into enhanced land values: this process is called land value uplift. In recent years, land value uplift has attracted increasing attention as a potential means of financing transport infrastructure, particularly in the UK where a swathe of new light rail schemes failed to be implemented through lack of funds (GVA Grimley 2004 p1). However, the empirical evidence to date is not sufficiently robust to identify how much transport infrastructure and its associated accessibility impacts contribute to land value uplift and this is a pre-requisite to sensible discussions on land value capture. In the early stages of seeking evidence on this matter, comparison methods were used (Pickett and Perrett 1984, Cervero and Landis 1993, Du and Mulley 2006). Hedonic price methods have also been widely considered as an approach to identify the impact of transport investment on land value and this is particularly so in the US (Weinberger 2001, Cervero and Duncan 2002a, 2002b).
World Symposium on Transport and Land Use Research, Whistler Canada, 28-30 July 2011
2
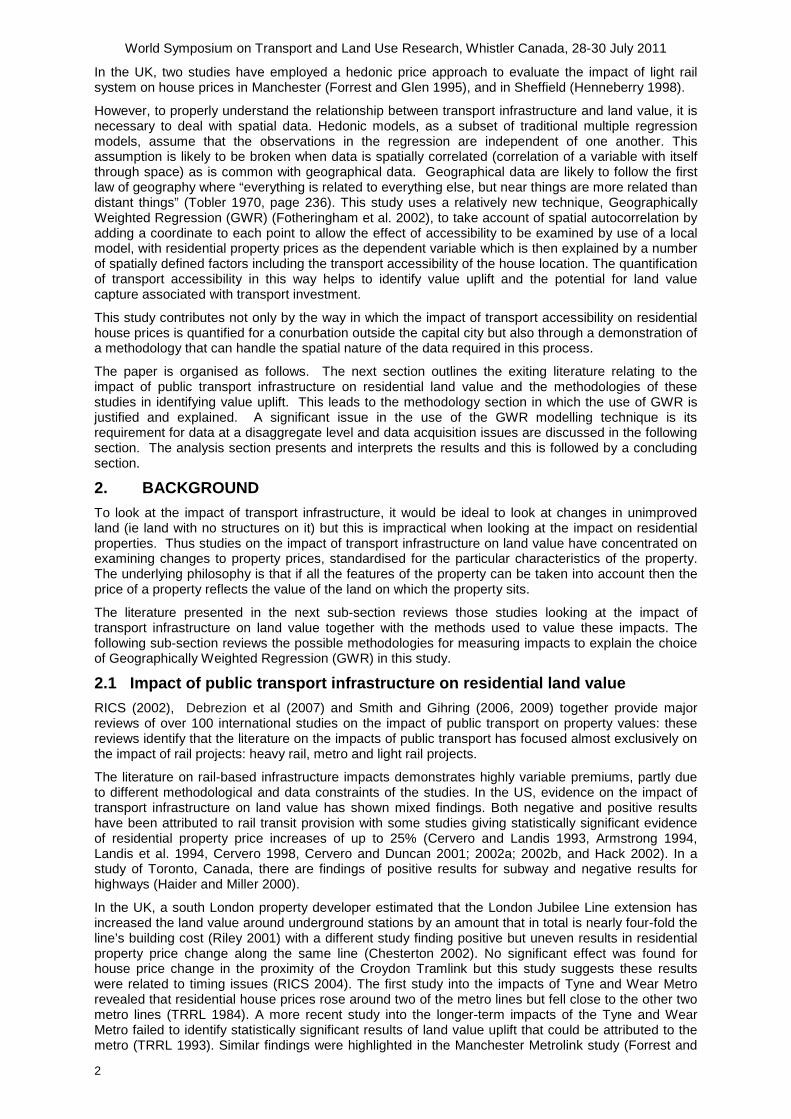
In the UK, two studies have employed a hedonic price approach to evaluate the impact of light rail system on house prices in Manchester (Forrest and Glen 1995), and in Sheffield (Henneberry 1998).
However, to properly understand the relationship between transport infrastructure and land value, it is necessary to deal with spatial data. Hedonic models, as a subset of traditional multiple regression models, assume that the observations in the regression are independent of one another. This assumption is likely to be broken when data is spatially correlated (correlation of a variable with itself through space) as is common with geographical data. Geographical data are likely to follow the first law of geography where “everything is related to everything else, but near things are more related than distant things” (Tobler 1970, page 236). This study uses a relatively new technique, Geographically Weighted Regression (GWR) (Fotheringham et al. 2002), to take account of spatial autocorrelation by adding a coordinate to each point to allow the effect of accessibility to be examined by use of a local model, with residential property prices as the dependent variable which is then explained by a number of spatially defined factors including the transport accessibility of the house location. The quantification of transport accessibility in this way helps to identify value uplift and the potential for land value capture associated with transport investment.
This study contributes not only by the way in which the impact of transport accessibility on residential house prices is quantified for a conurbation outside the capital city but also through a demonstration of a methodology that can handle the spatial nature of the data required in this process.
The paper is organised as follows. The next section outlines the exiting literature relating to the impact of public transport infrastructure on residential land value and the methodologies of these studies in identifying value uplift. This leads to the methodology section in which the use of GWR is justified and explained. A significant issue in the use of the GWR modelling technique is its requirement for data at a disaggregate level and data acquisition issues are discussed in the following section. The analysis section presents and interprets the results and this is followed by a concluding section.
2. BACKGROUND To look at the impact of transport infrastructure, it would be ideal to look at changes in unimproved land (ie land with no structures on it) but this is impractical when looking at the impact on residential properties. Thus studies on the impact of transport infrastructure on land value have concentrated on examining changes to property prices, standardised for the particular characteristics of the property. The underlying philosophy is that if all the features of the property can be taken into account then the price of a property reflects the value of the land on which the property sits.
The literature presented in the next sub-section reviews those studies looking at the impact of transport infrastructure on land value together with the methods used to value these impacts. The following sub-section reviews the possible methodologies for measuring impacts to explain the choice of Geographically Weighted Regression (GWR) in this study.
2.1 Impact of public transport infrastructure on residential land value RICS (2002), Debrezion et al (2007) and Smith and Gihring (2006, 2009) together provide major reviews of over 100 international studies on the impact of public transport on property values: these reviews identify that the literature on the impacts of public transport has focused almost exclusively on the impact of rail projects: heavy rail, metro and light rail projects.
The literature on rail-based infrastructure impacts demonstrates highly variable premiums, partly due to different methodological and data constraints of the studies. In the US, evidence on the impact of transport infrastructure on land value has shown mixed findings. Both negative and positive results have been attributed to rail transit provision with some studies giving statistically significant evidence of residential property price increases of up to 25% (Cervero and Landis 1993, Armstrong 1994, Landis et al. 1994, Cervero 1998, Cervero and Duncan 2001; 2002a; 2002b, and Hack 2002). In a study of Toronto, Canada, there are findings of positive results for subway and negative results for highways (Haider and Miller 2000).
In the UK, a south London property developer estimated that the London Jubilee Line extension has increased the land value around underground stations by an amount that in total is nearly four-fold the line’s building cost (Riley 2001) with a different study finding positive but uneven results in residential property price change along the same line (Chesterton 2002). No significant effect was found for house price change in the proximity of the Croydon Tramlink but this study suggests these results were related to timing issues (RICS 2004). The first study into the impacts of Tyne and Wear Metro revealed that residential house prices rose around two of the metro lines but fell close to the other two metro lines (TRRL 1984). A more recent study into the longer-term impacts of the Tyne and Wear Metro failed to identify statistically significant results of land value uplift that could be attributed to the metro (TRRL 1993). Similar findings were highlighted in the Manchester Metrolink study (Forrest and

World Symposium on Transport and Land Use Research, Whistler Canada, 28-30 July 2011
3
Glen 1995) with a very small discrete transport induced price rise being identified by an evaluation of the Sheffield Supertram (Henneberry 1998).
The contribution of new bus-based infrastructure to land value uplift is an area that has only recently emerged in the literature, despite the progressive implementation of bus rapid transit (BRT). As notable exceptions, Rodriguez and Targa (2004) and Munoz-Raskin (2009) both studied the impact of BRT in a large city in a developing country context, focusing on the Transmilenio in Bogota, Colombia and found, as for rail, that the housing market placed value premiums on residential properties in the immediate walking proximity of feeder lines to the BRT service. Cervero and Duncan (2002) found no evidence of appreciable effects of BRT on multi-family housing in Los Angeles, although this study was only 1 year after the BRT opened, but for this system there was no dedicated right-of-way, and stops were in redevelopment districts. In contrast, McMillen and McDonald (2004) found that the housing market in Chicago capitalised the impact of a new rapid transit line 6 years before its opening. More recently, Des Rosiers et al. (2010) investigated the impact of bus services on residential property values in Quebec, Canada using a hedonic pricing model and found differing uplifts for houses close to regular routes (negative uplift) as opposed to express routes (positive uplift) but that greater opportunities in terms of an increase in destination choice added positively to house prices.
The variation in effects exposed by the literature, both in the quantity of uplift, timing of impacts, the relevance of mode and potential causal links, indicates the importance of not overstating the accessibility impacts of new infrastructure. Hall and Hass-Klau (1985) argue that transport changes facilitate urban change but do not bring about the change by themselves and this was reinforced by Knight (1980) who suggested that for substantial land use impact to occur it needed the synergies of co-ordinated land use policies, developable land, and favourable regional development trends, social and physical conditions. The success of London dockland’s development following the introduction of Dockland light rail is a good example of this.
2.2 Methods to evaluate impacts Methods which have been used to evaluate impacts include simple comparison and hedonic price models. Methods based on simple comparisons have been employed in a number of studies (TRRL 1984; Cervero and Landis 1993; TRRL 1993; Pasha 1995; Du and Mulley 2007). The price changes of houses in the catchment areas of a station are compared with the property price changes in control areas. But this method seems unable to identify the more complicated, multi-dimensional features which underpin property values.
Whilst the comparison method examines the relationship between land value or property price and transport accessibility by isolating transport accessibility from other factors through comparisons of land value/property price, the hedonic pricing method examines this relationship by standardising for a number of attributes in a multiple regression model with the dependent variable of land value/property price. Hedonic models have been the most common approach to analyse property prices using a multiple regression methodology to explain house prices as a function of a number of house specific explanatory variables. It has been widely considered to be the best method available to identify the effects on house prices associated with factors such as proximity to transportation facilities (Cervero and Duncan 2001).
However, literature (Landis et al. 1994; Cervero and Duncan 2002a, 2002b) points to the variability of transport accessibility and land value over space: in hedonic modelling this has been met either by applying hedonic price models to submarkets or to different types of properties as in Adair et al. (2000). However, these approaches require the land area to be subdivided using some arbitrary ‘rule’ to give boundaries for the separate hedonic models.
The interpretation of hedonic-based analyses can be problematic: issues over which variables should be included in the model specification and in interpretation, particularly the best way to choose between competing models on the basis of model fit when models may include different variables and have different functional forms. Additional issues for hedonic price models are the need to use a functional form that satisfies the assumptions of multiple regression (Forrest and Glen 1995; Weinberger 2001) which may not give rise to easy interpretation. Perhaps more importantly, hedonic models in the presence of spatial autocorrelation and/or spatial heterogeneity (or spatial non-stationarity) will have parts of their unexplained variance caused by interdependence between observations as a result of their relative location in space. Unless the models can be adjusted for these effects then, using the terminology of Anselin (1999), spatial dependence (where the dependent variable is associated with a lagged effect) gives rise to biased estimated coefficients and spatial error dependence (where the error term follows a spatial autoregressive process) means that although the estimated coefficients remain unbiased they are inefficient (Rodriguez and Targa 2004). Spatial non-stationarity is more difficult to address without the use of spatial models.

World Symposium on Transport and Land Use Research, Whistler Canada, 28-30 July 2011
4
Spatial models which recognise directly this variability have become more accessible in recent times through improvements in computing power and available software and this has given rise to an increase in the use of local models. This study is a demonstration of recognising the spatial variability of land values directly in its use of Geographically Weighted Regression (GWR) which estimates a hedonic model as the global model which is then extended to produce a local model at each point of the data. The methodology of this modelling technique is discussed next, together with alternative spatial modelling approaches to justify the use in this study of the GWR approach.
3. METHODOLOGY As identified above many studies have used a hedonic modelling approach, essentially a traditional multiple regression model formulation, to examine the effect of transport infrastructure on land value. This approach effectively standardises for the internal qualities of the property so that the effect of accessibility on house price can be derived. In contrast, this study uses a local model approach in which first a global model is calibrated which is equivalent to a hedonic model but then a second stage develops the more disaggregate local model estimates. This section looks in more detail at the reasons for the use of the GWR approach and outlines the methodology of GWR.
In traditional multiple regression it is assumed that the relationship to be modelled holds everywhere in the study area. However, this is often violated in the analysis of house prices due to the presence of spatial effects which can be seen by mapping the residuals of the multiple regression when distinct spatial patterns can be identified. Spatial effects may occur in two different forms as discussed above: one is concerned with spatial dependency, or its weaker expression, spatial autocorrelation (they are not identical though they are often used interchangeably in the literature) and the other form is spatial heterogeneity, namely spatial non-stationarity (Anselin 1999). Spatial autocorrelation can be seen as spatial interaction whilst spatial heterogeneity (spatial non-stationarity) refers to spatial structure (Anselin 1999). Spatial dependency and spatial non-stationarity have been the major challenges in spatial data analysis (Fotheringham et al. 2002). Indeed, as a local spatial modelling technique, GWR not only tackles spatial non-stationarity by accounting for coordinates in parameter estimates, but also can deal with spatial dependency by taking into account of geographical location in intercepts. With the allowance of spatial non-stationarity in the regression parameters, GWR local models can improve global models by accounting for some or even a large part of spatial autocorrelation in error terms. Although not widely used in transport studies, GWR has been identified as providing more rigorous analysis of change over other spatial analytical tools if its significant data demands can be met.
Moving away from hedonic price models to models that more directly account for spatial relationships between variables opens up a number of possibilities, each with their associated merits in comparison to the GWR methodology. In contrast to the GWR approach, spatial lag models extend the autoregressive models typically used in time series modelling. In these, spatial relationships are taken into account by the use of a lagged dependent variable but its computation is more difficult but can be undertaken with maximum likelihood or instrumental variables estimation. However, the estimation gives results which, unlike GWR, cannot be easily related to geographical space. Spatial error models are another alternative which, in contrast to a spatial lag approach, assume that it is the error term itself which can be defined to capture spatial correlations in the model. Spatial lag models are typically estimated using maximum likelihood techniques but, as with spatial lag models, the estimates from these models are not easily related to geographical space. As this study is focussing on indentifying variability and not just taking spatial relationships into account in the modelling process, GWR is identified as a superior methodology.
The modelling approach of this paper is discussed in the next section, starting with the global model and moving then to the local model, with the following section describing how the significant data collection requirements of GWR are met.
3.1 Global regression model “Location, location and location” is the mantra of the estate agency industry and this suggests that house prices are determined not only by internal factors, such as the quality of the house itself, but also external factors which are highly related to location such as accessibility and environment. This study has defined a global model in which house prices are effectively standardised for internal factors and environmental factors so that the relevance of accessibility and location can be determined. This is equivalent to studies using a hedonic modelling approach.
The model used thus relates the dependent variable of house price to a group of variables, as follows:
Pi = f (C, T, N) (1) where C is a vector of characteristics of properties (whether it is a flat, terraced, semi-detached or detached) and the number of bedrooms; T is a vector of transport accessibility, measured as travel time to employment opportunities using an accessibility measure by public transport (based on
World Symposium on Transport and Land Use Research, Whistler Canada, 28-30 July 2011
5
timetables) and travel time to the city centre (Haymarket) by car (using an algorithm of minimum path build) assuming that the network of roads was half way between the congested peak hour and free flow levels and N is a vector of the neighbourhood environment effects captured by income (measured by the percentage of higher professional occupations and the percentage of long term unemployment, the ethnic characteristics of the area (measured by the percentage of ethnic minority) as well as the accessibility to schools which has been identified as one of the key factors to determine the location of houses in Tyne and Wear (TRRL 1984). The accessibility to schools was controlled by the average point score of the nearest primary school which was calculated by allocating points to each pupil's exam results in nationally-based statutory tests and dividing this total by the number of eligible pupils in each subject (DfES 2004). Accessibility data for public transport and car journeys was provided by local government partners from modelling undertaken to fulfil their statutory commitments to provide a Local Transport Plan. The accessibility data was an output from the Tyne and Wear Transport Accessibility Model which was being developed at the time of this study and its methodology, following the requirements of the UK central government, were outside the control of the study.
The data requirements of the modelling are constrained by the need to provide disaggregate data for the local model. Thus, census data are collected at the census output area level which is the smallest unit of Census geography and covered between 100-125 households in the UK 2001 Census.
The global model estimated was:
Ln Pi = α0 + α1BEDROOMi + α2FLATBEDi + α3SEMIBEDi + α4DETABEDi + α5SP_AVEi
+ α6%ETHNMi + α7%HPROFi + α8%UNEMi + α9CAR_ACCi + α10PT_ACCi (2) where
Ln Pi is the natural logarithm of Pi where Pi is the asking price in pounds sterling;
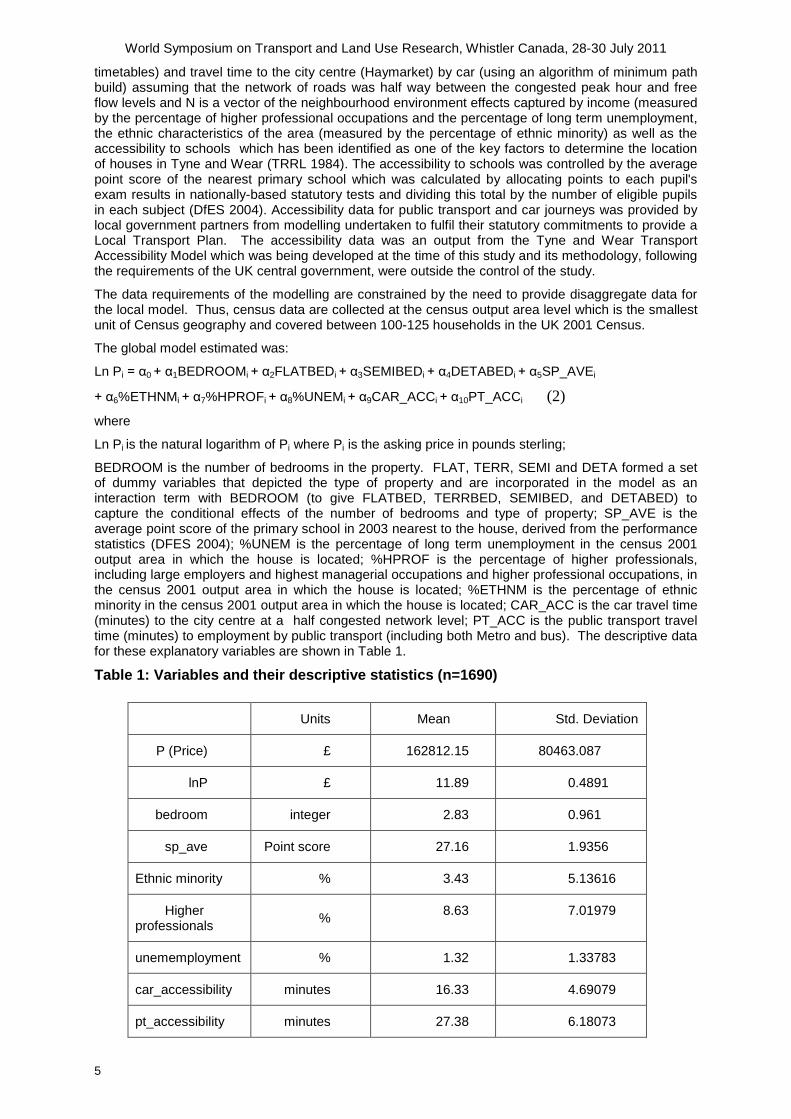
BEDROOM is the number of bedrooms in the property. FLAT, TERR, SEMI and DETA formed a set of dummy variables that depicted the type of property and are incorporated in the model as an interaction term with BEDROOM (to give FLATBED, TERRBED, SEMIBED, and DETABED) to capture the conditional effects of the number of bedrooms and type of property; SP_AVE is the average point score of the primary school in 2003 nearest to the house, derived from the performance statistics (DFES 2004); %UNEM is the percentage of long term unemployment in the census 2001 output area in which the house is located; %HPROF is the percentage of higher professionals, including large employers and highest managerial occupations and higher professional occupations, in the census 2001 output area in which the house is located; %ETHNM is the percentage of ethnic minority in the census 2001 output area in which the house is located; CAR_ACC is the car travel time (minutes) to the city centre at a half congested network level; PT_ACC is the public transport travel time (minutes) to employment by public transport (including both Metro and bus). The descriptive data for these explanatory variables are shown in Table 1.
Table 1: Variables and their descriptive statistics (n=1690)
Units Mean Std. Deviation
P (Price) £ 162812.15 80463.087
lnP £ 11.89 0.4891
bedroom integer 2.83 0.961
sp_ave Point score 27.16 1.9356
Ethnic minority % 3.43 5.13616
Higher professionals % 8.63 7.01979
unememployment % 1.32 1.33783
car_accessibility minutes 16.33 4.69079
pt_accessibility minutes 27.38 6.18073

World Symposium on Transport and Land Use Research, Whistler Canada, 28-30 July 2011
6
3.2 The local model of Geographically Weighted Regression (GWR) Geographically Weighted Regression (GWR) as a technique was developed by Fotheringham et al. (2002). It extends the traditional cross-sectional regression model which can be written as
εββ ik ikki XY ++= ∑0 (3)
to a model in which local variations in the parameter values can be estimated by taking into account the coordinates of the variable. If the dependent variable has coordinates (ui,vi), the model expressed in (3) above can be rewritten as:
εββ ik ikkiiiii XvuvuvuY ii ++= ∑ )()()(0
(4)
This can be then fitted using a weighted least squares method to give an estimate of the parameters at the location (ui, vi) and a predicted value of y where the weights are chosen so that observations near the point in space where the parameter estimates are chosen, (ui, vi), have more influence on the result than observations further away. By this geographically weighted calibration, estimates of the parameters can be made for each data point with coordinates, which then can be mapped. This unique advantage of GWR over some other spatial methods is that each observation is treated as an individual observation at a specific geographic point as opposed to an observation lying within an artificially bounded geographical area (for example within a particular political boundary) as required by other methodologies used in spatial analysis such as multi-level modelling.
Estimation is a trade-off between efficiency and bias in the estimators. The weighting process is undertaken by the use of spatial kernels which capture the data points to be regressed by moving the regression point across the region. The weight is measured through the bandwidth against the distance from data point j to regression point i. Regression results are very sensitive to the choice of bandwidth and the GWR software allows the choice of adaptive spatial kernels to be used so that the bandwidth is narrow when data are dense but that the bandwidth is allowed to spread where data are sparse. The Akaike Information Criterion (AIC) (Akaike 1973) is used as the measure for evaluating the explanation given by GWR models as, in addition to measuring goodness of fit, it takes the complexity of the model into account. A rule of thumb is if the AIC of two models differ by more than 3 then they are statistically significantly different with the lower AIC suggesting a better fit (Fotheringham et al 2002). If adaptive kernels are used in the estimation process, the GWR software chooses bandwidths so as to minimise AIC. This is explained in more detail in Fotheringham et al (2002).
In practical terms, collecting sufficient disaggregate data is the most critical aspect of applying this spatial technique. Data acquisition issues are discussed in the next section.
4. DATA ACQUISITION The Tyne and Wear Metro is the focus of the case study. Tyne and Wear is a conurbation in the north-east of England, UK. In public transport terms, the area is served by a light rail system, Metro, opening in 1980 on the route of a heavy rail system with some new tunnel links.
Figure 1: Map of Tyne and Wear Metro
Source: based on Tyne and Wear Accessibility Modelling and Edina Digimap

World Symposium on Transport and Land Use Research, Whistler Canada, 28-30 July 2011
7
Only part of the area is covered by Metro (see Figure 1 above) and the rest of the area is served by bus. Metro was extended in 2002 to Sunderland in the south east of the area but this area is not included in this study. For private transport, the area benefits from good arterial road access as shown in Figure 1. Car ownership is low for the UK with low average numbers of cars per household as compared to England as a whole (TWWP (2005)), and congestion on these roads is low, even at peak times.
This study required property price data, socio-economic data and importantly, good quality transport accessibility data. Many data sources were explored before making the decision on data sources for the study.
4.1 Property data Land value is examined in the form of house prices in this study. The house price is the value of the land together with the property which is built on it. This study uses residential property prices but standardises for the features which have improved the land to identify the underlying land value.
Transaction property price data are normally considered as the ideal data for property related analysis on the grounds that these prices are the agreed and accepted prices by the market. Transaction data with sufficient information about the internal features of the property are unavailable in England due to confidentiality. As asking prices are available, these form the basis of this study. Asking prices can be considered as expected prices, based on the valuation of experts and whilst these are expected to reflect a market valuation, there may be some unrealistic and extreme cases. Indeed, asking prices may be more appropriate than transaction prices for the purpose of examining the effect of external factors influencing house prices, such as transport accessibility, since these may well be more generalised in terms of external and internal factors as compared to transaction prices which are more likely to vary due to internal factors such as decoration style, garden or parking space. There is of course a high correlation between asking and transaction prices and for the period covered by this study, the transaction house price achieved was, on average, 98.6% of the asking price in the North Region of the UK (Hometrack 2005).
Current property asking prices advertised on the internet were drawn from a website www.icnewcastle.co.uk which provides a service called ‘icproperty’ containing the advertisements of property for sale in Tyne and Wear. The advantages of this source is that it gives sufficient information about the property and the neighbourhood environment at full six digit postcode level (which has an average of 15 properties per postcode) to allow the study to add demographic and social-economic factors to each property from the Census.
This data was collected at the six digit postcode level for one day in May 2005 and, in total, provided nearly 1700 properties for the Districts of Newcastle City, Gateshead, North Tyneside and South Tyneside within Tyne and Wear. The main advantages of using asking prices from the internet has been the easy access to considerable data which includes information on internal features as well as giving a sample originating from a number of major estate agencies in Tyne and Wear area rather than relying on a single property agency. A separate investigation revealed about 95% of all properties from the relevant estate agencies were provided to the ‘icproperty’ website identifying that the majority of properties for sale are captured by this data collection process. A rather unique feature of the UK property market should also be noted at this stage: the internal space, in terms of square area, is rarely used as part of a market valuation and indeed is not recorded even in transaction price data. In urban areas the conventional wisdom is that the availability of gardens etc do not add so much to the house price but to the speed in which a property sells. However, an obvious disadvantage of this data source was that a great deal of manual work was involved in the collection of data both in its downloading and formatting. In addition the age of the property was unavailable although information about the type (whether it is detached, semi-detached, terraced or a flat) was available and, in the context of Tyne and Wear, provides a good proxy for age.
4.2 Transport accessibility The literature described in the first section identifies the accessibility of a location, determined mainly by the transport system and land use pattern, as an important element of the external factors that influence house prices and this therefore makes a discussion of the transport accessibility central to this study. The term “accessibility” has been debated in the transport planning literature for some time. In this study, accessibility is used to refer to the ease with which the land use and transportation systems enable individuals to reach activities or destinations (Morris et al. 1979, Handy and Niemeier 1997, Zhu and Liu 2004, Horner and Mefford 2005).
How to measure accessibility has been a significant issue drawing a great deal of attention from both academic and practical viewpoints. Accessibility implies the ease of reaching somewhere, thus travel distance, time or cost between origins and destinations can describe accessibility on the grounds that

World Symposium on Transport and Land Use Research, Whistler Canada, 28-30 July 2011
8
it measures the degree of ease. This is the simplest way to measure accessibility and it is easy to understand. Accessibility is perhaps more rigorously measured by the potential opportunities at destinations involved in activities from a specific origin to a destination because this allows multiple links of a transport network to be included. Using these ideas, accessibility measures can be subdivided into three main forms (DfT 2004). Infrastructure-based measures measure travel speeds by different modes, operating costs and congestion levels. These are theoretically weak because they only reflect the level of throughput on the infrastructure and take no explicit account of the land use component. Gravity based measures are an improvement over these infrastructure-based measures because they attempt to reflect travel behaviour realities through the functional form by making the potential attractiveness an inverse function of the distance between origin and destination. Utility based measures reflect individual preferences and are based on the individual’s actual choice set. Grounded in microeconomic theory, whereby an individual makes his or her travel choice by maximising his or her utility (Handy and Niemeier 1997), utility based accessibility measures are normally derived using discrete choice modelling which has a long tradition of application in the transport domain.
The specification of a measure for accessibility is critical. This is especially so when moving to the use of a lower level of data aggregation as with GWR. Travel time to activities has been found significant in house location choice for all types of household (Zondag and Pieters 2005). In terms of the relationship between transport accessibility and land use, the jobs-housing concept has long been the centre of transport and land use studies (Ma and Banister 2005). As a result, employment is now considered as the most likely single destination type for an accessibility measure on the grounds that commuting is probably the most regular form of travel (Horner and Mefford 2005). Whilst utility based measures are theoretically appealing because of their grounding in behavioural theory and welfare economics, they still have some theoretical shortcomings. For example the assumption of defining utility as linear with respect to income and the intrinsic travel bias does not explain non-travellers or the behaviour of an individual who ‘trip chains’.
Accessibility values were provided by the local government partner, calibrated to one minute intervals for this study, which provided the level of disaggregation required. Car accessibility was calculated using the highway speed (between a fully congested network and a free flow network) using an algorithm of minimum path build to give travel times for journey times to the city centre of Newcastle as the place with the greatest concentration of employment. Public transport accessibility was calculated using a gravity based Hansen method, using timetabled times, to all employment opportunities, weighted by the distance to the origin, as reflecting the most frequent destination type.. Whilst these measures did take account of the location of the stops and stations, no additional weight was given to houses located close to stations or stops although the literature does identify that perceived or actual closeness to stations may increase house prices more (Adair et al 2000, Hess and Almeida 2007).
4.3 Social economic data Social economic data, including data on income and ethnic group, were derived from the 2001 UK census at the level of Output Areas (OAs) which were created, as far as possible, by grouping together six digit postcodes to give better integration between the geographical information referenced by census and postcode geographies. On average, OAs contain between 200-400 people (between 120 and 150 households) and there are approximately 3,714 OAs in Tyne and Wear. As the property data was obtained at six digit postcode level, each property was mapped at the centroid of the six digit postcode unit and then social economic data was allocated to each property by GIS.
5. ANALYSIS This research concentrates on the labour market provided by Newcastle city centre and therefore on the impacts of the original and major phase of the Tyne and Wear Metro.. The results are shown below in two stages. The first part shows the results from the global regression analysis, showing parameter estimates and the associated t-statistics: this global result is the equivalent of a hedonic price model and gives average results for the area without any variability over space. The second part shows the local results, together with appropriate diagnostic information, mapped using GIS so that the spatial variation can be seen clearly: this is the added value provided by the use of GWR in this analysis.
5.1 The results from Global regression model The diagnostic information suggests that 38% of the variation in the dependent variable is explained by this global model (adjusted R2) which is a reasonable fit given the cross-section nature of the data. The dependent variable is the natural logarithm of house price and Table 2 gives the independent variables, as described above in equation 2, the parameter estimate, and the significance (p-value).

World Symposium on Transport and Land Use Research, Whistler Canada, 28-30 July 2011
9
The dependent variable was transformed to natural logarithms to ensure the normal probability plot of the residuals followed a straight line.
Table 2: Results of global regression parameters
Parameter Estimate Significance (p-value)
Intercept 11.965 0.000
beds -0.074 0.000
flatbed 0.070 0.000
semibed 0.082 0.000
detabed 0.092 0.000
sp_ave -0.009 0.085
ethnm 0.001 0.685
hprof 0.029 0.000
unem -0.074 0.000
car_acc 0.021 0.000
PT_ACC -0.012 0.003
As this is a semi-log functional form, the interpretation of the estimated coefficients relates to their proportional (or when multiplied by 100, the percentage) effect on Price. For the internal factors of the property, it can be seen that there is significant interaction between the size of the property, measured by the number of bedrooms, and the property type as well as a significant estimated coefficient for the number of bedrooms. The interpretation of these interaction terms is that, within a given property type there is a differential impact of the number of bedrooms on the price of property and moreover, this differential impact declines when moving from detached houses to the higher density flat type. To understand the impact of an additional bedroom, the estimated parameter for BEDS needs to be taken into account and thus the global regression suggests that, ceteris paribus, an additional bedroom in a detached house will lead to 1.8% (-0.074 + 0.092 = 0.018) increase in price.
With respect to the socio-economic factors, the percentage of ethnic minority residents and the percentage unemployed (ETHNM and UNEM respectively) might be expected to vary with property value but only the percentage unemployed was significant in the global regression with an increase in 1% in unemployed, ceteris paribus, leading to a 7% decrease in property price. Having a higher percentage of professional residents (HPROF) and having a better school nearby would be expected to lift property value and whilst this is the case for HPROF (adding nearly 3% to property price), the school variable (SP_AVE) is not significantly different from zero. However, the factors of high professional residents and levels of unemployment, reflecting income of residents do, as expected, significantly contribute positively and negatively to property value respectively.
In terms of car and public transport accessibility, greater travel time implies worse accessibility and vice versa. If accessibility improves then, everything else being held constant would suggest that the estimated parameters should be negative as one more minute of car/public transport travel time (implying less good accessibility) is expected to lead to lower property prices. Both estimated parameters are significant and the estimate for the public transport parameter PT_ACC is negative albeit with a small absolute value of 1%. At the mean, a one minute saving in public transport travel time equates to approximately 3% saving from the average time (see Table 1) and generates a house price premium of approximately £1600 (1% of the mean price, see Table 1) For the car variable, CAR_ACC, the estimated parameter is significant but positive suggesting that longer travel times to the to city centre have higher property prices. In general this applies to houses located further away from the city centre and this is evidence of the general trend of suburbanisation in the UK and which is so noticeable in the Tyne and Wear area. It should be noted that, whilst this global regression used
World Symposium on Transport and Land Use Research, Whistler Canada, 28-30 July 2011
10
car accessibility times based on a road network between congested and free flow, the modelling was not sensitive to whether this accessibility or one based on the full or free flow network was used.
The next section considers the effect of geography, as identified by the local GWR model.
5.2 Local model: the GWR estimation One of the advantages of GWR model is the ability to examine the spatial variability of independent variables included as explanatory variables. Some independent variables therefore might be non-significant in the global regression model but might vary significantly over the geographical area and be revealed as significant local parameters by the GWR modelling. It is expected that mapping the estimated parameters for public transport accessibility to employment, using the results of the local estimates from GWR, will show these distributed in accordance with public transport facilities, such as bus stops and Metro stations, and the estimated parameters for car accessibility to city centre are expected to show a relationship with good road access, such as arterial roads.
The GWR software provides diagnostic information to assess whether the local model is an improvement over the global model described above. In this analysis, the local model benefits from a higher adjusted coefficient of determination (adjusted R2) from 0.328 to 0..467 and a lower AIC (from 1721 down to 1392) suggesting that the GWR local model gives a significantly better explanation, after taking the degrees of freedom and complexity into account.
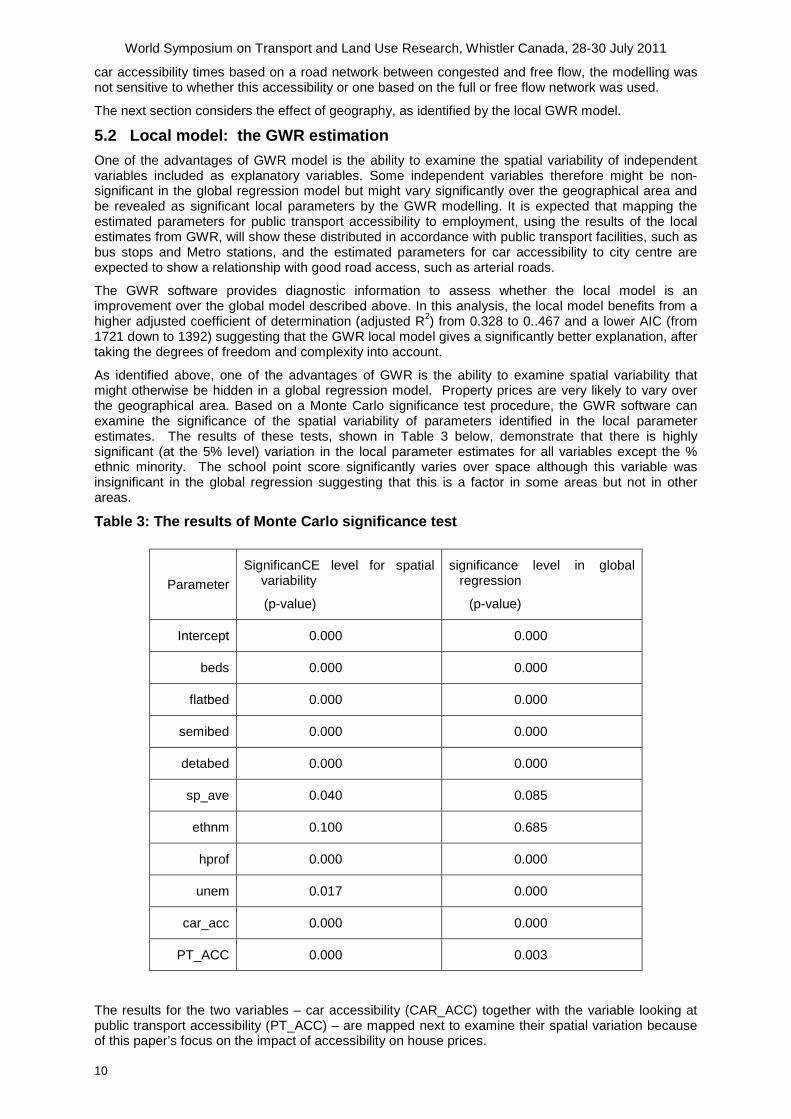
As identified above, one of the advantages of GWR is the ability to examine spatial variability that might otherwise be hidden in a global regression model. Property prices are very likely to vary over the geographical area. Based on a Monte Carlo significance test procedure, the GWR software can examine the significance of the spatial variability of parameters identified in the local parameter estimates. The results of these tests, shown in Table 3 below, demonstrate that there is highly significant (at the 5% level) variation in the local parameter estimates for all variables except the % ethnic minority. The school point score significantly varies over space although this variable was insignificant in the global regression suggesting that this is a factor in some areas but not in other areas.
Table 3: The results of Monte Carlo significance test
Parameter SignificanCE level for spatial
variability
(p-value)
significance level in global regression
(p-value)
Intercept 0.000 0.000
beds 0.000 0.000
flatbed 0.000 0.000
semibed 0.000 0.000
detabed 0.000 0.000
sp_ave 0.040 0.085
ethnm 0.100 0.685
hprof 0.000 0.000
unem 0.017 0.000
car_acc 0.000 0.000
PT_ACC 0.000 0.003
The results for the two variables – car accessibility (CAR_ACC) together with the variable looking at public transport accessibility (PT_ACC) – are mapped next to examine their spatial variation because of this paper’s focus on the impact of accessibility on house prices.

World Symposium on Transport and Land Use Research, Whistler Canada, 28-30 July 2011
11
In Figures 2 and 3, the background shading refers to the significance of the local parameter estimates which are shown as different coloured points. Areas shaded grey contain local parameters which are statistically significant with dark grey areas referring to t-values of less than -2 and light grey areas referring to t-values greater than +2. The values of the local parameters have been coloured so positive values are shades of red whilst negative values are shades of green. It is clear from the maps that the parameters demonstrate considerable spatial variation.
Figure 2: Map of the local parameter estimates associated with public transport
accessibility (variable PT_ACC)
Figure 2 shows that there is clear variation in the local parameter estimates for the variable PT_ACC over different areas. Everything else being equal, it is expected that quicker access by public transport (thus a decrease in time of access) will lead to an increase in house price suggesting there should be a negative relationship between public transport travel time and property price. In Figure 2, there is a large area of significant and negative local parameters which covers the majority of the Newcastle upon Tyne District, overlaps into the Gateshead District in the south and includes the central and most westerly parts of the Metro system. Using known information about Tyne and Wear, within this area, the effect is stronger in the poorer areas where savings in public transport accessibility of one minute give a bigger percentage change to house prices (up to 6% as compared to the global average of 1.2%, shown in Table 2). This reflects the way in which public transport accessibility is likely to be more important to households with lower incomes, especially as car ownership is relatively low in Tyne and Wear. Figure 2 shows also that within this area there is a strong cluster of significant negative local parameters around the metro link going north and west. These areas are regarded as a wealthier and include inner suburbs that have been gentrified. Although a less strong effect, Figure 2 shows that the house price premiums associated with these locations are equal or greater (between 1-2%) to that identified by the global regression.
Similarly, Figure 3 exhibits clear variation in the local parameter estimates for the variable CAR_ACC over the different areas, being positive in most areas, and negative in some. The geographic central core shows significant negative local parameters although the absolute values are close to zero, suggesting that accessibility by car does not add premium to house prices here. However, the

World Symposium on Transport and Land Use Research, Whistler Canada, 28-30 July 2011
12
location of these properties are such that need to travel by car to the centre is low, if nonexistent. This core is surrounded by an area of insignificant local parameters. On the outer area is a large area of significant positive local parameters. Positive parameters suggest that an extra minute of car travel time adds to house prices. These areas with positive relationships between car travel time to city centre and property price are hypothesised to have other, stronger neighbourhood features with specific amenities, such as the seaside (in the east), countryside (in the north and west) or being close to a major shopping centre (in the north part of Gateshead District). In the east in particular, it can be seen that there is a concentration of positive local parameters suggesting one additional minute travel time by car increases house prices by more than 7%, as compared to the average of 2% identified by the global regression. The results suggest that occupants of properties in these locations are prepared, ceteris paribus, to pay for suburban living with additional minutes travelling by car.
Figure 3: Map of the local parameter estimates associated with the car accessibility
(variable CAR_ACC)
The way in which house prices vary over geographical space could be mapped for each of the independent variables identified in the model, as reported in Table 3, giving a set of maps which together would give a fuller picture of the drivers of house price over geographical space. Indeed, whilst more difficult to present in two dimensional space, the building of a multi-layered map may be an alternative to simply considering a number of maps side by side.
As a way of modelling data with a spatial content, GWR provides an elegant way of estimation with outcomes that can be interpreted over geographical space. However, the literature identifies a significant theoretical issue arising from the additional complexities of the GWR estimation, potentially giving rise to multicollinearity or interrelationships among the local estimates even when there are no such relationships at the global model level. Checks for linear dependency at the global level were carried by an examination of the correlation matrix and with regard to the stability of the parameter estimates and the associated standard errors. At the local level, checks for multicollinearity followed Wheeler and Teifelsdorf (2005) who propose a number of different tests for identifying the presence of multicollinearity: this work has followed two of these tests which follow directly from GWR output

World Symposium on Transport and Land Use Research, Whistler Canada, 28-30 July 2011
13
(scatter plots between the local parameter estimates, supplemented by histograms of local parameter correlations) with little evidence of multicollinearity in this dataset.
As in all analysis, missing variables will lead to model specification problems. In this analysis, improvements in the model specification need to be considered in the context of the results discussed above. One category of missing variables is those variables which might better distinguish a property’s internal factors, for example the number of bathrooms or the existence of a garage. As these were unavailable, their absence is likely to have resulted in a depressed R2. A second category of missing variables such as proximity to amenities, proximity to stations, parking availability, crime, and other social factors, also create limitations in terms of model specification. But being able to better standardise the internal features of a property which might allow variations in transport accessibility to become more visible is only partly a data availability issue but also an issue of model calibration. Although adding variables to the model tends to improve the adjusted R2 there is always a risk of over fitting the regression model which would add noise to the calibration and actually reduce the reliability of the model.
6. CONCLUSION In conclusion, a global regression model – as a hedonic model – offers the basis for explaining variation in property prices on an average basis, but gives no indication of spatial variability. Based on the results from the global regression model, property prices are mainly determined by the internal property factors and socio-economic classification of the property location. But the additional information from the results from the local model using GWR clearly reveal a spatially varying relationship between property prices and the variables included in the model. The maps of this paper show public transport accessibility does affect property prices particularly in relatively poor neighbourhoods. This suggests that providing light rail infrastructure as part of a network can have a positive distributional effect. In general, properties further away from city centre tend to be larger and in lower density areas as well as more expensive as a result of the suburbanisation in Tyne and Wear (as in the rest of the UK) in the recent decades. Equally interesting is the effect of gentrification where the local GWR model shows that property value is increased by proximity to the city centre.
The analysis was motivated by a desire to provide empirical evidence for uplift in land value following the provision of new transport infrastructure which offered benefits in terms of enhanced accessibility. Evidence of this nature is a pre-requisite to underpin any new policy of land value capture. The evidence from this study shows, at the very least, that accessibility varies over space, having a positive effect on land value in some areas but in others a negative or zero effect. Although neighbourhood features may help to explain such variation, the implementation of a uniform land value capture policy would necessarily give rise to winners and losers and needs to be very carefully considered if it is not to turn out to be regressive. However, a better understanding of winners and losers may allow such a land value capture policy to be introduced as a more progressive tax if ‘winners’ are in the relatively poor areas and the ‘losers’ are in areas where other external factors, such as the seaside, have a stronger effect. Indeed the results demonstrate a clear need to undertake analysis at a more disaggregate level and in a way that allows variation over space to be apparent.
7. ACKNOWLEDGEMENTS The authors would like to acknowledge the support from Trevor Arkless at Newcastle City Council on behalf of Tyne and Wear Plan Partnership for his assistance with the acquisition of transport accessibility data. In the same vein, Michael Tanner from the Department of Transport, NSW, provided significant GIS help. They also acknowledge the funding support from Newcastle University, School of Civil Engineering and Geosciences of Newcastle University, Rees Jeffreys Road Fund, RICS Education Trust and The Henry Lester Trust Ltd.

World Symposium on Transport and Land Use Research, Whistler Canada, 28-30 July 2011
14
8. REFERENCES Adair, A., McGreal, S., Smyth, A., Cooper, J. and Ryley, T. (2000) House Prices and Accessibility: The Testing of Relationships within the Belfast Urban Area, Housing Studies, 15, 699-716.
Akaike, H. (1973) Information Theory and an Extension of the Maximum Likelihood Principal, in Geographically Weighted Regression: the analysis of spatially varying relationships, (Ed, Charlton, M.) John Wiley and Sons, West Sussex.
Anselin, L. (1999) Spatial Econometrics, School of Social Sciences, University of Texas at Dallas.
Armstrong, R. (1994) Impacts of Commuter Rail Service as Reflected in Single-Family Residential Property Values, Journal of Transportation Research Record, 15, 88-98.
Cervero, R. (1998) The Transit Metropolis: A Global Inquiry, Island Press, Washington D. C.
Cervero, R. and Duncan, M. (2001) Transit's Value-Added: Effects of Light and Commuter Rail Services on Commercial Land Values, in 81st TRB Annual Meeting, Transportation Research Board, Washington D.C.
Cervero, R. and Duncan, M. (2002a) Land Value Impacts of Rail Transit Services in Los Angeles County, National Association of Realtors; Urban Land Institute.
Cervero, R. and Duncan, M. (2002b) Land Value Impacts of Rail Transit Services in San Diego County, National Association of Realtors; Urban Land Institute.
Cervero, R. and Landis, J. (1993) Assessing the Impacts of Urban Rail Transit on Local Real Estate Markets Using Quasi-Experimental Comparisons, Transportation Research Part A: Policy and Practice, 27, 13-22.
Chesterton (2002) Second Property Market Activity Final Report, Jubilee Line Extension Impact Study Unit, University of Westminster.
Debrezion, G. Pels, E. and Rietveld, P. (2007) The Impact of Railway Stations on Residential and Commercial Property Value: A Meta-analysis J Real Estate Finance and Economics 35, 161–180.
Des Rosiers, F., Theriault, M., Voisin, M. and Dube, J. (2010) Does an improved urban bus service affect house values? International Journal of Sustainable Transportation 4 (6), 321-346.
DfES (2004) Performance Tables 2003: Key Stage 2 Test Results, Department for Education and Skills.
DfT (2004) Technical Guidance on Accessibility Planning in Local Transport Plans, in Guidance on accessibility planning in local transport plans, Department for Transport, UK.
Du, H. and Mulley, C. (2007) The Short-Term Land Value Impacts Of Urban Rail Transit: Quantitative Evidence from Sunderland, UK. Land Use Policy 24(1), 223-233.
Forrest, D. and Glen, J. (1995) The Impact of a Light Rail System on the Structure of House Prices, Journal of Transport Economics and Policy, 30, 15-29.
Fotheringham, A.S., Brunsdon, C. and Charlton, M.E. (2002) Geographically Weighted Regression: The Analysis of Spatially Varying Relationships, Chichester: Wiley.
GVA Grimley (2004) Developing a methodology to capture land value uplift around transport facilities. Report for the Scottish Executive,
Hack, J. (2002) The Role of Transit Investment in Urban Regeneration and Spatial Development: A Review of Research and Current Practice, in CIP(Canada) Annual conference.
Haider, M. and. Miller, E.J. (2000) Effects of Transportation Infrastructure and Locational Elements on Residential Real Estate Values: Application of Spatial Autoregressive Techniques, Transportation Research Record, No. 1722, pp 1-8.
Hall, P. and Hass-Klau, C. (1985) Can Rail Save the City? - The Impacts of Rail Rapid Transit and Pedestrianisation on British and German Cities, Gower Publishing Company Ltd.
Handy, S.L. and Niemeier, D.A. (1997) Measuring Accessibility: An Exploration of Issues and Alternatives, Environment and Planning A, 29, 1175-1194.
Hess, B.D. and Almeida, T.M. (2007) Impact of Proximity to Light Rail Rapid Transit on Station-area Property Values in Buffalo, New York, Urban Studies, 44, 1041-1067
Hass-Klau, C., Crampton, G. and Benjari, R. (2004) Economic Impact of Light Rail: The Results of 15 Urban Areas in France, Germany, UK and North America, Environmental and Transport Planning, England.

World Symposium on Transport and Land Use Research, Whistler Canada, 28-30 July 2011
15
Henneberry, J. (1998) Transport Investment and House Prices, Journal of Property Valuation and Investment, 16, 144-158.
Horner, M.W. and Mefford, J.N. (2005) GIS-Based Strategies for Measuring Worker Accessibility to Job Opportunities: The Case of Bus Transit, in TRB 84th, Washington D C.
Hometrack (2005) Annual house price survey (UK) (www.hometrack.co.uk )
Knight, R.L. (1980) The Impact of Rail Transit on Land Use: Evidence and a Change of Perspective, Transportation, 9, 3-16.
Laakso, S. (1992) Public Transport Investment and Residential Property Values in Helsinki, Scandinavian Housing & Planning Research, Vol. 9, pp 217-229.
Landis, J., Guhathakurta, S. and Zhang, M. (1994) Capitalization of transit investments into single-family home prices, The University of California Transportation Center.
Lawless, P. and Dabinett, G. (1995) Urban Regeneration And Transport Investment - A Research Agenda, Environment and Planning A, 27, 1029-1048.
Leung, Y., Mei, C.L. and Zhang, W.X. (2000) Statistical Tests for Spatial Nonstationarity Based on the Geographically Weighted Regression Model, Environment and Planning A, 32, 9-32.
Ma, K-R., and Banister, D. (2006) Extended excess commuting: a measure of the jobs-housing imbalance in Seoul. Urban Studies, 43(11): 2099-2113.
McMillen, D. and McDonald, J. (2004) Reaction of house prices to a new rapid transit line: Chicago, Real Estate Economics 32 (3), 463-6.
Morris, J.M., Dumble, P. and Wigan, M. (1979) Accessibility Indicators for Transport Planning, Transportation Research Part A, 13 (2), 91-109.
Munoz-Raskin, R. (2009) Walking accessibility to bus rapid transit: does it affect property values? The case of Bogota, Colombia, Transport Policy, 17 (2), 72-84.
Pasha, H.A. (1995) Comparative Statics Analysis of Urban Land Values in the Presence of Government Regulation, Urban Studies, 32, 1505 -1516.
Pickett, M.W. and Perrett, K. (1984) The Effect of the Tyne and Wear Metro on Residential Property Values, SR 825, TRRL, 29.
RICS (2002) Land Value and Public Transport Stage 1 – Summary of Findings, RICS Policy Unit, Royal Institute of Chartered Surveyors. www.rics.org
RICS (2004) Land Value and Public Transport Stage 2 - Summary of Findings, RICS Policy Unit, Royal Institute of Chartered Surveyors. www.rics.org
Riley, D. (2001) Taken for a Ride, the Centre for Land Policy Studies, London.
Rodriguez, D. and Targa, F. (2004) Value of accessibility to Bogota’s Bus Rapid Transit System, Transport Reviews 24 (5), 586-610.
Smith, J. and Gihring, T. (2006) Financing transit systems through value capture: an annotated bibliography, American Journal of Economics and Sociology 65 (3), 751-786. Updated as Smith and Gihring with Litman (2009).
Smith, J. and Gihring, T. with Litman, T. (2009) Financing Transit Systems through Value Capture: An Annotated Bibliography, Victoria Transport Policy Institute. www.vtpi.org .
So, H.M, Tse, R. and Ganesan, S. (1997) Estimating the Influence of Transport on House Prices: Evidence from Hong Kong, Journal of Property Valuation and Investment, 15, 40-47.
Thomas, M. and Copley, G. (2002), Croydon Tramlink Impact Study - Summary Report, DfT.
Tobler, W. (1970) A Computer Movie Simulating Urban Growth in the Detroit Region, Economic Geography, 46, 234-240.
TRRL (1984) The Impact of Metro and Public Transport Integration in Tyne and Wear, in Metro monitoring and development study, SR 478, TRRL.
TRRL (1993) The Longer Term Effects of the Tyne and Wear Metro, CR 357, TRRL.
TWWP (2005) Local Transport Plan – Tyne and Wear 2006-2011, Tyne and Wear Plan Partners
Weinberger, R. (2001) Light Rail Proximity: Benefit or Detriment? - the Case of Santa Clara County, California, in TRB 80th Annual Meeting, Washington, D.C.

World Symposium on Transport and Land Use Research, Whistler Canada, 28-30 July 2011
16
Wheeler, D. and Tiefelsdorf, M. (2005) Multicollinearity and correlation among local regression coefficients in geographically weighted regression, Journal of Geographic Systems,7, 161-187
Zhu, X. and Liu, S. (2004) Analysis of the Impact of the MRT System on Accessibility in Singapore Using an Integrated GIS Tool, Journal of Transport Geography, 12, 89-101.
Zondag, B. and Pieters, M. (2005) Influence of Accessibility on Residential Location Choice, in TRB 84th annual meeting, Washington DC.
Copyright © 2022 FDOKUMEN