Local statistical modeling by cluster-weighted
27
arXiv:0911.2634v3 [stat.ME] 15 Jun 2011 Noname manuscript No. (will be inserted by the editor) Local Statistical Modeling via Cluster-Weighted Approach with Elliptical Distributions Salvatore Ingrassia · Simona C. Minotti · Giorgio Vittadini Received: date / Accepted: date Abstract Cluster Weighted Modeling (CWM) is a mixture approach regarding the mod- elisation of the joint probability of data coming from a heterogeneous population. Under Gaussian assumptions, we investigate statistical properties of CWM from both the theoreti- cal and numerical point of view; in particular, we show that CWM includes as special cases mixtures of distributions and mixtures of regressions. Further, we introduce CWM based on Student-t distributions providing more robust fitting for groups of observations with longer than normal tails or atypical observations. Theoretical results are illustrated using some em- pirical studies, considering both real and simulated data. Keywords Cluster-Weighted Modeling, Mixture Models, Model-Based Clustering. Salvatore Ingrassia Dipartimento di Impresa, Culture e Societ` a Universit` a di Catania Corso Italia 55, - Catania (Italy). E-mail: [email protected] Simona C. Minotti Dipartimento di Statistica Universit` a di Milano-Bicocca Via Bicocca degli Arcimboldi 8 - 20126 Milano (Italy). E-mail: [email protected] Giorgio Vittadini Dipartimento di Metodi Quantitativi per l’Economia e le Scienze Aziendali Universit` a di Milano-Bicocca Via Bicocca degli Arcimboldi 8 - 20126 Milano (Italy). E-mail: [email protected]
Transcript of Local statistical modeling by cluster-weighted

arX
iv:0
911.
2634
v3 [
stat
.ME
] 15
Jun
201
1
Noname manuscript No.(will be inserted by the editor)
Local Statistical Modeling via Cluster-Weighted Approachwith Elliptical Distributions
Salvatore Ingrassia · Simona C. Minotti · GiorgioVittadini
Received: date / Accepted: date
Abstract Cluster Weighted Modeling (CWM) is a mixture approach regarding the mod-elisation of the joint probability of data coming from a heterogeneous population. UnderGaussian assumptions, we investigate statistical properties of CWM from both the theoreti-cal and numerical point of view; in particular, we show that CWM includes as special casesmixtures of distributions and mixtures of regressions. Further, we introduce CWM based onStudent-t distributions providing more robust fitting for groups of observations with longerthan normal tails or atypical observations. Theoretical results are illustrated using some em-pirical studies, considering both real and simulated data.
Keywords Cluster-Weighted Modeling, Mixture Models, Model-Based Clustering.
Salvatore IngrassiaDipartimento di Impresa, Culture e SocietaUniversita di CataniaCorso Italia 55, - Catania (Italy). E-mail: [email protected]
Simona C. MinottiDipartimento di StatisticaUniversita di Milano-BicoccaVia Bicocca degli Arcimboldi 8 - 20126 Milano (Italy). E-mail: [email protected]
Giorgio VittadiniDipartimento di Metodi Quantitativi per l’Economia e le Scienze AziendaliUniversita di Milano-BicoccaVia Bicocca degli Arcimboldi 8 - 20126 Milano (Italy). E-mail: [email protected]
010
2030
4050
0 50 100 150 200 250 300
CW
M
X
Y

1111
111
11
111 1 11111
1
11 1
11
1
11
1
11 11
11
11
11
1 11
11
11 1 1
1
11
11 1
1
0 2000 4000 6000 8000
050
010
0015
00
CWM
X
Y
22
2
2
2
2
22
2
2
2
22
2
2
2 2
2
22
2
2
2
22
22
2
2
22
22
22
2
2
2
3
33
3
44
444 44 4 4
4
4 44
44
4
4
4
44
4
44
44444
4
444
4
4
44
44
4
44
44
4
444
4
−15 −10 −5 0 5 10 15
4060
8010
0
CWM
X
Y

510
1520
25
−40 −20 0 20 40 60 80
CW
M
X
Y

010
2030
4050
0 50 100 150 200 250 300
FM
RC
X
Y

010
2030
4050
0 50 100 150 200 250 300
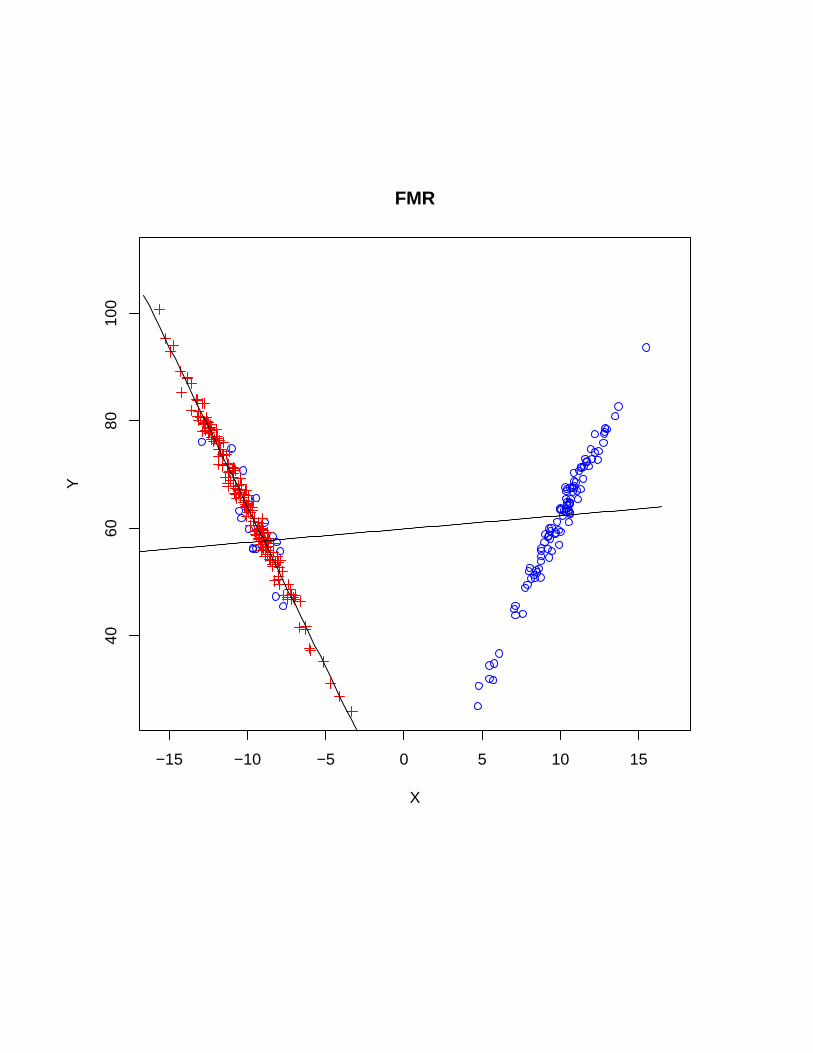
FM
R
X
Y

111 11
1111
111
1
1111 11
111
11 11 11
11
111
111
111 1 11
11
1
11
11
1
111
1111
11
1 11
0 2000 4000 6000 8000
050
010
0015
00
FMR
X
Y
22
222
22
2222 2 22 2
2
2 22
22 222
2222
2
22
2
22
22
22
2 222
22 22
22
2 2
22
3
3
333
3
3
3
3
344
44
4
44
44
4
444
4 44
44
44
−15 −10 −5 0 5 10 15
4060
8010
0
FMR
X
Y

510
1520
25
−40 −20 0 20 40 60 80
FM
R
X
Y

010
2030
−50 0 50 100

010
2030
4050
−50 0 50 100 150 200 250

0 10 20 30 40 50
050
100
150
200
250
300
True distribution
X
Y

5 10 15 20 25
−40
−20
020
4060
80
true distribution
X
Y

||||| || || | ||||||||| | | |||||| ||| |||||| ||||| || ||| | || || |||| |||| || | |||||||| |||||||| ||| ||||| ||| || || || || || |
BD
15 25 35 45 8 12 16 20
610
1418
1525
3545
| |||| ||||| |||||| ||| | ||||||| ||||||| ||||||||| |||| || || ||||||||||| |||||||||||||||| ||| ||||| |||||||||| | || |
CL
| | ||| |||| | |||||| |||| ||||||| ||| |||| ||||| |||| ||| ||| || |||| ||||||| |||| ||| ||||||||||||||||| ||||| || ||| | || |
CW
2030
4050
812
1620
| |||| |||||||||||||| |||||||||||||||||||||||| |||||| || |||||||||||||||||| |||||||||| |||||||||||||||||| || |
FL
6 10 14 18 20 30 40 50 8 10 14
810
14
| |||| | || | ||||| |||||| ||| | ||| ||| | ||| || ||| || || ||| ||| || |||| | |||||| || || || | || |||| || | || | | |||| ||| || || ||| | |||
RW12


−6 −4 −2 0 2 4 6
−20
020
40
−6 −4 −2 0 2 4 6−6 −4 −2 0 2 4 6−6 −4 −2 0 2 4 6


−10 −5 0 5 10
−40
−20
020

510
1520
25
−40 −20 0 20 40 60 80
FM
R
X
Y
−10 0 10 20 30
−50
050
100

−10
010
2030
4050
0 50 100 150 200 250 300

x
Density
02000
40006000
800010000
0e+00 1e−04 2e−04 3e−04 4e−04


−15 −10 −5 0 5 10 15
4060
8010
0
true distribution
X
Y