Ultrasound and Radionuclide Images of Liver
312
IN01$0001-O0f M. Fukuda, H. Bergmann, A. K. Padhy and K. Fukuhisa (Eds) INIS-XA--293 Ultrasound and Radionuclide Images of Liver An IAEA (CRP) Group Study Monograph of liver images used for "Evaluation of imaging Procedures on the diagnosis of liver diseases" (Phase -2) Himalaya c Publishing G House MUMBAI • DELHI • NAGPUR • BANGALORE 32/ 07
-
Upload
khangminh22 -
Category
Documents
-
view
1 -
download
0
Transcript of Ultrasound and Radionuclide Images of Liver

IN01$0001-O0f
M. Fukuda, H. Bergmann, A. K. Padhy and K. Fukuhisa (Eds)
INIS-XA--293
Ultrasound andRadionuclide
Images of LiverAn IAEA (CRP) Group Study
Monograph of liver images used for"Evaluation of imaging Procedureson the diagnosis of liver diseases"
(Phase -2)
Himalaya cPublishingGHouseMUMBAI • DELHI • NAGPUR • BANGALORE
32/ 07

MORIMICHI FUKUDA, M.D.,Department of Diagnostic Ultrasound and Medical Electronics,Sapporo Medical Unversity School of Medicine,Minami 1-jo, Nishi 16-chome, Chuo-ku,Sapporo, Hokkaido,Japan 060
HELMAR BERGMANN, Ph.D.,Institute of Biomedicine Technique and Physics,Vienna University,Hospital AKV Vienna,Vyaehringer Guertel 180-20, ViennaAustria A-1090
AJIT KUMAR PADHY M.D.,Department of Nuclear MedicineAll India Institute of Medical SciencesNew DelhiINDIA-1.10 029
KENJIRO FUKUHISA, Ph.D.,Medical Information Processing,Research Center on Charged Particle Theraphy,Anagawa 4-chome, Inage-ku, Chiba,Japan 263
Copyright © 1996 by theNuclear Medicine SectionDivision of Human HealthInternational Atomic Energy AgencyVienna, Austria
Published by : Mrs. Meena Pandey
for HIMALAYA PUBLISHING HOUSE,"Ramdoot", Dr. Bhalerao Marg, Girgaon,Bombay - 400 004.Phones: 386 01 70 / 386 38 63
Branch Offices :
Delhi : "Pooja Apartments", 4-B, Murari Lai Street,Ansari Road, Darya Ganj,New Delhi -1100 002.Phone: 327 03 92
Nagpur : Kundanlal Chandak Industrial Estate,Ghat Road, Nagpur - 440 018.Phones: 72 12 15/72 12 16.
Laser typeset at : SPECTRUM MEDIA, 3721/5, Netaji Subhash Marg,New Delhi - 2 Phone : 3270060
Printed at : Gayatri Offset Press,Noida(U.P.)

PLEASE BE AWARE THATALL OF THE MISSING PAGES IN THIS DOCUMENT
WERE ORIGINALLY BLANK

Ultrasound andRadionuclide
Images of Liver

GROUP PHOTOGRAPH O F THE PARTICIPANTS

LIST OF PARTICIPANTS, OFFICERS OFIAEA AND JAPANESE SCIENTISTS
Shahana Afroz, M.D.,Institute of Nuclear Medicine,Bangladesh Atomic Energy Commission,IPGMR Campus,Shabagh Avenue, Dhaka, 1000Bangladesh
Zhu Guochong, M.D.,Department of Nucler Medicine,China-Japan Friendship Hospital,Peace St., East Cherry Road, Beijing, 10013People's Republic of China
Soo Kyo Chung, M.D.,Department of Radiology and Nuclear Medicine,St. Mary's Hospital,Catholic University Medical College,505 Banpu-donk, Socho-gu, Seoul,Republic of Korea 137-701
Ee Sin Ang, M.D.,Department of Nuclear Medicine,Singapore General Hospital,Outram Road,Singapore 0319
Hussein Kartamihardja, M.D.,Department of Nuclear Medicine,Dr. Hasan Sadikin Hospital,University of Padjadjaran School of Medicine,Jalan Pasirkaliki No. 192, Bandung,Indonesia 40161

IV • Ultrasound and Radionuclide Images of Liver
Sutee Na Songkhla, M.D.,Section of Nuclear Medicine,Faculty of Medicine Siriraj Hospital,Mahidol University, Bangkok,Thailand 10700
Ajit Kumer Padhy, M.D.,Department of Nuclear Medicine,All India Institute of Medical Sciences,Ansari Nagar, New Delhi,India 110029
Rukhsana Memon, M.D.,Department of Nuclear Medicine,c/o Atomic Energy Medical Center,Jamshoro, Sindh,Pakistan
Orestes Monzon, M.D.,Department of Nuclear Medicine,Philippine Nuclear Research Institute,Don Mariano Marcos Avenue, Diliman,Quezon City,Philippines
Yukio Tateno, M.D.,Division of Clinical Research,Research Center on Charged Particle Therapy,National Institute of R,adioligical Sciences,Anagawa 4-chome, Inage-ku,Chiba 263 Japan
Morimichi Fukuda, M.D.,Department of Diagnostic Ultrasound and Medical Electronics,Sapporo Medical University School of Medicine,Minami 1-jo, Nishi 16-chome, Chuo-ku,Sapporo 060 Japan
Gopinathan Nair, M.D.,Head, Section of Nuclear Medicine,Division of Human Health,IAEAVienna, Austria

List of Participants • V
Helmar Bergmann, Ph.D.,Institute of Biomedical Engineering and Physics,Vienna University,Hospital AKV Vienna,Waehringer Guertel 180-20, Vienna,Austria A-1090
Fumio Shishido, M.D.,Department of Radiology,Fukushima Prefectural College,Hikarigaoka 1-banchi, Fukushima-city,Japan 960-12
Kenjiro Fukuhisa, Ph.D.,Medical Information Processing,Research Center on Charged Particle Therapy,National Institute of Radiological Sciences,Anagawa 4-chome, Inage-ku, ChibaJapan 263

CONTENTS
Page1. Group photograph of Participants ii
2. List of Participants Hi
3. Chapter-1 1IntroductionG. Nair
4. Chapter-2.1 4Liver ScintigraphyY. Tateno
5. Chapter-2.2 10Ultrasonography of the Liver: Anatomy, Procedure, Normal andAbnormal Findings in Diseased StatesM. Fukuda
6. Chapter-3 18Assessment and Evaluation on the Performance of NuclearMedicine and Ultrasound Imaging InstrumentationH. Bergmann & C. Kollmann
7. Chapter-4.1 32Evaluation of the Imaging Procedure for theDiagnosis of the Liver Diseases: Part-1K. Fukuhisa,- Y. Tateno, M. FukudaY. Sasaki, F. Shishido and T. Matsumoto
8. Chapter-4.2 78Evaluation of the Imaging Procedure for theDiagnosis of the Liver Diseases: Part-2K. Fukuhisa, Y. Tateno, M. FukudaY. Sasaki, F. Shishido and T. Matsumoto
9. Chapter-5 119Case StudyM. Fukuda, K. Fukuhisa, Y. Tateno, G. Nair, S.M. SharmaA.K. Padhy and F. Shishido
10. Chapter-6 301ConclusionG. Nair
11. Chapter-7 303AcknowledgementG. Nair

INTRODUCTION
GOPINATHAN NAIR, M.D.,
Section Head of Nuclear Medicine,Division of Human Health,IAEA, Vienna
Two decades ago radionuclide imaging of liver was very popular in the investigation of patientswith liver disorders. This situation has changed with the advent of ultrasound imaging. Cliniciansnow ask less frequently for radionuclide imaging and more for ultrasound imaging to investigatetheir patients with suspect liver diseases. There are many reasons for this shift in preference.The main one is that ultrasound examination is readily available in most hospitals and laboratories,whereas radionuclide examination is not. This is due to the high capital and running costs ofproviding radionuclide imaging facilities. The other reason is, it is believed, that on a one to onebasis ultrasound images of liver provide more information about liver pathology than radionuclideimages.
Society has become extremely cost conscious about medical care. The available resourcesneed to be used in the most cost-effective way. This is all the more necessary in developingcountries where resources for medical care are severely limited, and the demands on availableresources are very high. Thus the need of the hour is to relieve the pressure of demand on anygiven resource by choosing appropriate alternatives and using that resource in the best possiblemanner. This is the philosophy which had prompted the Agency in 1988 to undertake thecoordinated research programme on "evaluation of imaging procedures in the diagnosis of liverdiseases."
Liver diseases are many and vary widely in etiology and pathology. Pattern of liver diseasesalso vary depending on the geographical and demographical factors. Alcoholic cirrhosis is morecommon in industrialised countries whereas post necrotic or post hepatitic cirrhosis is morecommon in developing countries. Abscesses and parasitic cysts are more common in lessprivileged countries whereas cancer seems to be equally prevalent in all parts of the world. Thesedifferences in geographic pathology of liver diseases influence the education, training, learningprocess and skills of medical personnel who interpret liver images obtained from various imagingmodalities. Thus the skills of liver image interpretation becomes an important variable whichdetermines the ultimate value of a given imaging modality.
In different countries, the training of nuclear medicine physicians vary in scope and c6htent.

2 • Ultrasound and Radionuclide Images of Liver
Some are trained solely as nuclear medicine physicians without any serious study of other relatedimaging modalities. Some are basically trained as radiologists with good knowledge of ultrasoundand nuclear medicine. This situation also brings in a certain variable that needs to be consideredwhen evaluating the diagnostic value of an imaging method.
No less important is the instrument itself, whether it is a scintillation gamma camera orultrasound machine. The age of the instrument, its care and maintenance, the regular quality checkof its performance and the quality of final output - the image itself - also matters when it comesto interpreting an image and giving a diagnosis.
The coordinated research programme (CRP), "Evaluation of imaging procedures in thediagnosis of liver diseases (Phase II)" endeavoured to address all these aspects mentioned above.This CRP was started in 1989 as a logical sequence to its predecessor, "Evaluation of nuclearmedicine procedures for the diagnosis of liver diseases". Apart from Japan, nine other countriesparticipated in the CRP. The objective of the CRP was to determine the sensitivity and specificityof the radiocolloid liver imaging and the standard grey scale ultrasound imaging of liver in differenttypes of liver diseases with a view to determine the relative merit of each imaging modality inthe diagnosis of a given type of liver disease. The intention was that if one shows distinctivesuperiority in term of its diagnostic value, then that modality can be recommended as a front lineinvestigation in a given type of liver disease. This approach not only gives certain cost effectivenessin patient care, but also reduces demand on resources that are already under strain in developingcountries.
The Japanese group participating in this study had a set of 93 paired (radionuclide andultrasound) liver images of patients with confirmed diagnosis. Copies of these were provided toeach of the participating countries. The principal investigator in each country then sent theseimages to a group of nuclear medicine and ultrasound specialists for their independent (and latercombined) interpretation. The interpretation data were recorded on forms specially designed forthis CRP. These forms had bepn meticulously prepared by the Japanese scientists. The datasheets were then sent back.tq/tjje,"Japanese scientists for detailed evaluation. The next step inthe research programrne consisted of collecting a large number of paired liver images obtainedfrom radionuciide and ultrasound imaging of patients with a wide variety of liver disorders anddespatching them to the Japanese scientists at the National Institute of Radiological Sciences(NIRS), Chiba-shi, Japan. The final diagnosis was known in each case. The details of each patientwere also recorded on a specially designed form prepared by the Japanese scientists. Out of these,103 paired images selected on the basis of their quality were distributed among the participantsof the CRP for interpretation in the same way as was done before with the liver images obtainedfrom Japanese patients. Also, the images and results of the quality control procedures done onthe equipments, both gamma camera and ultrasound were analyzed for determining theperformance standards of the equipment used in these studies.
Detailed computer analysis of the interpretation and other data was carried out at NIRS. Thesensitivity and specificity of the liver imaging done by radionuclide and ultrasound methods weredetermined for different types of liver diseases such as hepatocellular carcinoma, cirrhosis of liver,benign tumours, cysts, abscesses and fatty degeneration of liver. Receiver operating characteristic(ROC) curve analysis was used for the purposes of comparison.

Introduction • 3
Despatching to and recovering from ten countries a very large volume of documents - copiesof hundreds of liver images and data sheets - were not an easy task considering that these neededto be done on a strictly time bound basis. In a given country itself, these images were interpretedby a large number of nuclear medicine physicians and ultrasonography specialists, many at timesfrom different cities. The interest and cooperation of the participants and the high level of disciplineand dedication of the Japanese scientists played a major role in successfully concluding thiscoordinated research programme.
Some very interesting, although not unexpected, observations have been made based on theanalysis of the data collected in this CRP. Observations on the influence of the image interpretingskills of medical doctors from different countries on the diagnostic verdict are also revealing. Soare the observations on the performance standards of equipment and quality of liver imagesobtained in this study.
It is hoped that this monograph will be of interest to nuclear medicine physicians andultrasonography specialists involved in the diagnosis of liver diseases. It may also be useful tohealth care managers who have the responsibility to distribute limited resources most efficientlyand effectively.

IHIITlirilTlIN01$0002
LIVER SCINTIGRAPHY
YUKIO TATENO, M.D.,
Division of Clinical Research,National Institute of Radiological Sciences,Chiba-shi, Japan
INTRODUCTION
Liver scintigraphy can be classified into 3 major categories according to the properties ofthe radiopharmaceuticals used, i.e., methods using radiopharmaceuticals which are (1) incorporatedby hepatocyts. (2) taken up by reticulo endothelial cells, and (3) distributed in the blood pool ofthe liver. Of these three categories, the liver scintigraphy of the present research falls intocategory-2.
Radiopharmaceuticals which are taken up by endothelial cells include 198Au colloids and99mTc-labelled colloids. Liver Scintigraphy takes advantage of the property by which colloidalmicroparticles are phagocytosed by Kupffer cells, and reflect the distribution of endothelial cellsand the intensity of their phagocytic capacity.
This examination is indicated in the following situations:
(/) When you suspect a localized intrahepatic lesion (tumour, abscess, cyst, etc.),
(ii) When you want to follow the course of therapy of a localized lesion,
(///) When you suspect liver cirrhosis,
{iv) When you want to know the severity of liver cirrhosis or hepatitis,
(v) When there is hepatomegaly and you want to determine the morphology of the liver,
(w) Differential diagnosis of upper abdominal masses, and
(i///) When there are abnormalities of the right diaphragm and you want to know their relationto the liver.

Liver Scintigraphy • 5
Although all of the indications we have listed above are valid, in reality, the most commonindications are (i) and (ii), particularly to determine the presence or absence of lesion.
METHODS
In regard to the 99mTc colloids, there are those which form colloids after being infused intothe body, as a result of the action of Ca++ ions in the blood and those in which the colloid is labelledin advance. 99mTc-phytate belongs to the former class and 99mTc-tin colloid to the latter. Althoughnot much difference has been found between them, 99mTc-phytate is convenient to use becauselabelling is easy. On the other hand, because 99mTc-tin colloid is administered already in colloidform, labeling is complicated. However, the spleen is imaged even when normal, and it is superiorin providing simultaneous images of the liver and the spleen.
With both agents a dose of about 2 to 5 mCi is injected intravenously, and scintigrams obtainedstarting about 10 to 20 minutes later.
It is advisable to record the scintigrams in 3 projections, anterior, posterior and right lateral,A Left lateral view may also be obtained if necessary. If the position of the costal arch and thexiphoid process are marked in the anterior view, it will be helpful in diagnosing the site.
NORMAL IMAGES
Here we will focus on features that must be noted when interpreting images.
(7) Position
The right inferior margin of the liver on the anterior view comes close to the costal arch, butnever goes beyond it. The left inferior margin of the liver goes slightly past the costal arch belowthe xiphoid process. If you mark the left and right costal arches and the xiphoid process, theserelationships are seen more clearly.
(2) Shape
The anterior view takes the form of a right-angled triangle with relatively flat edges. Becauseof its relationship to surrounding organs, even when normal, there are several defects in the images(physiological defects). These organs are the gall bladder, inferior vena cava, hepatic hilum, portalvein, kidney, etc. When we compiled the liver scans performed at the NIRS, the occurrence ratesof physiological defects were as follows: 60% were due to the gall bladder, 44% due to the inferiorvena cava, 40% due to the hepatic hilum, and 16% due to the ribs. Most of the pseudodefectson the liver scintigrams are attributable to physiological defects. Moreover, the shape of the liveris easily altered as a result of compression by other organs, and it is very important to correctlygrasp its positional relationships with the surrounding organs.
(3) Size
Because of respiratory movements, etc., scintigraphic dimensions do not always reflect thetrue size of the liver. However, there have been attempts to measure the widths of the right lobeand the left lobe in order to diagnose hepatomegaly and atrophy of the individual lobes. Care must

6 • Ultrasound and Radionuclrde Images of Liver
be taken because a congenitally long, narrow projection of the right lobe, Riedel's lobe, issometimes seen extending below the costal arch.
(4) Intrahepatic distribution of radio colloid
The images must be interpreted from two perspectives. One is the state of radio colloid uptakeby the liver as a whole. It is necessary to be attentive to whether radio colloid uptake is decreasedand to whether radio colloid distribution is uniform. The other is determining whether there areareas of focal decrease in radio colloid uptake (cold areas).
Since the former is influenced by the radio colloid dose, time after administration, size anduniformity of the camera field of vision, total count of the images obtained, exposure time, exposureconditions, etc., it is necessary to know these conditions and to produce the images and readthem under as similar conditions as possible.
In regard to the later, when searching for space occupying lesions (SOLs), it is important todistinguish them from the physiological defects described above. A note must be made of positionalrelationships with organs surrounding the liver. Since it seems that the smaller the lesions, themore they are concealed by lack of uniformity of the field of vision of scinticamera, it is importantto consider the properties of scinticamera and maintain it in optimum condition.
(5) Extrahepatic Radio Colloid Distribution
Colloid is also taken up by the reticuloendothelial system outside the liver. However, this isaffected by the size of the particles and the activity of the hepatic reticuloendothelial system. Inregard to the extrahepatic reticuloendothelial system, the spleen and bone marrow are importantfrom the standpoint of interpreting liver scans.
Even when normal, visualization of the spleen varies with the agent being used. In the caseof 99mTc-phytate, it is often not visualized from the anterior when normal. With 99mTc-tin colloidand 99mTc-sulphur colloid, however, the spleen is clearly visualised even when normal. Normallythere is less uptake by the spleen than by the liver.
Distribution of radio colloid in the bone marrow is not normally seen, regardless of theagent.
SCINTIGRAMS IN LOCALIZED LIVER DISEASE
Liver diseases which show up as localized cold areas based on intrahepatic radio colloiddistribution are listed below.
(/) primary liver cancer,
(/;) metastatic liver cancer,
(///) benign tumours,
(/V) cysts,

Liver Scintigraphy • 7
(v) abscesses,
(w) wounds
(vil) radiation hepatitis,
{viii) infarctions,
(ix) tuberculosis and
(*) miscellaneous.
It can generally be said that visualization of intrahepatic defects (SOLs) produced by the aboveis the main purpose of radio colloid scintigrams. More specifically, it is the method of diagnosiswhich should be attempted first to determine whether liver metastasis 6t malignant neoplasmshas occurred. When we compiled the results of liver scintigraphy performed at NIRS aspreoperative patient screening, we found that the lesion-positive correct diagnosis rate was 43%and that the lesion-negative correct diagnosis rate was 87%. The size limit for detectable lesionsis about 2 cm.
When we reviewed false-positive cases, almost always they were found to have been confusedwith physiological defects. Errors in the interpretation of physiological defects due to impressionsmade by the inferior vena cava were the most common. They were errors in interpreting defectsobserved close to the superior aspect of the Junction between the two lobes on frontal images.Next, there were errors which were thought to be due to ribs, when defects in the lateral marginof the right lobe appeared on frontal images, and those which were thought to be due to deformityof the left lobe, when observed as a cold area in the lateral side of the left lobe on frontal images.Also, impressions made by the liver hilum area, the gallbladder bed and the large intestine, mayresult in false positive studies.
In addition, since dilated intrahepatic bile ducts sometimes appear as intrahepatic cold areas,caution is required when interpreting the images.
SCINTIGRAMS OF DIFFUSE LIVER DISEASE
Since radio colloids are taken up by endothelial cells, they do not directly reflect hepatocellulardamage. Nevertheless, knowledge of changes in endothelial cells and the interstitium which occurin association with hepatocellular damage makes it possible to estimate the severity of liver celldamage to a certain extent.
The diagnosis of diffuse liver disease requires the interpretation of shape, size, the degreeof radio colloid uptake and its distribution both within the liver and in the extrahipatic reticulo-endothelial system. Careful attention must be given to the following points:
(/) Is hepatomegaly or atrophy present?
(//) Is there good liver radio colloid uptake?

8 • Ultrasound and Radionuclide Images of Liver
(Hi) IS intrahepatic radio colloid distribution uniform?
(lv) Is the spleen visible? What is the degree of visualization and its size? and
(v) Is bone marrow visualized?
Combination of the above findings permits differential diagnosis to a certain extent. Moreover,monitoring changes in the findings is helpful in judging the progression of the disease and in makinga prognosis.
(1) Liver cirrhosis
When the typical pattern of "right lobe atrophy and relative tumentia of the left lobe togetherwith a moderately enlarged splenic shadow" is present, liver cirrhosis can be diagnosed on thebasis of these findings alone. Besides the above, the following findings are also observed in livercirrhosis:
(a) decrease in intrahepatic radio colloid uptake.
(b) unevenness of intrahepatic radio colloid distribution, and
(c) appearance of bone marrow shadows.
These findings are believed to be attributable to a decrease in liver blood flow, thedevelopement of collateral pathways, and a decrease in the number and activity of Kupffer cellsas a result of the liver tissue fibrosis caused by liver cirrhosis.
There are attempts to express the above findings quantitatively to improve diagnosticcapability. One method is to determine the liver blood flow coefficient (often referred to as theK value). Another is a method which determines the spleen-liver ratio (S/L value) and allowsquantitative evaluation of the splenic shadow. These were used as quantitative diagnostic methodsfor liver cirrhosis.
(2) Chronic hepatitis
Although not displaying a typical pattern like liver cirrhosis, changes in liver shape accordingto the degree of liver fibrosis and cellular infiltration as well as in liver blood flow and rate ofintrahepatic concentration, together with abnormal intra- and extrahepatic radio colloid distribution,are observed as findings. Thus rather than being used to diagnose chronic hapatitis, it is moreoften used to estimate the severity of the lesions and as a means of monitoring the course oftreatment. In cases in which fibrosis and cell infiltration are believed to be severe, and liver bloodflow is reduced, these findings sometimes resemble those of liver cirrhosis.
Moreover, in inactive-type chronic hepatitis, sometimes mild hepatomegaly is found andsometimes there are no findings, and it is difficult to perform a differential diagnosis from livercirrhosis or from normal on the basis of this examination alone.

Liver Scintlgraphy• 9
(3) Acute hepatitis
No particularly characteristic findings are observed in acute hepatitis, but depending on theseverity of the patient's condition, findings include liver size, morphology, intrahepatic radio colloiduptake and distribution, and visualization of the splenic shadow. The findings change as we followthe course of the disease and information is obtained which is helpful in judging the progress ofthis disease.

IN01$0003
ULTRASONOGRAPHY OFTHE LIVERANATOMY, PROCEDURE,NORMAL AND ABNORMALFINDINGS INDISEASED STATES
MORIMICHI FUKUDA
Department of Diagnostic Imaging andMedical ElectronicsSapporo Medical University School of MedicineMinami 1-Jo,Nishi 16-chome, Chuo-ku, Sapporo, Hokkaido, Japan 060
ULTRASONOGRAPHY OF THE LIVER
INTRODUCTION
Although the very first attempt to use ultrasound for diagnostic purpose in medicine may betraced back to 1940's, the modern ultrasound imaging has only been started in 1963 by G. Kossoff,who developed the idea of grayscale ultrasonography together with the automatic waterbathscanner, Octoson, to examine pelvic and other abdominal organs.
The signal processing, logarithmic compression of incoming backscattered echo signals,greatly improved image quality and thus facilitated the use of ultrasound imaging in clinicaldiagnostic purposes. The bistable, black and white ultrasound equipments used in 60's, and evensophisticated B-mode contact scanners had been completely replaceed by the real-time B-modeequipments, and, then the technique started to be used widely in medical imaging in clinical andradiology departments. These rather drastic changes took place since the introduction of thephased array technique infroduced by Somer in 1967 and later the linear array method introducedby Bom in 1970.

Ultrasonography of the liver m 11
The linear array transducer, an electronically driven array of small transducers, producedcross-sectional images of organs placed under the scanhead. This method has revolutionized thepractice of ultrasonography because of its simplicity and easy maneuverability to produce clearand easily recognizable sonograms.
The equipment showed rapid progress almost at every three years intervals and harshcompetition among manufacturers has created numerous diagnostic instruments of moderate pricerange and with markedly improved performance.
The methods of advanced signal processing widely applied in modern real-time equipments,the transmission of wide-band ultrasound, dynamic focusing and dynamic frequency imaging, haveled to the production of superb sonographic images and thus resulted in a wide-spread use ofthe diagnostic ultrasound in almost every clinical discipline. Further more as the word 'computedsonography' implies, the extensive application of computer methodology has created even the newdiagnostic application of ultrasound, 'ultrasono-angiography' using further sophisticated techniqueof digitization and computerization.
Because of the fact that these research and development took place within a relatively shortperiod of time, another serious problem had been created, the persistence of obsolete sonogaphicequipments used in the past dacade. The use of out-dated equipments in certain institutions couldnot be criticized because of various reasons such as lack of proper education of ultrasonographyin medical schools, insufficient recognition on the use of ultrasound in medical imaging andprobably financial reasons to purchase the high-end equipment that could be a considerableeconomical burden to certain clinical departments. The lack of proper communication in regardto the advancing front of medical imaging equipments will be another reason for these phenomena.The non uniformity in propagation of newer diagnostic methodology could be particularlytroublesome in certain countries where serious lack of financial resources limit the purchase ofmodern expensive instruments.
It goes without saying that the quality and efficacy of ultrasonic imaging are, in general,intimately related to the expertise of examining personnel involved and at the same time to thequality of the imaging equipment used.
In planning the cooperative research on the imaging of the liver in Asian countries, the needof the comparative studies on the equipments had been debated. As a result, it was advocatedthat the assessment on the performance status of ultrasound and nuclear medicine equipmentsused in daily practice should be checked by the use of an adequate phantom so that thestandardization of the imaging equipments could be made.
An appropriate phantom as described in the chapter of equipment standardization by Dr.Bergmann of Vienna University has been selected and distributed to the institutions taking partin the Coordinated Research Programme (CRP).
ANATOMY OF LIVER
The Liver is localized in the epigastrium, with varying degrees of extension into the left

12 • Ultrasound and Radionuclide Images of Liver
diaphragm, and ventral and lateral boundary is the thorax. The size, position, and shape are subjectto large physiological variations depending on age, sex, body position, and constitutional changes.
The shape and surface of the liver are largely determined by their placement in relation tothe surrounding organs and tissues, their peritoneal attachments as well as by the parenchymalfissures and the structures of the porta hepatis.
Most of the liver is intraperitoneal. Excluded is the fixed part, the connctive tissue fusion regionlocated dorsocranially between the diaphragm and the convex liver surface.
The liver is comprised of two lobes, the right and left lobes. In the right hepatic lobe, anteriorand posterior segments are distinguished. The left hepatic lobe is divided into a lateral and medialsegments.
The anatomical quadrate lobe corresponds to the caudal part of the left lobe, medial segment.The caudate lobe has a rounded papillary process anteriorly towards the porta hepatis and a thinhepatic bridge, the caudate process to the right towards the main right hepatic lobe.
The porta is arranged approximately transversely and contains three sets of vessels. Thelargest is the portal vein, which divides into the right and left branches at the porta just beforeentering into the liver substance. The portal vein lumen usually measures about 10 mm. Anteriorto the portal vein lie the hepatic artery medially and the biliary system laterally.
The hepatic circulation has the dual arterial blood supply through the portal vein and the hepaticartery. The anatomic key structures are the portal triad: portal vein, hepatic artery and bile duct,all of which are at first in the hepatoduodenal ligament, then branching in the porta hepatis andalso in the segmental and subsegmental planes.
The portal veins typically branch widely away from the hilum, interlobarly and intrasegmentally,while the hepatic veins are spread out from the inferior vena cava, interlobarly and intersegmentally.Both vascular systems intersect like interlocking fingers.
EXAMINATION TECHNIQUE
The liver lies primarily in an inaccesible, high subcostal position. By asking to take deepabdominal inspiration, caudal repositioning can be achieved, and access will be facilitated. A carefulsubcostal compression of the abdominal wall using the ultrasound transducer also improves imagerepresentation characteristics through a displacement of the superimposed intestinal structuresas well as optimization of the beam angle and distance to the organ.
Application Technique
The reliable sonographic scan is intimately related to an evaluation of the whole liverparenchyma as completely as possible. Several imaging access and application techniques maybe used during examination.
(1) Subcostal Diagonal

Ultrasonography of the liver* 13
(2) Subcostal longitudinal, or sagittal
(3) Transverse
(4) Right intercostal lateral
The selection of scan planes depends on the availability of acoustic windows, the port wherebyultrasound beam could be passed without interference by intraabdominal gas containing viscera.
The general, objectives are to record representative scans from above mentioned scandirections. If no pathology is identified during ultrasound scanning, these 4 to 6 images aresatisfactory for the ultrasound imaging, If abnormal findings, such as the cysts, masses or otherstructures were imaged, thorough recordings are requested to identify their 3D constructions, atleast from two sections like vertical intersection, so that an adequate interpretation could be made.
Methodological Limitations
Despite the remarkable picture quality of current ultrasound equipments a number of limitations iought to be considered in the examination of the liver. These are
(1) Coupling difficulties
(2) Sonographic blind areas
(3) High ultrasound absorption
(4) Reflection due to abdominal gas
In regards to application, sector scanner or convex array scanners are easier to use becauseof the smaller footprint.
SONOANATOMY AND NORMAL ECHO PATTERN:
Sagittal ultrasound sections near the midline show the left lobe as a triangular structure, withthe diaphragm and the heart superiorly. The caudate lobe may be visualised posteriorly overlyingthe inferior vena cava or when it is prominent, the aorta as well.
Section further to right shows the major part of the right lobe of the liver bounded superiorlyby the strongly reflecting diaphragm, with the right kidney posteriorly. The gallbladder may appearin this region. Often a fine reflective line can be identified linking the right portal vein with theneck of the gallbladder. This represents the fissure separating the quadrate lobe anteriorly fromthe right lobe. Inferiorly, the gas-containing bowel gives strong echoes with shadowing.
Transverse sections show the right lobe of the liver in close contact with the diaphragm.
The liver parenchyma is seen as a uniform, sponge-like texture of low-level gray. Passingthrough it are the blood vessels which are seen as branching tubular structures that can be tracedtowards the porta or the inferior vena cava. Identification of these two groups is facilitated by thefact that portal vein branches are usually surrounded by reflective tissues, whereas hepatic veintributaries are not and appear as simple tubular echo defects.

14 • Ultrasound and Radionuclide Images of Liver
ABNORMAL FINDINGS
Assessment of hepatomegaly
In general, total volume of the liver is closely related to body weight, and its shape is veryvariable. Assessment of hepatomegaly by ultrasound is often difficult. The longitudinal scanningon the right midclavicular line usually gives the measure of the presence of hepatomegaly.Likewise, scanning at the right intercostal space also gives useful information on the size of theliver.
Focal Liver Diseases
Scanning on the longitudinal, diagonal, intercostal and transverse planes are all useful indetecting the presence or absence of focal lesions of the liver.
Solitary or multiple cysts can be Identified by rounded masses with anechoic spaces. Echolevels of the cystic mass has to be carefully observed to differentiate benign cysts of variousetiologies, i.e. simple, infectious, parasitic, traumatic or malignant.
Pneumobilia and cholelithiasis could be readily identified by the characteristic echo pattern.
Solid masses detected by ultrasound have to be differentiated accordingly. Descriptions arenecessary concerning the number, size, shape and echo pattern characteristics including contours,echo texture, acoustic attenuation or enhancement, presence or absence of target sign, halo andcalcification of the masses.
Benign haemangiomas are often easily differentiated by the echo pattern characteristics,however, hepatocellular carcinoma and metastatic deposits may be fairly difficult, especially whenthe size is small. The most difficult are the rare tumors of benign nature, focal nodular hyperplasia,regenerative nodules and tuberculomas, which often require US-guided biopsy as well.
Diffuse Diseases
Two distinct patterns of diffuse disease with uniform alteration of liver reflectivity can beidentified. In the bright liver pattern, the overall echo levels are increased. Brightness may bediffuse and attenuating the ultrasound transmission, however, it qould be an inhomogenous pattern.Liver kidney contrast may be very apparent in which bright liver is accompanied by dark patternof the kidney. The cause is supposed to be attenuation and scattering of ultrasound energy byprecipitated fat globules in the hepatic parenchyma.
Liver fibrosis accompanying chronic hepatitis is often difficult to differentiate from the echolevels. Patients' history and liver function profiles have to be carefully analyzed and in difficultcases, US-guided biopsy is necessary.
Liver cirrhosis caused by viral infections have to be checked for the presence or absence ofmass lesions. Liver size and splenomegaly are important keys to the final diagnosis, nevertheless,tissue biopsy specimen is necessary to differentiate cirrhosis from other causes.

Ultraspnography of the liver* 15
Other rare metabolic diseases have to be analyzed carefully for 1^e:'differential diagnosis.
In summary, ultrasonography is a useful measure to identify the presence of pathologicchanges in the liver. The information obtained is mostly of morphological nature, though someadditional findings could be obtained by careful analysis of the sonographic features. Examinationis quick, non-invasive and findings are fairly reproducible and even very small lesions could beidentified.
Combined use of the ultrasound imaging with other modalities such as the radio isotopescanning, X ray, CT or MRI will be very helpful in identifying and characterising the lesions inthe liver.
REFERENCES
Focal liver diseases:
Hepatocellular carcinoma
Hepatocellular carcinoma (HCC) most commonly produces a focal mass lesion which is initiallyhypoechoip but becomes more echogenic with increasing size. Texture pattern characteristicallyproduces mosaic appearance and is often accompanied by posterior echo enhancement. In somecases, the tumour infiltrates widely through the liver substances, giving rise to an irregular pattern,Invasion of veins, hepatic and portal, is common. The incidence of intra-and extrahepaticdissemination is high in HCC with diffuse infiltration.
Metastatic carcinoma
Metastatic tumours are more common than primary hepatocellular carcinoma. The commonappearance is that of multiple focal lesions of altered reflectivity. The margins are poorly defined.The echoes are less intense than those of non-tumour parenchyma, but many are stronglyreflective especially those deposits from Gl tract and urogenital tumours. Other patterns, bull'seye or target lesion, are characteristic in metastatic tumours. Fluid-filled deposits and calcifiedtumours also appear in ovarian or pancreatic malignancy as well as in metastases arising fromcolorectal cancer.
Non-Hodgkin lymphoma
Lymphoma can infiltrate the liver parenchyma in a diffuse manner. Size usually increases.Formation of solid masses can also occur in the liver parenchyma and differentiation is difficultfrom other causes of metastatic deposits.
Presence of splenomegaly is another important finding suggesting malignant lymphoma.
Haemangioma
One of the most frequent benign masses found is haemangioma. Two types, cavernous andcapillary may occur. The former is characterized by the irregular bordered hypoechoic mass withposterior echo enhancement and the latter is characterized by echogenic masses. The masses

16* Ultrasound and Radlonucllde Images of Liver
will remain unchanged for over months of follow-up. Angiography may not be revealing. MRI givesrather clear cut differentiation of T2 weighted images by increased contrast.
Pyogenic abscess
Ultrasound is very useful in detecting liver abscess due to bacterial infection and parasiticinfestation. The abscess is initially demonstrated as an ill-defined solid mass lesion with decreasedechogenicity. As pus accumulates, shaggy walled capsules encircle more or less echopoor cysticlesions. Gas may be formed in the cystic mass. Appearance of cysts are usually identical bothin pyogenic and amoebic abscesses. Therapeutic drainage with a catheter is useful for resolutionof cystic changes.
Benign tumour other than Haemangioma and abscess
Solid-cyst differentiation is most useful in the diagnosis of cystic masses of polycystic diseasein which single or multiple cysts surrounded by thin, round walls accompany definite posterior echoenhancement. Cysts usually contain liquid with no echoes, however, US guided aspirationsometimes causes bizarre strands by haemorrhages. Liver trauma sometimes causes formationof cystic mass with some echoes within the cystic mass.
Hydatid disease (Echinococcus granulosus) can produce a cystic lesion that is quiteindistinguishable from simple cyst. However, when daughter cysts bud from the wall, irregularitybecome apparent. These irregularities should be looked for if the patient comes from sheep raisingfarms. The cyst can grow into considerable size exhibiting characteristic 'Cartwheel appearance'.
A more aggressive disease is caused by infestation of E. multilocularis transmitted from foxesor dogs. It is endemic in Eastern Europe, Russia, Japan and Australia. Parasitic buds are smalland multiple showing patchy appearance throughout the liver. Cyst formation can occur but notvery frequently.
Diffuse liver diseases
Liver cirrhosis
Cirrhosis usually exhibits higher echoes due to the presence of fibrous tissue in combinationwith accompanying fatty changes. There is often distinct enlargement of the caudate lobe, whichis easily assessed by the sagittal scanning. In advanced stage, the size of the liver shrinksaccompanied by splenomegaly and ascites. The secondary portal hypertension may ensue butthe differentiation between primary and secondary portal hypertension is by no means easy byultrasound. Careful search for the portal vein width and presence or absence of thrombi in portalcirculation has to be sought.
Chronic hepatitis
Chronic hepatitis is also characterized by increased parenchymal echoes due tofibrosis. Shape and size nlay not be very different from normal, hence the diagnosis is relativelydifficult.

Ultrasonography of the liver m 17
Fatty liver
The diabetics, alcoholics and patients suffering from overweight frequently reveal bright liverpattern changes due to massive infiltration of the parenchyma by fat. Because of increasedattenuation due to fat accumulation, the liver tends to show hyperechogenicity at its very surface.Scattering of ultrasound causes formation of bright liver pattern. No discrete masses are detected,however, inhomogeneity of parenchymal echogenicity occurs in metabolic precipitation of fat.

INO1$0004
ASSESSMENT ANDEVALUATION OF THEPERFORMANCE OFNUCLEAR MEDICINE ANDULTRASOUND IMAGINGINSTRUMENTATION
Helmar Bergmann, Christian Kollmann :
Department of Biomedical Engineering and Physics,Vienna University Hospital AKH, WaehringerGuertel 18-20, A-1090 Vienna, Austria
INTRODUCTION
The purpose of this work has been to assess the quality of instrumentation used for the collectionof representative patient images during the coordinated research program entitled "Evaluation ofImaging Procedures for the Diagnosis of Liver Diseases". Previous work carried out during earlierphases of the project was concerned with the establishment of methods for comparison of thequality of such instrumentation (1,2). In this stage the quality of both gamma cameras andultrasound scanners were assessed using the previously established methods. The evaluation waspartly used to validate acceptable working conditions of the equipment during the collection ofpatient studies, partly to obtain basic data in order to be able to characterize the imaging qualityof the devices. This would permit to both identify equipment unsuitable to be used in the studyand to take into account the imaging quality token performing the ROC analysis of the evaluationof the patient images.
METHODS
(1) Gamma cameras
Test images were received from all participating institutions and all gamma cameras used forpatient studies. The test images consisted of a uniformity image acquired either with a fillable floodsource imaged with the gamma camera with collimator or with a point source imaged without

Assessment of Instrumentation • 19
collimator. Additionally, a spatial resolution and distortion pattern was imaged, using the gammacamera without collimator and a remote point source. The radionuclide used was "mTc. Most ofthe images obtained were recorded on X-ray film, one gamma camera produced polaroid greyscale images, the image of the total performance phantom was obtained as a Xerox-copy. Altimages were presented in arbitrary sequence to three experienced observers who evaluated theimages independently of each other. The observers were asked to rate the quality of each imagevisually, using a scale of 1 - good, 2 - acceptable and 3 - poor.
Furthermore, the observers were asked to give a rating using the same scale for their overallimpression of the quality of the gamma camera taking into account all information available forthat device. This was useful and necessary especially for gamma cameras for which additionalphantom images such as the IAEA simulated liver phantom or a grid phantom were submitted.The,, global rating for each device was obtained by taking the arithmetic mean of the 3 individualvalues.
(2) Ultrasound
The participants provided images of the multipurpose phantom model 539 (manufactured byRMI). They were asked to produce best possible images of all structures of the phantom, usingali probes that were used in the project for patient work (see appendix). Hard copies of the phantomimages were first sent to Dr. M. Fukuda, Japan, who performed a visual assessment of the qualityof the images, thereafter the images were forwarded to Vienna for quantitative analysis. Most ofthe images were recorded on X-ray films, a few images were recorded on thermal paper. Theimages were evaluated visually. Whenever quantitative measurements were necessary such asfor example when assessing depth calibration or measurement calibration a ruler was used tomeasure distances directly in the image. In a few cases the images were digitized andmeasurements were carried out on the digital image using general purpose image processingsoftware (3). Table 3.1 describes how the various performance parameters used for theassessment of the ultrasound device have been obtained and which rating criteria were applied.
TABLE 3.1 EXPLANATIONS TO THE TEST METHODS AND KEYS USED FOR THE USE OFULTRASOUND DEVICES
US-device
Model
Scanner type
Frequency
Frame rate
Beam profile
Specification given by the participating institution.
Specification given by the participating institution.
Specification given by the participating institution.
Specification given by the participating institution.
Value taken from the image legend.
Visual measurement of the apparent minimum width of the vertical rods in the givenimage scale units for
a) the first focal zone or available data in the minimum depth and
b) for the greatest available depth.
In some cases the minimum beam width lies between two vertical rods, so that the(Contd.)

20 • Ultrasound and Radionuclide Images of Liver
TABLE 3.1 (Contd.)
depth could not be measured exactly. The listed value is then the next visible minimumrod; measurement error: + 10% (note: the measurement of the minimum beam widthboth for the first focal zone and for the greatest available depth is independent of themeasurement of the lateral resolution, the best image of the set was used forevaluation).
Maximum : Measurement of the deepest completely visible structure in the image.Penetration
Depth calibration : Visual measurement of the vertical rod distances (equidistant), measurement error +10%.
Measurementcalibration : Visual measurement of the horizontal rod distances (equidistant) measurement error
+ 10%.
Maximum - : Smallest still visible distance difference of the rods of the resolution pattern in the
Resolution phantom both axial and lateral.
Dead zone : Distance-measurement of the first visible rod from the surface.
Definition : Qualitative estimation of the aneqhoic targets' shape and sharpness in the image.
Dynamic : Dynamic range estimation of the image relative to the well defined range correspondingtargets.
Minimum diameter ofanechoic targets in80 mm depth : The smallest visible diameter of t ie anechoic target in this depth.
Signal-to-noiseratio : Qualitative evaluation of the targets' visibility relative to the image background
speckles.
Final rating : Average for all qualitative and quantitative measurement with weighting.
Rating criteria used in table 3.3
Measurement/Topic: Criteria: Weight:
Beam profile
Linear array - 1 . focal zone (0-|0 mm): x2x < 1 mm '' =>e1 <x < 2 mm =>gx>2 mm =>p-greatest depth (50 mm): x2x < 3 mm =>e3<x<4 mm =>gx > 4 mm =>p
Sector/convex - 1 . focal zone (0-50 mm): x2x < 3 mm =>e
(Contd)

Assessment of Instrumentation m 21
TABLE 3.1 (Contd.)
3<x<4 mmx > 4 mm
=>g=>P
-greatest depth (50 - oc mm):x<3 mm =>e3<x<5 mm =>gx > 5 mm =>p
Maximum Penetration depthlinear array
Sector/convex
x < 100 mm100<x<150 mmx > 150 mm
x <, 150 mm150<x<200 mmx > 200 mm
=>p x1=>g=>e
=>P=>g=>e
Depth calibration
Measurement calibration
Maximum Resolution axial
Lateral
Dead zone :
Definition
Dynamic range
Minimum diameter ofanechoic targets
Signal-to-noise-ratio
Average of all subjective assessmentsof the suitable images of the set.
Average of all subjective assessmentsof the suitable images of the set.
1 mm2 mmx > 3 mm;.X S 2 mnv3 mmx>3 mm(for normalotherwise ifis reduced
x<4 mm4 mmx>4 mm
=>e,=>g,
• =>P>>e,=>g=>pdepth of resolution structure,
: the depth is greater the ratingby one step (for linear arrays).
=>e,=>g>=>p
Average of "all subjective assessmentsof the anechoic of the set of images.
Average ofcall subjective assessmentsof the anechbic of the set of images.
2 mm , =>e,3 mm =>g,x>3 mm =>p
Average of, all subjective assessmentsof the particular image of the set.
x2
x1
x1
x2
x2
x1
x2
X2
x2
x2
Final rating Weighted,,average of all individual ratings.

22 • Ultrasound and Radionuclide Images of Liver
In order to preserve anonymity the countries were given letters from A-l, each letter identifyinga country. Numbers behind the letters signify the number of the set of images belonging to onegamma camera. In the case of ultrasound images the country code is followed by a capital U.
RESULTS
Table 3.2 summarizes the quality control results for gamma cameras. It contains the 3 individualratings of the experts where applicable, and the mean of the 3 individual ratings. It can be seenthat the average values cover the possible range of values rather uniformly indicating that gammacameras with all performance levels were used.
The results of the evaluation of the images of the ultrasound phantom are summarized intable 3.3.
DISCUSSION
(1) Gamma cameras
The majority of gamma cameras (73%) have been rated as performing well or acceptably.Cameras which have been rated poor suffer from severe non-uniformity and distortions. However,from these cameras also images of the IAEA liver phantom (1) have been obtained which showedthat the clinical lesions contained in the phantom could be detected with acceptable performance.Therefore, the images obtained from that country are in principle acceptable for inclusion in thestudy. However, great care should be taken to verify that they do not distort the outcome of theROC-analysis. It is therefore advisable that special attention be given to the quality of reportsoriginating from images obtained with poor cameras. Another potential problem which mayinfluence the outcome of the ROC analysis is the fact that the optical density of the quality controlimages is widely varying. Country A, for example, produces rather dark images, whereas countryD is used to low exposure of the quality control images resulting in almost underexposed images.Since it is to be expected that similar patterns will be found in the clinical images this variationin exposure level might introduce an additional uncertainty and deterioration of performance inthe evaluation of the images by participants not accustomed to such extreme levels of exposure.
(2) Ultrasound
The situation with respect to the results obtained from the ultrasound phantom are similar.The global ratings show that most of the machines have been classified as between good andexcellent, only one falling between poor and good. In terms of ROC analysis this signifies thatthe quality of the ultrasound equipment used can be regarded as being essentially homogeneous.This is somewhat surprising since sample images of the phantom seemed to indicate bigdifferences in the performance of machines. When looking at the quantitative performanceparameters, however, little difference between probes employing the same technique, i.e. betweenthe group of linear probes or the group of sector scanner probes, is observed. There is, of course,a significant difference between the resolution values for linear array and sector scanning probes.Also the clinical resolution as determined by the minimum diameter of anechoic targets in 80 mmdepth does not differ much between different types of machines. The only big difference betweenthe images is the amount of speckle or noise found in those parts of the phantom which contain

TABLE 3.2 RESULTS OF THE EVALUATION OF THE QUALITY CONTROL IMAGES OF GAMMA CAMERAS
Evaluation of Quality of Gamma Cameras
ID
Flood
Bar
OHTP
Other
Comments
Global rating
Average rating
A1
- 2 3
3 2 3
—
—
Camera
very old,
in poor
condition
3 2 3
2.7
A2
3 - 3
3 3 3
—
IAEA
liver
—
3 3 3
3.0
A3
3 3 3
3 3 3
—
IAEA
liver
Follow-
up of A2
3 3 3
3.0
B1*
1 1 2
2 1 2
1 1 1
—
—
11 1
1.0
C1
1 1 2
1 1 1
—
—
—
1 1 2
1.3
D1
—
—
- 3 3
—
- 33
3.0
E1*
2 2 2
22 1
—
—
—
2 2 2
2.0
F1
2 1 2
1 1 2
—
—
—
1 1 2
1.3
F2 -
1 1 1
1 1 2
—
—
—
1 1 2
1.3
11
1 1 2
2 2 2
—
—
2 22
2.0
H1
2 2 2
2 2 2
—
—
—
2 2 2
2.0
G1
2 1 2
1 1 2
—
—
—
1 1 2
1.3
* images of previous survey were used for evaluation
!(0(0
01
IIrvs00

24 • Ultrasound and Radionuclide Images of Liver
TABLE 3.3: EVALUATION OF ULTRASOUND QUALITY CONTROL TEST IMAGES OF PARTICIPATINGINSTITUTIONS
Identification
US-device
Model(year)
Scanner type
Frequency (MHz)
Frame rate
Beam profile- 1 . focal zone-greatest depth(min. width/depth)
max. Penetrationdepth
Depth calibration(equidistant)
Measurementcalibration(equidistant)
max. Resolutionaxial
lateral
Dead zone
Definition
Dynamic range
min. diameter ofanechole targets in80 mm depth
Signal-to-noise ratio
Final rating
Comments:
AU
Shimasonic
SDL-300
linear array
3,5
low
2,7 mm/30 mm2,7 mm/60 mm
190 mm
g
g
2 mm in 70 mmdepth
3 mm in 110 mmdepth
<2 mm
g
p/g
3 mm
g
g
partial geometricdistortion
AU
Shimasonic
SDL-300
sector
3,5
low
3,5 mm/10 mm3 mm/30 mm
140 mm
g
g
3 mm in 120 mmdepth
>5 mm in 120mm depth
<10 mm
g
P
6 mm
P
p/g
geometric distortion,dark images
BU
Aloka
SSD-280 LS(1984)
linear array
5
high
1,3 mm/15 mm3,1 mm/56 mm
110 mm
g/e
g/e
1 mm in 60 mmdepth
1 mm in 70 mmdepth
<1 mm
g
g
3 mm
g
g/e
very small beams
BU
Aloka
SSD-280 LS(1984)
sector
3,5
n.d.
3,6 mm/70 mm4,1 mm/110 mm
>200 mm
g/e
g/e
2 mm in 120 mmdepth
<5 mm in 110mm depth
n.d.
g
g/e
3mm
p/g
g
Abbreviations:min :P :
Minimumpoor
max :g :
Maximumgood
n.d. :e :
no dataexcellent
Hz : Hertz

TABLE 3.3: (Contd.)
Assessment of Instrumentation • 25
Identification
US-device
Model(year)
Scanner type
Frequency (MHz)
Frame rate
Beam profile- 1 . focal zone-greatest depth(min. width/depth)
Max. Penetrationdepth
Depth calibration(equidistant)
Measurementcalibration(equidistant)
Max. Resolutionaxial
lateral
Dead zone
Definition
Dynamic range
mln. diameter ofanechoic targets in80 mm depth
Signal-to-noise ratio
Final rating
Comments:
CU
ATL
Ultramark IV(1987)
linear array
5
21 Hz
n.d.n.d.
70 mm
g/e
g/e
n.d.
n.d.
<4 mm
g/e
P
4 mm
P
g
gain too high infocal zone
CU
ATL
Ultramark IV(1987)
sector
3
8,8 & 20 Hz
n.d.n.d.
170 mm
g/e
g/e
n.d.
n.d.
n.d.
p/g
n.d.
4 mm
P
p/g
sub optimal ad-justment of scanner
DU
n.d.
SAL-90A
linear array
3,73
n.d.
2,9 mm/30 mm3,8 mm/70 mm
190 mm
g/e
g/e
2 mm in 120 mmdepth
4 mm in 110 mmdepth
<3 mm
p/g
p/g
2 mm
P
g
gain too high
EU
Hitachi
EUB-450(1988)
sector
3,5
n.d.
3 mm/30 mmn.d.
>160 mm
g/e
g
3 mm in 110 mmdepth
4 mm in 110 mmdepth
<6 mm
p/g
p/g
3 mm
p/g
g
geometricdistortion
Abbreviations:min : Minimump : poor
max : Maximumg : good
n.d. : no datae : excellent
Hz : Hertz

26 • Ultrasound and Radionuclide Images of Liver
TABLE 3.3: (Contd.)
Identification
US-device
Model(year)
Scanner type
Frequency (MHz)
Frame rate
Beam profile- 1 . focal zone-greatest depth(min. width/depth)
Max. Penetrationdepth
Depth calibration(equidistant)
Measurementcalibration(equidistant)
vlax. Resolutionaxial
lateral
Dead zone
Definition
Dynamic range
Min. diameter ofanechoic targets in80 mm depth
Signal-to-noise ratio
Final rating
Comments:
EU
Hitachi
EUB-450(1988)
convex
3,5
n.d.
2,8 mm/35 mmn.d.
>160 mm
g/e
g/e
3 mm in 120 mmdepth
>5 mm in 120mm depth
<6 mm
g
g
3 mm
P
g
geometricdistortion
FU
Hitachi
EUB-22(1981)
linear array
3
n.d.
n.d.2,7 mm/60 mm
170 mm
g/e
g
1 mm in 70 mmdepth
1 mm in 70 mmdepth
<4 mm
p/g
p/g
3 mm
p/g
g/e
small beams,nearfield gain toohigh, partialgeometric distortion
GU
Aloka
Fanson 190
linear array
3,5
n.d.
2,9 mm/50 mm3,2 mm/80 mm
190 mm
g
g
3 mm in 70 mmdepth
4 mm in 80 mmdepth
n.d.
g
p/g
2 mm
p/g
g
slopingphantom's plane
GU
Aloka
Fanson 190
narrow sector
3,5
n.d.
1,6 mm/60 mmn.d.
210 mm
g
g
2 mm in 150 mmdepth
<5 mm in 150mm depth
n.d.
g
P
2 mm
P
g
images too dark
Abbreviations:min :P :
Minimumpoor
max :g :
Maximumgood
n.d. :e :
no dataexcellent
Hz : Hertz

TABLE 3.3: (Contd.)
Assessment of Instrumentation • 27
Identification
US-device
Model(year)
Scanner type
Frequency (MHz)
Frame rate
Beam profile- 1 . focal zone-greatest depth(min. width/depth)
Max. Penetrationdepth
Depth calibration(equidistant)
Measurementcalibration(equidistant)
Max. Resolutionaxial
lateral
Dead zone
Definition
Dynamic range
Min. diameter ofanechoic targets in80 mm depth
Signal-to-noise ratio
Final rating
Comments:
HU
ATL
Ultramark IV(1987)
linear array
3,0
n.d.
2,6 mm/50 mm2,6 mm/100 mm
170 mm
g/e
g/e
2 mm in 60 mmdepth
3 mm in 75 mmdepth
<4 mm
9
P
3 mm
P
g
geometricdistortion
HU
ATL
Ultramark IV(1987)
sector
3,5
16 & 18 Hz
3 mm/40 mm3 mm/80 mm
190 mm
g
g
1 mm in 90 mmdepth
1 mm in 90 mmdepth
<20 mm
p/g
p/g
3 mm
P
g
reverberationartifacts
IU
n.d.
EUM-40(1987)
linear array
3,5
n.d.
n.d.3,3 mm/60 mm
160 mm
p/g _.
g , -
1 mm in 110 mmdepth;,iV^
3 mm in-110 mmdep thy ! ] ' : . ^
<2;tntn.'•
: ' ? : • • ' T
p/g
2 mm
P
g/e
IU
n.d.
EUM-40(1987)
sector
3,5
n.d.
3,5 mm/40 mm4,6 mm/75 mm
150 mm
g/e
g/e
1 mm in 70mm depth
2 mm in 70mm depth
<4 mm
p/g
P
3 mm
P
g
images toodark
IU
Diasonic
Spectra(1987)
convex
3,5
48 Hz
2,3 mm/10mm; n.d.
160 mm
g
g/e
2 mm in 60mm depth
3 mm in 60mm depth
<8 mm
g
p
3 mm
p/g
g
imagestoo dark
Abbreviations:min : Minimump : poor
max : Maximumg : good
n.d. : no datae : excellent
Hz : Hertz

28 • Ultrasound and Radlonuclide Images of Liver
no structure. A high noise level produces aesthetically unpleasent images which may influencereporting but does not affect resolution parameters.
CONCLUSIONS
The image quality of the majority of gamma cameras participating in the survey was acceptableor good. However, an attempt should be made to separately analyze images from gamma cameraswith poor performance. ROC analysis could be employed to estimate the importance of this effect.
The ultrasound equipment used in the project exhibit acceptable or good images at an evenhigher percentage than the gamma cameras. No subgroup of clinical images or evaluation resultswhich should be treated separately need therefore be defined.
A still unresolved issue is the wide variation of acquisition parameters as exemplified by thevariation of exposure levels. An IAEA program for standardization of nuclear medicine procedureswould be essential to improve the efficacy of nuclear medicine studies.
REFERENCES
(1) Bergmann H, Wegst AV, Ganatra R, Souchkevitch GN: Inter- laboratory ComparisonStudy of Nuclear Medicine Imaging Devices-Results of a Joint IAEA/WHO Quality ControlSurvey in 43 Countries. In: Medical Physics '87 (Bergmann H ed), Proc. Ann. Sci. MeetingOeGMP-DGMP-EFOMP, Innsbruck 1987, 579-589
(2) Atlas of liver imaging. IAEA-Technical Document 501, IAEA Vienna 1989
(3) Robb RA: A software system for interactive and quantitative analysis of biomedicalimages. In: Hohne KH, Fuchs H and Pizer SM: 3D Imaging in Medicine, NATO ASISeries, 1990, Vol. F 50:333-361

Assessment of Instrumentation • 29
APPENDIX
ATS Multipurpose phantom Model 539
8 6 4 3 2rrvn
Model 539
J
• ••••o oo oo oo o
' O '_•
o co ;
. ©•
. For Arrays and B Scanmachines use thisscan plan.
For Sector Scanmachines use this
• scan plane.
Figure 3.1. ATS Multipurpose phantom Model 539 used for ultrasound equipment evaluation.
The phantom is made of urethan rubber and shock-proof. It has been choosen for this purposebecause of its reliability even in extreme temperature conditions like tropical area. All the'targets, points,.holes and scale determinations, are calibrated in reference to the standard sound speed.

30 • Ultrasound and Radionuclide Images of Liver
Figure 3.2. Test images of a sector probe of 3.5 MHz frequency.
Top two figures indicated image resolution to be 3 mm in axial and 4 mm to lateral directions. Thelower two figures are for visual estimation of hole phantom and gray scale determinations. The equipmentused was Ultramark 9 of Advanced Technology Laboratory, USA.

Assessment of Instrumentation m 31
Figure 3.3. Test images of a linear probe of 5.0 MHz frequency.
Top two figures indicated resolution of point targets. Because of five layer focusings, beam profilesshown as longitudinal spot echoes showed little changes according to the depth of the target images. Twolower figures indicated the resolution of hole phantoms and of gray scale determination. Round contoursof the holes are well preserved indicating considerable degrees of resolution. Because of the use of higherfrequency, deeper layer beyond 6-7 cm has shown marked attenuation. Proximal dots placed 1 mm eachtowards the axial direction have shown fairly good resolution both in lateral and axial directions.
• ; • *< ;
Figure 3.4. Resolution of sonograms recorded' in vivo from one healthy volunteer.
The right kidney is imaged using linear and sector probes. Frequency used in 3.5 MHz in linear andsector probes. In general, the images of the normal kidney recorded by the linear and sector probes aregood quality, the sector image tends to loose some grayscale pattern because of area broadening. Detailedanalysis of parenchymal echoes are better in linear probe as could be expected from the beam pattern.
Addendum: These Images were supplied by Dr. Sin of the Nuclear Medicine Department, SingaporeGeneral Hospital.

IN01$0005
EVALUATION OF THEMEDICAL IMAGINGPROCEDURES FOR THEDIAGNOSIS OF LIVERDISEASES:
PART - IExperiments on the Effectiveness of
Diagnostic Image Reading in 93 Cases Collected in Japan
KENJIRO FUKUHISA1, YUKIO TATENO1,
MORIMICHI FUKUDA2, Y A S U H I T O SASAKI3,
FUMIO SHISHIDO4 AND TORU MATSUMOTO1
INTRODUCTION
In 1989 the IAEA published the Atlas of Liver Imaging (IAEA-TECDOC-501). This report isa large compilation of the "Evaluation of nuclear medicine imaging procedures for the diagnosisof liver diseases" project conducted over the 5-year period from 1984 to 1988. The purpose ofthe project was to assess the actual state of nuclear medicine diagnostic technical know-how inthe management of liver diseases in the countries of Asia. The work related to the project wasconducted in three phases: first, on the investigation of the state of maintenance of the diagnosticequipments of nuclear medicine (gamma cameras or scintillation scanners) in each participatingcountry, second, on the use of the phantoms for nuclear medicine specifically prepared anddistributed by the IAEA, to assess objectively the detection capabilities of nuclear medicineequipments in routine diagnostic use, and third, collection of scintigrams of patients who haveactually been diagnosed by nuclear medicine procedure from each country accompanied by clinical
(1) National Institute of Radiological Sciences, 9-1, Anagawa 4-chome, Inage-ku, chiba, Japan 263(2) Sapporo Medical University School of Medicine, Mimani 1-Jo, Nishi 16-chome, Chuo-ku,Sapporo,
Hokkaido Japan 060(3) Tokyo Unversity Faculty of Medicine, 3-1, Hongo 7-chome, Bunkyo-ku, Japan 113(4) Fukushima Prefectual College, 1-banchi, Hikarigaoka, Fukushima, Japan 960-12

Evaluation of the Medical Imaging Procedure • 33
information, including the definite diagnosis, informations on the imaging conditions etc. Thephysicians in each country participated in the interpretation and assessment of specific features.The atlas cited above, included the results of the 2nd and 3rd surveys, and, ;n addition, describedimages of typical cases used in the third experiment.
At present, liver diseases still pose a threat to human health and welfare. The diagnostictechnology has shown continuous expansion. Nuclear medicine (NM) is being used practically atall countries, including developed countries. In addition, ultrasound tomography (US) and X-rayCT are used in parallel. MRI is also being used in Japan, the United States and most of thedeveloped and developing countries. In view of these situations, the IAEA extended its previouscooperative research one step further, deciding to survey the current status of the diagnosis ofliver diseases by NM and US in the countries participating in the Phase 2 of the above-mentionedproject. In September 1989, a preliminary meeting was held at Seoul, Republic of Korea, andultimately it was decided to execute this new project using methods similar to those employedin the Phase 1, and Japan was given the responsibility to conduct actual case interpretation testing.
A total of 10 groups from respective countries, Bangladesh, the People's Republic of China,India, Indonesia, Japan, Republic of Korea, Pakistan, the Philippines, Singapore and Thailand,has participated in this project.
CASES COLLECTED AND THEIR CHARACTERISTIC FEATURES
In Phase 1, because of limited time allowance for case collection, the first experiment wasconducted using cases collected in Japan, i.e., the Japan Radioisotpe Association for ImageStandardization collected them from 14 Japanese institutions in 1980 taking into account suchfactors as image quality, lesion definition condition, balance of disease distribution and cost toprepare copy films for evaluation. Scans belonging to one hundred sixteen cases were selectedfrom the scintigrams of 343 cases of liver disease. Distributed copies were produced on a similarmedium (various sizes of X-ray film and photographic paper). Image interpretation startedimmediately following its distribution. In parallel with that, images and clinical data on patients withliver diseases imaged in each country were collected and copies were made on photographicpaper. On completion of image interpretation of the Japanese Cases, image interpretation of scanscollected from participating countries were made in respective countries. The final results weresubjected to ROC analysis.
This time, in Phase 2, we tried to adopt the similar approach. However, now-a-days very fewmedical institutions in Japan are conducting radio nuclide liver scans to diagnose liver diseases.Hence we could not obtain any result of image interpretation experiments on patients examinedsimultaneously by Nuclear Medicine and ultrasound Scanning. Through the cooperation of theDepartment of Internal Medicine of Hokkaido Kin-ikyo Central Hospital and the Department ofNuclear Medicine of Gunma University Medical School, we collected 93 cases with establisheddiagnosis on whom both NM and US had been performed and all clinical records were available.Dates of examination were during 1987-89, however, one case dated back to 1981.
Table 4.1.1 shows the age and sex distribution of the subjects. Thirtyfour (37%) of the 93patients were 60 to 69 years old. and there were equal number of males (47) and females (46).

34 • Ultrasound and Radionuclide Images of Liver
The average age of the males was 52.4 years, the average age of the females was 56.6 years,and this was almost the same as in the Phase 1 Study.
TABLE 4.1.1 DISTRIBUTION OF AGE AND SEX ON 93 CASES COLLECTED IN JAPAN
agesex
male
female
total
10-19
1
0
1
20-29
2
0
2
30-39
6
9
15
40-49
9
3
12
50-59
11
9
20
60-69
14
20
34
70-79
3
4
7
over 80/unknown
1
1
2
Total
47
46
93
malefemaletotal
average52.456.654.4
standard deviation+/- 13.5+/- 12.8+/- 13.2
Table 4.1.2 shows the distribution of clinical liver function tests. We believe that all physicianswho interpreted the images most likely referred to this data. Table 4.1.3 shows the distributionof the tumor-marker examination in the clinical data. Many are within the normal range, and therewere also patients on whom these studies could not be performed. AFP and CEA estimationscould not be done is 15 and 25 patiens respectively.
TABLE 4.1.2 DISTRIBUTION OF FUNCTION TEST CLASSIFICATION ON 93 CASES COLLECTED
resulttest
SGOT
SGPT
Cholineesterase
normal
27
43
12
mildlyabnormal
35
29
26
moderatelyabnormal
17
8
26
severelyabnormal
9
8
20
norecord
5
5
9
total
93
93
93
TABLE 4.1.3 SERUM BIOCHEMISTRY (AFP AND CEA) ON 93 CASES COLLECTED IN JAPAN
(a) AFP
result*
cases
1-50
61
51-100
2
101-150
5
151-200
1
201-300
0
over 450
9
no record
15
total
93
(b) CEA
result*
cases
0 1-1
19
.0 1.1-2.0
32
2 1-3.0
9
3.1-4.0
3
over 4
5
1 no record
25
total
93
*note; unit=ng/ml

Evaluation of the Medical Imaging Procedure • 35
Table 4.1.4 shows the final diagnosis. There were 25 patients with primary hepatocellularcarcinoma (HCC), comprising 26.9% of the total cases. Another 6 patients had metastatic livercancer, making a total of 31 with malignant tumors. There were 5 cases each of haemangiomaof the liver and hepatic cyst, 4 cases of echinococcosis, 1 case each of liver abscess andhematoma of the liver. This hematoma of the liver will also be shown in this atlas later, but itwas caused by post-biopsy hemorrhage. There were 2 cases of focal nodular hyperplasia (FNH),and all together there were 49 cases of mass lesions. There were 14 cases of liver cirrhosisuncomplicated with mass lesions, but if primary biliary cirrhosis (PBC) and idiopathic portalhypertension (IPH) are included, the total number of cases of liver cirrhosis increases to 22. Therewere also 22 cases of liver cirrhosis associated with mass lesions, including HCC, bringing thetotal number of cases of liver cirrhosis to 44. There were 22 cases of diffuse liver disease otherthan liver cirrhosis, consisting of 14 cases of chronic hepatitis, 5 cases of fatty liver and 3 others.
TABLE 4.1.4 CONFIRMED DIAGNOSIS (JAPANESE LIVER IMAGES)
Confirmed diagnosis
Hepatocellular Ca.Metastasis of liverHemangiomaCystEchinococcosisAbscessHematoma of liverFNHLiver cirrhosisPBCIPHChronic hepatitisFatty liverOthers
total
male
142212111
10
842
48
female
114342
1453611
45
total
256554112
1453
1453
93
Table 4.1.5 shows the methods of verificaton of the final diagnosis of the mass lesions.Although, the diagnosis was based on result of imaging in nearly all cases, the final diagnoseswere obtained by biopsy under laparoscopy, in few patients.
TABLE
MethodsConfirmeddiagnosis
HCC*Meta.HemagiomaCystEchinoAbscessHematoma
4.1.5 DISTRIBUTION OF
Angio.
17442411
US
25654411
XCT
25654411
VERIFICATION
Rl Clinicalcourse
25554411
OF LIVER MASS ON JAPANESE CASES
Cytology Histology Surgery
1 41
1
Autopsycases
25654411
Note "Hepatocelluler carcinoma

36 • Ultrasound and Radionuclide Images of Liver
METHODS OF IMAGE INTERPRETATION AND COLLECTION OF THE RESULTS
Fig. 4.1.1 shows the flow-chart for the entire image interpretation experiments. The US andNIV! images of the 93 cases which had been collected were both divided into 2 groups, A andB (A; record numbers JN-1 through JN-47, B; record numbers JN-48 through JN-93). We thensent the NM from A group and US from B group, along with the corresponding brief clinicalexamination data (sex, age, GOT, cholinesterase and -globulin result classifications, AFP and CEAexamination values) to respective countries. Primarily, the NM images were interpreted by nuclearmedicine physicians alone and the US images were interpreted by sonologists alone.Theworksheet used for the image interpretation is shown in Fig. 4.1.2. We, then, asked them to sendthe sheets to Japan as soon as the work was completed. We then sent the remaining NM of Bgroup and the US of A group to them. We again asked them to interpret the images in the samemanner, and finally had both the nuclear medicine physicians and the sonologists to interpret bothmodalities in combination. The reason for adopting such a complicated scheme was that, if wesent all the images, both NM and US, for all of the cases at the outset, they would have interpretedthe US images, which contain an abundant amount of information concerning mass lesions, first,with the resultant risk of a large bias. Another reason is that if, for example, we sent only all ofthe US first then the nuclear medicine physicans would have nothing to do for more than 6 months,and if we sent the NM images next, the sonologists would have nothing to do for the next morethan 6 months. Hence this was the method adopted at the preliminary meeting of RCA held inSeoul, Republic of Korea in September, 1989. When we actually tried carrying out this method,however, it became very involved, the various countries were out of cadence with each other,and there was about 18-month difference between the country in which the image interpretationwas completed first and the country where it was completed last.
However, this was not just a matter of the speed of ;he work, but was closely correlated withthe number of physicians participating in the image interpretations and the time required to forwardthe images within each country, and naturally, the more physicians who participated in the imageinterpretation, the more time was required for the completion of the image interpretation and theforwarding of the images. Be that as it may, as a result of the above, we conducted a varietyof analyses based on the report sheets.
Fig. 4.1.3 shows the scheme of the entire project. As a whole, it was close to 18 monthsdelay than planned at the preliminary meeting. According to the plan, it was scheduled that allof the results concerning the Japanese cases would be presented at the 1st coordination meetingheld in Bandoung, Indonesia in February, 1991, but since image interpretation had not beencompleted in all of the countries, only the NM of A group and US of B group results wera presented.Final discussion of the selection of cases to be used in the Atlas and the features of image interpre-tation of the individual cases, etc., was scheduled for the 2nd coordinating meeting in Delhi, Indiain January, 1993, but actually it was only possible to present the image interpretation results forhalf of the cases collected from the various countries shown in Part il.
The status of collection of image interpretation reports from the various countries in February1993 is shown in Table 4.1.6. The greatest participation was from India (41 participants). A totalof 126 physicians participated in the image interpretation. However, not all of them completed allof the categories; i.e., there were 22 physicians who interpreted only half of the NM images, 16who

Materials
93 cases from2 institutes
Image interpretation
1st session 2nd session 3rd session
Data analysis
NM images
1st half set(A group)
2nd half set(B group)
Clinical
Information
Confirmed
Diagnosis
2nd half set(B group)
1st half set(A group)
Combined
c
0
M
P
u
T
E
R
StatisticalanalysisROC, BVC etc
Imageevaluation
Clinicalevaluation
Casestudy
Fig. 4.1.1 A Flow Chart for the Interpretation of Liver Images collected in Japan.
rn
II
IDQ .
I"
CD
CO

38 • Ultrasound and Radionuclide Images of Liver
I . Palieni ID number
3 . Diagnosis by
4. Image quality
( I ) US images
5. US findings ol lesion
3. Shape of the mass
2 . Doctor' s code n_.n_r column 6: Country" s code (don ' t fill out '
7: Code o l the inst i tut ion in charge
8. 9 : D o c i o r ' s code number m each
inst i tut ion or d o c t o r ' s name
( 2 ) Scintigraphic images
b. Margin
c. Halo
e. Posterior
Scintigram lindirigs
a. Location
In case ofdisplacement
A
(•)
(iii)
Upward
Lateral
d . Internal echo
I . Lateral shadow
( i i ) Downward
(iv) Medial
Shape
: of
UJ Mirror image
c. Size of liverA B
d. intrahepatic (RI) distribution ol radioaciivi ly
l:i rast; ol non-uniform: bjH
| t i Ratlifli.oiloid accumulation "1
(iii) Atrophy( i i ! Hypertrophy
c Exuahepatic Distribution ( i ) SP'e e"
fntorprotanoft of images: ( i ) Normal liver
(iii) SOL (Mass lesion) ' '" : ' i '')
Mass: location, number, disease and confidence levels of mass (In case ol NM. as an estimation)
( 2 ) " ' " ''\ "\ ' " ' ]
(ii) Bone marrow 'J
(ii) Diffuse liver disease
13)
( 4 )
"1
'"66
Code of disease: A:Hepatoma B:Meiastasis C: Other malignancyD: Hemangioma EiCyst F:Abscess
(In case of D or G, fill out the disease name)* i d o n ' t. Wl om
, Hepatic disease without detectable massi ' • ^'-•":••- - v ^ ^ ^ ^ eon,,
( I ) Liver cirrhosis i", QJ D G (2) Fatty liver D D
' I ' ( ? * (3) ( 4 ) ( I ) | 2 )
(3) Acute hepatitis ["] L3 L_: • (4) Chronic hepatitis D D
(5) Others C; • G _
• 5? ' 5 3 "Jmm
: L Jmm
G: Other benign
cp
SOL of liver
n£1
D
n
__ir
c
D
IEL
--S6
- 6 g
• •a u
D
D
(Fill out the name o l the disease)
*")don't fiii oui Iheir cokimn " ^ ^
Note: confidence levelsdefinitely absent (score I)
— - probably absent (score 2)(4j probably present (score 3)
, definite ly present (score 4)
LJ
Fig. 4.1.2 A Report Sheet used for Interpretation of the Liver Images.

Preparative meeting Time limit for sendong
of RCH in Seoul the 1st set reports to
Transportation of MRS
1st half set to
participants
1389
JULY SEP.
Time limit, for sending
the 2nd set reports Lo NIKS
Tlic 1st meeting of RCH
[] liandung, Indonesia
1990
JAN. MARCH
Acquisition andcopy of fi ims
Time 1irait for sendingail reports of Japanese
/cases to NIRS
Transportation' of2nd set to participants
HoccivtxJ report slicet3 from vnrioii3Final transportation contriesof 2nd lialf set to aCountry Final data analysis
JULY
Image selection for
case study III
s.8
II"J
Fig. 4.1.3 Final Schedule on the Interpretation of the Liver Images. CO

40 • Ultrasound and Radionuclide Images of Liver
interpreted only half of the US images, as well as 2 who made their imaging diagnoses basedon both US and NM images without interpreting either of them alone, 7 (in parentheses) whointerpreted both the US alone and the NM alone, and 1 who made a combined interpretation ofjust half of the cases, so that ultimately there were 52 physicians who we could evaluate in allthe categories. The discussion of the image interpretation results presented next has beennarrowed down to the results for physicians who at least interpreted images for all of the casesin each of the individual categories (NM alone, US alone, combined US and NM imageinterpretation by nuclear medicine physicians, or combine US and NM image interpretation bysonologistsj. However, in the analysis of opinions relating to assessment of image interpretationcharacteristics of the individual cases and whether image quality was good or poor, we used allof the information, including the results for physicians who only interpreted half.
TABLE 4.1.6 NUMBER OF READERS ON JAPANESE LIVER IMAGESon 15 Feb. 1994
Status•'~'our,tr;8s
BCDEFGHJK
total
hdf
2125
43
16
US aloneall
816531552
46
NMhalf
1 (1)56
11
22
alone*all
1
4145 (5)8155 (1)3
47 (7)
UShalf
11
1
and NMall
151271
101045
56
Note; "The parenthesized number indicates physicians interpreted both US alone and NM alone, butthey did not combine both to interpret simultaneously.
Although a few additional report sheets were mailed after February 1993, since that was afterthe definitive diagnoses of all of the cases had been publicised at the 2nd coordinating meetingin India, we did not include them in the analysis.
ANALYSIS OF RESULTS OF IMAGE INTERPRETATION
Detection of the presence of liver diseases and mass lesions
Since, in contrast to Phase 1, there were no normal livers among the Japanese cases, it wasimpossible to analyze the detection of liver disease. Nevertheless, when we avereged the truepositive fractions (TPFs) at the 3rd operating point (3rd-0P) versus the sick patients in each oftht; countries, we obtained the results shown in table 4.1.7. The letters are symbols assigned tothe various countries at random and are the same as used through-out this report. The resultsTO? US gione compared favourably in all of the countries, but there was a 20% difference betweenthe niqhesi ar>ci the lowest in the case of NM alone.

Evaluation of the Medical Imaging Procedure • 41
TABLE 4.1.7 TRUE POSITIVE FRACTION AT 3RD OPERATINGPOINT FOR THE DIAGNOSIS OF LIVER DISEASE
Code of
Countries
ABCDEFGHJK
average
TPF at
NM alone
_
95.780.386.095.391.0
100.091.688.198.4
88.4
3rd operating point (%)
US alone
100.097.897.092.098.993.397.897.497.899.3
95.8
The ROC curves for detecting liver mass lesions are shown in Fig. 4.1.4 (a) through (d). Theletters assigned to the various curves are the same as the symbols in table 4.1.7, and the thicklines and the "•" represent the overall average values. In addition, the results for interpretationof NM alone by nuclear medicine physicians are shown in (a), the results for interpretation of USalone by sonologists are shown in (b), the results for interpretation of both NM and US by nuclearmedicine physicians in (c), and the results for interpretation of both modalities by sonologists areshown in (d). Obviously there are fairly large differences in the average values from country tocountry in the case of NM alone. More specifically, the TPFs are relatively high in countries A,K and B, and relatively low in countries C, E and H, however, no statistical significance wasdetected among them. In the case of (b), US alone, on the other hand, the TPFs were higherthan in (a) and the false positive fractions (FPFs) were lower. The results in the individual countrieswere very similar, and although the results in country K were high, no statistical significance wasdetected among the individual countries. In the case of (c), reports were received from 5 countries.There was an overall improvement in both the TPFs and FPFs compared to NM alone, but notas high as in US alone. Countries E, F and K had similar results, but country J had a high TPFand FPF, obviously indicating over reading, country H had a somewhat low TPF. In the case of(d), however, the results were almost the same as in (b), and apart from the slight overreadingin country J, no special characteristics were observed. This shows that mass lesions which couldnot be detected by NM alone were noted by nuclear medicine physicians, although not all, whowere not very familiar with US could observe the new findings when NM was added to US. Fig.4.1.5 (a) and (b) shows the results for each of the nuclear medicine physicians (individually) whenUS was added to NM in countries E and H.
Qualitative diagnosis of mass lesions, malignant or benign tumours
Fig. 4.1.6 (a) through (d) show the ROC curves for malignant tumours of the liver. The TPFshere are proportions of when as a result of image interpretation of cases in which the definitivediagnosis was primary hepatocellular carcinoma (HCC) or metastatic liver cancer at least they

False positive fraction
10 20 30 40 50 60 70 80 90 100
g
I<x>
1
10
A
r\
—-e—
D - -
- - E - -
I—
1
- — G — -
— - H
J - - -
- - K - -
Country A
Country B
Country C
Country D
Country E
Country F
Country G
Country H
Country J
Country K
Average
asound and fjnuclide Im
at
of Liver
Fig. 4.1.4 (a) ROC Curve for Japanese Liver mass by NM alone

False positive fraction
60 70 80 90 100
8Q.CD
Fig. 4.1.4 (b) ROC for Japanese Liver Mass by US alone
A
- — B - - -
— © —
D- -
- - E - - -
—-G—-
—-H
— J —
- - K - -
Country
Country
Country
Country
Country
Country
Country
Country
Country
Country
Average
A
B
C
D
E
F
G
H
J
K
Eva,
§tion oith
en
Q.
2
I3"
g P
roced
ure *
CO

False positive fraction
10 20 30 40 50 80 90 100
1H—
ICO
oQ_0)
100
90
\ I
Q
-—•B- —
C*
r\
- - - E - - -
i
-G—
— -H
- - K - —
Country A
Country B
Country C
Country D
Country E
Country F
Country G
Country H
Country J
Country K
Average
raso
un
d and F
g.oc
te Images of
Livei
Fig. 4.1.4 (c) ROC Curve for Japanese Liver Mass by NM combined with US by NM Physicians

CQ o Q LU
Evaluation of the Medical Imaging Procedure • 45
O
^*c3oo
3oO
£
3oOi
I
11
^£^c:3oO
1
i
3oo1
LU
i
3oo
L
•£3oO
c3
^
3oO
i
11
^
3oO
1
1
3oo1
i
curacoc5><
1
[CD_goco
o
1oQ.
CD
co
x:'IT3a>
1Q
oo
co
IS
CD>
ccao.ca
ooDC
O)
UOJIOBJJ.

False positive fraction
10 20 30 40 50 60 70 80 90 100
.11Q.0)13
100
90 -
80 -
70 -
60 -
50 -
40 -
30 -
20 -
10
0
-
-
- I/1
1/
ai *
?
i
1• /
/
/
V"
/
1 1 1 1 1 l_____rtV7j3- i-^
-2-
-3--- 3
!o§Q.&)
3
IsI!1
Fig. 4.1.5 (a) ROC Curves for Japanese Liver Mass, Personal Results. Country E by NM alone

False positive fraction
0 10 20 30 40 50 60 70 80 90 100
g
I>Q.
3
10
-2
—-3-
- - - 5 - - -
1
2
- 3
- 4
5
I5"Q
i
i
3o(D
Fig. 4.1.5 (b) ROC Curves for Japanese Liver Mass, Personal Results. Country H by NM alone.

coo
>
1Q.CD
False positive fraction
10 20 30 40 50 60 70 80 90 100100
20
10
-A Country A
-B--
--e-
• - D -
• - E - -
CO
no§Q.ta
a
Q.
Country B ?
Country C 2_
Country D <§0)
- — G — -
- - K - - •
Country E
Country F
Country G
Country H
Country J
Country K
Average
o
Fig. 4.1.6 (a) ROC Curves for Japanese Liver Malignant Tumour by NM alone

False positive fraction
0 10 20 30 40 50 60 80 90 100
cg
I>1
100
90
80
70
60
50
40
30
20
10
**-
KK/
A
- — B - —
—-e—
D - -
p
I—
1
—-H
j - - -
K - *
Country A
Country B
Country C
Country D
Country E
Country F
Country G
Country H
Country J
Country K
Average
Evaluation
1Medleal In
to(Q
5"
Fig. 4,1.6 (b) ROC Curves for Japanese malignant tumour by US alone

False positive fraction
oCO
.1oQ.
i_
0100
10 20 30 40 50 60 70 80 90 100
90
80
70
60
50
40
30
20
10
0
-
—
i" //m
tii
i i
ffittr11
i
i i i
/
1 ! i_ r _ ^ ^ r ^ j ^ '
A
- --B—-
ct
D - -
- - E - -
rn
- G — -
— -H
J- - - -
- - K - -
Country A
Country B
Country C
Country D
Country E
Country F
Country G
Country H
Country J
Country K
Average
ow
c:(0
o
1Q.
S:onuclide Ima
to
a'Liver
Fig. 4.1.6 (c) ROC Curves for Japanese malignant tumours of liver by NM combined with US by NM Physicians

Evaluation of the Medical Imaging Procedure • 51
00 O Q UJ O
c3oO
c3oO
cp
c3OO
i
i
1
c3oO
iTi
c3oO
1
UJ
i
c3oO
L
c3
8
6
c3oO
1
1
•11
c3oO
i
i
c3oO
K- —
i
0
I<0
O
OCO
g"5
.18Q.(1)
J/3
oo
1
oCO
1
s1
g
1 " —^=1
oin
1 1
oCO
•oa)c!ooo
Q)
(0
O
w0)
8-—3
D
=3
oooDC
U>
UOJJOBJJ e/viiisod

52 • Ultrasound and Radionuclide Images of Liver
replied HCC or metastatic liver cancer, or else indicated another malignant tumor, e.g., malignantlymphoma. The meaning of the individual figures (a) to (d) and the symbols in the figures is thesame as in Fig. 4.1.4. In contrast to mass lesions, the differences between the various countriesin (b) and (d) are large, and the TPFs on 3rd-OP are characterized by declining an average ofclose to 10%. From the very start the qualitative diagnosis of mass lesions from scans has oftenbeen difficult, especially in early cancers, etc., and there is the history of being limited to diagnosethe presence of a space occupying lesion (SOL) in the Phase 1 efficacy of nuclear medicine alone.According to the results of the analysis here, while as a whole maintaining TPFs equal to SOLdetection ability, the FPFs on 3rd-0P improved about 20% over the diagnosis of the presenceof an SOL. This suggests that, at least in relation to malignant tumours, image interpretation criteriafor scintiscans were fairly consistent in all of the countries. When nuclear medicine physiciansinterpreted the images combining US with NM in (c), while there was over reading by some, theTPFs compared fairly well to when US was used alone (Fig. 4.1.6 (b)). The mean 3rd-0P TPFexceeded the mean value with US alone, and the differences between countries were smaller.Since there appears to be individual differences here too, we show the individual results in countriesF and K in the case of NM alone in Fig. 4.1.7 (a) and (b). Fig. 4.1.8 (a) through (d) show theROC curves for benign mass disease of the liver. Fig. 4.1.8 (a) shows the difficulty of qualitativediagnosis of liver mass lesions by NM alone, as mentioned eariier, i.e., the TPFs of the ROCcurves by the nuclear medicine physicians, whether interpreting NM alone or interpreting bothmodalities together, never reached 40%, and only countries A and B (only 1 image interpretingphysician in each) surpassed 50% at the 3rd-OP. In the case of image interpretation by nuclearmedicine physicians who combined both modalities, except for country G (only 1 participant) whichstood out high, nuclear medicine physicians had no influence by US. Moreover, in the case ofdiagnosis by sonologists by US alone, countries B and K have TPFs slightly higher than the overallaverage, and their dyerage also approached 50% at the 3rd-0P and are higher overall than withNM, however, no large differences from NM alone can be seen in terms of the FPFs. Thedifferences between individual countries are small, suggesting individual differences betweensonologists are small as well. It was also almost impossible to find any influence of NM on theROC curves for the results of diagnosis by sonologists using both modalities.
Table. 4.1.8 shows striking figures of misdiagnosis among the benign tumors of liver. CaseJN-1 was a patient with a final diagnosis of focal nodular hyperplasia (FNH) associated with a10 mm diameter mass in the anterior portion of the right lobe, who developed alcoholic hepatitisas a complication. Fifty-eight out of 68 nuclear medicine physicians made a diagnosis of metastaticliver cancer (52 definitely positive, 3 probably positive, and 3 possibly negative) or primary livercancer (total: 8), and a mere 8 suspected a benign tumor disease (1 definitely positive, 1 probablypositive, 6 possibly negative). Case JN-35 was a patient with a 150 mm diameter, large hepaticcyst on the anterior surface of the right lobe, the front surface of the left lobe and the center ofthe left lobe, but as many as 15 of the 70 nuclear medicine physicians replied that it was definitelypositive or probably positive for primary liver cancer. Case JN-46 represents a patient found tohave a 100 mm diameter hepatic hemangioma in the posterior portion of the right lobe associatedwith chronic hepatitis, but 24 of the 68 nuclear medicine physicians diagnosed it as primary livercancer. In addition, Case JN-59, a patient with hepatic echinococcosis who had a 30 mm tumorin the posterior wall of the right lobe, and while there were those who suspected liver cirrhosison the basis of NM alone, A mere 12 of the 48 physicians suspected the presence of a mass,and the diagnoses were scattered among primary liver cancer (1), metastatic liver cancer (3),

TABLE 4.1.8 FALSE DIAGNOSIS ON 4 CASES OF HEPATIC BENIGN TUMORS BY NUCLEAR MEDICINE
Abnormality
SOL (mass)
HCC
Matastasis
Hemangioma
Cyst
Abscess
Other benign
JN-1
-
2
9
60
10
67
68
67
68
FNH andhepatitis
+-
0
3
1
3
0
0
0
0
alcholic
+
0
10
4
3
1
0
1
0
++
66
46
3
52
0
0
0
0
JN-35
-
0
11
55
69
68
46
49
69
Liver
+-
0
2
0
0
C
1
1
0
cyst
+
4
6
3
0
0
9
9
1
++
66
51
12
1
0
14
11
0
JN-46
-
1
4
44
64
48
49
45
65
Hemangiomahepatitis
+-
0
2
2
0
0
0
1
0
+
1
10
12
4
0
10
45
1
with
++
66
52
10
0
0
9
7
2
JN-59
-
4
36
47
45
45
48
42
Liverechinccoccosis
+ - •
5
3
0
0
1
0
2
+
22
9
1
3
2
0
4
++
17
0
0
0
0
0
0
IT*:valuatio
sI<3
|
piCO

False positive fraction
10 20 30 40 50 60 70 80 90 100
oo
iCO
oQ.CDi—
100
90
80
70
—2 —
—3--
- - - 5 - - -
- 1
- 2
- 3
- 4
5
o
§a>3
53
Q
Fig. 4.1.7 (a) ROC Curves for Malignant Tumour, Personal Results Country F by NM alone

False positive fraction
0 10 20 30 40 50 100
.1
100
-H
- 2 - —
- 3 - -
- 1
- 2
- 3
m
I
Fig. 4.1.7 (b) ROC Curves lor Malignant Tumour, Personal Results Country K by NM alone
8
I

False positive fraction0)
100
oCO
iCO
o<D
H
-B--
-e-• - D -
• -E -
<5—
K
Country A
Country B
Country C
Country D
Country E
Country F
Country G
Country H
Country J
Country K
Average
2(0o3
Q.
§
Fig. 4.1.8 (a) ROC Curves for Japahese Liver benign Turmour by NM alone

False positive fraction
10 100100
co
1IIQ.
A
- - B - -
—-e—
D - -
- - E - -
1
— G—-
1 1
J - - -
. ix _ .
Country A
Country B
Country C
Country D
Country E
Country F
Country G
Country H
Country J
Country K
Average
Evaluiitio
n <
1g.
fi>
I"
Fig. 4.1.-8 (b) ROC Curves for Japanese Liver benign tumour by US alone

False positive fraction
o
oCO
>
oQ.
10010 20 30 40 60 70 80 90 100
A
A
- - - - •B -—
r>
D- -
- - E - —
r-i
-G—-
— H - -
—j —
- - K -
Country
Country
Country
Country
Country
Country
Country
Country
Country
Country
^ \ V W^^ t? ^ ^t ^^
Average
A
B
C
D
E
F
G
H
J
K
•89
Ultra
V)ocQ.&>aa
g.
a
3to
<Q(D(AQ
s
Fig. 4.1.8 (c) ROC Curves for Japanese Liver benign tumour by NM combined with US by NM Physicians

False positive fraction
10 20 30 40 50 60 70 80 90 100
g
0)
1Q.Q)3
100
90 -
80 -
70 -
60 -
50 -
40 -
30 -
20
10
0
1
-
/
W -i /•/ yI
i1
i i
,y
.^yA Country A
6— Country B
— - € Country C
D Country D
E Country E
F Country F
— Q — Country G
H Country H
j- — Country J
— K — Country K
% Average
Fig. 4.1.8 (d) ROC Curves for Japanese Liver benign tumour by US combined with NM by Sonologists
rn
I5"
Q.
I
dS
Iento

60 • Ultrasound and Radionuclide Images of Liver
hepatic cyst (3) and benign masses in liver (other than hemangioma, liver cyst and liver abscess)(6). We have published many cases in which image interpretation possessing these characteristicswere observed.
Diagnosis of diffuse diseases
The ROC curves for liver cirrhosis are shown in Fig. 4.1.9 (a) through (d). In this instance,we treated patients who had liver cirrhosis as a complication of mass lesions as having cirrhosis.Although there were large differences from country to country, countries in which they interpretedliver cirrhosis by each modality and countries in which they did not are indicated very clearly. Morespecifically, hardly any of the nuclear medicine physicians, except those in countries C and D,or the sonologists, except those in countries G and K, diagnosed liver cirrhosis. The same wastrue even when the modalities were combined, except for the sonologists in countries B and K.In this instance there was only one physician serving as a subject in country J. Fig. 4.1.10 (a)and (b) show the individual results for countries E and J, which showed intermediate TPFs in Fig.4.1.9 (a) among the diagnoses of nuclear medicine physicians by NM alone. In each of thecountries there was a mixture of physicians who interpreted the images as liver cirrhosis andphysicians who did not, and it is clear that the average value in each country was determinedby whichever percentage was greater.
The results of ROC analysis for diffuse liver diseases other than liver cirrhosis are shown inFig. 4.1.11 (a) through (d). For each modality alone and the combinations there were countriesin which diffuse liver diseases were diagnosed well, countries in which they are hardly diagnosedat all, and countries in between. Many of the countries with intermediate results, as seen in Fig.4.1 7and Fig. 4.1.10, clearly had a mixture of physicians who interpreted the images and thosewho did not, even within the same country, however, country K aside, the results of interpretationby NM alone in country F and country G and of combined interpretation by nuclear medicinephysicians in country F were relatively good, whereas the TPFs in both of country A and B werelow. In the case of countries A, B, F and G, however, the results are from oniy 1 physicians,and only extremely individualistic results were shown. Moreover, hardly any liver diseases wereinterpreted regardless of modality or even when they were combined.
Analysis according to mass size and image quality evaluation
We focused on mass lesions alone and assessed whether the size of the masses had anyeffect on ability to diagnose them. Cases in which the masses were considered multiple in thefinal diagnosis and there was no particular mention on size were treated as being large massclusters, and the average ROCs as a whole for cases in which there were other mass findings,excluding cases in which the masses had a maximum diameter of 10 mm or less, 20 mm or less,30 mm or less, 40 mm or less or 50 mm or less, are shown according to each modality alonein Fig. 4.1.12 (a) and (b). The meaning of (a) and (b) is the same as up to Fig. 4.1.10(a) and(b). Although there are differences in degrees, when we excluded the small masses, the TPFsimproved with both modalities, but the improvement was especially marked when NM images wereinterpreted alone. In Fig. 4.1.12 (b), TPFs value between "30 mm or less" and "50 mm or less"were the same.

False positive fraction
10 20 30 40 50 60 70 80 90 100
oo
Q.
CD
100
90
80
70
60
50
40
30
20
0
-
-
!i
f4
kIV
I
i
V
y
/
*
I
5
^^,
' **&
' >
r
i
y
/
/
/'
/
I
y
'' /
i
\\\
s
y/ ,
/ '
/
\ I
Fig. 4.1.9 (a) ROC Curves for Japanese Liver Cirrhosis. By NM alone

False positive fraction en
10 20 30 40 90 100100
soCD
—A—
— B - -
- • € - •
- - O -
--E--
—F—
-J
-K
Country A
Country B
Country C
Country D
Country E
Country F
Country G
Country H
Country J
Country K
Average
I§
a
I
f
(0
Fig. 4.1.9 (b) ROC Curves for Japanese Liver Cirrhosis. By US alone

False positive fraction
10 20 30 40 50 60 70 80 90 100
oo
a)
oQ.CD
100
90
80
70
60
£ 50
40
30
20
10
-
_
-;
i
"j!1
r
i
/
/
\r
V ;i
i
JN
/
*y^
' !
y*i
s
1
•
;
1
y'
y''
y
y''
1 I
—--
^ yy' '
1
y
•
y
,y',y
y
i
S
A
- —e—-
—-c—
D - -
- - - E - -
|—1
G - —
1 1
—j —
_i
Country A
Country B
Country C
Country D
Country E
Country F
Country G
Country H
Country J
Country K
Average
mS
Ion ofthe M
edical i
I
Fig. 4.1.9 (c) ROC Curves for Japanese Liver Cirrhosis.By NM Combined with US by NM Physicians
I"J8
CO

g"o
>
COoa.CD
100
90 -
80 -
70 -
60 -
£ 50 -
40
30
20
10
False positive fraction
10 20 30 40 50 60 70 80 90 100
-
-
B ,
~ f/• I , 1 '
"1,1i
f
! I I
*""'---'"S'''
s
\yyS y
-'^'^yjr
yyyy
y ,y
A
--6- —
—-e—
D - -
_ . . £ . . _
r
-G—-
—-H
— J —
- - K - -
Country A
Country B
Country C
Country D
Country E
Country F
Country G
Country H
Country J
Country K
Average
2c-lltrasound,
Q.
Q.
§
l
3,r-
Fig. 4.1.9 (d) ROC Curves for Japanese Liver Cirrhosis. By US combined with NM by Sonoiogists

False positive fraction
10 20 30 40 50 60 70 80 90 100
oo
5
o
100
so -
80 -
70 -
60 -
50
40
30
20
10
0
1
-
-
(y-'
'} 119 /•<T 1
P< '' • /
i /
J. /
;/
i i
''''''S''
1 1 ] 1
_ f '' S* * ~ S
1 I j0"
• - - • } - - -
---2 —-
—3---
.-4-.
--5---
1
2
3
4
5
Fig. 4.1.10 (a). ROC Curves for Liver Cirrhosis by Personal Results. Country E by NM alone
m
Io"
ct.
I(Q
I
en

False positive fraction 05cr>
0 10 20 30 40 50 60 70 80 90 100
o
CD
1CDZ!
100
90 -
80 -
70
60 -
50 -
40 -
30
20
10
1 1
4 ' ' '
_4
_i _r.y
'•5 y
i /
1 '
/ ' -//y
1
'\y' / '
1
,y:yy/
-—•2 — -
- - - 5 - - -
1
2
3
4
5
o
Q.
Q.
9too
Fig. 4.1.10 (b) ROC Curves for Liver Cirrhosis by Personal Results. Country J by NM alone

False positive fraction
80 90 100
COH—
.11Q.CD
100
90 -
80 -
70 -
Fig. 4.1.11 (a) ROC Curves for Japanese Liver Diffuse Diseases. By NM alone
A
- - & -
— -€
D - -
- - E - • -
i -i
— - H - - -
- - K- —
Country A
Country B
Country C
Country D
Country E
Country F
Country G
Country H
Country J
Country K
Average
'aluatior,
1' Medit
S
!
1"J1i•

co
tsCC
H—
CD
'55oQ.
100
90
80
70
60
50
40
30
20
10
10
False positive fraction
20 30 40 50 60 70 80 90 100
1
-
-
1
I
w
1
i
iK/
/ /; /
if1y
w
V
yy
1
. - -
y **
y
/
I 1
^ y y, i'
1
/' /
i
y
1
wA
# "\
13
JP__
D-- -
n;
I
- - - < 3 - - -
LJ
J - - -
- -K- —
Countjy
Country
Country
Country
Country
Country
Country
Country
Country
Country
Average
a
C
D
E
F
G
H
J
K
co©
aso
un
d<
S
Sr
ages ofL
iver
Fig. 4,1.11 (b) ROC Curves for Japanese Liver Diffuse Diseases. By VS alone

False positive fraction
10 60 70 80 90 100
co
'woQ_
CD= 3
100
10
F-j. 4.1.11 (c) ROC Curves for Japanese Liver Diffuse Diseases.By NM Combined with US by NM Physicians
—A Country A
--B— Country B
--G Country C
- -D Country D
-- E Country E
—F Country F
- - G — Country G
--H Country H
- - J Country J
- - K - - - Country K
""-#-»-" Average
rn
I
IQ.s
CD
O)

False positive fraction
10 20 30 40 50 60 70 80 100
oCD
*+—
Ic/5oQ.CD13
1003(nO
§
3Q.
A
B--
•€
D
E
— Country A a
I•- Country B o
I- Country C §•
<3—
— K--
-- Country D «
- Country E ^
- Country F
Country G
• - Country H
- - Country J
- Country K
- Average
Fig. 4.1.11 (d) ROC Curves for Japanese Liver Diffuse Diseases. By US combined with NM by Sonoiogists

False positive fraction
100
oCO
Q)
"8Q .CD
• less than 10 mm
— • — less than 20 mm
— -A less than 30 mm
@ less than 40 mm
0 less than 50 mm
I5
IQ.
8
!I"JsQ.
I4.1.12 (a) ROC Curves for Size of the Liver Mass by NM alone

False positive fraction
10 20 30 40 50 60 70 80 90 100100
o03
IoCL
CD
less than 10 mm
less than 20 mm
a>o
a&>a33
a.
— - A less than 30 mm -»
Fig. 4.1.12 (b) ROC Curves for Size of the Liver Mass by US alone, Overall.

Evaluation of the Medical Imaging Procedure • 73
In Fig. 4.1.13 (a) and (b), ROCs are analyzed excluding those in which image quality wasrated poor by 5% or less, 10% or less or 15% or less, respectively, of the physicians who interpretedthem. Here too, there was a clear tendency for TPF to increase and FPF to decrease as caseswith poor images were eliminated, but this was shown not to have as much influence as size ofliver masses.
5. DISCUSSION
Thus, with 10 countries participating, we have described a portion of the results of an analysisof data concerning image interpretation while referring to brief clinical test data relating to 93Japanese cases in which nuclear medicine and ultrasound tomography examinations had beenperformed. In the image interpretation/recorded data, in addition to the final confirmed diagnosis,mass size, and information about image quality were also obtained. There were descriptive itemsfor mass site, and the special features of the scintiscan images and ultrasound tomography images(see Fig. 4.1.2), but because these were not always recorded throughly, analysis is fairly difficult.In future studies it may be possible to conduct analyses which will fully record the parameters.
We have cited similar results regarding the presence of liver disease in all of the countries,and failed to observe anything which constituted any particular problem. According to the overallaverages, however, with 88.4% for NM alone at the 3rd operating point and 95.8% for US alone,the latter proved higher, and additional improvements in TPF of about 2% were observed whenthe modalities were used in combination.
In regard to the detection of mass lesions, TPF values were lowest and FPF values werehighest with NM alone, and when compared according to country there were no large differences.The results for US alone were extremely close among all countries; TPF were high, FPF werelow, and detectability was found to be extremely high. In addition, diagnosis of the presence ofmasses by nuclear medicine physicians clearly improved as a result of interpreting US incombination with NM. This is because the resolution of NM is lower than that of US, and it isdifficult to detect masses 2 cm in diameter or less. Actually, there were 19 cases with a maximumdiameter under 35 mm. and when we calculated ROCs excluding them, with overall means atthe 3rd-0P of 6.4% with US alone and 10.0% with NM alone, TPF was found to have improved.
With respect to the qualitative diagnosis of masses, diagnosis of benign masses by NM alonewas found to be particularly difficult, and there was not much improvement in ability to diagnosethem when US was used in combination. Nevertheless, some physicians, by taking full advantageof the special features of both modalities, made relatively accurate diagnoses. With US alone,on the other hand, physicians who knew the special features of the patterns (shape of the mass,margin, halo, internal echo, posterior shadow/enhance, lateral shadow, etc) made accuratequalitative diagnoses of many masses, but since not all of the sonologists always diagnosed inthe same way, we believe that their education will become an increasingly important topic in thefuture.
In the case of liver cirrhosis, among the diffuse liver diseases other than liver cirrhosis, it wasreported even in the results of the Phase 1 analysis that there were countries in which theyinterpreted the images well, countries in which they hardhy ever made the diagnosis and countries

False positive fraction
100
i"803
100
less than 5% poor
(no
§Q.ai
2Q.o'3
IIless than 10% poor "§
CO
— -4 less than 15% poor
I"
Fig. 4.1.13 (a) ROC Curves for Image Quality of Liver Mass by NM alone

False positive fraction
0 10 20 30 40 50 60 70 80 90 100
o• •5
CO
ItooQ.
i _
100 i I I I
less than 5% poor
less than 10% poor
less than 15% poor
§
3-
Fig. 4.1.13 (b) ROC Curves for Image Quality of Liver Mass. US alone, Overall 3!

76 • Ultrasound and Radionuclide Images of Liver
intermediate between the two, and that was apparent in the results this time as well. There weremany countries in which the TPF was far higher with NM alone than US alone, but there werealso countries in which many physicians hardly interpreted the images at all. Although severalphysicians who apparently received their educational training based on a considerable numberof cases in the developed countries had high TPFs with US alone, almost all of them had lowFPFs. Moreover, the difference between physicians who interpreted the images and those whodid not was even more pronounced in the case of NM alone for diffuse liver disease other thancirrhosis and the results were exactly the same as in Phase 1. They included 4 cases of fattyliver, which is claimed to be unfavorable for interpretation by nuclear medicine. And although someof the nuclear medicine physicians did not reply that, the confirming level was probably positiveor possibly negative, they nevertheless accurately indicated fatty liver, and we did not excludefatty liver cases on the ROC analysis. In the case of US alone, only some of the physicians, whoappeared to have received proper nuclear medicine education, had a relatively high TPF valuesin the same way as liver cirrhosis, whereas almost all of them appeared not to have interpretedthe images.
The results show that some of the nuclear medicine physicians have not had much practicein interpreting US images or that the addition of US had hardly any influence at all. However,other nuclear medicine physicians extracted great deal of information from the US and accuratelydiagnosed diffuse liver diseases, which have also special scintiscan features, especially in livercirrhosis. We believe that broader education/instruction in such image interpretation practice usinga combination of modalities should be carried out in countries in which hardly any favorable trendhas been observed this time. Moreover, since liver cirrhosis and chronic diffuse hepatitis havehigh risk indices for the development of liver cancer, we also believe it is urgent to expand educationand the availability of technology to diagnose these diseases based on the distinctive characteristicsof the images as much as possible.
The purpose of the efficacy study discribed here was not an international competition. It wasto analyze the image interpretation posture of each country and to provide basic information whichwould be useful for education required in the future and for planning and executing aid, and itwas hoped that as many physicians as possible in each country would participate and interpretthe images. Due to the circumstances in each country we can hardly say that our hopes werealways completely fulfilled, but we certainly did obtain quite a few results.
Since the films which we showed here has been released to each of the countries, we willuse the clinical data which is scheduled to be sent at a later date, continue the interpretationexperiments in each of the countries, with increase in the number of interpreting physicians andthe number of cases, and continue expanding. This will be useful in improving diagnostic capablityon each of the modalities in all of the countries. And at the same time, it will be useful in improvingability to diagnose liver diseases throughout the world. We also believe that this is the responsibilityof the physicians in each of the countries that participated in this efficacy study.
6. CONCLUSION
We collected images and clinical data from 93 cases with suspicion of liver diseases, on whichscintiscans and ultrasound tomograms had been performed at 2 Japanese institutions. We then

Evaluation of the Medical Imaging Procedure m 77
copied the images faithfully, sent them together with some clinical test data to each of theparticipating countries and had them interpreted. Ultimately 126 physicians participated, and thefollowing findings have been obtained based on our analysis.
(1) Diagnosis of the presence of mass lesions of the liver by US yielded results that comparedfavorably in all of the countries. Moreover, US provided better detectability of masslesions than NM.
(2) There were fairly large individual differences in the diagnosis of the presence of masslesions of the liver by NM. and this ultimately was the difference between the variouscountries.
(3) There were also large individual differences between the two modalities in thedetectability of malignant tumors. FPF values were lower for US than NM.
(4) The detectability of benign tumours was poor by both methods, and there were also largeindividual differences. Thus, it will be necessary to provide education in qualitativediagnostic methods using each of the modalities.
(5) In regard to liver cirrhosis and other diffuse liver diseases, there are countries in whichimage interpretation is performed and countries in which it is not, as well as physicianswho interpret images and those who do not. This tendency was particularly prominentamong sonologists. In view of the high risk of progression to primary liver cancer,however, it will be necessary to provide proper education in techniques of diagnosingthem from images.
(6) The results of assessing ability to make diagnosis based on image evaluation showedthat diagnostic ability increased when poor image quality cases were eliminated. It willbe necessary to produce images under as favorable conditions as possible to improvephysicians' ability to make diagnosis.

IN01$0006
EVALUATION OF THEMEDICAL IMAGINGPROCEDURES FOR THEDIAGNOSIS OF LIVERDISEASES:
PART - IIExperiments on the effectiveness of diagnostic
interpretation of Liver images in 103 cases collectedfrom nine participating countries
INTRODUCTION
Part one of this report was a computer analysis of the results of nuclear medicine scintiscan (NM)and ultrasound (US) images obtained from a collection of liver disease cases in Japan, reportedand interpretated by 126 physicians from 10 participating countries.
While conducting Part I, we collected images for use in the Part II of this study from participatinginstitutions in each of the participating countries. These images were from liver disease caseswith conditions similar to the cases in Part I of this study and with clinical informations includingfinal diagnoses. From those cases,, we selected cases considered to be appropriate for this study.The images from the selected cases were copied onto the same type of recording medium asthat used for the originals, and was added with brief clinical informations (sex, age, liver functiontest classification, and tumor marker examination of AFP and CEA values) to each copy. We thendistributed these copies among all the participating countries and asked physicians to interpretand give a final diagnosis in each case.
The same ten countries that participated in Part I of the study participated in Part II;Bangladesh, People's Republic of China, India, Indonesia, Japan, Republic of Korea, Pakistan,The Philippines, Singapore and Thailand.

Evaluation of the Medical Imaging Procedure m 79
COLLECTED CASES AND THEIR CHARACTERISTICS
Fig. 4.2.1 a and b show the worksheet that we used for the collection of clinical information. Fig.4.2.1 (a) includes the patient ID, history, clinical findings (subjective complaints, objectivesymptoms and the clinical laboratory investigations), and the types of machines used for NM andUS including the measurement conditions. Fig. 4.2.1 (b) includes the final diagnosis of liver disease,methods of verification of liver mass, locations and sizes of liver disease. We sent 100 pairs ofthese worksheets to each participating country and asked physicians to start collecting casesbeginning at the end of 1989. Most countries sent cases to us after the first coordination meetingin Bandoung, Indonesia in February of 1991.
Finally, in November of 1991, we were able to obtain cases from all participating countriesand immediately began to compile the informations. Each participant country supplied 12 to 30cases each, for a total of 189 cases, as exhibited in table 4.2.1. From these cases, a total of
TABLE 4.2.1 NUMBER OF CASES COLLECTED FOR LIVER IMAGES FROM PARTICIPATINGCOUNTIES
Country
BangladeshP.R.ChinaIndiaIndonesiaR. KoreaPakistanPhilippinesSingaporeThailand
Total
Received by NIRS
192526122328123014
189
Acceptable
48
209
15144
1811
103
Unacceptble
1517638
148
123
86
Media of lmages:Scintigrams
Sonograms
= 101 cases of X-ray films and2 cases of Polaroid films
= 92 cases of X-ray films and11 cases of Polaroid films
103 cases were selected by eliminating cases that satisfied any of the following conditions:1. the focus of the liver mass that is documented as the final diagnosis is not clearly observable
in the image accompanying the documentations;
2. the location of the liver masses has been marked or recorded on the image;
3. the cases without established diagnosis,
4. the case does not promote the optimum procedure for the diagnostic interpretation of images;or,
5. the selection of the case will result in a statistical bias.

80 • Ultrasound and Radlonucllde Images of Liver
* ) don't Ml out
I . Paten! ID number LiJ L J J 2- Country name 3. Institution> I J A i
4. Information of Patient
( I ) Name of Patient (2) Sex Jf 9 , <3) ASe a t l i f S t examination ! j _ _ _ ' years old
(4) Date of US examination \$[ i J y [_J |m |_J U W D a l e o f N M examination 19 L_!_J y '_:_.. j mi . . . l_J dV To II ,Z I I « IS It II ;8 P9 IQ
5. Clinical Oale at the lime of examination *)doirt mi out
(I) Past history <j) L J L J J - J al I I I V-old
( i i ) I I I I I at I I I v . o l d L l ._!
ini)
2) Clintcaf findings
a- Subjective complaints
. n a, (j) («) (i) t?) o ) <*. Note; score(a) Anorexia G • G Q (b) Oppressive feeling D G G D I-absent, normal
u ' ^~^~".—" *J ~~~—~' 2 •••mild, minimum
(c) Wei8ht loss D D G D W) Pain LJ G • iG 3-moderate, med.um1 6
u , <s . 4-seveie
n""' "' r H(e) Others M ^_ ' - :
(Fill oul the condition)b. Objective symploms score score
n . a, I D («> Hi (2i ' i i H» Noteiscore(a} Hepatomegaly {.} .: G G (b) Tumor • G G G I—absent
..... . _ . . „ _ . . -.-- - _ . _ _ _ , 9 _ _ ^ —^ 2-smalor mild
(c) Tenderness '".", " ' t j G (d) Ascites D D G • 3-medwm_... s(1 . . s, 4-largeor severe
(e) Jaundice G G C G«)««» i MI o.i ^ ;
(I) Others _ I j ^ —• ' -^(Fi l l oul the condition)
c. Serum biochemislry scorn score.r. a, n, i i . i n (?•• \y> (4i Note;score
(a) GOT ".: Cj L j r j (b) GPT G D LJ G 1-normal- » ' ^ ^ —- ' 2---mildly abnormal
(c) Choline ''-, if)' Q Q (d)y-Groblin G L I H G 3-moderately abnormalEsterase . . . s7 ^ M - 4 -severely abnormal
(e) AFP j 1 H [ J J Im/ml (0 CEA I ^ L j J . Ljn|/ml
d. Other; . — ^(Fill out the condition)
6- Equipment used «)don-t tin om
( I ) Ultrasound Manufacturer _ Model | I i Year of manufacture I9.__| i year
JMHZ
(2) Gamma-camera Manufacturer Model J j Year of manufacture 19 i '< year
Number of PMT P L! fi D Q D "S Thickness of NalfTI) 5 ~j 5 "C.A B C O E F O . A B C 0
R a d i o n u c l i d e u s e d H G Q
Collimatot s ' i.j G G p (p
Dose ol tadionuclide j ',_ [ [ I J MBcj (mO i X 37) Energy window [_[J %
Total counts ! ; i i k counts Inlormalion density i i i . j I k counts /cni• • « • > ! • " * 5T1 - . , ITs) ic«
Fig. 4.2.1 (a) A Report Sheet for Filling up the Clinical ExaminationData and the Equipment used in each Case.

Evaluation of the Medical Imaging Procedure •81
I . Patient ID number
4. Information of Patient
Name of Patient
7. Confirmed diagnosis
(a} Hepatic disease ( i ) _
*)2. Country name
(b) Related disease ( i ) _other than liver
(iii)
8. Confirmation of hepatic mass
Hepatic mass D
(2} Verification of mass
•K-aphy US
V D D D D(3) Mass:locaiion and maximum diameter oi mass
3. Institution
03,000-000
I2 13 u * ) don't f.ll
•' •Ans r*O3l, unclear *•" uu(n IQO1J lAQQ. L,ai unc>Q0l
"•0 0 0 0 0 0 0<»g 0 0 0 0 0 0- 0 0 0 0 0 0 0««Q D D D 0 0 0
9. Sketch of hepatic findings
El.
TO-rm.
IVC
Fig. 4.2.1 (b) Report Sheet for Filling up the Confirmed Diagnosisand Confirmation of the Liver Mass in each Case.

82 • Ultrasound and Radionuclide Images of Liver
The selected images were copied on to the same type and size of recording medium as usedin the originals, and then, brief clinical information was attached to each copy. In January of 1992the copies were distributed to each of the participating countries, and physicians were asked tointerpret the diagnostic images and provide an appropriate diagnosis. The NM images consistedof 101 X-ray film images and two Polaroid images and the US images consisted of 92 X-ray filmimages and 11 Polaroid images.
Table 4.2.2 summarizes the distribution of age and sex of cases submitted for interpretation.The greatest number of cases were from the age group 40-49 category, in which there were 30cases. The age distribution ranged from 2 to 80 years. The average age of males was 46.1 andfemales was 43.5 years. These average ages in Part II study were approximately 10 years belowthe average obtained in Part I of the study (in which only cases originating in Japan wereconsidered). Furthermore, while the average age of females in this study was 2.6 years lowerthan that of male in Part I, the male average was lower than the female average (by 4.2 years).The ratio of males to females was approximately 5 to 2.
TABLE 4.2.2 DISTRIBUTION OF AGE AND SEX OF 103 PARTICIPANTS' LIVER IMAGES
age sex
Male
Female
Total
0-9
5
5
10-19
2
1
3
20-29
6
5
11
30-39
11
6
17
40-49
20
10
30
50-59
16
4
20
60-69
9
1
10
70-79
5
1
6
over 80
1
1
Total
74
29
103
malefemaletotal
average46.1 H
43.5 H
45.4 H
standard devition-/- 17.9-/- 15.6-/- 17/2
Table 4.2.3 summarizes the distribution of the results of liver function tests. SGOT or SGPTvalues were not reported in almost 20% of the cases, and in more than half of the cases thecholine esterase and gamma-globulin values were not reported.
TABLE 4.2.3 SERUM BIOCHEMISTRY OF 103 PARTICIPANTS' CASES (1)
resulttest
SGOT
SGPT
Cholineesterase
Y globuline
normal
41
42
20
12
mildlyabnormal
19
25
6
5
moderatelyabnormal
18
12
3
4
severelyabnormal
4
5
1
3
norecord
21
19
73
79
total
103
103
103
103

Evaluation of the Medical Imaging Procedure • 83
Table 4.2.4 shows the distribution of the AFP and CEA values. In over half of the cases, eitherthe AFP or CEA values were not reported—especially the CEA values, which were not reportedin more than 85% of the cases.
TABLE 4.2.4 SERUM BIOCHEMISTRY (AFP AND CEA) OF 103 PARTICIPANTS' CASES
(a) AFP
result*
cases
(b) CEA
result*
cases
1-50
32
0.1-1.0
1
51-100
2
1.1-2.0
6
101-150
1
2.1-3.0
2
151-200
1
201-300
2
7.0-8.0
1
over 450
5
over 10.1
4
no
no
record
60
record
69
total
103
total
103
*note; unit=ng/ml
Table 4.2.5 summerizes the spectrum of final diagnosis in males and females separately.There were a total of 62 tumour cases (60.2% of all cases) consisting of 29 malignant cases (28.2%of all cases) and 33 benign liver tumour cases (32.0%). The malignant tumor cases included thefollowing: 15 cases of primary hepatocellular carcinoma (14.6% of all cases): 11 cases of
TABLE 4.2.5 FINAL DIAGNOSIS (PARTICIPANTS'
Confirmed Diagnosis
Hepatocellular Ca.Cholangio Ca.Metastasis of liverLymphomaInfiltration of
Lymphoid leukemiaHemangiomaCystTraumatic cystTuberculomaAbscessAmoebic abscessLiver cirrhosisAlcoholic cirrhosisHepatomegalyChronic hepatitisAmoebic hepatitisAcute hepatitisNormal liverothers
Total
LIVER IMAGES)
male
12171
115
55882242
91
74
female
3
4
341
12
3
161
29
total
151
111
1491559
1022721
152
103

84 • Ultrasound and Radionuclide Images of Liver
metastatic liver cancer (10.7%): and, one case each of intrahepatic bile duct carcinoma, malignantlymphoma, and liver infiltration in lymphatic leukemia. The benign tumour cases included nine caseof amoebic liver absecess—a conspicuously high occurrence. Also characteristic of this case-group was a high occurrence, five cases, of hepatic tuberculoma. There were 18 cases of livercirrhosis, eight of those were accompanied by turmours. There were 14 cases of diffuse liverdiseases other than liver cirrhosis, including two cases of hepatomegaly, seven cases of chronichepatitis, and two cases of amoebic hepatitis. There were 15 normal liver cases. Other casesincluded were one each of situs inversus viscerum and Riedel's lobe.
Table 4.2.6 shows the methods used in the final diagnosis of liver masses. Since mostdiagnoses were based on the diagnostic imaging without consideration of other relevant clinicalfindings, perhaps there should be a future, follow-up study in order to confirm the final diagnosesof some of the cases in this study.
TABLE 4.2.6
MethodsConfirmeddiagnosis
HCC*
ccc**Meta.LymphomaInf. LeukemiaHemangiomaCystTuberculomaAbscessAmoebicabscessOther tumors
DISTRIBUTION OF
Angio. US
2 10191137444
3
VERIFICATION OF LIVER MASS
XCT
5
3
2
1
Rl
8121
33111
2
Clinicalcourse
31511
2223
Cytology
4
1
1
22
3
ON PARTICIPANTS' CASES
Histology
6141
121
1
Surgery
11
1113
1
Autopsy
2
cases
151
1111410559
3
Note *;hepatocellular carcinoma**;intrahepatic cholangiocelluler carcinoma
Distribution of diagnostic images for interpretation and collection of results.
As in Part I of this study, all cases were divided into one of two subgroups, A or B. However,in this study, group A and B were formed by dividing the cases according to the countries fromwhich we selected the cases, as follows: Group A (51 cases) included Bangladesh (4 cases), China(8 cases), India (20 cases), Korea (15 cases) and Philippines (4 cases); Group B (52 cases)included Indonesia (9 cases), Pakistan (14 cases) Singapore (18 cases) and Thailand (11 cases).To conduct this study, we first distributed NM images of group A and the US images of groupB to each of the participating countries and asked physicians to interpret these images and describea diagnosis on each case. After the results of these studies were reported to us at NIRS in Japan,we then sent the NM images of group B and the US images of group A to each country and askedphysicians to interpret these images and again render a diagnosis in each case. Finally, we askedeach country to read the diagnostic images and render a diagnosis in each case using bothmodalities, i.e. NM and US.

Evaluation of the Medical Imaging Procedure • 85
Fig. 4.2.2 shows the final schedules of each participant country regarding this experiments.The final analysis of the study was delayed by more than two years due to a delay in completingthe schedule in Part I of this study. Fortunately, with the support of the IAEA, authorization foran additional year of research was granted. Therefore, even though the period for data analysisand documentation were very limited, we finally succeeded to summarize this report as an atlas.
Table 4.2.7 shows the number of physicians who had participated in this study up to the endof February, 1994. Although we organized a sufficient number of meetings and were careful tomaintain communications in promotion of this study, some defects remained. For example, in twocountries there were no physician who could interpret diagnostic images of both modalities forall of the cases. By excluding inappropriate cases a total of 80 physicians finally participated inthis study.
TABLE 4.2.7 NUMBER OF READERS ON PARTICIPATING COUNTRIES' LIVER IMAGES
at 15 Feb., 1994
StatusCountries
BangladeshChinaIndiaIndonesiaJapanKoreaPakistanPhilippinesSingaporeThailand
Total
NM alone
half
1
51
1
8
all
41
334561
28
US
half
10)
131
15(1)
alone
all
4(4)1743
3(1)5(1)
41(1)5
30(7)
US
half
1
1
2
and NM
all
4156625911
40
Note: *The parenthesized number indicates physicians, physicians interpreted both US alone and NMalone, but they did not combine both to interpret simultaneously.
ANALYSIS OF RESULTS
Detection of liver diseases.
As previously stated, in 15 of the cases included in this study the livers were regarded asnormal, we were thus able to perform the Reciever Operating Characteristic (ROC) analysisregarding the detection of liver disease. Fig. 4.2.3 (a) through (d) indicate the results of eachanalysis. The results of (a), (b), (c) and (d) were obtained as follows: the ROC curves in (a) weremade by nuclear medicine physicians who interpreted NM images alone; the ROCs in (b) weremade by sonologists who interpreted US images alone; the ROC curves in (c) were made bynuclear medicine physicians who interptreted both NM and US images; and, the ROCs in (d) were

09
Time limit of caseacquisition andsend to NIRS
1991HAY,
Time limit for sendingFinal cases the 1st session reportssent to NIRS to NIRS
JULY SEP. NOV. ,,1992JAN. MARCH
rntz\Transportation of 2nd
2nd meeting ofRCM in Dehli(reported results for
Requested toparticipants.
1st half-set1993JAN. /MARCH.
3J f
N. hi L
Final reportsreceived by NIRS
NOV.1994JAN. MARCH
Q
Q.
Q.
i
1
Copy and rearrangementof cases at NIRS
2nd half setto participating countries
Transportation of 1st halfset to participants
Time limit sending,all reports to NIRS Data recrrangcment
and analysisCase study
\Final reportto IAEA
Formatting ofthe Atlas withcases collected in Japan
Fig. 4.2.2 Final Schedule on the Interpretation for the Liver Images collected from Participating Countries.

False positive fraction
10 20 30 40 50 60 70 80 90 100100 r
A
-— -B—-
—•€—
r\
- - - £ - - -
T~
1
—-6-—
Country
Country
Country
Country
Country
Country
Country
A
B
C
D
E ;
rnF I
sG 1- -H Country H 3
•—J —-.- Country J §.
I-K Country K 5"
Average
Fig. 4.2.3 (a) ROC Curves for Detection of Abnormality of the Liver Images by NM alone
s!OS
N

False positive fraction 0009
ooCO
oCD
0 10 20 30 40 50 60 70 80 90 100 (0O§
—A Country A g.5"
- - • B — Country B §.
—C Country C 33
D — Country D 8o
^ Country E 5-
F Country F
- - • G — Country G
--H Country H
--J— Country J
--K Country K
# Average
Fig. 4.2.3 (b) ROC Curves for Detection of Abnormality of the Liver Images by US alone

False positive fraction
10 20 30 40 50 60 70 80 100100
o
1i
"05OQ.
Fig. 4.2.3 (c) ROC Curves for Detection of Abnormality of the Liver Imagesby NM combined with US by NM Physicians
A
-—e—-
—-e—
—D---
.p.
T-
I
-—•G — -
—-H
J.
.. iz.
Country
Country
Country
Country
Country
Country
Country
Country
Country
Country
Average
A
B
C
D
E
F
G
H
J
K
rri
15"n o
f the< Medical lm
a<
i
to

o
COoQ_
100
90
80
70
60
50
40
30
20
10
False positive fraction
10 20 30 40 50 60
s70 80 90 100
A
A
-— -B-—
—-€
D- - -
— e—
P1
-—<3—-
H
—j.
— K»-
Country A
Country B
Country C
Country D
Countn/ E
Country F
Country G
Country H
Country J
Country K
Average
sou
nd
and
1?|
1lor-ver
Fig. 4.2.3 (d) ROC Curves for Detection of Abnormality of the Liver In^agesby US combined with NM by Sonologists

Evaluation of the Medical Imaging Procedure • 91
made by sonologists who interpreted both US and NM images. The letters used in Fig. 4.2.3,which shows the average of the ROC results by participating countries. This code is identical tothe code used in Part I of the study. The thick line and symbol"*" in Fig. 4.2.3 indicate the averagesfor the sum of all participating physicians. In this particular anaiaysis to avoid reader's bias, weexcluded the diagnoses made on cases collected in participants' own countries, the bias inevitablydo occur while reading images for which the final diagnosis is already known.
Among the analyses in category (a), three countries, A,G and J stood out because theydemonstrated a tendency to over read. However, in the other countries, the incidence of correctdiagnoses was consistently high. Among the diagnoses based only on US images, all countriesdemonstrated a consistently higher fractions of correct diagnoses, with the exception of countryH, which demonstrated a tendency to over read. As a whole, the tendency to over read was slightlyhigher among the analyses based only on US images than those based on NM images alone.The false positive fractions (FPFs) for Country F was low for the analysis in which a nuclearmedicine physician diagnosed the cases based on both NM and US images. Only in country Fphysicians interptret both NM and US images, and because there were several physicians whoread NM images without US images, we were unable to compare the existing results. There weresome countries in which higher FPF values resulted from reading both NM and US images. Inthe analyses in which sonologists diagnosed the cases based on both US and NM images, itappeared that in countries C and D the FPF values were slightly lower than those values obtainedfrom diagnoses based on US images alone. However, we were unable to conduct a directcomparison of these results because diagnoses in these two categories were not rendered bythe same physicians. Furthermore, when we included the countries' own cases (which werepreviously stated to have been excluded from the analyses) in calculating the true positive fractions(TPFs) and FPF values, not only did each country's average TPF values become higher (amaximum of 2.4%) at the third operating point (3rd-OP), but each country's average FPF valuesalso became lower (a maximum of 6.7%) at 3rd-OP.
Since the average TPF value was near 95% when each country's own cases were excluded,which was considered to be a very high value, an improvement of 2.4% was very significant andcould not be ignored. Therefore, we calculated all the ROCs values in this study excluding eachcountry's own cases. However, in the following discussion, in which we compare the types of liverdiseases that each country was asked to diagnose with each country's corresponding diagnoses,we use all available data—including each country's own cases and the diagnoses of participantswho reported a diagnosis in only half of the cases.
Detection of liver masses
Fig. 4.2.4 (a) through (d) provide ROC curves for the detection of liver masses. The symbolsused for the same as those used in Fig. 4.2.3. Although TPF values of most countries wereconsistently similar, those of countries A and B were comparatively higher. The major finding ofthe analysis was that the FPF values of each country were approximately 20% lower than FPFsyielded when the same analysis was performed in Part I of this study (where only Japanese caseswere considered). When diagnosis was based on US images alone, all countries yielded similarTPFs values, with the exception of country A, which yielded a TPF value that was somewhat lowerthan the other countries. The average of TPFs yielded by the present analysis was about 5%lower than that yielded by the same analysis when performed in Part I of this study, however,

False positive fraction
0 10 20 30 40 50 60 70 80 90 100
CD
oQ .CD
JU
90
80
70
60
50
40
30
20
10
I
- W
-mwMfWJ
t
1
'MA
if
' ' ' L J - ^ ^ ^ * ^1 s&~^~^*>el0^:'''~' Ar\
—-€
D---
1
-— G—-
i i
l~1
J- - -
— K —
>
Country A
Country B
Country C
Country D
Country E
Country F
Country G
Country H
Country J
Country K
Average
rasounclan
dl
-a
|
iges of Llvet
Fig. 4.2.4 (a) ROC Curves for Detection of Liver Mass by NM alone

False positive fraction
0 10 20 80 90 100
52
IoQ.CD
100
90
80
70
60
50
40
30 -.'
20
10
I I
Fig. 4.2.4 (b) ROC Curves for Detection of Liver Mass by US alone
A
-—e—-
— € —
D---
_--£--_
1
H
J"
IX
• —
Country A
Country B
Country C
Country D
Country E
Country F
Country G
Country H
Country J
Country K
Average
Evali
1Qt of the
|
-,al tm,
8)
1IIire •
93

False positive fractionto
10 20 30 40 50 60 70 80 90 100
oCD
CD
OQ.
100
90
80
70
60
50
40
30
20
10
1 1 1
I-'*"
;V- / / W / /:,T/; / /:[ H
- i ii /:/// /' /' /' hi i ' 1, ' / • / ; / / • / /
1 ' / ' '
-it!!;/
Wit'Ml1, i/ni //
—' i1 hii ii• • 'Hi 'at a
§
i
Fig. 4.2.4 (c) ROC Curves for Detection of Liver Massby NM combined with US by NM Physicians
—B-
—e-
- - D -
- - E -
(0o§Q.a>
— Country A ^&>
•- Country B g
•- Country C §:
3

False positive fraction
0 10 20 30 40 50 60 70 80 90 100
coo£0
a>
'c/5
90
80
70
60
50
40
30
20
10
n
-
-
—
- :
1
;lM
;/
•1
i
1 1 1
(3 ,lx ' ' _^^^^*
•! ' f> / ;
1 * /wit'';! 1,if;;•In
1
— B -
-^ Country A
•- Country B
- Country C
- - Country D
- Country E
- Country F m
-- Country G |
I- - Country H §,
- J — Country J §(b
- - K - - - CountryK 8
I# Average <§
I
Fig. 4.2.4 (d) ROC Curves for Detection of Liver Massby US combined with NM by Sonologists

96 • Ultrasound and Radionuclide Images of Liver
the FPF values were approximately 20% at the 3rd-0P in both studies. While this finding wouldindicate that the materials used in both studies were approximately the same quality, whendiagnosis based on NM images alone in Part I of this study, higher FPF values were obtained.
There was a slight increase in the combined average of all countries' FPF values due to overreading in certain countries where same physicians read the NM and US images. On reading bythe nuclear medicine physicians; however, there was also an increase in TPF values as comparedto the values obtained when diagnosis was based on NM images alone, and these increased valueswere almost as high as when diagnosis was based on US images alone interpreted by sonologists.
The results of the analysis in cases where the sonologists based their diagnoses on UScombined with NM images were almost the same as the results obtained by US images alone,therefore, the added consideration of NM images produced no observable effects.
Detection of the malignant and benign tumors of the liver
Fig. 4.2.5 (a) through (d) show the analytical results for diagnosis of malignant tumors.Although country B yielded good results on NM images alone, there was a large variation in FPFvalues from country to country, and in general, FPF values were higher than that on US imagesalone interpreted by sonologists. In particular, country K yielded poor results overall whendiagnoses were based on NM images alone, but yielded high TPF values for such cases originatingon Japanese cases. Although countries B,G,H and K yielded relatively higher TPF values indiagnosis based on US images alone, as in diagnoses based on NM images alone, there werelarge country-to-country variations in the values obtained. Overall, however, when diagnoses werebased only on US images, FPF values on 3rd-OP were 10% lower than for diagnoses with NMalone and TPF values remained at the same level.
When diagnoses were based on US images alone, all countries, with the exception of countryK, yielded TPF values in the present study that were similar to those yielded in Part I of this study.Country K yielded comparatively high TPF values in Part I of this study and in the present study,yielded TPF values on the 3rd-0P of ROC curves that were 10% higher than the other countries'values. Overall, TPF and FPF values yielded by nuclear medicine physicians and those yieldedby sonologists were approximately the same when diagnoses were based on both modalities, butrevealed large variations in these values from country to country.
Fig. 4.2.6 (a) through (d) show the ROC curves for diagnoses of benign tumors of liver. Aswe observed in Part I of this study, a very cautious approach to the diagnosis of these caseswas prominent among the participating physicians. In the present study, when diagnoses werebased on NM images alone by nuclear medicine physicians, the combined average of all countries'FPF values were similar to the corresponding average in Part I of this study. However, countryA yielded the highest TPF values on 3rd-OP, country B the second highest, and country K thethird highest TPF values among all countries, and there was great disparity among countriesregarding their opinions about each individual case. Furthermore, when diagnoses were basedon US images alone, the TPF and FPF vlaues were very similar to those obtained in Part I ofthis study, however, countries B, G and K yielded high TPF values.
The TPF and FPF values in the present study also tended to be similar to those values in

False positive fraction
10 20 30100
90 -
80 -
70 -
60 -
40 50 60 70 80 90 100
£ 50 ->
aa>5
40 -
30 -
20 -
10
-
CDD1
_ Ii
1
' /
tj[/,
Iff-filli •wwf
i
•
h1/1
I
r
/y/i
Ifr/,:/ •
' /
E
1
, . . - - • '
/A
1/ ,/' f
1
1 1 1 1 1 1 J ^ ^
--e--
—e-
-H3-
— Country A
-- Country B
- - Country C
- - Country D
• - Country E
Country F
j — Country J
— K - - - Country K
§
Country G §"•
- Country H -•3"
8
Fig. 4.2.5 (a) ROC Curves for Malignant Tumour of the Liver by NM alone
Average ^«
J}to

False positive fraction
ooCO
I"55OQ .CD
70 80 90 1000 10 20 30 40 50
A
-— B—-
—-e---
D - - -
-P- -
rI
-- —Q—-
— - H
.j.
Country
Country
Country
Country
Country
Country
Country
Country
Country
Country
Average
A
B
C
D
E
F
G
H
J
K
(O09
frasound a
Q.
Q.
o'|<deln
1of Live
-*
Fig. 4.2.5 (b) ROC Curves for Malignant Tumor of the Liver by US alone

False posith/e fraction
50 60 70 80 90 1000 10 20 30 40
Fig. 4.2.5 (c) ROC Curves for Malignant Tumor of the Liverby NM combined with US by NM Physicians.
A
-— -B—-
j * _
D---
- - - £ - - -
r\
—-H
j .
— • —
Country A
Country B
Country C
Country D
Country E
Country F
Country G
Country H
Country J
Country K
Average
1on of
i5dlcah
|
!!•

False positive fraction
90 100100
co
IoQ.
Country A
o
IIa
—B— Country B oc
--€ Country C S-HQ Country D I
Fig. 4.2.5 (d) ROC Curves for Malignant Tumor of the Liverby US combined with NM by Sonologists

False positive fraction
10 20 30 40 50 60 70 80 90 100
o
(D
'55OQ.
100
90 -
80 -
70 -
60 -
•H 50 -
40
30 -
20
10
-
-
Ik/I
f
i
B-"i
;
/ /
/ {u
i i
/
1
,y'y
* % /
1 1
*y>yY/'
wA
-— -B—-
D- - -
- - - € - - -
1
— G — -
t i
ri
—j —
Country A
Country B
Country C
Country D
Country E
Country F
Country G
Country H
Country J
Country K
Average
Eval
13
a>theh
ledica
<Q
ajPro
ce
du
re
Fig. 4.2.6 (a) ROC Curves for Benign Tumour of the Liver by NM alone

False positive fraction
co
IGOoQ.CD
£
10 20 30 40 50 60 70 80 90 100100
90 -
80 -
70 -
60 -
£ 50 -
40 -
30 ~0
20
10
1
-
SBS,'
/A
mW
1/
'•]'
''''''{
I
1
i i i i
—B--
—e-
- - D -
--E-
— € — -
—J-
- Country A
-- Country B
- Country C
- - Country D
- Country E
- Country F
Country G
- Country H
- Country J
- Country K
Average
s
o
§Q.
Q.g.O3
I!1
Fig. 4.2.6 (b) ROC Curves for Benign Tumour of the Liver by US alone

False positive fraction
10 20 30 40 50 60 70 80 90 100
g
1
oQ.©
90
80
70
60
50
40
30
20
(
10
ft
r
_
—i
tm
- %
Til Livfi-if;#7 /
* / '
1
1 i 1——i
_ , - — '
/ - " " " -/
/ " " • ' " ^
/ ^ ^ y'
r5r •-•>''yy
y'y'
-i 1 1 i--^H
••-' ,^0---- fi—-
D -
F—
-<3—
— - H - -
Country A
Country B
- Country C
- Country D
- Country E
- Country F
Country G
- Country H
- Country J
Country K
Average
I
5"
f8
tQ
IFig. 4.2.6 (c) ROC Curves for Benign Tumour of the Liver by NM combined with US by NM Physicians

IoCL
a>
False positive fraction
0 10 20 30 40 50 60 70 80 90 100100
90 -
80
70 -
60 -
£ 50 -
40 -
30
20
10
1
-
i i /
WMr
r
i
. /
i i
' ' ^ ^ '
i
y
i i
-—<3 —
2c:
!o§§Q.
—A Country A
- - 6 — Country B |
—C Country C §
- -D — Country D |
- - t Country E *
—F Country F §
- Country G
- Country H
• — J - — Country J
- K — Country K
# Average
Fig. 4.2.6 (d) ROC Curves for Benign Tumor of the Liver byby US combined with NM by Sonologists

Evaluation of the Medical Imaging Procedure • 105
Part I of this study when diagnoses were based on the joint consideration of images from bothmodalities. This indicates that many benign tumor cases of liver were among the cases sent fromparticipating countries and, in this study, these cases could be diagnosed correctly with relativeease if clear standards for diagnosis exist.
Diffuse Liver Diseases
Fig. 4.2.7 (a) through (d) show the ROC curves for liver cirrhosis cases. As Fig. 4.2.7 (a)indicates, when diagnoses were based on NM alone, the following countries, in descending order,yielded high TPF vlaues: B, K, A, G and H. However, large variances have been observed amongthe countries. The results on US images alone interpreted by sonologists, also yielded greatvariances in TPF values among the countries. The countries with the highest TPF values on the3rd-OP, in descending order, are as follows: B, K, G and H. However, we did not receive a sufficientnumber of responses correctly diagnosing liver cirrhosis from countries A, G and F. There wasno change in these tendencies even when both modalities were jointly considered in formingdiagnoses. It appeared that when both modalities were available to the physicians, most diagnoseswere based on the NM images; there was faint evidence that the US images were consideredin forming these diagnoses. The above analysis indicates that the liver cirrhotic pattern was clearlyobservable on the NM images from among various countries. However, even though the NMimages were clear, countries D, E and J provided almost no response that indicated liver cirrhosisamong the cases used in this analysis.
Fig. 4.2.8 (a) through (d) show the ROC curves of diffuse liver diseases other than livercirrhosis. Both modalities had a tendency to yield low TPF and high FPF values, and these valuesplotted almost diagonally. However, diagnoses based on NM images alone yielded relatively higherTPF values, and there was almost no tendency for the TPF values to improve when both modaritieswere considered in forming diagnoses as compared to the sole consideration of NM images. Asexhibited in Fig. 4.2.8 (c), there was a slight improvement in the TPFs of countries F, J and Kon NM combined with US images interpreted by nuclear medicine physicians.
Analysis of Liver Mass by the Size and Quality of Diagnostic Images
In Part I, the variation of diagnostic correctness according to the size of liver masses wasanalyzed. There were seven liver mass cases in which the size of the mass was not reportedin the clinical information record. We excluded these unreported cases and proceeded with thepresent analysis, however, the results of the present analysis were similar to the results obtainedin the Part I analysis and yielded low TPF vlaues for the detection on NM images of liver massessmaller than 30 mm in diameter. Also, we omit discussion of the results of the analysis regardingevaluated image quality becuause these results were similar to those obtained by the analysisperformed in Part I of this study.
DISCUSSION
In part I of this study, the collection of liver disease cases was limited because the technologyfor diagnosing liver diseases in Japan was changing, and only a limited number of institutions

False positive fraction
o
1oQ.
0 10100
90 -
80 -
30 40 50 60
10
8
I
Country A 31
5*Country B c---- -B-
C Country C ^
D-
- - - t -
•ft)
Country D gj
Country E £
— - G — -
Country F
Country G
Country H
Country J
Country K
Average
Fig. 4.2.7 (a) ROC Curves for Liver Cirrhosis by NM alone

False positive fraction
10 20 30 40 50 60 70 80 90 100100
90
80
70
60co
1 50§"woQ. 40
30
20
10
1
-
-
G'
" / / /
MIk*f
i
B"•
•
f /
i i i i i i ^-pP
• <:'W
V
A
• — -B—-
___r1*
—. - r> „_
- • - € - - -
rI
-—<3—-
—-tt
j —
— K —
Country A
Country B
Country C
Country D
Country E
Country F
Country G
Country H
Country J
Country K
Average
Sf"ofth
eM
ed
lca
1!s!
Fig. 4.2.7 (b) ROC Curves for Liver Cirrhosis by US alone

False positive fractiono09
g
I 50CD
'to
§. 40<D
30
20
10
0 10100 r- r-
90
80
70
60
20 30 40 5Q 60 70 .100
—B
—£-
--D
- -1
- — G — -
• —J-
• - K -
Country A
Country B
Country C
Country D *§o
Country E C
Country F
Country G
Country H
Country J
Country K
Average
Fig. 4.2.7 (c) ROC Curves for Liver Cirrhosis by NM combined with US by NM Physicians

False positive fraction
0 10 20 30 40 50 60 70 80 90 100100
o
.1w8.
90 -
80 -
70 -
Fig. 4.2.7 (d) ROC Curves for Liver Cirrhosisby US combined with NM by Sonologists
A
-— -B-—
—-e---
—D---
- • - • E - - -
r~I
- - € - -
— - H
Country A
Country B
Country C
Country D
Country E
Country F
Country G
Country H
Country J
Country K
Average
mval
11i of th
e Med
I
ling
Pro
cedu
re •109

False positive fraction
0 10 20 30 40 50 60 70 80 90 100
CD
'woQ.
100
90 -
80 -
70 -
60 -
£ 50 -
40 -
30
20 -
10
I I I
-
— * • • " / '
' ' ' /
w /m /
i
/
/
1 i
m''^-
i
/
i
wA
A
-—-B—-
— - € - - -
D-- -
- - - E - - -
r1
- - < B - -
i i
1 1 ~
J - - -
- - - K - - -
Country
Country
Country
Country
Country
Country
Country
Country
Country
Country
Average
A
B
C
D
E
F
G
H
J
K
as(0Q
Q.01
1
Ide In
(0Q
Fig. 4.2.8 (a) ROC Curves for Diffuse Liver Diseases other than Liver Cirrhosis by NM alone

False positive fraction
10 20 30 40 50 60 70 80 90 100
co
Ia>
' • ^
'woQ.0)
100
90
80
70
60
50
A
• - - - -B—-
D-- -
- - - € - - -
rI
-— <3—-
—-H
—J —
— K —
Country A
Country B
Country C
Country D
Country E
Country F
Country G
Country H
Country J
Country K
Average
val
s1o' th
e Medica,
ting Pro
Fig. 4.2.8 (b) ROC Curves for Diffuse Liver Diseases other than Liver Cirrhosis by US alone

False positive fraction
cooCOCD
WOQ .
0inJ\J
90
80
70
60
50
40
30
20
10
n
10 . 20i i
-
-
-
-
^•jy
1 Hpy?
W/wF
30 40 50 60 70 80 90 10I I I I I I I _S
^0/
r'y/'/
--•B--
—e—
- - D -
- - € - •
—F—
j -
Country A
Country B
Country C
Country D
Country E
Country F
Country G
Country H
Country J
Country K
Average
ro
s»ocQ.
aaao*
o
I
(AO
Fig. 4.2.8 (c) ROC Curves for Diffuse Liver Diseases other than Liver Cirrhosisby NM combined with US by NM Physicians

False positive fraction
10 20 30 40 50 60 70 80 90 100
g
IQ.
100
90
80
70
60
20
10
A
-—-B- —
—-e---
D---
- - - £ - - -
rt
. . . . . . . . .
— - H
j .
Country A
Country B
Country C
Country D
Country E
Country F
Country G
Country H
Country J
Country K
Average
Evah
oi of th
eM
edleal In
•9.to1 P
roced
u
Fig. 4.2.8 (d) ROC Curves for Diffuse Liver Diseases other than Liver Cirrhosisby US combined with NM by Sonologists

114 • Ultrasound and Radlonuclide Images of Liver
could contribute cases. There were no institutions in Japan that utilized both scintiscan andultrasound tomography for the diagnosis of liver diseases. Therefore, we were forced to selectcases that were two to eight years older and to limit the number of contributing institutions to two(89 out of a total of 93 cases were contributed by one of these two institutions). However, becausethe cases used in the series were collected from nine Asian countries and were mostly currentcases, the conditions of the study were quite realistic.
From among the 189 cases that were initially collected, 103 were ultimately selected for usein this study. The main criteria for selecting these cases were as follows: to select cases thatmaintained a balance in the types of final diagnosis; and to eliminate cases in which the presenceof a liver mass was marked on the accompanying diagnostic images (among the markers weobserved, one of them clearly identified a mass of HCC). We placed particular emphasis oneliminating cases in which there was an obvious marker indicating the presence of a liver massbecause the diagnosis of such cases did not require the judgement of an expert and evensometimes it might mislead the final diagnoses.
A radiological engineer at Sapporo Medical College used an improved version of automaticcopy machine to reproduce the X-ray films that were used in this study. A photo studio in Chiba-shi, Japan, that specializes in medical photography used 35 mm long-focus filming to reprint thePolaroid films used in this study. As a final step, a group of specialists in nuclear medicine andultrasound examined the reproductions and confirmed that all information detectable on theoriginals was also detectable on the reproductions. However, only the original images are usedin this atlas.
In this study, all countries yielded high TPF values for the detection of liver diseases, however,the FPFs were also high. This created some uncertainty as to the correctness of our assertionthat the 15 cases that we initially regarded as normal livers were, in fact, normal livers. It maybe necessary to reconfirm doubtful final diagnoses in a follow-up study.
The average FPF values on the 3rd-OP, in Part II of this study for detection of liver masses,was over 20% lower than the average in Part I. This difference may be due to a difference inthe type of machines used for nuclear medicine diagnostic imaging. In Part I, relatively oldmachines were used, but in Part II, the up-to-date machines were used throughout. There is adifference in the amount of detectable information that can be produced by these differentmachines, however.
An analysis of diagnoses based on US images in Part II of this study yielded results similarto those by the same analysis conducted in Part I of this study. Although not all the physicianswho participated in one part of this study participated in both parts, it is safe to conclude thatcopies of similar quality were used in both studies. As in the Part I, Part II produced disparitiesamong physicians in their diagnoses of liver diseases and in the frequency of their detection ofdiffuse liver diseases, though the degree of desparity differed between the two studies. Thisdisparity highlights the necessity of promoting an international educational standard for thediagnosis of liver disease based on the reading of US images. We think that inviting these Asianphysicians to Western countries or Japan to receive additional education might not be a sufficientsolution to solve this problem, the regional distribution of diagnoses.

Evaluation of the Medical Imaging Procedure • 115
In this study, Country K was actually Japan, and in Japan there were six physicians whoparticipated in this study: three nuclear medicine physicians (one from Sapporo Medical UniversitySchool of Medicine and two from Gunma University School of Medicine) and three sonologists(one from Gunma Univ. School of Medicine and two from Sapporo Medical University School ofMedicine). In Part I of this study, in which only Japanese cases were studied, Japanese physiciansachieved first-rate results in all analyses, but in Part II, their results were not always as excellentas the Part I. Country A, B, F and G actually achieved better result in most of the analysis. Weconcluded these conflicting results were due to the differing composition of the cases in Part Iand II of this study. Particularly, diseases such as a liver tuberculoma and amoebic liver abscessare almost non-existent in Japan, therefore, most Japanese physicians were unable to correctlydiganose there cases.
Hence, as mentioned previously, it may not be practical for physicians from developingcountries to seek additional training and education in developed countries in regard to theinterpretation of diagnostic images. If possible, educators from developed countries should visitindividual institutions in each developing country and practice medicine for a few months or morein order to gain experience in diagnosing endemic diseases. Furthermore, these physicians shouldjoin surgical teams in the host countries and participate in exploratory or regular surgicalprocedures in order to confirm diagnoses. In this way, the physicians could provide the feedbackto the host countries' physicians regarding diagnosis of those particular diseases. This processof refining diagnostic methods for the purpose of advanced training and education of the hostcountries' physicians is difficult and time-consuming. However, such hard work would make itpossible to provide more effective education in the interpretation of diagnostic images forphysicians in developing countries.
In regard to the maintenance of the equipment used for diagnostic images, our opinion is similarto that regarding the education of medical experts. Educating engineers from developing countriesin the use of diagnostic imaging equipments by developed country standards may not be practicalkeeping in view conditions prevailing in these developing countries. In other words, experts in themaintenance of diagnostic imaging equipments should go to these developing countries in orderto understand the issues affecting the use of these equipments in each particular host countryinstitution. These experts should then make the adjustments necessary to put the equipmentsin the condition best suited to the particular circumstances of each institution. Also, these expertsshould gather information about how to realize the maximum efficiency of the equipments in theparticular circumstances prevailing in each country, share this information with the coordinatorsof each country, and provide the coordinators with more advanced training in the maintenanceof these equipments. Although this concept may appear too idealistic, perhaps the scheme is worthconsidering.
As we stated in Part I, this study was never intended to be a contest among the participatingphysicians to test their ability to interpret and diagnose a liver disease using the two diagnosticmodalities, US and NM imaging. Rather, it was intended to make a realistic inquiry into thetechniques used in Asian countries in detection of liver diseases. Our intention and goal is thatthe results of this study will be reflected in the planning and execution of the support programsdesigned to improve the detection of liver diseases in Asian countries.

116 • Ultrasound and Radionuclide Images of Liver
Since each country that participated retained a copy of the images used in this study, wewould propose that each country incorporate these images and their accompanying final diagnoses(which will be sent to each country in the near future) into an educational program designed toenrich the expertise of its physicians, especially those who did not participate in this study. Wealso suggest that each country should broaden the effects of this study by adding new casesoccurring in their own country to their collection of images. By doing so, this study will providesplendid benefits not only to young medical students learning about the techniques of diagnosticimaging but also to physicians who are already in practice. We believe this collection would beof much more practical benefit than merely reading a book about the techniques of imagingdiagnosis or receiving education about it in a developed country. Whether or not the developingcountries stop using nuclear medicine imaging for diagnosis of liver disease due to similar reasonsto those that have caused the trend of declining use in Western countries and Japan, the useof ultrasound imaging alone will still yield similar results. Also, when both X-ray CT scan andultrasonogram become popular in developing countries, images of these modalities and thecorresponding clinical information can be sent from Japan to these countries.
We feel strongly that due consideration should be given to change in the type of medium usedin this type of study. In the past, either X-ray or Polaroid films were used. However, it would bemore useful if images were digitized and recorded on computer medium such as CD-ROM anda computer system with large scale and high resolution CRT could be distributed to each country.Diagnostic images could be displayed on the CRT of the computer, and the person who isinterpreting the displayed image could enter a diagnosis and related information into the computersystem by following the software instructions. The computer could then process and calculate theuser's input immediatly and then provide the user with immediate feedback regarding the finalresults. If such a system is developed, it will be very useful.
The usefulness of the system should be further enhanced if it could also provide feedbackpertaining to the final diagnosis of the images that includes comments, illustrations, the correctmethods of diagnosis, and if applicable, the reason why the user's input diagnosis or otherinformation is incrorrect. Young medical students and practicing physicians alike would benefit fromthis type of educational computer system. A physician could use this kind of system as a reviewor for remedial training, to learn a diagnostic method in an unusual case, or to master the newestdiagnostic techniques. Before such a system can be realized, the following goals must be achieved:1) computers with a capacity to support the system must be made available to all participantingcountries; 2) a system to maintain and manage all the computer terminals in this study must becreated; and, 3) all participanting physicians must become proficient in the use of the computerterminals and have an understanding of the characteristics of CRT screens.
We have verified that the diagnostic images on films and those on CRT screens yield thesame amount of detectable information for use in deriving diagnoses. Although many problemsmust be solved prior to implementation of this system, such as problems with the operation ofCRT displays, limits in the number of images that can be observed on one screen simultaneously,and user eye strain caused by observing on one screen simultaneously, and user eye strain causedby the use of CRT displays. But digital images will eventually replace the use of film, the filmlessage is clearly approaching. The filmless age will come to developed countries first, but it is obviousthat it will eventually arrive in the developing countries, as well. Today, a system that uses digital

Evaluation of the Medical Imaging Procedure • 117
images is more expensive to install, but we assume that the transition to flmless systems shouldtake place as soon as possble.
The ultmate goal in developing this proposed system sould be for any organization in the worldto be able to access needed information freely from their computer terminals through an on-linecomputer network. Once this network becomes a reality, information about new cases from allover the world will be continuously added to the existing collection of informations and internationalauthorities such as the International Atomic Energy Agency (IAEA) or the World HealthOrganization (WHO) will preserve all collected informations in their massive file server computersystem.
If this computer system is actually implemented, we can identify a number of advantages.This system will provide an easy solution to one problem, we identified in this study, i.e., the numberof physicians who did not report a diagnosis in cases of liver cirrhosis and hepatitis. Further-more,this system will provide physicians with an opportunity to learn diagnostic methods for endemicdiseases or rare cases related to liver conditions from around the world without leaving their homecountry. Finally, it will enable physicians to obtain the latest informations possible and to applythe information in the diagnosis of actual cases that they are treating.
Moreover, this databese system technology can be applied to other conditions besides liverdiseases. For example, it can be applied to the assessment, diagnostic and treatment planningprocesses in pancreas, gall bladder, kidney, lung, heart, breast and brain. Furthermore, a projectcan be developed that implements this system to create a database of medical images relevantto any potential disease, injury or dysfunction that humans might possibly experience on earth.
In any event, we strongly urge that at least the materials used in this project be used in thefuture for the advancement and dissemination of clinical technology to all countries.
CONCLUSION
The above discussion is a summary of "Evaluation of Medical Imaging Procedures for theDeagnosis of Liver Diseases—Part II", a project planned by and executed with the support of theInternational Atomic Energy Agency/Research Cordinated Agreement (IAEA/RCA). The results ofthis project, and issues and proposals for the future, are presented in the discussion section ofthis study.
Finally, we would be extremely delighted if the results of this project were used in any wayto help establish and maintain healthy lives for all people around the world.

IN01$0007
CASE STUDY ON THERESULTSOF IMAGE INTERPRETATION
MORIMICHI FUKUDA1, KENJIRO FUKUHISA2, YUKIO TATENO2,
GOPINATHAN NAIR3, S.M. SHARMA4, AJIT KUMAR PADHY5 AND
FUMIO SHISHIDO6
5.1. HEPATOCELLULAR CARCINOMA(HCC)
Hepatocellular carcinoma(HCC) most commonly produces a focal mass lesion which is initiallyhypoechoic, but becomes more echogenic with increasing size. Texture pattern characteristicallyproduces mosaic appearance and is often accompanied by posterior echo enhancement. In somecases, the tumor infiltrates widely through the liver substance, giving rise to an irregular pattern,invasion of veins, hapatic and portal, is common. The incidence of intra and extrahepaticdissemination is high in HCC with diffuse infiltration.
1. Sappor Medical University School of Medicine, Minami 1-jo, Nishi 16-chome, Chuo-ku, Sapporo,Hokkaido, Japan 060
2. National Institute of Radiological Sciences, 9-1, Anagawa 4-chome, Inage-ku, Chiba, Japan 2633. Division of Human Health, IAEA, Vienna, Austria4. Bhabha Atomic Reseach Center, Trombey, Bombay, India 4000945. All India Institute of Medical Sciences, Ansari Nagar, New Delhi, India 1100296. Fukushima Prefectural College, 1-banchi, Hiakrigaoka, Fukushima, Japan 960-12

120 • Ultrasound and Radionuclide Images of Liver
5.1-1. Case No. JN-25Diagnosis: HCC with chronic hepatitis
Clinical history and reasons for referral; 54 M. No subjective complaints and objectivesymptoms, but was rated as a high risk patient for HCC mass survey becaus of sustainedchronic hepatitis.
Laboratory investigations; GOT and GPT mildly abnormal, choline esterase moderatelyelevated, AFP; 176 ng/ml, CEA; 1.1ng/ml, total bilirubin; 1.2,-bilirubin; 0.2, CRP;-,ZTT;22.2, TTT;25.7 HBsAg;-, HBsAb;- and HCV;-.
Liver scintigraphy; 99m Tc-Sn colloid, 148 MBq (4 mCi)Views; anterior, posterior and right lateral (Anti clockwise from top left)Scan findings; inhomogenous radiocolloid uptake of the liver, enlargement of left lobe, and
no definite SOL were found in these scintigrams.Scintigraphic comments; chronic hepatitis

Case Study on the Results • 121
Sonograms; Aloka SSD 650, 3.5 MHz convex scan transducer.Sonographic findings; a round mass of 1.5 cm in diameter is found at the lower edge of the
right lobe. The mass is slightly echogenic and circumscribed with hypoechoic halo.Cholecystolithiasis and low grade splenomegaly were found.

122 • Ultrasound and Radionuclide Images of Liver
Final diagnosis verified by; biopsy under laparoscopy and surgery.Individual scores for case No. JN-25
AbnormalitySOLHCCMetastasisLiver cirrhosisFatty liverAcute hepatitisChronic hepatitisDiffuse liver diseaseother than cirrhosis,fatty liver andhapatitis
+
3630591000
5
US
+/-
579
111004
0
alone
-/+
43001000
0
-
49
352946494945
44
+
266220018
0
NM
+/-
30835545
18
3
alone
-/+
83701220
1
-
653586364646244
66
+
27231052401
8
US and
+/-
159560407
1
NN
-/+
76111011
0
-
1010434856515850
50
Comments; because of fairly apparent mass in sonograms, diagnostic results generally agreedwell especially those of existence of the mass. Interpretation, however, is ambiguousconcerning whether primary or secondary mass. Scintigraphic findings suggested chronichepatitis.
5.1-2. Case No. JN-33Diagnosis: HCC with liver cirrhosis
Clinical history and reason for referral; 60F. Choline esterase was severely abnormal in follow-up of liver damage and laparoscopy detected FNH.
Laboratory investigations; serum biochemistryand tumor marker normal. HBsAg;-and HBsAb;+.

Case Study on the Results • 123
Liver scintigraphy; 99mTc-Sn colloid 148M Bq (4 mCi) 700 kc.Views; anterior, posterior, left lateral and right lateral views (Anti clockwise from top left).Scan findings; no liver uptake, and remarkable splenomegaly.Scintigraphic comments; liver cirrhosis, but HCC not ruled-out.

124* Ultrasound and Radionuclide Images of Liver
Sonograms; Aloka SSD 650, 3.5 MHz convex scan transducerSonographic findings; a discrete mass with 3 cm in diameter is found in the medial portion
of the left lobe and is characterized by variable echogenicity circumscribed with a thinhalo. Interpretation generally inclined to a malignant mass with either primary or metastaticorigin. A minority of readers interpreted as liver cirrhosis.

Case Study on the Results • 125
Final diagnosis verified by; biopsy under laparoscopy.Individual scores for case No. 33;
US alone NM alone US and NM
Abnormal 41 5 1 0 50 15 1 0 48 7 1 0SOL(mass) 35 7 1 4 5 2 3 56 35 6 1 14HCC 9 10 0 28 2 2 19 43 19 19 2 23Metastasis 8 10 1 28 0 0 0 66 . 5 6 0 45Malignant tumor other than HCC and metastasis of liver
Liver cirrhosisFatty liverAcute hepatitisChronic hepatitisDiffuse liver disease
44100other2
14001than0
01001
4238474745
cirrhosis, fatty0 43
025
130
liver3
020
333
and4
00232
hepatitis1
6621605761
58
119010
2
07003
0
01012
0
5529565451
54
Comments; clinical diagnosis of the case was focal nodular hyperplasia. Histological diagnosishas disclosed primary HCC. Extremely low intake of tracer, the diagnosis of liver cirrhosis is wellsubstantiated. This case is one of the typical cases of which diagnosis depends on two modalitiescarried out in parallel.
5.1-3. Case No. JN-45Diagnosis: HCC with liver cirrhosis.
Clinical history and reason for referral; 49 M. Modeate weight loss.Laboratory investigation; GOT and GPT mildly abnormal, choline esterase
moderately abnormal, AFP;5700 ng/ml, CEA;2.3 ng/ml, total bilirubin; 0.5, direct-bilirubin;0.2, CRP;-, ZTT;17.9, TTT;9.1 and AAR;-.

126 • Ultrasound and Radionuclide Images of Liver
Liver scintigraphy; 99mTc-Sn colloid, 148 MBq(4 mCi).Views; anterior, posterior and right lateral views (Anti clockwise from top left).Scan findings; two or three defects in the right lobe, poor and inhomogenous uptake of
the liver and mild splenomegaly.Scintigraphic comments; (1) Multiple metastatic liver tumors,
(2) HCC and its liver metastasis with liver cirrhosis.

Case Study on the Results • 127
Sonograms; Aloka SSD 650, 3.5 MHz convex scan transducer.Sonographic findings: a discrete mass of 3 cm in diameter is found in the lower edge of the
right lobe of the liver. The mass possessed characteristic halo sign, thin and clearly hypoechoic,which is most characteristic of HCC. A slight degree of posterior enhancement and the so-calledmosaic pattern did coexist.
. * • • >

128 • Ultrasound and Radionucllde Images of Liver
Final diagnosis verified by; biopsy under laparoscopy and surgery.Individual scores for case No. Jn-45;
AbnormalitySOLHCCMetastasisHemangiomaLiver cystLiver cirrhosis
+
48411513500
US
+/-
1473301
alone
-/+
0100000
-
03
2733414948
+
6654
138
030
NM
+/-
173
14140
alone
-/+
0011200
64
-
535
62136660
1
+
3491023
002
US and
+/-
13
115011
NM
-/+
011200
53
-
435275756
Comments; diagnostic interpretation is generally supportive of malignant mass of the liver,however, a few readers inclined for hemangioma the benign lesion, of the liver. Scintigram,however, has shown inhomogeneity in uptake compatible with metastatic masses or cystic lesionsof the liver.
5.1-4. Case No. JN-53Diagnosis: HCC with liver cirrhosis.
Clinical history and reason for referral; 66 M. Follow up of lung tuberculosis. Moderate weightloss.
Laboratory investigations; GOT and GPT mildly abnormal, choline esterase moderatelyabnormal, AFP; 5700, CEA;2.3, ZTT;17.9, TTT;9.1, total-bilirubin,0.5, direct bilirubin;0.2,CRP;-, HBsAg;+ and HBsAb;-.
Liver scintigraphy; 99mTc-Sn colloid 148 MBq(4 m Ci).Views; anterior, posterior and right lateral views (from left to right).Scan findings; SOL in the right lobe, relative enlargement and poor radiocolloid uptake
of the right lobe with moderate splenomegaly.Scintigraphic comments; HCC with liver cirrhosis.

Case Study on the Results • 129
Sonograms; Aloka SSD 650, 3.5 MHz convex scan transducer.Sonographic findings; a medium-sized mass with heterogeneous echo-texture is found in the
posterior segment of the right lobe. Interpretation mostly inclined for HCC, however, afew has favoured the diagnosis of metastatic tumors.

130 • Ultrasound and Radionuclide Images of Liver
Final diagnosis verified by; biopsy under laparoscopyIndividual scores for case No.JN-53;
AbnormalitySOLHCCMetastasisLiver cirrhosis
+
452923
60
Diffuse liver disease other0
US
+1-
913813
than3
alone
-/+
38200
-
411285458
cirrhosis, fatty2 56
+
363123
25
liver0
NM
+/-
68944
alone
-/+
13300
and hepatitis1 0
-
04
114037
45
+
484232
18
0
US
+/-
3111013
0
and NM
-/+
34400
0
-
41
125647
58
Comments; the imaging diagnosis is very straight forward for the existence of the mass inthe right lobe of the liver. Unlike the previous cases, the diagnosis is inclined to HCC,however, the interpretation could very well be influenced by the laboratory data, the highAFP value.
5.1-5. Case No. JN-69Diagnosis: HCC with chronic hepatitis (non-A and non-B type).
Clinical history and reason for referral; 66 M. Follow-up study for pneumoconiosis.Laboratory investigations; choline esterase mildly abnormal, ZTT;6.9, TTT; 2.0, total-bilirubin;
0.8, direct-bilirubin, 0.3, CRP;-, HBsAg;-, HBsAb;- and HCV;+.
Liver scintigraphy; 99mTc-Sn colloid 222 MBq(6 mCi).Views; anterior, posterior and right lateral views (from left to right).Scan findings; suspected of SOL in the right lobe, moderate splenomegaly.Scintigraphic comments; suspected of HCC with chronic hepatitis.
'<• / ,

Case Study on the Results m 131
Sonograms; Aloka SSD650, 3.5MHz convex scan transducer.Sonogram findings; an oval shaped mass of 3.5 cm in diameter is found in the anterior portion
of the right lobe of the liver. The internal echo is more or less heterogeneous with theposterior echo enhancement characteristic of HCC.
V
• < « *
•*i * - .

132 • Ultrasound and Radionuclide Images of Liver
Final diagnosis verified by; biopsy under laparoscopy and surgery.Individual scores for case No. JN-69;
AbnormalitySOLHCCMetastasisMalignant tumor
HemangiomaLiver cystAbscessLiver cirrhosis
+
513621
9other
10430
US
+/-
81457
alone
-/+
0320
than HCC and05131
00001
-
06
3143
+
14930
metastasis of5854545357
10000
NM
+/-
121222
liver12356
alone
-/+
12610
40020
-
10214246
4246454142
+
4338212
02253
US
+/-
510114
01133
and NM
-/+
2100
00010
-
56
2349
5552524649
Comments; due to almost normal scan image and hypoechogenicity of the mass, a fewinterpreted as benign lesions, either those of abscess or hemangioma. The majority,however, correctly interpreted HCC as the most probable diagnosis. By NM reading alone,however, the majority of interpretation favoured absence of mass or malignant lymphoma.In combination interpretation, diagnosis of HCC is fairly established indicating final decisionlargely depends on US findings.
5.1-6. Case No.JN-77Diagnosis: HCC with liver cirrhosis (non-A and non-B type).
Clinical history and reason for referral; 63 F. Anorexia moderately elevated at 1973.Physical; liver hard and palpable.
Laboratory investigations; GOT and choline esterase mildly abnormal, AFP;54 ng/ml, totalbilirubin; 2.1, direct-bilirubin; 0.1, CRP;-, ZTT;23.6, TTT;12.1, HBsAg;-,HBsAb;- andHCV;+.

Case Study on the Results • 133
Liver scintigraphy; 99mTc-Sn colloid 148 MBq (4 m Ci).Views; anterior, posterior, left lateral and right lateral views (Anti clockwise from top left).Scan findings; two SOLs in right lobe, poor radionuciide uptake of the liver, and remarkable
splenomegaly.Scintigraphic comments; (1) HCC with liver metastasis, or
(2) Metastatic liver tumors, and liver cirrhosis.

134 • Ultrasound and Radionuclide Images of Liver
Sonograms; Aloka SSD 650, 3.5 MHz convex scan transducer.Sonographic findings; a small mass of 15 mm in diameter is found in the subcapsular rigion
of the right lobe of the liver of which sonographic finding is barely visible because of multipleecho artifact. Also a small discrete cyst of 2 cm in diameter is found in the left lobe ofthe liver.
~r
i i
n i l

Case Study on the Results • 135
Final diagnosis verified by; biopsy under laparoscopy.Individual scores for case No.JN-77;
AbnormalitySOLHCCMetastasisMalignant tumor
Liver cystLiver cirrhosis
+
503716
US
+/-
81697
alone
-/+
4411
other than HCC and2
301
4102
010
-
38
5451
+
3623173
metastasis of592462
00
13
NM
+/-
81495
liver017
alone
-/+
1421
002
-
04
1736
454423
+
514620
5
0177
US
+/-
46
146
025
and NM
-/+
2120
011
-
04
2146
573744
Comments; interpretation of US image at the first run has mostly inclined for SOL and livercyst and only less than 20% of interpreters sugested the diagnosis of HCC. NM, on theother hand, has resulted in the diagnosis of SOL in approximately 70% of the interpretation,and half of them interpreted either HCC or liver cirrhosis. The combination readingdisclosed further increase in interpretation as HCC and in the decrease of cirrhosisinterpretation. Diagnosis of liver cyst increased because of easy identification bysonograms.
5.1-7. Case No. SI-5.Diagnosis: HCC with alcoholic liver cirrhosis.
Clinical history and reason for referral; 60 M. Moderate weight loss and alcoholic dysfunctionwas severe.
Physicals; marked hepatomegaly.Laboratory investigations; GOT and GPT were moderately abnormal. The tumor markers;
AFP;6.0 ng/ml and CEA; 7.0 ng/ml.

136 • Ultrasound and Radionuclide Images of Liver
Liver scintigraphy; 99mTs-Sn colloid 185 MBq (5 mCi), 500 Kc, Elscint APGX 409-AG, numberof PMT; 37, thickness of Na(TL); 1/4 inch and collimator; high resolution.Views; anterior, posterior, left lateral and right lateral views (Anti clockwise from top left).Scan findings; irregular SOL in the right lobe, suspected of SOL in the left lobe, remarkable
hepatomegaly, inhomogenous radionuclide uptake of the liver, mild splenomegaly,remarkable bone marrow radionucli_de_ uptake.
Scintigraphic comments; (1)HCC with liver cirrhosis or (2) Liver cirrhosis and metastaticliver tumors.

Case Study on the Results • 137
Sonograms; Aloka SSD-280LS, 3.5 MHz sector scan transducer.Sonographic findings; a large tumor of 9 cm in diameter is identified in the right lobe of the
liver. Echo texture appearance and existence of halo clearly suggested the diagnosis ofHCC.
<! \
> •
• • * -
' ' V"*
, v . - ^ ' ^

138 • Ultrasound and Radionuclide Images of Liver
Final diagnosis verified by; angiography and histology.Individual score for case No.SI-5;
AbnormalitySOL(mass)HCCMetastasisLiver cirrhosisChronic hepatitis
+
3326135
140
+/-
1798582
US alone
-/+
000021
-
11630412748
+
3529139
211
NM
+/- -
329271
alone
/+
000200
-
07
16261036
+
32271311140
US
+/-
342352
and
-/+
021001
NM
-
13
20221736
Comments; by US interpretation alone, the diagnosis of HCC was made by less than half of theinterpreters and other half suggested the diagnosis of metastatic masses. Diagnosis of livercirrhosis has also" reached to a significant level.
5.1-8. Case NO. CH-3;Diagnosis; HCC with liver cirrhosis.
Clinical history and reason for referral; 54 M. Mild anorexia, oppressive feeling and weightloss. The liver moderately palpable. Tenderness and ascites were moderate.
Laboratory investigations; GOT and GPT were mildly abnormal, choline esterase and gamma-globulin were moderately abnormal. AFP 1200 ng/ml (severely abnormal).

Case Study on the Results • 139
Liver scintigraphy; 99mTc-phytate 148 MBq (4 mCi), 300 Kc, Technicare Sigma 43G, numberof PMT;37, collimator;general purpose and windows; 20.0%.Views; anterior, posterior and right lateral (Anti clockwise from top left).Scan findings; suspected of SOL in right lobe, remarkable hepatomegaly, inhomogenous
radionuclide uptake of the liver, remarkable splenomegaly and marked bone marrowvisualization.
Scintigraphic comments; HCC with liver cirrhosis.

Sonograms; SSA 90A.3.5 MHz linear scan transducer. £Sonographic findings; though the images are rather of limited resolution, can depict the existence of multiple masses in °
the right lobe of the liver. Ascitis accumulation is also found. S3(0o
Q.
I(0

Case Study on the Results • 141
Final diagnosis verified by; histology.Individual score for case No. CH-3;
AbnormalitySOL(mass)HCCMetastasisBenign tumor other
Liver cirrhosis
+
2626113
than45
US
+/-
6492
alone
-/+
0001
hemangioma,16
00
-
02
1226cyst
2721
+
3814111
NM
+/-
411100
and abscess1
262
10
alone
-/+
1560
42
-
0131642
365
+
332512
1
118
US
+/-
26
114
110
and NM
-/+
0011
00
-
04
1129
337
Comments; tumor masses could be identified solely by US, however, liver cirrhosis couldnot be confirmed without NM, which showed apparent splenomegaly and marked bonemarrow uptake suggestive of liver cirrhosis.

142 • Ultrasound and Radionuclide Images of Liver
5.1-9. Case No. CH-1Diagnosis: HCC with liver cirrhosis and chronic hepatitis.
Clinical history and reason for referral; 37 M. Anorexia, oppressive feeling, moderate weightloss and pain abdomen.
Laboratory investigations; choline esterase severely abnormal, GPT mildly elevated and AFPwas 135 ng/ml (moderately abnormal).
Liver scintigraphy; 99mTc-phytate 148 MBq(4 mCi), 300 kc, Technicare Sigma 43G, numberof PMT; 37 and window; 20%.Views; anterior, posterior and right lateral views (Anti clockwise from top left).Scan findings; SOL in right lobe, moderate hepatomegaly, remarkable splenomegaly and
moderate bone marrow visualization.Scintigraphic comments; HCC with liver cirrhosis.

Case Study on the Results • 143
Sonograms; SSA90A, 3.5 MHz linear and sector scan transducers.Sonographic findings; a large tumor of 8 cm in diameter is easily identified in the posterior
portion of the right lobe of the liver. Extensive liver cirrhosis could be diagnosed even bysonogram alone based on the splenomegaly and dilated splenic vein suggesting portalhypertension.

144 • Ultrasound and Radionuclide Images of Liver
Final diagnosis verified by; histologyIndividual score for case No. CH-1;
AbnormalitySOL(mass)HCCLiver cirrhosisChronic hepatitis
+
29291820
US
+/-
33940
alone
-/+
00001
-
005
2631
+
383325121
NM
+/-
348
113
alone
-/+
01000
-
149
1938
+
323221
70
US and
+/- -/
32
1262
NM
'+
00000
-
012
2233
Comments; SOL or mass is easily identified either by US or NM alone. Liver cirrhosis, whichis apparent even on sonograms are not depicted satisfactorily, whereas in NM, nearly halfof interpreters depicted as liver cirrhosis. By combination reading, a majority of interpretationswere HCC.

Case Study on the Results • 145
5.1-10. Case No.fiK-7.Diagnosis; HCC with portal vein thrombosis.
Clinical history and reason for referral; 55 M. Anorexia, moderate weight loss and mildabdominal pain. Ascites and mild jaundice.
Laboratory investigations; GOT was mildly abnormal.
Liver scintigraphy; 99mTc-phytate 370 MBq(10 mCi).Views; anterior, posterior and right lateral views (Anti clockwise from top left).Scan findings; suspected of two SOLs in the right lobe, inhomogenous radionuclide uptake
of the liver, moderate hepatomegaly, mild splenomegaly.Scintigraphic comments; (1) HCC with liver cirrhosis or (2) multiple metastatic liver tumors.
tsfi

146 e Ultrasound and Radionuclide Images of Liver
Sonograms; Diasonix, 3.5 MHz sector scan transducer.Sonographic findings; indiscrete masses of considerable size could be discerned by careful
scrutiny and tumor thrombi in the intrahepatic portal vein should also be identified. Absenceof discrete mass, characteristics of diffuse type HCC makes it difficult to decide this caseas HCC at first glance. Existence of perihepatic ascitic accumulation further suggests themalignant nature of the lesion.

Case Study on the Results • 147
Final diagnosis verified by; US,RI and XCT.Individual score for case No. RK-7;
AbnormalitySOL(mass)HCCMetastasisBenign tumor other
Liver cirrhosisFatty liverChronic hepatitis
+
2722
55
than3400
US
+/-
6567
alone
-/+
0000
hemangioma,1612
0001
-
06
2221cyst
23232930
+
261818
NM
+/-
15112
11and abscess
0001
2457
alone
-/+
2511
3110
-
09
3923
38383735
+
2826
610
0202
US and
+/- -/
5768
0014
NM
'+
2102
1100
-
01
2314
34323429
Clomments; although interpretation as SOL is high, US reading scattered among HCC,metastasis and liver cirrhosis. NM, on the other hand, favors the diagnosis of metastatictumors. By combined interpretation, the diagnosis as HCC was observed in one third ofreaders, the majority of interpretation still in favor of metastatic tumors. This reflects thedifficulty in diagnosing diffuse type HCC in the absence of increased AFP levels.
5.1-11. Case No. RK-5.Diagnosis: HCC with portal vein thrombosis.
Clinical history and reason for referral; 42 M. Moderate anorexia and pain abdomen, mildweight loss and the liver was moderately palpable.
Physicals; hepatomegaly and tenderness were moderate.Laboratory investigations; GOT moderately abnornal, GPT mildly abnormal and AFP was 700
ng/ml (severely abnormal).

148 • Ultrasound and Radionuclide Images of Liver
Liver scintigraphy; 99mTc-phytate 370 MBq(10 mCi).Views; anterior, posterior and right lateral views (Anti clockwise from top left).Scan findings; large SOL in the right lobe, small 3 SOLs in right and left
hepatomegaly, inhomogenous radionuclide uptake and mild splenomegaly.Scintigraphic comments; (1) HCC with hepatitis and its liver metastasis or
(2) Multiple metastatic liver tumors.
lobes,

Case Study on the Results • 149
Sonograms; Hitachi, EU 45, 3.5MHz linear and convex scan transducers.Sonographic findings; large tumor mass with indistinct border was found in the right lobe of
the liver. The tumor mass extends to portal stem causing large, enlarged portal trunkloaded with tumor thrombi. Dilated splenic vein also supports the congestion of the portalsystem.
:-.-.»*•*

150 a Ultrasound and Radionuclide Images of Liver
Final diagnosis virified by; XCT and cytology.Individual scores for case No.RK-5;
Abnormality
SO L( mass)l W ^1 t u o
MetastasisLiver cirrhosisChronic hepatitis
+
29
2913900
US
+/-
3
35321
alone
-/+
0
00011
-
0
014202930
+
8
3426
600
NM
+/-
5
74424
alone
-/+
0
10101
-
0
113324138
+
33
3313800
US and
+/- -/
2
26535
NM
'+
0
00010
-
0
016223130
Comments; all the interpreters agreed on the existence of mass lesion in the liver.Concerning the qualitative interpretation of mass lesion, US finding was interpreted as HCC
in two thirds, whereas the remainder favored the diagnosis of metastatic tumor. On NMimage interpretation the majority interpreted as HCC as the main lesion, however, thecombined reading again has shown a shift, the increase in metastatic masses. If oneconsiders the contribution or coexistence of tumor thrombi in HCC, this shift might nothave occurred.
5.1-12. Case No.PK-6.Diagnosis: HCC
Clinical history and reason for referral; 39 M. Weight loss and painless liver swelling, severeoppressive feeling and moderate anorexia.
Physicals; Hepatomegaly and moderate jaundice.Laboratory investigations; GOT and GPT were moderately abnormal, tumor markers; AFP was
685. 7ng/ml and CEA 43.9 ng/ml.

Case Study on the Results m 151
Liver scintigraphy; 99mTc-Sn colloid 74 MBq(2 mCi) 300 kc, Toshiba GCA-40A, No. of PMT;61, thickness of Nal(TI) 4.5 mm and collimator; general purpose.Views; anterior, posterior and right lateral views (Anti clockwise from top left)Scan findings; remarkable hepatomegaly, suspected of SOL in the left lobe with moderate
splenomegaly.Scintigraphic comments; HCC with chronic hepatitis.

152 • Ultrasound and Radionuclide Images of Liver
Sonograms; Hitachi EUB22, 3.0 MHz linear scan transducer.Sonographic findings; although limited imaging of the liver by the classic instrument,
characteristic change of liver cancer is well imaged throughout the liver. Surface contouris irregular and largely hypoechoic with slight degrees of tumor thrombi in the main trunkof the portal vein of the liver.
' l ,

Case Study on the Results • 153
Final diagnosis verified by; cytology, histology and surgery.Individual score for case No.PK-6;
AbnormalitySOL(mass)HCCMetastasisLiver cirrhosisChronic hepatitis
+
292610920
US
+/-
181813873
alone
-/+
122212
-
13
24303944
+
262110112
NM
+/-
105
10047
alone
-/+
332000
-
01017383430
+
302817210
US and
+/- -I
669135
NM
r+
001020
-
029
333031
Comments; the majority agree on the existence of mass lesions in the liver. In US inter-pretation, though the majority still favor the HCC, there are many readings as metastasisor liver cirrhosis. In NM readings, the majority interpreted HCC as the principal lesion,which alsp showed similar tendency in combination readings with further increase inpositive interpretation than single modality reading.

154 • Ultrasound and Radionuclide Images of Liver
5.1-13. Case No. ID-4.Diagnosis: HCC.
Clinical history and reason for referral; 64 M. Oppressive feeling and pain of the abdomenof mild degree, the liver was slightly palpable. Jaundice was moderate.
Laboratory investigations; GOT and gamma-globulin were moderately abnormal and AFP was35,000 ng/ml.
Liver scintigraphy; 89mTc-sulfur colloid 165 MBq(5 mCi) 400 kc, window; 20%, No. of PMT;61,thickness of Nal(TI); 10 mm and collimatorjhigh resolution.Views; anterior, posterior and right lateral views (Anti clockwise from top left).Scan findings; remarkable hepatomegaly, irregular SOL in the right lobe, inhomogenous
RN uptake of the liver and moderate splenomegaly..Scintigraphic comments;(1) HCC with cirrhosis or(2) Metastatic liver tumors.
*>„*. •
h-it A''

Case Study on the Results • 155
Sonograms; Aloka FanSonic 190, 3.5 MHz narrow convex and contact scan transducer, Polaroidimages.
Sonographic findings: a large tumor in the medial portion of the liver. A marked degree ofheterogeneous echo pattern is evident, suggestive of primary liver cancer. Existence ofsignificant splenomegaly also supports the diagnosis.

156 • Ultrasound and Radionuclide Images of Liver
Final diagnosis is" verified by; US and Rl images and clinical course.Individual scores for case No. ID-4;
AbnormalitySOL(mass)
HCCMetastasisLiver cirrhosisChronic hepatitis
+
4846
28711
US
+/-
CM COO CM CO
CM
alone
-/+
00
O O CO CO
-
01
12414344
+
3535
23431
NM
+/-
11
CO CO CO
CO
alone
-/+
11
1000
-
00
10273133
+
3636
25250
US and
+/- -/
11
7132
NM
'+
00
0011
-
00
5342834
Comments; everyone agrees on the presence of mass lesions in the liver. The majority alsoagreed on HCC, whereas a small percentage of the interpreters also doubt on metastaticmasses. Upon combined reading, however, diagnosis of HCC and liver cirrhosis ispredominant.

Case Study on the Results • 157
5.2 LIVER METASTASIS:
Metastatic tumors are more common than primary hepatocellular carcinoma. The commonappearance is that of multiple focal lesions of altered reflectivity. The margins are poorly defined.The echoes are less intense than those of non-tumor parenchyma, but many are strongly reflectiveespecially those deposits from Gl tract and urogenital tumors. Other patterns, bull's eye or targetlesion, are characteristic of metastatic tumors. Fluid-filled deposits and calcified tumors may alsoappear in metastases from ovarian or pancreatic malignancy and also in metastses arising fromcolorectal cancer.

158 • Ultrasound and Radionuclide Images of Liver
5.2-1. Case No. JN-6Diagnosis: Liver metastasis from breast carcinoma.
Clinical history and reason for referral; 50F Radical mastectomy in Feb. 1985(solid tubularcarcinoma). Ascites is severe.
Laboratory investigations; serum biochemistry and tumor markers examined were normal.
Liver scintigraphy; 99mTc-Sn colliod 148 MBq(4 mCi), 700 kcViews; anterior, posterior, right lateral views ( clockwise from top left).Scan findings; two SOLS in the right lobeScintigraphic comments; metastatic liver tumors.

Case Study on the Results • 159
Sonograms; Aloka SSD 650, 3.5 MHz convex scan transducer.Sonographic findings; scattered hypoechoic, round mass echoes were found in the hilar portion
and perichoiecystic regions. The normal sized spleen also suggests metastatic tumors ofthe liver.
•s . "• * fl
• £ K -

160 • Ultrasound and Radionuclide Images of Liver
Final diagnosis verified by; angiography and biopsy under laparoscopy.Individual score for case No.JN-6.
AbnormalitySOLHCCMetastasisMemangiomaLiver cystLiver abscessBenign tumor other
Fatty liverChronic hepatitis
+
4639
325201
than040
US
+/-
370
12300
alone
-/+
0102000
hemangioma,020
210
-
02
4610444948liver
474349
+
3218
15031
cyst and000
NM
+/-
2317
115
154
alone
-/+
5706014
abscess452
323
-
6246440655757
595961
+
4237
723
002
140
US
+/-
1293
10001
310
and NM
-/+
4433000
002
-
19
4623595956
555457
Comments; good agreement were obtained on the existence of mass lesion of the liver. InUS reading, the mojority agreed on metastatic tumors of the liver. In NM reading,inerpretation scattered among metastasis, cyst, abscess. By combined reading, themajority has interpreted correctly as metastatic tumor, however, a small portion of thereaders has interpreted as HCC, sway of interpretation.
5.2-2. Case No. JN-12Diagnosis: Liver metastasis from transverse colon carcinoma
Clinical history and reason for referral; 67 M. Subtotal colectomy for transverse colon cancerin 1985. Because of palpable liver mass and tenderness of the RUQ, and ascites, thepatient was referred to the clinic.
Laboratory investigations; GOT severely abnormal, GPT, choline estrase and gammaglobulinmildly abnormal, AFP;1 ng/ml, CEA 233.4 ng/ml, ZTT;6.2, TTT2.1, CRP;+++, HBsAg;-and HBsAb;-.

Case Study on the Results m 161
Liver scintigraphy; 99mTc-Sn colloid 148 MBq(4 mCi) 700 kc.Views; anterior, posterior, left lateral and right lateral (Anti clockwise from top left).Scan findings; large SOL in the right lobe with hepatomegaly.Scintigraphic comments; metastatic liver tumors.

162 • Ultrasound and Radionuclide Images of Liver
Sonograms; Aloka SSD 650, 3.5 HMz convex scan transducer.Sonographic findings; echogenic liver mass scattered in the liver, the size of the mass ranged
from more than 10 cm in diameter to the much smaller masses. Echo levels weresignificantly echogenic, suggesive of colonic origin.

Case Study on the Results • 163
Final diagnosis verified by; angiography and biopsy under laparoscope.Individual score for case No. JN-12.
AbnormalitySOL(mass)HCCMetastasisLiver cystChronic hepatitis
+
4032131402
US
+/-
456503
alone
-/+
010000
-
06
25254439
+
6956
645
50
NM
+/-
081821
alone
-/+
020102
-
03
62156266
+
5651
444
00
US and
+/- -/
342700
NM
'+
131001
-
02
539
6059
Comments; interpretation as SOL is unanimous. In US reading, interpretation as HCC ormetastatic mass was almost equal, however, in NM reading, the diagnosis mostlysupported was metastatic tumors. In combination reading, this was further confirmed.
5.2-3. Case No. TH-4.Diagnosis: Liver metastasis from colon carcinoma.
Clinical history and reason for referral; 82 F. Left hemi-colectomy for colon carcinomaapproximately 2 years ago. Anorexia, oppressive feeling and moderate weight loss, barelypalpable liver were the symptoms at the time of referral.
Physicals; moderate degrees of hepatomegaly, tenderness and jaundice were present.Laboratory investigations; choline esterase was moderately abnormal, and GOT and GPT
levels were mildly abnormal.

164 • Ultrasound and Radionuclide Images of Liver
Liver scintigraphy; 9mTc-phytate 111 MBq(3 MCi), 500 kc, window; 15%, No. PMT; 37,thickness of Nal (Tl); 10 mm and collimator; general purpose.Views; anterior, posterior and right lateral views (Anti clockwise from top left).Scan findings; hepatomegaly, two SOLs in the right lobe and a SOL in left lobe.Scintigraphic comments; metastatic liver tumors.

Case Study on the Results • 165
Sonograms; ATL Mark 4, 3.5MHz sector scan transducer.Sonographic findings; echogenic tumor masses with or without surrounding halo were found
scattered throughout the liver. The liver parenchyma appeared almost normal.Size of the mass ranged from 2-3 cm in diameter.

166 • Ultrasound and Radionuclide Images of Liver
Final diagnosis verified by; US and clinical course.Individual scores for case No. TH-4;
AbnormalitySOL(mass)HCCMetastasisHemangiomaChronic hepatitis
+
5049
221
90
US
+/-
122992
alone
-/+
000001
-
00
47213348
+
32300
2100
NM
+/-
542703
alone
-/+
110301
-
00
367
3834
+
3333
12020
US and
+/- -,
331903
NM
'+
000002
-
00
347
3431
Comments; the majority agreed upon the existence of SOL in the liver. Either in US or NMinterpretations, the majority again favored the diagnosis of metastatic tumors, however,in US some also suggested the diagnosis of hemangioma based upon echo levels andshape of the masses.
5.2-4 Case No. Ch-7Diagnosis: Liver metastasis from lung carcinoma.
Clinical history and reason for referral; 35 M. Enlargement of the liver with suspected livermass during the course of lung cancer treatment.
Laboratory investigations; the liver function tests were normal.

Case Study on the Results • 167
Liver scintigraphy; 99mTc-phytate 148 MBq(4 MCi), 320 kc, Technicare Sigma 43G, No.ofPMT;37, collimator; general purpose and window; 20%.Views; anterior, posteroir and right lateral views (Anti clockwise from top left).Scan findings; remarkable hepatomegaly, small SOLs in the right and left lobes with mild
splenomegaly.Scintigraphic comments; (1) metastatic liver tumors or (2) metastatic liver tumors with
chronic hepatitis.

168 • Ultrasound and Radionuclide Images of Liver
Sonograms; Toshiba SSA 90A, 3.75 MHz linear scan transducer.Sonographic findings; in the enlarged liver, there are scattered bull's eye lesions of 1-2 cm
in diameter. One mass in the medial portion of the left lobe of the liver exceeds 3 cmin diameter. Liver textures were generally normal.
I
/ ski

Case Study on the Results • 169
Final diagnosis verified by; histology.Individual scores for case No. CH-7;
AbnormalitySOL(mass)HCCMetastasisFatty liverAcute hepatitisChronic hepatitis
+
2626
019001
US
+/-
772
10100
alone
-/+
0000001
-
00
314
323331
+
16915012
NM
+/-
171446647
alone
-/+
6207002
-
3173724363731
+
231709021
US and
+/- -i
1270
13342
NM
'+
0004003
-
01135
9322929
Comments; interpretation of US images were straightforward as metastatic tumors. In NMinterpretations, however, existence of SOL was less significant and interpretation scatteredamong HCC, metastasis, chronic hepatitis. In combined readings, however, the majorityagain interpreted as metastic tumors of the liver.
5.2-5. Case No. TH-2Diagnosis: Liver metastasis from colon carcinoma.
Clinical history and reason for referral; 60 F. Two years ago, colectomy was carried out, andmetastatic liver tumors (left lateral) were found during the follow-up by US examination.
Physicals; no subjective complaints and no objective symptoms.Laboratory investigations; no change in the liver function tests and tumor markers.

170 • Ultrasound and Radionuclide Images of Liver
Liver scintigraphy; 99mTc-phytate 120 MBq(3.25 mCi), 500 kc, Siemens Basicam, No. of PMT;75, thickness of Nai(TI); 10 mm, collimator; general purpose and window; 15%.Views; anterior, posterior and right lateral views (Anti clockwise from to left).Scan findings; hepatomegaly, small SOL in the left lobeScintigraphic comments; metastatic liver tumor with chronic hepatitis.

Case Study on the Results • 171
Sonograms; ATL Mark 4,3.5 MHz sector scan transducer.Sonographic findings; in the left of the liver, small echogenic foci are found in the triangular
echo poor portion. No other abnormality was found.
5 * I

172 • Ultrasound and Radionuclide Images of Liver
Final diagnosis verified by; US and clinical course.Individual scores for case No. TH-2;
AbnormalitySOL(mass)HCCMetastasis of liverLiver cystAbscessLiver cirrhosisChronic hepatitis
+
39391443101
US
+/-
11101451303
alone
-/+
01000011
-
00
224146464945
+
94020101
NM.
+/-
1910232046
alone
-/+
30000001
-
724363336373430
+
1714
130011
US and
+/- -;
12101042144
NM
'+
31040021
-
310242433342829
Comments; the majority agreed upon the existence of SOL. The interpretations of SOL in USfavored the diagnosis of HCC, however, by NM image interpretation, complete reversionoccurred and interpretation scattered among disease criteria. In combined reading, somefavored the diagnosis of metastatic tumor.

Case Study on the Results • 173
5.3. NON-HODGKIIM'S LYMPHOMA.
Lymphoma can infiltrate the liver parenchyma in a diffuse manner. Liver size usually increases.Formation of solid masses can also occur in the liver parenchyma and differentiation is difficultfrom other causes of metastatic deposits.
Presence of splenomegaly is another important finding suggesting malignant lymphoma.

174 • Ultrasound and Radionuclide Images of Liver
5.3-1. Case No. TH-7.Diagnosis: Non-Hodgkin's lymphoma.
Clinical history and reason for referral; 42 M. Two years ago, anorexia, oppressive feelingand weight loss were moderate. Masses were found in the liver by US. Laboratoryinvestigations; GOT and GPT were slightly abnormal.

Case Study on the Results • 175
Liverscintigraphy;99mTc-phytate122MBq(3.3mCi), 500 kc, Siemens Basicam, No. of PMT;37,thickness of Nal (Tl); 10 mm, collimator; general purpose and window; 15%.Views; anterior, posterior and right lateral (Anti clockwise from top left).Scan findings; remarkable hepatomegaly, a large SOL and three small SOLs in the right
and left lobes, mild splenomegaly.Scintigraphic comments; metastatic liver tumors.

176 • Ultrasound and Radionuctide Images of Liver
Sonograms; ATL, Mark 4, 3.5 MHz sector scan transducer.Sonographic findings; round hypoechoic masses of considerable size are found in both liver
lobes. Internal echo texture is homogenous and no surrounding halo found. These featuresare suggestive of sarcomatous changes.
7/

Case Study on the Results m 177
Final diagnosis verfied by; cytology.Individual scores for case No. TH-7;
AbnormalitySOL(mass)HCCMetastasisLiver cystAbscessLiver cirrhosisChronic hepatitis
+
4544
173
1100
US
+/-
563
140733
alone
-/+
00000032
-
00
462947324445
+
3535
0137001
NM
+/-
22293430
alone
-/+
11010001
-
00
361528343536
+
34343
142410
US and
+/- -/
22264102
NM
'+
00000021
-
00
311630313333
Comments; the majority agreed upon SOL in the liver. In US images, characteristic findingsfor lymphomatous lesion are present. The interpretations as metastatic masses, abscessor cystic lesion are in decreasing order. In NM reading, almost identical tendencies werefound. The combined reading favored metastatic tumor.

178 • Ultrasound and Radionuclide Images of Liver
5.4. HEMANGIOMA
One of the most frequent benign masses found in liver is hemangioma. Two types, cavernousand capillary are distinguished. The former mass is characterized by the irregular borderedhypoechoic lesion with posterior echo enhancement and the latter is characterized by theechogenic lesion. The masses will remain unchanged for over months of follow-up. Angiographymay not be revealing. MRI gives rather clear cut differentiation of T2 weighted images by increasedcontrast.

Case Study on the Results • 179
5.4-1. Case No. JN-90Diagnosis: Liver hemangioma with liver cirrhosis
Clinical history and reason for referral; 37 M. Carrier of HBV and the high risk patient ofhepatoceljular carcinoma. An echogenic mass of the liver in follow-up for myelofibrosis.
Laboratory investigations; serum biochemistry and tumor marker test were normal, but ZTT;4.9and HBsAg;+.
Liver scintigraphy; 99mTc-Sn colloid 222 MBq(6 mCi), 1200 kc.Views; anterior, posterior, right lateral and left lateral (Anti clockwise from top left).Scan findings; mild hepatomegaly, poor RN uptake of the liver, remarkable splenomegaly
and irregular RN uptake of the spleen.Scintigraphic comments; (1) Portal hypertension or (2) Liver cirrhosis.

180 • Ultrasound and Radionuclide Images of Liver
Sonograms; Aloka SSD 250, 3.5 MHz linear scan transducer.Sonographic findings; a round small echogenic nodule is found in the very posterior margin
of the liver. The size is less than 2 cm in diameter.

Case Study on the Results m 181
Final diagnosis verified by; angiography and biopsy under laparoscopy.Individual scores for case No.JN-90;
AbnormalitySOLHCCMetastasisHemangiomaLiver cirrhosisFatty liverAcute hepatitisChronic hepatitisDiffuse liver disease
+
3293613371other2
US
+/-
1651203566
than1
alone
-/+
700000110
-
74858546156534855
cirrhosis, fatty1 58
+
2750404100
liver0
NM
+/-
1510309923
alone
-/+
241
1600211
and hepatitis11 0
-
13544224532334241
34
+
3590114512
1
US
+/-
1224137428
7
and NM
-/+
12
16061101
0
-
94437554745475446
49
Comments; although abnormality is suspected by most of the interpreters, the significancelevel of SOL is far lower than any of the previous cases in which some lesions were foundin the liver. The small hemangioma in the posterior sections of the right lobe of the liverapparently perplexed the image interpretation.
5.4-2. Case No. JN-46.Diagnosis; hemangioma with chronic hepatitis (non-B type).
Clinical history and reason for referral; 63 F. Hysteromyomectomy in 1962 (37 years old).Laboratory investigations; GOT and gamma-globulin were sustained at abnormal level. Of the
liver function tests; ZTT; 29.5, TTT; 19.5, HBs Ag;-, HBsAb+ And HCV;+.

182 • Ultrasound and Radionuclide Images of Liver
Liver scintigraphy; 99mTc-Sn colloid 148 MBq(4 mCi) 700 kc.Views; anterior, posterior, left lateral and right lateral views (Anti clockwise from top left).Scan findings; large SOL in the right lobe with moderate splenomegaly.Scintigraphic comments; HCC with chronic hepatitis.

Case Study on the Results • 183
Sonograms; Aloka SSD 650, 3.5 MHz convex scan transducer.Sonographic findings; a large echogenic mass and medium-sized masses with heterogenous
echo texture are found in the anterior and posterior segments of the right lobe.
* -*

184 • Ultrasound and Radionuclide Images of Liver
Final diagnosis verified by; angiography and biopsy under laparoscopy.Individual scores for cases No.JN-46;
AbnormalitySOLHCCMetastasisHemangiomaLiver cystLiver abscessLiver cirrhosisFatty liver
+
29202800134
US
+/-
17148
1120322
alone
-/+
120420000
-
01137244347434241
+
665210009700
NM
+/-
1101240
101540
alone
-/+
022000122
-
14
44646849456266
+
4843121021200
US and
+/- -/
10119843141
NM
'+
121010000
-
03
37415255565558
Comments; the majority agreed on SOL both in US and NM readings. By US image reading,nearly half of the interpreters read as metastatic masses and remainder interpreted asHCC. In NM interpretation, on the other hand, benign lesions, liver cyst or liver abscesswere favored in place of malignant mass of the liver. On combined interpretation, however,most readers again inclined to interpret as one of the malignant masses and only onetenth of readers suggested the diagnosis of hemangioma.
5.4-3. Case No. RK-3.Diagnosis: Hemangioma
Clinical history and reason for referral; 43 F. Oppressive feeling. On US examination forabdomen, a mass lesion on posterior segment of right lobe was found.
Laboratory investigations; liver function tests and tumor markers were in range of normalvalues.

Case Study on the Results • 185
Liver scintigraphy; 99mTc-phytate 370 MBq(10 mCi).Views; anterior, posterior and right lateral (Anti clockwise from top left).Scan findigns; mild hepatomegaly, SOL in right lobeScintigraphic comments; SOL (suspected HCC, but differential diagnosis is difficult from
scintigraphic images.)

186 • Ultrasound and Radionuclide Images of Liver
Sonograms; Hitachi SUB 45, 3.5 MHz sector scan transducer.Sonographic findings; a 59 x 45 mm, echogenic round tumor was found in posteromedial
section of liver by US scanning. Contour is sliqhtlv irregular, without any halo around.

Case Study on the Results • 187
Final diagnosis verified by; US and NM images.Individual scores for case NO. RK-3;
AbnormalitySOL(mass)HCCMetastasisHemangiomaAbscessChronic hepatitis
+
2322
83200
US
+/-
9833720
alone
-/+
0000002
-
02
2136233030
+
3834
80091
NM
+/-
4691053
alone
-/+
1210011
-
01
2542432838
+
303010
1231
US and
+/- -I
4473450
NM
'+
0000002
-
00
1730282631
Comments; majority interpreted as SOL positive both in US and NM. differential diagnosisfluctuated considerably.
5.4-4. Case No. RK-2.Diagnosis: Hemangioma.
Clinical history and reason for referral; 48 M. Mild hepatomegaly was found on US examinationon occupational group health check-up.
Laboratory investigations; liver function tests were within normal values and tumor markerswere not estimated.

188 • Ultrasound and Radionuclide Images of Liver
Liver scintigraphy; 99mTc-phytate 370 MBq (10 mCi).Views; anterior, posterior and right lateral (Anti clockwise from top left).Scan findings; large SOL in right lobe.Scintigraphic comments; (1) HCC or (2) Abscess.
-V -

Case Study on the Results • 189
Sonograms; Hitachi EUB 22, 3.0 MHz sector scan transducer.Sonographic findings; a large irregular-shaped mass of 6 cm diameter is found in posterior
of right lobe. Echo texture of mass supports diagnosis of hemangioma.

190 • Ultrasound and Radionuclide Images of Liver
Final diagnosis verified by; 99m Tc-RBC imaging.Individual scores for case No.RK.2;
AbnormalitySOL(mass)HCCMetastasisHemangiomaLiver cystAbscessChronic hepatitis
+
30291224000
US
+/-
22516012
alone
-/+
00000001
-
01
152922323129
+
40361140350
NM
+/-
24450345
alone
-/+
12100000
-
01
273443373438
+
31311332500
US
+/-
44722103
and NM
-/+
00000001
-
00
153031293531
Comments; because of the large mass which shows characteristic uptake defect of radiotracer,the majority of interpretation favored the diagnosis of HCC and few suggested of metastatictumor of the liver. Very few interpreted as hemangioma which was the correct diagnosis.

Case Study on the Results • 191
5.5. LIVER ABSCESS.
Ultrasound is very useful in detecting liver abscess due to bacterial infection and parasiticinfestation. The abscess initially demonstrates as an ill-defined solid mass lesion with decreasedechogenicity. As pus accumulates, shaggy walled capsules encircle more or less echopoor cysticlesions. Gas may be formed in the cystic mass. Appearance of cysts are usually identical bothin pyogenic and amoebic abscesses. Therapeutic drainage with a catheter is useful for resolutionof cystic changes.

192 • Ultrasound and Radionuclide Images of Liver
5.5-1. Case No.lN-9.Diagnosis: Amoebic liver abscess.
Clinical history and reason for referral; 50 M. Moderate pain in right upper quadrant of theabdomen with spiking fever of 10 days duration. Oppressive sensation with mild degreeof hepatomegaly was evident
Laboratory investigations; liver function tests were entirely normal.
Liver scintigraphy; 99mTc-phytate 185 MBq(5 mCi), 500 kc, No.of PMT; 75, thickness of Nal(Tl); 10 mm and window; 20%.Views; anterior, posterior and right lateral (Anti clockwise from top left).Scan findings; moderate hepatomegaly, large SOL in the right lobe.Scintigraphic comments; (1) Abscess or (2) HCC.

Case Study on the Results • 193
Sonograms; ATL Cardio Mark 610, 3.5 MHz sector scan transducer.Sonographic findings; a large round mass with the diameters of 5.6 x 6.6 cm is located in
the right lobe of the liver. Because of the complete round and relatively sharp contourwith the posterior echo enhancement, cystic nature of the mass is evident. Together withminimum internal echoes and febrile course of the disease, the liver abscess is the mostprobable diagnosis.

194 • Ultrasound and Radionuclide Images of Liver
Final diagnosis verified by; XCT and cytology.Individual scores for case No. IN-9;
AbnormalitySOL(mass)HCCAbscess
+
3030
59
US
+/-
3359
alone
-/+
0000
-
00
2315
+
4139106
NM
+/-
23
107
alone
-/+
0000
-
01
2230
+
3333
97
US and
+/- -/
3349
Nlv
'+
0000
1
-
00
2320
Comments; the majority of interpreters have agreed on the presence of SOL in the liver.The final diagnosis has separated into two, HCC and abscess, the latter was the correctone. NM image showed rather indistinct contour and possibly reflect the presence offunctional tissues surrounding the abscess.
5.5-2. Case No TH-8.Diagnosis: Amoebic liver abscess.
Clinical history and reason for referral; moderate pain of the upper abdomen, anorexia andweight loss were the chief complaints.
Laboratory investigations; GOT, GPT and choline esterase were mildly abnormal.

Case Study on the Results a 195
Liver scintigraphy; 99mTc-phytate 120 MBq (2.25 m Ci), 500 kc, Siemens Basicam, No. ofPMT;37, thickness of Nal(TI); 10mm, collimator; general purpose, window; 15%.Views; anterior, posterior and right lateral (Anti clockwise from top left).Scan findings; remarkable hepatomegaly, large SOL with clear margin in the right lobe
and small SOLs in the right and left lobes and positive bone marrow visulaization.Scintigraphic comments; (1) Metastatic liver tumours or (2) HCC and its liver metastases
with liver cirrhosis.

196 • Ultrasound and Radionuclide Images of Liver
Sonograms; ATL Mark 4, 3.5 MHz sector scan transducer.Sonographic findings; two cystic masses with different size are demonstrated in the right lobe
of the liver. The internal echoes and echo texture of periphery of the cystic lesion clearlyindicated the presence of abscess as shown in the previous case.

Case Study on the Results • 197
Final diagnosis verified by; US and clinical course.Individual scores for case No. TH-8;
AbnormalitySOL(mass)HCCMetastasisAbcsessLiver cirrhosisChronic hepatitis
+
4645
42
2711
US
+/-
5623
1002
alone
-/+
0010013
-
00
4446144945
+
3635126150
NM
+/-
12
104340
alone
-/+
1101001
-
00
1627342937
+
3535115741
US and
+/- -y
1139323
NM
'+
0000001
-
00
2222263031
Comments; US diagnosis in the first glance rather favors the diagnosis of abscess, which isthe final diagnosis. NM scan, however, caused deviation from the true answer, since theborder of the mass appeared as less smooth and daughter lesions also exist mimickingmetastatic disease.
5.5-3. Case No. IN-19.Diagnosis: Amoebic liver abscess with right pleural effusion.
Clinical history and reason for referral; 31 M, Severe pain in the upper abdomen combinedwith a moderate degree of fever and tendeness.
Laboratory investigations; GOT and GPT were moderately abnormal.

198 • Ultrasound and Radlonuclide Images of Liver
Liver scintigraphy; 99mTc-phytate 185 MBq (5 mCi), 500 kc, Siemens ZLC 7500, No. of PMT;71,thickness of Nal (Tl); 10 mm, collimator, high resolution and window; 15%.Views; Anterior, posterior and right lateral views (Anti clockwise from top left).Scan findings; hepatomegaly, large clear-margined SOL in the right lobe.Scintigraphic comments; (1) HCC or (2) Abscess.

Case Study on the Results • 199
Sonograms; ATL, Mark 600, 3.5 MHz sector scan transducer.Sonographic findings; a large cystic mass was found in the posterior part of the right lobe.
It measured 12 cm diameter with fine debritic echoes.
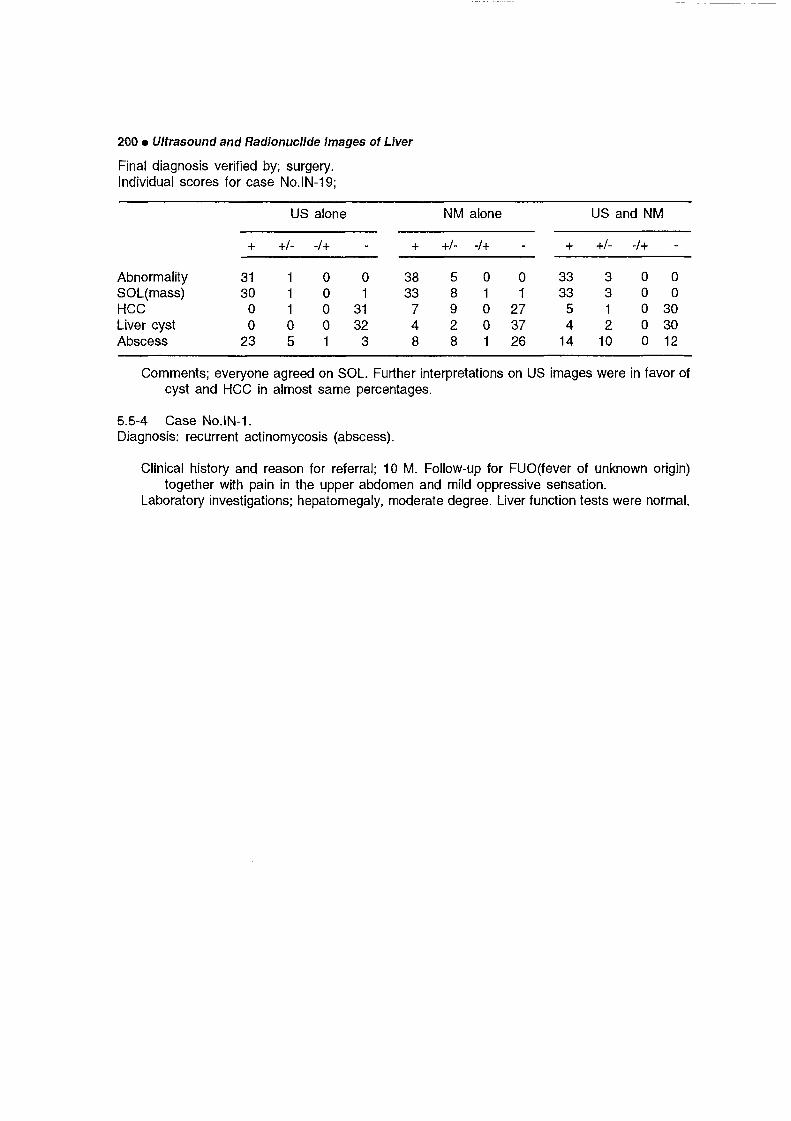
200 • Ultrasound and RadionucHde Images of Liver
Final diagnosis verified by; surgery.Individual scores for case No.lN-19;
AbnormalitySOL(mass)HCCLiver cystAbscess
+
3130
00
23
US
+/-
11105
alone
-/+
00001
-
01
3132
3
+
3833748
NM
+/-
58928
alone
-/+
01001
-
01
273726
+
3333
54
14
US and
+/- -/
3312
10
NM
'+
00000
-
00
303012
Comments; everyone agreed on SOL. Further interpretations on US images were in favor ofcyst and HCC in almost same percentages.
5.5-4 CaseNo.lN-1.Diagnosis; recurrent actinomycosis (abscess).
Clinical history and reason for referral; 10 M. Follow-up for FUO(fever of unknown origin)together with pain in the upper abdomen and mild oppressive sensation.
Laboratory investigations; hepatomegaly, moderate degree. Liver function tests were normal.

Case Study on the Results • 201
Liver scintigraphy; 99mTc-phytate 185 MBq (5 mCi), 500 kc, Seimens ZLC 7500, NO.of PMT;75,thickness of Nal(TI);10mm, collimator; high resolution and window; 15%.Views; anterior, posterior and right lateral views (Anti clockwise from top left).Scan findings; moderate hepatomegaly, SOL with irregular margin in the right lobe with
moderate splenomegaly.Scintigraphic comments; (1) Abscess or (2) HCC.
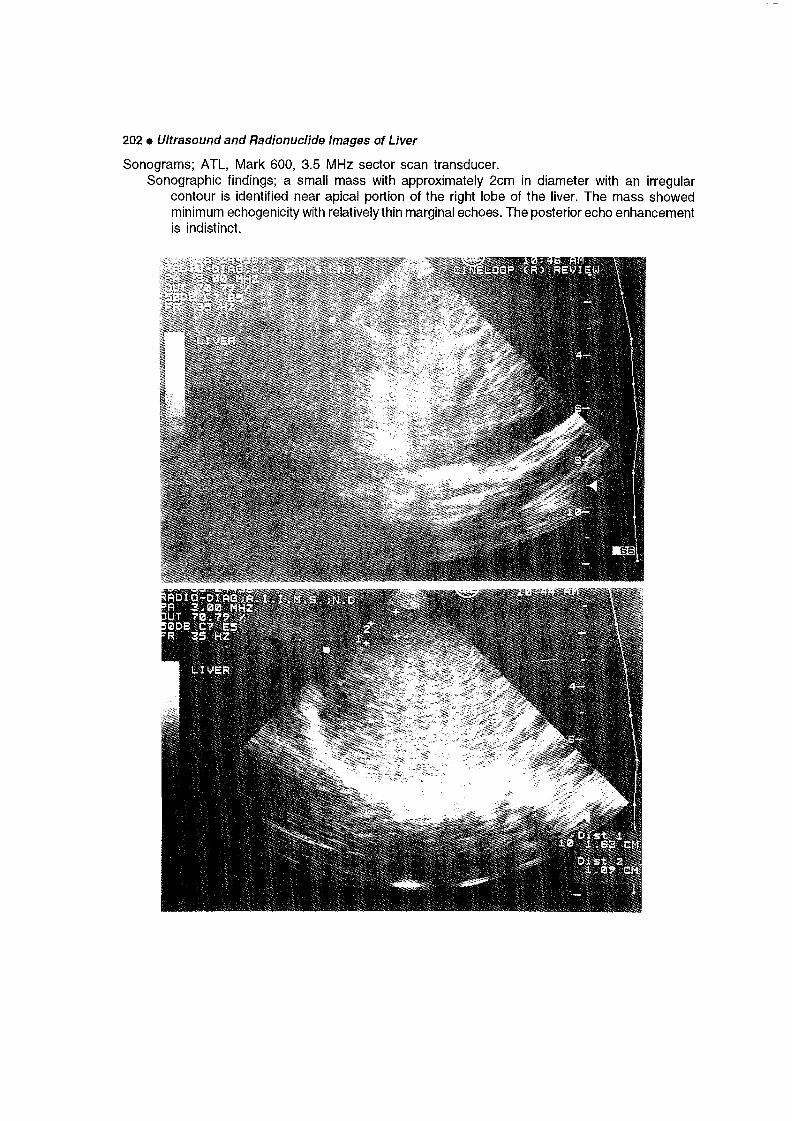
202 • Ultrasound and Radionuclide Images of Liver
Sonograms; ATL, Mark 600, 3.5 MHz sector scan transducer.Sonographic findings; a small mass with approximately 2cm in diameter with an irregular
contour is identified near apical portion of the right lobe of the liver. The mass showedminimum echogenicity with relatively thin marginal echoes. The posterior echo enhancementis indistinct.

Case Study on the Results • 203
Final diagnosis verfied by; surgery.Individual score for case No.lN-1;
AbnormalitySOL(mass)HCCMatastasisAbscess
+
1514040
Benign tumor other than
Acute hepatitis10
us
+/-
1515528
alone
-/+
10001
hemangioma:
20
Diffuse liver disease other than0 1
00
-
24
282724
, cyst3033
+
2016207
NM
+/-
2013505
and abscess21
cirrhosis, fatty liver0 32 1
63
alone
-/+
14011
21
and hepatitis4 0
-
19
354129
3237
37
+
2323
300
10
0
US
+/-
1111963
11
1
and NM
-/+
20001
21
0
-
02
243032
3234
35
Comments; the majority of readers identified the SOL since it was marked on the image. Theresulting differential diagnosis is multiple, however, and no convergence was noted evenafter addition of US and NM images. Abscess following actinomyces infestation is indeedrare and could not be identified with ease.
5.5-5. Case No.TH-9.Diagnosis: Multiple liver abscess.
Clinical history and reason for referral; 69 M. High fever, severe pain in the upper abdomen,moderate anorexia and mild oppressive feeling.
Physicals; high fever, severe tenderness and moderate hepatomegaly.Laboratory investigations; choline esterase was mildly abnormal.

204 • Ultrasound and Radionuclide Images of Liver
Liver scintigraphy; 99mTc-phytate 120 MBq(3.25mCi),500 kc, Siemens ZLC 7500, No.of PMT;75, collimator; general purpose and window; 15%.Views; anterior, posterior and right lateral (Anti clockwise from top left).Scan findings; moderate hepatomegaly, two SOLs with clear margin in the right lobe and
suspected SOL in left lobeScintigraphic comments; (1) metastatic liver tumors or (2) HCC and its hepatic metastasis.

Case Study on the Results m 205
Sonograms; ATL, Mark 600, 3.5 MHz sector scan transducer.Sonographic findings; cystic masses with internal echoes located in the posterior sections of
the right lobe of the liver and also in the left lobe. Small cystic masses are also found.The posterior echo enhancement is indistinct.
4 v.

206 • Ultrasound and Radionucllde Images of Liver
Final diagnosis verified by; clinical course.Individual scores for case No. TH-9;
AbnormalitySOL(mass)HCCMetastasisAbscessBenign tumor other
Liver cirrhosisChronic hepatitis
+
504912125
than610
US
+/-
12592
alone
-/+
00000
hemangioma,024
021
-
00
343044cyst
454646
+
3535481
NM
+/-
22976
and abscess100
000
alone
-/+
11200
001
-
00
232331
373837
+
34341592
000
US and
+/- -/
22441
001
NM
'+
00000
011
-
00
172333
363534
Comments; the majority indicated the SOL in the right lobe of the liver. The final diagnosisagain showed a considerable multiplicity reflecting the complicated scan findings. Uponcombined reading, the correct diagnosis as abscess was by three readers, approximatelyone twentieth of the total number of examiners.
5.5-6. Case NO. TH-3.Diagnosis: Liver abscess.
Clinical history and reason for referral; 25 M. Moderate pain in the upper abdomen, mildanorexia and weight loss.
Physicals; severe tenderness with hepatomegaly.Laboratory investigation; GOT slightly elevated.

Case Study on the Results • 207
Liver scintigraphy; 99mTc-phytate 120 MBq(3.25 mCi), 500 kc, Siemens ZLC 7500, No. of PMT;75, thickness of Nal(TI); 10mm, collimator; general purpose and window; 15%.Views; anterior, posterior and right lateral (Anti clockwise from top left).Scan findings; moderate hepatomegaly, inhomogenous RN uptake of the liver, large SOL
in the right lobe, mild splenomegaly.Scintigraphic comments; (1) Cyst, (2) Abscess or (3) HCC.
/ i jr.

208 • Ultrasound and Radionuclide Images of Liver
Sonograms; ATL, Mark 4, 3.5 MHz sector scan transducer.Sonographic findings; two large cystic masses with identical image characteristics in the right
lobe of the liver. Diffuse fine internal echoes with clear border and contour, minimumhypoechoic zone which circumscribed the space, has clearly indicated the cystic natureof the mass.

Case Study on the Results • 209
Final diagnosis verified; surgery.Individual scores for cease No.Th-3;
AbnormalitySOL(mass)
HCCLiver cystAbscessChronic hepatitis
+
4948
09
250
US
+/-
23
06
112
alone
-/+
00
0001
-
00
51361548
+
3535
21072
NM
+/-
22
23
102
alone
-/+
11
1001
-
00
33252133
+
3333
06
160
US
+/-
33
0552
and NM
-/+
00
0003
-
00
33251531
Comments; diagnosis of the lesions are correctly made by the most of interpreters, however,a few had inclined to the diagnosis of cysts.
5.5-7. Case No. CH-4.Diagnosis: Pyogenic liver abscess.
Clinical history and reason for referral; 39 M. Insidious weight loss of unknown origin.Physicals; mild hepatomegaly, however there was no tenderness.Laboratory investigations; liver function tests were normal.

210* Ultrasound and Radionuclide Images of Liver
Liver scintigraphy; 99mTc-phytate 148 MBq (4 mCi), 300 kc, Technicare Sigma 43G, No. ofPMT; 37, collimator; general purpose and window; 20%.Views; anterior, posterior and right lateral views (Anti clockwise from top left).Scan findings; remarkable hepatomegaly, poor RN uptake of the liver, rounded large SOL
in the right lobe and mild splenomegaly.Scintigraphic comments; (1) Abscess or (2) HCC.

Case Study on the Results • 211
Sonograms; Toshiba SSA 90A, 3.5MHz linear scan transducer.Sonographic findings; a large and round cystic mass is found to occupy the right lobe of the
liver. The echogenic rim, heterogeneous internal echos and the posterior echo enhancementare strongly suggestive of cystic mass of pyogenic origin.

212 • Ultrasound and Radionuclide Images of Liver
Final diagnosis verified by; histology.Individual scores for case No. CH-4;
AbnormalitySOL(mass)HCCLiver cystAbscessLiver cirrhosis
+
282716020
US
+/-
543023
alone
-/+
000000
-
02
14332930
+
4037
75
101
NM
+/-
255460
alone
-/+
110000
-
00
31342742
+
323210
170
US and
+/- -/
3333
115
NM
'+
000000
-
00
22311730
Comments; a round mass with diffusely distributed internal echoes with surrounding strongechoes makes it difficult to suggest a diagnosis. US image, however, is of much lowerquality compared to NM images, making it difficult to interpret adequately.
5.5-8. Case No. IN-6.Diagnosis: Amoebic liver abscess.
Clinical history and reason for referral; 13 M. High fever continued for 10 days, oppressivefeeling and pain of upper abdomen were moderate in degree.
Physicals; moderate tenderness and mild hepatomegaly are present.Laboratory investigations; liver function tests were all normal.

Case Study on the Results • 213
Liver scintigraphy; 99mTc-phytate 185 MBq(5 mCi), 500 kc, Siemens ZLC 7500, NO. of PMT;75, thickness of Nal (Tl); 10 mm, collimator; high resolution and window; 20%.Views; anterior, posterior and right lateral (Anti clockwise from top left).Scan findings; mild hepatomegaly and SOL in the right lobe with mild splenomegalyScintigraphic comments; (1) Abscess, (2) HCC or (3) Cyst.

214 • Ultrasound and Radionuclide Images of Liver
Sonograms; ATL, Mark 600, 3.5 MHz sector scan transducer.Sonographic findings; a medium sized, round mass with internal echoes located in the right
lobe of the liver. The posterior echo enhancement is not apparent.
. * • *

Case Study on the Results • 215
Final diagnosis verified by; cytology.Individual scores for case No. IN-6;
AbnormalitySOL(mass)HCCMetastasisLiver cystAbscess
+
3029
7401
US alone
+/- -/
327405
+
000000
-
02
19253327
NM
+ -
3834
3358
alone
473328
'+
110010
-
01
37373527
US
+
323211205
and
+/-
445418
NM
-/+
000000
-
00
20303523
Comments; all the interpreters agreed on presence of SOL. While US reading favors thediagnosis of HCC, NM diagnosis was abscess. The final reading by US & NM images, has shownconvergence to HCC or abscess, of which final answer was amoebic abscess.

216 • Ultrasound and Radionuclide Images of Liver
5.6. BENIGN TUMORS OF LIVER OTHER THAN HEMANGIOMA AND ABSCESS.
Soiid-cyst differentiation is most useful in the diagnosis of cystic masses of polycystic diseasein which single or multiple cysts surrounded by thin, round walls are accompanied by definiteposterior echo enhancement. Cysts usually contain liquid with echoes. However, US guidedaspiration sometimes causes bizarre strands by hemorrhages. Liver trauma sometimes causesformation of cystic mass with some echoes within the cystic mass.
Mydatid cysts
Hydatid disease (Echinococcus granuiosus) can produce a cystic lesion that is quiteindistinguishable from simple cyst. However, when daughter cysts bud from the wall, irregularitybecomes apparent. These irregularities should be looked for, if the patient comes from sheepraising farms. The cyst can grow into considerable size exhibiting characteristic 'Cartwheelappearance'.
A more aggressive disease is caused by infestation of E. Multilocularis transmitted from foxesor dogs. It is endemic in Eastern Europe, Russia, Japan and Australia. Parasitic buds are smalland multiple showing patchy appearance throughout the liver. Cyst formation can occur but notvery frequently.

Case Study on the Results • 217
5.6-1. Case No. JN-81Diagnosis: Liver cyst with liver cirrhosis (non-A and non-B type).
Clinical history and reason for referral; 41 F. GOT slightly abnormal and choline esteraseactivity has shown abnormal values. Subjective complaints and objective symptoms wereboth absent.
Laboratory investigations; AFP; 11, CEA; 2.7, ZTT; 24.4, TTT; 24.5, total-bilirubin; 1.8, direct-bilirubin, 0.8, CRP;-, HBsAg;-, HBsAb;- and HCV;+.
Liver scintigraphy; 99mTc-Sn colloid 148 MBq(4 mCi), 700 kcViews; anterior, posterior, left lateral and right lateral (Anti clockwise from top left).Scan findings; no RN uptake of the liver and remarkable splenomegaly. Scintigraphic
comments; (1) Liver cirrhosis or (2) Portal hypertension.

218 • Ultrasound and Radionuclide Images of Liver
Sonograms; Aloka, SSD 650, 3.5 MHz convex scan transducer.Sonographic findings; a medium sized round and echoic cyst was detected. Internal echo
texture of the liver parenchyma appeared almost normal, only the enlarged spleensuggested the advanced degree of the liver dysfunction.

Case Study on the Results • 219
Final diagnosis verified by; angiography and biopsy under laparoscopy.Individual scores for case No.JN-81;
AbnormalitySOL:HCCMetastasisLiver cystCirrhosis
+
5746
00
573
US
+/-
380022
alone
-/+
020001
-
26
6262
356
+
307730
19
NM
+/-
733306
alone
-/+
120012
-
02632293711
+
4739
10
3614
US and
+/- -/
750095
NM
'+
100031
-
1115455
735
Comments; the majority agreed on the existence of SOL, however, by US scanning,interpretation as liver cyst was predominant. In NM scanning, no liver image was obtainedbecause of poor uptake by the liver. Splenomegaly was also evident. This has clearlyindicated extensive liver dysfunction. The latter finding could not be yielded by ultrasoundalone.
5.6-2. Case No. JN-50.Diagnosis; polycystic disease of the liver.
Clinical history and reason for referral; 58 F. Liver enlargement.Laboratory investigations; low choline esterase activity and slight elevation of gammaglobulin
level.

220 • Ultrasound and Radionuclide Images of Liver
Liver scintigraphy; 99mTc-Sn colloid; 148 MBq(4 mCi), 700 kcViews; anterior, posterior, left lateral and right lateral views (Anti clockwise from top left).Scan findings; moderate hepatomegaly, multiple SOLs in the liver.Scintigraphic comments; metastatic liver tumors.
* P.

Case Study on the Results • 221
Sonograms; Aloka SSD 650, 3.5 MHz convex scan transducer.Sonographic findings; multiple anechoic cystic changes throughout the liver parenchyma.
Polycystic changes of the bilateral kidneys are also evident.

222 • Ultrasound and Radlonucllde Images of Liver
Final diagnosis verified by; biopsy under laparoscopy.Individual scores for case No.JN-50;
AbnormalitySOLHCCMetastasisLiver cystBenign tumor
+
5541
02
43other than
8
US
+/-
412004
alone
-/+
12001
hemangioma,0 0
-
05
605812cyst
52
+
4234
131
3
NM
+/-
25240
and abscess0 0
alone
-/+
13031
0
-
03
427
41
45
+
5349
02
34
9
US and
+/- -/
13024
2
NM
>+
11010
0
-
02
555017
44
Comments; all the readers agreed on SOL in the liver. The interpretation, however, clearlydifferent in either modality, US and NM. NM images were interpreted as metastases, whileUS alone or US alongwith NM correctly diagnosed multiple cystic lesions of liver.
5.6-3. Case No. JN-27Diagnosis: Liver echinococcosis
Clinical history and reason for referral; 72 M. Tenderness in RUQ with medium degree ofjaundice were the principal reasons, but the diagnosis was not established before 1982.
On liver mass survey in October, 1984, the enlarged, hard liver was detected and furtherinvestigation was advised.
Laboratory investigations; serum biochemistry and tumor marker tests were normal, HBsAg;-and HBsAB; +

Case Study on the Results • 223
Liver scintigraphy; 99mTc-Sn colloid 222 MBq (6 mCi), 1200 kc.Views; anterior, posterior, left lateral and right lateral (Anti clockwise from top left)Scan findings; hepatomegaly, SOL in the right lobe.Scintigraphic comments; (1) Cyst, (2) Abscess or (3) HCC.

Sonograms; Aloka SSD-256, 3.5 MHz linear scan transducer. KSonographic findings; a markedly enlarged liver with a medium-sized cystic lesion of the right lobe of the liver together £
with extensive echogenic change of the entire liver causing acoustic shadowing. §3
N*.
3(0o
a
Q.
!
o

Case Study on the Results • 225
Final diagnosis verified by; XCT, angiography and biopsy under laparoscopy. Individual scoresfor case No.JN-27;
AbnormalitySOL (mass)HCCMetastasisLiver cystAbscess
+
3328
0248
US
+/-
9100149
alone
-/+
110014
-
48
47443826
+
6856
512108
NM
+/-
1843
145
alone
-/+
020101
-
03
60334555
+
4541306
10
US and
+/- -/
711137
16
NM
'+
120212
-
32
52514228
Comments; presence of SOL in the liver almost unanimous among all the interpreters. Themajority diagnosis was liver cyst or abscess by both US and NM. Only a few suspectedmalignant lesion of the liver. The multiple small cystic changes throughout the liveralongwith diffuse acoustic shadowing are the most characteristic features of multilocularechinococcal infestation.
5.6.4 Case No. JN-13Diagnosis: Liver echinococcosis.
Clinical history and reason for referral; 63 M. Medium degrees of pain since April, 1988,together with abnormal sonograms suggestive of echinococcosis. Laboratory investigations;GOT and GPT were normal, however, choline esterase was mildly abnormal.

226 • Ultrasound and Radionuclide Images of Liver
Liver Scintigraphy; 99mTc-Sn colloid 148 MBq (4 mCi), 700 kc.Views; anterior, posterior, and right lateral (Anti clockwise from top left).Scan findings; inhomogenous RN uptake of the liver, small SOL in the right lobeScintigraphic comments; (1) Cyst, (2) Metastatic liver tumor, or (3) Chronic hepatitis.

Case Study on the Results • 227
Sonograms; Aloka SSD 650, 3.5 MHz convex scan transducerSonographic findings; medium sized echo clusters casting acoustic enhancement and
shadowings. Furthermore, accumulation of ascitic fluid is also evident. Other part of theliver is seemingly normal, both in shape and internal echo texture.

228 • Ultrasound and Radionuclide Images of Liver
Final diagnosis verified by; angiography and biopsy under laparoscopy.Individual scores for case No. JN-13;
AbnormalitySOL (mass)HCCMetastasisHemangiomaAbscess
+
3431
21148
Benign tumor other than
Fatty liverChronic hepatitis
100
US
+/-
8815
144
alone
-/+
030100
hemangioma,500
Dili use liver disease other than1 0
000
-
11
40262531
+
1150400
NM
+/-
34182606
, cyst and abscess374343
cirrhosis, fatty0 42
000
liver0
397
alone
-/+
1571
1100
122
and hepatitis6 0
-
93966486963
655860
63
+
42394
1046
200
2
US and
+/- -1
91132
108
312
0
NM
'+
630040
001
0
-
15
51464044
535755
56
Comments; the majority of interpreters agreed on the presence of SOL in the right lobe ofthe liver. Interpretation with respect to etiology are diverse. In US reading, metastasis,hemangioma, and abscess were almost in same proportion, whereas in NM readings,many consultants interpreted it as hemangioma. The combined reading resulted in thediverse interpretations from malignant changes to benign lesions.
5.6.5. Case No. JN-31Diagnosis: Haematoma after liver biopsy.
Clinical history and reason for referral; 65F. After chemotherapy for liver abscess in July, 1981,pain on right hypochondrium and fever aggravated in Sept., 1981.
Laboratory investigations; GOT values were moderately abnormal and GPT were significantlyabnormal,. ZTT; 2.0, TTT; 0.7 and HBs-Ab;+.

Case Study on the Results • 229
Liver scintigraphy; 99mTc-Sn colloid 148 MBq (4 mCi), 700 kc.Views; anterior posterior and right lateral (Anti clockwise from top left).Scan findings; moderate hepatomegaly.Scintigraphic comments, chronic hepatitis.

230 • Ultrasound and Radionuclide Images of Liver
Sonograms; Aloka SSD 250, 3.5 MHz linear scan transducer.Sonographic findings; a medium sized hypoechoic mass with some internal echoes onthe lower edge of the right lobe of the liver.

Case Study on the Results • 231
Final diagnosis verified by; angiography and biopsy under laparoscopy.Individual scores for case No. JN-31;
AbnormalitySOL (mass)HCCMetastasis
+
3832122
US
+/-
710
60
alone
-/+
1110
Malignant tumor other than HCC and
AbscessBenign tumor other
Liver CirrhosisFatty liverAcute hepatitisChronic hepatitis
013than
10000
110
00
hemangioma00012
01010
-
03
2744
+
22100
metastasis of4523
, cyst4545464444
00
NM
+/-
19220
liver00
and abscess02091
164
147
alone
-/+
6110
00
12112
-
22656669
6969
6759644559
+
241880
06
11020
US and
+/- -i
171031
23
21185
NM
'+
3400
62
10011
-
10224353
4643
5052534348
Comments; interpretation disclosed general agreement on the presence of SOL in the liver.In US image reading, HCC, abscess got the highest rating. In NM, however, liver cirrhosisor acute hepatitis was suspected.
5.6.6. Case No. IN-2Diagnosis: Tuberculoma in the liver with abdominal and colonic involvement.
Clinical history and reason for referral; 12 M. Fever and extensive weight loss, anorexia, massin the hypochondrium.
Physicals; hepatomegaly with tenderness.Laboratory investigations; GOT and GPT moderately elevated and amoebic serology; -ve.

232 • Ultrasound and Radionuclide Images of Liver
Liver scintigraphy; 99nTc-Phytate 148 MBq (4 mCi), 500 kc, Siemens ZLC 7500, No. of PMT;75, thickness of Nal (Tl); 10mm, collimator; high resolution and window; 15%.Views; anterior, posterior and right lateral (Anti clockwise from top left).Scan findings; moderate hepatomegaly, inhomogenous RN uptake of the liver, SOL in the
right lobe.Scintigraphic comments; (1) HCC or (2) Abscess.
pi

Case Study on the Results • 233
Sonograms; ATL, Mark 600, 3.5 MHz sector scan transducer.Sonographic findings; multiple echogenic and echopoor masses in liver casting acousticshadows.

234 • Ultrasound and Radionuclide Images of Liver
Final diagnosis verified by; histology and surgery.Individual scores for case No. IN-2;
AbnormalitySOL (mass)HCCMetastasisAbscessBenign tumor other
Liver CirrhosisAcute hepatitisChronic hepatitis
+
1510040
than1300
us
+/-
115042
alone
-/+
51010
hemangioma,2304
1001
-
015312229cyst
27253126
+
2215204
NM
+/-
1816542
and abscess.1020
6153
alone
-/+
14011
3000
-
15
353735
32413539
+
2319050
0010
US and
+/- -/
1072
103
4426
NM
'+
22000
2000
-
07
332032
29313229
Comments; SOLs were reported by the majority of interpreters, though not unanimous. Theinterpretation of possible etiology was also diverse with metastasis or liver cirrhosis in USand no consistent diagnosis in NM. Combined readings suspected metastatic tumors.Inconsistency of reading itself reflected complex nature of the lesion. Some calcificationsseen in the US scans are characteristic of tubercular granulomatous lesions.
5.6.7. Case No. PH-1.Diagnosis: Hepatobiliary tuberculoma.
Clinical history and reason for referral; 33 M. Recurrent fever, anorexia and weight loss ofmoderate degree. Hepatomegaly.
Laboratory investigations; liver function tests and tumor markers were not collected.

Case Study on the Results • 235
Liver scintigraphy; 99mTc-phytate 555 MBq (15 mCi), 500 kc, Ohio Nuclear Sigma 400, No.of PMT; 37, collimator; high resolution and window; 15%.Views; anterior, right lateral and posterior ( clockwise from top left).Scan findings; moderate hepatomegaly, inhonnogenous RN uptake in the liver and irregular
intrahepatic SOL.Scintigraphic comments; (1) Abscess or (2) HCC.

236 • Ultrasound and Radionuclide Images of Liver
Sonograms; Toshiba SSA 100A, 3.5 MHz linear scan transducer, Polaroid images.Sonographic findings; only apparent changes are dilated biliary tree of the portal area as the
parallel channel sign indicating mild degrees of biliary congestion.
Final diagnosis verified by; surgery.Individual score for case No. PH-1;
AbnormalitySOL (mass)HCCLiver cystAbscessBenign tumor other
Fatty liverAcute hepatitisDiffuse liver disease
+
80000
than021
US
+/-
138202
alone
-/+
24000
hemangioma323
i other than3 3
110
-
617272927
. cyst252425
+
199211
NM
+/-
159341
and abscess331
cirrhosis, fatty liver2 21 0
146
alone
-/+
98000
521
and hepatitis1 1
-
017383841
343435
41
+
105020
012
1
US and
+/- -i
1510405
043
1
NM
'+
87000
520
0
-
213313330
302830
33
Comments; there is no apparent mass lesion in the liver. The majority of interpreters havenegated the presence of SOL in US images. In NM readings, half of the readers suspectedSOL, however, no definite etiology was suggested. This tendency was also observed incombined reading. Since the change occurring in the lower biliary tree are slow andinsidious in nature, no apparent SOL does appear in the liver.

Case Study on the Results • 237
5.6.8. Case No. PH-3.Diagnosis: Liver tuberculoma.
Clinical history and reason for referral; 25 M. Active lung tuberculosis. During treatment follow-ups, developed anorexia, oppresive feeling and body weight loss.
Physicals; enlarged liver with tenderness and moderate degree of jaundice.Laboratory investigations; liver function tests and tumor markers were not collected.
Liver scintigraphy, 99mTc-phytate 555 MBq (15 mCi) 500 kc, Ohio Nuclear Sigma 400, No. ofPMT; 37, collimator; high resolution, window; 15%.Views; anterior, posterior and right lateral (Polaroid films) (Anti clockwise from top left).Scan findings; remarkable hepatomegaly, SOL with irregular margin in the right lobeScintigraphic comments; (1) HCC with liver cirrhosis or (2) Abscess and liver cirrhosis.

238 • Ultrasound and Radionuclide Images of Liver
Sonograms; Toshiba, SAL 50A, 3.5 MHz linear scan transducer, Polaroid films.Sonographic findings; scatterd echogenic mass with or without acoustic shadows. A fewdilated intrahepatic ducts are noted.

Case Study on the Results • 239
Final diagnosis verified by; cytology.Individual scores for case No. PH-3;
AbnormalitySOL (mass)HCCMetastasisBenign tumor other
Liver CirrhosisFatty liverChronic hepatitisDiffuse liver disease
+
181626
than2000
US
+/-
6924
alone
-/+
1011
hemangioma,3212
other than4 0
01a4
-
22
2216cyst
22242624
+
271251
NM
+/-
141280
and abscess2601
cirrhosis, fatty liver0 23 4
3833
alone
-/+
2300
3021
-
0163042
35293838
and hepatitis.4 1 33
+
2820
92
1701
3
US
+/-
7382
3443
2
and NM
-/+
0700
4001
0
-
0201831
27243130
30
Comments; existence of SOL is reported by most readers. The etiologies suggested weremultiple, from HCC to metastatic masses and hemangioma or even abscess. Livertuberculosis in clinical practice is likewise very difficult to diagnose and only immunologictest may reveal the correct diagnosis. At the present moment, precise diagnosis couldonly be established by US-guided biopsy.
5.6.9. Case No. PK-11Diagnosis: Hydatid cyst in liver
Clinical history and reason for referral; 30 F. Pain in upper abdominal region together withpalpable masses in the liver. Moderate degree of anorexia.
Laboratory investigations; Liver function tests were normal and tumor marker were normal.

240 • Ultrasound and Ftadionuclide Images of Liver
Liver scintigraphy, 99mTc-Sn colloid 74 MBq (2 mCi), 500 kc, Scintronix 480, No. of PMT; 61,thickness of Nal (Tl); 9.5 mm, collimator; general purpose and window; 40%Views; anterior, posterior and right lateral (Anti clockwise from top left).Scan findings; remarkable hepatomegaly, large SOL in the right and left lobes and mild
splenomegaly.Scintigraphic comments; (1) HCC or (2) Abscess.
*• w « '
* fr

Case Study on the Results • 241
Sonograms; Hitachi EUB 22, 3.0 MHz linear scan transducer.Sonographic findings; a large round cystic mass on the edge of the liver was identified on
sonograms. No apparent change on the cyst wall suggestive of daughter cyst formation.Contents of the cyst were entirely echo-free.

242 • Ultrasound and Radionuclide Images of Liver
Final diagnosis verified by; surgery.Individual scores for case No. PK-11;
AbnormalitySOL (mass)HCCLiver cystAbscess
+
4342
036
3
US
+/-
66061
alone
-/+
00000
-
12
508
46
+
32311234
NM
+/-
43372
alone
-/+
21100
-
03
222832
+
3434
1164
US and
+/- -/
22155
NM
'+
00000
-
00
341527
Comments; By US interpretation as SOL and cyst are unanimous. Although most NuclearMedicine specialists correctly detected the mass lesion, about half of them interpreted itas HCC. The cause of error is not image reading alone but poor quality of NM images.The combined reading resulted in better interpretation.
5.6.10. Case No. BD-3Diagnosis: Liver cyst.
Clinical history and reason for referral; 60 F. Anorexia was moderate. Liver palpable mildly.Physicals; hepatomegaly moderate.Laboratory investigations; Liver function tests and tumor markers were not collected.

Case Study on the Results m 243
Liver scintigraphy; 99mTc-sulphur colloid 111 MBq (3 mCi), 350 kc, Nuclear Enterprises NE8970, No. of PMT; 37, thickness of Nal (Tl); 10 mm, collimator; general purpose andwindow; 20%.Views; anterior, posterior and right lateral (Anti clockwise from top left).Scan findings; mild hepatomegaly, inhomogenous RN uptake of the liver, SOL in the right
lobe, mild splenomegaly.Scintigraphic comments; (1) HCC or (2) Metastatic liver tumor.

244 • Ultrasound and Radionuclide Images of Liver
Sonograms; Shimadzu, SDL 300, 3.5 MHz sector scan transducer.Sonogrphic findings; a large cystic mass in the posterior segment of the right lobe of the liver.
The wall echo is smooth and no abnormal echo was identified.
-%

Case Study on the Results • 245
Final diagnosis verified by; cytology.Individual scores for case No. BD-3;
Abnormality
SOL (mass)HCCMetastasisLiver cystAbscess
+
30
3000
233
US
+/-
2
2001.2
alone
-/+
0
00000
-
0
03232
827
+
30
272812
NM
+/-
7
106641
alone
-/+
1
30200
-
7
335273840
+
28
2805
180
US and
+/- -/
7
71522
NM
f+
0
00010
-
0
034251433
Comments; interpretation is unanimous on liver cyst. Very few suspected of liver abscess.
5.6.11. Case No. IN-18Diagnosis: Hydatid liver cyst
Clinical history and reason for referral; 5 years old M. Lump hypochondrium. moderatehepatomegaly. Mild weight loss.
Laboratory investigations; liver function tests were normal.

246 • Ultrasound and Radionucllde Images of Liver
Liver scintigraphy; "Tc-phytate 185 MBq (5 mCi) 500 kc, Siemens ZLC 7500, No. of PMT;75, thickness of Nal (Tl); 10 mm, collimator; high resolution and window; 15%.Views; anterior, posterior and right lateral (Anti clockwise from top left).Scan findings; moderate hepatomegaly, clear margin SOL in right lobeScintigraphic comments; (1) HCC, (2) Abscess or (3) Cyst.
ft,' »T»i(frj<"

Case Study on the Results • 247
Sonograms; ATL, Mark 600, 3.5 MHz sector scan transducer.Sonographic findings; large cystic mass in the right lobe of the liver is evident.Presence of septal echoes in the anechoic content clearly indicated the diagnosis of hydatid
cyst.

248 • Ultrasound and Radlonucllde Images of Liver
Final diagnosis verified by; XCT and surgeryIndividual scores for case No. IN-18;
AbnormalitySOL (mass)HCCLiver cystAbscess
+
2929
059
US
+/-
3313
11
alone
-/+
00000
-
00
312412
+
4137659
NM
+/-
24365
alone
-/+
01010
-
01
313129
+
3131
26
11
US and
+/- -i
55426
NM
'+
00010
-
00
302719
Comments; interpretation as SOL is unanimous. Interpretations on the etiology were eithercyst or abscess in US and Cyst, abscess or HCC in NM. There was no significant differencein combined interpretation
5.6.12. Case No. SI-15.Diagnosis: Traumatic liver cyst (hematoma) in the right lobe.
Clinical history and reason for referral; 42 F. Follow-up case of laceration of liver, light painin the upper abdomen. Objective symptoms were nothing remarkable.
Laboratory investigations; liver function tests and tumor markers were not collected.

Case Study on the Resu/ts • 249
Liver scintigraphy; 99nrTc-Sn colloid 185 MBq (5 mCi), 500 kc, Elscint Apex 409AS, No. of PMT;37, thickness of Nal (Tl); 1/4 inch, collimator; high resolution and window; 10%.Views; anterior, posterior and right lateral (Anti clockwise from top left).Scan findings; moderate hepatomegaly, inhomogenous RN uptake of the liver, two SOLs
in the right lobe.Scintigraphic comments; (1) Metastatic liver tumors or (2) HCC.

250 • Ultrasound and Radionuclide Images of Liver
Sonograms; Aloka SSD 280, 3.5 MHzSonographic findings; a round cystic mass with minimum internal echoes is found. There is
no other abnormal echo texture in the liver parenchyma.

Case Study on the Results m 251
Final diagnosis verified by; XCT and US images.Individual scores for case No. IN-15;
US alone NM alone US and NM
Abnormality 47 4 0 0 24 1 2 0 2 31 5 0 0SOL (mass) 46 4 0 1 22 11 1 4 30 4 0 2HCC 2 5 0 44 1 8Metastasis 13 5 1 32 9 9Abscess 3 10 0 38 1 2Benign tumor other than hemangioma, cyst and abscess
6 1 0 44 0 1Liver Cirrhosis 0 1 2 48 1 4Chronic hepatitis 0 0 3 48 1 5
Comments; existence of SOL is unanimous. Intepretation of the causative pathology is diversefrom metastasis, HCC to abscess and benign mass lesion. In NM images, malignantmasses were suspected and this tendency persisted in combined reading. The internalechoes in the cystic change probably detoured the correct diagnosis.
111
101
281934
363331
381
101
395
123
011
001
301834
343431

252 • Ultrasound and Radionuclide Images of Liver
5.7. LIVER CIRRHOSIS
Cirrhosis usually exhibits higher echoes due to the presence of fibrous tissue in combinationwith any accompanying fatty changes. There is often distinct enlargement of the caudate lobe,which is easily assessed by the sagittal scanning. In advanced stage, the size of the liver shrinkswith associated splenomegaly and ascites. The secondary portal hypertension may ensue but thedifferentiation between primary and secondary portal hypertension is by no means easy byultrasound. Careful search for the portal vein width and presence or absence of thrombi in portalcirculation has to be sought carefully.

Case Study on the Results • 253
5.7.1. Case No. JN-34.Diagnosis: Liver cirrhosis (Stage IV) with chronic rheumatism and diabetes meilitus.
Clinical history and reason for referral; 65F. Asciter, Jaundice and abnormal LFT.Laboratory investigations; GOT and GPT were moderately elevated, and choline esterase and
gamma-globulin were abnormal. ZTT; 47.6 and TTT; 55.1.
Liver scintigraphy; 99mTc-Sn colloid 148 MBq (4 mCi), 700 kc.Views; anterior, posterior, left lateral and right lateral (Anti clockwise from top left).Scan findings; inhomogenous RN uptake of the liver, suspected SOLs in the right and left
lobes, moderate splenomegaly.Scintigraphic comments; (1) Metastatic liver tumors with liver cirrhosis or (2) HCC with liver
cirrhosis.

254 • Ultrasound and Radionuclide Images of Liver
Sonograms; Aloka, SSD 650, 3.5 MHz linear and convex transducers.Sonographic findings; ascites, marked splenomegaly and a large uterine myoma are evident.
Liver parenchyma is essentially normal except a slight degree of dilatation of intrahepaticbile duct in the hilar area.

Case Study on the Results • 255
Final diagnosis verified by; biopsy under laparoscopy, UCG and ERCP.Individual scores for case No. JN-34
AbnormalitySOL (mass)HCCMetastasisLiver Cirrhosis
+
36721
25
US
+/-
62236
alone
-/+
21001
-
238444416
+
6248122312
NM
+/-
67
11108
alone
-/+
02120
-
011443348
+
5322
67
30
US
+/-
54857
and NM
-/+
14531
-
029404421
Comments; interpretation of SOL is rather minority in US. In NM image, because of insufficientuptake by the hepatic parenchyma, interpretation as SOL has resulted. This readingpersisted in combined reading, however, interpretation is more inclined to liver cirrhosis,because of ascites and insufficient liver uptake.
5.7.2. Case No. JN-80Diagnosis: Idiopathic portal hypertension (IPH) with esophageal varices and cerebral infarction.
Clinical history and reason for referral; 65 F, with severe Hepatomegaly.Laboratory investigations; choline esterase and gamma-globulin were mildly abnormal and
HBsAb;+.

256 • Ultrasound and Radionuclide Images of Liver
Liver scintigraphy; 99mTc-Sn colloid, 148 MBq (4 mCi) 700 kc.Views; anterior, posterior, left lateral and right lateral (Anti clockwise from top left).Scan findings; inhomogenous RN uptake of the liver, remarkable splenomegaly.Scintigraphic comments; (1) Portal hypertension or (2) Liver cirrhosis.

Case Study on the Results • 257
Sonograms; Aloka SSD 256, 3.5 MHz linear scan transducer.Sonographic findings; extreme splenomegaly with dilated portal vein.
» -

258 • Ultrasound and Radionuclide Images of Liver
Final diagnosis verified by; US and biopsy under laparoscopy.Individual scores for case No. JN-80;
AbnormalitySOL (mass)Liver cirrhosisChronic hepatitisDiffuse liver disease
+
24370other7
US
+/-
240
242
than2
alone
-/+
12022
-
4613160
cirrhosis, fatty0 55
+
313
181
liver2
NM
+/-
121
124
alone
-/+
1111
and hepatitis3 0
-
0391338
39
+
323
170
6
US
+/-
121
100
6
and NM
-/+
14120
0
-
0532958
46
Comments; existence of SOL has been negated by most of the interpreters and diffuse lesionof the liver, liver cirrhosis and related conditions were suspected both in US and NMimages. Diagnosis of IPH depends upon recognition of extreme splenomegaly not foundin ordinary liver cirrhosis. Dilated portal venous system is indeed the clue to correctdiagnosis.
5.7.3. Case No. JN-67.Diagnosis: Liver cirrhosis (non-A and non-B type) with liver dysfunction, cerebral infarction,myocardial infarction, DM and hypertension.
Clinical history and reason for referral; 57 M. In rehabilitaiton of Cl and Ml.Laboratory investigations; choline esterase was moderately elevated and GOT and GPT were
mildly abnormal and HCV;+.

Case Study on the Results m 259
Liver scintigraphy; 99mTc-Sn colloid 148 MBq (4 mCi), 700 kc.Views; anterior, posterior, left lateral and right lateral (Anti clockwise from top left).Scan findings; moderate hepatomegaly, inhomogenous RN uptake of the liver and
moderate splenomegaly.Scintigraphic comments; liver cirrhosis.

260 • Ultrasound and Radionuclide Images of Liver
Sonograms; Aloka SSD 650, 3.5 MHz converx scan transducer.Sonographic findings; a mild degree of liver enlargement together with coarse echo support
is suggestive of liver cirrhosis. Medium degree of splenomegaly also suppport thediagnosis. No. ascitic fluid accumulation indicated the disease is still in compensatorystage.

Case Study on the Results • 261
Final diagnosis verified by; biopsy under laparoscopy.Individual scores for case No. JN-67;
AbnormalitySOL (mass)HCCMetastasisLiver CirrhosisFatty liverChronic hepatitisDiffuse liver disease
+
48194
111124other1
US
+/-
13524
1076
than2
alone
-/+
3425011
-
0365644435453
cirrhosis, fatty0 61
+
21613612
liver0
NM
+/-
2062565
10
alone
-/+
4329022
and hepatitis1 0
-
2324230353933
46
+
401127
1113
7
US
+/-
1471845
10
0
and NM
-/+
14
1212010
0
-
2354230425144
50
Comments; less than half of interpreters suggested the presence of SOL, most of theregenerative nodules were interpreted as SOL. Some interpreted them as HCC. However,significant number of interpreters correctly diagnosed cirrhosis of live in individual US &NM as well as in combined readings.
5.7.4. Case No. JN-7.Diagnosis: Liver cirrhosis (non-A and non-B type) with oesophageal varices, DM and gallbladderstone.
Clinical history and reason for referral; 41 M. High risk group for HCC. Mild Hepatomegaly.Laboratory investigations; choline esterase; mildly abnormal, AFP; 122 ng/ml, HGsAB;+ and
HCV;+.

262 • Ultrasound and Radionuclide Images of Liver
Liver scintigraphy; 99mTc-Sn colloid 148 MBq (4 mCi), 700 kc.Views; anterior, posterior, left lateral and right lateral (Anti clockwise from top left).Scan findings; poor RN uptake by the liver, irregular SOL in the left lobe and remarkable
splenomegaly.Scintigraphic comments; (1) HCC with liver cirrhosis or (2) metastatic liver tumors with
liver cirrhosis.

Case Study on the Results • 263
Sonograms; Aloka SSD 650, 3.5 MHz convex scan transducer.Sonographic findings; .enlarge spleen and coarse texture of the liver are compatible with liver
cirrhosis. No apparent mass lesions were found in the liver.

264 • Ultrasound and Radionuclide Images of Liver
Final diagnosis verification by; biopsy under laparoscopy.Individual score for case No. JN-7;
AbnormalitySOL (mass)HCCMetastasisLiver CirrhosisDiffuse liver disease
+
19412
10other5
US
+/-
177374
than4
alone
-/+
44332
-
732403531
cirrhosis, fatty0 38
+
6646202113liver
0
NM
+/-
4131487
alone
-/+
02332
and hepatitis1 0
-
110343949
70
+
4526101017
6
US and
+/- -I
9131137
0
NM
f+
22732
0
-
217304232
52
Comments; in US image interpretation, very few suspected SOL, whereas, in NM images,as many as two thirds suspected SOL and hence HCC or metastasis. This tendency alsopersisted in the combined image interpretation. However, in either case precise diagnosisas liver cirrhosis was obtained in almost equal frequency indicating that correct diagnosisis possible with balanced interpretation criteria.
5.7.5. Case No. ID-5.Diagnosis: Liver cirrhosis.
Clinical history and reason for referral; 64 M. Hypertension anorexia and mild weight loss,severe hepatomegaly, enlarged spleen.
Laboratory investigations; gamma-globulin abnormal.

Case Study on the Results • 265
Liver scintigraphy; 99mTc-sulfur colloid 185 MBq (5 mCi), 400 kc, Toshiba 6CA-602A, No. ofPMT; 61, thickness of Nal (Tl); 10 mm, collimator; high resolution, and window; 20%.View; anterior, posterior and right lateral (Anti clockwise from top left).Scan findings; remarkable hepatomegaly, poor RN uptake of the liver, suspected SOL
in the'liver, remarkable splenomegaly with significantly increased radio tracer uptake.Scintigraphic comments; (1) HCC with liver cirrhosis,
(2) Liver cirrhosis, or(3) Metastatic liver tumors and liver cirrhosis.

266 • Ultrasound and Radionuclide Images of Liver
Sonograms; Aloka SSD 190, 3.5 MHz convex scan transducer, Polaroid images.Sonographic findings; because of limited sonographic images correct diagnosis is apparently
difficult. However the available US images reveal ascites, thickened gallbladder walltogether with gallstones and normal hepatic texture. A marked degree of splenomegalyis also noted.

Case Study on the Results • 267
Final diagnosis verified by; US and NM imaging and clinical course.Individual scores for case No. ID-5;
AbnormalitySOL (mass)HCCMetastasisBenign tumor other
Liver Cirrhosis
+
15100
than0
13
US
+/-
20611
alone
-/+
7402
hemangioma,2
1120
-
7384846cyst
4525
+
341024
NM
+/-
4432
and abscess3
2008
alone
-/+
0703
60
-
0173329
2910
+
31514
019
US
+/-
4311
06
and NM
-/+
028
16
10
-
1262615
3511
Comments; In US and NM interpretation most of the readers suggested liver cirrhosis andno SOL. Combined readings further substantiated the above impression.
5.7.6. Case No. TH-10.Diagnosis: Liver cirrhosis.
Clinical history and reason for referral; 72 M. Severe anorexia, mild oppressive feeling andweight loss, and progressive weakness.
Physicals; moderate jaundice with ascitesLaboratory investigations; GOT moderately abnormal and GPT mildly abnormal.

268 • Ultrasound and Radionuclide Images of Liver
Liver scintigraphy; 99mTc-Phytate 111 MBq (3 mCi), 500 kc, Siemens ZLC 7500, No. of PMT;75 thickness of Nal (Tl); 10 mm, collimator; general purpose and window; 15%.Views; anterior, posterior and right lateral (Anti clockwise from top left).Scan findings; relative enlargement of the left lobe, remarkable splenomegaly, remarkable
RN uptake in the bone marrow.Scintigraphic comments; liver cirrhosis.

Case Study on the Results • 269
Sonograms; ATL, Mark 4, 3.5 MHz sector scan transducer.Sonographic findings; shrunken liver lobes with ascites clearly indicated the diagnosis ofdecompensated liver cirrhosis. In the liver no discrete mass lesions were found exceptcoarse texture of the liver parenchynna.
I *

270 • Ultrasound and Radionuclide Images of Liver
Final diagnosis verified by; US images alone.Individual scores for case No. TH-10;
AbnormalitySOL (mass)HCCLiver cirrhosisChronic hepatitis
+
2921
200
US
+/-
1753
165
alone
-/+
21511
-
141401343
+
3530
331
NM
+/-
22522
alone
-/+
13011
-
030332
34
+
3550
312
US
+/-
12023
and NM
-/+
03001
-
02636
330
Comments; both US and NM image readings agreed well on the diagnosis of liver cirrhosis.The radionuclide scan features of low hepatic uptake, splenomegaly and significant bonemarrow uptake (colloid shift) were diagnostic of cirrhosis of liver.
5.7.7. Case No. RK-11.Diagnosis: Liver cirrhosis
Clinical history and reasons for referral; 42 F. No significant past history, slight anorexia andoppressive feeling.
Physicals; ascites.Laboratory investigations; GOT and GPT moderately abnormal. AFP; 12 ng/ml.

Case Study on the Results • 271
Liver scintigraphy; 99mTc-phytate 370 MBq (10 tnCi).Views; posterior, anterior and right lateral (Anti clockwise from top left).Scan findings; poor liver RN uptake, remarkable splenomegaly, mild bone marrow uptake.Scintigraphic comments; liver cirrhosis.
* •>„<

272 • Ultrasound and Radionuclide Images of Liver
Sonograms; Diasonics, 3.5 MHz sector scan transducer.Sonographic findings; there is no apparent mass lesion in the liver. Internal echo texturewas coarse indicating cirrhotic changes in the liver parenchyma. No ascitic fluid could bedetected.

Case Study on the Results • 273
Final diagnosis verified by; cytology.Individual scores for case No. RK-11;
AbnormalitySOL (mass)HCCMetastasisLiver cystAbscessLiver cirrhosisChronic hepatitis
+
15820
• 0322
US
+/-
158250253
alone
-/+
53000031
-
114292833282327
+
33156120
180
NM
+/-
888520
110
alone
-/+
13361011
-
117263138431342
+
302110211
111
US
+/-
53332142
and NM
-/+
02020002
-
09
222832332030
Comments; because of coarse texture in the liver sonogram, approximately half of theinterpreters have read as SOL positive. In NM images, liver uptake is extremely low andsplenic enlargement is clearly evident. Based on these findings, the interpretation as livercirrhosis was in the same order of HCC suspect, however, coarse texture in US andinsufficient uptake by the liver bed probably effected synergistically the final diagnosiswhich was erroneous.

274 • Ultrasound and Radionuclide Images of Liver
5.8. DIFFUSE LIVER DISEASES OTHER THAN CiRRHOSiS.
Chronic hepatitis
Chronic hepatitis is also characterized by increased parenchymal echoes on US due to fibrosis.Shape and size may not be very different from normal, hence the differentiation is relatively difficult.
Fatty liver
Diabetics, alcoholics and patients suffering from overweight frequently develop massiveinfiltration of the liver parenchyma by fat. Because of increased attenuation due to fat accumulation,the liver tends to show hyperechogenicity at its very surface. Scattering of ultrasound causesformation of bright liver pattern. No discrete masses are detected. However, inhomogeneity ofparenchymal echogenicity occurs in metabolic precipitation of fat.

Case Study on the Results • 275
5.8.1. Case No. JN-9Diagnosis: Choledocholithiasis with extrahepatic portal vein infarction, esophageal varix andchronic pancreatitis.
Clinical history and reason for referral; 63 M. Unknown hematochezia and liver damage about10 years ago. Anorexia and oppressive feeling.
Laboratory investigations; choline esterase was moderately and gamma-globulin was mildlyabnormal. ZTT; 6.3 and TTT; 3.9.
Liver scintigraphy; 99mTc-Sn colloid 148 MBq (4 mCi), 700 kc.Views; anterior, posterior, left and right lateral (Anti clockwise from top left).Scan findings; poor and irregular RN uptake of the liver, suspected SOL in the hilar portion
of the liver and remarkable splenomegaly.Scintigraphic comments; (1) Portal hypertention, (2) Liver cirrhosis or (3) HCC with liver
cirrhosis.

276 • Ultrasound and Radionuclide Images of Liver
Sonograms; Aloka SSD 650, 3.5 MHz convex scan transducer.Sonographic findings; there is no apparent change in echo texture of the liver parenchyma
except the dilatation of intrahepatic bile ducts and presence of stones in the common bileduct and hepatic duct. Acoustic shdowing is also evident.
,*%"•»

Case Study on the Results • 277
Final diagnosis verified by; biopsy under laparoscopy, ERCP and angiography.Individual score for case No. JN-9;
AbnormalitySOL (mass)HCCMetastasis
+
15831
US
+/-
151224
alone
-/+
14401
Malignant tumor other than HCC and
Benign tumor other
Liver cirrhosisFatty liverAcute hepatitisChronic hepatitisDiffuse liver disease
2than
01010
5 0hemangioma
04124
i other than2 5
00001
-
6234241
+
531355
metastasis of40
, cyst4242464442
1
NM
+/-
151238
liver0
and abscess0
15003
cirrhosis, fatty liver0 40 0
514307
alone
-/+
121
10
0
51222
and hepatitis2 0
-
1426147
69
6040656856
68
+
2814
111
1
08011
0
us
+/-
241334
4
111057
2
and NM
-/+
42
117
0
00100
0
-
4314538
55
5941595452
58
Comments; very few interpreters could correctly diagnose the disease by either modality, USand NM, individualy as well as in combination. Some suspected SOL in both US and NMimages.
5.8.2. Case No. JN-55.Diagnosis: Fatty liver with DM.
Clinical history and reason for referral; 74F. Follow-up Case of benign breast tumor, milddorsalgia.
Laboratory investigations; GOT and GPT were slightly abnormal. TTT; 25.8.

278 • Ultrasound and Radionuclide Images of Liver
Liver scintigraphy; 99mTc-Sn colloid 148 MBq (4 mCi), 700 kc.Views; anterior, posterior and right lateral (Anti clockwise from top left).Scan findings; mild hepatomegaly, irregular RN uptake of the liver.Scintigraphic comments; (1) Chronic hepatitis or (2) Fatty liver.
s i ? . ' , ••*••;•;•

Case Study on the Results m 279
Sonograms; Aloka SSD 650, 3.5 MHz convex scan transducer.Sonographic findings; there are no discrete mass lesions in any of the sonograms. So-called
bright liver pattern clearly indicated accumulation of fat in the liver parenchyma.
<*

280 • Ultrasound and Radionuclide Images of Liver
Final diagnosis verified by; biopsy under laparoscopy.Individual scores for case No. JN-55;
AbnormalitySOL (mass)Metastasis of liverLiver cirrhosisFatty liverAcute hepatitisChronic hepatitis
+
25521242
US
+/-
1721263
14
alone
-/+
8144210
-
14565757545648
+
181251000
NM
+/-
1997461
10
alone
-/+
87
130112
-
3202343414636
+
17410253
US
+/-
18212419
and NM
-/+
63
100002
-
17493956525244
Comments; although sonograms have clearly indicated absence of mass lesions in the liver,NM images showed decreased uptake of tracer in the liver parenchyma. Few alsosuspected chronic hepatitis.
5.8.3. Case No. JN-84.Diagnosis: Chronic hepatitis (non-A and non-B type) with DM.
Clinical history and reason for referral; 47 M. Mild oppressive feeling. Liver function test, weremoderately abnormal at liver cancer mass survey in Sept. 1987.
Laboratory investigations; GOT and GPT were mildly abnormal, choline esterase and gamma-globulin were moderately abnormal and HCV;+.

Case Study on the Results • 281
Liver scintigraphy; ""Tc-Sn colloid 148 MBq (4 mCi), 700 kc.Views; anterior, posterior and right lateral (Anti clockwise from top left).Scan findings; irregular RN uptake of the liver, mild splenomegalyScintigraphic comments; chronic hepatitis.

Sonograms; Aloka SSD 256, 3.5 MHz linear scan transducer.Sonographic findings; there is no apparent abnormal findings in sonograms except mild degrees of splenomegaly.
toCOto
BfMB:i' ^ J " l " l l ' " ! ' , ' 1
1 ', I
fiiCOO
Q
I
I1O

Case Study on the Results • 283
Final diagnosis verified by; biopsy under laparoscopy.Individual score for case No. JN-84;
AbnormalitySOL (mass)HCCMetastasisAbscessLiver cirrhosisChronic hepatitis
+
12000012
US
+/-
8110029
alone
-/+
17300002
-
29626566666353
+
191331101
NM
+/-
151235753
alone
-/+
5411022
-
4143636353637
+
161011140
US
+/-
131017318
and NM
-/+
11507001
-
7325542535248
Comments; interpretations on sonograms are consistent with the sonographic findings listedabove. In NM image interpretation, significant percentage of interpreters favored thepresence of SOL. due to limited uptake of tracer by the liver. In the combined readingsalso similar interpretations were made.
5.8.4. Case No. JN-78.Diagnosis: Acute hepatitis (B type)
Clinical history and reason for referral; 41 M. Patient fell sick with associated epigastric painand brown coloured unne after eating flavor oyster with vinegar,
Investigations; GOT and GPT were severly abnormal, choline esterase and gamma-globulinwere moderately abnoimal and total bilirubin was 6.6. HBc-Ab;+ and HAsAb;+.

284 • Ultrasound and Radionucllde Images of Liver
Liver scintigraphy; 99nTc-Sn colloid 148 MBq (4 mCi), 700 kc.Views; anterior, posterior, left lateral and right lateral (Anti clockwise from top left).Scan findings; mildly disturbed RN uptake of the liver.Scintigraphic comments; (1) Chronic hepatitis or (2) Acute hepatitis.

Sonograms; Aloka SSD 256, 3.5 MHz linear scan transducer.Sonographic findings; no apparent abnormality was found in sonograms recorded except barely visible gallbladderwith possible thickening of the waif. No ascites was detected.
,V.
, Io3
S

286 • Ultrasound and Radionuclide Images of Liver
Final diagnosis verified by; Blind biopsy and histologyIndividual scores for case No. JN-78.
US alone NM alone US and NM
002
393740
051
147
103
554846
Abnormality 11 18 18 18 13 16 9 7 12 13 16 16SOL (mass) 1 1 0 63 9 14 11 11 3 7 4 43HCC 0 00 65 2 5 2 36 0 3 2 52Cyst 0 0 15 50 1 1 4 39. 0 1 0 56Benign tumor other than hemangioma, cyst and abscess.
0 0 0 65 1 5Acute hepatitis 4 8 1 52 2 3Chronic hepatitis 0 10 1 54 0 3
Comments; Majority of interpreters, both US and NM, failed to correctly diagnose acutehepatitis.
5.8.5. Case No. RK-8Diagnosis: Portal hypertension with pseudo lesion due to dilated portal vein.
Clinical history and reason for referral; 40 M. High risk patient for liver cancer.Liver cirrhosis, esophogeal varix and duodenal bulb ulcer diagnosed 3 years ago.
Laboratory investigations; moderate tenderness, GOT was mildly abnormal.

Case Study on the Results • 287
Liver scintigra'phy; 99mTc-phytate 370 MBq (10 mCi).Views; anterior, posterior and right lateral (Anti clockwise from top left).Scan findings; suspected SOL in the liver, remarkable splenomegaly.Scintigraphic comments; HCC with liver cirrhosis.
«• m

288 • Ultrasound and Radionuclide Images of Liver
Sonograms; 3.5 MHz secter scan transducer.Sonographic findings; dilated portal branches in the liver, shrunken liver lobes andthickened gallbladder wall with stones. No apparent liver mass was detected.

Case Study on the Results • 289
Final diagnosis verified by; US, NM and clinical course.Individual scores for case No. RK-8.
AbnormalitySOL (mass)HCCLiver cyst
+
24701
Benign tumor other than
Liver cirrhosis3
13
US
+/-
7901
alone
-/+
0100
hemangioma;
62
Diffuse liver diseases other than4 2
10
-
1153230
, cyst2217
+
3524
71
NM
+/-
712113
and abscess3
15cirrhosis, fatty livei0 26 0
55
r and3
alone
-/+
1321
31
-
04
2338
3222
hepatitis.0 40
+
2820
33
19
3
US and
+/- -,
6853
46
3
NM
'+
1021
00
0
-
07
2528
3020
29
Comments; The intrahepatic SOLs diagnosed by radionuclide study were in fact dilatedintrahepatic biliary channels. Liver cirrhosis and diffuse disease of the liver were diagnosedby two third US interpreters and half NM interpreters.
5.8.6. Case No. IN-10.Diagnosis: Congestive hepatomegaly with myopericarditis.
Clinical history and reason for referral; 26 M. Follow-up case of myopericarditis, Anorexia andoppressive feeling, hepatomegaly and ascites,
Laboratory investigations; liver function tests were not available.

290 • Ultrasound and Radionuclide Images of Liver
Liver scintigraphy; 99mTc-phytate 185 MBq (5 mCi), 500 kc, Siemens ZLC 7500, No. of PMT;75,thickness of Nal (Tl); 10 mm and window; 20%.
Views; anterior, posterior and right lateral (Anti clockwise from top left).Scan findings; moderate hepatomegaly, moderate splenomegaly, moderate bone marrow
RN uptakeScintigraphic comments; liver cirrhosis.

Case Study on the Results • 291
Sonograms; ATL, Mark 600, 3.5 MHz sector scan transducer.Sonographic findings; except accumulation of ascitic fluid and dilated hepatic veintributaries in the liver, there is no abnormality in liver parenchyma. These findings areconsistent with congestive cirrhosis of the liver.

292 • Ultrasound and Radionuclide Images of Liver
Final diagnosis verified by; biopsy and histopathology.Individual scores for case No. IN-10;
AbnormalitySOL (mass)Benign tumor other
Liver cirrhosisFatty liverAcute hepatitisChronic hepatitisDiffuse liver disease
+
110
than07001
US
+/-
113
alone
-/+
23
hemangioma,36001
other than3 2
11002
-
826
, cyst2828313228
+
280
NM i
+/-
82
and abscess.0
16303
cirrhosis, fatty liver0 27 2
17442
ilone
-/+
43
31110
and hepatitis1 1
-
338
3919353838
39
+
260
013005
1
US and
+/- -/
71
16333
1
NM
'+
13
31101
0
-
131
3115313326
33
Comments; Both US and NM findings suggest absence of focal liver disease (SOL). Thediagnosis, either as liver cirrhosis or diffuse lesion of the liver, was unanimous.
5.8.7. Case No. SI-11.Diagnosis: Mild liver parenchymal disease.
Clinical history and reason for referral; 58 M. Follow-up case of carcinoma rectum, presentswith hepatomegaly.
Laboratory investigations; liver function tests were normal, but CEA 17.1 ng/ml (due to rectumcarcinoma).

Case Study on the Results • 293
Liver scintigraphy; 99mTc-Phytate 185 MBq (5 mCi), 500 kc, Elscint AFEX 409AG, No. of PMT;37, thickness of Nal (Tl); 1/4 inch, collimator; high resolution, window; 10% and informationdensity; 3.2 kc/cm2.Views; anterior, posterior and right lateral (Anti clockwise from top left).Scan findings; mild hepatomegaly, mild splenomegalyScintigraphic comments; (1) Chronic hepatitis or (2) Fatty liver.

294 • Ultrasound and Radionuclide Images of Liver
Sonograms; Aloka SSD 280, 3.5 MHz sector scan transducer.Sonographic findings; size, shape and internal echo textures are entirely normal and no mass
lesions could be identified.
^sfh^*^

Case Study on the Results • 295
Final diagnosis verified by; clinical course.Individual scores for case No. SI-11;
AbnormalitySOL (mass)Liver cirrhosisFatty liverChronic hepatitis
+
41010
US
+/-
84262
alone
-/+
122323
-
1441433943
+
90403
NM
+/-
151548
alone
-/+
52000
-
935293427
+
50100
US
+/-
151457
and NM
-/+
10002
-
1535313127
Comments; no apparent abnormality was detected either by US or NM images.

296 • Ultrasound and Radionuclide Images of Liver
5.9 NORMAL LIVER

Case Study on the Results • 297
5.9.1 Case No. IN-4.Diagnosis: Normal liver.
Clinical history and reason for referral; 36 F. In follow-up study of ovarian carcinoma with lymphnode metastasis.
Physicals; mild hepatomegalyLaboratory investigations; liver function tests and tumor marker tests were all normal.
Liver scintigraphy; 99mTc-phytate 185 MBq (5 mCi), 500 kc, Siemens ZLC 7500, No. of PMT;75, thickness of Nal (T1); 10 mm, collimator; high resolution and window; 15%.
Views, anterior, posterior and right lateral (Anti clockwise from top left).Scan findings; mild hepatomegaly, relative left lobe enlargement.Scintigraphic comments; (1) Fatty liver or (2) Chronic hepatitis.

298 • Ultrasound and Radionuclide Images of Liver
Sonograms; ATL, Mark 600, 3.5 MHz sector scan transducer.Sonographic findings; entirely normal sonograms without any tumor mass in the liver.

Case Study on the Results • 299
Final diagnosis verified by; XCT, US and clinical course.Individual scores for case No. IN-4;
AbnormalitySOL (mass)HCCBenign tumor other
Fatty liverChronic hepatitis
+
303011than
100
US
+/-
319
alone
-/+
010
hemangioma,301
101
-
01
13cyst
303331
+
600
NM
+/-
810
and abscess011
034
alone
-/+
720
114
-
213942
413733
+
1313
6
001
US and
+/- -1
8104
311
NM
'+
750
012
-
88
26
333432
Comments; there is very distinct difference in the interpretation of SOL between US and NMscans. One thirds of US image interpretation refered to possible HCC whereas no suchinterpretations were made in NM imaging. This tendency was also observed with combinedimage interpretations. Ironically this is due to marking of measurement of the width withslight inhomogeneity of the internal echo textures.This study is a good example of howsometimes combined readings instead of helping in correct diagnosis, may also misguidethe interpreter, leading to wrong diagnosis.

CONCLUSION
GOPINATHAN NAIR, M.D.,
Head, Section of Nuclear Medicine,Division of Human Health,IAEA, VIENNA
The coordinated research programme (CRP) entitled "Evaluation of imaging procedures for thediagnosis of liver diseases" was undertaken to study the role of 99mTc radiocolloid planarscintigraphy and gray scale and real-time ultrasonography in the diagnosis of various liverdiseases. This was done essentially by comparing the sensitivity and specificity of each imagingmodality in the diagnosis of a spectrum of focal and diffuse liver disorders. Many institutions anda large number of qualified Nuclear Medicine and Ultrasonography specialists took part in the imagegeneration and image interpretation exercise.
The gamma cameras and ultrasound equipments used in this study were different with respectto their make and age, as they were from institutions from different countries. It was thereforeneccessary to examine and define the performance status of these equipments used for generatingimages for later interpretation and diagnosis of the liver disorders. The visual inspection of thetest images—uniformity, spatial resolution and distortion images—revealed that gamma cameraswith good, acceptable and poor performance were used in this study. 73% of the gamma cameraswere rated as performing well or acceptable. There were also differences in the quality of hardcopy images such as overexposure or underexposure. For the evaluation of ultrasound equipment,images of multipurpose phantom generated by the equipments were examined both visually andquantitatively. The machines were rated mostly as good or excellent in performance. Theconclusion from this part of the research was that there is a greater need to stress the practiceof quality assurance in nuclear medicine studies including the need to improve the maintenanceof gamma cameras. The Agency's future programme should take due note of this observation.
The sensitivity and specificity of scintigraphic and ultrasonographic images in the diagnosisof liver diseases were examined using two approaches. In the first approach, paired liver imagesi.e. scintigraphic and ultrasonographic images of the liver from patients with known diagnoses,obtained from Japanese investigators were sent out to institutions in countries participating in theresearch programme. Nuclear medicine and ultrasonography specialists were invited to interpret

Conclusion • 301
these images and give a diagnosis. These reports were compared with final diagnosis to determinethe sensitivity and specificity of the imaging modalities. The second apprach was to do the sameinterpretation exercise on carefully selected paired liver images from all participating countries.This dual approach ensured a wider regional representation of various liver pathologies in thisexercise and gave opportunities to participants to examine a wide range of liver diseases andliver images. The receiver operating characteristic (ROC) analysis was used to determine theseparameters.
The analyses revealed that ultrasonography offered a slightly higher rate of true positivefraction (TPF) than the scintigraphy in the diagnosis of mass lesions of the liver although thedifference was not statistically significant. The mass lesions included hepatocellular carcinoma,metastatic cancer, hemangioma, cysts, abscesses and hematoma. There was also a widerdifference in the average of TPF with scintigraphy among various countries than that observedin case of ultrasonography. Use of information from images obtained from one modality whileinterpreting the images obtained from the other (combined reading) increased the TPF slightly,but not significantly. There were also differences in TPF among indvidual interpreters from differentcountries for diagnosing mass lesions and providing a qualitative diagnosis in terms of the benignor malignant nature of the mass. These findings could be explained on the basis of the differencesin experience, training and skills of the interpreters.
In dealing with diffuse lesions of the liver, particularly cirrhosis of liver, scintigraphy providedhigher TPF than ultrasonography. This observation was less striking in the other type of diffuselesions such as fatty liver, chronic hepatitis, acute hepatitis, intrahepatic portal hypertension andprimary biliary cirrhosis. As in the case of mass lesions, there was a wide scatter of the averageTPF in case of scintigraphy as compared to ultrasonography from different countries. This couldalso be explained on the basis of wider differences in the quality of scintigraphic images.
The ultrasonographic images yielded a clearly high TPF in diagnosing mass lesions, especiallysmaller size lesions of 20 mm or less in diameter, indicating the higher resolution of ultrasonography.
In the scintigraphic image analysis, the false positive fraction (FPF) was higher for the imagesobtained from Japanese patients as compared to that for images collected from the otherparticipating countries. This could be explained on the basis of the geographic variation in theprevalence of various liver diseases in a developed country like Japan and the rest of thedeveloping countries in that region.
Analysis of results was also carried out after eliminating poor quality images. There was adefinite increase in the diagnostic accuracy seen in the results. This underscored the importanceof ensuring good quality images for use in clinical diagnosis which is a part of quality assurancein medical imaging.
In conclusion, ultrasonography is reported to be better than scintigraphy in the diagnosis ofhepatic tumors which include focal nodular hyperplasia, hepatocellular carcinomas, metastatictumors and hemangiomas. The ability of ultrasonography and scintigraphy in detecting multifocaland diffuse fatty infiltration of liver is reported to be varying based on the interpretation skills ofthe observers which depend, among others on past experience in dealing with such lesions.

302 • Ultrasound and Radionuclide Images of Liver
In many reports in the literature, the complimentary role of both these modalities has beenstressed rather than their competitive roles. Diagnosis by ultrasonography requires a high degreeof technical skill, both in generating good quality images and interpreting them. The informationcontent of planar radiocolloid hepatic scintigraphy is rather limited. In an average situation existingin many hospitals in developing countries, these negative attributes of ultrasonography andscintigraphy balance each other, leaving very little edge for one over the other. An integratedimaging protocol involving a combination of ultrasound and scintigraphy often provides a higherdegree of diagnostic accuracy than when only one modality is used for diagnosis. At the ultimatepractical level, it would be prudent to recommend an integrated imaging protocol when dealingwith liver lesions that pose a challenge to a correct diagnosis. The factors that come into play,when one modality is chosen for imaging are interpreter experience, cost of the study, down time,physician/technologist involvement time and ready accessability to a given modality.

ACKNOWLEDGEMENT
GOPINATHAN NAIR, M.D.,
Head, Section of Nuclear Medicine,Division of Human Health,IAEA
This monograph is the result of a collaborative endeavour. It truely is a reassertion of theoften used quote that science has no boundaries. The collection of this enormous data, basedon the coordinated research programme (CRP) on the evaluation of imaging procedures in thediagnosis of liver diseases—Phase II, was possible only because of the commitment anddedication of the chief scientific investigators of this CRP, namely Dr. Shahana Afroz (Bangladesh),Dr. Zhou Guochong (the People's Republic of China), Dr. A. K. Padhy (India), Dr. HusseinKartamihardja (Indonesia), Dr. Soo Kyo Chung (Republic of Korea), Dr. Rukhsana Memon(Pakistan), Dr. Orestes Monzon (the Philippines), Dr. Ee Sin Ang (Singapore) and Dr. Suttee NaSongkhla (Thailand). This and the participation of the large number of nuclear medicine andultrasound specialists in these countries in the image reading and diagnosis of 197 paired imagesof the liver are gratefully acknowledged. They were not motivated by anything other than the spiritof true scientific enquiry.
Churning this sea of data to generate the cream was no small task. This most important workwas done by the excellent team of Japanese scientists led by Dr. Yukio Tateno, which includedDr. Kenjiro Fukuhisa, Dr. Fumio Shishido and Dr. Toru Matsumoto at the National Institute ofRadiological Sciences (NIRS), Chiba, Japan. It was also this brilliant team, which included Ms.Eiko Takeda, Ms. Yoriko Tanaka, Ms. Hiroko Tabata and Ms. Yasuko Joshima (NIRS), thatconceived and prepared the most exhaustive data sheets for entering all the data from this researchwork. Dr. Morimichi Fukuda, Sapporo Medical University, Sapporo, Japan, was entirely responsiblefor all the matters related to ultrasound imaging in this study starting from selecting theultrasonographic imaging phantom, designing the protocol for ultrasonographic imaging, assessingthe quality of these images, and selecting suitable images for inclusion in the image readingexercise. Dr. Yasuhito Sasaki, Tokyo University, Tokyo, was also involved in this CRP during itsearly stage. Thus the Japanese team of scientists which formed the backbone of this CRP deserveto be commended specially for successfully completing a very difficult task. The InternationalAtomic Energy Agency wishes to make special mention of this.

304 • Ultrasound and Radionuclide Images of Liver
The Agency acknowledges the significant contribution of Prof. H. Bergmann of the Institutefor Biomedicine and Physics, Vienna, to this research. He had been involved in both the qualitativeand quantitative evaluation of the quality of performance of all the gamma camera and ultrasoundmachines used in this study.
The Agency acknowledges the help rendered by Dr. A.K. Padhy of AIIMS, New Delhi, Indiafor doing a substantial part of the editorial work and in getting this monograph printed.
The support and encouragement of both Dr. Masatoshi Kobayashi and Dr. Teiki Kobayashi,the past and present RCA/IAEA coordinators in Japan respectively in matters related to thisresearch are gratefully acknowledged.
I wish to express my thanks also to Dr. Alfredo Cuaron, the director of the Division of HumanHealth, to Mr. John Easey, RCA coordinator, and to Dr. Sueo Machi, the deputy director generalof the department of Research and Isotopes at the Agency for their support given to me inmanaging this research programme to its successful conclusion.
Lastly, but not the least, I wish to pay tribute to my predecessor Dr. R. D. Ganatra, whomanaged successfully the first phase and early part of the second phase of this CRP and whomade things easier for me to carry on from where he left on retirement from the Agency.