Ultrafine particle and fine trace metal (As, Cd, Cu, Pb and Zn) pollution episodes induced by...
11
Ultrane particle and ne trace metal (As, Cd, Cu, Pb and Zn) pollution episodes induced by industrial emissions in Huelva, SW Spain R. Fernández-Camacho a, * , S. Rodríguez a, b , J. de la Rosa a , A.M. Sánchez de la Campa a , A. Alastuey c , X. Querol c , Y. González-Castanedo a , I. Garcia-Orellana d , S. Nava e a Joint Research Unit to CSIC “Atmospheric Pollution”, CIQSO, University of Huelva, Campus El Carmen, E21071 Huelva, Spain b Izaña Atmospheric Research Centre, AEMET Joint Research Unit to CSIC “Studies on Atmospheric Pollution”, La Marina 20, planta 6, Santa Cruz de Tenerife, E38071 Canary Islands, Spain c Institute of Environmental Assessment and Water Research IDAEA, CSIC, C/Jordi Girona, 18-26, 08034 Barcelona, Spain d National Accelerator Center, Avd. Thomas A. Edison 7, E-41092 Sevilla, Spain e Dipartimento di Fisica and INFN Sezione di Firenze, via Sansone 1, I- 50019 Sesto Fiorentino, Italy highlights < We studied how industrial emissions contribute to ultrane particles (UP). < Trafc and industrial UP episodes are identied from the relation of UP and PM 2.5 . < Road trafc emissions, in the morning rush hours, are associated with OM and BC. < Industrial plumes, during daylight, are related with heavy metals. < Industrial emissions are the rst cause of high UP in Huelva city. article info Article history: Received 5 March 2012 Received in revised form 30 July 2012 Accepted 1 August 2012 Keywords: Ultrane particles Arsenic Cadmium Industrial emissions Vehicle exhausts abstract Urban air quality impairment by ultrane particles has become a matter of concern due to the adverse effects on human health. Most of the studies of ultrane particles in urban air quality have focused on vehicle exhaust emissions. We studied how industrial emissions contribute to ultrane particle concentrations in downwind urban ambient air. This research is based on experimental data collected in the ambient air of the industrial city of Huelva (SW Spain) over April 2008eDecember 2009 period (particle number, gaseous pollutants and black carbon concentrations and levels and chemical composition of PM 10 and PM 2.5 with daily and hourly resolution). This city is affected by emissions from the second largest Cu-smelter in Europe, phosphoric acid and fertilizer production plants and an oil renery and petrochemical plant. Industrial emissions are the main cause of ultrane particle episodes. When vehicle exhaust emissions are the main source, ultrane particles typically show (24-h mean) concentrations within the range 14,700e5000 cm 3 (50the1st), with 60% of these linked to this source and 30% to industrial emissions. In contrast, when daily mean levels of N are within the range 50,000 e25,500 cm 3 (100the70th), industrial and vehicle exhaust emissions accounted for 49 and 30%, respectively. High concentrations of toxic trace metals (As, Cu, Cd, Zn and Pb) were recorded when the study city suffered fumigations of the Cu-smelter plumes (e.g. 10e25 ng m 3 As, 1e2 ng m 3 Cd and >10 5 cm 3 of ultrane particles). Because of these industrial emissions, ultrane particle concentrations during daylight are about two times higher than those observed in other European cities. Recently, ultrane particle emissions in vehicle exhausts have been subject to limit values in a recent stage of the EURO standards. Industrial emissions should also be considered. Ó 2012 Elsevier Ltd. All rights reserved. 1. Introduction Epidemiological studies performed during recent decades have shown that in urban areas there is a relationship between the mass concentration of particles smaller than 10 and 2.5 mm aerodynamic * Corresponding author. E-mail address: [email protected] (R. Fernández-Camacho). Contents lists available at SciVerse ScienceDirect Atmospheric Environment journal homepage: www.elsevier.com/locate/atmosenv 1352-2310/$ e see front matter Ó 2012 Elsevier Ltd. All rights reserved. http://dx.doi.org/10.1016/j.atmosenv.2012.08.003 Atmospheric Environment 61 (2012) 507e517
-
Upload
independent -
Category
Documents
-
view
0 -
download
0
Transcript of Ultrafine particle and fine trace metal (As, Cd, Cu, Pb and Zn) pollution episodes induced by...
Ultra!ne particle and !ne trace metal (As, Cd, Cu, Pb and Zn) pollution episodesinduced by industrial emissions in Huelva, SW Spain
R. Fernández-Camacho a,*, S. Rodríguez a,b, J. de la Rosa a, A.M. Sánchez de la Campa a, A. Alastuey c,X. Querol c, Y. González-Castanedo a, I. Garcia-Orellana d, S. Nava e
a Joint Research Unit to CSIC “Atmospheric Pollution”, CIQSO, University of Huelva, Campus El Carmen, E21071 Huelva, Spainb Izaña Atmospheric Research Centre, AEMET Joint Research Unit to CSIC “Studies on Atmospheric Pollution”, La Marina 20, planta 6,Santa Cruz de Tenerife, E38071 Canary Islands, Spainc Institute of Environmental Assessment and Water Research IDAEA, CSIC, C/Jordi Girona, 18-26, 08034 Barcelona, SpaindNational Accelerator Center, Avd. Thomas A. Edison 7, E-41092 Sevilla, SpaineDipartimento di Fisica and INFN Sezione di Firenze, via Sansone 1, I- 50019 Sesto Fiorentino, Italy
h i g h l i g h t s
< We studied how industrial emissions contribute to ultra!ne particles (UP).< Traf!c and industrial UP episodes are identi!ed from the relation of UP and PM2.5.< Road traf!c emissions, in the morning rush hours, are associated with OM and BC.< Industrial plumes, during daylight, are related with heavy metals.< Industrial emissions are the !rst cause of high UP in Huelva city.
a r t i c l e i n f o
Article history:Received 5 March 2012Received in revised form30 July 2012Accepted 1 August 2012
Keywords:Ultra!ne particlesArsenicCadmiumIndustrial emissionsVehicle exhausts
a b s t r a c t
Urban air quality impairment by ultra!ne particles has become a matter of concern due to the adverseeffects on human health. Most of the studies of ultra!ne particles in urban air quality have focused onvehicle exhaust emissions. We studied how industrial emissions contribute to ultra!ne particleconcentrations in downwind urban ambient air. This research is based on experimental data collected inthe ambient air of the industrial city of Huelva (SW Spain) over April 2008eDecember 2009 period(particle number, gaseous pollutants and black carbon concentrations and levels and chemicalcomposition of PM10 and PM2.5 with daily and hourly resolution). This city is affected by emissions fromthe second largest Cu-smelter in Europe, phosphoric acid and fertilizer production plants and an oilre!nery and petrochemical plant. Industrial emissions are the main cause of ultra!ne particle episodes.When vehicle exhaust emissions are the main source, ultra!ne particles typically show (24-h mean)concentrations within the range 14,700e5000 cm!3 (50the1st), with 60% of these linked to this sourceand 30% to industrial emissions. In contrast, when daily mean levels of N are within the range 50,000e25,500 cm!3 (100the70th), industrial and vehicle exhaust emissions accounted for 49 and 30%,respectively. High concentrations of toxic trace metals (As, Cu, Cd, Zn and Pb) were recorded when thestudy city suffered fumigations of the Cu-smelter plumes (e.g. 10e25 ng m!3 As, 1e2 ng m!3 Cd and>105 cm!3 of ultra!ne particles). Because of these industrial emissions, ultra!ne particle concentrationsduring daylight are about two times higher than those observed in other European cities. Recently,ultra!ne particle emissions in vehicle exhausts have been subject to limit values in a recent stage of theEURO standards. Industrial emissions should also be considered.
! 2012 Elsevier Ltd. All rights reserved.
1. Introduction
Epidemiological studies performed during recent decades haveshown that in urban areas there is a relationship between the massconcentration of particles smaller than 10 and 2.5 mm aerodynamic
* Corresponding author.E-mail address: [email protected] (R. Fernández-Camacho).
Contents lists available at SciVerse ScienceDirect
Atmospheric Environment
journal homepage: www.elsevier .com/locate/atmosenv
1352-2310/$ e see front matter ! 2012 Elsevier Ltd. All rights reserved.http://dx.doi.org/10.1016/j.atmosenv.2012.08.003
Atmospheric Environment 61 (2012) 507e517
diameter (PM10 and PM2.5, respectively) and cardiovascular andrespiratory morbidity (WHO, 2005). Because of this, standards forPM10 andPM2.5 have been set inmany countries.More recent studiesreveal that some of the cardiovascular effects attributed to exposureto PM2.5 may be due to ultra!ne particles (diameter smaller than0.1 mm; Araujo & Nel, 2009). Ultra!ne particles typically account for80e90% of the total number concentrations and for <10% of thePM2.5 particlemass concentration (Putaud et al., 2010 and referencestherein). Most of the PM2.5 mass concentrations ("90%) occur in theaccumulationmode (0.1e1 mm). As a consequence ultra!ne particlesare not properly monitored using PM10 and PM2.5 as air qualityassessment metrics. The total number concentration of particlescoarser than a given size (usually 2 or 10 nanometres) has been usedas a metric representative of ultra!ne particles (e.g. Puustinen et al.,2007). Size-resolved measurements have been used to study thesources and processes contributing to ultra!ne particles (e.g. Casatiet al., 2007). The correlation between particle number and PM2.5concentrations in urban ambient air is rather weak (Putaud et al.,2010). In urban areas it has been observed that organic matter andelemental carbon are the only two PM2.5 components that maysigni!cantly correlate with the particle number, with this beingattributed to vehicle exhaust emissions (Rodríguez et al., 2007).Because of the concern linked to ultra!ne particle ambient airpollution, standards for particle number emissions have been set inEURO-5b (Regulation 692/2008).
Although biogenic SOA emissions may in general contribute toultra!ne and organic carbon concentrations, the high correlationbetween OC and BC in the study area points to anthropogenicemissions (industrial plus vehicle exhaust emissions) as dominantsource. Particles emitted by this source tend to be bimodal, exhib-iting a nucleation mode (<30 nm), constituted by sulphuric aciddroplets that may be covered by condensed hydrocarbons, anda soot mode (50e200 nm; Kittelson, 1998). The formation rate ofthe nucleationmode particles is signi!cantly in"uenced by ambientair conditions (e.g. wind speed, temperature and humidity; Casatiet al., 2007). The soot mode is constituted by light-absorbingelemental carbon, primary organic carbon, condensed metals andsulphates and some carcinogenic organic pollutants (e.g. polycyclicaromatic hydrocarbons; Morawska and Zhang, 2002).
Up to the present date, modest attention has been paid to otherpotential major anthropogenic sources of ultra!ne particles, eventhough it is well known that some activities may release largeamounts of gaseous precursors. This is the case of some industrialactivities that release large amounts of SO2 and/or hydrocarbons.Sulphuric acid plays a key role in nucleation and new particleformation processes (Kulmala et al., 2004). These emissions resultin gas-to-particle conversion processes that may prompt ultra!neand accumulation mode (0.1e1 mm) particle pollution. Nucleationof sulphur gases followed by particle growth by condensationand/or coagulation may result in the formation of ultra!ne and !neparticles and both (especially the latter) result in PM2.5 pollution.These particles may be externally or internally mixed with traceelements linked to industrial emissions.
The development of techniques or methods for identifying thesources contributing to ultra!ne particles is a major challenge inurban air quality nowadays. Several attempts have been made, bystudying the relationship between particle number and PM2.5composition (Pey et al., 2009), by performing speciation of organiccompounds (Kleeman et al., 2009) and by using the relationshipbetween black carbon and particle number with a high time reso-lution (Rodríguez and Cuevas, 2007).
In this studywe focused on identifying the sources and processescontributing to the number concentration of particles coarser than2.5 nm in an urban area affected by industrial emissions. Differentmethods were used. Particle number concentrations were analysed
using: 1) 1-h data of black carbon, trace gases and meteorologicalparametersmeasured over twoyears, 2) 1-h resolution data of PM2.5elemental composition, and 3) receptor-modelling techniquesbased on 2-years’ data of 24-h average PM2.5 chemical composition.Results show that the contribution of industrial emissions to ultra-!ne particles in the urban ambient air of industrial cities is compa-rable to that of vehicle exhausts.
2. Methodology
2.1. Study area
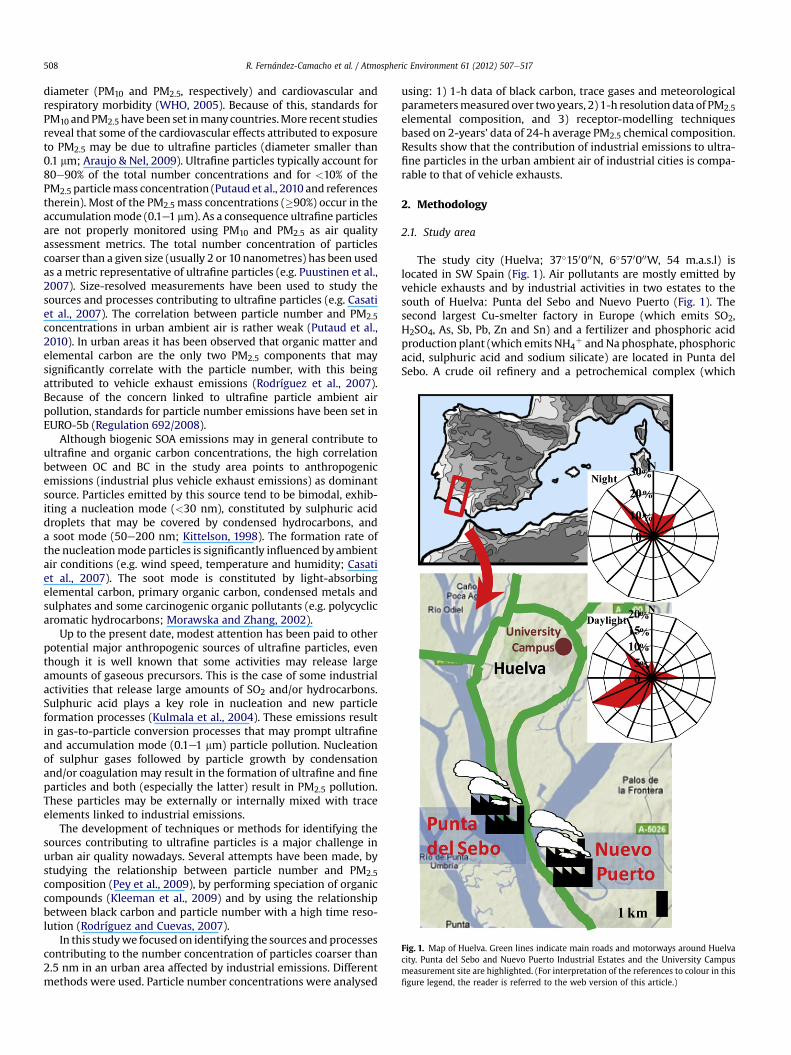
The study city (Huelva; 37#150000N, 6#570000W, 54 m.a.s.l) islocated in SW Spain (Fig. 1). Air pollutants are mostly emitted byvehicle exhausts and by industrial activities in two estates to thesouth of Huelva: Punta del Sebo and Nuevo Puerto (Fig. 1). Thesecond largest Cu-smelter factory in Europe (which emits SO2,H2SO4, As, Sb, Pb, Zn and Sn) and a fertilizer and phosphoric acidproduction plant (which emits NH4
$ andNa phosphate, phosphoricacid, sulphuric acid and sodium silicate) are located in Punta delSebo. A crude oil re!nery and a petrochemical complex (which
Fig. 1. Map of Huelva. Green lines indicate main roads and motorways around Huelvacity. Punta del Sebo and Nuevo Puerto Industrial Estates and the University Campusmeasurement site are highlighted. (For interpretation of the references to colour in this!gure legend, the reader is referred to the web version of this article.)
R. Fernández-Camacho et al. / Atmospheric Environment 61 (2012) 507e517508

emits SO2, NOx, NH3, Ni, V and awide variety of hydrocarbons) are tobe found inNuevo Puerto. Pollutants emitted by these industries aredescribed in previous works (De la Rosa et al., 2010; Fernández-Camacho et al., 2010a; Sánchez de la Campa et al., 2011) and inthe European Pollution and Emission Register (http://eper.ec.europa.eu/eper/). These industrial emissions can reach the city ofHuelva on the southerly winds episodically linked to speci!csynoptic conditions or on an almost daily basis linked to thedevelopment of coastal breezes during daylight (Castell et al., 2010).
2.2. Experimental data
Concentrations of gaseous pollutants and levels and composi-tion of atmospheric particulate matter were monitored in an urbanbackground station (37#16013.100, 6#55030.900 m.a.s.l) located at theUniversity Campus on the northern side of the city. The site is sit-uated about 7 km from Punta del Sebo Estate and about 14 km fromNuevo Puerto Estate. Moreover, two entry roads to the city arelocated about 500m to thewest and about 1000m to the east of themeasurement site. The measurements used for this study werecollected from April 2008 to December 2009.
2.2.1. Particle number, black carbon, PM10 and PM2.5 concentrationsDetails of the experimental methods have been presented by
Fernández-Camacho et al. (2010b). Thus a brief summary is per-formed here. The particle number (PN) was monitored using a TSI"3776 model Ultra!ne Condensation Particle Counter (UCPC). Theinstrument records data averaged at 1-min intervals and detectsparticles coarser than 2.5 nanometres (nm) operating in high-"owmode (1.5 l m!1). Because 80e90% of particles in urban air are<0.1 mm, PN is considered representative of ultra!ne particlenumber concentration. Black carbon (BC) concentration was moni-toredusing a Thermo"Carussomodel 5012Multi-Angle AbsorptionPhotometer (MAAP). BC concentrations were calculated usinga mass-speci!c attenuation cross-section equal to 10.31 m2 g!1
(Fernández-Camacho et al., 2010b). Instruments were inter-compared before the measurement campaign and calibrated forair"ow on a weekly basis using a Gilibrator" bubble-"ow meter.Data availability was 90% for BC and 70% for particle number.
PM10 and PM2.5 were sampled (24-h) using EU referencemethods: a Graseby Andersen" sampler (68 m3 h!1, EN-12341) forPM10 and a MCV" (30 m3 h!1, EN-14907) for PM2.5. The samplingfrequency was 1 sampling day (00:00e00:00 GMT) every four daysin 2008 and every eight days in 2009. MUNKELL" microquartz!bre !lters were used. Filters were conditioned at 20 #C and 25% RHbefore weighting previous and after sampling. Blank !eld !lterswere also used.
Hourly levels of PM10 and PM2.5 were monitored usinga GRIMM" optical particle counter. Their concentrations wereconverted to the gravimetric equivalent by comparing with the EU(gravimetric) reference method using the EU standardized method(EC Working Group on Particle Matter report, 2002).
2.2.2. Gaseous pollutants, meteorology and road traf!c dataConcentrations of gaseous pollutants (SO2, NOx and O3) were
monitored with 1-h resolution using the reference methods of theEuropean air quality directives (2008b/50/EC). Meteorologicalparameters (wind speed and direction, temperature, relativehumidity, pressure and global radiation), monitored in a station lessthan 2 km away managed by the Meteorological State Agency(AEMET), and road traf!c intensity data (number of vehicles$h!1),recorded on the two roads close to the measurement site, were alsoused. These data were obtained during 2008 and 2009 with 1-hresolution.
2.2.3. Bulk chemical composition of particles: 24-h resolutionSamples of PM10 and PM2.5 collected on the microquartz !bre
!lters were chemically analysed using the method of Querol et al.(2008). This method includes ICP-OES and ICP-MS for elementalcomposition, Ion Chromatography for ions (SO4
2!; NO3!;
Cl! and NH4$) and the LECO SC-144 DR instrument for total carbon.
Average precision and accuracy are within the range of 3e10% formostelements andcompounds. Silica andcarbonatewereestimatedby stoichiometry using the Ca, Mg and Al data (Querol et al., 2001).
A set of 62 samples of PM10 and 59 samples of PM2.5 wereselected for the analysis of organic carbon (OC) and elementalcarbon (EC), using the Thermo Optical Transmittance technique(Birch and Cary, 1996) and a Sunset Laboratory" instrument withthe default temperature steps of the EUSAAR2 program. The !lterswere selected in a homogeneous way, covering a representativerange of concentrations of the area of study during the four seasons.The EC data were used to determine the mass-speci!c attenuationcross-section by comparison with the absorption coef!cientmeasured by the MAAP. Then, mean black carbon (BC) concentra-tions were determined for each PM10 and PM2.5 sample. To deter-mine the BC load in PM2.5, the mean ratio of BC in PM2.5/BC in PM10was used. A mass-absorption ef!ciency of 10.31 % 0.25 m2 g!1 anda mean BC in PM2.5/BC in PM10 ratio equal to 0.74 % 0.025 wasobtained (see details in Fernández-Camacho et al., 2010b). Then,the organic carbon in each PM10 and PM2.5 sample was determinedas the difference betweenTC and BC. Finally, the organicmatter wasestimated by multiplying OC concentrations by 1.8 to take thecontribution of other atoms into account (Turpin and Lim, 2001).
A total of 136 samples of PM10 and 134 samples of PM2.5collected from April 2008 to December 2009 were analysed usingthis method (Table 1).
2.2.4. Elemental composition of particles: 1-h resolutionA ‘streaker’ sampler (PIXE International Corporation) was
employed to collect samples of !ne (<2.5 mm aerodynamic diam-eter) and coarse (2.5e10 mm) particles with one hour resolution(D’Alessandro et al., 2003). A paraf!n-coated kapton foil was usedas an impaction surface for coarse particles and a Nuclepore !lter asa !ne particle collector. Elemental composition was determined byPIXE in the LABEC laboratory at INFN in Florence (Italy): Ti, V, Cr,Mn, Fe, Ni, Cu, Zn, As, Se, Sr and Pb as trace elements and Na, Mg, Al,Si, P, S, Cl, K and Ca as major elements. Concentration uncertaintieswere around 5%. Detection limits were about 10 ng m!3 for low-Zelements and 1 ng m!3 (or below) for medium-high Z elements.(Chiari et al., 2006). The sampling was performed from 15th to22nd October 2009.
2.3. Data treatment
2.3.1. Components of ultra!ne particlesIn order to identify the sources and processes that contribute to
the particle number concentrations, PN was split into twocomponents (Rodríguez and Cuevas, 2007):
PN1 & S1$BC (1)
PN2 & PN! PN1 (2)
where S1&6.9 106 particlesng!1 BC is theminimum slope observedin the PN vs BC plot in our measurement site and represents theminimum number of particles formed/emitted per nanogram of BCemitted by vehicle exhausts (Fig. 2).
In cities where black carbon is dominated by vehicle exhaustemissions, this method allows to segregate the contribution of thissource from that of other sources to the ultra!ne particle
R. Fernández-Camacho et al. / Atmospheric Environment 61 (2012) 507e517 509
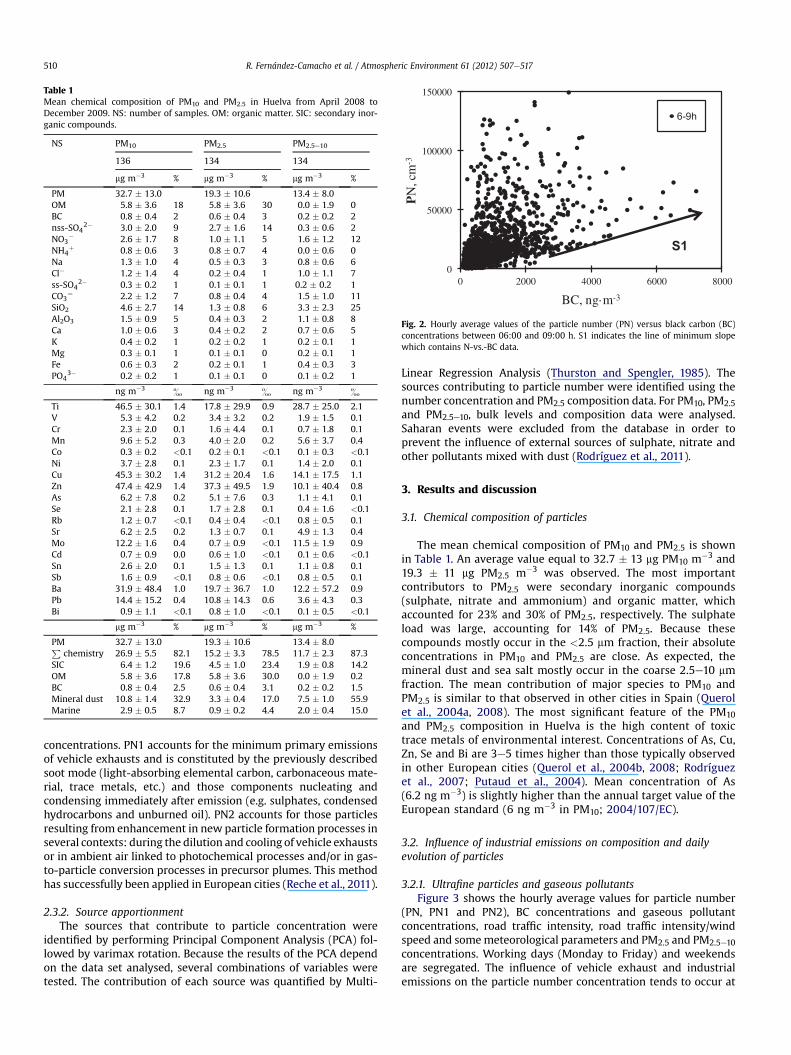
concentrations. PN1 accounts for the minimum primary emissionsof vehicle exhausts and is constituted by the previously describedsoot mode (light-absorbing elemental carbon, carbonaceous mate-rial, trace metals, etc.) and those components nucleating andcondensing immediately after emission (e.g. sulphates, condensedhydrocarbons and unburned oil). PN2 accounts for those particlesresulting from enhancement in new particle formation processes inseveral contexts: during the dilution and cooling of vehicle exhaustsor in ambient air linked to photochemical processes and/or in gas-to-particle conversion processes in precursor plumes. This methodhas successfully been applied in European cities (Reche et al., 2011).
2.3.2. Source apportionmentThe sources that contribute to particle concentration were
identi!ed by performing Principal Component Analysis (PCA) fol-lowed by varimax rotation. Because the results of the PCA dependon the data set analysed, several combinations of variables weretested. The contribution of each source was quanti!ed by Multi-
Linear Regression Analysis (Thurston and Spengler, 1985). Thesources contributing to particle number were identi!ed using thenumber concentration and PM2.5 composition data. For PM10, PM2.5and PM2.5e10, bulk levels and composition data were analysed.Saharan events were excluded from the database in order toprevent the in"uence of external sources of sulphate, nitrate andother pollutants mixed with dust (Rodríguez et al., 2011).
3. Results and discussion
3.1. Chemical composition of particles
The mean chemical composition of PM10 and PM2.5 is shownin Table 1. An average value equal to 32.7 % 13 mg PM10 m!3 and19.3 % 11 mg PM2.5 m!3 was observed. The most importantcontributors to PM2.5 were secondary inorganic compounds(sulphate, nitrate and ammonium) and organic matter, whichaccounted for 23% and 30% of PM2.5, respectively. The sulphateload was large, accounting for 14% of PM2.5. Because thesecompounds mostly occur in the <2.5 mm fraction, their absoluteconcentrations in PM10 and PM2.5 are close. As expected, themineral dust and sea salt mostly occur in the coarse 2.5e10 mmfraction. The mean contribution of major species to PM10 andPM2.5 is similar to that observed in other cities in Spain (Querolet al., 2004a, 2008). The most signi!cant feature of the PM10and PM2.5 composition in Huelva is the high content of toxictrace metals of environmental interest. Concentrations of As, Cu,Zn, Se and Bi are 3e5 times higher than those typically observedin other European cities (Querol et al., 2004b, 2008; Rodríguezet al., 2007; Putaud et al., 2004). Mean concentration of As(6.2 ng m!3) is slightly higher than the annual target value of theEuropean standard (6 ng m!3 in PM10; 2004/107/EC).
3.2. In"uence of industrial emissions on composition and dailyevolution of particles
3.2.1. Ultra!ne particles and gaseous pollutantsFigure 3 shows the hourly average values for particle number
(PN, PN1 and PN2), BC concentrations and gaseous pollutantconcentrations, road traf!c intensity, road traf!c intensity/windspeed and somemeteorological parameters and PM2.5 and PM2.5e10concentrations. Working days (Monday to Friday) and weekendsare segregated. The in"uence of vehicle exhaust and industrialemissions on the particle number concentration tends to occur at
Table 1Mean chemical composition of PM10 and PM2.5 in Huelva from April 2008 toDecember 2009. NS: number of samples. OM: organic matter. SIC: secondary inor-ganic compounds.
NS PM10 PM2.5 PM2.5e10
136 134 134
mg m!3 % mg m!3 % mg m!3 %
PM 32.7 % 13.0 19.3 % 10.6 13.4 % 8.0OM 5.8 % 3.6 18 5.8 % 3.6 30 0.0 % 1.9 0BC 0.8 % 0.4 2 0.6 % 0.4 3 0.2 % 0.2 2nss-SO4
2! 3.0 % 2.0 9 2.7 % 1.6 14 0.3 % 0.6 2NO3
! 2.6 % 1.7 8 1.0 % 1.1 5 1.6 % 1.2 12NH4
$ 0.8 % 0.6 3 0.8 % 0.7 4 0.0 % 0.6 0Na 1.3 % 1.0 4 0.5 % 0.3 3 0.8 % 0.6 6Cl! 1.2 % 1.4 4 0.2 % 0.4 1 1.0 % 1.1 7ss-SO4
2! 0.3 % 0.2 1 0.1 % 0.1 1 0.2 % 0.2 1CO3
& 2.2 % 1.2 7 0.8 % 0.4 4 1.5 % 1.0 11SiO2 4.6 % 2.7 14 1.3 % 0.8 6 3.3 % 2.3 25Al2O3 1.5 % 0.9 5 0.4 % 0.3 2 1.1 % 0.8 8Ca 1.0 % 0.6 3 0.4 % 0.2 2 0.7 % 0.6 5K 0.4 % 0.2 1 0.2 % 0.2 1 0.2 % 0.1 1Mg 0.3 % 0.1 1 0.1 % 0.1 0 0.2 % 0.1 1Fe 0.6 % 0.3 2 0.2 % 0.1 1 0.4 % 0.3 3PO4
3! 0.2 % 0.2 1 0.1 % 0.1 0 0.1 % 0.2 1
ng m!3 & ng m!3 & ng m!3 &
Ti 46.5 % 30.1 1.4 17.8 % 29.9 0.9 28.7 % 25.0 2.1V 5.3 % 4.2 0.2 3.4 % 3.2 0.2 1.9 % 1.5 0.1Cr 2.3 % 2.0 0.1 1.6 % 4.4 0.1 0.7 % 1.8 0.1Mn 9.6 % 5.2 0.3 4.0 % 2.0 0.2 5.6 % 3.7 0.4Co 0.3 % 0.2 <0.1 0.2 % 0.1 <0.1 0.1 % 0.3 <0.1Ni 3.7 % 2.8 0.1 2.3 % 1.7 0.1 1.4 % 2.0 0.1Cu 45.3 % 30.2 1.4 31.2 % 20.4 1.6 14.1 % 17.5 1.1Zn 47.4 % 42.9 1.4 37.3 % 49.5 1.9 10.1 % 40.4 0.8As 6.2 % 7.8 0.2 5.1 % 7.6 0.3 1.1 % 4.1 0.1Se 2.1 % 2.8 0.1 1.7 % 2.8 0.1 0.4 % 1.6 <0.1Rb 1.2 % 0.7 <0.1 0.4 % 0.4 <0.1 0.8 % 0.5 0.1Sr 6.2 % 2.5 0.2 1.3 % 0.7 0.1 4.9 % 1.3 0.4Mo 12.2 % 1.6 0.4 0.7 % 0.9 <0.1 11.5 % 1.9 0.9Cd 0.7 % 0.9 0.0 0.6 % 1.0 <0.1 0.1 % 0.6 <0.1Sn 2.6 % 2.0 0.1 1.5 % 1.3 0.1 1.1 % 0.8 0.1Sb 1.6 % 0.9 <0.1 0.8 % 0.6 <0.1 0.8 % 0.5 0.1Ba 31.9 % 48.4 1.0 19.7 % 36.7 1.0 12.2 % 57.2 0.9Pb 14.4 % 15.2 0.4 10.8 % 14.3 0.6 3.6 % 4.3 0.3Bi 0.9 % 1.1 <0.1 0.8 % 1.0 <0.1 0.1 % 0.5 <0.1
mg m!3 % mg m!3 % mg m!3 %
PM 32.7 % 13.0 19.3 % 10.6 13.4 % 8.0Pchemistry 26.9 % 5.5 82.1 15.2 % 3.3 78.5 11.7 % 2.3 87.3
SIC 6.4 % 1.2 19.6 4.5 % 1.0 23.4 1.9 % 0.8 14.2OM 5.8 % 3.6 17.8 5.8 % 3.6 30.0 0.0 % 1.9 0.2BC 0.8 % 0.4 2.5 0.6 % 0.4 3.1 0.2 % 0.2 1.5Mineral dust 10.8 % 1.4 32.9 3.3 % 0.4 17.0 7.5 % 1.0 55.9Marine 2.9 % 0.5 8.7 0.9 % 0.2 4.4 2.0 % 0.4 15.0
0
50000
100000
150000
0 2000 4000 6000 8000
PN
, cm
-3
BC, ng·m-3
6-9h
S1
Fig. 2. Hourly average values of the particle number (PN) versus black carbon (BC)concentrations between 06:00 and 09:00 h. S1 indicates the line of minimum slopewhich contains N-vs.-BC data.
R. Fernández-Camacho et al. / Atmospheric Environment 61 (2012) 507e517510
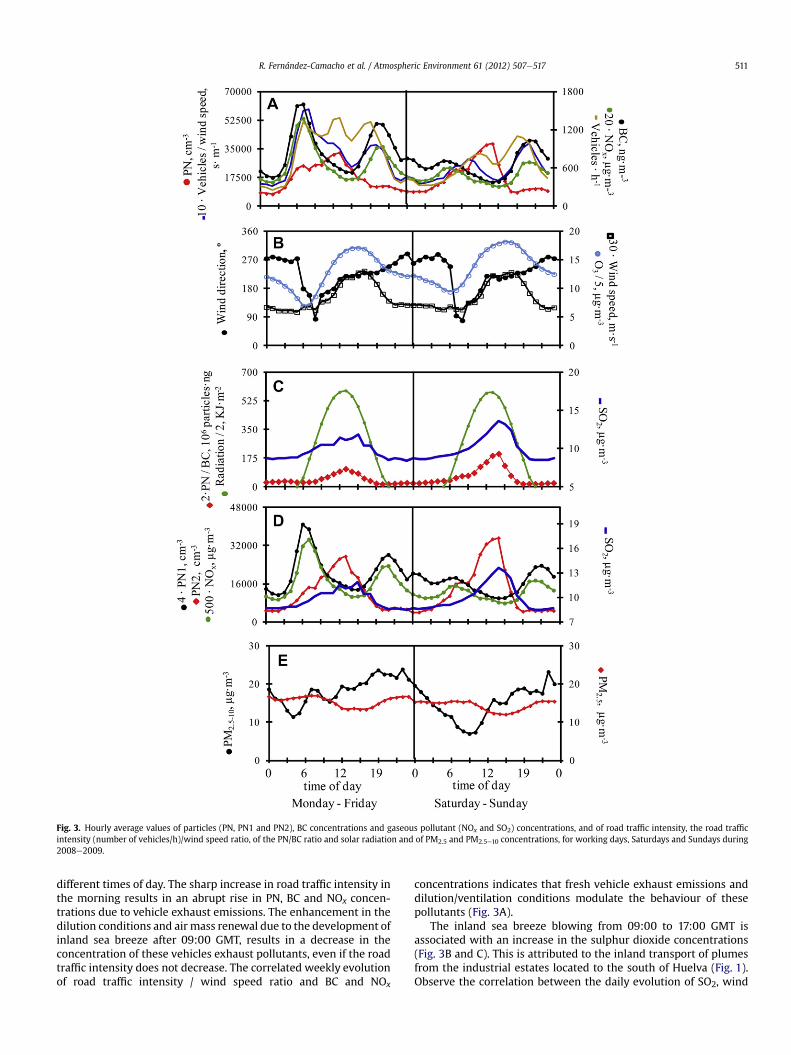
different times of day. The sharp increase in road traf!c intensity inthe morning results in an abrupt rise in PN, BC and NOx concen-trations due to vehicle exhaust emissions. The enhancement in thedilution conditions and air mass renewal due to the development ofinland sea breeze after 09:00 GMT, results in a decrease in theconcentration of these vehicles exhaust pollutants, even if the roadtraf!c intensity does not decrease. The correlated weekly evolutionof road traf!c intensity / wind speed ratio and BC and NOx
concentrations indicates that fresh vehicle exhaust emissions anddilution/ventilation conditions modulate the behaviour of thesepollutants (Fig. 3A).
The inland sea breeze blowing from 09:00 to 17:00 GMT isassociated with an increase in the sulphur dioxide concentrations(Fig. 3B and C). This is attributed to the inland transport of plumesfrom the industrial estates located to the south of Huelva (Fig. 1).Observe the correlation between the daily evolution of SO2, wind
Fig. 3. Hourly average values of particles (PN, PN1 and PN2), BC concentrations and gaseous pollutant (NOx and SO2) concentrations, and of road traf!c intensity, the road traf!cintensity (number of vehicles/h)/wind speed ratio, of the PN/BC ratio and solar radiation and of PM2.5 and PM2.5e10 concentrations, for working days, Saturdays and Sundays during2008e2009.
R. Fernández-Camacho et al. / Atmospheric Environment 61 (2012) 507e517 511
speed and solar radiation. The increase in the PN/BC ratio and inPN2 concentrations observed during the inland blowing period isattributed to ultra!ne particle formation in the SO2 plumes.Fernández-Camacho et al. (2010b) showed that there is a strongstatistical relationship between PN2 and SO2, and between PN1and NOx, in such a way that PN2 tends to show high values duringfumigations of industrial plumes, whereas PN1 shows high valueslinked to vehicle exhaust emissions. Stanier et al. (2004) andCheung et al. (2011) observed that high particle number concen-tration in industrial SO2 plumes was due to nucleation burstlinked to the sulphuric acid/sulphate particles. During the morningNOx maximum period, when ultra!ne particles were linked tovehicle exhaust emissions, PN is higher on average value than23,000 cm!3, and PN2 accounted for 53% of PN, whereas duringthe noon e afternoon SO2 maximum due to the impact of theindustrial plumes, PN is typically higher on average value than29,000 cm!3, and PN2 accounted for 70% of PN.
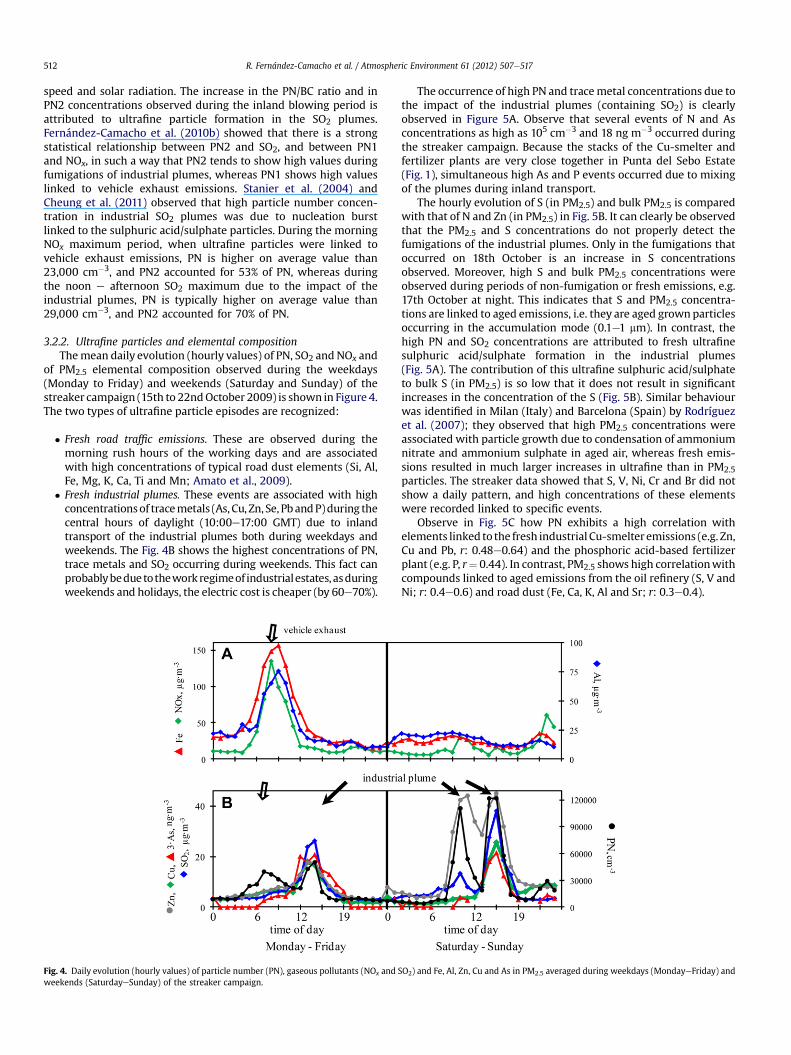
3.2.2. Ultra!ne particles and elemental compositionThemean daily evolution (hourly values) of PN, SO2 and NOx and
of PM2.5 elemental composition observed during the weekdays(Monday to Friday) and weekends (Saturday and Sunday) of thestreaker campaign (15th to 22ndOctober 2009) is shown in Figure 4.The two types of ultra!ne particle episodes are recognized:
' Fresh road traf!c emissions. These are observed during themorning rush hours of the working days and are associatedwith high concentrations of typical road dust elements (Si, Al,Fe, Mg, K, Ca, Ti and Mn; Amato et al., 2009).
' Fresh industrial plumes. These events are associated with highconcentrationsof tracemetals (As, Cu, Zn, Se, PbandP)during thecentral hours of daylight (10:00e17:00 GMT) due to inlandtransport of the industrial plumes both during weekdays andweekends. The Fig. 4B shows the highest concentrations of PN,trace metals and SO2 occurring during weekends. This fact canprobablybeduetotheworkregimeof industrialestates, asduringweekends and holidays, the electric cost is cheaper (by 60e70%).
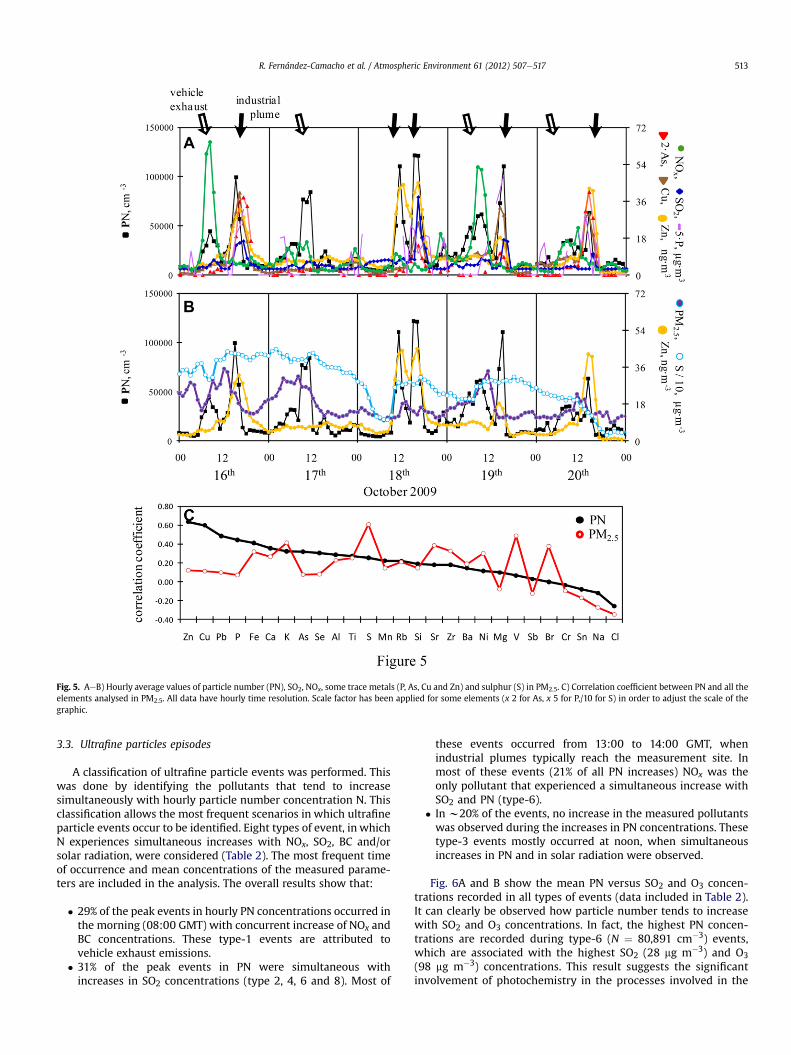
The occurrence of high PN and tracemetal concentrations due tothe impact of the industrial plumes (containing SO2) is clearlyobserved in Figure 5A. Observe that several events of N and Asconcentrations as high as 105 cm!3 and 18 ng m!3 occurred duringthe streaker campaign. Because the stacks of the Cu-smelter andfertilizer plants are very close together in Punta del Sebo Estate(Fig. 1), simultaneous high As and P events occurred due to mixingof the plumes during inland transport.
The hourly evolution of S (in PM2.5) and bulk PM2.5 is comparedwith that of N and Zn (in PM2.5) in Fig. 5B. It can clearly be observedthat the PM2.5 and S concentrations do not properly detect thefumigations of the industrial plumes. Only in the fumigations thatoccurred on 18th October is an increase in S concentrationsobserved. Moreover, high S and bulk PM2.5 concentrations wereobserved during periods of non-fumigation or fresh emissions, e.g.17th October at night. This indicates that S and PM2.5 concentra-tions are linked to aged emissions, i.e. they are aged grownparticlesoccurring in the accumulation mode (0.1e1 mm). In contrast, thehigh PN and SO2 concentrations are attributed to fresh ultra!nesulphuric acid/sulphate formation in the industrial plumes(Fig. 5A). The contribution of this ultra!ne sulphuric acid/sulphateto bulk S (in PM2.5) is so low that it does not result in signi!cantincreases in the concentration of the S (Fig. 5B). Similar behaviourwas identi!ed in Milan (Italy) and Barcelona (Spain) by Rodríguezet al. (2007); they observed that high PM2.5 concentrations wereassociated with particle growth due to condensation of ammoniumnitrate and ammonium sulphate in aged air, whereas fresh emis-sions resulted in much larger increases in ultra!ne than in PM2.5particles. The streaker data showed that S, V, Ni, Cr and Br did notshow a daily pattern, and high concentrations of these elementswere recorded linked to speci!c events.
Observe in Fig. 5C how PN exhibits a high correlation withelements linked to the fresh industrial Cu-smelter emissions (e.g. Zn,Cu and Pb, r: 0.48e0.64) and the phosphoric acid-based fertilizerplant (e.g. P, r& 0.44). In contrast, PM2.5 shows high correlationwithcompounds linked to aged emissions from the oil re!nery (S, V andNi; r: 0.4e0.6) and road dust (Fe, Ca, K, Al and Sr; r: 0.3e0.4).
Fig. 4. Daily evolution (hourly values) of particle number (PN), gaseous pollutants (NOx and SO2) and Fe, Al, Zn, Cu and As in PM2.5 averaged during weekdays (MondayeFriday) andweekends (SaturdayeSunday) of the streaker campaign.
R. Fernández-Camacho et al. / Atmospheric Environment 61 (2012) 507e517512
3.3. Ultra!ne particles episodes
A classi!cation of ultra!ne particle events was performed. Thiswas done by identifying the pollutants that tend to increasesimultaneously with hourly particle number concentration N. Thisclassi!cation allows the most frequent scenarios in which ultra!neparticle events occur to be identi!ed. Eight types of event, in whichN experiences simultaneous increases with NOx, SO2, BC and/orsolar radiation, were considered (Table 2). The most frequent timeof occurrence and mean concentrations of the measured parame-ters are included in the analysis. The overall results show that:
' 29% of the peak events in hourly PN concentrations occurred inthe morning (08:00 GMT) with concurrent increase of NOx andBC concentrations. These type-1 events are attributed tovehicle exhaust emissions.
' 31% of the peak events in PN were simultaneous withincreases in SO2 concentrations (type 2, 4, 6 and 8). Most of
these events occurred from 13:00 to 14:00 GMT, whenindustrial plumes typically reach the measurement site. Inmost of these events (21% of all PN increases) NOx was theonly pollutant that experienced a simultaneous increase withSO2 and PN (type-6).
' In w20% of the events, no increase in the measured pollutantswas observed during the increases in PN concentrations. Thesetype-3 events mostly occurred at noon, when simultaneousincreases in PN and in solar radiation were observed.
Fig. 6A and B show the mean PN versus SO2 and O3 concen-trations recorded in all types of events (data included in Table 2).It can clearly be observed how particle number tends to increasewith SO2 and O3 concentrations. In fact, the highest PN concen-trations are recorded during type-6 (N & 80,891 cm!3) events,which are associated with the highest SO2 (28 mg m!3) and O3(98 mg m!3) concentrations. This result suggests the signi!cantinvolvement of photochemistry in the processes involved in the
Fig. 5. AeB) Hourly average values of particle number (PN), SO2, NOx, some trace metals (P, As, Cu and Zn) and sulphur (S) in PM2.5. C) Correlation coef!cient between PN and all theelements analysed in PM2.5. All data have hourly time resolution. Scale factor has been applied for some elements (x 2 for As, x 5 for P,/10 for S) in order to adjust the scale of thegraphic.
R. Fernández-Camacho et al. / Atmospheric Environment 61 (2012) 507e517 513
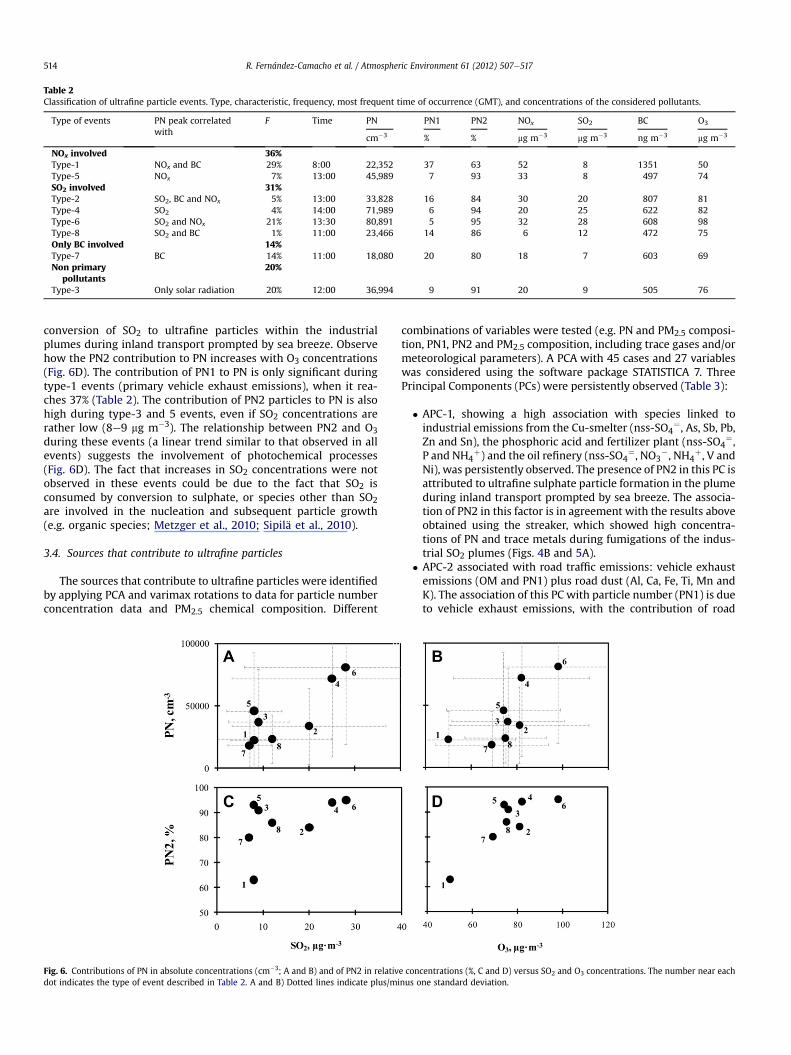
conversion of SO2 to ultra!ne particles within the industrialplumes during inland transport prompted by sea breeze. Observehow the PN2 contribution to PN increases with O3 concentrations(Fig. 6D). The contribution of PN1 to PN is only signi!cant duringtype-1 events (primary vehicle exhaust emissions), when it rea-ches 37% (Table 2). The contribution of PN2 particles to PN is alsohigh during type-3 and 5 events, even if SO2 concentrations arerather low (8e9 mg m!3). The relationship between PN2 and O3during these events (a linear trend similar to that observed in allevents) suggests the involvement of photochemical processes(Fig. 6D). The fact that increases in SO2 concentrations were notobserved in these events could be due to the fact that SO2 isconsumed by conversion to sulphate, or species other than SO2are involved in the nucleation and subsequent particle growth(e.g. organic species; Metzger et al., 2010; Sipilä et al., 2010).
3.4. Sources that contribute to ultra!ne particles
The sources that contribute to ultra!ne particles were identi!edby applying PCA and varimax rotations to data for particle numberconcentration data and PM2.5 chemical composition. Different
combinations of variables were tested (e.g. PN and PM2.5 composi-tion, PN1, PN2 and PM2.5 composition, including trace gases and/ormeteorological parameters). A PCA with 45 cases and 27 variableswas considered using the software package STATISTICA 7. ThreePrincipal Components (PCs) were persistently observed (Table 3):
' APC-1, showing a high association with species linked toindustrial emissions from the Cu-smelter (nss-SO4
&, As, Sb, Pb,Zn and Sn), the phosphoric acid and fertilizer plant (nss-SO4
&,P and NH4
$) and the oil re!nery (nss-SO4&, NO3
!, NH4$, V and
Ni), was persistently observed. The presence of PN2 in this PC isattributed to ultra!ne sulphate particle formation in the plumeduring inland transport prompted by sea breeze. The associa-tion of PN2 in this factor is in agreement with the results aboveobtained using the streaker, which showed high concentra-tions of PN and trace metals during fumigations of the indus-trial SO2 plumes (Figs. 4B and 5A).
' APC-2 associated with road traf!c emissions: vehicle exhaustemissions (OM and PN1) plus road dust (Al, Ca, Fe, Ti, Mn andK). The association of this PC with particle number (PN1) is dueto vehicle exhaust emissions, with the contribution of road
Table 2Classi!cation of ultra!ne particle events. Type, characteristic, frequency, most frequent time of occurrence (GMT), and concentrations of the considered pollutants.
Type of events PN peak correlatedwith
F Time PN PN1 PN2 NOx SO2 BC O3
cm!3 % % mg m!3 mg m!3 ng m!3 mg m!3
NOx involved 36%Type-1 NOx and BC 29% 8:00 22,352 37 63 52 8 1351 50Type-5 NOx 7% 13:00 45,989 7 93 33 8 497 74SO2 involved 31%Type-2 SO2, BC and NOx 5% 13:00 33,828 16 84 30 20 807 81Type-4 SO2 4% 14:00 71,989 6 94 20 25 622 82Type-6 SO2 and NOx 21% 13:30 80,891 5 95 32 28 608 98Type-8 SO2 and BC 1% 11:00 23,466 14 86 6 12 472 75Only BC involved 14%Type-7 BC 14% 11:00 18,080 20 80 18 7 603 69Non primary
pollutants20%
Type-3 Only solar radiation 20% 12:00 36,994 9 91 20 9 505 76
Fig. 6. Contributions of PN in absolute concentrations (cm!3; A and B) and of PN2 in relative concentrations (%, C and D) versus SO2 and O3 concentrations. The number near eachdot indicates the type of event described in Table 2. A and B) Dotted lines indicate plus/minus one standard deviation.
R. Fernández-Camacho et al. / Atmospheric Environment 61 (2012) 507e517514

dust considered being almost negligible (road dust is mostlycoarse, with a high contribution tomass, but a low contributionto number concentrations). The association of road dust in thisPC is attributed to the simultaneous (correlated) increases inroad dust and vehicle exhaust components during the morningrush hours (e.g. Fig. 4A). The presence of PN1 in this PC is inagreement with the weekly cycles of NOx and PN1 particlesdescribed above, which exhibited high values during working-day rush hours (Fig. 3).
' APC-3 showing high factor loading for typical sea salt compo-nents (Cl,NaandMg).Asexpected,neitherof theparticlenumbercomponents, PN1 or PN2, was associated with this factor.
Only two sources contributed signi!cantly to the particlenumber PN: road traf!c accounted for 50 % 9%, whereas industrialemissions accounted for 44 % 7% of PN (Fig. 7). The contribution ofsea salt was negligible (<1%), whereas the undetermined fraction(the difference between measured PN and the sum of the identi!edsources) accounted for 4% (Fig. 7). The contribution of these two
sources to ultra!ne particle concentration in ambient air is ofa comparable magnitude: the daily mean contribution of each ofthese sources to the particle number concentration exhibits valueswithin the range 10,000e30,000 cm!3 (Fig. 8). Observe howindustrial emissions can frequently contribute 20,000e30,000 cm!3
to the particle number and can result in As concentrations withinthe range 10e25 ng m!3 (Fig. 8B). Fig. 9 shows the daily mean
Table 3Factor loading of the Principal Components Analysis (followed by a varimax rota-tion) obtained using daily data of PM2.5 chemical composition and of PN1 and PN2particles.
PC-1 PC-2 PC-3
Industrial Road traf!c Sea salt
OM 0.37 0.57 !0.10PN1 0.52 0.59 !0.10PN2 0.57 0.26 !0.06nss-SO4
2! 0.84 !0.02 !0.14NO3
! 0.51 0.26 !0.14NH4
$ 0.87 0.05 !0.29Na !0.08 !0.06 0.86Cl! 0.15 !0.03 0.81Mg !0.13 0.33 0.83Al 0.13 0.76 !0.21Ca !0.07 0.89 0.14Fe 0.14 0.95 0.05Ti 0.14 0.46 0.25Mn 0.26 0.83 0.12K 0.29 0.71 0.13P 0.67 0.10 0.10As 0.83 0.26 0.16Pb 0.86 0.21 0.28Cd 0.88 0.18 0.32V 0.82 0.25 !0.09Ni 0.74 0.29 0.02Zn 0.61 0.11 0.31Cu 0.44 0.13 !0.05Bi 0.81 0.07 0.39Mo 0.53 !0.01 0.21Sn 0.71 0.44 0.20Sb 0.41 0.30 !0.29% Var 39.20 12.00 11.70
Factor loadings with absolute values > 0.5 are in bold.
Fig. 7. Mean daily contribution to PN (cm!3 and %) of the different factors identi!ed bythe PCA analysis.
Fig. 8. Daily averaged values of BC, As and of the particle number PN linked to vehicleexhaust and industrial emissions.
Fig. 9. A) Daily averaged values of PN classi!ed from the highest to the lowestconcentration (100th to 1st percentile) highlighting the contribution of the industrial,vehicle exhaust and undetermined fraction contributions. The associated concentra-tions of As, Cd, P, Pb, Al, Fe and BC are plotted in B and C.
R. Fernández-Camacho et al. / Atmospheric Environment 61 (2012) 507e517 515
averaged values of the particle number PN, classi!ed from thehighest to the lowest concentration (100th to 1st percentile), andthe contribution of the identi!ed sources. Observe how PN values>25,500 cm!3 (70th P) aremainly induced by industrial emissions,whereas for PN values <14,700 cm!3 (50th P) the vehicle exhaustcontribution is greater:
' For daily mean levels of PN within the range 50,000e25,500 cm!3 (100the70th) industrial and vehicle exhaustemissions accounted for 49 and 30%, respectively.
' For daily PN values within the range 14,700e5000 cm!3
(50the1st), vehicle emissions accounted for 60% of PN, withonly 30% of PN being linked to industrial emissions.
These results suggest that high PN concentrations, about25,000 cm!3, are mostly due to industrial emissions. Observe thesharp increase in the concentrations of As, Cd, Pb and P (linked tothe Cu-smelter and fertilizer production plants) when PN concen-trations higher than the 70th P are recorded (Fig. 9B). In contrast,compounds linked to vehicle exhaust and road dust emissionsincrease progressively from low to high PN events (Fig. 9C).
The potential contribution of new particle formation in ambientair linked to photochemical processes, typically occurring with lowconcentrations of primary pollutants (e.g. NOx and SO2; Rodríguez
et al., 2009), was not identi!ed in our PCA, with this being attrib-uted to the fact that any chemical tracer of such a process wasanalysed. The features of the type-3 events we observed in the timeseries analysis suggest that these events occur in our study area. Infact, these events could account for the unexplained variance in thePCA (w37%) and for the unaccounted-for fraction in the sourcecontribution (4%; Fig. 7). Pey et al. (2009) identi!ed such photo-chemically induced new particle formation events in Barcelona,and concluded that they accounted for 3% of the number of parti-cles >10 nm and for 23% of 10e20 nm particles.
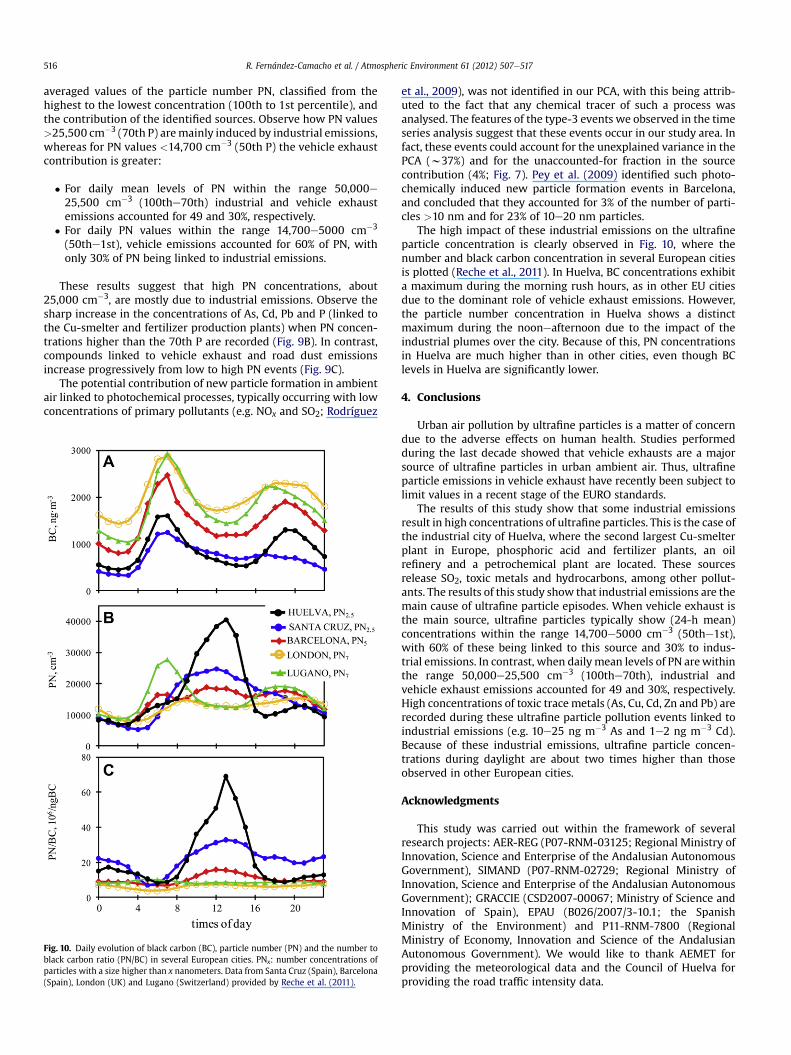
The high impact of these industrial emissions on the ultra!neparticle concentration is clearly observed in Fig. 10, where thenumber and black carbon concentration in several European citiesis plotted (Reche et al., 2011). In Huelva, BC concentrations exhibita maximum during the morning rush hours, as in other EU citiesdue to the dominant role of vehicle exhaust emissions. However,the particle number concentration in Huelva shows a distinctmaximum during the nooneafternoon due to the impact of theindustrial plumes over the city. Because of this, PN concentrationsin Huelva are much higher than in other cities, even though BClevels in Huelva are signi!cantly lower.
4. Conclusions
Urban air pollution by ultra!ne particles is a matter of concerndue to the adverse effects on human health. Studies performedduring the last decade showed that vehicle exhausts are a majorsource of ultra!ne particles in urban ambient air. Thus, ultra!neparticle emissions in vehicle exhaust have recently been subject tolimit values in a recent stage of the EURO standards.
The results of this study show that some industrial emissionsresult in high concentrations of ultra!ne particles. This is the case ofthe industrial city of Huelva, where the second largest Cu-smelterplant in Europe, phosphoric acid and fertilizer plants, an oilre!nery and a petrochemical plant are located. These sourcesrelease SO2, toxic metals and hydrocarbons, among other pollut-ants. The results of this study show that industrial emissions are themain cause of ultra!ne particle episodes. When vehicle exhaust isthe main source, ultra!ne particles typically show (24-h mean)concentrations within the range 14,700e5000 cm!3 (50the1st),with 60% of these being linked to this source and 30% to indus-trial emissions. In contrast, when dailymean levels of PN arewithinthe range 50,000e25,500 cm!3 (100the70th), industrial andvehicle exhaust emissions accounted for 49 and 30%, respectively.High concentrations of toxic trace metals (As, Cu, Cd, Zn and Pb) arerecorded during these ultra!ne particle pollution events linked toindustrial emissions (e.g. 10e25 ng m!3 As and 1e2 ng m!3 Cd).Because of these industrial emissions, ultra!ne particle concen-trations during daylight are about two times higher than thoseobserved in other European cities.
Acknowledgments
This study was carried out within the framework of severalresearch projects: AER-REG (P07-RNM-03125; Regional Ministry ofInnovation, Science and Enterprise of the Andalusian AutonomousGovernment), SIMAND (P07-RNM-02729; Regional Ministry ofInnovation, Science and Enterprise of the Andalusian AutonomousGovernment); GRACCIE (CSD2007-00067; Ministry of Science andInnovation of Spain), EPAU (B026/2007/3-10.1; the SpanishMinistry of the Environment) and P11-RNM-7800 (RegionalMinistry of Economy, Innovation and Science of the AndalusianAutonomous Government). We would like to thank AEMET forproviding the meteorological data and the Council of Huelva forproviding the road traf!c intensity data.
Fig. 10. Daily evolution of black carbon (BC), particle number (PN) and the number toblack carbon ratio (PN/BC) in several European cities. PNx: number concentrations ofparticles with a size higher than x nanometers. Data from Santa Cruz (Spain), Barcelona(Spain), London (UK) and Lugano (Switzerland) provided by Reche et al. (2011).
R. Fernández-Camacho et al. / Atmospheric Environment 61 (2012) 507e517516
References
Amato, F., Pandol!, M., Escrig, A., Querol, X., Alastuey, A., Pey, J., Perez, N.,Hopke, P.K., 2009. Quantifying road dust resuspension in urban environment byMultilinear Engine: a comparison with PMF2. Atmospheric Environment 43,2770e2780.
Araujo, J.A., Nel, A.E., 2009. Particulate matter and atherosclerosis: role of particlesize, composition and oxidative stress. Particle and Fibre Toxicology 6, 24.http://dx.doi.org/10.1186/1743-8977-6-24.
Birch, M.E., Cary, R.A., 1996. Elemental carbon-based method for monitoringoccupational exposures to particulate diesel exhaust. Aerosol Science andTechnology 25, 221e241.
Casati, R., Scheer, V., Vogt, R., Benter, T., 2007. Measurement of nucleation and sootmode particle emission from a diesel passenger car in real world and laboratoryin situ dilution. Atmospheric Environment 41, 2125e2135.
Castell, N., Mantilla, E., Salvador, R., Stein, A.F., Millán, M., 2010. Photochemicalmodel evaluation of the surface ozone impact of a power plant in a heavilyindustrialized area of sourthwestern Spain. Journal of EnvironmentalManagement 91, 662e676.
Cheung, K., Daher, N., Kam, W., Shafer, M.M., Ning, Z., Schauer, J.J., Sioutas, C., 2011.Spatial and temporal variation of chemical composition and mass closure ofambient coarse particulate matter (PM10e2.5) in the Los Angeles area. Atmo-spheric Environment 45, 2651e2662.
Chiari, M., Del Carmine, P., Garcia Orellana, I., Lucarelli, F., Nava, S., Paperetti, L.,2006. Hourly elemental composition and source identi!cation of !ne andcoarse PM10 in an Italian urban area stressed by many industrial activities.Nuclear Instruments & Methods in Physics Research Section B-Beam Interac-tions with Materials and Atoms 249, 584e587.
D’Alessandro, A., Lucarelli, F., Mandò, P.A., Marcazzan, G., Nava, S., Prati, P., Valli, G.,Vecchi, R., Zucchiatti, A., 2003. Hourly elemental composition and sourcesidenti!cation of !ne and coarse PM10 particulate matter in four Italian towns.Journal of Aerosol Science 34 (2), 243e259.
De la Rosa, J.D., Sánchez de la Campa, A.M., Alastuey, A., Querol, X.,González-Castanedo, Y., Fernández-Camacho, R., Stein, A.F., 2010. Using PM10geochemical maps for de!ning the origin of atmospheric pollution in Andalusia(Southern Spain). Atmospheric Environment 44, 4595e4605.
EC Working group on particulate matter, January 2002. REPORT e Guidance toMember States on PM10 Monitoring and Intercomparisons with the ReferenceMethod.
EU, 2008a. Commission Regulation (EC) No 692/2008. Of!cial Journal of the Euro-pean Union 136.
EU, 2004. 2004/107/CE. Council Directive Relating to Arsenic, Cadmium, Mercury,Nickel and Polycyclic Aromatic Hydrocarbons in Ambient Air. The Council of theEuropean Union.
EU, 2008b. 2008/50/EC Council Directive on ambient air quality and cleaner air forEurope. Of!cial Journal L 152, 0001e0044.
Fernández-Camacho, R., de la Rosa, J., Sánchez de la Campa, A.M., González-Castanedo, Y., Alastuey, A., Querol, X., Rodríguez, S., 2010a. Geochemical char-acterization of Cu-smelter emission plumes with impact in an urban area of SWSpain. Atmospheric Research 96, 590e601.
Fernández-Camacho, R., Rodríguez, S., de la Rosa, J., Sánchez de la Campa, A.M.,Viana, M., Alastuey, A., Querol, X., 2010b. Ultra!ne particle formation in theinland sea breeze air"ow in Southwest Europe. Atmospheric Chemistry andPhysics 10, 9615e9630.
Kittelson, D.B., 1998. Engines and nanoparticles: a review. Journal of Aerosol Science29, 575e588.
Kleeman, M.J., Riddle, S.G., Robert, M.A., Jakober, C.A., Fine, P.M., Hays, M.D.,Schauer, J.J., Hannigan, M.P., 2009. Source apportionment of !ne (PM1.8) andultra!ne (PM0.1) airborne particulate matter during a severe winter pollutionepisode. Environmental Science and Technology 43 (2), 272e279.
Kulmala, M., Vehkamäki, H., Petäjä, T., Dal Maso, M., Lauri, A., Kerminen, V.-M.,Birmili, W., McMurry, P.H., 2004. Formation and growth rates of ultra!neatmospheric particles: a review of observations. Journal of Aerosol Science 35(2), 143e176.
Metzger, A., Verheggen, B., Dommen, J., Duplissy, J., Prévôt, A.S.H., Weingartner, E.,Riipinen, I., Kulmala, M., Spracklen, D.V., Carslaw, K.S., Baltensperger, U., 2010.Evidence for the role of organics in aerosol particle formation under atmo-spheric conditions. Proccedings of the National Academy of Science of theUnited States of America 107, 6646e6651.
Morawska, L., Zhang, J., 2002. Combustion sources of particles. 1. Health relevanceand source signatures. Chemosphere 49, 1045e1058.
Pey, J., Querol, X., Alastuey, A., Rodríguez, S., Putaud, J.P., Van Dingenen, R., 2009.Source apportionment of urban !ne and ultra-!ne particle number concen-tration in a Western Mediterranean city. Atmospheric Environment 43, 4407e4415.
Putaud, J.-P., Raes, F., Van Dingenen, R., Brüggemann, E., Facchini, M.-C., Decesari, S.,Fuzzi, S., Gehrig, R., Hüglin, C., Laj, P., Lorbeer, G., Maenhaut, W., Mialopoulos, N.,
Müller, K., Querol, X., Rodríguez, S., Schneider, J., Spindler, G., ten Brink, H.,Tørseth, K., Wiedensohler, A., 2004. A European aerosol phenomenologyd2:chemical characteristics of particulate matter at kerbside, urban, rural andbackground sites in Europe. Atmospheric Environment 38, 2579e2595.
Putaud, J.-P., Van Dingenen, R., Alastuey, A., Bauer, H., Birmili, W., Cyrys, J., Flentje, H.,Fuzzi, S., Gehrig, R., Hansson, H.C., Harrison, R.M., Herrmann, H., Hitzenberger, R.,Hüglin, C., Jones, A.M., Kasper-Giebl, A., Kiss, G., Kousa, A., Kuhlbusch, T.A.J.,Löschau,G.,Maenhaut,W.,Molnar,A.,Moreno, T., Pekkanen, J., Perrino, C., Pitz,M.,Puxbaum,H.,Querol,X., Rodriguez, S., Salma, I., Schwarz, J., Smolik, J., Schneider, J.,Spindler, G., Ten Brink, H., Tursic, J., Viana, M., Wiedensohler, A., Raes, F., 2010.A European aerosol phenomenology-3: physical and chemical characteristics ofparticulate matter from 60 rural, urban, and kerbside sites across Europe.Atmospheric Environment 44, 1308e1320.
Puustinen, A., Hämeri, K., Pekkanen, J., Kulmala, M., De Hartog, J., Meliefste, K.,Ten Brink, H., Kos, G., Katsouyanni, K., Karakatsani, A., Kotronarou, A.,Kavouras, I., Meddings, C., Thomas, S., Harrison, R., Ayres, J.G., Van der Zee, S.,Hoek, G., 2007. Spatial variation of particle number and mass over four Euro-pean cities. Atmospheric Environment 41, 6622e6636.
Querol, X., Alastuey, A., Rodríguez, S., Plana, F., Ruiz, C.R., Cots, N., Massagué, G.,Puig, O., 2001. PM10 and PM2.5 source apportionment in the BarcelonaMetropolitan area, Catalonia, Spain. Atmospheric Environment 35, 6407e6419.
Querol, X., Alastuey, A., Rodríguez, S., Viana, M.M., Menéndez, M., Gil Ibarguichi, J.I.,2004a. Speciation and origin of PM10 and PM2.5 in Spain. Journal of AerosolScience 35, 1151e1172.
Querol, X., Alastuey, A., Rodríguez, S., Viana, M.M., Artiñano, B., Salvador, P.,Mantilla, E., García do Santos, S., Fernández Patier, R., de la Rosa, J., Sánchez de laCampa, A., Menéndez, M., Gil Ibarguichi, J.I., 2004b. Levels of particulate matterin rural, urban and industrial sites in Spain. Science of the Total Environment334-335, 359e376.
Querol, X., Alastuey, A., Moreno, T., Viana, M.M., Castillo, S., Pey, J., Rodríguez, S.,Artiñano, B., Salvador, P., Sánchez, M., García Dos Santos, S., HerceGarraleta, M.D., Fernández-Partier, R., Moreno-Grau, S., Negral, L.,Minguillón, M.C., Monfort, E., Sanz, M.J., Palomo-Marín, R., Pinilla-Gil, E.,Cuevas, E., de la Rosa, J., Sánchez de la Campa, A.M., 2008. Spatial and temporalvariations in airborne particulate matter (PM10 and PM2.5) across Spain 1999e2005. Atmospheric Environment 42, 3964e3979.
Reche, C., Querol, X., Alastuey, A., Viana, M., Pey, J., Moreno, T., Rodríguez, S.,González, Y., Fernández-Camacho, R., Sánchez de la Campa, A.M., de la Rosa, J.,Dall’Osto, M., Prévôt, A.S.H., Hueglin, C., Harrison, R.M., Quincey, P., 2011. Newconsiderations for PM, Black Carbon and particle number concentration for airquality monitoring across different European cities. Atmospheric ChemistryPhysics 11, 6207e6227.
Rodríguez, S., Cuevas, E., 2007. The contributions of ‘minimum primary emissions’and ‘new particle formation enhancements’ to the particle number concen-tration in urban air. Journal of Aerosol Science 38, 1207e1219.
Rodríguez, S., Van Dingenen, R., Putaud, J.P., Dell’Acqua, A., Pey, J., Querol, X.,Alastuey, A., Chenery, S., Kin-Fai, H., Harrison, R.M., Tardivo, R., Scarnato, B.,Gianelle, V., 2007. A study on the relationship between mass concentrations,chemistry and number size distribution of urban !ne aerosols in Milan, Bar-celona & London. Atmospheric Chemistry Physics 7, 2217e2232.
Rodríguez, S., González, Y., Cuevas, E., Ramos, R., Romero, M., Abreu-Afonso, J.,Redondas, A., 2009. Atmospheric nanoparticle observations in the low freetroposphere during upward orographic "ows at Izaña Mountain Observatory.Atmospheric Chemistry and Physics 9, 6319e6335.
Rodríguez, S., Alastuey, A., Alonso-Pérez, S., Querol, X., Cuevas, E., Abreu-Afonso, J.,Viana, M., Pandol!, M., de la Rosa, J., 2011. Transport of desert dust mixed withNorth African industrial pollutants in the subtropical Saharan Air Layer.Atmospheric Chemistry and Physics 11, 6663e6685.
Sánchez de la Campa, A.M., de la Rosa, J., González-Castanedo, Y.,Fernández-Camacho, R., Alastuey, A., Querol, X., Stein, A.F., Ramos, J.L.,Rodríguez, S., García Orellana, I., Nava, S., 2011. Levels and chemical compositionof PM in a city near a large Cu-smelter in Spain. Journal of EnvironmentalMonitoring 13, 1276.
Sipilä, M., Berndt, T., Petäjä, T., Brus, D., Vanhanen, J., Stratmann, F., Patokoski, J.,Mauldin, R.L., Hyvärinen, A.P., Lihavainen, H., Kulmala, M., 2010. The role ofsulphuric acid in atmospheric nucleation. Science 327, 1234e1246.
Stanier, C.O., Khlystov, A.Y., nd Pandis, S.N., 2004. Ambient aerosol size distributionsand number concentrations measured during the Pittsburgh Air Quality Study(PAQS). Atmospheric Environment 38, 3275e3284.
Thurston, G.D., Spengler, J.D., 1985. A quantitative assessment of source contribu-tion to inhalable particulate matter pollution in Metropolitan Boston. Atmo-spheric Environment 19, 9e25.
Turpin, B.J., Lim, H.J., 2001. Species contribution to PM2.5 mass concentrations:revisiting common assumptions for estimating organic mass. Aerosol Scienceand Technology 35, 602e610.
WHO, 2005. Air Quality Guidelines Global Update. http://www.euro.who.int/Document/E90038.pdf.
R. Fernández-Camacho et al. / Atmospheric Environment 61 (2012) 507e517 517