An Exploration of Effective Messaging for Shark Conservation
Upload
khangminh22Category
view
0download
0
lable at ScienceDirect
Journal of Pharmaceutical Sciences 109 (2020) 785-796
Contents lists avai
Journal of Pharmaceutical Sciences
journal homepage: www.jpharmsci .org
Pharmaceutical Biotechnology
An Experimental-Based Approach to Construct the Process DesignSpace of a Freeze-Drying Process: An Effective Tool to Design anOptimum and Robust Freeze-Drying Process for Pharmaceuticals
Getachew Assegehegn 1, *, Edmundo Brito-de la Fuente 1, Jos�e M. Franco 2,Críspulo Gallegos 1
1 Fresenius-Kabi Deutschland GmbH, Product and Process Engineering Center, Global Manufacturing Pharmaceuticals, Bad Homburg, Germany2 Departamento de Ingeniería Química, Pro2TecS-Chemical Product and Process Technology Research Centre, Complex Fluid Engineering Laboratory,Universidad de Huelva, Huelva, Spain
a r t i c l e i n f o
Article history:Received 28 May 2019Revised 2 July 2019Accepted 2 July 2019Available online 6 July 2019
Keywords:freeze-dryinglyophilizationquality-by-designformulationprocessingmathematical models(s)
* Correspondence to: Getachew Assegehegn (TelephE-mail address: getachew.assegehegn@fresenius-k
https://doi.org/10.1016/j.xphs.2019.07.0010022-3549/© 2020 American Pharmacists Association
a b s t r a c t
The application of quality by design (QbD) is becoming an integral part of the formulation and processdevelopment for pharmaceutical products. An essential feature of the QbD philosophy is the designspace. In this sense, a new approach to construct a process design space (PDS) for the primary dryingsection of a freeze-drying process is addressed in this paper. An effective customized design of experi-ments (DoE) is developed for freeze-drying experiments. The results obtained from the DoE are thenused to construct the product-based PDS. The proposed product-based PDS construction approach hasseveral advantages, including (1) eliminating assumptions on the heat transfer coefficient and driedproduct resistance, as it is constructed from experimental results specifically obtained from a givenformulation, yielding more realistic and reliable results and (2) PDS construction based on a narrowrange of product temperatures and considering the variations in product temperature and sublimationrate of vials across a shelf. This guarantees the effectiveness and robustness of the process and facilitatesthe process scale-up and transfer. The PDS developed herein was experimentally verified. The PDSpredicted parameters were in excellent agreement with the experimentally obtained parameters.
© 2020 American Pharmacists Association®. Published by Elsevier Inc. All rights reserved.
Introduction
Freeze-drying or lyophilization is a drying unit operation that isfrequently used in pharmaceutical and biopharmaceutical in-dustries to convert labile liquid formulations into a solid state withthe aim of improving their long-term storage stability.1,2 Despitebeing a method of high relevance for these industries, freeze-drying is an energy intensive, time consuming, and economicallyexpensive process.3,4 Therefore, the rational design and optimiza-tion of the freeze-drying process is of paramount importance. It isunderstandable that a sound knowledge of a formulation and itscritical properties are essential for the efficient and rational designof a freeze-drying process.5-9 Formulation critical propertiesinclude the freezing behavior of the formulation (phase separation,protein denaturation, and pH shift), glass transition temperature ofthe maximally freeze-concentrated solution (Tg’), collapse tem-perature of the amorphous formulation (Tc), eutectic temperature
one: þ4961726087381).abi.com (G. Assegehegn).
®. Published by Elsevier Inc. All ri
of the crystalline formulation (Teu), stability of the active in-gredients during preparation, and properties of the excipients.Knowledge of such formulation properties and the freeze-dryingprocess itself significantly eases the design of a robust and opti-mum process. Whereas an optimum process minimizes the processtime, a robust process addresses minor process deviations andmaintains the predefined quality target product profiles (QTPP).
The primary drying step of the freeze-drying process is, typi-cally, the most critical and longest processing step. Consequently,the majority of the optimization efforts are performed in this step.As reviewed in previous papers,10,11 the freezing step has a signif-icant effect on the primary drying rate; this is attributed to themorphology, and the number and size of ice crystals formed duringthe freezing step. The ice crystals leave a porous structure of driedproduct upon sublimation, which determines the permeability andresistance to water vapor flow through the dried product. Thelarger the ice crystals formed during the freezing, the larger thepore radius of the porous dried product and, hence, the lower theresistance to water vapor flow. This facilitates the drying rateduring the sublimation step of the freeze-drying process. In gen-eral, the influence of the freezing step on the different freeze-
ghts reserved.

Nomenclature
CQAs Critical quality attributesDoE Design of experimentsDS Design spaceKv Vial heat transfer coefficientMF1 Model formulation 1 (10% (w/w) trehalose solution)MF2 Model formulation 2 (20% (w/w) sucrose solution)_m Overall mass transfer rate (sublimation rate) from a
vialPc Chamber pressurePDS Process design spacePi Vapor pressure of ice
QbD Quality by designQTPP Quality target product profilesr Pore radius of a dried productRp Resistance to mass transfer of the dried productTc Collapse temperature of an amorphous formulationtd Drying time of primary dryingTeu Eutectic temperatureTg’ Glass transition temperature of the maximally freeze-
concentrated solutionTp Product temperatureTPave Average product temperature during primary dryingTpt Target product temperatureTs Shelf temperature
Table 1Differences in Overall Vial Heat Transfer Coefficients (Kv) of a Drug Formulation andWater for Injection
Pc (mbar) Ts (�C) Overall Vial Heat Transfer Coefficient, Kv*104 (cal/s.cm2.K)
Drug Formulation Water for Injection Difference (%)
0.05 �10.0 1.895 1.934 2.06�17.0 1.952 1.871 4.15�20.0 2.127 1.869 12.1
0.10 �10.0 3.044 3.044 0.00�15.0 2.847 3.093 8.64�20.0 3.131 3.165 1.09�24.0 2.764 3.182 15.1
0.15 �15.0 4.169 4.624 10.9�18.0 4.508 4.229 6.19�25.0 3.485 4.144 18.9
Note that the experiments were performed using identical vials and stoppers. Au-thors’ own experimental results. Pc is chamber pressure and Ts is shelf temperature.
G. Assegehegn et al. / Journal of Pharmaceutical Sciences 109 (2020) 785-796786
drying parameters can be summarized as shown in Equation 1. Amore detailed analysis of Equation 1 is given in reference.11
r ¼ f ðice crystal sizeÞ
Rp ¼ f�
1r
�
Tp ¼ f�Rp;
1r
�
Pi ¼ f�Tp; Rp
�
_m ¼ f�1Rp
; Tp
�
�����������������������
Provided Ts and Pc are held constant (1)
where, r(cm) is the pore radius of the dried product; Rp(mbar,s/g)is the resistance to mass transfer of the dried product; Tp(�C) is theproduct temperature, Pi(mbar) is the vapor pressure of ice; Ts(�C) isthe shelf temperature; Pc(mbar) is the chamber pressure; and_mðg=sÞ is the overall mass transfer rate from a vial.
During the primary drying step, the chamber pressure, Pc, isreduced to trigger the sublimation of the ice crystals and, simul-taneously, the shelf temperature, Ts, is increased to provide energyto the sublimation process. The endothermic sublimation of ice andthe exothermic heat input processes are occurring in “close equi-librium.” Thus, the change in product temperature during the pri-mary drying is insignificant, provided that the shelf temperatureand chamber pressure are held constant. One major factor for aslight change in product temperature during the primary dryingcould be the increase in dried product resistance caused by an in-crease in dried layer thickness.
In a freeze-drying process, the product temperature is indirectlycontrolled through the manipulation of the shelf temperature andchamber pressure. In the majority of cases, the manipulation of theshelf temperature and chamber pressure is realized through a trialand error approach, which leads to unnecessary long experimentalsetups. Further, the resulting freeze-drying process is neither robustnor efficient. In an attempt to minimize the trial and error experi-ments, researchers have developed mathematical models for thedetermination of the optimum processing conditions based on thegoverning heat and mass transfer equations.4,12-28 In these mathe-matical models, 2 input parameters, namely the overall vial heattransfer coefficient and the resistance to mass transfer of the driedproduct, are experimentally determined. The overall vial heattransfer coefficient is typically determined fromawater sublimationtest, whereas the resistance to mass transfer of the dried product isdetermined using the drug formulation. The determination of these
parameters from a nondrug formulation and from a single experi-mental run could lead to a significant error during the optimizationof the process.22 The authors’ experimental results show up to 18%difference in the overall vial heat transfer coefficient determinedfrom water sublimation tests and from drug formulation sublima-tion tests (see Table 1). Further, determination of the dried productresistance from a single experimental run may not representdifferentprocessing conditions. Processing at aproduct temperatureclose to the Tc could introduce a microcollapse on the dried struc-ture, yielding a considerably reduced dried product resistancecompared with the dried products without microcollapse.
Following the roll out of the International Conference onHarmonization (ICH) Q8(R2), the application of quality by design(QbD) has become an integral part of the formulation and processdevelopment for pharmaceutical products.29 An essential feature ofthe QbD philosophy is the design space, which is defined, accordingto ICH Q8(R2), as a multidimensional combination and interactionof input variables and process parameters that have been demon-strated to provide the assurance of critical product quality.30 Giventhe high interest of the pharmaceutical industries in implementingthe QbD concept in their formulation and process developmentplatforms, there exists a requirement for a systematic, scientific,and result-based design space construction strategy.
To address this point for a freeze-drying process, this studypresents a new approach for the construction of a process designspace (PDS) using a customized design of experiments (DoE). A PDSis a space enclosed by critical input process parameters of a givenprocess, within which the output parameters and the criticalquality attributes (CQAs) of the product remain within the desiredlimit. A PDS ensures both process efficiency and product quality,
G. Assegehegn et al. / Journal of Pharmaceutical Sciences 109 (2020) 785-796 787
and, hence, its advantages and applications during the freeze-drying of pharmaceutical products are significant. Because freeze-drying is an energy intensive process, designing the most opti-mum freeze-drying process is certainly one of the highest prioritiesfor pharmaceutical industries. In this regard, a PDS provides anopportunity to define optimum process parameters while main-taining product quality. Further, a PDS significantly eases thefreeze-drying process scale-up and transfer and ensures consistentproduct quality during large-scale commercial manufacturing. APDS provides information on how possible process deviationsduring scale-up, transfer, or manufacturing influence the outputparameters and CQAs and offers an opportunity for an early andsystematic mitigation system for the case where the output pa-rameters and CQAs are outside the PDS. Possible process deviationsduring scale-up, transfer, or manufacturing could be caused bydifferences in freezing conditions at lab and manufacturing scaleand differences in equipment design. In such circumstances,equipment characterization is necessary to assess the differencesbetween equipment and to adjust the processing conditions.Adjustment of the processing conditions could be significantlyfacilitated using the PDS.
In a freeze-drying process, it is important to consider that a PDScontains the input parameters that provide the maximum possiblesublimation rate during the primary drying step. As can be deducedfrom Equation 1, the sublimation rate is dependent on several pa-rameters, namely, ice vapor pressure or product temperature,chamber pressure, and dried product resistance to mass transfer. Tomaximize the sublimation rate during primary drying, it is impor-tant to execute at the highest vapor pressure of ice (this correspondsto the highest product temperature) and at the lowest chamberpressure. However, the maximum product temperature duringprimary drying is limited by the Tc of the amorphous formulations orthe Teu of the crystalline formulations. Conversely, the minimumchamber pressure is limited by the capability of the freeze-dryingequipment.31-33 In this sense, a PDS offers a method to identify theproduct and equipment limitations and to select themost optimizedand robust process parameters for a given formulation.
Although profound prior scientific knowledge of both formula-tion andprocess is indispensable for building an effectiveDoE, it alsosignificantly assists in minimizing the number of experimentsnecessary to construct a PDS. Using an effective DoE, less than 20freeze-drying experiments can be performed to develop the PDS of apharmaceutical formulation. As mentioned earlier, the primarydrying is the most critical phase in terms of process economics andoverall product quality. Thus, the focus of this study is on the con-struction of the PDS for the primary drying phase of the freeze-drying process. Although the mathematical models provide an op-portunity to simulate several combinations of input process vari-ables during the PDS construction, their success is highly dependenton the accuracy of themodel input parameters and the assumptionsof the model equations. In this sense, the experimental-based PDSconstruction approach detailed in this study offers an alternativemethod for the construction of a freeze drying PDS. In addition,although the mathematical models may need fewer experimentalsetups than the experimental approach presented herein, the ad-vantages of the experimental approach over the mathematicalmodels are several folds. These include (1) the utilization of uniqueand easy procedures to construct a PDS using the data obtainedsolely from freeze-drying experiments of a given drug product. Thiseliminates the assumptions on heat transfer coefficient and driedproduct resistance, thus providing highly accurate results. For thisreason, the PDS developed in this study is termed a product-basedPDS; (2) unlike the current representation of a freeze-drying PDS,this study uses shelf temperature versus chamber pressure curveswith narrow ranges of product temperatures as contour lines. This
facilitates the selection of the most effective and optimized processparameters for a given formulation; and (3) the PDS presentedherein incorporates the variation in product temperatures andsublimation rates of vials at different locations of a shelf. This gua-rantees the robustness of the process and facilitates the processscale-up and transfer. Moreover, presenting a product-based PDSoffers more realistic and reliable results if there is an intention ofusing the PDS for regulatory purposes.
Finally, it is worth pointing out that Chang and Fischer reportedconstruction of a freeze-drying PDS based on experimentalapproach, aiming to explain the use of a single-step freeze dryingcycle for a crystalline formulation (i.e., use of high shelf tempera-ture [as high as 40�C] and low chamber pressure to avoid usingsecondary drying).34 Consequently, it is apparent that the approachfollowed by Chang and Fischer is based on a rather differentconcept.
Materials and Methods
Materials
Sucrose was purchased from VWR (Darmstadt, Germany), andtrehalose was purchased from Pfanstiehl, Inc. (Waukegan, IL). The 2raw materials were used without further treatment. Water for in-jection was obtained from Fresenius Kabi Deutschland GmbH(Friedberg, Germany). All vials used in this study were 10-mLtubing vials purchased from SCHOTT AG (Mainz, Germany). Thestoppers were Igloo single vented gray stoppers from West Phar-maceutical Services, Inc. (West Whiteland Township, PA).
Two model formulations were used for the development of thePDS. Model formulation 1 (MF1) was a 10% (w/w) trehalose solu-tion; model formulation 2 (MF2) was a 20% (w/w) sucrose solution.Water for injectionwas used to prepare all the solutions used in thisstudy. Aiming to remove particulate matters that could be intro-duced during preparation, the model formulations were filteredusing 0.22 mmpore-size filters (PALL Corporation, Port Washington,NY) prior to filling the vials.
Methods
Differential Scanning CalorimetryThe glass transition temperature of the frozen samples (Tg’) was
measured using a TA Instruments Q2000 series differential scan-ning calorimetry (DSC) with refrigerated cooling system (RCS) (TAInstruments, New Castle, DE). Sucrose and trehalose solutions wereprepared as described previously, and a sample of 10-15 mg wasweighed into aluminum sample pans, which were then hermeti-cally sealed. An empty, hermetically sealed, pan was used as areference. The RCS was set on continuous mode, and the nitrogensupply was set to 50 mL/min. The solution samples were firstequilibrated at 40�C for 2 min and then frozen to �60�C at a rate of20�C/min. The frozen samples were held at�60�C for 10min beforeheating to 40�C at a rate of 10�C/min. The Tg’ values were deter-mined using Universal Analysis software and were reported as themidpoint of the glass transition curve.35
Freeze-Drying MicroscopyThe collapse temperature (Tc) of the model formulations was
determined using a Lyostat 2 freeze-dryingmicroscopy (BiopharmaTechnology Ltd., Winchester, UK). Sucrose and trehalose solutionswere prepared as described previously, and a sample of 2 mL wasplaced on a quartz cover slip and covered using a glass cover slip. Toallow sublimation of the sample, a 70 mm thick metal spacer wasplaced between the quartz and glass cover slips. The solutionsamples were frozen to �40�C at a rate of 20�C/min and held for

Table 2Custom Designed Full-Factorial Design of Experiments for Model Formulation 1 andModel Formulation 2
ExperimentNumber
Primary Drying InputParameters
Primary DryingOutput Parameters
Pc (mbar) Ts (�C)
1 0.05 �5.0a � Product temperature offront edge and center vials
� Sublimation rate of frontedge and center vials
2 �10.03 �13.0b
4 �15.05 �20.06 0.08 �10.07 �15.08 �20.09 �25.010 0.10 �15.011 �17.012 �20.013 �25.014 0.15 �17.015 �20.016 �25.017 �30.018 0.20 �20.019 �25.020 �30.0
Pc is chamber pressure and Ts is shelf temperature.a Experiment only for model formulation 1.b Experiment only for model formulation 2.
G. Assegehegn et al. / Journal of Pharmaceutical Sciences 109 (2020) 785-796788
5min. After freezing, the vacuumwas reduced to approximately 0.1mbar and maintained at this condition until an approximately 2-3mm dry layer thickness was achieved. The samples were furtherheated at 5�C/min to a temperature marginally less than the Tg’obtained from DSC, and then the heating rate was decreased to0.5�C/min, aiming to observe a structural change at a higher tem-perature resolution. The samples were heated until completestructural damage was observed. Images of the samples werecaptured throughout the experiment, and the collapse temperature(Tc) was defined as the temperature where a clearly observablestructural change of the frozen solution was observed.
Freeze-Drying ExperimentAll freeze-drying experiments were performed using an HOF
laboratory freeze dryer with a total usable shelf area of 0.36 m2
(HOF Sonderanlagenbau GmbH, Lohra, Germany). The freeze dryerwas equipped with a Pirani gauge for chamber pressure control and3 type K thermocouples for the measurement of the product tem-perature. Freeze-drying experiments of both model formulationswere performed using 10-mL tubing vials. For each of the modelformulations, 176 vials (1 fully loaded shelf) were filled with 4 mLsolution and placed on 1 of the 4 shelves of the freeze dryer. Duringthe sublimation rate determination experiments, the fill volumewas selected to be higher than the design fill volume (3mL) to bringequivalence in dried product resistance and sublimation rate. Forexample, consider a sublimation experiment that was stopped afteran average 60% of a given (5 mL) fill volume was sublimed. This isequivalent to a complete sublimation of 3 mL fill volume and, thus,brings equivalence in dried layer thickness (i.e., dried layer resis-tance) and sublimation rate. The freeze dryer had an acrylicchamber door, and to reduce the effect of radiation, the door wascovered with a 4-mm thick polystyrene foam block and analuminum foil. Eight wireless thermologgers (Lives International,Timis, Romania) and the 3 type K thermocouples were used tomeasure product temperatures. Although the presence of temper-ature probes could impact the freezing and drying behavior of theprobed vials, such impact could be minimized by using thin tem-perature probes. Thus, both the type K thermocouples and wirelessthermologgers used in this study were less than 1 mm thick.Product temperatures using the wireless thermologgers weremeasured every 20 s. The freezing step was held constant for allfreeze-drying experiments as follows: 1�C/min down to �10�C and90 min holding time; further freezing to �40�C at 1�C/min and240min holding time. Conversely, the primary drying was changedaccording to the DoE, as indicated in Table 2. The shelf surfacetemperatures (Fig. 4) were measured using the wireless thermo-loggers in a fully loaded shelf. For this purpose, the thermologgerswere inserted into bottomless 10-mL vials, and they were arrangedto have a clear contact with the shelf surface.
Determination of Sublimation RateThe sublimation rate was determined gravimetrically. For this
purpose, 50 selected sample vials were weighed before and afterthe freeze-drying experiments. The sample vials were systemati-cally placed to represent different vial groups, which could havedifferent sublimation rates and product temperatures, within thevial array. Figure 1 displays the placement of the sample vials andthermocoupled vials for all the experiments performed in thisstudy. For example, in Figure 1, vials numbered 1-8 represent a vialgroup referred to as “front edge,” vials 9-17 represent “side edgeouter,” vials 18-26 represent “side edge inner,” vials 27-42 represent“center,” and vials 43-50 represent “rear edge.” Maximum, mini-mum, and average sublimation rates of each vial group werecalculated from the sublimation rates obtained from the numberedvials of the same group (cf. Fig. 1). A laboratory analytical balance
(Sartorius AG, G€ottingen, Germany) was used to weigh the samplevials. The sublimation process was terminated by backfilling theproduct chamber using dry nitrogen, and the vials were heated to20�C before the product chamber door was opened. This step wasincluded to prevent condensation from the surrounding moisturefrom forming on the cold stoppers and penetrating into theextremely hygroscopic dried product. The freeze dryer available didnot have an automatic stoppering mechanism. As a result, once theproduct chamber door was opened, the sample vials were taken outof the chamber, immediately fully stoppered and re-weighed.
It is well-known that dried product resistance and producttemperature increase when product dried layer thickness in-creases.19,22,36 Therefore, to include the maximum effect of thedried product resistance during the determination of the subli-mation rate, the sublimation experiments were stopped once thedried layer of the front edge vials was close to the vial bottom. Thiswas performed by visually observing the dried layer of the frontedge vials. At the end of the sublimation experiments, up to 70 wt%of the initial water content of the edge vials was removed, whereas,for center vials, up to 50 wt% of the initial water content wasremoved. Further, this procedure allows determination of consis-tent loss of water during the different sublimation experiments.The exact drying time for the calculation of the sublimation ratewas obtained from the product temperature profile of the wirelessthermologgers. Primary drying time, by definition, starts when theshelf temperature attains the desired shelf set point temperaturefor primary drying. Thus, regardless of the product temperature,the starting time for the calculation of the sublimation rates wasdefined as the time at which the shelf temperature attained thedesired set point temperature. It was experimentally determinedthat at low chamber pressure and low shelf temperature, up to 4 hwere required to achieve a pseudo steady-state condition inproduct temperature. Whereas, up to 2 h were required to attain apseudo steady-state condition in product temperature at highchamber pressure and high shelf temperature conditions. Althoughthe time required to achieve a pseudo steady state in producttemperature was highly dependent on the processing conditionsand formulation solid content, the values obtained in this study

Figure 1. Vial placement for the sublimation experiments of this study. “Numberedvials” represent vials weighed before and after the freeze-drying experiment. “T-signed vials” represent vials with thermocouples for product temperature measure-ment of the different groups of vial arrays.
Figure 2. Critical input and output process parameters of a typical freeze-dryingprocess.
G. Assegehegn et al. / Journal of Pharmaceutical Sciences 109 (2020) 785-796 789
were significantly longer than the values reported in the litera-ture.37 Therefore, such definition of the starting time considers thereal effect of different processing conditions and formulations onthe sublimation rate before the product temperature attained apseudo steady-state condition. That is, the calculation of the sub-limation rates considered the transition period at the beginning ofthe primary drying. Thus, any bias in sublimation rate calculationthat could occur due to the transition period was avoided.
Design of ExperimentsDoE is a structured analysis of experiments wherein input pa-
rameters are changed, and differences and variations in outputparameters are measured. DoE allows the simultaneous determi-nation of the effects of all potential input variables on the outputresponses, as well as investigations on how the process responsechanges as input variables fluctuate (random and systematic vari-ation of the process parameters) within allowable limits. This re-quires a profound scientific background of the formulation andprocess, and, further, preliminary experiments using the specifieddrug formulation could be required to facilitate the development ofan effective DoE. For a freeze-drying process, the critical processinput and output parameters of the 3 steps are well known. Theyare depicted in Figure 2.
As the focus of this study was on the PDS development for theprimary drying step, the DoE only considered the input and outputparameters of the primary drying step of the freeze-drying process.Based on prior knowledge and preliminary experiments using themodel formulations, a customized full-factorial DoE for both modelformulations was developed as displayed in Table 2.
Results and Discussion
Characterization of Frozen Formulations
Representative DSC thermograms for MF1 and MF2 are dis-played in Figure 3i. For MF1, Tg’ was observed at a temperatureof �29.2�C; for MF2, Tg’ was observed at a temperature of �32.4�C.The Tg’ values of MF1 and MF2 obtained in this study were inexcellent agreement with previously reported values.35,38
Freeze-drying microscopy images of MF1 andMF2 are displayedin Figure 3ii. The Tc of both model formulations obtained in this
study were also in excellent agreement with the values reported inthe literature.39 Table 3 presents the results of Tg’, Tc, and the rangeof maximum product temperature during primary drying for thetwo model formulations.
Construction of Process Design Space for MF1
During the construction of the freeze-drying PDS, the limita-tions imposed by the freeze-dryer and formulation were consid-ered. Patel and Pikal40 reported that the majority of manufacturingdryers cannot control chamber pressures less than 0.06 mbar andthat there is no additional advantage in sublimation rate forchamber pressures greater than 0.40 mbar. To verify these limita-tions, preliminary experiments were performed as follows: (1) asublimation test using pure water at a chamber pressure of 0.05mbar and a shelf temperature of �10�C. This test provided anaverage sublimation rate of 0.319 g/h,vial, which exceeds the ex-pected average sublimation rate of the model formulations at thesame chamber pressure. Therefore, it can be safely assumed that0.05 mbar and greater chamber pressures would not experiencechocking flow for the expected sublimation rates of the modelformulations studied and (2) sublimation tests using both modelformulations at a chamber pressure of 0.25 mbar and a shelf tem-perature of �25�C. Although these processing conditions yieldedaverage product temperatures close to Tc (�29.7�C for MF1and �31.0�C for MF2), the corresponding average sublimation rates(0.074 g/h,vial for MF1 and 0.089 g/h,vial for MF2) were consid-erably less than the sublimation rates obtained at lower chamberpressures and similar product temperatures. Therefore, chamberpressures greater than 0.25 mbar would have no benefit from asublimation rate point of view.
The DoE displayed in Table 2 was developed considering theinformation obtained from the previously mentioned preliminaryexperiments. Representative results of the freeze-drying experi-ments are presented in Table 4. The results for all the processingconditions displayed in the DoE (Table 2) were obtained in a similarmanner (not indicated herein) and further processed.
The results displayed in Table 4 indicate remarkable differencesinTpave and the sublimation rates between the frontedge and centervials. As supported by the experimental results displayed in Figure 4and in the literature,41-44 even in a freeze-drying process with aminimum effect of radiation, there could be significant spatialvariation in the shelf surface temperature. Cold spotswere observedat the center of the shelf, indicating a temperature of approximately4�C colder than the hot spots, whichwere observed at the front edge

Figure 3. Characterization of frozen formulations. (i) DSC thermograms for MF1 (solid line) and for MF2 (dashed line). (ii) Freeze-drying microscopy images for MF1, (a) intactstructure at T ¼ �28.5�C, (b) onset of collapse at T ¼ �28.0�C, (c) collapse at T ¼ �27.5�C, and (d) significant damage at T ¼ �27.0�C and for MF2, (e) intact structure at T ¼ �31.8�C,(f) onset of collapse at T ¼ �31.4�C, (g) collapse at T ¼ �31.1�C, and (h) significant damage at T ¼ �30.6�C.
G. Assegehegn et al. / Journal of Pharmaceutical Sciences 109 (2020) 785-796790
of the shelf. These spatial shelf surface temperature variations couldbe attributed to the large thermal demand of the vials located at thecenter of the shelf compared with the vials located at the edge. Thecenter vials have a higher vial packing density (number of vials perunit area). Hence, they absorb much larger energy during ice subli-mation compared with edge vials. This, in turn, leads to differentproduct temperatures and sublimation rates of the vials placed atdifferent locations across a shelf (see Fig. 4).
Therefore, consideration of such variations during the con-struction of a PDS is critical in the design of a robust freeze-dryingprocess. Further, as indicated in Table 4, the sublimation rate isdependent on the chamber pressure. Thus, depending on thechamber pressure, similar product temperatures can producedifferent sublimation rates. As displayed in Table 4 for MF1, asimilar Tpave for front edge vials was obtained at Condition 1(Ts ¼ �20�C/Pc ¼ 0.10 mbar) and Condition 2 (Ts ¼ �30�C/Pc ¼ 0.20mbar). Analyzing Conditions 1 and 2, similar Tpavewere obtained atdifferent Ts values. Thus, to yield similar Tpave, a higher Pc requires alower Ts. This is because (1) when the chamber pressure increases,the heat transfer rate owing to gas conduction increases, leading toan increase in product temperature45 and (2) at constant Pi, highchamber pressures reduce the driving force for mass transfer rate,PiðTpÞ� Pc. The reduction in the endothermic mass transfer ratedecreases the energy consumption from a vial, leading to an in-crease in product temperature, unless Ts is adjusted. It is importantto note here that, although similar Tpave can be obtained atdifferent Pc values, the corresponding sublimation rate values canbe significantly different. Referring to the aforementioned condi-tions, the sublimation rates of the front edge vials under Condition1 are significantly greater than under Condition 2. Similarly,although the center vials at Condition 1 had reduced Tpave, theirsublimation rates were considerably greater compared with thecenter vials under Condition 2. This is attributed to the fact that at agiven Tp, the driving force for mass transfer rate, PiðTpÞ� Pc, de-creases as Pc increases. Thus, for a given Tp, low Pc and high Tsproduce a highmass transfer rate. Such knowledge and informationfor a specific drug product is essential to design the most optimizedand robust freeze-drying process. A PDS can be used as a tool to
Table 3Values of T
0g , Tc, and the Range of Maximum Product Temperature During Primary Dryin
Formulation T0g (�C) Tc (�C)
MF1 �29.2 �27.5MF2 �32.4 �31.1
T0g is the glass transition temperature of the maximally freeze-concentrated solution and
choose the optimum process variables that yield the maximumpossible mass transfer rate, without exceeding the maximumallowable product temperature during primary drying.
The construction of the PDS was started by plotting isotherms forthe product temperature on a graph of shelf temperature versuschamberpressure, asdisplayed inFigure5b. Theproduct temperatureisotherms were calculated from data obtained experimentally andrepresented the average product temperature of the front edge vials.The reason for selecting the front edge vials to define the producttemperature was that this vial group had the highest product tem-perature in thevial arrays. Product temperatureswere collectedevery20 s. The average product temperature represents an average value ofthe product temperatures collected during the entire period of thesublimation test. Figure 5a presents the average product temperatureof the front edge vials at the selected shelf temperature and chamberpressure. The results demonstrate an excellent linear relationship (R2
> 0.94) of the average product temperature and shelf temperature atany given chamber pressure. Using regression analyses of the datapoints (solid lines, Fig. 5a), possible combinations of chamber pres-sure and shelf temperature that produce any desired product tem-perature canbecalculated. This informationwasused to construct thegraph of chamber pressure versus shelf temperature with the iso-therms of the product temperatures (Fig. 5b).
As can be observed in Figure 5a, a change in the slope of thecurves with increasing chamber pressure was observed. At rela-tively low chamber pressures, less than 0.08 mbar, the driving forcefor the sublimation rate is large, and thus the heat transfer becomesa rate-limiting factor of the drying process. In this case, as theexcess sublimation process consumes additional input energy, largechanges in shelf temperature are required to produce an observablechange in product temperature. Conversely, although high chamberpressures enhance the heat transfer rate, which is attributed toimproved heat transfer via gas conduction,45 they significantlyreduce the driving force for mass transfer. Thus, the mass transferbecomes a rate-limiting factor of the drying process, and anyadditional input energy, that is an increase in shelf temperature,has significant influence on the product temperature. This isevident from Figure 5a, where it can be observed that the curves at
g for MF1 and MF2
Range of Maximum Product Temperature During Primary Drying (�C)
�28.5 to �29.5�31.5 to �32.5
Tc is the collapse temperature.

Table 4Results of Average Product Temperatures and Sublimation Rates at Selected Combinations of Chamber Pressure and Shelf Temperatures for MF1 and MF2
Pc (mbar) Ts (�C) Formulation Front Edge Vials Center Vials
Tpavea (�C) Sublimation Rate (g/h,vial) Tpave
a (�C) Sublimation Rate (g/h,vial)
Maxb Minc Aved Maxb Minc Aved
0.10 �15.0 MF1 �30.1 0.229 0.170 0.191 �32.6 0.137 0.115 0.121�17.0 �30.7 0.202 0.147 0.171 �33.5 0.113 0.102 0.107�20.0 �31.7 0.181 0.137 0.156 �34.2 0.110 0.088 0.099�25.0 �32.1 0.159 0.114 0.129 �36.6 0.087 0.069 0.076
0.20 �20.0 �28.9 0.223 0.175 0.193 �29.9 0.134 0.120 0.125�25.0 �29.8 0.165 0.125 0.138 �31.4 0.085 0.081 0.078�30.0 �31.7 0.094 0.069 0.078 �33.5 0.046 0.026 0.042�35.0 �34.7 0.055 0.035 0.044 �36.6 0.018 0.015 0.016
0.10 �15.0 MF2 �30.3 0.258 0.201 0.221 �31.4 0.150 0.121 0.131�17.0 �30.7 0.231 0.173 0.193 �32.8 0.127 0.102 0.109�20.0 �31.1 0.210 0.160 0.177 �33.2 0.115 0.086 0.091�25.0 �32.0 0.156 0.127 0.137 �35.0 0.072 0.059 0.067
0.20 �20.0 �30.1 0.272 0.208 0.232 �30.8 0.153 0.138 0.144�25.0 �31.3 0.174 0.145 0.157 �32.3 0.105 0.081 0.092�30.0 �32.2 0.131 0.095 0.108 �33.8 0.052 0.041 0.045�35.0 �34.5 0.077 0.046 0.057 �36.7 0.018 0.014 0.016
Pc is chamber pressure; Ts is shelf temperature; Tpave is the average product temperature.a The average product temperatures (Tpave) for each vial group were calculated as the arithmetic average of the temperature measurements in the time range used for
sublimation rate calculation.b The maximum sublimation rates were the maximum value of the sublimation rates from each vial group.c The minimum sublimation rates were the minimum value of the sublimation rates from each vial group.d The average sublimation rates were calculated as the arithmetic average of the sublimation rates from each vial group.
G. Assegehegn et al. / Journal of Pharmaceutical Sciences 109 (2020) 785-796 791
low chamber pressure have larger slopes than the curves at highchamber pressures. This fact has a quantifiable effect from a processrobustness point of view. That is, a freeze-drying process designedat relatively low chamber pressure is more robust to small shelftemperature variations than a freeze-drying process designed atrelatively high chamber pressure.
The range of maximum product temperature during primarydrying for MF1 was defined from �29.5�C to �28.5�C (see Table 3).Further, lower and higher chamber pressure limits were definedbased on the equipment and process constraints. This informationwas used to impose formulation, process, and equipment con-straints, and the PDS was defined as displayed in Figure 5b. FromFigure 5b, the process parameters that yielded a low producttemperature space and high product temperature space can beeasily identified. In the former, the product temperature is less thanthe desired range and leads to an unnecessarily long primary dry-ing time (inefficient process), whereas in the latter, the resultinghigh product temperature leads to product damage (collapse ormeltback), which compromises product CQAs. Although it has been
Figure 4. Experimental data showing significant spatial shelf surface temperature andproduct temperature differences across a shelf. Chamber pressure ¼ 0.1 mbar.
reported that collapse does not lead to a loss of CQAs for drugproducts,40 additional experimental studies are required to studythe effect of collapse on drug stability during storage.46-53 Further,regulatory agencies require consistent, reproducible, and uniformcake appearance to ensure drug stability.8
From the PDS defined in Figure 5b, one would choose to use“high chamber pressure-low shelf temperature” or “low chamberpressure-high shelf temperature” combinations to achieve thesame product temperature. However, depending on the chamberpressure, the same product temperature can produce differentsublimation rates. At a given product temperature, low chamberpressure yields a high sublimation rate. Thus, a further definition ofthe PDS including values for sublimation rate is necessary. Toinclude such information, the data of sublimation rates are plottedagainst experimental product temperatures, as displayed inFigure 6a. Figure 6a contains the average product temperature ofthe front edge vials in the x-axis and theminimum sublimation rateof the center vials in the y-axis. As reported in the literature42-44,54
and determined experimentally in this study, the center vials havethe lowest sublimation rate in the vial arrays. Therefore, Figure 6aallows consideration of the minimum sublimation rate during theconstruction of the PDS. This, in turn, avoids possible productdamage owing to premature change to the secondary drying step.The choice of the average product temperature of the front edgevials in Figure 6a is because the product isotherms of the PDS (seeFig. 5b) are based on this parameter. Therefore, information on thesublimation rate of the center vials when the front edge vialsachieve the target product temperature is required.
As indicated in Figure 6a, there is an excellent fitting of theexperimental data (R2 > 0.95) and regression analyses of the datawere used to calculate the minimum sublimation rate of the centervials at a given chamber pressure and product temperature of thefront edge vials. The initial PDS (Fig. 5b) was redefined after thesublimation rate values obtained from Figure 6awere included. Thefinal PDS for MF1 is presented in Figure 6b.
The PDS defined in Figure 6b encompasses a wide range of Ts, Pc,and sublimation rate values. Thus, a control space within the PDScan be defined when the range of process parameters is small andwell controlled. The control space is defined to encompass the

G. Assegehegn et al. / Journal of Pharmaceutical Sciences 109 (2020) 785-796792
highest sublimation rates within the PDS. However, it is recom-mended that the consideration of edge process parameters to ac-count for batch-to-batch process variations be avoided. Processparameters for the primary drying step can be defined within thecontrol space as a set point. The set point can be selected anywherewithin the control space. However, to consider intrabatch andinterbatch variation in the process parameters, it is recommendedto select the set point as the midpoint of the control space. At theset point, the minimum sublimation rate within the control spacecan be used to calculate the primary drying time.
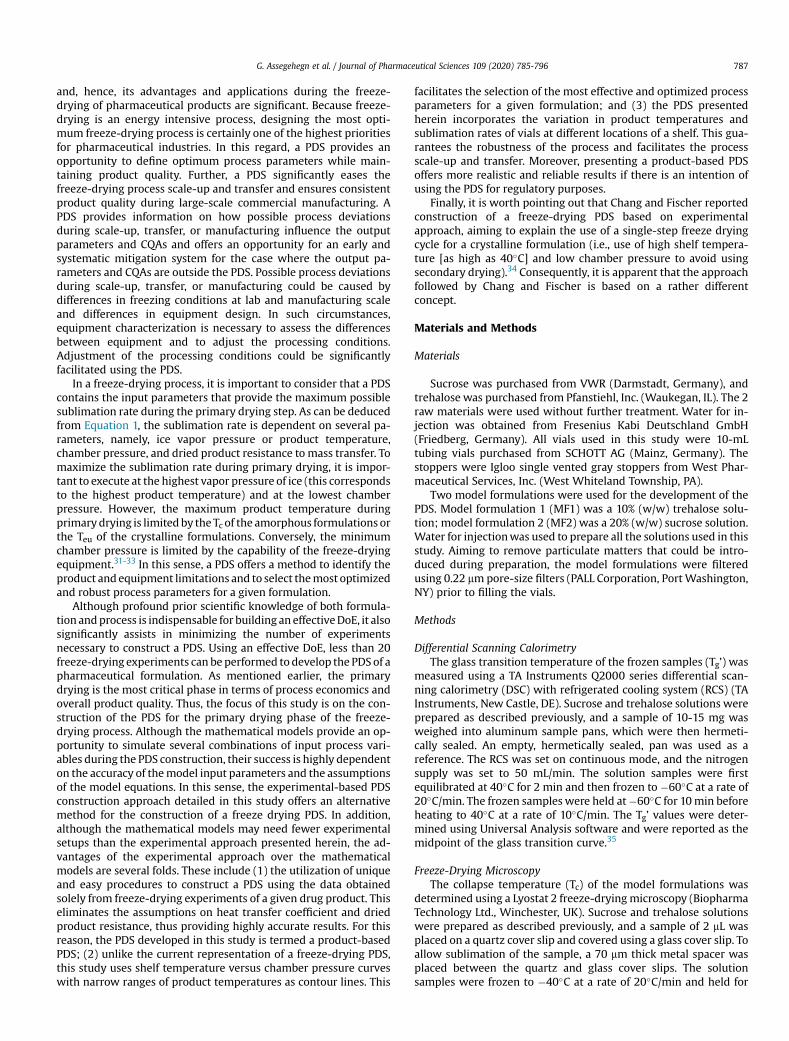
Construction of Process Design Space for MF2
The experimental data obtained for MF2 were analyzed in asimilar manner to the method followed for MF1. Accordingly, thePDS for the second formulation was obtained. It is presented inFigure 7.
Experimental Verification of the PDSs for MF1 and MF2
Because the calculations of the product temperatures and sub-limation rates involve linear regression analyses, minor inaccura-cies in the corresponding values could occur. Therefore, it isimportant to verify, experimentally, that the PDS obtained in thisstudy yields the expected product temperatures and sublimationrates of the model formulations. Freeze-drying experimental runswere performed at selected set point values for both model for-mulations. The values of the set point parameters were selectedfrom Figures 6b and 7, as follows:
� For MF1: Pc ¼ 0.075 mbar, Ts ¼ 3 �C, Fill volume ¼ 3 mL� For MF2: Pc ¼ 0.075 mbar, Ts ¼ -16 �C, Fill volume ¼ 3 mL
The freezing protocol in these verification experiments was thesame as the freeze protocol used for the construction of the PDS.This minimizes any possible variation of drying behavior owing tothe freezing protocol. The product temperatures of the center andfront edge vials weremeasured using wireless thermologgers (4 foreach vial group). The sublimation rates of the center vials weredetermined gravimetrically and, for this purpose, 16 center vialswere weighed before and after the experiment.
Figure 5. (a) Relationship between average product temperature of front edge vials and sheof MF1 after formulation, process and equipment constraints.
Figure 8 displays the product temperature profiles of MF1 andMF2 obtained from the verification experiments. Further, the esti-mated parameters from the PDS were compared with the param-eters obtained from the verification experiments. They arepresented in Table 5.
As indicated in Figure 8 and Table 5, there is an excellentagreement between the PDS-estimated and the experimentallydetermined values for both model formulations. This demon-strates that the procedures described in this article for theconstruction of an effective and product-based PDS, coupled withan effective DoE, produce highly accurate and reproducible re-sults. This can enable process scientists to design freeze-dryingprocesses for a given pharmaceutical drug formulation based ona scientific approach, using limited well-defined experimentalruns.
Utilization of the Lab PDS for Process Scale-Up and Transfer
Equipment CapabilityMainly owing to their large capacity, chocking flow could be
more pronounced at manufacturing scale freeze dryers. Therefore,it is critical to determine the capability of the target freeze dryer tocontrol the Pc at full load capacity and at typical freeze-dryingsublimation rates. The determination of the capability of a targetfreeze dryer could be carried out using a one-point water subli-mation test as follows: (1) fully load the target freeze dryer withpure water placed on a tray made from plastic; (2) freeze thewater and allow complete solidification; (3) set the Pc to 0 andincrease the Ts to þ30�C or þ40�C; and (4) observe the minimumPc and its stability, attained by the freeze dryer after the Ts setpointhas been reached. Although the calculation of the exact value ofthe total vapor flow rate could be difficult, it could be assumedthat the total vapor flow rate of pure water, at a Ts value rangingfrom þ30�C to þ40�C and a controllable low Pc is much higherthan most of the typical vapor flow rates obtained using drugformulations. Thus, if a freeze dryer is able to attain and control aminimum Pc of, for example, 50 mbar when pure water at a Tsof þ30�C or þ40�C is used, it could be safely concluded that theoccurrence of chocked flow for Pc up to 50 mbar is highly unlikelywhen a drug formulation at typical primary drying Ts values isused.
lf temperature (at different chamber pressures) for MF1 and (b) PDS for primary drying
Figure 6. (a) Relationship of average product temperature of front edge vials and minimum sublimation rate of center vials (at different chamber pressures) for MF1. (b) Finalprocess design space (PDS) for primary drying of MF1, taking into consideration minimum sublimation rate of center vials. Relatively minimum values of sublimation rate (mostly inthe region of high chamber pressure) were removed from the originally defined PDS (Fig. 5b).
G. Assegehegn et al. / Journal of Pharmaceutical Sciences 109 (2020) 785-796 793
Differences in Resistance to Mass Transfer of the Dried Product (Rp)and Overall Vial Heat Transfer Coefficient (Kv)
The differences in Rp and Kv between laboratory andmanufacturing scale freeze dryers are the major freeze-dryingprocess scale-up and transfer factors. Differences in Rp could becaused by variations in the degree of supercooling, which could beaffected by differences in cleanness between laboratory andmanufacturing environments. On the other hand, differences in Kv
could arise from differences in design and performance of thedryers. Differences in Rp and Kv during scale-up or transfer could beeasily detected from Tp response, provided that identical primarydrying processing conditions (i.e., Ts and Pc) are used. Thus, at thesame processing conditions, an increase in Rp is reflected by an
Figure 7. Final process design space (PDS) for primary drying of MF2, taking into conside(mostly in the region of high chamber pressure) were removed from the originally defined
increase in Tp. Because the vapor flow is more restricted at higherRp, there is less energy consumption from the system, and most ofthe heat input is utilized to increase the Tp. Conversely, at low Rp,most of the heat input is consumed by the relatively higher subli-mation rate (attributed to the lower resistance to vapor flow), andhence the Tp becomes lower. An increase in Kv at the same Ts and Pcleads to an increase in Tp and vice versa. However, the influence ofKv on freeze-drying process scale-up and transfer could be signifi-cantlyminimized by using the same container-closure system and alaboratory scale freeze dryer with similar design and performanceto a manufacturing scale freeze dryer. Therefore, the most impor-tant factor that could cause differences in Tp during scale-up ortransfer is Rp.
ration the minimum sublimation rate. Relatively minimum values of sublimation ratePDS.

Figure 8. Experimental verification of the process design space (PDS). (a) Product temperature profiles of front edge vials (FE) and center vials (c) for MF1; (b) Product temperatureprofiles of front edge vials (FE) and center vials (c) for MF2.
G. Assegehegn et al. / Journal of Pharmaceutical Sciences 109 (2020) 785-796794
From the above discussion, the Ts (keeping Pc constant) at thetarget freeze dryer that is needed to obtain the target producttemperature (Tpt) could be different, and thus determination of thenew Ts and adjustment of the drying time (td) would be the majorscale-up or transfer experiments. With this regard, the PDS devel-oped at lab scale provides important information that could beutilized during the scale-up or transfer experiments: (1) the rangeof possible Ts values that could be used to determine the new Ts; (2)the robustness of the formulation to Ts changes; and (3) variation ofsublimation rates at different processing conditions. Consideringpossible variations in Rp, a Ts range from �12�C to þ12�C at a Pc ¼0.075 mbar could yield the Tpt for MF1 (cf. Fig. 6b). Such informa-tion could be utilized to perform a temperature ramp experimentusing the target freeze drier to obtain the new Ts value. Point A ofFigure 6b shows that, at Pc ¼ 0.075 mbar, a Ts around þ1�C wasrequired to yield a Tp of�29.0�C. Assuming that the new Ts value, atthe target freeze dryer and Pc ¼ 0.075 mbar, required to yield a Tpof �29.0�C was �11�C (Point B, Fig. 6b), the corresponding differ-ences in sublimation rates and thus in td, of point A and point Bcould be adjusted using the PDS developed at lab scale. Thereduction in sublimation rate caused by an increase in Rp (thus adecrease in Ts) at constant Pc (Point B, Fig. 6b) is equivalent to areduction in sublimation rate caused by an increase in Pc (thus adecrease in Ts) at constant Rp, provided that the Tp is the same forboth cases. Considering the same formulation, product tempera-ture, and processing environment, the Rp at laboratory scale can beassumed as fairly constant at the different processing conditions.
Table 5Comparison of PDS-Estimated and Experimentally Determined Parameters at Set Point
Formulation PDS Estimated Values Experimenta
FE C FE
Tpave (�C) Tpave (�C) _m(g/h,vial) tdc (h) Tpave
a (�C)
MF1 �28.7 �31.0 0.169 16.0 �28.4MF2 �31.2 �33.4 0.094 25.5 �31.3
Tpave is average product temperature; _m is sublimation rate; td is drying time of primara Tpave was obtained by averaging product temperatures obtained from 4 thermologgb _m is the minimum value of 16 sublimation rate values.c td is calculated based on the minimum sublimation rate within the control space and td is calculated based on the minimum sublimation rate of the 16 experimentally de
Furthermore, assuming the reduction in Ts at the target freeze dryeris due entirely to the increase in Rp, the sublimation rate at the newTs value (i.e., �11�C) and Tp ¼ �29.0�C from the PDS (point C,Fig. 6b) could be used to adjust the sublimation rate and the td atthe target freeze dryer.
Conclusions
A new step-by-step procedure for the construction of a product-based PDS for the primary drying step was described. An effectiveDoE was developed, which could then be used to experimentallydetermine the necessary information for the construction of thePDS. The development of an effective DoE requires a profoundscientific understanding of the formulation and process andperhaps requires only limited preliminary experiments. The pro-posed product-based PDS considers variations in product temper-atures and sublimation rates within the vial arrays. With thisregard, the product temperature of the front edge vials and subli-mation rate of the center vials were used. This assures the effec-tiveness and the robustness of the PDS. Compared with themathematical models that could require several freeze-drying ex-periments for optimization and verification, the product-based PDSdetailed herein produced highly accurate results, demonstratingthe potential for significant development time and material sav-ings. Further, the PDS of a drug formulation based on experimentalresults presents more realistic and reliable data if there is anintention of using the PDS for regulatory agencies. Experimental
lly Determined Values Differences (%)
C FE C
Tpavea (�C) _mb (g/h,vial) td
d (h) Tpave Tpave _m td
�30.1 0.177 15.3 1.05 2.90 4.73 4.38�32.8 0.104 23.1 0.32 1.80 10.64 9.41
y drying; FE is front edge vials; and C is center vials.ers.
d based on 3 mL fill volume.termined sublimation rate values and based on 3 mL fill volume.

G. Assegehegn et al. / Journal of Pharmaceutical Sciences 109 (2020) 785-796 795
verifications of the PDS for the 2 formulations studied in thisresearch were performed, and an excellent agreement between thePDS predicted values and experimentally determined values wereachieved. Finally, coupled with an effective DoE, the proposedprocedure for the construction of a product-based PDS consider-ably reduces development time and material requirements andsignificantly improves the accuracy, effectiveness, and robustnessof the resulting freeze-drying process. Thus, process scale-upproblems are minimized with the development of a PDS. Further,the resulting optimum and robust freeze-drying process has sig-nificant advantages in process cost and energy savings and inmaintaining product quality consistency during a large-scalemanufacturing process.
Acknowledgment
Each of the authors confirms that there was no financial aidfrom an organization or technical assistance outside the authorsthemselves.
References
1. Pikal MJ. Freeze-drying of proteins. Part I: process design. BioPharm. 1990;3:18-27.
2. Pikal MJ. Freeze-drying of proteins. Part II: formulation selection. BioPharm.1990b;10:26-30.
3. Patel SM, Jameel F, Pikal MJ. The effect of dryer load on freeze drying processdesign. J Pharm Sci. 2010;99:4363-4379.
4. Mortier STFC, Van Bockstal PJ, Corver J, Nopens I, Gernaey KV, De Beer T. Un-certainty analysis as essential step in the establishment of the dynamic designspace of primary drying during freeze-drying. Eur J Pharm Biopharm. 2016;103:71-83.
5. Tang X, Pikal MJ. Design of freeze-drying processes for pharmaceuticals:practical advice. Pharm Res. 2004;21:191-200.
6. Liu J. Physical characterization of pharmaceutical formulations in frozen andfreeze-dried solid states: techniques and applications in freeze-drying devel-opment. Pharm Dev Technol. 2006;11:3-28.
7. Wang DQ. Formulation characterization. In: Rey L, May JC, eds. Freeze Drying/Lyophilization of Pharmaceutical and Biological Products. 3rd ed. London, UK:Informa Healthcare; 2010:233-253.
8. Goldman JM, More HT, Yee O, et al. Optimization of primary drying in lyoph-ilization during early-phase drug development using a definitive screeningdesign with formulation and process factors. J Pharm Sci. 2018;107:2592-2600.
9. Ward KR, Matejtschuk P. Characterization of formulations for freeze-drying. In:Ward K, Matejtschuk P, eds. Lyophilization of Pharmaceuticals and Biologicals.Methods in Pharmacology and Toxicology. New York: Humana Press; 2019:1-32.
10. Goshima H, Do G, Nakagawa K. Impact of ice morphology on design space ofpharmaceutical freeze-drying. J Pharm Sci. 2016;105:1920-1933.
11. Assegehegn G, Brito-de la Fuente E, Franco JM, Gallegos C. The importance ofunderstanding the freezing step and its impact on freeze drying process per-formance. J Pharm Sci. 2019;108:1378-1395.
12. Pikal MJ, Cardon S, Bhugra C, et al. The non-steady state modeling of freeze-drying: in-process product temperature and moisture content mapping andpharmaceutical product quality applications. PharmDev Technol. 2005;10:17-32.
13. Gieseler H, Kramer T, Pikal MJ. Use of Manometric Temperature Measurement(MTM) and SMARTTM freeze dryer technology for development of an optimizedfreeze-drying cycle. J Pharm Sci. 2007;96:3402-3418.
14. Velardi SA, Barresi AA. Development of simplified models for the freeze-dryingprocess and investigation of the optimal operating conditions. Chem Eng ResDes. 2008;86:9-22.
15. Kuu WY, Nail SL. Rapid freeze-drying cycle optimization using computer pro-grams developed based on heat and mass transfer models and facilitated byTunable Diode Laser Absorption Spectroscopy (TDLAS). J Pharm Sci. 2009;98:3469-3482.
16. Sundaram J, Shay YHM, Hsu CC, Sane SU. Design space development forlyophilization using DOE and process modeling. Biopharm Int. 2010;23:26-36.
17. Giordano A, Barresi AA, Fissore D. On the use of mathematical models to buildthe design space for the primary drying phase of a pharmaceutical lyophili-zation process. J Pharm Sci. 2011;100:311-324.
18. Koganti VR, Shalaev EY, Berry MR, et al. Investigation of design space forfreeze-drying: use of modeling for primary drying segment of a freeze-dryingcycle. AAPS PharmSciTech. 2011;12:854-861.
19. Fissore D, Pisano R, Barresi AA. Advanced approach to build the design spacefor the primary drying of a pharmaceutical freeze-drying process. J Pharm Sci.2011;100:4922-4933.
20. Bosca S, Barresi AA, Fissore D. Fast freeze-drying cycle design and optimizationusing a PAT based on the measurement of product temperature. Eur J PharmBiopharm. 2013;85:253-262.
21. Kodama T, Sawada H, Hosomi H, et al. Determination for dry layer resistance ofsucrose under various primary drying conditions using a novel simulationprogram for designing pharmaceutical lyophilization cycle. Int J Pharm.2013;452:180-187.
22. Kodama T, Sawada H, Hosomi H, et al. Optimization of primary drying condi-tion for pharmaceutical lyophilization using a novel simulation program with apredictive model for dry layer resistance. Chem Pharm Bull. 2014;62:153-159.
23. Fissore D, Pisano R. Computer-aided framework for the design of freeze-dryingcycles: optimization of the operating conditions of the primary drying stage.Processes. 2015;3:406-421.
24. Chen X, Sadineni V, Maity M, Quan Y, Enterline M, Mantri RV. Finite elementmethod (FEM) modeling of freeze-drying: monitoring pharmaceuticalproduct robustness during lyophilization. AAPS PharmSciTech. 2015;16:1317-1326.
25. Van Bockstal PJ, Mortier STFC, Corver J, Nopens I, Gernaey KV, De Beer T. Quan-titative risk assessment via uncertainty analysis in combination with errorpropagation for the determination of the dynamic design space of the primarydrying step during freeze-drying. Eur J Pharm Biopharm. 2017;121:32-41.
26. Arsiccio A, Pisano R. Application of the quality by design approach to thefreezing step of freeze-drying: building the design space. J Pharm Sci.2018;107:1586-1596.
27. Zhu T, Moussa EM, Witting M, et al. Predictive models of lyophilization processfor development, scale-up/tech transfer and manufacturing. Eur J Pharm Bio-pharm. 2018;128:363-378.
28. Sharma P, Kessler WJ, Bogner R, Thakur M, Pikal MJ. Applications of the tunablediode laser absorption spectroscopy: in-process estimation of primary dryingheterogeneity and product temperature during lyophilization. J Pharm Sci.2019;108:416-430.
29. Patel S, Jameel F, Sane S, Kamat M. Lyophilization process design and devel-opment using QbD principles. In: Jameel F, Hershenson S, Khan M, Martin-Moe S, eds. Quality by Design for Biopharmaceutical Drug Product Development.AAPS Advances in the Pharmaceutical Sciences Series. 18. New York: Springer;2015:303-329.
30. US Department of Health and Human Services, Food and Drug, Administration.Center for drug evaluation and research(CDER), center for biologics evaluationand research (CBER). In: ICH Q8(R2) Pharmaceutical Development. Silver Spring,MD: Food and Drug Administration (FDA); 2009.
31. Ganguly A, Alexeenko AA, Schultz SG, Kim SG. Freeze-drying simulationframework coupling product attributes and equipment capability: towardaccelerating process by equipment modifications. Eur J Pharm Biopharm.2013;85:223-235.
32. Ganguly A, Varma N, Sane P, Bogner R, Pikal M, Alexeenko A. Spatial variationof pressure in the lyophilization product chamber part 1: computationalmodeling. AAPS PharmSciTech. 2017;18:577-585.
33. Kshirsagar V, Tchessalov S, Kanka F, Hiebert D, Alexeenko A. Determiningmaximum sublimation rate for a production lyophilizer: computationalmodeling and comparison with ice slab tests. J Pharm Sci. 2019;108:382-390.
34. Chang BS, Fischer NL. Development of an efficient single-step freeze-dryingcycle for protein formulations. Pharm Res. 1995;12:831-837.
35. Her LM, Nail SL. Measurement of glass transition temperatures of freeze-concentrated solutes by differential scanning calorimetry. Pharm Res.1994;11:54-59.
36. Scutell�a B, Trelea IC, Bourl�es E, Fonseca F, Passot S. Determination of the driedproduct resistance variability and its influence on the product temperature inpharmaceutical freeze-drying. Eur J Pharm Biopharm. 2018;128:379-388.
37. Pikal MJ. Use of laboratory data in freeze-drying process design: heat and masstransfer coefficients and the computer simulation of freeze-drying. J ParenterSci Technol. 1985;39:115-139.
38. Chang BS, Randall CS. Use of sub-ambient thermal analysis to optimize proteinlyophilization. Cryobiology. 1992;29:632-656.
39. Adams GDJ, Ramsay JR. Optimizing the lyophilization cycle and the conse-quences of collapse on the pharmaceutical acceptability of Erwinia l-Aspar-aginase. J Pharm Sci. 1996;85:1301-1305.
40. Patel SM, Pikal MJ. Lyophilization process design space. J Pharm Sci. 2013;102:3883-3887.
41. Pikal MJ, Bogner R, Mudhivarthi V, Sharma P, Sane P. Freeze-drying processdevelopment and scale-up: scale-up of edge vial versus center vial heattransfer coefficients, Kv. J Pharm Sci. 2016;105:3333-3343.
42. Scutell�a B, Plana-Fattoric A, Passota S, et al. 3D mathematical modelling tounderstand atypical heat transfer observed in vial freeze-drying. Appl ThermEng. 2017;126:226-236.
43. Scutell�a B, Passot S, Bourl�es E, Fonseca F, Tr�el�ea IC. How vial geometry vari-ability influences heat transfer and product temperature during freeze-drying.How vial geometry variability influences heat transfer and product tempera-ture during freeze-drying. J Pharm Sci. 2017;106:770-778.
44. Scutell�a B, Bourl�es E, Plana-Fattori A, et al. Effect of freeze dryer design on heattransfer variability investigated using a 3D mathematical model. J Pharm Sci.2018b;107:2098-2106.
45. Pikal MJ, Roy ML, Shah S. Mass and heat transfer in vial freeze-drying ofpharmaceuticals: role of the vial. J Pharm Sci. 1984;73:1224-1237.
46. Wang DQ, Hey JM, Nail SL. Effect of collapse on the stability of freeze-driedrecombinant factor VIII and a-amylase. J Pharm Sci. 2004;93:1253-1263.
47. Schersch K, Betz O, Garidel P, Muehlau S, Bassarab S, Winter G. Systematicinvestigation of the effect of lyophilizate collapse on pharmaceutically relevantproteins I: stability after freeze-drying. J Pharm Sci. 2010;99:2256-2278.

G. Assegehegn et al. / Journal of Pharmaceutical Sciences 109 (2020) 785-796796
48. Schersch K, Betz O, Garidel P, Muehlau S, Bassarab S, Winter G. Systematicinvestigation of the effect of lyophilizate collapse on pharmaceutically relevantproteins, part 2: stability during storage at elevated temperatures. J Pharm Sci.2012;101:2288-2306.
49. Schersch K, Betz O, Garidel P, Muehlau S, Bassarab S, Winter G. Systematicinvestigation of the effect of lyophilizate collapse on pharmaceutically relevantproteins III: collapse during storage at elevated temperatures. Eur J PharmBiopharm. 2013;85:240-252.
50. Ullrich S, Seyferth S, Lee G. Measurement of shrinkage and cracking inlyophilized amorphous cakes. Part I: final-product assessment. J Pharm Sci.2015;104:155-164.
51. Patel SM, Nail SL, Pikal MJ, et al. Lyophilized drug product cake appearancewhat is acceptable? J Pharm Sci. 2017;106:1706-1721.
52. Duralliu A, Matejtschuk P, Williams DR. Humidity induced collapse in freeze driedcakes: adirectvisualization studyusingDVS.Eur J PharmBiopharm. 2018;127:29-36.
53. Haeuser C, Goldbach P, Huwyler J, Friess W, Allmendinger A. Imaging tech-niques to characterize cake appearance of freeze-dried products. J Pharm Sci.2018;107:2810-2822.
54. Pikal MJ, Pande P, Bogner R, Sane P, Mudhivarthi V, Sharma P. Impact of naturalvariations in freeze-drying parameters on product temperature history:application of quasi steady-state heat and mass transfer and simple statistics.AAPS PharmSciTech. 2018;19:2828-2842.
Copyright © 2022 FDOKUMEN