A lead dependent ischemic episodes detection strategy using Hermite functions
11
Biomedical Signal Processing and Control 5 (2010) 271–281 Contents lists available at ScienceDirect Biomedical Signal Processing and Control journal homepage: www.elsevier.com/locate/bspc A lead dependent ischemic episodes detection strategy using Hermite functions T. Rocha a,∗ , S. Paredes a , P. Carvalho b , J. Henriques b , M. Harris c , J. Morais d , M. Antumes e a Instituto Superior de Engenharia de Coimbra, Departamento de Engenharia Informática e de Sistemas, Coimbra, Portugal b Centro de Informática e Sistemas da Universidade de Coimbra, Portugal c Philips Research Europe, Aachen, Germany d Servic ¸ o de Cardiologia, Hospital de Santo André, Leiria, Portugal e Centro de Cirurgia Cardiotóracia, Hospitais da Universidade, Coimbra, Portugal article info Article history: Received 23 November 2009 Received in revised form 22 June 2010 Accepted 1 July 2010 Available online 26 August 2010 Keywords: ECG analysis Ischemic episodes detection Hermite functions Wigner–Ville transform Neural networks classifier abstract In this work a new strategy for automatic detection of ischemic episodes is proposed. A new measure for ST deviation based on the time–frequency analysis of the ECG and the use of a reduced set of Hermite basis functions for T wave and QRS complex morphology characterization, are the key points of the proposed methodology. Usually, ischemia manifests itself in the ECG signal by ST segment deviation or by QRS complex and T wave changes in morphology. These effects might occur simultaneously. Time–frequency methods are especially adequate for the detection of small transient characteristics hidden in the ECG, such as ST segment alterations. A Wigner–Ville transform-based approach is proposed to estimate the ST shift. To characterize the alterations in the T wave and the QRS morphologies, each cardiac beat is described by expansions in Hermite functions. These demonstrated to be suitable to capture the most relevant morphologic characteristics of the signal. A lead dependent neural network classifier considers, as inputs, the ST segment deviation and the Hermite expansion coefficients. The ability of the proposed method in ischemia episodes detection is evaluated using the European Society of Cardiology ST–T database. A sensitivity of 96.7% and a positive predictivity of 96.2% reveal the capacity of the proposed strategy to perform ischemic episodes identification. © 2010 Elsevier Ltd. All rights reserved. 1. Introduction The World Health Organization estimates that 17.5 million peo- ple died of cardiovascular diseases in 2005, representing 30% of all global deaths. Out of these, 7.6 million were due to coronary artery disease (CAD) [1]. As one of the leading causes of death worldwide, this cardiovascular condition represents a focus of international interest. On the other hand, the use of new monitoring technolo- gies and specialized processing based on wearable and information technologies, provide professionals with adequate information that allows the evaluation of cardiovascular conditions and symptoms progression, enabling the early detection of forthcoming clinical severe conditions [2]. In this context, personal Health systems (pHealth) are a new and fast growing concept. The patient is at the center of the health delivery process and, through remote mon- itoring and management applications, pHealth systems aim the ∗ Corresponding author. E-mail addresses: [email protected] (T. Rocha), [email protected] (S. Paredes), [email protected] (P. Carvalho), [email protected] (J. Henriques), [email protected] (M. Harris), [email protected] (J. Morais), [email protected] (M. Antumes). continuity of care at all levels of health care delivery. Following this perspective, several research projects have been developed over the past few years [3]. This work focuses coronary artery disease and, in particular, the development of algorithms for myocardial ischemia detection. Moreover, the feasibility of incorporating the designed algorithms into pHealth monitoring systems (e.g. personal data assistant) is also a fundamental aspect and, therefore, the computational effi- ciency of the algorithms is essential. In CAD, coronary arteries become narrowed by atherosclerosis, restricting the supply of blood and oxygen to the heart. This depri- vation may originate a cardiac disorder called myocardial ischemia, which can be silent, without evidence of symptoms, or it might be characterized by chest pain also known as angina pectoris. A severe and sudden blockage of coronary arteries causing a pro- longed lack of blood supply to the heart may lead to a myocardial infarction due to cellular necrosis. Moreover, myocardial ischemia is the pathological substrate to originate serious abnormal heart rhythms (arrhythmias), which can cause fainting or frequently sud- den death. Hence, it is observed that early diagnosis and treatment of CAD is of primary importance to avoid serious consequences for patient’s health, treatment success and quality of life. In effect, if blood supply of the heart muscle is timely reestablished, myocar- 1746-8094/$ – see front matter © 2010 Elsevier Ltd. All rights reserved. doi:10.1016/j.bspc.2010.07.001
-
Upload
independent -
Category
Documents
-
view
0 -
download
0
Transcript of A lead dependent ischemic episodes detection strategy using Hermite functions

A
Ta
b
c
d
e
a
ARRAA
KEIHWN
1
pgdtigtaps(ci
(m(
1d
Biomedical Signal Processing and Control 5 (2010) 271–281
Contents lists available at ScienceDirect
Biomedical Signal Processing and Control
journa l homepage: www.e lsev ier .com/ locate /bspc
lead dependent ischemic episodes detection strategy using Hermite functions
. Rochaa,∗, S. Paredesa, P. Carvalhob, J. Henriquesb, M. Harris c, J. Moraisd, M. Antumese
Instituto Superior de Engenharia de Coimbra, Departamento de Engenharia Informática e de Sistemas, Coimbra, PortugalCentro de Informática e Sistemas da Universidade de Coimbra, PortugalPhilips Research Europe, Aachen, GermanyServico de Cardiologia, Hospital de Santo André, Leiria, PortugalCentro de Cirurgia Cardiotóracia, Hospitais da Universidade, Coimbra, Portugal
r t i c l e i n f o
rticle history:eceived 23 November 2009eceived in revised form 22 June 2010ccepted 1 July 2010vailable online 26 August 2010
eywords:CG analysisschemic episodes detection
a b s t r a c t
In this work a new strategy for automatic detection of ischemic episodes is proposed. A new measure forST deviation based on the time–frequency analysis of the ECG and the use of a reduced set of Hermite basisfunctions for T wave and QRS complex morphology characterization, are the key points of the proposedmethodology.
Usually, ischemia manifests itself in the ECG signal by ST segment deviation or by QRS complex andT wave changes in morphology. These effects might occur simultaneously. Time–frequency methodsare especially adequate for the detection of small transient characteristics hidden in the ECG, such asST segment alterations. A Wigner–Ville transform-based approach is proposed to estimate the ST shift.To characterize the alterations in the T wave and the QRS morphologies, each cardiac beat is described
ermite functionsigner–Ville transformeural networks classifier
by expansions in Hermite functions. These demonstrated to be suitable to capture the most relevantmorphologic characteristics of the signal. A lead dependent neural network classifier considers, as inputs,the ST segment deviation and the Hermite expansion coefficients. The ability of the proposed methodin ischemia episodes detection is evaluated using the European Society of Cardiology ST–T database. Asensitivity of 96.7% and a positive predictivity of 96.2% reveal the capacity of the proposed strategy to
es ide
perform ischemic episod. Introduction
The World Health Organization estimates that 17.5 million peo-le died of cardiovascular diseases in 2005, representing 30% of alllobal deaths. Out of these, 7.6 million were due to coronary arteryisease (CAD) [1]. As one of the leading causes of death worldwide,his cardiovascular condition represents a focus of internationalnterest. On the other hand, the use of new monitoring technolo-ies and specialized processing based on wearable and informationechnologies, provide professionals with adequate information thatllows the evaluation of cardiovascular conditions and symptomsrogression, enabling the early detection of forthcoming clinical
evere conditions [2]. In this context, personal Health systemspHealth) are a new and fast growing concept. The patient is at theenter of the health delivery process and, through remote mon-toring and management applications, pHealth systems aim the∗ Corresponding author.E-mail addresses: [email protected] (T. Rocha), [email protected]
S. Paredes), [email protected] (P. Carvalho), [email protected] (J. Henriques),[email protected] (M. Harris), [email protected]
J. Morais), [email protected] (M. Antumes).
746-8094/$ – see front matter © 2010 Elsevier Ltd. All rights reserved.oi:10.1016/j.bspc.2010.07.001
ntification.© 2010 Elsevier Ltd. All rights reserved.
continuity of care at all levels of health care delivery. Following thisperspective, several research projects have been developed overthe past few years [3].
This work focuses coronary artery disease and, in particular,the development of algorithms for myocardial ischemia detection.Moreover, the feasibility of incorporating the designed algorithmsinto pHealth monitoring systems (e.g. personal data assistant) isalso a fundamental aspect and, therefore, the computational effi-ciency of the algorithms is essential.
In CAD, coronary arteries become narrowed by atherosclerosis,restricting the supply of blood and oxygen to the heart. This depri-vation may originate a cardiac disorder called myocardial ischemia,which can be silent, without evidence of symptoms, or it mightbe characterized by chest pain also known as angina pectoris. Asevere and sudden blockage of coronary arteries causing a pro-longed lack of blood supply to the heart may lead to a myocardialinfarction due to cellular necrosis. Moreover, myocardial ischemiais the pathological substrate to originate serious abnormal heart
rhythms (arrhythmias), which can cause fainting or frequently sud-den death. Hence, it is observed that early diagnosis and treatmentof CAD is of primary importance to avoid serious consequences forpatient’s health, treatment success and quality of life. In effect, ifblood supply of the heart muscle is timely reestablished, myocar-
2 rocess
dc
ntoiitaa
idseoctncibr
AotwedstbmGt(emaiotSao
aisMm[(wo
[tmKpbed
2. Proposed methodology
Fig. 1 depicts the schematic diagram of the methodology fol-lowed in this work. The input consists of a discrete ECG signal,which is passed through a set of preprocessing stages for noise
72 T. Rocha et al. / Biomedical Signal P
ial ischemia can be reversed, cellular necrosis limited and severeomplications avoided.
The analysis of the electrocardiogram’s (ECG) characteristics,amely the ST segment deviation as well as the QRS complex andhe T wave morphologies, are determinant for accurate detectionf ischemic episodes [4]. The automatic diagnosis of myocardialschemia based on the ECG signal usually involves two phases:schemic beat classification and ischemic episode identification. Inhe first phase, each cardiac beat is labeled as normal or ischemicnd, in the second phase, sequential ischemic beats are appropri-tely grouped in order to identify ischemic episodes.
In the context of ischemic beat detection and ischemic episodesdentification using the ECG, several methodologies have beeneveloped. Time, frequency and time–frequency domain analy-is techniques [5–10] have been successfully applied for featurextraction and analysis. Some authors have explored the projectionnto different sets of basis functions for feature extraction. In thisontext, principal component analysis (PCA) and Karhunen–Loèveransform (KLT) [11–13] have been extensively utilized, while a fewumber of works have used discrete Hermite functions [14]. Thelassification stage has been tackled using different approaches. Fornstance, artificial neural networks-based methods [15–17] haveeen proposed. Other authors favor rule-based [18,19] and fuzzyule [20,21] approaches.
In terms of time and frequency domain analysis techniques,kselrod et al. [5] proposed the first method for direct analysisf the ST segment. It is based on a single measure of the magni-ude of the point located 104 ms after the R peak. Another methodas proposed by Benhorim et al. [6], in which two points, consid-
red as the start and end points of the ST segment, are calculatedepending on the RR interval of each beat. Badilini et al. [7] pre-ented an algorithm that uses statistic variables, extracted fromhe frequency distributions of ST displacements, to discriminateetween normal and ischemic ambulatory ECG recordings. Further-ore, ischemic episodes are identified by using a cluster technique.arcia et al. [8], applied an adaptive amplitude threshold method
o the root mean square series of differences between ST–T complexor ST segment) and an average pattern segment, to detect ischemicpisodes. Ranjith et al. [9] employed a wavelet transform to deter-ine ECG characteristic points from which ST segment deviation
nd T wave amplitude measures are obtained and used to detectschemic episodes. Milosavljevic and Petrovic [10] proposed the usef wavelets for extracting myocardial ischemia characteristic pat-erns, which are obtained through different decomposition scales.T deviation is calculated for each beat and the number of ST devi-tions is correlated with the time of consecutive appearances inrder to distinguish normal from ischemic ECGs.
Regarding methods based on neural networks, Maglaveras etl. [15] introduced an adaptive backpropagation neural network todentify ischemic beats. In this approach, ischemic episodes clas-ification is achieved by analyzing a sequence of classified beats.ohebbi and Moghadam [17] also proposed a beat classificationethod based on an adaptive backpropagation neural network. In
16], Papaloukas et al. employed a feed-forward neural networktrained using a Bayesian regularization method) as a beat classifier,hich was integrated into a four-stage procedure for the detection
f ischemic episodes.With respect to PCA and KLT approaches, Castells et al.
11] reviewed the application of principal component analysisechniques for the detection of myocardial ischemia and abnor-
alities in ventricular repolarization. Pang et al. [12] utilized
arhunen–Loève transform parameters extracted from ST–T com-lex and a measure of the ST segment deviation to detect ischemiay means of an adaptive neuro-fuzzy logic classifier. In turn, Afsart al. [13] used Karhunen–Loève transform to reduce ST segmentata together with an ensemble of lead-specific neural networksing and Control 5 (2010) 271–281
classifiers to detect ST segment deviation episodes. In terms of Her-mite functions based methods, Gopalakrishnan et al. [14] used ECGexpansion in discrete Hermite functions for a real-time monitoringof ischemic changes. Namely, the first fifty Hermite coefficients areapplied as inputs to a committee neural network classifier, trainedto identify ischemic beats.
Regarding rule-based systems methods, Papaloukas et al. [18]proposed a strategy to detect ECG changes suggestive of ischemiausing a rule-based expert system. Specifically, the system is able todistinguish between episodes of ST segment deviation and T wavechanges. Andreao et al. [19] presented an ischemia detection sys-tem that uses a hidden Markov model approach for online beatdetection and segmentation, and a rule-based classifier for ischemicepisodes detection, derived from some heuristic rules defined bycardiologists.
Vila et al. [20] developed an intelligent monitoring systemsupported on fuzzy set theory, which uses three electrocardio-graphic leads and one invasive cardiovascular pressure signal inreal-time to detect ischemic episodes. Exarchos et al. [21] proposeda methodology to create fuzzy expert systems for ischemic beatsdetection that involves a set of rules extraction using a decisionthree.
Despite of the many works that have been developed in the con-text of ischemia automatic detection, the results achieved in termsof sensitivity and positive predictivity can yet be improved. Thus,the search for better results is an incentive for further investigation.
In the present paper a new methodology for automatic detectionof ischemic episodes is proposed considering the ST segment devi-ation, the T wave and the QRS morphology variations. In effect, it isknown that variations in the ST segment are not always associatedwith ischemia. For example, sudden changes in QRS morphologycan reflect shifts in the electrical axis and ventricular depolariza-tion of the heart, which usually causes considerable alterations inthe ST segment level [11]. Thus, taking into account the QRS mor-phology, it is expected to improve the detection of true ischemicbeats. A new measure of ST deviation based on the time–frequencyanalysis of the signal and the expansion onto Hermite basis func-tions to capture the T wave and the QRS complex morphologies arethe key points of the proposed strategy.
The paper is organized as follows: in the next section the pro-posed methodology is described, in Section 3 validation results,using the European Society of Cardiology (ESC) ST–T database, arepresented and, finally, in Section 4 some conclusions are drawn.
Fig. 1. Proposed ischemic episode detection methodology.

T. Rocha et al. / Biomedical Signal Processing and Control 5 (2010) 271–281 273
rttubppr
2
tIf
t(dat
rESpcparqassmwaislf
2
Tsi
2
a
Table 1ST deviation—measuring point.
Heart rate (bpm) Measuring point
<100 Rpeak + 120 ms
Fig. 2. Baseline removal.
eduction, fiducial points identification, premature ventricular con-ractions (PVCs) elimination and baseline removal. Following this,he algorithm involves two processing steps: firstly, each individ-al beat is classified as normal or ischemic. For this end, featuresased on the ST deviation, the T wave and the QRS complex mor-hologies are considered. Secondly, ischemic episodes detection iserformed using a sliding window procedure. The detailed algo-ithms are introduced in the next subsections.
.1. Preprocessing
The first stage of preprocessing is concerned with noise reduc-ion. This is achieved by applying a low-pass filter to the ECG signal.n particular, a 4th order Butterworth low-pass filter, with a cut offrequency of 40 Hz, is employed for this purpose.
Afterwards, a segmentation algorithm is used in order to identifyhe beginning, the peak and the end of each ECG characteristic waveP, Q, R, S and T). The applied algorithm is based on the work intro-uced by Sun [22]. After the segmentation stage, PVCs are detectednd removed from the signal. The algorithm implemented for thisask is adapted from Couceiro et al. [23].
The final preprocessing stage consists of baseline wanderemoval. Baseline wander presence increases the difficulty of theCG analysis, especially while assessing ST segment deviation.ince the spectrum of baseline wander and the low frequency com-onents of the ECG usually overlap, baseline removal using filteringan cause significant distortion of important clinical information,articularly, ST segment alterations. An effective baseline removalpproach has been proposed by Wolf [24]. This method does notequire isoelectric level determination and preserves the low fre-uency ECG information. Originally, the method considered theverage of the distances between consecutive R peaks to split theignal into cardiac cycles. As it is illustrated in Fig. 2, based on theegmentation procedure previously mentioned, Wolf’s method isodified to consider as starting and ending points the start of the Pave (Pbegin) and the end of the T wave (Tend), respectively. The aver-
ge of the first and last N cardiac cycle samples (in this work N = 5)s used to define a first order polynomial. Fundamentally, baselinehift is approximated by this first order polynomial being the base-ine removal procedure completed by subtracting this baseline shiftrom the original cardiac cycle signal.
.2. Features extraction
The approach followed here, assumes that variations in thewave and QRS complex morphologies, and the ST segment
hift estimation, can be used to discriminate ischemic from non-schemic episodes.
.2.1. ST segment deviationThe ST segment deviation is assessed considering two different
pproaches. In the first, the ST deviation is evaluated based on the
100–110 Rpeak + 112 ms110–120 Rpeak + 104 ms
>120 Rpeak + 100 ms
heart rate and on the R peak location. This information can be easilyobtained by means of any ECG segmentation algorithm. Mainly forthis reason, this is a very simple and practical method, guarantyingrobustness, even in the presence of noise and artifacts. However,since it basically depends on the R peak location and not on theECG waves morphology, this method does not guarantee accurateresults. On the other hand, the second approach, based on the timefrequency analysis is able to explicitly capture the transient char-acteristics of the ECG waves. Given these properties, this method isideal to estimate the ST deviation being, however, more sensitive tonoise and artifacts. The strategy followed in this work aims to takeadvantage of both approaches by providing accurate ST estimationin the case of noise free signals, while ensuring satisfactory resultsin the presence of artifacts.
2.2.1.1. ST segment deviation based on R peak location. Through acorrelation analysis procedure, three algorithms for ST shift estima-tion ([5,12,25]) have been implemented, compared and validatedusing the ESC ST–T database. In view of the obtained results, themethod proposed by Pang et al. [12] was chosen for this task. Inthis method, the ST segment deviation is evaluated in a point thatdepends on the heart rate and on the R peak location, according toTable 1.
2.2.1.2. ST segment based on time–frequency analysis. In general,time–frequency methods are applied to provide a more detailedview of the time distribution of the spectral components that con-stitute a signal. In particular, it is recognized that time–frequencymethods are especially adequate for the detection of small transientcharacteristics hidden in the ECG, such as ST segment alterations.Thus, this work proposes a new approach for the estimation of STdeviation based on a time–frequency analysis, in particular usingthe Wigner–Ville transform, since it offers a good balance betweentime and frequency resolution.
The Wigner–Ville distribution (WVD) Wx(t, f) for a complex con-tinuous time signal x(t) is defined in the time domain as:
Wx(t, f ) =∫ ∞
−∞x(
t + �
2
)x∗
(t − �
2
)e−j2�f�d� (1)
where r(�) = x(t + (�/2))x*(t − (�/2)) is the instantaneous autocor-relation function and the operator (*) indicates the conjugateoperation. The correspondent discrete time transform Wx(nT, f) isgiven by Eq. (2).
Wx(nT, f ) = 2T
L∑p=−L
x(n + p)x∗(n − p)w(p)w∗(−p)e−j4�fp (2)
In this equation, T represents the sampling period and w is asliding window, symmetrical and with finite-length duration, veri-fying w(pT) = 0 for abs(p) > L. This relationship defines the discreteWVD at the time origin. At any other point in time, the discrete
WVD can be obtained by shifting the signal x(t), so that time t ismapped on the time origin. To avoid interference between the neg-ative and positive regions of the spectrum, the equivalent analyticsignal of the real ECG time-series has to be used. In effect, it can beobtained by adding to the real signal its Hilbert transform as the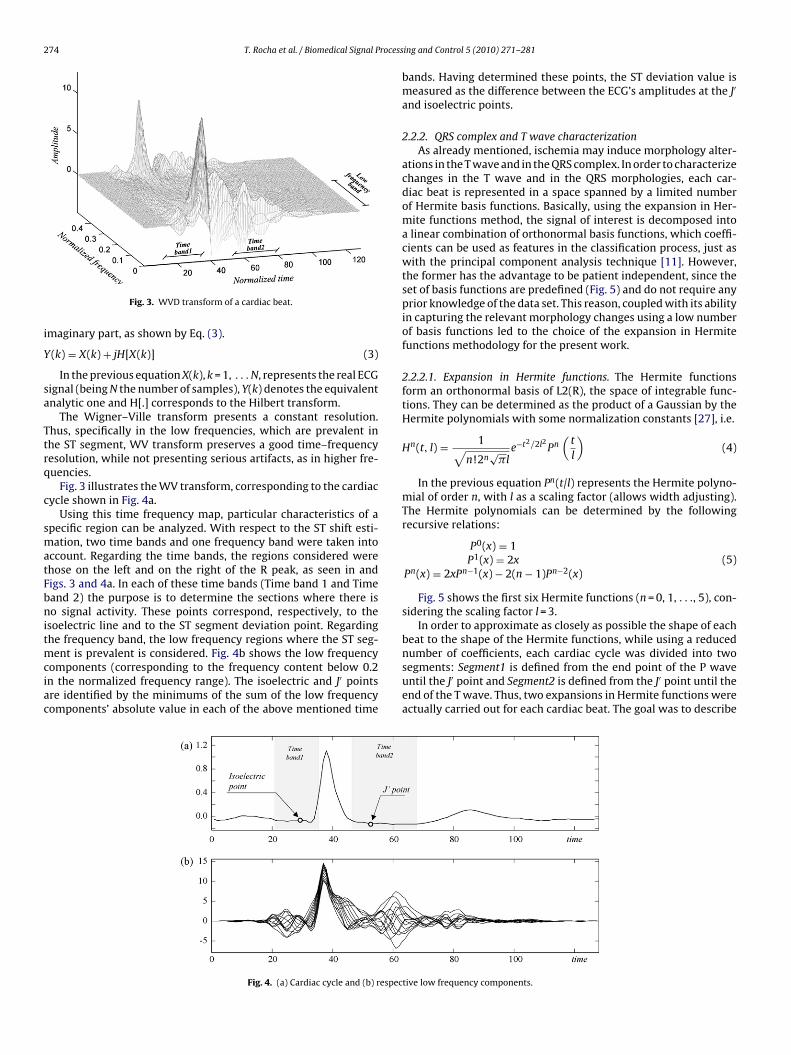
274 T. Rocha et al. / Biomedical Signal Process
i
Y
sa
Ttrq
c
smatFbnitmciac
Fig. 3. WVD transform of a cardiac beat.
maginary part, as shown by Eq. (3).
(k) = X(k) + jH[X(k)] (3)
In the previous equation X(k), k = 1, . . . N, represents the real ECGignal (being N the number of samples), Y(k) denotes the equivalentnalytic one and H[.] corresponds to the Hilbert transform.
The Wigner–Ville transform presents a constant resolution.hus, specifically in the low frequencies, which are prevalent inhe ST segment, WV transform preserves a good time–frequencyesolution, while not presenting serious artifacts, as in higher fre-uencies.
Fig. 3 illustrates the WV transform, corresponding to the cardiacycle shown in Fig. 4a.
Using this time frequency map, particular characteristics of apecific region can be analyzed. With respect to the ST shift esti-ation, two time bands and one frequency band were taken into
ccount. Regarding the time bands, the regions considered werehose on the left and on the right of the R peak, as seen in andigs. 3 and 4a. In each of these time bands (Time band 1 and Timeand 2) the purpose is to determine the sections where there iso signal activity. These points correspond, respectively, to the
soelectric line and to the ST segment deviation point. Regardinghe frequency band, the low frequency regions where the ST seg-
ent is prevalent is considered. Fig. 4b shows the low frequencyomponents (corresponding to the frequency content below 0.2n the normalized frequency range). The isoelectric and J′ pointsre identified by the minimums of the sum of the low frequencyomponents’ absolute value in each of the above mentioned time
Fig. 4. (a) Cardiac cycle and (b) respec
ing and Control 5 (2010) 271–281
bands. Having determined these points, the ST deviation value ismeasured as the difference between the ECG’s amplitudes at the J′
and isoelectric points.
2.2.2. QRS complex and T wave characterizationAs already mentioned, ischemia may induce morphology alter-
ations in the T wave and in the QRS complex. In order to characterizechanges in the T wave and in the QRS morphologies, each car-diac beat is represented in a space spanned by a limited numberof Hermite basis functions. Basically, using the expansion in Her-mite functions method, the signal of interest is decomposed intoa linear combination of orthonormal basis functions, which coeffi-cients can be used as features in the classification process, just aswith the principal component analysis technique [11]. However,the former has the advantage to be patient independent, since theset of basis functions are predefined (Fig. 5) and do not require anyprior knowledge of the data set. This reason, coupled with its abilityin capturing the relevant morphology changes using a low numberof basis functions led to the choice of the expansion in Hermitefunctions methodology for the present work.
2.2.2.1. Expansion in Hermite functions. The Hermite functionsform an orthonormal basis of L2(R), the space of integrable func-tions. They can be determined as the product of a Gaussian by theHermite polynomials with some normalization constants [27], i.e.
Hn(t, l) = 1√n!2n
√�l
e−t2/2l2 Pn(
t
l
)(4)
In the previous equation Pn(t/l) represents the Hermite polyno-mial of order n, with l as a scaling factor (allows width adjusting).The Hermite polynomials can be determined by the followingrecursive relations:
P0(x) = 1P1(x) = 2x
Pn(x) = 2xPn−1(x) − 2(n − 1)Pn−2(x)(5)
Fig. 5 shows the first six Hermite functions (n = 0, 1, . . ., 5), con-sidering the scaling factor l = 3.
In order to approximate as closely as possible the shape of eachbeat to the shape of the Hermite functions, while using a reduced
number of coefficients, each cardiac cycle was divided into twosegments: Segment1 is defined from the end point of the P waveuntil the J′ point and Segment2 is defined from the J′ point until theend of the T wave. Thus, two expansions in Hermite functions wereactually carried out for each cardiac beat. The goal was to describetive low frequency components.

T. Rocha et al. / Biomedical Signal Processing and Control 5 (2010) 271–281 275
functi
e
y
ssb
E
m
H
t
C
istics of the signal.In order to determine the adequate number of Hermite basis
functions several experiments were carried out, which results aresummarized in Fig. 6. In effect, for a selected set of representative
Fig. 5. First six Hermite
ach discrete signal segment y(k) as
ˆ(k) =m−1∑j=0
cjHj(k, l) (6)
In the previous equation, y(k) stands for the estimated signalegment, m defines the number of basis functions and cj corre-pond to the expansion coefficients. The last ones can be obtainedy minimizing the sum squared error, as follows:
(cj) =∑
k
⎡⎣y(k) −
m−1∑j=0
cjHj(k, l)
⎤⎦
2
(7)
In matrix notation, given a signal Y (N × 1) and being H a (N × m)atrix formed by the Hermite functions
= [H0, H1, . . . , Hm−1] (8)
he vector of coefficients C (m × 1)
= [c0, c1, . . . , cm−1] (9)
Fig. 6. Approximation of Segment1 and Segment2 using Hermite functions.
ons (order n = 0 to n = 5).
is obtained by using a pseudo inverse formulation:
C = (HT H)−1
HT Y = H+Y (10)
2.2.2.2. Number of Hermite basis functions, scaling factors and expan-sion coefficients. One of the main assumptions in this work is thatthe expansion coefficients C can reflect the changes in the ECG’smorphology induced by ischemia and, therefore, be able to repre-sent the second set of features used in beat classification process. Itis important to highlight that it is not fundamental to obtain verylow approximation errors. In fact, the underlying idea is that theapproximated signal and, indirectly, the Hermite coefficients havethe capacity to capture the most relevant morphologic character-
cardiac beats, several expansions were done considering different
Fig. 7. Approximation of a cardiac beat using expansion in Hermite functions.
2 rocessing and Control 5 (2010) 271–281
ntpwtoas
Tigaou
onvtW
ictmw
tfiebHs
]
mmasc
76 T. Rocha et al. / Biomedical Signal P
umbers of basis functions and the respective errors calculated (ashe difference between the real signal and the estimated one). Fig. 6resents the mean error obtained from the selected set of signals,hich is separately indicated for Segment1 and Segment2. From
he analysis of both error curves it can be concluded that a totalf six Hermite basis functions is a choice that leads to an accept-ble error at the same time that guaranties a number of coefficientsufficiently low for both segments.
Regarding, the scaling factors, a similar strategy was followed.he estimation of the adequate scaling factors resulted from exper-ments in which the values of these parameters were varied in aiven range [2–15]. The scaling factors for each segment (Segment1nd Segment2) were independently obtained by the minimizationf the error between the real and the estimated signals. These val-es were of l = 5 and l = 8, respectively for Segment1 and Segment2.
The number of Hermite basis functions, as well as the valuesf the scaling factors, were considered constants for all the sig-als. Actually, as referred above, it was not fundamental to obtainery low approximation errors for each specific case, but to capturehe most relevant morphologic characteristics of each cardiac beat.
ith the selected values this goal was achieved.Fig. 7 depicts a real cardiac beat and the correspondent approx-
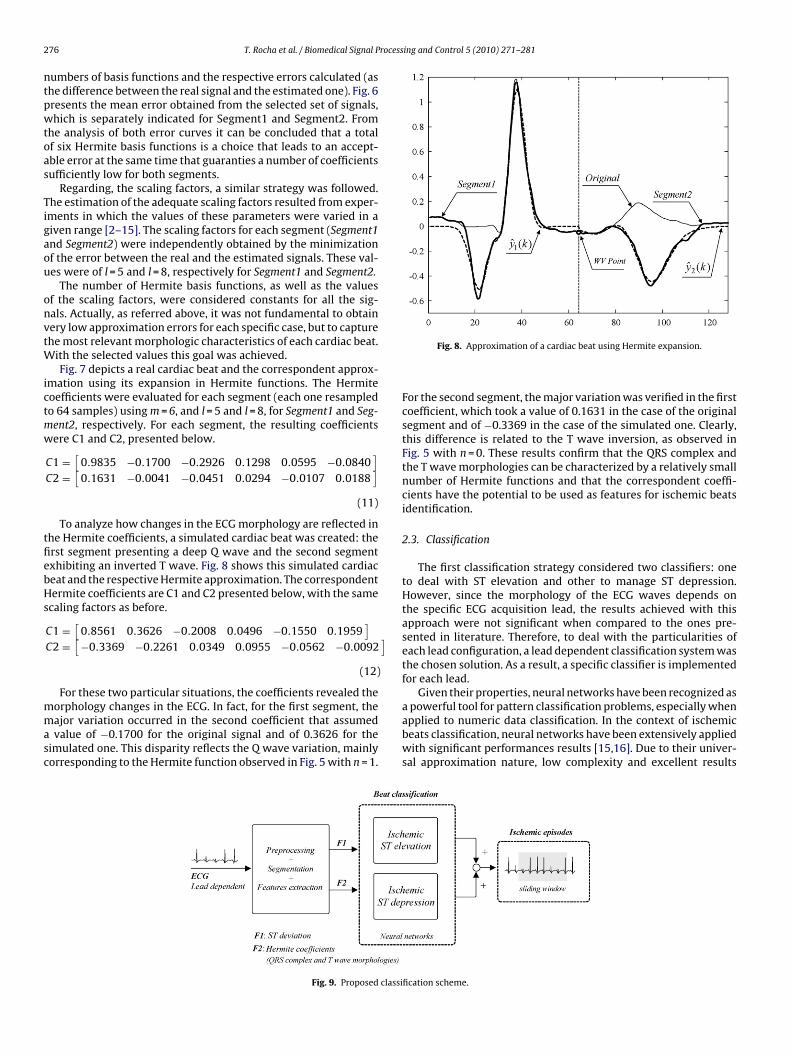
mation using its expansion in Hermite functions. The Hermiteoefficients were evaluated for each segment (each one resampledo 64 samples) using m = 6, and l = 5 and l = 8, for Segment1 and Seg-ent2, respectively. For each segment, the resulting coefficientsere C1 and C2, presented below.
C1 =[
0.9835 −0.1700 −0.2926 0.1298 0.0595 −0.0840]
C2 =[
0.1631 −0.0041 −0.0451 0.0294 −0.0107 0.0188]
(11)
To analyze how changes in the ECG morphology are reflected inhe Hermite coefficients, a simulated cardiac beat was created: therst segment presenting a deep Q wave and the second segmentxhibiting an inverted T wave. Fig. 8 shows this simulated cardiaceat and the respective Hermite approximation. The correspondentermite coefficients are C1 and C2 presented below, with the same
caling factors as before.
C1 =[
0.8561 0.3626 −0.2008 0.0496 −0.1550 0.1959]
C2 =[
−0.3369 −0.2261 0.0349 0.0955 −0.0562 −0.0092
(12)
For these two particular situations, the coefficients revealed the
orphology changes in the ECG. In fact, for the first segment, theajor variation occurred in the second coefficient that assumedvalue of −0.1700 for the original signal and of 0.3626 for theimulated one. This disparity reflects the Q wave variation, mainlyorresponding to the Hermite function observed in Fig. 5 with n = 1.
Fig. 9. Proposed classi
Fig. 8. Approximation of a cardiac beat using Hermite expansion.
For the second segment, the major variation was verified in the firstcoefficient, which took a value of 0.1631 in the case of the originalsegment and of −0.3369 in the case of the simulated one. Clearly,this difference is related to the T wave inversion, as observed inFig. 5 with n = 0. These results confirm that the QRS complex andthe T wave morphologies can be characterized by a relatively smallnumber of Hermite functions and that the correspondent coeffi-cients have the potential to be used as features for ischemic beatsidentification.
2.3. Classification
The first classification strategy considered two classifiers: oneto deal with ST elevation and other to manage ST depression.However, since the morphology of the ECG waves depends onthe specific ECG acquisition lead, the results achieved with thisapproach were not significant when compared to the ones pre-sented in literature. Therefore, to deal with the particularities ofeach lead configuration, a lead dependent classification system wasthe chosen solution. As a result, a specific classifier is implementedfor each lead.
Given their properties, neural networks have been recognized as
a powerful tool for pattern classification problems, especially whenapplied to numeric data classification. In the context of ischemicbeats classification, neural networks have been extensively appliedwith significant performances results [15,16]. Due to their univer-sal approximation nature, low complexity and excellent resultsfication scheme.

rocessing and Control 5 (2010) 271–281 277
ai
2
wsfossebo
2
wlmpe
3
d9jEfs4
a(
S
P
abtpat
3
Smascic2St
np
Fig. 10. ST deviation.
T. Rocha et al. / Biomedical Signal P
chieved in similar classification tasks, neural networks are usedn this work.
Fig. 9 depicts the main modules of the classification scheme.
.3.1. Beat classificationFor classifier selection several experiments were carried out
ith different types of neural networks. The chosen strategy con-ists of two independent feed-forward neural networks (FFNNs)or each lead: the first classifies the nature of the ST elevationf each beat and the second distinguishes beats with ST depres-ion from others. After beat classification a sliding window withize of 40 beats is applied to each FFNN output signal in order toliminate isolated misclassified beats. At the end, the outputs fromoth networks (elevation and depression) are combined by an ORperation.
.3.2. Episode detectionIschemia episodes detection involves two steps: first a sliding
indow procedure is applied to the entire ECG signal. The window’sength is set to 40 beats. It is considered as an ischemic episode if
ore than 50% of the beats are classified as ischemic. In a secondhase, the classification done in the previous step is reviewed andpisodes with a separation of less than 40 beats are merged.
. Results
For algorithm validation purposes the European Society of Car-iology ST–T database was used [25,26]. This database consists of0 annotated excerpts of ambulatory ECG recordings from 79 sub-
ects for which myocardial ischemia was diagnosed or suspected.ach record is 2 h in duration and contains two signals from 8 dif-erent leads (V1, V2, V3, V4, V5, MLI, MLIII and D3). These signals areampled at 250 Hz. From the 90 complete records of this database,8 records are freely available and were used in this work.
To assess the quality of the proposed algorithms, sensitivity (SE)nd positive predictivity (PP) have been evaluated, according to Eqs.11) and (12), respectively.
E = TP
TP + FN(13)
P = TP
TP + FP(14)
In the equations above, TP (true positives) represents thennotated beats/episodes in the database that were identifiedy the algorithms, FN (false negatives) corresponds to the anno-ated beats/episodes that were not detected and, finally, FP (falseositives) denotes the number of beats/episodes that were notnnotated in the database, but that were incorrectly identified byhe algorithms.
.1. Features extraction
The extracted features in each cardiac cycle were related withT segment deviation as well as with the QRS and the T waveorphology changes. ST deviation has been evaluated using both
pproaches described in Section 2.2.1. In turn, each cardiac beategment (Segment1 and Segment2) was approximated by a linearombination of the first six Hermite functions (orders 0–5). Takingnto account that the expansion of each segment originated 6 coeffi-ients, a total of 14 features were determined for each cardiac beat:features related to the ST deviation and 12 Hermite coefficients.
ubsequently, a moving average filter of order 10 was applied to allhe features.
To validate the potential of the referred features in discrimi-ating normal from ischemic beats, a linear correlation analysisrocedure took place. In effect, the correlation coefficients between
Fig. 11. First three coefficients of Hermite expansion—Segment1.
the computed Hermite coefficients and the beat classificationaccording to ESC ST–T database were assessed. Table 2 presents theaverage correlation coefficients and the respective standard devia-tions computed from all the beats considered in this study. The ST1and ST2 labels represent the ST deviation calculated using the twodifferent approaches mentioned before (Section 2.2.1) and the Hjj = 0, . . ., 5, denote the Hermite coefficients from orders 0 to 5. Thevalues presented in Table 2 confirm the potential of the features inquestion.
Figs. 10–12, illustrate this correlation analysis performed on thee0103 record, channel 2, lead MLIII, which is composed of 6997beats. In order to simplify the visualization, only some of the fea-tures are depicted. Thus, Fig. 10 depicts the ST deviation obtainedusing the Wigner–Ville approach. Fig. 11 shows the first three Her-mite coefficients corresponding to Segment1 and Fig. 12 presentsthe first three Hermite coefficients corresponding to Segment2. Forthis particular example, the correlation coefficients obtained arepresented in Table 3.
The correlation coefficients presented in Table 3, as well as the
respective visualization in Figs. 10–12, demonstrate the discrimi-nation effectiveness of the selected features.
278 T. Rocha et al. / Biomedical Signal Processing and Control 5 (2010) 271–281
Table 2Features correlation analysis.
Correlation coefficient ST deviation Hermite coefficients for Segment1 Hermite coefficients for Segment2
ST1 ST2 H0 H1 H2 H3 H4 H5 H0 H1 H2 H3 H4 H5
Average 0.63 0.64 0.30 0.34 0.41 0.40 0.37 0.35 0.35 0.41 0.28 0.46 0.48 0.63Standard deviation 0.21 0.23 0.25 0.22 0.27 0.26 0.24 0.26 0.26 0.26 0.20 0.24 0.23 0.22
Table 3Correlation analysis for the e0103 record.
ST deviation Hermite coefficients for Segment1 Hermite coefficients for Segment2
ST2 H0 H
Correlation coefficient 0.82 0.53 0
3
3
far2ccpwt
ww
end of them matched within a defined tolerance (40 beats) then
TT
Fig. 12. First three coefficients of Hermite expansion—Segment2.
.2. Training and validation
.2.1. DataSetRegarding training and validation, data subsets from the 48
reely available signals of the ESC ST–T database were selectedccording to each lead. Each ECG record was split into two sub-ecords, i.e. one from channel 1 and another one from channel, originating 96 signals for training and validation. Each specificlassifier for each lead was trained and validated using signalsontained in the database for that lead type. Moreover, after thereprocessing phase, some of the cardiac cycles were removed andere considered neither for training nor for validation purposes. In
his category are PVCs and noisy beats.To validate beat classification, 81 of the 96 available signals
ere utilized. In effect, some signals containing annotations thatere not considered consistent were discarded. An example of an
able 4raining and validation dataset.
Lead No. of signals in database Cardiac cycles in database
V1 5 33,554V2 8 49,704V3 3 14,487V4 19 1,34,872V5 27 1,92,249MLI 8 63,851MLIII 25 1,59,142D3 1 1465Total 96 6,49,324
1 H2 H0 H1 H2
.49 0.79 0.83 0.11 0.44
ambiguous situation is illustrated in Fig. 13. The figure on the left(Fig. 13a) shows a 4 s section of the e0207 record, channel 1, leadV5, starting at index 1620900. The figure on the right (Fig. 13b)shows a 4 s section of the e0303 record, channel 2, lead V5, startingat index 1107300.
According to the ESC ST–T database classification, the signal onthe right has been annotated as normal, while the one on the lefthas been considered as having ST depression. However, as can beobserved, this classification contradicts what one might expect.
Table 4 presents the exact number of cardiac cycles used for eachlead (after PVCs, noisy and non-consistent beat elimination). Thediscarded signals, for each lead, were: e0207 for lead MLI, e0109,e0121, e0609 and e0613 for lead MLIII, e0403 for lead V1, e0415 ande0603 for lead V2, e0119, e012 and e0161 for lead V4, and e0207,e0213, e0303 and e0405 for leadV5.
3.2.2. Training and validationFor training purposes only a small portion of representative sig-
nals (30 beats before and after the annotated episodes transitions)were applied. As already mentioned, beat classification was leaddependent and was carried out by means of two FFNNs per lead.Considering the 8 different leads (V1, V2, V3, V4, V5, MLI, MLIIIand D3) present in the ESC ST–T database, a total of 16 neural net-works were utilized. A neural architecture composed by two hiddenlayers (sigmoid tangent activation functions) was considered. Thenumber of hidden neurons was experimentally determined and theparameters (weights and bias) that characterize all the FFNNs weretrained using the Levenberg Marquardt algorithm. Table 5 presents,for each lead, the architecture applied for each classifier. The nota-tion used is the number of neurons corresponding to [inputs, firstlayer, second layer, output].
For ischemic episode validation, beat sequences of annotatedand identified episodes were compared. If the beginning and the
episode detection was considered as successful. Otherwise, it wasconsidered as unsuccessful. In Fig. 14, a representative exampleof ischemic episodes identification by the proposed algorithms ispresented using the e0103 record. In fact, the manifest overlap
No. of signals considered Cardiac cycles considered
4 30,5486 35,1103 14,487
16 1,08,10723 1,62,747
7 56,99021 1,33,477
1 146581 5,42,931

T. Rocha et al. / Biomedical Signal Processing and Control 5 (2010) 271–281 279
) ESC
bai
4
bT
pr
Fig. 13. Non-consistent beat classification examples. (a
etween the annotated episodes and the ones identified by thelgorithms, testifies the ability of the methodology to perform thentended detection task.
. Results and discussion
The results achieved by the proposed algorithms for ischemic
eat classification and ischemic episode detection are presented inables 6 and 7.As can be observed in the tables above, the global sensitivity andositive predictivity reached average values of 96.7% and 96.2%,espectively.
ST–T depression beats and (b) ESC ST–T normal beats.
Despite the importance of evaluating the performance of theproposed algorithms with respect to other state of the art meth-ods, it is observed that this is a very difficult task due to the factthat different data sets are applied to derive the reported resultsin many of these papers. Badilini et al. [7] uses a private database.Although many authors use the ESC ST–T database to evaluate theiralgorithms, it is observed that some (e.g. [10,14]) do not specify
the number of records (although the latter refers the number ofischemic/normal beats used). Others (e.g. [16]) use all the availablerecords of the database but with reviewed annotations. In otherstudies, as those reported in [17,21], only a small set of recordsare utilized (5 and 10, respectively) for validation purposes. On the
280 T. Rocha et al. / Biomedical Signal Processing and Control 5 (2010) 271–281
Table 5Lead NN structure.
Lead NN structure
V1 [14,5,3,1]V2 [14,5,3,1]V3 [14,5,3,1]V4 [14,6,4,1]V5 [14,7,3,1]MLI [14,3,3,1]MLIII [14,5,3,1]D3 [14,5,3,1]
orafmrtreS[atdaeiss
Table 7Episodes detection performance.
Lead Episodes TP FP FN SE PP
V1 5 5 0 0 100.0% 100.0%V2 5 5 0 0 100.0% 100.0%V3 2 2 0 0 100.0% 100.0%V4 34 32 2 4 88.9% 94.1%V5 38 35 3 6 85.4% 92.1%MLI 5 5 1 0 100.0% 83.3%MLIII 32 32 0 0 100.0% 100.0%D3 1 1 0 0 100.0% 100.0%Total 122 117 6 10 96.7% 96.2%
TB
Fig. 14. Ischemic episodes validation (e0103 record).
ther hand, some authors evaluate their methods using all databaseecords with the original annotations. This is the case of Pang [15]nd Vila et al. [20] (ischemic episodes detection), where SE variesrom 81.3% to 83.0% and PP ranges from 74.7% to 75.0%. For ST seg-
ent deviation episodes, Garcia et al. [8] and Papaloukas et al. [18]eport for SE between 84.7% and 92.0%, while PP ranges from 86.1%o 93.8%. Another group of authors base their evaluation on the 48ecords freely available. This is the case of the method for ischemicpisodes detection introduced by Andreao et al. [19] that achieves aE of 83.0% and a PP of 85.0%. The algorithm reported by Afsar et al.16] for ST segment deviation episodes achieves a SE of 90.8% andPP of 89.2%. For obvious reasons, it would be unfair to compare
he current work with the group that used the entire records of theatabase as they would be in disadvantage. In fact, the most suit-
ble studies for comparison are actually those reported by Andreaot al. and by Afsar et al., since the data set used for their evaluations basically the same as the one applied in the present study. Con-equently, it can be concluded that the results presented in Table 7ignificantly improve the results achieved by the methods reportedable 6eat classification performance.
Lead No. of signals No. of beats F
S
V1 4 30,548 10V2 6 35,110 9V3 3 14,487 10V4 16 1,08,107 9V5 23 1,62,747 9MLI 7 56,990 9MLIII 21 1,33,477 10D3 1 1465Total 81 5,42,931 9
by these authors, both in terms of sensitivity (96.7%) as well as interms of positive predictivity (96.2%).
It should be stressed that all modules of the algorithm have beendesigned to operate on short signal windows (40 beats). This is animportant aspect, since it does not require significant durationsof ECG to perform ischemia characterization. Since the proposeddetection scheme is based on neural network models, the classifi-cation process is very fast. Thus, this methodology has the potentialto be used in home monitoring pHealth applications.
5. Conclusions
In this paper a strategy for ischemic episode detection was pro-posed. The methodology consists of two main steps: first, eachindividual beat is classified as normal or ischemic, considering fea-tures based on the ST deviation, the T wave and the QRS complexmorphologies. To deal with the particularities of each lead con-figuration, a lead dependent classification scheme is implementedusing two FFNNs per lead, specifically designed to deal with ST ele-vation and ST depression, respectively. In the second stage of thealgorithm, ischemic episodes detection is performed based on asliding window procedure.
The most innovative aspects are the new approach for accu-rate ST shift and isoelectric point estimation based on thetime–frequency analysis, and the ECG beat morphology effectivecharacterization using the expansion in Hermite functions.
The methodology’s potential was confirmed by using the Euro-pean Society of Cardiology ST–T database. In fact, the achievedresults (sensitivity of 96.7% and positive predictivity of 96.2%) arerelevant when compared with similar works reported in literature.
Given the relative simplicity of the algorithm it will be straight-forward to incorporate it into pHeath systems. In particular, thedeveloped solution will be part of a cardiovascular status assess-
ment tool that is being developed under HeartCycle EuropeanProject.FNN neg. FFNN pos.
E PP SE PP
0.0% 100.0% – –9.6% 99.9% 100.0% 100.0%0.0% 99.3% – –4.6% 92.8% 100.0% 100.0%5.7% 97.5% 100.0% 100.0%9.2% 98.7% 99.6% 99.3%0.0% 100.0% 96.4% 97.0%– – 100.0% 100.0%8.4% 98.3% 99.3% 99.3%

rocess
A
buI
R
[
[
[
[
[
[
[
[
[
[
[
[
[
[
[
[
[26] A. Goldberger, L. Amaral, L. Glass, J. Hausdorff, P. Ivanov, R. Mark, J. Mietus, G.Moody, C.-K. Peng, H. Stanley, PhysioBank, PhysioToolkit, and PhysioNet: com-ponents of a new research resource for complex physiologic signals, Circulation
T. Rocha et al. / Biomedical Signal P
cknowledgements
This work was supported by HeartCycle, a project partly fundedy the European Community’s Seventh Framework Programmender grant agreement no. FP7-216695, and by CISUC—Center for
nformatics and Systems of University of Coimbra, Portugal.
eferences
[1] World Health Organization, Fact Sheet no. 317, February (2007).[2] H. Reiter, N. Maglaveras, HeartCycle: compliance and effectiveness in HF and
CAD closed-loop management, in: EMBC-2009, 31th Annual International Con-ference of the IEEE Engineering in Medicine and Biology Society, Minneapolis,USA, September 2–6, 2009.
[3] Z. Kolitsi, M. Cabrera, Personal health systems, deployment opportunities andICT research challenges, in: Personal Health Conference, Brussels, February,2007.
[4] T. Barill, The Six Second ECG: A Practical Guidebook to Basic ECG Interpretation,Nursecom Educational Technologies, 2003, chapter 4.
[5] S. Akselrod, M. Norymberg, L. Peled, E. Karabelnik, M.S. Green, Computerisedanalysis of ST segment changes in ambulatory electrocardiograms, Medical andBiological Engineering and Computing 25 (1987) 513–519.
[6] J. Benhorim, F. Badilini, A.J. Moss, W.J. Hall, M. Merri, W. Zareba, New approachto detection of ischemic-type ST segment depression, in: Noninvasive Electro-cardiology, W.B. Saunders Co, London, 1996, pp. 345–355 (chapter 19).
[7] F. Badilini, M. Merri, J. Benhorin, A.J. Moss, Beat-to-beat quantification andanalysis of ST displacement from Holter ECGs: a new approach to ischemiadetection, Computers in Cardiology (1992) 179–182.
[8] J. Garcia, L. Sornmo, S. Olmos, P. Laguna, Automatic detection of ST–T complexchanges on the ECG using filtered RMS difference series: application to ambu-latory ischemia monitoring”, Transactions on Biomedical Engineering 47 (9)(2000) 1195–1201.
[9] P. Ranjith, P. Baby, P. Joseph, ECG analysis using wavelet transform: applicationto myocardial ischemia detection, ITBM-RBM 24 (1) (2003) 44–47.
10] N. Milosavljevic, A. Petrovic, ST segment change detection by means ofwavelets, in: 8th Seminar on Neural Network Applications in Electrical Engi-neering, NEUREL, 2006.
11] F. Castells, P. Laguna, L. Sornmo, A. Bollmann, J. Roid, Principal component anal-ysis in ECG signal processing, EURASIP Journal on Advances in Signal Processing2007 (1) (2007) 98–198.
12] L. Pang, I. Tchoudovski, M. Braecklein, K. Egorouchkina, W. Kellermann, A. Bolz,
Real time heart ischemia detection in the smart home care system, in: 27thAnnual International Conference of the Engineering in Medicine and BiologySociety, 2005, pp. 3703–3706.13] F. Afsar, M. Arif, J. Yang, Detection of ST segment deviation episodes in ECGusing KLT with an ensemble neural classifier, Physiological Measurement 29(7) (2008) 747–760.
[
ing and Control 5 (2010) 271–281 281
14] R. Gopalakrishnan, S. Acharya, D. Mugler, Real time monitoring of ischemicchanges in electrocardiograms using discrete Hermite functions, in: 26thAnnual International Conference of the Engineering in Medicine and BiologySociety, 2004, pp. 438–441.
15] N. Maglaveras, T. Stamkopoulos, C. Pappas, M. Strintzis, An adaptive backpropa-gation neural network for real-time ischemia episodes detection: developmentand performance analysis using European ST–T database, Transactions onBiomedical Engineering 45 (7) (1998) 805–813.
16] C. Papaloukas, D. Fotiadis, A. Likas, L. Michalis, An ischemia detection methodbased on artificial neural networks”, Artificial Intelligence in Medicine 24 (2)(2002) 167–178.
17] M. Mohebbi, H. Moghadam, Real-time ischemic beat classification usingbackpropagation neural network, Signal Processing and CommunicationsApplications (2007) 1–4.
18] C. Papaloukas, D. Fotiadis, A. Likas, C. Stroumbis, L. Michalis, Use of a novel rule-based expert system in the detection of changes in the ST segment and the Twave in long duration ECGs, Journal of Electrocardiology 35 (1) (2002) 27–34.
19] R. Andreao, B. Dorizzi, J. Boudy, J. Mota, ST-segment analysis using hiddenMarkov model beat segmentation: application to ischemia detection, Comput-ers in Cardiology (2004) 381–384.
20] J. Vila, J. Presedo, M. Delgado, S. Barro, R. Ruiz, F. Palacios, SUTIL: intelligentischemia monitoring system, International Journal of Medical Informatics 47(3) (1997) 193–214.
21] T. Exarchos, M. Tsipouras, C. Exarchos, C. Papaloukas, D. Fotiadis, L. Michalis, Amethodology for the automated creation of fuzzy expert systems for ischaemicand arrhythmic beat classification based on a set of rules obtained by a decisiontree, Artificial Intelligence in Medicine 40 (3) (2007) 187–200.
22] Y. Sun, Arrhythmia Recognition from Electrocardiogram using Non-linear Anal-ysis and Unsupervised Clustering Techniques, PhD Thesis. School of Electrical& Electronic Engineering (2001).
23] R. Couceiro, P. Carvalho, J. Henriques, M. Antunes, On the detection of pre-mature ventricular contractions, in: EMBC-2008, 30th Annual InternationalConference of the IEEE Engineering in Medicine and Biology Society, Vancouver,Canada, August 20–24, 2008.
24] A. Wolf, Automatic Analysis of Electrocardiogram Signals using Neural net-works, PUC-Rio, Ms. Thesis, No. 0210429/CA2004 (in Portuguese).
25] A. Taddei, G. Distante, M. Emdin, P. Pisani, G.B. Moody, C. Zeelenberg, C. March-esi, The European ST–T Database: standard for evaluating systems for theanalysis of ST-T changes in ambulatory electrocardiography, European HeartJournal 13 (1992) 1164–1172.
101 (2000) e215–e220.27] G. Clifford, F. Azuaje, P. McSharry, Advanced Methods and Tools for ECG Data
Analysis, in: Engineering in Medicine & Biology, Artech House Inc, 2006.