Ultra-trace determination of Persistent Organic Pollutants in Arctic ice using stir bar sorptive...
9
Journal of Chromatography A, 1216 (2009) 8581–8589 Contents lists available at ScienceDirect Journal of Chromatography A journal homepage: www.elsevier.com/locate/chroma Ultra-trace determination of Persistent Organic Pollutants in Arctic ice using stir bar sorptive extraction and gas chromatography coupled to mass spectrometry S. Lacorte a,∗ , J. Quintana b , R. Tauler a , F. Ventura b , A. Tovar-Sánchez c , C.M. Duarte c a Department of Environmental Chemistry, IDAEA-CSIC, Jordi Girona 18-26, 08034 Barcelona, Catalonia, Spain b AGBAR Aigües de Barcelona, Av. General Batet 4, 08028 Barcelona, Catalonia, Spain c Department of Global Change Research, IMEDEA-CSIC-UIB, Miquel Marqués 21, 07190 Esporles, Mallorca, Spain article info Article history: Received 11 August 2009 Received in revised form 7 October 2009 Accepted 9 October 2009 Available online 14 October 2009 Keywords: Artic ice Persistent Organic Pollutants Stir bar sorptive extraction Gas chromatography Mass spectrometry abstract This study presents the optimization and application of an analytical method based on the use of stir bar sorptive extraction (SBSE) gas chromatography coupled to mass spectrometry (GC–MS) for the ultra- trace analysis of POPs (Persistent Organic Pollutants) in Arctic ice. In a first step, the mass-spectrometry conditions were optimized to quantify 48 compounds (polycyclic aromatic hydrocarbons, brominated diphenyl ethers, chlorinated biphenyls, and organochlorinated pesticides) at the low pg/L level. In a second step, the performance of this analytical method was evaluated to determine POPs in Arctic cores collected during an oceanographic campaign. Using a calibration range from 1 to 1800 pg/L and by adjust- ing acquisition parameters, limits of detection at the 0.1–99 and 102–891 pg/L for organohalogenated compounds and polycyclic aromatic hydrocarbons, respectively, were obtained by extracting 200 mL of unfiltered ice water. -hexachlorocyclohexane, DDTs, chlorinated biphenyl congeners 28, 101 and 118 and brominated diphenyl ethers congeners 47 and 99 were detected in ice cores at levels between 0.5 to 258 pg/L. We emphasise the advantages and disadvantages of in situ SBSE in comparison with traditional extraction techniques used to analyze POPs in ice. © 2009 Elsevier B.V. All rights reserved. 1. Introduction Because of long range transport and dispersion throughout the environment, Persistent Organic Pollutants (POPs) have been detected in remote areas such as the Arctic [1] and Antarctic [2] ecosystems. The main sources of these compounds in polar environments are atmospheric transport and continental run-off. Although the concentrations encountered in ice water are at the low pg/L level [3,4], there is evidence that these compounds are released upon snow and ice melt [5] and are accumulated in api- cal predators in polar food webs, such as seals, whales, polar bears [6] and humans [7]. There are reasons for concern on the poten- tial risks they may pose for fauna and, ultimately, for human health. Yet, data on contaminant loads in Arctic ice is very scarce. To date, resolving POP levels in Arctic ice is particularly important due to accelerated rates of ice melting [8], which releases the POPs trapped in ice into the surrounding waters [9]. Considering the low concentration of POPs in ice samples, ana- lytical methods should be sufficiently sensitive and selective to meet quantification limits at the pg/L level. The measurement of ∗ Corresponding author. Tel.: +34 934006133; fax: +34 932045904. E-mail address: [email protected] (S. Lacorte). such low levels is analytically complex, especially when performed in the field (e.g. on board of an oceanographic vessel) where sam- pling, processing and storage require a rigorous analytical control to reach the required sensitivity and at the same time avoid any exter- nal source of contamination [4]. Traditionally, large ice volumes are extracted to detect pg/L concentration. In a very early study per- formed in 1983, Tanabe et al. extracted 200–1200 L of ice melt water using an Amberlite XAD-2 resin column which was reconstituted in 100 L of hexane and analyzed by gas chromatography coupled to mass spectrometry (GC–MS) using a packed column, measuring concentrations of 1500–4900 pg/L in Antarctic ice and snow [10]. Donald et al. melted 20 L of water equivalents of snow and ice and liquid–liquid extracted (LLE) target compounds, yielding limits of detection (LODs) of 2 pg/L for organochlorinated (OC) compounds [6]. Villa et al. LLE-extracted 1–5 L of ice water to obtain limits of detection of 0.25–1 ng/L for several OC pesticides [11]. Gustafsson et al. collected 200 L of ice which was melted on an ice-melter and using LLE, levels of 0.005–0.44 pg/L of polychlorinated biphenyls (PCBs) were detected in Arctic ice and snow [4]. To avoid the use of large solvent volumes in LLE, Solid Phase Extraction (SPE) base techniques have been deployed. Using C 18 cartridges, 1–6 L of snow was preconcentrated and yielded LODs between 0.63 and 27 pg/L for polybromodiphenyl ethers (PBDEs) [12]. Speedisks were also evaluated to process high sample volumes (up to 50 L) without the need for sample filtration and provided mean recoveries of 68% 0021-9673/$ – see front matter © 2009 Elsevier B.V. All rights reserved. doi:10.1016/j.chroma.2009.10.029
Transcript of Ultra-trace determination of Persistent Organic Pollutants in Arctic ice using stir bar sorptive...
Ub
Sa
b
c
a
ARRAA
KAPSGM
1
td[eAlrc[th
ddt
lm
0d
Journal of Chromatography A, 1216 (2009) 8581–8589
Contents lists available at ScienceDirect
Journal of Chromatography A
journa l homepage: www.e lsev ier .com/ locate /chroma
ltra-trace determination of Persistent Organic Pollutants in Arctic ice using stirar sorptive extraction and gas chromatography coupled to mass spectrometry
. Lacortea,∗, J. Quintanab, R. Taulera, F. Venturab, A. Tovar-Sánchezc, C.M. Duartec
Department of Environmental Chemistry, IDAEA-CSIC, Jordi Girona 18-26, 08034 Barcelona, Catalonia, SpainAGBAR Aigües de Barcelona, Av. General Batet 4, 08028 Barcelona, Catalonia, SpainDepartment of Global Change Research, IMEDEA-CSIC-UIB, Miquel Marqués 21, 07190 Esporles, Mallorca, Spain
r t i c l e i n f o
rticle history:eceived 11 August 2009eceived in revised form 7 October 2009ccepted 9 October 2009vailable online 14 October 2009
eywords:
a b s t r a c t
This study presents the optimization and application of an analytical method based on the use of stirbar sorptive extraction (SBSE) gas chromatography coupled to mass spectrometry (GC–MS) for the ultra-trace analysis of POPs (Persistent Organic Pollutants) in Arctic ice. In a first step, the mass-spectrometryconditions were optimized to quantify 48 compounds (polycyclic aromatic hydrocarbons, brominateddiphenyl ethers, chlorinated biphenyls, and organochlorinated pesticides) at the low pg/L level. In asecond step, the performance of this analytical method was evaluated to determine POPs in Arctic corescollected during an oceanographic campaign. Using a calibration range from 1 to 1800 pg/L and by adjust-
rtic iceersistent Organic Pollutantstir bar sorptive extractionas chromatographyass spectrometry
ing acquisition parameters, limits of detection at the 0.1–99 and 102–891 pg/L for organohalogenatedcompounds and polycyclic aromatic hydrocarbons, respectively, were obtained by extracting 200 mL ofunfiltered ice water. �-hexachlorocyclohexane, DDTs, chlorinated biphenyl congeners 28, 101 and 118and brominated diphenyl ethers congeners 47 and 99 were detected in ice cores at levels between 0.5 to258 pg/L. We emphasise the advantages and disadvantages of in situ SBSE in comparison with traditional
d to
extraction techniques use. Introduction
Because of long range transport and dispersion throughouthe environment, Persistent Organic Pollutants (POPs) have beenetected in remote areas such as the Arctic [1] and Antarctic2] ecosystems. The main sources of these compounds in polarnvironments are atmospheric transport and continental run-off.lthough the concentrations encountered in ice water are at the
ow pg/L level [3,4], there is evidence that these compounds areeleased upon snow and ice melt [5] and are accumulated in api-al predators in polar food webs, such as seals, whales, polar bears6] and humans [7]. There are reasons for concern on the poten-ial risks they may pose for fauna and, ultimately, for humanealth.
Yet, data on contaminant loads in Arctic ice is very scarce. Toate, resolving POP levels in Arctic ice is particularly importantue to accelerated rates of ice melting [8], which releases the POPs
rapped in ice into the surrounding waters [9].Considering the low concentration of POPs in ice samples, ana-ytical methods should be sufficiently sensitive and selective to
eet quantification limits at the pg/L level. The measurement of
∗ Corresponding author. Tel.: +34 934006133; fax: +34 932045904.E-mail address: [email protected] (S. Lacorte).
021-9673/$ – see front matter © 2009 Elsevier B.V. All rights reserved.oi:10.1016/j.chroma.2009.10.029
analyze POPs in ice.© 2009 Elsevier B.V. All rights reserved.
such low levels is analytically complex, especially when performedin the field (e.g. on board of an oceanographic vessel) where sam-pling, processing and storage require a rigorous analytical control toreach the required sensitivity and at the same time avoid any exter-nal source of contamination [4]. Traditionally, large ice volumes areextracted to detect pg/L concentration. In a very early study per-formed in 1983, Tanabe et al. extracted 200–1200 L of ice melt waterusing an Amberlite XAD-2 resin column which was reconstitutedin 100 �L of hexane and analyzed by gas chromatography coupledto mass spectrometry (GC–MS) using a packed column, measuringconcentrations of 1500–4900 pg/L in Antarctic ice and snow [10].Donald et al. melted 20 L of water equivalents of snow and ice andliquid–liquid extracted (LLE) target compounds, yielding limits ofdetection (LODs) of 2 pg/L for organochlorinated (OC) compounds[6]. Villa et al. LLE-extracted 1–5 L of ice water to obtain limits ofdetection of 0.25–1 ng/L for several OC pesticides [11]. Gustafssonet al. collected 200 L of ice which was melted on an ice-melter andusing LLE, levels of 0.005–0.44 pg/L of polychlorinated biphenyls(PCBs) were detected in Arctic ice and snow [4]. To avoid the useof large solvent volumes in LLE, Solid Phase Extraction (SPE) base
techniques have been deployed. Using C18 cartridges, 1–6 L of snowwas preconcentrated and yielded LODs between 0.63 and 27 pg/Lfor polybromodiphenyl ethers (PBDEs) [12]. Speedisks were alsoevaluated to process high sample volumes (up to 50 L) without theneed for sample filtration and provided mean recoveries of 68%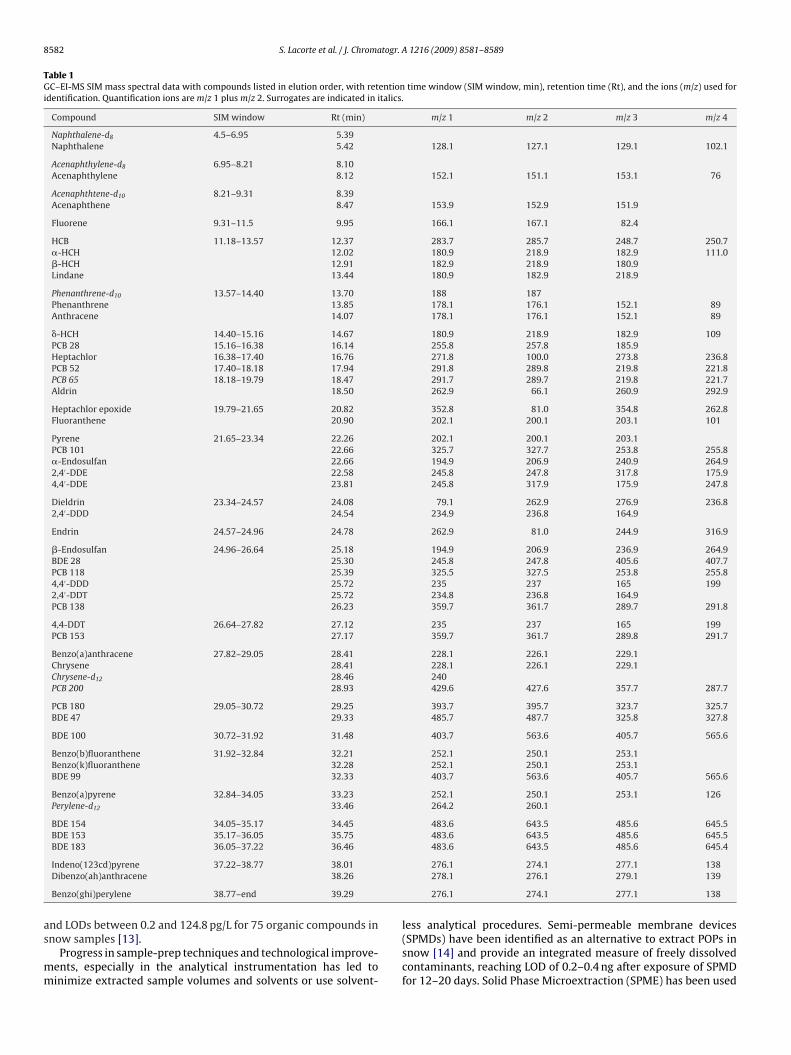
8582 S. Lacorte et al. / J. Chromatogr. A 1216 (2009) 8581–8589
Table 1GC–EI-MS SIM mass spectral data with compounds listed in elution order, with retention time window (SIM window, min), retention time (Rt), and the ions (m/z) used foridentification. Quantification ions are m/z 1 plus m/z 2. Surrogates are indicated in italics.
Compound SIM window Rt (min) m/z 1 m/z 2 m/z 3 m/z 4
Naphthalene-d8 4.5–6.95 5.39Naphthalene 5.42 128.1 127.1 129.1 102.1
Acenaphthylene-d8 6.95–8.21 8.10Acenaphthylene 8.12 152.1 151.1 153.1 76
Acenaphthtene-d10 8.21–9.31 8.39Acenaphthene 8.47 153.9 152.9 151.9
Fluorene 9.31–11.5 9.95 166.1 167.1 82.4
HCB 11.18–13.57 12.37 283.7 285.7 248.7 250.7�-HCH 12.02 180.9 218.9 182.9 111.0�-HCH 12.91 182.9 218.9 180.9Lindane 13.44 180.9 182.9 218.9
Phenanthrene-d10 13.57–14.40 13.70 188 187Phenanthrene 13.85 178.1 176.1 152.1 89Anthracene 14.07 178.1 176.1 152.1 89
�-HCH 14.40–15.16 14.67 180.9 218.9 182.9 109PCB 28 15.16–16.38 16.14 255.8 257.8 185.9Heptachlor 16.38–17.40 16.76 271.8 100.0 273.8 236.8PCB 52 17.40–18.18 17.94 291.8 289.8 219.8 221.8PCB 65 18.18–19.79 18.47 291.7 289.7 219.8 221.7Aldrin 18.50 262.9 66.1 260.9 292.9
Heptachlor epoxide 19.79–21.65 20.82 352.8 81.0 354.8 262.8Fluoranthene 20.90 202.1 200.1 203.1 101
Pyrene 21.65–23.34 22.26 202.1 200.1 203.1PCB 101 22.66 325.7 327.7 253.8 255.8�-Endosulfan 22.66 194.9 206.9 240.9 264.92,4′-DDE 22.58 245.8 247.8 317.8 175.94,4′-DDE 23.81 245.8 317.9 175.9 247.8
Dieldrin 23.34–24.57 24.08 79.1 262.9 276.9 236.82,4′-DDD 24.54 234.9 236.8 164.9
Endrin 24.57–24.96 24.78 262.9 81.0 244.9 316.9
�-Endosulfan 24.96–26.64 25.18 194.9 206.9 236.9 264.9BDE 28 25.30 245.8 247.8 405.6 407.7PCB 118 25.39 325.5 327.5 253.8 255.84,4′-DDD 25.72 235 237 165 1992,4′-DDT 25.72 234.8 236.8 164.9PCB 138 26.23 359.7 361.7 289.7 291.8
4,4-DDT 26.64–27.82 27.12 235 237 165 199PCB 153 27.17 359.7 361.7 289.8 291.7
Benzo(a)anthracene 27.82–29.05 28.41 228.1 226.1 229.1Chrysene 28.41 228.1 226.1 229.1Chrysene-d12 28.46 240PCB 200 28.93 429.6 427.6 357.7 287.7
PCB 180 29.05–30.72 29.25 393.7 395.7 323.7 325.7BDE 47 29.33 485.7 487.7 325.8 327.8
BDE 100 30.72–31.92 31.48 403.7 563.6 405.7 565.6
Benzo(b)fluoranthene 31.92–32.84 32.21 252.1 250.1 253.1Benzo(k)fluoranthene 32.28 252.1 250.1 253.1BDE 99 32.33 403.7 563.6 405.7 565.6
Benzo(a)pyrene 32.84–34.05 33.23 252.1 250.1 253.1 126Perylene-d12 33.46 264.2 260.1
BDE 154 34.05–35.17 34.45 483.6 643.5 485.6 645.5BDE 153 35.17–36.05 35.75 483.6 643.5 485.6 645.5BDE 183 36.05–37.22 36.46 483.6 643.5 485.6 645.4
as
mm
Indeno(123cd)pyrene 37.22–38.77 38.01Dibenzo(ah)anthracene 38.26
Benzo(ghi)perylene 38.77–end 39.29
nd LODs between 0.2 and 124.8 pg/L for 75 organic compounds innow samples [13].
Progress in sample-prep techniques and technological improve-ents, especially in the analytical instrumentation has led toinimize extracted sample volumes and solvents or use solvent-
276.1 274.1 277.1 138278.1 276.1 279.1 139
276.1 274.1 277.1 138
less analytical procedures. Semi-permeable membrane devices(SPMDs) have been identified as an alternative to extract POPs insnow [14] and provide an integrated measure of freely dissolvedcontaminants, reaching LOD of 0.2–0.4 ng after exposure of SPMDfor 12–20 days. Solid Phase Microextraction (SPME) has been used
S. Lacorte et al. / J. Chromatogr. A 1216 (2009) 8581–8589 8583
pled
twtisothcfamdai2
mPgbatpSthtta
2
2
rAi
Fig. 1. Map showing the locations where ice cores were sam
o determine OC pesticides in Himalayan ice using only 35 mL ofater [15]. This technique is solvent-free and is characterized by
he fact that analytes are extracted on a fiber which is then injectedn a GC–MS, minimizing sample manipulation and increasing inensitivity since all extracted analytes are detected. The outcomef stir bar sorptive extraction (SBSE) followed by thermal desorp-ion and GC–MS further improves the method sensitivity since itas higher capacity than SPME. By using 100 mL of water, all pre-oncentrated compounds are detected, lowering the LODs to ng/Lor PAHs, PCBs and pesticides [16]. This technique has additionaldvantages such as minimal sample manipulation, implying mini-al external contamination risk and is also solventless. This recent
evelopment was timely, as its application could be instrumental inchieving an increase of knowledge on pollutant loads in the polarce sought as one of the aims of the International Polar Year (IPY007–2008).
The aim of the present study was to develop an ultra-sensitiveethodology based in SBSE-GC–MS to identify a large number of
OPs in Arctic ice cores collected during the 2007 ATOS oceano-raphic campaign. First, in situ extraction conditions (consideringoat movement and limited laboratory facilities) were optimized inn attempt to: (i) reduce the amount of ice extracted in comparisono state of the art methods; (ii) avoid the burden to store and trans-ort large water volumes and (iii) increase the sample throughput.econd, the analytical conditions were carefully optimized to reachhe 0.1 pg/L sensitivity for four chemical families of POPs. We reportere the new approach and its performance, as well as its utilityo determine the levels of contaminants in Arctic cores, which arehen compared with values reported in the literature using othernalytical methods.
. Experimental
.1. Chemicals and reagents
Compounds analyzed are indicated in Table 1. Sixteen Envi-onmental Protection Agency (EPA) PAHs were purchased fromccuStandard (New Haven, CT, USA) as a mix solution at 200 mg/L
n methanol. The internal standard solution used to quantify
during the Arctic ATOS campaign carried out in July 2007.
these compounds contained naphthalene-d8, acenaphthylene-d8,acenaphthene-d10, phenanthrene-d10, chrysene-d12 and perylene-d12 at 2 mg/L in methanol (Supelco, Bellefonte, USA). PCBs werepurchased as a mix solution at 10 mg/L in iso-octane and OCpesticides at 100 mg/L in methanol (Dr. Ehrenstorfer, Augsburg,Germany). The main PBDE congeners studied were bromodiphenylether (BDE) 28, BDE 47, BDE 100, BDE 99, BDE 154, BDE 153 andBDE 183, purchased at 1 �g/mL in nonane (Cambridge Isotope Lab-oratories, Inc., Andover, MA, USA). BDE 209 was not analyzed sinceit implied a separate GC method. PCB 65 and 200 (Dr. Ehrenstorfer)were used as internal standards for all halogenated compounds.Methanol and HPLC grade water were from Merck (Darmstadt,Germany).
2.2. Sampling area
The cruise was conducted on board of the Spanish Research Ves-sel (R/V) “Hespérides” from June 28 to July 28, 2007, sailing fromIceland to the Fram Strait. Seven ice stations were sampled alongthe cruise track (Fig. 1), corresponding to multi-year ice rangingin thickness from 2 to 3 m. At each station, 1 m deep × 7.25 cmdiameter ice cores were collected using a motorized Mark III coringdevice (Kovacs Enterprise Inc.), removing the unconsolidated sur-face snow and ice before sampling. The blades of the coring devicewere stainless steel and were rinsed with MilliQ water prior to eachsampling event. The individual ice cores were inserted inside a pre-cleaned PVC core holder and transported to the research vessel,where they were kept at −12 ◦C until sectioned, typically within2 h after sampling. From each 1 m long ice core, the 20 cm extremeswere cut using an acetone precleaned knife and placed in a PFTEbag, sealed totally and left in a cooler at the side of the ship (0–5 ◦C)until melted.
2.3. Extraction procedure
SBSE extraction was performed in situ in the vessellaboratories. 100 mL ice melt water was transferred in awater–methanol–acetone pre-washed Erlenmeyer flasks where10 mL of MeOH were added together with 100–500 pg of the

8 togr.
iTd(alcs9tecbp
K
wdordˇt[hPi
%
KsKte
%
lhPeebdarri
ftpcspisr
584 S. Lacorte et al. / J. Chroma
nternal standards. At this step, new precleaned stir bars (orwisters) were added in the Erlenmeyer flask which were imme-iately capped and placed on the 15 position magnetic stirrerGerstel, GmbH, Mülheuim a/d Ruhr, Germany) at room temper-ture, in the dark. Extractions were carried out with new 20 mmength × 1.0 mm film thickness polydimethylsiloxane (PDMS)oated stir bars which corresponded to 126 �L of phase. Eachample was extracted in duplicate. Samples were agitated at00 rpm during 24 h to reach an equilibrium partitioning betweenhe dissolved chemical and the PDMS phase of the stir bar. Thextraction of solutes from aqueous phase into PDMS phase isontrolled by the PDMS/water partition coefficient (approximatedy the octanol water coefficient, log KOW) to the mass of analyteresent in the aqueous sample of a known volume, according to:
ow»KPDMS/W = CPDMS
CW= mPDMS
mW
VW
VPDMS= mPDMS
mWˇ
here KPDMS/W is the distribution coefficient between poly-imethylsiloxane and water; CPDMS and CW are the concentrationf a solute in the polydimethylsiloxane phase and in the water,espectively; mPDMS and mW are the mass of the solute in the poly-imethylsiloxane phase and in the aqueous phase, respectively andis the phase ratio (ˇ = Vw/VPDMS, which represents the volume of
he PDMS coated Twister and the volume of water, respectively17,18]). All target analytes studied exhibit KOW that reflect highydrophobicity and thus have a high tendency to diffuse onto theDMS phase. A theoretical percent recovery for a given analyte initially dissolved in water is given by:
R SBSE =Ki
PDMD/W/ˇ
1 + KiPDMD/W/ˇ
× 100
If the KSBSE for any specific compound is substituted by itsOW, the theoretical percent recovery can be calculated. In ourpecific case, and using BDE 47 as an example, considering theOW = 5.9 × 10⁶, the sample volume of 100 mL and the volume ofhe PDMS fiber of 126 �L, substituting these values to the abovequation, we obtain:
R SBSE = 5.9 × 10⁶/(126/105)
1 + 5.9 × 10⁶/(126/105)× 100 ≈ 100
This calculation predicts that the recovery for this specific ana-yte would be of 100%. As demonstrated by other authors, KOWigher than 3.5 ensures an efficient partitioning of solutes to theDMS phase within 2 h, and partitioning increases with longerxtraction times, leading to higher sensitivities [19,20]. After 24 hxtraction, time chosen for the above mentioned conditions, stirars were removed with tweezers, rinsed with HPLC grade water,ried with a lint-free tissue and placed into the insert of a 2 mL vialnd capped. The preconcentrated SBSE bars were kept at 4 ◦C in theefrigerator of the boat during 4 months, time that took the ship toeach Spain. Once samples were gathered from the ship, they weremmediately processed in the land-based laboratory.
To prevent any external source of contamination and to ensureull recovery of target analytes, some precautions were taken in
he extraction and storage steps in the boat conditions: (i) ice coresieces were placed from the holders into the Teflon bags inside aool room avoiding any contact with hands; (ii) Teflon bags wereealed until melted; (iii) 100 mL of melt water (in duplicate) waslace directly inside the precleaned Erlenmeyer flask and cappedmmediately after so that there was no contact with ship atmo-phere; (iv) storage conditions were controlled by measuring theecoveries of internal standards in each sample.
A 1216 (2009) 8581–8589
2.4. Instrumental analysis
An Agilent 6890GC/5975B MS system (Agilent Technologies,Palo Alto, CA, USA) equipped with a programmed-temperaturevaporization (PTV) injector was used. Two stir bars (correspond-ing each to 100 mL of extracted melt water) were placed insidea precleaned Twister Desorption Liners (Gerstel), capped with asealed Transportation Adapter and placed on a Autosample Tray.Stir bars were thermally desorbed in a thermal desorption unit(TDU from Gerstel) connected to the PTV injector CIS-4 (Ger-stel) by a heated transfer line. TD was performed from 15 ◦C(holding time 0.8 min) and then increased at 60 ◦C/min to 280 ◦Cheld during 7 min (desorption parameters). Helium flow wasset at 50 mL/min. The PTV injector temperature was held at8 ◦C during 0.1 min and then increased to 325 ◦C at 10 ◦C/s andfinally held during 7 min. An Agilent HP-5MS (30 m × 0.25 mmi.d. × 0.25 �m film thickness) capillary column was used. The oventemperature was programmed from 70 ◦C (holding time 2 min)to 150 ◦C at 25 ◦C/min, to 200 ◦C at 3 ◦C/min and finally to 280 ◦Cat 8 ◦C/min, keeping the final temperature for 10 min. Transferline and ion source temperatures were 280 and 230 ◦C, respec-tively.
Data acquisition was performed simultaneously using full scanconditions over a mass range of 44–750 amu and time scheduledSelected Ion Monitoring (SIM) using three or four ions per com-pound (Table 2). To enhance sensitivity, the SIM program wasoptimized using the autoSIM option and resulted in 27 chromato-graphic windows where one to seven compounds were included,thus diminishing the number of ions displayed in each window andtherefore, increasing in sensitivity. The sum of the two most abun-dant ions per compound was used for quantification. Peak detectionand integration was carried out using MSD ChemStation (Agilent)software using external standard quantification. The concentrationof target analytes was corrected by the recovery of each surrogatestandard in cases where recoveries were lower than 70% (Table 3).
2.5. Quality control/quality assurance
To prevent contamination and to obtain reliable POPs data,special care was given to blank analysis and to sensitivity and iden-tification criteria.
As for blank analysis, HPLC grade water was extracted in boatconditions to evaluate possible external contributions of any ofthe target compounds. We also performed laboratory blanks usingHPLC grade water and we evaluated the memory effect of emptyTwister Desorption Liners used in the TDU of the GC to evaluatecarry over effects among samples.
Method optimization was performed with HPLC grade water. Acalibration curve at 1, 5, 10, 20, 50, 90, 180, 460, 900, 1360 and1800 pg/L (the last two concentrations were measured only forPAHs) with internal standards at 500 pg for deuterated PAHs and100 pg for PCBs. Recoveries were tested in HPLC water spiked at10 pg/L level. LODs for organohalogenated compounds were cal-culated by dividing the sum of the intercept value plus 3 timesits standard deviation by the slope, both obtained from the cal-ibration curve. This technique relies on the overall performanceof the calibration, not just the response at one concentration. ForPAHs, since boat blanks contained traces between 98 and 300 pg/L,LODs were calculated using 3 times the standard deviation of threeblanks.
All target compounds should undergo the following identifica-
tion and confirmation criteria: (i) each compound was identifiedusing at least three specific ions; (ii) the retention time of targetcompounds should be within 3 s to that of a standard; (iii) the iso-tope ratio of the two ions monitored per congener should be within20% of the theoretical isotopic ratio, and (iv) the signal to noise ratio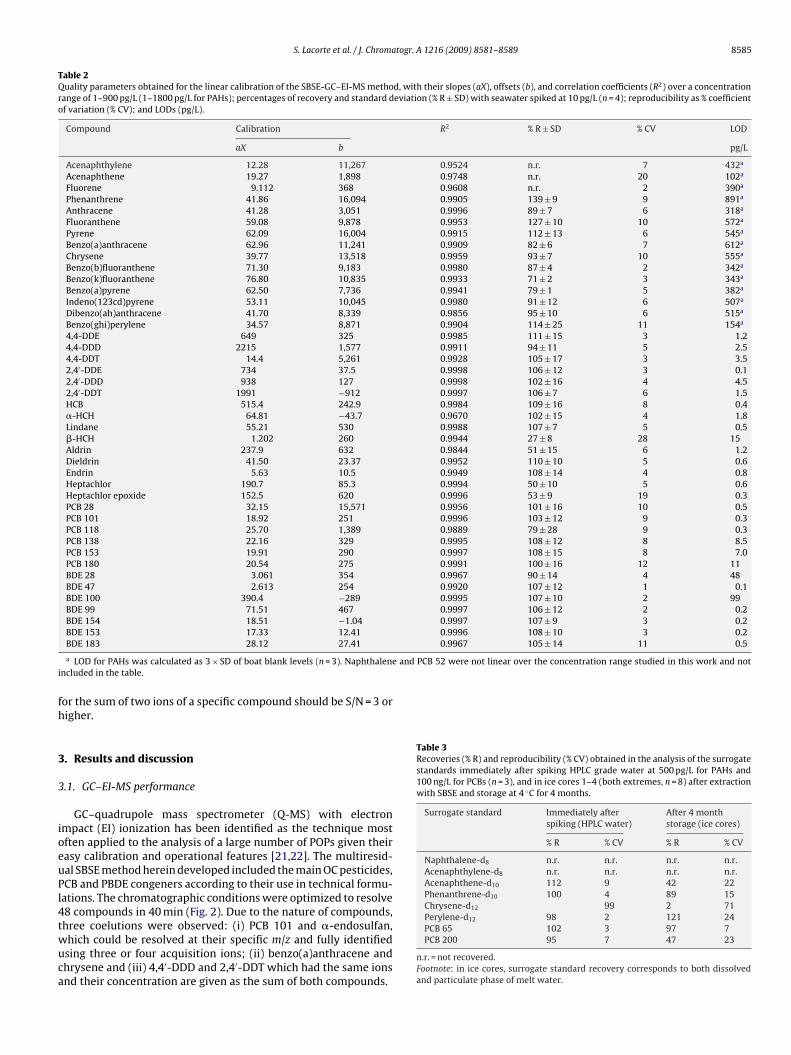
S. Lacorte et al. / J. Chromatogr. A 1216 (2009) 8581–8589 8585
Table 2Quality parameters obtained for the linear calibration of the SBSE-GC–EI-MS method, with their slopes (aX), offsets (b), and correlation coefficients (R2) over a concentrationrange of 1–900 pg/L (1–1800 pg/L for PAHs); percentages of recovery and standard deviation (% R ± SD) with seawater spiked at 10 pg/L (n = 4); reproducibility as % coefficientof variation (% CV); and LODs (pg/L).
Compound Calibration R2 % R ± SD % CV LOD
aX b pg/L
Acenaphthylene 12.28 11,267 0.9524 n.r. 7 432a
Acenaphthene 19.27 1,898 0.9748 n.r. 20 102a
Fluorene 9.112 368 0.9608 n.r. 2 390a
Phenanthrene 41.86 16,094 0.9905 139 ± 9 9 891a
Anthracene 41.28 3,051 0.9996 89 ± 7 6 318a
Fluoranthene 59.08 9,878 0.9953 127 ± 10 10 572a
Pyrene 62.09 16,004 0.9915 112 ± 13 6 545a
Benzo(a)anthracene 62.96 11,241 0.9909 82 ± 6 7 612a
Chrysene 39.77 13,518 0.9959 93 ± 7 10 555a
Benzo(b)fluoranthene 71.30 9,183 0.9980 87 ± 4 2 342a
Benzo(k)fluoranthene 76.80 10,835 0.9933 71 ± 2 3 343a
Benzo(a)pyrene 62.50 7,736 0.9941 79 ± 1 5 382a
Indeno(123cd)pyrene 53.11 10,045 0.9980 91 ± 12 6 507a
Dibenzo(ah)anthracene 41.70 8,339 0.9856 95 ± 10 6 515a
Benzo(ghi)perylene 34.57 8,871 0.9904 114 ± 25 11 154a
4,4-DDE 649 325 0.9985 111 ± 15 3 1.24,4-DDD 2215 1,577 0.9911 94 ± 11 5 2.54,4-DDT 14.4 5,261 0.9928 105 ± 17 3 3.52,4′-DDE 734 37.5 0.9998 106 ± 12 3 0.12,4′-DDD 938 127 0.9998 102 ± 16 4 4.52,4′-DDT 1991 −912 0.9997 106 ± 7 6 1.5HCB 515.4 242.9 0.9984 109 ± 16 8 0.4�-HCH 64.81 −43.7 0.9670 102 ± 15 4 1.8Lindane 55.21 530 0.9988 107 ± 7 5 0.5�-HCH 1.202 260 0.9944 27 ± 8 28 15Aldrin 237.9 632 0.9844 51 ± 15 6 1.2Dieldrin 41.50 23.37 0.9952 110 ± 10 5 0.6Endrin 5.63 10.5 0.9949 108 ± 14 4 0.8Heptachlor 190.7 85.3 0.9994 50 ± 10 5 0.6Heptachlor epoxide 152.5 620 0.9996 53 ± 9 19 0.3PCB 28 32.15 15,571 0.9956 101 ± 16 10 0.5PCB 101 18.92 251 0.9996 103 ± 12 9 0.3PCB 118 25.70 1,389 0.9889 79 ± 28 9 0.3PCB 138 22.16 329 0.9995 108 ± 12 8 8.5PCB 153 19.91 290 0.9997 108 ± 15 8 7.0PCB 180 20.54 275 0.9991 100 ± 16 12 11BDE 28 3.061 354 0.9967 90 ± 14 4 48BDE 47 2.613 254 0.9920 107 ± 12 1 0.1BDE 100 390.4 −289 0.9995 107 ± 10 2 99BDE 99 71.51 467 0.9997 106 ± 12 2 0.2BDE 154 18.51 −1.04 0.9997 107 ± 9 3 0.2
0.9996 108 ± 10 3 0.20.9967 105 ± 14 11 0.5
and PCB 52 were not linear over the concentration range studied in this work and noti
fh
3
3
ioeuPl4twuca
Table 3Recoveries (% R) and reproducibility (% CV) obtained in the analysis of the surrogatestandards immediately after spiking HPLC grade water at 500 pg/L for PAHs and100 ng/L for PCBs (n = 3), and in ice cores 1–4 (both extremes, n = 8) after extractionwith SBSE and storage at 4 ◦C for 4 months.
Surrogate standard Immediately afterspiking (HPLC water)
After 4 monthstorage (ice cores)
% R % CV % R % CV
Naphthalene-d8 n.r. n.r. n.r. n.r.Acenaphthylene-d8 n.r. n.r. n.r. n.r.Acenaphthene-d10 112 9 42 22Phenanthrene-d10 100 4 89 15Chrysene-d12 99 2 71Perylene-d12 98 2 121 24
BDE 153 17.33 12.41BDE 183 28.12 27.41
a LOD for PAHs was calculated as 3 × SD of boat blank levels (n = 3). Naphthalenencluded in the table.
or the sum of two ions of a specific compound should be S/N = 3 origher.
. Results and discussion
.1. GC–EI-MS performance
GC–quadrupole mass spectrometer (Q-MS) with electronmpact (EI) ionization has been identified as the technique mostften applied to the analysis of a large number of POPs given theirasy calibration and operational features [21,22]. The multiresid-al SBSE method herein developed included the main OC pesticides,CB and PBDE congeners according to their use in technical formu-ations. The chromatographic conditions were optimized to resolve8 compounds in 40 min (Fig. 2). Due to the nature of compounds,
hree coelutions were observed: (i) PCB 101 and �-endosulfan,hich could be resolved at their specific m/z and fully identifiedsing three or four acquisition ions; (ii) benzo(a)anthracene andhrysene and (iii) 4,4′-DDD and 2,4′-DDT which had the same ionsnd their concentration are given as the sum of both compounds.PCB 65 102 3 97 7PCB 200 95 7 47 23
n.r. = not recovered.Footnote: in ice cores, surrogate standard recovery corresponds to both dissolvedand particulate phase of melt water.
8586 S. Lacorte et al. / J. Chromatogr.
FDi
1tTsdoftgRrep
3
scuwpsAmB
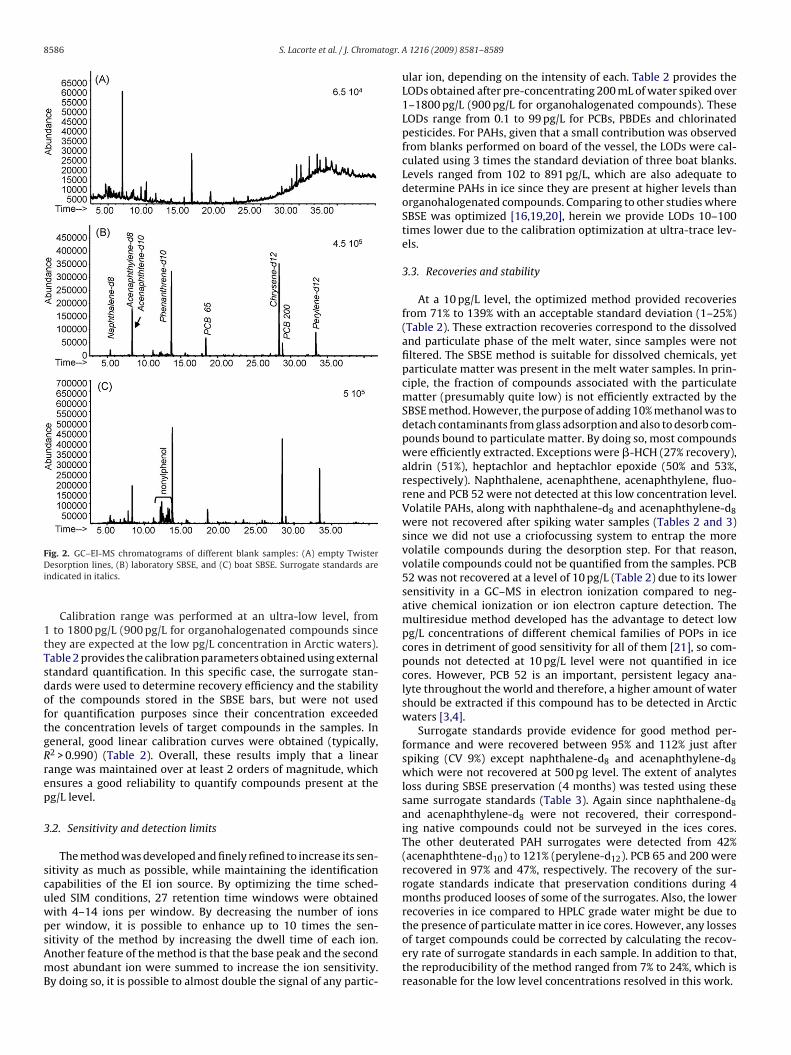
ig. 2. GC–EI-MS chromatograms of different blank samples: (A) empty Twisteresorption lines, (B) laboratory SBSE, and (C) boat SBSE. Surrogate standards are
ndicated in italics.
Calibration range was performed at an ultra-low level, fromto 1800 pg/L (900 pg/L for organohalogenated compounds since
hey are expected at the low pg/L concentration in Arctic waters).able 2 provides the calibration parameters obtained using externaltandard quantification. In this specific case, the surrogate stan-ards were used to determine recovery efficiency and the stabilityf the compounds stored in the SBSE bars, but were not usedor quantification purposes since their concentration exceededhe concentration levels of target compounds in the samples. Ineneral, good linear calibration curves were obtained (typically,2 > 0.990) (Table 2). Overall, these results imply that a linearange was maintained over at least 2 orders of magnitude, whichnsures a good reliability to quantify compounds present at theg/L level.
.2. Sensitivity and detection limits
The method was developed and finely refined to increase its sen-itivity as much as possible, while maintaining the identificationapabilities of the EI ion source. By optimizing the time sched-led SIM conditions, 27 retention time windows were obtainedith 4–14 ions per window. By decreasing the number of ions
er window, it is possible to enhance up to 10 times the sen-itivity of the method by increasing the dwell time of each ion.nother feature of the method is that the base peak and the secondost abundant ion were summed to increase the ion sensitivity.y doing so, it is possible to almost double the signal of any partic-
A 1216 (2009) 8581–8589
ular ion, depending on the intensity of each. Table 2 provides theLODs obtained after pre-concentrating 200 mL of water spiked over1–1800 pg/L (900 pg/L for organohalogenated compounds). TheseLODs range from 0.1 to 99 pg/L for PCBs, PBDEs and chlorinatedpesticides. For PAHs, given that a small contribution was observedfrom blanks performed on board of the vessel, the LODs were cal-culated using 3 times the standard deviation of three boat blanks.Levels ranged from 102 to 891 pg/L, which are also adequate todetermine PAHs in ice since they are present at higher levels thanorganohalogenated compounds. Comparing to other studies whereSBSE was optimized [16,19,20], herein we provide LODs 10–100times lower due to the calibration optimization at ultra-trace lev-els.
3.3. Recoveries and stability
At a 10 pg/L level, the optimized method provided recoveriesfrom 71% to 139% with an acceptable standard deviation (1–25%)(Table 2). These extraction recoveries correspond to the dissolvedand particulate phase of the melt water, since samples were notfiltered. The SBSE method is suitable for dissolved chemicals, yetparticulate matter was present in the melt water samples. In prin-ciple, the fraction of compounds associated with the particulatematter (presumably quite low) is not efficiently extracted by theSBSE method. However, the purpose of adding 10% methanol was todetach contaminants from glass adsorption and also to desorb com-pounds bound to particulate matter. By doing so, most compoundswere efficiently extracted. Exceptions were �-HCH (27% recovery),aldrin (51%), heptachlor and heptachlor epoxide (50% and 53%,respectively). Naphthalene, acenaphthene, acenaphthylene, fluo-rene and PCB 52 were not detected at this low concentration level.Volatile PAHs, along with naphthalene-d8 and acenaphthylene-d8were not recovered after spiking water samples (Tables 2 and 3)since we did not use a criofocussing system to entrap the morevolatile compounds during the desorption step. For that reason,volatile compounds could not be quantified from the samples. PCB52 was not recovered at a level of 10 pg/L (Table 2) due to its lowersensitivity in a GC–MS in electron ionization compared to neg-ative chemical ionization or ion electron capture detection. Themultiresidue method developed has the advantage to detect lowpg/L concentrations of different chemical families of POPs in icecores in detriment of good sensitivity for all of them [21], so com-pounds not detected at 10 pg/L level were not quantified in icecores. However, PCB 52 is an important, persistent legacy ana-lyte throughout the world and therefore, a higher amount of watershould be extracted if this compound has to be detected in Arcticwaters [3,4].
Surrogate standards provide evidence for good method per-formance and were recovered between 95% and 112% just afterspiking (CV 9%) except naphthalene-d8 and acenaphthylene-d8which were not recovered at 500 pg level. The extent of analytesloss during SBSE preservation (4 months) was tested using thesesame surrogate standards (Table 3). Again since naphthalene-d8and acenaphthylene-d8 were not recovered, their correspond-ing native compounds could not be surveyed in the ices cores.The other deuterated PAH surrogates were detected from 42%(acenaphthtene-d10) to 121% (perylene-d12). PCB 65 and 200 wererecovered in 97% and 47%, respectively. The recovery of the sur-rogate standards indicate that preservation conditions during 4months produced looses of some of the surrogates. Also, the lowerrecoveries in ice compared to HPLC grade water might be due to
the presence of particulate matter in ice cores. However, any lossesof target compounds could be corrected by calculating the recov-ery rate of surrogate standards in each sample. In addition to that,the reproducibility of the method ranged from 7% to 24%, which isreasonable for the low level concentrations resolved in this work.
S. Lacorte et al. / J. Chromatogr. A 1216 (2009) 8581–8589 8587
Table 4Concentration levels of target organochlorinated pesticides, PCBs and PBDEs (pg/L) in superficial (S) and deep (D) ice cores from the Arctic Ocean collected in July 2007.Compounds not included in the table were not detected. Sample codes as in Fig. 1.
Compounds Core 1 Core 2 Core 3 Core 4 Core 5 Core 6 Core 7
S D S D S D S D S D S D S D
�-HCH 72 51 129 230 94 55 253 172 88 0.8 155 221 200 2584,4′-DDT Int. Int. 81 116 70 80 43 117 35 n.d. 37 20 21 n.d.4,4′-DDE Int. n.d. 15 15 n.d. n.d. n.d. n.d. 19 4.7 26 19 33 294,4′-DDD + 2,4′-DDT n.d. 34 73 18 n.d. n.d. n.d. n.d. n.d. n.d. n.d. n.d. n.d. 62PCB 28 n.d. n.d. n.d. n.d. 30 14 n.d. n.d. n.d. n.d. n.d. n.d. n.d. n.d.PCB 101 22 n.d. 1.5 7.3 22 21 1.9 n.d. 2.5 n.d. 11 n.d. 28 16PCB 118 2.2 n.d. n.d. n.d. 13 14 n.d. n.d. 16 n.d. 98 n.d. 42 25
d.d.
I
3
micjwemaePbbn[Dm
iwpn
3
eman(clcaam
miiiDct1tu
PBDE 47 0.8 0.9 2.2 2.3 0.5 n.PBDE 99 0.5 0.5 1.5 1.6 n.d. n.
nt. = interference in this specific sample; n.d. = not detected.
.4. Blank analysis
Ultra-trace analysis of POPs in Arctic ice requires that sampleanipulation is minimized, which in turns avoids sample contam-
nation and improves the precision of the analysis. In our particularase, ice cores were directly transferred to precleaned Teflon bagsust after collection and cutting. Once they were melted, 100 mL
ere transferred in precleaned capped Erlenmeyer flasks, andxtracted on board (in duplicate). Fig. 2 shows that blank chro-atograms obtained from HPLC grade water extracted in the ship
nd those obtained in the land-based laboratory were very similar,xcept for a big contribution of nonylphenol in boat blanks (Fig. 2C).AHs were detected in boat blanks and at lower level, in laboratorylanks. Organohalogenated compounds were not present in anylank sample, indicating that possible external sample contami-ation from the ship’s atmosphere, which may contain, e.g. PCBs23], was not detected. To control carry over effects, empty Twisteresorption Liners were also analyzed (Fig. 2A) and they showed noemory effects.In the context of the ice sampling procedure, since the ice cor-
ng device system was running with gasoline, high levels of PAHsere detected in the analyzed ice samples, with no clear apparentatterns. Due to this external source of contamination, PAHs wereot quantified in ice core samples.
.5. Utility of the method to detect POPs in Arctic ice cores
POPs were detected in the ice cores collected in the Arctic ATOSxpedition in summer 2007 (Table 4), thus proving the utility of theethod to reach the pg/L concentration. Levels varied between 0.5
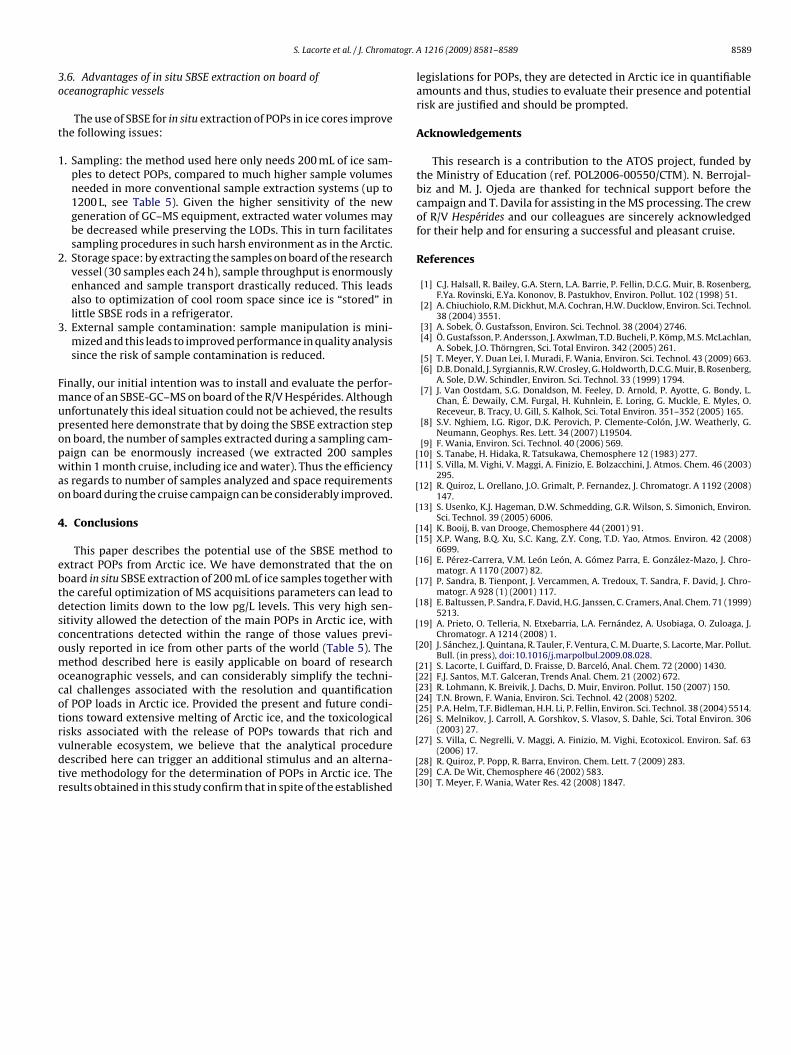
nd 258 pg/L with concentrations in surface ice cores (0–20 cm)ot differing statistically from concentrations in deep ice cores80–100 cm) (t-test one side, p = 0.05). Also, there was no signifi-ant difference among POP concentrations in the seven samplingocations, given their proximity. Fig. 3 shows a SIM chromatogramorresponding to an ice sample, with specific traces for PBDEs 47nd 99 as an example, where the different ions with their specificbundance show the identification capabilities of the developedethod.Among OC pesticides, �-HCH was present in all samples and its
ean concentration was of 141 ± 83 pg/L. �-HCH has been usedn large amounts worldwide and although a global decrease ints use has been observed since 1962 [15], it has been detectedn the Arctic atmosphere at concentrations of 0.25–747 pg/m3 [1].DTs were detected in a fewer number of samples at a mean con-
entration of 44 ± 32 pg/L. Only the main 4,4′-DDT isomers fromechnical DDT were identified in Arctic ice at levels from 4.7 to17 pg/L. In most sites, 4,4′-DDT concentrations were higher thanheir main metabolites, indicating no degradation of this still in-se pesticide. Drins, HCB and heptachlor were not detected in ice0.9 0 0.7 0.4 0.5 n.d. n.d. n.d.0.6 0.5 0.7 n.d. 0.5 n.d. n.d. n.d.
cores in agreement with their reduced usage worldwide. Concen-trations and patterns of OC pesticides detected in Arctic watersusing 200 mL of melt water are consistent with the levels of OCpesticide found in other parts of the world using other methods(Table 5).
In the ATOS campaign, the presence of PCB 118, 101 and 28 ina lesser extent dominated among all the PCB7 analyzed (Table 4).The presence of these more volatile PCBs is in agreement with theglobal distillation effect, which suggests the worldwide transportof lighter compounds to remote areas where atmosphere–surfacewater exchange takes place [24,25]. The mean PCB3 concentra-tion in ice melt water was of 20 ± 22 pg/L. These levels rangewithin those reported earlier. In a pioneering study performed in1983, Tanabe et al. detected �PCB between 310 and 610 pg/L inAntarctic ice by extracting 200–1200 L of water [10]. By extract-ing 180–200 kg of ice, concentrations of 2–15 pg/L and 3–40 pg/L of�PCB15 in the ice dissolved and particulate fraction, respectively,were detected in the Arctic Marginal Ice Zone, with predomi-nance of PCB 52 [4]. Other studies detected �PCB9 concentrationsbetween 200 and 700 pg/L in Ob-Yenisey River (Arctic) watershedby extracting 1 L of water [26]. A study from an Italian Alps glacierreports �PCB15 between 10 and 195 pg/L by extracting 0.6 L ofmelt water [27] and very recently, SBSE-GC/MS has been proven todetect PCBs in snow from the Aconcagua mountains (South Amer-ica), at levels up to 330 pg/L with predominance of four to sixchlorinated congeners [28].
In this study, we provide first evidence for the presence of PBDEsin Arctic ice. Only PBDEs 47 and 99 were detected, coinciding withthe main congeners present in technical penta PBDE formulationsused in a wide array of products such as building materials, elec-tronic devices, furnishings, motor vehicles, plastics, polyurethanefoams, and textiles [29]. PBDE concentrations ranged between 0.5and 2.3 pg/L, and they were in general 1 or 2 orders of magnitudelower than for PCBs, according to their more recent and moderateusage [29]. Only a very recent study on PBDEs in snow from theAlps, reported PBDEs 47, 99, 100, 153 and 183 at levels between5.2 and 56 pg/L [12], more than 10-fold higher concentrations thanthe ones detected in our ice samples.
Comparison of the POP levels detected in this study (Table 4)with those values previously reported from ice elsewhere (Table 5),indicate that the procedure developed here yields results analogousto those obtained using other analytical methods which in gen-eral extract higher melt water volumes. The additional ability ofthe proposed method to monitor several chemical families in Arc-tic ice may provide a comprehensive survey on the loads of POPs
stored in ice. Since the method can process many samples, it isenvisaged that it can be used to generate large data sets which canthen contribute to evaluate the release of contaminants into theArctic ecosystem and to study their bioavailability and associatedrisks for the receiving ecosystems [30].
8588 S. Lacorte et al. / J. Chromatogr. A 1216 (2009) 8581–8589
Fig. 3. GC–EI-MS chromatogram of an ice core sample (Surface Ice 6) with the specific ion traces for PBDEs 47 and 99 and their mass spectrum, to provide unequivocalidentification.
Table 5Selected studies indicating POP concentrations (pg/L) in ice with indication of the amount of extracted (in L) and of the used preconcentration technique.
L extracted HCHs DDTs PCBs HCB PBDEs
This study (Arctic) 0.2 L, SBSE 0.8–258 �-HCH 4.7–117 1.5–98 n.d. 0.5–2.2Tanabe et al. [10] (Antarctic) 200–1200 L, XAD2 SPE 2000–2200 �HCH 9.8–11 �DDTs 310–610 �PCBs n.a. n.a.Gustafsson et al. [4] (Barents Sea) 180–200 kg n.a. n.a. 0.04–6.44 n.a. n.a.Chiuchiolo et al. [2] (Antarctic) 100–130 L, particulate
matter10–40 (�-and �-HCH) 5–78 n.a. n.a. n.a.
Usenko et al. [13] (Oregon Cascades) 50 L, speedisk 77.8 n.a. n.a. n.a. n.a.Donald et al. [6] (Alberta glacier) 20 L water-eq., LLE 30–1000 10–50 �DDTs n.a. 25 n.a.Melnikov et al. [26] (Ob-Yenisey River) 1 L, LLE 500–1100 �HCH 200–1400 �DDTs 100–700 �PCBs n.a. n.a.Villa et al. [11] (Alpine glacier) 0.6–1 L, LLE 1000 1000–3000 4,4′-DDT n.a. 500 n.a.Villa et al. [27] (Alpine glacier) 0.6 L, LLE 120–2435 (�-HCH) 59–547 �DDTs 585–1994 �PCBs 21–168 n.a.Wang et al. [15] (Central Himalaya) 0.035 L, SPME 500–6500 �-HCH 100–1800 �DDTs n.a. n.a. n.a.Quiroz et al. [12] (Alps/Tatra Mountains)a 1–6 L, SPE n.a. n.a. n.a. n.a. 5.2–38a
Quiroz et al. [28] (Aconcagua)a 40 mL n.a. n.a. n.d.–330 n.a. n.a.
n.d. = not detected; n.a. = not analyzed.a Snow.
togr. A
3o
t
1
2
3
Fmupopwao
4
ebtdscomocotrvdtr
[[
[
[
[[
[
[
[
[
[
[[[[[[
S. Lacorte et al. / J. Chroma
.6. Advantages of in situ SBSE extraction on board ofceanographic vessels
The use of SBSE for in situ extraction of POPs in ice cores improvehe following issues:
. Sampling: the method used here only needs 200 mL of ice sam-ples to detect POPs, compared to much higher sample volumesneeded in more conventional sample extraction systems (up to1200 L, see Table 5). Given the higher sensitivity of the newgeneration of GC–MS equipment, extracted water volumes maybe decreased while preserving the LODs. This in turn facilitatessampling procedures in such harsh environment as in the Arctic.
. Storage space: by extracting the samples on board of the researchvessel (30 samples each 24 h), sample throughput is enormouslyenhanced and sample transport drastically reduced. This leadsalso to optimization of cool room space since ice is “stored” inlittle SBSE rods in a refrigerator.
. External sample contamination: sample manipulation is mini-mized and this leads to improved performance in quality analysissince the risk of sample contamination is reduced.
inally, our initial intention was to install and evaluate the perfor-ance of an SBSE-GC–MS on board of the R/V Hespérides. Although
nfortunately this ideal situation could not be achieved, the resultsresented here demonstrate that by doing the SBSE extraction stepn board, the number of samples extracted during a sampling cam-aign can be enormously increased (we extracted 200 samplesithin 1 month cruise, including ice and water). Thus the efficiency
s regards to number of samples analyzed and space requirementsn board during the cruise campaign can be considerably improved.
. Conclusions
This paper describes the potential use of the SBSE method toxtract POPs from Arctic ice. We have demonstrated that the onoard in situ SBSE extraction of 200 mL of ice samples together withhe careful optimization of MS acquisitions parameters can lead toetection limits down to the low pg/L levels. This very high sen-itivity allowed the detection of the main POPs in Arctic ice, withoncentrations detected within the range of those values previ-usly reported in ice from other parts of the world (Table 5). Theethod described here is easily applicable on board of research
ceanographic vessels, and can considerably simplify the techni-al challenges associated with the resolution and quantificationf POP loads in Arctic ice. Provided the present and future condi-ions toward extensive melting of Arctic ice, and the toxicological
isks associated with the release of POPs towards that rich andulnerable ecosystem, we believe that the analytical procedureescribed here can trigger an additional stimulus and an alterna-ive methodology for the determination of POPs in Arctic ice. Theesults obtained in this study confirm that in spite of the established[
[[[
1216 (2009) 8581–8589 8589
legislations for POPs, they are detected in Arctic ice in quantifiableamounts and thus, studies to evaluate their presence and potentialrisk are justified and should be prompted.
Acknowledgements
This research is a contribution to the ATOS project, funded bythe Ministry of Education (ref. POL2006-00550/CTM). N. Berrojal-biz and M. J. Ojeda are thanked for technical support before thecampaign and T. Davila for assisting in the MS processing. The crewof R/V Hespérides and our colleagues are sincerely acknowledgedfor their help and for ensuring a successful and pleasant cruise.
References
[1] C.J. Halsall, R. Bailey, G.A. Stern, L.A. Barrie, P. Fellin, D.C.G. Muir, B. Rosenberg,F.Ya. Rovinski, E.Ya. Kononov, B. Pastukhov, Environ. Pollut. 102 (1998) 51.
[2] A. Chiuchiolo, R.M. Dickhut, M.A. Cochran, H.W. Ducklow, Environ. Sci. Technol.38 (2004) 3551.
[3] A. Sobek, Ö. Gustafsson, Environ. Sci. Technol. 38 (2004) 2746.[4] Ö. Gustafsson, P. Andersson, J. Axwlman, T.D. Bucheli, P. Kömp, M.S. McLachlan,
A. Sobek, J.O. Thörngren, Sci. Total Environ. 342 (2005) 261.[5] T. Meyer, Y. Duan Lei, I. Muradi, F. Wania, Environ. Sci. Technol. 43 (2009) 663.[6] D.B. Donald, J. Syrgiannis, R.W. Crosley, G. Holdworth, D.C.G. Muir, B. Rosenberg,
A. Sole, D.W. Schindler, Environ. Sci. Technol. 33 (1999) 1794.[7] J. Van Oostdam, S.G. Donaldson, M. Feeley, D. Arnold, P. Ayotte, G. Bondy, L.
Chan, É. Dewaily, C.M. Furgal, H. Kuhnlein, E. Loring, G. Muckle, E. Myles, O.Receveur, B. Tracy, U. Gill, S. Kalhok, Sci. Total Environ. 351–352 (2005) 165.
[8] S.V. Nghiem, I.G. Rigor, D.K. Perovich, P. Clemente-Colón, J.W. Weatherly, G.Neumann, Geophys. Res. Lett. 34 (2007) L19504.
[9] F. Wania, Environ. Sci. Technol. 40 (2006) 569.10] S. Tanabe, H. Hidaka, R. Tatsukawa, Chemosphere 12 (1983) 277.11] S. Villa, M. Vighi, V. Maggi, A. Finizio, E. Bolzacchini, J. Atmos. Chem. 46 (2003)
295.12] R. Quiroz, L. Orellano, J.O. Grimalt, P. Fernandez, J. Chromatogr. A 1192 (2008)
147.13] S. Usenko, K.J. Hageman, D.W. Schmedding, G.R. Wilson, S. Simonich, Environ.
Sci. Technol. 39 (2005) 6006.14] K. Booij, B. van Drooge, Chemosphere 44 (2001) 91.15] X.P. Wang, B.Q. Xu, S.C. Kang, Z.Y. Cong, T.D. Yao, Atmos. Environ. 42 (2008)
6699.16] E. Pérez-Carrera, V.M. León León, A. Gómez Parra, E. González-Mazo, J. Chro-
matogr. A 1170 (2007) 82.17] P. Sandra, B. Tienpont, J. Vercammen, A. Tredoux, T. Sandra, F. David, J. Chro-
matogr. A 928 (1) (2001) 117.18] E. Baltussen, P. Sandra, F. David, H.G. Janssen, C. Cramers, Anal. Chem. 71 (1999)
5213.19] A. Prieto, O. Telleria, N. Etxebarria, L.A. Fernández, A. Usobiaga, O. Zuloaga, J.
Chromatogr. A 1214 (2008) 1.20] J. Sánchez, J. Quintana, R. Tauler, F. Ventura, C. M. Duarte, S. Lacorte, Mar. Pollut.
Bull. (in press), doi:10.1016/j.marpolbul.2009.08.028.21] S. Lacorte, I. Guiffard, D. Fraisse, D. Barceló, Anal. Chem. 72 (2000) 1430.22] F.J. Santos, M.T. Galceran, Trends Anal. Chem. 21 (2002) 672.23] R. Lohmann, K. Breivik, J. Dachs, D. Muir, Environ. Pollut. 150 (2007) 150.24] T.N. Brown, F. Wania, Environ. Sci. Technol. 42 (2008) 5202.25] P.A. Helm, T.F. Bidleman, H.H. Li, P. Fellin, Environ. Sci. Technol. 38 (2004) 5514.26] S. Melnikov, J. Carroll, A. Gorshkov, S. Vlasov, S. Dahle, Sci. Total Environ. 306
(2003) 27.27] S. Villa, C. Negrelli, V. Maggi, A. Finizio, M. Vighi, Ecotoxicol. Environ. Saf. 63
(2006) 17.28] R. Quiroz, P. Popp, R. Barra, Environ. Chem. Lett. 7 (2009) 283.29] C.A. De Wit, Chemosphere 46 (2002) 583.30] T. Meyer, F. Wania, Water Res. 42 (2008) 1847.