uganda - World Bank Documents & Reports
175
A WORLD BANK COUNTRY STUDY UGANDA Country Economic Memorandum aN r6 Public Disclosure Authorized Public Disclosure Authorized Public Disclosure Authorized Public Disclosure Authorized
-
Upload
khangminh22 -
Category
Documents
-
view
1 -
download
0
Transcript of uganda - World Bank Documents & Reports

A WORLD BANK COUNTRY STUDY
UGANDACountry Economic Memorandum
aN
r6
Pub
lic D
iscl
osur
e A
utho
rized
Pub
lic D
iscl
osur
e A
utho
rized
Pub
lic D
iscl
osur
e A
utho
rized
Pub
lic D
iscl
osur
e A
utho
rized

UGANDA
Country Economic Memorandum
This report is based on the findings of an economic mission which visited Uganda in
August 1981. The mission members were:
Mark Baird, mission leader and principal author
Robert Liebenthal, senior economist
Tigani Ibrahim, industrial economist
Jerry Bigosinski, transport consultant
Vaughan Sear, energy consultant
Stephen Heyneman, education specialist
Cynthia Angeles, debt specialist
Sally Chan, research assistant
and
Stefanie Berger, loan officer
The agriculture chapter also draws on the findings of a separate mission by Stephen
Carr and Joseph Wambia in July 1981. The report was reviewed with the Government
in February 1982 and some partial updating was completed at that time.
This is the first economic report prepared by the World Bank on Uganda since 1969. As
a result, the first chapter of Part I briefly reviews events prior to the 1978-79 war,
events which continue to have a major impact on the Ugandan economy. A discussion
of developments since the war, including the new financial program, is provided in
Chapter 2. Chapter 3 outlines the priority areas for further action, and the implications
of the balance of payments outlook for aid requirements. Part II is a more detailed
review of the problems and issues in five major sectors: agriculture, industry, transport,
energy, and education. The coverage of this report is by no means comprehensive, due
in part to the incomplete and unreliable data base as well as the World Bank's limited
contact with the country over the past decade. Important sectors not covered include
forestry, mining, construction, water supply, health, and housing. Nevertheless, the
report tries to identify the major economic issues facing the country at this time, and
outlines some of the key components of a rehabilitation program.
Note that the map included at the end of the report does not fully reflect recent
divisional boundary changes within Uganda.
Eastern Africa Regional Office
The World BankWashington, D.C., U.S.A.

The World Bank issues country economic studies in two series. This report is a working document
and is, as such, part of an informal series based wholly on materials originally prepared for
restricted use within the Bank. The text is not meant to be definitive, but is offered so as to make
some results of internal research widely available to scholars and practitioners throughout the
world. A second, more formal series entitled World Bank Country Economic Reports is pub-
lished for the Bank by The Johns Hopkins University Press, Baltimore and London. Titles of
these and all other bank publications may be found in the Catalog of Publications, which is
available free of charge from World Bank, Publications Unit, 1818 H Street, N.W., Washington,
D.C. 20433, U.S.A.
The views and interpretations in this report are the authors' and should not be attributed to the
World Bank, to its affiliated organizations, or to any individual acting in their behalf.
Copyright @ 1982 The International Bank for Reconstruction
and Development/The World Bank
The World Bank enjoys copyright under Protocol 2 of the Universal Copyright Convention.
Nevertheless, permission for reproduction of any part of this report is hereby granted provided
that full citation is made.
Library of Congress Cataloging in Publication DataMain entry under title:
Uganda, country economic memorandum.
(A World Bank country study)1. Uganda--Economic conditions--1971-1979.
2. Uganda--Economic conditions--1979- . I. WorldBank. II. Series.HC870.U37 1982 330.9676'lo4 82-13427ISBN o-8213-0027-X

UGANDA
COUNTRY ECONOMIC MEMORANDUM
Table of Contents
Page No.
Currency and Other EquivalentsCountry DataSummary and Conclusionsr. . . . . * * * * * * * * * * * * * * * *
PART I: AN OVERVIEW . . . . . . . . * * * * * * * * * * * * * 1
Chapter 1. Background . . . . . . . . . . . . . . . . . . . . . 3
A. Introduction . . . . . . . . .. o d u * * * * * * * * * * 3
B. The Military Regime . . . . . . . . . * * * * * * * * * 4
C. The 1978-79 War . . . . . . * * * * * * * * * * * * * 7
Chapter 2. Recent Developments. . . . . . . * * * * * * * * 9
A. Introduction . . . . . . . . .. r o d * * * * * * * * * * 9
B. The Post-War Period (Through mid 1981) . . . . . . . . . . 10
C. The New Financial Program . . . . . . . . . . . . . . . . 23
Chapter 3. Priorities and Prospects . . . . . . . . . . . . . . 27
A. Introduction . . . . . . . . . . . . * * * * i . . 27
B. Priority Areas for Further Action. . . . . . . . . . . . . 28
C. Foreign Exchange Prospects . . . . . . .o s * * * * * * * 36
PART II: SECTORAL REVIEWS . . . . . . . . . . . . . . . . . . . 47
Chapter 4. Agriculture. . . . . . . . . . . . . . . . . . . . . 49A. Introduction . . . . .. ri. .. .. .. .* * * * * * * * 49B. Present Conditions and Problems . . . . . . . . . . . 51
C. Rehabilitation Priorities. . . . . .. . . . . . . . . . . 60Annex. Livestock and Fisheries. . . . . . . . . . . . . . . . 71
Chapter 5. Industry . . . . . . . . . . . . . . . . . . . . . . 73A. Introduction . . . . . . . . .r o d * * * * * * * .. .. 73B. Problems and Policies. . . . . . . . . . . . . . . . . . . 76
Chapter 6. Transport. . . . . . . . . * * * * * * * * * * * * 87
A. Introduction . . . . . . . . . . . . . . . . . . . . . 87
B. Present Conditions and Problems. . . . . . . . * * * * * 87C. Rehabilitation Priorities. . . . . . . . . . . . . . . . . 94

Chapter 7. Energy . . * . * * * * * * * * * * * * * * * * * * 99A. Introduction . . . . .. o d * * * * * * * * * * * * * * * 99B. Electricity. . . . . . . . . . . . . . . . . . . . . . . . 100C. Petroleum. . . . . . . * * * * * * * * * * * * * * * * * 105
Chapter 8. Education. . . . . . . . . . . . . . . . . . . . . . 109
A. Introduction . . . . . . .o d * * * * .* * * * * * * * * 109
B. Present Conditions and Problems. . . . . . . . . . . . . . 110
C. Rehabilitation Priorities. . . . . . . . . . . . . . . . . 116
STATISTICAL APPENDIX (Including List of Tables). . . . . . . . . 119
Map

List of Text Tables Page No.
Chapter 2
2.1 Natio-al Account Summary. . . . . . . . . . . . . 112.2 Balance of Payments Summary . . . . . . . . . . . 142.3 Commitments of External Assistance, 1979-1981 . . 162.4 Selected Indicators of Budgetary Performance. . . 192.5 Open Market Prices for Selected Consumer Goods. . 222.6 Recent Adjustments in Official Prices . . . . . . 22
Chapter 3
3.1 Summary of Base Case Projections. . . . . . . . . 373.2 Balance of Payments Projections - Base Case . . . 383.3 Alternative Projections . . . . . . . . . . 39
Chapter 4
4.1 Crop Production . . . . . . . . . . . . . . . . . 504.2 Allocation of Robusta Coffee Earnings . . . . . . 554.3 Agricultural Producer Prices. . . . . . . . . . . 62
Chapter 5
5.1 Industrial Production . . . . . . . . . . . . . . 735.2 Register of Industrial Establishments, 1981 . . 765.3 Foreign Exchange Requirements for Industrial. . .
Rehabilitation. . . . . . . . . . . . . . . . . 78
Chapter 6
6.1 Transport Rates . . . . . . . . . . . . . . . . . 97
Chapter 8
8.1 Primary Academic Achievement. . . . . . . . . . . 112
List of Text Charts
Chapter 7
7.1 Electricity Consumption . . . . . . . . . . . . . 101
CURRENCY AND OTHER EQUIVALENTS
Currency
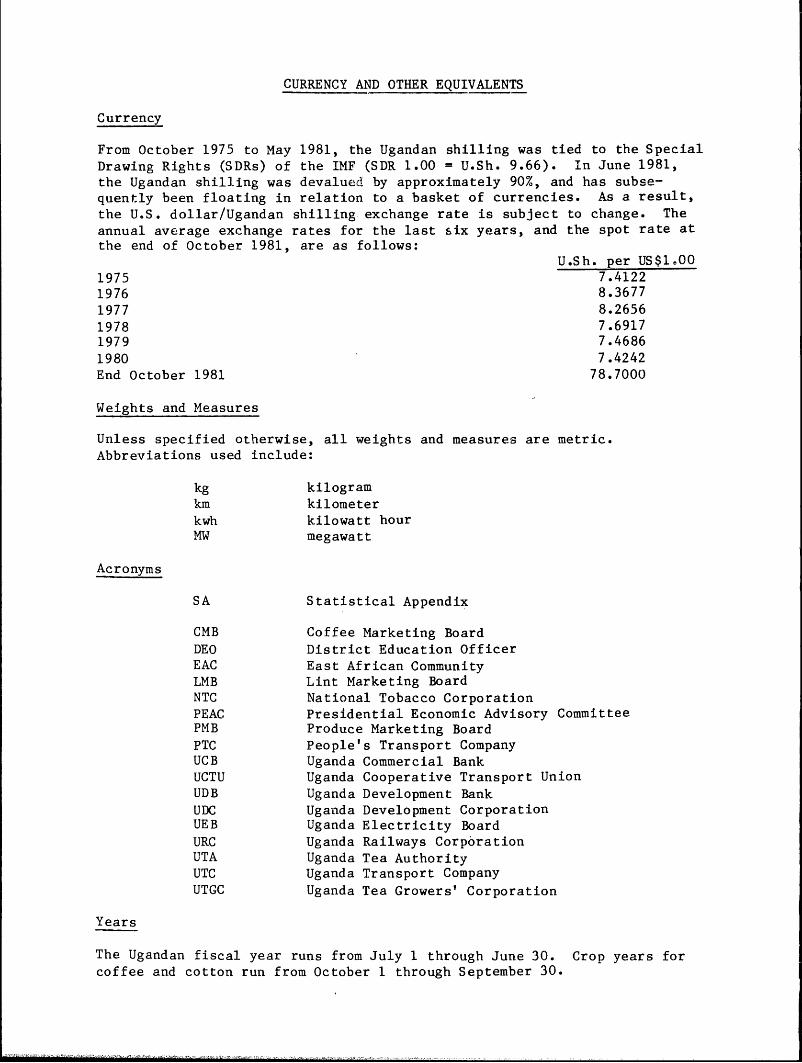
From October 1975 to May 1981, the Ugandan shilling was tied to the SpecialDrawing Rights (SDRs) of the IMF (SDR 1.00 = U.Sh. 9.66). In June 1981,the Ugandan shilling was devalued by approximately 90%, and has subse-quently been floating in relation to a basket of currencies. As a result,the U.S. dollar/Ugandan shilling exchange rate is subject to change. Theannual average exchange rates for the last six years, and the spot rate atthe end of October 1981, are as follows:
U.Sh. per US$1. 0 01975 7.41221976 8.36771977 8.26561978 7.69171979 7.46861980 7.4242End October 1981 78.7000
Weights and Measures
Unless specified otherwise, all weights and measures are metric.
Abbreviations used include:
kg kilogramkm kilometer
kwh kilowatt hour
MW megawatt
Acronyms
SA Statistical Appendix
CMB Coffee Marketing BoardDEO District Education OfficerEAC East African Community
LMB Lint Marketing BoardNTC National Tobacco CorporationPEAC Presidential Economic Advisory CommitteePMB Produce Marketing BoardPTC People's Transport CompanyUCB Uganda Commercial BankUCTU Uganda Cooperative Transport UnionUDB Uganda Development Bank
UDC Uganda Development CorporationUEB Uganda Electricity BoardURC Uganda Railways CorporationUTA Uganda Tea AuthorityUTC Uganda Transport CompanyUTGC Uganda Tea Growers' Corporation
Years
The Ugandan fiscal year runs from July 1 through June 30. Crop years forcoffee and cotton run from October 1 through September 30.
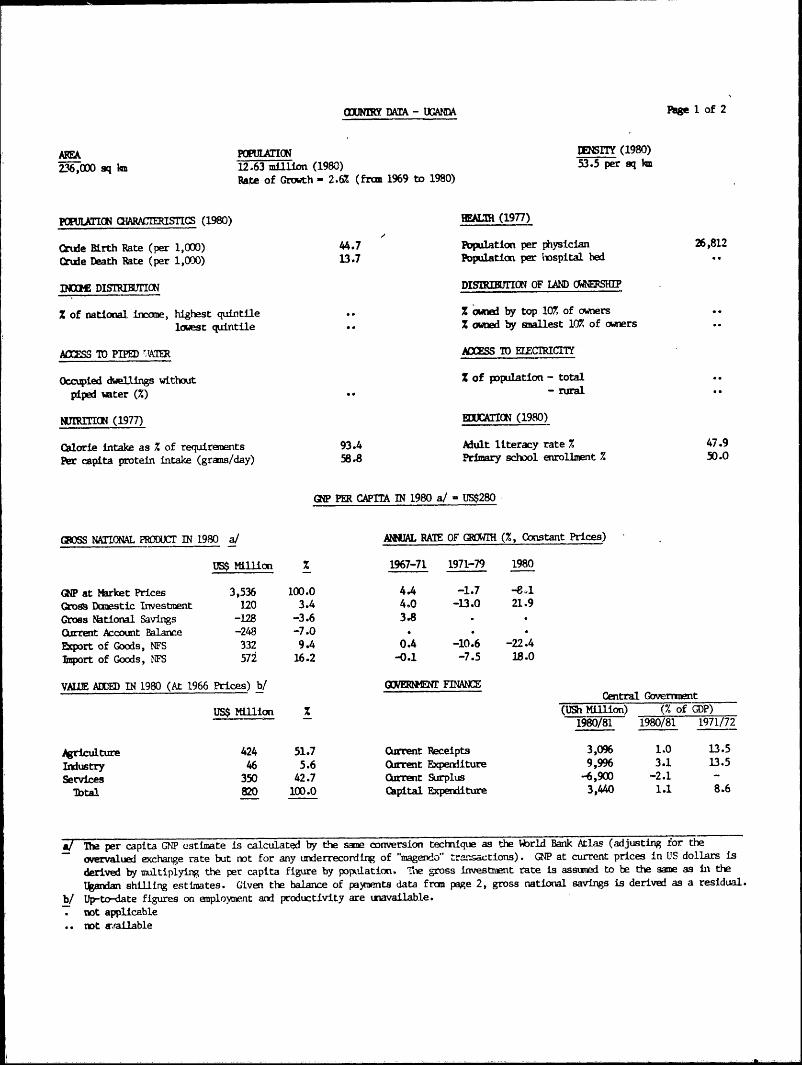
aUNwY 1amA - UGANDA Page 1 of 2
AWA POPULATION MENSITY (1980)
2-16,000 sq ln 12.63 million (1980) 53.5 per aq ln
Pate of Growth - 2.6% (fran 1969 to 1980)
PPUMATION CIARACIERISICS (1980) WALTH (1977)
Crule Birth Rate (per 1,000) 44.7 Population per physician 26,812
Crule Death Rate (per 1,000) 13.7 Population per hospital bed
INDOM DISTR=Irl0N DISIRIBU ON OF LAND OWNERSHIP
% of national income, highest quintile .. Z ownel by top 10% of owners
lowest quintile .. % owned by anallest 10% of owners
AMSS IO PIPED UA ACCSS TO ELEC1RICITY
Occupied dwellings without Z of population - total
piped wter (%) - rural
N11RIN (1977) EIXTION (1980)
Calorie intake as % of requirements 93.4 Adult literacy rate % 47.9
Per capita protein intake (grans/day) 58.8 Primary schol enrollment % 50.0
GP PER CAPITA IN 1980 a/ = US$280
GROSS NATIEONAL RODICT IN 1980 a/ ANIUAL RATE OF GFLWIR (%, Constant Prices)
US$ Million % 1967-71 1971-79 1980
GNP at market Prices 3,536 100.0 4.4 -1.7 -8.1
Gros Donestic Investment 120 3.4 4.0 -13.0 21.9
Gross National Savings -128 -3.6 3.8
Ourrent Account Balance -248 -7.0
Export of Coods, NFS 332 9.4 0.4 -10.6 -22.4
Import of Goods, NFS 572 16.2 -0.1 -7.5 18.0
VAUE ADDED IN 1980 (At 1966 Prices) b/ GNErMME FINACentral Government
US$ Million % (US Million) (% of GDP)F980/81 1980/81 1971/72
griculture 424 51.7 Current Receipts 3,096 1.0 13.5
Industry 46 5.6 Ourent Expenditure 9,996 3.1 13.5
Services 350 42.7 Ourrent Surplus -6,900 -2.1 -
'Ibtal 820 100.0 Capital Expenditure 3,440 1.1 8.6
al The per capita aP ustimate is calculated by the san conversion technique as the Wrld Bank Atlas (adjusting for the
overvalued exchange rate but not for any underrecording of "magendo" transactions). GNP at current prices in US dollars is
derived by multiplying the per capita figure by poplation. 'T gross investment rate is assad to be the same as In the
Ugandan shilling estimates. Given the balance of payoents data fran page 2, gross national savings is derived as a residual.
b/ Up-to-date figures on enploya*ent and productivity are uravailable.not applicablenot arailable

.aIRY DATA - lANA Page 2 of 2
UNEY, CREDIT AND PRICES 1976 1977 1978 1979 1980 1981&/(USh Million Outstanding Ed Period)
MXey SUpply 4,492 5,787 7,051 10,620 13,905 34,600Bank Credit to Goverment 4,790 5,522 7,199 9,198 14,848 29,300Bank Credit to Other Sectors 1,937 2,885 3,221 3,658 5,849 11,500
1976 1977 1978 1979 1980 1981/(Percentage or Index Nunbers)
Mmey as % of GDP 17.0 10.6 10.1 9.0 5.9 8.5General Price Index (1966 - 100) b/ 601 1,133 1,546 4,894 5,474 10,058Annual percentage changes in:General Price Index 46.6 88.5 36.5 216.6 11.9 83.7Bank Credit to Public Sector 32.9 15.3 30.4 27.8 61.4 97.3
Bank Credit to Private Sector 14.3 48.9 , 11.6 13.6 59.9 96.6
BALANCE OF PAYMEMS WRCANDISE EUPORS (Average 1978-81)US$ Million % e/
1978 1979 1980 1981a/(US$ Million) Coffee 329 95.4
Cotton 9 2.5
Exports of Goods, NFS 332 412 332 240 Tea 3 0.8
Imports of Goods, FS -458 -391 -572 -490 Tobacco 1 0.3
Resource Gap (deficit - -) -126 21 -240 -250 Other Exports 3 1.0
Factor Services and Transfers (net) c/ -12 -25 -8 - Sub-Total 345 100.0
Balance on Current Accoumt -138 -4 -248 -250 Adjustments f/ -30 -8.6Total 315 91.4
Official Grants 9 24 85 110
Public bfLT loans (net) 38 104 84 10 mTERNAL DEBT, DECEMER 31, 1980
Disbursements (66) (145) (131) (120) US$ Million
tnortization (-28) (-41) (-47) (-110)
Use of Fund Credit -2 -4 26 125 Public Debt, incl. Guaranteed 6 12 /
Other Items n.e.i. (net) 50 -182 -123 96 Norr-Guaranteed Private Debt
overall Balance of Payments -43 -62 -176 91 Total Outstanding and Disbursed 612
Net Reserves (end year) 72 17 -24 -24 NET DEBT SERVICE RATIO FR 1980 h/
Payment Arrears (end year) 94 100 235 144 2
Petrolemn Imports d/ 43 63 124 114 Public Debt, incl. Guaranteed 17.7
Petroleuan Exports - - - - Non-Guaranteed Private DebtTotal outstanding and Disbursed 17.7
RAE OF EXCHANZ IBD/DA LENDING (Dec. 31, 1981) (US$ Million)IaD &/ InA
Annual Averages End Period
1979 1980 Jan.-Sept.1981 Oct.1981 outstanding and Disbursed 25 58
US$1.00 - U.Sh. 7.4686 7.4242 39.8020 78.7000 Undisbursed 1 58
USh 1.00 - US$ 0.1339 0.1347 0.0251 0.0127 outstanding, incl. Undisbursed 26 116
a/ Estimates.I/ Kanpala low-incone cost of living index. Indices prior to 1979 may be unlerstated as &ae controlled prices ure used In the
calculation of the indices. Indices for 1980 and 1981 are incomplete as cost-of-living data uere not collected fron October 1980
to July 1981. In particular, the increase in the index for 1980 is grossly understated, especially for the food caponent.
c/ Exclules official grants.l/ Uganda imports all petroleun in the form of products and has no petroleun exports.
e/ 7 of unadjusted merchandise exports.f/ Includes errors arid anissions, and adjustments for valuation, coverage and timing.
g/ Incldes Ugarda's notional share (15%) of EAC loans.
h/ Debt service payments (amortization ard interest) as a percentage of exports of goods and NFS.
Not available. March 31, 1982
SUMMARY AND CONCLUSIONS
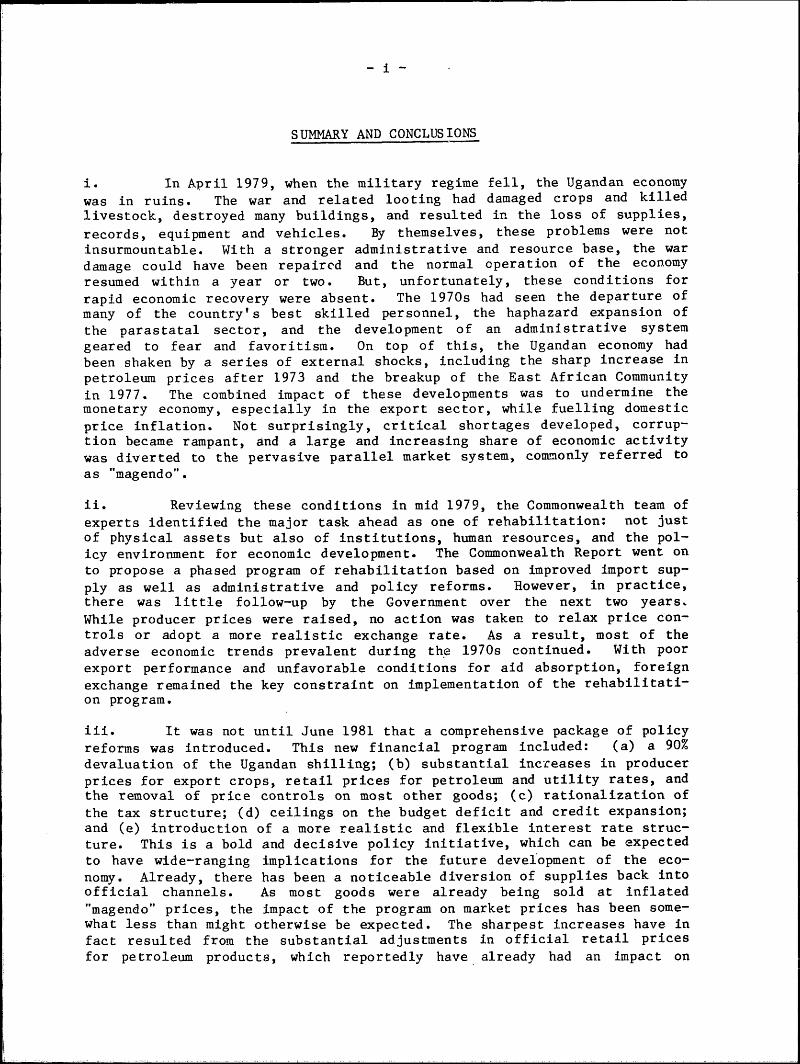
i. In April 1979, when the military regime fell, the Ugandan economy
was in ruins. The war and related looting had damaged crops and killedlivestock, destroyed many buildings, and resulted in the loss of supplies,
records, equipment and vehicles. By themselves, these problems were notinsurmountable. With a stronger administrative and resource base, the wardamage could have been repaired and the normal operation of the economyresumed within a year or two. But, unfortunately, these conditions for
rapid economic recovery were absent. The 1970s had seen the departure ofmany of the country's best skilled personnel, the haphazard expansion ofthe parastatal sector, and the development of an administrative systemgeared to fear and favoritism. On top of this, the Ugandan economy hadbeen shaken by a series of external shocks, including the sharp increase inpetroleum prices after 1973 and the breakup of the East African Communityin 1977. The combined impact of these developments was to undermine themonetary economy, especially in the export sector, while fuelling domestic
price inflation. Not surprisingly, critical shortages developed, corrup-tion became rampant, and a large and increasing share of economic activitywas diverted to the pervasive parallel market system, commonly referred to
as "magendo".
ii. Reviewing these conditions in mid 1979, the Commonwealth team ofexperts identified the major task ahead as one of rehabilitation: not justof physical assets but also of institutions, human resources, and the pol-icy environment for economic development. The Commonwealth Report went onto propose a phased program of rehabilitation based on improved import sup-
ply as well as administrative and policy reforms. However, in practice,there was little follow-up by the Government over the next two years.
While producer prices were raised, no action was taken to relax price con-trols or adopt a more realistic exchange rate. As a result, most of theadverse economic trends prevalent during the 1970s continued. With poorexport performance and unfavorable conditions for aid absorption, foreignexchange remained the key constraint on implementation of the rehabilitati-
on program.
iii. It was not until June 1981 that a comprehensive package of policyreforms was introduced. This new financial program included: (a) a 90%devaluation of the Ugandan shilling; (b) substantial increases in producerprices for export crops, retail prices for petroleum and utility rates, andthe removal of price controls on most other goods; (c) rationalization ofthe tax structure; (d) ceilings on the budget deficit and credit expansion;and (e) introduction of a more realistic and flexible interest rate struc-
ture. This is a bold and decisive policy initiative, which can be expectedto have wide-ranging implications for the future development of the eco-nomy. Already, there has been a noticeable diversion of supplies back intoofficial channels. As most goods were already being sold at inflated"magendo" prices, the impact of the program on market prices has been some-what less than might otherwise be expected. The sharpest increases have in
fact resulted from the substantial adjustments in official retail pricesfor petroleum products, which reportedly have already had an impact on

smuggling and consumption. Many other market prices also rose initially inJune 1981, as the economy reacted nervously to the new program, but mosthave since stabilized and some have even come down. For a few basicconsumer items -- sugar, salt, and rice -- present prices are actuallybelow pre-devaluation "magendo" levels. Nevertheless, the program hasimposed economic hardship on those, including some civil servants, whopreviously had privileged access to goods at controlled prices.Furthermore, inflationary pressures could quickly re-emerge under presentconditions, especially if transport bottlenecks and security problemsrestrict the movement of basic goods to isolated and heavily-populatedareas.
iv. Inevitably, further policy adjustments and refinements will berequired in such a fluid and unpredictable economy. However, the realpriority at this time is to build on these policy reforms to develop a morecomprehensive rehabilitation program. Given the resource constraints, thisprogram will have to include only very low levels of investment in newcapacity. Instead, the emphasis in resource allocations should be onrecurrent financing of maintenance and operations, and priority rehabilita-tion projects. Particular attention needs to be given to the mobilizationof foreign exchange, which will remain the key constraint on the implemen-tation of any rehabilitation program. These resource efforts will, inturn, have to be supported by further government action in the key areas ofeconomic management and institution building to improve the efficiency ofresource use.
v. Foreign exchange management. Over the longer term, as the balanceof payments situation improves, there will be scope for gradually reducingthe country's dependence on quantitative import restrictions. However, forthe moment, tight management of Uganda's scarce foreign exchange resourcesis essential. The Government is aware of this need, and has responded witha number of recent improvements in the foreign exchange management system,including the appointment of an IMF advisor to help prepare quarterly for-eign exchange forecasts and to monitor actual foreign exchange flows.These are encouraging developments. Nevertheless, it seems clear that fur-ther strengthening of the system will be required, if it is to deal effec-tively with the present foreign exchange pressures.
vi. Firstly, it is essential that a more comprehensive budgetaryframework is adopted, which takes account of all sources and all uses offoreign exchange. At the moment, payments for government services andgoods (including pledges against coffee earnings), petroleum imports andexternally-financed imports are largely taken to be prior claims on theavailable foreign exchange, and trade-offs are consequently only consideredwithin the very small residual balance. One of the adverse consequences ofthis approach is that inadequate priority has been given to the recurrentimport requirements of the productive sectors. Secondly, there is still anapparent preoccupation with import requirements at the budgeting and licen-sing stages, without due regard for the limited foreign exchange avail-able. Although the recently-instituted final review by the PresidentialEconomic Advisory Committee has played a valuable role in preventing over-budgeting of foreign exchange, this crisis management approach is not wellsuited to a rational selection of import priorities. What is needed,therefore, is a resource-constrained and integrated annual import budget.Initially, priority would have to be given to: (a) imports of basic con-sumer items in short supply, which cannot be produced domestically; (b) im-

ports of raw materials and inputs to utilize existing capacity, espe-cially to produce basic consumer goods and exports; and (c) imports tosupport selective rehabilitation of capacity in priority areas. Finally,there is a need to strengthen and centralize the technical capacity to eva-luate individual import requests and relate them to the broad budget allo-cations. Without this technical input, there is a danger that the foreignexchange will be spread around too thinly, with over-reliance on a fewestablished import channels.
vii. Public administration and finance. The need to strengthen foreign
exchange management is symptomatic of a wider concern with the Government's
administrative capacity. This reflects the loss of administrators andtechnicians, as well as the decline in professional standards, during the1970s and has limited subsequent efforts to improve economic management.Firstly, an effective budgetary process is still to be re-established inUganda. Projected expenditures often bear little relation to the likelyavailability of resources, the recurrent budget still underfunds the main-tenance and operations requirements of the economy, and the developmentbudget includes many low-priority projects. While there is obviously scopefor reallocating recurrent expenditure, it seems inevitable that budgetarycuts, at least in the short term, will fall most heavily on developmentexpenditure. Even with a more effective budgetary process, the actual re-
venue and expenditure outcome will still depend critically on the Govern-ment's capacity for tax collection and expenditure control. Improvements
in tax collection will be largely dependent upon increased staffing, forboth administration and enforcement, and improved financial performance inthe parastatal sector, to help reduce tax delinquency and arrears. The
more pressing and difficult problem, however, is probably expenditure con-trol. This will require that actual spending can be related to what hasbeen budgeted, that controlling officers are held accountable for theirministries' spending, and that legal sanctions are applied in cases of mis-appropriation.
viii. Secondly, one of the major constraints on the Government's capac-ity to raise and utilize resources is the absence of an effective systemfor aid coordination. Sectoral ministries have often sought external sup-port for their projects directly, and only worked through the Ministries ofFinance or Planning at the negotiating stage. The Government has now re-affirmed that statutory responsibility for negotiating aid agreements andfinancial obligations is with the Ministry of Finance alone, and thisshould be strictly enforced. However, the Ministry of Planning also needsto take a much more active role in the prior selection of priority projectproposals, as well as the reallocation of financing commitments to morepressing (often recurrent) import requirements. To this end, the Govern-ment is reviewing its investment plan, and intends to present a more real-istic and prioritized list of projects as part of its two-year economicrecovery program (presently being prepared with assistance from theCommonwealth Fund for Technical Cooperation). The Government should adoptthis as a basic policy document, translating it into action through thegovernment and foreign exchange budgets for 1982/83.
ix. Finally, a major constraint on all administrative functions inUganda is the deficient statistical base. The Statistical Department inthe Ministry of Planning, which has primary responsibility for the collec-
- iv -
tion and compilation of official statistics, has effectively ceased to
function. To .rebuild this capacity will require recruitment of additionalqualified staff, including support from technical assistance, and the re-
establishment of channels of routine reporting, most of which have broken
down over the past decade.
x. Parastatal organization. Problems of management and organiza-
tion also carry over into the parastatal sector. Partly in response tothese problems, the Government has outlined its intention to follow a
"mixed economy" strategy, with some parastatals to be closed down andothers turned over to the private sector. Already, some private ownershave returned to Uganda, notably in the sugar and tea sectors, although in
each case some interim arrangements have been made with the Government,usually on a joint venture basis. The Government is also drafting legislr-
tion to formalize the return of properties to former owners and the settle-
ment of compensation claims. But, further decisions and follow-up action
are now required to clarify what the Government's policy means in practice
for the role and structure of the parastatal sector.
xi. Firstly, the basis on which public ownership should continue,
and the mechanism of asset disinvestment and compensation, need to be de-
termined. Secondly, it would be useful to explore further what scope
exists for more private initiative and competition, especially in areaswhere parastatals presently have a monopoly, due to either statutory rights
(e.g., crop marketing) or privileged access to credit and imports (e.g.,
commerce). Thirdly, for those parastatals that are to continue in opera-tion, measures will be needed to improve their financial viability, includ-
ing: (a) clarification of status and ownership; (b) restoration of execu-tive responsibility to boards of directors and to management, selected fortheir professional competence; (c) resolution of outstanding debt obliga-
tions; and (d) provision of appropriate financial support and access tocredit. Finally, to avoid further unplanned development (or reduction) of
the parastatal sector, there is a strong case for establishing a special-ized unit within the Department of Economic Affairs (Ministry of Finance)to coordinate parastatal operations and policies. Such responsibilitiesare at present not clearly defined or located within government. This spe-
cialized unit could also serve as a focus for assistance in updating paras-
tatal acounts, and advise on joint ventures, especially when foreign in-vestment is involved.
xii. Pricing policy. In the past, the monopoly position of many
parastatals was protected to some extent by the imposition of administered
price controls. Since mid 1981, all price controls -- except on majorexport crops, petroleum products and public utilities -- have been re-moved. For industry, this represents a major step towards restoring a more
competitive and financially-viable sector, even though a large proportionof some producers' profits is presently being absorbed by high effectiverates of sales tax and excise duty. The real concern, however, is with the
official producer prices for export crops, which, even after the recentadjustments, do not cover costs in the case of tea, and provide a substan-
tially lower return than food production for coffee, tobacco, and cotton.
The analysis presented in Chapter 4 suggests that further producer priceincreases are warranted for tea, tobacco and, to a lesser extent, coffee.Inevitably, subsequent adjustments will also be required as the full impact
of the devaluation is felt, and world prices change.

-v -
xiii. In this context, it is essential that the administered prices beregularly reviewed and adjusted in a systematic manner. For this, anappropriate institutional structure needs to be found, which gives dueweight to the concerns of producers, and also provides for more automaticadjustments in producer prices in line with world market conditions. Forthe longer term, the Government should also begin a review of the overallsystem of producer pricing for export crops. This should include an analy-sis of the potential impact on producer incentives, the budget and thebalance of payments of alternatives to administered prices (e.g., minimumsupport prices, open market prices) and of more competitive marketing sys-tems (e.g., auctions).
xiv. External assistance. To effectively implement a rehabilitationprogram, including progress in these key areas of economic management andinstitution building, the Government is going to need substantial amountsof foreign exchange. Given the inevitable delays before the program canhave a significant impact on export performance, and the immediate importrequirements for rehabilitation, the foreign exchange constraint will beparticularly severe over the next two to three years. Even allowing forthe inevitable constraints on import absorption imposed by the. present eco-nomic and administrative conditions in Uganda, and assuming a continuationof aid commitments at their present level in real terms, the projections inChapter 3 indicate an average financing gap of around US$190 million perannum over this period.
xv. Uganda's case for additional external assistance needs to be con-sidered in relation to the recent progress made on domestic policy reform,the scope for high economic payoffs to additional disbursements of foreignexchange under present conditions in Uganda, and the very meager interna-tional support provided to date. Given Uganda's critical foreign exchangesituation, it is important that this assistance be provided on concessionalterms, with a high proportion of balance of payments support. Balance ofpayments support not only disburses faster than project aid, but also pro-vides the Government with flexibility to meet more immediate and urgentrecurrent import requirements. The scope for investment in new capacitywill remain extremely limited over at least the next three years, andpossibly much longer. Therefore, where project aid is provided, it needsto be directed towards priority rehabilitation tasks, taking into account(and if possible financing) the related recurrent import requirements.
xvi. There, of course, can be no guarantee of Uganda's rapid recovery.Nor should one minimize the risks that could stall progress. Internalsecurity and political stability are obviously important prerequisites, andthese are still to be fully restored. But there is now clearer evidencethan at any time in recent years that economic management is improving andwith it, economic performance. Certainly, with continued governmentcommitment and international support, Uganda has the potential to becomeone of the fastest growing, and eventually one of the strongest, economiesin Sub-Saharan Africa. Developments over the next year or two will becritical in determining, one way or the other, whether this potential canindeed be realized.

- 1-
PART I
AN OVERVIEW

Chapter 1
BACKGROUND
A. Introduction
1.1 At Independence, in 1962, Uganda was one of the strongest andmost promising economies in Sub-Saharan Africa. With favorable climaticand soil conditions, the agricultural sector was able to provide ample foodto feed the whole population, as well as generate foreign exchange. Al-though agricultural exports were dominated by coffee and cotton, rapid pro-gress was being made on developing new export crops, such as tea and tobac-co. The industrial sector, although small, helped supply the domestic eco-nomy with basic inputs and consumer goods, and also contributed foreign ex-change through exports of textiles and copper. Uganda's transport systemwas broad-based and reasonably well developed: the road network was com-monly regarded as one of the best in Sub-Saharan Africa, and through commonservices with Kenya and Tanzania (later to be formalized in the East Afri-can Community), Uganda shared access to an effective network of railway,port and airline facilities. On the energy front, the country was blessedwith an abundant potential for hydro-electric development, a potentialwhich was already being harnessed in part by the Owens Falls hydro-electricstation. Although school enrollment was still low, the country had devel-oped a reputation for the quality of its education at all levels, from pri-mary schools through to the internationally-respected Makerere University.
1.2 At the same time, the fledgling country faced a number of socialand geographical handicaps, which were to play a major role in the subse-quent development of the country. Two of these deserve special mention.Firstly, the boundaries of the country were largely set by historical acci-dent, and during the protectorate years, little attempt was made to unifythe country or establish a common administrative system. As a result,in-ternal divisions -- especially between the strongest of the four originalkingdoms (Buganda) and the rest of the country -- have repeatedly led toconflicts and political instability. Secondly, the country is landlocked,with no easy or reliable access to the sea. This has made Uganda particu-larly susceptible to disruptions in relations with its neighbors, and in-evitably increased the cost and risks of international transport.
1.3 Despite these handicaps, the initial years after Independenceclearly demonstrated the economic potential of the country. GDP at 1966prices grew by 4.8% per annum from 1963 to 1970, implying an increase inper capita terms of at least 2% per annum. The country was also able tomaintain a reasonable savings rate (averaging 13%), which permittedimplementation of an ambitious investment program without undue pressure ondomestic prices or the balance of payments. Although Uganda's export vol-ume grew slowly, export earnings were more than adequate to cover importrequirements, and the country maintained a current account surplus in mostyears. Domestically, the Central Government's public finances were also in
-4-
a relatively healthy state; revenue increased faster than recurrent expen-
diture during the latter half of the 1960s and, together with non-bank do-
mestic borrowing, helped finance a significant proportion of development
outlays.
B. The Military Regime
1.4 From the early 1970s, and especially following the change of
government in 1971, the situation deteriorated abruptly. The adverse
impact of developments under the military regime on the country's economy
is of continuing concern. In particular:
(a) many of the country's best administrators, managers, entrepre-
neurs, bookkeepers, teachers, and traders left the country (in-
cluding most of the Asian population during the so-called "eco-
nomic war" of 1972);
(b) the parastatal sector, which had already been expanded during the
early 1970s, 1 became bloated with the addition of numerous aban-
doned or confiscated industries (others were given to inexperi-
enced private owners). This whole process was undertaken in a
haphazard and chaotic manner, with little concern for proper
transfer of ownership, compensation and financial control, and
little regard for managerial constraints in the parastatal sec-
tor; and
(c) the administrative system, in both government and the parastatal
sector, was increasingly geared to fear and favoritism. Many
civil service and parastatal positions were filled by political
appointees, and there was little reward for technical competence
or scope for open discussion of economic strategy or policies.
Fiscal responsibility was virtually non-existent, leading to
widespread misuse of funds and corruption.
Many individuals resisted these developments at great personal risk and
sacrifice. But the general reaction was understandably one of resigna-
tion, demoralization and indiscipline.
1.5 On top of these domestic problems, the Ugandan economy was shaken
by a series of external shocks during the mid 1970s. As with all other
oil-importing countries, Uganda was severely affected by the rise in
1/ This process actually began with the "Nakivubo Pronouncements" of
1970, in which the Government sought a 60% participation in a
number of private industrial, commercial and financial undertak-
ings. The military regime initially toned down this policy, re-
ducing the participation to 49% and the number of nationalized
companies to only 17, including the banks, one of the oil com-
panies and some manufacturing and mining companies. However, the
nationalization drive was revived during the "economic war" of
1972.

-5-
petroleum prices after 1973. Uganda imports all of her petroleum require-ments, and despite having abundant hydro-electric potential, is stillheavily dependent on petroleum as an energy source, especially in industry
and transport. As a result, higher petroleum prices not only had an ad-
verse impact on the balance of payments but also increased production costs
throughout the economy. These problems were soon to be compounded by ten-
sions among the partners in the East African Community (EAC), which ledfinally to its breakup in 1977. Almost overnight, Uganda lost virtuallyall railway rolling stock and, aircraft, as well as her part-ownershiprights to railway, port and telecommunications facilities in Kenya and Tan-
zania. This not only necessitated heavy investment (and further expansion
of the parastatal sector) by Uganda, but led to substantial disruptions and
cost increases on international traffic movements.
1.6 The impact of these domestic and external developments wassevere. GDP at 1966 prices basically stagnated from 1970 to 1978 (implyingfalling per capita incomes), with particularly sharp falls recorded in thevalue added of the industrial and monetary agricultural sectors. The only
sector to record a steady growth was subsistence agriculture, both to pro-
vide individual food security and to supply the thriving and lucrative"magendo" markets.2 The savings rate fell sharply (to less than 8% from
1971 to 1978), and with limited external capital inflows, investment hadalso to be cut back. Few development projects were started during this
period, and little effort was made to replace obsolete plant and equip-ment. Even more importantly, little attention was paid to the maintenance
of existing infrastructure and productive assets. Evidence of this is
still widespread throughout the economy: worn-out and unreliable indus-trial machinery, many agricultural processing units closed down or workingat low levels of throughput, deteriorating conditions on the road network,and limited capacity (in terms of volume and treatment quality) at the
urban areas' water supply and sewerage facilities.
1.7 The general malaise in the economy during the 1970s is clearlyreflected in the balance of payments. On taking power, the military regime
spent freely on government imports, often paid for with cash or on short-
term credit. Although subsequent import restrictions provided temporaryrelief, these fell particularly severely on priority development require-ments, further reducing the capacity of the economy to generate or saveforeign exchange. With inflation eroding producer incentives, and a steady
deterioration in the country's transport and marketing facilities, produc-
tion of export crops initially stagnated and then began to decline. Assmuggling increased, official export volumes fell even more sharply. This,
together with the impact of higher oil prices on the terms of trade,slashed the purchasing power of Uganda's exports by more than 60% from 1970
to 1975. Although some temporary respite was subsequently provided by the
coffee boom in 1977, the underlying weaknesses in the balance of paymentsremained evident: merchandise export volumes in 1978 were barely 40% ofthe level in 1970; although coffee volumes were down, the combination of
2/ "Magendo" is used in Uganda to describe the pervasive system ofblack market or parallel market operations. A brief discussionof its nature and importance is provided in paragraph 1.10.

-6-
even sharper volume declines for all other major export items and high cof-fee prices increased Uganda's dependence on coffee to 90% of merchandiseexport earnings; tourism, which in the late 1960s was third only to coffeeand cotton in terms of its contribution to foreign exchange earnings, vir-tually ceased; 3 and, Uganda's access to concessional development assis-tance (which had never been substantial) dwindled to insignificant levels,leaving military and commercial credits as the only major capital inflows.By 1978, despite the accumulation of more than US$90 million in paymentarrears, import volumes were still less than half the peak level of 1971.With little evidence of any serious attempt to protect the priority importrequirements of the economy, the effective impact on economic developmentwas probably even more severe than these aggregate cuts would suggest.
1.8 The combination of declining production in the monetary economy,the diversion of sales into "magendo" markets, and reduced levels of exportand import trade, all contributed to an erosion of the Central Government'srevenue base. Revenue collections were also adversely affected by the im-pact of the overvalued exchange rate and price controls on the "value" ofgoods being taxed, the poor financial performance and tax compliance of theexpanded parastatal sector, and the ineffectiveness of tax administrationand collection procedures. As a result, the ratio of current revenue toGDP fell from 14% in 1971/72 to 9% in 1975/76. Revenue performance sub-sequently recovered temporarily due to the impact of higher world prices,especially for coffee, on export duty collections, but the underlying weak-ness in the tax structure was still apparent. Income and profit taxes, aswell as import duties, all continued to decline in importante. And, col-lections of sales and excise taxes became increasingly limited to a feweasily-taxed items, five of which accounted for over 80% of indirect taxes(excluding export duties) in 1978/79. Despite these revenue problems, lit-tle effort was made to restrict the growth of government expenditure. Asalready noted, this period was characterized by the almost total collapseof fiscal responsibility and routine expenditure control. 4 Furthermore, arelatively large proportion of expenditure was used for unproductive pur-poses, with a few "service" ministries -- internal affairs, police, pris-ons, defense, and finance -- acounting for about 40% of recurrent and 50%-60% of development expenditure. Inevitably, the earlier budget surplusesturned into large deficits, equal to at least 60% of current revenue inevery year (other than the coffee boom year of 1977/78) since 1972/73.
3/ The decline in tourism really started in 1972, following theexpulsion of Asians (who played a major role in the touristindustry) and a temporary ban on overseas tourist arrivals. Sub-sequently, large numbers of wildlife (the major tourist attrac-tion) were killed and the supporting infrastructure (hotels,lodges, and transport facilities) deteriorated substantially.
4/ There are many examples of this: well prepared and properly-audited accounts were unavailable; large supplementary estimateswere presented to approve expenditures already undertaken outsidethe framework of the budget; when parliament was suspended, bud-gets were approved by Cabinet, without accountability to a publicaccounts committee; and, ministries entered into commitmentswithout Ministry of Finance approval.

-7-
1.9 With access to external assistance restricted, the Government in-creasingly resorted to borrowing (and money creation) from the domesticbanking system to finance these deficits. This in turn fueled monetary ex-pansion at the rate of 30% per annum from 1971 to 1978, with the Govern-ment's share of outstanding credit rising from 50% to 70% over this pe-riod. Such rapid monetary expansion inevitably led to uncontrollable pres-sure on domestic prices, especially for basic goods which weighed heavy inthe consumption patterns of the general population. Although officialprice controls remained in effect (with the notable exception of food pri-ces which were freed in 1977), only a few privileged individuals had accessto supplies at these prices. Open market prices (as measured by the Kam-pala low-income cost-of-living index) rose on average by 38% per annum from1971 to 1978. With only minimal adjustments in official wage levels, andmost employers limited in their ability to pay higher wages at controlledprices, the real incentive to work in the formal economy quickly declined.Consequently, many workers returned to subsistence production on a full-time or part-time basis, or participated in "magendo" activities to augment
their incomes. Absenteeism amongst civil servants became widespread.
1.10 It is generally accepted that during the 1970s the impact of "ma-
gendo" was pervasive throughout the Ugandan economy. Its importance hasalready been noted in relation to coffee smuggling, the erosion of theGovernment's tax base, the undermining of official price controls, and thedeclining returns to formal sector wage employment. Although the activi-ties and profits of "magendo" may well have been controlled by a few power-ful (and no doubt very rich) individuals,it depended upon an elaboratestructure of petty traders and officials to succeed. And virtually every-one, whether to sell export crops for which the official purchasing agencyhad no funds and collection facilities, or to buy basic consumer items, hadto participate in order to survive. The supply of goods and related finan-cing of "magendo" took many forms: irregularities (kickbacks, under-invoi-cing of exports and over-invoicing of imports) on foreign contracts; pref-erential allocation of foreign exchange and resale of imports purchased atofficial prices; smuggling of export crops, especially coffee; bribes tocivil servants for completing official functions (whether legitimate ornot); exploitation of transport "choke points", especially for food; andstealing, of public and private property. This whole system was fed by andfed on the general decay in the administrative structure, especially thefalling levels of civil service morale and living standards, during the1970s.
C. The 1978-79 War
1.11 In late 1978, Ugandan troops crossed over into Tanzania. Thisincursion was contained by the Tanzanian army, and by mid-January 1979, acounter-offensive had been launched into Uganda. Extensive damage wascaused by artillery bombardment around Mbarara and Masaka before the deci-sion to move on to Kampala was finally taken. Subsequent resistance waslight and in April 1979, the military regime fell. Remnants of the re-gime's army were then pursued north through Jinja and on towards the north-ern borders with Sudan and Zaire.

-8-
1.12 Although the war was brief, with major damage limited to thesouthern areas of the country, it imposed. an unmanageable burden on thealready fragile and disintegrating Ugandan economy. With normal economicactivities virtually at a standstill, and the army and police in disarray,widespread looting broke out, backed by the large numbers of weapons readi-ly available in the country. The combined impact of the war and subsequentlooting was devastating. By mid 1979, when the Commonwealth team ofexperts arrived, evidence of damage and destruction was everywhere:
(a) crops were damaged and livestock killed, either due to thedirect impact of military activities or to provide food for sol-diers and marauders;
(b) many houses, factories and public buildings were gutted or par-tially destroyed, especially around Mbarara and Masaka;
(c) school supplies, textbooks and writing materials were looted;
(d) food, clothes and furniture were taken from shops and houses;
(e) office records were lost or destroyed;
(f) tools and equipment were taken from workshops; and
(g) thousands of cars and trucks were stolen.
1.13 Although the war imposed severe hardships and difficulties, theseproblems were not by themselves insurmountable. With a stronger adminis-trative and resource base, the war damage could have been repaired and thenormal operation of the economy resumed within a year or two. Unfortu-nately, this was not the case. The years of the military regime had leftthe economy short of skilled manpower and foreign exchange, and the admin-istrative system had virtually collapsed. With such deep-rooted and per-vasive problems, it would have been difficult for any government, with thebest of intentions and support, to implement an effective rehabilitationprogram. In Uganda, where the government leadership has changed four timesover the past three years 5 and where the security situation has remainedunsettled, it is not surprising that initial progress was slow.
5/ The first post-war Government was that of the Uganda NationalLiberation Front (UNLF), a coalition of all the main politicalparties and groupings opposed to the military regime. The firstPresident, Professor Yusufu Lule, was ousted in June 1979 andreplaced by Mr. Godfrey Binaisa. In May 1980, President Binaisawas deposed and the UNLF Government replaced by a militarycommission. Elections were held in December 1980, from which theUganda People's Congress (UPC), led by former President MiltonObote, emerged with a majority and formed a government. TheDemocratic Party is the parliamentary opposition.

-9-
Chapter 2
RECENT DEVELOPMENTS
A. Introduction
2.1 Reviewing conditions in mid 1979, the Commonwealth team con-
cluded:
"the task of rehabilitation is not only, or even fundamentally, a
financial one. The really important need is to reform the insti-
tutions and policies the Government inherited. More fundamen-tally still, successful rehabilitation depends on political
leadership to bridge the rifts in Ugandan society -- some long-standing, some of more recent origin -- and to create law, order
and political stability."1
The Commonwealth Report went on to propose a phased program of rehabilita-tion based on improved import supply and administrative and policy re-forms. The critical bottleneck identified by the Report, as impeding reha-bilitation efforts in the short term, was foreign exchange: to improve the
supply of basic consumer goods, inputs and vehicles, and to support reha-
bilitation of the productive sectors.
2.2 Bearing these concerns in mind, the Report outlined a number ofareas where urgent government action was required:
(a) to improve export performance, producer prices should be
increased, and measures taken to relieve existing bottle-
necks in the transport and marketing systems;
(b) to ensure that the limited foreign exchange available was
allocated effectively, the foreign exchange budgeting and
import licensing procedures needed to be strengthened;
(c) to provide adequate domestic finance to purchase imports,
steps would have to be taken to restore normal bankingfunctions, with possibly a moratorium on outstandingparastatal and cooperative debts to the Government and
banking system;
(d) to reduce leakages into the "magendo" economy, the Reportsuggested a relaxation of price controls, with the re-
lated profits mopped up by either devaluation (whichwould also reduce the budgetary impact of higher producerprices), or some combination of foreign exchange auction-
ing and higher taxes; and
1/ Prof. Dudley Seers, et al.: The Rehabilitation of the Economy ofUganda, a report by a Commonwealth Team of Experts, June 1979.
- 10
(e) to help cover the projected foreign exchange gap, Ugandawas advised to declare a moratorium on outstanding offi-
cial debts and actively seek additional external assis-tance, especially in the form of balance of payments sup-port.
2.3 Although the then Government accepted the general analysis andstrategy presented by the Commonwealth team, doubts were expressed aboutthe desirability or feasibility of some of the proposals. 2 In practice,while producer prices were raised, no action was taken to relax price con-trols or reduce "magendo" profits. As a result, the exchange rate remainedseriously overvalued, with the parallel market offering as many as tentimes more shillings per US dollar than the official rate. Subsequent fol-low-up action by the Government was limited over the next two years, andthis contributed to the continued decline in economic performance discussedin Section B below. This in turn severely restricted the country's capa-city to earn foreign exchange, which remained the key constraint on imple-menting the rehabilitation program. It was not until June 1981, that acomprehensive package of policy reforms was introduced, centered on a sub-stantial devaluation of the Ugandan shilling and related price adjust-ments. This new financial program is a bold and decisive policy initia-tive, which can be expected to have wide-ranging implications for the fu-ture development of the economy. The various components of this program,and their expected impact, are therefore reviewed in some detail in thefinal section of this chapter.
B. The Post-War Period (Through mid 1981)
2.4 Production and investment. The general decline in monetary agri-
culture during the early and mid 1970s -- reflecting inadequate incentives,shortages of inputs and infrastructure failures in transport, processingand marketing -- has continued over the past three years (see Table 2.1).1Furthermore, with the disruptions caused by the 1978-79 war and subsequentlooting, as well as the impact of drought, the subsistence sector has alsobeen affected, with production reportedly down in both 1979 and 1980.Regional food shortages, especially in Karamoja, were made even more severeby deficiencies in the internal distribution system. Although overallproduction seems to have recovered in 1981, food shortages are still
2/ See the Government's White Paper on the Report by CommonwealthTeam of Experts, October 1979.
3/ It is difficult to determine to what extent the national accountstatistics underrecord economic activity due to the rising im-portance of "magendo" transactions during the 1970s. An adjust-ment is made for estimated coffee smuggling, and many other itemswhich eventually enter the "magendo" economy may still be re-corded at the production stage. On balance, it would seem likelythat there is underrecording and that it has increased in recentyears. However, in the absence of any reliable information, itis difficult to make additional adjustments in the nationalaccount statistics.

- 11 -
Table 2.1: NATIONAL ACCOUNT SUMMARY
1963-70 1970-78 1978-80
GDP growth rate (% p.a. 4.8 -0.2 -9.7at 1966 prices)/a
Monetary economy 5.2 -2.0 -6.8-Agriculture 4.6 -1.6 -10.2-Industry/e 6.5 -5.9 -17.0-Other sectors 5.3 -1.4 -3.2
Subsistence production 3.9 3.4 -14.3-Agriculture 4.0 3.4 -16.3-Other sectors 3.7 3.4 -1.3
1964-70 1971-78 1979-80
Composition of GDP 100.0 100.0 100.0(% at 1966 prices)
Monetary economy 69.1 65.7 62.7-Agriculture 24.8 23.2 22.2-Industry/e 8.2 7.3 4.2-Other sectors 36.1 35.2 36.3Subsistence production 30.9 34.3 37.3-Agriculture 27.1 30.0 31.4-Other sectors 3.8 4.3 5.9
Gross investment rate 12.7 8.6 3.0/d(% at current prices)/b
National savings rate 13.0 7.7 2.6/d(% at current prices)/c
/a Trend growth rates, calculated by the least squaresmethod.
/b Gross domestic investment as a percentage of GDP atmarket prices.
/c Gross national savings as a percentage of GDP atmarket prices.
/d Preliminary estimates only./e Agricultural processing and manufacturing only.
Source: SA Tables 2.2 and 2.3

- 12 -
reported in isolated areas. Despite these negative trends, the agri-
cultural sector still dominates the economy, accounting for more than one-
half of GDP and virtually all of Uganda's exports in recent years. The
industrial sector, already suffering from the chaotic expansion of the
parastatal sector and loss of managerial and technical manpower during theearly 197 0s, has been brought to a virtual standstill by shortages of do-mestic and imported inputs. Many units have been closed down, while those
producing are operating on average with a very low capacity utilization ofaround 20% (compared to 70% in 1970). As a result, industrial value addedin 1980 was 30% lower than in 1978, and accounted for less than 5% of totalGDP. Perhaps not surprisingly, the only sector to sustain a steady rate ofgrowth in recent years has been central government, which now accounts for15% of GDP. But this has not been sufficient to offset declining value
added in other tertiary sectors (electricity, transport and communications,
and commerce), reflecting reduced levels of economic activity and supplyconstraints.
2.5 Overall, GDP (at 1966 prices) is estimated to have fallen by 11%in 1979 and 8% in 1980. Taking into account population growth4 and theloss from the country's deteriorating terms of trade, per capita real in-comes in 1980 were 27% lower than in 1978.5 Although there has probablybeen some recovery in 1981, especially in the agricultural sector, it seems
almost certain that average income levels are still substantially worsethan at the end of 1978.
2.6 With high inflation rates and falling real incomes, as well asfinancial indiscipline in the public sector, the domestic savings rate has
4/ The latest information on Uganda's population comes from the pre-
liminary results of the census conducted in January 1980 (see SATables 1.1 and 1.2). These show an average population growth
rate of 2.6% per annum since the previous census in 1969, margin-
ally less than the average for all Sub-Saharan African countries(2.7% per annum) over this period, and down from the 3.9% perannum recorded in Uganda during the previous decade. It is dif-ficult to evaluate the accuracy of these results, given the coun-
try conditions prevailing in 1980 and the lack of supporting dataon fertility and mortality rates. But it seems plausible thatsome decline in the population growth rate did occur during the1970s, due to rising mortality (especially among infants) and thereversal of earlier net immigration flows.
5/ Inter-country comparisons of Uganda's income levels are compli-cated by the imperfect coverage of subsistence and "magendo" ac-tivities, as well as the high rates of domestic inflation, andincreasingly overvalued exchange rate, in recent years. Accept-ing the national account estimates given in SA Tables 2.1 and2.2, and adjusting for the overvalued exchange rate on the basis
of purchasing power parity, per capita GNP in 1980 would be equi-valent to US$280.

13 -
continued to fall. 6 Although the inflow of foreign capital did pick upafter the 1978-79 war, it remained small in relation to the country'srequirements. As a result, the ratio of gross investment to GDP is estima-ted to have fallen as low as 3% during 1979 and 1980. Given normal depre-ciation provisions, this almost certainly implies negative net investmentover these two years. 7 Consequently, little progress has been made onreplacing obsolete and damaged plant and machinery. 8 More generally, theproductivity of virtually all existing assets continues to be constrainedby inadequate maintenance. If anything, this problem has become even moresevere over the past three years, due to the impact of foreign exchangeshortages on imports of spare parts (for some of the older equipment, spareparts are also no longer readily available) and the widespread looting ofworkshop equipment and tools at the time of the 1978-79 war.
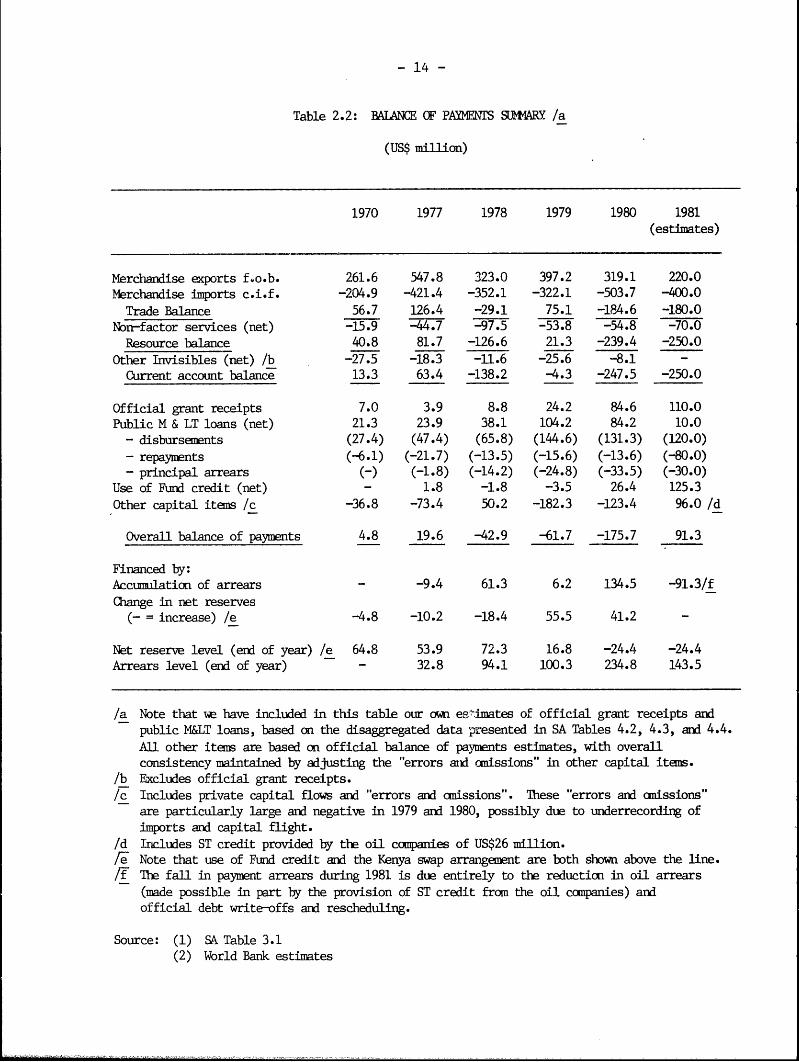
2.7 External sector. Through mid 1981, there were no signs of anyrecovery in export performance. (Although coffee shipments did pick uplater in August and September, this was achieved largely by moving stocks,and has not been sustained in subsequent months.) As a result, after abrief rise in 1979, merchandise export volumes fell back below the alreadydepressed 1978 levels in both 1980 and 1981. This reflects the continueddecline in export crop production, and, at least through mid 1981, the saleof a significant proportion of this production through unofficialchannels.9 On the positive side, coffee exports have not fallen anyfurther over the past three years, and preliminary indications are that the
6/ Allowing for "magendo" transactions, the effective savings ratemay have been higher. However, even if this were the case, the"magendo" savings would probably be offset to a large extent byunrecorded capital outflows, reducing the available resources fordomestic investment.
7/ Note, however, that because of the highly overvalued exchangerate in these two years, the tradable component of expenditure isunderstated, as compared to the estimates for earlier years. Asinvestment is relatively import-intensive, the effective invest-ment rate might therefore have been higher than shown in the re-corded estimates. This would also be reflected in the recordedestimates from 1981, following the devaluation of the Ugandanshilling.
8/ This problem is most evident in the industrial sector. PambaTextiles, for example, is still using 19th Century weavingmachines, of which only 90 out of 300 are presently operative.
9/ Although no reliable figures are available, it is estimated thatas much as 50,000 tons of coffee per annum, or almost one-thirdof total production, has been smuggled out to Kenya and otherneighboring countries in recent years.
- 14 -
Table 2.2: BLAANCE OF PAYMENTS SM-ARY /a
(US$ million)
1970 1977 1978 1979 1980 1981
(estimates)
Merchandise exports f-o.b. 261.6 547.8 323.0 397.2 319.1 220.0Merchandise imports c.i.f. -204.9 -421.4 -352.1 -322.1 -503.7 -400.0
Trade Balance 56.7 126.4 -29.1 75.1 -184.6 -180.0Non-factor services (net) -15.9 -44.7 -97.5 -53.8 -54.8 -70.0
Resource balance 40.8 81.7 -126.6 21.3 -239.4 -250.0Other Invisibles (net) /b -27.5 -18.3 -11.6 -25.6 -8.1 -
Current account balance 13.3 63.4 -138.2 -4.3 -247.5 -250.0
Official grant receipts 7.0 3.9 8.8 24.2 84.6 110.0Public M & LT loans (net) 21.3 23.9 38.1 104.2 84.2 10.0
- disbursements (27.4) (47.4) (65.8) (144.6) (131.3) (120.0)
- repayments (-6.1) (-21.7) (-13.5) (-15.6) (-13.6) (-80.0)- principal arrears (-) (-1.8) (-14.2) (-24.8) (-33.5) (-30.0)
Use of Fund credit (net) - 1.8 -1.8 -3.5 26.4 125.3Other capital items /c -36.8 -73.4 50.2 -182.3 -123.4 96.0 /d
Overall balance of payments 4.8 19.6 -42.9 -61.7 -175.7 91.3
Financed by:Accumulation of arrears - -9.4 61.3 6.2 134.5 -91.3/fChange in net reserves
(- = increase) /e -4.8 -10.2 -18.4 55.5 41.2 -
Net reserve level (end of year) /e 64.8 53.9 72.3 16.8 -24.4 -24.4Arrears level (end of year) - 32.8 94.1 100.3 234.8 143.5
/a Note that we have included in this table our own eelimates of official grant receipts andpublic M&T loans, based on the disaggregated data przesented in SA Tables 4.2, 4.3, and 4.4.All other items are based on official balance of payments estimates, with overallconsistency maintained by adjusting the "errors and omissions" in other capital items.
/b Excludes official grant receipts./c Includes private capital flows and "errors and omissions". These "errors and anissions"
are particularly large and negative in 1979 and 1980, possibly due to underrecording ofimports and capital flight.
/d Includes ST credit provided by the oil companies of US$26 million./e Note that use of Fund credit and the Kenya swap arrangement are both sbown above the line.
/F The fall in payment arrears during 1981 is due entirely to the reduction in oil arrears(made possible in part by the provision of ST credit from the oil, companies) andofficial debt write-offs and rescheduling.
Source: (1) SA Table 3.1(2) World Bank estimates
- 15 -
1980/81 "shortfall" quotal0 of 117,000 tons has been fulfilled. (This isa significant achievement in that it helped justify a higher quota forUganda in 1981/82, but it is still well short of the peak level of 214,000tons achieved- in 1972.) However, other export crops, including cottonwhich was once Uganda's major export item, have all but disappeared,raising dependence on coffee to 97% of merchandise export earnings, Thetourist industry, the major source of non-factor service receipts in thelate 1 9 6 0s, is still to recover from the setbacks of the 1970s and the1978-79 war. With infrastructural problems in accommodation and transport,as well as reported security problems around Kampala and the Kabalega Fallsarea, international passenger traffic to Uganda has largely stopped, andtourist earnings remain at very low levels.
2.8 In addition to the depressed levels of merchandise exports andtourist receipts, external assistance over the past three years has beenless than expected. Total commitments (excluding debt relief andwar-related assistance from Tanzania and Zambia) rose from US$113 millionin 1978 to an average of US$250 million per annum over the subsequent threeyears. As shown in Table 2.3, more than two-thirds of these newcommitments were in the form of balance of payments support. In addition,much of the project aid was simply financing of raw materials (e.g. steelfor hoes manufacture) or capital goods (e.g. trucks and locomotives), andshould have been able to disburse quickly. However, in practice, this hasnot been the case. Actual disbursements have averaged only US$150 millionper annum since 1978 and have been inadequate to fully cover principalrepayment obligations and other capital outflows. Some of the reasons forthis poor aid response were outside the control of the Ugandan Government.The general aid climate in many donor countries has not been conducive toincreased assistance in recent years; traditional ties with many of thedonor countries were broken during the military regime and these take timeto restore; and many donors were initially reluctant to commit largeamounts of support, especially untied balance of payments support, untilthe political and security situation became more settled. Yet, at the sametime, the Ugandan authorities were unable to provide a suitable frameworkfor mobilizing and utilizing external assistance. The institutional struc-ture for aid coordination, even today, remains confused, with duplicationand dissipation of effort between ministries and unnecessary competitionamong donors for suitable projects. In addition, the initial failure ofthe authorities to deal effectively with the pricing and exchange rate dis-tortions in the economy, together with the lack of well-defined importpriorities, often made it difficult to convince donors that their resourceswould be used effectively.
2.9 The limited foreign exchange provided from these major sourceswas further eroded by price developments over these three years. As shownin SA Table 3.7, the continued decline in coffee prices from their peaklevels in 1977, coupled with the sharp rise in petroleum prices from 1979,led to a deterioration in the terms of trade by 55% over the past three
10/ When it became apparent that Uganda would not be able to meet itsfull quota of 135,000 tons for 1980/81, a "shortfall" quota of117,000 tons was declared. Uganda will be permitted to exportthe balance of 18,000 tons, in addition to its normal quota, dur-ing 1981/82.

Table 2.3: 0t4MIBENS OF EKDERNAL ASSISTANCE, 1979-1981 /a
(US$ million)
B. of P. Project Assistance Technical Food EmergencySupport Agric. Ind. Trans. Other Total Assistance Aid Aid Misc. TOTAAL
Bilateral 114.1 5.2 16.0 85.8 - 107.0 17.4 31.3 5.8 17.9 293.5Australia 0.9 - - - - - - -1.5 - - 2.4
Canada 4.3 - - - - - - - - - 4.3
France 10.8 - - 24.4 - 24.4 - - - - 35.2
Germany 9.9 - 4.9 6.4 - 11.3 10.1 - - 1.9 33.2
India 3.3 - 9.2 9.9 - 19.1 - - - - 22.4
Italy - - 1.9 1.0 - 2.9 - - - - 2.9
Japan 1.9 - - - - - - - - - 1.9
Kenya 31.5 - - - - - - - - - 31.5
Netherlands 17.5 - - 5.9 - 5.9 - - 3.8 6.5 33.7
Sweden 2.3 - - - - - - - - 6.0 8.3
United Kingdom 20.7 - - 23.0 - 23.0 5.7 - - - 49.4
United States 8.0 - - - - - 1.6 29.8 2.0 3.5 44.9
Others 3.0 5.2 - 15.2 - 20.4 - - - - 23.4
Multilateral 157.7 144.1 30.2 25.0 34.8 234.1 40.4 8.7 8.3 5.0 454.2ADB - 22.7 13.0 - - 35.7 - - - - 35.7
AEF - 10.4 - - - 10.4 - - - - 10.4
EEC 56.4 91.0 17.2 25.0 25.8 159.0 11.9 8.7 8.3 5.0 249.3IDA 55.0 - - - 9.0 9.0 8.0 - - - 72.0
IFAD - 20.0 - - - 20.0 - - - - 20.0
RF/b 41.3 - - - - - - - - - 41.3
OPEC Special Fund 5.0 - - - - - - - - - 5.0
UNDP - - - - - - 20.5 - - -- 20.5
TUAL 271.8 149.3 46.2 116.0 34.8 341.1 57.8 40.0 14.1 22.9 747.7
/a Excludes debt relief and war-related assistance from Tanzania and Zanbia. Coverage may be incmplete.Fb Coumitments fran Trust Fund and gold sales only.
Source: World Bank estimates
- 17 -
years (and by 71% over the past four years).11 Although these develop-ments -- in export and aid receipts, as well as import prices -- weretemporarily offset by a substantial increase in payment arrears (during1980) and use of Fund credit (during 1981), the estimated volume of mer-chandise imports in 1981 was still 30% lower than in 1978 (and 59% lowerthan in 1970).12
2.10 As no detailed figures are available on the structure of merchan-dise imports since 1979, it is difficult to determine precisely where theseimport cuts were made. However, a number of general trends in import com-position are apparent. Firstly, despite relatively constant volumes ofpetroleum imports (due initially to.supply constraints and more recently tothe impact of higher retail prices on domestic demand) the foreign exchangecost of petroleum imports (including oil company service payments) hasrisen 168% over the past three years, due largely to higher internationalprices, reaching US$114 million in 1981. At this level, petroleum accountsfor almost 30% of the total import bill and absorbs more than 50% ofUganda's export earnings. Secondly, while Uganda did have to importadditional quantities of food during 1979 and 1980 to help relieveshortages in the Karamoja region, this was largely financed by humanitarianassistance and did not, therefore, result in any significant net burden onthe balance of payments. Thirdly, the level of direct government imports(for defense and security, as well as administrative purposes) increasedsubstantially during the mid 1970s, reaching a peak of US$185 million in1977 or 44% of the total import bill. Significantly, direct governmentimports have come down in subsequent years, to US$100 million in 1980 andan estimated US$60 million in 1981.13 Although these imports may well beof high priority, this downward trend is in line with the increasinglytight foreign exchange situation and the need to meet the competingrequirements of the productive sectors. Finally, with the largeallocations for both petroleum and direct government imports, the availa-bility of "free" foreign exchange for other priority imports -- essentialconsumer items, raw materials, spare parts and capital goods -- has becomeincreasingly scarce. During 1981, for example, almost 80% of Uganda'smerchandise export earnings were absorbed by petroleum and
11/ The estimated income loss in 1981 from the deterioration in theterms of trade since 1978 is equal to 2.2% of GDP. This losswould be even larger if a more realistic exchange rate were used,and if there had not been such a severe reduction in exportvolumes over this period.
12/ The extent of the shortfall can be gauged in relation to the pro-jections prepared by the Commonwealth team. They calculated animport requirement of US$650 million for the last half of 1979,more than double the actual import bill for the whole of 1978.As it turned out, the import bill was constrained to just overUS$200 million during the last half of 1979, and averaged onlyUS$225 million over the subsequent four semi-annual periods.
13/ This estimate for 1981 may exclude some government imports fi-nanced under coffee barter deals or the Kenya swap arrangement.Nevertheless , even allowing for these, the downward trend isexpected to be maintained during 1981.
- 18 -
government imports. As a result, for the critical imports needed for reha-
bilitating the economy, Uganda has become almost entirely dependent on net
capital inflows, including IMF drawings, external assistance and commercial
credits. This helps highlight both the difficulty and critical importance
of effective foreign exchange management under present conditions in
Uganda. Some of the key areas for improvement in this regard are discussed
further in Chapter 3.
2.11 Public finance. The public sector in Uganda comprises central
government, local government and the parastatal corporations. Reliable
data on all three components are few and far between; only on central
government are there any published data and in recent years, these have
often been based on estimates for ministries that had not closed their
accounts or prepared financial statements. Lack of comprehensive data has
also prevented successive reportsl4 from indicating the importance and
resource requirements of the parastatal sector. No industrial survey has
been carried out since 1974, so no data enumerating public and private in-
dustrial enterprises are available. Moreover, the status of many para-
statals is obscure. Under the military regime, legal transfers of property
were often not carried out, with the result that some operating parastatals
have no articles of association, capital or legally-recorded assets. In
very few cases are accounts up to date or audited. A presidential instruc-
tion required such accounts to be prepared and submitted by August 1981,but the shortage of accounts staff and of independent auditors has delayed
compliance.
2.12 Central Government revenue performance, at least through mid1981, has been restricted by the same factors evident during the years of
the military regime: declining monetary production, pervasive "magendo"
transactions, reduced levels of foreign trade, the impact of price distor-
tions on the "value" of goods taxed, poor financial performance in theparastatal sector, and ineffective tax administration and collection proce-
dures. On top of this, the decline in world coffee prices since 1978 has
severely reduced the revenue generated by export duties. As shown in Table
2.4, current revenue probably fell to less than 3% of GDP in 1979/80, as
compared to almost 10% in 1977/78. At the same time, recurrent expenditure
more than doubled as successive governments struggled to overcome the
effects of the war and start rehabilitation, while coping with growing
inflationary pressures. By 1979/80, sizeable deficits had again emerged
and, with limited inflows of external finance and development assistance,
they were met almost exclunively by recourse to domestic borrowing, espe-
cially from the Bank of Uganda. Total government expenditure was more than
double current revenue in 1979/80 and more than five times current revenue
in 1980/81. (Note, however, that nearly 10% of expenditure in 1980/81 re-
flected the devaluation of the Ugandan shilling in early June 1981.)Expenditure growth has been particularly rapid in the "non-productive" sec-
tors (such as public administration and defense) which accounted for more
than one-half of both recurrent and development expenditure in 1980/91. On
the basis of trends to date, there is little evidence that the
14/ Notably the Commonwealth Report, an internal Ministry of Financereport on parastatal bodies, two reports on the Uganda Develop-
ment Corporation (one by a former chairman and one by an inter-ministerial committee) and the report of the Industrial Reactiv-ation Task Force.

Table 2.4: SELECTED INDICATORS OF BUDGETARY PERFORMANCE
1971/72 1973/74 1975/76 1977/78 1978/79 1979/80 1980/81(prov.) (est.) (est.) (est.)
As percent of GDP at currentmarket prices /a
Current revenue 13.5 9.1 9.1 9.5 3.5 2.2Current surplus (+) deficit (-) - -4.9 -2.5 2.8 -1.3 -0.8Total expenditure 22.1 18.4 16.4 10.2 5.8 4.6 WOverall deficit -8.1 -8.9 -6.9 -0.7 -2.3 -2.2Domestic borrowing 4.3 6.9 5.7 0.6 2.2 2.2
As percent of current revenue
Recurrent expenditure 100.3 153.1 132.9 70.4 137.4 141.1 375.7 b/Total expenditure 163.9 201.1 181.2 107.6 165.6 208.6 505.1 b/Overall deficit -59.9 -97.1 -75.8 -7.3 -64.3 -100.9 -383.2 b/Domestic borrowing 31.6 75.8 63.2 6.2 63.0 99.7 337.1 b/
A/ GDP for fiscal years estimated using moving average of calendar year estimates (see SA Table 2.1). SinceGDP deflators for the mnre recent years are both large and unreliable, only limited reliance can be placedon current price GDP estimates.
b/ Includes supplenentary estimates of U.Sh. 4.1 billion (about 32% of total expenditure), U.Sh. 1.2 billion ofwhich related to the floating of the Uganda shilling in June 1981, and U.Sh. 1.1 billion of which reflectedallowance for price increases during 1980/81.
Source: SA Tables 2.1, 5.1, 5.2

- 20 -
Central Government has been able to re-establish an effective system of ex-
penditure monitoring and control, and this remains one of the priorityareas for further policy and institutional action.
2.13 Similar trends are evident for local government finance, a not
unimportant component of the public sector. District administrations' re-
current expenditure rose almost fourfold in nominal terms between 1974 and
1980, and now is equivalent to about 17% of central government recurrent
expenditure. In the early 1970s, district administrations were generally
able to cover these expenditures from local revenues (mainly a graduated
tax on incomes) and a block grant from central government. By 1980, localrevenues only met 82% of expenditure and block grants another 11%, leaving
7% to be covered by depletion of reserves. Although reliable data are not
available, it seems likely that urban authorities have, if anything, fared
worse, especially those which bore the brunt of destruction and lootingresulting from the 1978-79 war.
2.14 Some public corporations have managed to maintain an acceptable
standard of performance (the companies under the Textile Board and theUganda Electricity Board, for example), but the parastatal sector isgenerally in disarray. This disarray is exemplified by the accountingbacklog and the difficulty in obtaining reliable information about para-
statals; of 97 parastatal bodies listed by the Director General's office as
of January 1982, 31 had never presented audited accounts while a further 38
were one year or more in arrears. Together, the parastatals constitute a
net drain on central government finance: excluding on-lending of foreignfunds, parastatals received U.Sh. 260 million in loans from the Government
during 1980/81 (1.9% of government expenditure), and paid dividends to the
Government totaling U.Sh. 29 million (all from the oil companies). In thelast six months of 1981, payments to parastatals reached U.Sh. 1.1 billion(5.2% of government expenditure), many of them, however, to cover increased
capital requirements following the June 1981 devaluation of the Ugandanshilling- Loan repayments by the parastatals have been negligible, whilesizeable tax payment arrears continue to build up. (On the other hand,many of them are also owed money by the Government for services they haveprovided.) In addition, many parastatals borrow from the Uganda Commercial
Bank (UCB) against formal or informal government guarantees. At the end of
June 1981, UCB was owed U.Sh. 384 million in this way by parastatals, whilefrom July to December, it lent them a further U.Sh. 6.9 billion, againlargely because of the increased costs of local cover following the deva-luation of the Ugandan shilling. Several companies have been accumulatinglosses, which will eventually have to be written off or capitalized, butfor which no budgetary provision has been made. These financial problems
reflect to some extent the depressed state of the economy and the impact of
war damage. Many parastatals have also suffered in the past from theimposition of inappropriate pricing policies. But the general organization
of the parastatal sector and the management of individual public companieshave in themselves contributed to the overall problem.

-21-
2.15 Money and prices. The Ugandan financial system comprises theBank of Uganda (the central bank), seven commercial banksl 5 , four othercredit institutions, two development banks 1 6 , a post office savings bank,and several insurance companies. The commercial banks represent the heartof the system, accounting for the bulk of financial resources mobilized andallocated. Over the last decade, commercial banking coverage has declinedsharply: whereas in 1970 Uganda had 290 bank branches, or one for every34,000 people, present estimates i:n icate only 110 branches stilloperating, or one for every 115,000 people. Despite highly negative realinterest rates, the commercial banking system has remained remarkably liq-uid in recent years; non-governmental demand for commercial credit waslight, and a number of banks even decided to stop accepting time deposits.This seemingly paradoxical situation is probably indicative of the virtualcollapse in monetary sector activities, the continuing importance of "ma-gendo" transactions, and the general shortage of goods readily availablefor purchase, at affordable prices. To some extent, the apparent lowdemand for commercial credit probably also reflects the creditworthinessproblems of most private and parastatal organizations (due to their poorfinancial situation and ownership disputes), which limited their access tonormal credit facilities.
2.16 Fuelled by large central government deficits, financed primarilyby borrowing from the Bank of Uganda, the money supply almost doubled overthe two years 1979 and 1980, and continued to rise at a rapid rate into1981 (see SA Table 6.1). Not surprisingly, the Government's share in totaldomestic credit continued to rise over this period, reaching 83% by the endof May 1981 (compared to 69% at the end of 1978 and 51% at the end of1971). The rapid money supply growth inevitably led to sustained pressureon domestic prices. This is perhaps most vividly illustrated in Table 2.5,which shows the sharp increase in market prices for a range of basicconsumer goods. The only official cost-of-living index presently availablethrough 1981 is the low-income index for Kampala (see SA Table 6.2).Unfortunately, this index is distorted by the inclusion of some controlledprices prior to 1979, and incomplete coverage of the monthly base dataduting both 1980 and 1981. However, independent estimates of the generalrate of inflation prepared by the IMF suggest that it has been averagingclose to 100% per annum over the past three years.
15/ The largest is the Uganda Commercial Bank (UCB), which is wholelyowned by the Government. The remaining six include five foreign-owned banks (four of which are Ugandan subsidiaries with minoritygovernment participation) and a cooperative bank.
16/ These are the Uganda Development Bank (UDB) and the East AfricanDevelopment Bank, owned jointly by Kenya, Tanzania and Uganda. Athird institution involved in term financing of industry, theDevelopment Finance Company of Uganda, ceased operations in themid 1970s and is yet to be reactivated.
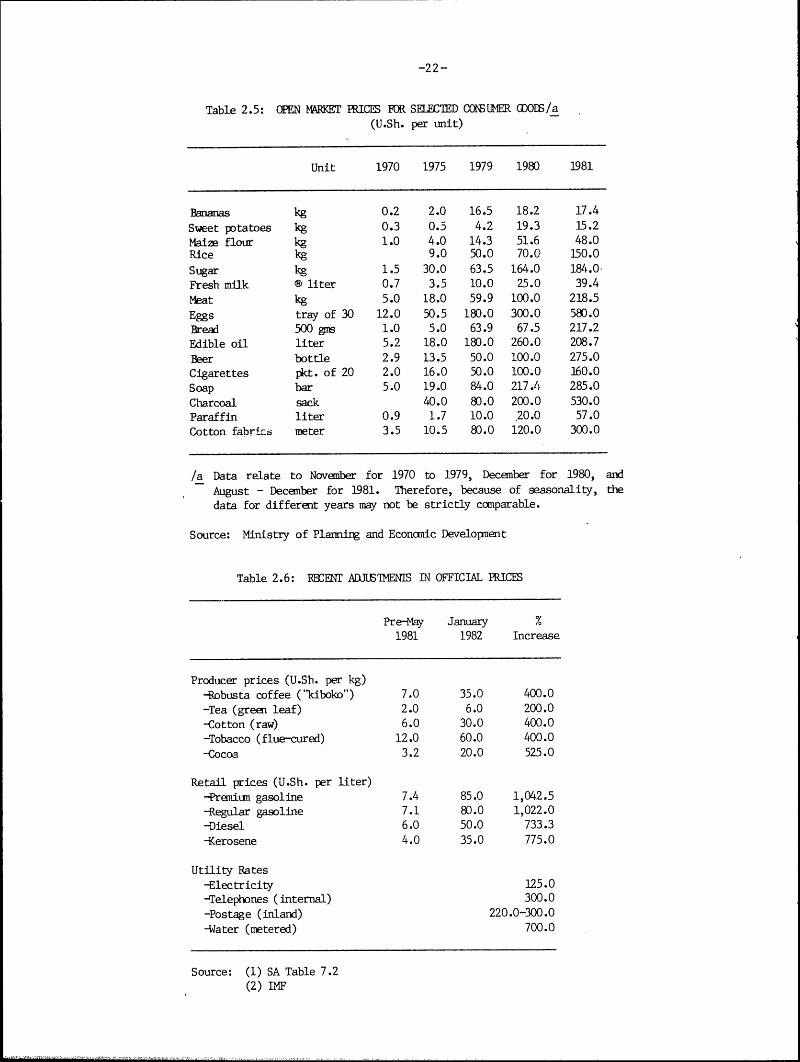
-22-
Table 2.5: OPEN MARKET PRICES FOR SELECTED C0SUER (DODS/a(U.Sh. per unit)
Unit 1970 1975 1979 1980 1981
Bananas kg 0.2 2.0 16.5 18.2 17.4
Sweet potatoes kg 0.3 0.5 4.2 19.3 15.2Maize flour kg 1.0 4.0 14.3 51.6 48.0Rice kg 9.0 50.0 70.0 150.0
Sugar kg 1.5 30.0 63.5 164.0 184.0Fresh milk 0 liter 0.7 3.5 10.0 25.0 39.4
Meat kg 5.0 18.0 59.9 100.0 218.5
Eggs tray of 30 12.0 50.5 180.0 300.0 580.0
Bread 500 gms 1.0 5.0 63.9 67.5 217.2
Edible oil liter 5.2 18.0 180.0 260.0 208.7
Beer bottle 2.9 13.5 50.0 100.0 275.0
Cigarettes pkt. of 20 2.0 16.0 50.0 100.0 160.0
Soap bar 5.0 19.0 84.0 217.4 285.0
Charcoal sack 40.0 80.0 200.0 530.0Paraffin liter 0.9 1.7 10.0 .20.0 57.0Cotton fabric meter 3.5 10.5 80.0 120.0 300.0
/a Data relate to November for 1970 to 1979, December for 1980, and
August - December for 1981. Therefore, because of seasonality, the
data for different years may not be strictly camparable.
Source: Ministry of Planning and Economic Developnent
Table 2.6: RECENT ADJLSTMENIS IN OFFICIAL PRICES
Pre-+May January %1981 1982 Increase
Producer prices (U.Sh. per kg)-Robusta coffee ("kiboko") 7.0 35.0 400.0-Tea (green leaf) 2.0 6.0 200.0
-Cotton (raw) 6.0 30.0 400.0-Tobacco (flue-cured) 12.0 60.0 400.0
-Cocoa 3.2 20.0 525.0
Retail prices (U.Sh. per liter)-Premium gasoline 7.4 85.0 1,042.5
-Regular gasoline 7.1 80.0 1,022.0-Diesel 6.0 50.0 733.3
-Kerosene 4.0 35.0 775.0
Utility Rates
-Electricity 125.0
-Telephones (internal) 300.0
-Postage (inland) 220.0-300.0
-Water (metered) 700.0
Source: (1) SA Table 7.2(2) IMF

- 23 -
C. The New Financial Program
2.17 In early June 1981, the Government reached agreement with the IMF
on a comprehensive financial program.1 7 The objective of the program isto stabilize the economy and eventually revive investment and productionthrough restoring confidence in the currency, eliminating price
distortions, and improving fiscal and monetary discipline. In particular,
the Government took the following actions:
(a) "floated" the Ugandan shiling, effectively devaluing itapproximately 90% from 7.8 to the US dollar to around 80 (byearly 1982, the rate had fallen further to around 85);
(b) removed administered price controls,1 8 except for major exportcrops, petroleum products and public utility tariffs. In a
series of adjustments, the Government has substantially raisedthe remaining administered prices since April 1981 (see Table2.6);
(c) rationalized the taxation structure by: (i) changing import
duties from specific to an ad valorem basis and reducing the num-
ber of different rates of duty from 22 to 12; (ii) merging thePublic Sector Investment Contribution (PSIC) with sales tax or
excise duty; (iii) equalizing sales tax on imports and domesticproduction; and (iv) raising the effective rates of sales tax andexcise duty on a number of major revenue-producing items, whileconverting some excise duties to an ad valorem basis;
(d) agreed to ceilings on the budget deficit, government borrowingand domestic credit expansion; and
(e) introduced a more realistic and flexible interest rate structure.
2.18 The key component of the program is clearly the 90% devaluationof the shilling, which represents a courageous and much needed break withpast policies. Although the adjustment is referred to as a "float" (andindeed that concept is useful insofar as it provides the Government with
latitude for further exchange rate changes), there is no illusion that the
present exchange rate is adequate to clear the foreign exchange markethowever restrictively defined. Commercial banks are still required to sell
their foreign exchange to the Bank of Uganda at fixed rates, foreignexchange allocations are tightly controlled, and a substantially higherblack market exchange rate still exists. Nevertheless, the new exchange
17/ This is supported by a 13-month stand-by arrangement for US$135million. In addition, Uganda drew US$54 million under the Com-pensatory Financing Facility in June 1981.
18/ Guidelines on pricing are still given by the Ministry ofCommerce, and some parastatals reportedly have been reluctant toraise prices beyond these levels. The Government has, however,clarified that these guidelines are only intended to help firms
revise their cost estimates following the devaluation of the
Ugandan shilling, and are not intended as ceilings.

rate (and related price adjustments) does seem to have led to a substantialreduction in "magendo" transactions and smuggling. It will obviously benecessary to keep the exchange rate under continual review, to ensure thatit provides a realistic guide to the value of foreign exchange over the me-dium term. But, for the next few years, the viability of the economy willdepend critically on the availability of additional external assistance andimprovements in the present system of foreign exchange management.
2.19 A major step towards restoring the economy's export sector hasalready been taken with the recent adjustments in producer prices, as shownin Table 2.6. Apart from tea, these adjustments have provided farmers witha positive return on export production and, with a narrowing of the pricedifferentials vis-a-vis neighboring countries, there has been a noticeablediversion of supplies back into official channels. (For example, in thecase of robusta coffee, CMB estimates that, because of higher officialpurchases, stocks with primary processors have doubled over the past sixmonths to around 50-60,000 tons of clean coffee equivalent. Unfortunately,because of the processing bottleneck, this has not as yet been.reflected inany significant increase in coffee export volumes.) But, the returnsavailable by growing food crops are still substantially higher, and atpresent price levels, it remains uncertain whether farmers will be preparedto reinvest in export production to any large extent (see paragraphs 4.33 -4.38). The ability and willingness of farmers to respond to higher pro-ducer prices will also depend to a large extent on the availability of com-plementary inputs and incentive goods, as well as the effectiveness of theinstitutional structure for crop processing and marketing. Therefore, theimpact of the present producer prices will have to be carefully monitored,to see if and when additional adjustments may be warranted. The case forfurther producer price increases, as well as some suggestions for improvingthe system of producer pricing, are discussed further in Chapter 3.
2.20 For industrial products, it is hoped that removal of price con-trols will help divert previous "magendo" profits back into the officialeconomy. Initially, a large proportion of these gains will be channeledinto government revenue, as a result of the tax adjustments noted above.Indeed, for a number of items, the new tax rates appear to have been setwith the objective of absorbing most of the difference between ex-factorycosts and market prices. As a result, it has been estimated that theeffective rates of sales tax and excise duty now average 40% - 50% of ex-factory costs for the industrial sector as a whole, ranging as high as 620%for beer and 725% for cigarettes. In general, these exceptional rates areprobably justified under the present exceptional conditions, given the needto contain the Government's budget deficit and the evident capacity of themarket to bear even higher price levels. However, it will be important tokeep these tax rates under careful review to ensure that market prices,especially of basic consumer items, can be adjusted down as productionlevels recover, while still providing the producing units adequate profitsfor reinvestment and growth. From the point of view of the Government,such discretionary increases in tax rates do not improve the buoyancy ofthe tax system. This will depend on applying ad valorem sales taxes to awider range of goods, as production revives. Excessive dependence on largediscretionary increases in tax rates could jeopardize this revival, as wellas perpetuate the concentration of revenue on a few easy "tax handles".
-25-
2.21 As most goods were already being sold at inflated "magendo" pri-ces, the impact of the devaluation and removal of price controls on market
prices has been somewhat less than might otherwise be expected. (See SAtable 6.3 for a summary of recent price trends.) The sharpest increases
have in fact resulted from the substantial adjustments in official retail
prices for petroleum products, which reportedly have already had an impacton smuggling and consumption. Many other market prices also rose initiallyin June 1981, as the economy reacted nervously to the new program, but most
have since stabilized and some have even come down. For a few basicconsumer items -- sugar, rice and salt -- present prices are actually below
pre-devaluation "magendo" levels. Nevertheless, as discussed below, the
impact on those who previously had preferential access to goods at
controlled prices has obviously been more severe. Furthermore,
inflationary pressures could quickly re-emerge under present conditions,
especially if transport bottlenecks and security problems restrict themovement of basic goods to isolated and heavily-populated areas.
2.22 While present market prices may not in general be substantiallyhigher than before devaluation, they are still very high in relation tofixed income levels. In August 1981, the Government did announce increases
of over 100% in the mini.mum wage (to U.Sh. 950 per month) and averaging 25%
(tapering down to 8% at the higher levels) for civil service salaries.
However, these increases are very small in relation to the general erosion
of real purchasing power over the past ten years. For example, for middle
and senior ranking civil servants, salaries have been increased by 80% to110% from late 1975 to now, while over the same period, prices of selected
consumer items on the open market rose between 500% and 2,000%. Evenafter the latest salary adjustment, a senior civil servant's gross monthly
salary would only buy the equivalent of either 12 kilograms of sugar, or 31
kilograms of rice, or 7 bottles of beer, or 7 bars of laundry soap or 6liters of cooking oil. Admittedly, the effective purchasing power of civil
servant salaries was in the past enhanced by preferential access to goods
at controlled prices, and still is by subsidized housing and other perqui-sites, especially for ministers and senior civil servants. However, with
the removal of price controls, some civil servants are now suffering econo-
mic hardship, and the implications of this for morale and discipline need
to be taken seriously. Therefore, while it is recognized that wage andsalary restraint is an integral part of the adjustment process in Uganda,this needs to be balanced against the need to sustain at least a minimumstandard of living for the general population and to maintain adequate work
incentives, especially within the civil service. In an effort to minimizethe budgetary impact of any further salary adjustments, the Governmentshould also look carefully at the present size of the civil service, to seewhether there is scope for reductions in personnel numbers.
2.23 Turning to the central government budget, the general impact of
the financial program on economic recovery, as well as the specific provi-
sions for price and tax adjustments, are expected to lead to a tenfold

-26-
increase in revenue during 1981/82 (see SA Table 5.1). Receipts fromexternal grants were expected to rise twentyfold, equivalent to a treblingin US dollar terms at the exchange rate assumed in the budget. The budget,however, provided for much more moderate increases in expenditure,threefold in the case of recurrent expenditurel 9 and fivefold fordevelopment expenditure. The overall result was a projected currentsurplus of U.Sh.14.3 billion, as compared to a deficit of U.Sh.6.9 billionin 1980/81, and a reduction in the overall deficit from U.Sh. 10.2 millionin 1981/81 to U.Sh. 4.0 billion in 1981/82. With increased externalborrowing, domestic deficit financing would have been almost eliminated.
2.24 The actual outturn for the first six months of the fiscal yearfell below these expectations, but was nevertheless a significant improve-ment on 1980/81. Revenue was about 74% of estimates (pro-rated), while re-current expenditure was about 54% higher and -levelopment expenditure nearly50% lower than expected (total expenditure was 7% above budget estimates).Export duty collections (entirely from coffee) were coincidentally equal tobudget estimates, the October increase in producer prices having beenalmost exactly compensated for by the greater-than-expected devaluation ofthe Ugandan shilling. Customs duty, excise duty and sales tax laggedbehind estimates, mainly because of the low level of imports, includingimported inputs for industry. Part of the rise in expenditure is attri-butable to the foreign exchange loss on arrears, estimated at U.Sh. 4.5billion. In addition, the budget estimates were prepared assuming'an aver-age exchange rate over the year of U.Sh.53 per US dollar. To date, theactual rate has been in the range U.Sh.80-85 per US dollar. Security andadministration expenditures were underestimated in the budget.
2.25 The prospects for adhering to the 1981/82 budget estimates under-lying the financial program will depend on finding additional revenue andexternal assistance, as well as on curbing expenditure. The earlier dis-cussion indicates that further discretionary increases in tax rates are notadvisable, but the Government has improved tax collection, especially ofexport duties and tax arrears. The main burden, however, will fall onexpenditure, which will almost certainly have to be held to a lower levelin real terms than envisaged in the budget. This has been achieved so farby curbing the development budget and by reducing cash allocations to min-istries. However, as indicated in Chapter 3, the control of expendituremust also improve.
19/ This increase is calculated excluding from 1980/81 recurrent ex-penditure those portions of supplementary expenditure incurred inJune 1981 relating to the float of the Ugandan shilling (U.Sh.1,184 million) and to price increases (U.Sh. 1,126 million). Therecurrent expenditure estimates for 1981/82 include provision forthe average increase of 25% in wages and salaries announced inAugust 1981.

- 27 -
Chapter 3
PRIORITIES AND PROSPECTS
A. Introduction
3.1 Perhaps the most lucid statement of the Government's own objec-tives and strategy for the medium-term development of the country is pro-vided in a Communication from the Chair of the National Assembly, appropri-ately entitled "The Challenge of Recovery", by President Obote in March1981. In this speech, the President outlined the present problems facingthe Ugandan economy and the broad dimensions of the Government's rehabili-tation program. Understandably, primary emphasis was placed on the need torestore law and order within the country, a basic prerequisite for futureeconomic progress. However, the need for direct measures to improve pro-duction was also recognized. To quote from the President:
"there can be no economic development nor can the eco-nomy sustain efficient social services without in-creased production. It follows, therefore, that themain thrust in restoring our economy to a sound levelwill be to rehabilitate, as fast as possible, theexisting productive sector. Uganda is richly endowedwith natural resources. In addition, it has talentedand hardworking citizens whose aspiration towards self-improvement is all too evident. However, our presenteconomic situation is a major constraint."
"Let me reiterate ..... that financial assistance fromfriendly nations and institutions is only supplementaryto our own efforts. The success of our economic re-covery and development will depend very heavily on theexistence of correct policies and a strong implementingmachinery coupled with hard work by all able-bodiedpersons. On the part of Government, we shall strength-en the National Planning Commission, restructure theMinistry of Planning and Economic Development and cre-ate planning units in ministries and the districts.All these measures shall be to give practical meaningto the socio-economic policy which the Government hasadopted. The Government has clearly stated that itshall follow the policy of mixed economy in which theState, the private sector, and the Cooperative Movementwill play a role". (Page 4)
3.2 The real priority at this time is to translate these broad prior-ities into a program of resource allocations, policies and institutionalreforms, designed to rehabilitate the economy over the next two to threeyears. Given the resource constraints, this program will have to includeonly very low levels of investment in new capacity. Instead, the emphasisshould be on recurrent financing of maintenance and operations, andpriority rehabilitation projects. Particular attention needs to be givento the mobilization and management of foreign exchange, which will remain

- 28 -
the key constraint on the implementation of any rehabilitation program.Many of the related policy concerns have already been addressed in the newfinancial program; while, as discussed in Chapter 2, there is scope forfurther policy adjustments, these need to be seen as part of an ongoingprocess of review and refinement which is inevitable in such a fluid andunpredictable economic environment. The more fundamental problems still tobe tackled are in the areas of economic management and institution build-ing. These will be reviewed in Section B below. The implications of reha-bilitation for the foreign exchange outlook and aid requirements are dis-cussed in Section C.
B. Priority Areas for Further Action
3.3 Foreign exchange management. The administrative machinery forallocating foreign exchange in'rolves three basic stages. Firstly, at thestart of each fiscal year, discussions are held between the major minis-tries to determine the broad range of import requirements. Although noannual foreign exchange budget has been formally approved in recent years,indicative import lists have been prepared to help guide import licensing.This is the second stage, and is done by a number of authorities, dependingon the source and use of the foreign exchange: government imports by theCentral Tender Board, petroleum imports by the Ministry of Finance, exter-nally-financed imports by a committee under the Ministry of Planning, andother general imports financed out of "free" foreign exchange by a commit-tee under the Ministry of Commerce. The Advisory Board of Trade, whichpreviously had responsibility for issuing import licenses, now acts as asecretariat for the allocation committee under the Ministry of Commerce.Finally, for those imports where financing is not provided, foreign ex-change is released by the Bank of Uganda. Since the start of this fiscalyear, the release of foreign exchange has been limited to licenses endorsedby the Presidential Economic Advisory Committee (PEAC),l which makes itsdecisions on the basis of monthly forecasts of the availability and priorclaims on foreign exchange prepared by the Bank of Uganda. As the netavailability of foreign exchange is substantially less than the value oflicenses issued, the effective control over import allocations is made atthis stage.
3.4 Given the severe restraint on Uganda's import capability at thepresent time, and the almost unlimited "priority" import requirements, itis not surprising that the administrative machinery for allocating foreignexchange has come under increasing strain. The Government has responded tothis situation with a number of further improvements in recent months: anIMF advisor has been appointed within the Bank of Uganda to help with thepreparation of the foreign exchange forecasts and to monitor actual foreignexchange flows; the period covered by these forecasts is to be extendedfrom one to three months; and the import proposals submitted to PEAC forapproval are now reviewed by a special committee, including representativesfrom the private sector and CMB. These are encouraging developments.Nevertheless, it seems clear that further strengthening of the system will
1/ This committee includes representatives from the Ministry ofFinance, Bank of Uganda, and Uganda Commercial Bank.

- 29 -
be required, if it is to deal effectively with the present foreign exchangepressures.
3.5 Firstly, it is essential that a more comprehensive budgetaryframework is adopted, which takes account of all sources and all uses offoreign exchange. At the moment, payments for government services andgoods (including pledges against coffee earnings), petroleum imports andexternally-financed imports are largely taken to be prior claims on theavailable foreign exchange, and trade-offs are consequently only consideredwithin the very small residual balance. One of the adverse consequences ofthis approach is that inadequate priority has been given to the recurrentimport requirements of the productive sectors. For externally-financedimports, the options for reallocating funds towards higher priority itemsneed to be explored. If this is not possible, it may be better not to usethe financing. In making this decision, particular attention should begiven to the net impact of the financing on the balance of payments, takinginto account its terms and conditions, as well as related investment andrecurrent costs which are unfunded.
3.6 A second area of concern regarding the allocation system, is theapparent preoccupation with requirements at the budgeting and licensingstages, without due regard for the limited foreign exchange available. Forexample, a six-month list of "emergency" import requirements prepared inOctober 1981 totaled US$530 million; this is larger than the likely inflowof foreign exchange from exports, grants and net loan disbursements for thewhole of 1982. As a result, while it is difficult to find fault with thebroad priorities indicated in this import list, these provide little guid-ance to the "priorities within priorities" which should be financed withina more limited, resource-constrained framework. Although the final reviewby PEAC has played a valuable role in preventing over-budgeting of foreignexchange, this crisis management approach is not well suited to a rationalselection of import priorities. What is needed, therefore, is a resource-constrained and integrated annual import budget, based upon a realistic(preferably conservative) estimate of foreign exchange availability. Addi-tional priority imports should also be identified, but only approved if andwhen additional foreign exchange becomes available. Initially, prioritywould have to be given to: (a) imports of basic consumer items in shortsupply, which cannot be produced domestically (e.g., soap, cooking oil,medical supplies); (b) imports of raw materials and inputs to utilize exis-ting capacity, especially to produce basic consumer goods and exports; and(c) imports to support selective (see paragraph 3.13) rehabilitation ofcapacity in priority areas. Clearly, this exercise needs to be closely co-ordinated with preparation of the government budget and investment plan, toensure consistency. It is also important that interlinkages, both betweenimport requirements and with other policy measures, are taken into accountin determining the phasing of import allocations.
3.7 A final, but related, concern is the need to strengthen the tech-nical capacity to evaluate individual import requests and relate them tothe broad budget allocations. Traditionally, this has been done by theAdvisory Board of Trade for non-governmental imports and by the CentralTender Board for government imports, but there is a case for centralizingthis function, possibly within the Ministry of Finance or the Bank of

- 30 -
Uganda. Without this technical input, there is a danger that the limitedforeign exchange available will not be used to full benefit. In the indus-trial sector, for example, the few import allocations approved over thepast year have often been too small in amount to be effective or not accom-panied by sufficient complementary allocations to relieve related bottle-necks. For example, the Tororo Cement Factory was allocated importedasbestos and spares but not bags to pack the cement produced. Similarly,Nyanza Textiles has also been allocated spares, but production is stillconstrained by shortages of chemicals and dyes. There has also been inade-quate attention to industrial linkages. An allocation was made to theUganda Electricity Board, for example, to import conductors, which couldhave been produced domestically by the Uganda Cable Corporation if importedinputs had been available. Another danger is that over-reliance will beplaced on a few established import channels, both in terms of the buyer(mostly parastatals) and seller (mostly Kenyan/Ugandan agents). For exam-ple, of the licenses issued from June to mid-August 1981, 90% went to para-statals, most of which were trading parastatals under the Advisory Board ofTrade. Following the subsequent selection of licenses for endorsement byPEAC, this percentage probably went even higher. Unfortunately, we do nothave a clear picture of what alternative trading channels were available,nor of what percentage of these imports eventually ended up in the privatesector. Given that many of the private trading links were broken duringthe military regime, and the small amount of foreign exchange allocated,the high percentage channeled through trading parastatals may have been un-avoidable. But the real concern is to ensure that the import applicationand tendering procedures do not by themselves limit import sources and sup-port unnecessary trading monopolies. A strong technical input is a basicprerequisite for establishing a more open and effective import licensingsystem.
3.8 At the moment, tight management of Uganda's scarce foreign ex-change resources is inevitable. However, over the longer term, as the bal-ance of payments situation improves, there will be scope for graduallyreducing the country's dependence on quantitative import restrictions, andaccordingly, the foreign exchange management system should be relaxed.With more adequate supplies of imports and domestic inputs, many of Ugan-da's industries could potentially compete successfully with other suppliersin the region and further abroad (as they have in the past), provided a re-alistic exchange rate is maintained. Therefore, domestic pressures forlonger-term protection, once the present balance of payments problems arepassed and market penetration is re-established, need to be resisted.Otherwise, it will be difficult to break the vicious circle of low effi-ciency and production, coupled with high costs and prices, which hascharacterized the economy over the past decade.
3.9 Public administration and finance. The need to strengthen theforeign exchange management system is symptomatic of a wider problem oflimited administrative capcity within the Central Government. This is adirect result of the loss of many of the country's best administrators andtechnicians, and the virtual collapse of the civil service, as well as ofprofessional standards, during the 1970s. The impact has been to weaken awide range of administrative functions: government budgeting, tax collec-tion and expenditure control, aid coordination, investment planning, andthe compilation of statistics. Present staffing constraints can be

- 31 -
relieved by: (a) intensified efforts to recruit and train appropriate per-sonnel; (b) improved work conditions, including remuneration and careerprospects; and (c) appropriate use of technical assistance. But the morefundamental problem is to strengthen the role of the two key ministries--Finance and Planning -- within the decision-making system.
3.10 An effective budgetary process is still to be re-established inUganda. Projected expenditures often bear little relation to the likelyavailability of resources, the recurrent budget still underfunds the main-tenance and operations requirements of the economy (general public servicesand defense account for more than one-half of recurrent expenditure in1981/82), and the development budget includes many low-priority projects.2While there is obviously scope for reallocating recurrent expenditure, itseems inevitable that budgetary cuts, at least in the short term, will fallmost heavily on development expenditure. This in turn will require moreactive involvement by the Ministry of Planning in project scrutiny andselection. At the moment, the Ministry of Planning basically just aggre-gates the submissions of sectoral ministries, with little sifting out orprioritizing. This aggregation is then cut back on an arbitrary pro ratabasis by the Ministry of Finance to meet overall expenditure ceilings,while actual spending and implementation depend primarily on foreignexchange availability. In practice, this means that the allocation of de-velopment expenditure is determined by the use of external assistance andthe foreign exchange management system.
3.11 Even with an effective budgetary process, the actual revenue andexpenditure outcome will depend critically on the Government's capacity fortax collection and expenditure control. Improvements in tax collectionwill be largely dependent upon increased staffing, for both administrationand enforcement, and improved financial performance in the parastatal sec-tor, to help reduce tax delinquency and arrears. However, the more pres-sing problem at the moment, and perhaps the more difficult problem toaddress, is expenditure control. This is the administrative capacity toensure that actual spending can be related to what has been budgeted, thatcontrolling officers are held accountable for their ministries' spending,and that legal sanctions are applied in cases of misappropriation. Thiswill require: (a) improvements in the speed and accuracy of governmentaccounting and the reporting of expenditure; (b) strengthening the Ministryof Finance, through staff recruitment and training, and possibly throughreorganization; (c) increasing the authority of the Ministry vis-a-visspending ministries and parastatals; (d) reviving the Auditor General'soffice and the Public Accounts Committee; and (e) in future, institutinglegal proceedings against individuals implicated by audit reports. Howeverintractable these problems may now appear, it is essential that a start bemade in resolving them.
2/ In the 1981/82 development budget, for example, several seeminglylow-priority projects have been included: the Ministry of Agri-culture and Forestry has provided for irrigation and mechaniza-tion projects, and citrus schemes; the Ministry of Animal Indus-try has provided for ranches, dairies, feedlots and exotic cattleimportation; and the Ministry of Urban Development and Housinghas provided substantial sums for new office accomodation, "slumupgrading" and "major improvements to unallocated stores".
- 32 -
3.12 Another major limitation on the Government's capacity to raise
and utilize resources has been the absence of an effective system for aid
coordination. Sectoral ministries have often sought external support for
their projects directly, and only worked through the Ministries of Finance
or Planning at the negotiating stage. Little attempt has been made to
establish the priority for the project proposal or to reallocate the finan-
cing commitment to more pressing (often recurrent) import requirements.Although the overall levels of external assistance remain insufficient to
cover even the country's minimum import program, aid donors often find
themselves unnecessarily competing for suitable projects due to the lack of
adequate information flows between ministries, and between the Government
and the international community. The Government has now reaffirmed
(through a presidential circular of May 1981) that statutory responsibility
for negotiating aid agreements and financial obligations is with theMinistry of Finance alone, and this should be strictly enforced. However,
the Ministry of Planning also needs to take a much more active role in theprior selection of project and technical assistance proposals which are
considered suitable for external financing.
3.13 One of the reasons for the deficiencies in both aid coordination
and the preparation of the development budget has been the failure to come
up with a realistic investment plan. A ten-year action program3 has been
prepared, but this is based on highly unrealistic assumptions regarding
economic performance and the availability of resources for investment.Furthermore, the detailed project proposals for each sector included in the
program are only loosely related to the overall macro framework. In many
cases, these proposals are little more than general sectoral priorities(e.g., "rehabilitation of the tea industry") with only rough, or in some
cases no, indication of cost implications. There is no discussion of howthese projects were selected or their relative priorities, both within and
between sectors. There is an obvious need for a more thorough analysis ofthe effective contribution of each project proposal to economic recovery.Under present conditions, projects which improve utilization of existing
capacity and help earn or save foreign exchange (on a net basis) are likelyto have higher rates of return. Similarly, infrastructure investments
which support these projects also need to be given priority, although care
needs to be taken to ensure that the least-cost option has been selected.Some rehabilitation priorities identified in the sectoral chapters of this
report include: repairing processing plants for export crops (especiallycoffee, cotton and tea); rebuilding industrial capacity to supply agricul-tural inputs (e.g., hoes) and basic consumer goods (e.g., soap, textiles,
footwear, sugar and edible oils); re-equipping of the road maintenanceprogram and rehabilitation of priority road links; strengthening the rail-way signalling and communications system; replacing old electricity sub-stations and distribution networks; and repairing damaged classrooms, espe-
cially in primary schools.
3/ Ministry of Planning and Economic Development, A Ten-Year
Programme of Action 1981-1990, for presentation at the UNCTADConference on Least Developed Countries, held in Paris in
September 1981.
- 33 -
3.14 With these concerns in mind, the Government is reviewing itsinvestment proposals, and intends to present a more realistic and priori-tized list as part of its two-year economic recovery program (presentlybeing prepared with assistance from the Commonwealth Fund for TechnicalCooperation). The Government should adopt this as a basic policy document,translating it into action through the government and foreign exchange bud-gets for 1982/83. This program should also provide a useful guide for po-tential aid donors, to help identify where their assistance can best bedirected in support of the Government's own rehabilitation efforts.
3.15 Sectoral planning problems will be discussed in more detail inPart II of this report. However, the general nature of these problems iswell illustrated by the present situation in the transport sector. Trans-port planning is poorly coordinated, with overlapping responsibilitiesshared by the Ministries of Transport, Works and Planning, and the numerousparastatals involved in the sector. In practice, planning is virtuallynon-existent, leaving the operating parastatals, by default, with a highdegree of autonomy in investment decisions, which is often exercised with-out due regard to intermodal coordination or the broader priorities of theeconomy. It has also left the sector vulnerable to pressure from vestedinterests. As a result, even the limited resources available to the sectorhave been poorly managed: (a) trucks and aircraft have been diverted fornon-rehabilitation purposes; (b) the railway, which is cost efficient forlong-haul traffic, has been underutilized; and (c) there has been over-investment in lake ferries, long-haulage trucks and larger aircraft forinternational traffic. There is, therefore, an urgent need to review fu-ture investment plans and import allocations for the transport sector, toensure that they are effective in relieving critical bottlenecks and im-proving utilization of the existing transport capacity.
3.16 Finally, a major constraint on all administrative functions inUganda is the deficient statistical base. The Statistical Department inthe Ministry of Planning, which has primary responsibility for the collec-tion and compilation of official statistics, has effectively ceased tofunction. Fortunately, much of the raw data collected by ministries intheir day-to-day operations (e.g., foreign exchange and budget transac-tions) have been retained, although it will take a lot of effort to clearthe backlog of compilation needed to put them into a useable form. But,information normally collected by special surveys, including major inputsinto the national account statistics, will be almost impossible toreplace. This task is made immeasurably more difficult by the increasingimportance of subsistence production and "magendo" transactions in recentyears, which by their nature are usually unrecorded. However, the impor-tant task is to rebuild the capacity to collect and compile data in thefuture. This will require recruitment of additional qualified staffing,including support from technical assistance, and the re-establishment ofchannels of routine reporting, most of which have broken down over the pastdecade.
3.17 Parastatal organization. The Government is acutely aware of thepresent problems in the parastatal sector, resulting in large part from theloss of key personnel and chaotic expansion of the sector during the1970s. In the President's Communication from the Chair, quoted at the

- 34 -
beginning of this chapter, the Government's intention to follow a "mixed
economy" strategy is clearly outlined. This Communication goes on to say:
"Many . . . parastatal bodies and companies are a drain on public
funds and do not have qualified personnel to run them. The
Government is examining the best way of selling them off or
returning them to their original owners." (Page 4)
Consistent with this approach, the Government is drafting legislation
to allow former owners to claim their property and either repossess and
operate it, or claim compensation. 4 Already, some private owners have re-
turned to Uganda, notably in the sugar and tea industries, although in each
case some interim arrangements have been made with the Government, usually
on a joint venture basis. But, more generally, it remains to be determined
what should be the role of the parastatal sector in Uganda, and the basis
on which public ownership should continue, the mechanism of disinvestment
of assets and compensation, and the scope for developing more private sec-
tor investment and initiative. Progress on these broader policy issues
will probably continue to be slow, until the Government has a better idea
of the present operational and financial position of individual paras-
tatals. For this reason, high priority needs to be given to the task of
updating parastatal accounts, preferably through the recruitment of quali-
fied and reputable auditors from outside Uganda.
3.18 Narrowing the scope of parastatal operations, through privatiza-
tion and closures, will help reduce the burden on the public sector's
stretched manpower resources. The financial position of the remaining
parastatals will also be improved to some extent by the recent decision
to remove most price controls, as well as by a general recovery in economic
activity. However, for most parastatals, more far-reaching improvements in
management and operating procedures will be required before they can become
financially viable. This will involve decisions and follow-up action on:
(a) clarifying the status and ownership of many parastatals, which present-
ly have no articles of association, capital or legally-recorded assets; (b)
restoring executive responsibility to boards of directors and to manage-
ment, selected for their professional qualifications and technical compe-
tence; (c) resolving the problem of outstanding debts, by providing whereappropriate official debt write-offs, rescheduling or refinancing; and (d)providing, for viable organizations, short-term financial support in order
to effect rehabilitation and in particular to generate the local (Ugandan
shilling) cover needed to finance imports of raw materials, spare parts and
other needed inputs. More generally, the Government will have to decide on
an appropriate structure for the public enterprises: their relationship
with "parent" ministries and, assuming the Government follows the logic of
a mixed economy, the basis on which they will compete and do business with
the private sector.
4/ Ownership problems not only affect former private owners whosecompanies were nationalized, but also other parastatals whose
subsidiaries were removed under the military regime. The Uganda
Development Corporation, formerly a viable and effective organi-zation, was truncated in this way, but was never compensated.

- 35 -
3.19 At present, the scope for private sector competition in many keysectors remains limited. In the export crop sector, for example, a numberof parastatals -- like the Coffee Marketing Board and the Uganda TeaAuthority -- have exclusive statutary rights to purchase and sell all pro-duction. In other sectors, most notably commerce, parastatals have a defacto monopoly based on privileged access to credit, government guaranteesor through the operation of the import licensing system. It is question-able whether these monopolies or quasi-monopolies serve a useful purpose.In the export sector, some official role will continue to be required formost crops, either to control quality standards or to provide trade inform-ation and promotion. But, this can be done without imposing trading mono-polies which, in the past, have often worked against the most importantlink in the export chain, the producer. In the commercial field, greatercompetition would also seem to offer advantages, provided the dangers ofover-invoicing and capital transfers by private companies are adequatelyaddressed through open bidding and tendering procedures, and by supervisionthrough such agencies as the General Superintendence Company.
3.20. To avoid further unplanned development (or reduction) of theparastatal sector, there is a strong case for establishing a specializedunit within the Department of Economic Affairs (Ministry of Finance) to co-ordinate parastatal operations and policies: reviewing company perfor-mance, formulating management and personnel policies, monitoring the bud-getary and financial impact of parastatal operations, and ensuring consis-tency and feasibility of objectives. Such responsibilities are at presentnot defined or located adequately in government. The Ministry of Financetheoretically carries budgetary responsibility, but does not have the capa-city to carry this out; sector ministries may or may not pursue compatibleapproaches to the parastatals under their purview, and more often than not,provide little guidance on the broader issues of sectoral priorities andpolicies. Such a specialized body would serve as a focus for accountingassistance, and could also advise on joint ventures, especially whenforeign investment is involved.
3.21 Pricing policy. In the past, the monopoly position of many para-statals was protected to some extent by the imposition of administeredprice controls. These became increasingly unrealistic during the 1970s, assevere shortages developed and many goods were only traded on the "magendo"markets or smuggled overseas. The first major reversal of this policy camein 1977, when food prices were decontrolled, and since mid 1981, all pricecontrols -- except on major export crops, petroleum products and publicutilities -- have been removed. Some of the remaining distortions havebeen reduced by the recent adjustments in controlled prices. For industry,the removal of most price controls is a major step towards restoring a morecompetitive and financially viable sector, even though, as noted in Chapter2, a large proportion of some producers' profits, required for reinvestmentand growth, is presently being absorbed by high effective rates of salestax and excise duty. The real concern, however, is with the official pro-ducer prices for export crops, which, even after the recent adjustments, donot cover costs in the case of tea, and provide a substantially lowerreturn than food production for coffee, tobacco, and cotton..
- 36 -
3.22 At the new exchange rate and present world price levels, the far-
mer's share in export earnings is 70% for cotton, 50% for robusta coffee
and less than 40% for tea and tobacco. The balance is absorbed by proces-
sing and marketing margins, and, in the case of robusta coffee, by the im-
position of an export duty. For most crops, the processing and marketingmargins have become excessive due to the poor operational and financial
performance of the cooperatives and marketing boards involved, and the im-
pact of falling production levels on unit costs. To help break this vi-cious circle, it will be necessary to strengthen the operations and finan-
cial position of these cooperatives and marketing boards, and possibly open
up the trade to a greater degree of competition as discussed above. Ini-
tially, until production levels recover, some cooperatives and marketingboards may require temporary subsidies, to ensure that appropriate producer
prices can be paid, and promptly. In the case of robusta coffee, the
Government should also review the level of the existing export duty. At
late-1981 world prices, this absorbed about 20% of the export earnings from
robusta coffee, and is an important source of government revenue. Changes
in producer prices which involve subsidies or reductions in export dutyrates would clearly have to be weighed carefully against the need to main-
tain fiscal balance. Over the longer term, however, increased production
and official purchases of export crops (together with the higher levels ofimports and economic activity they would permit) could help strengthen the
revenue base of the Government.
3.23 The crop discussions in Chapter 4 indicate that higher producerprices are presently warranted for tea, tobacco and, to a lesser extent,
coffee. Inevitably, subsequent adjustments will also be required as the
full impact of the devaluation is felt, and world prices change. In thiscontext, it is essential that the administered prices be regularly reviewed
and adjusted in a systematic manner. For this, an appropriate institu-
tional structure needs to be found, which gives due weight to the concerns
of producers, and also provides for more automatic adjustments in producer
prices in line with world price trends. To help strengthen the analytical
base for producer price decisions, it will be necessary to re-establish ca-
pacity within the Ministry of Agriculture for collecting and analyzing in-formation on costs (producer, processing, and marketing), relative cropprices, producer responses for different areas, and world market
conditions. For the longer term, the Government should also begin a review
of the overall system of producer pricing for export crops. This shouldinclude an analysis of the potential impact on producer incentives, thebudget and the balance of payments of alternatives to administered prices(e.g. minimum support prices, open market prices) and of more competitivemarketing systems (e.g. auctions).
C. Foreign Exchange Prospects
3.24 A base case scenario for discussing Uganda's economic prospects
is summarized in Tables 3.1 and 3.2. Given the critical nature of the for-eign exchange constraint, the primary focus of the projections is on the

- 37 -
Table 3.1: SUMMARY OF BASE CASE PROJECTIONS
1981-85 1985-90
Growth rates at 1978 prices (% p.a.)GDP 6.8 4.5
-Monetary agriculture (10.0) (5.0)-Subsistence agriculture (3.5) (3.0)-Industry (10.0) (7.0)-Other sectors (5.0) (5.0)
Gross investment /a 6.8 15.7Merchandise exports 14.0 6.0
-Coffee (12.9) (6.0)-Cotton (53.8) (3.0)-Tea (108.8) (8.0)-Tobacco (39.2) (4.0)-Other exports (10.3) (10.0)
Merchandise imports 12.7 5.7
Increase in prices (% p.a.)Domestic 11.6 8.0International 7.6 6.0Merchandise exports 7.0 7.3Merchandise imports 7.1 6.0Terms of trade -0.1 1.2
1983-85 1986-90
Import elasticities (%)Food imports (w.r.t. GDP) - -Other consumer imports (w.r.t. GDP) 0.7 0.6Petroleum imports (w.r.t. GDP) 0.8 0.7Intermediate imports (w.r.t. monetary
agriculture and industry) 0.8 0.7Capital imports (w.r.t. investment) 1.0 0.8Government imports n.e.i (w.r.t. GDP) 0.5 0.5
/a Based on gross investment rate of 3% in 1982-85, rising to 5%by 1989. As these projections are based on the 1978 exchangerate, the effective investment rate is probably understated(see footnote 7, Chapter 2).
Source: World Bank estimates

- 38 -
Table 3.2: BALANE CF PAYMENTS MROJECTIONS - BASE CASE
(US$ million at current prices)
1981(estimates) 1982 1983 1984 1985 1990
Foreign exchange requirements 671 853 915 1,005 1,076 1,913
Merch. imports c.i.f. 400 541 624 718 825 1,488Invisibles (net) /a 70 109 132 174 188 327Principal repayments Ia 110 /b 135 91 40 43 70Arrears repayments 91 40 50 50 - -Increase in net reserves - 28 18 23 20 28
Foreign exchange financing 671 /e 853 915 1,005 1,076 1,913
Merch. exports f.o.b. 220 314 373 418 480 913Official grant receipts /c 110 126 137 144 140 157Gross loan disbursements 7c 120 172 118 106 138 241Use of IF credit (net) 125 112 117 63 12 -8Financing gap - 129 170 274 306 610
Memo items:
Debt service ratio (%) /d-including E4F credit 50 50 38 36 42 35-excluding DF credit 50 46 27 17 15 18
Financing gap/merch. imports (%) - 24 27 38 37 41Current account deficit/GDP (%) 3 5 5 5 5 5
/a Includes debt service on financing gap, assuming DAC terms: 2.7% interest, 32 yearsmaturity including 9 years grace.
/b Includes principal arrears accumulated.
/c Assunirg a continuation of present commitment levels (in real terms) and disbursementpatterns.
/d Debt service as a percentage of exports of goods and services. The first line includescharges anI repurchases related to use of IMF credit in debt service.
/e Includes [B$96 million of miscellaneous capital inflous and "errors and missions."
Source: World Bark estimates

- 39 -
Table 3.3: ALTERNATIVE PROJECTIOIB /a
Average gap Debt service ratio /c([B$ million p.a.) (%)1982-85 1986-90 1982 1985 1990
a. Base case: 220 488 50 42 35
b. Real growth in merchandiseexports reduced to 4% p.a.: 337 794 61 64 63
c. Real growth in merchandiseexports reduced to 4% p.a.and no new DF drawings: 426 762 61 48 37
d. Gap filled on non-concessionalterms: /b 244 820 50 53 9
e. Real growth in merchandiseexports increased to 20%p.a. through 1985 and 10%p.a. thereafter: 190 207 53 35 22
f. Investment rate stays at
3% through 1990: 220 400 50 42 34
Ia Alternatives show impact of specified change, with all other assumptionsremaining as in base case.
/b 11.6% interest, 9 years maturity including 4 years grace period.
Ic Including charges and repurchases relating to use of IMF credit in debtservice.
Source: World Bark estimates

- 40 -
balance of payments. 5 The impact of alternative assumptions on the for-eign exchange gap and debt service ratio is shown in Table 3.3.
3.25 The projections assume a sharp recovery in levels of economicactivity, with GDP rising by 6.8% per annum from 1981 to 1985. The mostrapid increases are in monetary agriculture (export crops) and industry,the two sectors which have suffered the most over the past decade, butwhich offer the best prospects for a quick revival. Although the projectedgrowth rate represents a major departure from past trends, it is considereda realistic option, given the recent policy measures taken by the Govern-ment and assuming continued progress on the economic management and insti-tutional issues discussed in Section B. As illustrated below, the via-bility of this scenario will also depend critically on the availability offoreign exchange, for both recurrent imports and priority rehabilitationprojects. Overall, however, the investment rate is assumed to remainaround its present level, estimated to be only 3% of GDP, through 1985.This, of course, implies an exceptionally low incremental capital-outputratio (ICOR), a reflection of the opportunities under present Ugandan con-ditions to increase effective capacity with relatively small investments inrehabilitation, and to improve overall capacity utilization throughincreased recurrent imports and other measures. It is difficult to beprecise about how long Uganda can maintain a low investment rate withoutimpacting significantly on GDP growth. The base case projections assumethe investment rate is steadily increased after 1985, although as discussedbelow, this will put additional pressure on the balance of payments. It ispossible that the projected GDP growth rates through 1990 could be main-tained with lower levels of investment. But eventually, it is inevitablethat the investment rate will have to be raised to provide for continuedgrowth over the longer term.
3.26 Foreign exchange requirements. The major claim on Uganda's for-eign exchange is for merchandise imports. Given the severe import re-straint imposed over the past four years, and particularly in 1981, as wellas the backlog of rehabilitation requirements, there is little doubt that asubstantial increase in import levels is a basic prerequisite for economicrecovery in Uganda. Back in 1979, the Commonwealth team estimated importrequirements to be US$660 million for the first six months and US$1,000million for the first full year of rehabilitation. With subsequent delaysand price increases, the requirements are no doubt substantially highernow. On the other hand, while it is easy to justify such large importrequirements in terms of the potential performance of the economy, it seemslss likely that this magnitude of imports could be usefully absorbed underpresent economic and administrative conditions. As already reviewed, thereremain many other constraints on the implementation of the rehabilitationprogram -- including weaknesses in public administration and finance, para-statal organization, and pricing policy -- which, until addressed, willlimit the effectiveness of additional imports. These conditions, togetherwith the inevitable constraints on foreign exchange availability,
5/ The projections have been prepared using the World Bank's RevisedMinimum Standard Model. As the foreign exchange constraint isbinding, ex-post consistency is achieved by an arbitrary "statis-tical" reduction in the level of domestic savings.

- 41 -
underscore the importance of strengthening the country's foreign exchangemanagement system, to ensure that only priority items, for priority pur-
poses, are imported.
3.27 With these qualifications in mind, the projections assume a 35%increase in import volumes during 1982, with above-average increases forinputs, spare parts, and basic consumer goods (other than food). The pro-jected import volume for 1982 is marginally above the restrained level ')f
1980, but still less than one-half of the peak level achieved in 1971. Incurrent prices, the 1982 import bill is US$540 million, only slightly high-er than the Government's six-month "emergency" list of import requirementsprepared in October 1981. In subsequent years, the import bill is projec-
ted using the assumptions on GDP and investment growth,elasticities andprices as shown in Table 3.1. Under Ugandan conditions, where both levels
of economic activity and imports have been falling in recent years, it isdifficult to calculate likely import elasticities for the future. However,there is substantial scope for steadily re-establishing domestic supplysources, and consequently reducing the import content of production. This
is reflected in the import elasticities, which are generally less than one,and lower after 1985. Even so, total import volumes are still projected to
rise sharply during both periods shown in Table 3.1. This reflects thelarge once-and-for-all adjustment in import levels assumed for 1982, andthe sharp increase in investment (and related capital good imports) after1985.
3.28 Apart from merchandise imports, the other major claim on foreignexchange is debt service, especially principal repayments. Unfortunately,
Uganda's external debt position was not well monitored or controlled during
the 1970s; and consequently, it is difficult to get a clear picture of thepresent situation. The World Bank's estimates, based on data from theUganda Treasury and Bank of Uganda, show total external public debt out-standing of US$950 million at the end of 1981, of which US$650 million wasdisbursed. (These estimates include Uganda's share of East African Commu-
nity debt and principal arrears, but exclude use of IMF credit and short-term obligations of less than one year.) Three features of the debt struc-ture are worth noting. Firstly, a large share of the debt outstanding anddisbursed is from private sources or related to commitments made by Tan-zania and Zambia at the time of the 1978-79 war. Official developmentloans account for less than two-thirds of the outstanding obligations.Secondly, the debt outstanding figures include an estimated US$84 million
of principal arrears, most of which were accumulated over the past threeyears. These, together with the payment arrears on short-term debt andimports, will eventually have to be repaid, adding a substantial burden onUganda's already fragile balance of payments. 6 Finally, even excludingarrears, about 40% of the debt outstanding and disbursed at the end of 1981is scheduled to be repaid over the next two years, reflecting the increasein non-concessional borrowing since the mid 1970s. At the Paris Club meet-ing held in November 1981, it was agreed that the participants' obligations
6/ Payment arrears are estimated to total US$144 million at the endof 1981. The projections assume that these are all repaid by the
end of 1984.

-42-
falling due in 1981/82 would be rescheduled. 7 However, as such a largeshare of the debt is held by non-participants, this covered only aboutUS$12 million, compared to total principal repayments due of US$110 millionin 1981 and US$135 million in 1982.
3.29 On a net basis, the invisibles account is also expected to remain
a net drain on foreign exchange during the 1980s. Although some recoveryin tourism will eventually be possible, this is unlikely to provide a sub-stantial net contribution to foreign exchange until the supporting infra-structure -- hotels, lodges, roads, and vehicles -- has been fully rehabil-itated. Taking into account other outflows for freight and interest pay-ments, the invisibles deficit is expected to rise from about US$70 millionin 1981 to more than US$300 million by 1990. Uganda will also have to makesome provision for the buildup of external reserves, although, given thelarge import requirements and financing constraints, it will not be pos-sible to provide adequate import coverage for the foreseeable future.Overall, the total financing requirement -- for merchandise imports, repay-ment of principal and arrears, the invisibles deficit and accumulation ofreserves -- is projected to rise from US$0.85 billion in 1982 to US$1.1billion by 1985 and US$1.9 billion by 1990.
3.30 Foreign exchange financing. The growth of merchandise exports,Uganda's major source of foreign exchange, will continue to be determinedlargely by developments in agriculture and the supporting infrastructure.With a rehabilitation program as outlined in Chapter 4 -- emphasizing pro-ducer incentives, relief of processing and transport bottlenecks, and im-provements in marketing -- exports of Uganda's major crops can be expected
to grow substantially over the next five years. Because of its initialdominance, coffee will continue to be the key to success for a number ofyears to come. Uganda's coffee quota for 1981/82 has been increased by 30%
to 2.6 million bags (156,000 tons), 8 and is unlikely to act as a con-straint on export volumes during this period. However, subsequently, fur-
ther quota increases 9 will be required if our volume projection for 1985(190,000 tons) is to be realized. While this represents an increase ofmore than 60% over the 1981 base, it is still below the peak level (214,000tons) reached in 1972 and is well within Uganda's productive potential.Similarly, while export volumes of cotton, tea, and tobacco are all pro-jected to rise substantially during the rehabilitation period, they are not
expected to regain their previous peak levels by 1985.
7/ Ninety percent will be repayable in 10 years, including 5 yearsgrace, and 10% will be repayable over the next 4 years. Theparticipants at the Paris Club meeting also agreed to rescheduleabout US$15 million of debt arrears.
8/ Uganda is also permitted to export another 18,000 tons in1981/82, from the shortfall declared in 1980/81.
9/ Alternatively, Uganda could sell the surplus coffee in non-quotamarkets, but this would result in substantially reduced unitvalues and would lower export earnings below projected levels.

- 43 -
3.31 Other merchandise exports -- which potentially include maize,groundnuts, animal feed, hides and skins, copper, cobalt, and cotton tex-tiles -- have virtually ceased. The initial recovery of some of theseitems will necessarily be limited by the need to focus scarce resources onthe major export crops, and also the competing demands of the domestic mar-ket (which, of course could still benefit the balance of payments throughimport substitution).10 However, many of these items have been exportedin the past and medium-term prospects for market penetration, especially inneighboring countries, would appear to be good. The rehabilitation programfor agriculture will also benefit the minor export crops, as well as en-courage increased output of manufactured exports through improved supply ofraw materials and relief of transport bottlenecks. Provided an appropriateexchange rate policy is maintained, there is little need for additionalexport incentives at this stage. Nevertheless, the institutional supportfor exports -- to provide market information, credit and insurance -- willeventually have to be rebuilt if a major export drive is to be successful.
3.32 Although the projections are based on a relatively optimisticview of export prospects (certainly compared to past performance), andassume no major change in the terms of trade, the resultant export earningsare clearly inadequate, and increasingly so, to meet the country's foreignexchange requirements. The additional foreign exchange required from capi-tal inflows averages US$560 million per annum over the next three years,rising to US$1 billion by 1990. On the basis of past experience, normaldisbursements from official grants and public loans could provide aboutUS$270 million per annum over the next three years;11 a further US$ 100million per annum (net) could possibly be drawn from the IMF, assumingUganda becomes eligible to make purchases from higher-level facilities.12However, this still leaves an average gap of US$190 million per annum overthe next three years to be financed by additional new resources. Subsequ-ently, the gap rises quite sharply, although as shown in Table 3.3, this isdue largely to the assumed increase in the investment rate, and associatedimport requirements. Given the eventual improvement in the debt serviceratio after 1985, and the wider options for improving both export perform-ance and import substitution over the longer term, the real crisis periodfor Uganda's balance of payments is the next three years. Unless this canbe successfully resolved, without undue cuts in import levels or accumula-tion of debt obligations, there will be no basis for establishing a moremanageable balance of payments situation in later years.
10/ This also applies to cotton, where present production is inade-quate to keep local textile mills running at full, capacity. Butit is reasonable to assume that, given the present foreign ex-change constraint, a significant share of production (either inthe form of raw cotton or cotton textiles) will continue to beexported, and that exports will, therefore, rise with cotton out-put.
11/ These projections basically assume a continuation of commitmentsat present levels in real terms, with disbursements and debt ser-vice calculated using disaggregated assumptions on disbursementpatterns and terms.
12/ In subsequent years, even assuming continued new drawings ofUS$100 million per annum, the net use of IMF credit falls closeto zero, due to the burden of accumulated repurchase obligations.

-44 -
3.33 Faced with this prospect of a severe and prolonged balance of
payments problem, the Government has asked the World Bank to organize aConsultative Group meeting for May 1982. This will be an important oppor-tunity for Uganda to put recent developments (especially those since thelast Consultative Group meeting in November 1979) into perspective, to out-line its new economic recovery program, and to seek appropriate levels andtypes of external assistance. Although the present aid climate is not con-
ducive to substantial global increases in aid flows, Uganda's case needs tobe considered in relation to the recent progress made in domestic policyreform, the scope for high economic pay-offs to additional disbursements offoreign exchange under present conditions in Uganda, and the very meagerinternational support provided to date. Possible new sources of assistance(including from OPEC countries) also need to be tapped. Given Uganda'scritical foreign exchange situation, it is important that this assistancebe provided on concessional terms, with a high proportion of balance ofpayments support. Balance of payments support not only disburses fasterthan project aid, but also provides the Government with flexibility to meetmore immediate and urgent recurrent import requirements. As indicated inthe above projections, the scope for investment in new capacity will remain
extremely limited for at least the next three years, and possibly muchlonger. Therefore, where project aid is provided, it needs to be directedtowards priority rehabilitation tasks, as identified in paragraph 3.13,taking into account (and if possible financing) the related recurrent im-port requirements.
3.34 Insofar as the additional commitments of concessional aid are in-adequate to cover the financing gap, Uganda may have to resort to otherbridging arrangements. Clearly, these are going to be difficult to arrangeon reasonable terms and it should be ensured that the resulting debt burdenis manageable. As shown in Table 3.3, fully financing the gap on non-con-cessional terms leads to unsustainable financing requirements and debtservice ratios in later years. Yet, given the immediate problem posed bythe bunching of principal repayments, some short-term, non-concessionalborrowing may be unavoidable. Perhaps the best option in this regard wouldbe suppliers credits, which, with increased competition for Uganda's ex-panding market, could provide more reasonable terms than other alterna-tives. However, careful scrutiny of price quotations would be required toavoid the hidden costs of overcharging.
3.35 If the additional financing to fill the gap in the balance ofpayments is not forthcoming, the impact on the economy would be drastic:with only normal aid inflows (and IMF purchases) the growth rate of GDPwould have to be reduced to levels that would allow no significant recoveryin per capita terms. In relation to what has been achieved in the past,and indeed what can be expected in many Sub-Saharan African countries dur-ing this decade, this might not seem unreasonable. But, in Uganda, it isprecisely because past performance has been so bad that a more substantiverecovery is required. Without this, the prospects for restoring a degreeof normalcy and stability to the economy would be bleak.
3.36 At the same time, the impo?tance of external financing should notdistract from the more basic domestic requirements of economic recovery.

- 45 -
Continued progress on improving the security situation, as well as thereform of policies and institutions, will be vital, both for their directcontribution to economic performance and to justify higher levels of inter-national support. In this respect, success in reviving the export sectorwill be of critical importance to the overall viability of any rehabilta-tion program. As shown in Table 3.3, with the growth of export volumesreduced to 4% per annum (not an unreasonable assumption on the basis ofpast performance), the financing gap soon becomes unmanageable.

- 46 -

-47-
PART II
SECTORAL REVIEWS

- 48 -

- 49 -
Chapter 4
AGRICULTURE1
A. Introduction
4.1 Agriculture dominates the Ugandan economy, providing livelihoodto 90% of the population and supplying almost all of Uganda's exports inrecent years. Ugandan agriculture is largely dependent on small- tomedium-scale peasant farms; no attempt was ever made to encourage expatri-ate settlements, and even today, large-scale estates are only significantfor the tea and sugar subsectors. With about two-thirds of the land areaavailable for agricultural use, large areas of fertile soils, an equitableclimate, and adequate rainfall over most of the country, Uganda has astrong base for agricultural development. Overall population density islow, and although there are pockets of population pressure, these oftenreflect the productivity of the area. In the "fertile crescent" aroundLake Victoria, for example, the combination of fertile soils and appro-priate farming systems can support almost continuous cultivation. On theother hand, there are areas in the north and east, where, despite lowerpopulation density, soils are in danger of being degraded.
4.2 Given the favorable natural conditions, Uganda has been able toproduce a food surplus (in terms of calories and proteins) in most years.The staple food crops are bananas in the south and west, and finger millet,maize, cassava and sweet potatoes in the north and east. The capacity toproduce a food surplus has helped free family labor to grow export crops.Export production was made possible by the opening of the railway to thecoast in the early 1920s, and was supported by a strong law and order sys-tem which encouraged private entrepreneurs and traders to enter ruralareas. Cotton production, which expanded rapidly during the 1920s and193 0s, initially dominated Uganda's exports. However, robusta coffee,which is indigenous to Uganda, became increasingly important during the19 50s (in response to favorable prices) and had become Uganda's majorexport earner by 1962. Successful efforts were also made to promote small-holder tea and tobacco production during the 1960s, although they neverrivalled cotton and coffee in terms of export earnings.
4.3 As shown in Table 4.1, the performance of the agricultural sec-tor deteriorated dramatically during the 19 7 0s. Production of exportcrops was hit the worst, reflecting increasingly unremunerative prices andthe general deterioration in capital assets and infrastructure (processing,transport, and marketing). With increased smuggling as well, officialexports fell even more sharply: coffee exports were down by more than 50%,while exports of other crops virtually ceased altogether. As the monetaryeconomy broke down, increased emphasis was placed on subsistence produc-tion: for survival, and to supply the thriving and lucrative "magendo"markets. However, even food production is reported to have declined during1979 and 1980, due to the impact of the war and subsequent security
1/ This chapter focuses primarily on crop cultivation. Brief dis-cussions of the livestock and fisheries subsectors are given inthe attached annex.

- 5o -
Table 4.1: CROP PRODUCTION /a
('000 tons)
Peak Year 1980 Ratio of 1980/
Year Amount Amount Peak Production
(%)
Export Crops
Coffee (robusta) 1969 232.5 130.4 56.1
Coffee (arabica) 1972 20.8 4.8 23.1
Cotton (lint) 1970 86.4 13.3 15.4
Tobacco 1972 5.0 3.0 60.0
Tea 1973 23.1 1.5 6.5
Sugar (raw) 1968 152.0 15.0 9.9
Food Crops
Bananas 1975 9,107.0 5,699.0 62.6
Cassava 1977 2,993.0 2,072.0 69.2
Maize 1976 674.0 286.0 42.4
Sorghum 1975 467.0 299.0 64.0.
Beans 1976 337.0 186.0 55.2
Groundnuts 1969 265.0 65.0 24.5
Finger millets 1966 1,136.0 459.0 40.4
Sweet Potatoes 1976 2,002.0 1,200.0 59.9
/a Note that the figures for food crops are estimates
of total production, while the figures for export
crops are of official purchases only. With substantial
and increasing "magendo" sales during the 1970s, thefall in production of export crops is ,harefore over-stated.
Source: SA Table 7.1
- 51 -
problems, as well as two successive droughts in the annual crop zone.Regional food shortages, especially in Karamoja, were made even more severeby failures in the internal distribution system. Although overallproduction 'seems to have recovered in 1981, food shortages are stillreported in isolated areas.
4.4 Differences in cropping patterns tended to accentuate income dif-ferentials during the 1 97 0s. In the south and east, for example, farmerswere able to grow either coffee, which could be smuggled profitably acrossany of four international borders, or bananas, which fetched high free mar-ket prices. However, in the generally less productive and poorer annualcrop zone, the main cash crop (cotton) ceased to be a source of income formany families, and there was no other high-value crop which could be easilyused for smuggling. In any event, the closest international borders (Nor-thern Kenya and Southern Sudan) were much less attractive in terms ofreadily available consumer goods, while distance prevented large-scaleaccess to the lucrative food trade with Kampala. As a result, livingstandards in the annual crop zone tended to decline, and many familiesreverted to subsistence.
4.5 Rehabilitation of the agricultural sector has the highest pri-ority for economic recovery in Uganda. As discussed in Section C of thischapter, one of the key components of an agricultural rehabilitation pro-gram is producer pricing: a policy variable which is immediately action-able, which provides producers with a clear signal of the Government's com-mitment to agricultural development, and which can also have an immediateimpact on supplies through reducing smuggling. The Government has indi-cated its willingness to take action in this area, through the recentintroduction of substantially higher producer prices for export crops.However, further progress is required, on both the level of producer pricesand the general system for price review and adjustment. Other supportingmeasures also are required if the incentive provided by higher producerprices is to be effective. In the first place, the farmer will have tohave confidence that he will receive prompt and full payment for his crop.The sector will also have to have access to: (a) adequate supplies ofinputs and implements, spares for processing and transport, and consumergoods to encourage farmers to generate surplus cash incomes; and (b) moreefficient marketing channels. Over the longer term, greater attention willhave to be given to developing an appropriate structure for providing abroader range of services to the farmer, including research, extension andcredit. But, as shown by past experience, these are largely institutionalissues, which will inevitably take time to be addressed, and which are un-likely to be very successful without first improving farmers' incentives.Hence the initial emphasis given to pricing, supplies and marketing in theproposed rehabilitation program.
B. Present Conditions and Problems
4.6 Food crops. Food crop producing areas in Uganda can be dividedinto two broad zones based on the duration and intensity of the dry sea-son. In the center, south and west of the country, the dry seasons are ofsuch low intensity that bananas grow well and as a result, this perennialcrop provides the staple food of the population. To the north and east(apart from the slopes of Mt. Elgon), where the dry season is more severe,annual crops predominate.

- 52 -
4.7 As already noted, although food shortages did develop in 1979
and 1980 (due to the impact of the war, subsequent security problems and
two succesive droughts), Uganda traditionally produces a food surplus. The
sustained increase in food production throughout the 19 7 0s was in responseto farmers' concern to provide subsistence requirements during a period of
insecurity, as well as the relatively favorable price trends for food as a
cash crop over this period (see paragraph 4.33). The bulk of the produc-
tion increase was contributed by maize, cassava, and sweet potatoes. Maize
appears to have become an alternative cash crop in traditional cotton grow-
ing areas, while cassava and sweet potatoes are both low-risk crops, which
are less dependent on the availability of tools and inputs than intensive
millet and sorghum production. Production of finger millet, which had
traditionally been the staple food in the annual crop zone, fell throughout
the 1970s. While there is no record of any striking increases in groundnut
and simsim production, and indeed, official sales have fallen to low
levels, there is evidence that these crops became extensively used for
cross-border deals in exchange for consumer goods.
4.8 With surplus food production in most years, and no major urban or
export market outlets, there has been little stimulus in the past to pro-
vide yield-increasing innovations. However, this situation can be expected
to change as population and markets expand, requiring greater emphasis on
developing and adapting appropriate farming techniques.
4.9 In the perennial crop zone, the combination of good soils and
climate has fostered the development of a productive banana farming sys-
tem. A well-established and cared-for banana garden will provide the farm-
ing family with their basic starch requirements for a lifetime, with no
need for annual cultivation or rotation. The important elements of good
husbandry are known, and if these are followed, there are few problems with
pests or diseases. Even so, there are two problems which need to be ad-
dressed. Firstly, the main banana growing area of Buganda had tradition-
ally relied on cheap labor from Rwanda and Kigezi to maintain the gardens.
With falling real wages, and (until recently) an increasingly over-valued
exchange rate, this labor pool dried up and husbandry standards fell, re-
sulting in a significant rise in the incidence of banana weavils and nema-todes. Research is, therefore, required on less labor-intensive methods of
banana garden management. Secondly, nutritional problems, particularly
among young children, have been a persistent feature of these areas. There
is, therefore, a need to encourage the production of protein-rich supple-
mentary foods such as pulses.
4.10 In the annual crop zone, finger millet was until recently the
major staple food crop, but this is now being replaced by maize, cassava
and sweet potatoes. This shift is likely to result in increased production
of calories per unit of labor and land, but will be accompanied by a fall
in the quality of the diet. As a result, the annual cropping areas, which
have been largely free of malnutrition problems in the past, will require
increased attention to improve the range and quality of supplementary pro-
tein foods available to the family. One possible reason for the shift from
grains to cassava in some areas is a declining pattern of soil fertility,resulting from the continued use of farming systems which have become inap-
propriate with rising population pressure. Although this is a compara-tively recent problem, and still not widespread, it will need to be ad-
dressed in future research efforts.
- 53 -
4.11 Traditionally, food production in Uganda has been primarily forsubsistence and local market sales. Even by 1980, there were only threeurban centers with a population of more than 30,000 and the overwhelmingmaje'rity of people had access to personal plots. There was, therefore, nosignificant interregional trade in food crops and, although food productionwas in surplus for most years, little attempt was made to develop exportmarkets. However, the situation has changed in recent years. Domesticshortages of consumer goods have helped foster a thriving informal trade infood exports to Kenya (maize, groundnuts, sorghum, and millet) and Rwanda(fieldpeas and Irish potatoes). With these supply leakages through smug-gling, and as increasing numbers of people left farming for more lucrativeoccupations of smuggling and petty trading, domestic food prices rosesharply. Faced with widening differentials between official and open mar-ket food prices, the Government abandoned officially-regulated producerprices for food in 1977,2 and the Produce Marketing Board, which had pre-viously had an official monopoly on food purchases, was forced to competewith private traders on the open market. PMB did, however, continue toregulate interregional trade in food, and until early 1982 (when therestrictions were relaxed), the issuance of trading permits remained tight-ly controlled. This, together with the impact of transport bottlenecks,hindered the movement of food to deficit areas.
4.12 Robusta coffee. Robusta coffee is indigenous to Uganda and wascultivated by the Baganda before the arrival of the Arabs or Europeans.93% of the robusta coffee crop is grown in the "fertile crescent" to thewest and north of Lake Victoria, with the rest in scattered areas of West-ern Uganda. Acreage and production of robusta coffee expanded rapidly dur-ing the 19 5 0s, in response to higher producer prices, and by 1962 wasUganda's major export earner. Although that is still the case, officiallymarketed production is now only slightly more than half the peak level of233,000 tons reached in 1969. While smuggling may have accounted for an-other 20,000 to 50,000 tons per annum in recent years, it remains true thatoverall production has fallen during the 1970s.
4.13 Most robusta coffee is grown in mixed stands with bananas onscattered single-family holdings. Although, as discussed below, the majorreasons for the decline in production relate to pricing and marketing poli-cies, other constraints have also been important. These include:
(a) A shortage of labor. un the smaller holdings, this has resultedin an increased work load for the family, but on larger coffeegardens it has led to lower standards of husbandry (especiallyweeding and pruning) and on some pure coffee farms, partial aban-donment of the crop.
(b) Shortages of herbicides and hand pumps. These are generallyunavailable due to the foreign exchange constraint, but couldotherwise provide an effective alternative to hand-weeding.Without adequate weeding and pruning, use of other yield-improv-ing inputs, such as fertilizer, is unlikely to be economic.
(c) A lack of hand tools (hoes, forks, pruning saws) with which tocarry out basic field work.
2/ Minimum producer prices were still set, however, and initially,PMB was only permitted to buy at these prices. More recently,PMB has been making purchases at market prices as well.
- 54 -
(d) A lack of improved planting materials to replace abandonedcoffee.
(e) The poor morale and mobility of extension staff to provide in-struction on herbicide use, pruning and control of pests and dis-ease.
4.14 All robusta coffee in Uganda is now processed as dry cherry(known locally as "kiboko"). 3 To produce good quality kiboko, the cher-ries should be harvested when ripe and dried in shallow layers on trays andmats. However, as no premium is offered to farmers for good qualitykiboko, harvesting is accelerated by stripping branches of all fruit,whether ripe or not, and drying is done on the ground (which gives rise toa mouldy sample of dry cherry). As a result, the kiboko received by thehulleries is often of poor quality. Since 1974, private hulleries havebeen allowed to handle robusta coffee, breaking the ealier monopoly of thecooperatives. However, the condition of many of these processing units hasdeteriorated in recent years, and they are now the major constraint onincreasing coffee exports. Fortunately, plans are underway to rehabilitatea number of coffee processing units under assistance from the EEC and ADF.Transport bottlenecks, both from the farm to the hullery and then to Kam-pala, have also been relieved somewhat following the allocation during1981 of more than 200 newly imported trucks to upcountry cooperatives andfactories.
4.15 After processing, all coffee should officially be marketedthrough the Coffee Marketing Board (CMB). Although the hulleries are res-ponsible for delivering clean coffee to CMB's Central Processing and Stor-age Units at Kampala, the CMB provides a refund towards transport costs.Most of the export contracts are concluded in Kampala on an f.o.b. Mombasaor Tanga basis. However, with the recent transit problems in Kenya, somesales (at a discount) have been made on an f.o.b. Kampala basis, or evenair-freighted from Entebbe, with the buyer responsible for all transportcosts and risks. Transport movements to Mombasa have improved in recentmonths, with five trains a week now available. The main concerns are: (a)that the more cost-efficient method, the railway, is used to its fullpotential; and (b) that the Kampala coffee factory can handle all of theincoming coffee in an efficient manner. With recently-arrived importedparts to improve coffee grading and sorting, as well as use of prison laborto relieve warehousing and loading bottlenecks, it is hoped that this willbe possible.
4.16 In the past, producer prices for coffee have been recommended bya Pricing Committee, comprising officials from CMB, the Ministry of Agri-culture, the Ministry of Finance, and the Ministry of Cooperatives and Mar-keting. After Cabinet approval, the Minister of Cooperatives and Marketingannounces the new price. Until recently, an adequate return to farmers andthe hulleries had not been produced by this process, with the bulk of cof-fee earnings being siphoned off by CMB and the Government. As shown inTable 4.2, the farmers and hullers together have historically received lessthan 50% of the export earnings, falling below 30% in the boom years of
3/ Some wet processed pulped robusta was produced privately duringthe 1960s, but this is uneconomic at present price differentials.

- 55 -
1975/76 and 1976/77. By the late 1970s, producer prices for robusta coffeewere inadequate to cover costs, and uncompetitive with the high market
prices for the alternative crop, bananas. The impact was severe: pro-duction fell as some large farms were abandoned and husbandry standardsdeclined, and smuggling increased. Similarly, with low hullery margins,the stores and machinery of most hulleries have not been adequately main-tained or expanded. Although pricing adjustments are now being made (asshown in Table 4.2 and discussed later), it will take time for the negative
impacts from a decade of neglect to be reversed.
Table 4.2: ALLOCATION OF ROBUSTA COFFEE EARNINGS
(%)
/aFarmer Huller CMB Govt. Total
1972/73 39 10 11 40 1001973/74 27 7 8 58 1001974/75 32 8 10 50 1001975/76 19 5 7 69 1001976/77 15 4 6 75 1001977/78 28 6 6 60 1001978/79 31 6 20 43 1001979/80 52 9 13 26 1001980/81 46 7 15 32 1001981/82 (projected) 50 13 17 20 100
/a Includes export tax and contributions to price stabilization
fund, which were generally used to finance general government
expenditure.
Source: CMB
4.17 Arabica coffee. Arabica coffee is of secondary importance inUganda, grown primarily by some 140,000 farmers on the slopes of Mt.Elgon. As compared to robusta coffee, arabica is grown on substantiallysmaller plots, with more pure stands (rather than mixed with bananas).Officially marketed production fell from 21,000 tons in 1972 to less than5,000 tons in 1980, but this probably reflects the incidence of smugglingover the nearby Kenya border rather than any significant decline in pro-duction. The closeness of the Kenya border has also helped the arabicafarmers overcome domestic shortages of basic tools, and with smaller lots,labor shortages have not been as important as in the robusta areas. Themain production problems have been: (a) shortages of essential fungicides,insecticides, and pumps, to help control the growing occurrence of coffeerust, coffee berry disease, and insect damage; and (b) inadequate producerprices. The Bugisu Cooperative Union processes the coffee and, prior to1969, had also been responsible for marketing. Marketing is now done byCMB, although the coffee is still exported directly from the Mbale factory,without further processing or sorting at Kampala. Both the factory (with apresent capacity of only 6,000 tons of clean coffee) and stores at Mbaleare now urgently in need of repair and expansion to handle the increase inofficial sales expected to follow the higher producer prices announced in

- 56 -
1981. Collections, which had fallen as low as 600 tons in 1976/77, recov-ered to 3,000 tons in 1980/81, and at present production levels, could riseto 10,000 tons in 1981/82.
4.18 Cotton. Cotton was introduced into Uganda as a commercial cropin 1904. -- Production expanded rapidly through the 1920s and 1930s, peakedat around 86,000 tons in 1970, and has declined ever since. The growing
areas were initially centered around Buganda and the east, but with thesubsequent revival of coffee in Buganda and new plantings of cotton in thenorth, the majority of production now comes from the north and east. These
areas have a climate which is in some respects less favorable than in othercotton-growing areas of the world: temperatures are lower throughout thelife of the crop, solar radiation is less, the incidence of cloudiness isgreater, daylight hours are shorter, and rainfall during the growing seasonis less concentrated. As a result, cotton has often developed by default,in the absence of a readily available alternative.
4.19 Cotton is predominantly grown in the annual crop zones and takesits place in a rotation with finger millet and groundnuts. In the east,
especially in Teso District, land preparation is carried out with ox-drawnploughs, but all subsequent work is done by hand, as is primary cultivationas well in the other cotton growing areas. The main labor bottlenecks arefor weeding and picking, and experiments with tractor ploughing followed byhand operations have not led to increased areas under cultivation per fam-ily. The most urgent technical need of the farming system is developmentof an efficient ox-drawn seeder which could be used for both finger milletand cotton, and of ox-drawn implements for weeding. Little attention hasto date been given to these matters. Instead, most of the research andextension efforts have been concentrated on three issues: earlier plant-ing, closer spacing, and more recently, increased use of spraying. How-ever, these recommendations failed to take adequate account of competingdemands for farm labor, as well as of prevailing climatic conditions. Theyconsequently provided no significant increase in gross yields (and probablya fall in yields per labor input), and were rejected by most farmers.Early research efforts on cotton breeding did help improve quality and dis-ease resistance, which in turn probably made Ugandan cotton more competi-tive on the international markets and helped extend acreage to otherwisemarginal areas. But the record in terms of increasing yields and farmerprofitability was less clear, and certainly today, few tangible benefitsfrom the long history of cotton research in Uganda remain.
4.20 Since 1969, the collection and ginning of cotton has 'een thesole responsibility of cooperatives. Accordingly, growers are required to
sell their seed cotton to a cooperative society which in turn sells it to acooperative union for ginning. With the decline in output, as well as poormaintenance, the number of ginneries functioning fell from 54 in 1970 to 28in 1981. Ginning throughput has been further restrained by transport prob-lems (a lack of vehicles and poor road conditions) and a shortage of spareparts and baling materials. As a result, the output of lint has fallenfrom more than 400,000 bales in the early 1970s to 25,000 bales in 1980/81;and there remains a backlog of cotton from the past four seasons, equiva-lent to 17,000 bales of lint, still to be processed (and for which thefarmer is still to be paid). With an injection of foreign exchange, the

- 57 -
ginning capacity of the country could be quickly rebuilt and need not
remain a constraint on cotton development. However, a more difficult prob-
lem is the poor financial condition of the cooperative unions, which face
large overheads in relation to ginning throughput, and have accumulated a
heavy burden of outstanding debts. As a result, payment of producer prices
to farmers in some areas is more than a year in arrears.
4.21 The final sale of both lint and cotton seed is the responsibility
of the Lint Marketing Board (LMB). In the early 1970s, more than 80% ofthe lint produced was exported, but with falling production and quality,
this percentage is now below 50%. To date, the structure of LMB has not
been adjusted -- in size or orientation -- in line with the current reali-
ties of the cotton industry. One consequence of this has been that LMB's
overheads and operating expenses, per bale of lint sold, rose from U.Sh. 36
in 1970 to U.Sh. 620 in 1979, and have no doubt risen even further over thelast two years. Until the 1981 devaluation (which substantially increased
the shilling revenue generated by cotton exports), these high costs hadbeen a major factor in restricting the producer price paid to the farmer,
and consequently, in reducing cotton output.
4.22 Tea. Although tea was introduced to Uganda in 1900, there wasinitially little interest in it as a commercial crop. By Independence,
there were only 8,000 hectares of established plantations, all owned bynon-Africans. However, smallholder tea development was started in the
early 1960s, and became the responsibility of the Uganda Tea Growers Cor-
poration (UTGC) in 1966. All expatriate-owned estates were expropriated by
the Government in 1972 and handed over to parastatals or individuals. In1978, the latest year for which area figures are available, there were
9,416 hectares of smallholder tea and 11,489 hectares of estate tea in
Uganda. The estate sector j.s presently divided between parastatal estates(belonging to Agricultural Enterprises), company estates (which have been
returned to their former owners by the present Government), and a few small
African-owned estates.
4.23 After a period of rapid expansion in the 1960s, tea production
peaked at 23,000 tons in 1972, and then rapidly declined to less than 3,000tons per annum in recent years. Tea was originally planted in Buganda, but
the expansion during the 1960s was largely in the west (particularly inToro and Ankole), where the combination of soils, rainfall and temperatureprovides excellent growing conditions for tea. In the early 1970s -- as a
result of these good growing conditions, and use of appropriate techniquesand management -- some plantations in Toro were achieving among the highest
yields in the world, while realizing prices only marginally below thosepaid for quality Kenyan teas. Yields for smallholder tea also rose to high
levels, supported by inputs provided through UTGC.
4.24 Since the mid 1970s, the capacity of UTGC to provide growers withproper collection and processing services has declined sharply, due to both
financial and organizational constraints. This, together with rapidly
falling real producer prices, led to a reduction in smallholder productionfrom 1976 onwards. Following nationalization in 1972, estate productionalso went into decline, with poor management and inadequate labor supply(tea is much more labor intensive than coffee). As a result, many teaplantings were abandoned (80% of smallholder plantings and 90% of estateplantings have now been abandoned for up to four years), factories were
allowed to run down, and Uganda lost its reputation for quality tea in the
- 58 -
world markets. 4 Production is now barely sufficient to meet local demandand exports have virtually stopped, apart from small semi-formal sales toSudan. Tea plants can be rehabilitated after a number of.years of abandon-ment, but this will only be worthwhile if serious action is taken to im-prove producer prices and the marketing structure of the industry. Other-wise, there is a danger that substantial areas of tea will be overrun bybush, burnt down or uprooted by growers who have lost hope of receiving areasonable return from their crop.
4.25 Prior to 1972, tea was marketed directly by the producers, usingthe Mombasa market for lower grade teas and the London market for betterqualities. Following the nationalization of the tea estates, the UgandaTea Authority was given sole responsibility for marketing the nationalcrop, but this monopoly position has recently been withdrawn. There arenow three sales channels: Uganda Blenders, the largest buyer, which serv-ices the local market; direct sales from producers to traders; and privatesales on the export market (which are very small at the moment). TheGovernment is presently reviewing the whole structure of the tea industry,including a proposal to centralize the functions of UTGC, AgriculturalEnterprises, and UTA within one production and marketing body. While somereorganization could well be justified, to reduce administrative overheadsand rationalize the use of processing capacity, it would be unfortunate ifthis were achieved at the expense of greater competition within the indus-try.
4.26 Tobacco. Although tobacco is an old established crop in Uganda,commercial production was only begun in 1928. Early efforts were concen-trated on fire and air-cured tobacco; but in 1942, flue-curing was intro-duced and "master farmers" were encouraged to build their own barns andcure their own crop. Production reached a peak of 5,000 tons (of whichabout two-thirds was flue cured) in 1972, and has steadily declined eversince. Although present production is inadequate to fully supply localcigarette demand, some exports have been maintained because of the qualitymix (high-quality tobacco is exported and lower grades imported). However,export levels are well below their peak levels of the late 1960s, whentobacco earned as much as US$3 million per annum in foreign exchange. Forthe future, Uganda would not seem to have sufficient natural advantages tore-enter the world tobacco market on a large scale. But there is amplescope for expansion to meet local demand, and once this is achieved, exportprospects in neighboring countries could be explored.
4.27 Flue-cured tobacco is grown in the north and west, primarily inNile Province, where large areas of the crop have been damaged or abandonedbecause of continuing security problems. Production of fire-cured tobaccois centered in Bunyoro and Mubende, and is often grown by migrant cultiva-tors, some of whom come from outside Uganda. There is also a substantialarea of air-cured tobacco in Kigezi which has never entered the formal mar-ket but which is sold throughout Uganda and into Rwanda for pipe smokingand snuff. All of these areas are in the annual crop zone and as a result,tobacco competes with annual food crops (maize and groundnuts) as a sourceof cash income.
4/ The decline in tea quality is due primarily to irregular picking(labor shortages) and collection delays (transport bottlenecks).It is estimated that the poor quality of Ugandan tea reduces itsvalue by almost 50% as compared to average world prices.
- 59 -
4.28 The production of good quality flue-cured tobacco requires con-siderable levels of labor, skill, inputs, and firewood (for curing), andinvolves high risks, especially from hail damage. It has, therefore, beenlargely confined to the more enterprising farmers who can produce a satis-
factory product. However, in recent years, production has been severelyrestrained by shortages of fertilizers and nematocides (which when avail-able, were often smuggled to Kenya), a lack of essential spare parts forcuring barns, and the impact of reduced supplies and transport problems onthe availability of firewood. As a result, average yields have fallen toabout one-third of the levels attained in the late 1960s. Fortunately,
techniques of production are well established, and provided supplies andincentives can be restored, a substantial improvement in yields could beachieved.
4.29 The Produce Marketing Board retained a monopoly on tobacco mar-keting from 1968 to 1978, when the National Tobacco Corporation (NTC) took
over responsibility for all aspects of the industry. NTC now purchasesflue-cured tobacco from cooperatives and fire-cured tobacco directly fromfarmers. Although NTC officially has a monopoly, the low official producer
prices have resulted in an estimated 25% of the flue-cured crop and 50% ofthe fire-cured crop being sold through informal channels. The combinationof falling production and informal sales has resulted in low capacity uti-lization (about 10%) at NTC's central processing plant (which neverthelessremains in remarkably good condition), and consequently high unit costs.This, together with high tax rates, has kept the producer price down andreinforced the vicious circle of low production and high costs. Althoughproducer prices have recently been increased, they are still inadequate tocover producer costs, and are well below informal market price levels.
4.30 Sugar. The major part of Uganda's local sugar producing capacitylies with three large commercial estates. Two of these, Kakira and Lugazi,were nationalized in 1972, but the original owners have now returned tomanage them, under a 51% government/49% private ownership arrangement.Both of these estates are in run-down condition, although some rehabilita-tion has now started. The third estate, at Kinyala, is a newer plantationbelonging to the State, and its equipment is in fairly good condition.However, some technical assistance will be required to complete installa-tion and make the plant fully operational. These three mills are tradi-tionally supplied cane from their own plantations and outgrowers. However,there has also been a remarkable growth in smallholder cane production inrecent years. This cane is used to make jaggery, a crude brown sugar,which is consumed as a substitute for refined sugar or sold for furtherrefining at the Waragi distillery in Kampala.
4.31 Production of raw sugar peaked at 152,000 tons in 1968, and thenremained at over 100,000 tons per annum through 1972. However, followingthe nationalization of the estates, production plummetted and haE; remainedbelow 20,000 tons per annum since 1976. As a result, Uganda, which hadexported as much as 48,000 tons of sugar in 1969, has been a net importersince 1971. The immediate goal should be to return to national self-suffi-ciency, which could be achieved with full utilization of tIe potential fac-tory capacity presently available. However, this will require not onlysubstantial imports of equipment and spare parts for rehabilitation, butalso more remunerative prices, to make re-investment worthwhile and to paythe wage rates necessary to attract back the large labor force required.
- 60 -
C. Rehabilitation Priorities
4.32 In designing an effective rehabilitation program for the agricul-tural sector, there are a number of general concerns that need to be bornein mind. Firstly, agriculture, like the rest of the economy, will benefitfrom a return to normalcy, in terms of political stability, law and order,and effective public administration. While this is clearly not somethingwhich is actionable within an agricultural rehabilitation program, it is abasic prerequisite for success. Secondly, what can be achieved in the nearfuture will be very much constrained by limits of manpower and finance.This implies a careful selection of priority program components, and theirphasing over time, to ensure that progress on one front is not negated bybottlenecks elsewhere. Thirdly, objectives in the agriculture sectorshould not be governed by a simplistic desire to return to the situation ofthe early 1970s. Admittedly, the record production levels of that periodcan provide a useful benchmark for gauging the performance of the sector,but not everything was running smoothly back then, and much has changedsince, in both Uganda and the international economy. Finally, there aresome options which probably need to be avoided, at least for the timebeing:
(a) revival of the tractor hire service, which was first introducedduring the 1960s in an attempt to replace the hoe with theplough. In almost all respects, this scheme was a disaster: inits peak year (1968), the service incurred a deficit of almostU.Sh. 10 million on its operating costs alone, and was heavilysubsidizing farmers; the small number of farmers using the scheme(less than 1% of the arable area was covered) generally belonged
to the wealthier members of the community; the tractors were onlyinvolved in primary cultivation and provided no relief of criti-cal weeding and harvesting bottlenecks; and the emphasis on trac-
tors diverted attention from more appropriate intermediate op-tions, such as ox-drawn implements;
(b) development of large-scale irrigation, which would not only ab-sorb excessive resources, but also offer limited benefits in acountry so well endowed with good rainfall; and
(c) the development of large-scale state farms, as has been proposedby the Lint Marketing Board in the case of cotton. In the past,the Ugandan smallholder has demonstrated his ability to producesurpluses when given the necessary incentives and to surviveextended periods of neglect and adversity. State farms, group
farms and even private plantations and estates have a far lesssuccessful record. It is, therefore, essential that the focus ofany agricultural rehabilitation program be first and foremost onthe development of smallholder production.
4.33 Pricing policy. As discussed earlier, production incentives forfood have been sustained by the development of widespread informal marketsand the eventual abandonment of officially-regulated producer prices in1977. However, official producer prices for export crops have been

- 61 -
maintained, and until recently, little attempt was made to adjust theseprices in line with market forces. As shown in Table 4.3, the rise in pro-ducer prices for export crops during the 1970s was many times less than forcompeting food crops, as well as for various indicators of general infla-tion. Although, this was offset by opportunities for smuggling, especiallyfor farmers living near international borders, the foreign exchange earnedwas lost to official purposes, and in many cases, the potential incentiveto production was reduced by high transaction costs. Indeed, for many far-mers, the advantage of smuggling was not so much higher prices as promptcollection and payment for the crop and access to "magendo" supplies.
4.34 Over the past two years, and especially since the devaluation ofthe Ugandan shilling in mid 1981, the Government has made a concertedeffort to realign the producer prices for major export crops. Since April1979, tea prices have been raised by more than 340%, tobacco prices by400%, cotton prices by 500%, and robusta coffee prices by 900%.5 Asdiscussed below, these adjustments have provided farmers with a positivereturn on export production (except for tea), and with a narrowing of theprice differentials vis-a-vis neighboring countries, there has been anoticeable diversion of supplies back into official channels. But, thereturns to land and labor from growing food crops are still substantiallyhigher, and without further adjustments, it remains uncertain whetherfarmers will be prepared to reinvest in export production to any largeextent. Certainly, given the new exchange rate and present world prices,the scope for further adjustments exists: apart from cotton, the farmer'sshare in export earnings is 50% or less. The balance is absorbed byprocessing and marketing margins, and, in the case of robusta coffee, theimposition of an export duty.
4.35 For the major crop, robusta coffee, the present price is morethan adequate to cover costs on a small mixed garden or on larger farms,provided there are no perennial grasses to be cleared. However, four con-siderations would argue for a higher producer price. Firstly, the share ofthe export price paid to the farmer is still only 50% (as compared to about73% in Kenya). As a result, the farmer's private decision on whether ornot it is profitable to grow coffee may not be in line with Uganda's compa-rative advantage in earning foreign exchange. Secondly, it appears thatofficial sales (and possibly production as well) of coffee grown on smallmixed farms have increased in response to the recent price adjustments.However, a higher producer price, of at least U.Sh. 40 per kilogram, wouldprobably be required to make rehabilitation of larger pure stands profit-.able relative to the major competing crop, bananas. Similarly, the initialcost of clearing overgrown coffee farms of perennial grasses, especially"couch grass", is very high. Our estimates suggest that in the first yearof clearing, the cost of producing robasta kiboko could average close toU.Sh. 60 per kilogram, that is well above the present producer price.Under these circumstances, the farmer may well choose to leave his farmabandoned, or grow pasture for livestock. Thirdly, even at the officialexchange rate, the farmer can still earn a higher price (possibly as muchas U.Sh. 60 per kilogram) by smuggling his coffee to Kenya. Obviously,with the transport and risk costs involved, the net return on smuggling islower and the recent adjustments in producer prices do seem to have led to
5/ The producer price for cocoa was also raised, by 525%, in January1982.

Table 4.3: AGRICULTURAL PRODUCER PRICES
A. PRODUCER PRICES AND COSIS
Producer Prices (U.Sh./kg) Oct. 1981 (estimates)April Oct. Producer Prod.Price Yield per Net Return Net Return
State 1970 Change 1979 Change 1981 Costs/g Prod. Cost Bectare per Hectare per Manday(%) (%) (USh./kg) (%) (kg) (U.Sh.'OO) (U.Sh.)
Major export crops /aCoffee (robusta) kiboko 1.1 (218.2) 3.5 ( (900.0) 35.0 10.3 339.8 1,590.0 39.3 187.7Cotton raw 1.2 (316.7) 5.0 (500.0) 30.0 21.7 138.2 259.0 2.1 16.6Tea green leaf 0.9 (53.4) 1.4 (344.4) 6.0 11.2 53.6 3,625.0 -18.9 -63.4Tobacco flue-cured 10.7 (12.1) 12.0 (400.0) 60.0 56.6 106.0 600.0 2.0 3.1
Selected food crops /bBananas 5.0 /f 0.7 714.3 10,000.0 43.0 294.6Groundnuts 2.5 (1,201.6) 32.3 (364.4) 150.0 23.9 627.6 710.0 89.5 718.8Maize 30.0 4.3 697.7 1,150.0 29.6 269.9
General Inflation
Kampala cost of living index (low income) (3,229.3)GDP deflator (1,329.2)
B. ALLOCATION OF EXPORT EARNINGS
Oct. 1981 (U.Sh./kg) Prod. PriceProducer Coops/ Marketing Export Export World Export Price
State Price Processors BDards Tax Price Price /h (%)(f.o.b.) (c.i.f.)
Coffee (robusta) clean 67.9/c 17.7 23.1 27.1 135.8 173.8 50.0Cotton lint 99.9Fd 22.0 18.8 - 140.7 126.7 71.0Tea processed 30.0/e 48.0 2.0 - 80.0 153.4 37.5Tobacco flue-cured 60.0 20.0 80.0 - 160.0 300.8 37.5
/a Official producer prices./- Free market prices; official producer prices for food crops were abolished in 1977./c Assuming 1.94 kg of kiboko per kg of clean coffee./d Assuming 3.33 kg of raw cotton per kg of lint.e Assuming 5 kg of green leaf per kg of processed tea.
/f Off-main-rad price. Market prices in Kampala are substantially higher at around U.Sh. 12-20 per kg./g Preliminary estimates only. Assumptions on production techniques and input costings are summarized in SA Table 7.3.Fh Indicative wrld market prices as reported by the World Bank's Commodities and Export Projections Division.
Source: World Bank estimates
- 63 -
a substantial reduction in coffee smuggling. Nevertheless, the situationneeds to be kept under review; with a recovery in world coffee prices, thesmuggling incentive could well increase again. Finally, one of the majorreasons for thq Government's reluctance to increase producer prices furtheris the contribution of robusta coffee to government revenue, through anexport tax which in late 1981 absorbed about 20% of the export price. Thisis expected to contribute about U.Sh.13.8 billion during 1981/82, or 45% ofcentral government revenue. Any reduction in export duty rates wouldclearly have to be weighed carefully against the need to maintain fiscalbalance. Over the longer term, however, increased production and officialpurchases of export crops (together with the higher levels of imports andeconomic activity they would permit) could help strengthen the revenue baseof the Government.
4.36 For tea, the present situation is even less satisfactory. On anestablished but overgrown smallholder farm, the average cost of growinggreen leaf tea over a four-year pruning cycle would be about U.Sh. 11 perkilogram, with an initial cost of U.Sh. 40 per kilogram in the first year.Therefore, at the present producer price of U.Sh. 6 per kilogram (fromwhich a transport fee is deducted by UTGC), tea is clearly not a profitablecrop. On the other hand, the farmer is still receiving less than 40% ofthe export price, and the percentage would be even lower for higher-gradeteas. There is, therefore, considerable potential for raising tea producerprices, and a level of at least U.Sh. 15 per kilogram would seem necessaryto encourage rehabilitation. (Producer prices in Kenya are higher ataround U.Sh. 20 per kilogram using the official exchange rate, but Kenyantea is of superior quality.) To date, further increases in the producerprice for tea have been ruled out, on the grounds that they would jeopar-dize UTGC's already precarious financial position. But this is primarily ashort-term concern, which needs to be met by improving the efficiency ofUTGC's operations and bridging subsidies from the Treasury. Over the lon-ger term, the only solution to UTGC's financial problems is to increase teaproduction (reducing UTGC's unit overheads) and improve tea quality (in-creasing unit values). Neither of these can be expected to happen withouta substantial increase in producer incentives.
4.37 For the two major annual export crops, cotton and tobacco, pres-ent producer prices do not provide a profitable return in comparison withthe food ciop alternatives. In the case of cotton, producer prices arealready over 70% of the export price and comparable with those paid inKenya. Therefore, at the present exchange rate, there is little scope forincreasing producer prices further. However, tobacco is a somewhat differ-ent story. Although official producer prices for flue-cured tobacco areonly U.Sh. 60 per kilogram (or less than 40% of the export price) a flour-ishing informal market exists in many areas, offering prices in excess ofU.Sh. 100 per kilogram. The net return to the farmer on the informal mar-ket is still less than can be gained by growing maize (especially if trac-tors are used for tobacco cultivation). But even so, tobacco does providea competitive option in areas remote from urban centers where informalinternational trading is possible. If this tobacco is to be brought backinto official channels, a producer price of at least U.Sh. 100 per kilogramwill be required.
4.38 These brief crop discussions indicate that higher producer pricesare presently warranted for tea, tobacco and, to a lesser extent, coffee.Inevitably, subsequent adjustments will also be required as the full impactof the devaluation is felt, and world prices change. In this context,
- 64 -
it is essential that the administered prices be regularly reviewed and
adjusted in a systematic manner. For this, an appropriate institutional
structure needs to be found, which gives due weight to the concerns of
producers, and also provides for more automatic adjustments in producer
prices in line with world price trends. To help strengthen the analytical
base for producer price decisions, it will be necessary to re-establish
capacity within the Ministry of Agriculture for collecting and analyzing
information on costs (producer, processing and marketing), relative crop
prices, producer responses for different areas, and world market condi-
tions. For the longer term, the Government should also begin a review of
the overall system of producer pricing for export crops. This should
include an analysis of the potential impact on producer incentives, the
budget and the balance of payments of alternatives to administered prices
(e.g., minimum support prices, open market prices) and of more competitive
marketing systems (e.g., auctions). 6
4.39 Availability of goods. The crippling impact on the agricultural
sector of supply shortages was documented in the Commonwealth Report. At
that time (i.e., just after the 1978-79 war), the cost of the initial
two-year agricultural rehabilitation program was estimated at US$200 mil-
lion, of which US$160 million was in foreign exchange. While some progress
has been made, in relieving specific 'ottlenecks, the shortage of foreign
exchange has so far prevented any overall improvement in the supply situ-
ation. Therefore, with continuing deterioration in the condition of the
sector's assets, the rehabilitation requirements are no doubt substantially
larger now than in 1979. Although for some goods (e.g., hoes) domestic
production has already started to improve, most items will have to be
imported in final form for a number of years to come. But, the supply
problem is not solely a foreign exchange problem. When goods do become
available, it will be important to ensure that they can be moved effi-
ciently to rural areas. It will also be important to ensure that the goods
are sold at prices reflecting their market value, to avoid diversion to
non-agricultural uses, or even smuggling out of the country. Prior to the
recent devaluation and related pricing adjustments, this was a major
6/ To date, CMB has resisted proposals to move towards an auction
system for coffee, as is done in Kenya, claiming that Uganda is
already receiving higher prices for comparable grades of coffeeand that the potential crop, in normal years, would be too large
to handle effectively in an auction system. However, these argu-
ments are not very convincing prima facie, and a more thoroughreview of the potential advantages and disadvantages of using anauction system would seem warranted.
- 65 -
problem, and one which could re-emerge if significant subsidies are re-introduced.7
4.40 The priority items required to support the agricultural rehabili-tation program generally fall into six broad categories. Firstly, thereare a range of implements and inputs needed for production: simple toolsand hoes, fertilizers, pesticides, herbicides, and seeds. Although tractorimports should not be given priority at this time, some spare parts couldbe considered to repair tractors for use in specific and justified situa-tions (e.g., to relieve weeding and harvesting bottlenecks in food produc-tion and to clear swamps for rice growing). 8 Secondly, there are a rangeof spare parts , building materials (e.g., roofing sheets and cement), andmachinery required to repair and replace existing storage and processingcapacity. Processing bottlenecks are already restricting coffee exports,and are expected to develop for other export crops as production levelsrecover. In some areas (e.g., providing coffee drying trays for robustacoffee and hand pulperies for arabica coffee), the costs of rehabilitationare very modest, while in others (e.g., rehabilitation of the sugar mills),major investments are required. Thirdly, various packaging materials --including tea chests and liners, gunny bags and baling twine -- are neededat most stages of the production cycle. Without these, stores become over-loaded and the quality of the final product declines.
4.41 Fourthly, transport bottlenecks remain critical in many parts ofthe country, with widespread reports of vehicle losses and damage (bothduring and after the 1978-79 war), and deteriorating road conditions. Thisnot only affects the movement of crops, but also the distribution ofagricultural supplies and the mobility of extension staff. Although 600new trucks were imported by CMB during 1981, to help with the movement ofcoffee exports, a disproportionate number are for long-distance haulage(which would be better done by rail), while many others have been divertedto non-agricultural uses. Again, what is needed is primarily spare partsto make better use of the remaining fleet (as well as of road
7/ Although the objective of subsidies -- to improve farmers'income -- is commendable, this is better done through croppricing policy, to help prevent leakages of goods into the"magendo" economy.
8/ The general use of tractors, especially at subsidized rates,should probably not even be promoted over the longer term, aswith appropriate factor costs, more labor-intensive and inter-mediate technologies would become economic.
9/ External bottlenecks on the movement of agricultural exports andimports have also been a problem, but as discussed in the trans-port chapter, these can only be resolved by a joint commitment byKenya and Uganda to make better use of the available railwaycapacity.

- 66 -
repair equipment), with expansion of the fleet limited to appropriate vehi-
cle types, such as bicycles and small pickups, which can handle small
loads. Fifthly, there have been shortages of fuel which not only restrict
transport but, together with intermittent power failures, disrupt proces-
sing. The situation has improved somewhat recently, with higher prices
helping to allocate and conserve the scarce fuel supplies available, butwith increased agricultural production, the problem could soon re-emerge.Therefore, opportunities to substitute alternative energy sources for oil,
such as the use of wood in smallholder tea processing, need to be ex-
plored. Finally, it is essential to maintain supplies of basic consumer
goods in rural areas, in order to encourage farmers to produce cash crops.
With rehabilitation, these goods can be increasingly supplied by domesticindustry (e.g., soap, textiles, footwear, sugar, salt, edible oils, and
matches). But, in the interim, priority allocations of foreign exchange
for direct imports will be required.
4.42 Marketing. Although the open marketing system for food seems to
have worked reasonably well, especially taking into account the adverseeconomic and security situation in recent years, the Government has been
concerned that it is insufficiently responsive to emergency food situa-
tions, such as arose in Karamoja in 1979 and 1980. For this reason, it has
been proposed that a national food reserve be established, to help redis-tribute food from surplus to deficit areas (where lack of income preventsthe normal market mechanism from working), and reduce the need for food
imports. This scheme obviously has a number of potential benefits, but its
justification and structure needs to be carefully reviewed before any final
decision is taken. The recent breakdown in food distribution was due inlarge part to administrative and transport bottlenecks, and these will have
to be relieved before any reserve system could be efficiently managed and
utilized. A reserve system would also have to contend with storage prob-
lems relating to moisture, insect and rodent damage, which are inevitablyexpensive to overcome under Ugandan conditions. It would therefore be
necessary to decide whether the resources so allocated could not be betterused to encourage increased production through higher prices and better
input supplies. Certainly, the operation of a reserve system should not be
used as an excuse to reimpose PMB's marketing monopoly; food purchases
required to support the system would have to be made at open market prices.
4.43 In addition to the domestic marketing of food, the options for
food exports also need to be explored. There is already a thriving infor-mal trade in food exports to neighboring countries and at present world
prices, this could well be in line with Uganda's national comparative ad-
vantage. Now that a more realistic exchange rate has been adopted, andwith the potential for a quick return to a surplus food situation, it may
well be possible to formalize these export sales. However, this would
first require a careful assessment of market prospects, taking into account
the neighboring countries' own foreign exchange problems, and competitionfrom concessionally-financed imports.

- 67 -
4.44 In the marketing of export crops, the cooperative movement andthe marketing boards play a crucial role. Unfortunately, the financialposition of virtually all of the cooperatives was severely weakened duringthe 1970s, leading to an accumulated indebtedness estimated at over U.Sh.1.6 billion. There were many reasons for this financial decline: (a) lowofficial margins provided to cooperatives for processing and marketing; (b)the impact of declining production levels on unit overheads and profitabi-lity; (c) overexpansion and diversification of activities; (d) poor manage-ment; and (e) damage during the 1978-79 war to vehicles and processingfacilities. Most marketing boards, with the notable exception of CMB,faced similar problems. The result was increasingly inefficient operationsand delayed and sometimes non-payment of producer prices. Following the1981 devaluation, there is now more scope for improving the financial posi-tion of marketing agencies, without impacting adversely on producer re-turns. It should also be possible to resolve outstanding indebtednessproblems by providing, where appropriate, official debt write-offs, re-scheduling or refinancing. With a sounder financial base, and improvedstaffing and management (recruited for technical competence rather thanpolitical disposition), it should be possible to gradually restore operat-ing efficiency, and improve the payment of prices and supply of credit atall stages of the export process. However, until production levels fullyrecover, some cooperatives and marketing boards will require temporary sub-sidies to cover their high unit costs.
4.45 A broader strategy issue, already raised in the discussion ofpricing policy, is whether export trade should be opened up to a greaterdegree of competition. This is permitted to a limited extent in robustacoffee, where private primary processors compete with cooperatives, and, ofcourse, happens in any event when price distortions encourage informaltrading and smuggling. However, most cooperatives and marketing boardshave maintained their official marketing monopolies. Without this statu-tory protection, the more efficient cooperatives and marketing boards wouldsurvive, while others may go out of business. Clearly, some official rolein exporting will continue to be required for most crops, either to controlquality standards or to provide trade information and promotion. But, thiscan be done without necessarily imposing trading monopolies which, in thepast, have often worked against the interest of the most important link inthe export chain, the producer.
4.46 Support services. The immediate priorities for the rehabilita-tion of the agricultural sector are to improve pricing policy, the avail-ability of goods and marketing. However, once the rehabilitation phase iscomplete, progress in other areas (research, extension, training, planningand credit) will be required to support agricultural development over thelonger term. To ensure that this support is available when needed, a startwill have to be made now on building up an appropriate institutional struc-ture.
4.47 Despite concerted efforts to establish research institutionsand programs over the past 30 years, the results in Eerms of increased

- 68 -
production have been disappointing.1 0 (One major exception was for tea
during the 1960s, but there the research was carried out by industry rather
than government research stations.) Now, the priority is to relate the re-
search program more closely to the actual needs of its clients, usingtask forces to deal with specific challenges facing smallholders in various
parts of the country. At an institutional level, this will require inte-gration of the University's research work into the national program, ra-tionalization of the research stations (three of the four major stations in
Uganda are within 20 km of Kampala, in a single ecological zone and withoverlapping responsibilities), and closer contacts with developments inoverseas reasearch. However, perhaps even more important, is the need to
improve the motivation of research staff. At the moment, both the civil
service and university staff involved in agricultural research are demoral-ized, having produced no published reports nor fed any useful new informa-tion to the extension service over the past eight years. Remotivation will
therefore take not only better wages and conditions, but a general improve-
ment in the image and recognized contribution of agricultural research.
4.48 The extension service has been steadily expan'ed in recent years
and now has 2,300 staff, including 200 graduates, to serve 2 million farm-ing families. However, without well-validated and managerially feasibleinformation to pass on to farmers, the extension service has for many years
lacked the basic tools for improving productivity. 1 1 It is really thislack of a message that has been the real constraint on the extension sys-
tem, a constraint that has simply been compounded by the recent loss oftransport and teaching aids. If the service is to become effective, it
will have to be oriented much more towards an economic and managerial
approach to farming, rather than simply passing on purely agronomic advice.Given a basic reformation of the research system, the extension staff could
provide a valuable service by supervising and monitoring a wide range ofon-farm trials.
4.49 Although the planning division of the Ministry of Agriculturecontinues to be quite well staffed, it has suffered from the general dec-line in civil service morale over the past decade. The planning section of
the division has put together some 35 projects for donor funding over thepast year and most of these appear consistent with the priority needs ofthe crops and activities concerned. However, the main weakness of the div-
ision is its lack of influence over the critical areas of crop pricing andmarketing. As a result, agricultural planning has to take place withoutany detailed knowledge of farm-level budgeting or market trends, which
could form the basis of advice to Government and farmers on overall strat-
egies and priorities for development.
10/ The increase in production of cotton and coffee during the 1950sand 1960s resulted from increased acreages. Average yields ofboth these crops actually fell over this period, and there wereno obvious and widespread improvements in food crop production
techniques.
11/ The extension service did, however, play an important role inteaching farmers how to grow and handle the new tea and tobacco
crops during the 1960s.

- 69 -
4.50 Graduate training is given at the faculty of agriculture at Make-rere University which has an output of about 75 graduates in agricultureand 20 in forestry each year. There are also three agricultural collegesat Bukalasa, Arapai and Busitems offering diplomas and certificates in ag-riculture and agricultural engineering. At present, these produce approxi-mately 80 diplomates and 180 certificated staff per year. The problem ofstaff absorption is becoming serious as the output of trained staff consis-tently outnumbers the replacement requirements of the ministry, whichnevertheless guarantees employment to all trainees. The number of train-ees, therefore, needs to be reviewed. However, equally important, the con-tent of training needs to be reviewed to ensure that it is relevant topresent conditions in the agricultural sector. In particular, the farmmanagement section of the syllabus needs to be strengthened and made moreappropriate for smallholder decision making.
4.51 During the late 1960s, the Ministry of Agriculture took on res-ponsibility for multiplying and distributing seeds of maize, sorghum,groundnuts, and soybeans. The program collapsed in the latter part of the1970s but is now to be reviewed with EEC assistance. Decisions are re-quired on four major issues.
(a) The responsibility for seed production and distribution.This at present lies with the Ministry of Agriculture, butexperience elsewhere suggests that a private firm or para-statal could provide the commercial basis for large-scaleseed marketing, withouc which the scope and long-term viabi-lity of the program are likely to be seriously restricted.
(b) The means of production. Will the program develop large-scale mechanized seed farms or rely on eliciting the cooper-ation of smallholder contract suppliers?
(c) The extent to which hybrid maize seed could be supplied fromKenya, rather than developing a new program in Uganda.
(d) The supply of foundation seed from which to develop commer-cial seed. The capacity of the research division in theMinistry of Agriculture to produce an adequate amount ofwell-tested genetically pure material to the seeds schemewill be crucial to both its viability and usefulness.
4.52 Finally, with the exception of tea and tobacco growers who haveobtained credit for input supplies through their respective crop parasta-tals, there has been little smallholder credit available for severalyears. The Government now proposes to initiate a major small-farm creditscheme for the whole country. As this will be the successor to a number ofprevious schemes, there is a real need to study the impact of these prede-cessors and the reasons for their weakness. With a number of crops, it hasbeen the absence of viable technical recommendations which were dependentupon credit for their effectiveness which led to the lack of production im-pact of credit schemes. Therefore, without careful analysis of the creditconstraints in agriculture, and the economics of overcoming them, there isa danger that scarce resources will again be channeled into unproductiveinvestments.

- 70 -

- 71 -
Annex to Chapter 4
LIVESTOCK AND FISHERIES
A. Livestock
A4.1 Uganda is well suited to livestock development, having betterpastures than other East African countries due to well distributed andample rainfall (except in the northeast). Most livestock in Uganda areprivately owned. In areas where cattle, goats and sheep are herded commu-nally, they are still owned by indiv 'uals rather than by families orclans. The numbers owned by individuals can range from a single animal toherds of several thousand cattle. The proportion of the population engagedin livestock raising varies widely between districts. In Kara,moja, wherelow rainfall almost precludes cropping, most people work with livestock.In other areas, livestock is mainly confined to people of one ethnic ori-gin, while other groups concentrate on crop cultivation. In Buganda, mixedfarming is the usual pattern, as coffee, the dominant crop, responds wellto livestock manure. The spread of ownership in the east and north isinfluenced by farmers' dependence on oxen for draft power, and about 70% ofthe country's cattle are found in these regions. Overall, it is estimatedthat about one-third of the active population work at least partly withlivestock.
A4.2 During the 1960s and early 1970s, the most obvious advances werewith cattle. Small-scale dairying, using high-grade and cross-bred stock,mushroomed in the "fertile crescent" and to the west. However, modern andefficient commercial dairying, ranching, and poultry and pig farming werealso developed on a limited scale. Many of these new farms were located inareas cleared from tsetse fly, and which were otherwise unused and unoccu-pied. By the mid 1970s, about 400 commercial ranches were in various sta-ges of development, each designed to carry 600 to 1,000 head of cattle.Most of these proved to be highly successful, providing returns three tofour times higher than with traditional husbandry methods.
A4.3 Uganda's livestock subsector was adversely affected during the1970s by shortages of good quality breeding stock and pasture seed, inade-quate supplies (such as fencing wire, dipping fluid and pumps), deterior-ating transport infrastructure, and an increasingly under-equipped diseasecontrol program. Nevertheless, the livestock population continued to grow:by 1977, it is estimated that Uganda had 4.9 million head of cattle, 2.4million goats, 1.1 million sheep, 0.2 million pigs and 12.3 million poul-try. At that time, about 70,000 tons of beef and 400 million liters ofmilk were produced each year. However, after 1978, the livestock subsectorwent into a serious decline: commercial poultry farming has ceased, andthe cattle population is estimated to have been reduced by as much as 20%.As a result, prices have skyrocketed, with eggs costing U.Sh. 10 each, meatU.Sh. 100 per kilogram, and fresh milk U.Sh. 50 per half liter.
A4.4 There are two major reasons for these setbacks. Firstly, withwidespread looting during and after the 1978-79 war, many cattle werekilled or stolen. This affected the large ranches most, as the smaller sizeof dairying farms made them less attractive to marauders. However, facili-ties for both dairying and ranching were damaged, and many farmers pulled

- 72 -
out of commercial livestock farming. The main milk processing plant atKampala is now working at only 10% of capacity, and that using importedmilk powder. Secondly, with the breakdown of the disease control programand critical shortages of many essential drugs and vaccines, a number offatal or debilitating diseases have returned. In particular, tsetse flyhas now reinfested many areas previously cleared and as a result, trypano-somiasis is spreading once again. Both rinderpest and pleuropneumonia arebecoming more prevalent, and in some areas spreading without control, whilethe incidence of rabies and foot and mouth disease has reached epidemicproportions. The major campaign to r-duce and ultimately eliminate EastCoast fever has collapsed and the disease is again endemic throughout thecountry.
A4.5 Before the Ministry of Animal Industry can usefully begin work onrehabilitating the livestock sector, it will be necessary to complete amore comprehensive review of present conditions and constraints. Initially,top priority will have to be given to re-establishing an effective diseasecontrol program. This will require not only improved supplies of drugs andvaccines, but also effective quarantine and vaccination procedures, withemphasis on disease monitoring and research. (Fortunately, a strong andwell-staffed Department of Veterinary Services is in place). As areas arecleared, restocking should proceed only to the extent that supporting ser-vices and infrastructure can be provided. Over the longer term, livestockplanning needs to look closely into the possibilities for more integratedsmall mixed farms, especially in those locations where progressive in-creases in cropping density have led to a loss of fertility and loweryields. In other areas, which have been recently cleared of tsetse fly,ranching may remain the only practical form of land use for some years.However, even there, population pressure is likely to bring about moreintensive land use problems by the end of the century, and this needs to betaken into account in livestock planning.
B. Fisheries
A.4.6. Fishing provides about one-half of Uganda's animal protein and isan important source of income for people living near the country's manylakes, rivers and swamps. In 1978, 50% of the catch came from Lake Kyogaand 40% from Lake Victoria. The total fish catch is estimated to haverisen from 139,000 tons to 223,000 tons in 1978 but declined thereafter.While catches in some areas, such as Lake Kyoga, continue to rise, theaverage weight of individual fish has been falling. This has led to fearsthat certain waters may have been overfished although this is difficult toassess without additional knowledge of recent fishing patterns.
A4.7 Most fishermen are small-scale producers, using simple woodenboats. The fish are transported on bicycles and by pickups to the maindistributing centers where about 60% are sold fresh and locally consumed,while the rest is either smoked or chilled and sent to the main markets,primarily at Jinja and Kampala. The recent decline in fish production inUganda is attributable to the breakdown of the fishnet manufacturing fac-tory at: Kampala, boat repair services and the ice plant at Soroti, whichprovided, ice for preserving fish during transportation to urban areas.Once these facilities are repaired, a revival in fishing can be expectedand then intensified efforts will be needed to ensure adequate stocking andto control poaching and overfishing.

- 73 -
Chapter 5
INDUSTRY1
A. Introduction
5.1 Although Uganda's industrial sector has always been relativelysmall, it did in the past make a valuable contribution towards supplyingthe domestic market with basic goods (e.g., edible oils, soap, paper, andcement) and in some instances, produced a surplus for export (e.g., tex-tiles and copper). During the 1960s and early 1970s, the sector grew at asatisfactory rate of around 6% per annum (similar to the growth rate forthe economy as a whole), and accounted for about 12% of monetary GDP and8% of total GDP (at 1966 prices). With a promising potential for furtherdevelopment, based on the country's agricultural and mineral resources, itwas hoped that industry would become an increasingly important source ofeconomic growth, providing both employment and foreign exchange earningopportunities. However, the actual performance of the sector since theearly 1970s has been disappointing. The overall growth rate of the indus-trial sector began to slow in 1970 and has generally been negative since1972. As shown in Table 5.1, production of many key industrial products
Table 5.1: INDUSTRIAL PRODUCTION
Peak Year 1980 Ratio ofUnits Year Amount Amount 1980/Peak Production
Spirits (waragi) '000 liters 1973 910.0 34.0 3.7Beer m. liters 1973 45.6 12.0 26.3Cigarettes billions 1974 2.0 0.6 30.0Fabrics m.sq.meters 1970 49.6 7.5 15.1Soap '000 tons 1966 14.9 0.4 2.7Matches (small) '000 cartons 1971 64.0 2.8 4.4Steel ingots '000 tons 1970 24.8 1.9 7.7Cement '000 tons 1971 205.1 4.9 2.4Paints m. liters 1974 1.9 0.1 5.3
Source: SA Table 8.1
1/ As used in this chapter, the term "industry" refers to agricul-tural processing and manufacturing only. Although mining andconstruction are also important sectors in the Ugandan economy,it has not been possible to cover them in this report. Electri-city generation is discussed in Chapter 7.

-74-
in 1980 was only a fraction of earlier peak levels. 2 Overall, industrialvalue added in 1980 was only 40% of its peak 1972 level, and accounted forless than 7% of monetary GDP and 5% of total GDP. Now, many industrieshave closed down while others continue to operate at very low levels ofcapacity utilization.
5.2 While there are no reliable figures available on industrial in-vestment, it would seem inevitable that, with the generally adverse envi-ronment for industrial activity, there has been little investment in newcapacity over the past decade (and indeed, in more recent years, there isevidence of disinvestment in many areas). Fortunately, direct damage tothe industrial sector during the 1978-79 war was minimal. However, withinadequate provisions for maintenance and modernization over the pastdecade, many firms are now left with equipment which is obsolete or in poorcondition. Despite the rundown state of the sector and declining produc-tion levels, industrial wage employment continued to rise, on average by2.3% per annum from 1966 to 1977 (see SA Table 1.3). Although the indus-trial labor force has almost certainly fallen in more recent years, follow-ing the closure of many firms during and after the war, it seems clear thatmany firms (especially parastatals) have tried to protect the employment oftheir workers, despite declining levels of production and capacity utiliza-tion. This will no doubt help facilitate the eventual rehabilitation ofthese industries, although this will occur through improved labor produc-tivity rather than additional employment opportunities.
5.3 With little investment in new capacity, the general compositionof industries has not changed very much over the past decade, with the pro-duction of basic consumer goods, wood products, building materials, simpleengineering goods, fertilizers and chemicals still dominating. Theseindustries are characteristically inward-oriented, requiring relativelylittle skilled labor inputs (except for machine maintenance) and moderatecapital investment. There are few intermediate and capital good indus-tries, and notably, in comparison to Kenya and Tanzania for example, virtu-ally no pure assembly industries, making electro/mechanical products frommair.y imported parts and components. The only significant change in thestructure of the industrial sector over the past decade is the shift ofownership from private to public. This started in the early 1970s, andwith the consequent expansion of the parastatal sector, almost all medium-and large-scale industries are now publicly owned. The present Governmenthas announced its intention to reverse this policy, both through the returnof selected parastatals to the private sector, and the adoption of a moreliberal industrial promotion strategy.
5.4 Although the industrial structure has not changed much, thereappears to have been a considerable reduction in the number of operatingenterprises over the past decade. In 1971, when the last full industrialsurvey was conducted, the sector was reported to comprise about 970 estab-
2/ It should be noted that statistics of industrial production inUganda are not necessarily very reliable, because of the generalupheaval in the country over the past decade, and because manyfirms have been unwilling to report accurate figures due to their"magendo" operations.

- 75 -
lishments employing ten or more people, and a much larger number of cottageindustries and small workshops scattered throughout the country. A recentregister of existing industries compiled by the Ministry of Industry (seeTable 5.2) records only 464 establishments. (While the coverage of thisregister could well be incomplete, and is unlikely to exactly match that ofthe 1971 survey, the figures still corroborate the conclusion that the sizeof the industrial sector has been considerably reduced over the past dec-ade.) Perhaps even more significant is the fact that almost 40% of thereported establishments have temporarily ceased operations while the re-mainder are operating on average with very low capacity utilization ofaround 20% (compared to 70% in 1970). At present, the most obvious andgenerally binding constraint is the severe shortage of foreign exchange:to import inputs, spare parts for machinery repair and capital goods forreplacing outdated and damaged plant. However, the longer-term decline inthe sector reflects more fundamental constraints, which could well re-emerge as the foreign exchange situation improves. These include:
(a) poor performance in the agricultural sector, which limited thesupply of raw materials, tightened the foreign exchange con-straint, and reduced the effective domestic market for industrialproducts;
(b) infrastructure weaknesses, especially in energy, transport, andwater supply;
(c) over-expansion and political interference in the management ofthe parastatal sector;
(d) shortages of qualified managerial and technical expertise, aggra-vated by the departure of many Asians and other skilled Ugandansduring the "economic war" of the early 1970s;
(e) problems of creditworthiness, resulting from ownership uncertain-ties, financial indiscipline, and more recently, the impact ofthe June 1981 devaluation on costs; and
(f) excessive government regulation, through import controls andpricing and taxation policies.

- 7b -
Table 5.2: REGISTER OF INDUSTRIAL ESTABLISHMENTS, 1981
(number)
TemporarilyOperating shut down Total
Small-scale 256 162 418Public 70 15 85Private 186 147 333
Medium-scale 25 14 39Public 24 13 37Private 1 1 2
Large-scale 6 1 7Public 6 TPrivate - -
Total 287 177 464Public 100 29 129Private 187 148 335
Source: Ministry of Industry
5.5 The Government recognizes the importance of improving utilizationof existing industrial capacity, and has set as a target, the increase ofaverage capacity utilization from 20% to 60% over the next two years. Thisis clearly an ambitious target given the foreign exchange, manpower, andinstitutional constraints on the sector. Nevertheless, it does help illus-trate the magnitude of the task ahead and the resultant need to mobilizeresources from a variety of sources: public and private, domestic and for-eign. Section B of this chapter outlines in more detail the presentproblems and constraints on industrial performance, and suggests someappropriate policy reforms for improving the environment for industrialrehabilitation and revival.
B. Problems and Policies
5.6 Foreign exchange. As with all areas of the economy, the indus-trial sector has suffered from the general shortage of foreign exchange inrecent years. In recent months, the situation has become particularlysevere, with no "free" foreign exchange being allocated for i.ndustrialimports. As a result, the sector's access to imports -- of inpats, spareparts for machinery repairs and capital goads for plant rehabilitation --has been severely limited. Examples of critioal imported inputs no longeravailable in adequate quantities are numerous: pulp for paper manufacture;

- 77 -
hops for beer production; chemicals and dyes, especially for the textileand tanning industries; rubber for producing tires and tubes; zinc and leadfor galvanizing; sulphur for fertilizer production; and packaging materialsfor virtually all industries. As noted elsewhere in this report, foreignexchange shortages are also affecting the supply of domestic inputs fromthe agricultural sector, and the condition of the supporting infrastructurefor industry, especially energy and transport.
5.7 Acco,rding to estimates prepared recently by the Ministry ofIndustry (see Table 5.3), the targeted increase in capacity utilizationover the next two years for 125 selected industries would cost more thanUS$340 million in direct foreign exchange. 3 This is equal to 85% ofUganda's 1981 import bill, and is patently unattainable within the foresee-able future. First priority will therefore have to be given to supplyinginputs and critical spare parts to industries which are already in opera-tion and which supply essential goods for the domestic market or earnforeign exchange (there are very few of the latter at the moment). Selec-tion among industrial firms should be made on the basis of appropriatecriteria relating to potential net income or net foreign exchange genera-tion, taking into account the scope for improved capacity utilization andmarket penetration (rather than simplistic targets for gross production asat present). Major rehabilitation can only be justified in the short termfor priority industries which earn (e.g., coffee and cotton processing) orsave (e.g., agricultural implements) enough foreign exchange to supporttheir own operations.4
3/ This estimate apparently includes the cost of recurrent importsfor the rehabilitated industries for one year.
4/ For a detailed discussion of rehabilitation requirements by indi-vidual enterprises, see the Report by the Industrial ReactivationTask Force: Proposals for the Reactivation of the IndustrialSector, March 1981.
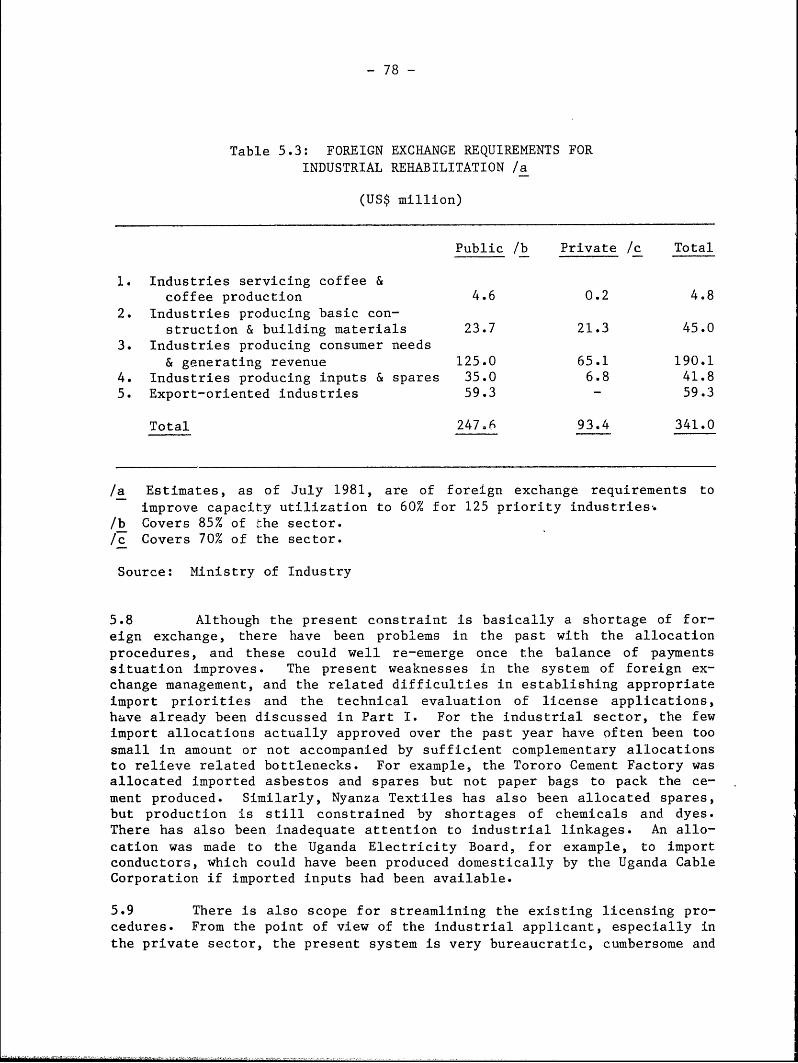
- 78 -
Table 5.3: FOREIGN EXCHANGE REQUIREMENTS FOR
INDUSTRIAL REHABILITATION /a
(US$ million)
Public /b Private /c Total
1. Industries servicing coffee &coffee production 4.6 0.2 4.8
2. Industries producing basic con-
struction & building materials 23.7 21.3 45.03. Industries producing consumer needs
& generating revenue 125.0 65.1 190.14. Industries producing inputs & spares 35.0 6.8 41.85. Export-oriented industries 59.3 - 59.3
Total 247.6 93.4 341.0
/a Estimates, as of July 1981, are of foreign exchange requirements to
improve capacity utilization to 60% for 125 priority industries./b Covers 85% of the sector./c Covers 70% of the sector.
Source: Ministry of Industry
5.8 Although the present constraint is basically a shortage of for-
eign exchange, there have been problems in the past with the allocation
procedures, and these could well re-emerge once the balance of payments
situation improves. The present weaknesses in the system of foreign ex-change management, and the related difficulties in establishing appropriateimport priorities and the technical evaluation of license applications,have already been discussed in Part I. For the industrial sector, the fewimport allocations actually approved over the past year have often been too
small in amount or not accompanied by sufficient complementary allocationsto relieve related bottlenecks. For example, the Tororo Cement Factory was
allocated imported asbestos and spares but not paper bags to pack the ce-
ment produced. Similarly, Nyanza Textiles has also been allocated spares,
but production is still constrained by shortages of chemicals and dyes.There has also been inadequate attention to industrial linkages. An allo-
cation was made to the Uganda Electricity Board, for example, to importconductors, which could have been produced domestically by the Uganda CableCorporation if imported inputs had been available.
5.9 There is also scope for streamlining the existing licensing pro-cedures. From the point of view of the industrial applicant, especially inthe private sector, the present system is very bureaucratic, cumbersome and
- 79 -
time consuming. License applications 5 must be submitted to the Ministryof Industry after being verified by the respective commercial banks. (Eachapplication must be completed with five copies and accompanied by one copyeach of a summary statement, the seller's pro forma invoice, certificate oforigin for manufactured goods imported from Kenya and Tanzania, tax clear-ance certificate, and by the post-importation refundable bond equivalent to5% of the value of the license 6 .) The Ministry of Industry endorses thatthe applicant is a registered importer, and then the papers are submittedto the Advisory Board of Trade, which checks on pricing and other technicaldetails 7 . Final approval is then made by the National Allocation Commit-tee under the Ministry of Planning for aid-financed imports, and through animport licensing committee chaired by the Ministry of Commerce for importsto be financed out of "free" foreign exchange. However, as already noted,the final release of "free" foreign exchange is actually made only afterendorsement from PEAC, and at the moment, virtually no licenses.are beingendorsed. Therefore the whole licensing procedure, which takes about fiveto six weeks to complete, has become largely a matter of form.
5.10 Domestic inputs and infrastructure. Although shortages of im-ported inputs and spare parts are at the moment the most evident constrainton industrial production, the longer-term decline in the sector also re-flects poor performance elsewhere in the domestic economy, especially inagriculture (as a major supplier of raw materials and as a market) and thesupporting infrastructure (transport, energy and water supply). The poorperformance of these sectors was, of course, itself in part due to theshortage of foreign exchange, and in the case of agriculture and transport,contributed significantly to the decline in export earnings. There is,therefore, no clear distinction between foreign exchange and domestic con-straints, but rather a mutually reinforcing deterioration.
5.11 The declining levels of agricultural production, coupled withincreased smuggling, have naturally enough had a particularly severe impacton the agro-processing industries (e.g., coffee curing, cotton ginning,sugar manufacture, tanning and milk production), as well as on industriesusing these processed products as inputs. For example, the collapse ofcotton output has also affected production of textiles, edible oils andsoap (the last two, through the shortage of cotton seed). Similarly,declining official purchases of tobacco have affected cigarette manufac-ture, and shortages of hides and skins have affected the leather and shoeindustries. The basic reasons for the poor performance of agriculture
5/ Exempted from the import licensing procedures are governmentimports, gifts, supplies for diplomatic and UN missions, andgoods imported for capital formation or on a loan-account basis.
6/ To be deposited with the respective commercial banks which, inturn, transfer the deposits to the Bank of Uganda.
7/ Pre-shipment inspections are now also made by the General Super-intendence Company, to reduce the possibility of over-invoicingand ensure that the goods meet required specifications.

- 80 -
-- including distorted pricing policies, 8 inadequate supplies of inputs
and incentive goods, and ineffective marketing channels -- were discussed
in some detail in Chapter 4 of this report. Suffice it to say here, that
successful implementation of an agricultural rehabilitation program will be
a basic prerequisite for re-establishing a strong and viable industrial
sector.
5.12 Transport bottlenecks, both domestically and on international
routes, are also causing serious delays in the delivery of crucial inputs
to the industrial sector and of final products to markets. As discussed in
Chapter 6 of this report, Uganda's transport network deteriorated markedly
over the past decade, due in large part to inadequate road maintenance, the
loss or damage of road vehicles, especially during and after the 1978-79
war, and the impact of the breakup of the EAC on railway and air services.
Industries most seriously affected by transport bottlenecks are generally
those whose inputs and outputs cannot be readily stocked so that frequent
collection and distribution is required (e.g., bakeries and milk proces-sing). Transport disruptions have also led to substantial price differ-
entials, both between Uganda and overseas markets, and between different
regions and markets within Uganda. As a result, rehabilitation of thetransport sector will not only improve the delivery of goods, but also help
reduce industrial costs.
5.13 The overwhelming majority of Ugandan industries are using im-ported fuel oil as an energy source for production. This generally re-
flects the fact that most plant in the sector was installed before the
sharp increase in petroleum prices from the mid 1970s.9 With the recent
upward adjustment of domestic retail prices for petroleum products, follow-
ing the June 1981 devaluation, many firms are finding it increasingly dif-
ficult to raise sufficient working capital to maintain regular fuel sup-plies.1 0 Therefore, given the heavy foreign exchange burden imposed by
petroleum imports, a burden that would rise substantially as productionlevels increase, serious consideration needs to be given to the conversion
of industries now using oil to produce their own electric power and process
8/ Two relevant examples are worth noting here. For milk, while the
ex-factory price was recently increased from U.Sh. 5 to U.Sh. 50per liter, the producer price has remained unchanged at U.Sh. 3per liter. As a result, the Uganda Dairy Corporation is unableto purchase domestic milk supplies, and is operating its plants
on imported milk powder. In the case of the tanning industry,while the price of raw hides was recently increased from U.Sh. 12
to U.Sh. 20 per kilogram, this is still well below comparableprices in Kenya (especially at the prevailing unofficial exchangerate) and as a result, most hides and skins are still smuggled
out of the country.
9/ Indeed, a number of factories, including Nyanza Textiles, actu-
ally switched from electricity to fuel oil for raising steam inthe early 1970s.
10/ At the Tororo Cement Factory, for example, the fuel costs of
operating at 20% capacity utilization increased more than ten-fold from U.Sh. 45,000 to U.Sh. 500,000 per day.

- 81 -
steam to mains-supplied electricity for these purposes. As outlined inChapter 7, Uganda at present has a surplus of electric generating capacityand abundant potential for further development of hydro-electricity asrequired. Although detailed appraisals of the various options for expan-sion of generating capacity are still to be completed, it seems assuredthat this could be achieved at reasonable cost, and with substantial netsavings of foreign exchange over the longer term. Even so, individual pro-posals for industrial energy conversion would still have to be carefullyreviewed, to ensure that the initial import costs could be justified withinpresent foreign exchange constraints, and that other bottlenecks would notprevent the operation of the plant at economic levels. Where conversion isjustified, the Government may want to consider introducing tax inducements(e.g., accelerated write-offs) to help overcome the financial constraintsfacing individual firms. In other instances, where major rehabilitationwould be required before conversion bacomes economic, it may be necessaryto delay investment in conversion for a number of years.
5.14 Industrial parastatals. The structure of Uganda's industrialsector was severely disrupted by the progressive nationalizations of theearly 1970s, and the departure of many of the -country's best entrepeneurs(both Asian and non-Asian) after the "economic war" of 1972. Many aban-doned industries were allocated to inexperienced private owners whileothers were added to the already burgeoning parastatal sector. Almostovernight, the Uganda Development Corporation (UDC) was faced with theadditional operational and management problems of more than 100 companies.In 1974, many of UDC's more viable companies were removed from its controland set up as independent parastatals or subsidiaries, further weakeningUDC's financial position and stretching the limited managerial capacity ofthe country. This whole process was completed in a chaotic and haphazardmanner, with no formal transfer of shares, compensation, or adequate provi-sion for financial control. Furthermore, the management of parastatalsbecame increasingly subject to political interference: many managerialpositions were filled by political appointees and annual reports (when pre-pared) were submitted directly to the Secretary of the Treasury. As aresult, the effective control of the Boards of Directors, which formallyhad responsibility for operational decisions, was undermined.
5.15 There are a number of public enterprises (Nyanza Textiles, forexample) that have managed to maintain an acceptable standard of perform-ance under very difficult economic conditions. However, in general, theindustrial parastatals remain in disarray. Recognizing the inherited prob-lems, the present Government has indicated its commitment to change in boththe structure and management of the parastatal sector. In particular,various policy statements over the past year have stressed that: (a) pre-vious owners of abandoned or expropriated properties are welcome to returnand take over management of their operations, usually under joint ownershiparrangements and pending the settlement of compensation disputes;11 (b) anumber of industrial parastatals will be closed down or handed over to theprivate sector; (c) the remainder of the parastatal sector will be reorgan-ized, to improve efficiency and restore financial viability (especially for
11/ The most notable examples of this to date are the return of theMehta and Madhvani Groups, both of which were previously involvedin a number of industrial activities including sugar processing.
- 82 -
UDC); and (d) parastatal positions will be filled on the basis of technicalqualifications and competence. This is a promising start. However, inpractice these policy commitments will be difficult to implement, and manyof the more thorny problems -- including ownership, compensation and debtsettlement -- can be expected to take a number of years to resolve. In the
meantime, it is important to proceed with the more routine tasks of updat-ing records of financial accounts and operating performance, to provide abasis for taking decisions on both the day-to-day functioning and longer-term structure of the industrial parastatal sector.
5.16 Trained manpower. We have already noted the impact of the mili-
tary regime on the management of parastatals. However, the "economic war"of 1972 also decimated Uganda's already limited supply of technical person-nel, especially at the middle and high levels. This, together with inade-quate training, poor labor discipline, and shortages of spare parts, led topoor maintenance of existing plant and equipment. As a result, plant and
equipment in most industries is now in very poor condition. The shortageof technical expertise also makes it difficult to accurately estimaterehabilitation requirements and related costs.
5.17 The present staffing constraints, managerial as well as techni-cal, need to be assessed more thoroughly for each industry, and appropriate
programs of recruitment and training developed to fill the most criticalgaps as soon as possible. To help improve the morale of existing caders,as well as to encourage trained Ugandans overseas to return, it will benecessary to establish a more professionally-oriented and rewarding systemof salaries and compensation, career development and working conditions.Present staffing imbalances, both between and within industries, also needto be addressed, to ensure that the most competent staff are assigned topriority tasks, and that technically qualified personnel are utilized inappropriate productive enterprises, rather than in administrative func-tions.
5.18 Even with the best of local efforts, it seems inevitable thatsignificant inputs of technical assistance will be needed throughout theindustrial sector for a number of years to come. Government recognizesthis need and welcomes such assistance. When technical assistance is pro-
vided through aid programs, it raises no major problems. However, diffi-culties have arisen for expatriates who are not funded under aid programs,because the Government is yet to put in place an effective system to faci--litate partial payment of their salaries in foreign exchange, and promptremittance of such salaries and fees to dependents. Since it is inevitablydifficult to guarantee these payments in the current tight foreign exchange
situation, the most promising short-term solution is for the Government toseek most of the required technical assistance under aid-funded arrange-ments.
5.19 Creditworthiness. Most firms in the industrial sector continueto report shortages of working capital and inadequate access to credit fromdomestic commercial banks. In general, this reflects problems of credit-worthiness, rather than any general shortage of liquidity. The extent ofthis problem seems to vary across the sector, dependc, on the firm's size,ownership status, equity base and debt portfolio. Takit' employment as anindicator of size, large firms (employing 50 or more worker appear to be
- 83 -
suffering most from inadequate domestic credit. Nationalized industriesare also having difficulty in obtaining supplementary working capitalcredit because they cannot provide collateral (due to the failure in manycases to formally transfer ownership). The parastatal sector in generalhas a weak equity base, and with low production and financial indiscipline,substantial losses and debts were accumulated during the 1970s. This situ-ation has been compounded, at least for the short term until assets arerevalued, by the impact of the June 1981 devaluation on industrial costs.As an illustration of the magnitude of these creditworthiness problems,arrears of industries with the Uganda Commercial Bank as of October 30,1980, stood at U.Sh. 1,321 million. Of this, about one-quarter was accu-mulated since 1977. At the enterprise level, the Tororo Cement Factory,for example, had an unpaid debt to commercial banks of U.Sh. 90 millionin mid 1981. Many industries are also indebted to the Treasury for largeoverdue tax payments. For example, in mid 1981, the Uganda Leather andTanning Industries and the Tororo Cement Factory owed the Treasury U.Sh. 13million and U.Sh. 12 million respectively in unpaid sales taxes.
5.20 In October 1981, the Government raised the standard lending ratefor industry from 12% to 14% per annum. This is certainly not excessive inrelation to historical inflation rates and repayment risks. On the otherhand, maturities are generally very short, averaging around 12 months,including a 3-6 months grace period. However, because of debt repaymentproblems, most loans require rescheduling.
5.21 Inevitably, as industrial activity begins to pick up, an in-creased supply of credit, especially for working capital, will be re-quired. Initially this will be difficult for most firms to manage, giventheir present creditworthiness problems and the inevitable lags untilrevenues are generated. Therefore, commercial banks may have to exploreoptions for providing longer-term credit, posssibly with concessionaryinterest rates during the initial rehabilitation period. The Government,for its part, should consider options for assuming or rescheduling out-standing commercial debt and tix arrears, as well as providing temporaryguarantees of commercial loans to industry for working capital.1
5.22 Price and tax policies. The Government recently took a majorinitiative to improve the financial position of the industrial sector, byremoving price controls on virtually all industrial products. (Guidelineson pricing are still given by the Ministry of Commerce, and some parasta-tals reportedly have been reluctant to raise prices beyond these levels.The Government has, however, clarified that these guidelines are only in-tended to help firms revise their cost estimates following the devaluationof the Ugandan shilling, and are not intended as ceilings.) The impact ofthis decision on ex-factory prices has been dramatic. For example, sinceJune 1981, the ex-factory price of bread has risen from U.Sh. 9 to U.Sh. 60pu: ,)af, of cigarettes from U.Sh. 20 to U.Sh. 87 per packet, and of beer
12/ Government guarantees have recently been provided to permit para-statals to provide local cover for items imported under the IDAReconstruction Credit.

- 84 -
from U.Sh. 80 to U.Sh. 240 per bottle.13 However, as most commodities
were already selling at substantially higher than controlled prices in the
"magendo" economy, there has so far been little impact on the actual pricepaid by the consumer (except, of course, for those who had preferential
access to goods at controlled prices). The decontrol has meant, however,
that the sales profits are now being directed back into the official eco-
nomy, in the form of government taxes or retained earnings of the producing
units.
5.23 For the moment, the Government has decided to absorb most of the
surplus between producer costs and market prices through higher sales and
excise taxes. As a result, the effective tax rates are now exceptionally
high, averaging around 40%-50% for most industries and ranging up to more
than 600% for beer and cigarettes. In general, these exceptional rates are
probably justified under the present exceptional circumstances, given the
need to contain the Government's budget deficit and the evident capacity of
the market to bear the resultant price levels. There are, however, indivi-
dual commodities for which some downward adjustment in sales and excise tax
rates, and possibly temporary exemption from corporation, withholding and
selective incomes taxes, needs to be considered (e.g. sugar, cement and
steel). The Government itself has recognized this in the case of sugar,where the sales tax has temporarily been deferredl 4 to permit a sales
price of U.Sh. 130 rather than U.Sh. 220 per kilogram (as compared to a
pre-June 1981 official price of U.Sh. 90 per kilogram and market price ofU.Sh. 350 per kilogram, and the present import price from Kenya of U.Sh.150 per kilogram). More generally, it will be important to keep the tax
rates under careful review to ensure that prices of industrial goods can be
adjusted down as production recovers, while still providing the producingunit with adequate profits for reinvestment and growth. This is particu-
larly important for those basic consumer goods which weigh heavy in theexpenditure patterns of the population, and are generally unaffordable atpresent wage and price relationships.
5.24 Finally, a brief word about longer-term industrial strategy.
Uganda's small domestic market and cost structure will eventually impose a
limit on industrial expansion, especially of import-substitution for inter-
mediate products, machinery and consumer durables. For this reason, and
because of the uncertain market and price prospects for many of Uganda's
primary products, adoption of an appropriate export promotion policy fornon-traditional items needs to be considered in the not too distant
13/ The significance of these prices can perhaps best be seen in
relation to the minimum wage: at its present level of U.Sh. 950
per month, it can purchase only 16 loaves of bread, 11 packets of
cigarettes or 4 bottles of beer.
14/ The Government's decision to defer rather than temporarily sus-
pend these tax payments adds an unfortunate element of uncer-
tainty to the sugar industry (especially as it has been
suggested that the deferred payments may be adjusted against the
Government's equity contribution), and could well lead to an even
higher effective tax rate if and when the taxes are eventually
collected.
- 85 -
future. Given Uganda's comparative advantage, this would probably be based
initially on a range of processed agricultural products (e.g., meat, canned
foods, vegetables, fertilizers, textiles and handicrafts) as well as pos-sibly some light manufactured goods. These exports could be marketed inthe traditional markets of neighboring African countries and in the rapidlyexpanding markets of the Middle East. In addition to earning valuable for-
eign exchange, these trading contacts will help expose the industrial sec-tor to the rigors of international competition, encouraging more efficient
production and providing opportunities for product innovations and techni-
cal progress. As already noted in Chapter 3, a similar process would alsobenefit Uganda's import-substitution industries, through an eventual re-duction in quantitative import restrictions and the overall level of indus-trial protection. Technical innovations can also be transferred throughdirect foreign investments and management/technical contracts. However
this is only likely to happen, on any significant scale, once a clearer andmore coherent investment policy (for both domestic and foreign investors)
is seen to be effective, in line with the Government's already declared"mixed economy" strategy for industrial development. Such a policy wouldhave to provide the investor with confidence that-his monpy is secure, and
also provide Uganda with safeguards to ensure that appropriate technologyis in fact transferred at reasonable cost, and used to develop the coun-try's indigenous technical capacity.

- 86 -

-87-
Chapter 6
TRANSPORT
A. Introduction
6.1 In the early 1970s, Uganda had a broad-based and reasonably well-developed transport system. The road network was commonly regarded as one
of the best in Sub-Saharan Africa, and through the East African Community,Uganda shared access to an effective network of railway, port and airlinefacilities. As a landlocked country, Uganda has always been dependent onits neighbors, especially Kenya, for movement of its imports and exports,and the related strategic concerns have tended to dominate transport prior-
ities.
6.2 The availability and quality of transport services deterioratedrapidly during the 1970s. There were three major reasons for this. First-ly, the transport sector suffered under the military regime due to: (a)
the deportation of Asians, who had provided much of the sector's managerialand technical manpower; (b) political alienation from many of the tradi-tional suppliers of equipment and spare parts for development and operationof the system; and (c) the low priority accorded to the transport sector,especially for maintenance, in resource allocations. Secondly, the breakupof the EAC in 1977 had a devastating impact on Uganda's transport system,especially for international trade. Almost overnight, Uganda lost virtu-ally all railway rolling stock and aircraft, and her part-ownership rightsto railway and port facilities in Kenya and Tanzania. This not only neces-sitated heavy new investments by Uganda, but led to substantial disruptionsand cost increases on international traffic movements. Finally, the domes-tic transport system was adversely affected by the impact of the 1978-79war and widespread looting which followed. The motor vehicle and aircraftfleets were decimated; terminals, workshops, offices, and warehouses weredamaged; and most movable objects -- including supplies, spare parts, fur-niture and records -- were looted or vandalized.
6.3 Rehabilitation of Uganda's transport system is generally recog-nized as one of the key requirements for economic revival in the country.However, to date, progress has been slow and uneven, reflecting the generalcountry situation, shortages of foreign exchange, and technical and admini-strative constraints. The following two sections will review the presentconditions and problems facing the major transport modes, and outlineappropriate priorities for rehabilitating the system, and for rebuildingthe country's capacity for effective transport coordination and planning.
B. Present Conditions and Problems
6.4 Roads. Uganda has over 27,000 km of roads, of which 2,000 km arepaved. As shown in SA Table 9.1, the Ministry of Works is responsible for7,000 km of major and trunk roads, while the remaining 20,000 km of second-ary and tertiary roads are maintained by local authorities. Although tae

- 88 -
coverage of the highway network is generally adequate,l road conditionshave deteriorated substantially during the 1970s, due to the lack of effec-tive maintenance and rehabilitation. The situation is particularly severe
for trunk roads, of which only about 6% have been resealed or regravelledsince 1972. On those trunk roads serving transit traffic (to Rwanda, Bu-rundi, Zaire, and Sudan), high volumes and heavy loads have added to theproblems, causing numerous structural deficiencies and making the roads
difficult and dangerous for traffic. For the secondary road network, thesituation is somewhat better, due to the sharp fall in vehicular traffic in
recent years, and the use of an excellent road building material, murram,in construction. Nevertheless, in many areas, the secondary road surfaceshave become very rough, making travel slow, and on some isolated sections,the gravel has worn or washed off, making the roads impassable, parti-cularly during the rainy season.
6.5 Over the past three years, there has been no periodic repair orrehabilitation program. Even routine maintenance -- such as grass cutting,pothole filling, and drain and culvert clearing -- has fallen off mark-edly. Although direct damage to the network from the 1978-79 war wasremarkedly slight, the resultant looting severely damaged workshop facili-ties and depleted the stock of maintenance equipment, spares, vehicles, and
tools. For roads which are the responsibility of local authorities, re-placement of hand tools would by itself make a major contribution to roadrepair and maintenance, as traditionally, labor is willingly supplied bylocal villagers.2 At the district level, the Ministry of Work's mainte-nance program could also usefully benefit from additional supplies, al-though this would have to be matched by substantially higher funding ofwages to attract suitable labor and reduce the incidence of tool thefts bymaintenance workers. But, at the center, the capacity of the Ministry ofWorks to manage and coordinate road maintenance efforts is very weak. Thisreflects the lack of vehicles 3 and fuel for supervision, the general
1/ There are, however, areas where the effective capacity of theroad network is restricting transport movements. Examples ofthis are feeder roads providing access to large-scale agricul-tural activities (often the responsibility of the estates them-selves), roads in the Mount Elgon coffee growing area, and badstretches of roads in densely-populated areas (especially around
Kampala) which restrict public passenger transport.
2/ Under customary law in many areas, villagers can pay their taxesin the form of community work, such as road maintenance, ratherthan cash.
3/ Out of 98 vehicles available in the Ministry before the1978-79 war, 71 were looted, leaving 17, most of which areunserviceable.

- 99 -
shortage of staff, especially executive engineers, in the Ministry, 4 theabsence of practical field experience in recent years, and low staff mor-ale. At present wage levels, many Ministry staff have left their jobs,while others only work part-time.
6.6 Road transport. As shown in SA Table 9.2, the vehicle fleet hasbeen severely depleted in recent years, falling from around 45,000 at thestart of the 197 0s to 35,000 in 1978, and then further to below 26,000 in1979 and 1980. With the overthrow of the military regime, many vehicleswere taken out of the country, while others have been damaged ordestroyed. The reduction in vehicle numbers was most severe for cars andheavy commercial vehicles. Use of road transport has also been curtailedby shortages (and high prices) of fuel and spare parts, as well as theclosing of many repair and maintenance facilities.
6.7 Public passenger bus services are provided by two parastatalorganizations -- Uganda Transport Company (UTC) and People's Transport Com-pany (PTC) -- under the jurisdiction of the Ministry of Transport. UTC,which provides bus services in Kampala and also on some routes in Westernand Southern Uganda, has a present fleet of 160 buties, of which 96 areoperational, 36 are grounded for repairs and 28 are to be scrapped. PTCoperates on routes in Eastern and Northern Uganda with a fleet of 56 buses,of which only 23 were operating in March 1981. There has so far beenlittle attempt to standardize bus makes, with UTC using five differentmakes and PTC six. In addition to these parastatals, there are also a num-ber of private bus companies (160 in 1979) licensed to operate over speci-fied routes. However, due to the lack of spare parts and high costs, manyof these have now gone out of business. Overall, many authorized busroutes are presently unserviced, and with the severe shortage of citybuses, passenger waits of up to two hours are common in both Jinja and Kam-pala.
6.8 The freight transport industry is also dominated by two parasta-tal organizations. For internal movements, the Uganda Cooperative Trans-port Union (UCTU) acts as an "apex" organization for the cooperatives,importing vehicles for them and providing additional services with its own
4/ The Ministry has 83 established positions for professionals, and.another 33 are proposed. However, only 53 positions were filledin mid 1981. The situation in the road maintenance section wassomewhat better with staff in 12 of 16 positions (23 proposed),although only 1 out of 7 senior executive engineer positions wasfilled.
5/ Shell and BP, for example, had only 59 operating stations inMarch 1981, compared to 142 in 1970.

- 90 -
fleet of trucks. 6 With some rebuilding after the 1978-1979 war, UCTU nowhas a fleet of 127 vehicles, of which 80 are operational. Normally, nearly80% of UCTU's business is the transportation of coffee to Kampala, supple-mented by the distribution of agricultural inputs and basic consumer goods
in rural areas. However, given the prevailing conditions in recent years,
UCTU's vehicles have been used more to move relief supplies to the Karamojaand Arua regions, to move food to Kampala, and for military transport.UCTU is now also expecting to receive some new trucks and trailers to move
coffee to Mombasa. This transit road traffic has in the past been handled
by Kenyan companies or the Ugandan parastatal, Transocean. Transocean'soriginal fleet of 200 trucks and trailers was reduced to 62 after the war,
and only about 42 are roadworthy at the present time. So far, no newvehicles have been allocated to Transocean, and with increasing competitionfrom UCTU, the company's present financial difficulties are expected to get
worse.
6.9 Vehicle imports have been given high priority by the Governmentin its allocation of free foreign exchange and use of external financing.
During 1981, fcr example, the Coffee Marketing Board (CMB) arranged a bart-er deal of coffee for 600 commercial vehicles, intended to help move coffee
exports. The initial aim was to sell some 434 vehicles to coffee proces-sors and cooperatives, and use the other larger trucks for long-haul trans-port to Mombasa. By mid 1981, 368 vehicles had been received, of which 214were allocated to coffee processors and cooperatives; of the rest, 110 werediverted to other uses (including 47 for the Ministry of Defense), and 44have been retained by CMB. While this emphasis on increasing the vehiclefleet is understandable, and in many cases justified by the importance of
transport bottlenecks, the number and type of vehicle imports could be bet-ter tailored to present conditions. Firstly, one of the highest prioritiesshould be to improve short-distance rural transport, linking farms to pro-cessing units and markets. Given the generally small loads involved,emphasis should be given to increasing the supply of bicycles and smallpickups rather than larger trucks. Bicycles, together with additionalbuses, could also help relieve the present bottlenecks in urban passengertransport. Secondly, on the longer routes, the railway provides a far more
economic option than road transport. Yet, emphasis is still being placedon increasing the fleet of long-haul trucks, while the available railwaycapacity is being underutilized. Finally, high priority needs to be givento imports of spare parts, to repair the existing fleet and to ensure that
all vehicles (old and new) can continue to be maintained. Given thelimited foreign exchange available, this will inevitably mean some further
restriction on imports of new vehicles.
6/ UCTU also repairs and maintains its own vehicles and thosebelonging to its member cooperative organizations. Presently
this is being done from a makeshift workshop. A new workshopstarted in 1977 at Kowmpe is about 25% complete and most machin-
ery has been lying in boxes for about four years, awaitinginstallation. Completion of this workshop should be given highpriority, and its facilities should be made available to othertransporters who suffer from similar inadequacies in maintenance
capacity.

- 91 -
6.10 Rail transport. Until 1974, rail services in Kenya and Ugandawere organized as a single operating system within the East African Rail-ways Corporation, although each country-system separately collected revenuefor goods loaded in that country. Train and traffic control in both coun-tries was centered At the Nairobi headquarters, where locomotives and rol-ling stock for the system were kept and maintained. However, following anumber of disputes over railway services and charges, and with increasingpolitical tension between the two countries, the unified system began todisintegrate. This was formalized in 1977, when the EAC broke up and theUganda Railways Corporation (URC) was formed. However, Uganda remains vit-ally dependent on Kenya for use of the track to Mombasa, provision of addi-tional wagons and heavy-duty locomotives (only Kenyan locomotives areallowed to be used on the Kenyan portion of the track), and all major ser-vicing. Although the Government is keen to open up an alternative transitroute through Tanzania (see discussion under water transport), this wouldnot be able to handle the volume of traffic that can be expected with a re-vival in economic activity, and would be less economic than the Kenyaroute. Therefore, cooperation with Kenya is likely to remain a key elementin Uganda's overall transport strategy. In this context, the recent im-provement in relations between the two countries is to be welcomed. Inpractical terms, this has led to a Kenyan loan to help finance the clear-ance of goods at Mombasa port and their movement to Uganda, the rental of
Kenyan rolling stock to URC,7 and an increase in the number of trains bet-ween Uganda and the coast to five per week in each direction. However,there remains an urgent need to address the broader issues relating to thejoint organization and control of railways operations, including the ratio-nalization of interchange and revenue agreements between the two coun-tries. Only after this has been done, can a substantial improvement inrailway performance be expected.
6.11 The condition of the railway, while generally adequate for pres-ent traffic levels, needs to be rehabilitated. Although the track was notseriously damaged during the 1978-79 war, it is estimated that over 70% isnow sub-standard, due to its long life (more than 50 years in some cases)and inadequate maintenance over the past ten years. Many sections are alsotoo light and not structurally suited to modern locomotives and heavierwagon loads. This is not considered a major problem at present. However,bottlenecks may develop as traffic levels recover. The more immediatepriority is to repair damage caused during the war to supporting infra-structure, such as stations, offices, communications equipment, and servicevehicles. Signalling, apart from simple mechanized signals at stations, isvirtually non-existent and the communications system relies on radio callsand telephones. The result has been to strain the already limited adminis-trative and operational capacity of the fledgling Uganda Railways Corpora-tion.
6.12 The situation regarding rolling stock and locomotives has im-proved somewhat in recent years. Following the breakup of the EAC,
7/ The loan of rolling stock probably reflects in part the temporarysurplus of rolling stock in Kenya due to the economic slowdownin that country, and some may be withdrawn if Kenya's demandincreases.

- 92 -
Uganda had been allocated only 137 units of rolling stock (it had expected925), and all of these have now been retired. However, with new acquisi-tions of 380 covered wagons, 20 livestock wagons and 20 passenger coaches,the total rolling stock park has been increased to 420 units. In addition,Kenya has made available an additional 90 tank cars and several hundredcovered and open wagons on a rental basis. If anything, Uganda presentlyhas excess rolling stock capacity (except for passenger services 8), al-though this could quickly be absorbei as traffic levels pick up. As re-gards locomotives, Uganda was allocated 49 from the EAC park, of which allof the steam locomotives (28) have now been retired. With the net acquisi-tion of 25 new diesel locomotives, the park has been increased to 46 withanother 23 on order. Although more than one-half of the locomotives arepresently out of service for repairs or because of a lack of spare parts,the availability of locomotives is still adequate for domestic services.The immediate priorities for both rolling stock and locomotives are to com-plete the Nalukolongo workshop, so that major repairs can be undertakenwithin Uganda, 9 and to import those spares needed to keep the existingcapacity in operation.
6.13 With the breakup of the EAC, the number of passengers handled bythe Ugandan railway system fell sharply (see SA Table 9.3). Freight traf-fic had begun to decline much earlier, and by 1978, the volume of goodsforwarded and received had fallen to 13% and 28% respectively of the peaklevels reached in the early 1970s. Although there has been some recovery,especially in passenger service over the past two years, the railway isstill very much underutilized. While this reflects in part the generaldecline in economic activity, it is also due to a diversion of traffic toroad transport. For example, of the coffee exports moved to Mombasa, railtransport accounted for only 29% in 1979/80 and 53% in 1980/81, compared toover 70% in the early 1970s. Similarly, the proportion of fuel oil importsmoved by rail from Mombasa to Jinja has fallen from almost 100% to only10%. This trend is cause for concern: use of road transport is signifi-cantly more expensive (on average by about 100% under present conditions,but possibly by as much as 250% with improved railway operations), and hasresulted in deteriorating conditions on Uganda's trunk roads, especiallyfrom transit traffic travelling through to Rwanda, Burundi, Zaire, andSudan.10 Admittedly, the number of trains between Uganda and the coastallowed by Kenya is still limited to five per week in each direction (ascompared to 30 in the early 1970s). But even so, the available capacityis not being effectively utilized, with wagons often lying idle for ex-tended periods or travelling without full loads. This cannot be adequately
8/ With only 20 passenger coaches presently available, URC has beenusing 20 of its livestock wagons for commuter services in theKampala area. Some 84 passenger coaches are on order from theGerman Democratic Republic, but their delivery is uncertain.
9/ Minor repairs are presently undertaken at the Tororo workshop.
10/ The volume of transit traffic moving through Uganda in 1980 wasestimated at 200,000 tons, and virtually all of this went byroad. In the early 1970s, most of this transit traffic wastransported by rail.
93
explained by bottlenecks on the use of the railway or any lack of potentialdemand. As the diverted traffic is often moved by Kenyan or Kenya-basedcompanies, the higher cost is paid for by Uganda in foreign exchange. TheGovernment, therefore, needs to take strong action to ensure that truckingvested interests do not cause an unnecessary diversion of long-distancetraffic to road transport, and that, instead, the railway is used to thefullest extent possible.
6.14 Water transport. Inland water transport, once a major means ofmoving passengers and freight, has largely come to a standstill. Thisreflects: (a) disruptions caused by flood damage in 1962 and continuedhigh water levels; (b) the breakup of the EAC, which resulted in the trans-fer of responsibility for inland water transport to URC, where it was givenno separate institutional or administrative identity; and (c) increasinglyeff-ctive competition from land transport. Except for a survey completedin 1976, little has been done to revive water transport services. Thereare now no regular services on the lakes (Albert, Kyoga and Victoria) orNile, and virtually all vessels have sunk or remain unserviceable. Oneconsequence of this neglect has been the isolation of the Sese Islands inLake Victoria, whose population now has no regular connection to the main-land.
6.15 The major preoccupation of Uganda's approach to water transportin recent years has been to develop an alternative route to the coast.This reflects both political concern that Uganda should not be solelydependent on Kenya, and economic concern regarding the impact of congestionand clearance delays at Mombasa port. The alternative route via Lake Vic-toria to Tanzania was utilized to a limited extent before the breakup ofthe EAC and was reopened immediately after the 1978-79 war for transportingcoffee exports.11 However, use of this route stopped once again when theJinja-Mwanza ferry, owned by Tanzania, broke down in 1980. Uganda orderedthree new ferries in 1978, one of which is now under construction at PortBell. These are intended to provide ferry services from Jinja, andpossibly also Port Bell, to Mwanza and then connect by rail to the ports atDar es Salaam and Tanga. (There have also been periodic discussions onopening up a new railway link via Musoma to Tanga, but this does not seemto be under active consideration at the present time.) Under normalcircumstances, the Tanzania route is not as economic as the Kenya route,and would not be able to handle the full volume of transit traffic,particularly once the Ugandan economy begins to revive. Therefore, on eco-nomic grounds, top priority should be given to strengthening the Kenyaroute, with additional investments in the Tanzania route (for ferries,terminals and rail links) limited to the minimum level considered compat-ible with Uganda's strategic concerns.
6.16 Air transport. The airport system consists of an internationalairport at Entebbe and eleven domestic airfields, of which eight were oper-ational until June 1981 when all domestic air services were suspended.Entebbe airport, which was completed in the mid 1970s, has three tarmac
11/ Seven thousand tons of coffee were moved this way in 1979/80,although it is not clear how much of this was actually exported,and how much was used to repay Tanzanian debts.

- 94 -
runways capable of handling wide-body jet aircraft but lacks runway light-ing for night operations. The airport has no facilities for regional airtraffic control, which is presently handled from Kenya. Although the pas-senger terminal building is relatively new, it suffered extensive damageduring the 1978-79 war and now needs structural reconstruction. Otherfacilities at the airport which were destroyed, damaged, or stolen includenavigational aids, meteorological and fire fighting equipment, and the con-trol tower. The war also interrupted construction of a new cargo terminalwhich remains unfinished due to a lack of funds. Upcountry airports havefor the most part grass or murram landing strips, and small terminal struc-tures which have not been maintained for lack of activity. Only one up-country airfield at Soroti, the site of a regional air training school, hasa control tower; most have no grass cutting equipment, and navigational andsafety aids have been looted or remain unserviceable.
6.17 Uganda Airlines was formed in 1976 and became the sole nationalcarrier with the collapse of East African Airlines in 1977. During the1978-79 war, the airline lost its two Boeing 707s, four smaller propelleraircraft were damaged, and its cargo plane was requisitioned by theMinistry of Defense. Since the war, Uganda Airlines has replaced its twoBoeing 7 07 s and resumed limited international services. Domestic and regi-onal services were also resumed using two Fokker Friendships and one TwinOtter; but, as already mentioned, domestic services have now been sus-pended. In 1980, the first full year of operations since the war, the air-line carried 41,000 domestic and 43,000 international passengers, and 2,000tons of cargo. However, the company's financial position was severelyeroded by high fuel costs, service disruptions resulting from aircraft di-versions for non-scheduled purposes, and the non-payment of bills, especi-ally by public sector customers.
6.18 The first priority in the air transport subsector is to restoreEntebbe airport to ICAO-required opereaional standards. At the moment,only three foreign air carriers are using Entebbe, but this could increasesubstantially once the airport is upgraded and the country situation, es-pecially for tourism, improves. Under these conditions, Uganda Airlinesshould seriously consider whether it is necessary to expand internationalservices. On economic grounds, even the two aircraft presently used forthis purpose should probably be sold off. Instead, as circumstances per-mit, Uganda Airlines should re-establish and consolidate its domestic andregional services, for both passenger and cargo traffic. With the presentforeign exchange and staffing constraints, this effort will initially haveto be focussed on improved maintenance and aircraft operations rather thanfleet expansion.
C. Rehabilitation Priorities
6.19 Rehabilitation of Uganda's transport system was emphasized in theCommonwealth Report as one of the key requirements for economic revival.The Government, for its part, has also recognized the importance of thetransport system, by giving high priority to imports of road vehicles, andrailway rolling stock and locomotives. However, although these importshave helped to increase the overall capacity of the transport system, manybottlenecks remain. In part, this reflects poor management of the resour-ces available, especially: (a) diversion of trucks and aircraft for

- 95 -
non-rehabilitation purposes; (b) under-utilization of the available railwaycapacity; and (c) over-investment in lake ferries, long-haulage trucksand larger,aircraft for international routes.
6.20 The Government's ten-year investment planl2 for the transportsector is, perhaps inevitably, highly ambitious. For the initial rehabili-tation period (January 1981 to June 1982), it includes as many as 90 pro-jects costing US$290 million, of which US$220 million is in foreign ex-change. Overall, taking into account the virtual absence of field work andeffective transport planning in recent years, the plan is a useful firststep in listing the resource requirements -- for new investments, rehabili-tation and maintenance -- of the transport sector. However, a number ofweaknesses in approach are apparent:
(a) the plan is intended to restore the capacity of the transportsystem to levels attained in the early 1970s, without due regardfor subsequent changes in costs or patterns of economic activity,and the impact of the breakup of the EAC;
(b) little indication is provided of project priorities, taking intoaccount the inevitable resource and administrative constraintswhich will restrict the size of the program for the immediatefuture;
(c) greater attention will have to be given to linkages between thetransport sector and productive activities, as well as to inter-modal coordination; and
(d) the program will have to be supported by more detailed analysisof present traffic levels and network conditions, especially inthe roads subsector.
6.21 The Government is presently reviewing the investment plan for thetransport sector with these concerns in mind, and it is expected that thenew two-year economic recovery program will more clearly reflect presentresource constraints and priorities. In particular, it will be necessaryto extend the rehabilitation phase over a longer period (say, through 1985)and select only priority projects which: lead to more efficient use of thepresent infrastructure and transport fleets, especially through strengthen-ing maintenance and repair capacity; remove critical bottlenecks to the re-vival of productive activities, especially exports; have relatively lowcosts (especially in foreign exchange) and short gestation periods; and aresimple to implement. Given the present problems as outlined in Section B,the following immediate priorities would seem to be appropriate:
12/ As presented in the Ten-Year Programme of Action 1981-90, Sep-tember 1981.

- 96 -
(a) cooperation with Kenya to: (i) improve the joint organizationand control of railway operations, including the rationalization
of interchange and revenue agreements between the two countries;
and (ii) reduce the influence of trucking vested interests on the
utilization of the railway for long-distance traffic;
(b) increasing the capacity of the railway by: (i) importation ofhand tools for routine track maintenance; (ii) rehabilitation ofthe signalling and communications system; (iii) selective track
rehabilitation, and also limited upgrading, as justified by traf-fic levels; and (iv) possibly, additional purchases of tank carsand passenger coaches;
(c) to permit major repairs to rolling stock and locomotives to beundertaken within Uganda, completion of the Nalukolongo workshopand importation of appropriate railway spare parts;
(d) strengthening of the road maintenance program, through: (i)imports of simple tools, equipment and vehicles; (ii) rebuildingworkshop and storage facilities; and (iii) strengthening (interms of staff numbers, expertise and motivation) the administra-
tive capacity of the Ministry of Works;
(e) rehabilitation of priority road links, especially those providingaccess to rail headsl 3 and connecting Kampala with nearby cen-
ters of economic activity (Port Bell, Entebbe, Jinja, Wobulenzi,and Masaka);
(f) to improve utilization of the existing road vehicle fleet, im-
portation of appropriate spare parts (some new bicycles, pickipsand passenger buses could also be considered), and rehabilitation
and completion of public transport workshop facilities; and
(g) upgrading of Entebbe international airport to ICAO-required oper-ational standards, including rehabilitation of the passenger
terminal, completion of the new cargo facilities, and replacement
of navigational, meteorological and safety equipment.
6.22 Although the most obvious constraint at the moment on rehabili-
tating the transport sector is the shortage of foreign exchange, there isalso an urgent need to strengthen the Government's capacity to coordinatetransport policies and planning. At the moment, transport sector responsi-bilities are divided among the Ministry of Transport, Ministry of Works,and the numerous parastatals involved in the sector.14 Transport planning
is supposed to be done by the Ministries of Transport and Planning, but to
13/ For example, the road links from Kasese to Katunguri, Ishaka toNtungamo to Kabale, Gulu to Nimule, Arua to Pakwach, and FortPortal to Kasese.
14/ At the moment, URC and Uganda Airlines report to the Ministry of
Transport, while UCTU reports to the Ministry of Marketing andCooperatives and Transocean to the Ministry of Commerce. It would
be worth considering bringing all of these trans,art parastatalsunder the one umbrella of the Ministry of Transport.

- 97 -
Table 6.1: TRANSPORT RATES /a
(U.Sh.)
Units Before AfterDevaluation
Passengers
Rail:Kampala-Jinja per passenger 28.5 90.0Kampala-Gulu per passenger 181.0 450.0Kampala commuters per passenger 10.0 10.0
Bus (public):Kampala-Jinja per passenger 22.5 100.0Kampala-Gulu per passenger 93.2 350.0
Bus (private):Kampala-Jinja per passenger 200.0Kampala-Gulu per passenger 400.0
Passenger car:Kampala-Jinja per car 1,882.0Kampala-Gulu per car 2,141.0Air:Entebbe-Gulu per passenger 390.0 2,655.0
Cargo
Rail (bulk oil):Malaba-Kampala per ton 108.0 634.8Malaba-Jinja per ton 79.5 351.3Malaba-Kasese per ton 213.0 1,229.1
Road (public):Kampala-Jinja per ton 136.8 610.5Kampala-Gulu per ton 296.7 1,840.4
Road (private):Kampala-Masindi per ton 7,500.0
/a Guidelines provided by Ministry of Transport
Source: Ministry of Transport
- 98 -
date, little has been completed apart from the collection of data for the
ten-year action program. As a result, the parastatals tend, by default, to
have a high degree of autonomy in investment decisions-, often without dueregard to intermodal coordination or the broader priorities of the eco-
nomy. This situation needs to be improved as soon as possible, with theMinistry of Transport taking a lead role in efforts to: (a) increase andsystematize knowledge about the transport sector; (b) assess Uganda'smedium- and long-term transport needs; (c) prepare a comprehensive andintegrated transport investment program; and (d) develop an appropriatetransport strategy and policy framework. These efforts will have to besupported by measures to strengthen staffing in the key ministries andparastatals, through in-house training of technical and professional per-sonnel and appropriate use of expatriate technical assistance.
6.23 Finally, a word about transport costs and prices. Transportcosts have risen dramatically in Uganda in recent years, reflecting higher
fuel prices, domestic shortages and inflation, and the deteriorating condi-
tion of the transport infrastructure. These problems have been compounded
by the impact of falling traffic levels on unit costs and the misallocationof traffic among transport modes. As a result, the financial viability of
the various transport parastatals, many of which were already sufferingfrom poor management and undercapitalization, has been seriously eroded,and most require operational subsidies from the Government to survive. On
top of this, transport costs have now jumped again following the recent de-
valuation of the Ugandan shilling and associated wage and price adjust-ments. As shown in Table 6.1, the Ministry of Transport has accordinglyreviewed the existing guidelines on transport rates and suggested substan-
tial increases. These adjustments are inevitable under present conditions,
and will help move rates in line with economic costs. But, at the same
time, there is an urgent need to work towards an improvement in transport
efficiency to help reduce the impact of high costs on effective demand andthe pace of economic recovery. To this end, the Government should con-
tinue to keep transport regulation, pricing, taxes and subsidies underreview, to encourage'competition and to ensure that adequate incentives are
provided to the parastatals to improve their operating performance.

- 99 -
Chapter 7
ENERGY
A. Introduction
7.1 Energy use in Uganda is primarily based on electricity, petroleumand woodfuels. At the present time, Uganda has a surplus of electric gen-erating capacity, but this could soon be absorbed as the economy recovers.Fortunately, Uganda has abundant potential for further development of rela-tively cheap hydro-electricity. Expansion of electric generating capacityshould not only be geared to the increase in domestic demand associatedwith economic growth, but also to the opportunities to substitute for moreexpensive fuels (such as petroleum products) and to secure long-term exportagreements with neighboring countries. Uganda has no identified petroleumreserves and the resultant need to import all of the country's petroleumproduct requirements represents a major drain on foreign exchange; in 1981,more than 50% of Uganda's merchandise exports went to pay for petroleumproducts. Little is presently known about the woodfuel subsector, eventhough it is a major source of energy for domestic heating and cooking.Charcoal is also used in industry, chiefly for the production of steel,lime and cement. There is mounting concern that uncontrolled developmentof charcoal and firewood will eventually deplete the most accessible andeconomic forest resources, and lead to mounting soil erosion problems.
7.2 Among the alternative sources of energy which could possibly bedeveloped at some future date, few appear to be economic. Biogas is prob-ably one of the more promising prospects, especially in isolated ruralareas, and there are also favorable natural conditions in the rift valleyfor the development of geothermal resources. However, for general use, nei-ther are likely to be competitive with hydro-electricity. The same holdstrue, a fortiori, for gasohol production from sugar, especially since thecountry actually imports sugar at present to meet food needs.
7.3 Two years ago, the Ministry of Power and Transport was separatedinto the Ministry of Power, Posts and Telecommunications and the Ministryof Transport, the latter taking most of the staff. The Government hasrecently decided to expand the Ministry of Power, Posts and Telecommunica-tions into a new Ministry of Energy, which now has primary responsibilityfor regulating the energy sector and formulating energy programs and poli-cies. 1 This Ministry is still in a formative stage: only 45 positions
1/ The Ministry of Energy also has responsibility for posts andtelecommunciations. Although this sector was not reviewed indetail by the economic mission, it is clear that postal and tele-phone services have virtually collapsed in Uganda, and substan-tial expenditures on spare parts, modernization of exchanges, andvehicles will be required to restore normal operations. TheUganda Posts and Telecommunications Corporation, which was formedto look after the installations in Uganda on a caretaker basisafter the breakup of the EAC, will also need total restructuring(legally and financially) if it is to become a viable and effec-tive institution.

- 100 -
were filled in mid 1981, and it is estimated that an additional 150 newstaff will be required to handle its expanded responsibilities effect-ively. It is therefore not surprising that the Ministry has not as yet had
time to provide any effective guidance to long-range planning and policyfor the sector.
7.4 Partly because of this lack of effective government involvement,
and partly because of the general conditions in Uganda, there remain manygaps in the data base on the energy sector. Given the importance of the
sector, every effort needs to be made to fill these gaps and complete a
more comprehensive energy assessment for the country. This will require,
inter alia, additional information on actual and potential energy demand,the options for electricity development, petroleum consumption patterns,
and the fuelwood subsector. Nevertheless, it is possible at this stage toprovide an overview of the present situation in the important electricity
and petroleum subsectors, and to identify the major issues that will haveto be addressed in the coming years. This is the focus of Sections B and Cbelow.
B. Electricity
7.5 Uganda's installed generating capacity is 154 MW. Of this, 150MW is provided by the Owens Falls hydro-electric station, with the balanceof 4 MW coming from seven small diesel stations and one small hydro-elec-
tric station in the northern and western regions. The Owens Falls station,situated just downstream from the Victoria source of the Nile, was commis-sioned in 1954 and was expanded to its present capacity by 1968. Despiteits age, the station is still in good condition and reliability is high.This reflects the excellent maintenance and operating record at the sta-tion, as well as the favorable natural conditions provided by an abundant
and clean source of water. Although some of the ten units at Owens Fallsare now being derated because of age, they are still capable of sustaininga 10% overload during peak-load periods.
7.6 Electricity consumption within Uganda rose on average by 6.4% perannum from 1964 to 1971. (The only disruption to this upward trend came in
1970, when consumption was curtailed by the conversion of a number offirms, including Nyanza Textiles, from electricity to fuel oil for raisingsteam.) However, since 1971, consumption has fallen by almost one-half, to239 million kwh in 1980. As shown in Chart 7.1, the bulk of this declinewas contributed by the industrial sector, in line with the fall in indus-trial activity during the 1970s. As a result, industry's share in electri-
city consumption fell from around 75% in the mid 1960s to 42% in 1980.Overall, despite the fall in total consumption during the 1970s, the numberof customers serviced by UEB has continued to rise. (There was a sharpfall in the number of customers in 1979 due to the impact of the 1978-79war, but this was recovered in 1980.) However, the total number of cus-tomers is still less than 100,000 and annual per capita consumption, at 19kwh, is presently among the lowest in the world.
7.7 Faced with the prospect of surplus generating capacity, Ugandaentered into a 50-year contract to sell electricity to Kenya in 1958. Thisinitially provided for sales up to 30MW, although maximum demand by Kenyahas risen as high as 48MW in recent years. Although the terms of the

- 101 -
CHART 7.1 ELECTRICITY CONSUMPTION148-
130-
12Ø-
ig
ELECTRICITY SALES CKWh)
70--- TOTAL CUGANDA)
-- D:IDUSTRIAL SECTOR
VALUE ADDED CU.Sh. AT 1 96e PRICES)
---MONETARY GOP
•••MANUFACTURING INDUSTRY
48-
3Ø%
1 966 1 gce 197Ø 1972 1,974 1976 t 978 90
YEARS
8MØWCE iSA TANLES 2.2 AM© 10. 1

- 102-
contract were renegotiated in 1980, they remain highly favorable to Kenya.Kenya now pays a minimum charge of K.Sh. 7.95 million per annum for up to30MW of electricity. For all energy supplied in excess of 100% load factoron 30MW, Kenya pays an additional K.Sh. 0.135 per kwh. Reflecting thesenew terms for half of the year, Uganda's foreign exchange earnings from the
sale of electricity to Kenya totaled US$2.6 million during 1980.
7.8 Even with the export of electricity to Kenya, Uganda's installedgenerating capacity has become increasingly underutilized, with the ratio
of maximum demand to installed capacity falling from a peak of 84% in 1973to 69% in 1980. The demand for electricity is, of course, closely tied tothe general prospects for economic recovery, and these are not easy to pre-dict. However, a number of factors would suggest that a fairly rapid
increase in demand needs to be planned for: (a) the economy is presentlyhighly depressed, especially in the industrial sector, and with appropriatepolicies and support, the prospects for an early recovery would appear tobe good; (b) under normal circumstances, electricity demand tends to risefaster than the level of economic activity; and (c) in Uganda, there is
considerable scope for substituting electricity for petroleum and other
energy sources in response to relative prices and extension of the trans-mission network. Even with a modest assumption of 7% per annum growth in
domestic demand, and continuation of sales to Kena at the contract levelof 30 MW, present capacity would be fully utilized by 1986.2 Given thenormal lead time of four to five years in planning and constructing ahydro-electric station, it is therefore clear that a decision needs to betaken soon on expanding capacity.
7.9 Fortunately, Uganda has abundant potential for economic and reli-able hydro-electric development, especially along the Nile river betweenLake Victoria and Lake Albert. However, even at a sustained growth rate of7% per annum, domestic demand could only justify additional capacity ofabout 30 MW by the end of the decade. This would, therefore, require theconstruction of small schemes or the phased development of larger schemesat relatively high unit costs. In this context, it is important to explorethe prospects for additional regional sales, especially to Kenya. Thesesales could help relieve Kenya's own power constraint at possibly lowercost than construction of additional capacity in Kenya, 3 reduce the perunit cost of Uganda's electricity generation, and provide a valuable sourceof foreign exchange. However, it would be essential that a firm commitment
was made to buy electricity from Uganda, and at an economic price, beforethe decision to construct a large-scale station was made. Apparently, some
2/ This projection assumes that: (a) domestic demand in the baseyear (1981) will be 75 MW; and (b) one of the ten units at OwensFalls will be kept as a reserve for normal maintenance andemergencies.
3/ A 1968 study, sponsored by the World Bank, indicated that jointdevelopment of the generating potential in Kenya and Uganda wouldbe mutually advantageous, especially for Kenya. This study couldusefully be updated now, as with changing cost considerations,the advantages to Kenya of purchases from Uganda have probablyincreased.

- 103 -
preliminary contacts between the two countries have already been made onthis issue, but no concrete proposals have yet been discussed. Prospects
for sales to other countries within the region, including Tanzania andSudan, also need to be explored on a priority basis.
7.10 *A number of feasibility studies have already been completed fornew hydro-electric projects in Uganda. These include the following propos-
als:
(a) Extension of the Owens Falls station. This would involve cons-
truction of a new station on the opposite side of the river but
using the existing dam. This could add an additional 60MW ofcapacity, although the cost per MW is estimated to be substanti-
ally higher than for the "run of the river" station at Ayago [see(d) below].
(b) The Bujagali project. This site is 5 miles downstream from Owens
Falls and could generate 180 MW. However, it would take as long
to construct as (c) or (d), both of which provide much more final
capacity.
(c) The Kabalega Falls project. This would seem to be a technicallysound alternative for the staged development of up to 600 MW of
capacity, but has been discarded for environmental reasons (theKabalega Falls are one of Uganda's major tourist attractions).
(d) The Ayago project. This site is upstream from Kabalega Falls.Although the feasibility study is still not available, 4 it isunderstood that this project could be started by first building a"run of the river" station of about 60 MW, with final capacity of
up to 500 MW once the full dam is completed.
7.11 Among these options, the immediate priority would seem to be the"run of the river" station at Ayago. This project could provide adequate
capacity for Ugandan demand through the end of the 1980s. The larger pro-jects are only likely to become viable over the longer term, or if satis-
factory export arrangements can be made. Any final decision on new invest-
ments in electric generating capacity will have to await review of thefeasibility report for the Ayago project as well as preparation of a morerigorous forecast of demand. When both of these are available, the various
alternative proposals should be compared to find the least-cost solution.The subsequent timing of project implementation will depend on when additi-
onal capacity is required and the availability of financing within theoverall framework of investment plan priorities.
7.12 Transmission. The country's major transmission line (132 kv)extends across the southern part of the country, to cover Kampala and Jinja
to the west of Owens Falls and Tororo to the east. At the Tororo substa-
tion, the line connects with the Kenyan system and to a northern line run-ning up to Lira. The rest of the country is served by lower voltage sub-
transmission and distribution lines, although there remain some sparselypopulated rural areas without electricity supply.
4/ The report has apparently been completed, but Uganda has so farbeen unable to make the final payment for its release.
- 104 -
7.13 The transmission and sub-transmission systems are generally insatisfactory condition except where a few steel towers, destroyed duringthe 1978-79 war, need replacing. On the other hand, the substations,
distribution networks, and underground cables are 30 or more years old, andin many cases have passed their normal life expectancy. With little main-
tenance or modernization over the past ten years, there is now a backlog ofreplacement requirements. An initial priority list of imported equipmentand materials is being financed under the IDA Reconstruction Credit and a.program grant from the United Kingdom, but additional recurrent funding for
this purpose will obviously be required.
7.14 Some expansion of the transmission system, through a rural elec-trification scheme, has also been proposed. This is designed to bringelectric supply to the western part of the country where some 12,000 newcustomers would initially be connected. In addition, the scheme will re-place some of the diesel stations now serving isolated areas, thereby sav-
ing high-cost imported fuel. The scheme, which is estimated to cost about
US$15 million (including US$8.5 million in foreign exchange), is expectedto be financed by the EEC. When it is complete, the scheme will add about7 MW to aggregate demand.
7.15 UEB's financial position. Under the Electricity Act, as modifiedin 1964, the tariffs to be charged for electricity service by UEB are to beadequate to cover recurrent expenditures, depreciation, and loan repay-ments, and to provide an allocation to reserves. This was the case through
1972, when UEB was earning a rate of return on fixed assets of around 12%(see SA Table 10.2). However, in subsequent years, with only marginal tar-
iff adjustments and declining consumption, UEB's financial position deteri-orated. In 1978 and 1979, UEB's accounts showed a net loss. The situationhad started to improve following a 50% tariff adjustment in 1980.5 How-ever, recent cost increases, resulting from the devaluatioi, of the Ugandan
shilling and wage and salary adjustments, have undermined UEB's financialposition once again. Although a further 50% tariff increase was approvedin January 1982, and another 50% increase is expected in July, these willnot be adequate to fully cover UEB's recurrent expenditures.
7.16 More fundamentally, there is an urgent need to review the Elec-tricity Act, to provide for regular and frequent tariff adjustments in linewith UEB's costs. In particular, the existing general statement on tariff
levels should be replaced by a more detailed tariff regulation, setting outguidelines for calculating the rate base (including provisions for assetrevaluation), and the procedures and basis for tariff adjustments. Theexisting schedule of tariffs for different consumers is essentially an old-fashioned "room rate" schedule, and has not been substantially revisedsince its introduction in 1961. It therefore needs to be reviewed to bringit in line with modern practices and tariff concepts.
5/ The rate of return on fixed assets recovered to 4% in 1980 and an
estimated 8% in 1981. However, this latter figure will besubstantially reduced with the revaluation of assets at the newexchange rate.
- 105 -
7.17 UEB's financial position has also been adversely affected byweaknesses in the system of billing and payment collection. In this re-
gard, there are three problems at the moment. Firstly, UEB computerized
its accounting and billing system several years ago. However, due to in-
adequate maintenance and shortages of spare parts, the computers are fre-quently out of service and as a result, collections are at least threemonths delayed. (As similar problems are also faced by other parastatalbodies, including the Uganda Posts and Telecommunications Corporation, itmight be better to establish a central computer center, preferably operated
and serviced by the supplier.) Secondly, the difference between units
billed and units generated is presently about 25%. As normal system losses
should be about 17%, this suggests illegal use of around 8%. UEB hasstarted a campaign to eliminate illegal connections and meter thefts, but
this is inevitably difficult under present conditions. Although pressureto pay overdue accounts is also being applied through service cuts, these
are not very effective given the billing delays noted above. Finally,
UEB's financial position has been adversely affected by large accountsreceiveable owed by the Government and parastatal organizations. At the
end of 1980, these totaled U.Sh. 85 million; excluding debts owed by UEB tothe Government, the net amount was still U.Sh. 21 million. Some solution
to these outstanding debts needs to be found to enable UEB to operate on asound financial basis.
C. Petroleum
7.18 Uganda imports all of its petroleum products. As shown in SA
Table 3.4, the volume of petroleum imports fell by more than 50% from 1971to 1979, reflecting the general decline in the economy and the increasingly
tight foreign exchange constraint. There was a further cut-back in con-
sumption from mid 1981, following the sharp increase in retail pricesintroduced by the Government (see paragraph 7.21). However, with higher
world prices, the foreign exchange cost of petroleum imports (including oil
company service payments) has continued to rise, reaching an estimated
US$114 million in 1981: this is more than seven times higher than in 1971and absorbed over 50% of Uganda's export earnings.
7.19 The importation and marketing of petroleum products in Uganda is
handled by six companies, the largest of which (Shell) is jointly ownedwith the Ugandan Government. Three of these companies, including Shell,supply 58% of the market, primarily using crude purchased from their asso-
ciate companies overseas and processed at the Mombasa refinery.6 The re-maining three companies buy products in the Nairobi market. It would seem
that the processing of crude provides a substantial saving over purchases
of Kenyan products, on which a high minimum export price is imposed.
6/ The petroleum products obtained from a barrel of crude do notalways correspond in type or quality with what is required to
meet the demand in Uganda. Therefore, the oil companies sell thesurplus products and give Uganda a corresponding credit.

- 106 -
However, both options are more expensive than direct imports of productsfrom the Middle East. 7 Although some direct purchases have apparentlybeen made in recent months, to augment the supply of aviation fuel, thescope for more widespread use of direct product imports from the MiddleEast needs to be explored. As regards transit transportation, light-endproducts (e.g., motor spirit, kerosene) are moved from Mombasa to Nairobiby pipeline and then on to Uganda by truck. Heavy-end products (e.g., fueloil) used to be sent by rail directly from Mombasa, but most of these arealso now going by road. This is apparently due to the influence of truckingvested interests rather than any shortage of railway tank cars. As use ofroad transport is much more expensive than the railway, a solution needs tobe found on a priority basis. The extension of the pipeline to Kampala orconstruction of a refinery within Uganda are not considered economicoptions at this time.
7.20 Under the present system, the Government is supposed to releaseforeign exchange to pay for imported petroleum products (as well as oilcompany service payments) on the basis of quantities and costings as re-ported by the oil companies themselves. This approach has become increas-ingly unacceptable to both the Government and the oil companies. For theGovernment, it has been difficult to check whether the products have beenactually arriving and the validity of the costings presented. To helpresolve this problem, the oil companies themselves have now instituted anindependent audit of the supply situation. For the longer term, the pro-posed Petroleum Inspectorate in the Ministry of.Energy will have to take anactive role in collecting and analyzing data on the import of petroleumproducts. This will not only help monitor the operations of the oilcompanies, but also provide a basis for evaluating the overall supply anddemand situation, and designing appropriate pricing policies. For the oilcompanies, the recent difficulties experienced by the Government in meetingimport payments meant that either supplies would have to be cut off or in-voluntary credit extended. Fortunately for Uganda, the companies did notcut off supplies, and as a result, the accumulated arrears on petroleumimports reached US$50 million by the end of May 1981. These arrears havenow been reduced to an acceptable level. However, the Government needs toensure that a similar situation does not arise again, especially as theinitial demand for petroleum can be expected to rise with a recovery ineconomic activity.
7.21 Although exploration for petroleum has been done on several occa-sions, the latest in 1978, no commercially viable reserves have yet beenclearly identified. While further surveys are probably justified, the moreimmediate prospects for reducing the large foreign exchange burden of pe-troleum imports are to be found in petroleum conservation and the develop-ment of alternative energy sources, especially hydro-electricity. In thisregard, the Government has already taken a major step towards restrainingpetroleum demand by raising retail prices. As already discussed in Chapter2 (see Table 2.6), the retail prices of gasoline have been raised more than
7/ Taking the example of premium gasoline, our own estimates wouldsuggest that in mid 1981, the cost per ton c.i.f. Mombasa wouldhave been US$406 if imported directly from the Middle East,US$463 if processed through the Mombasa refinery, and US$539 ifpurchased on the Kenyan market.
- 107 -
tenfold since April 1981, reflecting the full impact of the June devalua-tion. Substantial adjustments in prices for diesel and kerosene have also
been made. At these levels, the retail prices reflect the full cost ofimportation and marketing and also provide a significant contribution togovernment revenues in the form of import and sales taxes. Although import
levels have recently been reduced, these prices appear adequate to clear
the market without rationing or significant "magendo" premiums.
7.22 At present economic costs, Uganda should seriously consider mak-
ing greater use of its ample hydro-electric potential to substitute for pe-
troleum use. Perhaps the best prospects for this are in industry wherefirms now using oil to produce their own electric power and process steam
could be converted to mains-supplied electricity. It is estimated thatabout 20 MW of additional electricity demand would be involved, possiblysaving as much as 10% of the present petroleum import bill. Progress in
this area will require feasibility studies for individual firms, to deter-
mine the economic justification for conversion, the capital investment re-
quired and the optimal timing of implementation. Where conversion isjustified, the Government may want to consider introducing tax inducements
(e.g., accelerated write-offs) to help overcome the financial constraintsfacing individual firms. In other instances, where major rehabilitationwould be required before conversion becomes economic it may be necessary to
delay investment in conversion for a number of years. With careful plan-ning, a successful petroleum conservation program could be developed, andthe Ministry of Energy should take a lead in this as an important component
of the country's overall energy strategy.

- 108 -
- 109 -
Chapter 8
EDUCATION
A. Introduction
8.1 The collapse, characteristic of most areas of the U andan economyduring the 1970s, is not so evident in the education sector. Though sub-ject to the same constraints and adverse country conditions, public andprivate investment in education, as well as enrollments, have expandedrapidly over the past decade. This is indicative of the high priorityattached to education by the Ugandan people, at all income levels, and theapparent economic and social returns education continues to provide. How-ever, this expansion has in fact only been possible at the expense of edu-cational quality, and substantial rehabilitation is now required if theearlier standards, of which Uganda is justly proud, are to be regained. Inparticular, the education system has suffered from: the general lack ofmaintenance characteristic of the past decade; the departure of Asians,which left critical gaps in secondary school teaching, especially of mathe-matics and science; a decline in teacher morale and productivity due tofalling real incomes, harrassment, and better opportunities elsewhere inthe "magendo" economy or overseas; and the loss or damage of school sup-plies, buildings, and equipment. While the most striking examples of thisdecline are to be found at Makerere University, once recognized throughoutthe world as one of the premier African universities, the most serious andpervasive effects have probably been at the other end of the educationspectrum, in the primary schools. Now, many primary students attendschools without windows, chairs, books, or writing materials; unless thissituation is quickly corrected, these deficiencies will impact on thehigher levels of education for many years to come.
8.2 The coverage of this chapter is incomplete, with gaps in a numberof important areas: enrollment rates, the condition of schools throughoutthe country, differences in access to education between income groups andregions, and teacher numbers and standards. Additional information inthese areas would be required to provide a more comprehensive review of theeducation sector. However, given the importance of the sector withinUganda -- not only for relieving the country's skilled manpower constraintsbut also for improving the range of economic opportunity and quality of
1/ Uganda's education system consists basically of four levels:first, seven years of primary education, which is estimated tocover about one-half of the respective age group; second, ofthose who complete primary school, about one-quarter enter sec-ondary school for four years up to "0 level" or enter technicalschool for up to three years of vocational training; third, ofthose who pass the "0 level" examinations, about: 40% continueinto higher education, including secondary school for another twoyears to "A level", various departmental training institutes, andteacher training colleges (Grade III); and finally, after "Alevel" examinations, students are eligible to go on to univer-sity, either at Makerere University in Kampala or overseas.
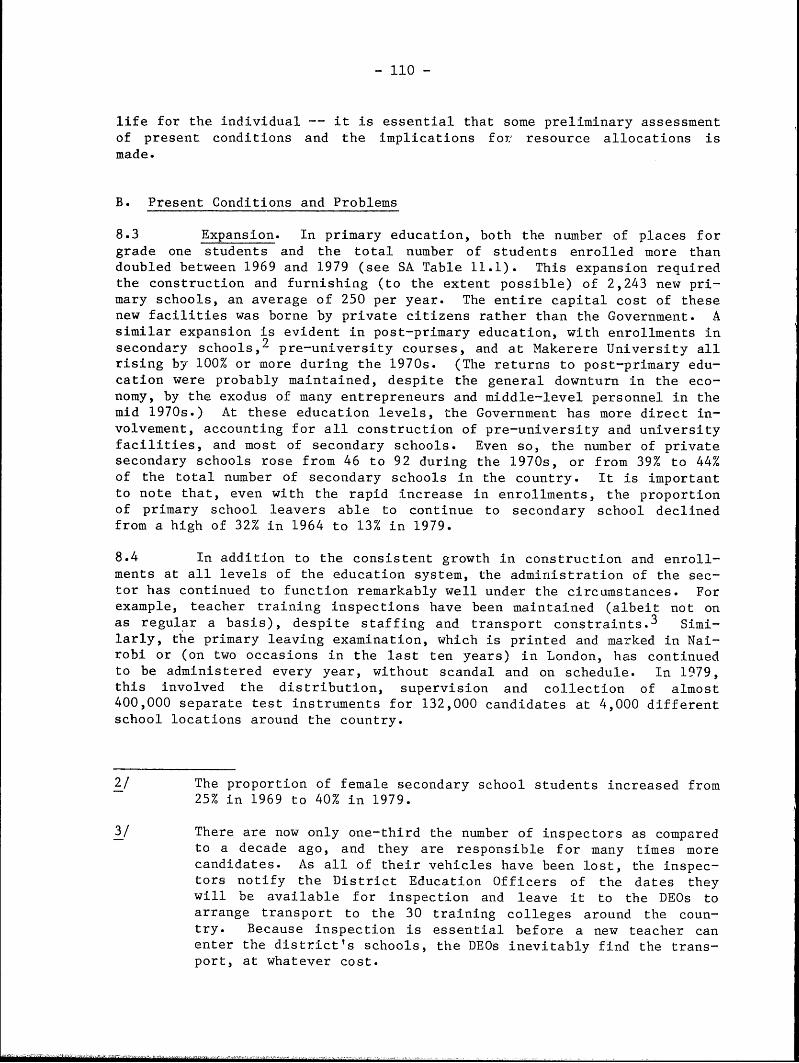
- 110 -
life for the individual -- it is essential that some preliminary assessmentof present conditions and the implications for resource allocations ismade.
B. Present Conditions and Problems
8.3 Expansion. In primary education, both the number of places forgrade one students and the total number of students enrolled more thandoubled between 1969 and 1979 (see SA Table 11.1). This expansion requiredthe construction and furnishing (to the extent possible) of 2,243 new pri-mary schools, an average of 250 per year. The entire capital cost of thesenew facilities was borne by private citizens rather than the Government. Asimilar expansion is evident in post-primary education, with enrollments insecondary schools,2 pre-university courses, and at Makerere University allrising by 100% or more during the 1970s. (The returns to post-primary edu-cation were probably maintained, despite the general downturn in the eco-nomy, by the exodus of many entrepreneurs and middle-level personnel in themid 1970s.) At these education levels, the Government has more direct in-volvement, accounting for all construction of pre-university and universityfacilities, and most of secondary schools. Even so, the number of privatesecondary schools rose from 46 to 92 during the 1970s, or from 39% to 44%of the total number of secondary schools in the country. It is importantto note that, even with the rapid increase in enrollments, the proportionof primary school leavers able to continue to secondary school declinedfrom a high of 32% in 1964 to 13% in 1979.
8.4 In addition to the consistent growth in construction and enroll-ments at all levels of the education system, the administration of the sec-tor has continued to function remarkably well under the circumstances. Forexample, teacher training inspections have been maintained (albeit not onas regular a basis), despite staffing and transport constraints. 3 Simi-larly, the primary leaving examination, which is printed and marked in Nai-robi or (on two occasions in the last ten years) in London, has continuedto be administered every year, without scandal and on schedule. In 1979,this involved the distribution, supervision and collection of almost400,000 separate test instruments for 132,000 candidates at 4,000 differentschool locations around the country.
2/ The proportion of female secondary school students increased from25% in 1969 to 40% in 1979.
3/ There are now only one-third the number of inspectors as comparedto a decade ago, and they are responsible for many times morecandidates. As all of their vehicles have been lost, the inspec-tors notify the District Education Officers of the dates theywill be available for inspection and leave it to the DEOs toarrange transport to the 30 training colleges around the coun-try. Because inspection is essential before a new teacher canenter the district's schools, the DEOs inevitably find the trans-port, at whatever cost.

- 111 -
8.5 Quality, Although the education sector in Uganda has continuedto expand, this has only been possible, given the resource constraints, atthe expense of quality. As shown in Table 8.1, the level of science know-ledge in the last year of primary school, which was never high in the bestof times, is today among the lowest in the world, and approximately half ofwhat would be expected in an industrialized country. 4 Ugandan performancein reading and sentence comprehension is at or below the average for otherless developed countries, and substantially below the average for developedcountries. As alarming as these results may be, there has been surpris-ingly little decline over the past decade in the level of mathematicsachievement attained by primary school students. Indeed, for the five sam-ple schools, the proportion of mathematical questions answered correctlyremained approximately the same (45% in 1971 and 47% in 1981). This prob-ably reflects: (a) the improvement in teacher quality following the re-tirement of 400 vernacular (non-English speaking) teachers;5 (b) the factthat many schools have attempted to compensate for the scarcity of class-room resoures by requiring students to spend an additional two to threehours memorizing lessons written on the chalkboard; and (c) the relativelylower dependence on textbooks for mathematics as compared to science, lang-uage, history and geography.
8.6 Despite the obvious resourcefulness of schools, it will be virtu-ally impossible to improve education quality without first improving theavailability of classroom supplies. In the five sample schools, four hadno textbooks at all, none had an operating duplicating machine, and therewere far fewer chairs than pupils. Today, the norm is for students tospend longer hours in school sitting on a barren floor, copying and memo-rizing a lesson which the teacher has summarized (on the chalkboard) from asingle out-dated textbook, as often as not, borrowed from a neighboringschool. Uniforms are now a rarity, and many pupils have to sh"e.a pencilsand note paper. The effect of this scarcity is then passed up through thesystem. In 1980, 49% of those who sat for their "0 levels" either failedor received the lowest possible pass, while in university, 20% of those whoattempted to major in science failed to obtain a degree in their chosenspecialization.
8.7 Staffing constraints -- in terms of numbers, qualifications, andmotivation -- have also played a role in the decline in educational qual-
4/ These very preliminary conclusions are based on results from only5 primary schools (out of more than 4,000 in the country) alllocated in one district, Mpigi. Results from a sixth school,Buddo, were considered unrepresentative and excluded; Buddo isone of the most exclusive schools in the country. The other fiveschools, however, can be taken as at least representative ofMpigi district. In general, schools in Mpigi district are moreadvantaged than schools elsewhere, though the impact of lootingduring and after the 1978-79 war may have been more serious thanin other parts of the country.
5/ This is also reflected in improved levels of teachers' Englishlanguage comprehension revealed in test results from the sampleschools in Mpigi.

- 112 -
Table 8.1: PRIMARY ACADEMIC ACHIEVEMENT /a(% of items correct)
General Reading Sentence
Science Comprehension Comprehension /f
LDC average /b 37 46 42
Uganda /d /e 30 43 42Malawi /e 42 34 61
Thailand 47Chile 36 61 42India 36 53 27Iran 32 39 39
DC average /c 55 70 80
Ia Based on achievement items used by the International Association for
Evaluation of Educational Achievement on a ten-year old population.lb Average of six countries listed.Ic Average of twelve countries.Id Average of five schools in Mpigi district.e Students in Uganda and Malawi had a minimum of three years more educa-
tion than did students in other countries, and were 5.2 and 6.0 yearsolder respectively.
/f Percentage missing one or none of nine items. In Malawi, the first two
items were given as examples, providing a 22% advantage.
Source: World Bank

- 113 -
ity. This reflects the departure of Asians, which left critical gaps insecondary school teaching, especially of mathematics and science, and theimpact of falling real wages and harrassment on teacher morale and produc-tivity. The actual number of teacher training candidates has in fact con-tinued to rise during the 1970s, by as much as 80% for Grade II candidates,250% for Grade III candidates and 470% for in-service upgrading. But moreimportantly, the proportion of teachers classified as "unlicensed" in-creased from 14% in 1971 to 35% in 1981.6 The critical constraint now inprimary education is the scarcity of places in Grade III teacher traininginstitutions which necessitates the use of "unlicensed" teachers. At Make-rere, only one half of the 627 established posts are currently filled. Inmany ways, this would still represent an acceptable staff/student ratio, ifonly the necessary back-up services and supplies were available. But theyare not. This situation could perhaps be improved by allowing universitydepartments to convert salaries for unfilled posts into expenditures onback-up requirements.
8.8 Financing. The education sector is one of the nation's largestindustries and the largest public sector employer. In 1981/82, 5% of theCentral Government's development budget and 19% of the recurrent budgethave been earmarked for the Ministry of Education. In addition, a substan-tial amount is invested in education from private sources. In 1981, theGovernment collected U.Sh. 66 million in primary and U.Sh. 28 million insecondary school fees. Primary schools, on their own, collected perhapsfour times more again in fees, and provided a significant contribution inlabor and materials. Therefore, efficient management of resources in theeducation sector is obviously a critical component of the country's overallrehabilitation strategy.
8.9 Fiscal management in secondary education continues to work rea-sonably well. School fees are collected and managed directly by the Head-master, supervised with periodic audits by the Government. The Headmastercan use the fees, together with grants-in-aid from the Government7 to pur-chase the school's supply requirements from the most appropriate source,public or private. In addition, the Government provides direct assis-tance-in-kind, such as textbooks, chalk, exercise books, pens, maps andother visual aids.
8.10 Primary schools were traditionally managed by their own parentcommittees and their sponsoring (usually religious) voluntary agencies.However, in the mid 1960s, these powers were subsumed by local
6/ Unlicensed teachers are those who fail to obtain an "0 level"examination score sufficient for entry to "A level" or into thehealth or agricultural colleges. Unlicensed teachers have usu-ally obtained a "third class pass"; that is, they have passed therequired number of subjects, but have failed to pass mathematicsand science.
7/ In 1981, these grants-in-aid amounted to U.Sh. 5,000 per "0level" pupil and U.Sh, 6,000 per "A level" pupil.

- 114 -
government. 8 This has caused two major problems. Firstly, the standard
of fiscal management has declined significantly. In some districts, schoolfees have been transferred to the general revenue pool and used for non-
educational expenditures or allotted excessively (above the legal 10%limit) for local managerial functions. The watchdog activities of schoolmanagement committees have been hampered by poorly maintained accounts and
the formation of joint-management committees for several schools, appointed
by the district government. Secondly, in an attempt to provide a moreequitable distribution of school supplies, four parastatal companies wereestablished, with monopoly rights to copyright and print school textbooksand to distribute school supplies. However, the actual outcome was disas-trous. By 1971, the average primary school had received only 60% of theirorders, although all had been prepaid through the forced transfer of schoolfees to local government. Some schools in fact received none of the sup-plies ordered while others received more than double. The end result, des-
pite the best of intentions, has been to increase inefficiencies and social
inequalities.
8.11 Given the enormous task ahead of rehabilitating the educationsector, and the limited public revenues available for this purpose, prior-ity should be given to tapping new financing sources and ensuring that allresources allocated to education are used effectively. At the moment,
demand for primary, secondary and higher education remains high, and thegeneral population is willing to pay a portion of the cost. Yet, fees inprimary and secondary schools have not been changed in more than a decade,and with rampant inflation, are now worth only a fraction of their initialvalue. Furthermore, no fees are charged after "0 level" in secondaryschool, providing a subsidy to higher education which has always been dif-ficult to justify, but which now simply cannot be afforded any'longer. 9
This applies equally to university preparation, university (Makerere nowhas more than 5,000 enrollments compared to only a few hundred two decadesago when state sponsorship was introduced), and post-secondary technicaltraining (teacher, nursing, engineering, and agricultural extension). In
8/ There are three categories of government-aided primary schools inUganda: (a) former Asian schools; (b) former European schools;and (c) all others. The first two categories have in fact beenprovided special status, in that their management committees arestill allowed to control school accounts, and their quality ismaintained through special "capitation grants". However, as theschool population is now entirely African, this distinction isobsolete and a consistent policy towards the financing of allprimary schools needs to be established.
9/ No fees are charged to "A level" students directly; the expec-tation is that they will be sponsored by their local districtadministration. This has now broken down, and in certain instan-ces, schools now insist that the fees for "A level" be covered bythe student. At the university, not only are there no fees, butthe state is expected to cover a student's "pocket money" whichin 1981 amounted to U.Sh. 4,800 per student year. School mainte-nance in primary and secondary schools is assisted enormously bystudent labor, but this stops at the university level.

- 115 -
all of these areas, demand for professional employment is high and there isheavy competition for enrollment. Therefore, to help pay for the educa-tional opportunity provided, a review of fees is urgently required at alllevels of the education system. At the primary school level, higher feeswould only be warranted and effective, if fiscal responsibility were re-turned to the school management committees. With more direct control overthe use of their contributions, parents would generally be willing to meeta greater share of education costs.
8.12. Training. Post-primary technical training1 0 has developed slow-ly and sporadically as a step-child of general educational opportunity.Rarely would someone with the choice of entering secondary school or aGrade II teacher training college choose to go to a technical school in-stead. This is not due to any prejudice against manual labor, but simplyreflects the relative marketability of different kinds of education. Asevidence of this apparent low demand for post-primary technical trainingper se, there is no record of parent or community groups constructing aprivate technical school in the last decade, the number of state technicalschools has not increased, and the expansion of technical student numbers(13%) is a small fraction of what it has been in other areas of the educa-tion sector.11 Further, the unit costs of technical training are commonly20% to 40% higher than in general secondary education.12
8.13 Given the apparent low demand and high costs involved, the publicsector needs to carefully review its technical training program, to ensurethat the skills provided cannot be provided more efficiently by on-the-job
10/ Courses are available in: woodwork, construction, brickwork,pottery, tailoring, electrical installation, motor mechanics,agriculture, tanning, cobbling, and commerce.
11/ In 1969, there were 14 rural farm and junior trade schools (of-fering short-term terminal courses at the post-primary level) and5 technical schools (offering three-year terminal courses at thepost-primary level), with a combined enrollment of 2,211. By1979, 5 of the rural farm and junior trade schools had been con-verted to technical schools, and the rest presumably closed down,leaving 10 technical schools only, with an enrollment of 2,506.These figures exclude separate vocational institutions run by theMinistries of Cooperatives and Marketing, Animal Industry andFisheries, and Culture and Community Development. Also excludedfrom the 1979 figure are 5 new technical institutes (offering twoto three year certificate courses at the post-secondary level)with an enrollment of 1,545.
12/ This is just a rough approximation, assuming that both technicaland secondary schools were operating under more normal condi--tions. Present cost comparisons, even if available, would not bevery meaningful because of the severe impact of supply con-straints.

- 116 -
training or proprietory schools. In particular, the Ministry of Education
should consider three cost-saving options: (a) the transfer of post-pri-mary technical schools to the private sector; (b) a revision in the present
policy of attempting to provide metalshops and wood-working shops to allgeneral secondary school students; and (c) awarding grants-in-aid not onthe basis of vocational school enrollments but of performance, the abilityof a student to pass an agreed upon vocational skill test.
8.14 The Central Government currently sets aside just over 1% of itsrecurrent budget for the training and upgrading of public sector employees
and managers. Among ministries, however, there are substantial variationsin the proportion of the budget allocated to training, ranging from lessthan 0.1% in Internal Affairs to over 12% in Public Service and CabinetAffairs. In establishing an appropriate policy for future development ofpublic sector training, two considerations need to be taken into account.Firstly, the provision of generalized skills -- such as management, typing,
filing -- should be coordinated between ministries to provide economies ofscale. Secondly, the focus of training programs needs to be directedtowards providing skills which are in short supply and in areas where theywill be used productively. In these ways, the costs of public sectortraining in Uganda could be held to manageable levels, while improving theeffectiveness of the skills provided.
C. Rehabilitation Priorities
8.15 It is generally recognized that the enormous rehabilitation needsof the education sector deserve high priority within the overall allocationof resources; not only is education essential to relieving the country'sskilled manpower constraints, but it also makes a major contribution to the
the individual's economic opportunity and quality of life. In Uganda, aselsewhere, education investments have proven themselves resilient to vicis-
situdes of nature, human or otherwise, and with ample evidence of long-term
demand, there is little or no danger of capacity under-utiliztion. On the
other hand, resources are very limited. Even with more effective use oflocal resources, including private financing sources, the foreign exchangeconstraint will continue to restrict the scope for new investments andmajor institutional restructuring for several years ahead. Expansion of a
university faculty of technology, however attractive conceptually, is worse
than shortsighted when university lights do not work. Major curriculum
changes, producing textbooks locally and new audio-visual equipment aresimply unrealistic as ambitions in an environment where students havenothing to write on and no place to sit; and, where consumable supplies --printing paper, ink, projector bulbs -- do not exist.
8.16 Short term (1982-83). Initial resource allocations for theeducation sector will have to be based on the potential for quick

- 117 -
disbursement, wide coverage and low risk. 1 3 Three of the more importantrisks to be avoided are diversion away from intended users, prohibitivemaintenance costs, and delicate technologies (e.g., audio-visual equipment,radios, televisions, tape recorders, and electronic workshop equipment).Instead, priority items at present would be textbooks, exercise books,library books, pencils, chalk, chalkboards, non-electric visual aids,paint, window glass, and school furniture.
8.17 Medium term (1984-85). Over the medium term, and as resourcespermit, consideration could be given to new investments which will expandexisting facilities and programs, and relieve critical bottlenecks in theiroperation. Given the financial and organizational constraints, it wouldnot be possible to simultaneously accomplish the above and to introduceinto the system new institutional specializations or significant retoolingof educational content. Under this premise, highest priority should begiven to the expansion of Grade III teacher training colleges and secondaryeducation, as well as to improving the effectiveness of Makerere Univer-sity. Lower priority will have to be allocated to developing new colleges,new technical courses, and significant alterations of curriculum. All ofthese involve high equipment costs, substantial expenses for personneldevelopment, and most importantly, the testing of untried demand.
8.18 Longer term (1986-90). Longer term investments should begin toaddress the present shortcomings in the productive and managerial capacityof the central administration of the education system. This would includeeducational materials, examination design and analysis, and facilities forthe development of new curricula, the local production of textbooks andsupervision, acounting and evaluation. Though badly needed, these improve-ments cannot be expected to yield results quickly, and their priority musttherefore await progress in meeting the more immediate rehabilitation re-quirenents of the education sector. Also in the longer term, when specificskilled manpower requirements have been properly identified, investment canstart to address related training needs.
13/ Teachers' salaries, although not discussed here, are of course a
major element in education expenditures. These can be expectedto increase as staffing levels and wages improve. It will there-fore be important to keep close control on overall recurrent bud-
getary allocations for education, to ensure that adequate provi-sion is made for classroom supplies and school maintenance. Atthe moment, for example, the proportion of recurrent expenditurefor primary education devoted to classroom supplies is only 0.1%,far below standards in other countries and other educationallevels within Uganda. While this may reflect present foreignexchange constraints, the allocation for classroom supplies willeventually have to be increased if rehabilitation efforts are tobe successful.

- 118 -

- 119 -
STATISTICAL
APPENDIX

- i го -

121 -
UGANDA
COUNTRY ECONOMIC MEMORANDUM
STATISTICAL APPENDIX
Table No. Contents
POPULATION AND EMPLOYMENT
1.1 Population by District
1.2 Population by Major Towns
1.3 Wage Employment by Sector
NATIONAL ACCOUNTS
2.1 Gross Domestic Product by Industry (at current prices)
2.2 Gross Domestic Product by Industry (at 1966 prices)
2.3 Expenditure on Gross National Product (at current prices)
2.4 Capital Formation by Type of Asset (at current prices)
BALANCE OF PAYMENTS AND FOREIGN TRADE
3.1 Balance of Payments
3.2 Merchandise Exports
3.3 Merchandise Imports
3.4 Petroleum Imports
3.5 Destination of Exports
3.6 Origin of Imports
3.7 Trade Indices
3.8 Payment Arrears Outstanding
3.9 External Reserves
EXTERNAL DEBT
4.1 External Public Debt Outstanding
4.2 External Public Debt Service
4.3 Loan Commitments and Disbursements
4.4 Official Grant Receipts
PUBLIC FINANCE
5.1 Central Government Budgetary Operations
5.2 Central Government Revenue and Grants
5.3 Central Government Recurrent Expenditure
5.4 Central Government Development Expenditure
MONEY AND PRICES
6.1 Monetary Survey
6.2 Kampala Cost of Living Indices
6.3 Recent Price Trends
- 122 -
AGRICULTURE
7.1 Production of Major Crops7.2 Minimum Agricultural Producer Prices7.3 Costs of Crop Production
INDUSTRY
8.1 Production of Selected Manufactured Goods
TRANSPORT
9.1 Highway Network9.2 Vehicle Fleet9.3 Railway Traffic9.4 Railway Rolling Stock
ENERGY
10.1 Power Generation and Consumption10.2 UEB Operating Statistics
EDUCATION
11.1 Educational Institutions
11.2 Educational Enrollments

2;27 PM 11/06/81PAGE 1
TABLE 1.1UGANDA: POPULATION BY DISTRICT
(IN THOUSANDS)
Average1969 1980 Growth Rate
(% p.a.)APAC 1 225.41 313.33 3.10ARUA 2 369.62 472.28 2.30BUNDIBUGYO 3 74.92 112.13 3.80BUSHENYI 4 410.68 522.49 2.20GULU 5 223.71 270.18 1.70HOIMA 6 184.06 294.22 4.40IGANGA 7 470.19 643.80 2.90JINJA 8 200.90 228.52 1.20KABALE 9 403.40 455.47 1.20KABAROLE 10 332.46 520.14 4.20KAMPALA 1i 351.80 478.90 2.80KAMULI 12 278.30 349.55 2.10KAPCHORWA 13 64.46 74.52 1.30KASESE 14 164.13 277.71 4.90KITGUM 15 240.14 307.59 2.30KOTIDO 16 105.58 161.45 3.90KUMI 17 190.72 238.81 2.10LIRA 18 278.90 370.25 2.60LUWERO 19 315.20 412.47 2.50MASAKA 20 458.02 631.16 3.00MASINDI 21 167.85 223.25 2.60 IMBALE 22 421.43 557.24 2.60MBARARA 23 450.46 687.80 3.90MOROTO 26 164.70 189.46 2.40MOYO 25 89.98 106.49 1.50MPIGI 26 164.70 189.46 2.40MUBENDE 27 330.96 510.26 4.00MUKONO 28 536.38 631.64 1.50NEBBI 29 204.14 232.98 1.20RAKAI 30 182.57 274.60 3.80RUKUNGIRI 31 244.60 297.66 1.80SOROTI 32 379.91 476.63 2.10TORORO 33 527.09 668.33 2.20
UGANDA - TOTAL 34 9535.06 12630.08 2.60
SOURCE: MINISTRY OF PLANNING AND ECONOMIC DEVELOPMENT, CENSUSOFFICE, THE PROVISIONAL RESULTS OF THE UGANDA POPULATION CENSUS 1980.
DATA FILE: D/UGA/IS/D.
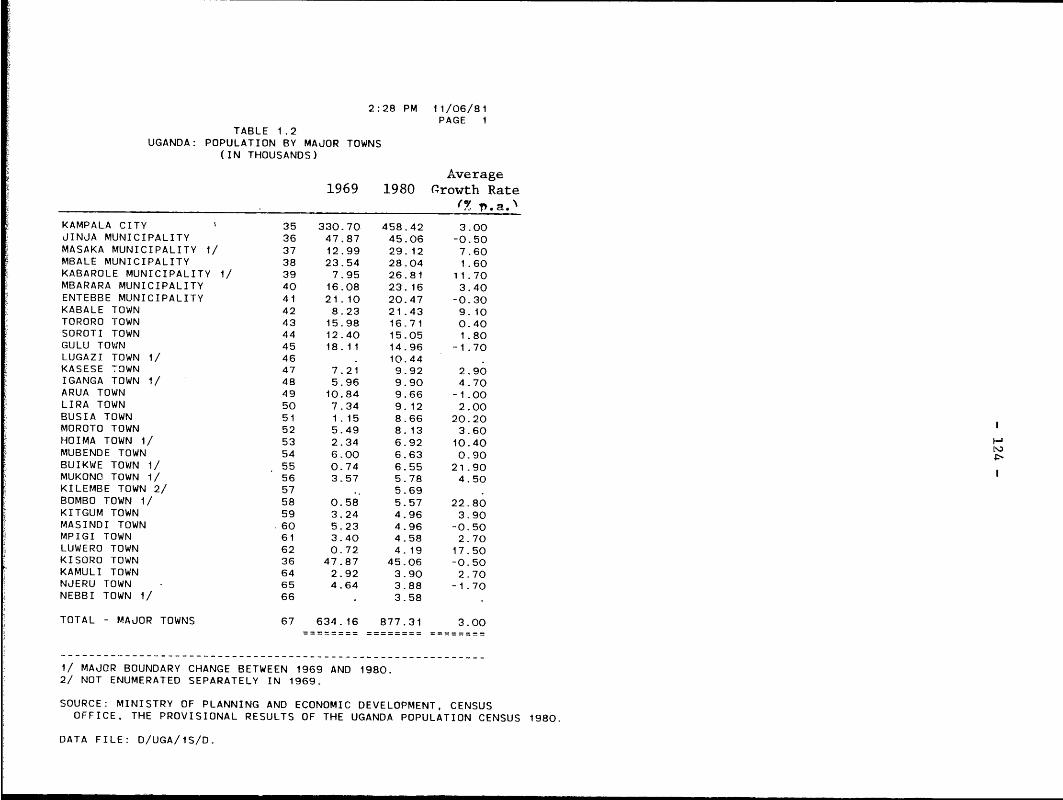
2:28 PM 11/06/81PAGE 1
TABLE 1.2UGANDA: POPULATION BY MAJOR TOWNS
(IN THOUSANDS)
Average1969 1980 Growth Rate
KAMPALA CITY 35 330.70 458.42 3.00JINJA MUNICIPALITY 36 47.87 45.06 -0.50MASAKA MUNICIPALITY 1/ 37 12.99 29.12 7.60MBALE MUNICIPALITY 38 23.54 28.04 1.60KABAROLE MUNICIPALITY 1/ 39 7.95 26.81 11.70MBARARA MUNICIPALITY 40 16.08 23.16 3.40ENTEBBE MUNICIPALITY 41 21.10 20.47 -0.30KABALE TOWN 42 8.23 21.43 9.10TORORO TOWN 43 15.98 16.71 0.40SOROTI TOWN 44 12.40 15.05 1.80GULU TOWN 45 18.11 14.96 -1.70LUGAZI TOWN 1/ 46 . 10.44KASESE TOWN 47 7.21 9.92 2,90IGANGA TOWN 1/ 48 5.96 9.90 4.70ARUA TOWN 49 10.84 9.66 -1.00LIRA TOWN 50 7.34 9.12 2.00BUSIA TOWN 51 1.15 8.66 20.20MOROTO TOWN 52 5.49 8.13 3.60HOIMA TOWN 1/ 53 2.34 6.92 10.40MUBENDE TOWN 54 6.00 6.63 0.90BUIKWE TOWN 1/ . 55 0.74 6.55 21.90MUKONO TOWN 1/ 56 3.57 5.78 4.50KILEMBE TOWN 2/ 57 .. 5.69BOMBO TOWN 1/ 58 0.58 5.57 22.80KITGUM TOWN 59 3.24 4.96 3.90MASINDI TOWN 60 5.23 4.96 -0.50MPIGI TOWN 61 3.40 4.58 2.70LUWERO TOWN 62 0.72 4.19 17.50KISORO TOWN 36 47.87 45.06 -0.50KAMULI TOWN 64 2.92 3.90 2.70NJERU TOWN - 65 4.64 3.88 -1.70NEBBI TOWN 1/ 66 . 3.58
TOTAL - MAJOR TOWNS 67 634.16 877.31 3.00
1/ MAJOR BOUNDARY CHANGE BETWEEN 1969 AND 1980.2/ NOT ENUMERATED SEPARATELY IN 1969.
SOURCE: MINISTRY OF PLANNING AND ECONOMIC DEVELOPMENT, CENSUSOFFICE, THE PROVISIONAL RESULTS OF THE UGANDA POPULATION CENSUS 1980.
DATA FILE: D/UGA/lS/D.

3:56 PM 03/22/82PAGE 1
TABLE 1.3UGANDA: WAGE EMPLOYMENT BY SECTOR
ITEM 1966 1967 1968 1969 1970 1971 1972 1973 1974 1975 1976 1977
AGRICULTURE 69 49,919 50,306 52,343 53,359 51,429 54,095 54,609 56,128 63.057 63.784 64,737 64.361
COTTON GINNING 70 5,359 3.613 4,555 5,588 6,344 5,884 5,594 5,809 6,651 4,574 4,826 4.331
COFFEE CURING 71 4,779 5.043 5,625 5.579 5,113 4.914 4,631 5,729 5,332 6.678 6.252 5,939
FORESTRY, FISHING AND HUNTING 72 2,960 4,259 3,518 2.897 3.508 3,563 5,A92 5,086 8,165 6,989 7.175 7.187
MINING AND QUARRYING 73 6,448 6,749 7.885 6,268 7.898 7,371 5.782 5,323 4,743 4.196 4,121 4.069
MANUFACTURE OF FOOD PRODUCTS 74 9.524 9,957 11.822 13,144 13,467 15,225 14.538 13,492 16.295 16.453 17.955 15,434MISC. MANUFACTURING INDUSTRIES 75 23,069 25.620 27,560 29,823 29.038 26,809 26.092 28.078 27.506 27.598 28,816 29,345 1ELECTRICITY 76 . . . . . 2.058 2.376 2,194 2,658 2.692 2.421 2,880
LnCONSTRUCTION 77 29,156 32.411 41.987 42,352 47.656 46.170 42,431 42,872 45,026 43.845 45.538 44,315 1COMMERCE 78 14,150 14,155 13,847 14.773 14,298 20,989 20.696 22.087 19,923 19.331 14.122 17,890TRANSPORT AND COMMUNICATIONS 79 9.833 10,674 11.075 11,826 12.613 13.197 12,505 11,877 13,378 . 13.192 13.148 12,426GOVERNMENT 80 35,699 33,539 37.596 39.600 45.051 45.555 54,642 68.981 69.918 68,628 65,145 69,476EDUCATION AND MEDICAL SERVICES 81 41.334 46,618 49.500 53,571 62.728 69.868 70.992 65.Bi 69.453 75,701 73.621 76,712MISCELLANEOUS SERVICES 82 13.799 13.855 14,459 16.189 13.709 8.840 9,388 16.587 16.530 13.999 17,604 13.257TOTAL 83 246,029 256,799 281,772 294.969 312,852 324,538 329,768 350.061 368,635 367.660 365.481 367,622.ema.am. .amma..a .. ammem. .. a u am mm. ...... m. summ.m.. .... as.a ..mm..m. ..... s.. ...a..ss .... ...m.. s..
OF WHICH:
PUBLIC SECTOR 84 91,744 94,692 108,794 113,835 128.815 134.030 149,105 183.975 204.390 204.599 200,822 206.566PRIVATE SECTOR 85 154.285 162,107 172.978 181,134 184.037 190.508 180,663 166,086 164.245 163.061 164.659 161.056
SOURCE: MINISTRY OF PLANNING AND ECONOMIC DEVELOPMENT. STATISTtGALDEPARTMENT.
DATA SET: UGA/iS

ft:38 AM 03/16/82PAGE 1
TABLE 2.1UGANDA: GROSS DOMESTIC PRODUCT BY INDUSTRY 1/
(U. SH. MILLION AT CURRENT PRICES)
ITEM 1963 1964 1965 1966 1967 1968 1969 1970 1971 1972 1973 1974 1975 t97$ 1977 1979 1979 990
MONETARY ECONOMY 1 3.216 3.537 3.937 4.248 4.240 4.604 5.234 5.836 6.498 0.641 7.303 8,512 11.317 1.547AGRICULTURE 2 1.121 1.290 1.3t9 1.480 1.351 1,396 1.691 2.021 2,4t6 2.597 3,187 3,603 5.996 7.533COTTON GINNING. COFFEE CURING
Atn SUGAR MANUFACTURE 3 117 104 95 96 96 103 114 146 121 90 87 73 60 72FORESTRY. FISHING & HUJNTING 4 42 44 47 52 67 114 123 155 10 188 218 226 204 250MININ- AND QUARRYING 5 42 85 135 104 84 106 145 144 116 104 99 93 59 43MAtJFACTURED FOOD PRODUCTS 6 38 37 47 49 61 59 52 58 70 91 72 120 114 142NISCELLANEOUS MANUFACTURING 7 266 269 322 359 366 437 520 576 609 602 635 939 1.143 t.242ELECTRICITY 8 48 53 61 68 76 82 84 90 98 94 93 90 09 83CPN!.TRUCTION 9 60 60 6o 69 85 102 124 116 159 its 96 181 137 123CfMMEPCE 10 558 628 758 81 822 916 989 1.051 996 880 887 1.181 1,440 1,662IPANSDOqT AND COMMUNICATIONS 11 175 190 210 225 240 258 269 263 314 322 339 406 430 454GENERAL GOVERNMENT 12 279 304 345 371 382 382 385 447 566 627 634 669 712 911MISCELLANEOUS SERVICES 2/ 13 262 276 314 351 390 419 466 472 495 468 446 414 402 480RENTS 14 188 197 204 213 220 230 272 295 358 454 510 517 531 545SUBSISTENCE PRODUCTION 15 1.362 1.530 1.925 1.871 1.991 2.022 2.245 2,701 3.165 3.549 4,393 5.750 9.459 10.466AGRICULTURE 16 1.092 1.227 1,565 1.511 1.608 1.638 1.821 2.224 2,644 2.779 3.466 4.774 8.439 9.405FORESTRY. FISHING & HUNTING 17 97 106 133 132 141 144 152 191 231 240 252 302 357 401CON-TRUCTIO 18 2 1 22 26 27 26 28 30 36 36 34 47 73 93 99OWNER OCCUPIEO DWELLINGS 19 152 173 199 201 201 212 242 240 254 496 628 901 670 561GOP AT FACTDO COST 20 4.57 .067 82 6 9 6. 6.26 779 a 7 9663 090 1696 1 62 2 76 2 63272 -10.798 1.26NET INDIRECT TAXES 21 338 536 448 497 668 780 863 921 1,105 1.097 1.257 1,763 1,726 2.440 4.946 6.327 10.680 21.325GOP AT MARKET PRICES 22 4.916 5.603 .1 99 70 342 9.58 0768 1.7 12.953 16.025 22.502 26.453 54,406 69.599 117.478 234.571
I/ DATA FOR 1977-60 ARE PRELIMINARY ESTIMATES ONLY.2/ INCLUDES EDUCATION. HEALTH. SOCIAL AND PERSONAL SERVICES ANDWATER SUPPLY.
SOURCE: (1) MINISTRY OF PLANNING AND ECONOMIC DEVELOPMENT. STATISTICALDEPARTMENT: (2) IMF ESTIMATES.
DATA SET: UA/2S

11:39 AM 03/te/82PAGE 1
TABLE 2.2UGANDA: GROSS DOMESTIC PRODUCT BY INDUSTRY
(U.SH. MILLION AT 1966 PRICES)
ITEM 1963 1964 1965 1966 1967 1968 1969 1970 1971 1972 1973 1974 1975 1976 1977 1978 1979 1980
MON!ETARY ECONOMY 26 3,599 3.769 3.939 4,248 4.354 4.454 4,997 5,095 5.252 5.200 5.068 4.984 4,768 4,738 4.757 4.333 3.693 3.762
AGRICULTURE 27 1.302 1.382 1,324 -.480 1,478 1.445 1.746 1,781 1,633 1.680 1.795 1.669 1.605 1.541 1.547 1.462 -. 315 1.177COTTON GINNING, COFFEE CURINGANU SUGAR MANUFACTURE 28 90 97 65 96 95 94 113 114 99 95 91 72 59 53 49 39 43 43FORESToY. FISHING A HUNTING 29 42 43 47 S2 59 65 75 Bi 94 97 100 99 97 115 428 126 116 104MININIZ AND OUARRYING 30 103 119 ill 104 99 110 116 119 112 100 72 69 59 40 21 15 6 6MATUrFACTURED FOOD PRODUCTS 31 47 57 56 49 48 56 57 61 57 63 57 49 41 36 40 29 it 6MISCELLANEOUS MANUFACTURING 32 275 270 317 359 378 393 432 456 482 482 450 464 405 405 391 304 193 207ELECIRICITY 33 47 52 60 68 78 84 86 92 100 99 99 97 95 90 92 92 71 47CONSTRUCIION 34 97 69 81 69 84 96 109 92 35 77 65 73 56 44 45 39 30 2OCOMMERCE 35 652 672 779 811 805 844 900 891 940 806 685 699 635 642 665 646 580 527TRAN$PORT AND COMMUNICATIONS 36 175 203 203 225 245 266 291 276 323 332 326 346 322 318 266 167 134 163GENERAL GOVERNMENT 37 279 304 345 371 382 382 385 447 566 627 634 663 712 729 751 800 840 882MISCELLANEOUS SERVICES 1/ 38 280 289 319 351 388 407 447 453 479 502 474 437 413 430 436 262 270 378RENTS 39 210 212 212 23 212 212 238 232 272 240 220 241 269 295 326 352 282 282
SUBSISTENCE PROOUCTION 40 1.673 1.747 1.848 1.871 1.942 2,005 2.174 2.187 2.245 2,342 2,428 2 525 2.589 2,673 2.770 2.848 2.483 2.094AGRICULTURE 41 1,349 1.405 1.494 1.511 1.566 1.634 1.765 1.763 1,003 1.886 1,955 2.037 2.085 2.151 2,230 2.291 1.902 1,535FORESTRY. FISHING & HUNTING 42 120 123 127 132 137 741 145 150 157 162 168 173 179 185 192 198 204 209CONSTRUCTION 43 25 26 26 27 28 28 29 30 31 32 34 35 36 30 39 40 41 f2OWNER OCCUPIED DWELLINGS 44 179 19Z 201 201 2tt 202 235 244 254 262 271 280 28tr 299 309 319 336 338GOP AT FACTOR COST 45 5.272 5,516 5.787 6,119 6.296 6,459 7.171 7,282 7.497 7,542 7.496 7.509 7.357 7.411 7.527 7.181 6.376 5.856
I INCLUDES EDUCATION. HEALTH. SOCIAL AND PERSONAL SERVICES ANDWATER SUPPLY.
SOURCE: (1) MINISTRY OF PLANNING AND ECONOMIC DEVELOPMENT. STATISTICALDEPARTMENT.
DATA SET: USA/2S

11:45 PM 03/16/82PAGE 1
TABLE 2.3UGANDA: EXPENDITURE ON GROSS NATIONAL PRODUCT 1/
(U.SH. MILLION AT CURRENT PRICES)
. ITEM 1963 1964 V965 1966 1967 1966 1969 1970 1971 1972 1973 1974 1975 1976 1977 1979 IV79 1960
RESOURCES & EXPENDITURE
DISPOSABLE INCOME 61 4.865 5,566 6.176 6.492 6.779 7,2,0 8,216 9.262 10.513 11.052 12.808 15.844 22.419 26.322 54.255 69.510 117.286 234.Sti
- CURRENT TRANSFERS 3/ -62 -89 -94 -114 -45 -66 -55 .- 73 -61 -81 -142 2
GNP AT MARKET PRICES 59 4.865 5.566 6.176 6.492 6.764 7.286 8.216 9.351 10.607 11.t66 12.853 15,910 22.474 26,395 54.316 69.591 117,428 234.509
- FACTOR INCOME FROM ABROAD 58 -51 -37 -134 -124 -135 -120 -126 -107 -161 -121 -100 -115 -28 -58 -90 -8 -50 -62
GOP AT MARKET PRICES 55 4,916 5,603 6.310 6.616 6.99 7,406 8.342 9.458 10.768 11.287 12.953 16.025 22.502 26.453 54.406 69.599 117.478 234.571
+ IMPORTS OF GOODS AND NFS 53 1,166 1.287 i.539 1.674 1.685 1.676 1,698 1.810 2.425 1,787 1.599 2E.215- 2.318 2.351 3.893 3.524- 2.919 4.244
- EXPORTS OF GOODS AND NFS 54 1.349 1.627 1.616 1.690 1.748 1.774 1.797 2.101 2,006 2.065 2,012 2,167 1,837 2,787 4.569 2.550 3.078 2.467
TOTAL RESOURCES 48 4.73 5.263 6.23 3 9 7 1 9 1 40 16073 22983 2617 5730 70.573 17.1 23
CONSUMPTION 2/ 49 4.0il 4.465 5,376 5.709 5.774 6.197 6,821 7.906 9.555 9,771 11.478 14.362 21.271 24.486 50.712 67.136 114.209 220.46 6
GROSS DOMESTIC INVESTMENT 63 722 798 857 891 1.062 1.111 1,422 1.261 1.632 1.238 1.062 1.711 1,712 1.531 3.018 3.437 3.110 7.930 0- GROSS FIXED INVESTMENT 50 686 676 886 883 1.039 1,080 1.18 1.200 1.529 1.315 1,001 1,571 1,541 1,209
- CHANGE IN STOCKS 51 36 122 -29 8 23 31 234 61 103 -77 61 140 171 322
INVESTMENT FINANCING
GROSS DOMESTIC INVESTMENT 63 722 798 857 891 1.062 1,111 1,422 1,261 1,632 1.238 1,062 1.7t1 1.712 1,531 3.018 3.437 3.110 7.930
GROSS NATIONAL SAVINGS 2/ 64 854 1.101 800 783 990 1.089 1.395 V.356 958 1,282 1,320 1,481 1,148 1,835 3.543 2.374 3.077 6.092
CURRENT ACCOUNT DEFICIT (+) 65 -132 -303 57 108 72 22 27 -95 674 -44 -250 230 564 -304 -525 1.063 33 1.838
i/ DATA FOR 1977-80 ARE PRELIMINARY ESTIMATES ONLY.2/ RESIDUAL. -3/ EXCLUDES OFFICIAL GRANT RECEIPTS. DATA UNAVAILABLE PRIOR
TO 197C.
SOURCE: (1) MINISTRY OF PLANNING AND ECONOMIC DEVELOPMENT. STATISTICALDEPARTMENT: (2) IMF AND WORLD BANK ESTIMATES.
DATA SET: UGA/2S

11:41 PM 03/15/82PAGE 1
TABLE 2.4UGANDA: CAPITAL FORMATION BY TYPE OF ASSET
(U. SH. MILLION AT CURRENT PRICES)
ITEM 1966 1967 1968. 1969 1970 1971 1972 1973 1974 1975 1976
MONETARY ECONOMY
BUILDING AND CONSTRUCTION 137 323 396 445 530 536 686 565 504 817 667 449TRANSPORT EQUIPMENT 138 155 147 114 161 127 242 98 61 173 245 175MACHINERY & OTHER EQUIPMENT 139 296 382 408 378 374 620 523 329 363 413 343GROSS FIXED CAPITAL FORMATION 140 774 925 967 1,069 .1,037 1,548 1,186 894 1,353 1,325 967CHANGE IN STOCK 141 -8 -5 -1 130 61 -7 -111 -43 -7 -34 35GROSS INVESTMENT 142 766 920 966 1,199 1,098 1,541 1.075 851 1,346 1,291 1.002NON-MONETARY ECONOMY -
BUILDINGS 143 109 114 113 119 124 148 129 107 218 216 242CHANGE IN STOCK 144 16 28 32 104 39 23 34 104 147 205 287GROSS INVESTMENT 145 125 142 145 223 163 171 163 211' 365 421. 529TOTAL FIXED CAPITAL FORMATION 146 883 1.039 1,080 1,188 1,161 1,696 1,315 1,001 1.571 1,541 1,209TOTAL CHANGE IN STOCK 147 8 23 31 234 100 16 -77 61 140 171 322TOTAL GROSS INVESTMENT 148 891 1,062 1,111 1,422 1,261 1,712 1.238 1,062 1,711 1,712 1.531
SOURCE: MINISTRY OF PLANNING AND ECONOMIC DEVELOPMENT. STATISTICALDEPARTMENT.
DATA SET: UGA/2S
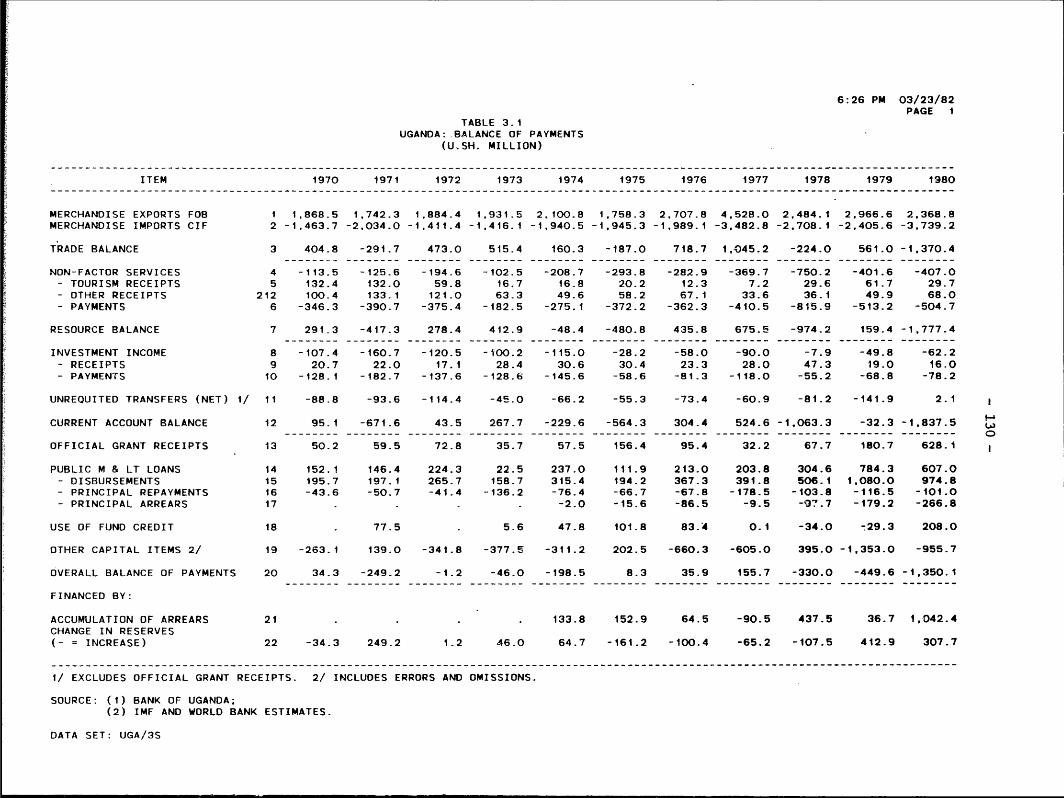
6:26 PM 03/23/82PAGE 1
TABLE 3.1UGANDA:.BALANCE OF PAYMENTS
(U.SH. MILLION)
ITEM 1970 1971 1972 1973 1974 1975 1976 1977 1978 1979 1980
MERCHANDISE EXPORTS FOB 1 1.868.5 1,742.3 1,884.4 1,931.5 2.100.8 1,758.3 2,707.8 4,528.0 2,484.1 2,966.6 2,368.8MERCHANDISE IMPORTS CIF 2 -1.463.7 -2.034.0 -1.411.4 -1,416.1 -1,940.5 -1,945.3 -1,989.1 -3,482.8 -2,708.1 -2.405.6 -3,739.2
TRADE BALANCE 3 404.8 -291.7 473.0 515.4 160.3 -187.0 718.7 1,045.2 -224.0 561.0 -1,370.4
NON-FACTOR SERVICES 4 -113.5 -125.6 -194.6 -102.5 -208.7 -293.8 -282.9 -369.7 -750.2 -401.6 -407.0- TOURISM RECEIPTS 5 132.4 132.0 59.8 16.7 16.8 20.2 12.3 7.2 29.6 61.7 29.7- OTHER RECEIPTS 212 100.4 133.1 121.0 63.3 49.6 58.2 67.1 33.6 36.1 49.9 68.0- PAYMENTS 6 -346.3 -390.7 -375.4 -182.5 -275.1 -372.2 -362.3 -410.5 -815.9 -513.2 -504.7
RESOURCE BALANCE 7 291-3 -417.3 278.4 412.9 -48.4 -480.8 435.8 675.5 -974.2 159.4 -1,777.4
INVESTMENT INCOME 8 -107.4 -160.7 -120.5 -100.2 -115.0 -28.2 -58.0 -90.0 -7.9 -49.8 -62.2- RECEIPTS 9 20.7 22.0 17.1 28.4 30.6 30.4 23.3 28.0 47.3 19.0 16.0- PAYMENTS 10 -128.1 -182.7 -137.6 -128.6 -145.6 -58.6 -81.3 -118.0 -55.2 -68.8 -78.2
UNREQUITED TRANSFERS (NET) 1/ 11 -88.8 -93.6 -114.4 -45.0 -66.2 -55.3 -73.4 -60.9 -81.2 -141.9 2.1
CURRENT ACCOUNT BALANCE 12 95.1 -671.6 43.5 267.7 -229.6 -564.3 304.4 524.6 -1,063.3 -32.3 -1,837.5
OFFICIAL GRANT RECEIPTS 13 50.2 59.5 72.8 35.7 57.5 156.4 95.4 32.2 67.7 180.7 628.1
PUBLIC M & LT LOANS 14 152.1 146.4 224.3 22.5 237.0 111.9 213.0 203.8 304.6 784.3 607.0- DISBURSEMENTS 15 195.7 197.1 265.7 158.7 315.4 194.2 367.3 391.8 506.1 1,080.0 974.8- PRINCIPAL REPAYMENTS 16 -43.6 -50.7 -41.4 -136.2 -76.4 -66.7 -67.8 -178.5 -103.8 -116.5 -101.0- PRINCIPAL ARREARS 17 . . . . -2.0 -15.6 -86.5 -9.5 -97.7 -179.2 -266.8
USE OF FUND CREDIT 18 . 77.5 . 5.6 47.8 101.8 83.4 0.1 -34.0 -:29.3 208.0
OTHER CAPITAL ITEMS 2/ 19 -263.1 139.0 -341.8 -377.5 -311.2 202.5 -660.3 -605.0 395.0 -1,353.0 -955.7
OVERALL BALANCE OF PAYMENTS 20 34.3 -249.2 -1.2 -46.0 -198.5 8.3 35.9 155.7 -330.0 -449.6 -1.350.1
FINANCED BY:
ACCUMULATION OF ARREARS 21 . . . . 133.8 152.9 64.5 -90.5 437.5 36.7 1,042.4CHANGE IN RESERVES(- = INCREASE) 22 -34.3 249.2 1.2 46.0 64.7 -161.2 -100.4 -65.2 -107.5 412.9 307.7
1/ EXCLUDES OFFICIAL GRANT RECEIPTS. 2/ INCLUDES ERRORS AND OMISSIONS.
SOURCE: (1) BANK OF UGANDA;(2) IMF AND WORLD BANK ESTIMATES.
DATA SET: UGA/3S

1:10 PM 09/15/S1PAGE 1
TABLE 3.2UGANDA: MERCHANDISE EXPORTS
ITEM 1966 1967 196A 1969 1970 1971 1972 1973 1974 1975 1976 1977 1978 1979 190
VOLUME ('000 TONS)
COFFEE 1/ 30 167.1 159.5 151.6 180.6 191.2 174.6 214.2 192.4 187.2 176.6 153.1 132.4 113.4 143.5 110.0COTTON 2/ 31 69.8 72.0 61.7 52.9 78.1 68.7 66.1 64.7 36.2 25.6 19.2 9.9 . 11.8 3.5 2.3TEA 3/ 32 9.0 9.6 11.4 15.9 15.1 15.3 20.7 19.2 16.7 17.1 11.7 8.8 8.7 1.4 0.5COPPER 33 15.8 15.0 15.6 16.6 16.4 16.8 14.1 9.7 9.0 7.8 5.4 2.5 7.1 4.4TOBACCO (UNMANUFACTURED) 34 2.5 2.9 2.1 2.4 2.0 2.2 12.5 1.5 1.1 1.3 1.1 1.8 1.2 0.4UNIT VALUE (U.SH./KG.)
COFFEE 1/ 35 4.2 4.3 4.7 4.3 5.3 5.6 5.3 6.5 8.4 7.9 16.2 34.3 21.3 22.2 22.9COTTON 2/ 36 4.4 4.2 4.8 4.7 4.5 5.1 ,5.6 5.2 7.5 8.3 9.5 12.7 13.0 16.2 13.5TEA 3/ 37 7.1 7.4 6.6 5.9 6,3 6.3 6.1 5.7 6.6 7.1 7.6 11.8 7.4 7.5 4.5COPPER 38 7.3 7.3 7.1 7.2 10.1 8.2 8.0 11.3 13.4 8.9 9.3 9.5 3.4 2.1TOBACCO (UNMANUFACTURED) 39 5.6 8.4 7.3 8.3 9.2 9.7 7.6 9.3 8.5 12.2 14.5 16.1 11.6 17.3VALUE (U.SH. MILLION)
COFFEE 1/ 40 695.7 692.0 714.6 780.0 1.014.5 982.3 1.128.3 1.247.6 1,567.8 1,398.1 2.487.0 4,536.3 2.419.4 3.179.5 2.523.9COTTON 2/ 41 306.9 303.2 295.7 251.0 351.0 352.1 370.7 336.0 272.3 213.2 182.0 126.4 152.3 56.2 31.5TEA 3/ 42 63.7 70.9 75.4 93.5 95.0 95.2 125.5 110.0 109.6 120.8 89.2 103.0 63.8 10.6 2.4COPPER 43 115.1 109.3 111.5 120.3 165.5 137.7 112.8 109.5 120.7 69.5 59.2 23.7 24.1 9.41TOBACCO (UNMANUFACTURED) 44 13.9 24.3 15.3 19.8 18.3 21.3 18.9 13.9 9.4 15.9 15.9 29.0 13.9 6.9 24.4OTHER EXPORTS 45 332.1 345.0 310.5 323.4 336.7 260.4 252.7 207.6 165.7 83.8 85.0 46.9 14.4 16.7RE-EXPORTS 46 23.7 18.1 17.5 14.2 13.3 9.2 9.7 4.6 3.3 4.8 1.7 0.3 .CUSTOMS TOTAL - 47 1,551.1 1,562.8 1,540.5 1,602.2 1.994.3 1.857.2 2,018.6 2,029.2 2.248.8 1,906.1 2.920.0 4,865.6 2,687.9 3.279.3 2.582.2ERRORS AND OMISSIONS 126 0.4 0.6 12.3 61.6 18.6 . -0.1 0.5 . -2.8 -1.1 -1.7 0.5 -82.3
ADJUSTMENTS FOR:VALUATION 127 -75.1 -72.6 -83.4 -86.7 -107.5 -105.4 -117.6 -92.6 -128.3 -106.8 -180.9 -306.3 -166.7 -198.2 -173.0COVERAGE 128 -1.4 -0.7 -0.2 -0.4 -0.3 -0.8 -0.2 -5.6 -19.7 -38.2 -30.2 -29.6 -37.6 -32.2 -39.5TIMING 129 -4.4 6.1 22.2 0.9 -36.6 -8.7 -16.3 . . . . -
TOTAL EXPORTS 130 1.470.6 1,496.2 1,491.4 1,577.6 1,868.5 1,742.3 1,884.4 1.931.5 2.100.8 1.758.3 2.707.8 4.528.0 2,484.1 2.966.6 2.36.8.s....e m....mes .e...... .mam.m.a .massa.. .memew.a mass.ems a.amm.e. ........ ........ ........ ...... ...... ........"**
I/ DATA FROM 1973 ARE FROM COFFEE MARKETING BOARD.2/ DATA FROM 1977 ARE FROM LINT MARKETING BOARD3/ DATA FROM 1977 ARE FROM UGANDA TEA AUTHORITY.
SOURCES: (M) EAC AND UGANDA CUSTOMS. ANNUAL TRADE REPORTS.(2) BANK OF UGANDA.
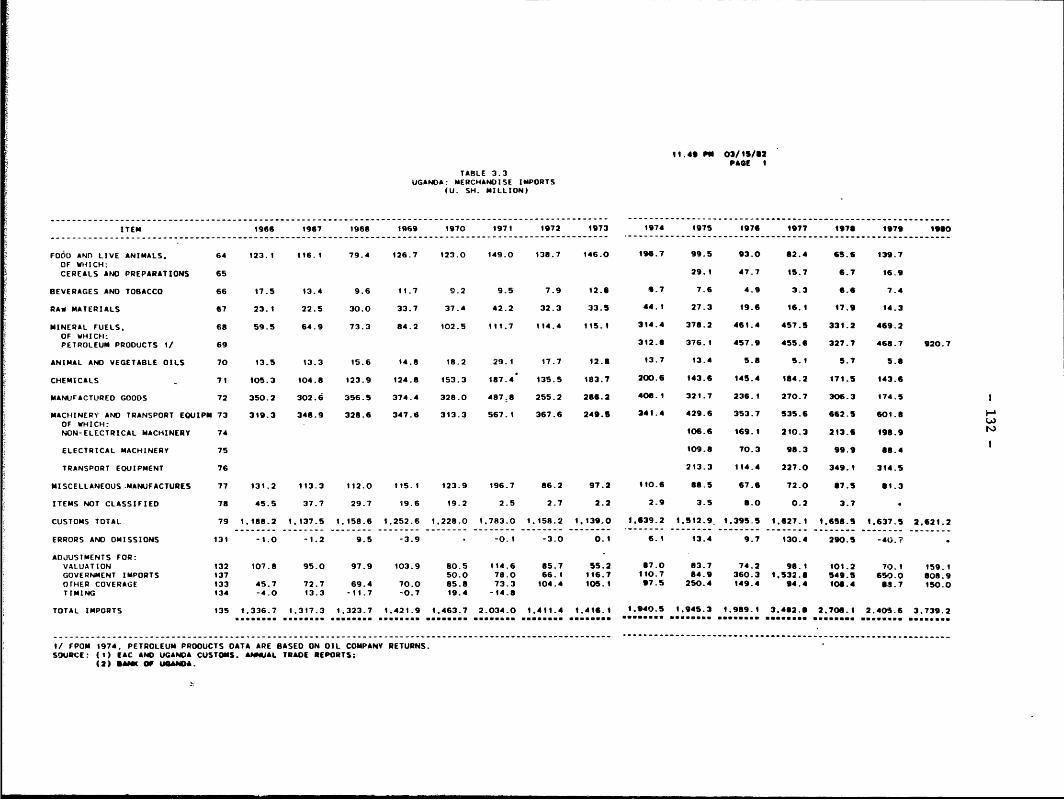
11.49 P" 03/115/82PAGE I
TABLE 3.3UGANDA: MERCHANDISE IMPORTS
(U. SH. MILLION)
ITEM 1966 1967 1968 1969 1970 1971 1972 1973 1974 1975 1976 1977 1978 1979 190
FO60 ANn LIVE ANIMALS. 64 123.1 116.1 79.4 126.7 123.0 149.0 138.7 146.0 196.7 99.5 93.0 82.4 65.5 139.7
OF WHICH:CEREALS AND PREPARATIONS 65 29.1 47.7 15.7 6.7 16.9
BEVERAGES AND TOBACCO 66 17.5 13.4 9.6 1i.7 9.2 9.5 7.9 12.8 4.7 7.6 4.9 3.3 6.6 7.4
RAW MATERIALS 67 23.1 22.5 30.0 33.7 37.4 42.2 32.3 33.5 44.1 27.3 19.6 16.1 17.9 14.3
MINERAL FUELS. 68 59.5 64.9 73.3 84.2 102.5 111.7 114.4 115.1 314.4 378.2 461.4 457.5 331.2 469.2
OF WHICH:P O PROUCT 312.8 376.1 457.9 455.6 327.7 468.7 920.7PETROLEUM PRODUCTS 1/ 69
ANIMAL AND VEGETABLE OILS 70 13.5 13.3 15.6 14.8 18.2 29.1 17.7 12.8 13.7 13.4 5.8 5.1 5.7 5.8
CHEMICALS 71 105.3 104.8 123.9 124.8 153.3 187.4 135.5 183.7 200.6 143.6 145.4 184.2 171.5 143.6
MANUrACTURED GOODS 72 350.2 302.6 356.5 374.4 328.0 487.8 255.2 286.2 406.1 321.7 236.1 270.7 306.3 174.5
MACHINERY AND TRANSPORT EQUIPM 73 319.3 348.9 328.6 347.6 313.3 567.1 367.6 249.5 341.4 429.6 353.7 535.6 662.5 601.8
OF WHICH:NON-ELECTRICAL MACHINERY 74 106.6 169.1 210.3 213.6 198.9
ELECTRICAL MACHINERY 75 109.8 70.3 98.3 99.9 88.4
TRANSPORT EQUIPMENT 76 213.3 114.4 227.0 349.1 314.5
MISCELLANEOUS.MANUFACTURES 77 131.2 113.3 112.0 t15.1 123.9 196.7 86.2 97.2 $10.6 88.5 67.6 72.0 87.5 01.3
ITEMS NOT CLASSIFIED 78 45.5 37.7 29.7 19.6 19.2 2.5 2.7 2.2 2.9 3.5 6.0 0.2 3.7
CUSTOMS TOTAL 79 1.188.2 1.137.5 1.158.6 1.252.6 1.228.0 1.783.0 1.158.2 1,139.0 .639.2 1.5t2.9, 1,395.5 1.627.1 I.658.5 1.637.5 2.621.2
ERRORS AND OMISSIONS 131 -1.0 -1.2 9.5 -3.9 . -0.1 -3.0 0.1 6.1 13.4 9.7 130.4 290.5 -40.7
ADJUSTMENTS FOR:VALUATION 132 107.8 95.0 97.9 103.9 80.5 114.6 85.7 55.2 67.0 83.7 74.2 98.1 101.2 70.1 159.1GOVERNMENT IMPORTS 137 50.0 78.0 66.1 116.7 110.7 84.9 360.3 1.532.6 549.5 650.0 808.9OTHER COVERAGE 133 45.7 72.7 69.4 70.0 85.8 73.3 104.4 105.1 97.5 250.4 149.4 94.4 105.4 68.7 150.0TIMING 134 -4.0 13.3 -11.7 -0.7 19.4 -14.6
TOTAL IMPORTS 135 1.336.7 1.317.3 1.323.7 1.421.9 1.463.7 2.034.0 1.411.4 1.416.1 1.940.5 1.945.3 1.989.1 3.482.9 2.708.1 2.405.6 3.739.2
I/ FPOM 1974, PETROLEUM PRODUCTS DATA ARE BASED ON OIL COMPANY RETURNS.SOURCE: (1) EAC AND UGANDA CUSTOMS. ANNUAL TRADE REPORTS;
(2) @,ei OF UsANA.

11:34 AM 03/16/82PAGE 1
TABLE 3.4UGANDA: IMPORTS OF PETROLEUM PRODUCTS 1/
ITEM 1971 1972 1973 1974 1975 1976 1977 1978 1979 1980 1981
VOLUME (TONS) 60 451,633 399.075 354.827 367,980 351,476 297,927 303,599 258,194 220,269 259,428 142,800
AVIATION FUEL 50 77,917 68,720 37,663 38,629 36,489 23,626 20,196 10,627 5,021 12,915 9,000
MOTOR SPIRIT 51 108,343 112,975 108,551 115,933 113,421 89,007 94,733 90,279 59,297 85,985 40,300
KEROSENE 52 89,985 36,285 40.784 41,546 46,493 55,967 51,697 44,185 39,755 47,816 20,000
AUTO DIESEL 53 83,851 81,514 75,814 72,715 73,744 56,220 59,294 58,815 48,006 72,507 43,700
INDUSTRIAL DIESEL 54 11,262 9,616 8,004 7.024 6,804 4,410 4,844 3,190 1,589 1.455
FUEL OIL 55 70,273 68,076 68,517 76.321 59,123 56,202 60,100 36,115 51,770 23,675 19,000
LUBRICANTS 56 3,871 8,794 8,720 9,492 6,578 4,232 5,682 5,020 8,026 7,252 4.900
BITUMEN 57 1,945 9,156 3,259 3,021 2,493 1,523 1,878 2,382 885 1,131 600
L.P. GAS 58 3,842 2,459 2,573 2,700 2,759 2,527 1,900 1,492 695 804 600 o
OTHER 59 344 1,420 942 599 3,572 4,211 3,275 6,089 5,226 5,888 4,700 1
VALUE (U.SH. '000) 2/ 61 111,218 115,574 136,407 312,800 376,121 457,896 455,647 327,686 468,704 920,703
1/ DATA FOR 1981 ARE ESTIMATES.2/ INCLUDES ALL FOREIGN EXCHANGE RELEASED FOR OIL COMPANIES, COVERING
BOTH IMPORT AND SERVICE PAYMENTS. VALUE IN 1981 IS ESTIMATED ATUS$114 MILLION, OP U.SH. 5.7 BILLION AT AN AVERAGE EXCHANGE RATE OFU.SH.50=US$1.
SOURCE; BANK OF UGANDA, BASED ON DATA PROVIDED BY OIL COMPANIES.
DATA SET: UGA/3S
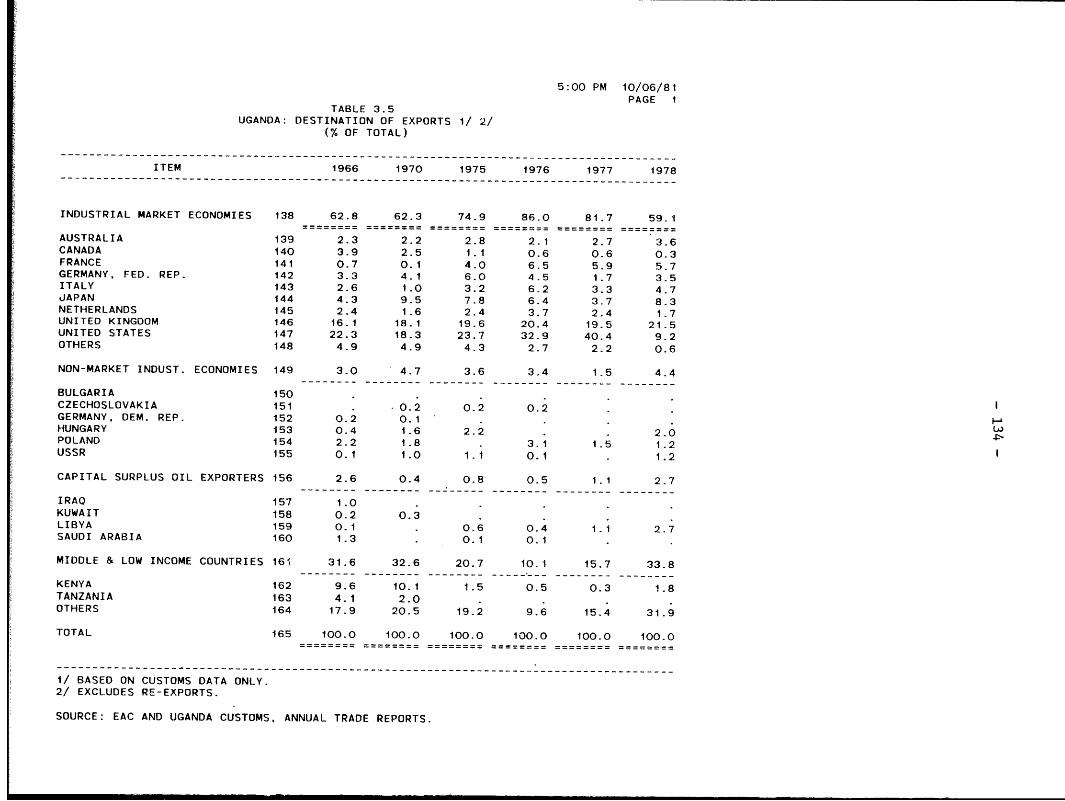
5:00 PM 10/06/81PAGE 1
TABLE 3.5UGANDA: DESTINATION OF EXPORTS 1/ 2/
(% OF TOTAL)
ITEM 1966 1970 1975 1976 1977 1978
INDUSTRIAL MARKET ECONOMIES 138 62.8 62.3 74.9 86.0 81.7 59.1
AUSTRALIA 139 2.3 2.2 2.8 2.1 2.7 3.6CANADA 140 3.9 2.5 1.1 0.6 0.6 0.3FRANCE 141 0.7 0.1 4.0 6.5 5.9 5.7GERMANY, FED. REP. 142 3.3 4.1 6.0 4.5 1.7 3.5ITALY 143 2.6 1.0 3.2 6.2 3.3 4.7JAPAN 144 4.3 9.5 7.8 6.4 3.7 8.3NETHERLANDS 145 2.4 1.6 2.4 3.7 2.4 1.7UNITED KINGDOM 146 16.1 18.1 19.6 20.4 19.5 21.5UNITED STATES 147 22.3 18.3 23.7 32.9 40.4 9.2OTHERS 148 4.9 4.9 4.3 2.7 2.2 0.6
NON-MARKET INDUST. ECONOMIES 149 3.0 4.7 3.6 3.4 1.5 4.4
BULGARIA 150 . .CZECHOSLOVAKIA 151 . 0.2 0.2 0.2GERMANY, DEM. REP. 152 0.2 0.1 . . .HUNGARY 153 0.4 1.6 2.2 . . 2.0POLAND 154 2.2 1.8 . 3.1 1.5 1.2USSR 155 0.1 1.0 1.1 0.1 . 1.2
CAPITAL SURPLUS OIL EXPORTERS 156 2.6 0.4 0.8 0.5 1.1 2.7
IRAQ 157 1.0 . . .KUWAIT 158 0.2 0.3 . .LIBYA 159 0.1 - 0.6 0.4 1.1 2.7SAUDI ARABIA 160 1.3 . 0.1 0.1
MIDDLE & LOW INCOME COUNTRIES 161 31.6 32.6 20.7 10.1 15.7 33.8
KENYA 162 9.6 10.1 1.5 0.5 0.3 1.8TANZANIA 163 4.1 2.0 . .OTHERS 164 17.9 20.5 19.2 9.6 15.4 31.9
TOTAL 165 100.0 100.0 100.0 100.0 100.0 100.0
1/ BASED ON CUSTOMS DATA ONLY.2/ EXCLUDES RE-EXPORTS.
SOURCE: EAC AND UGANDA CUSTOMS, ANNUAL TRADE REPORTS.

3:01 PM 09/20/81PAGE 1
TABLE 3.6UGANDA: ORIGIN OF IMPORTS 1/
(% OF TOTAL)
ITEM 1966 1970 1975 1976 1977 1978
INDUSTRIAL MARKET ECONOMIES 170 54.5 55.8 41.6 42.4 46.6 68.6
AUSTRALIA 171 0.4 0.6 0.4 0.9 0.3 0.1CANADA 172 0.6 0.8 0.2 1.2 0.2 0.3FRANCE 173 3.2 2.6 2.1 1.5 3.7 3.8GERMANY. FED. REP. 174 8.1 6.4 6.3 9.2 12.5 12.6ITALY 175 3.7 3.7 5.2 2.3 7.5 7.1JAPAN 176 3.9 8.1 5.9 3.9 4.7 8.3NETHERLANDS 177 1.7 2.1 1.3 2.0 0.9 2.0UNITED KINGDOM 178 26.1 22.7 13.3 15.1 12.8 17.4UNITED STATES 179 2.8 4.2 1.7 3-1 1.0 1.9OTHERS 180 4.0 4.6 5.2 3.2 3.0 15.1
NON-MARKET INDUST. ECONOMIES 181 1.6 1.7 3.0 1.8 0.9 0.6
BULGARIA 182 . . . . . .
CZECHOSLOVAKIA 183 0.5 0.4 0.3 0.5 0.3 0.1GERMANY, DEM. REP. 184 0.1 0.1 . . .
HUNGARY 185 0.3 0.2 0.1 . 0.2 . LnPOLAND 186 0.3 0.4 . 0.1 . .USSR 187 0.3 0.7 2.6 1.2 0.5 0.5
CAPITAL SURPLUS OIL EXPORTERS 188 . . 0.3 0.3 0.1
IRAO 189 . . . 0.3KUWAIT 190 . . 0.3 .LIBYA 191 . . . . 0.1SAUDI ARABIA 192 . . . .
MIDDLE & LOW INCOME COUNTRIES 193 43.9 42.5 55.1 55.5 52.4 30.8
KENYA 2/ 194 26.3 27.2 44.8 50.1 45.4 28.5TANZANIA 195 1.4 2.3 0.4 0.5 0.2OTHERS 196 16.2 13.0 9.9 4.9 6.8 2.3
TOTAL 197 100.0 100.0 100.0 100.0 100.0 100.0
1/ BASED ON CUSTOMS DATA ONLY.2/ INCLUDES IMPORTS OF PETROLEUM PRODUCTS.
SOURCE: EAC AND UGANDA CUSTOMS, ANNUAL TRADE REPORTS.

- 136 -
3:27 PM 02/02/82PAGE i
TABLE 3.7UGANDA: TRADE INDICES 1/
(1978 - 100)
ITEM 1966 1967 1968 1969 1970 1971 1972 1973
MERCHANDISE EXPORTS 2/
VOLUME 32 215.4 213.3 202.6 231.8 235.4 206.9 234.7 213.5
UNIT VALUE 83 29.6 30.4 31.9 29.5 34.4 36.5 34.8 39.9
VALUE 84 63.7 64.9 64.6 68.4 81.0 75.5 81.7 85.2
MERCHANDISE IMPORTS 3/
VOLUME 85 159.0 156.3 165.0 176.7 170.7 209.0 134.9 109.7
UNIT VALUE 86 33.4 33.5 31.9 32.0 34.1 38.7 41.6 52.2
VALUE 87 53.1 52.4 52.6 56.5 58.2 80.9 56.1 57.3
TERMS OF TRADE 4/ 88 88.6 90.7 100.0 92.2 100.9 94.3 83.7 76.4
EXPORT PURCHASING POWER 5/ 136 190.8 193.5 202.6 213.7 231.5 195.1 196.4 163.1
ITEM 1974 1975 1976 1977 1978 1979 1980 1981
MERCHANDISE EXPORTS 2/
VOLUME 82 184.5 162.8 139.3 116.0 100.0 114.7 88.8 93.3
UNIT VALUE 83 49.4 45.1 71.9 146.2 100.0 107.1 111.3 73.0
VALUE 84 91.1 73.4 100.2 169.6 100.0 123.0 98.8 68.1
MERCHANDISE IMPORTS 3/
VOLUME 85 108.6 94.8 77.0 129.5 100.0 71.6 90.3 70.5
UNIT VALUE 86 71.1 78.6 87.7 92.4 100.0 127.7 158.4 161.2
VALUE 87 77.2 74.5 67.5 119.7 100.0 91.5 143.1 113.6
TERMS OF TRADE 4/ 88 69.5 57.4 82.0 158.2 100.0 83.9 70.4 45.3
EXPORT PURCHASING POWER 5/ 136 128.2 93.4 114.2 183.5 100.0 96.2 62.5 42.3
1/ IN TERMS OF US DOLLARS.2/ UNIT VALUE SERIES ARE DERIVED FROM TABLE 3.2 FOR COFFEE, COTTON
TEA, COPPER AND TOBACCO. FOR ALL OTHER ITEMS INCLUDED IN CUSTOMSDATA, UNIT VALUES ARE ASSUMED TO RISE WITH THE INDEX OF INTERNATIONALINFLATION. THE OVERALL UNIT VALUE INDEX FOR CUSTOMS DATA IS THENAPPLIED TO TOTAL EXPORTS TO DERIVE THE VOLUME INDEX.
3/ THE UNIT VALUE SERIES FOR MINERAL FUELS IS DERIVED FROM THE WORLDBANK'S COMMODITY PRICE SERIES FOR PETROLEUM THROUGH 1971. AND FROM TABLE3.4 IN SUBSEQUENT YEARS. THE UNIT VALUE SERIES FOR FOOD, BEVERAGESAND TOBACCO, RAW MATERIALS AND ANIMAL AND VEGETABLE OILS ARE DERIVEDFROM APPROPRIATE WORLD BANK COMMODITY PRICE SERIES. FOR ALL OTHERITEMS INCLUDED IN CUSTUMS DATA. UNIT VALUES ARE ASSUMED TO RISE WITHTHE INDEX OF INTERNATIONAL INFLATION. THE OVERALL UNIT VALUE INDEXFOR CUSTOMS DATA IS THEN APPLIED TO TOTAL IMPORTS TO DERIVE VOLUME INDEX.
4/ EXPORT UNIT VALUE INDEX DIVIDED BY IMPORT UNIT VALUE INDEX,MULTIPLIED BY 100.
5/ EXPORT VOLUME INDEX MULTIPLIED BY TERMS OF TRADE INDEX, DIVIDED BY 100.
SOURCE: WORLD BANK ESTIMATES.
DATA SET: UGA/3S
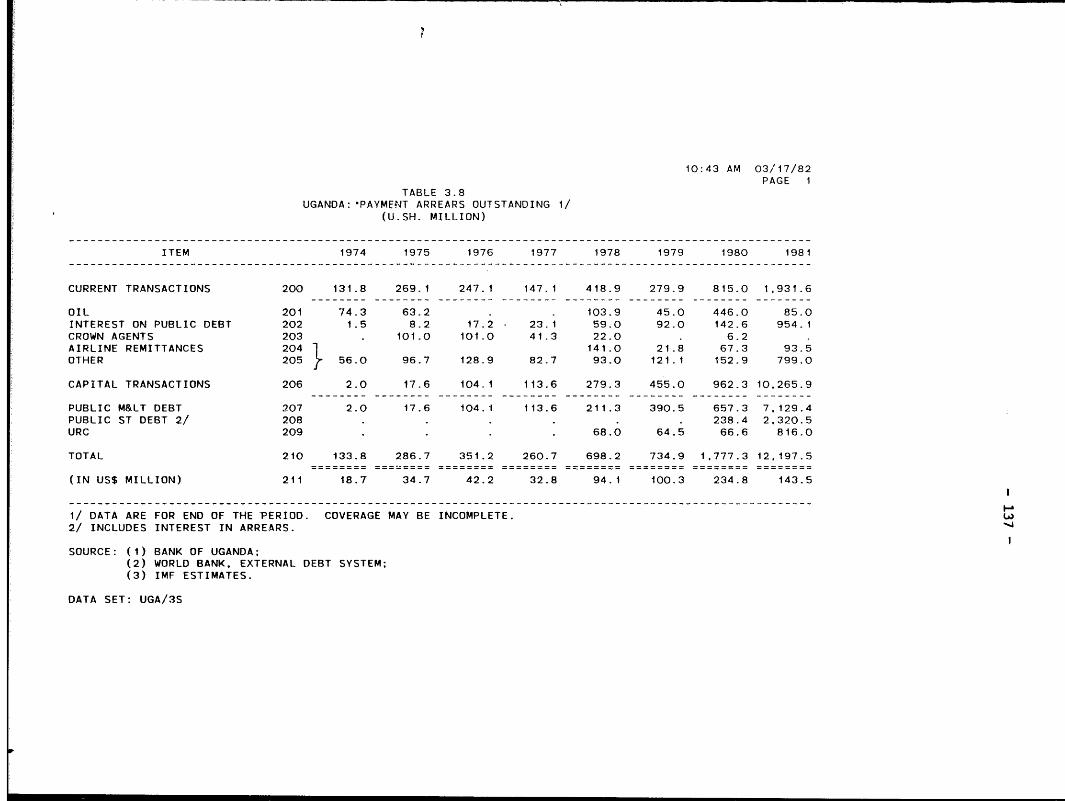
10:43 AM 03/17/82PAGE 1
TABLE 3.8UGANDA:'PAYMENT ARREARS OUTSTANDING 1/
(U.SH. MILLION)
ITEM 1974 1975 1976 1977 1978 1979 1980 1981
CURRENT TRANSACTIONS 200 131.8 269.1 247.1 147.1 418.9 279.9 815.0 1,931.6
OIL 201 74.3 63.2 . . 103.9 45.0 446.0 85.0INTEREST ON PUBLIC DEBT 202 1.5 8.2 17.2 23.1 59.0 92.0 142.6 954.1CROWN AGENTS 203 . 101.0 101.0 41.3 22.0 . 6.2AIRLINE REMITTANCES 204 141.0 21.8 67.3 93.5OTHER 205 56.0 96.7 128.9 82.7 93.0 121.1 152.9 799.0
CAPITAL TRANSACTIONS 206 2.0 17.6 104.1 113.6 279.3 455.0 962-3 10,265.9
PUBLIC M< DEBT 207 2.0 17.6 104.1 113.6 211.3 390.5 657.3 7,129.4PUBLIC ST DEBT 2/ 208 . . . . . . 238.4 2,320.5URC 209 . . . . 68.0 64.5 66.6 816.0
TOTAL 210 133.8 286.7 351.2 260.7 698.2 734.9 1,777.3 12,197.5
(IN US$ MILLION) 211 18.7 34.7 42.2 32.8 94.1 100.3 234.8 143.5
1/ DATA ARE FOR END OF THE PERIOD. COVERAGE MAY BE INCOMPLETE.2/ INCLUDES INTEREST IN ARREARS.
SOURCE: (1) BANK OF UGANDA;(2) WORLD BANK, EXTERNAL DEBT SYSTEM;(3) IMF ESTIMATES.
DATA SET: UGA/3S

0:34 PU 0/23/S
TABLE 3.9 PAG I
UGANDA: EXTERNAL RESERVES(U.SH. MILLION)
ITEM 1967 1968 1969 1970 1971 1972 1973 1974 1975 1976 1977 1978 1979 1960
BANK OF UGANDA 220 244.1 348.1 368.8 400.7 184.2 201.3 147.5 82.1 183.6 278.0 267.4 344.3 17.2 -292.6
ASSETS 221 245.1 349.3 373.7 401.5 192.1 256.9 200.1 119.5 207.9 311.8 315.9 391.0 167.1 22.7- FOREIGN EXCHANGE 222 216.3 320.5 341.8 317.3 118.1 150.9 88.1 75.5 176.9 302.8 272.9 256.2 86.1 22.7- SDRS 223 . . . 38.0 74.0 106.0 112.0 44.0 31.0 9.0 43.0 78.0 81.0- RESERVE POSITION IN FUND 224 28.8 28.8 31.9 46.2 . . . . . . . 56.8LIABILITIES 225 1.0 1.2 4.9 0.8 7.9 55.6 52.6 37.4 24.3 33.8 48.5 46.7 149.9 315.5
GOVERNMENT AND EACS 226 25.9 14.2 5.2 7.6 7.6 7.6 3.2 . . .
COMMERCIAL BANKS 227 17.1 -2.7 54.6 54.6 21.9 3.6 15.9 19.7 79.4 85.4 161.2 191.8 IS.0 108.3
ASSETS 228 89.6 49.0 78.8 70.5 61.9 63.2 38.4 70.5 101.5 146.7 256.5 233.6 243.6 140.0LIABILITIES 229 72.5 51.7 24.2 15.9 40.0 59.6 22.6 50.8 22.1 61.3 95.3 41.8 137.6 31.7
NET EXTERNAL RESERVES 1/ 230 287.1 359.6 428.6 462.9 213.7 212.5 166.5 101.8 263.0 363.4 428.6 536.1 123.2 -184.5LESS:.. ........ ...*. ...... ......*. .....= *= ..= * ..=...==. ........ ........ ........ ........ ........ ........ ........LESS:
USE OF FUND CREDIT 231 . . . . 77.5 77.5 83.1 130.9 232.7 316.1 316.2 282.2 252.9 460.9
NET FOREIGN ASSETS 232 287.1 359.6 428.6 462.9 136.2 135.0 83.4 -29.1 30.3 47.3 112.4 253.9 -129.7 -645.4
LESS:ACCUMULATED ARREARS 233 . -. . - . 133.8 286.7 351.2 260.7 698.2 734.9 1.777.3
ADJUSTED NET FOREIGN ASSETS 234 287.1 359.6 428.6 462.9 136.2 135.0 83.4 -162.9 '-256.4 -303.9 -148.3 -444.3 -864.6 -2.,22.7..amm.m. .easse.. ........ .me.w.n...mm.m... .... as.. .m.ammes .. a...as .. a.sess .mas.a.. ..... ass .memmas. massmass assawmas
IN USS MILLION:NET EXTERNAL RESERVES 235 40.2 50.3 60.0 64.8 29.9. 29.7 24.1 14.2 31.9 43.7 53.9 72.3 16.8 -24.4NET FOREIGN ASSETS 236 40.2 50.3 60.0 64.8 19.1 18.9 12.1 -4.1 3.7 5.7 14.1 34.2 -17.7 -85.3ADJUSTED NET FOREIGN ASSETS 237 40.2 50.3 60.0 64.8 19.1 18.9 12.1 -22.8 -31.1 -36.5 -18.6 -59.9 -118.0 -320.1
I/ AS DEFINED IN THE BALANCE OF PAYMENTS.
SOURCE: (1) BANK OF UGANDA:(2) IMF. INTERNATIONAL FINANCIAL STATISTICS.
DATA SET: UGA/35

- 139 -
11:50 AM 12/21/81PAGE 1
TABLE 4.1UGANDA: EXTERNAL PUBLIC DEBT OUTSTANDING 1/
(US$ MILLION)
end-1974 end-1980ITE Debt Outstanding In Arrears Debt Outstanding In Arrears
-.------------------------- Disb. Undisb. Total Princ. Int. Disb. Undisb. Total Princ. Int.
SUPPLIERS CREDITS 1 12.4 6.1 1B.5 76.1 76.1 31.6 5.8
FRANCE 3 . 6.1 6.1 . . 4.5 . 4.5 1.4
GERMANY, FED. REP. 4 . . . . . 15.3 . 15.3 6.9
ITALY 5 . . . . . 29.5 . 29.5 15.0 5.4
NETHERLANDS 6 . . . . 5.0 . 5.0 5.0 0.3
SWITZERLAND 7 . * * * * 7.1 * 7.1
UNITED KINGDOM 8 0.8 . 0.8 . . 0.1 . 0.1 0.1
INDIA 9 3.6 . 3.6 . . 11.5 . 11.5 1.1 0.1
YUGOSLAVIA 10 8.0 . 8.0 . 3.0 . 3.0 2.1
FINANCIAL INSTITUTIONS 11 5.1 5.f 35.3 26.6 61.9 4.3 1.2
FRANCE 13 . . . . . 9.7 24.8 34.5 . 0.5
UNITED KINGDOM 14 5.1 . 5.1 . . 25.5 1.8 27.3 4.3 0.7
NATIONALIZATION 15 7.1 . 7.1 . . 1.5 . 1.5 1.0 0.1
FRANCE 16 0.1 . 0.1 . . .
ITALY 17 0.1 . 0.1 . . . *
UNITED KINGDOM 18 5.7 . 5.7 . . 1.2 . 1.2 0.3 0.1
INDIA 19 1.1 . 1.1 . . 0.3 . 0,3 0.2
MULTILATERAL LOANS 20 55.1 19.7 74.8 110.2 152.7 262.9 1.0 0.7
ADB 21 2.9 7.9 10.8 . . 18.7 33.1 51.8 1.0 0.7
ADF 22 . . . . . . 10.2 10.2
BADEA/ABEDA 23 . . . . . 0.1 4.6 4.7
EEC 24 . . . . . . 20.0 20.0
IBRO 25 4.1 . 4.1 . . 0.8 . 0.7
IDA 26 36.8 11.8 48.6 . . 46.3 73.3 119.6
IMF TRUST FUND 27 . . . . . 28.5 .. 28.5
ISLAMIC DEVELOPMENT BANK 28 . . . . . . 6.4 6.4
OPEC SPECIAL FUND 29 . . . . . 4.6 5.0 9.6
SAFA 30 11.3 . 11.3 . . 11.3 . 11.3
BILATERAL LOANS 31 120.0 66.8 186.8 . . 345.3 129.1 474.4 49.0 11.1
CANADA 32 1.7 0.8 2.5 . . . .
DENMARK 33 7.3 0.7 8.0 . . . *
FRANCE 34 . . . . . . 9.0 9.0.
GERMANY. FED. REP. 3/ 35 13.8 14.7 28.5 0.3 0.2 30. 0.1 30.7 2.9 1.3
JAPAN 36 1.9 0.2 2.1 . . 3.8 . 3.8 0.3 0.1
NETHERLANDS 37 2.3 0.6 2.9 . . . *
UNITED KINGDOM 3/ 38 43.6 2.7 46.3 . . 43.5 . 43.5 16.5 6.3
UNITED STATES 39 11.3 . 11.3 . . 10.4 . 10.4 0.2 0.1
CHINA 40 3.4 6.7 10.1 . . 3.5 37.2 40.7 3.5
GERMANY, DEM. REP. 41 . . . . . 15.2 . 15.2 . O.5
USSR 42 19.7 27.9 47.6 . . 35.8 5.1 40.9 11.5 2.3
IRAQ 43 . . . . . 4.3 5.7 10.0
KUWAIT 44 . . . . . . 21.2 21.2.
LIBYA 45 . 12.5 12.5 . . 12.5 . 12.5 3.1 0.5
QATAR. 46 . . . . . 1.2 3.8 5.0SAUDI ARABIA 47 15.0 . 15.0 . . 14.7 29.4 44.1 11.1
UAE 48 . . . . . 4.1 13.6 17.7
INDIA 49 . . . . . 2.1 4.2 6.3
TANZANIA so . . . . . 132.7 . 132.7
ZAMBIA 51 . . . . . 31.0 . 31.0
SHARE OF EAC LOANS 2/ 52 40.7 16.3 57.0 . . 43.4 1.0 44.4
DAC 53 21.2 4.6 25.8 . . 16.7 . 16.7
OTHER BILATERAL 54 0.9 . 0.9 . . 0.2 . 0.2
IBRD 55 18.5 11.7 30.2 . . 26.4 1.0 27.4
OTHER MULTILATERAL 56 0.1 . 0.1 . . 0.1 . 0.1
TOTAL 57 240.4 108.9 349.2 0.3 0.2 611.8 309.4 921.2 86.8 18.8
OF WHICH:DAC 58 114.9 30.4 145.3 0.3 0.2 203.0 35.7 238.7 53.4 14.6
CPE 59 23.1 34.6 57.7 . . 54.5 42.3 96.8 15.0 2.8
OPEC 60 15.0 12.5 27.5 . . 36.8 73.7 110.5 14.2 0.5
OTHER BILATERAL 61 13.6 . 13.6 . . 180.8 4.2 185.0 3.4 0.1
MULTILATERAL 62 73.7 31.4 105.1 . . 136.7 153.7 290.3 1.0 0.7
1/ DEBT OUTSTANDING INCLUDES PRINCIPAL IN ARREARS BUT EXCLUDES INTEREST INARREARS.
2/ UGANDA'S NOTIONAL SHARE OF EAC LOANS IS ASSUMED TO BE 15%.3/ OFFICIAL DEBT WRITTEN OFF IN 1981.SOURCE: WORLD BANK, EXTERNAL DEBT SYSTEM.
DATA SET: UGA/45

11:51 PM 01/07/82PAGE 1
TABLE 4.2UGANDA: EXTERNAL PUBLIC DEBT SERVICE
(US$ MILLION)
------- IT EM -------- Picipl . . __ _ _ Interest1975 1976 1977 1978 1979 1980 1975 1976 1977 197 1979 1980
SUPPLIERS CREDIT . 66 2.0 1.8 2.2 4.9 8.8 8.9 0.2 0.2 0.1 1.0 0.6 0.4
FRANCE * 68 . . 0.5 0.5 0.5 . .GERMANY. FED. REP. 69 . . . . 6.1 3.1 .ITALY L0 . . . 2.8 2.0 1 . 0.9 0.6 0.4NETHERLANDS 7i 0.5. .SWITZERLAND 72 . . . . 0.1 4.0 .UNITED KINGDOM 73 0.1 0.1 0.1 0.1 0.1 . . 0.1 .
INDIA 74 0.5 0.4 0.4 0.4 . . 0.2 0.1 0.1 0.1 .YUGOSLAVIA 75 1.3 1.3. 1.2 1.1 . . . .
FINANCIAL INSTITUTIONS 76 1.0 0.1 0.1 0.1 0.1 . 0.1 0.1 0.1 . 0.1 0.1
FRANCE 77 * * * . -- - . . . 0.1 0.1UNITED KINGDOM 78 0.8 . . . . . .
INOIA 79 0.2 0.1 0.1 0.1 0.1 . 0., 0.1 0.1
NATIONALIZATION 80 1.8 0.6 0.6 0.6 0.4 0.4 0.3 0.1 p.t 0.1
FRANCE 81 0.1 . . . . . . . *ITALY 82 0.1 . . . . . . .UNITED KINGDOM 83 1.6 0.6 0.6 0.6 0.4 . 0.4 0.3 0.1 0.1 0.1 1
MULTILATERAL LOANS 84 0.5 0.8 1.0 0.8 1.5 1.3 0.7 0.8 0.9 0.8 V.6 1.0
ADB 85 . 0.3 0.3 0.3 0.6 0.2 0.2 0.2 0.3 0.4 1.0 0.6 018RD 86 0.5 0.6 0.6 0.3 0.7 0.7 0.2 0.2 0.2 0.1 0.2 0.1 IIDA 87 . . 0.1 0.2 0.2 0.4 0.3 0.3 0.3 0.3 0.3 0.3
BILATERAL LOANS 88 2.7 2.1 14.4 5.0 2.9 1.3 1.9 0.9 2.5 0.9 1.0 1.2
DENMARK 89 0.1 0.2 0 0.4 .GFRMANY, FED. REP. 90 0.5 0.1 2.6 . . 0.6 0.3 0.3 1.0 0.1 . 0.3JAPAN 91 0.1 0.2 0.2 0.2 0.2 . 0.1 0.1 0.1 0.2 0.2 0.1NETHERLANDS 92 * - * - . - 0.1 . .1UNITED KINGDOM 93 1.0 . . . . . 0.8 . .UNITED STATES 94 0.1 0.1 0.2 0.1 0.3 0.2 0.1 . 0.2 0.1 0.1 0.2
USSR 95 1.0 1.4 8.6 4.7 2.4 0.5 0.5 0.5 1.2 0.5 0.4 0.4
SAUDI ARABIA 96 . . 2.5 . . . . .UAE . 97 . . * * - . - - . . .0.2 0.2
SHARE OF EAC LOANS 1/ 98 1.0 2.6 3.3 1.9 1.9 2.2 1.9 2.6 2.4 2.4 3.0 2.4
DAC 99 0.3 1.8 2.5 0.8 0.8 0.9 0.7 0.7 0.6 0.0 0.6 0.6OTHtR BILATERAL 100 0.2 0.1 0.1 0.1 0.1 0.1 0.1 . .IBRD 101 0.5 0.7 0.7 1.0 1.0 1.2 1.1 1.9 1.8 1.8 2.4 1.
TOTAL 102 9.0 8.1 21.7 13.5 15.6 13.6 5.2 4.7 61 5.2 6.4 5.2
OF WHICH:DAC 103 4.8 3.1 7.1 5.1 10.4 10.6 2.5 1.5 2.0 2.0 1.7 1.7CPE 104 1.0 1.4 8.6 4.7 2.4 0.5 0.5 0.5 1.2 0.5 0.4 0.4OPEC 105 . . 2.5 . -. . . . . 0.2 0.2OTHER BILATERAL 106 2.2 1.9 1.8 1.7 0.2 0 1 0.4 0.2 0.2 0.1MULTILArERAL 107 1.0 1.5 i.7 1.8 2.5 2.5 1.8 2.7 2.7 2.6 4.0 2.3
1/ UGANDA'S NOTIONAL SHARE OF EAC LOANS IS ASSUMED 10 BE 15%.SOPrE: WORLD BANK. EXTERNAL DEBT SYSTEM.

- 141 -
11:53 PM 01/07/82PAGE 1
TABLE 4.3UGANDA: LOAN COMMITMENTS AND DISBURSEMENTS
(US$ MILLION)
---------------------------------- DisbursementsITEM 197 17 17 1979 1980 1975 1976 1977 1978 1979 1980
---------------------------------- 1975 1976 17 19
SUPPLIERS CREDITS 111 33.6 34.5 5.9 1. a a.6 33.6 34.5 5.9 11.8
FRANCE 113 . . . . . . . 5.6 .
GERMANY 114 . . 23.5 . . . 23.5
ITALY 115 . 33.6 . . 1.9 . . 33.6 . . 1.9
NETHERLANDS 116 . . . . 5.9 . . . . . 5.9
SWITZERLAND 117 . . . 10.9 . . . . . 10.9
INDIA 11 . 9.9 9.9
FINANCIAL INSTITUTIONS 119 13.9 39.7 31.5
FRANCE 121 . . . 18.9 . 16.7 . 10.3
UNITED KINGDOM 122 , . . . . 23.0 . . . . 21.2
MULTILATERAL LOANS 123 4.3 5.6 10.4 11.7 . 163.0 . 2. 6.7 5.4 7.1 4.7 34.3
ADB 124 4.3 . 5.8 6.3 . 26.0 . 4.0 4.5 0.8 3.4 4.1
ADF 125 . . . . . 10.4 . . .
BADEA/ABEDA 126 . . . 4.7 0.1
EEC 127 ..... 20.0. .
IDA 12 . 72.5 2.8 2.7 0.S 1.7 1.3 1.1
IMF TRUST FUND 129 . . . . . 29.1 . . . . . 29.1
ISLAMIC DEVELOPMENT BANK 130 . 5.6 . 0.8 . . - *
OPEC SPECIAL FUND 131 . . 4.6 . . 5.0 . . . 4.6
BILATERAL LOANS 132 41.6 12.1 30.3 39.4 195.8 9.6 16.2 27.1 5.5 22.6 132.3 53.1
CANADA 133 . . . . . . 0.4 . 0.2
DENMARK 134 . . . . . . 0.3 0.3 .
FRANCE 135 . . . . . 9.6 . . .
GERMANY, FED. REP. i36 . . . . . . . 5.1 6.1 2.1 1.1 0.1
JAPAN i37 . 1.2 . . . . 0.3 . 1.3
NETHERLANDS 138 . . . . . . 0.4 . . . 0.1
CHINA 139 . . . 27.9 . . * * *
GERMANY, DEM. REP. 140 v .. . 15.2 . . . . . 15.2
USSR 141 1.8 10.9 . . . . . 9.6 20.7 1.8 2.4
IRAQ 142 10.0 . . . . . . . 0.1 0.3 4.0
KUWAIT 143 . . 20.1 . . . . . *
LIBYA 144 . . . . * . . . . 12.5
QATAR 145 . . . 5.0 . . . . . 1.1
SAUDI ARABIA 146 29.9 . . . * * * . . 1.6 0.5
UAE 147 . . 10.2 6.5 . . . . . 3.5 0.4
INDIA 148 . . . . 6.2 . . . . . 2.1
TANZANIA 149 . . . . 131.5 . . . . . 80.9 51.0
ZAMBIA 150 . . . . 31.0 . . . . . 31.0
SHARE OF EAC LOANS 1/ 151 1.1 2.3 . , . . 7.3 4.5 2.9 1.7 1.7 0.5
DAC 152 1.1 . . . . . 2.5 1.9 0.5 0.2 0.3
IBRD* 153 . 2.3 . . . . 4.8 2.5 2.4 1.5 1.4 0.5
TOTAL 154 47.0 53.7 40.7 104.5 189.8 224.1 26.2 43.9 47.4 65.8 144.6 131.3
OF WHICH:DAC 155 1.1 34.8 . 53.4 5.9 51.2 9.0 13.9 37.7 35.7 6.4 33.4
CPE 156 i.8 10.9 . 27.9 15.2 . 9.6 20.7 1.8 2.4 15.2
OPEC 157 39.9 . 30.3 11.5 . . . . 0.1 19.0 4.9
OTHER BILATERAL 158 . . . . 168.7 9.9 . . . . 111.9 63.0
MULTILATERAL 159 4.3 7.9 10.4 11.7 . 163.0 7.6 9.2 7.8 8.6 6.1 34.8
1/ UGANDA'S NOTIONAL SHARE OF EAC LOANS IS ASSUMED TO BE 15%,
SOURCE: WORLD BANK, EXTERNAL DEBT SYSTEM.

0:05 AM 03/16/82PAGE 1
TABLE 4.4UGANDA: OFFICIAL GRANT RECEIPTS
(US$ MILLION)WARNING: DATA HAVE NOT BEEN EDITED
ITEM 1975 1976 1977 1978 1979 1980
DAC COUNTRIES 160 . . . . 6.2 41.6
AUSTRALIA 161 . . - - . 0.2DENMARK 162 . . . . 1.1 -GERMANY 163 . . . . . 4.4JAPAN 164 . - - -..9NETHERLANDS 165 - . . . . 3.8NORWAY 166 . . . . . 0.9SWEDEN 167 0 .. .0.6 3.0UNITED KINGDOM 168 . . . . 2.8 5.1UNITED STATES 169 . . . . 1.7 23.3
CENTRALLY PLANNED COUNTRIES 170 9.2 . . .
USSR 171 9.2 . . .
OPEC COUNTRIES 172 4.4 2.1 . . . 1.0
IRAQ 173 . . . . . 1 OQATAR 174 . 1.9 . . .SAUDI ARABIA 175 . 0.2 . . . .UAE 176 4.4 . . .
OTHER COUNTRIES 177 0.2 1.7 1.1 0.4 6.0 0.8
INDIA 178 . . . . 3.3KENYA 179 . . . . 2.7 0.8OTHERS 180 0.2 1.7 1.1 0.4
MULTILATERAL AGENCIES 181 7.3 7.6 2.8 8.4 12.0 29.2
EEC 182 . 2.0 . 4.6 8.3 25.9UNOP 183 7.3 5.6 2.8 3.8 3.7 3.3
SALE OF IMF GOLD 184 . - - . . 12.0
TOTAL 185 21.1 11.4 3.9 8.8 24.2 84.6
SOURCE: WORLD BANK ESTIMATES.
OATA SET: UGA/4S

11:36 AM 03/22/82
PAGE 1TABLE 5.1
UGANDA: CENTRAL GOVERNMENT BUDGETARY OPERATIONS 1/(U.SH. MILLION)
ITEM FY72 FY73 FY74 FY75 FY76 FY77 FY78 FY79 FY80 FY81 FY82
CURRENT REVENUE 1 1.487 1,266 1,324 2.100 2,223 3,369 5,841 3,273 3,860 2.513 25,292
EXTERNAL GRANTS 2 - . . 2 107 2 2 . 152 583 11,862
RECURRENT EXPENDITURE 3 1,491 1,531 2,027 2,467 2,954 3,632 4,113 4,497 5.446 9.996 22.830CURRENT SURPLUS/DEFICIT (-) 4 -4 -265 -703 -365 -624 -261 1,730 -1,224 -1,434 -6,900 14,324DEVELOPMENT REVENUE 3/ 5 59 20 54 15 13 21 15 41 145 147 1,250
DEVELOPMENT EXPENDITURE 6 946 574 635 860 816 1,037 1,755 1,522 1,345 3,440 19,616OTHER EXPENDITURE 2/ 7 . - . -187 257 496 419 -600 1,261 .OVERALL DEFICIT (-) 8 -891 -819 -1,285 -1,023 1,684 -1,773 -429 -2.105 -3.895 -10,193 -4,042
FINANCING
EXTERNAL (NET) 9 143 33 69 219 280 148 68 43 48 1,225 .
DOMESTIC (NET) 10 470 723 1,003 804 1,404 1.625 361 2,062 3,847 8,968 J- BANKING 11 . . . . . 1,458 321 2,024 3,435 8,812- NON-BANKING 12 - . . . . 167 40 38 412 156
OTHER 13 278 63 213 . . .
1/ 1977/78 DATA ARE PROVISIONAL; 1978/79-1980/81 DATA ARE REVISED ESTIMATES;AND 1981/82 ARE BUDGET ESTIMATES.
2/ INCLUDES EXTRA-BUDGETARY AND UNRECORDED CASH EXPENDITURE, AND THEDIFFERENCE BETWEEN CHECKS ISSUED AND PAID IN THE SAME FISCAL YEAR.
SOURCE: (1) GOVERNMENT OF UGANDA, SUMMARY OF ESTIMATES OF RECURRENTAND DEVELOPMENT EXPENDITURE; (2) DATA PROVIDED BY UGANDAN AUTHORITIES.
DATA SET: UGA/5S

2:07 PM 03/23/82PAGE 1
TABLE 5.2UGANDA: CENTRAL .GOVERNMENT CURRENT REVENUE 1/
(U.SH. MILLION)
ITEM FY72 FY73 FY74 FY75 FY76 FY77 FY78 FY79 FY80 FY81 FY82
TAX REVENUE 53 1.413 1,231 1,314 2.009 2,089 3.229 5.623 3.088 3,810 2,485 25,247
TAXES ON INCOME AND PROFIT 54 338 233 189 220 206 283 434 302 450 501 970
- PAY AS YOU EARN 55 68 69 76 79 103 98 96 85 84 130 177- COMPANY AND INDIVIDUAL 56 263 152 107 135 99 175 325 205 342 350 774-OTHER 57 7 12 6 6 4 10 13 12 24 21 19
TAXES ON GOODS AND SERVICES 58 509 462 530 847 814 1.268 1,417 1,660 1,663 1,345 11,052
- SALES TAX 59 258 228 292 619 621 1,041 1,176 872 1,129 894 8,655- PSIC 60 .. . . . . . . 555 305 250.- EXCISE DUTIES 61 222 200 176 160 130 136 96 68 76 102 2.280- COMMERCIAL TRANSACTION LEVY 62 . 5 12 19 18 25 40 30 16 59 50- MOTOR VEHICLE LICENCES 63 22 22 21 25 18 25 20 24 27 38 48- OTHER TAXES AND LICENCES 64 7 7 29 24 27 41 85 111 110 2 19
TAXES ON INTERNATIONAL TRADE 65 548 524 583 938 1,065 1.673 3,767 1,122 1,693 639 13.225
- IMPORT DUTIES 66 276 153 224 262 316 215 429 249 373 525 6.364- EXPORT DUTIES 67 272 371 359 676 749 1,458 3,338 873 1,320 114 6.861
OTHER TAXES 68 18 12 12 4 4 5 5 4 4
NON-TAX REVENUE 69 74 35 10 91 134 140 218 185 50 28 45
CURRENT REVENUE 72 1,487 1,266 1,324 2,100 2.223 3,369 5.841 3,273 3,860 2.513 25,292
1/ 1977/78 DATA ARE PROVISIONAL: 1978/79-1980/81 DATA ARE REVISED ESTIMATES;AND 1981/82 DATA ARE BUDGET ESTIMATES.
SOURCE: (1) GOVERNMENT OF UGANDA, FINANCIAL STATEMENT AND REVENUE ESTIMATES;(2) DATA PROVIDED BY UGANDAN AUTHORITIES.
DATA SET: UGA/5S

2:08 PM 03/23/82PAGE 1
TABLE 5.3UGANDA: CENTRAL GOVERNMENT RECURRENT EXPENDITURE 1/
(U.sH. MILLION)
ITEM FY72 FY73 FY74 FY75 FY76 FY77 FY78 FY79 FY80 FY81 FY82
GENERAL PUBLIC SERVICES 33 305 320 542 583 680 789 838 938 1,437 2,958 7,442
FINANCE 34 26 31 44 113 39 33 57 70 212 395 1,468INTERNAL AFFAIRS, POLICEAND PRISONS 35 122 117 119 182 237 312 365 356 459 981 2,259
OTHER 36 157 172 379 288 404 444 416 512 766 1,582 3,715
DEFENSE 37 300 224 306 379 494 749 833 872 639 1.932 4,774
ECONOMIC SERVICES 38 204 244 301 380 425 549 615 781 742 1,150 3,222
AGRICULTURE, FORESTRYAND COOPERATIVES 39 79 86 116 131 157 229 242 242 235 367 868
ANIMAL RESOURCES 40 37 44 47 92 72 104 109 106 116 160 363COMMERCE AND INDUSTRY 41 4 7 8 7 12 19 20 21 24 36 95OTHER 42 84 107 130 150 184 197 244 412 367 587 1,896
SOCIAL SERVICES 43 449 464 464 627 812 1,072 1,307 1,288 1,406 2,086 5,983
EDUCATION 44 322 331 330 445 529 676 735 892 948 1,429 4,054 LHEALT
11 45 106 114 109 131 202 309 406 280 346 493 1,242 I
OTHER 46 21 19 25 51 81 87 166 116 112 164 687
STATUTORY (CFS) 47 233 279 414 498 543 522 606 618 1,222 1,586 1,409
PUBLIC DEBT 48 143 235 393 383 372 310 448 548 330 686 1,160OTHER 49 90 44 21 115 171 212 158 70 892 900 249
TOTAL 2/ 50 1,491 1,531 2,027 2,467 2,954 3,681 4,199 4,497 5,446 9,712 22,830
1/ 1976/77-1979/80 DATA ARE PROVISIONAL; 1980/81 DATA ARE REVISED ESTIMATES;AND 1981/82 DATA ARE BUDGET ESTIMATES.
2/ RECURRENT EXPENDITURE TOTAL FOR 1980/81 IN TABLE 5.1, WHICH DIFFERS FROMTHE TOTAL IN THIS TABLE, IS A MORE RECENT ESTIMATE, BUTNO BREAKDOWN FOR IT IS AVAILABLE.
SOURCE: (1) GOVERNMENT OF UGANDA, SUMMARY OF ESTIMATES OF RECURRENT ANDDEVELOPMENT EXPENDITURES; (2) DATA PROVIDED BY UGANDAN AUTHORITIES.
DATA SET: UGA/5S
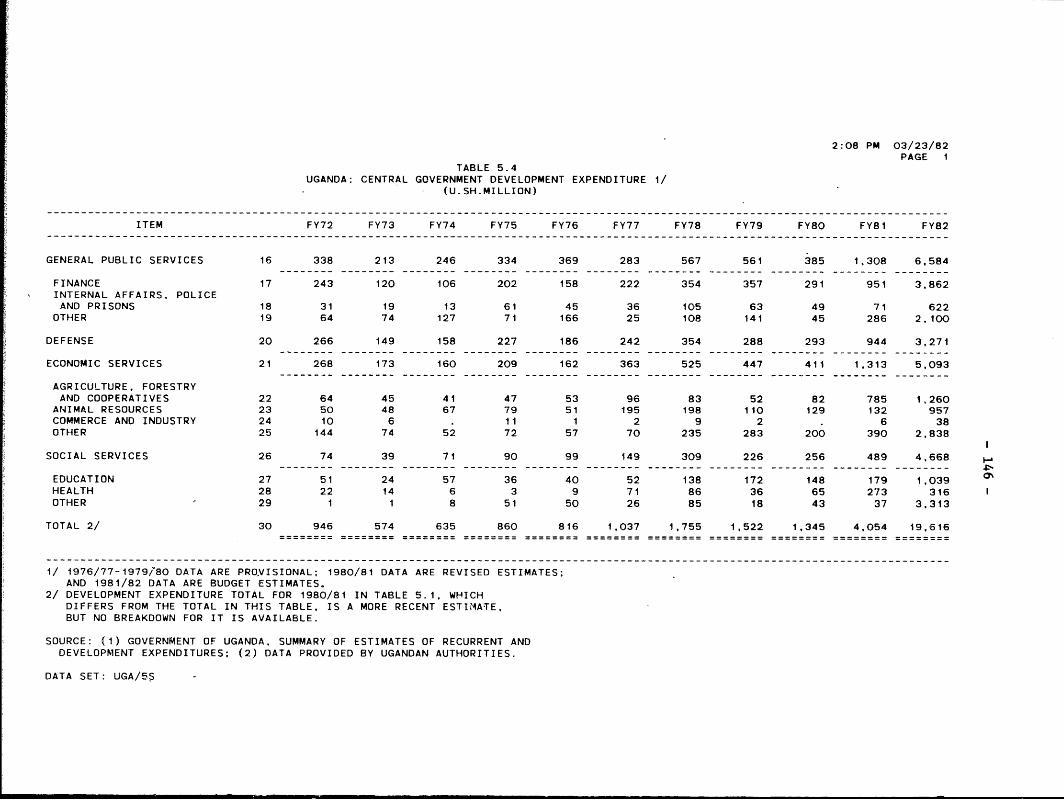
2:08 PM 03/23/82PAGE I
TABLE 5.4UGANDA: CENTRAL GOVERNMENT DEVELOPMENT EXPENDITURE 1/
(U.SH.MILLION)
ITEM FY72 FY73 FY74 FY75 FY76 FY77 FY78 FY79 FY80 FY81 FY82
GENERAL PUBLIC SERVICES 16 338 213 246 334 369 283 567 561 385 1.308 6,584
FINANCE 17 243 120 106 202 158 222 354 357 291 951 3,862INTERNAL AFFAIRS, POLICEAND PRISONS 18 31 19 13 61 45 36 105 63 49 71 622
OTHER 19 64 74 127 71 166 25 108 141 45 286 2,100
DEFENSE 20 266 149 158 227 186 242 354 288 293 944 3,271
ECONOMIC SERVICES 21 268 173 160 209 162 363 525 447 411 1,313 5,093
AGRICULTURE. FORESTRYAND COOPERATIVES 22 64 45 41 47 53 96 83 52 82 785 1.260ANIMAL RESOURCES 23 50 48 67 79 51 195 198 110 129 132 957COMMERCE AND INDUSTRY 24 10 6 . 11 1 2 9 2 . 6 38OTHER 25 144 74 52 72 57 70 235 283 200 390 2,838
SOCIAL SERVICES 26 74 39 71 90 99 149 309 226 256 489 4.668 4EDUCATION 27 51 24 57 36 40 52 138 172 148 179 1,039HEALTH 28 22 14 6 3 9 71 86 36 65 273 316 1OTHER 29 1 1 8 51 50 26 85 18 43 37 3,313
TOTAL 2/ 30 946 574 635 860 816 1.037 1,755 1,522 1,345 4,054 19,616
1/ 1976/77-1979/80 DATA ARE PROVISIONAL; 1980/81 DATA ARE REVISED ESTIMATES:AND 1981/82 DATA ARE BUDGET ESTIMATES,
2/ DEVELOPMENT EXPENDITURE TOTAL FOR 1980/81 IN TABLE 5.1, WHICHDIFFERS FROM THE TOTAL IN THIS TABLE, IS A MORE RECENT ESTI'4ATE,BUT NO BREAKDOWN FOR IT IS AVAILABLE.
SOURCE: (1) GOVERNMENT OF UGANDA. SUMMARY OF ESTIMATES OF RECURRENT ANDDEVELOPMENT EXPENDITURES; (2) DATA PROVIDED BY UGANDAN AUTHORITIES.
DATA SET: UGA/5S -

11:16 AM 03/25/82
TABLE 6.1 PAGE 1
UGANDA: MONETARY SURVEY 1/(U.SH. MILLION AT END OF PERIOD)
ITEM 1968 1969 1970 1971 1972 1973 1974 1975 1976 1977 1978 1979 1980 1901
NET FOREIGN ASSETS 1 359.6 428.6 462.9 136.2 135.0 83.4 -29.1 30.3 47.3 112.4 253.9 -129.7 -645.4-14,800.0
MONETARY AUTHORITIES 2/ 2 362.3 374.0 408.2 114.3 131.4 67.9 -44.9 -49.1 -38.1 -48.8 62.1 -235.7 -753.7-15.700.0COMMERCIAL BANKS 3 -2.7 54.6 54.7 21.9 3.6 15.5 15.8 79.4 85.4 161.3 191.8 106.0 108.3 900.0DOMESTIC CREDIT 4 941.8 1,184.0 1,451.9 1.821.5 2.455.2 3,356.7 4.508.6 5,298.8 6,726.6 8.406.6 10.420.5 12,856.4 20,696.5 40.800.0
NET CLAIMS ON GOVERNMENT 5 238.6 322.1 568.6 930.2 1,439.4 2.148.1 2,907.7 3,603.8 4.789.6 5,521.6 7.199.4 9.198.2 14,847.6 29.300.0- BANK OF UGANDA 6 143.4 167.9 336.2 693.8 795.9 1,244.6 1.672.8 2,355.9 3.190.6 3,863.0 5.442.4 7,276.3 12,439.4- COMMERCIAL BANKS 7 95.2 154.2 232.4 236.4 643.5 903.5 1,234.9 1,247.9 1,599.0 1,658.6 1,757.0 1.921.9 2,408.2 .4CLAIMS ON PRIVATE SECTOR 3/ 8 703.2 861.9 883.3 891.3 1,015.8 1.208.6 1.600.9 1,695.0 1,937.0 2,885.0 3,221.1 3,658.2 5,848.9 11,500.0ASSETS = LIABILITIES 9 1.30f.4 1,612.6 1,914.8 1,957.7 2,590.2 3,440.1 4,479.5 5,329.1 6.773.9 8.519.0 10.674.4 12,726.7 20,051.1 26,000.0
MONEY 10 864.6 965.2 1,103.5 1,131.6 1,542.7 2,114.5 3,005.8 3,252.1 4,491.5 5,786.7 7,051.0 10,619.7 13,905.0 34,600.0CURRENCY IN CIRCULATION 11 441.7 522.9 594.5 597.8 620.1 795.9 1,092.5 1.367.1 2,205.0 2,889.0 3,531.2 5,817.5 7.260.3DEMAND DEPOSITS 4/ 12 422.9 442.3 509.0 533.8 922.6 1,318.6 1,913.3 1,885.0 2,286.5 2,897.6 3,519.8 4.802.2 6,644.7QUASI-MONEY 13 399.8 427.0 544.3 511.7 543.6 807.7 859.2 1.425.6 1,742.8 1.613.6 2.294.2 3.103.7 4,495.0OTHER ITEMS 14 37.0 220.4 267.0 314.4 503.9 517.9 614.5 651.4 539.4 .,18.7 1.329.2 -996.7 1,651.1 -8,600.0
1/ DATA FOR 1981 ARE PRELIMINARY ESTIMATES ONLY.2/ INCLUDES TREASURY FOREIGN EXCHANGE HOLDINGS.3/ INCLUDES REGIONAL AND LOCAL GOVERNMENTS AND OFFICIAL ENTITIES.4/ INCLUDES PRIVATE SECTOR DEPOSITS WITH BANK OF UGANDA AND DEPOSITS
OF REGIONAL AND LOCAL GOVERNMENTS.
SOURCE: BANK OF UGANDA.
DATA SET: UGA/SS
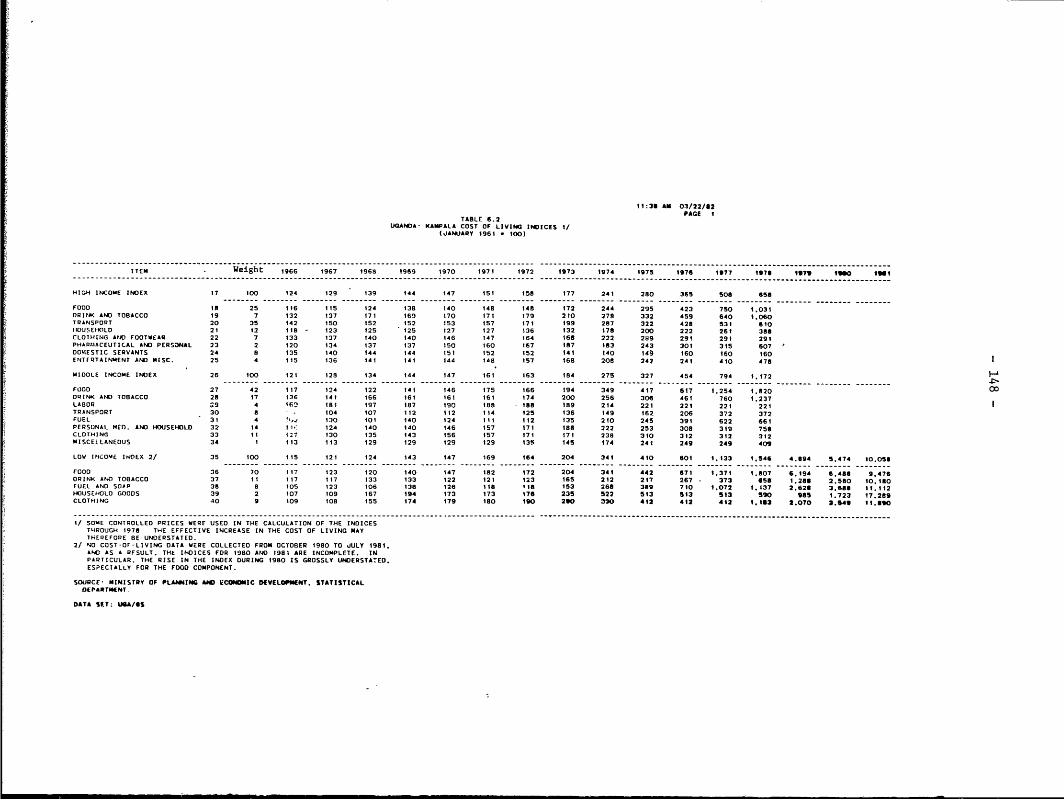
11:34 AN 0/22/62
TABLE 6.2 PAGE I
UGANDA' KAMPALA COST OF LIVING INDICES 1/(JANUARY 1961 - 100)
ITEM . Weight 1966 1967 196H 1969 1970 1971 1972 1973 1974 1975 1976 1977 1978 1979 990 19
HIGH INCOME INDEX 17 100 124 129 139 144 147 151 158 177 241 280 365 508 658
FOOD 18 25 116 115 124 138 140 148 145 172 244 295 423 750 t.031DRIN. AND TOBACCO 19 7 132 137 171 169 170 171 179 210 278 332 459 640 1.060TRANSPORT 20 35 142 ISO 152 152 153 157 171 199 287 322 428 531 6toHOUSEHKOLO 21 12 fIB 123 125 125 127 127 136 132 178 200 222 261 388CLOTHING AND FOOTWEAR 22 7 133 137 140 140 146 147 164 168 222 289 291 29f 291PHARPIACEUTICAL AND PERSONAL 23 2 120 134 :37 137 ¶50 160 167 187 183 243 301 315 607DOMIESTIC SERVANTS 24 8 ¶35 140 144 144 151 152 152 141 140 149 160 160 160ENTfRTAINMENT AND MISC. 25 4 115 136 141 141 144 148 157 168 208 242 241 410 478
MIDDLE INCOME INDEX 26 100 121 128 134 144 147 161 163 14 275 327 454 794 1.172
FOOD 27 42 117 124 122 t8 146 175 166 194 349 417 617 1.254 1.920DRINK AND TOBACCO 28 17 136 1 166 161 161 161 174 200 256 306 461 760 1.237LAaOR 29 4 160 181 197 187 190 188 ¶88 189 214 221 221 221 221TRANSPORT 30 8 - 104 107 112 112 114 125 136 149 162 206 372 372FUEL 31 4 .,. 130 101 140 124 111 112 ¶35 210 245 391 622 661PERSONAL NED. AND HOUSEHOLD 32- 14 1 124 140 140 146 157 171 188 222 253 308 319 758CLOTHING 33 it 121 ¶30 135 143 156 157 171 171 238 310 312 312 312MISCELLANEOUS 34 1 113 113 129 129 129 t29 135 145 174 241 249 249 409
LOW INCO-E INDEX 2/ 35 100 115 121 24 143 147 169 164 204 341 410 601 1.133 .546 4.S94 5.474 0.059
FOOD 36 70 117 123 120 140 147 182 172 204 341 442 671 1.371 1.807 6.194 6*488 9.476DRINK AND TOBACCO 37 It 117 117 ¶33 133 122 ¶21 123 185 212 217 267 - 373 658 1.288 2.580 10.1 0FUEL AND SOAP 38 8 105 123 106 138 126 ¶18 -18 153 268 389 710 1.072 t.i37 2.628 3,680 11.12HOUSEHOLD GOODS 39 2 107 109 167 194 173 173 176 235 522 513 513 53 590 985 1.723 17.289CLOTHING 40 9 to9 108 155 174 179 180 190 290 20 412 412 412 1,183 2.070 3.949 11.490
1/ SOME CONTROLLED PRICES WERE USED IN THE CALCULATION OF THE INDICESTHROUGH 1978 THE EFFECTIVE INCREASE IN THE COST OF LIVING MAYTHEREFORE BE UNDERSTATED.
2/ NO COST-O-LIVING DATA WERE COLLECTED FROM OCTOBER 1980 TO aJULY 1981AND AS A RFSULT. THE INDICES FOR 1980 AND 1981 ARE INCOMPLETE. INPARTICULAR. THE RISE IN THE INDEX DURING 1980 15 GROSSLY UNDERSTATED.ESPECIALLY FOR THE FOOD COMPONENT.
SOURCE MINISTRY OF PLANNING AD ECONMIC DEVELOPMET. STATISTICALDEPARTMENT
DATA $5T: USA/95

TABLE 6.3UGANDA: RECENT PRICE TRENDS
(April 1981 100)
1981 1982Weights Apr. June July Aug. Sep. Ort. Nov. Dec. Jan.
Food 41 100 104 92 77 79 81 80 83 70Drinks and tobacco 17 100 199 179 164 161 167 162 162 172Fuel and lighting 6 100 154 155 155 155 155 155 171 171Transport 8 100 103 498 498 498 498 498 498 498Textiles (domestic) 4 100 154 127 120 123 122 133 131 160Textiles (imported) 6 100 250 259 260 270 276 300 324 337Other consumer goods 10 100 217 186 143 174 175 173 177 174Other manu. goods 8 100 246 230 218 208 204 202 200 210
Weighted average 100 100 156 175 161 164 166 166 170 169
Source: (1) Bank of Uganda(2) IMF
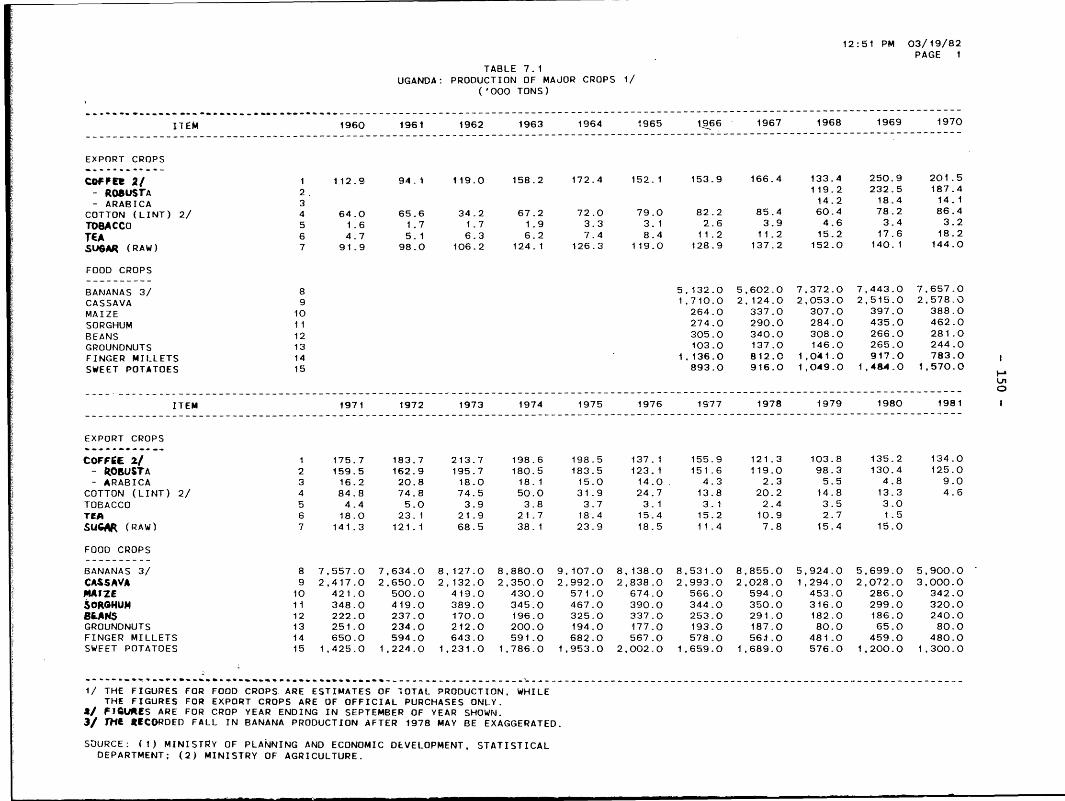
12:51 PM 03/19/82PAGE 1
TABLE 7.1UGANDA: PRODUCTION OF MAJOR CROPS 1/
('000 TONS)
ITEM 1960 1961 1962 1963 1964 1965 tP66 1967 1968 1969 1970
EXPORT CROPS
COFFEt 2/ 1 112.9 94.1 119.0 158.2 172.4 152.1 153.9 166.4 133.4 250.9 201.5- ROBUSTA 2. 119.2 232.5 187.4- ARABICA 3 14.2 18.4 14.1
COTTON (LINT) 2/ 4 64.0 65.6 34.2 67.2 72.0 79.0 82.2 85.4 60.4 78.2 86.4TOBACCO 5 1.6 1.7 1.7 1.9 3.3 3.1 2.6 3.9 4.6 3.4 3.2TEA 6 4.7 5.1 6.3 6.2 7.4 8.4 11.2 11.2 15.2 17.6 18.2SUGAR (RAW) 7 91.9 98.0 106.2 124.1 126.3 119.0 128.9 137.2 152.0 140.1 144.0
FOOD CROPS
BANANAS 3/ 8 5.132.0 5,602.0 7,372.0 7,443.0 7,657.0CASSAVA 9 1,710.0 2,124.0 2,053.0 2,515.0 2,578.0MAIZE 10 264.0 337.0 307.0 397.0 388.0SORGHUM 11 274.0 290.0 284.0 435.0 462.0BEANS 12 305.0 340.0 308.0 266.0 281.0GROUNDNUTS 13 103.0 137.0 146.0 265.0 244.0FINGER MILLETS 14 1,136.0 812.0 1,041.0 917.0 783.0 1SWEET POTATOES 15 893.0 916.0 1,049.0 1,484.0 1,570.0
Lno
ITEM 1971 1972 1973 1974 1975 1976 1977 1978 1979 1980 1981 I
EXPORT CROPS
COFFEE 2/ 1 175.7 183.7 213.7 198.6 198.5 137.1 155.9 121.3 103.8 135.2 134.0- kOBUSTA 2 159.5 162.9 195.7 180.5 183.5 123.1 151.6 119.0 98.3 130.4 125.0- ARABICA 3 16.2 20.8 18.0 18.1 15.0 14.0 4.3 2.3 5.5 4.8 9.0COTTON (LINT) 2/ 4 84.8 74.8 74.5 50.0 31.9 24.7 13.8 20.2 14.8 13.3 4.6TOBACCO 5 4.4 5.0 3.9 3.8 3.7 3.1 3.1 2.4 3.5 3.0TEA 6 18.0 23.1 21.9 21.7 18.4 15.4 15.2 10.9 2.7 1.5SUGAR (RAW) 7 141.3 121.1 68.5 38.1 23.9 18.5 11.4 7.8 15.4 15.0
FOOD CROPS
BANANAS 3/ 8 7,557.0 7,634-0 8,127.0 8,880.0 9,107.0 8,138.0 8,531.0 8,855.0 5,924.0 5,699.0 5,900.0CASSAVA 9 2,417.0 2,650.0 2,132.0 2,350.0 2,992.0 2,838.0 2,993.0 2,028.0 1,294.0 2,072.0 3,000.0MAIZE 10 421.0 500.0 419.0 430.0 571.0 674.0 566.0 594.0 453.0 286.0 342.0SORGHUM 11 348.0 419.0 389.0 345.0 467.0 390.0 344.0 350.0 316.0 299.0 320.0BEANS 12 222.0 237.0 170.0 196.0 325.0 337.0 253.0 291.0 182.0 186.0 240.0GROUNDNUTS 13 251.0 234.0 212.0 200.0 194.0 177.0 193.0 187.0 80.0 65.0 80.0FINGER MILLETS 14 650.0 594.0 643.0 591.0 682.0 567.0 578.0 56.1.0 481.0 459.0 480.0SWEET POTATOES 15 1,425.0 1,224.0 1,231.0 1,786.0 1,953.0 2,002.0 1,659.0 1,689.0 576.0 1,200.0 1,300.0
1/ THE FIGURES FOR FOOD CROPS ARE ESTIMATES OF lOTAL PRODUCTION, WHILETHE FIGURES FOR EXPORT CROPS ARE OF OFFICIAL PURCHASES ONLY.
S/ FIGURES ARE FOR CROP YEAR ENDING IN SEPTEMBER OF YEAR SHOWN.3/ THE RECORDED FALL IN BANANA PRODUCTION AFTER 1978 MAY BE EXAGGERATED.
SOURCE: (1) MINISTRY OF PLANNING AND ECONOMIC DEVELOPMENT, STATISTICALDEPARTMENT; (2) MINISTRY OF AGRICULTURE.

*0:44 PM 03/10/0PAtE I
TABLE 7.2UGANDA: MINIMUM AGRICULTURAL PRODUCER PRICES
(U.SH. PER KILOGRAM)
ITEM IV6" 1367 1"@1 13ll 1370 1971 1972 1*73 1174 1375 1076 1177 176 179 10 I36t
COFFEE- ROBUSTA. UNHULLED 18 0.86 0.83 0.88 1.06 1.06 1.19 1.19 1.19 1.25 2.50 2.50 3.50 3.50 7.00 7.00 3.8
- ARABICA. PARCHMENT(NOT BUGISU) 19 3.74 3.74 3.31 3.64 4.28 4.28 3.42 4.20 4.22 4.40 5.15 7.35 10.00 15.00 15.00
- ARABICA. PARCH4ENT
(BUGISU I) 20 3.74 3.74 3.30 3.65 4.46 4.46 4.46 4.46 4.46 4.55 5.86 8.50 10.00 15.00 15.00
COTTON (RAW)- SAFI 21 1.32 0.88 0.99 1.10 1.20 1.25 1.25 1.30 1.65 3.00 3.00 3.00 5.00 6.00 0.00 30.9
- FIFI 22 0.50 0.50 0.55 0.55 0.55 0.55 0.55 0.5 0.55 0.75 0.75 0.75 1.00 i.00 1OG
TOBACCOFIRE-CURED. I 23 3.31 3.60 4.00 4.00 4.05 4.05 4.20 4.45 5.50 6.50 8.10 8.65 8.65 50.00
- FLUE-CURED. TLI 24 10.69 10.65 10.65 10.70 10.70 11.00 11.25 11.45 11.85 11.35 *1.95 1t.95 11.95 60.00
FLUE-CURED. TSO 25 6.61 6.50 6.55 6.55 6.80 6.85 7.10 7.20 7.45 12.00 12.15 12.15 12.15
TEA - GREEN LEAF 26 0.8 0.86 0.88 0.88 0.88 0.88 0.33 0.88 0.88 0.88 1.35 1.35 2.00 2.00 6.00
GROUNDNUTS. SHELLED 27 f.37 1.94 2.27 1.69 1.97 2.97 3.48 6.75 10.00 10.00 10.00 10.00
GROUNDNUTS. UNSHELLED 28 1.24 1,28 t.23 1.43 1.83 2.93 4.75 7.00 7.00 7.00 7.00
SOYAREANS 30 0.55 0.95 1.05 0.66 0.72 1.39 2 01 2.45 2.30 2.80 2.30 2.30
BEANS 3t. 0.79 0.98 0.97 1.10 1.38 2.11 2.55 2.45 2.40 2.40 2.40 2.40
FIELDPEAS 32 0.96 1.10 1.13 1.00 0.57 1.73 1.75 2.30 2.0 2.80 2.60 2.80
RICE 33 .i10 3.65 2.82 3.04 4.84 6.06 5.55 5.00 3.00 5.00 5.00
MAIZE 34 0.35 0.43 0.64 0.44 0.79 0.99 1.29 1.66 2.00 2.00 2.00 2.00
FINGER MILLET 35 0.49 0.91 0.96 1.01 0.98 1.71 2.32 2.37 2.40 2.40 2.40 2.40
SORGHUM 36 0.59 0.74 0,87 0.78 0.86 1.26 1.91 1.96 2.00 2.00 2.00 2.00
WHEAT 37 0.45 0.45 0.45 0.50 0.55 0.65 1.39 2.20 3.00 3.00 3 00 3.00
SOURCE: (1) MINISTRY OF PLANNING AND ECONOMIC DEVELOPMENT. STATISTICAL
DEPARTMENT: (2) MINISTRY OF AGRICULTURE.
DATA SET: UQA/75

TABlE 7.3
UGANDA: COSTS OF CROP PRODUCION
(in post-devaluation shillings)
RobustaCoffee Cotton Tea Tobacco Bananas Maize Groundnuts
Cost per hectare (U.Sh.)labor 13,150 5,120 11,558 17,910 7,300 4,400 5,000Inputs - - 19,067 10,012 - 600 12,000
-Seed (-) (-) (2,400) () (600) (12,000)-Fertilizer (-) (-) (10,337) (7,612) (-) (-) (-)-Chemicals (-) (-) (8,730) (-) (-) (-) (-)Implents - - 5,787 - - -
Packing and transport 3,300 500 4,350 1,037 - -Depreciation - - - 5,000 - -Total 16,450 5,620 40,762 33,959 7,300 5,000 17,000
Yield (kg/hectare) 1,590 259 3,625 600 10,000 1,150 710Cost per kg (U.Sh.) 10.3 21.7 11.2 56.6 0.7 4.3 23.9
labor input (mandays/hectare) 210 128 298 597 146 110 125Cost per manday (U.Sh.) 78.3 43.9 136.8 56.9 50.0 45.5 136.0
Notes:
Robusta coffee. For a pure stand of established coffee, without perennial grasses and assuming handweeding. labor input is valued at U.Sh.50 per day (U.Sh. 75 per day for picking at piece-work rate).
Cotton. Assuning no improvements in husbandry or purchased inputs. Labor input is valued at UnSh. 40per manday.Tea. Average for first four-year pruning cycle of abandoned tea. labor input is valued at U.Sh. 40 per
manday.Tobacco. For flue-cured tobacco, using hand labor for primary cultivation. labor input is valued at
U.Sh. 30 per day.Bananas. For established banana garden using hired labor. labor input is valued at U.Sh. 50 per day.Maize and groundnuts. Assuming no improvements in husbandry or purchased inputs. labor input is valued
at U.Sh 40 per manday. Seed costs are based on present market prices within Uganda.

I 11:17 AM 03/17/82PAGE I
TABLE 8.1UGANDA: PRODUCTION OF SELECTED MANUFACTURED GOODS
ITEM 19ss 1967 1968 1969 1970 1971 1972 1973 1974 1975 1976 1977 1978 1979 1980
suGAR ('o TONS) 1 128.9 137.2 152.0 140.1 144.0 141.3 121.1 68.5 38.1 23.9 18.5 11.4 7.8 t5.4 15.0VEGETASLE OILS ('000 TONS) 2 15.4 13.0 12.5 12.8 6.2 1.9 1.7ANIMAL FEEDS ('000 TONS) 3 25.6 25.1 24.9 16.6 10.0 11.9 7.6SPIRITS (WARAGI) ('000 LITERS) 4 238.0 258.0 365.8 396.0 564.5 598. .^ 729.0 910.0 814.0 859.0 543.0 526.0 420.0 69.0 34.0BEEP (MILL. LITERS) 5 19.7 20.5 19.8 21.0 27.8 35.0 37.9 - 45.6 43.5 38.8 23.3 22.1 22.8 6.5 12.0CIGARETTES (BILLIONS) 6 1.3 1.2 1.3 1.3 1.5 1.6 1.7 1.9 2.0 18 1.8 1.9 1.3 0.5 0.6-PIPE TOBACCO (TONS) 7 203.0 183.0 159.0 137.0 127.0 126.0 127.0 96.0 82.0 108.0 115.0 98.0 66.0 9.0 12.0FABRICS (M. SO. PETERS) 8 40.0 46.0 43.4 47.2 49.6 46.2 48.3 38.1 35.6 33.5 38.8 36.6 28.4 15.1 7.5 IBLANKETS (MILLIONS) 9 0.6 i.1 1.2 1.2 1.4 1.2 0.4 0.3 0.2: 0.2 0.3 0.2 0.1 4SCAP (ooo TONS) 10 14.9 12.6 12.0 12.0 12.9 13.6 14.0 6.3 5.1 3.6 .2.5 1.1 0.8 0.8 0.4MATCHES (5) ('000 CARTONS) 1/ 11 38.2 41.6 42.8 40.9 49.3 64.0 57.0 50.0 35.0 37.0 13.3 10.0 4.5 4.4 .8Vt.TCHES (L) ('00O CARTONS) 2/ 12 4.4 6.7 4.6 4.6 6.3 3.9 0.2 2.5 2.5 0.7SUPErHOSPHATES ('ooo TONS) 13 24.6 17.0 15.0 22.8 24.8 23.9 22.6 18.6 14.1 4.0 1.9. 1.2 0.3tTEEL INGOTS ('000 TONS) 14 19.8 17.9 21.4 '20.6 19.5 16.3 10.8 11.7 9.0 6.3 5.7 5.6 6.6 3.4 19CORUG.IRON SHEEtS ('000 TONS) 15 9.3 9.7 11.6 11.9 14.3 12.9 5.1 4.0 1.4 1.1 2.0 2.0 0.4CFrENr ('000 TONS) Is 122.4 139.5 154.9 172.9 191.9 205.1 16S.1 142.7 153.0 98.0 87.7 73.0 44.0 13.0 4.9PAINTS (MILL. LITERS) 17 1.2 1.4 1.7 1.8 1.6 1.4 1.9 0.9 0.4 0.6 0.8 0.1 0.1BLISTER COOPER ('000 TONS) 18 16.7 14.1 9.6 8.9 8.3 5.0 2.3 1.3 0.4FCOTWE'R ('000 PAIRS) 19 2.9 3.2 2.5 1.8 1. 1.1 1.3 0.7
FTSHNETS ('000) 20 467.1 406.5 349.2 362.8 298.8 93.0 98.5 141.0 47.0EICfCLE TIRES & TUBES (MILL.) 21 1.3 1.5 1.4 1.4 0.5 0.4 .0.7 0.7 0.4
1/ OF 1O GROSS SMALL-SIZE MATCHBOXES.2/ OF 200 LARGE-SIZE MATCHOXES.
SOURCE: MINISTRY OF PLANNING AND ECONOMIC DEVELOPMENT. STATISTICALDEPARTMENT.
DATA SET: UGA/US

11:19 AM 11/23/81PAGE 1
TABLE 9.1UGANDA: HIGHWAY NETWORK
(LENGTH IN KM.)
ITEM Primary Rds. Sec. Rds. Tertiary Rds. Total----------- EBit. Gravel Bit. Gravel Bit. Gravel Bit. Gravel TOTAL
RESPONSIBLE AGENCY
MINISTRY OF WORKS 1 1,630.0 2.233.0 85.0 1,704.0 219.0 1,146.0 1.934.0 5,083.0 7,017.0
- KAMPALA 2 632.0 236.0 77.0 179.0 80.0 155.o. 789.0 570.0 1.359.0- MBALE 3 316.0 549.0 553.0 125.0 248.0 441.0 1,350.0 1.791.0- FORT PORTAL 4 536.0 585.0 2.0 679.0 5.0 .443.0 543.0 1,707.0 2,250.0- GULU 5 146.0 863.0 6.0 293.0 5.0 300.0 161.0 1,456.0 1,617.0
RURAL LOCAL AUTHORITIES 1/ 6 20,020.0 20.020.0 20.020.0
CITY COUNCILS 2/ 7 130.0 130.0 130.0
TOTAL 8 1,630.0 2,233.0 215.0 1,704.0 219.0 21,146.0 2,064.0 25.103.0 27,167.0
1/ INCLUDES SOME SECONDARY ROADS.2/ INCLUDES SOME PRIMARY AND TERTIARY ROADS.
SOURCE: (1) MINISTRY OF WORKS.(2) WORLD BANK ESTIMATES.
DATA FILE: D/UGA/9S/D.

il:19 AM 11/23/81
PAGE 1TABLE 9.2
UGANDA: VEHICLE FLEET 1/
ITEM 1971 1972 1973 1974 1975 1976 1977 1978 1979 1980
HEAVY COMMERCIAL VEHICLES 11 6,795.0 6,617.0 5,978.0 5,535.0 7,210.0 6,185.0 5.755.0 5,812.0 3,216.0 3.500.0
PICKUPS AND VANS 12 4,989.0 5.320.0 4,836.0 4.542.0 5,087.0 4,393.0 4.475.0 5,101.0 3,336.0 3,500.0
BUSES 13 903.0 '996.0 9-15.0 902.0 971.0 846.0 777.0 839.0 553.0 00.0
MINI-BUSES AND COMBOS 14 665.0 709.0 645.0 611.0 593.0 514.0 614.0 779.0 533.0 V 500.0
CARS 15 23,771.0 24,054.0 21,732,0 20,025.0 18,994.0 16,523.0 15,734.0 15,757.0 11,279.0 11,000.0
MOTORCYCLES AND SCOOTERS 16 6,161.0 6,235.0 5,654.0 5,381.0 5,132.0 4,399.0 4.5.62.0 4.754.0 4.459.0 4,500.0
OTHERS 17 1.227.0 1,331.0 1,220.0 1,260.0 1,365.0 1,298.0 1,765.0 2,252.0 1,914.0 1,950.0
TOTAL 18 44,510.0 45,262.0 40,980.0 38,256.0 39.352.0 34.158.0 33,682.0 35,294.0 25.290.0 25,550.0
t/ IN 1980 EXCLUDES SOME VEHICLES LICENSED BUT NOT YET RECORDED AT CENTRAL LnREGISTRY.
SOURCE: MINiSTRY OF WORKS.
DATA FILE: D/UGA/9S/D.

11:20 AM 11/23/81PAGE i
TABLE 9.3
UGANDA: RAILWAY TRAFFIC
ITEM 1971 1972 1973 1974 1975 1976 1977 1978 1979 1980
PASSENGERS (NOS.) 21 552.0 667.0 1,185.0 1,659.0 2.007.0 1,697.0 867.0 866.0 624.0 1,288.0
GOODS FORWARDED ('000 TONS) 22 1.030.0 669.0 772.0 670.0 493.0 377.0 308.0 130.0 211.0 195.0
GOODS RECEIVED ('000 TONS) 23 786.0 584.0 1.036.0 918.0 949.0 767.0 363.0 287.0
SOURCE: UGANDA RAILWAYS CORPORATION.
DATA FILE: D/UGA/9S/D.
------------------------ ------------------------------------------------------------------I-- -

11:21 AM 11/23/81PAGE 1
TABLE 9.4UGANDA: RAILWAY ROLLING STOCK
(AS OF JUNE 30. 1981)
---------------.---------------.--- Rolling StockITEM High Low Locomotives
Cov. Open Open Tank Coach Livest. Total Diesel Steam TotalINHERITED FROM EAC 26 42.0 48.0 13.0 8.0 26.0 137.0 21.0 28.0 49.0
ACOUIRED AND DELIVERED 27 380.0 20.0 20.0 420.0 30.0 30.0
SUB-TOTAL 28 422.0 48.0 13.0 8.0 46.0 20.0 557.0 51.0 28.0 79.0
LESS:
RETIRED 29 42.0 48.0 13.0 8.0 26.0 137.0 28.0 28.0
LOST 30 5.0 5.0
SUB-TOTAL 31 42.0 48.0 . 13.0 8.0 26.0 137.0 5.0 28.0 33.0
AVAILABLE ON JUNE 30. 1931 32 380.0 20.0 20.0 420.0 46.0 46.0
OF WHICH:
IN OPERATION 33 380.0 20.0 20.0 420.0 22.0- 22.0
OUT OF SERVICE 34 24.0 24.0
OTHERS:
.ON QRDER 35 84.0 84.0 23.0 23.0
ON LOAN FROM KENYA 1/ 36 90.0 90.0
i/ SINCE JULY 1981. ADDITIONAL WAGONS HAVE ALSO BEEN MADE AVAILABLE. BUTTHERE ARE NO SPECIFIC COMMITMENTS.
SOURCE: UGANDA RAILWAYS CORPORATION.
DATA FILE: D/UGA/95/D.
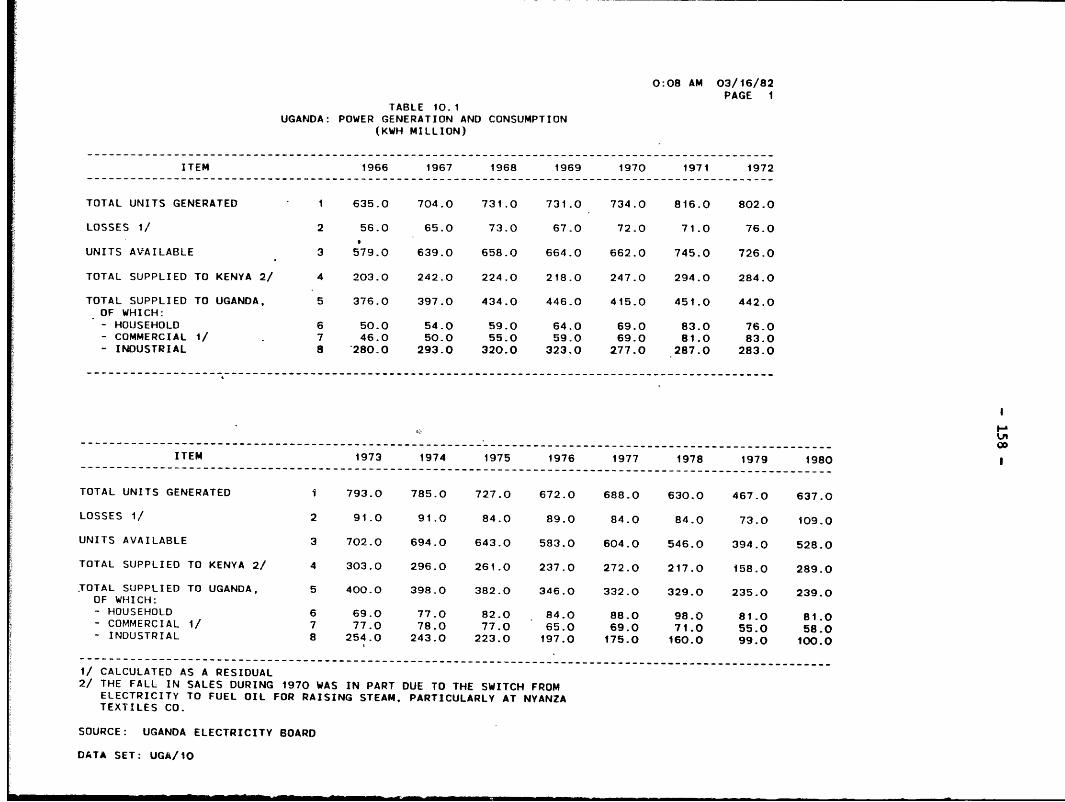
0:o8 AM 03/16/82PAGE 1
TABLE 10.1UGANDA: POWER GENERATION AND CONSUMPTION
(KWH MILLION)
ITEM 1966 1967 1968 1969 1970 1971 1972
TOTAL UNITS GENERATED 1 635.0 704.0 731.0 731.0 734.0 816.0 802.0
LOSSES 1/ 2 56.0 65.0 73.0 67.0 72.0 71.0 76.0
UNITS AVAILABLE 3 579.0 639.0 658.0 664.0 662.0 745.0 726.0
TOTAL SUPPLIED TO KENYA 2/ 4 203.0 242.0 224.0 218.0 247.0 294.0 284.0
TOTAL SUPPLIED TO UGANDA, 5 376.0 397.0 434.0 446.0 415.0 451.0 442.0OF WHICH:- HOUSEHOLD 6 50.0 54.0 59.0 64.0 69.0 83.0 76.0- COMMERCIAL 1/ . 7 46.0 50.0 55.0 59.0 69.0 81.0 83.0- INDUSTRIAL 8 280.0 293.0 320.0 323.0 277.0 287.0 283.0
-- --------- --------...------ -----------------------------------------------------------------.-- . .. O
ITEM 1973 1974 1975 1976 1977 1978 1979 1980
TOTAL UNITS GENERATED 1 793.0 785.0 727.0 672.0 688.0 630.0 467.0 637.0
LOSSES 1/ 2 91.0 91.0 84.0 89.0 84.0 84.0 73.0 109.0
UNITS AVAILABLE 3 702.0 694.0 643.0 583.0 604.0 546.0 394.0 528.0
TOTAL SUPPLIED TO KENYA 2/ 4 303.0 296.0 261.0 237.0 272.0 217.0 158.0 289.0
JTOTAL SUPPLIED TO UGANDA, 5 400.0 398.0 382.0 346.0 332.0 329.0 235.0 239.0OF WHICH:- HOUSEHOLD 6 69.0 77.0 82.0 84.0 88.0 98.0 81.0 81.0- COMMERCIAL 1/ 7 77.0 78.0 77.0 65.0 69.0 71.0 55.0 58.0- INDUSTRIAL 8 254.0 243.0 223.0 197.0 175.0 160.0 99.0 100.0
1/ CALCULATED AS A RESIDUAL2/ THE FALL IN SALES DURING 1970 WAS IN PART DUE TO THE SWITCH FROM
ELECTRICITY TO FUEL OIL FOR RAISING STEAM, PARTICULARLY AT NYANZATEXTILES CO.
SOURCE: UGANDA ELECTRICITY BOARD
DATA SET: UGA/1o

2:47 PM 91/06/81PAGE 1
TABLE 10.2UGANDA: UEB OPERATING STATISTICS
ITEM 1971 1972 1973 1974 1975 1976 1977 1978 1979 1980
UGANDA SALES
CUSTOMERS (NO. '000) 11 69.0 73.0 76.0 81.0 83.0 90.0 93.0 98.0 61.0 93.0
TOTAL SALES (KWH M.) 12 451.0 443.0 400.0 398.0 382.0 346.0 332.0 329.0 235.0 239.0
AVERAGE USAGE PERCUSTOMER (KWH) 13 6,536.0 6.061.0 5,259.0 4,917.0 4,602.0 3,838.0 3,587.0 3,346.0 3,878.0 2,586.0
TOTAL REVENUE (U.SH.M.) 14 101.0 101.0 97.0 99.0 97.0 92.0 92.0 92.0 71.0 95.0
REVENUE PERCUSTOMER (U.SH.) 15 1,460.0 1,386.0 1,275.0 1,218.0 1,167.0 1,018.0 996.0 939.0 1,167.0 1,024.0
REVENUE PER 100 KWHSOLD (U.SH.) 16 22.0 23.0 24.0 25.0 25.0 27.0 28.0 28.0 30.0 40.0
KENYA SALES
TOTAL SALES (KWH MILL.) 17 294.0 284.0 303.0 296.0 261.0 237.0 272.0 217.0 158.0 289.0
TOTAL REVENUE (U.SH. M.) 18 . 11.0 10.0 12.0 11.0 8.0 8.0 9.0 9.0 8.0 20.0
REVENUE PER 100KWH SOLD (U.SH.) 19 4.0 4.0 4.0 4.0 3.0 3.0 3.0 4.0 5.0 7.0 I
RATE OF RETURN ON FIXED LnASSETS (%) 20 13.0 12.0 12.0 9.0 8.0 6.0 6.0 -2.0 -6.0 4.0
- - - - - - - - - - - - - - - - - -- - - - - I
SYSTEM CAPACITY DEMAND
INSTALLED CAPACITY (MW) 21 154.0 154.0 154.0 154.0 154.0 154.0 154.0 154.0 154.0 154.0
MAXIMUM DEMAND(INCLUDING KENYA) (MW) 22 117.0 125.0 130.0 126.0 122.0 115.0 116.0 121.0 114.0 106.0
MAXIMUM DEMAND/CAPACITY RATIO (%) 23 76.0 81.0 84.0 82.0 79.0 75.0 75.0 79.0 74.0 69.0
SOURCE: UGANDA ELECTRICITY BOARD
DATA FILE: D/UGA/10/D.

11:30 AM 11/24/81PAGE 1
TABLE 11.1UGANDA: EDUCATIONAL INSTITUTIONS
(NUMBER)Average
ITEM 1969 1979 Growth Rate---- - ---- ---- ---- ---- ---- ---- --- - ---- ---- (% p .a .)
PRIMARY SCHOOLS 1/ i 2,722.0 4,229.0 4.5
SECONDARY SCHOOLS 2 117.0 210.0 6.0- PRIVATE 3 46.0 92.0 7.2- PUBLIC 4 71.0 118.0 5.2
TECHNICAL SCHOOLS 5 19.0 10.0 -6.2- RURAL TRADE AND OR. FARM 2/ 6 14.0- OTHER 7 5.0 10.0 7.2
TECHNICAL INSTITUTES 8 . 5.0
TEACHER TRAINING COLLEGES 3/ 9 30.0 32.0 0.6
POST-SECONDARY COLLEGES 10 . 3.0
UNIVERSITIES 11 1.0 1.0
1/ INCLUDES 1,986 SCHOOLS WITH P7 IN 1969. COMPARABLE STATISTIC FOR1979 :S NOT AVAILABLE.
2/ NOT REPORTED IN 1979.3/ GRADES II AND III.
SOURCE: MINISTRY OF EDUCATION.
DATA FILE: D/UGA/11/D.

11:25 AM 11/23/81PAGE 1
TABLE 11.2UGANDA: EDUCATIONAL ENROLLMENTS
(000)Average
- Growth ----------.--.--.- Growth RateITEM 1969 1979--------- ------------------------------(% p . a . )
PRIMARY SCHOOL 14 632.2 1.223.9 6.8
Pi 15 113.1 251.7 8.3P2 16 103.8 211.3 7.4P3 17 100.8 189.3 6.5P4 18 90.3 161.9 6.0P5 19 80.0 140.6 5.8P6 20 75.7 136.7 6.1P7 21 68.6 132.3 6.8
SECONDARY SCHOOL - "0 LEVEL" 22 29.5 61.1 7.5
Sl 23 9.0 16.7 6.3S2 24 8.5 15.5 6.2S3 25 6.5 14.9 8.7S4 26 5.6 14.2 9.7
SECONDARY SCHOOL - "A LEVEL" 27 2.1 5.6 10.4
S5 28 1.2 2.8 8.9S6 29 0.9 2.8 12.1
UNIVERSITY 30 1.8 4.3. 9.0
TEACHER TRAINING 3t 3.7 7 9 7.8
GRADE II 32 3.3 6.1 6.4GRADE III 33 0.3 1.1 12.7GRADE II UPGRADING 34 0.1 0.7 19.1
SOURCE: MINISTRY OF EDUCATION.
DATA FILE: D/UGA/il/D.

IBRD 16148R
30- ;-7 33. MARCH 19821
S U D A NUGANDA S UDA N UAlTJCr
PAK 'Main paved roads 1FAKOP
r -- •-**
PARKOther moan roads MOYO e R
Ro- OYOPA CONTRotI, ÖPF .alto 4RTH KARAMOMASRadlways $ANCaARY OiCWNTROLLED ARE-ARivers Mdi Oped Kabong
Swamps -VCSC, Ylumbce J \NaIonal porks /Gamne reserves Yumbe /CON01 E - , I KA-REA-
GAMEA , RE, Kitgurn K E N Y A® Natonal capital Kitgu
D,skr,cl capilalsk
- International boundari,,
SRhino,A nARUA RhinoAngCapAng KortidoP n i AKARJOJA
LEEPHAT - A cT JANRA
ARI MAHENIKOAENcT4ARY COWoNtLED AREAKIOMETERS 0 20 40 61 80 100 NME
MILES 0 20 40 60 GULUUL
MORO1wakwa{
W , FFA, s UTH KARAMDJAåuRkNSON FAL[$N NA A LIRATo RNgole NATNgNAL PAR¥ LIRAou0AA FAtLS
uCNNTR AREAA AREA
CESAKEN NMa dSORa Mas,nd, SOR Tj ANCTU.RY
Z A l R E Bå
Burua > \ l
maI~A KAPCHORW
2,i NakasongolafNoka'songo0)\
ý,Y Nk BALE(Nomas0 gah
4 TOROROFORTBuoo'PORTAL)
Kyinöo oNUBEDE o UBElNDE ganga
Ben,gng
r a PIG K MP L L.gaziMI Lg
MIDASAKA
VIMASAKA A A II?
W l 01/1 32' 33 :,U , .,ý
~GA SUDAN ETHIOPAAD/
Ka Tnz URUNKisn
r Ths ma hasbeenprepred yvihThsma,a be peatTWrunakgutaruclsel o TAN
Wom Lak' MtÅSxAKAtecovneceo h raesor/AðAhe aovnec ftettterpr owihi satceAlhe reo0t hc te ttednmntosue n hsoro t h eomtosue onae hw nti a
bYunlAe shwVntu ontupt, h ata h
RRE Wil An3
Kolumn3,z o Kyo érml