THE PROBLEM OF VARIABLE SELECTION FOR FINANCIAL DISTRESS: APPLYING GRASP METAHEURISTICS
Annals of Management Science
Vol. 3, No. 1, May 2014, 29-42
Two Multiobjective Metaheuristics for Solving the Integrated
Problem of Frequencies Calculation and Departures Planning in
an Urban Transport System
Paulina A. Avila Torres* and Fernando López Irarragorri
Universidad Autónoma de Nuevo León,
Graduate Program in Systems Engineering,
San Nicolás de los Garza 66451, México.
Abstract
The process of urban public transport planning commonly includes four basic activities,
usually executed in sequence: Network design, Timetabling, Vehicle scheduling and Crew
scheduling. In this paper we present a multiobjective model that integrates the calculation of
minimum frequencies and departures scheduling (minimum frequencies are calculated when
solving the Network Design Problem. The calculated frequencies are employed for
Timetabling Construction Problem). Two multiobjective metaheuristics for solving randomly
generated instances of the problem are presented and their performances are compared. The
main scientific contribution of this paper is the development of an integrated mixed integer
linear programming model to construct timetable by selecting frequencies in such a way that
multiple objectives, like operational cost, synchronization, transfer time and smooth
transitions between periods are optimized.
Keywords: Integrated, frequency, timetable.
1. Introduction.
In this paper is addressed the public transport planning problem. This is a process
which is usually divided into four phases: network design, timetabling
construction, vehicle scheduling, and crew scheduling. Usually, these phases are
executed sequentially. Here in the paper, we are tackling the bus timetable
construction problem of an urban bus transport network. This is usually
accomplished in three steps: first for each scenario (covering a concrete planning
period) bus frequencies are calculated for each route in the network, then bus
departures are settled for each route in the network based on previously calculated
frequencies. This is then adjusted for getting acceptable timetables for planners.
The main scientific contribution of this work is the development of an
integrated multi-objective mixed integer lineal mathematical model to construct
multi-period urban bus timetables, which also allows smooth transitions between
----------------------- *Corresponding Author: E-Mail: [email protected]
30 P. A. Torres and F. L. Irarragorri
adjacent planning periods with different demand.
Recently Ibarra-Rojas & Ríos-Solís (2012) have shown formally that the
timetabling problem is NP-Hard, so we implemented two multi-objective
metaheuristics to explore the effectiveness of the proposed model. We designed
an experiment for testing the heuristics with generated random instances.
The timetabling problem has been tackled in the literature from different
approaches. Ceder (2007) proposes an exact methods for creating a timetable with
maximal synchronization. Also, Eranki (2004), proposes a model to create
timetables with maximal synchronization using time windows. She used a
heuristic method to solve the problem, but she did not consider multiple criteria.
Also, other authors consider maximization of synchronization as a key objective
in urban transport planning. Among them, Paunovic (2013) showed a positive
correlation between children blood pressure and road traffic noise, transit density
and public transport. Burke (2011) also advocates the importance of taking into
consideration passenger transfer as a measure of quality for an urban transport
system, which indirectly calls for synchronization maximization. Another
important measure of quality for urban transport planning is quality of service
from the users’ perspective (see Ibeas & Cecin, 2011). Ibeas & Cecin, (2011)
concluded that the most important variables when defining quality of public
transport from the users’ perspective are waiting time, journey time and above all,
level of occupancy. Recently, this claim has been a subject of research studies by
some researchers. For example, Barra et al (2007) presented a model considering
different characteristics of the transport system (passenger requirements, budget
constraints, level of service). There are other research works on timetabling
problem in which the authors use metaheuristics like GRASP. Among these is
Mauttone & Urquhart (2009) who developed a metaheuristic based on GRASP
for optimizing simultaneously different objectives for passengers and schedulers.
In literature, there are approaches such as Szeto & Wu (2011) that combine
two phases of the urban transport process. Szeto & Wu (2011) propose a
simultaneously integrated solution for the bus network design and frequency
setting problems using a genetic algorithm (GA) that tackles the route network
design problem. GA is hybridized with a neighborhood search heuristic which
tackles the frequency setting problem. Also in Cipriani et al. (2012), network
design and frequency calculation are integrated for optimizing passenger transfer,
among other impact measures. There are also approaches for solving two phases
sequentially. A good example is Chakroborty (2003) who combines the transit
routing and scheduling phases using a genetic algorithm. In his approach, he tries
to minimize the transfer time and the waiting time. Another research that
combines several phases is the one proposed by Zhao & Zeng (2008). Zhao &
Zeng (2008) present a metaheuristic method for optimizing transit networks,
including route network design and vehicle headway and timetable. The goal is to
identify a transit network that minimizes a passenger cost function. Their
metaheuristic combines simulated annealing, tabu and greedy search methods.
In some published research works, multiple criteria are considered. In some
Annals of Management Science 31
others, different phases of the transport system are combined sequentially or
integrated. Some others, smooth transitions between periods are considered. An
example of these is Ceder (2007) who proposes two techniques to handle the
smooth transitions between periods with different demand. We have not come
across any article that integrates minimum frequency problem and the timetabling
problem and considers multiple objectives and the smooth transition
simultaneously.
The rest of our paper is organized as follows: in section 2, we will describe
the problem, present the mathematical model and give a brief description of it. In
section 3, we will describe the decision support methodology we are
implementing. Some results will be presented in section 4. In section 5, we will
present some discussions about ranking portfolios. Finally, in section 6, we will
present our conclusions and suggestions for future research.
2. The Development and Interpretations of the Model
According to Ceder (2007), the transport planning process is divided into four
phases: network design, timetabling, vehicle scheduling and crew scheduling. The
timetabling phase has two activities: frequency determination and timetable
assignment. These activities are executed sequentially.
The problem addressed in this paper relates to the development of a
mathematical model for determining, in an integrated way, the frequencies and
the timetables for the operation of the urban transport. The model is a multi-
period model with changing demands.
Additionally, there are multiple objectives that have to be considered in the
model. The objectives are derived from the requirements of the social actors
involved in the process: like synchronization (between bus routes in a specific
node), operational transport cost, transfer time and smooth transitions between
adjacent periods (a transition from a period with high demand to a period with
low demand or the other way).
2.1. The Development of the Model
Assumptions:
The assumptions on which the model is based are:
Demand does not change significantly in each period and it is known
in advanced.
Average travel time from each route in each period is known.
Periods lengths must be enough to allow the schedule of the needed
departures.
The planning requirements must ensure the satisfaction of the
demand during the planning period established.
32 P. A. Torres and F. L. Irarragorri
We consider only departures from the same period of the
synchronization we wish to activate.
Sets:
The following set notations are used in the model:
Set of routes.
Set of nodes.
Set of periods.
Set of pairs of nodes where potentially synchronize the routes i and j.
( ) Set of routes which have common nodes with the route i
Variables:
The following are the model’s decision variables:
There is a trip in the route i with departure time in the interval
(
)in the period v y 0 otherwise.
(
) iff
, iff
If the bus of the route i with departure time in the interval (
) and the bus of the route j with departure time in the
interval (
) in the period v, arrive to the segment
(fixed synchronization node) within the window time and 0 otherwise.
Represents the absolute difference in relation to the closer departure time of
the even average loads method if there is a trip in the route i in the interval
(
) in the period v.
The difference between the arrival time of the routes i and j in the segment
in the period v.
Parameters:
The following are the parameters of the model:
Number of trips in the period, if we use a frequency equal to .
Maximum load of passengers in the route i in the period v.
Maximum load of passengers on bord in the day in the route i.
Desired occupancy of the bus in the route i in the period v.
Total passengers/km, in the route i in the period v.
Length of the route i.
Bus capacity of the route i in the period v.
Length of the segment k.
Percentage allowed of the route i of exceed the load in the period v.
Minimum headway of the route i in the period v.
Annals of Management Science 33
Maximum headway of the route i in the period v.
Planning period [
].
Beginning time of the planning period v.
Ending time of the planning period v.
Desired time before the end of the period for the last departure of the route
i in the period v.
Maximum window time for the route i in the period v.
Minimum window time for the route i in the period v.
Travel time from the origin point of the route i to the segment k in the period v.
Minimum time the passenger needs to change from segment k of the route i
to the segment u of the route j in the period v.
Number of passengers changing from segment k of route i to the segment k
of the route j.
Maximum load average of passengers on bus of route i in the period v.
Method applied to determine the frequency in the period v.
Minimum frequency required to satisfy the demand of the route i in the
period v.
Timetable calculated with the even average load method. 1 if there is a
departure in the interval p for the route i in the period v.
Fixed cost for the route i in the period v.
Variable cost for the route i in the period v.
Average of passengers on board in the segment k in the period v.
Holding time of the route i in the interval p during the period v.
The model:
Using all the set symbols, decision variables, and input parameters defined
above, we develop the model’s objective functions and constraints and present it
(the model) as follows.
∑ ∑ (
∑
) (1)
∑ ∑ ∑ ∑ ∑ ∑
( ) ( ) (2)
∑ ∑ ∑ ∑
( ) ( )
(3)
∑ ∑ ∑
(4)
s.t.
34 P. A. Torres and F. L. Irarragorri
∑
(5)
∑
(6)
∑
∑
(7)
∑
∑
∑
{
} (8)
(9)
∑
{ } (10)
(11)
(
)
(12)
( )
(13)
( ) ( ) (14)
((
) (
)) (15)
( ) ( )
( ) ( ) (16)
|(
)| ( ) (17)
(18)
Annals of Management Science 35
2.2. Model Interpretations
The model consists of 4 objective functions, the first objective function, (1),
minimizes the total cost. There are fixed and a variable costs associated with the
long route and the departures made on the route in any period. The second
function, (2), maximizes the number of synchronizations between two bus routes
in a period. The third function, (3), minimizes the transfer times, and the fourth
function, (4), minimizes a penalty for not meeting the departure time obtained
with an average loads method (Brans & Mareschal, 2005), which guarantees a
good transition between periods with different demand.
These objective functions are subjected to frequency constraints (5) to (8),
which were proposed by Ceder (2007). Constraint (9) says that if there is no
travel in period v on the route i in the segment k, then we do not assign a
departure time. Constraint (10) ensures that the quantity of departures must be the
maximum of the number of departures determined by the maximum headway and
the minimum frequency, which satisfies the maximum load point. This guarantees
that demand is met.
Constraint (11) specifies that the departure time of the first departure must be
less or equal to the maximum headway. Constraint (12) is for the consecutive
departures. It specifies that the departure time must be between a minimum and a
maximum headway. For the last departure, (13) ensures that the departure time
must be between the end of the period and a desired time. Constraint (14)
represents synchronization. This means when two buses of different routes arrive
to a synchronization node between a time window, and taking into account the
transfer times, the permanence time in a node, and the travel time, then there is a
synchronization.
Constraints (15) and (16) account for the time that passengers wait to do the
transfer. Constraints (17) and (18) are related to objective function (4). They
represent the difference between the departure assigned by our model and the
closer departure, just as in the method of average loads proposed by Ceder
(2007).
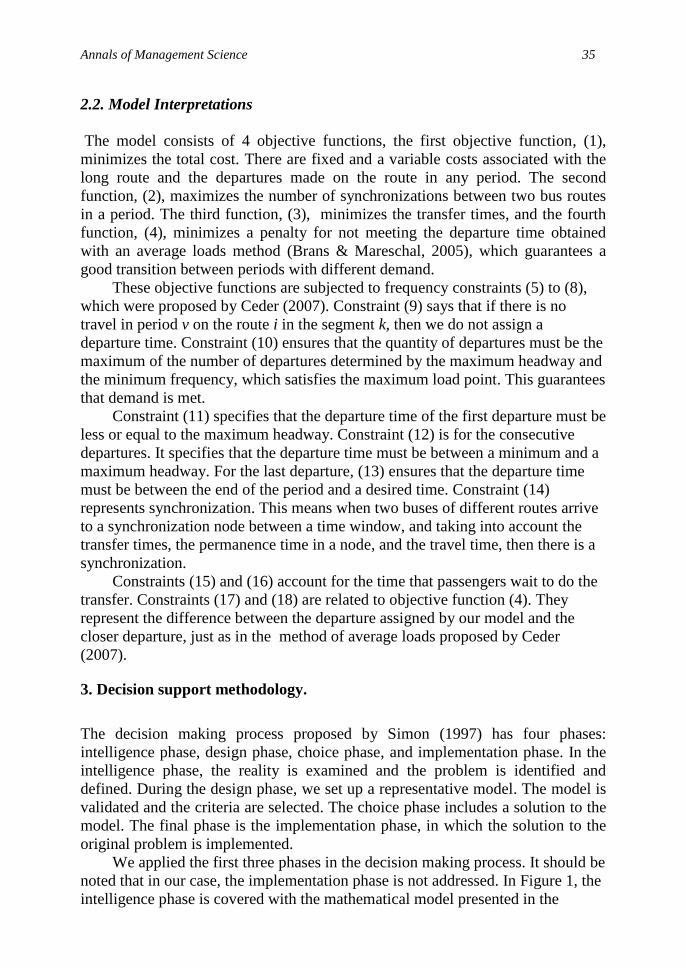
3. Decision support methodology.
The decision making process proposed by Simon (1997) has four phases:
intelligence phase, design phase, choice phase, and implementation phase. In the
intelligence phase, the reality is examined and the problem is identified and
defined. During the design phase, we set up a representative model. The model is
validated and the criteria are selected. The choice phase includes a solution to the
model. The final phase is the implementation phase, in which the solution to the
original problem is implemented.
We applied the first three phases in the decision making process. It should be
noted that in our case, the implementation phase is not addressed. In Figure 1, the
intelligence phase is covered with the mathematical model presented in the
36 P. A. Torres and F. L. Irarragorri
previous section, the design phase covers the optimization - in this case,
metaheuristics optimization (MOTS Hansen (1997) and SSPMO Molina et al.
(2007)) is applied.
Finally, in the selection phase, we employ Promethee Brans & Mareschal
(2005) because the generated ranking of alternatives offered allows the schedulers
to choose the most attractive alternatives with regard to his own preferences.
Also, it allows the application of any ranking method as an interactive method.
Phases Actions
Intelligence Mathematical model
Design Multiobjective optimization
Selection Exploring efficient frontier
Figure 1. Phases of decision making process according to Simon (1997)
MOTS Hansen (1997) is an adaptation of the well know tabu search. It is
used heuristically to generate non-dominated alternatives to multiobjective
combinatorial optimization problems. MOTS works with a set of current solutions
which, through manipulation of weights, are optimized towards the non-
dominated frontier while at the same time seek to disperse over the frontier.
The basic MOTS procedure starts by setting a random feasible starting
solution and then determining a weight vector for the point. Each element in the
weight vector is set according to the proximity of the other points for that
objective. The closeness is measured by a distance function based on some metric
in the objective function space and using the range equalization weights. The
standard tabu search procedure is used to replace a current solution with the best
feasible neighbor solution that is determined by the scalar product between the
weight vector and the vector objective function. The new point is inserted into the
ND-set if it is non-dominated. Then we replace one randomly selected solution by
another randomly selected solution whenever a drif-criterion is reached and we
continue with the next iteration until a stop-criterion is met.
SSPMO Molina et al. (2007) consists of a scatter/tabu search hybrid that
includes two different phases: 1) generation of initial set of efficient points
through various searches and 2) combinations of solutions and updating of
efficient frontier (Ê) via scatter search.
The procedure starts by linking p+1 tabu searches. The first tabu search
starts from an arbitrary point and attempts to find the optimal solution to the
problem with a single objective function f1(x). Let x1 be the last point visited at
the end of this search. Then, a tabu search is applied again to find the best
solution to the problem with the single objective f2(x) using x1 as the initial
solution. This process is repeated until all the single-objective function problems
associated with the p objectives have been solved. At this point, we again solve

Annals of Management Science 37
the problem with the first objective function f1(x) starting from xp, to finish a
cycle around the efficient set. The aim in this step is to minimize a function that
measures the distance to the ideal point.
In the second phase, the main search mechanism is the combination of
solutions that are currently considered efficient and therefore belong to Ê. The
solutions to be combined are selected from the reference set. Every solution that
is added to RefSet is also added to Tabu-RefSet. All pairs of solutions in RefSet
are combined and each combination yields four new trial solutions. Then the
same tabu search used in the initial phase is applied to improve new trial
solutions, guided by a compromise function. Solutions generated during this
improvement phase are tested for possible inclusion in Ê. With this, we update the
RefSet in preparation for the next scatter search iteration
After we have presented the procedure of both metaheuristics, we can see
that the structure of SSPMO helps us to find better solutions because, first, we
construct the space where all possible feasible solutions can be when we solve
individually each objective and we use the best solution to star the next search
and then we improve the found solutions. Using MOTS, we generate a set of
feasible solutions by optimizing all objective at the same time, and we do not
have an idea of where best solutions could be.
4. Results.
Random instances were created and classified according to the number of periods,
bus stops and routes into small, medium and large. In relation to synchronization,
the instances were classified by density according to the percentage of the
combinations of bus stops in each route. (See Table 1). The instances generator
was developed in OPL (Optimization Programming Language).
Table 1. Characteristics of instances.
Small Medium Large
Routes 2-4 5-8 8
Periods 3-5 8-10 8-10
Nodes 10-18 19-23 35-50
Density 1%-2% 2%-4% 4%-7%
Out of the 25 instances tested, we have selected three of them to show their
results and compare both algorithms because in the other instances the behavior is
similar. Table 2 shows the classification random instances.

38 P. A. Torres and F. L. Irarragorri
Table 2. Results of the classifications of random instances
Small Medium Large
Routes 3 4 6
Periods 5 9 10
Nodes 37 88 153
Headways 9-19, 11-17, 10-
18,8-20
6-10,4-12 6-10,4-12
Synchronization
nodes
45 271 1201
Waiting Window 10-29, 5-16, 6-33,
10-14,3-29
4-34,4-18, 10-26,1-
16, 10-29,2-22, 7-
28,3-15, 5-34
7-28, 7-18, 5-28, 4-
19, 9-27, 1-21, 10-30,
2-19, 13-29, 8-15
For the medium instance category, we got 19 efficient solutions with MOTS
and 99 efficient solutions with SSPMO. We find that most of the objectives in
both methods have a distance very similar to the ideal point (center of graph).
However, the distance of the penalty obtained with SSPMO in this instance is
bigger.
In the large instance category, we got 21 efficient solutions with MOTS and
99 efficient solutions with SSPMO. We find that both methods have very similar
distances in cost and synchronizations but the distance for penalty and transfer
time make both solutions attractive for the decision maker according to his
preferences.
Figure 2. Distance to the ideal point
In Table 3, we present the summary of the results we obtained in each
instance category with each metaheuristics. The execution time for each
Large Instance Medium Instance Small Instance

Annals of Management Science 39
metaheuristic is also presented.
Table 3. Results obtained in each instance category with each metaheuristic
O.F. Small Medium Large
MOTS SSPMO MOTS SSPMO MOTS SSPMO
Cost .51 .49 .50 .50 .50 .50
Synchronization .47 .53 .46 .54 .50 .50
Transfer Time .49 .51 .47 .53 .50 .43
Penalty 1 0 .10 .90 .68 .32
Ex. Time (sec.) 30 84420 1320 2704620 2820 124140
5. The Comparison and Ranking of the Solutions
To compare the solutions obtained with both metaheuristics, a metric method, a
ranking method or an interactive method like Korhonen & Halme (1996) can be
used. In our case, we used a ranking method. We decided to implement a
Promethee I, for simplicity, but we would like to note that any other method can
be selected.
To establish the preference values, we simulated a decision maker. We
consider 5% as the indifference threshold and 20% as the preference threshold for
all objectives. The determination of these values are based on the range of
variation of the values of the objectives of the alternatives. With regard to the
weights, the cost is considered as the main objective and, therefore, a weight of
50% is assigned to it. The synchronizations and the transition between periods are
equally important. Hence, a weight of 20% is assigned to each of them. The least
important is the transferring time which has a weight or 10% attached to it.
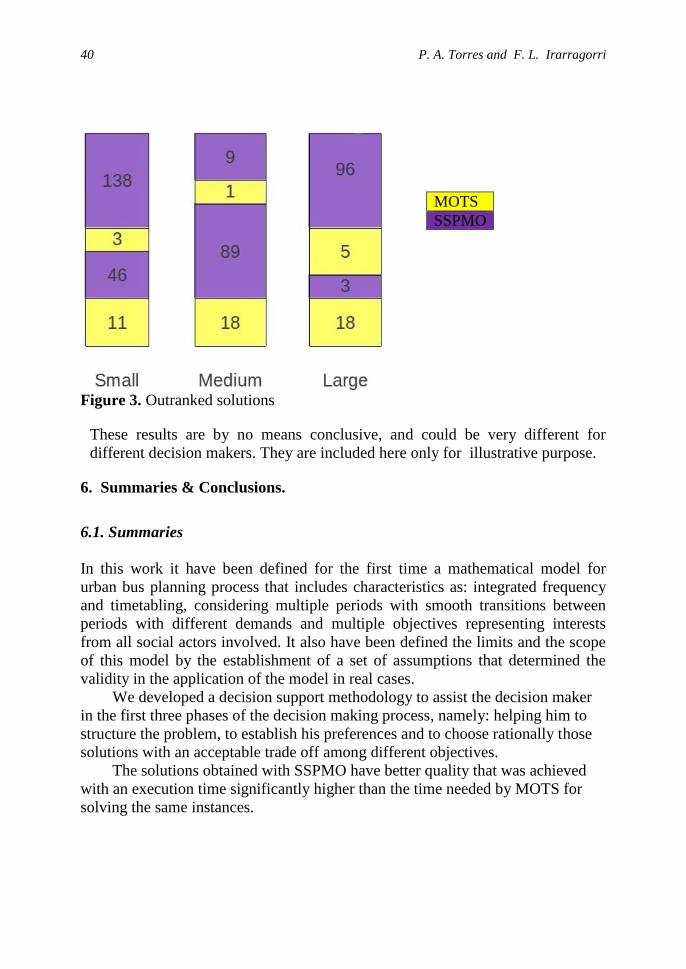
In Figure 3, we made comparisons between MOTS and SSPMO based on an
outranking relation. These results have been obtained by applying Promethee I to
the set of alternatives, conformed for the efficient solutions given for both
methods in a particular instance. In each column we present blocks of efficient
solutions obtained with both methods, the superior block outranks the solutions of
the inferior block.
The example for the small instance category, the first block, has 138 efficient
solutions of SSPMO, these solutions outrank the three solutions of the second
block, but these three solutions outrank the solutions of the third block, and so on.
From these results, one can conclude that SSPMO gives solutions of better
quality (with respect to the proximity of Pareto front) than MOTS.
These comparisons provide the criteria for discarding non-efficient solutions.
If an efficient solution generated by one of both methods is outranked by at least
one solution of the other method, then it will be discarded.
40 P. A. Torres and F. L. Irarragorri
Figure 3. Outranked solutions
These results are by no means conclusive, and could be very different for
different decision makers. They are included here only for illustrative purpose.
6. Summaries & Conclusions.
6.1. Summaries
In this work it have been defined for the first time a mathematical model for
urban bus planning process that includes characteristics as: integrated frequency
and timetabling, considering multiple periods with smooth transitions between
periods with different demands and multiple objectives representing interests
from all social actors involved. It also have been defined the limits and the scope
of this model by the establishment of a set of assumptions that determined the
validity in the application of the model in real cases.
We developed a decision support methodology to assist the decision maker
in the first three phases of the decision making process, namely: helping him to
structure the problem, to establish his preferences and to choose rationally those
solutions with an acceptable trade off among different objectives.
The solutions obtained with SSPMO have better quality that was achieved
with an execution time significantly higher than the time needed by MOTS for
solving the same instances.
MOTS
SSPMO
Annals of Management Science 41
6.2. Conclusions
The frequency and timetable integrated problem is a NP-Hard problem that has
not been studied enough. They need deeper and more extensive studies due to
their importance in the planning of urban transport systems.
In Mexico, it is very important to develop a tool which solves this problem
because the decision makers develop schedules based on their experience. If there
are tools or techniques that can be applied, transport agencies will be able to
improve their performance, minimize costs and give better quality services to
their passengers or customers. Presently, we do not know of any attempt that has
been made to solve the integrated frequency and timetable problem.
Here in our research, we have implemented two metaheuristics for solving
the frequency and timetable integrated problem. Among them, SSPMO is the one
that give us better results.
Although we present a mathematical model in this research, we have not
developed or implemented an exact method for its solution. We hope to do that in
future. In this research, we have assumed that demand is deterministic. But, in
real life, this is not always the case. In future, we would like to consider and
incorporate situations in which there are demand and travel time uncertainties.
References
Barra, Alexandre, Carvalho, Luis, Teypaz, Nicolas & Balassiano, Ronaldo
(2007). Solving the transit network design problem with constraint
programming, 11th World Conference in Transport Research
Brans, Jean-Pierre & Mareschal, Bertrand (2005). Multiple criteria decision
analysis. Springer(Ed), Promethee Methods, 163-195. New York, USA.
Burke, M., Dodson J., Mees P., Stone J. (2011). The Principles of Public
Transport Network Planning: A review of the emerging literature with select
examples. Urban Research Program, (15), Griffith University, Australia.
Ceder, A. (2007). Public transit planning and operation: theory, modeling and
practice. (1). Elsevier.
Chakroborty, Partha (2003), Genetic Algorithms for Optimal Urban Transit
Network Design, Computer-Aided Civil and Infrastructure Engineering,
18(3), 184-200.
Cipriani, E., Gori, S. & Petrelli, M. (2012). Transit network design: A procedure
and an application to a large urban area. Transportation Research Part C:
Emerging Technologies, 20(1), 3-14.
Eranki, Anitha, A model to create bus timetables to attain maximum
synchronization considering waiting times at transfer stops (2004).
University of South Florida.
Simon Herbert A. (1997). Administrative Behavior: a study of decision-making
process in administrative organizations.(4). The free press.
Hansen, Michael Pilegaard (1997). Tabu search for multiobjective optimization:
42 P. A. Torres and F. L. Irarragorri
MOTS. MCDM Cape Town South Afica.
Ibarra-Rojas, Omar J. & Rios-Solis, Yasmin A. (2012). Synchronization of bus
timetabling, Transportation Research Part B: Methodological, 46(5), 599-
614.
Ibeas, A. & Cecin, P. (2011). The quality of service desired by public transport
users. Transport Policy, 18(1), 217-227
Korhonen, P. & Halme, M. (1996). Using Lexicographic Parametric
Programming for Searching a Non‐dominated Set in Multiple‐Objective
Linear Programming. Journal of Multi‐Criteria Decision Analysis, 5(4), 291-
300.
Mauttone, Antonio & Urquhart, María (2009). A multi-objective
metaheuristic approach for the Transit Network Design Problem, Public
Transport, 1(4), 253-273.
Molina, Julian, Laguna, Manuel, Martí, Rafael & Caballero, Rafael (2007).
SSPMO: A Scatter Tabu Search Procedure for Non-Linear Multiobjective
Optimization, INFORMS Journal on Computing, 19(1), 91-100.
Paunovic, K., Belojevic, G. & Jakovljevic, B. (2013). Blood pressure of urban
school children in relation to road-traffic noise, traffic density and presence
of public transport. Noise and Health, 15(65), 253-260.
Szeto, W.Y. & Wu, Yongzhong (2011). A simultaneous bus route design and
frequency setting problem for Tin Shui Wai, Hong Kong, European Journal
of Operational Research, 209(2), 141-155.
Zhao, Fang & Zeng, Xiaogang (2008). Optimization of transit route network,
vehicle headways and timetables for large-scale transit networks, European
Journal of Operational Research, 186(2), 841-855.
Copyright © 2022 FDOKUMEN