STEM Switching: Examining Departures of Undergraduate Women in STEM Fields
24
Journal of Women and Minorities in Science and Engineering 17(2), 149–171 (2011) ISSN 1072-8325/11/$35.00 Copyright © 2011 by Begell House, Inc. 149 STEM SWITCHING: EXAMINING DEPARTURES OF UNDERGRADUATE WOMEN IN STEM FIELDS Casey E. George-Jackson College of Education, University of Illinois at Urbana-Champaign, Champaign, Illinois 61820, USA, E-mail: [email protected]l Address all correspondence to: Casey E. George-Jackson, E-mail: [email protected] This study uses longitudinal data of undergraduate students from five public land-grant universities to beer understand undergraduate students’ persistence in and switching of majors, with particu- lar aention given to women’s participation in science, technology, engineering, and mathematics (STEM) fields. The study examines paerns of behavior of women in relation to students’ initial choice of college major and major field persistence. Of particular interest is what fields students enter upon departing from an initial STEM major, rather than assuming that such movements are a loss to the STEM fields. Factors that impact major field persistence are also examined, as well as how switching majors affects students’ time-to-degree. Using a broad definition of STEM, data from nearly 17,000 undergraduate students was analyzed using descriptive statistics and cross-tabulations. The results highlight women’s retention in STEM through their movement between a variety of STEM majors, challenging common notions of departure from the STEM fields. The study calls for researchers to use a broad definition of STEM and highlights the need to follow students upon switching majors. KEY WORDS: undergraduate women in STEM, women of color in STEM, college majors, persistence in majors, land-grant universities 1. INTRODUCTION The connection between social stratification and higher education has been an area of inter- est for education researchers for some time. Past studies have investigated not only how higher education can perpetuate or disrupt social stratification, but also how college stu- dents’ choice of major can impact social mobility and occupational status. Differences in major field selection at the college level continue to stratify groups along gender and racial lines, leading to differential salary earnings and workforce opportunities. Access to and en- trance into high-status, high-reward fields such as science, technology, engineering, and mathematics (STEM) continues to be limited for women and minorities. The complexity of the underrepresentation of women and students of color in STEM fields is reflected in the many explanations, results, and implications offered by researchers from multiple disciplines. Although the number of underrepresented students in the STEM pipeline has slowly increased in recent decades, disparities still exists between well-repre- sented (defined in this study as white and Asian male students) and underrepresented popula- tions in these fields (Oakes, 1990; Stake and Mares, 2001). As shown by Camp (1997), Sax (2000), and Seymour (2001), underrepresentation in these fields at the undergraduate level
-
Upload
louisville -
Category
Documents
-
view
0 -
download
0
Transcript of STEM Switching: Examining Departures of Undergraduate Women in STEM Fields
Journal of Women and Minorities in Science and Engineering 17(2), 149–171 (2011)
ISSN 1072-8325/11/$35.00 Copyright © 2011 by Begell House, Inc. 149
STEM SWITCHING: EXAMINING DEPARTURES OF UNDERGRADUATE WOMEN IN STEM FIELDS
Casey E. George-Jackson
College of Education, University of Illinois at Urbana-Champaign, Champaign, Illinois 61820, USA, E-mail: [email protected]
Address all correspondence to: Casey E. George-Jackson, E-mail: [email protected]
This study uses longitudinal data of undergraduate students from five public land-grant universities to better understand undergraduate students’ persistence in and switching of majors, with particu-lar attention given to women’s participation in science, technology, engineering, and mathematics (STEM) fields. The study examines patterns of behavior of women in relation to students’ initial choice of college major and major field persistence. Of particular interest is what fields students enter upon departing from an initial STEM major, rather than assuming that such movements are a loss to the STEM fields. Factors that impact major field persistence are also examined, as well as how switching majors affects students’ time-to-degree. Using a broad definition of STEM, data from nearly 17,000 undergraduate students was analyzed using descriptive statistics and cross-tabulations. The results highlight women’s retention in STEM through their movement between a variety of STEM majors, challenging common notions of departure from the STEM fields. The study calls for researchers to use a broad definition of STEM and highlights the need to follow students upon switching majors.
KEY WORDS: undergraduate women in STEM, women of color in STEM, college majors, persistence in majors, land-grant universities
1. INTRODUCTION
The connection between social stratification and higher education has been an area of inter-est for education researchers for some time. Past studies have investigated not only how higher education can perpetuate or disrupt social stratification, but also how college stu-dents’ choice of major can impact social mobility and occupational status. Differences in major field selection at the college level continue to stratify groups along gender and racial lines, leading to differential salary earnings and workforce opportunities. Access to and en-trance into high-status, high-reward fields such as science, technology, engineering, and mathematics (STEM) continues to be limited for women and minorities.
The complexity of the underrepresentation of women and students of color in STEM fields is reflected in the many explanations, results, and implications offered by researchers from multiple disciplines. Although the number of underrepresented students in the STEM pipeline has slowly increased in recent decades, disparities still exists between well-repre-sented (defined in this study as white and Asian male students) and underrepresented popula-tions in these fields (Oakes, 1990; Stake and Mares, 2001). As shown by Camp (1997), Sax (2000), and Seymour (2001), underrepresentation in these fields at the undergraduate level

Journal of Women and Minorities in Science and Engineering
George-Jackson150
has long-term, negative reverberations in terms of graduate program enrollment and careers in STEM fields. The latter is of particular concern to education policymakers and business leaders (U.S. Department of Education, 2006).
Research on the topic of underrepresentation in STEM fields provides an opportunity to better understand gender and racial differences and to respond to calls for increased representa-tion of women and minorities for reasons of equity, social mobility, scientific workforce devel-opment, and national competitiveness (Blickenstaff, 2005; Hanson, 2004; Leslie et al., 1998; Oakes, 1990). Continuing this line of research is necessary, particularly in the STEM fields, because through the process of “uncovering differences in persistence patterns across diverse groups, we can illuminate factors that inhibit equal opportunity as well as policy factors that might be able to improve opportunity” (Carter, 2006, p. 34). To better understand the prepara-tion of a skilled, scientific workforce, it is important to consider the patterns of those who move through the STEM education pipeline and the impact of public land-grant universities on edu-cating undergraduates in these fields.
2. LITERATURE REVIEW
A number of explanations for the continued underrepresentation of women and minorities in the STEM fields are offered in the literature, with issues existing throughout the “leaky pipeline” (Blickenstaff, 2005, p. 369). Departures from the STEM pipeline differ by gender and race (Blickenstaff, 2005; Seymour, 2001), with fewer women and minorities persisting in the STEM pipeline, beginning in elementary school, continuing through higher education, and into the workforce.
Individuals who deviate from STEM—by individual choice or other factors—encounter great difficulty in re-entering the pipeline at a later point in time, or never return (Elliott et al., 1996). Preparing to enter STEM majors and occupations is largely a sequential and lin-ear process given the prerequisites that are required to advance in the sciences and remain in the STEM pipeline from year-to-year. Declaring a STEM major early in college is critical to minimizing additional time, funds, and opportunity costs “because the prerequisites for engineering coursework increase the ‘cost’ to switch into engineering for students who lack these courses” (Frehill, 1997, p. 228).
A number of factors impact the persistence of women and minorities in the STEM fields, including “precollege preparation, recruitment programs, admissions policies, financial as-sistance, academic intervention programs, and graduate school preparation and admission” (May and Chubin, 2003, p. 27). Precollege factors include how individuals are socialized regarding their specific role in society (Clewell and Campbell, 2001), course-taking pat-terns and performance (Blickenstaff, 2005), issues of pedagogy (Tai and Sadler, 2001), self-esteem and self-confidence (Association of American University Women, 1991; Lesley and Oaxaca, 1998), and participation in recruitment and retention programs that help retain stu-dents in the STEM pipeline (Hrabowski and Maton, 1995; Watson and Froyd, 2007).
Academic preparation and performance in high school and college are also important factors to consider in regard to understanding enrollment and persistence patterns in STEM fields. Academic preparation, as measured by standardized test scores and performance in high school math and science courses, is a predictor of performance in college-level math and science courses and for persistence in STEM fields (Elliott et al., 1996). In addition, standardized test scores are significant predictors of all students persisting to their second year of college in STEM majors (Tan, 2002). High standardized test scores can also result

Volume 17, Issue 2, 2011
STEM Switching 151
in students attending highly selective institutions, which are also shown to positively impact persistence in STEM, regardless of students’ race or gender (Tan, 2002). Academic perfor-mance pertains not only to students’ grades, but also the impact of using different teaching methods on students’ learning outcomes (Tai and Sadler, 2001), as well as the differential decisions men and women make pertaining to their major. For example, a study of chemical engineering students found that upon failing a course in their major, men were more likely to remain in chemical engineering and retake the course, while women were more likely to transfer to a new major (Felder et al., 1995). In addition, men and women cited different rea-sons for failing, whereby “women were more likely than men to attribute poor performance to their own lack of ability and the men were more likely to attribute it to a lack of hard work or being treated unfairly” (Felder et al., 1995, p. 162).
Financial aid, including the amount, quality, and mix of aid, can impact the amount of time students devote to their studies and allow students to enter more costly majors—all important factors in the STEM fields. For instance, African American students enrolled in high-demand majors are more likely to persist due to the perceived economic benefit of obtaining a job in that field following graduation (St. John et al., 2004), signaling “a nexus between students’ financial reasons for attending college and their subsequent persistence behavior” (Carter, 2006, p. 41). Other factors that impact students during college include future workforce goals (Frehill, 1997) as well as interests in and attitudes toward science (Elliott et al., 1996),
Early research on underrepresentation focused on individual factors (Brainard and Car-lin, 1998), while more recent research has focused on departmental and institutional factors, highlighting how contextual factors such as campus climate or faculty composition can also impact students’ participation and success in the STEM fields (see Elliott et al., 1996; Smyth and McArdle, 2004; Turner and Bowen, 1999). Other institutional factors considered by researchers include the presence of underrepresented faculty (Etkowitz et al., 1994) and the gender distribution within a specific field (Serex and Townsend, 1999), institutional type and selectivity (Smyth and McArdle, 2004), and the availability of support services and other intervention programs.
Although extensive research has been conducted on the many factors that impact under-represented students’ entrance and persistence in the STEM fields, there is a current gap in the existing literature in understanding what majors students switch to after initially majoring in a STEM field. Past studies on STEM participation are limited by ending observations of students at the point of departure from a STEM major, which is viewed as not persisting in STEM, or by only examining the major that a student obtains their degree in. The ability to track students’ movements between various majors between matriculation and graduation represents one way to address these limitations.
3. THE CONTEXT
Land-grant institutions are a unique set of institutions due to the history of their formation and their mission. The Morrill Act of 1862 utilized “federal economic policy” (Key, 1996, p. 198) to establish land-grant colleges and universities in each state. These institutions were charged with the purpose of educating the nation’s citizens, particularly in the areas of mechanics, industry, and agriculture. The founding and expansion of these universities increased overall access to higher education, although this was not the act’s original purpose (Johnson, 1981). When public universities, many of which were land grants, offered coeducation, access to higher education
Journal of Women and Minorities in Science and Engineering
George-Jackson152
was expanded even further, beginning with the University of Iowa in 1855 (Rudolph, 1990). Co-education at the nation’s land-grant colleges and universities resulted in a “proliferation of op-portunities for women” (Thelin, 2004, p. 75). Today these institutions continue to play a unique role in American higher education and the tradition of educating the nation’s higher education students in the sciences. In addition, due to the large student bodies, land-grant universities also serve a large number of minority students. Given the history of land-grant colleges and universi-ties, their role in educating scientists, and the number of students they educate, these institutions are important to investigate the extent to which they provide opportunities for women to enter and persist in the sciences.
4. RESEARCH OBJECTIVES
This study investigates the movement of undergraduate women within and from STEM fields at a set of public land-grant universities using a broad definition of STEM. Specifi-cally, students’ initial and last major are examined, with a primary focus on women in the STEM fields. The following research questions are examined: At what rate do undergraduate females initially declare a STEM major as compared to undergraduate males?
1. What are the rates of persistence in STEM fields for undergraduate females as com-pared to undergraduate males?
2. Of students who switch majors, what type of majors do they enter? When do these movements occur?
Comparisons are first made between males and females, then between racial and ethnic groups of women, in order to uncover possible differences that exist between these groups.
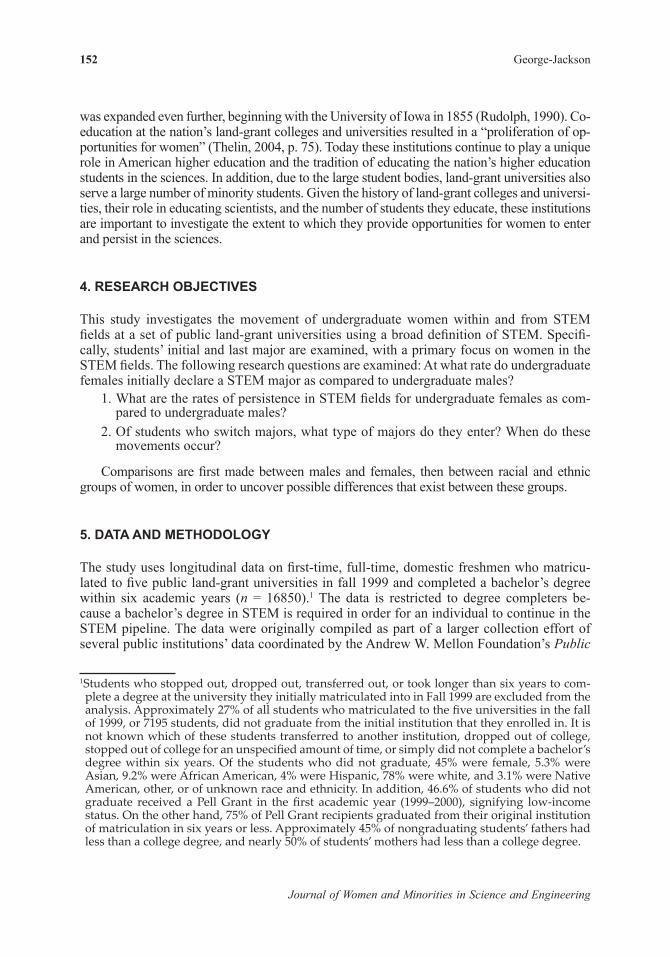
5. DATA AND METHODOLOGY
The study uses longitudinal data on first-time, full-time, domestic freshmen who matricu-lated to five public land-grant universities in fall 1999 and completed a bachelor’s degree within six academic years (n = 16850).1 The data is restricted to degree completers be-cause a bachelor’s degree in STEM is required in order for an individual to continue in the STEM pipeline. The data were originally compiled as part of a larger collection effort of several public institutions’ data coordinated by the Andrew W. Mellon Foundation’s Public
1Students who stopped out, dropped out, transferred out, or took longer than six years to com-plete a degree at the university they initially matriculated into in Fall 1999 are excluded from the analysis. Approximately 27% of all students who matriculated to the five universities in the fall of 1999, or 7195 students, did not graduate from the initial institution that they enrolled in. It is not known which of these students transferred to another institution, dropped out of college, stopped out of college for an unspecified amount of time, or simply did not complete a bachelor’s degree within six years. Of the students who did not graduate, 45% were female, 5.3% were Asian, 9.2% were African American, 4% were Hispanic, 78% were white, and 3.1% were Native American, other, or of unknown race and ethnicity. In addition, 46.6% of students who did not graduate received a Pell Grant in the first academic year (1999–2000), signifying low-income status. On the other hand, 75% of Pell Grant recipients graduated from their original institution of matriculation in six years or less. Approximately 45% of nongraduating students’ fathers had less than a college degree, and nearly 50% of students’ mothers had less than a college degree.

Volume 17, Issue 2, 2011
STEM Switching 153
University Database project. Variables used in the study included gender, race/ethnicity, standardized test scores, institution attended, first major, last major, cumulative undergradu-ate GPA, and graduation date. For students who filed FAFSA for the 1999–2000 academic year, additional information was available, including parents’ educational attainment, par-ent’s marital status, parent’s income, Pell Grant, and Supplemental Educational Opportunity Grant (SEOG) status.2 Receiving a Pell Grant or SEOG served as an indicator of low-income status. The research questions are answered using descriptive statistics, cross-tabulations, and chi-square analysis.
5.1 Definitions
Previous studies on STEM have focused on a single major (Frehill, 1997; Tai and Sadler, 2001; May and Chubin, 2003) or a narrow set of high-profile STEM majors (Chen and Weko, 2009), or have not specified what majors they include in their analysis (Brainard and Carlin, 1998). This study used a broad definition of STEM in order to capture and compare a wide range of math- and science-based majors. While much attention has been given to the high-status, high-profile STEM fields (e.g., computer science and engineering)—often fo-cused on due to the large number of concentrated efforts in improving participation and out-comes in these fields (Chen and Weko, 2009)—other scientific fields such as the agricultural sciences and behavioral sciences are also arguably math- and science-based, and should be considered in a broad definition of what constitutes the STEM fields. Although high-status fields are important to investigate due to the lack of women and minorities entering and suc-ceeding in those majors, the scientific merit, contributions, and participation of women and minorities in other scientific fields should not be diminished or disregarded.
In addition, using a broad definition of STEM allows for an alternative perspective on differential participation rates. While women remain underrepresented in the high-profile STEM fields such as computer science and some engineering disciplines, the use of a broad-er STEM definition shows their increased participation rates in fields such as the biological sciences and psychology. Taken together, the participation gap between men and women in the STEM fields does not disappear but significantly narrows. For example, a recent study of undergraduate students at a single institution found that only 11% of women initially enrolled in a high-status STEM field, but using a broader definition of STEM, their participa-tion increased to 38% (George-Jackson et al., 2008). Therefore, a broad definition of STEM is used in this study.
In order to disaggregate the STEM fields rather than treat them or the students in them as homogenous, a four-category taxonomy was created using the Classification of Instructional Programs (CIP) codes.3 In most categories, the four-digit CIP code was used. However, in categories containing a variety of programs, the six-digit category was used (e.g., multidis-ciplinary studies). In many of the non-science and engineering categories, the two-digit CIP code was sufficient to categorize the majors. These categories are largely based on those used by the National Science Foundation’s (2008) Science and Engineering Indicators, with some modifications. Specifically, under the taxonomy presented here, individual disciplines are grouped together, while the social sciences such as economics, sociology, and political science are not classified as STEM majors. NSF classifies all education majors as non–sci-
2 Parents’ educational attainment levels were not available for one of the five universities included in the study.
3 The detailed taxonomy is available upon request.

Journal of Women and Minorities in Science and Engineering
George-Jackson154
ence and engineering. However, in the revised taxonomy, math- and science-based education majors are included in the respective STEM category, with the assumption that individuals who earn degrees in STEM education gain and must demonstrate math and science skills and knowledge. The inclusion criteria for the taxonomy of majors was influenced by the prob-ability that a student in these STEM majors would have the opportunity to continue on in the STEM pipeline—either through graduate programs or occupations—based on earning their undergraduate major. The major categories are:
1. Physical science, computer science, math, and engineering (PSCSME) (e.g., chemis-try, physics, astronomy, and earthy sciences);
2. Agricultural and biological sciences (ABS) (e.g., plant sciences, biochemistry, zool-ogy and neurosciences);
3. Health sciences and psychology (HSP) (e.g., health professions, clinical psychology, and psychometrics); and
4. Non-STEM fields (e.g., History, foreign languages, business, visual and performing arts).
Students were classified according to the CIP code of their majors. Science- and math-related education majors were included in the appropriate STEM category. Students who had not yet declared a specific major were classified as non-STEM.4 For the sake of brevity, the four categories are referred to by the abbreviations listed above.
5.2 Institutional Profiles
The five institutions in this dataset are public land-grant universities. The description of these universities provided here offers an understanding of the context in which the students in the study were attending college but conceals the identities of each university in order to maintain confidentiality. Data from the Integrated Postsecondary Education Data System (IPEDS, 1999) was used to create an institutional profile of these five universities, including the institutional characteristics, average tuition charges, and financial information.
Three universities are located in the Great Lakes region, one in the Plains region, and one in New England. Two universities are located in a large city, two universities are located in a mid-sized city, and one university is located on the urban fringe of a large city. All five institutions award doctoral degrees and are classified as public, four-year, land-grant univer-sities. In 1999–2000, the average annual tuition at the five universities is $4,485 for in-state residents and $12,773 for out-of-state residents. The universities are predominately white institutions (PWIs), with the average minority population across the campuses comprised of 5.2% African Americans, 0.4% American Indian/Alaskan Natives, 6.4% Asian Pacific Is-landers, and 2.8% Hispanics. Two of the five universities have an affiliated hospital and four universities award medical degrees. In the 1999–2000 academic year, the campuses each served an average of 28,267 full-time undergraduate students and 4609 part-time undergrad-uate students. The average full-time-equivalent (FTE) number of undergraduates enrolled at each of the five universities in 1999–2000 was 29,788.
In terms of the financial status of the five universities in this study, the average revenue funds for the academic year of 1999–2000 was $1.3 billion, with approximately 25% of
4 Undeclared students within a specific field (e.g., engineering undeclared) were classified into the appropriate category. Students who were undeclared without reference to a specific field were classified as non-STEM.

Volume 17, Issue 2, 2011
STEM Switching 155
revenues originating from state appropriations, 20% from tuition and fees, and 14% from federal appropriations. Total expenditures and transactions for 1999–2000 were also $1.3 billion, with the largest expenditures related to instruction (26%) and research (20%). Of the average $69 million in scholarships and revenues across the five universities, 35% were institutional awards, 25% were state awards, 17% were from private sources, and 16% were Pell Grants.
In relation to the nation’s public, four-year universities, the five institutions in this study enrolled 4.2% of all men and 3.15% of all women attending these types of universities in 1999–2000. Overall, 3.6% of all students attending public, four-year universities were enrolled in these five institutions in 1999–2000 (IPEDS, 1999). All five universities were ranked in the top 50 public national universities by U.S. News and World Report in 1999 (U.S. News and World Report, 1999).
In 1999–2000, the five universities granted approximately 4% of all bachelor’s degrees awarded by the nation’s public four-year universities. Examining the number of degrees awarded by major field category, these five universities granted nearly 7% of PSCSME degrees, 5.5% of ABS degrees, and 3.4% of HSP degrees. Given that there are six hundred forty-seven public four-year institutions in the country,5 the five universities appear to be meaningful producers of undergraduate STEM degrees.
6. FINDINGS
Of the first-time, full-time domestic undergraduate students featured in this study, 49.2% were female, 5.9% were Asian, 4.1% were African American, 2.4% were Hispanic, and 86% were white (see Table 1). As such, the 1999 cohort, reflective of the campuses that they at-tended, was predominantly white. In addition, 65.7% of students were in-state residents of their perspective universities.
In terms of students’ academic qualifications as measured by standardized test scores, the average math SAT score for these students was 603.45 (standard deviation 91.578), the average verbal SAT score was 579.78 (standard deviation 82.025), and the average total SAT score was 1181.15 (standard deviation 154.629).6 Given that departments and colleges likely differed in terms of admissions requirements, it is not surprising that students who initially declared a major in PSCSME fields had higher math, verbal, and total SAT scores as com-pared to students who initially entered in other majors. Nearly half of the students graduated within four years (47%), and the average cumulative GPA of all graduating students was 3.2 on a 4.0 scale (standard deviation 0.44079).
Approximately 72% of the 1999 entering class applied for financial aid through FAFSA for their first year of college (1999–2000). For these students, additional information about their so-cial backgrounds is known. For students who filed a FAFSA and reported their parent’s highest level of education in 1999–2000, 64.4% of fathers had a college education or higher and 59.7% of mothers had a college education or higher.7 Parents’ and students’ marital status were also
5 This number includes the five universities in this study. 6 ACT scores were converted to SAT scores. If a student took both entrance exams, the higher of the two scores was used.
7 These figures are of students who filed FAFSAs from Institution A, Institution B, Institution C, and Institution D. As a reminder, parent’s educational attainment was not reported for students who attended Institution E.

Journal of Women and Minorities in Science and Engineering
George-Jackson156
reported by the majority of FAFSA filers. Of the 70% of those reporting their parent’s marital status, 84.5% of parents were married or remarried and 12.2% were divorced or separated. A similar percentage of FAFSA filers reported their own marital status, with 99.8% reporting that they were single. In addition, 12.5% of all students received a Pell Grant and 7.2% received an SEOG award in 1999–2000, signifying low-income status. The average Pell Grant amount awarded in 1999–2000 was $1,933.
6.1 Declaring the Initial Major
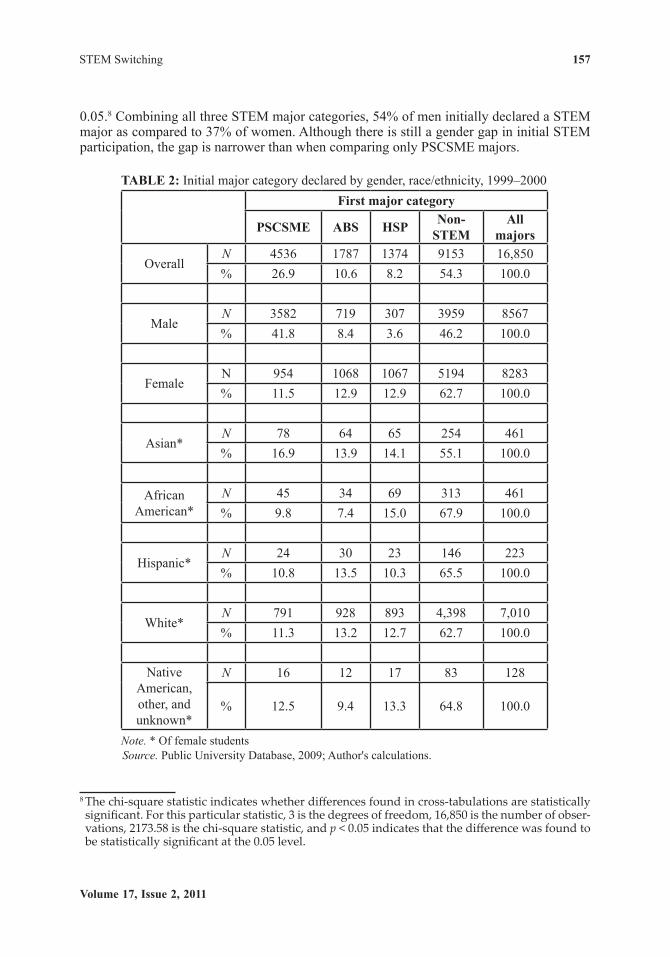
As expected, men initially declared a major in PSCSME at higher rates than women (42% versus 11.5%) (see Table 2). However, a higher percentage of women initially entered ABS and HSP majors as compared to men. In examining the gender composition of ABS, the field was comprised of 60% women and 40% men. The gender gap—in favor of women—was even greater in the HSP (78% women and 22% men). Additionally, 13% of all women in the study entered ABS and another 13% entered HSP majors. A much smaller percentage of men entered these fields (8% entered ABS and 4% entered HSP). Differences in the initial major choice selection by gender was statistically significant, x2 (3, N = 16,850) = 2173.58, p <
Disaggregating the female students in the dataset by racial and ethnic groups allows for the examination of differences that exist between women. This additional level of analysis seeks to bring important differences to light, rather than assume that women’s patterns of behavior and experiences with regard to college majors are homogenous. The Pearson Chi-Square test showed that the differences in initial major choice by women of different racial and ethnic groups was statistically significant, x2 (12, N = 8283) = 36.59, p < 0.05.
Table 1: Demographic and background infor-mation, 1999Variables N %
GenderMale 8567 50.8Female 8283 49.2Total 16,850 100.0
Race and ethnicityAsian 1000 5.9African American 694 4.1Hispanic 410 2.4Native American, Other, and unknown 259 1.5
White 14,487 86.0Residency status
Out-of-state 5786 34.3In-state 11,064 65.7
Source. Public University Database, 2009; Author's calculations.
Volume 17, Issue 2, 2011
STEM Switching 157
0.05.1 Combining all three STEM major categories, 54% of men initially declared a STEM major as compared to 37% of women. Although there is still a gender gap in initial STEM participation, the gap is narrower than when comparing only PSCSME majors.
8 The chi-square statistic indicates whether differences found in cross-tabulations are statistically significant. For this particular statistic, 3 is the degrees of freedom, 16,850 is the number of obser-vations, 2173.58 is the chi-square statistic, and p < 0.05 indicates that the difference was found to be statistically significant at the 0.05 level.
0.05.8 Combining all three STEM major categories, 54% of men initially declared a STEM major as compared to 37% of women. Although there is still a gender gap in initial STEM participation, the gap is narrower than when comparing only PSCSME majors.
Table 2: Initial major category declared by gender, race/ethnicity, 1999–2000First major category
PSCSMe abS HSP Non-STeM
all majors
OverallN 4536 1787 1374 9153 16,850% 26.9 10.6 8.2 54.3 100.0
MaleN 3582 719 307 3959 8567% 41.8 8.4 3.6 46.2 100.0
FemaleN 954 1068 1067 5194 8283% 11.5 12.9 12.9 62.7 100.0
Asian*N 78 64 65 254 461% 16.9 13.9 14.1 55.1 100.0
African American*
N 45 34 69 313 461% 9.8 7.4 15.0 67.9 100.0
Hispanic*N 24 30 23 146 223% 10.8 13.5 10.3 65.5 100.0
White*N 791 928 893 4,398 7,010% 11.3 13.2 12.7 62.7 100.0
Native American, other, and unknown*
N 16 12 17 83 128
% 12.5 9.4 13.3 64.8 100.0
Note. * Of female studentsSource. Public University Database, 2009; Author's calculations.

Journal of Women and Minorities in Science and Engineering
George-Jackson158
A higher percentage of Asian women initially entered PSCSME (16.9%), as compared to white women (11.3%), Hispanic women (10.8%), and African American women (9.8%). As such, there was a slight difference in the rates that women of different racial and ethnic backgrounds declared majors in the high-status, high-profile STEM fields. Asian women, Hispanic women, and white women entered ABS majors at approximately the same rate (13.9%, 13.5%, and 13.2%, respectively). Fewer African American women initially majored in ABS (7.4%). Although the percentage of Asian women who declared this type of major was less than in PSCSME, the percentage of Hispanic and white women entering ABS ma-jors increased in comparison to PSCSME. The percentage of African American women who entered HSP was twice that of those who initially declared a major in ABS (15% versus 7.4%). Asian women entered HSP at approximately the same level of participation as in ABS (14%), while white and Hispanic women’s participation in HSP decreased slightly as compared to ABS (12.7% and 10.3%, respectively). The majority of women across all five campuses initially entered a non-STEM major (55% of Asian women, 67.9% of African American women, 65.5% of Hispanic women, and 62.7% of white women).
6.2 Major Field Persistence
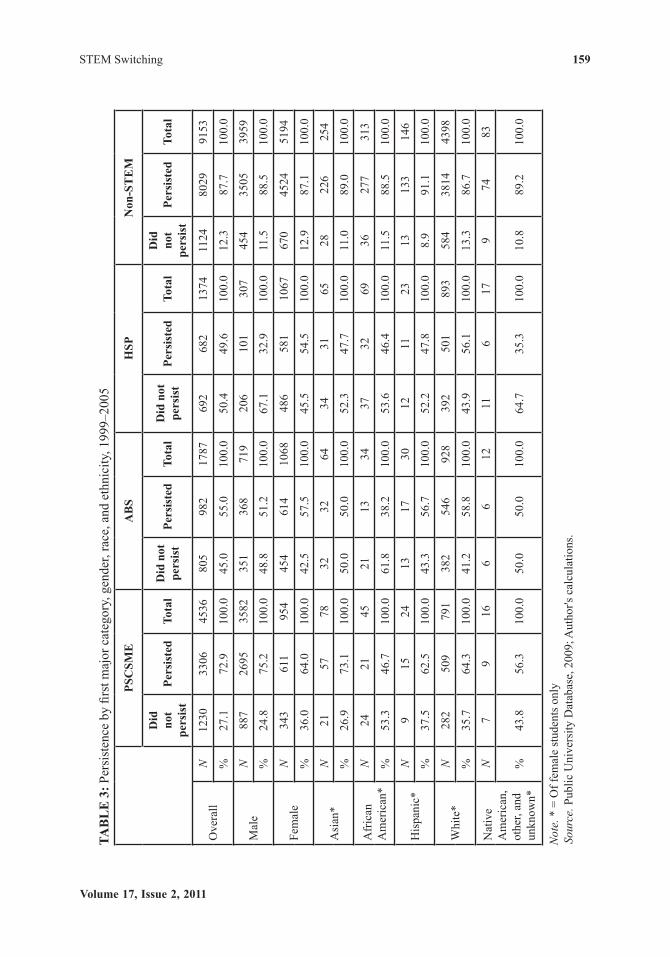
Using students’ first and last major field category, analysis was conducted on major field persistence. Overall, the majority of students persisted in their initial major category (77%). Although a greater percentage of men persisted in PSCSME as compared to women, the majority of women persisted in PSCSME (75% versus 64%) (see Table 3). A greater per-centage of women persisted in ABS and HSP majors as compared to men. A slightly higher percentage of women persisted in ABS as compared to men (57.5% versus 51.2%). A much larger percentage of women who began in HSP persisted in their original major as compared to men, with 54.5% of women and 32.9% of men persisting and obtaining degrees in HSP. Differences in persistence by gender and initial major were found to be statistically signifi-cant across each major field category: PSCSME x2 (1, N = 4536) = 47.74, p < 0.05; ABS x2 (1, N = 1787) = 6.91, p < 0.05; HSP x2 (1, N = 1374) = 44.3, p < 0.05; and non-STEM x2 (1, N = 9153) = 4.28, p < 0.05.
Of women, Asian women persisted at higher rates in PSCSME, while black women had the lowest levels of persistence in both PSCSME and ABS majors. Hispanic women persisted at the same rate as white women in PSCSME and ABS, and at higher rates than Asian and black women in ABS. Chi-square tests revealed that the differences in persistence between racial and ethnic groups of women were not statistically significant.
6.3 Switching Major Fields
Next, the majors that students switched to upon leaving their initial major were examined, with specific attention given to the outcomes of women in comparison to their male counter-parts, as well as the outcomes of women of different racial and ethnic groups. The timing of when the movements occurred was also examined.
Although a larger percentage of men entered into and completed degrees in PSCSME than women, women entered and persisted at greater rates than men in ABS and particularly in HSP (see Table 4). In addition, of students who switched from PSCSME, ABS, and non-STEM majors, a greater percentage of women entered HSP as compared to men. Given the patterns of women’s movement into ABS and HSP from PSCSME, women do not necessarily abandon science if they switch from high-status STEM majors. A greater percentage of men initially
Volume 17, Issue 2, 2011
STEM Switching 159
Tab
le
3: P
ersi
sten
ce b
y fir
st m
ajor
cat
egor
y, g
ende
r, ra
ce, a
nd e
thni
city
, 199
9–20
05
PSC
SMe
ab
SH
SPN
on-S
Te
M
Did
no
t pe
rsis
tPe
rsis
ted
Tota
lD
id n
ot
pers
ist
Pers
iste
dTo
tal
Did
not
pe
rsis
tPe
rsis
ted
Tota
lD
id
not
pers
ist
Pers
iste
dTo
tal
Ove
rall
N12
3033
0645
3680
598
217
8769
268
213
7411
2480
2991
53
%27
.172
.910
0.0
45.0
55.0
100.
050
.449
.610
0.0
12.3
87.7
100.
0
Mal
eN
887
2695
3582
351
368
719
206
101
307
454
3505
3959
%24
.875
.210
0.0
48.8
51.2
100.
067
.132
.910
0.0
11.5
88.5
100.
0
Fem
ale
N34
361
195
445
461
410
6848
658
110
6767
045
2451
94
%36
.064
.010
0.0
42.5
57.5
100.
045
.554
.510
0.0
12.9
87.1
100.
0
Asi
an*
N21
5778
3232
6434
3165
2822
625
4
%26
.973
.110
0.0
50.0
50.0
100.
052
.347
.710
0.0
11.0
89.0
100.
0
Afr
ican
A
mer
ican
*N
2421
4521
1334
3732
6936
277
313
%53
.346
.710
0.0
61.8
38.2
100.
053
.646
.410
0.0
11.5
88.5
100.
0
His
pani
c*N
915
2413
1730
1211
2313
133
146
%37
.562
.510
0.0
43.3
56.7
100.
052
.247
.810
0.0
8.9
91.1
100.
0
Whi
te*
N28
250
979
138
254
692
839
250
189
358
438
1443
98
%35
.764
.310
0.0
41.2
58.8
100.
043
.956
.110
0.0
13.3
86.7
100.
0
Nat
ive
Am
eric
an,
othe
r, an
d un
know
n*
N7
916
66
1211
617
974
83
%43
.856
.310
0.0
50.0
50.0
100.
064
.735
.310
0.0
10.8
89.2
100.
0
Not
e. *
= O
f fem
ale
stud
ents
onl
ySo
urce
. Pub
lic U
nive
rsity
Dat
abas
e, 2
009;
Aut
hor's
cal
cula
tions
.

Journal of Women and Minorities in Science and Engineering
George-Jackson160
entered other science majors but completed their degrees in PSCSME, signaling a possible alternative pathway to completing a PSCSME degree. Examining students who began in any STEM major and completed a degree in a non-STEM major reveals that 28.9% of women and 24.2% of men fully departed STEM. In essence, what may be perceived as a “loss” to the STEM fields in terms of student departures does not differ greatly between men and women. Chi-square tests were used to determine if the differences between men and women switching major, by students’ first major, were statistically significant. The results revealed that within each first major category, differences between the genders were statistically significant: PSC-SME x2 (3, N = 4536) = 87.808, p < 0.05; ABS x2 (3, N = 1787) = 49.715, p < 0.05; HSP x2 (3, N = 1374) = 82.093, p < 0.05; and non-STEM x2 (1, N = 9153) = 193.004, p < 0.05.
Table 4: First and last reported major for women and men, 1999–2005
last major category
PSCSMe abS HSP Non-STeM all majors
First major category N % N % N % N % N %
Women
PSCSME 611 64.0 59 6.2 50 5.2 234 24.5 954 100.0ABS 56 5.2 614 57.5 144 13.5 254 23.8 1068 100.0HSP 11 1.0 69 6.5 581 54.5 406 38.1 1067 100.0
Non-STEM 69 1.3 157 3.0 444 8.5 4524 87.1 5194 100.0
All majors 747 9.0 899 10.9 1219 14.7 5418 65.4 8283 100.0Men
PSCSME 2695 75.2 85 2.4 65 1.8 737 20.6 3582 100.0ABS 66 9.2 368 51.2 44 6.1 241 33.5 719 100.0HSP 22 7.2 45 14.7 101 32.9 139 45.3 307 100.0
Non-STEM 189 4.8 133 3.4 132 3.3 3505 88.5 3959 100.0
All majors 2972 34.7 631 7.4 342 4.0 4622 54.0 8567 100.0
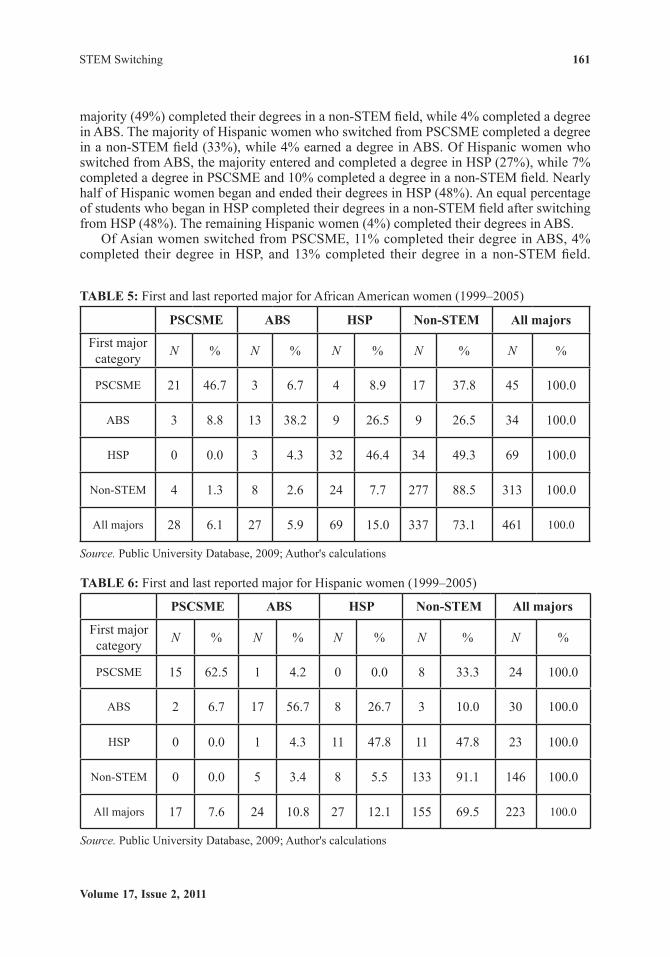
Tables 5–8 summarize women’s first and last major by race and ethnicity. A greater per-centage of black and Hispanic women switched from ABS to HSP as compared to Asian and white women. Of African American women who began in PSCSME, 47% completed degrees in the same field. Of those who switched majors, 38% completed a degree in non-STEM fields, 7% completed a degree in ABS, and 9% completed a degree in HSP. Of African American women who began their undergraduate studies in ABS, 38% completed a degree in their original major field category. Nine percent of African American women who switched from ABS completed a degree in PSCSME, 27% completed a degree in HSP, and 27% com-pleted a degree in non-STEM. Of African American women who switched from HSP, the
Volume 17, Issue 2, 2011
STEM Switching 161
majority (49%) completed their degrees in a non-STEM field, while 4% completed a degree in ABS. The majority of Hispanic women who switched from PSCSME completed a degree in a non-STEM field (33%), while 4% earned a degree in ABS. Of Hispanic women who switched from ABS, the majority entered and completed a degree in HSP (27%), while 7% completed a degree in PSCSME and 10% completed a degree in a non-STEM field. Nearly half of Hispanic women began and ended their degrees in HSP (48%). An equal percentage of students who began in HSP completed their degrees in a non-STEM field after switching from HSP (48%). The remaining Hispanic women (4%) completed their degrees in ABS.
Of Asian women switched from PSCSME, 11% completed their degree in ABS, 4% completed their degree in HSP, and 13% completed their degree in a non-STEM field.
Table 5: First and last reported major for African American women (1999–2005)
PSCSMe abS HSP Non-STeM all majors
First major category N % N % N % N % N %
PSCSME 21 46.7 3 6.7 4 8.9 17 37.8 45 100.0
ABS 3 8.8 13 38.2 9 26.5 9 26.5 34 100.0
HSP 0 0.0 3 4.3 32 46.4 34 49.3 69 100.0
Non-STEM 4 1.3 8 2.6 24 7.7 277 88.5 313 100.0
All majors 28 6.1 27 5.9 69 15.0 337 73.1 461 100.0
Source. Public University Database, 2009; Author's calculations
Table 6: First and last reported major for Hispanic women (1999–2005)
PSCSMe abS HSP Non-STeM all majors
First major category N % N % N % N % N %
PSCSME 15 62.5 1 4.2 0 0.0 8 33.3 24 100.0
ABS 2 6.7 17 56.7 8 26.7 3 10.0 30 100.0
HSP 0 0.0 1 4.3 11 47.8 11 47.8 23 100.0
Non-STEM 0 0.0 5 3.4 8 5.5 133 91.1 146 100.0
All majors 17 7.6 24 10.8 27 12.1 155 69.5 223 100.0
Source. Public University Database, 2009; Author's calculations

Journal of Women and Minorities in Science and Engineering
George-Jackson162
Thirty percent of Asian women began their studies in ABS but completed a degree in a non-STEM field. In addition, 5% of Asian women who began in ABS completed a de-gree in PSCSME, while 16% completed a degree in HSP. The majority of Asian women who began in HSP completed a degree in HSP (48%), while 5% completed a degree in PSCSME, 11% completed a degree in ABS, and 37% completed a degree in a non-STEM field. Sixty-four percent of white women who entered PSCSME earned a degree in these types of fields, 25% switched from PSCSME to non-STEM fields, 6% switched to ABS, and 5% switched to HSP. Of white women who initially majored in ABS, 59% completed their degrees in this field. Of those who switched from ABS, 24% completed a degree in non-STEM, 5% completed a degree in PSCSME, and 12% completed a degree in HSP.
Table 7: First and last reported major for Asian women (1999–2005)
PSCSMe abS HSP Non-STeM all majors
First major category N % N % N % N % N %
PSCSME 57 73.1 8 10.3 3 3.8 10 12.8 78 100.0
ABS 3 4.7 32 50.0 10 15.6 19 29.7 64 100.0
HSP 3 4.6 7 10.8 31 47.7 24 36.9 65 100.0
Non-STEM 6 2.4 7 2.8 15 5.9 226 89.0 254 100.0
All majors 69 15.0 54 11.7 59 12.8 279 60.5 461 100.0
Source. Public University Database, 2009; Author's calculations
Table 8: First and last reported major for white women (1999–2005)
PSCSMe abS HSP Non-STeM all majors
First major category N % N % N % N % N %
PSCSME 509 64.3 47 5.9 41 5.2 194 24.5 791 100.0
ABS 48 5.2 546 58.8 115 12.4 219 23.6 928 100.0
HSP 8 0.9 56 6.3 501 56.1 328 36.7 893 100.0
Non-STEM 56 1.3 137 3.1 391 8.9 3814 86.7 4398 100.0
All majors 621 8.9 786 11.2 1048 15.0 4555 65.0 7010 100.0
Source. Public University Database, 2009; Author's calculations
Volume 17, Issue 2, 2011
STEM Switching 163
Of white women who initially majored in HSP, 56% persisted within the field, 37% com-pleted a degree in non-STEM majors, 6% completed a degree in ABS, and 1% completed a degree in non-STEM fields.
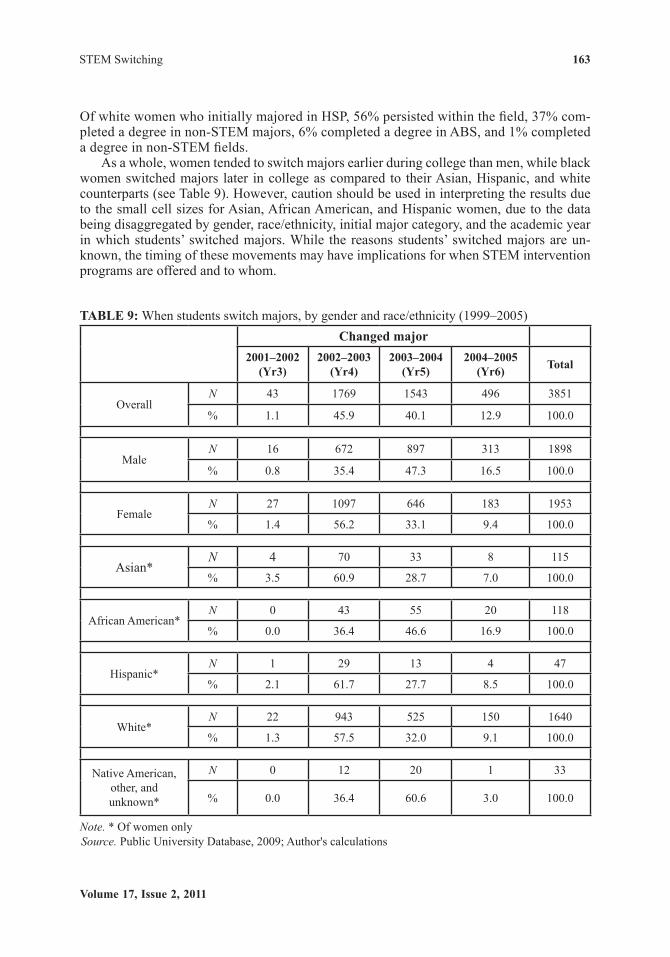
As a whole, women tended to switch majors earlier during college than men, while black women switched majors later in college as compared to their Asian, Hispanic, and white counterparts (see Table 9). However, caution should be used in interpreting the results due to the small cell sizes for Asian, African American, and Hispanic women, due to the data being disaggregated by gender, race/ethnicity, initial major category, and the academic year in which students’ switched majors. While the reasons students’ switched majors are un-known, the timing of these movements may have implications for when STEM intervention programs are offered and to whom.
Table 9: When students switch majors, by gender and race/ethnicity (1999–2005)
Changed major2001–2002
(Yr3)2002–2003
(Yr4)2003–2004
(Yr5)2004–2005
(Yr6) Total
OverallN 43 1769 1543 496 3851
% 1.1 45.9 40.1 12.9 100.0
MaleN 16 672 897 313 1898
% 0.8 35.4 47.3 16.5 100.0
FemaleN 27 1097 646 183 1953
% 1.4 56.2 33.1 9.4 100.0
Asian*N 4 70 33 8 115
% 3.5 60.9 28.7 7.0 100.0
African American*N 0 43 55 20 118
% 0.0 36.4 46.6 16.9 100.0
Hispanic*N 1 29 13 4 47
% 2.1 61.7 27.7 8.5 100.0
White*N 22 943 525 150 1640
% 1.3 57.5 32.0 9.1 100.0
Native American, other, and unknown*
N 0 12 20 1 33
% 0.0 36.4 60.6 3.0 100.0
Note. * Of women onlySource. Public University Database, 2009; Author's calculations

Journal of Women and Minorities in Science and Engineering
George-Jackson164
6.4 Time-to-Degree for Students Who Switched Majors
Table 10 compares the time-to-degree for men and women who switched majors, orga-nized by their initial major. A higher percentage of women, despite switching majors, graduated within four years of study as compared to men (59% versus 37% in PSCSME, 64% versus 48% in ABS, 48% versus 39% in HSP, and 60% versus 40% in the non-STEM fields, respectively). The differences between men and women’s time-to-degree within each major field category were found to be statistically significant, PSCSME x2(4, N = 1230) = 67.61, p < 0.05; ABS x2 (4, N = 805) = 22.73, p < 0.05; HSP x2 (54 N = 692) = 11.91, p < 0.05; and non-STEM x2 (4, N = 1124) = 72.57, p < 0.05.
Differences in time-to-degree for students who switched majors were then com-pared for women of different racial and ethnic backgrounds. Of women who began college majoring in PSCSME, a higher percentage of Asian women graduated within four years as compared to women of other racial and ethnic backgrounds. Of students who switched from initially majoring in ABS, a higher percentage of Hispanic women graduated within four years as compared to women of other racial and ethnic groups. A greater portion of Hispanic women and white women who began their college careers in HSP graduated within four years, as compared to their Asian and African American counterparts.
Table 10: Time-to-degree for students who switched majors, by initial major and gender (1999–2005)
4 years 5 years 6 years N % N % N %
PSCSME
Male 327 36.9 751 84.7 887 100.0
Female 203 59.2 322 93.9 343 100.0
Total 530 43.1 1073 87.2 1230 100.0
ABS
Male 167 47.6 317 90.3 351 100.0
Female 289 63.7 429 94.5 454 100.0
Total 456 56.6 746 92.7 805 100.0
HSP
Male 81 39.3 176 85.4 206 100.0
Female 235 48.4 443 91.2 486 100.0
Total 316 45.7 619 89.5 692 100.0
Non-STEM
Male 182 40.1 390 85.9 454 100.0
Female 405 60.4 626 93.4 670 100.0
Total 587 52.2 1016 90.4 1124 100.0
Source. Public University Database, 2009; Author's calculations

Volume 17, Issue 2, 2011
STEM Switching 165
7. DISCUSSION AND IMPLICATIONS OF THE FINDINGS
7.1 Declaring the Initial Major
The patterns by which students initially declared their college major stresses the importance of specifically defining what disciplines are included in the STEM fields. The results also provide empirical evidence of higher than expected rates of women’s participation in the STEM fields. If only the high-status, high-profile fields—in this study categorized as the PSCSME fields—are considered as STEM fields, the participation gap between men and women in the dataset was approximately 30 percentage points (41.8% of men versus 11.5% of women). However, if other science-based fields—classified here as the ABS and HSP fields—are combined to create a broader and more nuanced definition of the STEM fields, the gender gap in STEM participation is reduced to 16.5 percentage points (53.8% of men versus 37.3% of women). By adding ABS and HSP to the definition of STEM, men gained an additional 12 percentage points in terms of participation (41.8% to 53.8%), compared to the 25.8 percentage points that women gained (11.5% to 37.3%). In other words, expanding the definition of STEM results in an increase in women’s representation in STEM fields and reduces the gender gap in STEM participation.
The tendency to use a constricted definition of STEM, which typically focuses on the high-status, high-profile STEM fields, has resulted in a body of research that emphasizes women’s and minorities’ underrepresentation. Disciplines such as computer science and en-gineering that are characterized as being high-tech, high-profile, and high-status fields can also be characterized as being dominated by men. By focusing on these types of majors and the disciplines which appear to be most valued by society, education researchers have largely neglected the fields women are participating in and at a high success rate. Excluding the types of science majors that women are concentrated in, such as the health sciences, not only distorts measurements of STEM participation, but also overlooks women’s scientific abilities and contributions. In addition, the definition of STEM or science fields may vary from country to country. The Higher Education Statistics Agency (HESA) (2010) examines degrees awarded in the sciences in the United Kingdom, including fields such as medicine, biological sciences, veterinary sciences, agricultural sciences, physical sciences, mathemat-ics, computer science, engineering, technology, and even architecture. If future studies adopt a similar classification scheme used as the one by HESA, the findings of the research will likely differ than if a different taxonomy is used, leading to differences in understandings of students’ participation and success in STEM.
The patterns of investigation found in the current literature, undermined by a method-ological weakness of poorly or undefined STEM fields, have resulted in a narrative that perpetuates notions of women’s and minorities’ underrepresentation in the sciences. This raises the question of whether research on the topic of STEM participation has thus far been gender biased in the fields that have been focused on, rather than recognizing the diverse set of science-based disciplines that “historically underrepresented” students are more likely to participate in.
The findings challenge notions of women’s lower levels of participation in the STEM fields, particularly given the high rates of participation women have in fields such as HSP, as evidenced in this study. By using a broad definition of STEM, this study provides evidence of women’s participation and representation in the STEM fields, which disputes commonly accepted notions that too few women persist in science majors. This finding has important implications in terms of changing and reframing the underlying message that women “don’t

Journal of Women and Minorities in Science and Engineering
George-Jackson166
do science,” arguing for researchers to reconsider what fields should be included in the defi-nition of STEM. Perhaps most importantly, the conversation about who does and does not “do science” changes as other science-based fields are included or excluded in the discus-sion.
Broadening the definition of the STEM fields also allows for a closer, more nuanced examination of students’ participation in these fields. Although Asian women have the high-est levels of participation in the high-status, high-profile STEM fields, the narrative changes when other STEM fields are included. Expanding the types of fields included in the defini-tion of STEM increased overall participation rates of women across all race and ethnicity categories who initially entered these fields but did not change the differences in participa-tion between racial and ethnic groups.
7.2 Major Field Persistence
Overall, the majority of women persisted in each of the STEM categories and a higher percentage of women than men persisted in ABS and HSP. This finding indicates that when considering a broad definition of STEM, most women do remain in and complete degrees in the STEM fields. Issues of access and recruitment to the STEM fields at matriculation to college may explain lower levels of participation in select STEM fields, such as engineer-ing. Specifically investigating how more women can be encouraged to initially pursue these fields continues to be an important area of research.
Women out-persisted men by a large margin in HSP. One possible explanation is that men use initial majors in HSP as avenues to other majors that they were not academically qualified to be directly admitted to, such as engineering and computer science. Another possibility of the men’s lower rates of persistence in HSP is due to changes of interest, mo-tivations, or other factors that are unavailable in this dataset. An unexpected topic for future research is to investigate whether intervention programs could be used to increase the reten-tion of men in HSP.
The descriptive results indicate that overall, African American and Hispanic women per-sist at similar levels as Asian and white women when a broad definition of STEM is used. This reinforces the call for explicitly defining what fields are included in studies on STEM participation, as including multiple types of science-based fields changes the narrative of non-Asian minority women’s participation and success in the sciences.
7.3 Switching Major Fields
The ability to track students’ movements between majors, and demonstrating the extent to which they remain in STEM fields, offers a counternarrative to the notion that students, particularly women, who leave high-status, high-profile STEM fields depart science all to-gether. This area of investigation also fills a deficit in the literature of determining where stu-dents go when they leave a STEM major (Frehill, 1997). In this cohort of students, women were particularly resilient in terms of staying within science. Of students who left PSCSME, a higher percentage of women entered other science-based disciplines as compared to men. In addition, a higher percentage of women began college in ABS and completed a degree in HSP, offering additional evidence of women changing majors but remaining within the STEM fields.
Differences were found between racial and ethnic groups of women in terms of the ma-jors they switched to upon leaving their initial major. These decisions may represent chang-

Volume 17, Issue 2, 2011
STEM Switching 167
ing interests, motivations, and career orientations or their desire to serve others (Bowen et al., 2005). While the underlying causes of these changes are unknown, the finding has two important implications. The first implication is that aggregating data on women’s behaviors and decisions related to their college major would have concealed important differences between racial and ethnic groups of women. Had the majors of all women who switched been simply compared to those of men, a slightly different and incomplete understanding of women’s movements between college majors would have resulted.
The second implication is that simply knowing that students leave certain majors is a truncated view of students’ behaviors in relation to college major choices. By following stu-dents who leave one STEM major as they enter a new (STEM or non-STEM) major, more information is known about whether or not students fully abandon the sciences. Investigat-ing students’ movements between different types of science-based fields, as well as in com-parison to non-STEM fields, allows for determining the extent to which students may retain an interest in science. Comparing multiple types of majors within a broad definition of the STEM fields and mapping out students’ movements between majors challenges notions that leaving PSCSME is a loss to science, or that such a transition indicates a student is leaving the STEM pipeline. Contrary to expectations based on notions of women’s underrepresenta-tion in the STEM fields, the results here demonstrate that many women do remain in other types of science-based majors upon switching from high-status, high-profile majors such as engineering.
7.4 Time-to-Degree for Students Who Switched Majors
Analysis on students’ time-to-degree finds that regardless of whether or not students per-sisted in their original major, and regardless of the major field category in which students obtained their degrees, a higher percentage of women completed their degrees faster than did men. This outcome may be due in part to the fact that the women in the study had higher grade point averages than men, regardless of whether or not they persisted in their original major. In addition, women in the study may have attended more classes and/or completed more homework assignments, which may accelerate their time-to-degree as compared to men (Sax, 2008). The consequences of delayed entry into students’ final major may have some cost- and time-related consequences, but these do not appear to be burdensome for the students included in the dataset. Students who obtain their degrees in less time can enter graduate school or enter the workforce earlier than students who take longer to complete their degrees. These students also have lower financial and opportunity costs. In this case, a higher percentage of women had the advantage of graduating from college earlier than men, allowing them to enter graduate school or begin their careers earlier than men. If students enter the workforce immediately after college, a larger percentage of women than men can begin their careers and will begin earning salaries. This one- to two-year advantage may have further implications in terms of financial choices and stability, such as purchasing a car, purchasing a home, or paying down debt such as student loans.
While these results are encouraging in light of women’s success, particularly in science-based fields, the importance of examining time-to-degree beyond the traditional four years is also apparent in the findings. For example, of African American women who persisted in PSCSME, only 34% graduated within four years, yet 87% graduated within five years. Across each category of majors, African American women took longer to complete their degrees, which may be reflective of the types of high schools they attended and fewer edu-cational opportunities prior to college.

Journal of Women and Minorities in Science and Engineering
George-Jackson168
Hispanic and African American women who persisted in math and science took longer to complete their degrees, except for Hispanic women who persisted in HSP. In these fields, Hispanic women completed their degrees as fast as white women, and faster than Asian and African American women. This finding reiterates the importance of explicitly defining the STEM fields being used in research on students’ participation in the STEM fields, as well as the importance of disaggregating outcomes of women by racial and ethnic groups.
8. LIMITATIONS
This study has a number of limitations related to the use of secondary data, and not having access to additional student information that may help answer the specific set of questions featured in this study. Regarding students’ background, data on parental factors, such as marital status or income levels, were only available for students who filed a FAFSA. Even for these students, the data on parental information was limited and did not contain impor-tant information such as mother’s and father’s work status or occupation—factors that have been shown to influence decisions to major in STEM (Leslie et al., 1998; Fleming et al., 2005). Other precollege and college information may have been useful to the study, includ-ing students’ attitudes and interests toward science (Elliott et al., 1996; Turner and Bowen, 1999), high school transcripts, and participation in STEM intervention programs. In addi-tion, knowing students’ intended major may shed light on the extent to which students are using initial majors temporarily until they are able to enter their intended major.
The results have limited generalizability, and selection bias is present in the study. Only the first and last major of students who completed their degrees were examined, and move-ments within each of the four categories were not analyzed. Students who dropped out, stopped out, transferred out, or simply did not complete their degree in six academic years at the first institution they enrolled at were not examined in this study. Disaggregating move-ments within each major category, examining students who switched majors multiple times, comparing racial and ethnic groups of men, and expanding the inclusion criteria are all op-portunities for future research.
Finally, the long-term effects of students initial major and major field persistence is unknown, given that students’ graduate or professional degree enrollments and workforce participation are not included in the dataset. While students may appear successful in the sciences at the undergraduate level, it is not known if they continued in the STEM pipeline after completing a bachelor’s degree.
9. CONCLUSION
This study contributes to the field of higher education by investigating the persistence of under-graduate women in the STEM fields at public land-grant universities. By using a broad defini-tion of STEM and examining patterns of persisting in and switching between majors among undergraduates who completed bachelor’s degrees within six years, the study offers empirical evidence of women’s participation and success in the sciences at five public land-grant univer-sities. The study also begins to fill a void in the existing literature on choice of college major by investigating students’ initial declaration of majors, persistence in those majors, and the fields that students switched to if they changed majors. In addition to reframing the collective under-standing of students’ “departures” from certain fields, the study has two main contributions.

Volume 17, Issue 2, 2011
STEM Switching 169
The first is related to the definition of STEM fields used in the study, which not only examined a broad array of science majors, but also allowed for STEM to be disaggregated. The results demonstrate that disaggregating the STEM fields allows for a more nuanced and accurate understanding of women’s participation and success in the sciences. Along similar lines, the disaggregation of women by racial and ethnic groups revealed important differ-ences between groups which remain hidden when women are examined as a homogenous group. Explicitly defining the STEM fields—specifically what majors and disciplines are classified as STEM fields—when researching STEM participation is encouraged in future research. In addition, conducting a meta-analysis on the existing literature on STEM partici-pation at the postsecondary level to examine how STEM has been defined by past studies would offer an interesting perspective on how research on STEM has been carried out thus far, potentially identifying selection bias that may have impacted the findings of existing studies.
The second, and perhaps the most important, contribution of the study is that the results offer an alternative perspective on undergraduate women’s participation in STEM. Switching from high-status STEM fields is not necessarily a departure from science, a loss to the scientific community, or evidence that women abandon science. The ability to follow students from their initial to last choice of major through the use of detailed data results in a counternarrative of women’s underrepresentation in the STEM fields. While high-status STEM fields may offer more lucrative workforce opportunities, career earnings, and opportunities for social mobility as compared to other STEM fields, these opportunities should not bias research efforts, particularly when there is still much to be learned about students’ participation and success in a variety of STEM majors. Moving forward, scholarship can seek to influence the conceptualization of the STEM fields, challenge notions of women’s and minorities’ participation in the STEM fields, and modify the language used to describe participation in the STEM fields. These adjustments, significant to the fields of education, sociology of education, and science education, may have an immediate impact on researchers and the literature on STEM participation, but with time and practical application they may also have an impact on higher education and social stratification.
ACKNOWLEDGMENT
The author would like to thank the Editor and two anonymous reviewers for their comments on the earlier version of this article. This material is based upon work supported by the Na-tional Science Foundation under Grant No. 0856309.
REFERENCES
Association of American University Women, Shortchanging Girls, Shortchanging America: A Nationwide Poll to Assess Self-Esteem, Educational Experiences, Interest in Math and Science, and Career Aspira-tions of Girls and Boys Ages 9–15, Executive Summary, Washington, DC: AAUW, Retrieved June 20, 2008, from: http://www.aauw.org/research/upload/SGSA-2.pdf, 1991.
Blickenstaff, J.C., Women and science careers: Leaky pipeline or gender filter? Gender Education, vol. 17, no. 4, pp. 369–386, 2005.
Bowen, W.G., Kurzweil, M.A., and Tobin, E.M., Equity and Excellence in American Higher Education, Charlottesville, VA: University of Virginia Press, 2005.
Brainard, S.G. and Carlin, L., A longitudinal study of undergraduate women in engineering and science,

Journal of Women and Minorities in Science and Engineering
George-Jackson170
Proc. of the 1997 Frontiers in Education Conf., Nov. 5-8, 1997, Pittsburgh, PA, Retrieved June 10, 2008, from: http://www.iwitts.com/html/brainard.pdf, 1998.
Camp, T., The incredible shrinking pipeline, Commun. ACM, vol. 40, no. 10, pp. 103–110, 1997. Carter, D.F., Key issues in the persistence of underrepresented minority students, New Directions for Insti-
tutional Research, vol. 130, pp. 33–46, 2006.Chen, X. and Weko, T., Students who study science, technology, engineering, and mathematics (STEM) in
postsecondary education, Statistics in Brief, NCES Publication no. 2009161, Washington, DC: National Center for Education Statistics, 2009.
Elliott, R, Strenta, A.C., Adair, R., Matier, M., and Scott, J., The role of ethnicity in choosing and leaving science in highly selective institutions, Res. Higher Educ., vol. 37, no. 6, pp. 681–709, 1996.
Etkowitz, H., Kemelogor, C., Neuschatz, M., Uzzi, B., and Alonzo, J., The paradox of critical mass for women in science (Change in workplace structure needed to integrate women successfully into aca-demic science departments), Science, vol. 266, no. 5182, pp. 51–54, 1994.
Felder, R.M., Felder, G.N., Mauney, M., Hamrin, C.E., and Dietz, E.J., A longitudinal study of engineering student performance and retention: Gender differences in student performance and attitudes, J. Eng. Educ., vol. 84, no. 2, pp. 151–163, 1995.
Fleming, L., Engerman, K., and Griffin, A., Persistence in engineering education: Experiences of first year students at a historically black university, Proc. of the 2005 American Society for Eng. Education An-nual Conf. and Exposition, June 12–15, 2005, Portland, OR, Retrieved July 2, 2008, from: http://www.asee.org/acPapers/2005-1786_Final.pdf, 2005.
Frehill, L.M., Education and occupational sex segregation: The decision to major in engineering, Sociologi-cal Quarterly, vol. 38, no. 2, pp. 225–249, 1997.
George-Jackson, C.E., Kienzl, G.S., and Trent, W.T., Underrepresented students entering STEM fields, As-sociation for the Study of Higher Education, Nov. 5–8, 2008, Jacksonville, FL, 2008.
Hanson, S.L., African American women in science: Experiences from high school through the post-second-ary years and beyond, National Women’s Study Association J., vol. 16, no. 1, pp. 96–115, 2004.
Higher Education Statistics Agency, Students by Subject of Study, First Year Indicator, Mode of Study and Level of Study 2009/10, Statistics- Student and Qualifiers at UK HE Institutions, Retrieved Apr. 8, 2011, from: http://www.hesa.ac.uk/dox/dataTables/studentsAndQualifiers/download/subject0910.xls, 2010.
Hrabowski, F.A. and Maton, K.I., Enhancing the success of African-American students in the sciences: Freshmen year outcomes, Sch. Sci. Math., vol. 95, no. 1, pp. 18–27, 1995.
Integrated Postsecondary Education Data System, Integrated Postsecondary Education Data System, Washington, DC: U.S. Department of Education, 1999.
Johnson, E.L., Misconceptions about the early land grant colleges, J. Higher Educ., vol. 52, no. 4, pp. 333–351, 1981.
Key, S., Economics or education: The establishment of American land-grant\universities, J. Higher Educ., vol. 67, no. 2, pp. 196–220, 1996.
Leslie, L.L., McClure, G.T., and Oaxaca, R.L., Women and minorities in science and engineering: A life sequence analysis, J. Higher Educ., vol. 69, no.3, pp. 239–276, 1998.
Leslie, L.L. and Oaxaca, R.L., Women and Minorities in Higher Education, In J.C. Smart (Ed.), Higher Education: Handbook of Theory and Research, vol. 13, New York: Agathon Press, pp. 304–352, 1998.
May, G.S. and Chubin, D.E., A retrospective on undergraduate engineering success for underrepresented minority students, J. Eng. Educ., vol. 92, 1, pp. 27–40, 2003.
National Science Foundation, Science and Engineering Indicators, Retrieved Feb. 19, 2009, from: http://www.nsf.gov/statistics/seind08/c2/c2s3.htm#c2s31, 2008.
Oakes, J., Opportunities, Achievement, and Choice: Women and Minority Students in Science and Math-ematics, Rev. Research Educ., vol. 16, pp. 153–222, 1990.
Rudolph, F., The American College and University: A History, Athens, GA: The University of Georgia Press, 1990.
Sax, L.J., Undergraduate science majors: Gender differences in who goes to graduate school, Rev. Higher Educ., vol. 24, no. 2, pp. 153–172, 2000.
Volume 17, Issue 2, 2011
STEM Switching 171
Sax, L.J., The Gender Gap in College: Maximizing the Developmental Potential of Women and Men, San Francisco, CA: Jossey Bass, 2008.
Serex, C.P. and Townsend, B.K., Student perceptions of chilling practices in sex-atypical majors, Res. High-er Educ., vol. 40, no. 5, pp. 527–538, 1999.
Seymour, E., Tracking the processes of change in U.S. undergraduate education in science mathematics, engineering, and technology, Sci. Educ., vol. 86, no. 1, pp. 79–105, 2001.
Smyth, F.L. and McArdle, J.J., Ethnic and gender differences in science graduation at selective colleges with implications for admission policy and college choice, Res. Higher Educ., vol. 45, no. 4, pp. 353–381, 2004.
St. John, E.P., Hu, S., Simmons, A., Carter, D.F., and Weber, J., What difference does a major make? The influence of college major field on persistence by African American and white students, Res. Higher Educ., vol. 45, no. 3, pp. 209–232, 2004.
Stake, J.E. and Mares, K.R., Science enrichment programs for gifted high school girls and boys: Predic-tors of program impact on science confidence and motivation, J. Res. Sci. Teach., vol. 38, no. 10, pp. 1065–1088, 2001.
Tan, D.L., Majors in science, technology, engineering, and mathematics: Gender and ethnic differences in persistence and graduation, Proc. of the 42nd Annual Association for Institutional Research (AIR) Forum, June 3–6, 2002, Toronto, Canada, 2002.
Tai, R.H. and Sadler, P.M., Gender differences in introductory undergraduate physics performance: Univer-sity physics versus college physics in the USA, Int. J. Sci. Educ., vol. 23, no. 10, pp. 1017–1037, 2001.
Thelin, J.R., A History of American Higher Education, Baltimore, MD: The Johns Hopkins University Press, 2004.
Turner, S.E. and Bowen, W.G., Choice of major: The changing (unchanging) gender gap, Ind. Labor Relat. Rev., vol. 52, no. 2, pp. 289–313, 1999.
U.S. Department of Education, A Test of Leadership: Charting the Future of U.S. Higher Education, Wash-ington, DC: U.S. Department of Education, Retrieved Sept. 28, 2006, from: http://www.ed.gov/about/bdscomm/list/hiedfuture/reports/pre-pub-report.pdf, 2006.
U.S. News and World Report, Best National Universities, vol. 127, no. 8, Aug. 30, 1999.Watson, K. and Froyd, J., Diversifying the U.S. engineering workforce: A new model, J. Eng. Educ., vol. 96,
no. 1, pp. 19–32, 2007.