NGA investments: A departure from the existing cost and demand structure assumptions
Upload
canterbury-nzCategory
view
8download
0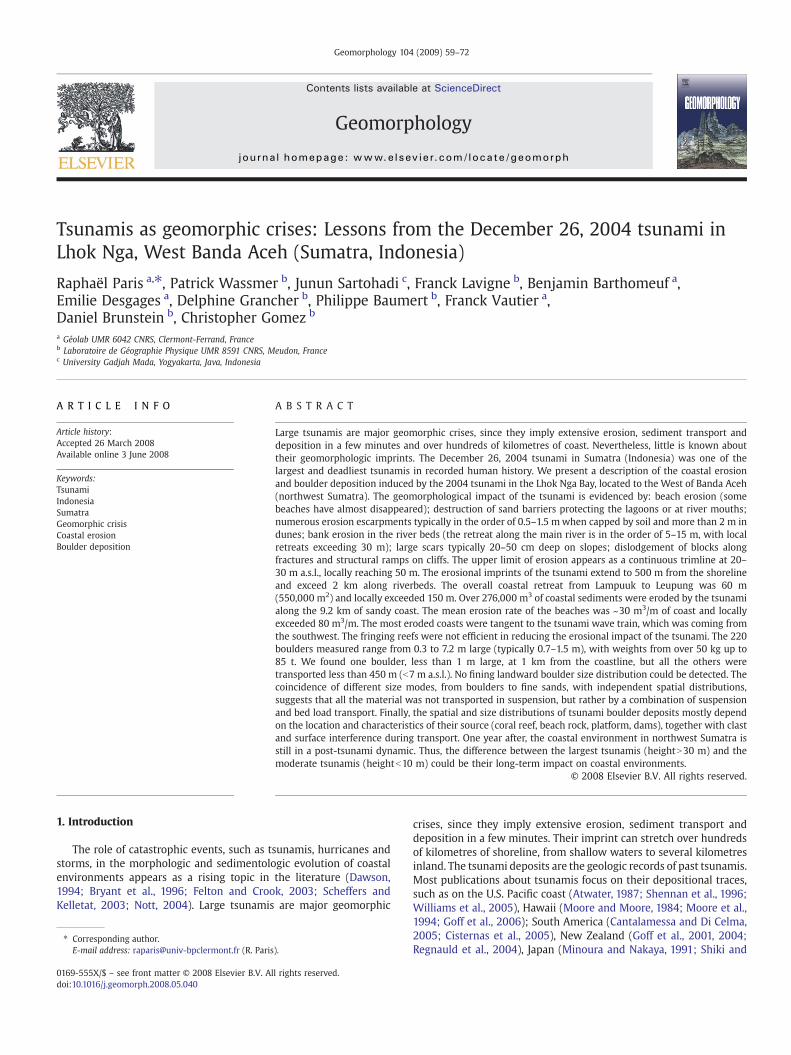
Geomorphology 104 (2009) 59–72
Contents lists available at ScienceDirect
Geomorphology
j ourna l homepage: www.e lsev ie r.com/ locate /geomorph
Tsunamis as geomorphic crises: Lessons from the December 26, 2004 tsunami inLhok Nga, West Banda Aceh (Sumatra, Indonesia)
Raphaël Paris a,⁎, Patrick Wassmer b, Junun Sartohadi c, Franck Lavigne b, Benjamin Barthomeuf a,Emilie Desgages a, Delphine Grancher b, Philippe Baumert b, Franck Vautier a,Daniel Brunstein b, Christopher Gomez b
a Géolab UMR 6042 CNRS, Clermont-Ferrand, Franceb Laboratoire de Géographie Physique UMR 8591 CNRS, Meudon, Francec University Gadjah Mada, Yogyakarta, Java, Indonesia
⁎ Corresponding author.E-mail address: [email protected] (R. Paris
0169-555X/$ – see front matter © 2008 Elsevier B.V. Aldoi:10.1016/j.geomorph.2008.05.040
A B S T R A C T
A R T I C L E I N F OArticle history:
Large tsunamis are major g Accepted 26 March 2008Available online 3 June 2008Keywords:TsunamiIndonesiaSumatraGeomorphic crisisCoastal erosionBoulder deposition
eomorphic crises, since they imply extensive erosion, sediment transport anddeposition in a few minutes and over hundreds of kilometres of coast. Nevertheless, little is known abouttheir geomorphologic imprints. The December 26, 2004 tsunami in Sumatra (Indonesia) was one of thelargest and deadliest tsunamis in recorded human history. We present a description of the coastal erosionand boulder deposition induced by the 2004 tsunami in the Lhok Nga Bay, located to the West of Banda Aceh(northwest Sumatra). The geomorphological impact of the tsunami is evidenced by: beach erosion (somebeaches have almost disappeared); destruction of sand barriers protecting the lagoons or at river mouths;numerous erosion escarpments typically in the order of 0.5–1.5 mwhen capped by soil and more than 2 m indunes; bank erosion in the river beds (the retreat along the main river is in the order of 5–15 m, with localretreats exceeding 30 m); large scars typically 20–50 cm deep on slopes; dislodgement of blocks alongfractures and structural ramps on cliffs. The upper limit of erosion appears as a continuous trimline at 20–30 m a.s.l., locally reaching 50 m. The erosional imprints of the tsunami extend to 500 m from the shorelineand exceed 2 km along riverbeds. The overall coastal retreat from Lampuuk to Leupung was 60 m(550,000 m2) and locally exceeded 150 m. Over 276,000 m3 of coastal sediments were eroded by the tsunamialong the 9.2 km of sandy coast. The mean erosion rate of the beaches was ~30 m3/m of coast and locallyexceeded 80 m3/m. The most eroded coasts were tangent to the tsunami wave train, which was coming fromthe southwest. The fringing reefs were not efficient in reducing the erosional impact of the tsunami. The 220boulders measured range from 0.3 to 7.2 m large (typically 0.7–1.5 m), with weights from over 50 kg up to85 t. We found one boulder, less than 1 m large, at 1 km from the coastline, but all the others weretransported less than 450 m (b7 m a.s.l.). No fining landward boulder size distribution could be detected. Thecoincidence of different size modes, from boulders to fine sands, with independent spatial distributions,suggests that all the material was not transported in suspension, but rather by a combination of suspensionand bed load transport. Finally, the spatial and size distributions of tsunami boulder deposits mostly dependon the location and characteristics of their source (coral reef, beach rock, platform, dams), together with clastand surface interference during transport. One year after, the coastal environment in northwest Sumatra isstill in a post-tsunami dynamic. Thus, the difference between the largest tsunamis (heightN30 m) and themoderate tsunamis (heightb10 m) could be their long-term impact on coastal environments.
© 2008 Elsevier B.V. All rights reserved.
1. Introduction
The role of catastrophic events, such as tsunamis, hurricanes andstorms, in the morphologic and sedimentologic evolution of coastalenvironments appears as a rising topic in the literature (Dawson,1994; Bryant et al., 1996; Felton and Crook, 2003; Scheffers andKelletat, 2003; Nott, 2004). Large tsunamis are major geomorphic
).
l rights reserved.
crises, since they imply extensive erosion, sediment transport anddeposition in a few minutes. Their imprint can stretch over hundredsof kilometres of shoreline, from shallow waters to several kilometresinland. The tsunami deposits are the geologic records of past tsunamis.Most publications about tsunamis focus on their depositional traces,such as on the U.S. Pacific coast (Atwater, 1987; Shennan et al., 1996;Williams et al., 2005), Hawaii (Moore and Moore, 1984; Moore et al.,1994; Goff et al., 2006); South America (Cantalamessa and Di Celma,2005; Cisternas et al., 2005), New Zealand (Goff et al., 2001, 2004;Regnauld et al., 2004), Japan (Minoura and Nakaya, 1991; Shiki and

60 R. Paris et al. / Geomorphology 104 (2009) 59–72
Yamazaki, 1996; Fujiwara et al., 2000; Nanayama et al., 2000;Takashimizu and Masuda, 2000), Caribbean (Kelletat et al., 2004;Scheffers, 2004), North Atlantic coasts (Bondevik et al., 1997; Dawsonand Smith, 2000; Bondevik et al., 2005), Canary Islands (Pérez Torradoet al., 2006), Mediterranean and Portugal (Andrade, 1992; Dawsonet al., 1995; Hindson et al., 1996; Minoura et al., 2000; Luque et al.,2001; Tanner and Calvari, 2004). Their recognition and analysisprovide clues to better understand the sedimentary signature oftsunamis, reconstruct their spatial distribution and determine earth-quake recurrence intervals in highly seismic areas. Analysis of recenttsunami deposits and events that produced themwere carried out byShi et al. (1995), Minoura et al. (1997) in Florès (December 1992tsunami), Bourgeois and Reinhart (1993) in Nicaragua (September1992 tsunami), Nishimura and Miyaji (1995), Sato et al. (1995), inHokkaido (July 1993), Dawson et al. (1996) in Java (June 1994),McSaveney et al. (2000), Gelfenbaum and Jaffe (2003) in Papua NewGuinea (July 1998), Jaffe et al. (2003) in Peru (June 2001) andSzczucínski et al. (2005) in Thailand (December 2004). Nevertheless,we still know little about the geomorphologic imprints of tsunamis,and only a few authors intended to correlate tsunami deposits witherosional features and processes (Andrade, 1992; Shi et al., 1995;Bondevik et al., 1997; Gelfenbaum and Jaffe, 2003). Systematic anddetailed surveys immediately following a tsunami are required inorder to link geomorphological and sedimentological traces of pasttsunamis with specific processes and features observed during andjust after a tsunami event.
The December 26, 2004 tsunami in Sumatra (Indonesia) was one ofthe largest and deadliest tsunamis in recorded human history. In thispaper, we present a description of the coastal erosion and boulderdeposition induced by the 2004 tsunami in the Lhok Nga Bay, locatedon the northwestern coast of Sumatra, near the city of Banda Aceh(Fig. 1). The Aceh province was poorly studied prior to the tsunami,because of a thirty years long civil war. The Lhok Nga Bay is 300 kmfrom the Sunda subduction trench between the Indo-Australian plateand the Burma microplate. The December 26, 2004 main earthquake(magnitude 9.3) occurred 100 km east of the Sunda trench and 250 kmsouth–southeast of the study area. The northwestern coast of Aceh hasa contrasted relief of bays and creeks dominated by steep slopestypical of tropical environments. The cliffs display Palaeozoic lime-stones and dolomites, fractured and sometimes folded. Karstmorphologies can be observed all along the coast. The embaymentsdisplay a landscape of beaches, small estuaries with sand barriers,mangroves and lagoons.
The Northern part of the Lhok Nga Bay is a 5 km large coastalembayment (25 km2) open to the west and delimited by steep slopes
Fig. 1. Location map of the Lhok Nga Bay (Sumatra, Indonesia).
typical of tropical environments (Fig. 2). The coast prior to the tsunamievent appeared as a continuous beach, breached at the mouth of therivers during the wet season. The sea floor topography is almost flat,with a gentle slope break about 1 km from the shoreline. The lowestareas correspond to coastal lagoons. Hummocky terrains correspondto dunes and palaeo-dunes reaching 15 m a.s.l. (e.g. Lampuuk, LamLho). In the southern part of the bay, the coastal morphology becomesmore contrasted, especially between the harbour and Labuhan Point,where the coast shows alternating cliffs and flat crescent-shaped baysand creeks. Fringing reefs are located between Lhok Nga Point and themain river mouth.
2. The December 26, 2004 tsunami in Lhok Nga
The magnitude 9.3 earthquake was felt in Banda Aceh and LhokNga at 8:00 AM (7:58 local time, 00:58 UTC). The tsunami consisted inthree main waves. A retreat of the sea was observed 10 min after theearthquake. The first wave came from the southwest three minuteslater and was less than 5 m high, but very fast (Lavigne et al., 2006).The second and largest wave came from the west–southwest within5 min after the first one and was at least 15–30 m high at the coast.Very few observations were available for the third wave. The returnflow (backwash) was achieved 5 min after the third wave and itsspatial distributionwas controlled by the slope breaks and topographylows, such as rivers and lagoons (Lavigne et al., 2006; Paris et al.,2007). The eastern part of the bay was inundated for three days,because logjams of debris occurred along the river of Lhok Nga up to4 km inland. Almost all the buildings and trees were swept away, allthe roads and bridges were severely damaged or completelydestroyed. Only the mosque and a few coconut and casuarina treesremained after the tsunami hit the area of Lampuuk. The harbour andthe cement factory in the southern part of the bay suffered partialdamage. The confirmed death toll in Lhok Nga was over 7000 people.
The geomorphologic impact of the tsunami in Lhok Nga wasevidenced by severe coastal erosion. The upper limit of destructionappears as a continuous trimline at 20–30 m a.s.l. The runup reached36 m a.s.l. in Lhok Nga and 51 m a.s.l. in a small bay near Labuhan(Lavigne et al., 2006). It is the highest runup ever recorded in humanhistory for a tsunami without coseismic landslides (NGDC, 2006). Theerosional imprints of the tsunami extend to 500 m from the shorelineand exceed 2 km along the river beds.
3. Methodology
The field investigations were carried out in Lhok Nga in August andDecember 2005 in the framework of the Tsunarisk project. Apreliminary survey was undertaken in January 2005, three weeksafter the tsunami (1st ITST— International Tsunami Survey Team). Wealso collected additional data and observations along the road fromLhok Nga to Calang (Labuhan, Leupung, Lhoong and Gleebruk). Thecharacteristics of the tsunami in Lhok Nga (direction, velocity, heightand number of waves) were documented by dozens of eyewitnesses.We also measured flow directions attested by tilted trunks and pillars,and debris wrapped around trees. Thewave heights and runups on theslopes were estimated by measuring the elevation of broken limbs,uprooted bark, debris in trees or water level marks on buildings (datacollected with handheld reflectorless laser measurement systems, seeLavigne et al., 2006). We did not estimate the wave heights fromcoconut trees, because their trunks were simply tilted from the topwithout breaking before returning back to their initial position afterthe tsunami. We surveyed and mapped 12.4 km of shoreline using abifrequential DGPS (December 2005) and also by remote sensing(Ikonos images as of January 10, 2003 and December 28, 2004, Spot 5image as of December 30, 2004 and an orthorectified aerial photo as ofJune 2005), in order to estimate the coastal retreat directly induced bythe tsunami and coastline evolution during the following months.

Fig. 2. Sketch map of the geomorphological impact of the December 26, 2004 tsunami in Lhok Nga (inset photo: northern part of the bay). As suggested by the inset graphics, there isnot any relationship between the coastal retreat values (histograms) and the tsunami wave height values (curve).
61R. Paris et al. / Geomorphology 104 (2009) 59–72
Data were then corrected for tidal deviations. We calculated 125values of instant coastal retreat from satellite imagery and lasermeasurements in the field, considering the direction of the tsunamiwaves (not always perpendicular to the coastline).
We measured dozens of vertical erosion values and dug pits andtrenches in the tsunami sand deposits with the aim of reconstruct thepre-tsunami topography. The vertical erosion was estimated bymeasuring the height between the base of the tsunami sand depositscovering eroded beaches, beach rocks, dunes or soils (a detailed studyof the sand deposits has been carried out by Paris et al., 2007), and
preserved markers such as roads, exposed wells, foundations ofbuildings, non-eroded soils and roots. The main difficulties consistedin (1) determining the base of the tsunami sand deposits, which areenriched in bioclasts and rip-up clasts of soil, poorly sorted andcoarser than the beach or dune sands, and (2) estimating the pre-tsunami topography in hummocky terrains (e.g. dunes near Lampuuk,northern part of the Lhok Nga Bay). Thus, we also used eyewitnessesaccounts, photographs and videos of the area before the tsunami.
We systematically measured the thickness of tsunami sanddeposits and computed the data in a 100 m grid. Normally graded

Fig. 3. Gleebruk (road from Banda Aceh to Calang): the coastal retreat is here so important (N200 m) that the road is now directed toward the ocean.
Table 1Coastal retreat induced by the December 26, 2004 tsunami in Lhok Nga
Coast length Mean retreat Area affected Volume eroded
m m m2 m3/m
Lampuuk 900 64 58,000 25–40Lhok Nga Point 1600 86 137,400 30–80Golf course 600 10 5300 b40Main river 900 48 42,900 20–35South Lhok Nga 1850 38 70,000 20–80Harbour 110 46 5100Labuhan bay 1 900 16 14,250Labuhan bay 2 200 20 3980Labuhan bay 3 480 17 8360Leupung 1680 123 206,400 20–50Total 9220 60 551,690 30
62 R. Paris et al. / Geomorphology 104 (2009) 59–72
couplets or triplets of sand layers were previously used by Paris et al.(2007) to identify the inflows of successive waves and the finaloutflow (backwash).
In addition, we measured the 3 axis of 220 boulders, theirimbrications if any, and their distance to the shoreline (consideringthe direction of the tsunami waves). We also noted their lithology,took samples and calculated their volume, density and weight. Finally,all the data were integrated in a GIS database for statistical and spatialanalysis.
4. Field observations and results
4.1. Coastal retreat
In the field, the coastal erosion caused by the tsunami mainlyconsisted of severe beach erosion (some beaches have almostdisappeared, e.g. around Lhok Nga Point), attested by the exposureof the beach rock (e.g. Lampuuk and near the swimming pool of LhokNga), destruction of the sand barriers protecting the lagoons or at themouths of the rivers (e.g. Lhok Ngamain river), and numerous erosionescarpments. The most spectacular evidence are the sections ofmissing roads or bridges. In Gleebruk (on the road from Lhok Nga toCalang), the coastal retreat was so important (N200m) that the road isnow directed toward the ocean (Fig. 3). The overall coastal retreat,from Lampuuk to Leupung was 60 m when considering the area ofremoval divided by the coastline length, and 56 m when consideringthe mean of the 125 values of retreat (Fig. 2). Over 550,000 m2 ofsediments were eroded by the tsunami along the 9.2 km of sandycoast. In Lhok Nga, the largest retreats correspond to coastal lagoonsand topographic insets invaded and enlarged by the tsunami (e.g.197 m between Lhok Nga and Lampuuk, 111 m in south Lhok Nga).From the north to the south, we divided the coast in 10 morphologicalterrain units (Table 1). With less than 35 m of maximum retreat andless than 20 m of mean retreat, the small bays between Labuhan and
the harbour were less affected, perhaps due to the low approachingangle of the tsunami wave train. The coast of the golf course was alsosurprisingly preserved (mean coastal retreat: 10 m). The most erodedsectors were Lampuuk (mean retreat: 64 m), the Lhok Nga Point(86 m) and the Leupung Bay (123 m). These three coastlines weretangent to the tsunami wave train coming from the Southwest, andare located at the northern extremities of the two large bays. The smallfringing reef of Lhok Nga was not efficient in reducing the erosionalimpact of the tsunami. In north Leupung, the sand barrier — coastallagoon systems were considerably vulnerable and retreat values aretypically in the order of 100–150 m (Fig. 4).
An issue in question is the relationship between the coastal erosioninduced by the tsunami and the effects of the earthquake andsubsequent aftershocks. The numerous submerged roots and trunks inLeupung and Lhok Nga, especially in the southern part of the bay,suggest a land subsidence in the order of 1–2 m (Fig. 5). Compara-tively, the land has subsided 30 to 60 cm in the city of Banda Aceh(Yuichiro Tanioka and Yudhicara, pers. comm.). Thus, our estimations

Fig. 4. Satellite images showing the coast in the north part of the Leupung Bay, before (Ikonos image of January 10, 2003) and after the tsunami (CNES-Spot 5 image of December 30,2004). The coastal retreat exceeds 150 m and is attested by the complete destruction of the sand barrier, thus leaving the lagoons opened to the sea and modifying the coastaldrainage.
63R. Paris et al. / Geomorphology 104 (2009) 59–72
of coastal retreat aremaximumvalues andmore investigations shouldbe carried out in order to detail the spatial distribution and rates ofland subsidence.
4.2. Vertical erosion
The instant erosion induced by the tsunami was attested bymultiple sets of fresh escarpments typically in the order of 0.5–1.5 mwhen the surface was capped by the soil and the roots (Fig. 6). The
mean vertical erosion was 1.3 m, although the surface micromorphol-ogy affected the tsunami flows and locally increased flow turbulence,both during runup and backwash. As a consequence, the instantvertical erosion was higher near walls, sea-walls and roads (e.g. 2.3 mbetween the dam and the swimming pool in south Lhok Nga, 2.2 mbehind a wall in Lampuuk). The erosion escarpments occasionallydescribed coalescent topographic insets and outsets, determined bythe previous topography, the geometry of the infrastructures or deep-rooted trees. In South Lhok Nga, the main erosional insets were

Fig. 5. The submerged roots and trunks in south Lhok Nga suggest a land subsidence in the order of 1–2 m, due to the Mw 9.3 earthquake.
Fig. 6. The erosional impact of the tsunami is evidenced by beach erosion (A: vertical erosion of respectively 2 m near the swimming pool; B: 1.5 m at the contact with the road whichis also partly destroyed), fresh escarpments of soil erosion (C: typically 0.5–1.5 m), and bank erosion along the river beds (D: Lampuuk).
64 R. Paris et al. / Geomorphology 104 (2009) 59–72

65R. Paris et al. / Geomorphology 104 (2009) 59–72
located behind the trenches cut by the tsunami in a coastal dam,following the direction of the wave train (Fig. 7). There was a notabledifference between the vertical erosion in the outsets (1.1 m) and inthe insets (1.4 m).
The highest vertical erosion values (N2 m) were observed in thesmall dune field near Lampuuk (Fig. 8). The previous hummockytopography was heavily modified by the tsunami and some dunes arecompletely destroyed (N4 m of abrasion). A brown palaeo-soil wasexposed by the destruction of the dunes, and even partly eroded bythe tsunami. The density of the vegetation covering the dunes mayhave played a role in their degree of destruction. Secondary scarps onthe flanks of the eroded dunes suggest that the backwash alsoproduced significant erosion.
We estimated eroded volumes per metre of coast when the valuesof coastal retreat were completed by vertical erosion rates along beachprofiles. The mean eroded volume of the beaches is ~30 m3/m of coast
Fig. 7. Aerial orthorectified photo (June 2005) of south Lhok Nga, showing a boulder field (Ninsets and boulder concentrations are in the axis of the trenches cut by the tsunami in the
(Table 1), locally exceeding 80 m3/m of coast in South Lhok Nga (nearthe cement factory and the harbour) and at Lhok Nga Point (in the axisof the fringing reef). Assuming a mean coastal retreat of 60 m, a meanvertical erosion of 1 m at the top of the beach profiles (which is aconservative value) and an affected area of 551,690 m2, the volume ofsubaerial sediments transported by the tsunami may be around276,000 m3 along 9.2 km of coast.
4.3. Erosion of river beds and banks
Bank erosion along rivers, gullies and coastal lagoons was moredifficult to quantify, since no markers were available. After eyewitnessaccounts and using the Ikonos images of January 10, 2003 andDecember 28, 2004, we can affirm that the bank retreat along themain river (Lhok Nga bridge) was typically in the order of 5–15 m,with local retreats exceeding 30 m. No difference was found between
1000 boulders) and erosion escarpments behind a coastal dam. Note that the erosionaldam.

Fig. 8. Abrasion of dunes near Lampuuk. The vertical erosion is more than 4 m, as attested by this exposed well. The secondary scarp on the flank of the dune, below the maximuminundation height and pre-tsunami surface, probably reflects the erosion by the backwash.
66 R. Paris et al. / Geomorphology 104 (2009) 59–72
the two banks of the river. The flow orientation data that we collected(Lavigne et al., 2006) shows that the backwash was mostlyconcentrated in the topographic lows, thus playing a secondary rolein bank erosion.
Along the west coast on the road to Calang, the sand barriers at themouths of the rivers were systematically removed, leaving the lagoonsand river beds opened to the sea. Bank erosion was also severe in theareas of Leupung and Lhoong (small bays located south of Leupung).Satellite imagery confirms that the path of some rivers shifted andpalaeo-channels were reactivated (e.g. west Banda Aceh). This is theresult of the intense erosion of the topographic lows in a few minutes,followed by inundations because of the voluminous logjams of debris.The geometry of the hydrographic network and the spatial distribu-tion of the debris during the backwash may determine the post-tsunami distribution of the drainage.
4.4. Cliff and slope erosion
Rocky coasts and slopes undoubtedly underwent erosion, but itsestimation is almost impossible (Fig. 9). The pre-tsunami surface is noteasily identifiable in the field and the resolution of the satelliteimagery is not high enough to estimate retreats. Nevertheless, wecould notice erosion evidence on all the rocky coasts between Lhok
Nga and Gleebruk. The vegetation and the soil were almost washedover behind the tsunami's trimline on the cliffs and slopes. Theerosional features consisted in erosion escarpments at the foot of theslopes, large scars typically 20–50 cm deep, and dislodgment of blocksalong the fractures and structural ramps of the cliffs (the Palaeozoiclimestone is particularly fractured and karstified on this coast). Whenthe rock was previously weathered and fractured, the tsunami wasable to mobilise entire slope sections. On the road from Lhoong toGleebruk, the main road was cut and a new one has been built in atrench made by the tsunami through the slope. Limestone megaclastsresulting from this erosion were deposited on the rice fields behind.Nevertheless, this kind of spectacular erosional feature remains rare,despite the considerable intensity of the tsunami.
4.5. Boulder deposits
Although the deposition by the tsunami is mainly represented byextensive sheets of sand up to 5 km inland (Paris et al., 2007),megaclasts of soil, road, cement and boulders of coral (mainly Porites),beach rock and limestone were also deposited onshore. The 220boulders measured range from 0.3 to 7.2 m on the main axis. Most ofthem are 0.7–1.5 m large (0.1–0.9 m3). The beach rock clasts areslightly smaller (mean volume: 0.33 m3) than the coral clasts (mean
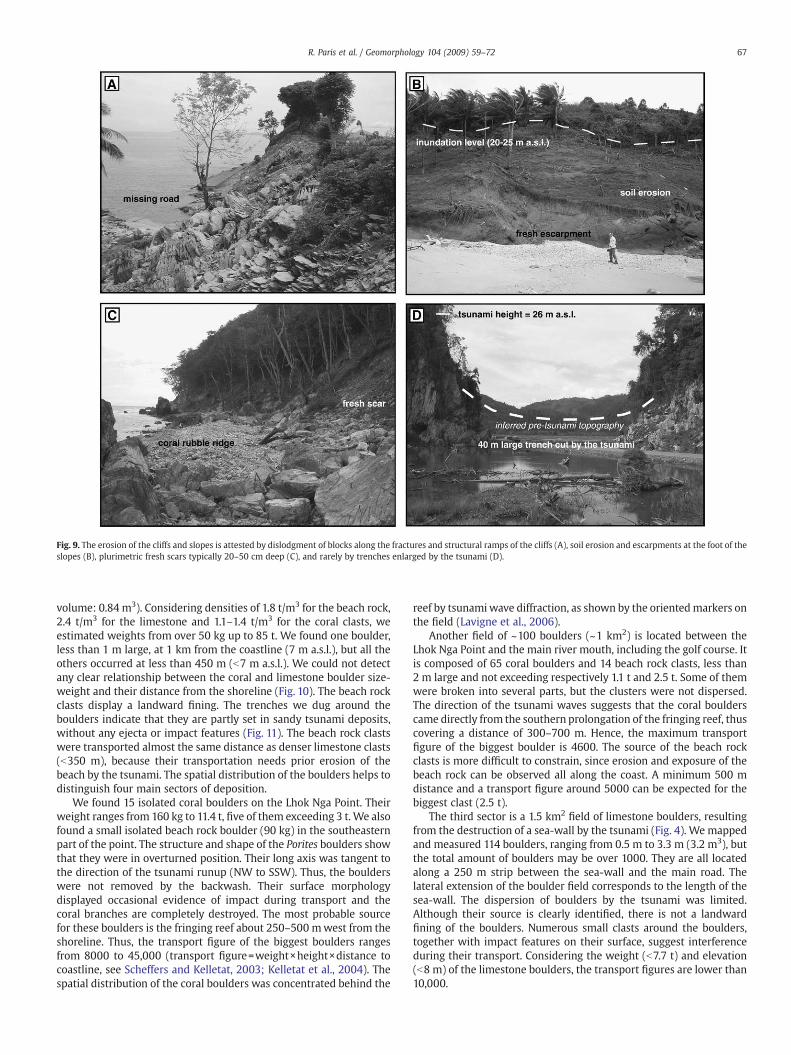
Fig. 9. The erosion of the cliffs and slopes is attested by dislodgment of blocks along the fractures and structural ramps of the cliffs (A), soil erosion and escarpments at the foot of theslopes (B), plurimetric fresh scars typically 20–50 cm deep (C), and rarely by trenches enlarged by the tsunami (D).
67R. Paris et al. / Geomorphology 104 (2009) 59–72
volume: 0.84 m3). Considering densities of 1.8 t/m3 for the beach rock,2.4 t/m3 for the limestone and 1.1–1.4 t/m3 for the coral clasts, weestimated weights from over 50 kg up to 85 t. We found one boulder,less than 1 m large, at 1 km from the coastline (7 m a.s.l.), but all theothers occurred at less than 450 m (b7 m a.s.l.). We could not detectany clear relationship between the coral and limestone boulder size-weight and their distance from the shoreline (Fig. 10). The beach rockclasts display a landward fining. The trenches we dug around theboulders indicate that they are partly set in sandy tsunami deposits,without any ejecta or impact features (Fig. 11). The beach rock clastswere transported almost the same distance as denser limestone clasts(b350 m), because their transportation needs prior erosion of thebeach by the tsunami. The spatial distribution of the boulders helps todistinguish four main sectors of deposition.
We found 15 isolated coral boulders on the Lhok Nga Point. Theirweight ranges from 160 kg to 11.4 t, five of them exceeding 3 t. We alsofound a small isolated beach rock boulder (90 kg) in the southeasternpart of the point. The structure and shape of the Porites boulders showthat they were in overturned position. Their long axis was tangent tothe direction of the tsunami runup (NW to SSW). Thus, the boulderswere not removed by the backwash. Their surface morphologydisplayed occasional evidence of impact during transport and thecoral branches are completely destroyed. The most probable sourcefor these boulders is the fringing reef about 250–500 mwest from theshoreline. Thus, the transport figure of the biggest boulders rangesfrom 8000 to 45,000 (transport figure=weight×height×distance tocoastline, see Scheffers and Kelletat, 2003; Kelletat et al., 2004). Thespatial distribution of the coral boulders was concentrated behind the
reef by tsunamiwave diffraction, as shown by the orientedmarkers onthe field (Lavigne et al., 2006).
Another field of ~100 boulders (~1 km2) is located between theLhok Nga Point and the main river mouth, including the golf course. Itis composed of 65 coral boulders and 14 beach rock clasts, less than2 m large and not exceeding respectively 1.1 t and 2.5 t. Some of themwere broken into several parts, but the clusters were not dispersed.The direction of the tsunami waves suggests that the coral boulderscame directly from the southern prolongation of the fringing reef, thuscovering a distance of 300–700 m. Hence, the maximum transportfigure of the biggest boulder is 4600. The source of the beach rockclasts is more difficult to constrain, since erosion and exposure of thebeach rock can be observed all along the coast. A minimum 500 mdistance and a transport figure around 5000 can be expected for thebiggest clast (2.5 t).
The third sector is a 1.5 km2field of limestone boulders, resulting
from the destruction of a sea-wall by the tsunami (Fig. 4). We mappedand measured 114 boulders, ranging from 0.5 m to 3.3 m (3.2 m3), butthe total amount of boulders may be over 1000. They are all locatedalong a 250 m strip between the sea-wall and the main road. Thelateral extension of the boulder field corresponds to the length of thesea-wall. The dispersion of boulders by the tsunami was limited.Although their source is clearly identified, there is not a landwardfining of the boulders. Numerous small clasts around the boulders,together with impact features on their surface, suggest interferenceduring their transport. Considering the weight (b7.7 t) and elevation(b8 m) of the limestone boulders, the transport figures are lower than10,000.
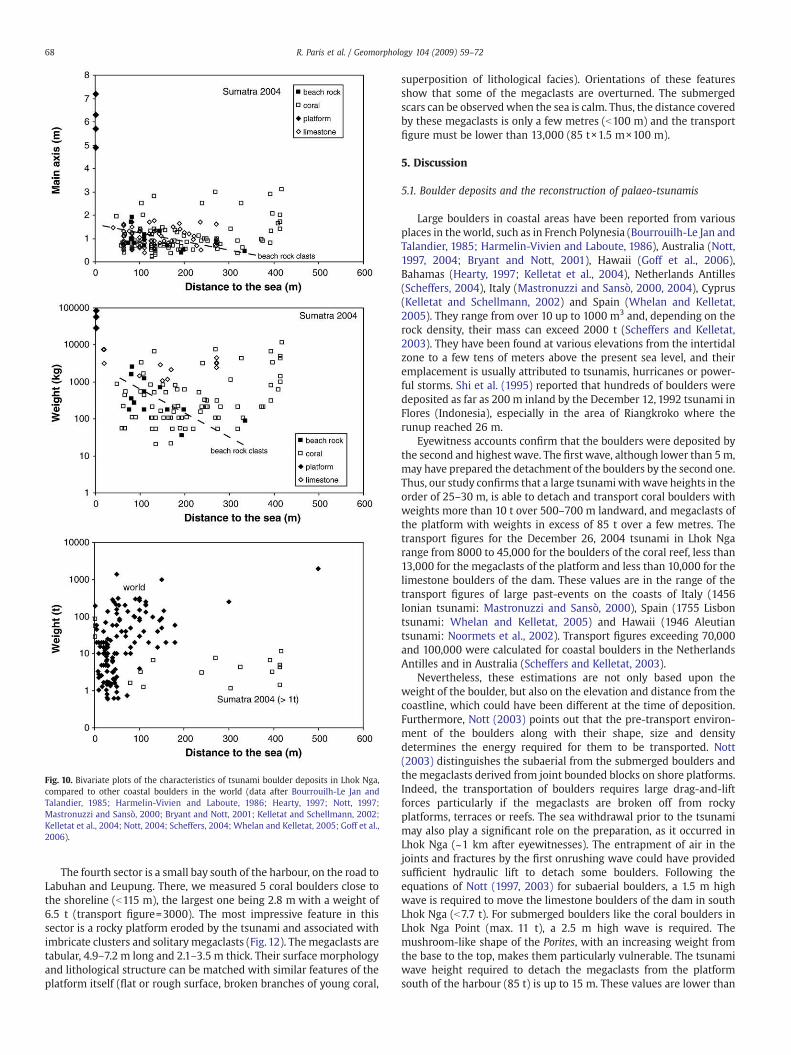
Fig. 10. Bivariate plots of the characteristics of tsunami boulder deposits in Lhok Nga,compared to other coastal boulders in the world (data after Bourrouilh-Le Jan andTalandier, 1985; Harmelin-Vivien and Laboute, 1986; Hearty, 1997; Nott, 1997;Mastronuzzi and Sansò, 2000; Bryant and Nott, 2001; Kelletat and Schellmann, 2002;Kelletat et al., 2004; Nott, 2004; Scheffers, 2004; Whelan and Kelletat, 2005; Goff et al.,2006).
68 R. Paris et al. / Geomorphology 104 (2009) 59–72
The fourth sector is a small bay south of the harbour, on the road toLabuhan and Leupung. There, we measured 5 coral boulders close tothe shoreline (b115 m), the largest one being 2.8 m with a weight of6.5 t (transport figure=3000). The most impressive feature in thissector is a rocky platform eroded by the tsunami and associated withimbricate clusters and solitary megaclasts (Fig. 12). Themegaclasts aretabular, 4.9–7.2 m long and 2.1–3.5 m thick. Their surface morphologyand lithological structure can be matched with similar features of theplatform itself (flat or rough surface, broken branches of young coral,
superposition of lithological facies). Orientations of these featuresshow that some of the megaclasts are overturned. The submergedscars can be observedwhen the sea is calm. Thus, the distance coveredby these megaclasts is only a few metres (b100 m) and the transportfigure must be lower than 13,000 (85 t×1.5 m×100 m).
5. Discussion
5.1. Boulder deposits and the reconstruction of palaeo-tsunamis
Large boulders in coastal areas have been reported from variousplaces in theworld, such as in French Polynesia (Bourrouilh-Le Jan andTalandier, 1985; Harmelin-Vivien and Laboute, 1986), Australia (Nott,1997, 2004; Bryant and Nott, 2001), Hawaii (Goff et al., 2006),Bahamas (Hearty, 1997; Kelletat et al., 2004), Netherlands Antilles(Scheffers, 2004), Italy (Mastronuzzi and Sansò, 2000, 2004), Cyprus(Kelletat and Schellmann, 2002) and Spain (Whelan and Kelletat,2005). They range from over 10 up to 1000 m3 and, depending on therock density, their mass can exceed 2000 t (Scheffers and Kelletat,2003). They have been found at various elevations from the intertidalzone to a few tens of meters above the present sea level, and theiremplacement is usually attributed to tsunamis, hurricanes or power-ful storms. Shi et al. (1995) reported that hundreds of boulders weredeposited as far as 200 m inland by the December 12, 1992 tsunami inFlores (Indonesia), especially in the area of Riangkroko where therunup reached 26 m.
Eyewitness accounts confirm that the boulders were deposited bythe second and highest wave. The first wave, although lower than 5m,may have prepared the detachment of the boulders by the second one.Thus, our study confirms that a large tsunamiwith wave heights in theorder of 25–30 m, is able to detach and transport coral boulders withweights more than 10 t over 500–700 m landward, and megaclasts ofthe platform with weights in excess of 85 t over a few metres. Thetransport figures for the December 26, 2004 tsunami in Lhok Ngarange from 8000 to 45,000 for the boulders of the coral reef, less than13,000 for the megaclasts of the platform and less than 10,000 for thelimestone boulders of the dam. These values are in the range of thetransport figures of large past-events on the coasts of Italy (1456Ionian tsunami: Mastronuzzi and Sansò, 2000), Spain (1755 Lisbontsunami: Whelan and Kelletat, 2005) and Hawaii (1946 Aleutiantsunami: Noormets et al., 2002). Transport figures exceeding 70,000and 100,000 were calculated for coastal boulders in the NetherlandsAntilles and in Australia (Scheffers and Kelletat, 2003).
Nevertheless, these estimations are not only based upon theweight of the boulder, but also on the elevation and distance from thecoastline, which could have been different at the time of deposition.Furthermore, Nott (2003) points out that the pre-transport environ-ment of the boulders along with their shape, size and densitydetermines the energy required for them to be transported. Nott(2003) distinguishes the subaerial from the submerged boulders andthe megaclasts derived from joint bounded blocks on shore platforms.Indeed, the transportation of boulders requires large drag-and-liftforces particularly if the megaclasts are broken off from rockyplatforms, terraces or reefs. The sea withdrawal prior to the tsunamimay also play a significant role on the preparation, as it occurred inLhok Nga (~1 km after eyewitnesses). The entrapment of air in thejoints and fractures by the first onrushing wave could have providedsufficient hydraulic lift to detach some boulders. Following theequations of Nott (1997, 2003) for subaerial boulders, a 1.5 m highwave is required to move the limestone boulders of the dam in southLhok Nga (b7.7 t). For submerged boulders like the coral boulders inLhok Nga Point (max. 11 t), a 2.5 m high wave is required. Themushroom-like shape of the Porites, with an increasing weight fromthe base to the top, makes them particularly vulnerable. The tsunamiwave height required to detach the megaclasts from the platformsouth of the harbour (85 t) is up to 15 m. These values are lower than
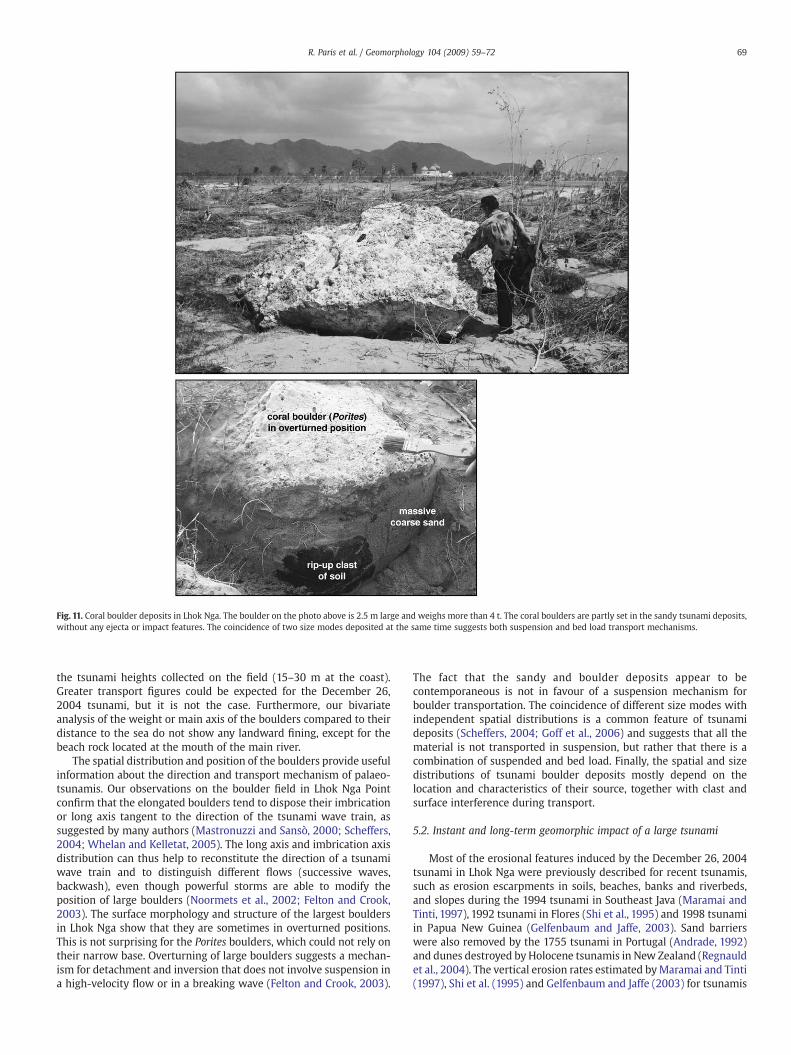
Fig. 11. Coral boulder deposits in Lhok Nga. The boulder on the photo above is 2.5 m large and weighs more than 4 t. The coral boulders are partly set in the sandy tsunami deposits,without any ejecta or impact features. The coincidence of two size modes deposited at the same time suggests both suspension and bed load transport mechanisms.
69R. Paris et al. / Geomorphology 104 (2009) 59–72
the tsunami heights collected on the field (15–30 m at the coast).Greater transport figures could be expected for the December 26,2004 tsunami, but it is not the case. Furthermore, our bivariateanalysis of the weight or main axis of the boulders compared to theirdistance to the sea do not show any landward fining, except for thebeach rock located at the mouth of the main river.
The spatial distribution and position of the boulders provide usefulinformation about the direction and transport mechanism of palaeo-tsunamis. Our observations on the boulder field in Lhok Nga Pointconfirm that the elongated boulders tend to dispose their imbricationor long axis tangent to the direction of the tsunami wave train, assuggested by many authors (Mastronuzzi and Sansò, 2000; Scheffers,2004; Whelan and Kelletat, 2005). The long axis and imbrication axisdistribution can thus help to reconstitute the direction of a tsunamiwave train and to distinguish different flows (successive waves,backwash), even though powerful storms are able to modify theposition of large boulders (Noormets et al., 2002; Felton and Crook,2003). The surface morphology and structure of the largest bouldersin Lhok Nga show that they are sometimes in overturned positions.This is not surprising for the Porites boulders, which could not rely ontheir narrow base. Overturning of large boulders suggests a mechan-ism for detachment and inversion that does not involve suspension ina high-velocity flow or in a breaking wave (Felton and Crook, 2003).
The fact that the sandy and boulder deposits appear to becontemporaneous is not in favour of a suspension mechanism forboulder transportation. The coincidence of different size modes withindependent spatial distributions is a common feature of tsunamideposits (Scheffers, 2004; Goff et al., 2006) and suggests that all thematerial is not transported in suspension, but rather that there is acombination of suspended and bed load. Finally, the spatial and sizedistributions of tsunami boulder deposits mostly depend on thelocation and characteristics of their source, together with clast andsurface interference during transport.
5.2. Instant and long-term geomorphic impact of a large tsunami
Most of the erosional features induced by the December 26, 2004tsunami in Lhok Nga were previously described for recent tsunamis,such as erosion escarpments in soils, beaches, banks and riverbeds,and slopes during the 1994 tsunami in Southeast Java (Maramai andTinti, 1997), 1992 tsunami in Flores (Shi et al., 1995) and 1998 tsunamiin Papua New Guinea (Gelfenbaum and Jaffe, 2003). Sand barrierswere also removed by the 1755 tsunami in Portugal (Andrade, 1992)and dunes destroyed by Holocene tsunamis in New Zealand (Regnauldet al., 2004). The vertical erosion rates estimated byMaramai and Tinti(1997), Shi et al. (1995) and Gelfenbaum and Jaffe (2003) for tsunamis
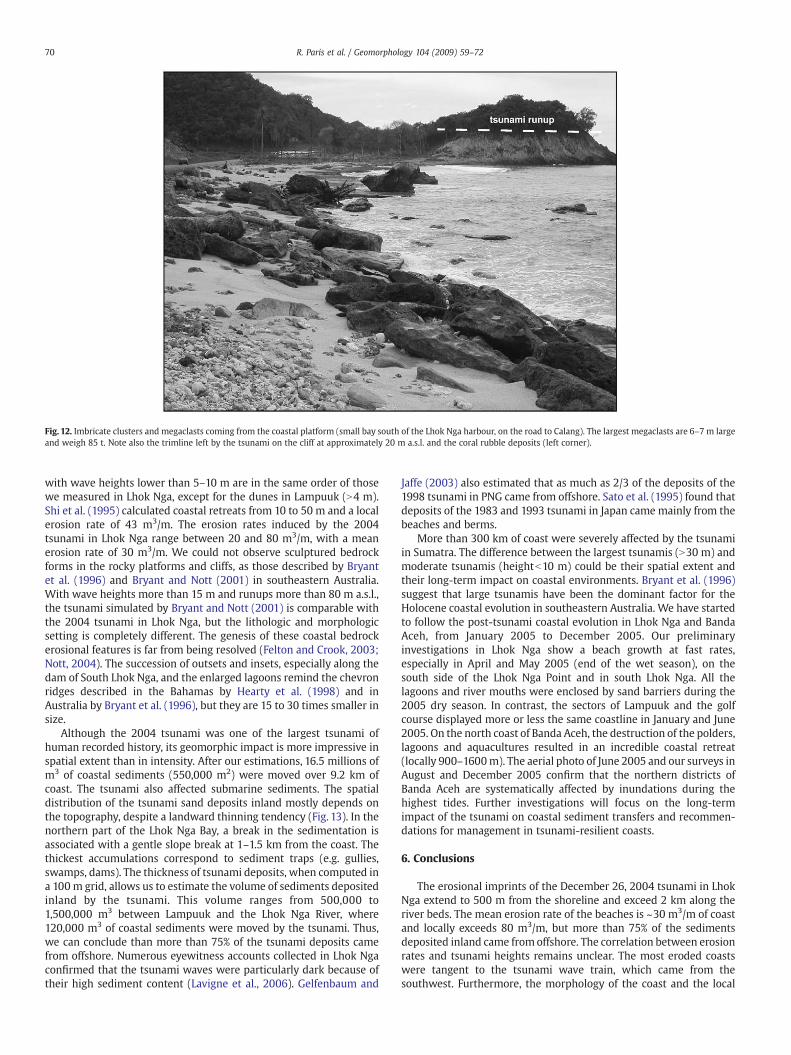
Fig. 12. Imbricate clusters and megaclasts coming from the coastal platform (small bay south of the Lhok Nga harbour, on the road to Calang). The largest megaclasts are 6–7 m largeand weigh 85 t. Note also the trimline left by the tsunami on the cliff at approximately 20 m a.s.l. and the coral rubble deposits (left corner).
70 R. Paris et al. / Geomorphology 104 (2009) 59–72
with wave heights lower than 5–10 m are in the same order of thosewe measured in Lhok Nga, except for the dunes in Lampuuk (N4 m).Shi et al. (1995) calculated coastal retreats from 10 to 50 m and a localerosion rate of 43 m3/m. The erosion rates induced by the 2004tsunami in Lhok Nga range between 20 and 80 m3/m, with a meanerosion rate of 30 m3/m. We could not observe sculptured bedrockforms in the rocky platforms and cliffs, as those described by Bryantet al. (1996) and Bryant and Nott (2001) in southeastern Australia.With wave heights more than 15 m and runups more than 80 m a.s.l.,the tsunami simulated by Bryant and Nott (2001) is comparable withthe 2004 tsunami in Lhok Nga, but the lithologic and morphologicsetting is completely different. The genesis of these coastal bedrockerosional features is far from being resolved (Felton and Crook, 2003;Nott, 2004). The succession of outsets and insets, especially along thedam of South Lhok Nga, and the enlarged lagoons remind the chevronridges described in the Bahamas by Hearty et al. (1998) and inAustralia by Bryant et al. (1996), but they are 15 to 30 times smaller insize.
Although the 2004 tsunami was one of the largest tsunami ofhuman recorded history, its geomorphic impact is more impressive inspatial extent than in intensity. After our estimations, 16.5 millions ofm3 of coastal sediments (550,000 m2) were moved over 9.2 km ofcoast. The tsunami also affected submarine sediments. The spatialdistribution of the tsunami sand deposits inland mostly depends onthe topography, despite a landward thinning tendency (Fig. 13). In thenorthern part of the Lhok Nga Bay, a break in the sedimentation isassociated with a gentle slope break at 1–1.5 km from the coast. Thethickest accumulations correspond to sediment traps (e.g. gullies,swamps, dams). The thickness of tsunami deposits, when computed ina 100 m grid, allows us to estimate the volume of sediments depositedinland by the tsunami. This volume ranges from 500,000 to1,500,000 m3 between Lampuuk and the Lhok Nga River, where120,000 m3 of coastal sediments were moved by the tsunami. Thus,we can conclude than more than 75% of the tsunami deposits camefrom offshore. Numerous eyewitness accounts collected in Lhok Ngaconfirmed that the tsunami waves were particularly dark because oftheir high sediment content (Lavigne et al., 2006). Gelfenbaum and
Jaffe (2003) also estimated that as much as 2/3 of the deposits of the1998 tsunami in PNG came from offshore. Sato et al. (1995) found thatdeposits of the 1983 and 1993 tsunami in Japan came mainly from thebeaches and berms.
More than 300 km of coast were severely affected by the tsunamiin Sumatra. The difference between the largest tsunamis (N30 m) andmoderate tsunamis (heightb10 m) could be their spatial extent andtheir long-term impact on coastal environments. Bryant et al. (1996)suggest that large tsunamis have been the dominant factor for theHolocene coastal evolution in southeastern Australia. We have startedto follow the post-tsunami coastal evolution in Lhok Nga and BandaAceh, from January 2005 to December 2005. Our preliminaryinvestigations in Lhok Nga show a beach growth at fast rates,especially in April and May 2005 (end of the wet season), on thesouth side of the Lhok Nga Point and in south Lhok Nga. All thelagoons and river mouths were enclosed by sand barriers during the2005 dry season. In contrast, the sectors of Lampuuk and the golfcourse displayed more or less the same coastline in January and June2005. On the north coast of Banda Aceh, the destruction of the polders,lagoons and aquacultures resulted in an incredible coastal retreat(locally 900–1600m). The aerial photo of June 2005 and our surveys inAugust and December 2005 confirm that the northern districts ofBanda Aceh are systematically affected by inundations during thehighest tides. Further investigations will focus on the long-termimpact of the tsunami on coastal sediment transfers and recommen-dations for management in tsunami-resilient coasts.
6. Conclusions
The erosional imprints of the December 26, 2004 tsunami in LhokNga extend to 500 m from the shoreline and exceed 2 km along theriver beds. The mean erosion rate of the beaches is ~30 m3/m of coastand locally exceeds 80 m3/m, but more than 75% of the sedimentsdeposited inland came from offshore. The correlation between erosionrates and tsunami heights remains unclear. The most eroded coastswere tangent to the tsunami wave train, which came from thesouthwest. Furthermore, the morphology of the coast and the local

Fig. 13. Thickness of tsunami sand deposits in the northern part of the Lhok Nga Bay, inferred from field observations computed in a 100 m grid (UTM coordinates). The spatialdistribution of the deposits mostly depends on the topography, despite a landward thinning tendency. Note the breakage in sedimentation associated with a gentle slope break at 1–1.5 km from the coast (thicknessb5 cm). The thickest accumulations correspond to sediment traps (e.g. gullies, swamps, sea-walls).
71R. Paris et al. / Geomorphology 104 (2009) 59–72
topography (dams, cliffs, buildings) greatly influence the erosionalimpact of a tsunami. The fringing reefs were not efficient in reducingthe erosional impact of the tsunami.
The large tsunami waves (25–30 m high) were able to detach andtransport coral boulders in excess of 10 t over 500–700 m andmegaclasts of the platform in excess of 85 t over a few metres. Nolandward fining trend in the boulder size distribution could bedetected. The spatial and size distributions of tsunami boulderdeposits mostly depend on the location and characteristics of theirsource (coral reef, beach rock, platform, dams), together with clast andsurface interference during transport. More systematic investigationson historic and future tsunamis are needed to confirm that the spatialdistribution and position of the boulders provide useful informationabout the direction and transport mechanism of a tsunami. At present,the boulder fields do not appear as powerful indicators of themagnitude and hydrodynamic of a palaeo-tsunami. Nevertheless, thecoincidence of different size modes, from boulders to fine sandssuggests that all the material was not transported in suspension, butrather that there was a combination of bed load and suspendedtransport modes.
One year after the disaster, the coastal environment in northwestSumatra was still in a post-tsunami dynamic. The large tsunamis(N30 m) may have more long-term impact on coastal environmentsthan moderate tsunamis (heightb10 m). Thus, the recognition andstudy of past geomorphic crisis could help in assess the intensity ofpalaeo-tsunamis and present-day associated hazards.
Acknowledgements
Funding came from the Délégation Interministérielle pour l'aidePost-Tsunami (DIPT, project no. 161), the French Embassy in Indonesiaand the Centre National de la Recherche Scientifique (CNRS) in France.We would like to thank the Tsunarisk team, François Flohic, BenjaminDe Coster and Damien Le Floch (Planet Risk), Taufik Gunawan,Fachrizal, Iman and Syahnan (Indonesian Meteorological and Geo-physical Agency), Adi Widagdo, Rino Cahyadi, Anggri Setiawan, DjatiMardiatno, Mujiono and Syamsul (University Gadjah Mada) for theircollaboration on the field in August and December 2005. We are alsograteful to the CNES which provided Spot 5 images at a reasonablerate. Mehdi Adjeroud, Michel Le Pichon and Bernard Salvat provided
72 R. Paris et al. / Geomorphology 104 (2009) 59–72
useful comments about the coral boulders. Finally, we would like tothank F. Javier Gracia and Giuseppe Mastronuzzi for their encouragingand meticulous reviews.
References
Andrade, C., 1992. Tsunami generated forms in the Algarve barrier island (SouthPortugal). In: Dawson, A.G. (Ed.), European Geophysical Union 1992 TsunamiMeeting. Science of Tsunami Hazard, vol. 10, pp. 21–34.
Atwater, B.F., 1987. Evidence for great Holocene earthquakes along outer coast ofWashington State. Science 236, 942–944.
Bondevik, S., Svendsen, J.I., Mangerud, J., 1997. Tsunami sedimentary facies deposited bythe Storegga tsunami in shallow marine basins and coastal lakes, western Norway.Sedimentology 44, 1115–1131.
Bondevik, S., Mangerud, J., Dawson, S., Dawson, A., Lohne, O., 2005. Evidence for threeNorth Sea tsunamis at the Shetland Islands between 8000 and 1500 years ago.Quaternary Science Reviews 24, 1757–1775.
Bourgeois, J., Reinhart, M.A., 1993. Tsunami deposits from 1992 Nicaragua event:implications of paleo-tsunami deposits, Cascadia Subduction Zone. EOS, FallMeeting of the American Geophysical Union, Washington DC, p. 350.
Bourrouilh-Le Jan, F.G., Talandier, J., 1985. Major high-energy events in a reefenvironment: tsunamis, hurricanes and tropical cyclones and their effects on thesedimentology and geomorphology of an atoll: Rangiroa, Tuamotu (SE Pacific).Marine Geology 37, 263–272.
Bryant, E.A., Nott, J., 2001. Geological indicators of large tsunami in Australia. NaturalHazards 24 (3), 231–249.
Bryant, E.A., Young, R.W., Price, D.M., 1996. Tsunami as a major control on coastalevolution, Southeastern Australia. Journal of Coastal Research 12, 831–840.
Cantalamessa, G., Di Celma, C., 2005. Sedimentary features of tsunami backwashdeposits in a shallowmarine Miocene setting, Mejillones Peninsula, northern Chile.Sedimentary Geology 178, 259–273.
Cisternas, M., Atwater, B.F., Torrejon, F., Sawai, Y.,Machuca, G., Lagos,M., Eipert, A., Youlton,C., Salgado, I., Kamataki, T., Shishikura, M., Rajendran, P.R., Malik, J.K., Rizal, Y., Husni,M., 2005. Predecessors of the giant 1960 Chile earthquake. Nature 437, 404–407.
Dawson, A.G., 1994. Geomorphological effects of tsunami run-up and backwash.Geomorphology 10, 83–94.
Dawson, S., Smith, D.E., 2000. The sedimentology of Middle Holocene tsunami facies innorthern Sutherland, Scotland, UK. Marine Geology 170, 69–79.
Dawson, A.G., Hindson, R., Andrade, C., Freitas, C., Parish, R., Baternan, M., 1995. Tsunamisedimentation associated with the Lisbon earthquake of 1 November 1755: Boca doRio, Algarve, Portugal. The Holocene 5 (2), 209–215.
Dawson, A.G., Shi, S., Dawson, S., Takahashi, T., Shuto, N., 1996. Coastal sedimentationassociated with the June 2nd and 3rd, 1994 tsunami in Rajegwesi, Java. QuaternaryScience Reviews 15, 901–912.
Felton, E.A., Crook, K.A.W., 2003. Evaluating the impact of huge waves on rockyshorelines: an essay reviewof the book ‘Tsunami— The Underrated Hazard’. MarineGeology 197, 1–12.
Fujiwara, O., Masuda, F., Sakai, T., Irizuki, T., Fuse, K., 2000. Tsunami deposits in Holocenebay mud in southern Kanto region, Pacific coast of central Japan. SedimentaryGeology 135, 219–230.
Gelfenbaum, G., Jaffe, B., 2003. Erosion and sedimentation from the 17 July, 1998 PapuaNew Guinea tsunami. Pure and Applied Geophysics 160, 1969–1999.
Goff, J.R., Chagué-Goff, C., Nichol, S.L., 2001. Palaeotsunami deposits: a New Zealandperspective. Sedimentary Geology 143, 1–6.
Goff, J.R., McFadgen, B.G., Chagué-Goff, C., 2004. Sedimentary differences between the2002 Easter storm and the 15th-century Okoropunga tsunami, southeastern NorthIsland, New Zealand. Marine Geology 204, 235–250.
Goff, J.R., Dudley, W.C., deMaintenon, M.J., Cain, G., Coney, J.P., 2006. The largest localtsunami in 20th century Hawaii. Marine Geology 226, 65–79.
Harmelin-Vivien, M.L., Laboute, P., 1986. Catastrophic impact of atoll outer reef slopes inthe Tuamotu (French Polynesia). Coral Reefs 5, 55–62.
Hearty, P., 1997. Boulder deposits from large waves during the last interglaciation onnorth Eleuthera Island, Bahamas. Quaternary Research 48, 326–338.
Hearty, P., Neuman, A.C., Kaufman, D.S., 1998. Chevron ridges and runup deposits in theBahamas from storms late in oxygen-isotope substage 5e. Quaternary Research 50,309–322.
Hindson, R.A., Andrade, C., Dawson, A.G., 1996. Sedimentary processes associated withthe tsunami generated by the 1755 Lisbon earthquake on the Algarve coast,Portugal. Physics and Chemistry of the Earth 21 (12), 57–63.
Jaffe, B., Gelfenbaum, G., Rubin, D., Peters, R., Anima, R., Swensson, M., Olcese, D.,Bernales, L., Gomez, J., Riega, P., 2003. Identification and interpretation of tsunamideposits from the June 23, 2001 Peru tsunami. Proceedings of the InternationalConference on Coastal Sediments 2003, World Scientific Publishing Corp and EastMeets West Productions, Corpus Christi, TX, USA. 13 pp.
Kelletat, D., Schellmann, G., 2002. Tsunamis on Cyprus: field evidences and 14C-datingresults. Zeitschrift für Geomorphologie NF 46, 19–34.
Kelletat, D., Scheffers, A., Scheffers, S., 2004. Holocene tsunami deposits on the BahamanIslands of Long Island and Eleuthera. Zeitschrift für Geomorphologie 48, 519–540.
Lavigne, F., Paris, R., Wassmer, P., Gomez, C., Brunstein, D., Grancher, D., Vautier, F.,Sartohadi, J., Setiawan, A., Syahnan, Gunawan, T., Fachrizal, Waluyo, B., Mardiatno,D., Widagdo, A., Cahyadi, R., Lespinasse, N., Mahieu, L., 2006. Learning from a majordisaster (Banda Aceh, December 26th, 2004): a methodology to calibratesimulation codes for tsunami inundation models. Zeitschrift für Geomorphologie.Supplementband 146, 253–265.
Luque, L., Lario, J., Zazo, C., Goy, J.L., Dabrio, C.J., Silva, P.G., 2001. Tsunami deposits aspaleoseismic indicators: examples from the Spanish coast. Acta GeologicaHispanica 3–4, 197–211.
Maramai, A., Tinti, S., 1997. The 3 June 1994 Java tsunami: a post-event survey of thecoastal effects. Natural Hazards 15 (1), 31–49.
Mastronuzzi, G., Sansò, P., 2000. Boulders transport by catastrophic waves along theIonian coast of Apulia (southern Italy). Marine Geology 170, 93–103.
Mastronuzzi, G., Sansò, P., 2004. Large boulder accumulation by extreme waves alongthe Adriatic coast of southern Apulia (Italy). Quaternary International 120, 173–184.
McSaveney, M., Goff, J., Darby, D., Goldsmith, P., Barnett, A., Elliott, S., Nongkas, M., 2000.The 17th July 1998 tsunami, Sissano Lagoon, Papua New Guinea — evidence andinitial interpretation. Marine Geology 170, 81–92.
Minoura, K., Nakaya, S., 1991. Traces of tsunami deposits preserved in intertidallacustrine and marsh deposits: some examples from Northeast Japan. Journal ofGeology 99, 265–287.
Minoura, K., Imamura, F., Takahashi, T., Shuto, N., 1997. Sequence of sedimentationprocesses caused by the 1992 Flores tsunami: evidence from Babi Island. Geology25, 523–526.
Minoura, K., Imamura, F., Kuran, U., Nakamura, T., Papadopoulos, G.A., Takahashi, T.,Yalciner, A.C., 2000. Discovery of Minoan tsunami deposits. Geology 28, 59–62.
Moore, J.G., Moore, G.W., 1984. Deposit from a giant wave on the island of Lanai, Hawaii.Science 226, 1312–1315.
Moore, J.G., Bryan,W.B., Ludwig, K.R., 1994. Chaotic deposition by a giant wave, Molokai,Hawaii. Geological Society of America Bulletin 106, 962–967.
Nanayama, F., Shigeno, K., Satake, K., Shimokawa, K., Koitabashi, S., Miyasaka, S., Ishii,M., 2000. Sedimentary differences between the 1993 Hokkaido-nansei-oki tsunamiand the 1959 Miyakojima typhoon at Taisei, southwestern Hokkaido, northernJapan. Sedimentary Geology 135, 255–264.
NGDC (National Geophysical Data Center), 2006. Tsunami Event Database. NationalOceanic and Atmospheric Association (NOAA). http://www.ngdc.noaa.gov/seg/hazard/tsu_db.shtml.
Nishimura, Y., Miyaji, N., 1995. Tsunami deposits from the 1993 southwest Hokkaidoearthquake and the 1640 Hokkaido Komagatake eruption, Northern Japan. Pure andApplied Geophysics 144, 719–733.
Noormets, R., Felton, E.A., Crook, K.A.W., 2002. Sedimentology of rocky shorelines: 2 —Shoreline megaclasts on the north shore of Oahu, Hawaii — origins and history.Sedimentary Geology 150, 31–45.
Nott, J., 1997. Extremely high wave deposits inside the Great Barrier Reef, Australia:determining the cause—tsunami or tropical cyclone. Marine Geology 141, 193–207.
Nott, J., 2003. Waves, coastal boulders and the importance of the pre-transport setting.Earth and Planetary Science Letters 210, 269–276.
Nott, J., 2004. The tsunami hypothesis — comparisons of the field evidences against theeffects, on the Western Australian coast, of some of the most powerful storms onEarth. Marine Geology 208, 1–12.
Paris, R., Lavigne, F., Wassmer, P., Sartohadi, J., 2007. Coastal sedimentation associatedwith the December 26, 2004 in Lhok Nga, west Banda Aceh (Sumatra, Indonesia).Marine Geology 238, 93–106.
Pérez Torrado, F.J., Paris, R., Cabrera, M.C., Schneider, J.L., Wassmer, P., Carracedo, J.C.,Rodriguez Santana, A., Santana, F., 2006. The Agaete tsunami deposits (GranCanaria): evidence of tsunamis related to flank collapses in the Canary Islands.Marine Geology 227, 137–149.
Regnauld, H., Nichol, S.L., Goff, J.R., Fontugne, M., 2004. Maoris, middens and dune frontaccretion rate on the northeast coast of New Zealand: resilience of sedimentarysystem after a tsunami. Géomorphologie 1, 45–54.
Sato, H., Shimamoto, T., Tsutsumi, A., Kawamoto, E., 1995. Onshore tsunami depositscaused by the 1993 Southwest Hokkaido and 1983 Japan Sea earthquakes. Pure andApplied Geophysics 144, 693–717.
Scheffers, A., 2004. Tsunami imprints on the Leeward Netherlands Antilles (Aruba,Curaçao, Bonaire) and their relation to other coastal problems. QuaternaryInternational 120, 163–172.
Scheffers, A., Kelletat, D., 2003. Sedimentologic and geomorphologic tsunami imprintsworldwide — a review. Earth-Science Reviews 63, 83–92.
Shennan, I., Long, A.J., Rutherford,M.M., Green, F.M., Innes, J.B., Lloyd, J.M., Zong, Y.,Walker,K.J., 1996. Tidal marsh stratigraphy, sea-level change and large earthquakes, I: a500 years record in Washington, U.S.A. Quaternary Science Reviews 15, 1023–1059.
Shi, S., Dawson, A.G., Smith, D.E., 1995. Coastal sedimentation associated with theDecember 12th, 1992 tsunami in Flores, Indonesia. Pure and Applied Geophysics144, 525–536.
Shiki, T., Yamazaki, T., 1996. Tsunami-induced conglomerates in Miocene upper bathyaldeposits, Chita Peninsula, central Japan. Sedimentary Geology 104, 175–188.
Szczucinski, W., Niedzielski, P., Rachlewicz, G., Sobczynski, T., Ziolla, A., Kowalski, A.,Lorenc, S., Siepak, J., 2005. Contamination of tsunami deposits in a coastal zoneinundated by the 26 December 2004 tsunami in Thailand. Environmental Geology49, 321–331.
Takashimizu, Y., Masuda, F., 2000. Depositional facies and sedimentary successions ofearthquake-induced tsunami deposits in Upper Pleistocene incised valley-fills,central Japan. Sedimentary Geology 135, 231–239.
Tanner, L.H., Calvari, S., 2004. Unusual sedimentary deposits on the SE side of Strombolivolcano, Italy: products of a tsunami caused by the ca. 5000 BP Sciarra del Fuococollapse? Journal of Volcanology and Geothermal Research 137, 329–340.
Whelan, F., Kelletat, D., 2005. Boulder deposits on the southern Spanish Atlantic coast:possible evidence for the 1755 AD Lisbon tsunami? Science of Tsunami Hazards 23 (3),25–38.
Williams, H.F.L., Hutchinson, I., Nelson, A.R., 2005. Multiple sources for late-Holocenetsunamis at Discovery Bay, Washington State, USA. The Holocene 15, 60–73.
Copyright © 2022 FDOKUMEN