TRILATERAL ECONOMIC REPORT
84
TRILATERAL ECONOMIC REPORT The Economic Impacts of the Olympic Games 2017 2017 中日韩三国经济报告 / 2017 日中韓三国経済報告書 / 2017 한중일 3국 경제 보고서
-
Upload
khangminh22 -
Category
Documents
-
view
0 -
download
0
Transcript of TRILATERAL ECONOMIC REPORT
2017 TRILATERA
L ECON
OMIC REPO
RT
TRILATERALECONOMICREPORTThe Economic Impacts of the Olympic Games
2017
2017
中日
韩三
国经
济报
告 / 2
017 日
中韓
三国
経済
報告
書 / 2
017 한
중일
3국
경제
보고
서


TRILATERALECONOMIC
REPORT
2017
Trilateral Cooperation Secretariat

Statement
This report was outsourced to Mr. CHEN Jian, Vice President
of the China Society of Economic Reform and Director of
the Beijing-Zhangjiakou Winter Olympic Games Research
Institute for China; Professor SAITO Jun, Visiting Professor at
International Christian University and Senior Research Fellow
of the Japan Center for Economic Research for Japan; Dr. JOO
Won, Deputy Director of the Economic Research Department of
the Hyundai Research Institute, and Mr. OH Jun-beom, Senior
Researcher of the Hyundai Research Institute for ROK.
Due to differences in statistical standards among countries,
results may vary. Each author’s analysis may not necessarily
reflect the positions of the other authors.
The contents of this report (including policy recommendations)
do not necessarily reflect the positions of the Trilateral
Cooperation Secretariat.

Foreword
I am pleased to introduce the 2017 Trilateral Economic Report, which is an annual flagship
report of the Trilateral Cooperation Secretariat (TCS). With the aim of following up and gaining a
comprehensive understanding on the economic development and integration among China, Japan,
and the Republic of Korea (ROK), the 2017 Trilateral Economic Report was outsourced to four
prominent scholars of the three countries: Mr. CHEN Jian, Vice President of the China Society of
Economic Reform (CSER) and Director of the Beijing-Zhangjiakou Winter Olympic Games Research
Institute for China; Professor SAITO Jun, Visiting Professor at International Christian University
and Senior Research Fellow of the Japan Center for Economic Research for Japan; Dr. JOO Won,
Deputy Director of the Economic Research Department of the Hyundai Research Institute, and Mr.
OH Junbeom, Senior Researcher of the Hyundai Research Institute for ROK.
Since 1999, China, Japan, and ROK have made remarkable progress on trilateral economic
cooperation. I hope the 2017 Trilateral Economic Report will provide useful information to help
you better understand the economic development, Olympic economy, and trilateral cooperation
between the three countries.
LEE Jong-heon
Secretary-General
Trilateral Cooperation Secretariat
Table of Contents
Chapter I Economic Profile ....................................................................................................10I. Macroeconomic Performance of China, Japan, and ROK .......................................................................10
1. China (Mr. CHEN).................................................................................................................................10
2. Japan (Prof. SAITO) .............................................................................................................................11
3. ROK (Dr. JOO and Mr. OH)...................................................................................................................14
II. Economic Adjustment of China, Japan, and ROK ...................................................................................18
1. China (Mr. CHEN).................................................................................................................................18
2. Japan (Prof. SAITO) .............................................................................................................................19
3. ROK (Dr. JOO and Mr. OH)...................................................................................................................20
III. Economic Prospects for China, Japan, and ROK .....................................................................................21
1. China (Mr. CHEN).................................................................................................................................21
2. Japan (Prof. SAITO) .............................................................................................................................22
3. ROK (Dr. JOO and Mr. OH)...................................................................................................................23
Chapter II Trade (Mr. CHEN) ...................................................................................................26I. Trade in Goods.........................................................................................................................................26
1. Status and Development Trend of Goods Trade of China, Japan, and ROK ......................................26
2. Intra-regional trade..............................................................................................................................26
3. Prospects and Forecasts for CJK Trade...............................................................................................30
II. Trade in Service .......................................................................................................................................31
1.Service Trade within CJK .....................................................................................................................32
Chapter III Investment (Mr. CHEN) ........................................................................................34I. Inward FDIs of China, Japan and ROK ....................................................................................................34
1. China ....................................................................................................................................................34
2. Japan ...................................................................................................................................................34
3. ROK ......................................................................................................................................................35
II. Outward FDI of China, Japan and ROK ...................................................................................................36
1. China ....................................................................................................................................................36
2. Japan ...................................................................................................................................................36
3. ROK ......................................................................................................................................................37

Chapter IV FTA (Mr. CHEN) .....................................................................................................40I. Current Status of FTAs of China, Japan, and ROK ..................................................................................40
1. China ....................................................................................................................................................40
2. Japan ...................................................................................................................................................41
3. ROK ......................................................................................................................................................41
II. Economic Prospects of CJK FTA ..............................................................................................................41
III. CJK FTA and other Mega FTAs in the Asia-Pacific Region ....................................................................42
Chapter V Olympic Economy .................................................................................................44I. Economic Impact of the Previous Olympic Games ..................................................................................44
1. China (Mr. CHEN).................................................................................................................................44
2. Japan (Prof. SAITO) .............................................................................................................................45
3. ROK (Dr. JOO and Mr. OH)...................................................................................................................51
II. Economic Prospects of Future Olympic Games .......................................................................................52
1. China (Mr. CHEN).................................................................................................................................52
2. Japan (Prof. SAITO) .............................................................................................................................54
3. ROK (Dr. JOO and Mr. OH)...................................................................................................................59
Chapter VI Policy Recommendations ..................................................................................64I. China (Mr. CHEN).....................................................................................................................................64
1. Macro-economy ...................................................................................................................................64
2. Olympic Economy.................................................................................................................................65
II. Japan (Prof. SAITO) .................................................................................................................................67
1. Macro-economy ...................................................................................................................................67
2. Olympic Economy.................................................................................................................................68
III. ROK (Dr. JOO and Mr. OH).......................................................................................................................71
1. Macro-economy ...................................................................................................................................71
2. Olympic Economy.................................................................................................................................73
List of Tables and Figures
TablesTable II-1 Statistics on China–Japan–ROK economic and trade relations 29Table III-1 Investment between Japan and ROK 38Table V-1 Impact of hosting the Olympics on Beijing’s GDP Growth 45Table V-2 Direct and indirect costs of the Olympic Games 46Table V-3 2022 Winter Olympics venue investment details 53Table V-4 Direct and indirect costs of future Olympic Games 55
FiguresFigure I-1 September 2017, investment, industrial added value,
and retail consumption recovered significantly10
Figure I-2 Q4 GDP growth is still strong 11Figure I-3 Monetary policy indicators 12Figure I-4 Consumer price index 12Figure I-5 Budget allocation for public works 13Figure I-6 Real GDP growth rate 13Figure I-7 Labor market indicators 14Figure I-8 Real GDP growth (year on year and quarter on quarter) 15Figure I-9 Coincident and leading indicator 15Figure I-10 Retail sales growth by product 15Figure I-11 Amount and volume of the imported consumer goods growth 15Figure I-12 Facilities investment growth 16Figure I-13 Domestic machinery order and capital goods import growth 16Figure I-14 Construction establishment growth 16Figure I-15 Construction order growth 16Figure I-16 Export growth 17Figure I-17 Export growth by region 17Figure I-18 Unemployment and employment rate 17Figure I-19 Increase/decrease of employees by major industries 17Figure I-20 Producer and import inflation 18Figure I-21 Core and living inflation 18Figure I-22 Potential GDP growth rate 20Figure I-23 Confidence index charts of China’s economists 21Figure I-24 Wages per worker 22Figure II-1 2007–2014 total amount and growth of China’s service imports and exports 31Figure III-1 ROK FDI status 35Figure III-2 Industry ratio in ROK's investment in China, 2016 38Figure V-1 Investment in Tokyo (FY1956–FY1966) 47Figure V-2 Investment in Hokkaido (FY1964–FY1974) 49Figure V-3 Investment in Nagano (FY1989–FY1999) 50Figure VI-1 Projection of old-age dependency ratio 70Figure VI-2 Projection of population 71

Abbreviations
ABMI Asian Bond Markets InitiativeAMRO ASEAN+3 Macroeconomic Research OfficeAPEC Asia–Pacific Economic CooperationASEAN Association of South-East Asian NationsCJK China, Japan, and Republic of KoreaCMIM Chiang Mai Initiative MultilateralizationCNY Chinese yuanCPI Consumer price indexDTI Debt to incomeEPA Economic Partnership AgreementEU European UnionFDI Foreign direct investmentFTA Free trade area/free trade agreementFTAAP Free Trade Area of Asia-PacificFY Fiscal yearGATT General Agreement on Tariffs and TradeGCC Gulf Cooperation CouncilGDP Gross domestic productICT Information and communication technologyIoT Internet of thingsIPC International Paralympic CommitteeI&S industry Ice and snow industryIMF International Monetary FundIOC International Olympic CommitteeIP Intellectual propertyJETRO Japan External Trade OrganizationJOC Japanese Olympic CommitteeJPY Japanese yenKRW Korean wonLTV Loan to valueMC industry Materials and components industryMERCOSUR Southern Common MarketNCCPC National Congress of the Communist Party of ChinaNTCT Network of Trilateral Cooperation Think-TanksOECD Organization for Economic Co-operation and DevelopmentQQE Quantitative and Qualitative Monetary EasingRCEP Regional Comprehensive Economic PartnershipRMB RenminbiROK Republic of KoreaSOC Social overhead capitalSMEs Small and medium-sized enterprisesTCS Trilateral Cooperation SecretariatTPP Trans-Pacific PartnershipUS United StatesUSD US dollarWTO World Trade OrganizationYOY Year over year/year on year

Executive Summary
The year 2017 marks the 45th anniversary of the normalization of diplomatic relations between China and Japan,
and bilateral political relations are being promoted and improved. In November, China–ROK relations found a
breakthrough in the conflicts over THAAD, providing an opportunity to improve bilateral relations. The recovery of the
US economy has directly contributed to the recovery of the world economy. The external environment is getting better
and becoming more conducive to the improvement of economic and trade cooperation between China, Japan, and
ROK, and further progress is possible.
The 19th National Congress of the Communist Party of China (NCCPC) has led to a sustained development of the
national economy. The supply-side structural reform of China’s economy is being promoted. The current high-
speed growth of about 6.7% will likely be maintained. For Japan’s economy, the basic pattern of relying on external
demand has not changed. Weak domestic demand and an aging and shrinking population have been the main factors
restricting Japan’s economic recovery. However, the export growth brought about by the global economic recovery
will provide support to the Japanese economy. The International Monetary Fund (IMF) predicted that Japan’s real
growth rate in 2017 would be 1.5%. ROK’s economy is also clearly export-oriented. Since September 2017, ROK’s
exports to developed and emerging markets have both increased. Of the 13 major export categories, 10 categories,
including steel and petrochemicals, have achieved double-digit growth. Its annual growth is sure to reach the
predicted 3%.
The economic and trade cooperation between China, Japan, and ROK (CJK) is of great significance to all three
countries. This cooperation is the stabilizer of inter-country relations. The gradual improvement of the relations
between the three countries has also positively influenced the bilateral economic and trade relations, created the
conditions for the establishment of a China–Japan–ROK Free Trade Area (FTA), and restored the confidence of
Japanese and ROK businesses in China’s market. In January 2017, for example, CJK FTA started the third round of
tax cuts. China and ROK enjoy strong economic complementarity and great potential for development. According to
Chinese statistics, from January to September 2017, the trade volume between China and ROK reached 202.2 billion
USD, an increase of 11.4% YoY. The cooperation among China, Japan, and ROK has vast room for development.
Concerning China and Japan, for example, Japan has extensive experience and technological advantages in the
control of air and environmental pollution; China, as a country with a rapidly aging population, can learn from Japan’s
rich experience in meeting this challenge. The cooperation between China and Japan in these fields should easily
achieve win–win results.
In the next four years, from February 2018 to February 2022, all three countries will host the Olympic Games. Japan’s
Sapporo intends to apply for the 2026 Winter Olympics and is likely to become the first city in Japan to host the
Olympic Winter Games twice. Hosting the Olympic Games has played a very positive role in expanding consumer
spending and investment, thus fostering economic growth. This provides room for platform cooperation for economic
and trade exchanges between the three countries. Whether in Olympic-related industries, experience-sharing,
urban infrastructure, information and communication technology (ICT), or the promotion of tourism among the three
countries, we can find room for cooperation in and around the great events of the Olympic Games.
CHEN Jian
November 7, 2017

09
Chapter I
Economic Profile

10
Chapter I Economic Profile
I. Macroeconomic Performance of China, Japan, and ROK
1. China (Mr. CHEN)
In 2016, China’s gross domestic product (GDP) increased 6.7% over the previous year (YoY) as calculated
using comparable prices. The first three quarters saw a 6.7% increase YoY, and Q4 saw 6.8% growth YoY.
Annual investment in fixed assets grew by 8.1% YoY, a drop of 0.1% over the previous three quarters. The
total retail sales of consumer goods had a nominal increase of 10.4% YoY, and the growth rate remained flat
as compared to the first three quarters.
In the first three quarters of 2017, China’s economy maintained a growth rate of 6.8%. Investment in fixed
assets was still an important driver. The growth rate of monthly fixed asset investment rebounded sharply
from 3.8% in August to 6.9% in September. The growth rate of industrial added value increased significantly
from 6.0% in August to 6.6% in September. In September, total retail sales increased slightly, reaching
10.3% YoY, continuing its double-digit growth and indicating that consumer spending remains the stabilizer
of economic growth.
Figure I-1 September 2017, investment, industrial added value, and retail consumption recovered significantly, % monthly YoY
Data source: Institute of Economic Policy, Peking University Notes: Green line- fixed asset investment; red line- industrial added value; yellow line- retail sales.
Foreign demand may slow moderately in Q4 due to the strong Renminbi (RMB) exchange rate. Domestic
manufacturing investment is expected to maintain relatively strong growth. Infrastructure investment will
maintain medium to high growth. Towards the end of the year, the growth rate of retail sales is expected to
increase to over 10.5%.

TRIL ATERAL ECONOMIC REPORT
2 0 1 7
11
Chapter I Economic Profile
Figure I-2 Q4 GDP growth is still strong (quarter %)
Data source: Institute of Economic Policy, Peking University
China’s National Bureau of Statistics released September’s real economy and third-quarter GDP figures. GDP
growth slowed slightly to 6.8 % in the third quarter but remained high, consistent with expectations and
significantly surpassing annual growth targets, showing that China’s economic growth momentum remains strong.
2. Japan (Prof. SAITO)
Japan was deeply affected by the global financial and economic crisis that broke out in 2008. Real GDP fell
by more than that in the United States (US), where the crisis originated.
Recovery from the crisis was also slow. Both private consumption and business investment showed only
modest growth. Exports were depressed by the slow recovery in foreign markets and the negative impact
from the appreciation of the Japanese yen (JPY). Fiscal stimulus packages were introduced but were able to
bring only a modest recovery to the Japanese economy.
The slow recovery also faced periodic external shocks, which exerted a negative influence on growth. The
European sovereign debt crisis that broke out in 2010 affected the Japanese economy through trade, stock
market volatility, and exchange rate fluctuations. The Great East-Japan earthquake in 2011 destroyed the
Tohoku area and also damaged Japanese industries in other areas because of its impact on the electricity
supply and the link with Tohoku through supply chains.
As a result, the negative output gap remained large and continued to provide significant downward pressure
on prices. Deflation had returned to Japan by the end of 2009.
Abenomics came into play in late 2012. Its main purpose was to contain deflation and achieve sustained
economic growth. To that end, a set of polices, the “three arrows,” was introduced. It consisted of bold
monetary policy (the first arrow), flexible fiscal policy (the second arrow), and a growth strategy to promote
investment (the third arrow).
In the area of monetary policy, inflation targeting was introduced in January 2013, followed by the
introduction of an unconventional monetary policy framework called “quantitative and qualitative monetary
easing” (QQE). The significance of QQE was its change of operational target from the uncollateralized
overnight call rate to the monetary base and the commitment to double the monetary base within two years
in order to achieve consumer price index (CPI) inflation of 2% within two years (see Figure I-3).

12
Figure I-3 Monetary Policy Indicators
Data Source: Bank of Japan
These actions helped improve households’ and firms’ expectations. It led to a correction of the overvalued
exchange rate, a steady rise in stock prices, and a gradual increase in private consumption. Reflecting these
positive developments, inflation started to rise, and, by early 2014, the YoY rate of CPI had reached as high
as 1.5% (see Figure I-4).
Figure I-4 Consumer Price Index
Data source: Ministry of Internal Affairs and Communications of Japan
However, the negative shock of a consumption tax rate hike in April 2014 and a decline in oil prices led to
a moderation of the inflation rate to almost zero in 2015. The widening of the gap between the target and
actual inflation rate was addressed by the Bank of Japan through a series of new initiatives: the expansion
of the QQE (October 2014), the introduction of QQE with a negative interest rate (January 2016), and the
introduction of QQE with yield curve control (September 2016).
During this period, fiscal policy was less restrictive than before. It was intended to support the economy
until the impact of the monetary policy started to show. The initial budgetary allocation for public works
programs, for instance, which had been cut since the early 2000s, was reversed after 2012 (see Figure I-5).
With additional appropriation made through supplementary budgets, public investment made a positive
contribution to GDP growth, particularly in the early years of Abenomics.

TRIL ATERAL ECONOMIC REPORT
2 0 1 7
13
Chapter I Economic Profile
Figure I-5 Budget Allocation for Public Works
Data source: Ministry of Finance of Japan
To avoid the negative impact on the economy that it may have had, the government postponed the
consumption tax rate hike from 8% to 10% twice; it is now planned for October 2019.
The active use of fiscal policy, however, had an adverse effect on the fiscal situation, which already required
close attention. The government had committed itself to a medium-term fiscal consolidation strategy with a target
of achieving a primary surplus by fiscal year (FY) 2020 and lowering the government debt to GDP ratio steadily
thereafter. However, the government’s own projection for the medium-term fiscal situation showed that, without
additional policy initiatives, the primary balance would not improve or meet the target by FY2020.
As a result of the active macroeconomic policies and a steady recovery in the global economy, the real GDP
growth rate has been positive since the first quarter of 2016.
The real GDP growth rate in the third quarter of 2017 was 0.6%, or 2.5% in annualized terms (see Figure I-6).
With the GDP deflator also showing an increase, the seasonally adjusted nominal GDP in annualized terms
reached a record high of 549.2 trillion JPY in the quarter.
Figure I-6 Real GDP growth rate
Data source: Cabinet Office of Japan

14
During this period, the main positive contribution came from an increase in net exports, supported by a
steady recovery of the global economy. However, private demand, such as private consumption and business
investment, has shown an increase that also supported growth. This shows that improvement is gradually
being felt in wider areas of the economy.
Reflecting the sustained growth of the economy, the negative output gap, which had widened in 2014
and 2015, steadily narrowed during the period, and has even turned positive since early 2017. In the labor
market, this corresponded to a tightening of the labor market. The job offers-to-applicants ratio has risen to a
record high, and the unemployment rate has fallen to below 3% (see Figure I-7). Since the 3% unemployment
rate roughly corresponds to the structural unemployment rate, the labor market can be judged as being
significantly tight.
Figure I-7 Labor market indicators
Data source: Ministry of Internal Affairs and Communication, and Ministry of Health, Labor and Welfare of Japan
3. ROK (Dr. JOO and Mr. OH)
The Republic of Korea (ROK) has been continuing its unstable economic growth in 2017. The economic
growth rate (quarter-on-quarter percentage change) in the second quarter of 2017 was 0.6% (2.7% YoY
percentage change), 0.5%p (percentage point) lower than 1.1% in the first quarter. The export growth in
the second quarter was -2.9%, and construction investment growth slowed to 0.3% from 6.8% in the first
quarter. Both sectors were leading to a decline in economic growth. However, one positive sign was that the
private consumption growth, which accounts for about half of GDP in ROK, improved from 0.4% in the first
quarter to 1.0% (see Figure I-8).
The coincident indicator, which shows the current economic situation, has been on a downward trend after
peaking in April 2017. On the other hand, the leading indicator, which predicts the direction of the economy,
has been on an upward trend, and it is expected to improve the economy (see Figure I-9).

TRIL ATERAL ECONOMIC REPORT
2 0 1 7
15
Chapter I Economic Profile
Figure I-8 Real GDP growth (year on year and quarter on quarter)
Figure I-9 Coincident and leading indicator
Data source: Bank of Korea Data source: Statistics Korea
Recently, private consumption has been improving gradually. In particular, the increase in the consumption
of durable goods, which can be regarded as a leading indicator of consumption, has been a positive sign (see
Figure I-10). However, although the value of consumer goods imports has continued to increase recently,
the volume of consumer goods imports has been on the decline (see Figure I-11). Therefore, the recovery of
private consumption is facing difficulty.
Figure I-10 Retail sales growth by product Figure I-11 Amount and volume of the imported consumer goods growth
Amount of consumer goods
Data source: Statistics Korea Data source: Korea Customs Service Note: Six-month moving average
Facilities investment has been recovering in 2017 due to growing demand for more investment due to
increased market demand (see Figure I-12). Facilities investment improvement is being helped by the fact
that domestic machinery orders and capital goods import growth, which are leading indicators of facilities
investment, are continuing to rise (see Figure I-13). However, the fact that it is showing a decline from the
previous quarter makes it likely that the surging facilities investment growth may change (see Figure I-12).

16
Figure I-12 Facilities investment growth Figure I-13 Domestic machinery order and capital goods import growth
Data source: Statistics Korea Data source: Statistics Korea, Ministry of Trade, Industry and Energy Note: Domestic machinery orders growth was driven by three-month moving average
Construction investment has been on the rise in the private sector, but the public sector is sluggish
(Figure I-14); this is because the real estate market has been booming since 2014, which is attributable
to the expansion of housing demand due to the alleviation of loan to value (LTV) and debt to income (DTI).
The public sector situation is not mainly due to a reduction in the social overhead capital (SOC) budget.
Construction orders, a leading indicator of construction investment, fell sharply in both the private and public
sectors, implying that the construction market is likely to weaken (see Figure I-15).
Figure I-14 Construction establishment growth Figure I-15 Construction order growth
Data source: Statistics Korea Data source: Statistics Korea
Exports have been recovering the fastest among domestic demand. By August 2017, exports had been on the
rise for 10 consecutive months since November 2016 and enjoyed double-digit growth for the eighth month
(see Figure I-16). In particular, export volume, which has been sluggish in recent years, has been steadily
increasing due to the recent recovery of the global economy. Exports to China, which account for about 25%
of ROK’s exports, continued to grow weakly but recorded double-digit growth in August 2017. Meanwhile,
exports to major export markets such as the European Union (EU) and Association of South-East Asian
Nations (ASEAN) were on the rise in 2017 (see Figure I-17).

TRIL ATERAL ECONOMIC REPORT
2 0 1 7
17
Chapter I Economic Profile
Figure I-16 Export growth Figure I-17 Export growth by region
Data source: Korea Customs Service, Ministry of Trade, Industry and Energy
Data source: Ministry of Trade, Industry and Energy
The employment sector has been experiencing difficulties even though the economy has been improving.
In August 2017, the unemployment rate was similar to that of the previous year, but the number of
new employees decreased to 200,000, mainly due to the decrease in new employees in the service and
construction industries (see Figures I-18 and I-19). In 2016, the number of new employees in ROK surpassed
300,000, but there is concern that it will stay at the 200,000 level in 2017.
Figure I-18 Unemployment and employment rates
Figure I-19 Increase/decrease of employees in major industries
Data source: Statistics Korea Data source: Statistics Korea
Although headline inflation has not been a deflationary concern in the third quarter of 2017, the sharp
increase in the prices of necessities of life has been a major cause of a deterioration in economic sentiment.
Import and producers’ prices, which have been high since the fourth quarter of 2016, have slightly declined
due to the adjustment of commodity prices and the base effect (see Figure I-20). On the other hand, headline
inflation was high due to supply-side factors such as the climatic factor and the egg crisis. The prices of
necessities have been surging since the first quarter of 2017 (see Figure I-21).

18
Figure I-20 Producer and import inflation Figure I-21 Core and living inflation
Data source: Bank of Korea Data source: Statistics Korea
II. Economic Adjustment of China, Japan, and ROK
1. China (Mr. CHEN)
In 2017, the basic trend of China’s macroeconomic policy is to stick to a base tone of seeking advancement
in stability, placing risk prevention in an important position, and striving to make progress in supply-side
structural reform, state-owned enterprise reform, and fiscal/tax/financial sector reforms.
(i) Continue to implement proactive fiscal policy and prudent monetary policy
Fiscal policy should be more proactive and effective. In 2017, the deficit is projected to be 3%, with a
fiscal deficit of 2.38 trillion Chinese yuan (CNY), an increase of 200 billion CNY over last year. The year will
witness a reduction in the corporate tax burden of about 350 billion CNY and a reduction in corporate fees
of about 200 billion CNY. Monetary policy should remain steady and neutral. The scales of both the broad
money M2 and total social financing in 2017 are expected to grow by about 12%.
(ii) Continue to promote supply-side structural reforms
Supply-side structural reforms include the following basic elements. (1) Cutting overcapacity: in 2017 steel
and iron production capacity will be reduced by 50 million tons; coal production capacity will be cut by at
least 150 million tons, and overcapacity cutting will be expanded to fields like shipbuilding, nonferrous
metals, building materials, and other industries. (2) Cutting inventory: to accelerate the establishment
and perfection of the long-term mechanism that promotes a steady and healthy development of the real
estate market; to let the market play the dominant role in meeting multi-level demands while letting the
government dominate in meeting the basic demands. (3) De-leveraging: It will be a top priority to lower the
leverage ratio of enterprises, to help enterprises mobilize existing assets, and promote asset securitization. (4)
Reducing costs: to extend the scope of small and micro enterprises that enjoy preferential half-rate income
tax; to comprehensively clean up and standardize government funds, to reduce government-priced for-
profit fees and charges to enterprises, and continue to lower the proportion of the “five insurances and one

TRIL ATERAL ECONOMIC REPORT
2 0 1 7
19
Chapter I Economic Profile
fund” contribution. (5) Improving weak links: to accelerate the upgrading of support capabilities, including
public services, infrastructure, innovation and development, resources, and the environment. This year, the
rural poor population will be reduced by at least 10 million, and 3.4 million people will be relocated to help
alleviate poverty.
(iii) To deepen reform in key areas
China will continue to push forward the transformation of government functions, to expand pilot programs
for the negative listing of market access, to reduce the government’s discretion, and increase the market’s
right to choose. China will deepen the reform of mixed ownership and take substantive steps in areas such
as electricity, petroleum, natural gas, railways, civil aviation, telecommunications, and the military industry.
(iv) To further release the potential of demand
To promote the steady growth of consumption and to help the private sector provide education, elderly care,
medical care, and other services. To promote the new urbanization in a pragmatic manner and settle more
than 13 million people in cities in 2017.
2. Japan (Prof. SAITO)
A necessary condition for the achievement of fiscal consolidation is higher and sustained growth. Structural
policies designed to raise the potential GDP growth rate are essential.
In terms of structural polices, recent initiatives include raising the labor force participation rate of females
and the elderly; shortening working hours; promoting equal pay for equal work; reducing the corporate tax
rate; introducing corporate governance and stewardship codes; increasing Free Trade Agreements (FTA) and
promoting inward foreign direct investment (FDI); reforming agricultural cooperatives; liberalizing electricity
and city gas retail markets; and introducing national strategic special zones.
The impacts of the structural policies are gradually being felt. The potential GDP growth rate recovered to 1%
by mid-2017, mainly due to the recovery of labor and capital inputs; both are now contributing positively to
the potential growth rate (see Figure I-22).

20
Figure I-22 Potential GDP growth rate
Data source: Cabinet Office of Japan
The tightening of the labor market has been partially alleviated by the rise in the labor force participation
rate of females, particularly in their 30s and 40s. It also contributed in improving the low participation that
led to the M-shaped labor participation rate curve for Japanese females. What is most promising is that this
has been accompanied by a recovery of the fertility rate, which was 1.44 in 2016. This is still far away from
the 2.1 that we need in order to stabilize the population in the long term, but it does show that the work–life
balance is gradually making progress.
3. ROK (Dr. JOO and Mr. OH)
The new government, launched in 2017, has been implementing a new economic strategy called “income-
led growth.” The vision of the economic sector is the construction of a growing economy with the creation
of new jobs, economic growth engines, and balanced regional development. The main economic pledges are
described below.
Regarding growth, the government emphasized the establishment of a growth foundation based on the
expansion of jobs and income, an escape from low growth through the fostering of potential and core
industries, and social integration and welfare equality.
Regarding industry, the government accentuated the preparation of the “Fourth Industrial Revolution” in order
to secure future growth engines and a leap into a strong economy by strengthening the competitiveness of
the manufacturing industry and the main industry.
For the commercial trade sector, the government announced policies designed to enhance export
competitiveness through the advancement of the export structure, the promotion of Korean-style hidden
championships for Small and medium-sized enterprises (SMEs), and the strengthening of trade organizational
capabilities.
For the employment sector, the government introduced comprehensive labor market measures such as
expanding jobs in the public sector, new job creation through job sharing, and improvement of job quality by
shortening working hours, and improving minimum wage and the labor market structure.

TRIL ATERAL ECONOMIC REPORT
2 0 1 7
21
Chapter I Economic Profile
For the corporate sector, the government announced a policy of “chaebol” reform, which emphasized
a loosening of economic concentration, the improvement of corporate governance, and an increase of
corporate taxes. Policies for solving the problem of polarization and inequality were also included to
strengthen the competitiveness of SMEs and protect small business owners and the self-employed.
III. Economic Prospects for China, Japan, and ROK
1. China (Mr. CHEN)
In September 2017, a confidence survey of the top 100 economists in China showed that, in Q3 2017, the
economist confidence index was 106.4 (on a range from 0 to 200), up 10.9 points from the previous quarter (see
Figure I-23).
Figure I-23 Confidence index chart for China’s economists
Trend of China Economist Confidence
Figure I-23 Confidence index chart for China’s economists
2014 Q1 to 2017 Q3
Data source: National Statistics Bureau; Charting: Zongwen Yu
With the successful convening of the 19th National Congress of the Communist Party of China (NCCPC),
China’s economic growth has entered a new cycle. It is estimated that GDP growth in Q4 2015 and FY2017
will remain around 6.8%. This will be the first time since 2009 that economic growth over the entire year has
been higher than that of the previous year, which changes the momentum of economic slowdown which has
been ongoing for years. Strong foreign demand, robust domestic investment and consumer demand, as well
as accurate and timely policy support will maintain China’s economic growth.

22
2. Japan (Prof. SAITO)
The consensus forecast expects that the real GDP growth rate, which was 1.2% in FY2016, will be 1.6% in
FY2017, and 1.2% in FY2018.1) Growth will be supported by a steady increase in private demand.
The price prospects will depend on how wages develop. Despite the tight labor market situation, average
wages have showed only a modest increase (see Figure I-24). The weak average wages have failed to
provide an upward pressure on prices. Unless wages start to rise more strongly, inflation will not reach the
target rate of 2%.
Figure I-24 Wages per worker
Data source: Ministry of Health, Labor and Welfare of Japan
However, the average wage masks the difference between regular and non-regular workers. The job-offers-
to-applicant ratio is much higher for part-time workers, a significant portion of non-regular workers that now
accounts for about 40% of total workers. Hence, hourly earnings are rising quickly for part-time workers. By
contrast, the job offers-to-applicants ratio for regular workers (about 60% of total workers) is lagging behind that
for the non-regular workers. Therefore, wage increases for new entrants to regular workers have stayed relatively
low. In addition, the wages of already employed regular workers are facing downward pressure, as can be seen
in the flattening of the wage profile, because their wages have been determined under the seniority-based wage
system, which meant that the wages of the senior workers had been set higher than their productivity.
Unless a negative external shock shakes the Japanese economy, the tightening of the labor market will
eventually lead to an increase in wages and a higher inflation rate. However, due to the downward pressure
on wages, the average wage increase and inflation rate are expected to stay modest.
Looking to the medium- to long-term, whether stronger real growth is possible or not depends on the performance
of the potential growth rate, which depends in turn on the implementation of the important reforms. The crucial
tasks are reforming the outdated economic system to match the recent underlying conditions, accelerating inward
globalization, and coping with the negative impact coming from an aging and shrinking population.
1) The consensus forecast is taken from the Japan Center for Economic Research, ESP Forecast: Monthly Survey of Professional Forecasters in Japan, November 2017.

TRIL ATERAL ECONOMIC REPORT
2 0 1 7
23
Chapter I Economic Profile
3. ROK (Dr. JOO and Mr. OH)
The ROK’s economic growth rate in 2018 is expected to be lower than the growth rate in 2017.2) Despite the
improvement in external conditions, the domestic economy is expected to show a mid-2% economic growth
rate, mainly due to the downside risks of construction investment.
Private consumption in 2018 is expected to improve slightly over 2017. Improving consumer sentiment and
the government’s income-led policies will help improve private consumption, but several factors will limit
consumption growth, such as an increase in household debt and a reduction of asset effects due to the
cooling of the real estate market.
Construction investment growth is expected to fall sharply. The construction business cycle is expected
to enter a downward phase due to a decrease in the orders, permits, and launches of new buildings.
Government policies such as for stabilizing the real estate market, reducing the SOC budget, and the
possibility of raising the policy rate of the Bank of Korea may restrict new construction demand.
Facilities investment growth is expected to slow slightly. Facilities investment will continue to expand as the
global economy improves and the ROK’s exports continue to grow, but the base effect may be restricted the
high growth of facilities investment.
On the other hand, exports will be positively influenced by global demand growth due to the recovery of
the global economy and expected increases in oil prices. However, export growth will slow slightly in 2018
due to uncertainties such as monetary tightening in the advanced economies in the US and Europe and a
deterioration of trade with China.
2) Hyundai research institute forecast. In the International Monetary Fund (IMF)’s economic outlook, the ROK’s economy will grow at 3% in 2018, which was the forecasted growth rate for 2017.

24

25
Chapter II
Trade (Mr. CHEN)

Chapter II Trade (Mr. CHEN)
I. Trade in Goods
1. Status and Development Trend of Goods Trade of China, Japan, and ROK
World Trade Organization (WTO) statistics indicate that, in 2016, the world’s merchandise trade exports
totaled 15.46 trillion US dollars (USD). Of these, the total value of US imports and exports reached 3.7
trillion USD and China’s reached 3.68 trillion USD, ranking second. In 2016, China exported 2.1 trillion USD,
accounting for 13.2% of the world’s total, and China imported 1.6 trillion USD. Although China ranks second
in terms of total trade volume, China maintained its status as the world’s largest goods-exporting country
and the second-largest goods importing country eight years in a row.
As the share of China’s trade volume has risen, the trade volume share of China-Japan-ROK (CJK) of total
world trade has been rising over the past 20 years. By the end of 2016, the goods export volume of the three
countries accounted for more than 20.3% of the world total.
In 2016, Japan’s exports were 0.62 trillion USD, accounting for 4.04% of the world total, making it the
fourth-largest exporter of goods. In 2016, ROK’s exports were 0.49 trillion USD, accounting for 3.11% of the
world total and ranking it the seventh-largest goods exporter.
2. Intra-regional trade
Since China acceded to the WTO in 2001, it has continuously increased its openness to the outside world,
and bilateral trade between China and Japan/ROK has entered a stage of rapid development.
(i) China–Japan trade
In 2016, bilateral import and export of goods between Japan and China amounted to 270.5 billion USD, up 0.2%.
Of this, Japan’s exports to China totaled 113.89 billion USD, up 4.3%, accounting for 17.7% of Japan’s total
exports, up 0.2%; Japan’s imports from China reached 156.61 billion USD, down 2.5%, accounting for 25.8% of
Japan’s total imports, up 1.0%. Japan’s trade deficit with China was 42.71 billion USD, down 16.9%.
In 2017, from January to August, Sino–Japan trade amounted to 192.17 billion USD, up 10.1% YoY, of which
China’s exports to Japan totaled 87.54 billion USD, up 5.4% YoY.
(ii) China–ROK trade
When diplomatic relations were established between China and ROK in 1992, the trade volume between
the two countries was less than 6.37 billion USD (about 42.74 billion CNY). Since then, the trade volume
between the two countries has had an average annual increase of 15.7% and reached 211.4 billion USD by
2016, 33-fold the rate in 1992. In 2003, China overtook the US and become ROK’s largest export market, and
ROK has also become one of China’s four major export markets.
In 2016, China was ROK’s primary export destination, accounting for 124.43 billion USD, or 25.1% of ROK’s total
exports, down 9.3% YoY. In 2016, China was also ROK’s primary import source country, representing 86.96 billion
USD, or 21.4% of ROK’s total imports, down 3.6% YoY. ROK’s trade surplus with China was 37.47 billion USD.
26

According to data released by the WTO on September 19, 2017, the total volume of ROK exports for the
January–July period of 2017 was up by 16.3% YoY, reaching 328 billion USD. The growth rate of its exports
was the highest among the top 10 exporters in the world and was twice that of China. According to an
analysis by ROK’s Ministry of Trade, Industry, and Energy, the main factors in the increase of ROK exports
are the global economic recovery, the rise in the unit prices of major export products, and the increase in
added value of the export products.
(iii) Japan–ROK trade
In 2015, ROK’s exports to Japan reached 25.6 billion USD, down 20.5% YoY. ROK’s exports to Japan make
up only 4.9% of ROK’s total exports. This is the first time since 1969 that this share has fallen below 5%.
After 2011, the share of ROK’s exports to Japan out of total Korean exports showed a downward trend for
four consecutive years, mainly due to the continuous expansion of ROK’s exports to China and the continued
weakening of the JPY.
(iv) The structure of CJK trilateral trade
The two countries are very similar in terms of resource endowment and technical level, and there is a large
amount of intra-industry trade between them. The level of intra-industry trade among China, ROK, and Japan
forms a ladder-like distribution. The scale of intra-industry trade between Japan and ROK, as measured by
the intra-industry trade index, is as high as 87.35; meanwhile, it is 66.23 for trade between China and ROK.
At 61.66, that of China–Japan intra-industry trade is the lowest.
In terms of trade structure, there have been great similarities between Japan and ROK, who have since
2015 been in the list of the top ten nations by bilateral trade volume. This trade involves mechanical
equipment and parts, motors, electrical equipment, recorders and reproducers, television images, sound
recording equipment and spare parts, optical, photographic, medical equipment, and accessories (e.g., steel,
organic chemicals, and plastic and its products). The difference is that Japanese exports to ROK comprise
miscellaneous chemicals, vehicles, and accessories, while ROK exports to Japan comprise mineral fuels,
mineral oils and products, fish and shellfish, and steel products.
The materials and components (MC) industry can be categorized into common basic materials and high-tech
materials, including components made of these two types of materials. The high-tech part of the industry
(which has great added value) decides the competitiveness of the MC industry. High-tech MC that contain
“core technologies” constitute the most profitable part, and have become increasingly important in the world
industrial chain.
The MC industry is the primary reason for the Korean trade deficit with Japan. This stems from differences in the
quality of Japanese and Korean MC industry products. Generally speaking, the reliability of Korean parts is often
lower than that of their Japanese counterparts; thus, many of the major large enterprises in the ROK – such as
Samsung, LG, and other large enterprises – have chosen high-quality Japanese material components over less-
reliable Korean products, to achieve a competitive advantage in the international market.
Both Japan and ROK are important trade partners with China. An analysis of Japan’s and the ROK’s trade
27
Chapter II Trade (Mr. CHEN)
TRIL ATERAL ECONOMIC REPORT
2 0 1 7

structure reveals that China has imported from the two countries a large quantity of the equipment and core
components needed to develop its manufacturing industry.
According to data from the Japan External Trade Organization (JETRO), in 2016, the value of all goods
imported to China from Japan reached 144.996 billion USD. The main products Japan exported to China were
electromechanical products, chemical products, and transportation equipment; in 2016, exports of these
products totaled 46.98 billion USD, 11.5495 billion USD, and 11.44 billion USD, respectively; these numbers
represent increases of 6.4%, 1.8%, and 17.4% YoY, and account for 41.3%, 10.1%, and 10.1% of Japan’s
total exports to China. Among the exports, precious metals and products made from them saw the largest
decrease, of 27.6%.
The total value of these goods totaled 116.5 billion USD, accounting for 80% of the total value of China’s imports
from Japan. Most of these goods comprise equipment and parts needed in China’s manufacturing industry.
The main products that Japan imports from China are electromechanical products, textiles and raw materials,
furniture, and toys. In the Japanese market, China’s labor-intensive products – such as textiles and raw
materials, shoes, umbrellas, luggage, and other light industrial products – still enjoy a great advantage.
These products account for more than 60% of the Japanese import market.
Most of the products China imports from ROK are equipment and parts for the manufacturing industry.
According to Chinese statistics, in 2015, China imported from ROK 174.5 billion USD of goods, with
mechanical electrical products, optical medical equipment, and chemical products predominating; in 2016,
the value of these exports was 59.22 billion USD, 16.65 billion USD, and 15.91 billion USD, respectively. The
three categories of goods together account for 73.8% of all ROK exports to China.
In 2015, China exported to Japan goods with a total value of 135.6 billion USD. China’s imports from Japan
are less substitutable than are the goods that Japan imports from China. In other words, the goods imported
from Japan are of greater importance to China’s economic development.
The comparative advantages of China’s export products manifest in labor-intensive products, while the
comparative disadvantages manifest in capital-intensive and resource-intensive products. The comparative
advantages of Japan, a developed country, and of ROK, a newly industrializing country, are in resource-
intensive and technology-intensive products. Most of the trade among China, ROK, and Japan is still based
on the resource endowments and comparative advantages of each; it does not represent intra-industry trade
due to economies of scale and product differentiation.
28

Table II-1 Statistics on CJK economic and trade relations
Unit: 100 million USD
YearChina-Japan Trade China-ROK Trade China-Japan Investment China-ROK InvestmentChina
importedChina
exportedChina
importedChina
exportedChina
investedJapan
investedChina
investedROK
invested2001 428 450 234 125 0.19 43.5 0.15 21.52003 742 594 431 201 0.075 50.5 1.95 44.92005 1,005 840 768 351 0.12 65.3 0.13 51.72006 1,157 916 898 445 0.39 46.0 0.27 38.92007 1,340 1,021 1,038 561 0.39 35.9 0.57 36.82008 1,507 1,161 1,122 740 0.59 36.5 0.97 31.42009 0.84 2.652010 1,767 1,211 1,384 688 3.38 40.8 -7.21 26.92011 1,946 1,483 1,627 829 1.49 63.3 3.42 25.52012 1,778 1,516 1,687 877 2.1 73.52 9.42 30.382013 1,623 1,503 1,831 912 4.34 70.58 2.69 30.542014 1,630 1,494 1,902 1,003 3.94 43.25 5.49 39.662015 1,429 1,356 1,745 1,013 2.4 31.95 13.2 40.342016 1139 1566 1244 869 4.71 31.1 20.5 47.5
Data source: Annual China Commerce Yearbook
Unit: Million USD (% of total exports or imports of Japan)
Japan Export to Japan Import from Japan Total
China ROK China ROK Exports Imports
2001 30,994 (7.7) 25,297 (6.3) 57,865 (16.6) 17,198 (4.9) 403,344 349,292
2002 39,825 (9.6) 28,570 (6.9) 61,784 (18.3) 15,485 (4.6) 416,729 337,613
2003 57,417 (12.2) 34,806 (7.4) 75,472 (19.7) 17,903 (4.7) 472,007 383,465
2004 73,939 (13.1) 44,257 (7.9) 94,340 (20.7) 22,046 (4.8) 565,761 455,254
2005 80,074 (13.5) 46,630 (7.9) 108,478 (21.0) 24,415 (4.7) 594,941 515,866
2006 92,770 (14.3) 50,270 (7.8) 118,526 (20.5) 27,328 (4.7) 646,725 579,064
2007 109,271 (15.3) 54,333 (7.6) 127,922 (20.6) 27,307 (4.4) 714,327 622,243
2008 124,901 (16.0) 54,493 (7.6) 143,230 (18.8) 29,475 (3.9) 781,412 762,534
2009 109,727 (18.9) 42,273 (8.1) 122,574 (22.2) 21,984 (4.0) 580,719 551,985
2010 149,451 (19.4) 62,361 (8.1) 153,203 (22.1) 28,601 (4.1) 769,774 694,059
2011 162,035 (19.7) 66,174 (8.0) 183,882 (21.5) 39,811 (4.7) 823,184 855,380
2012 144,208 (18.1) 61,538 (7.7) 188,435 (21.3) 40,593 (4.6) 798,568 885,843
2013 129,401 (18.1) 56,513 (7.9) 180,978 (21.7) 35,822 (4.3) 715,097 833,166
2014 126,361 (18.3) 51,520 (7.5) 181,294 (22.3) 33,385 (4.1) 690,217 812,185
2015 109,327 (17.5) 44,053 (7.1) 160,506 (25.6) 26,808 (4.3) 625,025 626,083
2016 113,830 (17.7) 46,235 (7.2) 156,553 (25.8) 25,020 (4.1) 644,932 606,924
Data source: World Integrated Trade Solution
29
Chapter II Trade (Mr. CHEN)
TRIL ATERAL ECONOMIC REPORT
2 0 1 7

Unit: Million USD (% of total exports or imports of ROK)
ROK Export to ROK Import from ROK Total
China Japan China Japan Exports Imports
2001 18,187 (12.1) 16,502 (11.0) 13,303 (9.4) 26,633 (18.9) 150,431 141,097
2002 23,753 (14.6) 15,140 (9.3) 17,400 (11.4) 29,855 (19.6) 162,466 152,124
2003 35,110 (18.1) 17,276 (8.9) 21,909 (12.3) 36,313 (20.3) 193,817 178,826
2004 49,763 (19.6) 21,701 (8.6) 29,585 (13.2) 46,144 (20.6) 253,845 224,461
2005 61,915 (21.8) 24,027 (8.5) 38,648 (14.8) 48,403 (18.5) 284,418 261,236
2006 69,459 (21.3) 26,534 (8.2) 48,557 (15.7) 51,926 (16.8) 325,457 309,379
2007 81,985 (22.1) 26,370 (7.1) 63,025 (17.7) 56,250 (15.8) 371,477 356,841
2008 91,389 (21.7) 28,252 (6.7) 76,927 (17.7) 60,956 (14.0) 422,003 435,271
2009 86,703 (23.9) 21,771 (6.0) 54,246 (16.8) 49,427 (15.3) 363,531 323,082
2010 116,838 (25.1) 28,176 (6.0) 71,573 (16.8) 64,296 (15.1) 466,381 425,208
2011 134,185 (24.2) 39,679 (7.2) 86,431 (16.5) 68,320 (13.0) 555,209 524,405
2012 134,322 (24.5) 38,796 (7.1) 80,782 (15.6) 64,363 (12.4) 547,854 519,576
2013 145,869 (26.1) 34,662 (6.2) 83,051 (16.1) 60,029 (11.6) 559,619 515,573
2014 145,328 (25.4) 32,248 (5.7) 90,071 (17.1) 53,776 (10.2) 573,075 525,557
2015 137,123 (26.0) 25,576 (4.9) 90,249 (20.7) 45,853 (10.5) 526,753 436,487
2016 124,433 (25.1) 24,354 (4.9) 86,979 (21.4) 47,466 (11.7) 495,418 406,182
Data source: World Integrated Trade Solution
3. Prospects and Forecasts for CJK Trade
In China–Japan trade, between 2000 and 2016, China has almost always had a trade deficit. One important
reason is that China’s rapid economic growth has brought about a rapid increase in the demand for high-tech
products from Japan and has also increased Japanese investment in China. As a result, China’s imports from
Japan have soared.
In China–ROK trade, China has also always been on the deficit side, and the trade deficit is growing,
reaching its highest level of 91.98 billion USD in 2013. One important cause of the serious trade deficit
between China and ROK is that, with the rapid economic development of China, ROK’s investment in China
has been expanding. Many Korean enterprises have shifted their production and processing trade to China,
leading to the import of raw materials and parts from ROK for processing in China, but only part of the
resulting goods are returned to ROK, causing the trade imbalance. China is in a period of rapid economic
growth with relatively high demand for ROK’s high-tech and capital, which is one of the reasons why China’s
deficit has been steadily widening.
30

II. Trade in Service
From 2010 to 2015, China’s service import and export volume grew at an average annual rate of more than 15%.
Figure ll-1 2007–2014 total amount and growth of China’s service imports and exports
Data source: Service Trade Division, Ministry of Commerce, People’s Republic of China Note: Green indicates the total amount and red the growth rate.
In 2016, China’s total service imports and exports increased by 7.9%. This growth is higher than that of the
global service trade and goods trade. At the same time, exports in emerging services have grown rapidly.
Emerging service industries account for 56.3% of service exports, up 2.4% from 2015. Exports of high value-
added services, represented by maintenance and repair services, advertising services, and financial services,
increased rapidly by 54%, 48% and 45%, respectively. In 2016, China Hong Kong, the US, China Macao,
Japan and ROK were the top five service trade partners of mainland China, accounting for 55.7% of China’s
total service imports and exports. In 2016, China’s total trade services reached 657.5 billion USD, ranking
second-largest in the world.
From January to September 2017, China’s total service imports and exports grew by 8.8% YoY, with trade
in emerging services showing a high-growth trend since early this year. For example, from January to
September, the import and export of royalties for intellectual property (IP) reached 168 billion CNY, up 38.8%
YoY. Tourism continues to be China’s largest services import and export sector, with growth in imports
and exports dropping back to 5%. In terms of exports, high value-added services such as financial services
have enjoyed rapid growth. From January to September, financial service and IP royalty exports totaled
17.18 billion CNY and 23.41 billion CNY, up by 16.7% and 493% respectively YoY. The rapid growth in the
exports of high value-added services is a collective showcase of the competitiveness of China’s professional
services sector. Concerning imports, the growth in telecommunications, computers, and information services
continued to remain high. From January to September, imports of telecommunications, computer, and
information services totaled 94.68 billion RMB, an increase of 73.5% YoY; the increase has been in the
range of 47% to 90% for nine consecutive months.
The trade deficit in services is an interim phenomenon during China’s economic restructuring and upgrading.
31
Chapter II Trade (Mr. CHEN)
TRIL ATERAL ECONOMIC REPORT
2 0 1 7

Imports of certain industries such as technology and intellectual property have played a positive role in
promoting the development of the national economy and the adjustment of the industrial structure. With the
deepening of supply-side structural reform in China, the potential for the development of service industries
will continue to be released. China will gradually attain a competitive advantage in service trade.
1. Service Trade within CJK
In 2000, the service trade volume between China and ROK was 4.26 billion USD. In 2014, the total service
trade between China and ROK reached 36.16 billion USD, 7.8 times greater than the 2000 total. The bilateral
service trade between China and ROK is dominated by industries such as transportation, tourism, and other
commercial services, which account for more than 90% of all service trade. In the service trade for which
China imports from ROK, transportation services are dominant, accounting for more than half of the total,
reaching 63.32% in 2010.
In service trade between China and ROK, China has a strong competitive advantage in other commercial
services. ROK has a strong competitive advantage in transportation services. The two can achieve trade
complementarity based on comparative advantages. Tourism services is the most competitive industry sector
in China. However, with the policy support given by the ROK government to its tourism industry, the gap
between China and ROK in the tourism service industry is gradually narrowing. The communications services
and government services sectors of both countries are developing slowly.
In 2008, Japan’s service imports and exports totaled 318.17 billion USD, while China’s totaled 306.06 billion
USD. However, by 2012, China’s service trade reached 472.63 billion USD, while Japan’s reached only
322.13 billion USD. In 2015, the service trade was 332 billion USD for Japan but 713 billion USD for China.
The gap in service imports and exports has widened between China and Japan, which was related to the
sharp decline in the global service trade.
32

Chapter III
Investment (Mr. CHEN)
Chapter III Investment (Mr. CHEN)
I. Inward FDIs of China, Japan and ROK
1. China
In 2016, the actual foreign investment China utilized totaled 118.46 billion USD, accounting for 94% of the
total amount of foreign investment actually utilized in the country, an increase of 0.4% YoY. The top 10
countries/regions that have invested in mainland China are, in descending order, China Hong Kong (87.7
billion USD), Singapore (6.18 billion USD), ROK (4.75 billion USD), the US (3.83 billion USD), China Taiwan
(3.62 billion USD), China Macau (3.48 billion USD), Japan (3.31 billion USD), Germany (2.71 billion USD), the
United Kingdom (2.21 billion USD), and Luxembourg (1.39 billion USD).
From January to September 2017, the actual utilized foreign investment in China totaled 618.57 billion CNY, up 1.6%
YoY. In September, the actually utilized foreign capital totaled 70.63 billion CNY, up 17.3% YoY. From January
to September, the main features of foreign investment absorption were as follows: the absorption of foreign
investment by manufacturing industries resumed its growth, and the high-tech manufacturing and high-tech
service industries maintained their strong growth momentum. From January to September, the actually utilized
foreign capital in high-tech manufacturing totaled 52.98 billion CNY, up 27.5% YoY. The actually utilized foreign
capital in the high-tech service industry totaled 91.59 billion CNY, up 24% YoY.
Among the major investment sources, China Hong Kong, China Taiwan, Japan, and other economies had
higher investment growth rates. From January to September, the actual investment from the three sources
increased by 8.8%, 44.2% and 7.9% YoY, respectively.
2. Japan
Since 2013, inward FDI in Japan has continued to increase, according to statistics released by Japan’s
Ministry of Finance. In 2016, FDI in Japan was twice that in the previous year: that figure, in the amount of
3.1 trillion JPY (30 billion USD), easily surpasses that in 2007, which was the highest investment level to
that time. Reinvestment by foreign enterprises has since 2014 retained a high value (1.3 trillion JPY). The
total amount of FDI introduced in Japan at the end of 2016 amounted to 27.8 trillion JPY (270 billion USD),
with the largest investment being from the EU (13.5 trillion JPY [130 billion USD]). In this respect, the EU is
followed by an investment of about 7.2 trillion JPY (70 billion USD) from North America, and an investment
of about 5 trillion JPY (50 billion USD) from the region.
The increase in foreign investment in Japan is inseparable from the Japanese government’s policies
towards improving the operating environment. For example, the government’s effective tax rate on corporate
enterprises has been reduced from 37% in 2013 to 29.97% in 2016. The reduction in the enterprise tax
burden has benefited Japan by attracting more foreign capital.
While there has been large growth in foreign enterprises’ direct investment in Japan, that level of
investment is only one-sixth that of Japan’s direct investment overseas.
34
3. ROK
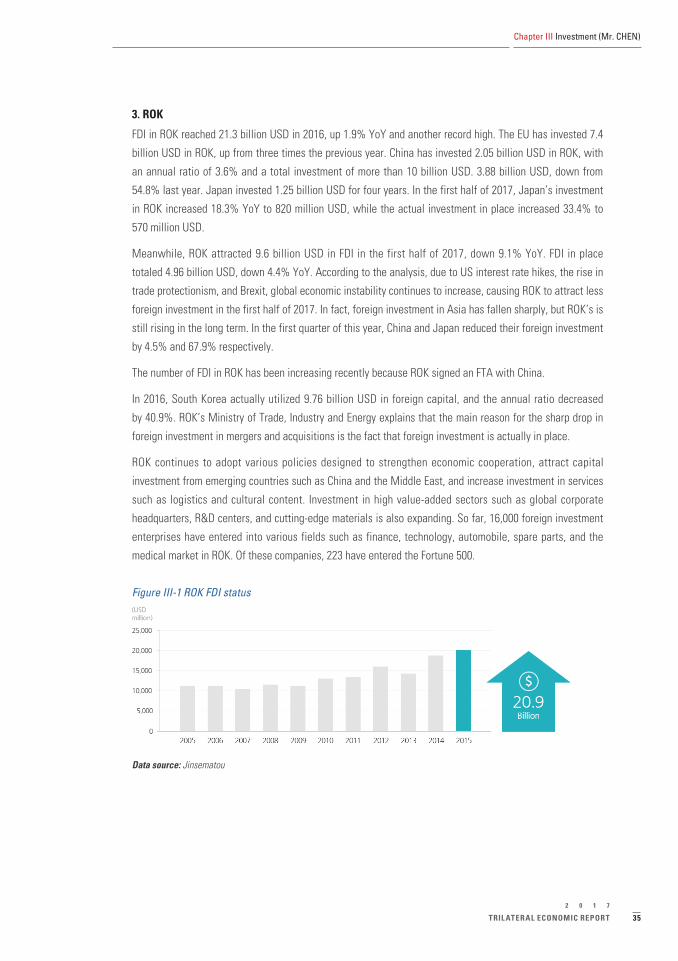
FDI in ROK reached 21.3 billion USD in 2016, up 1.9% YoY and another record high. The EU has invested 7.4
billion USD in ROK, up from three times the previous year. China has invested 2.05 billion USD in ROK, with
an annual ratio of 3.6% and a total investment of more than 10 billion USD. 3.88 billion USD, down from
54.8% last year. Japan invested 1.25 billion USD for four years. In the first half of 2017, Japan’s investment
in ROK increased 18.3% YoY to 820 million USD, while the actual investment in place increased 33.4% to
570 million USD.
Meanwhile, ROK attracted 9.6 billion USD in FDI in the first half of 2017, down 9.1% YoY. FDI in place
totaled 4.96 billion USD, down 4.4% YoY. According to the analysis, due to US interest rate hikes, the rise in
trade protectionism, and Brexit, global economic instability continues to increase, causing ROK to attract less
foreign investment in the first half of 2017. In fact, foreign investment in Asia has fallen sharply, but ROK’s is
still rising in the long term. In the first quarter of this year, China and Japan reduced their foreign investment
by 4.5% and 67.9% respectively.
The number of FDI in ROK has been increasing recently because ROK signed an FTA with China.
In 2016, South Korea actually utilized 9.76 billion USD in foreign capital, and the annual ratio decreased
by 40.9%. ROK’s Ministry of Trade, Industry and Energy explains that the main reason for the sharp drop in
foreign investment in mergers and acquisitions is the fact that foreign investment is actually in place.
ROK continues to adopt various policies designed to strengthen economic cooperation, attract capital
investment from emerging countries such as China and the Middle East, and increase investment in services
such as logistics and cultural content. Investment in high value-added sectors such as global corporate
headquarters, R&D centers, and cutting-edge materials is also expanding. So far, 16,000 foreign investment
enterprises have entered into various fields such as finance, technology, automobile, spare parts, and the
medical market in ROK. Of these companies, 223 have entered the Fortune 500.
Figure III-1 ROK FDI status
Data source: Jinsematou
35
Chapter III Investment (Mr. CHEN)
TRIL ATERAL ECONOMIC REPORT
2 0 1 7

II. Outward FDI of China, Japan and ROK
1. China
China’s outbound direct investment reached an all-time high of 145.67 billion USD in 2015, with the share
of global traffic rising from 0.4% in 2002 to 9.9% in 2015. China’s outbound investment volume reached
170.1 billion USD in 2016, more than doubling in five years, from 87.8 billion USD in 2012. China’s outbound
investment flows have been the second-highest in the world for two consecutive years, second only to the
US. China’s outbound direct investment increased by 35.9% annually from 2002 to 2015.
At the beginning of this century, the investment by Chinese enterprises in Japan and ROK was negligible.
As of 2001, Chinese enterprises have made an accumulated total investment of 19 million USD in Japan
and only 15 million USD in ROK. Since the international financial crisis of 2008, the investments of Chinese
enterprises in Japan and ROK have increased markedly. In 2015, Chinese enterprises invested 240 million
USD in Japan and 1.32 billion USD in ROK. In the past 15 years, China’s investment in Japan and ROK has
been growing steadily.
In 2015, China’s non-financial investment in ROK was 502 million USD, increasing by 21.4% YoY. By the
end of 2015, China had made 3.28 billion USD in direct investment in ROK. In 2016, China’s investment in
ROK reached 2.05 billion USD, up 3.6% YoY and maintained a growth momentum for three consecutive
years. China’s total accumulated investment in ROK has surpassed 10 billion USD. In the first half of 2017,
the investment of the Greater China region in ROK increased 0.3% YoY to 2.87 billion USD, and the actual
investment in place increased 15.6% to 1.59 billion USD. The number of Chinese companies investing in ROK
now outnumbers that of Japanese companies.
China has made less investment in Japan than Japan has made in China. In 2015, China invested 217 million
USD in Japan. From January to August 2017, China’s direct investment in Japan was 188 million USD, up
15.9% YoY, mainly in the manufacturing, import and export trade, and energy and minerals sectors. As of
August 2017, China’s accumulated direct investment in Japan is 3.7 billion USD.
It is clear that there remains much room for improvement in Chinese enterprises investment in Japan and ROK.
2. Japan
Although China–Japan relations have returned to a steady trend in recent years, Japan’s investment in China
is still on the decline. According to statistics from China’s Ministry of Commerce, in 2015, Japan established
643 new enterprises in China, and the actual funds in place totaled 3.19 billion USD, down 26.1% YoY. In
2016, Japan established 576 enterprises in China, down 10.4% YoY; the actual funds in place amounted to 3.1
billion USD, down 3.1% YoY, and accounting for 2.5% of the total foreign investment attracted by China. In
addition to Hong Kong and free ports, it ranked third, after Singapore and ROK.
From January to August 2017, Japan established 378 enterprises in China, down 3.1% YoY; and the actual
utilized capital totaled 2.04 billion USD. By August 2017, Japan had set up 50,794 enterprises in China, and
the total capital utilized reached 106.96 billion USD, accounting for 5.8% of all foreign investment attracted
by China, and ranking first of the countries from which China has utilized foreign capital.
36
From 2001 to 2015, there was a large fluctuation in Japanese companies’ investment in China. After China’s
accession to the WTO, Japanese companies increased their investment in China, reaching 6.5 billion USD in
2005. In 2012, Japan’s investment in China reached a peak of about 7.4 billion USD; afterwards, Japanese
investment in China declined. In 2015, Japan’s investment in China totaled only 3.5 billion USD, which
dropped to 3.1 billion USD in 2016. There are multiple reasons for this drop. One important reason is that
China’s economy is facing an important transformation. China’s economy is shifting from investment-led to
consumption-led, and the role of consumption in promoting China’s economic growth is increasing. China’s
advantage as a global processing factory has weakened, and the strength of China’s domestic market is
gradually increasing.
A survey conducted in September 2016 by JETRO showed that the number of Japanese enterprises that wish
to expand their operations in China is on an upward trend after many years of decline. Of the enterprises
that wish to expand, there are more non-manufacturing than manufacturing firms, and more domestic-
oriented than export-oriented enterprises. For export-oriented enterprises, China’s advantage has gradually
weakened. On the other hand, domestic-oriented enterprises regard China as a potential market and are
expected to continue their exploration of it. While Japanese enterprises transit from export-oriented to
domestic-oriented, they also hope to become among the tertiary industries in China.
By September 2017, Japanese companies’ direct investment in ROK totaled 1.68 billion USD, nearly double
the 880 million USD amount in the same period last year. This is higher than the total investment amount of
last year (1.25 billion USD). Japanese companies’ direct investment in ROK fell for four consecutive years
from 2013 to 2016, rebounding only this year. At the same time, investment in ROK from China, Europe, and
the US decreased by 63%, 63%, and 41% respectively over the previous year because of tensions in the
region.
3. ROK
ROK’s FDI increased from 23.1 billion USD in 2007 to 35.2 billion USD in 2016, setting a record high. The
ROK enterprises have maintained their investment in China at about 3 billion USD each year. Since 2015, the
conflict between China and ROK over the intensification of THAAD has affected the investment by Korean
companies in China. ROK has reduced its investment in China and greatly increased its investment in the
US and Vietnam. ROK’s direct investment in China dropped from 5.7 billion USD in 2007 to 4.75 billion USD
in 2016, ranking next to China Hong Kong and Singapore. In 2013, it was 5.2 billion USD. ROK enterprises
have been facing frictions due to relations between China and ROK, causing ROK to reduce or cease its
investments in China and turn its attention to Vietnam and the US.
In 2015, ROK invested in 1,958 projects in China, and the ROK’s utilized capital totaled 4.03 billion USD. By
the end of 2015, Korean companies accumulated 59,740 projects in China, and the actual investment totaled
63.946 billion USD. ROK is China’s second-largest source of foreign investment.
37
Chapter III Investment (Mr. CHEN)
TRIL ATERAL ECONOMIC REPORT
2 0 1 7

Figure III-2 Industry ratio in ROK’s investment in China, 2016
Manufacturing
Finance and insurance
Wholesale and retail
Professional and technical activities
Real estate
Utilities
Information and communication technology
Accommodation and catering
Transportation
Arts and sports
Data source: Korea Exim Bank website, Tianfeng Securities Institute
South Korean investment in Japan was just 75 million USD in 2001, 850 million USD in 2013 and 1.47 billion USD in 2015.
Table III-1: Investment between Japan and ROK
Unit: Million USD
Year Japan -Korea Korea-Japan
2001 559.745 75
2002 609.158 ..
2003 276.876 49.9
2004 839.599 288.7
2005 1785.696 ..
2006 1519.553 192.285
2007 1301.816 485.857
2008 2366.767 365.894
2009 1083.681 340.113
2010 1066.538 251.454
2011 2434.778 130.498
2012 4005.613 -130.272
2013 3299.245 850.37808
2014 3450.2468 506.12179
2015 1599.9696 1469.2937
Data source: OECD 2016 Report
38

Chapter IV
FTA (Mr. CHEN)
40
Chapter IV FTA (Mr. CHEN)
I. Current Status of FTAs of China, Japan, and ROK
The CJK FTA negotiations started in November 2012 and have now proceeded to the twelfth round. China, Japan,
and ROK are among the world’s major economies. The establishment of the CJK FTA will help bring into full play the industrial complementarities between the three countries, tap the potential for boosting the level of trade and investment in the three countries, and promote the further integration of regional value chains.
In the promotion of regional trade integration, two regional trade arrangements are affecting trade between the three countries. One is the Trans-Pacific Partnership (TPP) (Japan is still vigorously promoting a “TPP without the US”); the other is the institutional arrangement to participate in the Regional Comprehensive Economic Partnership (RCEP) and strive to establish a high-level liberalization in trade and investment. Japan attaches great importance to the development potential of Northeast Asia, especially China’s market.
Bilateral trade between China and Japan/ROK is concentrated in finished products. In the past 10 years, the structures of China–Japan trade and China–ROK trade have gradually converged. The proportion of China’s exports to Japan in machinery and electronic products has increased markedly, of which a large proportion is processing trade. Most of the exports are from Japanese enterprises in China and belong to intra-industry or intra-corporation trade. Meanwhile, the goods imported from China by ROK have also gradually shifted from primary products to semi-finished or finished products, and intra-industry trade has also become increasingly common.
In the negotiation of the CJK FTA, agricultural products have always been a focus and a difficulty. Agriculture is an area of advantage for China, while it is a highly sensitive industry in Japan and ROK. The average tariffs on agricultural products in the two countries once reached 753% and 887% respectively. Agriculture in both Japan and ROK has been highly protected, and it is very difficult to open up. The question of how to rationally arrange tariff concessions in the agricultural sector and manage the transition of agricultural products poses a huge challenge to the CJK FTA negotiations.
In manufacturing, Japan and ROK have marked advantages in high-end products such as machinery, chemicals, and information technology, while they are at a comparative disadvantage in areas such as textile and clothing; China is just the opposite. Therefore, it will also be a challenge to rationally arrange the progress of liberalization in the manufacturing sector, so as to not threaten the safety of the relevant industries in the three countries.
1. China
As of October 2017, China had signed 15 FTA agreements involving 23 countries or regions. Agreements
have been signed with Georgia, ROK, Iceland, Peru, New Zealand, Pakistan, Australia, Singapore,
Switzerland, Costa Rica, Chile, and ASEAN. As of July 2017, Beijing had hosted the 2nd round of China–Israel
FTA negotiation, the 2nd round of upgrading negotiations for the China–New Zealand FTA, and the 2nd round
of upgrading negotiations for the China–Chile FTA.3)
3) As of the date of publication, the 3rd round of China–Israel FTA negotiations had been held (in Israel, in December 2017), as had the 3rd round of upgrading negotiations for the China–New Zealand FTA (in New Zealand, in December 2017); additionally, the upgrading negotiations for the China–Chile FTA had been concluded and the agreement was signed (in November 2017).

41
Chapter IV FTA (Mr. CHEN)
TRIL ATERAL ECONOMIC REPORT
2 0 1 7
Other FTAs under negotiations are China - the Gulf Cooperation Council (GCC), China –Japan-ROK, China-Sri
Lanka, China-the Maldives, China-Israel, China-Norway, and China - Pakistan FTA Negotiations Phase II.
FTAs under study are China-Colombia, China-Moldova, China-Fiji, China-Nepal, China-Papua New Guinea,
China- Canada, China-Bangladesh, China- Mauritius, China-Mongolia, China-Peru upgrade FTA joint
feasibility study, China-Switzerland upgrade FTA joint feasibility study. The development of China’s free
trade zone should accelerate the negotiations between China and Pakistan, Israel, and Norway and lead
to the conclusion of a free trade agreement as soon as possible. China will speed up the negotiations on
upgrading the FTA with Singapore, New Zealand, and Chile in order to provide a repeatable and scalable
experience for China’s foreign economic and trade development. China will also step up research on issues
related to the establishment of free trade zones in countries such as Canada, Mongolia, and Colombia, and
launch bilateral formal negotiations as soon as possible.
2. Japan
In December 2017, Japan concluded an Economic Partnership Agreement (EPA) with the EU. Previously, one
focus of Japan’s foreign economic and trade cooperation has been the Asia–Pacific region. The Japanese
FTA strategy initially focused on countries with significant political and economic interests in the Asia–
Pacific region and Japan. Japan has stepped up FTA negotiations with its main trade partners, after ROK
and the US negotiated a free trade zone in 2007. Current FTA negotiations cover the major economies of
the world, and the global layout of Japan’s FTA strategy has gradually taken shape. As of June 2016, Japan
had signed separate FTAs with Singapore, Chile, Mexico, Malaysia, Thailand, Indonesia, Vietnam, Brunei,
ASEAN, the Philippines, Switzerland, India, Peru, Australia, and Mongolia. Negotiations on RCEP, and on
FTAs with China and ROK, the GCC, Colombia, Turkey, Canada, and ROK, are ongoing. Some substantial
progress has been made. In October 2015, the TPP negotiations resulted in an agreement, and in November
2017, negotiations in the area of service and investment for the Japan–ASEAN FTA were concluded.
3. ROK
ROK has so far signed free trade agreements with 57 countries and regions. The FTA signatories accounted
for 73.5% of global GDP, including the US, the EU, and China – the three largest economies. ROK has
established 14 free trade zones. By region, Asia mainly includes China, the ASEAN, Singapore, India,
Vietnam, and the GCC. America mainly includes the US, Chile, Canada, and Peru; Oceania mainly includes
New Zealand and Australia; Europe is mainly the European Union. At present, ROK and Japan are ready
to restart negotiations on the ROK–Japan FTA, which were suspended in 2004, and the FTA is gradually
advancing. In addition, ROK is considering launching FTA negotiations with countries such as the Russian
Federation, Turkey, MERCOSUR, Israel, and the Southern African Customs Union.
II. Economic Prospects of CJK FTA
Japan and ROK hope the CJK FTA will be built into a high-standard, wide-ranging free-trade area that

42
encompasses not only WTO areas such as goods, services, and investment but also non-WTO areas such
as intellectual property, government procurement, environmental protection, and technical standards.
Meanwhile, as a developing country, and despite the great strides it has made in recent years in market
openness and legal and institutional development, China still faces difficulties in reaching the level expected
by Japan and ROK. Therefore, negotiations on the degree of openness in non-WTO areas may be an obstacle
to building the CJK FTA.
The differences in industrial advantages between China, Japan, and ROK are the foundation for the
establishment of an FTA. Relatively developed Japan and ROK have significant competitive advantages
in capital and technology-intensive industries, while China’s competitive advantages are concentrated in
resource- and labor-intensive products. Each party has its own advantages in import and export commodities,
and their economies are highly complementary.
It will require a specific process to negotiate and set up the CJK FTA. The difficulties in this process mainly
involve the balance of economic and trade interests between the three countries. In other words, the three
parties need to properly handle the sensitive issues in their trade relationships.
III. CJK FTA and other Mega FTAs in the Asia-Pacific Region
Since the Free Trade Area of Asia-Pacific (FTAAP) initiative was proposed in 2004 by the Asia-Pacific
Economic Cooperation (APEC) Business Advisory Council, the research and planning for FTAAP has gradually
entered the agenda of APEC. In 2014, the APEC Beijing Summit set forth a concrete roadmap for building
the FTAAP and provided a framework for action and planning to implement the FTAAP initiative. At present,
four major policy approaches are being explored for setting up the FTAAP, including promoting the APEC
mechanism, relying solely on the RCEP or TPP, integrating the RCEP and TPP, and achieving the trade goals.
All the approaches face challenges. Setting up the FTAAP is being integrated into the agenda and issue
implementation of APEC and is been placed into more specific policy practices along with the continuous
advancement of APEC.
However, there are difficulties and challenges. There are numerous free trade zones in the Asia-Pacific
region, which have attracted the enthusiasm and attention of various economies. Even economies that
actively promote the FTAAP are busy negotiating and implementing bilateral and multilateral FTAs, including
the CJK FTA. Moreover, it is difficult to maintain a strong and sustained focus on this issue because of
complicated political considerations and concerns regarding different levels of economic development.
Therefore, promoting the FTAAP requires economies to strengthen coordination and collaborate. Although
the “Beijing Roadmap” has seen some consensus among various economies about the future direction of the
FTAAP, there is still a great deal of uncertainty.
The Chinese government has a clear-cut attitude of support for the multilateral trade system and for upholding
open regionalism. China will comprehensively and thoroughly implement the “APEC Roadmap for Promoting the
Implementation of the FTAAP, Beijing” and steadily advance toward the goal of setting up the FTAAP.

Chapter V
Olympic Economy

Chapter V Olympic Economy
I. Economic Impact of the Previous Olympic Games
1. China (Mr. CHEN)
In the process of hosting the Olympic Games, Beijing strived to extend the role of the Olympic economy to
its maximum. For example, it tried to allow more cities to participate in the Olympic Games. In addition to
the host city of Beijing, there were two project cities, Qingdao of Shandong province (sailing) and Hong Kong
(equestrian), and four soccer preliminary match cities, Shanghai, Tianjin, Shenyang of Liaoning province,
and Qinhuangdao of Hebei province. The Beijing Olympic Games involved seven cities, and organizing the
Olympic Games promoted the development of these cities and regions.
The first promotion is improving urban infrastructure. Take Beijing for example. In 2001, Beijing only had
about 54 km of subway lines, which took only 10% of the share of passenger traffic in the entire public
transport system. Over the seven years of Olympic preparations, the construction of Beijing’s rail transit
accelerated greatly. By July 2008, the total mileage of the rail transit reached 200 km.
The second promotion is upgrading regional industrial structure. The Olympic Games brought business
opportunities to the construction and building materials industry, environmental protection industry,
information industry, cultural industry, sports industry, and media and advertising industry within the region,
thus providing an opportunity for industrial structure adjustment for the Olympic Games host city and region.
The third promotion is promoting regional economic cooperation. The Olympic Games brought development
opportunities for regions on the periphery of the host cities and other non-Olympic cities, thereby promoting
exchanges and cooperation among regions.
At the beginning of the preparations for the Olympic Games, Beijing already showed a clear understanding
of the economic risks of the post-Olympic period and took a series of measures to mitigate those risks. From
the beginning, Beijing has taken into consideration the use of venues after the Games when carrying out
venue site selection, planning, and design. For example, temporary venues were increased; some venues
were built on university campuses, so that these venues would become facilities for college sports activities
after the Olympics. In addition, private investment and financing mechanisms were established to ease
the financial pressure and the risk of resource idling. In the construction of Beijing Olympic Games venues,
private investment accounted for more than half of the total investment, which greatly lowered the pressure
on government investment, and private enterprises also found development opportunities. For most other
projects, investment was decided by open and competitive joint bidding, and the winner group enterprises
then started investing and operations. This mechanism is effective for controlling the scale of investment
and enabling post-Games utilization.
From 2001 to 2008, during the seven years of preparation for the Olympic Games, the average annual
economic growth rate of Beijing reached 12.4%, and local fiscal revenue increased by 2.3. During this
period, the per capita GDP in Beijing increased from over 2,700 USD in 2001 to above 6,000 USD. The Beijing
Olympic Games have greatly enhanced the overall development level of Beijing and have brought Beijing’s
urban development to a new level.
44

Table V-1 Impact of hosting the Olympics on Beijing’s GDP growth
YEAR
ITEM2001 2002 2003 2004 2005 2006 2007 2008
Estimation per medium and long-term plan of the city
GDP (RMB 100 million yuan) 2846 3159 3506 3892 4320 4795 5323 5908
GDP growth (on inflation-adjusted basis) (%) 9 9 9 9 9 9 9
GDP per capita (USD) 3371 3716 4098 4518 4981 5494 6058
Measurement after adding the Olympic Games factor
GDP increment promoted by Olympic investment (RMB 100 million yuan)
34 125 271 408 435 416 300
GDP increment promoted by Olympic consumption (RMB 100 million yuan)
12 45 98 151 164 158 247
GDP (RMB 100 million yuan) 2846 3205 3676 4261 4879 5394 5897 6455
GDP growth (on inflation-adjusted basis) (%) 10.6 12.7 13.9 12.5 8.6 7.3 7.5
Registered population (ten thousand people) 1125 1133 1141 1149 1156 1164 1172 1179
GDP per capita (USD) 3421 3896 4486 5103 5603 6086 6619
Data source: Qi LIU edit, Beijing Olympic Economic Research, page 8. Beijing Publishing House, 2003 version 1.
2. Japan (Prof. SAITO)
Japan has hosted three Olympic Games: the 1964 Tokyo Olympic Games, 1972 Sapporo Olympic Winter
Games, and 1998 Nagano Olympic and Paralympic Winter Games. All three Games differed in their economic
environment. The 1964 Tokyo Games were held during the high-growth period (1954 to 1970), just after
Japan accepted Article 8 of the IMF Treaty and joined the Organization for Economic Cooperation and
Development (OECD): The Sapporo Games were held during the unstable external environment period (1970
to 1986), between the collapse of the Bretton-Woods system (1971) and the first oil crisis (1973); the Nagano
Games were held during the “Lost Decade” of the 1990s, amidst the financial crisis that broke out in 1997.4)
(i) 1964 Tokyo Olympic Games
The first Olympic Games Japan hosted was the XVIII Olympic Games held in Tokyo in 1964.5) It was the first
Olympic Games ever to be held in an Asian country.
The Games took place between October 10 and 24. A total of 5,152 athletes from 93 countries and regions
took part in 163 events for 20 sports.6) This size made the 1964 Tokyo Olympics the largest Games ever to be
4) For a broad overview of the economic implication of the Olympic Games hosted by Japan, see Yoshiyuki Mano and Mitsubishi Research Institute, Olinpikku Regashii: 2020-Nen Tokyo Wo Kou Kaeru [Olympic Legacy: How it is going to change Tokyo in 2020? ], and Sakamoto Kazumitsu, “Olinpikku To Keizai” [“Olympics and the Economy”].
5) The 13th International Stoke Mandeville Wheelchair Games was held in Tokyo in the following month (November 8 to 13). It was the second time the Stoke Mandeville Games were held in the city that hosted the Olympic Games, and it is now recognized as the 2nd Paralympic Games. However, the rule of hosting the two Games back-to-back was not officially established until the 1988 Seoul Olympic Games.
6) Numbers are from the Japanese Olympic Committee (JOC) website.
45
Chapter V Olympic Economy
TRIL ATERAL ECONOMIC REPORT
2 0 1 7

held at that time.
(1) Direct and indirect costs
According to the Organizing Committee for the 1964 Tokyo Olympic Games, the cost of administration and
operations, including expenses for personnel, facilities, sports equipment and apparatus, Olympic villages,
transportation, and others, totaled 10 billion JPY.
The Games took place mainly in venues in the Tokyo metropolitan area: the main venues were the National
Stadium (extended), National Gymnasium (newly constructed), Komazawa Gymnasium (newly constructed),
and Nippon Budokan Hall (newly constructed). In addition, facilities in Kanagawa, Saitama, and Nagano
prefectures were used. The cost of constructing the new venues and renovating the existing facilities (direct
capital costs) totaled 17 billion JPY.
Furthermore, hosting the Olympic Games required investment in infrastructure. Such investments included the
construction of the Tokaido-Shinkansen (the “Bullet train”), the extension of the underground railways, extensions
of the Metropolitan Expressway, extensions of the underground railways, and improvements in sewage and water
works. The total cost of infrastructure investment (indirect capital cost) was 961 billion JPY.
The grand total was 987 billion JPY, equivalent to about 3.1% of the nominal GDP in FY1964 (see Table V-2).7)
Table V-2 Direct and indirect costs of the Olympic Games
(billion JPY)Tokyo 1964 Sapporo 1972 Nagano 1998
Direct cost 27 17 250(Ratio to nominal GDP) (0.1) (0.0) (0.0) Administration and operation 10 8 114 Construction and renovation of venues 17 9 136 Others 0 0 0Indirect cost 961 202 1291(Ratio to nominal GDP) (3.0) (0.2) (0.2) Construction/upgrading of infrastructure 961 202 1291Total 987 219 1541(Ratio to nominal GDP) (3.1) (0.3) (0.3)Nominal GDP 31,567 86,083 533,149
(FY1964) (FY1971) (FY1997)
Data sources: For Tokyo 1964: Organizing Committee for the XVIII Olympiad (1966) For Sapporo 1972: Organizing Committee for the XI Olympic Winter Games (1973) For Nagano 1999: Organizing Committee for the XVIII Olympic Winter Games (1998), Nagano (1999) For the GDPs: Cabinet Office (2017a)Notes: 1. The table is an expanded version of the table in Sakamoto (2016). 2. Sums do not add up due to rounding.
Data sources: For Tokyo 1964: Organizing Committee for the XCIII Olympiad (1966) For Sapporo 1972: Organizing Committee for the XI Olympic Winter Games (1973) For Nagano 1999: Organizing Committee for the XVIII Olympic Winter Games (1998), Nagano (1999) For the GDPs: Cabinet Office (2017a) Notes: 1. The table is an expanded version of the table in Sakamoto (2016). 2. Sums do not add up due to rounding.
7) According to Flyvbjerg, Stewart, and Budzier (2016), the direct cost of the Tokyo 1964 Olympic Games (cost of administration and operation plus cost of construction and renovation of venues) is among the lowest within the sample of Summer and Winter Games held between 1960 and 2016 in terms of the total cost as well as cost per event and cost per athlete. See Bent Flyvbjerg, Allison Stewart, and Alexander Budzier, “The Oxford Olympics Study 2016: Cost and Cost Overrun at the Games.”
46

(2) Economic and social impacts
While they are not included in the official reports of the Organizing Committee, investments were also made by
the private sector to make the most of the business opportunities the Games provided. For example, a number of
international-standard hotels were constructed in Tokyo for the Games to accommodate the tourists.
The increase in domestic demand brought about by the Olympic Games assisted the economic growth taking
place at the time.
The Tokyo Olympic Games were held in the midst of the high-growth period (1954 to 1970), when the real
economic growth rate averaged about 10%. The first half of the period (1954 to 1964) was led by a rapid
growth in business investment. The extra spending made to host the Games as well as the infrastructure
investment helped to further support the economic growth during the period.
Figure V-1 Investment in Tokyo (FY1956–FY1966)
Public Investment Private Investment
F igure III- J 1 Inves tments in T okyo (F Y 1956- F Y 1966)
(P ublic Inves tment) (P rivate Inves tment)
(Data Source) Cabinet Office (Note) Data is based on 1973 System of National Account (base year = CY1980)
-20
-10
0
10
20
30
40
5019
56
1957
1958
1959
1960
1961
1962
1963
1964
1965
1966
(A)-(B)Tokyo(A)Rest of Japan (B)
-20
-10
0
10
20
30
40
50
1956
1957
1958
1959
1960
1961
1962
1963
1964
1965
1966
(A)-(B)Tokyo(A)Rest of Japan (B)
F igure III- J 1 Inves tments in T okyo (F Y 1956- F Y 1966)
(P ublic Inves tment) (P rivate Inves tment)
(Data Source) Cabinet Office (Note) Data is based on 1973 System of National Account (base year = CY1980)
-20
-10
0
10
20
30
40
50
1956
1957
1958
1959
1960
1961
1962
1963
1964
1965
1966
(A)-(B)Tokyo(A)Rest of Japan (B)
-20
-10
0
10
20
30
40
50
1956
1957
1958
1959
1960
1961
1962
1963
1964
1965
1966
(A)-(B)Tokyo(A)Rest of Japan (B)
Data source: Cabinet Office Note: Data are based on 1973 System of National Account (base year = CY1980)
The Olympic Games also helped the Japanese people become more open to the world.
The first half of the 1960s was a period of internationalization. Building on the high economic growth
achieved since the mid-1950s, Japan began to open up its economy to the world and made efforts to become
a responsible member of the international community. A major promotion of trade liberalization was initiated
in 1960, which led to the acceptance of Article XI of the General Agreement on Tariffs and Trade (GATT)
in 1963 and of Article VIII of the IMF Treaty in 1964. Japan also became a member of the OECD in 1964.
Restrictions on overseas travel by ordinary citizens were also removed this year.
While the economy was opening up to the rest of the world, people still felt remote from foreign countries
and foreigners. The Olympic Games, in this regard, provided an excellent opportunity for the people to feel
closer to, and become intimate with, the rest of the world.
(3) Some caveats in considering economic impacts
While Olympic Games can be considered to provide positive impacts on the economy and society, some
47
Chapter V Olympic Economy
TRIL ATERAL ECONOMIC REPORT
2 0 1 7

caveats are warranted so as not to overestimate them.
First, while the additional spending for the Olympic Games assisted the economic growth during the period
in advance of the Games, it may have crowded out other expenditures that may have been made otherwise,
particularly because of the low foreign reserves that were held by the government at that time. Under
the fixed exchange rate regime of the Bretton-Woods system, the Bank of Japan often had to tighten its
monetary policy and prevent the boom from depleting its limited foreign reserves.
Second, the public and private investments and other expenditure that were made to prepare for the Games
fulfilled their purposes and disappeared after the Games. This can be confirmed by the large decline in public
and private investment after the Games in 1964 and 1965, respectively (see Figure V-1).
The decline in domestic demand was part of the reason why the Japanese economy slid into a recession
in late 1964. The recession, which was later named the “structural recession,” was the most serious
recession experienced during the high-growth period. It led the government to issue government bonds for
the first time since the enactment of the 1947 Public Finance Act and led the Bank of Japan to engage in an
emergency liquidity operation.
Third, some of the expenditures such as the infrastructure investment, particularly in railways and highways,
may have been made in the long term, even without the Games. In this respect, the Olympic Games can be
regarded as having the effect of bringing forward investments that may have taken place later, rather than
creating an entirely new investment opportunity.
(ii) 1972 Sapporo Olympic Winter Games
The second Olympic Games hosted by Japan was the XI Olympic Winter Games held in Sapporo, Hokkaido
in 1972. It was the first winter Olympic Games held in Asia. The Games opened on February 3 and closed on
February 13. A total of 1,006 athletes from 35 countries and regions participated in 35 events for six sports.
According to the Organizing Committee for the 1972 Olympic Games, the cost of administration and operation
for the Games, including expenses for personnel, facilities, press and publicity, Olympic Village, and others,
totaled 8 billion JPY.
The venues of the Games were prepared within the vicinity of Sapporo. Newly constructed venues included the
Makomanai Indoor skating rink, Makomanai speed skating rink, Tsukisamu indoor skating rink, Mt. Eniwa downhill
events site, and Okurayama jump hill. The cost of constructing and renovating the venues totaled 9 billion JPY.
Infrastructure was also constructed around Sapporo. For example, the Sapporo City Subway and Hokkaido
Expressway were both opened before the Games. The cost of preparing the infrastructure totaled 202 billion JPY.
The grand total of the above costs is 219 billion JPY, equivalent to about 0.3% of the nominal GDP in FY1971
(see Table III-J1).8)
8) According to Flyvbjerg, Stewart, and Budzier (2016), the direct cost of the Sapporo 1972 Olympic Games (cost of administration and operation plus cost of construction and renovation of venues) is among the lowest of the sample of Summer and Winter Games held between 1960 and 2016 in terms of the total cost as well as cost per event and cost per athlete.
48

Investments by the private sector were also made, such as the construction of new hotels and additional
rooms at existing hotels, and a new underground shopping arcade.
Since it was a Winter Olympics, the overall cost was relatively limited compared to the Summer Games held
in Tokyo in 1964. The impact on the regional economy was also relatively small: As Figure V-2 shows, there
had been a modest acceleration in public investment since 1966 (Sapporo was voted the host of the 1972
Winter Olympic Games in April 1966), but private investment did not accelerate until 1971.
Figure V-2 Investment in Hokkaido (FY1964–FY1974)
Public Investment Private Investment
(Data S ourc e) C abinet Offic e (Note) Data is based on 1973 S ystem of National Ac c ount (B ase- year=C Y 1980)
F igure III- J 2 Inves tments in Hokkaido (F Y 1964- F Y 1974)
(P ublic Inves tment) (P rivate Inves tment)
-15.0
-10.0
-5.0
0.0
5.0
10.0
15.0
20.0
25.0
1964
1965
1966
1967
1968
1969
1970
1971
1972
1973
1974
(A)-(B)Hokkaido(A)Rest of Japan (B)
-20.0
-10.0
0.0
10.0
20.0
30.0
40.0
50.0
1964
1965
1966
1967
1968
1969
1970
1971
1972
1973
1974
(A)-(B)Hokkaido(A)Rest of Japan (B)
Data source: Cabinet Office Note: Data are based on 1973 System of National Account (base year = CY1980)
On the other hand, whatever its impact, it should not have crowded out other investments because, while
Japan was still under a fixed exchange regime (at that time, the Smithsonian Agreement was in effect),
foreign reserves had been accumulated, so that the constraint of low foreign reserves was no longer
applicable. Moreover, the money supply was consistently growing by around 20% during the period.
A decline in investment took place after the Games, as Figure III-J2 shows. However, the long-term decline
may be exaggerated by the negative impact of the first oil crisis that broke out in 1973 and the restrictive
macroeconomic policies taken thereafter.
(iii) 1998 Nagano Olympic and Paralympic Winter Games
The third Olympic Games that Japan hosted took place in Nagano, when it hosted the XVIII Winter Olympic
Games in 1998.
It took place between February 7 and 22 in Nagano city and other municipalities in the Nagano prefecture. A total
of 2,176 athletes gathered from 72 countries and regions to participate in 68 events for seven sports. The Olympic
Winter Games were followed by the VII Paralympic Winter Games, which took place between March 5 and 4. It
was the first Paralympic Winter Games to be held in Asia. A total of 571 athletes from 31 countries competed in
34 events for five sports. It remains the Paralympic Games with the largest number of athletes.
According to the Organizing Committee for the XVIII Olympic Winter Games, the cost of administration and
operation for the Games, including expenses for personnel, public relations and media support, equipment,
and information and telecommunications systems, totaled 114 billion JPY.
49
Chapter V Olympic Economy
TRIL ATERAL ECONOMIC REPORT
2 0 1 7

The venues were located in Nagano and its vicinities including Yamanouchi (Shiga Kogen), Hakuba,
Karuizawa, and Nozawa Onsen. The main venues in Nagano were M-Wave (newly constructed), Big Hat
(newly constructed), White ring (newly constructed), and Minami Nagano Sports Park (converted). The cost
of constructing and renovating the venues for the Games totaled 136 billion JPY. The cost of infrastructure
investment totaled 1,291 billion JPY, including improvements to infrastructure such as the upgrading of
Hokuriku Shinkansen and the construction of highways and other roads related to the Games. The grand total
of the above is 1,541 billion JPY, equivalent to about 0.3% of GDP in FY1997 (see Table V-2)9) .
The private sector also made investments. As Figure V-3 shows, public investment increased after 1991
(Nagano was voted to host the 1998 Games in June 1991). However, it also shows that both public and
private investment dropped steeply in FY1997 which was before the Games. This partly reflects the
completion of the construction works ahead of the Games but also the downturn of the Japanese economy
that started in 1997 as a result of the consumption tax rate hike in April, the outbreak of the Asian financial
crisis in July, and the collapse of several major financial institutions in November.10)
Figure V-3 Investment in Nagano (FY1989–FY1999)
Public Investment Private Investment
F igure 1- 4 Inves tment in Nagano (F Y 1989- F Y 1999)
(P ublic Inves tment) (P rivate Inves tment)
(Data S ourc e) C abinet Offic e (Note) Data is based on 1973 S ystem of National Ac c ount (B ase- year=C Y 1990)
-20.0
-10.0
0.0
10.0
20.0
30.0
40.0
1989
1990
1991
1992
1993
1994
1995
1996
1997
1998
1999
(A)-(B)Nagano (A)Rest of Japan (B)
-15.0
-10.0
-5.0
0.0
5.0
10.0
15.0
20.0
1989
1990
1991
1992
1993
1994
1995
1996
1997
1998
1999
(A)-(B)Nagano (A)Rest of Japan (B)
Data source: Cabinet Office Note: Data are based on 1973 System of National Account (base year = CY1990)
9) According to Flyvbjerg, Stewart, and Budzier (2016), the direct cost of the Nagano 1998 Olympic Winter Games (cost of administration and operation plus cost of construction and renovation of venues) is roughly around the median among the sample of Winter Games held between 1960 and 2016 in terms of the total cost as well as cost per event and cost per athlete.
10) Miyoshi and Sasaki (2016) assess the long-term effects of the 1998 Nagano Winter Olympic Games on economic and labor market outcomes by comparing the actual data with counterfactual dynamics. See Koyo Miyoshi and Masaru Sasaki, “The Long-Term Impacts of the 1998 Nagano Winter Olympic Games in Economic and Labor Market Outcomes”.
50

3. ROK (Dr. JOO and Mr. OH)
The Seoul Summer Olympic Games in 1988 was the first large-scale international sports event held in ROK.
In 1981, Seoul was designated as the host of the 1988 Summer Olympic Games at the 84th general meeting
of the International Olympic Committee. Seoul, ROK and Nagoya, Japan, were the candidates for the 1988
Olympic Games, and Seoul won 52 out of 79 votes. The ROK became the second country in Asia and the 16th
in the world to host the Olympic Games.
The significance of holding the Olympic Games in Seoul was that the Olympics, a symbol of peace, was held
in a country divided into South and North during the deepening Cold War between East and West. During
the Moscow Olympic Games in 1980, more than 60 Western countries, including the US, did not participate
due to the Soviet invasion of Afghanistan in 1979. Even though it was the first Olympic Games held in the
Communist Bloc, 67 countries, including the US, West Germany, Japan, and Korea, did not participate due to
the Soviet invasion of Afghanistan in 1979. During the opening ceremony, the chairman of the International
Olympic Committee (IOC) emphasized that the Moscow Olympic Games was an international event hosted by
the IOC and should be beyond politics, religion, or race. During the Los Angeles Olympic Games in 1984, the
US hosted the Games for the first time since 1932 and became the third country to hold the Olympic Games
twice. Eleven countries, including the Soviet Union, Eastern European nations, North Korea, and Cuba,
did not participate because the US had not taken part in the 1980 Moscow Olympic Games (only Romania
participated of the Eastern Bloc nations). Nonetheless, 140 countries participated in the Olympic Games (the
largest number in Olympics history), and more than 5.8 million people visited the sites.
After the 1988 Seoul Olympic Games were announced in 1981, the total projected cost for various facilities
and infrastructure over seven years was 2,382.6 billion Korean won (KRW). Expenses directly related to
the Olympic Games were projected at 1,108.4 billion KRW, and establishing other affiliated facilities was
projected to cost 1,244.2 trillion KRW. This includes stadium facilities, the construction of the Olympic
Expressway, the development of the Han River, the expansion of Gimpo Airport, road maintenance, and
infrastructure investment. According to the Korean Studies Central Research Institute, the production-
inducing effect of the investment of 2,382.6 billion KRW was 4,750.4 billion KRW, and the income-inducing
effect was estimated to be 1,846.2 billion KRW.
From September 17 to October 2, 1988, expenditure on the Olympic Games totaled 589 billion KRW, and
revenue totaled 841 billion KRW. The Seoul Olympic Games had a 252 billion KRW surplus. However, this
surplus declared by the Seoul Olympic Organizing Committee included 37.1 billion KRW in donations from the
government, 131.5 billion KRW in donations from the sales of the athlete and press village, 56.5 billion KRW
in national donations, and 9 billion KRW from contributions to the art works of the Olympic Park. Therefore,
the net profit of the Seoul Olympic Games was just 17.9 billion KRW.
The economic benefits of the Seoul Olympic Games were that, first, it had no deficits during the operation of
the competition. In general, the Summer Olympic Games, unlike the Winter Olympic Games, are held around
large cities, which is favorable to investments in social overhead capital and tourism. However, several
Olympic Games have not recorded surpluses, even excluding SOC investments.
Second, the adverse effects of large-scale SOC investments were suppressed by holding a convention in
51
Chapter V Olympic Economy
TRIL ATERAL ECONOMIC REPORT
2 0 1 7

Seoul, which was a growing city. After the Seoul Olympic Games were held in 1988, the amount invested
was 2,382.6 billion KRW, which was a huge amount considering the size of Korea’s economy at the time.
However, when considering the increasing population of Seoul and the congestion of central Seoul and sub-
centers like Yeongdeungpo, the development of eastern Seoul and the construction of high-speed roads in
the city played a major role in laying the foundation for further growth in the city.
Finally, the effect of raising the national brand was huge. Before the Olympic Games, ROK was only a
developing country with light industry exports, but the Games were an opportunity to show the development
of ROK to the world. The 160 countries participating in the Seoul Olympic Games included countries from
the Communist Bloc that did not have diplomatic relations with ROK, which provided a new opportunity for
international peace.
II. Economic Prospects of Future Olympic Games
1. China (Mr. CHEN)
In 2022, Beijing and Zhangjiakou will jointly host the Olympic Winter Games. The game venues will be
located in three places: Beijing City, Yanqing County of Beijing, and Chongli County of Zhangjiakou City. To
ensure transportation services between the three venue sites, Beijing will build high-speed railways and
expressways connecting Beijing to Yanqing and Zhangjiakou. The Beijing–Zhangjiakou intercity railway is
about to start construction. Its total length is to be about 174 km, with about 10 stations along the main
line. The design speed will reach 350 km per hour; from Beijing North Station, it will take 20 minutes to
reach Yanqing station and 52.5 minutes to reach Zhangjiakou station. To help spectators get to Chongli, a
Chongli Branch of the Beijing–Jingzhang Intercity Railway will be built as well. The Olympic Village and the
surrounding venues will then be within 10 minutes’ walk from the branch line.
For the 2022 Olympic Winter Games, there will be 25 venues located in the three sites of Beijing, Yanqing,
and Zhangjiakou. There will be 12 competition venues and 13 non-competition venues. Of the 25 venues, 10
already exist, six are planned, four will be built for the Olympic Winter Games, and five will be temporary
constructions. Beijing will have five competition venues and seven non-competition venues, while Yanqing
County will have two competition venues and three non-competition venues. Direct investment for the
Olympic Games has two targets. One is the construction of Olympic venues and non-competition venues; in
2014 monetary value, this part of the investment totals 1.51 billion USD, equivalent to 92.86 billion CNY. The
direct investment of the Olympic Winter Games and investment of the Olympic Games Organizing Committee
will be mainly distributed in the rental of venues, temporary facilities, and the trial operation of the venues.
The specific breakdown is as follows.
52

Table V-3 2022 Winter Olympics Venue Investment Details Unit: 100 million CNY
Venue type Venue name LocationCurrent
situation of the venue
Events Public funding
Private funding Total
Competition venues (56.1)
National Aquatics Center B Existing Curling 0.73 0.73
National Stadium B Existing Men's Ice Hockey 1.25 1.25National Speed Skating Stadium B Newly built Speed Skating 5.31 6.5 11.81
Capital Stadium B Existing Short Track Speed Skating/Figure Skating 0.433 0.433
Wukesong Stadium B Existing Women's Ice Hockey 0.579 0.579National Alpine Skiing Center Y Newly built Alpine Skiing 10.04 10.04
National Ski Center Y Newly built Bobsled/Luge 9.92 9.92Biathlon Center Z Newly built Biathlon 4.39 4.39Nordic Center Venue for Cross-Country Skiing
Z Newly built Cross-Country Skiing 5.83 5.83
Nordic Center Ski Field Z Newly built Ski Flying Hill 3.72 3.72
Yunding Snow Field A Z Existing Freestyle Skiing/Snowboard Skiing 5.17 5.17
Yunding Snow Field B Z Existing Freestyle Skiing/Snowboard Skiing 2.23 2.23
Training venues (3.00)
Capital Stadium for Short Track Speed Skating
B Existing 2.61 2.61
Capital Skating Rink B Existing 0.33 0.33Training Venue of Capital Stadium B Existing 0.06 0.06
Olympic village (32.20)
Beijing Olympic Village Newly built 18.21 18.21
Yanqing Olympic Village Newly built 6.92 6.92
Zhangjiakou Olympic Village Newly built 7.07 7.07
Main press center
China National Convention Center B Existing 0.572 0.572
Other non-competition venues
National Stadium B Existing 0.973 0.973
Total 32.81 60.06 92.86
Data source: Chen Jian, ed., Beijing-Zhangjiakou Winter Olympics Development Report 2016, page 216, Chinese Culture and History Press, December 2016, first edition
The impact of the Winter Olympics on the economy of Beijing and Zhangjiakou can be divided into three
stages. (1) Before the Olympics, the investment in various venues and supporting infrastructure will gradually
increase, which will lead to a gradual expansion of the local GDP growth. (2) In the Olympic year, games
operation will drive GDP growth to a high point. (3) After 2022, the long-term promotion of the Olympic
Games of the ski industry in the two places will gradually bear fruit.
53
Chapter V Olympic Economy
TRIL ATERAL ECONOMIC REPORT
2 0 1 7

2. Japan (Prof. SAITO)
(i) 2020 Tokyo Olympic and Paralympic Games
Tokyo is to host the XXXII Olympic Games in 2020. It will be the fourth Games to be held in Japan, and
Tokyo will be the first city to host the Games twice in Japan. It is expected to open on July 24 and to close
on August 9. Competition is planned to take place in 339 events for 33 sports, and the upper limit of the
number of athletes is 11,090.11) It will be followed by the XVI Paralympic Games that is expected to take
place between August 25 and September 6. There will be 537 events for 22 sports, and the upper limit of the
number of athletes is 4,400.12)
(1) Direct and indirect costs
According to the latest budgetary forecast by the Tokyo Olympic and Paralympic Games Organizing
Committee, the cost of administration and operation is estimated to be about 820 billion JPY.
The venues are planned to be in Tokyo and nearby prefectures and in Fukushima. The venues in Tokyo include
the Olympic Stadium (reconstructed), Ariake Arena (newly constructed), and Olympic Gymnastic Centre (newly
constructed). The cost of the construction and renovation of the venues is expected to be about 680 billion
JPY. In addition, a reserve fund of 100 to 200 billion JPY has been set aside for unexpected expenses.
The Games will also be supported by investments intended to improve the infrastructure. Improvement in the
transportation infrastructure includes renewal and repairs of the Metropolitan Expressway, the construction of
new railway lines and extension of existing lines, and an expansion of Narita and Haneda international airports.
The total cost of infrastructure investment is estimated by a private think-tank at about 2 to 3 trillion JPY.
The grand total of the above is 3600 to 4800 billion JPY, or 0.6 to 0.8% of nominal GDP in FY2020 (see Table
V-4).13) On one hand, it is larger than the 1972 Sapporo and 1998 Nagano Olympic Games, which were both
Winter Games. On the other hand, it is, at this stage, much smaller than the 1964 Tokyo Olympic Games,
which was a summer Games but did not include the cost of the Paralympic Games. It should be noted,
however, that past experience dictates that the final settled account will exceed the original budget by a
considerable margin.
11) Decision by the IOC in June 9, 2017.
12) DecisionbytheInternationalParalympicCommittee(IPC)onSeptember4,2017.
13) ProjectionforFY2020istakenfromtheeconomicrevitalizationcaseintheCabinetOffice,Chu-Chouki No Keizai Zaisei Ni Kansuru Shisan [Medium- and Long-Term Projections of the Economy and Public Finance].
54
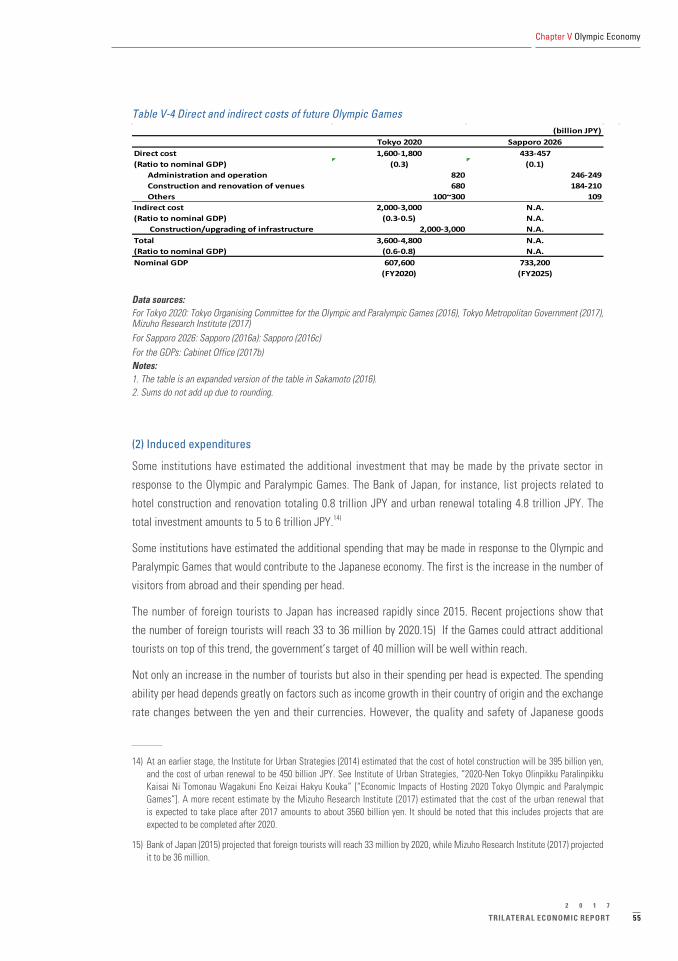
Table V-4 Direct and indirect costs of future Olympic Games(billion JPY)
Tokyo 2020 Sapporo 2026Direct cost 1,600-1,800 433-457(Ratio to nominal GDP) (0.3) (0.1) Administration and operation 820 246-249 Construction and renovation of venues 680 184-210 Others 100~300 109Indirect cost 2,000-3,000 N.A.(Ratio to nominal GDP) (0.3-0.5) N.A. Construction/upgrading of infrastructure 2,000-3,000 N.A.Total 3,600-4,800 N.A.(Ratio to nominal GDP) (0.6-0.8) N.A.Nominal GDP 607,600 733,200
(FY2020) (FY2025)
Data sources: For Tokyo 2020: Tokyo Organising Committe for the Olympic and Paralympic Games (2016), Tokyo Metropolitan Government (2017), Mizuho Research Instutute (2017) For Sapporo 2026: Sapporo(2016a): Sapporo (2016c) For the GDPs: Cabinet Office (2017b)Notes: 1. The table is an expanded version of the table in Sakamoto (2016). 2. Sums do not add up due to rounding.
Data sources: For Tokyo 2020: Tokyo Organising Committee for the Olympic and Paralympic Games (2016), Tokyo Metropolitan Government (2017), Mizuho Research Institute (2017)For Sapporo 2026: Sapporo (2016a): Sapporo (2016c)For the GDPs: Cabinet Office (2017b) Notes: 1. The table is an expanded version of the table in Sakamoto (2016). 2. Sums do not add up due to rounding.
(2) Induced expenditures
Some institutions have estimated the additional investment that may be made by the private sector in
response to the Olympic and Paralympic Games. The Bank of Japan, for instance, list projects related to
hotel construction and renovation totaling 0.8 trillion JPY and urban renewal totaling 4.8 trillion JPY. The
total investment amounts to 5 to 6 trillion JPY.14)
Some institutions have estimated the additional spending that may be made in response to the Olympic and
Paralympic Games that would contribute to the Japanese economy. The first is the increase in the number of
visitors from abroad and their spending per head.
The number of foreign tourists to Japan has increased rapidly since 2015. Recent projections show that
the number of foreign tourists will reach 33 to 36 million by 2020.15) If the Games could attract additional
tourists on top of this trend, the government’s target of 40 million will be well within reach.
Not only an increase in the number of tourists but also in their spending per head is expected. The spending
ability per head depends greatly on factors such as income growth in their country of origin and the exchange
rate changes between the yen and their currencies. However, the quality and safety of Japanese goods
14) At an earlier stage, the Institute for Urban Strategies (2014) estimated that the cost of hotel construction will be 395 billion yen, and the cost of urban renewal to be 450 billion JPY. See Institute of Urban Strategies, “2020-Nen Tokyo Olinpikku Paralinpikku Kaisai Ni Tomonau Wagakuni Eno Keizai Hakyu Kouka” [“Economic Impacts of Hosting 2020 Tokyo Olympic and Paralympic Games”]. A more recent estimate by the Mizuho Research Institute (2017) estimated that the cost of the urban renewal that is expected to take place after 2017 amounts to about 3560 billion yen. It should be noted that this includes projects that are expected to be completed after 2020.
15) Bank of Japan (2015) projected that foreign tourists will reach 33 million by 2020, while Mizuho Research Institute (2017) projected it to be 36 million.
55
Chapter V Olympic Economy
TRIL ATERAL ECONOMIC REPORT
2 0 1 7

and sightseeing attractions are also important elements in deciding where to spend their budget. Thus the
spending per head of foreign tourists to Japan can increase through the combined efforts of the government
and the private sector in providing more opportunities to the tourists in enjoying their stay in Japan.
The second is the increase in private investment to capture the new demand created by the Games. In
addition to hotel construction and renovations and urban renovation, the Paralympic Games taking place
together with the Olympic Games should accelerate the improvement of public and transportation facilities
so as to be more accessible to the handicapped. A private think-tank projects that introducing universal
design will increase investment by about 0.8 trillion JPY.
(3) Macroeconomic impact
In view of the above, the 2020 Tokyo Olympic and Paralympic Games could provide a significant impact
on macroeconomic activity in Japan. One of two approaches can be taken to estimate the macroeconomic
impact of these Olympic and Paralympic Games-related expenditures.
One approach is to estimate their impact on total production. The estimate published by the Tokyo
Metropolitan Government using an input–output table takes that approach. According to their estimate,
the increase in direct expenditures of about 2.0 trillion JPY (including increases in expenditures by the
participants and the spectators and by international broadcasting as well as direct management costs and
the cost of constructing and renovating the venues) will induce an additional production of 3.4 trillion JPY
within Tokyo and 5.2 trillion JPY nationwide. An increase in legacy-related expenditures of 12.2 trillion JPY
(including expenditure related to the use of the venues after the Games and increases in sport activities and
in tourism) is expected to induce an additional production of about 17.0 trillion JPY within Tokyo and about
27.1 trillion JPY nationwide.
The other approach is to consider the impact on GDP. An example is the estimate by the Bank of Japan.
It estimates that increase in demand by foreign visitors (in terms of their numbers but also in terms of
per capita spending) and the increase in investment by the public and private sectors (for the venues and
infrastructure) will lead to an upward shift of the real GDP growth rate from 2015 to 2018 by about 0.2 to 0.3
percentage points, equivalent to an increase of the real GDP in 2018 by about 1%.
(4) Some caveats in considering the economic impact
However, with regards to the economic impact, there are some caveats. In particular, crowding-out may
occur if the current economic situation continues.
The crowding-out effect through an increase in the long-term interest rate is not of a concern here because,
with the QQE with yield curve control in place, long-term interest rates will be kept low (zero under the
current commitment). Private investment would not be affected by the increase in economic activity under
such monetary conditions.
What may be of a concern is the crowding-out effect through competition for workers and consequent wage
increases. The labor market is already significantly tight (please refer to the discussion in Part I). If the
construction projects for the Olympic Games take place as expected, other projects may find it difficult to
56

secure a workforce. The resulting constraint on other projects could partly offset the positive impact of the
Games on economic activity.
Another reservation is the possibility of a decline in economic activity after the Games. In order to make
up for this drop, measures to stimulate private domestic demand need to be taken. In addition to the
implementation of structural policies to remove obstacle to growth, promoting innovation and creating new
growing industries will be essential.
(5) Social impacts
It is also important to note the social impact that Olympic and Paralympic Games may provide.
The first is the further integration to the globalized world. Compared to outward globalization, inward
globalization has been relatively slow to take place in Japan, particularly in the area of inward FDI and the
intake of foreign workers. That has led to a limited exposure to foreigners and foreign companies in Japan,
especially in rural areas. An increase in inbound tourists will provide an excellent opportunity to meet and
understand foreign athletes and visitors, to change mindsets, and promote inward globalization.
The second is a deeper understanding of diversity. While considerable efforts have been made, gender
equality is still an issue that Japan’s government and society need to address. The active participation of
female athletes in the Olympic Games will inspire the Japanese people to improving the situation. Similarly,
hosting the Paralympic Games will provide an opportunity to think about the handicapped and recognize the
need to create an economy and a society where the handicapped can enjoy life on equal terms.
The third is the positive impact on the young and the elderly. The 2020 Tokyo Olympic and Paralympic Games
will be held in the most aged society in the history of the Games. Not only Japan’s share of young people
in the population, but also their actual number will be much lower in the 2020 Tokyo Games than in the
1964 Tokyo Games: though the population in 2020, at 125 million, will be larger than that in 1964, at 97
million, the population of those aged between 0 and 14 in 2020 (15 million, or 12% of the total population)
is considerably lower than that in 1964 (25 million, or 26%). In contrast, the number and share of the elderly
will be higher in 2020 than in 1964. The population of those aged 65 and over in 2020 is projected to be 36
million (29% of the total population), considerably larger than that in 1964 at 6 million (6%).
For the young, the Games will provide a rare opportunity to see with their own eyes athletes from all over the
world competing with all their might. It will provide a role model that will benefit them throughout their lives.
For the elderly, the Games will provide an opportunity to think more seriously about sports and about the
importance of maintaining good health. If the elderly are stimulated to make more efforts to maintain their
health, it will allow them to stay fit longer. This will benefit themselves because it will enable them to delay
becoming bedridden. It will also benefit the social security system because less benefit payments will be
needed to support the elderly.
57
Chapter V Olympic Economy
TRIL ATERAL ECONOMIC REPORT
2 0 1 7
(ii) 2026 Sapporo Olympic and Paralympic Winter Games
Sapporo is planning to bid for a second Winter Olympic Games in 2026.16) If successful, it would be the first
city in Japan to host the Winter Games twice. It would be held by Sapporo in cooperation with other cities
and towns in Hokkaido.
(1) Direct Cost
According to the plan, the Olympic Games will open on February 6 and close on February 22, holding 98
events for seven sports. It will be followed by the Paralympic Games, to be held between March 6 and March
15, featuring 72 events for five sports.
By making the most of the legacy of the 1972 Sapporo Winter Olympic Games and by fully using its potential
as the center of winter sports, Sapporo intends to show to the world a model of the Games that is both
financially efficient and environmentally friendly.
According to the City of Sapporo, the estimated costs of administration and operation (including the bidding
costs) are 246 to 249 billion JPY, and the estimated cost of preparing the venues and the facilities (direct
capital cost) is 184 to 210 billion JPY (the difference depending on the venue of the speed skating events).
The grand total is 433 to 457 billion JPY (see Table V-4). In terms of its share of GDP, which is 0.1%,
administration and operation costs are expected to be larger than those for the 1972 Sapporo and 1998
Nagano Games.17)
(2) Economic Impacts
Sapporo, the capital of Hokkaido, has been enjoying a relatively high per capita income within Hokkaido.
According to the Sapporo’s Citizens’ Account for FY2014, per capita citizen income was 2,868 thousand JPY,
2% higher than the Hokkaido average. Partly because of that, the population was also increasing in a region
while others were losing population.
However, Sapporo’s income level is gradually falling behind the rest of Japan: it was almost 9 % lower than
the national average in FY2014. It is also expected to face a decline in population in the medium-term.
Faced with these expected difficulties Sapporo is seeking ways to attract more people and improve its
economic prospects. Since Sapporo has achieved a good reputation as a ski resort, it is looking at the
Olympic Games as an opportunity to repair and renew its facilities and to display its attractiveness to the
world once more. If it succeeds in attracting foreign tourists as well as Japanese visitors from other areas in
Japan, it should benefit not only Sapporo but also Hokkaido.
According to an estimate published by Sapporo, the number of spectators will total 1.1 million, and the
consumption expenditures made by the athletes, officials, media, and spectators is expected to add up to 51
billion JPY.
16) SapporohasreachedanagreementwiththeJOCtostartadialogueprocesswiththeIOCinNovember2017,beforesubmittingitsproposalforcandidacytohosttheOlympicGamesin2016.ThedecisiononthehostisexpectedtotakeplaceinSeptember2019attheIOCGeneralAssemblytobeheldinMilan,Italy.
17) ProjectionforFY2025istakenfromtheeconomicrevitalizationcaseinCabinetOffice(2017a).
58

Sapporo’s estimate of the macroeconomic impact using an input-output table shows that the induced production
resulting from the increase in total demand due to direct costs and consumption expenditures is estimated to be
645 billion JPY for Sapporo and 1,189 billion JPY for the nation as a whole. The increase in production is also
expected to increase employment by 52 thousand in Sapporo, and 86 thousand in the nation.
In their preparation for the official bid for the Games in 2026, Sapporo should plan the Games in a way that
provides the region with a sustained momentum to grow in the long term.
3. ROK (Dr. JOO and Mr. OH)
In 2018, ROK will host the Pyeongchang Winter Olympic Games. It will be the first Olympic Games held in
ROK since the 1988 Seoul Summer Olympic Games. Pyeongchang won first place in the first vote for the
2010 Winter Olympic Games but failed to win the final vote. Vancouver, Canada, won with just a three-vote
difference. Pyeongchang also failed to win the vote for the 2014 Winter Olympic Games (with Sochi, Russia,
won). In its third challenge, it won the 2018 Winter Olympic Games.
With the 2018 Winter Olympic Games, the ROK is expected to become the sixth nation to land a so-called “Grand
Slam” of international sporting events. The ROK has hosted major four international sporting competitions: the
Summer and Winter Olympic Games, the FIFA World Cup, and the IAAF World Championships in Athletics.18)
Although this is a glorious thing for the nation and the people, there are obviously pros and cons of hosting
international competitions in economic terms. Therefore, this chapter will discuss the economic effects of the
Pyeongchang Winter Olympics and then consider the criteria of Olympic Games success.
(i) The economic effects of the Pyeongchang Winter Olympic Games19)
The economic effects of international sports events can be divided into direct effects and indirect effects.
First, the direct effects include investment and consumption expenditure effects. The investment effect
reflects the total investment amount for hosting the Winter Olympics, such as the stadium, transportation,
and accommodations. The consumption expenditure effects cover the consumption expenditures of domestic
and foreign tourists and the expenses of the Olympic Games. The indirect effects include the additional
tourism effect and the enhancement of the national image due to becoming a famous tourist destination
after the closing ceremony.
In estimating the direct effects, the total amount invested for the Pyeongchang Winter Olympic Games by
the ROK has been about 7,225.5 billion KRW.20) About 4,742.5 billion KRW has been invested in roads and
railways, 771 billion KRW in accommodation facilities, and 540.2 billion KRW in venues and stadiums. The
economic effects of the total investment (production inducement amount) is estimated to be about 16.4
18) TheGrandSlamofinternationalsportingeventcountriesareFrance,Germany,Italy,andJapan.Russia(2018)andtheUS(2021)willsoonjointhem.
19) This chapter is written based on the working paper, Joo and Park (2011), “The Economic Effect of Hosting Pyeongchang Winter Olympic Games”, HRI 11-17.
20) According to the Pyeongchang Winter Olympic Organizing Committee and the media, ROK is expected to spend about 13 trillion won for the Olympics so far. In this article, however, the initial budget is used for analysis.
59
Chapter V Olympic Economy
TRIL ATERAL ECONOMIC REPORT
2 0 1 7

trillion KRW when considering the production inducement coefficient of the sector using an I-O table, as
announced by the Bank of Korea.
The economic effect of consumption expenditures is divided into the consumption expenditures of foreign
tourists, the consumption expenditure of domestic tourists, and the expenditure of Olympic Games expenses.
The expected increase in foreign tourists visiting Korea during the Olympic Games is about 390,000. This is
calculated from the fact that the number of foreign visitors during the 2002 World Cup increased about 3.9%
over the previous year. Based on the average spending of foreign visitors in the ROK (about 1,600 USD) and
the average exchange rate, the total consumption expenditure of foreign tourists is projected to be 721.3
billion KRW, and the production inducement amount is estimated to be about 1,254.3 billion KRW.
The expected increase in Korean tourists visiting Pyeongchang during the Olympic Games is about 2 million.
Visitors to Pyeongchang are expected to increase by 30% during the Winter Olympic Games over a normal year.
Given the average spending of domestic travelers (about 119,515 KRW per person), the consumption expenditure
of Korean tourists due to the hosting of the Pyeongchang Winter Olympic Games is calculated to be about 239
billion KRW, and the production inducement amount is estimated to be about 415.5 billion KRW.
The Olympic Organizing Committee will spend about 1.9 trillion KRW for the Olympic Games, and the
production inducement amount is estimated at about 3,755 billion KRW.
Therefore, the economic effect on total consumption expenditures (production inducement amount) is
estimated to be about 4,745.3 billion KRW.
Second, in estimating the indirect effects, if Pyeongchang becomes a global winter destination, additional
tourism demand is expected to occur. Therefore, assuming that about 10% of the current 10 million foreign
tourists will increase each year over the next 10 years after the closing ceremony, the expenditures resulting
from additional visits by foreign tourists will be about 18.46 trillion KRW over the next 10 years, and the
economic effect will be about 32.2 trillion KRW.
In addition, hosting international sporting competitions will raise not only urban (regional) brands such as
Pyeongchang and Gangwon Province, but also the national brand of the ROK, which will improve the nation’s
corporate image and improve the economic performance of the ROK’s corporations over the mid to long term.
In general, considering that global companies spend about 100 million USD to raise their brand awareness
by 1%, Korea’s top 100 companies need to spend 10 billion USD to increase their brand awareness by 1%.
Assuming that the national brand recognition and the top 100 companies’ brand awareness are raised by 1%
due to the Olympics, the economic effect will be equivalent to 10 billion USD (11.6 trillion KRW).
Therefore, the direct economic effect is about 21.1 trillion KRW, the indirect effect is about 43.8 trillion
KRW, and the total economic effect is estimated to be 64.9 trillion KRW. To achieve these economic effects,
the government should focus on enhancing national brands and make the hosting of the Winter Olympic
Games an opportunity to make a leap forward in the Korean economy. ROK’s corporations should also focus
on expanding into overseas markets and enhancing corporate brand value by maximizing the national brand
image. Korean citizens should commit to active participation in and enthusiasm for the Olympic Games to
bring about national integration and economic growth.
60
(ii) The criteria of Winter Olympic Games success21)
The previous chapter considered only the positive effects of the Pyeongchang Winter Olympic Games on
the overall economy. This chapter will examine the costs and benefits associated with the competition,
especially the Winter Olympics in Salt Lake City and Nagano, from preparation to end, and consider the
criteria of Winter Olympic Games success.
Due to the nature of Winter Games sports, most of the host cities face a cost burden after the competition.
Most of the host cities of the Winter Olympic Games are not in the population or economic center of the
country; usually, their population is quite small. Therefore, it is costly to construct the required infrastructure.
In addition, because the popularity of winter sports is relatively low and using most of the facilities is
impossible during most of the year, maintenance costs are a problem after the events.
The cost, income, and economic effects before, during, and after the Games are as follows.
Prior to the Olympic Games, facilities and infrastructure investments are made. As a result, stadiums,
accommodation facilities, and media villages are built, and investments are made in social infrastructure
such as transportation and electricity. Investment funds are financed by the central government, local
government, and private capital. At this time, bond issuance by the central government or local government
may occur. Economic effects include production, value added, and the employment inducement effects of
facilities and infrastructure construction. During the competition, the Organizing Committee of the Olympic
Games incurs official operating expenses. These operational expenses include personnel expenses, operating
costs for the facilities, and opening and closing ceremony expenses. The revenues comprise corporate
sponsorships, ticket sales, trademark revenues, IOC funding, and broadcast revenue. Economic effects
include production, value added, and the employment inducement effect of the consumption expenditure
of the visitors and operation expenditures. Costs after the competition comprise maintenance costs for
Olympic-related facilities. Income includes revenue from local residents and athletes’ use of the facilities.
The economic effects involve the production and the value added from the consumption expenditure of the
visitors due to the increase in popularity.
For a Winter Olympic Games to be successful, the cost of preparation needs to be restrained. If cost
increases are inevitable, transparency should be ensured by disclosing changes in the plan and the decision-
making process to the public and media. Second, the construction costs for fixed facilities whose utilization
after the event is uncertain should be minimized.
Unlike the Summer Olympics, many of the Winter Olympic Games are not publicized, and most of them occur
only during the winter season. As a result, the cost of operating the fixed facilities after the competition
has been the biggest financial burden for past Winter Olympic Games. In order to prevent such problems,
the stadium should be constructed in such a way that it can be easily demolished, and the accommodations
should be easily changeable into rental space.
21) This chapter is written based on the working paper, Joo, Oh and Baek (2014), “The criteria for Pyeongchang Winter Olympic Games’ success,” HRI 14-08.
61
Chapter V Olympic Economy
TRIL ATERAL ECONOMIC REPORT
2 0 1 7

Third, it is necessary to establish a dedicated agency for facility management after the competition and
to construct and operate a realistic roadmap. Prior to the Olympic Games, there should be a clear plan for
the facilities management agent and profitable businesses after the event. If the facilities are transferred
for the use of the local residents, they must be reduced to an appropriate size in consideration of the city’s
population size, income level, and age distribution.
Fourth, it is necessary to maximize the economic effect of the increase in the city’s popularity as host of the Winter
Olympic Games through the expansion of tourism infrastructure and product development. Before the Winter
Olympics, active marketing efforts are needed to attract foreign tourists. The establishment and exploration of
tourism resources and the development of products related to the Winter Olympics are needed.
62

Chapter VI
Policy Recommendations

64
Chapter VI Policy Recommendations
I. China (Mr. CHEN)
1. Macro-economy
(1) To participate in the “Belt and Road” initiative advocated by China and promote infrastructure development
In infrastructure construction, China, Japan, and ROK could complement each other. China has competitive
advantages in price and labor force, while Japan and ROK have clear advantages in engineering and
technology. The three parties could form a maritime logistics system that supports economic development
by participating in the construction of public facilities at all major ports along the route, and the three parties
could collaborate to ensure navigation conditions at various levels, including air–sea connections and legal
guarantees, so as to establish an interconnected maritime Silk Road network and help the passages operate
smoothly and efficiently.
(2) To develop emerging industries and optimize the structure of service industries
When the development of service trade between China, Japan, and ROK began, service-intensive industries
dominated. Japan soon went through the primary stage of service trade and quickly turned from labor-intensive
industries to high-tech and high-skill industries with a rapid rise in value-added products, which laid the foundation
for Japan’s later service trade. For China, vigorously developing industries with high technology content and
emerging industries is important for improving the added value of export products and increasing the quality of
service trade. When China is actively bringing in foreign capital, they should pay attention to the quality of foreign
capital and aim to bring in advanced science and technology at the same time.
(3) To gradually open up the service trade market and strengthen cooperation in service trade
Empirical analysis of the internal structure relationship of China–Japan service trade and goods trade shows
that China’s exporting of transportation service and computer and information services to Japan will promote
the import and export of goods between the two countries, while China’s importing of tourism services
from Japan will promote China’s export of goods to Japan, and China’s importing of transportation services
royalties and licensing services from Japan will promote the import and export of goods between the two
countries. While the global service trade is rapidly developing, China–Japan service trade is gradually
becoming a new driving force for bilateral trade. Therefore, gradually opening up the service trade market,
strengthening cooperation in service trade, and relying on modern produce services trade to promote the
development of high value-added and high-tech trade in goods will promote the restructuring and upgrading
of China’s goods trade and enhance service trade between the three countries.
(4) To set a long transition period for sensitive products of each country while advancing the CJK FTA
Agriculture is a sensitive industry in current CJK trade negotiations, and a gradual liberalization of
agricultural products trade will require tremendous effort from the three parties. A flexible tax reduction
model could be considered, which first allows a portion of less-sensitive agricultural products to be phased

65
Chapter VI Policy Recommendations
in to zero tariffs in order to avoid the huge impact on related industries that market liberalization will bring
and to ensure that member countries can fully enjoy the benefits of trade liberalization. We can learn from
the “Early Harvest Plan” implemented by the China-ASEAN FTA and allow sensitive agricultural products
a longer transition period. For tariff reduction on agricultural products in transition, a reasonable period of
time could be granted, and the tariff rate could be gradually adjusted to zero. For highly-sensitive agricultural
products, the final tariff could be set to be above zero.
(5) To make use of the RCEP promotion negotiations to advance the establishment of CJK FTA
The RCEP was initiated by the 10 ASEAN countries and invited China, Japan, ROK, Australia, New Zealand,
and India to participate (“10 + 6”). If the RCEP negotiations succeed, it will cover about 3.5 billion people and
GDP of 23 trillion USD, accounting for one-third of the global total. The areas covered will also become the
largest free trade zone in the world. The negotiations for China, Japan, and ROK to join the RCEP have gone
through multiple rounds. Promoting the RCEP would be an effective way to promote the CJK FTA. In addition,
the methods used in RCEP negotiations regarding sensitive industries and trade in services could provide a
valuable reference for the CJK FTA, and better methods could be devised on that basis.
2. Olympic Economy
(1) Strengthen Olympic economic cooperation
The three countries could consider the following priorities for trilateral Olympic economic cooperation. (1)
Strengthen cooperation in the ice and snow (I&S) industry. The 2022 Beijing Olympic Winter Games will serve as
a catalyst for the development of China’s winter sports industry. Taking this opportunity, Beijing and Zhangjiakou
will build a sports industry belt, cluster, or base. To expand China’s I&S industry, Japan and ROK could increase
their investment in China’s I&S industry market, including I&S fitness and leisure industry, high-level competition
show industry, and I&S tourism industry. Building a number of top-level ski equipment manufacturing enterprises
so as to form a complete industrial chain together with I&S bases and I&S tourism will make it possible to
gradually build the I&S industry in China, Japan, and ROK into a pillar industry comparable to those in the US and
Europe. In addition, one of the venues for the Beijing Olympic Winter Games is Zhangjiakou, a region with one
of the most abundant wind and solar energy resources in North China. The three countries could step up their
cooperation in wind and solar energy and jointly build a state-of-the-art international “low-carbon Olympics Area.”
(2) Promote cooperation in infrastructure. In infrastructure development, China, Japan, and ROK can complement
each other. China has a competitive advantage in price and labor, while Japan and ROK have obvious advantages
in engineering and technology. China can utilize the technological advantages of Japan and ROK and invite them
to participate in infrastructure construction and investment in China’s Olympic Winter Games. Japan and ROK will
host the Olympic Games and will also need infrastructure investment. China can also use their own advantage and
invest in Japan’s and ROK’s Olympic Games infrastructure development. (3) Promote cooperation in the Olympic
Games market development. The domestic enterprises of each country could be mobilized to actively participate in
sponsorship programs and concession plans that are conducive to their own development and are supported by the
respective organizing committees. National cooperation could promote the ticketing plans of each nation among
their domestic market to inspire the public to watch the games.
TRIL ATERAL ECONOMIC REPORT
2 0 1 7
66
(2) Strengthen cultural exchanges and cooperation among the three countries and share experi-ences of hosting the Games.
The sharing of experiences of hosting the Games between the three countries could include the following. (1) The
Olympic Games through effect. How to avoid unsustainable development after the Olympic Games is something
China, Japan, and ROK must consider when formulating Olympic Games planning and urban planning. (2) The
post-Games utilization of the venues. To solve the problem of idling venues, the design of the venues should
pay attention not only to the functional requirements during the Games but also to the post-Games functional
positioning and comprehensive utilization. The compounding and multi-functional design of the venues should
be fully considered, and spaces should be reserved during the construction phase for diversified post-Games
utilization. (3) Sharing experiences of hosting the Paralympic Games. Japan is the only country among the three to
have hosted both the Olympics and Paralympic Winter Games and has accumulated rich experience and lessons in
organizing these events, which are worth sharing with China and ROK.
(3) Establish a CJK League of Olympic Cities and set up an Olympic City Development Fund
The 1964 Tokyo Olympic Games set the precedent for an Asian country hosting the Olympic Games. Over the
next four years, the three countries will host three Olympic Games, which means that more cities in China,
Japan, and ROK will enter the ranks of Olympic cities.
Beijing was the host city for the 29th Olympic Games, but six other cities also participated. The Olympic
sailing competitions were held in Qingdao, equestrian events were held in Hong Kong, and the Olympic
soccer matches were held in Qinhuangdao, Shanghai, Shenyang, and Tianjin. In addition, Nanjing hosted the
Youth Olympic Games in 2014, and Beijing and Zhangjiakou will jointly host the 2022 Olympic Winter Games.
In other words, nine cities in China bear the honor of being an Olympic city. Among them, Beijing, Tianjin,
and Shanghai are municipalities directly ruled by China’s Central government.
The Olympic cities in ROK are Seoul (1988), Gangneung, and Pyeongchang (2018), and Japan’s Olympic cities
are Tokyo, Sapporo (1972), and Nagano (1998). We propose setting up a League of Olympic Cities in the
three counties, which will involve 12 cities plus the three national capitals. We propose setting up offices,
the Secretariat for the CJK League of Olympic Cities, to strengthen exchange and cooperation among the
members, with the three capitals serving as the core for each country. As a sub-regional development league
(as it involves only some cities in member countries), it has much flexibility and room for development and
wide-ranging cooperation. The league would inherit the Olympic legacy, and promote economic, cultural, and
social development in the Olympic cities in China, Japan, and ROK.
On the basis of the CJK League of Olympic Cities, we propose setting up an Olympic City Development
Fund, which will be used for cultural exchanges, infrastructure construction, the development of the sports
industry, and the promotion of Olympism in the Olympic cities of China, Japan, and ROK.
(4) Strengthen CJK exchange and cooperation in ICT field
The 2018 Olympics Winter Games in PyeongChang presented five grand visions, one of which is to
make breakthroughs in the information and communication technology (ICT) field. As a combination of
IT (information industry) and CT (telecommunications) services, the ICT framework will integrate the

67
Chapter VI Policy Recommendations
communications industry, the electronic information industry, the Internet, and the media industry. The
five-year strategic plan for the “Korean ICT 2020” (K-ICT 2020) of the ROK government announced that
the government will expand its investment in the ICT sector to make it the new “blue ocean” of Korea’s
innovation economy. In recent years, Japan has also made progress in the development of the ICT industry,
and China has made breakthroughs in some areas as well. The annual growth rate of ICT in China is expected
to reach 13.3% from 2013 to 2018. The breakthroughs made by ROK in ICT have not only promoted the
progress of the Technology Olympics but have also had an important impact on the technological revolution
in northeastern Asia and even the whole world. China, Japan, and ROK should strengthen exchange and
communication in this area, to try for in-depth collaboration to advance the level of the CJK in the ICT field
together to enable northeastern Asia to maintain synchronized ICT development with the world and even
lead it in some areas.
(5) Promote the development of intra-CJK tourism
China, Japan, and ROK are neighbors connected by narrow strips of water. The three countries also form an
important tourist area with strong growth potential and huge potential in the global tourism market. Taking
the opportunity to hold the Olympic Games to promote tourism cooperation between the three countries and
strive for a goal of 30 million people trips is undoubtedly worthwhile. For example, a unified CJK tourism
route could be designed that so that tourists outside CJK could go through the route and visit China, Japan,
and ROK. We could establish a CJK youth tourism cooperation mechanism, formulate an exchange plan,
and regularly organize exchange visits among young people, so that they could become the reserve for CJK
tourism. We could create new tourist routes and promote the development of the tourism market.
In December 2016, China and ROK officially implemented a mutual visa waiver policy for official passport
holders. Japan has not yet implemented a visa-free policy for Chinese tourists. Travel should not be
restricted by national boundaries. The three countries could expand the scope of the visa-free policy and
strive to let ordinary Chinese tourists enjoy this benefit.
The three countries can step up interconnection and increase air routes and flights between key hub cities,
encourage more second- and third-tier CJK cities to open air and water routes, and help and encourage businesses
to carry out tourism charter flights to make the exchange of visits among CJK tourists more direct and convenient.
II. Japan (Prof. SAITO)
The hosting of the Olympic and Paralympic Games by China, Japan, and ROK within a short period of time
provides a rare opportunity for the three countries to deepen cooperation with each other. Cooperation in a
well-planned and well-organized manner should benefit all three countries.
1. Macro-economy
Asia has established itself as the growth center of the world. China, Japan, and ROK have been the
main drivers of Asian growth, commanding about 20% of global GDP and about 70% of the Asian GDP.
It is important, therefore, that the economic cooperation between the three countries be maintained and
reinforced so that the growth potential of the region is fully exhibited. In this regard, economic cooperation
TRIL ATERAL ECONOMIC REPORT
2 0 1 7

68
could be enhanced in the areas of trade, financial transactions, and personnel exchanges.
In the area of trade, expansion of trade between the three countries is expected to continue, as the
establishment and strengthening of global supply chains has become essential for firms in the region to
strengthen competitiveness. For the global supply chains to fully realize their potential, trade liberalization
and facilitation in the region is an important factor.
In this regard, the successful conclusion of the China–Japan–ROK Free Trade Agreement would help boost
trade and economic growth in the three countries and in the Asian region. If the cooperation of the three
countries could promote a wider trade liberalization and facilitation through the successful agreement of the
RCEP, it will provide a greater momentum for growth in trade and for prosperity in the region. Cooperation
among the three countries in liberalizing and facilitating trade would be a strong countervailing power to
protectionism which, if it prevails, would undermine the strength of the global and regional economy.
In the financial sector, developing a sound financial system in each individual country and securing stable
financial transactions within the region are essential for achieving steady growth in the Asian region. In
this regard, establishing local currency bond markets in the region under the Asian Bond Markets Initiative
(ABMI) is important for the development of a deep and stable financial system in the respective countries.
To prepare for a sudden need, an arrangement such as the Chiang Mai Initiative Multilateralization
(CMIM) is important. This needs to be supported by the appropriate surveillance function of the ASAE+3
Macroeconomic Research Office (AMRO). The cooperation of the three countries in these areas should help
reduce the risks and enhance the stability of the global and regional economies.
Regarding personnel exchanges, the number of visitors traveling between the three countries has increased
significantly in the past five years. A considerable portion of the visitors consists of tourists who enjoy the
rich attractions that these countries provide. The number of tourists is expected to increase, as the Olympic
and Paralympic Games in the three countries will provide additional incentives to visit. While introducing
measures to further facilitate mutual visits between the three countries, the countries could also make use
of the occasion to invite more visitors from other countries by strengthening cooperation in such activities as
the “Visit East Asia Campaign.”
2. Olympic Economy
Cooperation in the areas related to the Olympic and Paralympic Games would be an obvious and important
starting point. This could occur through three channels.
First, information and experiences gained by hosting the Games can be shared by the three countries. One
obvious way to achieve this is through personnel exchanges between the Organizing Committees of the Games.
Members of the Organizing Committees of the preceding Games could join the Committees of the succeeding
Games and pass on their information and experience. Alternatively, members of the Organizing Committee of the
succeeding Games could join those of the preceding Games and bring back the information and experience to their
Committees. Either way would make the Games in the three countries more successful.
Second, wider cooperation in sports can occur at local levels as well as at civic levels. Cooperation in sports

69
Chapter VI Policy Recommendations
events between the hosting cities could gradually expand to include other localities. The cooperation could
also start with a specific group but could later include other groups.
For example, the China, Japan, Korea Junior Sports Exchange Meet has taken place every year since 1993.
In August 2017, the 25th Meet took place in Ibaragi prefecture, Japan, featuring 11 sports. The participants
were athletes from the three countries who were either under 18 or high school students.
A three-country sporting event covering wider age groups is also taking place. The China–Japan–Korea
Friendship Athletics Meet has taken place every year since 2014. This year, the 4th Meet took place in July in
Ningbo, China. Athletes competed in seven events.
These opportunities are invaluable. To commemorate the hosting of the Games in the three countries, the
meets can be upgraded to cover all ages, include the handicapped, and cover a wider range of sports.
Third, cooperation can develop into areas that are closely related to sports, such as health promotion. In
view of the increasing attention being given to health in the three countries, where an aging population is
imminent or is about to become significant, cooperation in health promotion will be beneficial.
Exchanging information on the health situation in the three countries and experiences dealing with the
health problems faced by the elderly will help address future problems. Allowing the elderly from the three
countries to exchange information will also deepen mutual understanding between the three countries’
citizens.
(iii) Research activities to support cooperation
Economic cooperation will benefit from a sound analysis of the economic situation of the three countries.
Analyses could examine the current economic situation of the three countries, the economic interdependency
among them, the economic outlook in the short and long term, the risks the three countries face, and the
policies that could improve the prospects and address the risks the three countries face.
Economic analysis of this kind has been undertaken by the Trilateral Economic Reports. Undoubtedly, it has
made a significant contribution. However, to make a further step forward, research activities for the three
countries should be made more systematic and consistent.
(1) Recommendations on the organization
Two approaches for fostering more systematic and consistent research activity are possible. One is to
establish a permanent network of think-tanks and research institutions, which the TCS could frequently
consult. This network could exchange information and analyses, and discuss matters of mutual interest,
especially in the area of economic monitoring and analyses.
While the Network of Trilateral Cooperation Think-Tanks (NTCT) already exists, it could be strengthened with a
fixed group of economists from think-tanks in each of the three countries, who monitor economic developments
and analyze economic issues daily. They could work closely with the TCS to support the Secretariat in
economic matters. It should create a solid analytical foundation that future cooperation can build on.
The other approach is to establish, within the TCS, a permanent section responsible for research activities.
TRIL ATERAL ECONOMIC REPORT
2 0 1 7

70
It should consist of economists from the three countries who monitor and analyze the economic situation of
the three countries. They could publish periodic reports on the economic situation and the policy issues of
mutual interest.
Whichever approach is taken, the research should focus not only on short-term issues but also on long-
term issues of mutual interest in the three countries. For the long-term issues, the analysis would require
significant time and resources and could be taken up as a multi-year project.
(2) Recommendation on the topic
Among the long-term issues of mutual interest, the impact of demographic changes and the costs and
benefits of alternative measures to address their impact should be given the highest priority because all
three countries are going to face an aging and declining population in the long term. This will transform the
economy and society in a significant way and pose problems to the three countries that may be difficult
to resolve. The expected demographic changes could be confirmed by the long-term population projection
provided by the United Nations.
As Figure VI-1 shows, the old-age dependency ratio22) of the three countries, which was 42.7 in Japan, 17.7
in Korea, and 13.3 in China in 2015, is expected to rise significantly as we approach 2100. Japan will see its
peak at 72.3 in 2055, Korea at 76.0 in 2065, and China will rise to 58.3 in 2100 (the last year of projection).23)
Since the ratio can be translated as an indicator of the size of the burden on the working generation (which
makes contribution for the pension benefit payments received by the elderly), the social security system will
be subject to a considerable pressure in the long term.
Figure VI-1 Projection of old-aged dependency ratio
Data source: United Nations.
22) The old-age dependency ratio is the ratio of the population between 15 and 64 to the population aged 65 or over.
23) It should be noted that the population projection by the United Nation may be different from the projections made by the individual countries. Both the UN’s old-age dependency ratio and total population projections for Japan are more optimistic than the official projections published by the Institute of Population and Social Security Research’s Population Projection for Japan: 2015-2065.
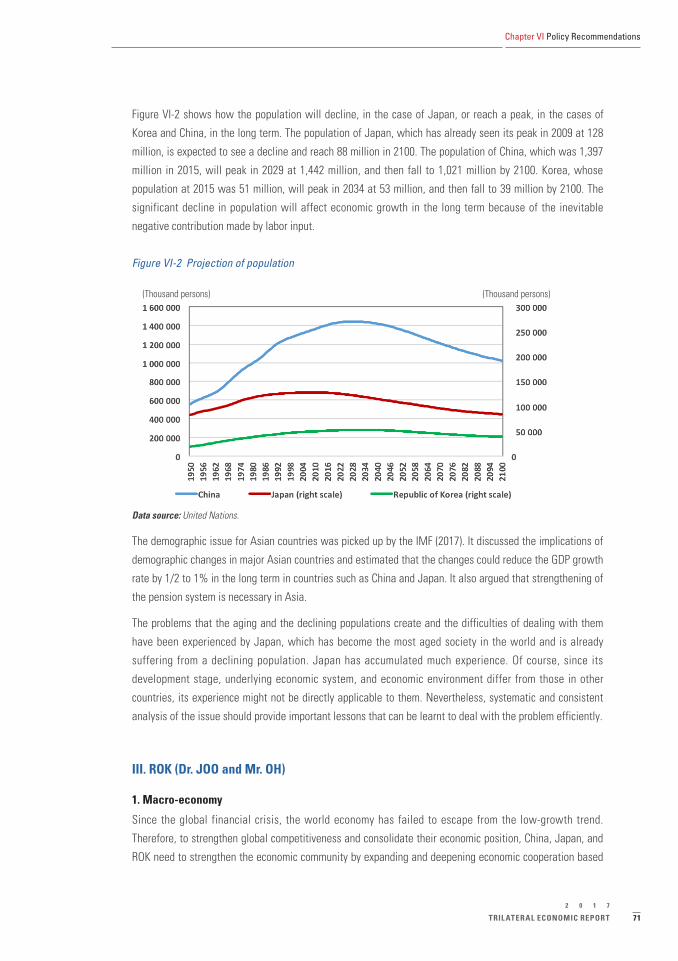
71
Chapter VI Policy Recommendations
Figure VI-2 shows how the population will decline, in the case of Japan, or reach a peak, in the cases of
Korea and China, in the long term. The population of Japan, which has already seen its peak in 2009 at 128
million, is expected to see a decline and reach 88 million in 2100. The population of China, which was 1,397
million in 2015, will peak in 2029 at 1,442 million, and then fall to 1,021 million by 2100. Korea, whose
population at 2015 was 51 million, will peak in 2034 at 53 million, and then fall to 39 million by 2100. The
significant decline in population will affect economic growth in the long term because of the inevitable
negative contribution made by labor input.
Figure VI-2 Projection of population
(Thousand persons) (Thousand persons)
Data source: United Nations.
The demographic issue for Asian countries was picked up by the IMF (2017). It discussed the implications of
demographic changes in major Asian countries and estimated that the changes could reduce the GDP growth
rate by 1/2 to 1% in the long term in countries such as China and Japan. It also argued that strengthening of
the pension system is necessary in Asia.
The problems that the aging and the declining populations create and the difficulties of dealing with them
have been experienced by Japan, which has become the most aged society in the world and is already
suffering from a declining population. Japan has accumulated much experience. Of course, since its
development stage, underlying economic system, and economic environment differ from those in other
countries, its experience might not be directly applicable to them. Nevertheless, systematic and consistent
analysis of the issue should provide important lessons that can be learnt to deal with the problem efficiently.
III. ROK (Dr. JOO and Mr. OH)
1. Macro-economy
Since the global financial crisis, the world economy has failed to escape from the low-growth trend.
Therefore, to strengthen global competitiveness and consolidate their economic position, China, Japan, and
ROK need to strengthen the economic community by expanding and deepening economic cooperation based
TRIL ATERAL ECONOMIC REPORT
2 0 1 7

72
on geographical proximity and high trade volumes.
China, Japan, and ROK have rapidly increased their trade volume and investment based on a mutually
complementary trade structure. However, the need to expand trade through new economic cooperation has
recently increased due to low economic growth in ROK and Japan, the end of China’s rapid economic growth
era, and the changes in the demographic and industrial structures of each country.
In order for China–Japan–-ROK economic cooperation to continue to expand, it is necessary to establish an
institutional basis through a rapid conclusion of the CJK FTA.
The CJK FTA will open up a huge common market in the region by mutually opening and integrating the
three markets. The three countries have different demographics and income distribution, and their market
integration can expand the consumption market by diversifying the consumers. Reducing trade costs by
mitigating tariffs and non-tariff barriers between the three countries will help improve the trade structure of
northeastern Asia, which is vulnerable to external factors, by expanding imports and exports in the region. In
addition, although there are many competitive industries in the three countries, new markets can be created
based on cooperation between them because there are also many complementary industries. Moreover, the
efficient distribution of production factors should be increased by mitigating regional investment barriers and
by promoting manpower interchange.
Financial cooperation between China, Japan, and ROK is another important task. Based on the experience of the
global financial crisis, the need for financial cooperation to mitigate external financial vulnerability has increased.
Amid the current global economic uncertainty, the three countries can reduce their external financial
vulnerability by engaging in economic cooperation as well as by concluding a trilateral currency swap that
provides liquidity support in a crisis. By actively utilizing it for trade settlement, the countries could enhance
the international utilization of their currencies and strengthen regional financial stability.
In addition to expanding trade based on current industries, China, Japan, and ROK should strengthen regional
cooperation by exploring and pioneering common-interest industries and markets. The three countries should
focus on cooperation in the fields of marine, environmental, and other issues of mutual interest as well as in
the development of next-generation technologies such as unconventional energy and ICT and the creation of
a market for them.
To adapt to technological changes caused by the appearance of the fourth industrial revolution, the three
countries have been making huge investments in technology development related to big data, artificial
intelligence, and the Internet of things (IoT). In the new technology field, it is necessary to strengthen
technical competitiveness in the world market by strengthening technical cooperation such as through joint
R&D investments between the three countries. Cooperation is necessary in order to develop new markets
and diversify export markets. Joint investments by the three countries would help mitigate the investment
risk in new market exploration.
73
Chapter VI Policy Recommendations
2. Olympic Economy
China, Japan, and ROK will need to strengthen sports exchanges and cooperation to take advantage of their
geographical proximity, as the 2018 Pyeongchang Winter Olympic Games, the Tokyo Summer Olympics in
2020, and the Beijing Winter Olympics in 2022 will be held successively.
First, holding a regular sports policy forum among the three countries will allow policymakers in the three
countries to network and communicate about sport policies. They will be able to promote cooperation in
education, training, financing, and investment in sports-related fields by exchanging opinions and sharing
knowledge.
Second, it is necessary to exempt foreigners from requiring visas during future Olympics in order to expand
the tourism industries of the three countries. For example, foreigners who have received a visa for one
country should be temporarily exempt from requiring a tourist visa for the other two countries during the
2018 Pyeongchang Winter Olympic Games, 2020 Tokyo Summer Olympic Games, and 2020 Beijing Winter
Olympic Games.
Third, the sports facilities, athletic villages, media villages, and other facilities established for international
sporting events in each country should be actively used as training and training sites for athletes in the three
countries. Some of the facilities should be changed into cultural, performance, and educational facilities to
create an integrated space for sports, culture, and the arts. It would then be possible to hold large and small
regional and international events between the three countries after the Games and to promote joint sports
and cultural exchanges between them. Furthermore, it is necessary to seek ways to utilize the venues as
tourism resources by developing and promoting tourism attractions connected to the surrounding area.
Fourth, hosting international sporting events involving the three countries jointly and constructing distributed
infrastructure and facilities in the three countries may alleviate the financial burden of hosting international
sporting events. After the closing ceremony, the facilities could also be used jointly by the three countries to
expand mutual exchange.
China, Japan, and ROK should expand their sports cooperation and revitalize their culture and arts industries
by increasing cultural and arts exchanges, such as through the joint production of cultural and artistic events
involving the three countries.
TRIL ATERAL ECONOMIC REPORT
2 0 1 7

References
1. China
“2017 Analysis on China-Japan-ROK Trade Relations (2017中日韩三国之间贸易关系及结构分析)”.
April 21, 2017. http://www.kanzhun.com/zhichang/lunwen/548194.html
“Balance of Japan’s Inward FDI Increased in the Past 4 Consecutive Years(海外对日本直接投资
余额连续4年增加)”. Nikkei 日经中文网. May 25, 2015. http://cn.nikkei.com/politicsaeconomy/
investtrade/14515-20150525.html
Chen, Jian, ed. Beijing-Zhangjiakou Winter Olympic Development Report 2016 . 1st edition. Beijing: China
Culture and History Press, December 2016.
Chen, Jian. “The Olympic Economy: China’s Innovation and Development”. People’s Daily. July 25, 2008: 10.
CJK FTA Negotiation Resumed After 9 Months, Financial and Communication Areas Will Be Discussed (中
日韩时隔九个月重启自贸谈判,将启动金融通信等领域磋商)”. 经济参考报. January 10, 2017.
http://news.xinhuanet.com/fortune/2017-01/10/c_129438982.htm
Financial Network (Beijing). “Predicting steady economic growth prospective and continued conversion of old
and new driving force—Report of confidence survey of China’s top 100 economists in Q3 2017”. November 1,
2017.
“Japan’s Investment to China Decreased by 16.3% from January to Jun (1-6月日本对华投资减少16.3%)e”.
Nikkei 日经中文网. July 22, 2015. http://cn.nikkei.com/politicsaeconomy/investtrade/15334-20150722.html
Jiang Yanshu, Xu Ling. “Study on the Interaction between Service Trade and Goods Trade in China–Japan
Bilateral Trade”. Modern Business. December 23, 2015.
Jinsematou. Accessed October 19, 2017, http://www.jinsematou.com.
Leadership Paper. 2017 China Economic Prospects and Macro-control Policies . Vol. 10. (2017).
Liu, Qi ed. Beijing Olympics Economic Research . 1st edition. Beijing: Beijing Press, 2003.
LV, Kejian. “Sino-Japan Economic and Trade Relationship: Retrospect of 2015 and Prospect of 2016 (中日
经贸关系:2015回顾与2016展望)”. 中文导报. June 8, 2016. http://www.rbzwdb.com/hrxw/2016/06-
08/9774.shtml
Northeast Asia academic journal of 2016. “Yao-Haitian, Japan and South Korea’s MC industry bilateral trade
comparison and competition”.
SIIK Task Force Report. Evolution, Pathways and Prospects of FTAAP Building (上海国际问题研究系
列课题报告: 亚太自贸区建设的演进、实现路径和前景). October 2015. http://www.siis.org.cn/
shgjwt201512107417/uploadfile/2015/1125/20151125065246116.pdf
Surging News, Color. “Interpreting China’s macroeconomic data in the third quarter: Steady economic
growth, reversal of the trend of multiple-year slowdown”. October 19, 2017.
74

“Trade Deficit with Japan Reached Nearly 200 Billion USD In The Past Eight Years (8年对日贸易逆差近2000
亿美元)”. 法制晚报. May 25, 2010. http://finance.sina.com.cn/world/yzjj/20100525/16577999962.shtml
Wang, Zhile. “Data based-view of China’s economic and trade relations with Japan and ROK”.
Xu, Bia. “Escalating of SAARD: Domestic industry opportunities after the injured trade”. Ministry of
Commerce Tianfeng Securities Institute. NetEase Financial.
Xu, Chang Wen. “China’s big manufacturing companies have invested in factories in Japan for the first
time”. The International Network. July 11, 2017.
YU, Fei. “Average Tariffs on Chinese Agricultural Products Is 1/4 of the World’s-Analysis on the Current
Status of Import and Export of Agricultural Products (中国农产品平均关税水平仅为世界水平的1/4 粮
食进出口现状分析)”. November 2014. 前瞻网. https://www.qianzhan.com/qzdata/detail/149/141113-
adea2604.html
YUAN Ruiling, TIAN Zhihong. “Research on Korea’s Agriculture Product Tariff under Its FTAs (自由贸易协
定背景下的韩国农产品关税问题研究)”. World Agriculture (世界农业). March 2014.
2. Japan
Bank of Japan. “2020-Nen Tokyo Olympic No Keizai Kouka” [“(Economic Impacts of the 2020 Tokyo Olympic
Games”]. Bank of Japan Reports & Research Papers , (2015) (in Japanese).
Cabinet Office. Chu-Choki No Keizai Zaisei Ni Kansuru Shisan [Medium- and Long-Term Projections of the Economy and Public Finance], (2017a) (in Japanese).
Cabinet Office. Keizai Zaisei Houkoku [Annual Report on the Japanese Economy and Public Finance ], (2017b)
(in Japanese).
Flyvbjerg, Bent, Allison Stewart, and Alexander Budzier, “The Oxford Olympics Study 2016: Cost and Cost
Overrun as the Games.” Working Paper July 2016, Said Business School, University of Oxford, (2016).
Institute of Population and Social Security Research. Population Projection for Japan: 2015-2065, (2017).
Institute of Urban Strategies. “2020-Nen Tokyo Olinpikku Paralinpikku Kaisai Ni Tomonau Wagakuni Eno
Keizai Hakyu Kouka [Economic Impacts of Hosting 2020 Tokyo Olympic and Paralympic Games]. The Mori
Memorial Foundation, (2014) (in Japanese).
International Monetary Fund. Regional Economic Outlook: Asia Pacific, Preparing for Choppy Seas,
Washington D.C., 2017.
Japan Center for Economic Research. ESP Forecast: Monthly Survey of Professional Forecasters in Japan,
November 2017.
75TRIL ATERAL ECONOMIC REPORT
2 0 1 7
References

Mano, Yoshiyuki and Mitsubishi Research Institute, Olinpikku Regashii: 2020-Nen Tokyo Wo Kou Kaeru [Olympic Legacy: How it is going to change Tokyo in 2020], Tokyo: Popular Publishing, 2013 (in Japanese).
Miyoshi, Koyo, and Masaru Sasaki. “The Long-Term Impacts of the 1998 Nagano Winter Olympic Games in
Economic and Labor Market Outcomes.” Asian Economic Policy Review, vol. 11 iss. 1 (2016): 70-90.
Mizuho Research Institute. “2020-Nen Tokyo Olinpikku Paralinpikku No Keizai Kouka” [“Economic Impacts of
2020 Tokyo Olympic and Paralympic Games”], One Think-Tank Report (2017) (in Japanese).
Nagano, City of. Dai 18 Kai Olinpikku Touki Kyougi Taikai Nagano-Shi Houkokusho [Report by the City of Nagano on the XVIII Olympic Winter Games]. Nagano: 1999.
Nagano Economic Research Institute. “Nagano Olinpikku Ga Motarashita Mono” [“What Nagano Olympic
Games brought”], Hokuriku No Shiza vol. 4 (1999) (in Japanese).
Organizing Committee for the Games of the XVIII Olympiad. The Games of the XVIII Olympiad, Tokyo 1964: The Official Report of the Organizing Committee . Tokyo: 1966.
Organizing Committee for the XI Olympic Winter Games, Sapporo 1972. The XI Olympic Winter Games Sapporo 1972: Official Report. Sapporo: 1973.
Organizing Committee for the XVIII Olympic Winter Games, Nagano 1998. The XVIII Olympic Winter Games: Official Report. Nagano: 1998.
Sakamoto, Kazumitsu. “Olinpikku To Keizai” [“Olympics and the Economy”], Reference, National Diet Library,
(2016) (in Japanese).
Sapporo, City of. “Sapporo Touki Olinpikku Paralinpikku: Kaisai Gaiyou Keikaku Ni Yoru Keizai Hakyuu Kouka
Shisan” [“Projection of the Economic Effects of the Sapporo Olympics and Paralympic Winter Games based
on the Outline of the Proposal”], (2016) (in Japanese)
Sapporo, City of. 2026-Nen Hokkaido Sapporo Olinpikku Paralinpikku Touki Kyougi Taikai: Kaisai Teiansho
[Proposal to Host the 2026 Hokkaido Sapporo Olympic and Paralympic Winter Games], (2016) (in Japanese).
Sapporo, City of. 2026-Nen Hokkaido Sapporo Olinpikku Paralinpikku Touki Kyougi Taikai: Kaisai Teiansho Shiryohen [Reference Materials for the Proposal to Host the 2026 Hokkaido Sapporo Olympic and Paralympic Winter Games], (2016) (in Japanese).
Tokyo Metropolitan Government. “Tokyo 2020 Taikai Kaisai Ni Tomonau Keizai Hakyuu Kouka [“Economic
Impacts of Hosting Tokyo 2020 Games”], (2017) (in Japanese).
Tokyo Organising Committee for the Olympic and Paralympic Games. “Soshiki Iinkai Yosan To Sonota Keihi,
Zentaizou (Barjon 1)” [“Overview of the Organising Committee’s Budget and Other Costs (version 1)”], (2016)
(in Japanese).
United Nations. World Population Prospects: The 2017 Revision (2017).
76

3. ROK
Agha et al, “Considering legacy as a multi-dimensional construct: The legacy of the Olympic Games”, Sport Management Review, Vol. 15 (2012).
Banmossy and Stephens, “Utah Image and Awareness: The Post-Olympics European Study“, working papers,
David Eccles School of Business; Utah. Division of Travel Development (2003).
Bondonio and Campaniello, “Torino 2006: An Organizational and Economic Overview“, OEMERO working
paper n. 1 (2006).
Chappelet, “From Lake Placid to Salt Lake City: The Challenging Growth of the Olympic Winter Games Since
1980”, European Journal of Sport Science, vol. 2 iss. 3 (2002).
Flyvbjerg and Stewart, “Olympic Proportions: Cost and Cost Overrun at the Olympics 1960-2012“, Saïd
Business School working papers (2012).
IOC, Olympic Games: Legacies and Impacts (2013).
IOC, Factsheet the Olympic Winter Games (2013).
IOC, Report of the IOC 2014 Evaluation Commission (2014).
IOC, Report of the IOC 2018 Evaluation Commission (2018).
Nagano Economic Research Institute. “Nagano Olinpikku Ga Motarashita Mono” [“What Nagano Olympic
Games brought”] Hokuriku No Shiza vol. 4 (1999) (in Japanese).
Pilipenko, The Sochi 2014 Winter Olympics – the cost-benefit analysis and ways to improve the project
efficiency, Pan-European Institute (2013)
PWC, Global Summary of the Impact of the 2010 Olympic and Paralympic Winter Games on British Columbia
and Canada 2003 to 2010 (2011).
Ralston et al, “What are the Economic Impacts on a Nation Hosing the Olympics“, USSR Working Paper (2008).
Zimbalist, Andrew, “Is It Worth It? Hosting the Olympic Games and Other Mega Sporting Events is an Honor
Many Countries Aspire to – but why? “, Finance and Development (2010).
77TRIL ATERAL ECONOMIC REPORT
2 0 1 7
References

CHEN Jian
Mr. CHEN Jian is the vice president of the China Society of
Economic Reform (CSER), the chief expert of the Beijing Reform
and Development Research Association (the former Beijing
Olympic Economy Research Association), and the director of the
Beijing-Zhangjiakou Winter Olympic Games Research Institute.
He obtained his master’s degree from the School of Economics,
Jilin University, and a bachelor’s degree from the Department of
Economy, Anhui University.
SAITO Jun
Professor Jun SAITO is currently a visiting professor at the
Department of Economics and Business, International Christian
University. He is also a senior research fellow at the Japan Center
for Economic Research. He served as the Director-General of the
Economic Research Bureau at the Cabinet Office of the Japanese
Government from 2007 to 2012. He received Bachelor and Master
of Economics degrees from the University of Tokyo and studied at
the University of Oxford, receiving an MPhil in Economics.
JOO Won
Dr. JOO Won is currently a deputy director at the Economic
Research Department, Hyundai Research Institute (HRI). He has
worked for the HRI since 2001. He obtained a Ph.D. in Economics
at Korea University.
OH Jun-beom
Mr. OH Jun-beom is currently a senior researcher at the Economic
Research Department, Hyundai Research Institute (HRI). He has
worked for the HRI since 2013. He graduated from Konkuk University
and obtained a Master of Economics at Seoul National University.
78
References

About Trilateral Cooperation Secretariat
The Trilateral Cooperation Secretariat (TCS) is an intergovernmental organization established with a vision to
contribute to peace, stability and prosperity of the East Asian region. Upon the agreement signed and ratifies
by the three governments of the People’s Republic of China, Japan and the Republic of Korea, the TCS was
inaugurated in Seoul, September 2011.
The TCS is mandated to promote cooperation and co-prosperity among the three countries. The primary
mandate is to support the trilateral consultative mechanisms including providing reference to newly
established mechanisms. We also aim to become the hub of trilateral cooperation by organizing multiple
projects and events. Additionally, we conduct research, explore new initiatives and promote public
understanding of trilateral cooperation.
2016 Trilateral Economic Report
Published in March, 2018
Published by LEE Jong-heon, Secretary-General, Trilateral Cooperation Secretariat (TCS)
Supervised by YAMAMOTO Yasushi, Deputy Secretary-General, TCS
HAN Mei, Deputy Secretary-General, TCS
JANG Eun-young, Director of Economic Affairs, TCS
Edited by SAKAI Marina, Economic Affairs Officer, TCS
HUANG Wandi, Economic Affairs Officer, TCS
Address S-Tower 20th FL, 82 Saemunan-ro, Jongro-gu, Seoul, Korea 110-700
Phone +82-2-733-4700
Website www.tcs-asia.org
Email [email protected]
Book design BOMYUNG Communication
The booklet will be available at the TCS website.
For further inquiry, please contact the Department of Economic Affairs of the TCS.
Copyright ©2018 by Trilateral Cooperation Secretariat. All rights reserved.
79TRIL ATERAL ECONOMIC REPORT
2 0 1 7


www.tcs-asia.org
TRILATERALECONOMICREPORT
2017