Jahrgang 15 ISSN 1611-227X 29. April 2017 Nr. 04 - Schibri ...
Upload
khangminh22Category
view
3download
0
2017ECONOMIC
REPORTON INDONESIA
ISSN 0522-2572
VISION
MISSION
STRATEGIC VALUES
To be a credible institution and the best central bank in the region by strengthening the strategic values held as well as through the achievement of low inflation along with a stable exchange rate.
To achieve rupiah exchange rate stability and maintain the efficacy of monetary policy transmission in order to drive quality economic growth.
To nurture an effective and efficient national financial system that can withstand internal and external shocks in order to support the allocation of funding/financing that contributes to national economic stability and growth.
To ensure a secure, efficient and smooth payment system that contributes to the domestic economy and helps maintain monetary as well as financial system stability whilst broadening access in the national interest.
To build and maintain the organization and human resources of Bank Indonesia, who are performance based and honour integrity, as well as to enforce good corporate governance in the implementation of tasks as mandated in prevailing laws.
The values that form the basis of Bank Indonesia, the management and employees to act and or behave, consisting of Trust and Integrity – Professionalism – Excellence – Public Interest – Coordination and Teamwork.

iv |
CONTENTS
Contents iv
Tables vii
Charts ix
Diagrams and Figures xvi
Bank Indonesia Board of Governors xviii
Foreword xx
General Review xxv
Chapter 1Global Economy 1
1.1. Global Economic Dynamics 2
1.2. Global Policy Responses 9
1.3. International Cooperation 13
Chapter 2Economic Growth 17
2.1. GDP by Expenditure 18
2.2. GDP by Economic Sector 24
2.3. Employment and Welfare 27
2.4. Regional Economic Dynamics 28
Box 2.1. Household Consumption and Income Dynamics 36
Contents • 2017 ECONOMIC REPORT ON INDONESIAiv |
2017 ECONOMIC REPORT ON INDONESIA • Contents | v
Chapter 3Indonesia’s Balance of Payments 39
3.1. Current Account 40
3.2. Capital and Financial Account 47
3.3. External Resilience 50
Chapter 4The Exchange Rate 55
4.1. Dynamics of the Rupiah Exchange Rate 56
4.2. Capital Flows on the Domestic Foreign Exchange Market 60
4.3. Structure of the Domestic Foreign Exchange Market 61
Chapter 5Inflation 65
5.1. Core Inflation 66
5.2. Volatile Food Inflation 70
5.3. Administered Price Inflation 72
5.4. Regional Inflation 74
Box 5.1. Low Core Inflation Regime 79
Chapter 6Fiscal Policy 83
6.1. Fiscal Dynamics 84
6.2. State Revenue 85
6.3. State Expenditure 88
6.4. Deficit Financing 90
6.5. Regional Fiscal Policy 92
Box 6.1. The Impact of Infrastructure Development on Indonesia’s Economy 99
Chapter 7Monetary Policy 103
7.1. Interest Rate Policies And Minimum Reserve Requirement Ratio 104
7.2. Exchange Rate Policy 106
7.3. Financial Market Deepening 109
7.4. Monetary Policy Transmission 112
7.5. Monetary Policy Coordination 115
Box 7.1. Implementation and Evaluation of the Minimum Reserve Requirement Averaging Policy 120
Contents • 2017 ECONOMIC REPORT ON INDONESIAvi |
CONTENTS
Chapter 8Macroprudential Policy 123
8.1. Loan/Financing to Value Ratio Policy 124
8.2. Loan-to-Funding Ratio 125
8.3. Countercyclical Capital Buffer (CCB) Policy 126
8.4. Supporting the Development of Micro, Small, and Medium Enterprises 126
8.5. Macroprudential Policy Coordination 128
8.6. Developments in Financial System Stability 130
Box 8.1. Strengthening Bank Indonesia’s Supervisory Function 144
Chapter 10Outlook, Challenges, and Policy Direction 171
10.1. Economic Outlook 172
10.2. Economic Challenges 180
10.3. Policy Direction 191
Box 10.1. Impact of Economic Policy Packages on the Economy 199
Box 10.2. Regional Economic Growth Strategies 201
Box 10.3. Bank Indonesia’s Blueprint for Islamic Economic and Financial Development 203
Appendices 207
Chapter 9Payment System and Currency Management Policy 147
9.1. Non-cash Payment System Policy 148
9.2. Currency Management Policy 155
9.3. Payment System Performance 160
9.4. Currency Management Performance 162
Box 9.1. National Non-cash Movement and Toll Road Electronification 167
2017 ECONOMIC REPORT ON INDONESIA • Contents | vii
TablES
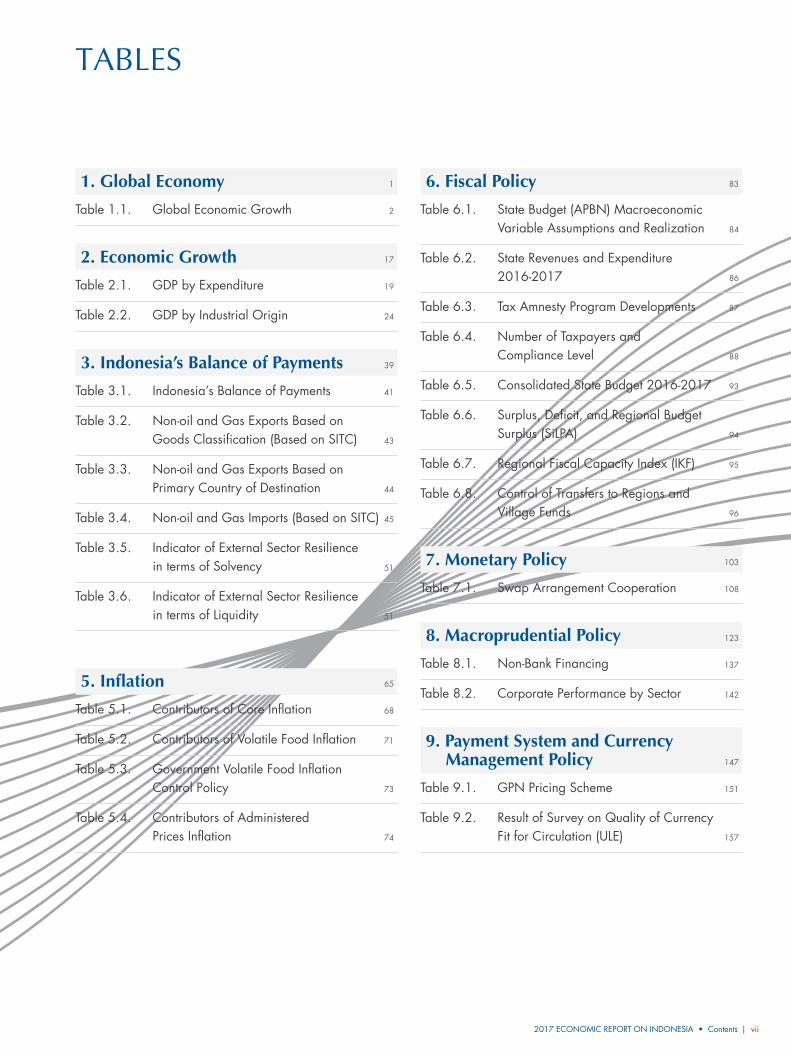
1. Global Economy 1
Table 1.1. Global Economic Growth 2
2. Economic Growth 17
Table 2.1. GDP by Expenditure 19
Table 2.2. GDP by Industrial Origin 24
3. Indonesia’s Balance of Payments 39
Table 3.1. Indonesia’s Balance of Payments 41
Table 3.2. Non-oil and Gas Exports Based on Goods Classification (Based on SITC) 43
Table 3.3. Non-oil and Gas Exports Based on Primary Country of Destination 44
Table 3.4. Non-oil and Gas Imports (Based on SITC) 45
Table 3.5. Indicator of External Sector Resilience in terms of Solvency 51
Table 3.6. Indicator of External Sector Resilience in terms of Liquidity 51
6. Fiscal Policy 83
Table 6.1. State Budget (APBN) Macroeconomic Variable Assumptions and Realization 84
Table 6.2. State Revenues and Expenditure 2016-2017 86
Table 6.3. Tax Amnesty Program Developments 87
Table 6.4. Number of Taxpayers and Compliance Level 88
Table 6.5. Consolidated State Budget 2016-2017 93
Table 6.6. Surplus, Deficit, and Regional Budget Surplus (SiLPA) 94
Table 6.7. Regional Fiscal Capacity Index (IKF) 95
Table 6.8. Control of Transfers to Regions and Village Funds 96
7. Monetary Policy 103
Table 7.1. Swap Arrangement Cooperation 108
8. Macroprudential Policy 123
Table 8.1. Non-Bank Financing 137
Table 8.2. Corporate Performance by Sector 142
9. Payment System and Currency Management Policy 147
Table 9.1. GPN Pricing Scheme 151
Table 9.2. Result of Survey on Quality of Currency Fit for Circulation (ULE) 157
5. Inflation 65
Table 5.1. Contributors of Core Inflation 68
Table 5.2. Contributors of Volatile Food Inflation 71
Table 5.3. Government Volatile Food Inflation Control Policy 73
Table 5.4. Contributors of Administered Prices Inflation 74
Contents • 2017 ECONOMIC REPORT ON INDONESIAviii |
TablES
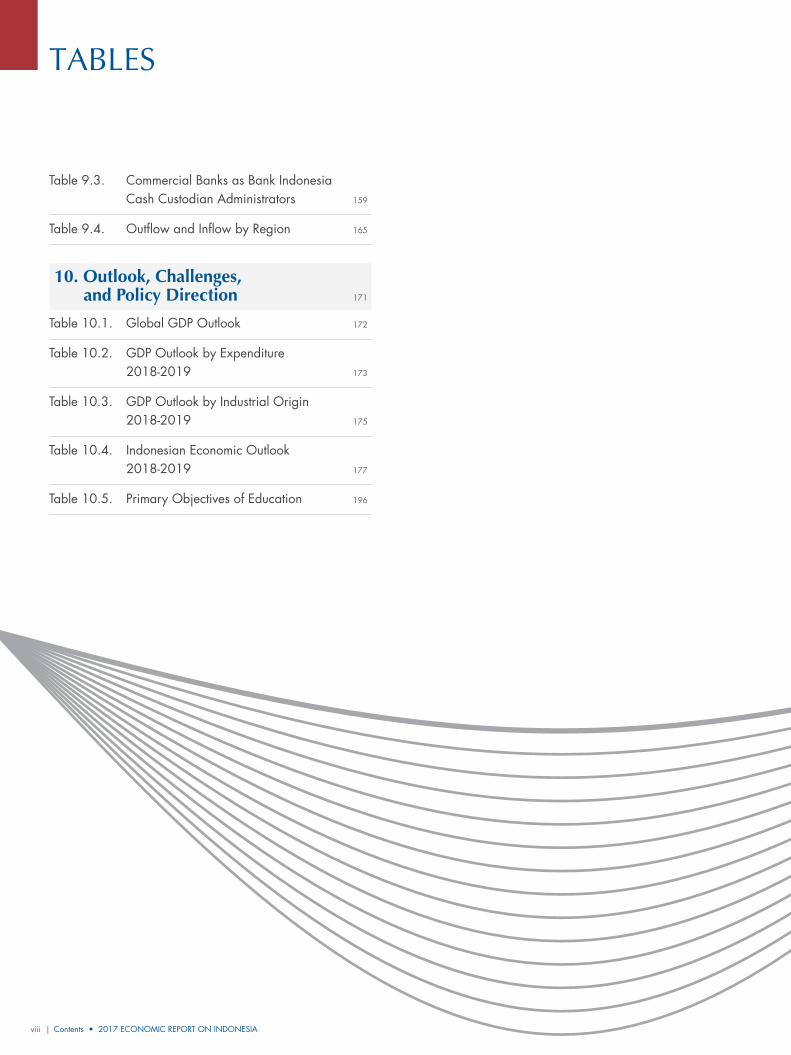
Table 9.3. Commercial Banks as Bank Indonesia Cash Custodian Administrators 159
Table 9.4. Outflow and Inflow by Region 165
10. Outlook, Challenges, and Policy Direction 171
Table 10.1. Global GDP Outlook 172
Table 10.2. GDP Outlook by Expenditure 2018-2019 173
Table 10.3. GDP Outlook by Industrial Origin 2018-2019 175
Table 10.4. Indonesian Economic Outlook 2018-2019 177
Table 10.5. Primary Objectives of Education 196
2017 ECONOMIC REPORT ON INDONESIA • Contents | ix
CharTS
1. Global Economy 1
Chart 1.1. Investment Growth of Advanced Countries 2
Chart 1.2. Inflation Rates of Advanced Countries 3
Chart 1.3. US Mining Sector Investment 3
Chart 1.4. US Manufacturing PMI and Industrial Output 3
Chart 1.5. US Unemployment Rate and Wage Growth 4
Chart 1.6. Use of Part Time Workers in the US 4
Chart 1.7. European Labour Market Indicators 4
Chart 1.8. Unemployment Rates of Advanced Countries 4
Chart 1.9. Japanese GDP Based on Contributions 5
Chart 1.10. Japanese Industrial Production and Export Index 5
Chart 1.11. Japanese Inflation, Core Inflation and Inflation Targets 5
Chart 1.12. Unemployment Rate and Part-Time Workers in Japan 5
Chart 1.13. Growth of Developing Countries 6
Chart 1.14. Chinese Manufacturing PMI and Industrial Profit 6
Chart 1.15. Chinese Investment Developments 6
Chart 1.16. Indian Currency Circulation Developments 7
Chart 1.17. Global Commodity Price Index 7
Chart 1.18. Global Energy Prices 8
Chart 1.19. Indonesia Exports Commodity Price Index (IHKEI) 8
Chart 1.20. Financial Market Volatility and Capital Flows of Developing Countries 9
Chart 1.21. Historical Pace of FFR Normalization 10
Chart 1.22. European Fiscal Space 10
Chart 1.23. Monetary Policy Interest Rate Changes in Emerging Economies 12
2. Economic Growth 17
Chart 2.1. Real Exports of Non-oil and Gas 19
Chart 2.2. Developments in Real Manufacturing Exports 20
Chart 2.3. Types of Investment and Utilization Capacity 20
Chart 2.4. Contribution of Non-Building Investment Growth to GDP 21
Chart 2.5. Free Cash Flow of Multi-Sectoral Issuers 21
Chart 2.6. Real Wages of Agriculture and Construction Workers 22
Chart 2.7. Consumer Confidence Index 22
Chart 2.8. Leisure vs Non-Leisure Consumption 23
Chart 2.9. Types of Household Consumption 23
Chart 2.10. Real Imports by Type 23
Chart 2.11. Imports of Transport Equipment and Parts 23
Chart 2.12. Contribution to GDP Growth from the Mining Sector 25
Chart 2.13. Coal Exports by Country of Destination 25
Chart 2.14. Industrial Production and Non-oil and Gas Export Index 25
Chart 2.15. Contribution to GDP Growth from the Manufacturing Industry Sector 26
Chart 2.16. Construction Development Projects 26
Chart 2.17. Retail Sales and Motor Vehicle Sales 26
Contents • 2017 ECONOMIC REPORT ON INDONESIA
CharTS
x |
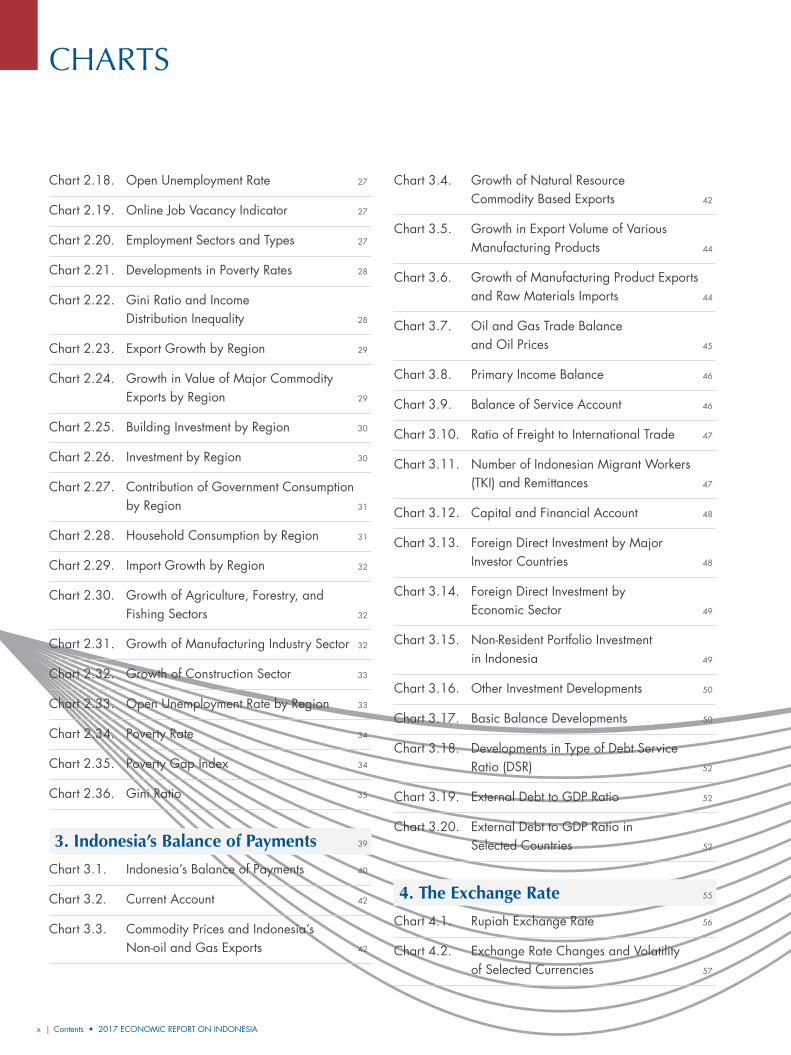
Chart 2.18. Open Unemployment Rate 27
Chart 2.19. Online Job Vacancy Indicator 27
Chart 2.20. Employment Sectors and Types 27
Chart 2.21. Developments in Poverty Rates 28
Chart 2.22. Gini Ratio and Income Distribution Inequality 28
Chart 2.23. Export Growth by Region 29
Chart 2.24. Growth in Value of Major Commodity Exports by Region 29
Chart 2.25. Building Investment by Region 30
Chart 2.26. Investment by Region 30
Chart 2.27. Contribution of Government Consumption by Region 31
Chart 2.28. Household Consumption by Region 31
Chart 2.29. Import Growth by Region 32
Chart 2.30. Growth of Agriculture, Forestry, and Fishing Sectors 32
Chart 2.31. Growth of Manufacturing Industry Sector 32
Chart 2.32. Growth of Construction Sector 33
Chart 2.33. Open Unemployment Rate by Region 33
Chart 2.34. Poverty Rate 34
Chart 2.35. Poverty Gap Index 34
Chart 2.36. Gini Ratio 35
3. Indonesia’s Balance of Payments 39
Chart 3.1. Indonesia’s Balance of Payments 40
Chart 3.2. Current Account 42
Chart 3.3. Commodity Prices and Indonesia’s Non-oil and Gas Exports 42
Chart 3.4. Growth of Natural Resource Commodity Based Exports 42
Chart 3.5. Growth in Export Volume of Various Manufacturing Products 44
Chart 3.6. Growth of Manufacturing Product Exports and Raw Materials Imports 44
Chart 3.7. Oil and Gas Trade Balance and Oil Prices 45
Chart 3.8. Primary Income Balance 46
Chart 3.9. Balance of Service Account 46
Chart 3.10. Ratio of Freight to International Trade 47
Chart 3.11. Number of Indonesian Migrant Workers (TKI) and Remittances 47
Chart 3.12. Capital and Financial Account 48
Chart 3.13. Foreign Direct Investment by Major Investor Countries 48
Chart 3.14. Foreign Direct Investment by Economic Sector 49
Chart 3.15. Non-Resident Portfolio Investment in Indonesia 49
Chart 3.16. Other Investment Developments 50
Chart 3.17. Basic Balance Developments 50
Chart 3.18. Developments in Type of Debt Service Ratio (DSR) 52
Chart 3.19. External Debt to GDP Ratio 52
Chart 3.20. External Debt to GDP Ratio in Selected Countries 52
4. The Exchange Rate 55
Chart 4.1. Rupiah Exchange Rate 56
Chart 4.2. Exchange Rate Changes and Volatility of Selected Currencies 57
2017 ECONOMIC REPORT ON INDONESIA • Contents | xi
CharTS
Chart 4.3. Developments in Volatility Index and Credit Default Swaps 57
Chart 4.4. Developments in US Dollar Index 58
Chart 4.5. Compliance Level of Prudential Principle (KPPK) Reporting Based on Number of Companies 59
Chart 4.6. Domestic Foreign Exchange Transactions and Rupiah Exchange Rate 60
Chart 4.7. Foreign Exchange Net Supply – Demand in Spot Market 60
Chart 4.8. Inflow of BI Certificate (SBI), Government Bonds (SUN), and Stocks 60
Chart 4.9. Indonesian Government Bond Yields 61
Chart 4.10. Comparison of Investment Yields in Selected Countries 61
Chart 4.11. Domestic Foreign Exchange Market 62
Chart 4.12. Bid-Ask Spread in US Dollar/Rupiah Spot Transactions 62
Chart 4.13. Spot Transaction Volume 62
Chart 4.14. Forward Transaction Volume 62
Chart 4.15. Swap Transaction Volume 63
Chart 4.16. Options Transaction Volume 63
5. Inflation 65
Chart 5.1. Consumer Price Index (CPI) Inflation and Its Targets 66
Chart 5.2. Monthly CPI Inflation Patterns 66
Chart 5.3. Core Inflation of Goods and Services 67
Chart 5.4. Durable Goods and Non-durable Goods Inflation 67
Chart 5.5. Monthly Core Inflation Patterns 68
Chart 5.6. Core Services Inflation 68
Chart 5.7. Demand Pull Inflation Indicators 68
Chart 5.8. Inflation Expectations 2017 69
Chart 5.9. Consensus Forecast, Sticky Price CPI, and Core Sticky Price CPI 69
Chart 5.10. Asset Prices and CPI 69
Chart 5.11. Property Price, Building Sector Commodity Price, and Housing Service Sector Rate 70
Chart 5.12. Global Commodity Prices 70
Chart 5.13. Non-oil and Gas External Pressure Indicator 70
Chart 5.14. Volatile Food Inflation 70
Chart 5.15. Dynamics of Volatile Food Inflation 71
Chart 5.16. Climate Indicator 71
Chart 5.17. Domestic Food Commodity Supply and Price 71
Chart 5.18. Global Food Prices and Volatile Food Inflation 72
Chart 5.19. Changes in Global Price (Corn, Oil) and Domestic Price (Chicken and Egg) 72
Chart 5.20. Commodities Supply from Abroad 72
Chart 5.21. Household Electricity Rates 73
Chart 5.22. Dynamics of Administered Prices Inflation in 2017 74
Chart 5.23. Fuel, Air Transport, and Electricity Rate Inflation 74
Chart 5.24. Distribution of Province Inflation 2017 75
Chart 5.25. Regional Inflation Comparison 75
Chart 5.26. Food Inflation by Region 76
Contents • 2017 ECONOMIC REPORT ON INDONESIA
CharTS
xii |
Chart 5.27. Disaggregation of Food Inflation by Region 76
Chart 5.28. Disaggregation of Sub-groups of Selected Spices by Region 76
Chart 5.29. Inter-regional Diversity Coefficient 76
Chart 5.30. Contribution of Electricity Tariff Inflation and Portion of Non-Subsidized 900 VA Electricity Customers 77
Chart 5.31. Air Transport Inflation by Region 77
6. Fiscal Policy 83
Chart 6.1. First Quarter and First Half Tax Revenue 2013-2017 85
Chart 6.2. Growth of Tax Revenue Components 86
Chart 6.3. Non-Oil and Gas Income Tax Growth 87
Chart 6.4. Growth of Non-Tax State Revenue Components 88
Chart 6.5. Tax Revenues and Tax Ratio 88
Chart 6.6. Growth of State Expenditure 88
Chart 6.7. Absorption of State Expenditure 89
Chart 6.8. Social Security Expenditure 89
Chart 6.9. Realization of Education Budget 90
Chart 6.10. Realization of Health Budget 90
Chart 6.11. Ratio of Subsidies, Infrastructure Budget, and Social Security Budget to State Expenditure 90
Chart 6.12. Fiscal Deficit and Primary Balance 91
Chart 6.13. Composition of Government Debt to GDP 91
Chart 6.14. Government Debt Ratios of Selected Countries 91
Chart 6.15. Position of Government Debt Based on Currency 92
Chart 6.16. Position of SBN Based on Currency 92
Chart 6.17. Comparison of Ministry/Institute Budget Expenditure Allocations and Transfer Funds 92
Chart 6.18. Revenue Budgets by Region 94
Chart 6.19. Composition of Revenue in State Budget by Region 2017 95
Chart 6.20. Locally-Generated Revenue (PAD) by Region 95
Chart 6.21. Composition of State Budget Expenditure 96
Chart 6.22. Composition of State Budget Expenditure by Region 96
Chart 6.23. State Budget Expenditure by Region 97
Chart 6.24. Distribution of Village Funds by Region 97
Chart 6.25. Local Government Deposits in Banks 98
7. Monetary Policy 103
Chart 7.1. Inflation Expectations and Realization in 2017 105
Chart 7.2. Policy Rate and Overnight Inter-Bank Money Market (PUAB O/N) Rate 105
Chart 7.3. Economic Policy Uncertainty (EPU) Index and Volatility Index (VIX) 105
Chart 7.4. Yield Curves for Monetary Operation Instruments 105
Chart 7.5. Monetary Operation Instruments Position 106
Chart 7.6. Composition of Conventional Forex Term Deposits by Tenor 107
Chart 7.7. Domestic Corporate and Retail Foreign Exchange Demand 107
2017 ECONOMIC REPORT ON INDONESIA • Contents | xiii
CharTS
Chart 7.8. International Reserves Position 108
Chart 7.9. Rupiah Money Market 109
Chart 7.10. Foreign Exchange Market 109
Chart 7.11. Issuances Certificates of Deposit 110
Chart 7.12. Value of Call Spread Option (CSO) Transactions 110
Chart 7.14. Jakarta Interbank Offered Rate (JIBOR) and PUAB Rate Spread 111
Chart 7.13. Repo Transactions 111
Chart 7.15. Policy Rate and Overnight Inter-Bank Money Market Rate Spread 112
Chart 7.16. Time Deposit Rates by Tenor 113
Chart 7.17. Credit Growth and Credit Interest Rates 113
Chart 7.18. Credit Interest Rates by Bank Group 113
Chart 7.19. Time Deposit and Credit Interest Rate Spread 114
Chart 7.20. Government Bonds (SBN) Yield by Tenor 114
Chart 7.21. Growth of M0 Components 115
Chart 7.22. Growth of M2 Components 115
Chart 7.23. Contribution of Components to M2 Growth 115
Chart 7.24. Contribution of Quasi Components 115
Chart 7.25. Contribution of Factors affecting M2 116
8. Macroprudential Policy 123
Chart 8.1. Growth of Housing Loan (KPR) and KPR Non-Performing Loan (NPL) 124
Chart 8.2. Growth of Housing Loan by Type of House 125
Chart 8.3. Loan-to-Deposits Ratio (LDR) and Loan-to-Funding Ratio (LFR) 125
Chart 8.4. Credit, Deposits and Securities Issued by Banks 125
Chart 8.5. Credit to GDP Gap Indicator 126
Chart 8.6. Financial Cycle 126
Chart 8.7. MSMEs Credit Ratio Target Achievement 127
Chart 8.8. MSMEs Credit Share 127
Chart 8.9. Financial System Stability Index 131
Chart 8.10. Growth of Bank Deposits 131
Chart 8.11. Lending Standard Index 131
Chart 8.12. Undisbursed Loan Ratio 132
Chart 8.13. Credit Growth in Five Major Economic Sectors 132
Chart 8.14. Credit Growth by Type of Use 132
Chart 8.15. Credit Growth by Region 132
Chart 8.16. Growth of NPL and NPL Ratio 133
Chart 8.17. NPL by Type of Use 133
Chart 8.18. NPL by Region 133
Chart 8.19. Banking Liquidity Ratio 133
Chart 8.20. Banking Efficiency 134
Chart 8.21. Banking Profitability 134
Chart 8.22. Capital Adequacy Ratio (CAR) 134
Chart 8.23. MSMEs Credit 134
Chart 8.24. MSMEs Credit Growth by Sector 135
Chart 8.25. Gross NPL in MSMEs Credit by Sector 135
Chart 8.26. Gross NPL in MSMEs Credit by Scale of Business 135
Contents • 2017 ECONOMIC REPORT ON INDONESIA
CharTS
xiv |
Chart 8.27. Financing, Funding, and NPF of Financing Companies 136
Chart 8.28. Source of Funding of Financing Company 136
Chart 8.29. Hedging and Premium Swap of Financing Company 136
Chart 8.30. Efficiency and Profitability of Financing Company 137
Chart 8.31. Growth of Insurance Assets and Investment 137
Chart 8.32. Ratio of Premium to Gross Claim 137
Chart 8.33. Net Domestic Financing Composition 138
Chart 8.34. Interest Rate and Bond Yield 138
Chart 8.35. Corporate Bond Yield 138
Chart 8.36. Volatility of Corporate Bond Yield 138
Chart 8.37. Government Bond (SBN) Yield 139
Chart 8.38. Volatility of Government Bond (SBN) Yield 139
Chart 8.39. Composite Stock Price Index (JCI) 139
Chart 8.40. JCI Sectoral Index 139
Chart 8.41. Assets, Disbursed Loans, and Third Party Funds 140
Chart 8.42. Sharia Banking Disbursed Financing and NPF 140
Chart 8.43. Sharia Banking Placement in Sharia Securities 141
Chart 8.44. Sales Growth, Asset Turnover Ratio, and Inventory Turnover Ratio 142
Chart 8.45. Debt-to- Equity Ratio (DER) and Interest Coverage Ratio (ICR) 143
9. Payment System and Currency Management Policy 147
Chart 9.1. Number and Composition of Financial Technology Participants 152
Chart 9.2. BI-RTGS Transaction 161
Chart 9.3. BI SSSS System Transactions 161
Chart 9.4. SKNBI System Transactions 161
Chart 9.5. ATM/Debit Transactions 162
Chart 9.6. Electronic Money Transactions 162
Chart 9.7. Credit Card Transactions 162
Chart 9.8. Growth of Delivery Channel Use 163
Chart 9.9. End-of-Year Position of Currency in Circulation (UYD) 163
Chart 9.10. Ratio of UYD to GDP and Household Consumption 163
Chart 9.11. Daily UYD 163
Chart 9.12. Currency in Circulation by Denomination 164
Chart 9.13. Outflow and Inflow through Bank Indonesia 164
Chart 9.14. Seasonal pattern of Outflow and Inflow 164
Chart 9.15. Number of Cash Custodian and Rupiah Withdrawal 165
Chart 9.16. Rupiah Withdrawal through Mobile Cash 165
Chart 9.17. Destruction of Currency Unfit for Circulation 165
Chart 9.18. Finding of Counterfeit Money by Police and Bank 166
2017 ECONOMIC REPORT ON INDONESIA • Contents | xv
10. Outlook, Challenges, and Policy Direction 171
Chart 10.1. Indonesia’s ‘Ease of Doing Business’ Ranking 174
Chart 10.2. Allocation of Subsidies and Social Assistance in State Budget 174
Chart 10.3. Tourism Competitiveness 176
Chart 10.4. Irrigation Development Progress 176
Chart 10.5. Irrigation Rehabilitation Progress 177
Chart 10.6. Inflation Forecasts 177
Chart 10.7. Development of National Strategic Projects and Electrical Power Programs 179
Chart 10.8. Estimated Completion of PSN Infrastructure Projects 179
Chart 10.9. Global Economic Productivity 181
Chart 10.10. Growth of GDP and Current Account 182
Chart 10.11. Indonesia’s Distance to Frontier 182
Chart 10.12. Infrastructure Ranking Comparisons 182
Chart 10.13. Quality of Indonesia’s Infrastructure 183
Chart 10.14. Digital Connectivity Comparisons 183
Chart 10.15. Average Comparison of School Year 183
Chart 10.16. Quality of Education Comparisons 183
Chart 10.17. Innovation Index 184
Chart 10.18. Ease of Doing Business Ranking 184
Chart 10.19. Government Governance Indicator Ranking 184
Chart 10.20. Corruption Perception Index 184
Chart 10.21. Composition of Indonesian Imports 185
Chart 10.22. Composition of Indonesian Exports 185
Chart 10.23. Share of Indonesian Sophisticated Product Exports 185
Chart 10.24. Relationship between Sophisticated Product Exports and GDP per Capita 185
Chart 10.25. Share of Manufacturing Industries in Various Countries 186
Chart 10.26. Comparison of Poverty Rates and Economic Gaps of Asian Countries 186
Chart 10.27. Regional Gross Domestic Product per Capita of Regencies/Cities in Java and Sumatra 187
Chart 10.28. Educational Opportunities for Children Until University Level in 2014 based on Household Economic Status in 2000 188
Chart 10.29. Asset Ownership Level by Household Group 188
Chart 10.30. Bank Interest Rate Spread 189
Chart 10.31. Volume of Bond Trading in Secondary Market 189
Chart 10.32. Foreign Ownership of Government Bonds 189
Chart 10.33. Internet Access and Cellular Telephones in Indonesia 190
Chart 10.34. Benefits of Digital Technology for Business, People, and Government 190
Chart 10.35. Education Budget 197
CharTS
Contents • 2017 ECONOMIC REPORT ON INDONESIAxvi |
diagramS aNd figurES
2. Economic Growth 17
Figure 2.1. Regional Economic Growth in 2017 29
5. Inflation 65
Figure 5.1. Determinants of Inflation in 2017 67
Figure 5.2. Regional Inflation in 2017 75
Figure 5.3. Price Disparities of Nine Major Essential Foods among Provinces in Indonesia 77
6. Fiscal Policy 83
Figure 6.1. Absorption of Local Government Expenditure in 2017 98
7. Monetary Policy 103
Figure 7.1. Number and Distribution of Regional Inflation Control Teams (TPID) in 2017 117
Figure 7.2. Six Strategic Steps to Control Inflation in 2017 118
Figure 7.3. Scope of National Strategic Food Price Information Centres (PIHPS) in 2017 119
9. Payment System and Currency Management Policy 147
Figure 9.1. National Payment Gateway (NPG) Logo 149
Figure 9.2. Interconnection and Interoperability 150
Diagram 9.1. NPG Ecosystem in Indonesia 150
Figure 9.3. Rupiah Distribution Channel in Bank Indonesia 158
10. Outlook, Challenges, and Policy Direction 171
Figure 10.1. National Strategic Projects 174
Figure 10.2. Achievements of Public-Private Partnerships (KPBU) and Non-Budget Investment Financing (PINA) 189
Figure 10.3. Targets of Public-Private Partnerships (KPBU) and Non-Budget Investment Financing (PINA) 198


Board of Governors • 2017 ECONOMIC REPORT ON INDONESIAxviii |
BANK INDONESIA BOARD OF GOVERNORS
AGUS D. W.MARTOWARDOJO
GOVERNOR
PERRY WARJIYO DEPUTY GOVERNOR
SUGENG DEPUTY GOVERNOR

2017 ECONOMIC REPORT ON INDONESIA • Board of Governors | xix
MIRZA ADITYASWARASENIOR DEPUTY GOVERNOR
ERWIN RIJANTO DEPUTY GOVERNOR
ROSMAYA HADI DEPUTY GOVERNOR

Foreword • 2017 ECONOMIC REPORT ON INDONESIAxx |
FOREWORD
Agus D. W. MartowardojoThe Governor of Bank Indonesia
2017 ECONOMIC REPORT ON INDONESIA • Foreword | xxi
“
“
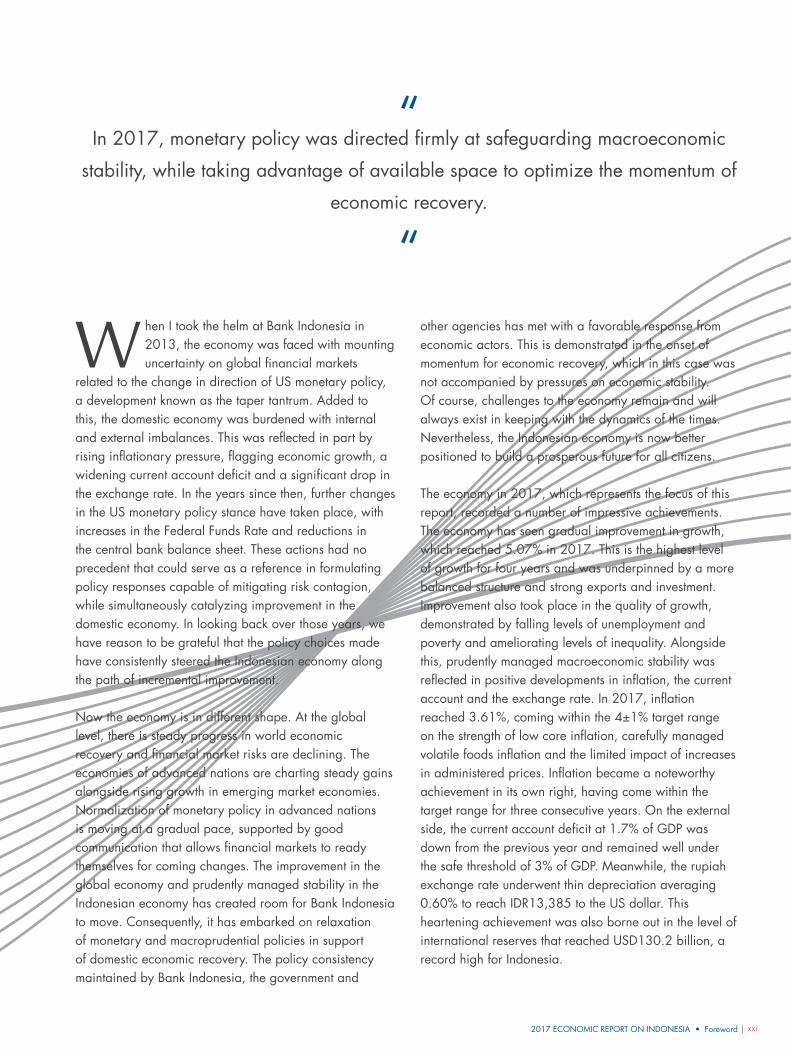
In 2017, monetary policy was directed firmly at safeguarding macroeconomic
stability, while taking advantage of available space to optimize the momentum of
economic recovery.
W hen I took the helm at Bank Indonesia in 2013, the economy was faced with mounting uncertainty on global financial markets
related to the change in direction of US monetary policy, a development known as the taper tantrum. Added to this, the domestic economy was burdened with internal and external imbalances. This was reflected in part by rising inflationary pressure, flagging economic growth, a widening current account deficit and a significant drop in the exchange rate. In the years since then, further changes in the US monetary policy stance have taken place, with increases in the Federal Funds Rate and reductions in the central bank balance sheet. These actions had no precedent that could serve as a reference in formulating policy responses capable of mitigating risk contagion, while simultaneously catalyzing improvement in the domestic economy. In looking back over those years, we have reason to be grateful that the policy choices made have consistently steered the Indonesian economy along the path of incremental improvement.
Now the economy is in different shape. At the global level, there is steady progress in world economic recovery and financial market risks are declining. The economies of advanced nations are charting steady gains alongside rising growth in emerging market economies. Normalization of monetary policy in advanced nations is moving at a gradual pace, supported by good communication that allows financial markets to ready themselves for coming changes. The improvement in the global economy and prudently managed stability in the Indonesian economy has created room for Bank Indonesia to move. Consequently, it has embarked on relaxation of monetary and macroprudential policies in support of domestic economic recovery. The policy consistency maintained by Bank Indonesia, the government and
other agencies has met with a favorable response from economic actors. This is demonstrated in the onset of momentum for economic recovery, which in this case was not accompanied by pressures on economic stability. Of course, challenges to the economy remain and will always exist in keeping with the dynamics of the times. Nevertheless, the Indonesian economy is now better positioned to build a prosperous future for all citizens.
The economy in 2017, which represents the focus of this report, recorded a number of impressive achievements. The economy has seen gradual improvement in growth, which reached 5.07% in 2017. This is the highest level of growth for four years and was underpinned by a more balanced structure and strong exports and investment. Improvement also took place in the quality of growth, demonstrated by falling levels of unemployment and poverty and ameliorating levels of inequality. Alongside this, prudently managed macroeconomic stability was reflected in positive developments in inflation, the current account and the exchange rate. In 2017, inflation reached 3.61%, coming within the 4±1% target range on the strength of low core inflation, carefully managed volatile foods inflation and the limited impact of increases in administered prices. Inflation became a noteworthy achievement in its own right, having come within the target range for three consecutive years. On the external side, the current account deficit at 1.7% of GDP was down from the previous year and remained well under the safe threshold of 3% of GDP. Meanwhile, the rupiah exchange rate underwent thin depreciation averaging 0.60% to reach IDR13,385 to the US dollar. This heartening achievement was also borne out in the level of international reserves that reached USD130.2 billion, a record high for Indonesia.
Foreword • 2017 ECONOMIC REPORT ON INDONESIAxxii |
The macroeconomic policies put in place successfully optimized the momentum for economic recovery, which was also seen to be structured in a healthier and more robust way. This was accomplished by focusing the policy mix of Bank Indonesia, the Government and the Financial Services Authority around three key objectives. First, to mitigate cyclical risks from the global and domestic environment in order to safeguard macroeconomic and financial system stability and build economic growth. Second, to accelerate the completion of the consolidation process in the domestic economy in order to boost economic growth. Third, to address the various structural problems in the domestic economy. The policy mix was pursued through synergy that brought together monetary, fiscal, macroprudential and structural reform policies, and also policies for the payment system and rupiah cash management.
In 2017, monetary policy was directed firmly at safeguarding macroeconomic stability, while taking advantage of available space to optimize the momentum of economic recovery. In the first half of 2017, the BI 7-Day Reverse Repo Rate, employed as the policy rate, was held at 4.75% in view of persistently high inflation expectations and risks of global uncertainties. Space opened up for monetary relaxation during the second half of 2017 in keeping with easing of risks within the context of prudently managed macroeconomic stability. Bank Indonesia responded by lowering the policy rate by 50 basis points in two rate cuts of 25 basis points each, first in August and subsequently in September 2017. It was envisaged that the cycle of interest rate reductions underway since 2016 would accelerate the ongoing business consolidation and pave the way for a period of economic recovery. In other developments, Bank Indonesia took further steps in reformulating the operational framework by launching the averaging reserve requirement, managing exchange rate movement in line with fundamentals while safeguarding the operation of market mechanisms, and promoting financial market deepening. Bank Indonesia also continued with the accommodative macroprudential policies that had been put in place to reverse the financial downturn, needless to say while continuing to strengthen financial system stability. At the same time, policy in the payment system focused on measures to support efficiency in the economy and ensure the secure, efficient and smooth operation of economic transactions.
For the government, the focus of fiscal policy was on delivering a stimulus for the economy while safeguarding fiscal sustainability. The government pursued measures to optimize revenues, improve the quality of expenditure and ensure efficient and sustainable management of financing. Government expenditure was targeted at productive sectors, while efficiency was improved in non-priority spending and measures were taken to promote a better balance between central and regional government expenditure. This strategy led to a two-fold increase in infrastructure spending over the level in 2013, before subsidy reforms were introduced. The strategy to raise infrastructure expenditure was also balanced by continued prioritization of short-term stimulus actions in order to strengthen domestic economic recovery. In other actions, the government also made further progress with its structural reforms.
Bank Indonesia has implemented policy in a consistent, timely and measured manner and has coordinated soundly with other relevant authorities throughout this process. This has had a positive effect on the sentiment of economic actors. Policy consistency strengthens credibility, making policy effective in supporting the performance of the economy. In this way, strong positive sentiment can be fostered among economic actors. The ratings issued by various international agencies for the Indonesian economy, in particular the investment grade ratings awarded by the three leading agencies, reflect Bank Indonesia’s success in applying this principle. Furthermore, significant improvement took place in our ease of doing business and global competitiveness ratings. Of course, having won this recognition, we will not rest on our laurels. Rather, these achievements have further convinced us of the importance of policy consistency, even as short-term interests or objectives also seek our attention. At this point, policy makers must have an accurate understanding of the direction of movement in the economy amid the clamor of its dynamics in order to develop appropriate policy options.
The Indonesian economy continues to face challenges in the pursuit of higher, more sustainable and more equitable growth. In the short term, a number of external and domestic challenges still call for vigilance. The normalization of US monetary policy and geopolitical dynamics represent external risks that must be monitored continually. At home, limited fiscal space, the ongoing
2017 ECONOMIC REPORT ON INDONESIA • Foreword | xxiii
corporate consolidation and suboptimal banking intermediation are causes for shared concern. In the longer term, a number of domestic risks warrant attention from us all. These challenges relate to the competitiveness of the economy, the strengthening of industrial capacity and capabilities, the provision of domestic sources of economic financing and the harnessing of advancements in digital technology.
In the face of these challenges, Bank Indonesia is continuing with a policy mix directed at safeguarding the macroeconomic and financial system stability achieved thus far. To achieve this, it is necessary to focus on monetary policy, macroprudential policies and payment system and rupiah cash management policies. On the government side, fiscal policy will consistently aim to stimulate the economy while safeguarding the outlook for fiscal sustainability. In 2018, fiscal policy will be pursued under the three key strategies of optimization of revenues, quality expenditure and sustainable financing. As before, these cyclical policies will be supported by structural policies aimed at resolving the structural issues that remain.
With these policy responses and the synergy forged with other authorities also responsible for the economy, Bank Indonesia expects that economic stability will remain well in hand in 2018 and will be accompanied by steady improvement in growth. The economy is forecast to grow in a range of 5.1% to 5.5%, buoyed primarily by domestic demand. Meanwhile, inflation in 2018 is predicted to remain under control within the target range of 3.5%±1%, although we must remain alert to risks related to food and energy prices. With conditions improving in the domestic economy, a slight increase is projected in the current account deficit, driven by the need for imports of raw materials and capital. The deficit will, however, remain at a sound level.
The 2017 Economic Report on Indonesia is a comprehensive record of the dynamics of the Indonesian economy. These dynamics are of interest for their own sake and also serve as lessons for the future. The book has been prepared by parties directly involved in developing policies at Bank Indonesia. That in itself lends a distinctive touch with a wealth of data, analysis and outlooks that were taken into account at the time policies were formulated, but could not be fully communicated until now. This book is also arranged with a smaller number of chapters than in previous years, which we hope will make comprehension easier for the reader.
On behalf of the Board of Governors of Bank Indonesia, permit us to present this 2017 Economic Report on Indonesia. Our hope is that this report will serve as a quality, trusted reference in preparing measures that will bring greater prosperity to the Indonesian economy amid ever-present challenges. To borrow from words coined by Bung Hatta, who proclaimed the independence of our nation, “Let the experience of our past be a guidepost, and not a rod that keeps us in bondage.”
May God the Almighty always bestow on us the abundance of His blessings and protect every step we take and all that we do.
Jakarta, March 2018The Governor of Bank Indonesia
Agus D. W. Martowardojo

2017 ECONOMIC REPORT ON INDONESIA • General Review | xxv
Optimizing Momentum, Reinforcing Structures
M acroeconomic stability in Indonesia strengthened further in 2017, in tandem with gradual progress in the economic recovery. Economic growth edged upwards and improvement in the structure of growth set in during the second half of the year. Economic gains were bolstered
by positive momentum from both global and domestic factors, although several challenges emerged that prevented a faster recovery. Bank Indonesia, the Government and the relevant authorities implemented policies aimed at leveraging positive momentum on several fronts to accelerate economic recovery. Simultaneously, measures were taken to reinforce the economy at a structural level. The policy stance remained consistent and successfully preserved macroeconomic and financial system stability, thereby paving the way for continued economic recovery. Looking ahead, policy responses will be strengthened further not only to bolster stability and mitigate risks, but also to support the economic outlook by making further structural improvements.
Indonesia’s economic recovery progressed gradually and at the same time became more stable. Economic growth edged upwards and improvement in the structure of growth were seen in the second half of the year. Growth in 2017 was recorded at 5.07%, up slightly from 5.03% in 2016. Macroeconomic stability was also well in hand, with inflation remaining within the target range, a prudent current account deficit level and a sufficiently stable exchange rate. Financial system stability was also carefully maintained, despite unresolved challenges relating to the still-limited performance in banking intermediation.
The direction of this economic recovery is reasonably positive, even though growth rose only marginally and was insufficiently broad-based. The government stimulus again provided an important source of growth during 2017, but private consumption also rose and the commodities sector continued to play a major role in lifting
the economy. Indications of structural improvement in economic growth became visible only during the second half of 2017, as private sector investment showed gains and exports of some manufactured products rose.
Indonesia’s economic recovery in 2017 would not have been possible without positive momentum in a variety of areas, which countered the multifaceted and lingering global and domestic challenges that arose. Positive momentum was generated by favorable global conditions, ongoing stability in the domestic economy and improving confidence among economic actors. Global challenges arose from normalization in the monetary policy of some advanced countries, which could have triggered capital reversal and threatened economic recovery in the developing world. Domestic challenges include the still incomplete consolidation within Indonesia’s corporate and banking sectors and the short-term impact of changes
GENERAL REVIEW
General Review • 2017 ECONOMIC REPORT ON INDONESIAxxvi |
in household behavior following changes in government spending, which were designed to improve the quality of its outgoings. In this regard, the policy responses of Bank Indonesia, the Government and relevant authorities focused on leveraging the positive momentum to promote more rapid economic recovery and reinforce the structure of the economy.
The recovery in the Indonesian economy is expected to continue. The path for further improvement is indicated by the structure of growth in 2017, which is marked by the beginning of increased private investment. Within this context, the rising levels of non-construction investment and imports of raw materials and capital goods give particular cause for optimism. Structural improvement in the economy was also supported by the onset of growth in exports of some manufactured products. Thus the economic outlook is optimistic, with policies for structural reform pursued consistently. Economic growth is expected to continue upwards, reaching a range of 5.1% to 5.5% in 2018 and a range of 5.8% to 6.2% in 2022, bolstered by increased productivity and economic competitiveness. Inflation will remain within the 3.5±1% target range in 2018 and will progressively ease to reach 3.0±1% in 2022. In addition, the current account deficit is predicted to remain at a sound level and to trend downwards in the medium term.
The drive to further strengthen the economy going forward will continue to face cyclical and structural challenges arising from global and domestic conditions. The cyclical or short-term global challenges arise from the ongoing normalization of monetary policy in advanced nations, renewed geopolitical turmoil and signs of rising protectionism. At home, the challenges relate to efforts to safeguard macroeconomic stability amid mounting risk of inflation and to speed up completion of the corporate and banking sector consolidation. Meanwhile, structural or medium-term challenges from the global environment will arise from the downward trend in productivity and the ageing populations in advanced nations. At home, structural challenges will arise from the drive for structural reinforcement of the economy in both the real and the financial sector. Advances in the digital economy present challenges that may transform the economic landscape of a range of sectors and, in this regard, Bank Indonesia, the Government and the relevant authorities are firmly committed to stability and economic recovery. Fiscal, monetary, macro-microprudential and structural policies,
including payment system and rupiah cash management policies, will be deployed to promote stronger and more balanced, sustainable economic growth.
MOMENtuM Of EcONOMIc REcOVERy
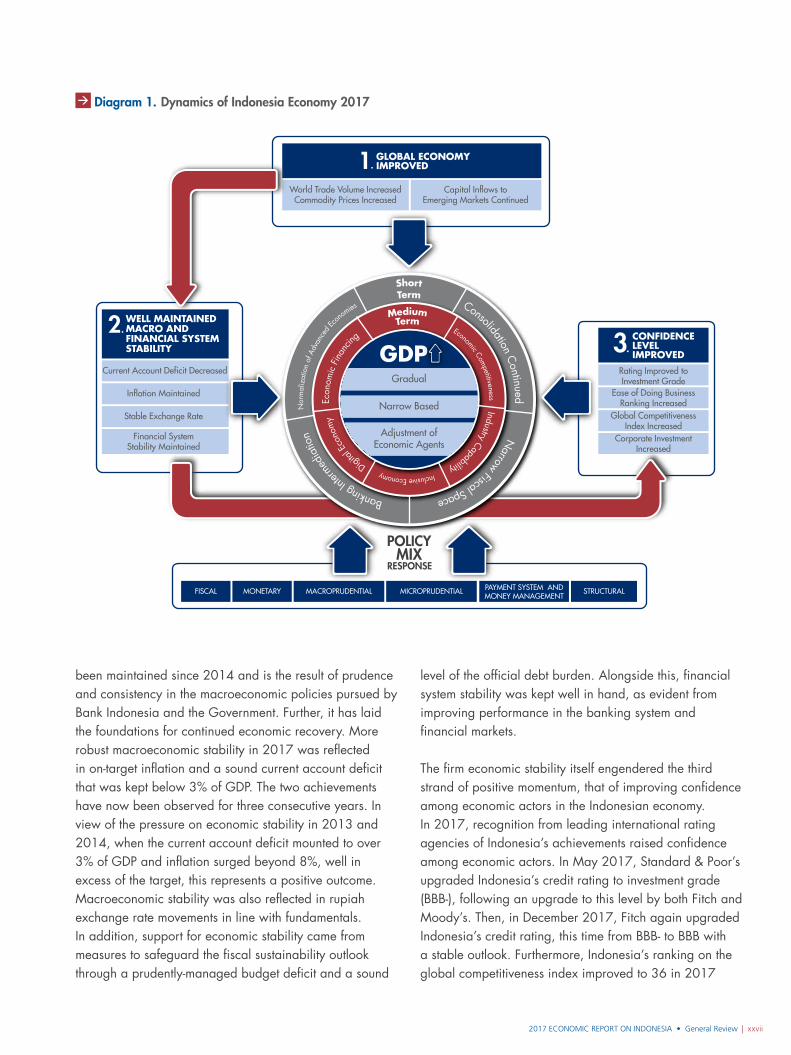
In 2017, Indonesia’s economic recovery was closely tied to positive momentum in three areas, triggered by favorable global and domestic conditions (Diagram 1). This positive momentum boosted the economic recovery and strengthened national economic resilience.
The most significant positive momentum came from the global economy. Rising global economic growth led to increases in world trade volumes and commodity prices and underpinned flows of capital to emerging market economies. In 2017, world GDP grew by 3.7%, ahead of both the 3.2% recorded in 2016 and forecasts made at the start of the year. Among Indonesia’s trading partners, advanced economies including the United States, the European Union (EU) and Japan charted more robust economic growth. In a similar vein, China, Indonesia’s most important trading partner among emerging market nations, managed to avoid a drastic economic slowdown by gradually rebalancing. This improvement in the global economy fueled increased demand and led to high growth in global trade volumes. This growth in world demand provided momentum for growth in Indonesia, by lifting its exports.
A significant increase in commodity prices in 2017 also gave Indonesia the opportunity to accelerate its domestic economic growth. These high commodity prices were driven by escalating demand and by supply-side problems in other producing countries. Prices for several key Indonesian export commodities, particularly coal, crude palm oil (CPO) and some metals, were significantly higher in comparison to 2016. The composite price for Indonesia’s non-oil and gas exports increased by 21.7% in 2017, sharply higher than the 5.4% price growth in 2016. This in turn strengthened Indonesia’s terms of trade and boosted domestic incomes.
The second factor behind the increased momentum for economic recovery is the ongoing and consistent macroeconomic and financial system stability. This has
2017 ECONOMIC REPORT ON INDONESIA • General Review | xxvii
been maintained since 2014 and is the result of prudence and consistency in the macroeconomic policies pursued by Bank Indonesia and the Government. Further, it has laid the foundations for continued economic recovery. More robust macroeconomic stability in 2017 was reflected in on-target inflation and a sound current account deficit that was kept below 3% of GDP. The two achievements have now been observed for three consecutive years. In view of the pressure on economic stability in 2013 and 2014, when the current account deficit mounted to over 3% of GDP and inflation surged beyond 8%, well in excess of the target, this represents a positive outcome. Macroeconomic stability was also reflected in rupiah exchange rate movements in line with fundamentals. In addition, support for economic stability came from measures to safeguard the fiscal sustainability outlook through a prudently-managed budget deficit and a sound
level of the official debt burden. Alongside this, financial system stability was kept well in hand, as evident from improving performance in the banking system and financial markets.
The firm economic stability itself engendered the third strand of positive momentum, that of improving confidence among economic actors in the Indonesian economy. In 2017, recognition from leading international rating agencies of Indonesia’s achievements raised confidence among economic actors. In May 2017, Standard & Poor’s upgraded Indonesia’s credit rating to investment grade (BBB-), following an upgrade to this level by both Fitch and Moody’s. Then, in December 2017, Fitch again upgraded Indonesia’s credit rating, this time from BBB- to BBB with a stable outlook. Furthermore, Indonesia’s ranking on the global competitiveness index improved to 36 in 2017
Diagram 1. Dynamics of Indonesia Economy 2017
Rating Improved toInvestment Grade
Ease of Doing BusinessRanking Increased
Global CompetitivenessIndex Increased
Corporate InvestmentIncreased
CONFIDENCELEVELIMPROVED3
WELL MAINTAINEDMACRO ANDFINANCIAL SYSTEMSTABILITY
2
Current Account Deficit Decreased
Inflation Maintained
Stable Exchange Rate
Financial SystemStability Maintained
GLOBAL ECONOMYIMPROVED1
World Trade Volume IncreasedCommodity Prices Increased
Capital Inflows toEmerging Markets Continued
POLICY
RESPONSEMIX
MONETARYFISCAL MACROPRUDENTIAL MICROPRUDENTIAL PAYMENT SYSTEM ANDMONEY MANAGEMENT
STRUCTURAL
GDPGradual
Narrow Based
Adjustment ofEconomic Agents
Digital
Eco
nom
y
Eco
nom
ic F
inan
cing
Economic Competitiveness Industry Capability Inclusive Economy
Banking Int
ermed
iatio
n
N
orm
aliz
atio
n of
Adv
ance
d Ec
onom
ies
Consolidation C
ontinued Narrow Fiscal Space
MediumTerm
ShortTerm
General Review • 2017 ECONOMIC REPORT ON INDONESIAxxviii |
from 41 the previous year, and in the Ease of Doing Business index to 72 in 2018, from 91 in 2017.
These positive developments boosted the confidence of both foreign and domestic economic actors in the Indonesian economy. Rising confidence led to higher inflows of foreign capital for direct and portfolio investments. In turn, the sizeable capital inflows provided a source of economic financing. At home, improved confidence was reflected in corporate investment and a renewed increase in capital expenditure, particularly during the second half of 2017. The steady improvement in confidence laid the foundations for a sustained economic recovery.
chALLENGES tO thE INdONESIAN EcONOMy IN 2017
Amid the positive momentum on multiple fronts, challenges emerged that hampered the pace of domestic economic recovery. These challenges were rooted in cyclical and structural problems, both global and domestic. To add to the complexity of the challenges, the Indonesian economy was simultaneously undergoing an adjustment phase in response to changes in the global and domestic environment. Taken together, these conditions held the domestic economy back from mounting a quick, robust recovery.
Four main cyclical challenges impeded economic recovery in 2017. First, the normalization of monetary policy by some advanced nations presented a challenge. Global financial markets were influenced by the direction of this monetary policy normalization, most importantly that undertaken by the United States. Even though markets were generally prepared for it, pressure on global financial markets did intensify at the end of the third quarter of 2017 as the US dollar strengthened over nearly every other currency. This pressure exacerbated uncertainty on global financial markets and in capital flows and threatened to rein in a more rapid global recovery, including in Indonesia. This became a challenge in itself, given the risk that normalization in advanced nations could cause instability by triggering a capital reversal from emerging markets, including Indonesia.
Second, the limited domestic fiscal space posed a challenge. It limited the Government’s capacity to create economic stimuli and to leverage positive momentum for the benefit of the domestic economy. The lack of a sizeable stimulus is explained in part by below-target taxation. In 2017, the tax ratio came to 9.9% of GDP, representing a decline compared to the preceding two years; the tax-to-GDP ratio in 2015 was 10.7% and in 2016 edged down to 10.4%. The capacity of fiscal stimuli to give a strong boost to the economic recovery was therefore limited, as evident in the dynamics of government financial operations during 2017.
Third, domestic corporate consolidation had not yet fully run its course, though it is now winding down. During this period of consolidation, companies generally did not expand, but instead were focused on putting their house in order. Corporate behavior was also influenced by adverse global developments in 2016 that damaged corporate confidence and discouraged them from expanding. In addition, corporate expansion plans were stifled by the modest fiscal stimulus and the still-sluggish household consumption. At the same time, bank intermediation underperformed, hitting corporate business financing and in turn impacting on corporate expansion. These factors led to inadequate levels of domestic non-construction investment, particularly in the first half of 2017. This was cause for concern because incorrect handling could have hampered the recovery process. For these reasons, short-term measures were taken to boost the confidence of domestic economic actors at a time when Indonesia was receiving positive recognition from abroad for the improvement in its economic fundamentals.
Fourth, as noted above, banking intermediation had not fully recovered, limiting the driving force of the economy. Slackness in credit growth was the result of both demand- and supply-side factors. On the demand side, the incomplete corporate consolidation slowed business expansion and therefore also demand for credit. At the same time, banks remained cautious and selective in extending new loans and continued to apply high lending standards.
The lack of strength in the recovery did not result only from cyclical challenges, but also from structural problems in the Indonesian economy. First, the limited capacity and capability of domestic industry is an obstacle, and is
2017 ECONOMIC REPORT ON INDONESIA • General Review | xxix
reflected in the commodity-based nature of exports and domestic-oriented nature of imports. In addition, a lack of competitiveness and the ongoing constraints in financing are also factors. These issues prevented the domestic economy from mounting an optimal response to the global recovery. Challenges also emerged from advancements in the digital economy that have potential to transform the medium-term landscape of both the real and financial sectors.
The challenges took on added complexity because, at the same time, various adjustments to the economy were being made by domestic authorities. The Government was making fiscal adjustments in keeping with its strategy of stimulating the economy while safeguarding the fiscal sustainability outlook. These fiscal adjustments prioritized capital expenditure by strengthening the role of infrastructure spending. This strategy, however, targets medium- and long-term strengthening of the economy and results in a reduction in the short-term fiscal stimulus. The fiscal adjustments were also related to a shift in subsidy strategy towards more precisely-targeted subsidies for individuals, such as the reforms in the fuel subsidy and increases in electricity billing rates. The changes in the electricity subsidies in 2017 contributed to price increases that in turn affected the consumption behavior of some households.
In addition, a shift in public behavior impacted the pace of economic recovery. This shift has been brought about by the millennial generation, new consumers who have been driving a move from goods-based consumption to consumption based on experience and leisure. As a result, there has been a short-term drop in consumption of goods. In the long run, shifts in behavior will need to be closely monitored because of their effect on the supply side of the economy.
In the midst of this adjustment process, the corporate sector sought alternative sources of financing outside the banking system and this helped mitigate the risks to economic recovery. Non-bank financing assumed an increasingly large role, as the role of financing from banks, which remained selective in their lending, declined.
Policy Responses in 2017
Macroeconomic policy responses in 2017 aimed to optimize the momentum for recovery, while reinforcing the economy at a structural level. To this end, the policy synergy forged in 2017 by Bank Indonesia, the Government and the Financial Services Authority (OJK) targeted three key areas. First, policies sought to mitigate cyclical risks from the global and domestic environment in order to safeguard macroeconomic and financial system stability as a basis for building economic growth. Second, policies were aimed at accelerating the completion of the domestic economic consolidation process in order to promote economic recovery. Third, policies were designed to correct a range of structural problems in the domestic economy. At the national level, the macroeconomic policy management responses were pursued through synergy that brought together fiscal, monetary, macro-microprudential and structural reform policies, including in the payment system and currency management.
The Government pursued a fiscal policy focused on stimulating the economy while safeguarding the fiscal sustainability outlook. In this regard, the thrust of the strategy for the state budget was threefold: (i) optimizing revenues; (ii) improving the quality of expenditure; and (iii) managing financing efficiently and sustainably. To this end, government spending was allocated to productive sectors, efficiencies were made in non-priority spending and a better fiscal balance between the central government and the regions was encouraged. This strategy was marked by increased infrastructure spending, which reached 19.4% of the state budget in 2017. This represents a twofold increase compared with 2013 – before state subsidies were reformed – when infrastructure accounted for only 9.4% of the state budget.
The strategy of increasing infrastructure expenditure was balanced with short-term stimuli that would immediately support the domestic economic recovery. The Government increased the budget for national priority and social safety net programs; social assistance was increased to IDR55.3 trillion, 11.5% higher than realized spending in 2016. At a practical level, more of the social assistance was disbursed during the second half of 2017, a factor that helped spur consumption during that period.
General Review • 2017 ECONOMIC REPORT ON INDONESIAxxx |
Efforts to create greater space for fiscal stimulus were, however, impeded by underperforming tax revenues. In 2017, tax revenues came in below the targets set in the 2017 Revised State Budget. Consequently, overall government spending was reined in to safeguard fiscal sustainability. This strategy ensured the 2017 fiscal deficit remained at a prudent and safe level of 2.5% of GDP, below the revised target of 2.9% of GDP. The deficit was financed by issuing government securities and by foreign debt. To improve the efficiency of financing, the Government carefully managed the denomination, timing and tenor of issuances of government securities. Accordingly, official debt was maintained at a low, prudent level of 29.2% of GDP.
Bank Indonesia’s policy mix comprises monetary, macroprudential, payment system and currency management policies. The most important of these were aimed at safeguarding macroeconomic and financial system stability and supporting recovery in the domestic economy. Bank Indonesia also strengthened coordination with the Government and other stakeholders in order to build synergy and enhance the effectiveness of policies. Further, Bank Indonesia worked hard to strengthen communications with stakeholders, with the intention of supporting the effectiveness of policies.
In 2017, monetary policy consistently sought to safeguard macroeconomic stability by taking advantage of available space for optimizing the recovery momentum. Bank Indonesia’s monetary policy stance was aligned with measures to keep inflation on target and hold the current account deficit at a prudent level. The maintained macroeconomic stability created space for Bank Indonesia to support the economic recovery process through prudent and measured relaxation of monetary policy. In the first half of 2017, Bank Indonesia’s policy rate, the BI 7-Day (Reverse) Repo Rate (BI7DRR), was held at 4.75% after taking account of rising inflation expectations and the fairly high and ongoing risks surrounding global uncertainty. Space opened up for monetary relaxation in the second half of 2017 as risks reduced, against a backdrop of prudently managed macroeconomic stability. Consequently, Bank Indonesia lowered the BI7DRR by 50 basis points in two rate cuts of 25 basis points each, one in August and the second in September 2017. It was envisaged that the interest rate reduction cycle underway since 2016 would accelerate the corporate consolidations
and lay the foundations for a period of economic recovery.
Bank Indonesia also continued to move ahead with changes to the monetary policy operational framework. This began in 2016 and is intended to improve monetary policy transmission. After the policy rate was changed to the BI7DRR in August 2016, reserve requirement (RR) averaging was put in place with effect from July 2017. The aim of this is to: (i) provide flexibility in managing liquidity and thus improve banking efficiency; (ii) serve as an interest rate buffer and thus reduce interest rate volatility on the money market; and (iii) provide space for liquidity placements in a way that promotes financial market deepening.
Bank Indonesia’s exchange rate policy sought to keep movement in the rupiah in line with fundamentals by promoting the operation of market mechanisms. Exchange rate policy was reinforced by improvements in the foreign exchange supply and demand structure, mandatory use of the rupiah in Indonesian national territory and the Implementing Activities for Prudential Principles (KPPK) for external debt management. These principles include the obligation for non-bank corporates with external debt exposure to comply with the hedging ratio, the minimum liquidity ratio and the minimum credit rating. This regulation is intended to mitigate exchange rate risk, liquidity risk and overleverage risk relating to external debt obligations. Bank Indonesia also expanded the range of instruments available on the foreign exchange market by issuing financial instruments in non-US dollar currencies. In addition, Bank Indonesia also promoted the use of local currency settlement (LCS) in trading transactions in order to reduce dependence on one particular currency. Exchange rate policy was also bolstered by strengthening of external sector resilience through adequate levels of international reserves, the first line of defense. Further, the role of the international financial safety net as the second line of defense was expanded.
Bank Indonesia also moved forward with its policy for financial market deepening. Measures for deepening the money market are divided into three pillars of development: (i) sources of economic financing and mitigation of risks; (ii) market infrastructure; and (iii) policy coordination, regulatory harmonization and education. Under the first point, Bank Indonesia promoted the
2017 ECONOMIC REPORT ON INDONESIA • General Review | xxxi
issuance of money market instruments by bank and non-bank corporates and encouraged domestic corporations to make use of hedging by supporting the provision of call-spread option (CSO) structured products. Second, Bank Indonesia raised the credibility of the Jakarta Interbank Offered Rate (JIBOR) as the reference rate for short-term funding. It also strengthened financial market infrastructure, including a new task force for establishment of the Indonesia Derivatives Central Counterparty, and improved the code of ethics for market actors. In pursuit of the third goal, Bank Indonesia built the capacity of market actors by improving the operational understanding of repo transactions and the Indonesia Global Master Repurchase Agreement (GMRA). These measures brought about positive outcomes as evident in the growth in transactions on the money market and foreign exchange market, the availability of a wider variety of instruments, an expansion of the investor base and improved credibility of financial market actors. These financial market developments led to improved monetary policy transmission, as the money market interest rate structure became more responsive to the Bank Indonesia monetary policy stance. Financial market deepening was also pursued with the aim of strengthening the resilience of the financial market to external shocks.
In 2017, macroprudential policies were directed at stimulating bank intermediation, again within a context of well-managed financial system stability. These policies were implemented by continuing the accommodative macroprudential policies that were already in place to correct the direction of the financial cycle, thus supporting the ongoing process of economic recovery. Relating to this, Bank Indonesia retained its policies concerning loan-to-value (LTV) and financing-to-value (FTV) for home mortgages and the accommodative loans-to-funding reserve requirement adopted previously. Under the policy for the countercyclical capital buffer (CCB), Bank Indonesia decided to hold the additional capital aggregate at 0%. This stance was intended to safeguard bank capacity for lending. Bank Indonesia implemented its policy for working towards more balanced bank intermediation by promoting financing and financial access for micro, small and medium enterprises (MSMEs). To this end, Bank Indonesia set out a phased increase in mandatory compliance with the MSME lending ratio. In 2016, a minimum MSME lending ratio of 10% was required, in 2017 this rose to 15% and in 2018 to 20%.
The focus of payment system policy is to support efficiency in the economy and assure the security, efficiency and smooth operation of economic transactions. To achieve these objectives, Bank Indonesia pursued a number of policies in the non-cash payments system. These policies targeted three main strategies: (i) promoting the interconnection and interoperability of domestic retail payment instruments, channels and infrastructure under the umbrella of the National Payment Gateway (NPG); (ii) expanding the electronification program for transport on toll roads and disbursement of social assistance; and (iii) a balanced response to advancements in the digital economy. These policy strategies were supported by measures to strengthen payment system monitoring. They include measures to eradicate crimes such as money laundering and terrorism financing, by monitoring business conducted by non-bank money changers and enforcing compliance.
In further actions relating to the NPG, Bank Indonesia launched a pricing scheme policy aimed at creating an equitable pricing structure that takes account of investment costs, but with transaction charges at levels not burdensome to the public. In June 2017, Bank Indonesia issued a regulation on the proper organization and structuring of the infrastructure, institutional framework, instruments and mechanisms of the NPG. Overall, the NPG will bring improvements to the management of the payments industry, with all domestic payments processed in-country using the rupiah at affordable prices. In addition, transaction data will be properly protected, a vital step in maintaining national security within the context of payment transactions and consumer protection.
Rupiah currency management policy also continued to focus on optimizing the role of cash payment instruments in support of the economy. This policy was to be developed via three pillars: (i) availability of quality, trusted currency; (ii) safe and optimum distribution and management of currency; and (iii) excellence in cash services. To improve currency distribution and cash services, Bank Indonesia made further improvements to cash management points, mobile cash services and the BI Jangkau outreach service for remote, outlying and border regions. To do this, it operated both through the Bank Indonesia office network and in collaboration with other banks or institutions.
General Review • 2017 ECONOMIC REPORT ON INDONESIAxxxii |
Bank Indonesia’s policies were also strengthened by synergizing with the Government and other stakeholders. Bank Indonesia and the Government coordinated on actions to safeguard macroeconomic stability, particularly in curbing inflationary pressure and promoting the real sector as part of the structural reforms. Coordination took place in various forums, including the inflation control and monitoring teams at both the central and regional government levels, and the Bank Indonesia–Central/Regional Government Coordination Meeting. Coordination with the Government on structural reforms took place within the task force for implementation of the economic policy packages (PKE). Within this, Working Group III – tasked with evaluation and analysis of the impact of economic policy – is the most important venue for coordination.
In financial system stability, Bank Indonesia continue its coordination with the Ministry of Finance, OJK and the Indonesian Deposit Insurance Corporation (LPS) in the Financial System Stability Committee (KSSK). This coordination covered the monitoring and maintenance of financial system stability, management of crises in the financial system and managing problems within systemically important banks. Bank Indonesia’s policy for safeguarding financial system stability was also supported by OJK policies, which require all activities in the financial services sector to be performed in an orderly, fair, transparent and accountable manner. The OJK policies also aim to ensure sustainable and stable growth in the financial system. In 2017, the OJK issued several regulations designed to strengthen the financial services sector. Actions by the OJK included the revocation of the rules for relaxation of debt restructuring, set out in OJK Regulation No. 11/POJK/03/2015 concerning Prudential Regulations for Commercial Banks within the Framework of Stimulus for the National Economy. This measure was taken in view of the improved condition of the banking system after internal consolidation. A number of strategic activities were also undertaken by OJK to development the supervisory function in the financial services sector, including development of the information system infrastructure for monitoring the financial services sector.
Bank Indonesia also strengthened coordination with the Government in the field of payment systems, mainly connected with actions to promote electronification. In managing rupiah cash, Bank Indonesia coordinated with
the police to prevent and eradicate the circulation of counterfeits.
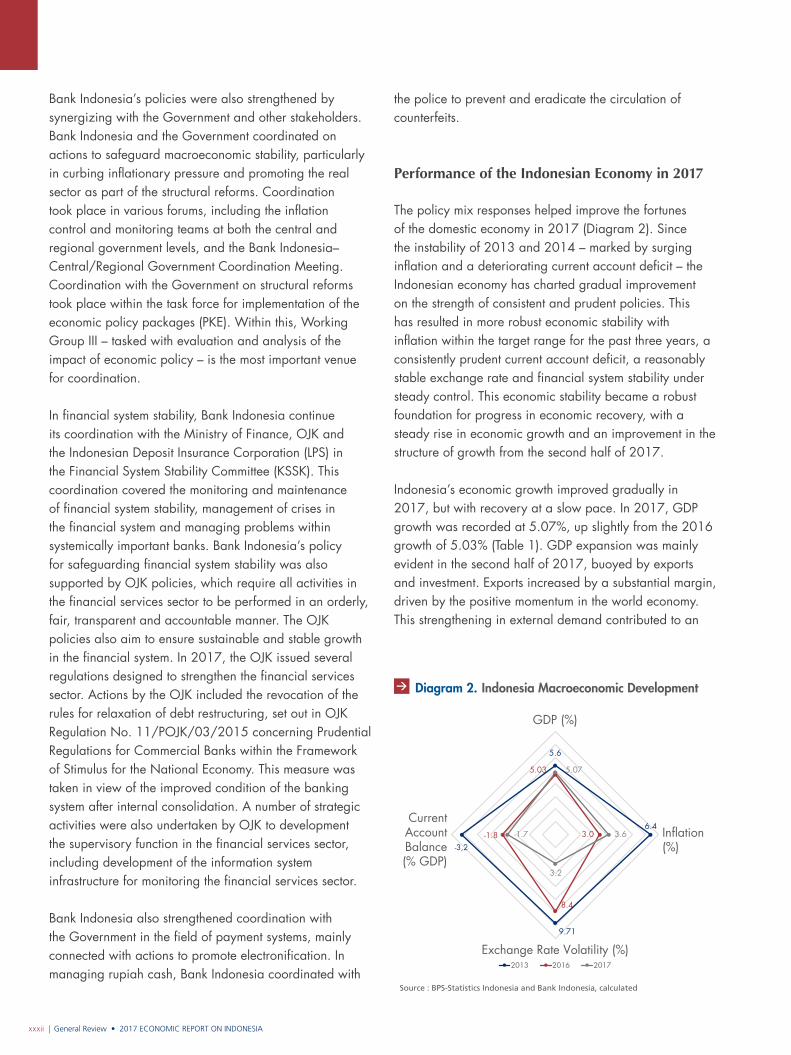
Performance of the Indonesian Economy in 2017
The policy mix responses helped improve the fortunes of the domestic economy in 2017 (Diagram 2). Since the instability of 2013 and 2014 – marked by surging inflation and a deteriorating current account deficit – the Indonesian economy has charted gradual improvement on the strength of consistent and prudent policies. This has resulted in more robust economic stability with inflation within the target range for the past three years, a consistently prudent current account deficit, a reasonably stable exchange rate and financial system stability under steady control. This economic stability became a robust foundation for progress in economic recovery, with a steady rise in economic growth and an improvement in the structure of growth from the second half of 2017.
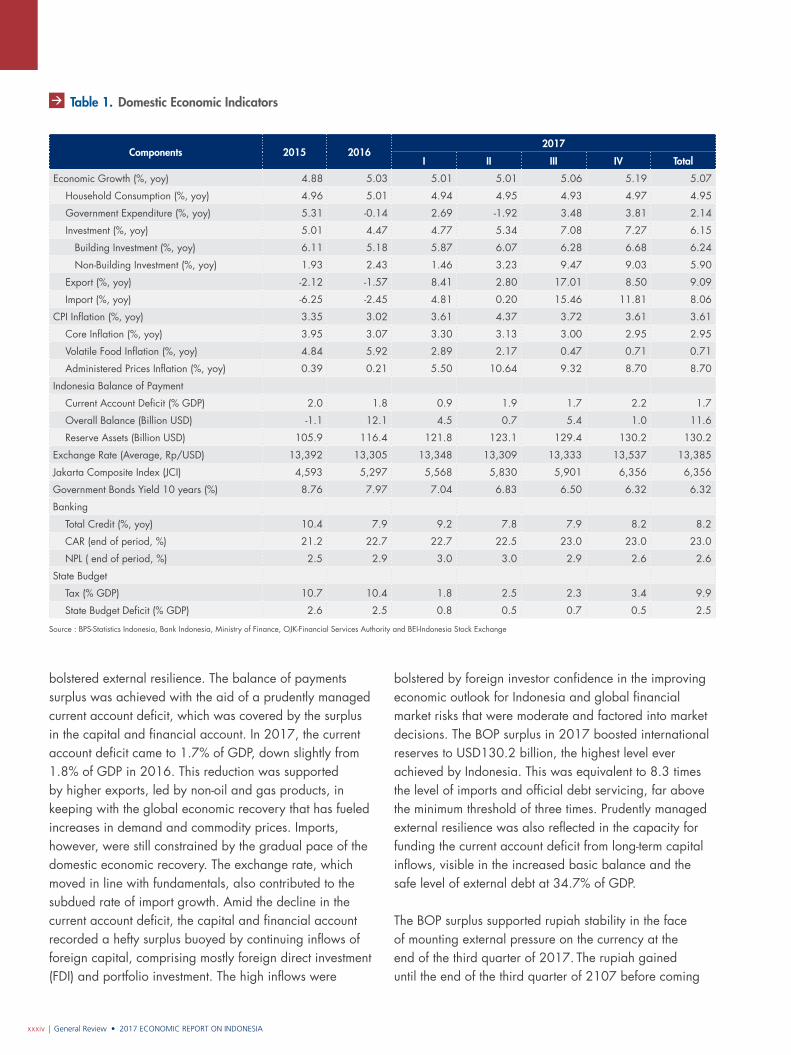
Indonesia’s economic growth improved gradually in 2017, but with recovery at a slow pace. In 2017, GDP growth was recorded at 5.07%, up slightly from the 2016 growth of 5.03% (Table 1). GDP expansion was mainly evident in the second half of 2017, buoyed by exports and investment. Exports increased by a substantial margin, driven by the positive momentum in the world economy. This strengthening in external demand contributed to an
Diagram 2. Indonesia Macroeconomic Development
5.6
6.4
9.71
-3,2
5.03
3.0
8.4
-1.8
5.07
3.6
3.2
-1.7
GDP (%)
Inflation(%)
Exchange Rate Volatility (%)
CurrentAccountBalance(% GDP)
2013 2016 2017
Source : BPS-Statistics Indonesia and Bank Indonesia, calculated
2017 ECONOMIC REPORT ON INDONESIA • General Review | xxxiii
easing of the corporate consolidation process and created space for corporates to expand. Brisk investment also received impetus from the fiscal stimulus, particularly in the second half of 2017 when work moved forward on various infrastructure projects. The increase in exports and investment, however, did not have an optimal effect in accelerating value creation in the domestic economy because, as in the past, some of this increase was offset by imports.
Indications point to improvement in the economic growth structure in 2017, although this was unevenly distributed. Structural improvements in the economy were manifested in higher exports and investment. As before, exports were dominated by commodities, although export growth was seen in some manufactured products, including basic chemicals, motor vehicles and iron and steel. Similarly, the renewed growth in non-construction investment was also bolstered by business activity tied to commodities, particularly agriculture and mining, as well as some forms of manufacturing.
Household consumption continued to play a limited role in driving economic growth. Although higher commodity prices and exports boosted incomes, household consumption lacked momentum and grew at 4.95%, or slightly below the level reached in 2016 of 5.01%. This is partly explained by changes in consumption in response to the increases in electricity costs in 2017. Early indications suggest the energy subsidy reforms have impacted household consumption in the short term, particularly within low-income groups, with consumption cut to cover the increase in bills. However, the distribution of social assistance did help to sustain household consumption within these groups. The enlarged fiscal space following the subsidy reforms has provided a boost to the economy through increased spending allocations for more productive activities.
The sluggish role of household consumption also represented the influence of income factors and changes of behavior in society. In overall terms, positive growth in personal bank deposits indicated that household incomes had been adequately maintained. However, no significant improvement was evident in income indicators for some groups in society, particularly low-income earners. Notably, real wage growth in the informal sector was limited. At the same time, there were indications
that middle and upper-class households were deferring consumption, placing greater emphasis on accumulating savings. Several factors weigh in on this condition, including income expectations and more rational, selective spending behavior. Furthermore, the millennial generation has also affected consumption patterns, having shifted spending away from conventional goods in favor of leisure. This shift in preferences contributed to less buoyant growth in goods consumption compared with 2016.
In 2017, improved GDP performance was not evenly distributed across business sectors. Sectors that did improve reflected the significant influence of resource-based exports, infrastructure development, and the shift in household consumption preferences. The primary sector powered the increased growth, driven by export demand, but only limited improvement took place in manufacturing. In other developments, the economy also received a boost from the construction sector, as work progressed on infrastructure projects. Further impetus for the economy came from the accommodation, food and beverages sector, transport and warehousing, and information and communications, in line with the shift in consumption preferences. In analysis by geography, a key element of economic gains was the upbeat growth in commodity-based regions, led by Kalimantan.
The recovery in the domestic economy had a positive impact on the quality of growth, which was accompanied by declining unemployment and a fall in poverty, albeit with a relatively flat Gini ratio. With the onset of improvement in the economy, unemployment eased slightly to 5.5% in August 2017 versus 5.6% in August 2016. The decline in unemployment is explained in part by advancements in digital technology. Its widespread use in economic activities created more job opportunities and provided a buffer against the downturn in formal employment in leading sectors, such as agriculture, mining and construction. This shift in employment also led to improvement in poverty figures. In 2017, the proportion of citizens living in poverty was recorded at 10.1%, representing an improvement over 10.7% in 2016. There was only limited amelioration of disparities, however, as evident from the Gini ratio that reached 0.391 or only slightly below the 2016 level of 0.394.
In 2017, the balance of payments (BOP) again recorded a surplus as positive global and domestic momentum
General Review • 2017 ECONOMIC REPORT ON INDONESIAxxxiv |
bolstered external resilience. The balance of payments surplus was achieved with the aid of a prudently managed current account deficit, which was covered by the surplus in the capital and financial account. In 2017, the current account deficit came to 1.7% of GDP, down slightly from 1.8% of GDP in 2016. This reduction was supported by higher exports, led by non-oil and gas products, in keeping with the global economic recovery that has fueled increases in demand and commodity prices. Imports, however, were still constrained by the gradual pace of the domestic economic recovery. The exchange rate, which moved in line with fundamentals, also contributed to the subdued rate of import growth. Amid the decline in the current account deficit, the capital and financial account recorded a hefty surplus buoyed by continuing inflows of foreign capital, comprising mostly foreign direct investment (FDI) and portfolio investment. The high inflows were
bolstered by foreign investor confidence in the improving economic outlook for Indonesia and global financial market risks that were moderate and factored into market decisions. The BOP surplus in 2017 boosted international reserves to USD130.2 billion, the highest level ever achieved by Indonesia. This was equivalent to 8.3 times the level of imports and official debt servicing, far above the minimum threshold of three times. Prudently managed external resilience was also reflected in the capacity for funding the current account deficit from long-term capital inflows, visible in the increased basic balance and the safe level of external debt at 34.7% of GDP.
The BOP surplus supported rupiah stability in the face of mounting external pressure on the currency at the end of the third quarter of 2017. The rupiah gained until the end of the third quarter of 2107 before coming
Table 1. Domestic Economic Indicators
Components 2015 20162017
I II III IV Total
Economic Growth (%, yoy) 4.88 5.03 5.01 5.01 5.06 5.19 5.07
Household Consumption (%, yoy) 4.96 5.01 4.94 4.95 4.93 4.97 4.95
Government Expenditure (%, yoy) 5.31 -0.14 2.69 -1.92 3.48 3.81 2.14
Investment (%, yoy) 5.01 4.47 4.77 5.34 7.08 7.27 6.15
Building Investment (%, yoy) 6.11 5.18 5.87 6.07 6.28 6.68 6.24
Non-Building Investment (%, yoy) 1.93 2.43 1.46 3.23 9.47 9.03 5.90
Export (%, yoy) -2.12 -1.57 8.41 2.80 17.01 8.50 9.09
Import (%, yoy) -6.25 -2.45 4.81 0.20 15.46 11.81 8.06
CPI Inflation (%, yoy) 3.35 3.02 3.61 4.37 3.72 3.61 3.61
Core Inflation (%, yoy) 3.95 3.07 3.30 3.13 3.00 2.95 2.95
Volatile Food Inflation (%, yoy) 4.84 5.92 2.89 2.17 0.47 0.71 0.71
Administered Prices Inflation (%, yoy) 0.39 0.21 5.50 10.64 9.32 8.70 8.70
Indonesia Balance of Payment
Current Account Deficit (% GDP) 2.0 1.8 0.9 1.9 1.7 2.2 1.7
Overall Balance (Billion USD) -1.1 12.1 4.5 0.7 5.4 1.0 11.6
Reserve Assets (Billion USD) 105.9 116.4 121.8 123.1 129.4 130.2 130.2
Exchange Rate (Average, Rp/USD) 13,392 13,305 13,348 13,309 13,333 13,537 13,385
Jakarta Composite Index (JCI) 4,593 5,297 5,568 5,830 5,901 6,356 6,356
Government Bonds Yield 10 years (%) 8.76 7.97 7.04 6.83 6.50 6.32 6.32
Banking
Total Credit (%, yoy) 10.4 7.9 9.2 7.8 7.9 8.2 8.2
CAR (end of period, %) 21.2 22.7 22.7 22.5 23.0 23.0 23.0
NPL ( end of period, %) 2.5 2.9 3.0 3.0 2.9 2.6 2.6
State Budget
Tax (% GDP) 10.7 10.4 1.8 2.5 2.3 3.4 9.9
State Budget Deficit (% GDP) 2.6 2.5 0.8 0.5 0.7 0.5 2.5
Source : BPS-Statistics Indonesia, Bank Indonesia, Ministry of Finance, OJK-Financial Services Authority and BEI-Indonesia Stock Exchange
2017 ECONOMIC REPORT ON INDONESIA • General Review | xxxv
under pressure from global factors. At this point, foreign investors engaged in portfolio rebalancing, a move triggered by external sentiment relating to US policy and one that put pressure on global currencies. This global sentiment triggered a wave of capital reversal that fueled depreciation in world currencies against the US dollar, with the rupiah also affected. Averaged over 2017, the rupiah weakened by a thin 0.60% to IDR13,385 to the US dollar from IDR13,305 to the US dollar in 2016.
Inflation in 2017 stayed within the target range, helping to safeguard macroeconomic stability, and came in at 3.61%, within the target range of 4.0%±1%. The subdued level of inflation was achieved with support from anchored inflation expectations, a largely stable rupiah exchange rate and management of demand-side pressures. Low inflation also benefited from adept management of pressure in domestic food prices, notably for volatile foods. Global food prices were low in 2017 and measures to secure domestic supply were successful. At the same time, administered prices (AP) inflation rose, primarily due to increases in electricity billing rates for some consumers following the subsidy reforms. Even so, the second-round effects of AP inflation on increases in other commodity prices was limited. Overall, inflation achievements in 2017 were positive, and the inflation target was reached for the third consecutive year.
Financial system stability was kept well in hand, despite a lack of full recovery in banking intermediation. Resilience was supported by strong levels of capital and adequate liquidity, but banking intermediation operated below par. Credit growth was slack and reached 8.2%, only slightly higher than the 2016 level of 7.9%, due to both demand and supply factors. Amid the lingering weakness in intermediation, positive developments were evident in non-bank financing, which recorded buoyant net growth of 32.2%. In the sharia financial sector, conditions were similar; the underperforming intermediation function in sharia banking was offset in the non-bank financing sector with growth in issuances of sukuk, Islamic bonds.
EcONOMIc OutLOOk ANd chALLENGES
Looking ahead, further improvement is predicted for the Indonesian economy with support from favorable
global and domestic factors. Global economic growth is projected to strengthen further in coming years, driven in the short term by both advanced countries and emerging market economies. However, in the medium and long term, emerging markets will play a greater role in driving global economic growth. This is explained by the structural problems of ageing populations and declining productivity that hamper growth in advanced economies, such as the United States, European nations and Japan. Overall, further global economic improvement has the potential to gradually strengthen commodity prices and this in turn will have a positive impact on the Indonesian economy.
With the steady improvement in the global economy, economic growth is predicted to climb in 2018 to a range of 5.1% to 5.5%. Progress in Indonesia’s economic recovery will not only be driven by global factors, but also by more vigorous domestic demand as confidence improves. The government fiscal stimulus, activity around the upcoming regional elections, the 2018 Asian Games and rising private incomes are all short-term sources of domestic demand from consumption. The fiscal stimulus for spurring short-term consumption will be delivered in part through significant increases in social safety net expenditures. In addition, the government commitment to infrastructure projects will stimulate investment going forward. Also contributing to the outlook for improved economic growth will be the corporate consolidation process, which is expected to start winding down in response to strengthening demand and growing confidence. This will improve the outlook for investment, including non-construction investment. At the same time, positive growth is forecast in exports – although at a slower rate than in 2017 – with reliance primarily on commodity exports in the short term.
The consumer price index (CPI) is predicted to remain within the target range, set lower for 2018 at 3.5%±1%. The subdued level of core inflation will be supported by greater anchoring of inflation expectations, a prudently managed exchange rate and supply-side capacity for responding to demand pressure. In the food staples category, various government policies aimed at improving supply and distribution are expected to keep volatile food (VF) inflation in check. In addition, the Government is likely to keep increases in strategic commodity prices to a minimum, so that they do not stoke inflationary pressures. The projections for subdued CPI inflation going forward
General Review • 2017 ECONOMIC REPORT ON INDONESIAxxxvi |
are also supported by improved behavior in inflation, such as the declining impact of exchange rate depreciation on inflation and the diminishing second-round effects of increases in administered prices and volatile foods on other commodities.
The financial and external sectors are also expected to improve. In the financial sector, bank lending is projected to rise by a range of 10% to 12% in 2018, consistent with the outlook for more robust economic growth. Similarly, depositor funds are also predicted to expand in the range of 9% to 11%. In the external sector, the 2018 current account deficit is projected to widen slightly to between 2.0% and 2.5% of GDP, still comfortably safe below 3%, in keeping with strengthening domestic demand.
The 2018 outlook for improvement in the economy will lay the ground for continued economic gains in the medium term. In the medium-term forecast for 2019 to 2022, the economy will maintain an upbeat course and growth will accelerate. In 2022, economic growth is forecast in a range of 5.8% to 6.2%. The sources of economic growth are also predicted to be broader-based and will not rely solely on commodity-based sectors. Improvement in the economy will be driven not only by the government stimulus, but also the growing role of the private sector. The more buoyant outlook for the economy is supported by the positive impact of the recent structural reforms, to which the Government has been firmly committed. The government drive to accelerate infrastructure build will also be supported by government policies for fiscal, institutional and regulatory reforms.
The improved prospects for the medium-term are influenced, among others, by productivity improvements in the economy driven by the Government’s structural reforms, which will support sustainable economic growth. From a geographical standpoint, support for the outlook for improved economic growth is expected from leading sectors of each region. The expectation of improved economic productivity is a factor influencing the lower inflation forecast of 3.0%±1% in 2022.
Amid the improving economic outlook, a careful watch must be kept on global and domestic short- and medium-term challenges, as there is a risk they could disrupt the acceleration of economic recovery. The short-term global challenges stem from the ongoing normalization
of monetary policy in advanced countries, renewed geopolitical turmoil and signs of rising protectionism. At home, short-term challenges remain similar to those in 2017 – the risk of contraction in capital inflows, the ongoing consolidation in the domestic economy and renewed constraints on fiscal space. Another short-term challenge will be to safeguard macroeconomic stability amid a growing risk of inflation linked to increases in prices of oil and food commodities. Meanwhile, medium-term challenges from the global environment will arise from a decline in total factor productivity and the ageing demographic of advanced nations. At home, various structural problems in the economy have led to challenges in improving economic competitiveness, building industry capacity and capability, bringing about an inclusive economy and providing sustainable financing. The interaction and complexity of these challenges means that the management of Indonesia’s economic stability will not become any easier than in past years.
Serious attention will also need to be paid in the medium term to advancements in the digital economy, including financial technology (fintech), given that it can transform the economic landscape. Fintech has the potential to make the economy more inclusive and boost economic productivity, and harnessing digital technology in the economy can help business processes to streamline and become more efficient. In the financial sector, digital technology has the potential to expand financial access and increase the speed of transaction processes. On the other hand, however, if appropriate responses are not made, there are risks that digital technology could disrupt the economy. Risks may stem from increasingly fierce market competition, reduced ability to provide employment and risks to financial system stability. Furthermore, the risk of limited capacity to provide employment, particularly for unskilled labor, could lead to worsened disparities.
Future Policy Direction
The dynamics of the Indonesian economy in 2017 contain key lessons on optimizing momentum in the economic recovery and reinforcing the economy structurally. First, Indonesia is on the right track for economic recovery. Growth is on a gradual upwards trend, supported by the stable economy. In Bank Indonesia’s view, this gradual improvement in Indonesia’s economic growth is part
2017 ECONOMIC REPORT ON INDONESIA • General Review | xxxvii
of a process of adjustment of behavior by economic participants at the early stages of the business expansion cycle. Looking ahead, the space for creating more vibrant economic growth will widen in keeping with strengthening confidence in the economic outlook. This is reflected in the fact that structural improvement in the sources of economic growth during 2017 did not rely only on the government stimulus, but also began to emerge from improvement in the private sector role. In this regard, the strengthening of confidence among economic participants is key in transforming the recovery momentum into higher, sustainable economic growth.
Second, the policies put in place will need to balance short-term and long-term stimuli and time their implementation appropriately. In the Indonesian economy, which is now embarking on a cycle of economic expansion, there is a pressing need for support from the fiscal stimulus. The stimulus delivered through infrastructure will have a longer-term impact on the economy, and needs to be balanced by a short-term stimulus. A short-term stimulus will protect public purchasing power and prevent momentum being lost in the drive for economic recovery. Attention must be paid to the timing of policy implementation, as this can affect economic adjustments in the short term and the subsequent process of economic recovery. An important lesson about timing of policy implementation can be seen in the provision of social assistance, which was delayed until the second quarter of 2017 and impacted economic recovery during that period.
Third, the credibility of macroeconomic policy management plays a vital role in strengthening economic recovery, enabling it to maintain momentum and remain on the right track. Consistency in macroeconomic policy management will convince economic actors of the credibility of authorities and the policy direction, which in turn will strengthen the effectiveness of implemented policies. Experience shows that policy consistency in safeguarding economic stability can bolster the confidence of economic actors in the outlook for the Indonesian economy. This is reflected in the steady level of economic stability, even though Bank Indonesia has embarked on measured relaxation of monetary and macroprudential policies. Besides this, the transformation of economic recovery into higher, sustainable economic growth will only be possible if the private sector participates. For this
reason, the confidence of economic actors needs to be progressively strengthened through consistency in a policy mix that contains fiscal, monetary and macroprudential policies, payment system and rupiah cash management policy and structural reforms.
Fourth, coordination with other stakeholders on key policies is crucial. Coordination is necessary to optimize the momentum for economic recovery, amid an increasingly complex set of challenges. Efforts to promote economic growth while safeguarding stability require a coordinated response on national macroeconomic policy from Bank Indonesia, the Government and other authorities. Fiscal policy must continue to provide an economic stimulus balanced between long-term and short-term objectives, while safeguarding the fiscal sustainability outlook. In monetary affairs, policy must be pursued with caution, with instruments optimized to safeguard economic stability, while creating space for economic growth. Meanwhile, an accommodative macroprudential policy will be maintained to optimize momentum for economic recovery, while safeguarding financial system stability. This cyclical policy response must also be reinforced with structural policies that not only accelerate the construction of physical infrastructure, but also address non-physical areas such as strengthening regulation and institutions. In this context, Bank Indonesia will introduce policies related to the payment system and financial market deepening.
Looking ahead, the risk of mounting uncertainty on global financial markets is one of the consequences of policy normalization in advanced economies. This means that efforts to safeguard economic stability and economic recovery will not be any easier than in past years. In looking at lessons learned in 2017, Bank Indonesia’s policy focus going forward will be to stay consistently focused on responding to challenges that may impair the outlook for the economy. Essentially, Bank Indonesia’s policy mix must achieve the right combination of policies to safeguard macroeconomic and financial system stability, the foundation for more robust, balanced and sustainable economic growth.
Bank Indonesia will persist with a policy mix aimed at maintaining the macroeconomic and financial system stability achieved thus far. The policy mix will be comprised of monetary policies, macroprudential policies and payment system and currency management
General Review • 2017 ECONOMIC REPORT ON INDONESIAxxxviii |
policies. Regarding monetary policy, Bank Indonesia will pursue a monetary policy stance aligned to the effort to keep inflation within the target range and the current account deficit at a safe level. To strengthen monetary policy effectiveness, Bank Indonesia will improve the implementation of RR averaging, further reinforcing the monetary policy operational framework. It will also strengthen monetary operations, including measures involving sharia-compliant monetary operations, pursue an exchange rate policy for maintaining exchange rate stability in line with fundamentals and continue measures for financial market deepening. Bank Indonesia will also build policy synergy with the relevant authorities in developing and promoting new sources of economic financing.
Bank Indonesia will strengthen macroprudential policies in order to stimulate bank intermediation within a context of well-managed financial system stability. The accommodative macroprudential policies will continue as a countercyclical measure to correct the direction of the financial cycle and support the continuation of the economic recovery. The strengthening of macroprudential policies will take place in three main areas: strengthening of liquidity, reinforcing the bank intermediation function and improvements in instrument effectiveness. Regarding the strengthening of liquidity, Bank Indonesia will implement a macroprudential liquidity buffer (PLM). To reinforce the quality of intermediation, Bank Indonesia will implement a macroprudential intermediation ratio (RIM) that comprises a strengthening of the loan-to-funding ratio (LFR). Concerning improvements in instrument effectiveness, Bank Indonesia will strengthen measures for the loan-to-value (LTV) policy, including the use of targeted LTV options. Macroprudential policies will also be supported by policies for development of MSMEs, as a supply-side measure that will counter inflationary pressures.
Regarding payment system policy, Bank Indonesia will support the efficient operation of the economy under the guidelines of the payment system and currency management (SP–PUR) blueprint for 2017 to 2024. Policy will be directed at ensuring that all economic transactions, both cash and non-cash, operate seamlessly, in a secure and efficient manner. This supports the maintenance of macroeconomic and financial system stability and also supports the Government in implementing its priorities.
In the non-cash payment system, Bank Indonesia policy will focus on shaping an interconnected, affordable, innovative and competitive payment ecosystem that protects its users. This will be achieved by: (i) promoting interconnection and interoperability of instruments, channels and infrastructure for domestic retail payments under the umbrella of the NPG; (ii) strengthening electronification; and (iii) ensuring the smooth operation of the registration process for fintech providers, including e-commerce, as outlined by the Bank Indonesia Regulation concerning Provision of Financial Technology. Regarding fintech, Bank Indonesia will strengthen coordination with other authorities to protect the domestic economy from any potential harm. These policies will be reinforced by the implementation of a risk-based supervision function to ensure compliance with Bank Indonesia policies. In the area of rupiah currency management, Bank Indonesia policy will focus on ensuring the provision of currency fit for circulation (ULE) in adequate quantities distributed to all outlying areas of Indonesian territory. This will be achieved through three key strategies: (i) building stronger synergy with various parties in cash services; (ii) ensuring that supply of quality rupiah currency is safeguarded and further enhancing security features; and (iii) improving the quality of rupiah currency and protecting the public from the risk of counterfeit rupiah currency.
In its effort to promote new sources of inclusive, quality and sustainable economic growth, Bank Indonesia will lend its full support to the development of the sharia economy and finance through the forum of the National Committee for Sharia Finance (KNKS). There is a large domestic and global market for sharia-compliant industries, including for halal products – products compliant with Islamic law. If these opportunities can be seized, this could potentially help in reinforcing economic structures – through domestic production – and the balance of payments. The national sharia economic and financial strategy will become increasingly important in realizing the significant potential of this market. Bank Indonesia will collaborate and coordinate with the relevant authorities to contribute to the development of the sharia economy and finance through three main strategies: (i) empowering the sharia economy; (ii) deepening the sharia financial market; and (iii) strengthening research, assessment and education about sharia economics and finance.
2017 ECONOMIC REPORT ON INDONESIA • General Review | xxxix
Turning to government measures, fiscal policy will consistently seek to deliver an economic stimulus that safeguards the fiscal sustainability outlook. In 2018, this policy will be pursued through optimization of revenues, quality expenditure and sustainable financing. On the revenues side, the Government will take several measures, including broadening the tax base through intensification and widening of coverage, increased taxpayer compliance and improvements to information systems and human resources in support of taxation. Regarding expenditure, the Government will make efficiency improvements in procuring non-priority goods, improve the effectiveness of social safety net programs, refocus government spending on infrastructure, health, education and targeted subsidies, and strengthen the quality of fiscal decentralization. In financing, the Government will work for efficiency and sustainability. Overall, the direction of fiscal policy is reflected in the 2018 budget deficit, which is targeted at 2.2% of GDP.
In the medium-term, the Government will work consistently to improve the quality of spending in productive sectors, supported by higher tax revenues. At the same time, the fiscal deficit will be maintained at a prudent level. The Government will also take measures to promote efficient and sustainable funding of the budget deficit, and will achieve this with prudent management of the debt ratio and the development of innovative sources of financing.
The Government, supported by relevant authorities, is firmly committed to moving forward with structural reform. Structural reform policies can be dived into three categories. The first covers the provision of adequate infrastructure of suitable quality, the building of innovation and the quality of human capital, and improvements in organization and structure that encompass the business climate, governance and government services. The second area is related to efforts to boost competitiveness in industry and services and efforts to ensure that the domestic economy is able to grow with inclusiveness, supported by sustainable financing. The third is related to preparation for the very rapid progress in digital technology, in order that it delivers the greatest possible benefits for the economy with minimal risk. The overarching objective of these policies is to support the achievement of robust, balanced, sustainable and inclusive economic growth.

| 1
CHAPTER 1
2017 ECONOMIC REPORT ON INDONESIA
The broad-based global economic recovery gained momentum in 2017, accompanied by increasing world trade volumes and rising commodity prices. The stronger global economy and the monetary policy normalization taking place within advanced economies was well anticipated by the markets, and therefore the risks to the global financial markets were lessened.
Global Economy
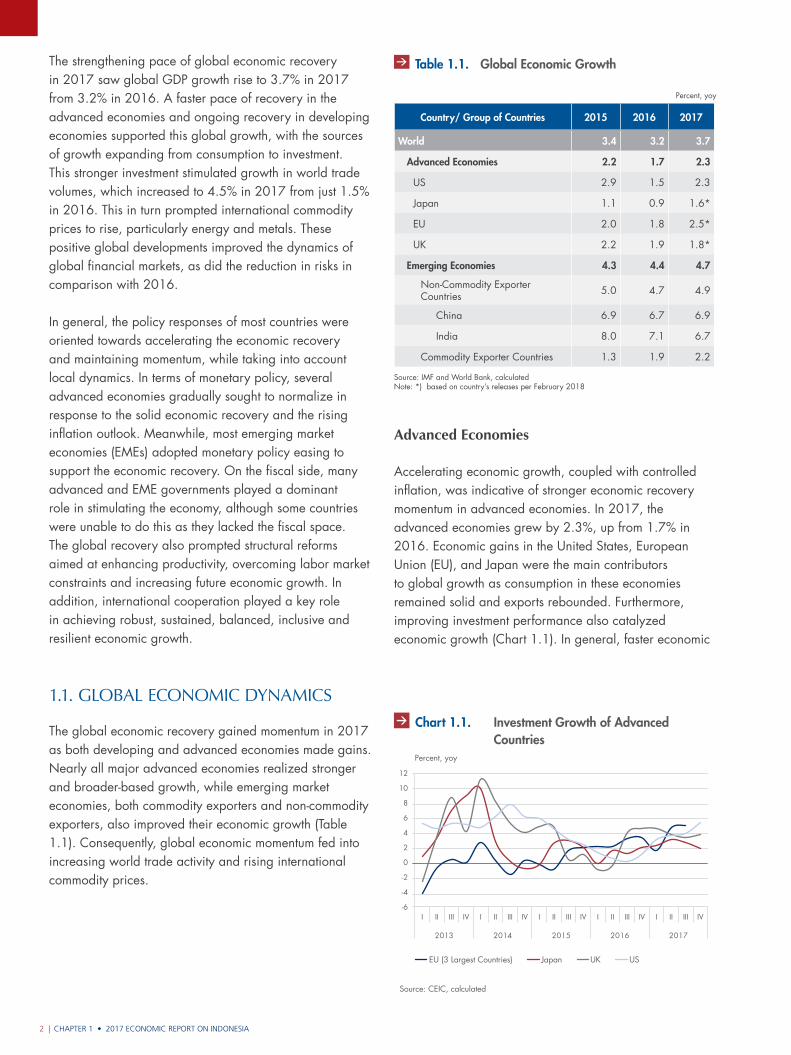
CHAPTER 1 • 2017 ECONOMIC REPORT ON INDONESIA2 |
The strengthening pace of global economic recovery in 2017 saw global GDP growth rise to 3.7% in 2017 from 3.2% in 2016. A faster pace of recovery in the advanced economies and ongoing recovery in developing economies supported this global growth, with the sources of growth expanding from consumption to investment. This stronger investment stimulated growth in world trade volumes, which increased to 4.5% in 2017 from just 1.5% in 2016. This in turn prompted international commodity prices to rise, particularly energy and metals. These positive global developments improved the dynamics of global financial markets, as did the reduction in risks in comparison with 2016.
In general, the policy responses of most countries were oriented towards accelerating the economic recovery and maintaining momentum, while taking into account local dynamics. In terms of monetary policy, several advanced economies gradually sought to normalize in response to the solid economic recovery and the rising inflation outlook. Meanwhile, most emerging market economies (EMEs) adopted monetary policy easing to support the economic recovery. On the fiscal side, many advanced and EME governments played a dominant role in stimulating the economy, although some countries were unable to do this as they lacked the fiscal space. The global recovery also prompted structural reforms aimed at enhancing productivity, overcoming labor market constraints and increasing future economic growth. In addition, international cooperation played a key role in achieving robust, sustained, balanced, inclusive and resilient economic growth.
1.1. Global Economic Dynamics
The global economic recovery gained momentum in 2017 as both developing and advanced economies made gains. Nearly all major advanced economies realized stronger and broader-based growth, while emerging market economies, both commodity exporters and non-commodity exporters, also improved their economic growth (Table 1.1). Consequently, global economic momentum fed into increasing world trade activity and rising international commodity prices.
Advanced Economies
Accelerating economic growth, coupled with controlled inflation, was indicative of stronger economic recovery momentum in advanced economies. In 2017, the advanced economies grew by 2.3%, up from 1.7% in 2016. Economic gains in the United States, European Union (EU), and Japan were the main contributors to global growth as consumption in these economies remained solid and exports rebounded. Furthermore, improving investment performance also catalyzed economic growth (Chart 1.1). In general, faster economic
Percent, yoy
Country/ Group of Countries 2015 2016 2017
World 3.4 3.2 3.7
Advanced Economies 2.2 1.7 2.3
US 2.9 1.5 2.3
Japan 1.1 0.9 1.6*
EU 2.0 1.8 2.5*
UK 2.2 1.9 1.8*
Emerging Economies 4.3 4.4 4.7
Non-Commodity Exporter Countries 5.0 4.7 4.9
China 6.9 6.7 6.9
India 8.0 7.1 6.7
Commodity Exporter Countries 1.3 1.9 2.2
Source: IMF and World Bank, calculatedNote: *) based on country’s releases per February 2018
Table 1.1. Global Economic Growth
Grafik 1.1. Tingkat Pengangguran Negara Maju
Percent, yoy
EU (3 Largest Countries) Japan UK US
Source: CEIC, calculated
-6
-4
-2
0
2
4
6
8
10
12
I II III IV
2013 2014 2015 2016 2017
I II III IV I II III IV I II III IV I II III IV
Chart 1.1. Investment Growth of Advanced Countries
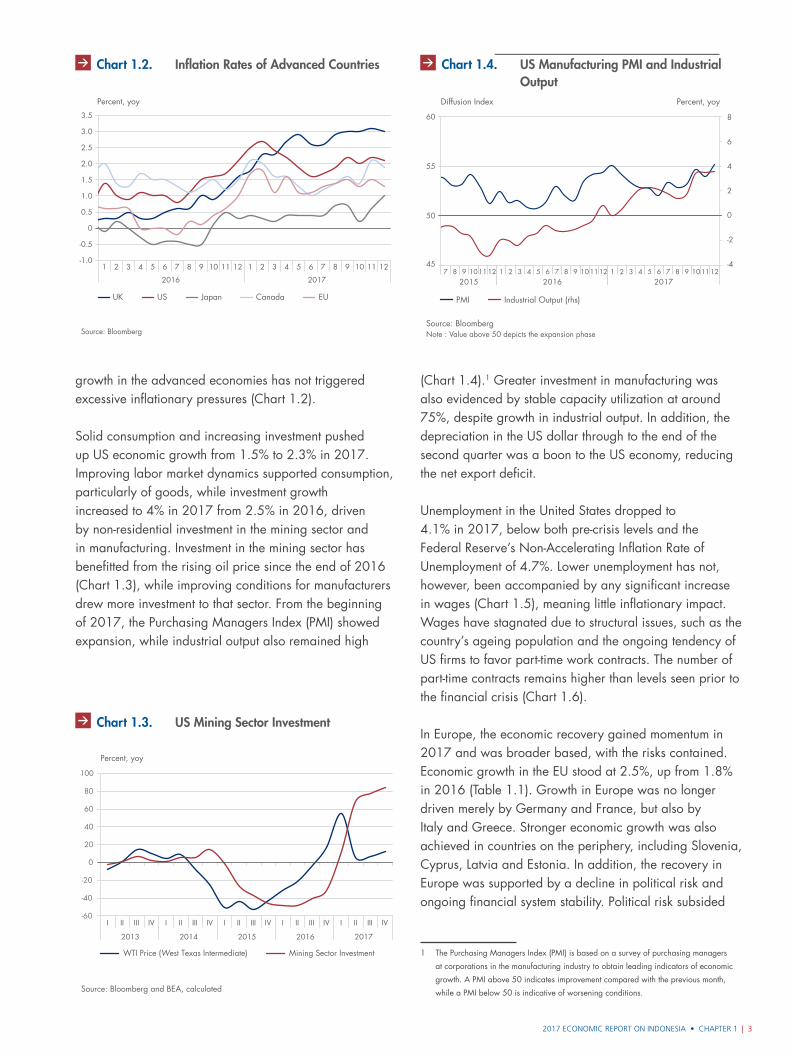
2017 ECONOMIC REPORT ON INDONESIA • CHAPTER 1 | 3
growth in the advanced economies has not triggered excessive inflationary pressures (Chart 1.2).
Solid consumption and increasing investment pushed up US economic growth from 1.5% to 2.3% in 2017. Improving labor market dynamics supported consumption, particularly of goods, while investment growth increased to 4% in 2017 from 2.5% in 2016, driven by non-residential investment in the mining sector and in manufacturing. Investment in the mining sector has benefitted from the rising oil price since the end of 2016 (Chart 1.3), while improving conditions for manufacturers drew more investment to that sector. From the beginning of 2017, the Purchasing Managers Index (PMI) showed expansion, while industrial output also remained high
(Chart 1.4).1 Greater investment in manufacturing was also evidenced by stable capacity utilization at around 75%, despite growth in industrial output. In addition, the depreciation in the US dollar through to the end of the second quarter was a boon to the US economy, reducing the net export deficit.
Unemployment in the United States dropped to 4.1% in 2017, below both pre-crisis levels and the Federal Reserve’s Non-Accelerating Inflation Rate of Unemployment of 4.7%. Lower unemployment has not, however, been accompanied by any significant increase in wages (Chart 1.5), meaning little inflationary impact. Wages have stagnated due to structural issues, such as the country’s ageing population and the ongoing tendency of US firms to favor part-time work contracts. The number of part-time contracts remains higher than levels seen prior to the financial crisis (Chart 1.6).
In Europe, the economic recovery gained momentum in 2017 and was broader based, with the risks contained. Economic growth in the EU stood at 2.5%, up from 1.8% in 2016 (Table 1.1). Growth in Europe was no longer driven merely by Germany and France, but also by Italy and Greece. Stronger economic growth was also achieved in countries on the periphery, including Slovenia, Cyprus, Latvia and Estonia. In addition, the recovery in Europe was supported by a decline in political risk and ongoing financial system stability. Political risk subsided
1 The Purchasing Managers Index (PMI) is based on a survey of purchasing managers
at corporations in the manufacturing industry to obtain leading indicators of economic
growth. A PMI above 50 indicates improvement compared with the previous month,
while a PMI below 50 is indicative of worsening conditions.
Source: Bloomberg
Grafik 1.3. Tingkat Inflasi Negara Maju
UK US Japan Canada EU
Percent, yoy
1 2 3 4 5 6
2016
7 8 9 10 11 12 1 2 3 4 5 6
2017
7 8 9 10 11 12-1.0
-0.5
0
0.5
1.0
1.5
2.0
2.5
3.0
3.5
Chart 1.2. Inflation Rates of Advanced Countries
Source: Bloomberg and BEA, calculated
Grafik 1.10. Investasi Sektor Tambang AS
-60
-40
-20
0
20
40
60
80
100
I II III IV I II III IV I II III IV I II III IV I II III IV
2013 2014 2015 2016 2017
WTI Price (West Texas Intermediate) Mining Sector Investment
Percent, yoy
Chart 1.3. US Mining Sector Investment
Source: BloombergNote : Value above 50 depicts the expansion phase
Grafik 1.4. PMI Manufaktur Negara Maju
Diffusion Index Percent, yoy
PMI Industrial Output (rhs)
-4
-2
0
2
4
6
8
45
50
55
60
7 8 9 101112 1 2 3 420162015
5 6 7 8 9 101112 1 2 3 42017
5 6 7 8 9 101112
Chart 1.4. US Manufacturing PMI and Industrial Output
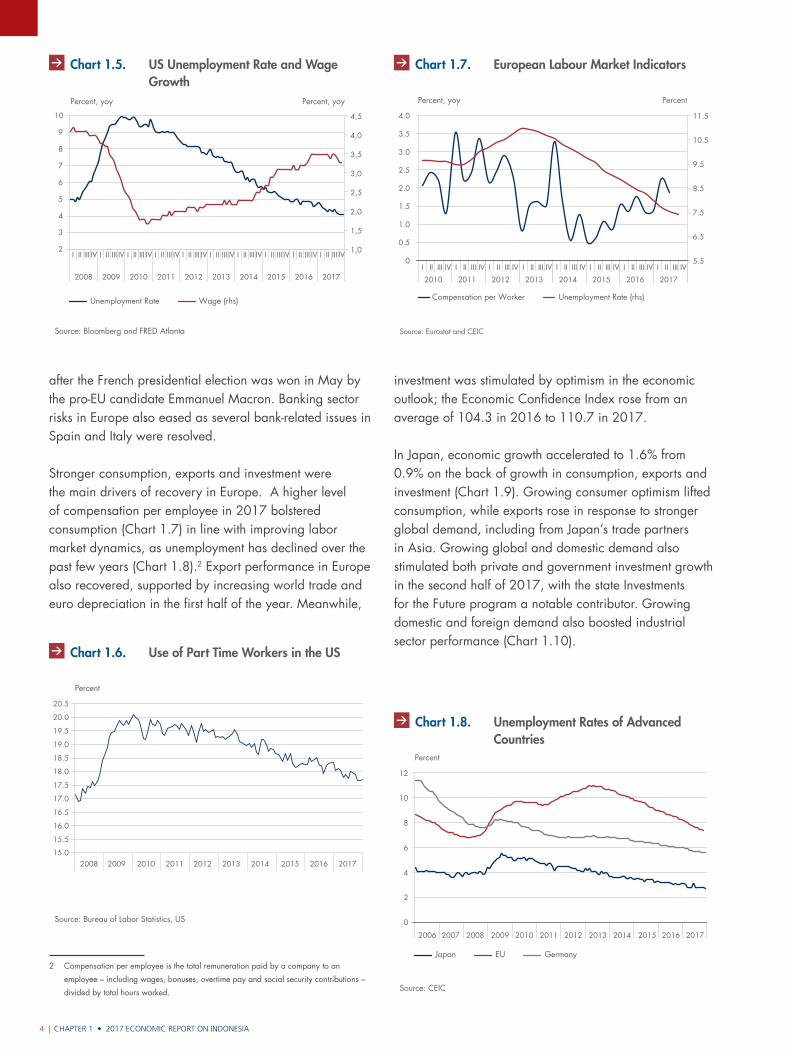
CHAPTER 1 • 2017 ECONOMIC REPORT ON INDONESIA4 |
after the French presidential election was won in May by the pro-EU candidate Emmanuel Macron. Banking sector risks in Europe also eased as several bank-related issues in Spain and Italy were resolved.
Stronger consumption, exports and investment were the main drivers of recovery in Europe. A higher level of compensation per employee in 2017 bolstered consumption (Chart 1.7) in line with improving labor market dynamics, as unemployment has declined over the past few years (Chart 1.8).2 Export performance in Europe also recovered, supported by increasing world trade and euro depreciation in the first half of the year. Meanwhile,
2 Compensation per employee is the total remuneration paid by a company to an
employee – including wages, bonuses, overtime pay and social security contributions –
divided by total hours worked.
investment was stimulated by optimism in the economic outlook; the Economic Confidence Index rose from an average of 104.3 in 2016 to 110.7 in 2017.
In Japan, economic growth accelerated to 1.6% from 0.9% on the back of growth in consumption, exports and investment (Chart 1.9). Growing consumer optimism lifted consumption, while exports rose in response to stronger global demand, including from Japan’s trade partners in Asia. Growing global and domestic demand also stimulated both private and government investment growth in the second half of 2017, with the state Investments for the Future program a notable contributor. Growing domestic and foreign demand also boosted industrial sector performance (Chart 1.10).
Source: Bureau of Labor Statistics, US
Gra�k 1.6. Indikator Pasar Tenaga Kerja Eropa
Percent
15.0
15.5
16.0
16.5
17.0
17.5
18.0
18.5
19.0
19.5
20.0
20.5
2008 2009 2010 2011 2012 2013 2014 2015 2016 2017
Chart 1.6. Use of Part Time Workers in the US
Source: Eurostat and CEIC
Gra�k 1.7. Indikator Pasar Tenaga Kerja Eropa
Unemployment Rate (rhs)Compensation per Worker
Percent, yoy
I II III IV
2010
I II III IV
2011
I II III IV
2012
I II III IV
2013
I II III IV
2014
I II III IV
2015
I II III IV
2016
I II III IV
2017
5.5
6.5
7.5
8.5
9.5
10.5
11.5
0
0.5
1.0
1.5
2.0
2.5
3.0
3.5
4.0
Percent
Chart 1.7. European Labour Market Indicators
Gra�k 1.2. Tingkat Pengangguran Negara Maju
0
2
4
6
8
10
12
2006 2007 2008 2009 2010 2011 2012 2013 2014 2015 2016 2017
Percent
Japan EU Germany
Source: CEIC
Chart 1.8. Unemployment Rates of Advanced Countries
1,0
1,5
2,0
2,5
3,0
3,5
4,0
4,5
2
3
4
5
6
7
8
9
10
2008 2009 2010 2011 2012 2013 2014 2015 2016 2017
Unemployment Rate Wage (rhs)
Percent, yoy Percent, yoy
Grafik 1.11. Tingkat Pengangguran danPertumbuhan Upah AS
Source: Bloomberg and FRED Atlanta
I II III IV I II III IV I II III IV I II III IV I II III IV I II III IV I II III IV I II III IV I II III IV I II III IV
Chart 1.5. US Unemployment Rate and Wage Growth
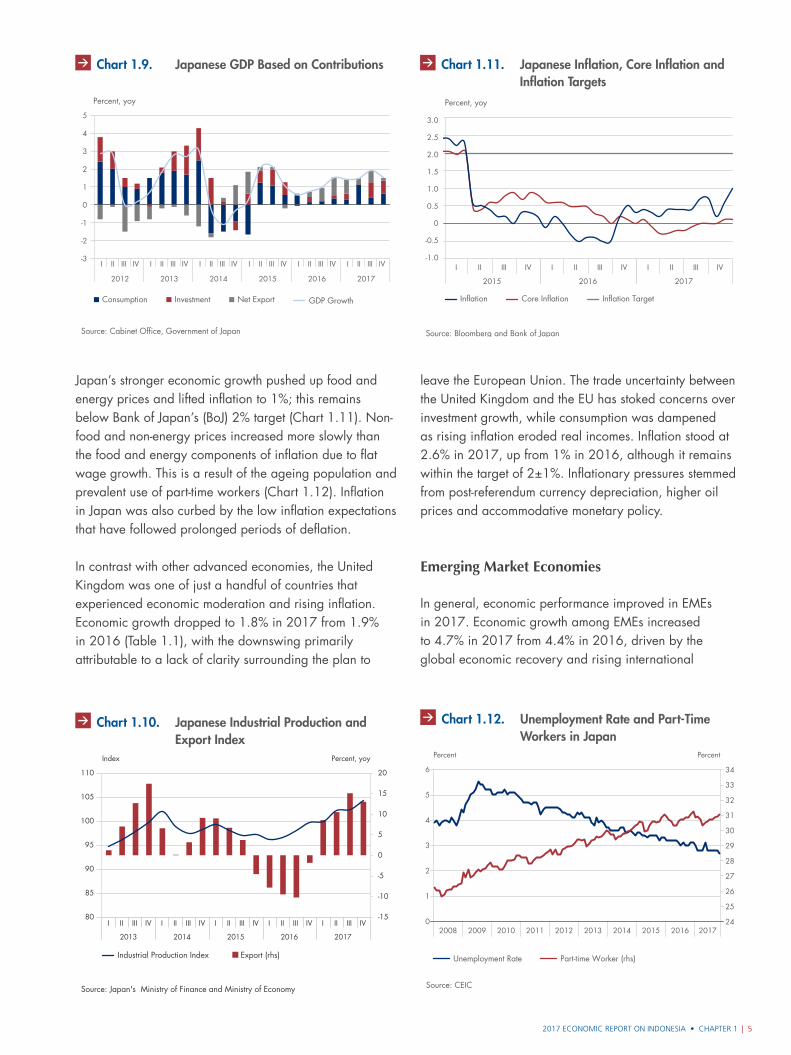
2017 ECONOMIC REPORT ON INDONESIA • CHAPTER 1 | 5
Japan’s stronger economic growth pushed up food and energy prices and lifted inflation to 1%; this remains below Bank of Japan’s (BoJ) 2% target (Chart 1.11). Non-food and non-energy prices increased more slowly than the food and energy components of inflation due to flat wage growth. This is a result of the ageing population and prevalent use of part-time workers (Chart 1.12). Inflation in Japan was also curbed by the low inflation expectations that have followed prolonged periods of deflation.
In contrast with other advanced economies, the United Kingdom was one of just a handful of countries that experienced economic moderation and rising inflation. Economic growth dropped to 1.8% in 2017 from 1.9% in 2016 (Table 1.1), with the downswing primarily attributable to a lack of clarity surrounding the plan to
leave the European Union. The trade uncertainty between the United Kingdom and the EU has stoked concerns over investment growth, while consumption was dampened as rising inflation eroded real incomes. Inflation stood at 2.6% in 2017, up from 1% in 2016, although it remains within the target of 2±1%. Inflationary pressures stemmed from post-referendum currency depreciation, higher oil prices and accommodative monetary policy.
Emerging Market Economies
In general, economic performance improved in EMEs in 2017. Economic growth among EMEs increased to 4.7% in 2017 from 4.4% in 2016, driven by the global economic recovery and rising international
Gra�k 1.7. PDB Jepang – Kontribusi per Komponen
Source: Cabinet Office, Government of Japan
Net Export GDP GrowthConsumption Investment
-3
-2
-1
0
1
2
3
4
5
I II III IV I II III IV I II III IV I II III IV I II III IV I II III IV
2012 2013 2014 2015 2016 2017
Percent, yoy
Chart 1.9. Japanese GDP Based on Contributions
Gra�k 1.9. Industrial Production dan Ekspor Jepang
Source: Japan's Ministry of Finance and Ministry of Economy
Export (rhs)Industrial Production Index
Percent, yoyIndex
-15
-10
-5
0
5
10
15
20
80
85
90
95
100
105
110
I II III IV I II III IV I II III IV I II III IV I II III IV
2013 2014 2015 2016 2017
Chart 1.10. Japanese Industrial Production and Export Index
Source: Bloomberg and Bank of Japan
Gra�k 1.11. In�asi, ekspektasi in�asi, dan Target In�asi Jepang
Core Inflation Inflation TargetInflation
-1.0
-0.5
2015
I II III IV
0
0.5
1.0
1.5
2.0
2.5
3.0
2016
I II III IV
2017
I II III IV
Percent, yoy
Chart 1.11. Japanese Inflation, Core Inflation and Inflation Targets
Percent Percent
Unemployment Rate Part-time Worker (rhs)
Grafik 1.12. Tingkat Pengangguran dan Pekerja Paruh Waktu di Jepang
Source: CEIC
24
25
26
27
28
29
30
31
32
33
34
0
1
2
3
4
5
6
2008 2009 2010 2011 2012 2013 2014 2015 2016 2017
Chart 1.12. Unemployment Rate and Part-Time Workers in Japan
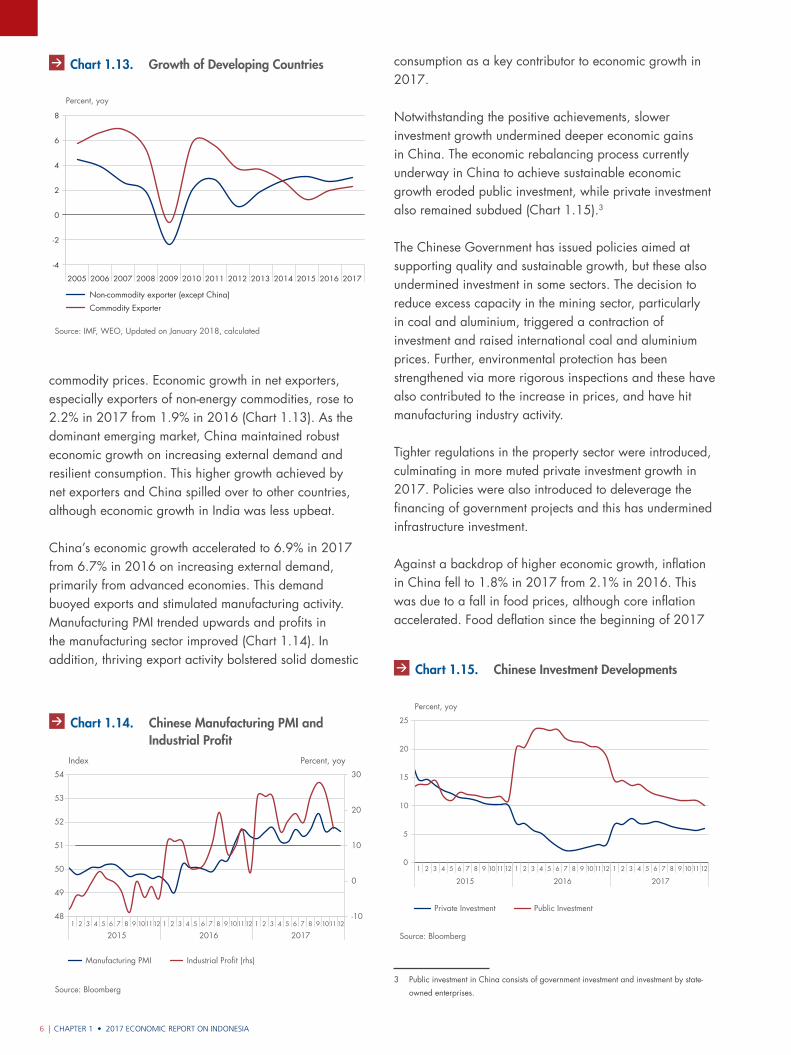
CHAPTER 1 • 2017 ECONOMIC REPORT ON INDONESIA6 |
consumption as a key contributor to economic growth in 2017.
Notwithstanding the positive achievements, slower investment growth undermined deeper economic gains in China. The economic rebalancing process currently underway in China to achieve sustainable economic growth eroded public investment, while private investment also remained subdued (Chart 1.15).3
The Chinese Government has issued policies aimed at supporting quality and sustainable growth, but these also undermined investment in some sectors. The decision to reduce excess capacity in the mining sector, particularly in coal and aluminium, triggered a contraction of investment and raised international coal and aluminium prices. Further, environmental protection has been strengthened via more rigorous inspections and these have also contributed to the increase in prices, and have hit manufacturing industry activity.
Tighter regulations in the property sector were introduced, culminating in more muted private investment growth in 2017. Policies were also introduced to deleverage the financing of government projects and this has undermined infrastructure investment.
Against a backdrop of higher economic growth, inflation in China fell to 1.8% in 2017 from 2.1% in 2016. This was due to a fall in food prices, although core inflation accelerated. Food deflation since the beginning of 2017
3 Public investment in China consists of government investment and investment by state-
owned enterprises.
commodity prices. Economic growth in net exporters, especially exporters of non-energy commodities, rose to 2.2% in 2017 from 1.9% in 2016 (Chart 1.13). As the dominant emerging market, China maintained robust economic growth on increasing external demand and resilient consumption. This higher growth achieved by net exporters and China spilled over to other countries, although economic growth in India was less upbeat.
China’s economic growth accelerated to 6.9% in 2017 from 6.7% in 2016 on increasing external demand, primarily from advanced economies. This demand buoyed exports and stimulated manufacturing activity. Manufacturing PMI trended upwards and profits in the manufacturing sector improved (Chart 1.14). In addition, thriving export activity bolstered solid domestic
Grafik 1.12. Pertumbuhan Negara Berkembang
Percent, yoy
Source: IMF, WEO, Updated on January 2018, calculated
-4
-2
0
2
4
6
8
2005 2006 2007 2008 2009 2010 2011 2012 2013 2014 2015 2016 2017
Non-commodity exporter (except China)
Commodity Exporter
Chart 1.13. Growth of Developing Countries
Grafik 1.14. PMI Manufaktur dan KeuntunganIndustri Tiongkok
Source: Bloomberg
Manufacturing PMI Industrial Profit (rhs)
-10
0
10
20
30
48
49
50
51
52
53
54
1 2 3 4 5 6 7 8 9 101112 1 2 3 4 5 6 7 8 9 101112 1 2 3 4 5 6 7 8 9 101112
2015 2016 2017
Percent, yoyIndex
Chart 1.14. Chinese Manufacturing PMI and Industrial Profit
Private Investment Public Investment
Grafik 1.15. Perkembangan Investasi Tiongkok
Source: Bloomberg
0
5
10
15
20
25
1 2 3 4 5 6 7 8 9 101112 1 2 3 4 5 6 7 8 9 101112 1 2 3 4 5 6 7 8 9 101112
2015 2016 2017
Percent, yoy
Chart 1.15. Chinese Investment Developments
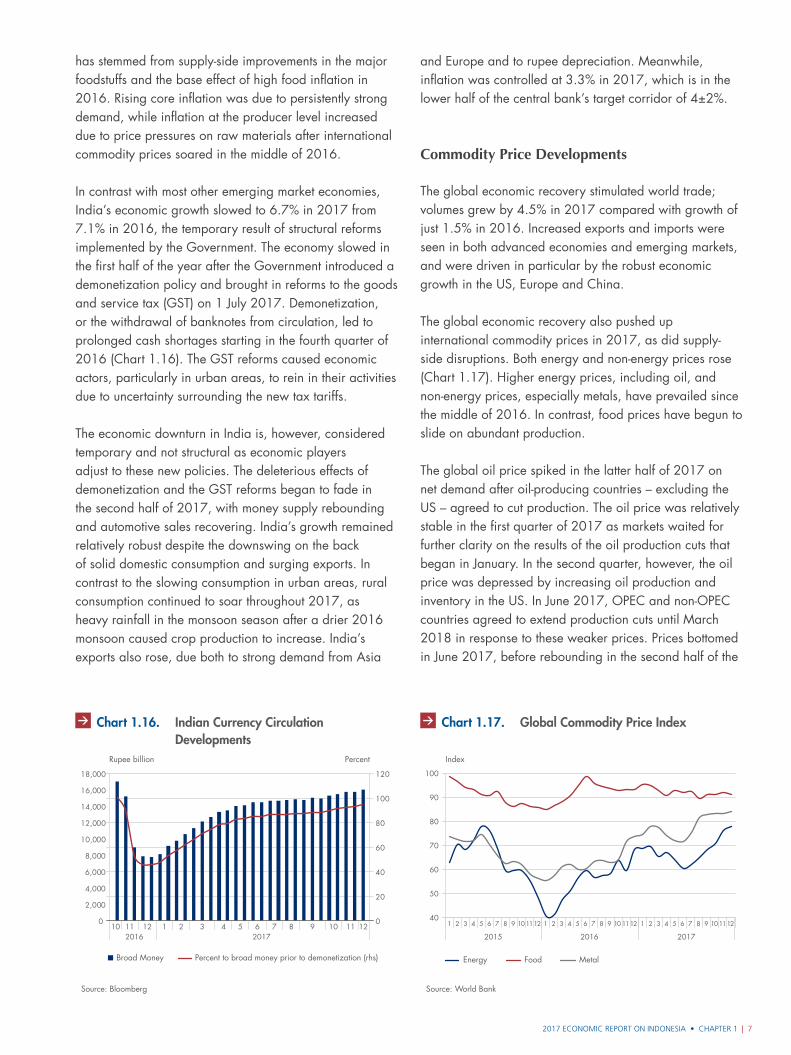
2017 ECONOMIC REPORT ON INDONESIA • CHAPTER 1 | 7
has stemmed from supply-side improvements in the major foodstuffs and the base effect of high food inflation in 2016. Rising core inflation was due to persistently strong demand, while inflation at the producer level increased due to price pressures on raw materials after international commodity prices soared in the middle of 2016.
In contrast with most other emerging market economies, India’s economic growth slowed to 6.7% in 2017 from 7.1% in 2016, the temporary result of structural reforms implemented by the Government. The economy slowed in the first half of the year after the Government introduced a demonetization policy and brought in reforms to the goods and service tax (GST) on 1 July 2017. Demonetization, or the withdrawal of banknotes from circulation, led to prolonged cash shortages starting in the fourth quarter of 2016 (Chart 1.16). The GST reforms caused economic actors, particularly in urban areas, to rein in their activities due to uncertainty surrounding the new tax tariffs.
The economic downturn in India is, however, considered temporary and not structural as economic players adjust to these new policies. The deleterious effects of demonetization and the GST reforms began to fade in the second half of 2017, with money supply rebounding and automotive sales recovering. India’s growth remained relatively robust despite the downswing on the back of solid domestic consumption and surging exports. In contrast to the slowing consumption in urban areas, rural consumption continued to soar throughout 2017, as heavy rainfall in the monsoon season after a drier 2016 monsoon caused crop production to increase. India’s exports also rose, due both to strong demand from Asia
and Europe and to rupee depreciation. Meanwhile, inflation was controlled at 3.3% in 2017, which is in the lower half of the central bank’s target corridor of 4±2%.
Commodity Price Developments
The global economic recovery stimulated world trade; volumes grew by 4.5% in 2017 compared with growth of just 1.5% in 2016. Increased exports and imports were seen in both advanced economies and emerging markets, and were driven in particular by the robust economic growth in the US, Europe and China.
The global economic recovery also pushed up international commodity prices in 2017, as did supply-side disruptions. Both energy and non-energy prices rose (Chart 1.17). Higher energy prices, including oil, and non-energy prices, especially metals, have prevailed since the middle of 2016. In contrast, food prices have begun to slide on abundant production.
The global oil price spiked in the latter half of 2017 on net demand after oil-producing countries – excluding the US – agreed to cut production. The oil price was relatively stable in the first quarter of 2017 as markets waited for further clarity on the results of the oil production cuts that began in January. In the second quarter, however, the oil price was depressed by increasing oil production and inventory in the US. In June 2017, OPEC and non-OPEC countries agreed to extend production cuts until March 2018 in response to these weaker prices. Prices bottomed in June 2017, before rebounding in the second half of the
2016 2017
0
20
40
60
80
100
120
0
2,000
4,000
6,000
8,000
10,000
12,000
14,000
16,000
18,000
10 11 12 1 2 3 4 5 6 7 8 9 10 11 12
Rupee billion Percent
Percent to broad money prior to demonetization (rhs)Broad Money
Grafik 1.16. Jumlah Uang Beredar India
Source: Bloomberg
Chart 1.16. Indian Currency Circulation Developments
Energy Food Metal
Grafik 1.18. Indeks Harga Komoditas Dunia
Source: World Bank
1 2 3 4 5 6 7 8 9 10 1112
2015
1 2 3 4 5 6 7 8 9 10 1112
2016
1 2 3 4 5 6 7 8 9 10 1112
2017
Index
40
50
60
70
80
90
100
Chart 1.17. Global Commodity Price Index
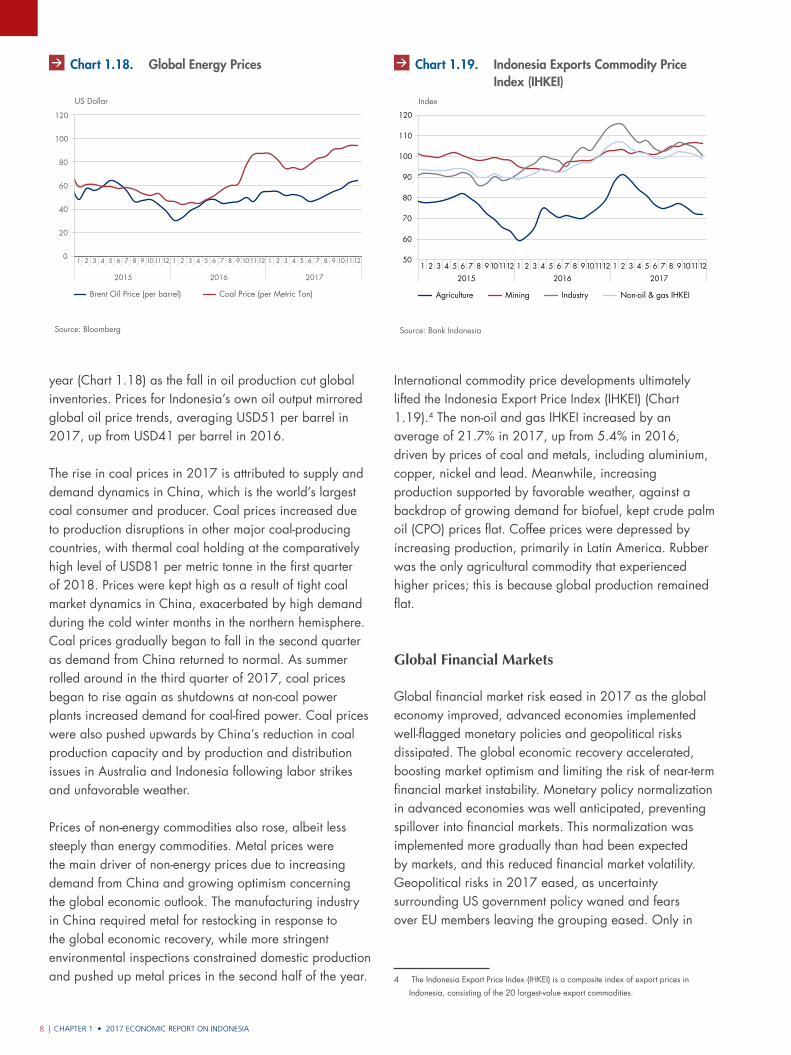
CHAPTER 1 • 2017 ECONOMIC REPORT ON INDONESIA8 |
year (Chart 1.18) as the fall in oil production cut global inventories. Prices for Indonesia’s own oil output mirrored global oil price trends, averaging USD51 per barrel in 2017, up from USD41 per barrel in 2016.
The rise in coal prices in 2017 is attributed to supply and demand dynamics in China, which is the world’s largest coal consumer and producer. Coal prices increased due to production disruptions in other major coal-producing countries, with thermal coal holding at the comparatively high level of USD81 per metric tonne in the first quarter of 2018. Prices were kept high as a result of tight coal market dynamics in China, exacerbated by high demand during the cold winter months in the northern hemisphere. Coal prices gradually began to fall in the second quarter as demand from China returned to normal. As summer rolled around in the third quarter of 2017, coal prices began to rise again as shutdowns at non-coal power plants increased demand for coal-fired power. Coal prices were also pushed upwards by China’s reduction in coal production capacity and by production and distribution issues in Australia and Indonesia following labor strikes and unfavorable weather.
Prices of non-energy commodities also rose, albeit less steeply than energy commodities. Metal prices were the main driver of non-energy prices due to increasing demand from China and growing optimism concerning the global economic outlook. The manufacturing industry in China required metal for restocking in response to the global economic recovery, while more stringent environmental inspections constrained domestic production and pushed up metal prices in the second half of the year.
International commodity price developments ultimately lifted the Indonesia Export Price Index (IHKEI) (Chart 1.19).4 The non-oil and gas IHKEI increased by an average of 21.7% in 2017, up from 5.4% in 2016, driven by prices of coal and metals, including aluminium, copper, nickel and lead. Meanwhile, increasing production supported by favorable weather, against a backdrop of growing demand for biofuel, kept crude palm oil (CPO) prices flat. Coffee prices were depressed by increasing production, primarily in Latin America. Rubber was the only agricultural commodity that experienced higher prices; this is because global production remained flat.
Global Financial Markets
Global financial market risk eased in 2017 as the global economy improved, advanced economies implemented well-flagged monetary policies and geopolitical risks dissipated. The global economic recovery accelerated, boosting market optimism and limiting the risk of near-term financial market instability. Monetary policy normalization in advanced economies was well anticipated, preventing spillover into financial markets. This normalization was implemented more gradually than had been expected by markets, and this reduced financial market volatility. Geopolitical risks in 2017 eased, as uncertainty surrounding US government policy waned and fears over EU members leaving the grouping eased. Only in
4 The Indonesia Export Price Index (IHKEI) is a composite index of export prices in
Indonesia, consisting of the 20 largest-value export commodities.
Source: Bloomberg
Grafik 1.19.
Brent Oil Price (per barrel) Coal Price (per Metric Ton)
0
20
40
60
80
100
120
1 2 3 4 5 6 7 8 9 101112 1 2 3 4 5 6 7 8 9 101112 1 2 3 4 5 6 7 8 9 101112
2015 2016 2017
US Dollar
Chart 1.18. Global Energy Prices Grafik 1.19. IHKEI
Source: Bank Indonesia
Index
50
60
70
80
90
100
110
120
1 2 3 4 5 6 7 8 9101112 1 2 3 4 5 6 7 8 9101112 1 2 3 4 5 6 7 8 9101112
2015 2016 2017
Agriculture Mining Industry Non-oil & gas IHKEI
Chart 1.19. Indonesia Exports Commodity Price Index (IHKEI)
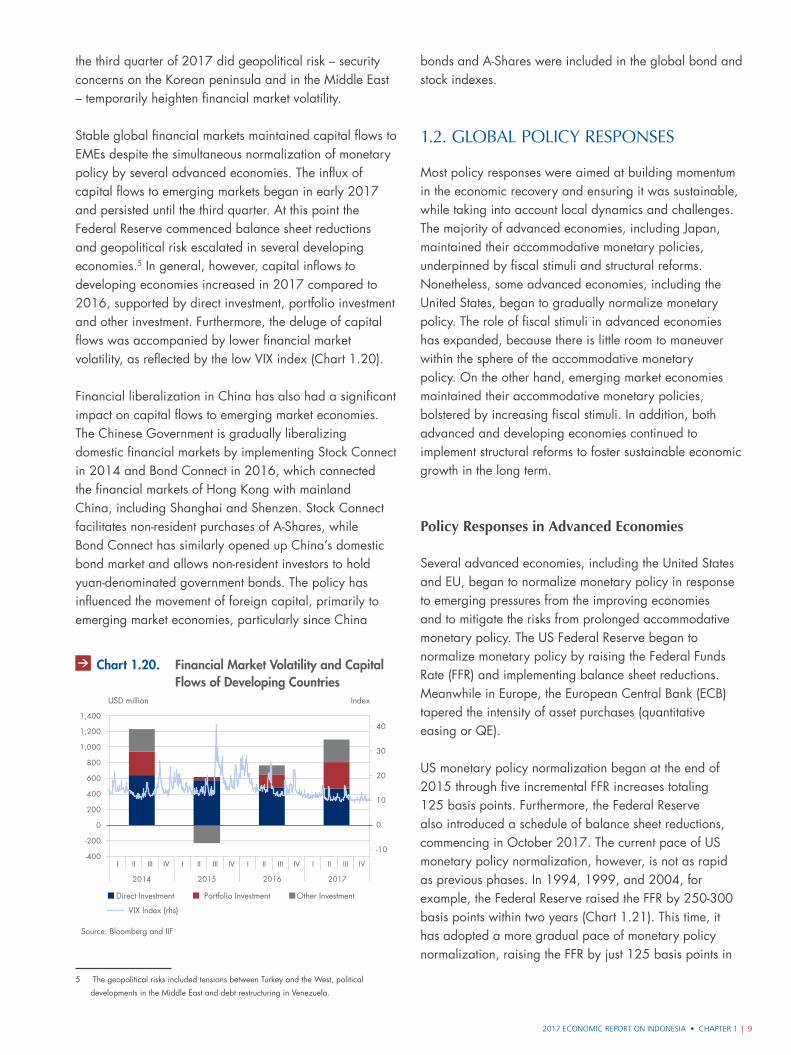
2017 ECONOMIC REPORT ON INDONESIA • CHAPTER 1 | 9
the third quarter of 2017 did geopolitical risk – security concerns on the Korean peninsula and in the Middle East – temporarily heighten financial market volatility.
Stable global financial markets maintained capital flows to EMEs despite the simultaneous normalization of monetary policy by several advanced economies. The influx of capital flows to emerging markets began in early 2017 and persisted until the third quarter. At this point the Federal Reserve commenced balance sheet reductions and geopolitical risk escalated in several developing economies.5 In general, however, capital inflows to developing economies increased in 2017 compared to 2016, supported by direct investment, portfolio investment and other investment. Furthermore, the deluge of capital flows was accompanied by lower financial market volatility, as reflected by the low VIX index (Chart 1.20).
Financial liberalization in China has also had a significant impact on capital flows to emerging market economies. The Chinese Government is gradually liberalizing domestic financial markets by implementing Stock Connect in 2014 and Bond Connect in 2016, which connected the financial markets of Hong Kong with mainland China, including Shanghai and Shenzen. Stock Connect facilitates non-resident purchases of A-Shares, while Bond Connect has similarly opened up China’s domestic bond market and allows non-resident investors to hold yuan-denominated government bonds. The policy has influenced the movement of foreign capital, primarily to emerging market economies, particularly since China
5 The geopolitical risks included tensions between Turkey and the West, political
developments in the Middle East and debt restructuring in Venezuela.
bonds and A-Shares were included in the global bond and stock indexes.
1.2. Global Policy REsPonsEs
Most policy responses were aimed at building momentum in the economic recovery and ensuring it was sustainable, while taking into account local dynamics and challenges. The majority of advanced economies, including Japan, maintained their accommodative monetary policies, underpinned by fiscal stimuli and structural reforms. Nonetheless, some advanced economies, including the United States, began to gradually normalize monetary policy. The role of fiscal stimuli in advanced economies has expanded, because there is little room to maneuver within the sphere of the accommodative monetary policy. On the other hand, emerging market economies maintained their accommodative monetary policies, bolstered by increasing fiscal stimuli. In addition, both advanced and developing economies continued to implement structural reforms to foster sustainable economic growth in the long term.
Policy Responses in Advanced Economies
Several advanced economies, including the United States and EU, began to normalize monetary policy in response to emerging pressures from the improving economies and to mitigate the risks from prolonged accommodative monetary policy. The US Federal Reserve began to normalize monetary policy by raising the Federal Funds Rate (FFR) and implementing balance sheet reductions. Meanwhile in Europe, the European Central Bank (ECB) tapered the intensity of asset purchases (quantitative easing or QE).
US monetary policy normalization began at the end of 2015 through five incremental FFR increases totaling 125 basis points. Furthermore, the Federal Reserve also introduced a schedule of balance sheet reductions, commencing in October 2017. The current pace of US monetary policy normalization, however, is not as rapid as previous phases. In 1994, 1999, and 2004, for example, the Federal Reserve raised the FFR by 250-300 basis points within two years (Chart 1.21). This time, it has adopted a more gradual pace of monetary policy normalization, raising the FFR by just 125 basis points in
-400
-200
0
200
400
600
800
1,000
1,200
1,400
-10
0
10
20
30
40
IndexUSD million
Direct Investment Portfolio Investment Other Investment
VIX Index (rhs)
I II III IV
2014
I II III IV
2015
I II III IV
2016
I II III IV
2017
Source: Bloomberg and IIF
Grafik 1.21. Volatilitas Pasar Keuangan (VIX Index) dan Aliran Modal Negara BerkembangChart 1.20. Financial Market Volatility and Capital Flows of Developing Countries
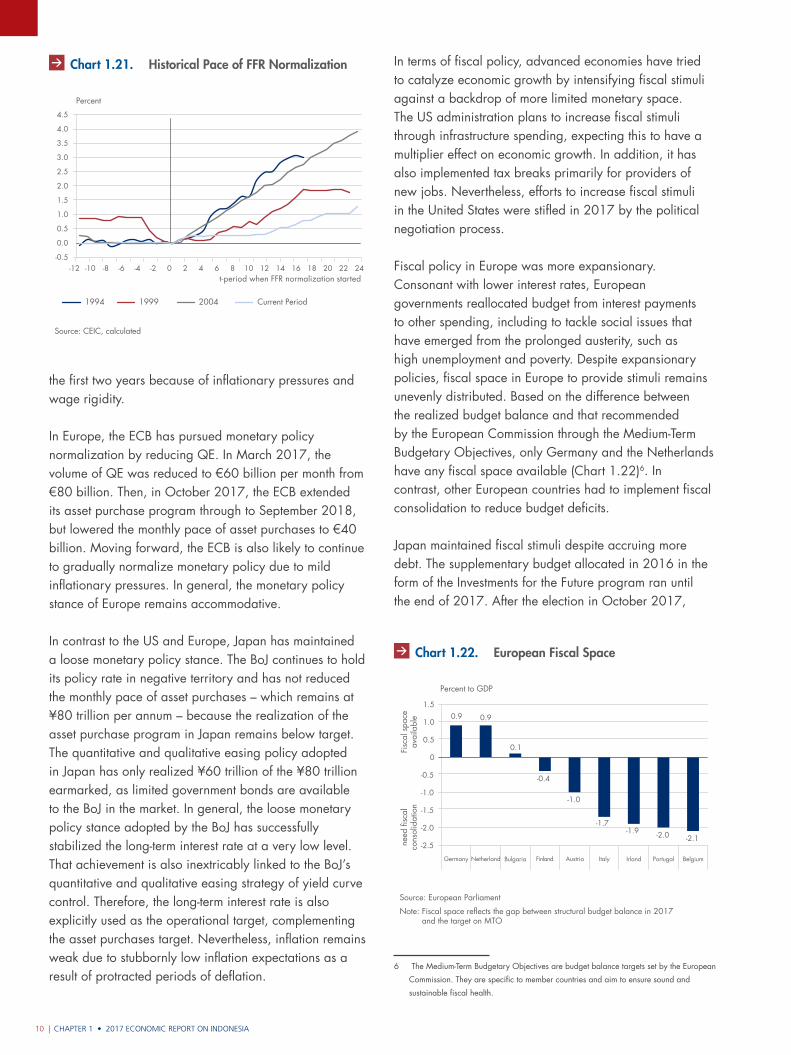
CHAPTER 1 • 2017 ECONOMIC REPORT ON INDONESIA10 |
the first two years because of inflationary pressures and wage rigidity.
In Europe, the ECB has pursued monetary policy normalization by reducing QE. In March 2017, the volume of QE was reduced to €60 billion per month from €80 billion. Then, in October 2017, the ECB extended its asset purchase program through to September 2018, but lowered the monthly pace of asset purchases to €40 billion. Moving forward, the ECB is also likely to continue to gradually normalize monetary policy due to mild inflationary pressures. In general, the monetary policy stance of Europe remains accommodative.
In contrast to the US and Europe, Japan has maintained a loose monetary policy stance. The BoJ continues to hold its policy rate in negative territory and has not reduced the monthly pace of asset purchases – which remains at ¥80 trillion per annum – because the realization of the asset purchase program in Japan remains below target. The quantitative and qualitative easing policy adopted in Japan has only realized ¥60 trillion of the ¥80 trillion earmarked, as limited government bonds are available to the BoJ in the market. In general, the loose monetary policy stance adopted by the BoJ has successfully stabilized the long-term interest rate at a very low level. That achievement is also inextricably linked to the BoJ’s quantitative and qualitative easing strategy of yield curve control. Therefore, the long-term interest rate is also explicitly used as the operational target, complementing the asset purchases target. Nevertheless, inflation remains weak due to stubbornly low inflation expectations as a result of protracted periods of deflation.
In terms of fiscal policy, advanced economies have tried to catalyze economic growth by intensifying fiscal stimuli against a backdrop of more limited monetary space. The US administration plans to increase fiscal stimuli through infrastructure spending, expecting this to have a multiplier effect on economic growth. In addition, it has also implemented tax breaks primarily for providers of new jobs. Nevertheless, efforts to increase fiscal stimuli in the United States were stifled in 2017 by the political negotiation process.
Fiscal policy in Europe was more expansionary. Consonant with lower interest rates, European governments reallocated budget from interest payments to other spending, including to tackle social issues that have emerged from the prolonged austerity, such as high unemployment and poverty. Despite expansionary policies, fiscal space in Europe to provide stimuli remains unevenly distributed. Based on the difference between the realized budget balance and that recommended by the European Commission through the Medium-Term Budgetary Objectives, only Germany and the Netherlands have any fiscal space available (Chart 1.22)6. In contrast, other European countries had to implement fiscal consolidation to reduce budget deficits.
Japan maintained fiscal stimuli despite accruing more debt. The supplementary budget allocated in 2016 in the form of the Investments for the Future program ran until the end of 2017. After the election in October 2017,
6 The Medium-Term Budgetary Objectives are budget balance targets set by the European
Commission. They are specific to member countries and aim to ensure sound and
sustainable fiscal health.
-0.5
0.0
0.5
1.0
1.5
2.0
2.5
3.0
3.5
4.0
4.5
-12 -10 -8 -6 -4 -2 0 2 4 6 8 10 12 14 16 18 20 22 24t-period when FFR normalization started
1994 1999 2004 Current Period
Percent
Source: CEIC, calculated
Grafik 1.21. Historis Kecepatan Normalisasi FFRChart 1.21. Historical Pace of FFR Normalization
0.9 0.9
0.1
-0.4
-1.0
-1.7-1.9 -2.0
-2.5
-2.0
-1.5
-1.0
-0.5
0
0.5
1.0
1.5
need
fisc
alco
nsol
idat
ion
Percent to GDP
Note: Fiscal space reflects the gap between structural budget balance in 2017 and the target on MTO
Fisc
al s
pace
avai
labl
e
-2.1
Germany Netherland Bulgaria Finland Austria Italy Irland Portugal Belgium
Source: European Parliament
Grafik 1.24. Ruang Fiskal Negara EropaChart 1.22. European Fiscal Space
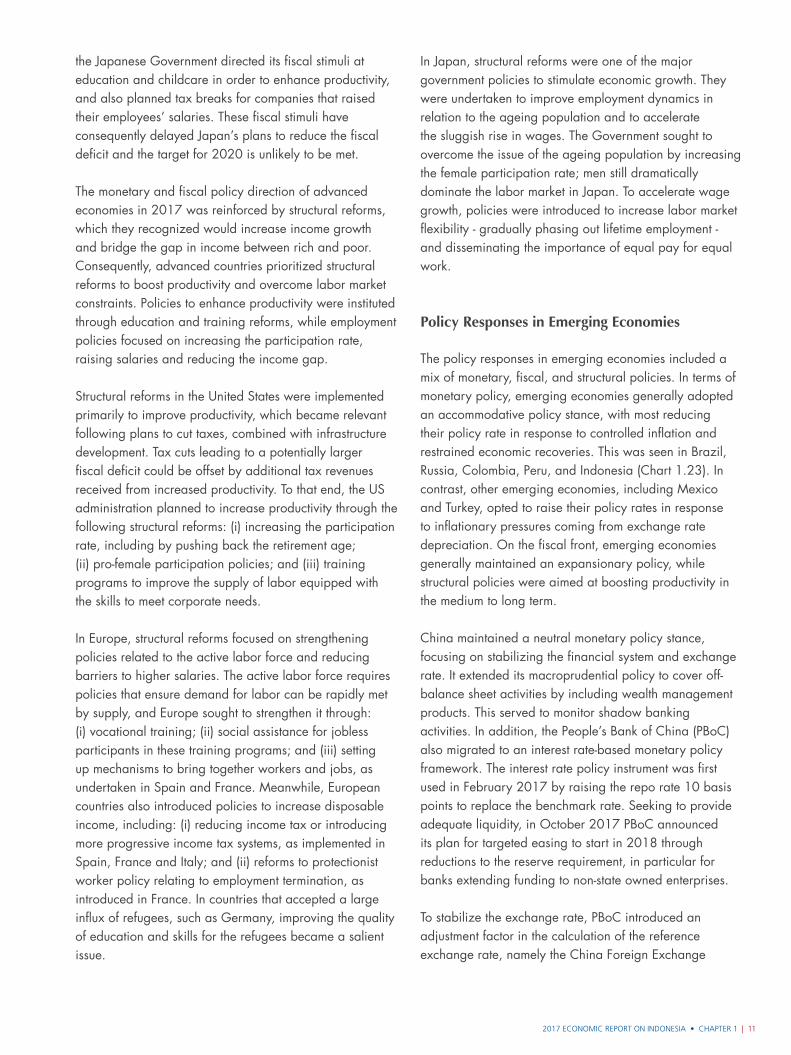
2017 ECONOMIC REPORT ON INDONESIA • CHAPTER 1 | 11
the Japanese Government directed its fiscal stimuli at education and childcare in order to enhance productivity, and also planned tax breaks for companies that raised their employees’ salaries. These fiscal stimuli have consequently delayed Japan’s plans to reduce the fiscal deficit and the target for 2020 is unlikely to be met.
The monetary and fiscal policy direction of advanced economies in 2017 was reinforced by structural reforms, which they recognized would increase income growth and bridge the gap in income between rich and poor. Consequently, advanced countries prioritized structural reforms to boost productivity and overcome labor market constraints. Policies to enhance productivity were instituted through education and training reforms, while employment policies focused on increasing the participation rate, raising salaries and reducing the income gap.
Structural reforms in the United States were implemented primarily to improve productivity, which became relevant following plans to cut taxes, combined with infrastructure development. Tax cuts leading to a potentially larger fiscal deficit could be offset by additional tax revenues received from increased productivity. To that end, the US administration planned to increase productivity through the following structural reforms: (i) increasing the participation rate, including by pushing back the retirement age; (ii) pro-female participation policies; and (iii) training programs to improve the supply of labor equipped with the skills to meet corporate needs.
In Europe, structural reforms focused on strengthening policies related to the active labor force and reducing barriers to higher salaries. The active labor force requires policies that ensure demand for labor can be rapidly met by supply, and Europe sought to strengthen it through: (i) vocational training; (ii) social assistance for jobless participants in these training programs; and (iii) setting up mechanisms to bring together workers and jobs, as undertaken in Spain and France. Meanwhile, European countries also introduced policies to increase disposable income, including: (i) reducing income tax or introducing more progressive income tax systems, as implemented in Spain, France and Italy; and (ii) reforms to protectionist worker policy relating to employment termination, as introduced in France. In countries that accepted a large influx of refugees, such as Germany, improving the quality of education and skills for the refugees became a salient issue.
In Japan, structural reforms were one of the major government policies to stimulate economic growth. They were undertaken to improve employment dynamics in relation to the ageing population and to accelerate the sluggish rise in wages. The Government sought to overcome the issue of the ageing population by increasing the female participation rate; men still dramatically dominate the labor market in Japan. To accelerate wage growth, policies were introduced to increase labor market flexibility - gradually phasing out lifetime employment - and disseminating the importance of equal pay for equal work.
Policy Responses in Emerging Economies
The policy responses in emerging economies included a mix of monetary, fiscal, and structural policies. In terms of monetary policy, emerging economies generally adopted an accommodative policy stance, with most reducing their policy rate in response to controlled inflation and restrained economic recoveries. This was seen in Brazil, Russia, Colombia, Peru, and Indonesia (Chart 1.23). In contrast, other emerging economies, including Mexico and Turkey, opted to raise their policy rates in response to inflationary pressures coming from exchange rate depreciation. On the fiscal front, emerging economies generally maintained an expansionary policy, while structural policies were aimed at boosting productivity in the medium to long term.
China maintained a neutral monetary policy stance, focusing on stabilizing the financial system and exchange rate. It extended its macroprudential policy to cover off-balance sheet activities by including wealth management products. This served to monitor shadow banking activities. In addition, the People’s Bank of China (PBoC) also migrated to an interest rate-based monetary policy framework. The interest rate policy instrument was first used in February 2017 by raising the repo rate 10 basis points to replace the benchmark rate. Seeking to provide adequate liquidity, in October 2017 PBoC announced its plan for targeted easing to start in 2018 through reductions to the reserve requirement, in particular for banks extending funding to non-state owned enterprises.
To stabilize the exchange rate, PBoC introduced an adjustment factor in the calculation of the reference exchange rate, namely the China Foreign Exchange
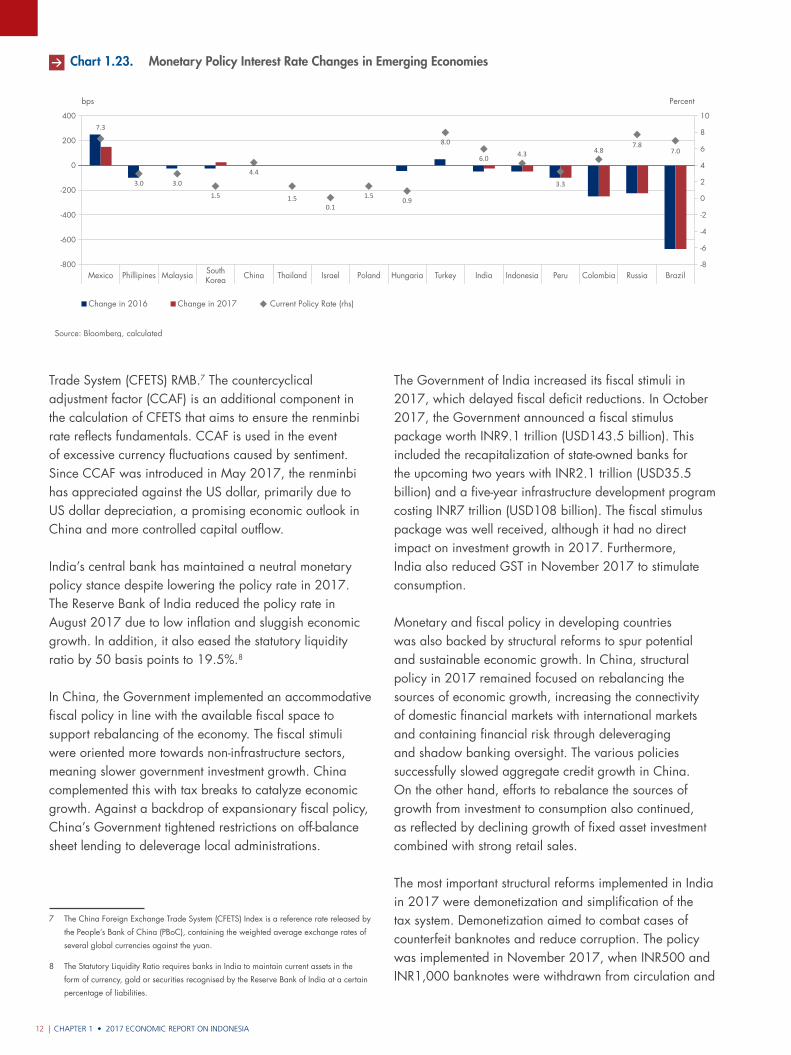
CHAPTER 1 • 2017 ECONOMIC REPORT ON INDONESIA12 |
Trade System (CFETS) RMB.7 The countercyclical adjustment factor (CCAF) is an additional component in the calculation of CFETS that aims to ensure the renminbi rate reflects fundamentals. CCAF is used in the event of excessive currency fluctuations caused by sentiment. Since CCAF was introduced in May 2017, the renminbi has appreciated against the US dollar, primarily due to US dollar depreciation, a promising economic outlook in China and more controlled capital outflow.
India’s central bank has maintained a neutral monetary policy stance despite lowering the policy rate in 2017. The Reserve Bank of India reduced the policy rate in August 2017 due to low inflation and sluggish economic growth. In addition, it also eased the statutory liquidity ratio by 50 basis points to 19.5%.8
In China, the Government implemented an accommodative fiscal policy in line with the available fiscal space to support rebalancing of the economy. The fiscal stimuli were oriented more towards non-infrastructure sectors, meaning slower government investment growth. China complemented this with tax breaks to catalyze economic growth. Against a backdrop of expansionary fiscal policy, China’s Government tightened restrictions on off-balance sheet lending to deleverage local administrations.
7 The China Foreign Exchange Trade System (CFETS) Index is a reference rate released by
the People’s Bank of China (PBoC), containing the weighted average exchange rates of
several global currencies against the yuan.
8 The Statutory Liquidity Ratio requires banks in India to maintain current assets in the
form of currency, gold or securities recognised by the Reserve Bank of India at a certain
percentage of liabilities.
The Government of India increased its fiscal stimuli in 2017, which delayed fiscal deficit reductions. In October 2017, the Government announced a fiscal stimulus package worth INR9.1 trillion (USD143.5 billion). This included the recapitalization of state-owned banks for the upcoming two years with INR2.1 trillion (USD35.5 billion) and a five-year infrastructure development program costing INR7 trillion (USD108 billion). The fiscal stimulus package was well received, although it had no direct impact on investment growth in 2017. Furthermore, India also reduced GST in November 2017 to stimulate consumption.
Monetary and fiscal policy in developing countries was also backed by structural reforms to spur potential and sustainable economic growth. In China, structural policy in 2017 remained focused on rebalancing the sources of economic growth, increasing the connectivity of domestic financial markets with international markets and containing financial risk through deleveraging and shadow banking oversight. The various policies successfully slowed aggregate credit growth in China. On the other hand, efforts to rebalance the sources of growth from investment to consumption also continued, as reflected by declining growth of fixed asset investment combined with strong retail sales.
The most important structural reforms implemented in India in 2017 were demonetization and simplification of the tax system. Demonetization aimed to combat cases of counterfeit banknotes and reduce corruption. The policy was implemented in November 2017, when INR500 and INR1,000 banknotes were withdrawn from circulation and
Change in 2016 Change in 2017 Current Policy Rate (rhs)
-800
-600
-400
400
200
0
-200
bps Percent
Mexico Phillipines Malaysia SouthKorea China Thailand Poland Hungaria Turkey India Indonesia Peru Colombia Russia BrazilIsrael
7.3
3.0 3.0
1.5
4.4
1.50.1
1.50.9
8.0
6.0 4.3
3.3
4.87.8
7.0
-8
-6
-4
-2
4
2
0
6
8
10
Source: Bloomberg, calculated
Grafik 1.25. Perubahan Suku Bunga Kebijakan Moneter di Negara berkembangChart 1.23. Monetary Policy Interest Rate Changes in Emerging Economies
2017 ECONOMIC REPORT ON INDONESIA • CHAPTER 1 | 13
simultaneously new INR500 and INR2,000 banknotes were introduced. The policy significantly reduced money supply (M0), as INR500 and INR1,000 banknotes accounted for 86% of this. This severely disrupted daily economic transactions and led to economic moderation during the first half of 2017. Nevertheless, the policy also had a propitious impact in the medium term as the use of e-money increased.
The tax structure was simplified in India by introducing GST on 1 July 2017 to replace several overlapping tax components with a new system, similar to value-added tax (VAT). The GST scheme was unclear, however, and consumers postponed buying goods. This undermined economic growth in the first half of the year. Sales began to recover in the third quarter of 2017 after the Government clarified the new tax system.
1.3. intERnational cooPERation
International cooperation strengthened in 2017 to optimize the global economic recovery and reinforce economic resilience. International cooperation was realized through the G20 Forum, International Monetary Fund (IMF), Bank for International Settlements and Chiang Mai Initiative Multilateralization (CMIM). At the G20, cooperation to build on the momentum in the global economic recovery manifested in a commitment to stimulate strong, sustained, balanced and inclusive growth. The IMF emphasized the importance of monetary policy, fiscal policy and structural reforms to maintain economic growth momentum. Meanwhile, efforts to strengthen economic resilience were realized through: (i) agreement concerning the Note on Resilience Principles for G20 Economies; (ii) strengthening the Global Financial Safety Net (GFSN), including through the CMIM; and (iii) increasing oversight of financial technology (fintech) development at various international forums.
Cooperation to Stimulate Economic Growth
Cooperation to stimulate global economic growth was achieved under the multilateral G20 framework. Under Germany’s presidency in 2017, G20 members agreed the Hamburg Action Plan. In this plan, the G20 set out a strategy to achieve strong, sustained, balanced and inclusive growth against a backdrop of weaker-than-expected global growth and several risk factors. These
goals will be pursued via monetary and fiscal policy instruments and structural reforms.
The G20 strives to achieve this strong, sustained, balanced and inclusive growth by extending its commitment to the structural reforms contained in the Growth Strategy. As per this strategy, G20 members agreed to achieve an additional 2% growth within the five years from 2014 to 2018 (known as ‘2-in-5’). G20 members submit data and information regarding their achievements each year, encompassing monetary policy, fiscal policy and commitment to structural reforms. Based on this information, international organizations, namely the Organisation for Economic Co-operation and Development (OECD), World Bank and IMF, assess annually each G20 member’s progress towards 2-in-5. In 2017, the collective growth of the G20 economies was 1.4%, down from 1.5% in 2016. The assessments showed the dip in performance was due to slower implementation of the structural commitments among G20 countries.
Furthermore, the G20 supports efforts to achieve more inclusive economic growth at the national and individual level. The current global economic recovery remains unbalanced because growth has failed to reach vulnerable groups. Inequality has primarily surfaced in low-income countries due to the sluggish investment in infrastructure. Efforts to achieve inclusive growth can be realized by: (i) increasing financial literacy; (ii) supporting the development of micro, small and medium enterprises (MSME); (iii) reforming the labor market; and (iv) embracing digital innovation. The G20 also put forward an initiative to stimulate investment in Africa, namely the Compact with Africa.9 In addition, it continued to expand infrastructure investment through multilateral development banks and private financing.
The IMF emphasized the importance of monetary policy, fiscal policy and structural reforms in maintaining economic growth momentum. It recommended member countries to apply: (i) accommodative monetary policy for those member countries with below-target inflation and a negative output gap; (ii) fiscal policy to stimulate growth with due regard to sustainable government debt levels and avoiding procyclicality; and (iii) structural reforms to increase productivity, stimulate growth and create jobs. Furthermore, the IMF encouraged its members to
9 The Compact with Africa is a framework to promote private investment in Africa,
including in infrastructure.
CHAPTER 1 • 2017 ECONOMIC REPORT ON INDONESIA14 |
introduce labor sector policies that allow the labor force to adapt to and benefit from rapid changes in the economic landscape.
Cooperation to Strengthen Resilience
The G20 is also committed to strengthening economic resilience, as contained in the Note on Resilience Principles for G20 Economies, agreed in 2017. These non-binding principles contain a menu of policies to reinforce economic resilience in tandem with strong, sustained, balanced and inclusive growth. Countries select from this policy menu according to their own particular needs. The Resilience Principles focus on five areas, namely: (i) the real sector; (ii) public finance; (iii) private finance; (iv) monetary policy; and (v) the external sector. The key principles include: (i) ensuring central bank independence and price stability; (ii) enhancing the analysis and monitoring of capital flows, as well as risk management; (iii) promoting international trade and investment; and (iv) promoting international cooperation on economic policy.
The G20 also agreed to strengthen the global financial system architecture, another initiative designed to increase financial system resilience. The initiative contains various policies, including: (i) capital flow policies to mitigate the risk of flows disrupting domestic financial system stability; and (ii) policies to strengthen the GFSN.
The G20 initiative to increase resilience was followed up by the IMF in deeper discussions on policies to overcome excessive capital flows and ways to strengthen the GFSN. The IMF explored the role of macroprudential measures to strengthen the financial systems of member economies that have experienced an influx of foreign capital flows. These will complement the capital flow management measures previously adopted. The outcome of the discussions concerning the interaction between these two types of measures may be used as guidelines for members on containing the risks associated with capital flows, while maintaining financial system stability. In terms of strengthening the GFSN, the IMF is exploring the development of new liquidity facilities available to member countries with solid economic fundamentals and a sound macroeconomic policy framework. The availability of new liquidity facilities is expected to bolster the GFSN as another line of defense in addition to reserves,
bilateral swap arrangements (BSA) and regional financing arrangements.
The G20 is encouraging its members to implement consistently, completely, and in a timely manner all financial sector reforms, including rules covering financial institutions under the Basel III Principles10 and Total Loss Absorbing Capacity Standards.11 This will increase financial sector resilience. In addition, financial sector reforms also include efforts to improve global financial market infrastructure through the establishment of a central counterparty,12 among others. The G20 also backs efforts to overcome the myriad problems of money laundering and international terrorism financing, and as such supports the work of the Financial Action Task Force (FATF).13
Regional resilience has been improved by strengthening the regional financial arrangements and surveillance. The ASEAN+3 forum has continued efforts to strengthen regional resilience to confront the risk of global uncertainty by refining the CMIM and strengthening the role of the ASEAN+3 Macroeconomic Research Office. To operationalize the CMIM, operating guidelines are constantly refined and a framework to evaluate the feasibility of the CMIM Prevention Line is prepared.14 In the context of volume, most ASEAN+3 members have agreed to increase the CMIM-IMF de-linked portion to 40% from 30% in order to bolster CMIM as a regional self-help mechanism.
Economic and financial sector resilience has also been strengthened in ASEAN by the regional grouping’s ongoing financial sector integration. ASEAN aims for economic integration in 2025 – the ASEAN Economic Community – particularly in the financial channel, and has set a strategic action plan for financial integration in 2025. In 2017, ASEAN compiled key performance indicators to evaluate the progress towards financial integration. These indicators are divided into three sections
10 The Basel III Principles is a banking sector regulatory framework issued by the Basel
Committee on Banking Supervision (BCBS).
11 Total Loss Absorbing Capacity Standards are issued by the Financial Stability Board
(FSB). They are minimum standards for potential loss-absorbing capacity in the banking
industry.
12 A central counterparty is a clearing house institution tasked with clearing and
guaranteeing transactions in the financial market.
13 The Financial Action Task Force (FATF) is an intergovernmental body established in
1989 with the aim of setting standards and promoting effective implementation of
legal, regulatory and operational measures for combating money laundering, terrorist
financing, and other related threats to the integrity of the international financial system.
14 The CMIM Prevention Line is an Economic Review and Policy Dialogue Matrix.
2017 ECONOMIC REPORT ON INDONESIA • CHAPTER 1 | 15
– financial integration, financial inclusion, and financial stability.
Various international cooperation forums, such as the IMF, G20, Executives’ Meeting of East Asia Pacific Central Banks and ASEAN, are also monitoring the rapid proliferation of fintech. Rapid development has thrust fintech into the financial system, and this could change the global and regional financial landscape. Fintech refers to technological innovations that expand the opportunities for financial services. Nevertheless, fintech is being monitored as it is seen as a potential threat to cyber security, which could undermine financial system stability if not well managed. To that end, the majority of central banks and financial authorities have agreed to scrutinize fintech more deeply and remain vigilant of fintech development in order to mitigate emerging risks.

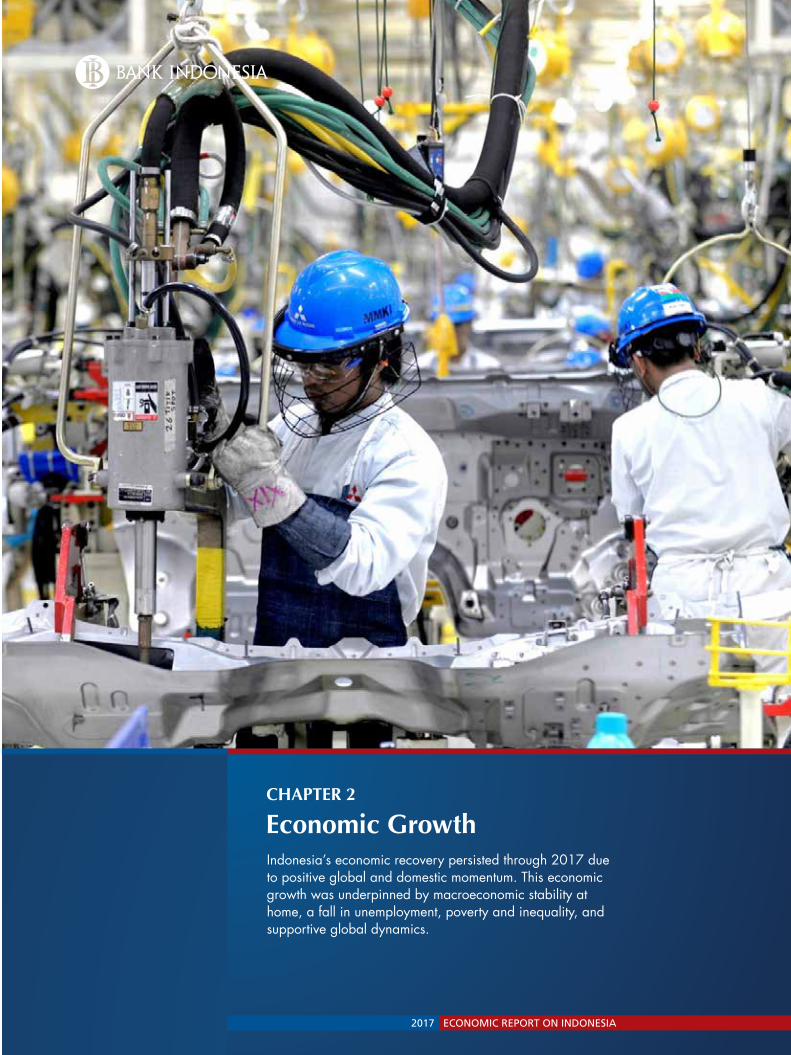
| 17LAPORAN PEREKONOMIAN INDONESIA 20172017 ECONOMIC REPORT ON INDONESIA
CHAPTER 2
Indonesia’s economic recovery persisted through 2017 due to positive global and domestic momentum. This economic growth was underpinned by macroeconomic stability at home, a fall in unemployment, poverty and inequality, and supportive global dynamics.
Economic Growth
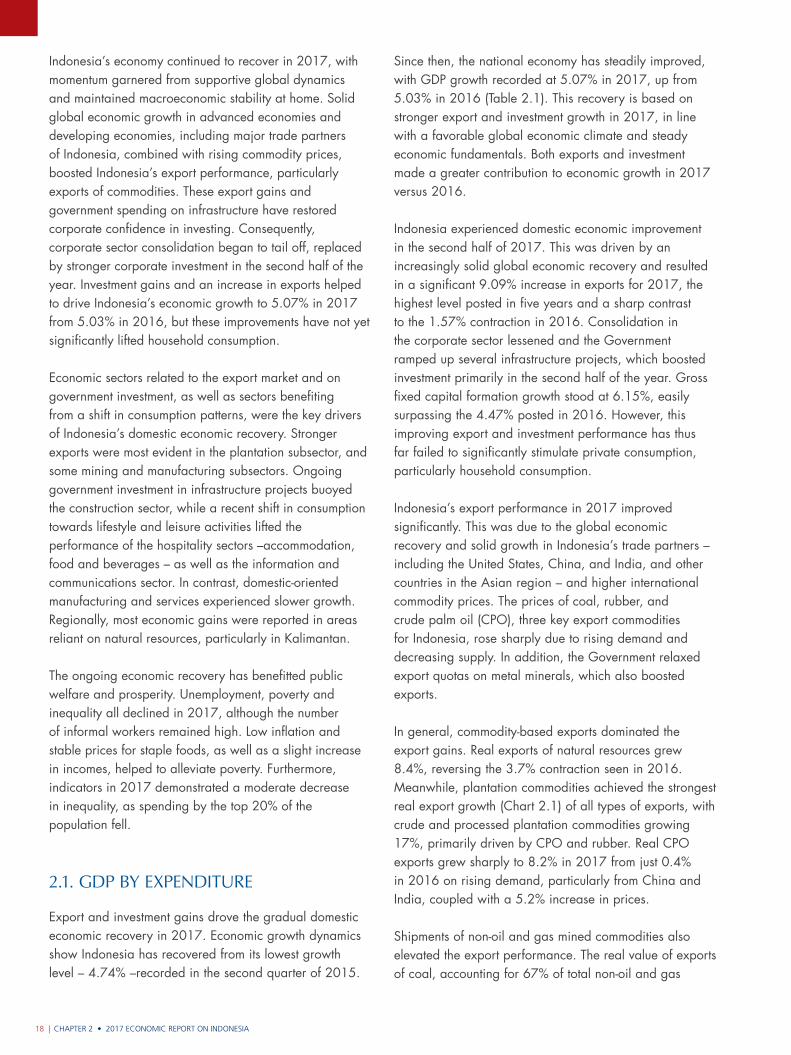
CHAPTER 2 • 2017 ECONOMIC REPORT ON INDONESIA18 |
Indonesia’s economy continued to recover in 2017, with momentum garnered from supportive global dynamics and maintained macroeconomic stability at home. Solid global economic growth in advanced economies and developing economies, including major trade partners of Indonesia, combined with rising commodity prices, boosted Indonesia’s export performance, particularly exports of commodities. These export gains and government spending on infrastructure have restored corporate confidence in investing. Consequently, corporate sector consolidation began to tail off, replaced by stronger corporate investment in the second half of the year. Investment gains and an increase in exports helped to drive Indonesia’s economic growth to 5.07% in 2017 from 5.03% in 2016, but these improvements have not yet significantly lifted household consumption.
Economic sectors related to the export market and on government investment, as well as sectors benefiting from a shift in consumption patterns, were the key drivers of Indonesia’s domestic economic recovery. Stronger exports were most evident in the plantation subsector, and some mining and manufacturing subsectors. Ongoing government investment in infrastructure projects buoyed the construction sector, while a recent shift in consumption towards lifestyle and leisure activities lifted the performance of the hospitality sectors –accommodation, food and beverages – as well as the information and communications sector. In contrast, domestic-oriented manufacturing and services experienced slower growth. Regionally, most economic gains were reported in areas reliant on natural resources, particularly in Kalimantan.
The ongoing economic recovery has benefitted public welfare and prosperity. Unemployment, poverty and inequality all declined in 2017, although the number of informal workers remained high. Low inflation and stable prices for staple foods, as well as a slight increase in incomes, helped to alleviate poverty. Furthermore, indicators in 2017 demonstrated a moderate decrease in inequality, as spending by the top 20% of the population fell.
2.1. GDP by ExPEnDiturE
Export and investment gains drove the gradual domestic economic recovery in 2017. Economic growth dynamics show Indonesia has recovered from its lowest growth level – 4.74% –recorded in the second quarter of 2015.
Since then, the national economy has steadily improved, with GDP growth recorded at 5.07% in 2017, up from 5.03% in 2016 (Table 2.1). This recovery is based on stronger export and investment growth in 2017, in line with a favorable global economic climate and steady economic fundamentals. Both exports and investment made a greater contribution to economic growth in 2017 versus 2016.
Indonesia experienced domestic economic improvement in the second half of 2017. This was driven by an increasingly solid global economic recovery and resulted in a significant 9.09% increase in exports for 2017, the highest level posted in five years and a sharp contrast to the 1.57% contraction in 2016. Consolidation in the corporate sector lessened and the Government ramped up several infrastructure projects, which boosted investment primarily in the second half of the year. Gross fixed capital formation growth stood at 6.15%, easily surpassing the 4.47% posted in 2016. However, this improving export and investment performance has thus far failed to significantly stimulate private consumption, particularly household consumption.
Indonesia’s export performance in 2017 improved significantly. This was due to the global economic recovery and solid growth in Indonesia’s trade partners – including the United States, China, and India, and other countries in the Asian region – and higher international commodity prices. The prices of coal, rubber, and crude palm oil (CPO), three key export commodities for Indonesia, rose sharply due to rising demand and decreasing supply. In addition, the Government relaxed export quotas on metal minerals, which also boosted exports.
In general, commodity-based exports dominated the export gains. Real exports of natural resources grew 8.4%, reversing the 3.7% contraction seen in 2016. Meanwhile, plantation commodities achieved the strongest real export growth (Chart 2.1) of all types of exports, with crude and processed plantation commodities growing 17%, primarily driven by CPO and rubber. Real CPO exports grew sharply to 8.2% in 2017 from just 0.4% in 2016 on rising demand, particularly from China and India, coupled with a 5.2% increase in prices.
Shipments of non-oil and gas mined commodities also elevated the export performance. The real value of exports of coal, accounting for 67% of total non-oil and gas
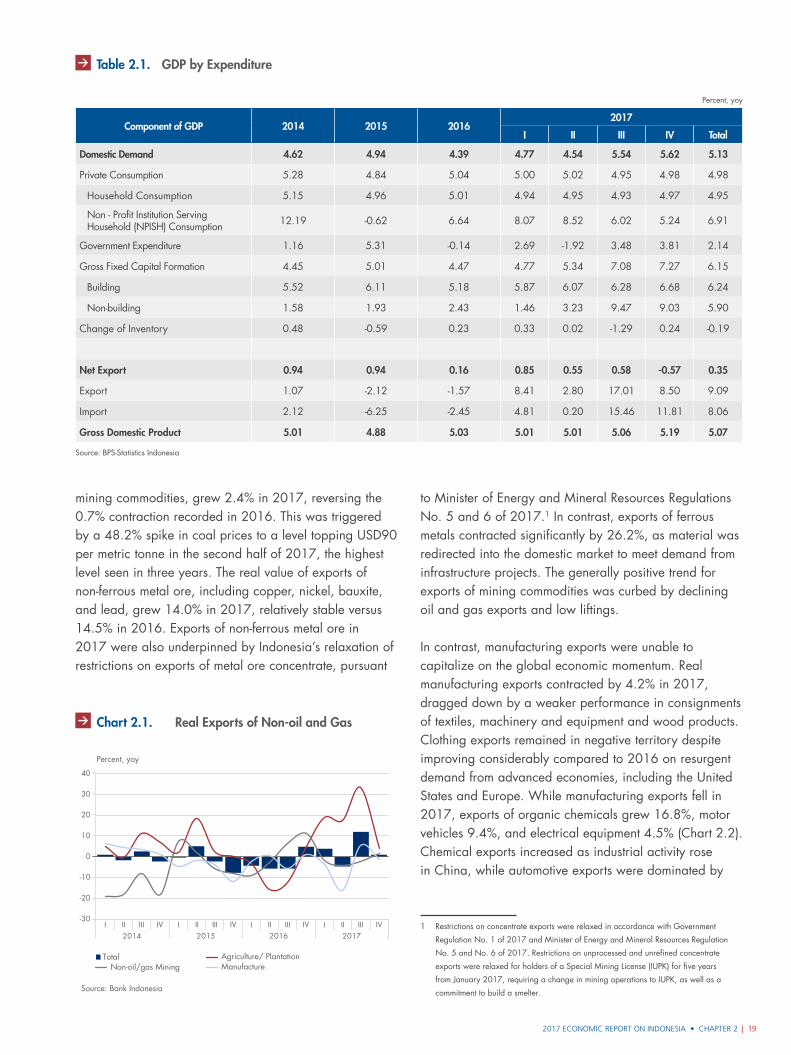
2017 ECONOMIC REPORT ON INDONESIA • CHAPTER 2 | 19
to Minister of Energy and Mineral Resources Regulations No. 5 and 6 of 2017.1 In contrast, exports of ferrous metals contracted significantly by 26.2%, as material was redirected into the domestic market to meet demand from infrastructure projects. The generally positive trend for exports of mining commodities was curbed by declining oil and gas exports and low liftings.
In contrast, manufacturing exports were unable to capitalize on the global economic momentum. Real manufacturing exports contracted by 4.2% in 2017, dragged down by a weaker performance in consignments of textiles, machinery and equipment and wood products. Clothing exports remained in negative territory despite improving considerably compared to 2016 on resurgent demand from advanced economies, including the United States and Europe. While manufacturing exports fell in 2017, exports of organic chemicals grew 16.8%, motor vehicles 9.4%, and electrical equipment 4.5% (Chart 2.2). Chemical exports increased as industrial activity rose in China, while automotive exports were dominated by
1 Restrictions on concentrate exports were relaxed in accordance with Government
Regulation No. 1 of 2017 and Minister of Energy and Mineral Resources Regulation
No. 5 and No. 6 of 2017. Restrictions on unprocessed and unrefined concentrate
exports were relaxed for holders of a Special Mining License (IUPK) for five years
from January 2017, requiring a change in mining operations to IUPK, as well as a
commitment to build a smelter.
mining commodities, grew 2.4% in 2017, reversing the 0.7% contraction recorded in 2016. This was triggered by a 48.2% spike in coal prices to a level topping USD90 per metric tonne in the second half of 2017, the highest level seen in three years. The real value of exports of non-ferrous metal ore, including copper, nickel, bauxite, and lead, grew 14.0% in 2017, relatively stable versus 14.5% in 2016. Exports of non-ferrous metal ore in 2017 were also underpinned by Indonesia’s relaxation of restrictions on exports of metal ore concentrate, pursuant
Percent, yoy
Component of GDP 2014 2015 20162017
I II III IV Total
Domestic Demand 4.62 4.94 4.39 4.77 4.54 5.54 5.62 5.13
Private Consumption 5.28 4.84 5.04 5.00 5.02 4.95 4.98 4.98
Household Consumption 5.15 4.96 5.01 4.94 4.95 4.93 4.97 4.95
Non - Profit Institution Serving Household (NPISH) Consumption 12.19 -0.62 6.64 8.07 8.52 6.02 5.24 6.91
Government Expenditure 1.16 5.31 -0.14 2.69 -1.92 3.48 3.81 2.14
Gross Fixed Capital Formation 4.45 5.01 4.47 4.77 5.34 7.08 7.27 6.15
Building 5.52 6.11 5.18 5.87 6.07 6.28 6.68 6.24
Non-building 1.58 1.93 2.43 1.46 3.23 9.47 9.03 5.90
Change of Inventory 0.48 -0.59 0.23 0.33 0.02 -1.29 0.24 -0.19
Net Export 0.94 0.94 0.16 0.85 0.55 0.58 -0.57 0.35
Export 1.07 -2.12 -1.57 8.41 2.80 17.01 8.50 9.09
Import 2.12 -6.25 -2.45 4.81 0.20 15.46 11.81 8.06
Gross Domestic Product 5.01 4.88 5.03 5.01 5.01 5.06 5.19 5.07
Source: BPS-Statistics Indonesia
Table 2.1. GDP by Expenditure
Grafik 2.1.
Source: Bank Indonesia
-30
-20
-10
0
10
20
30
40
I II III IV2014 2015
I II III IV2016
I II III IV2017
I II III IV
Percent, yoy
TotalNon-oil/gas Mining
Agriculture/ PlantationManufacture
Chart 2.1. Real Exports of Non-oil and Gas
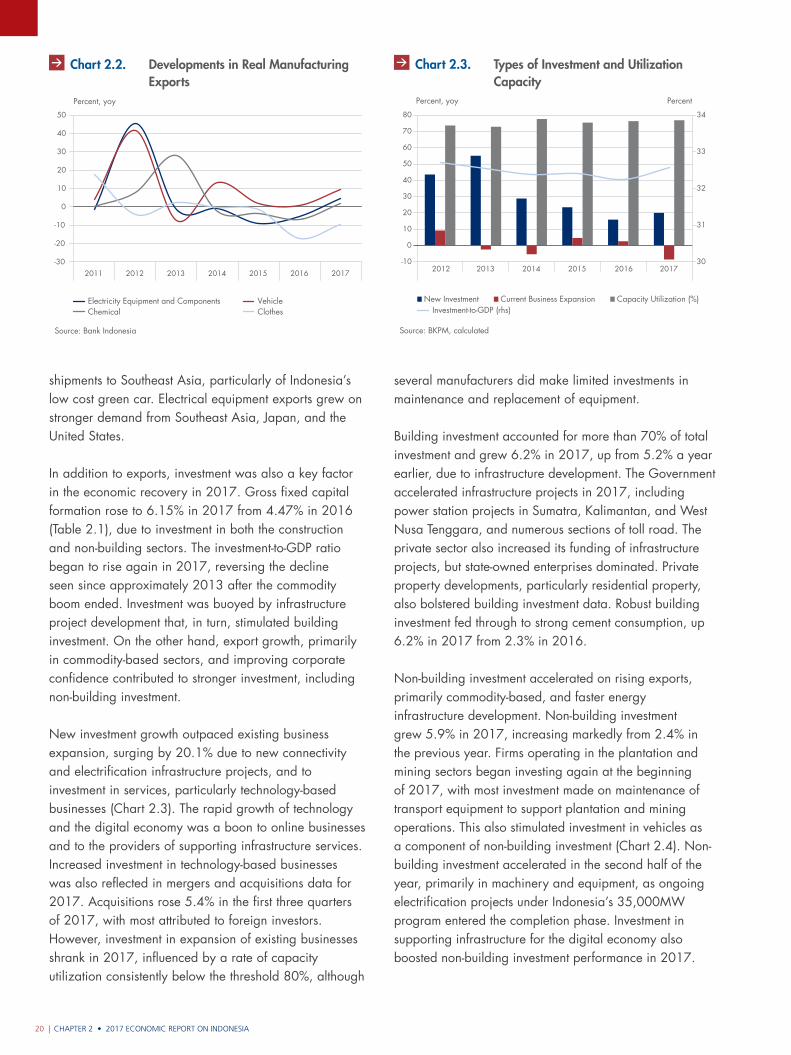
CHAPTER 2 • 2017 ECONOMIC REPORT ON INDONESIA20 |
shipments to Southeast Asia, particularly of Indonesia’s low cost green car. Electrical equipment exports grew on stronger demand from Southeast Asia, Japan, and the United States.
In addition to exports, investment was also a key factor in the economic recovery in 2017. Gross fixed capital formation rose to 6.15% in 2017 from 4.47% in 2016 (Table 2.1), due to investment in both the construction and non-building sectors. The investment-to-GDP ratio began to rise again in 2017, reversing the decline seen since approximately 2013 after the commodity boom ended. Investment was buoyed by infrastructure project development that, in turn, stimulated building investment. On the other hand, export growth, primarily in commodity-based sectors, and improving corporate confidence contributed to stronger investment, including non-building investment.
New investment growth outpaced existing business expansion, surging by 20.1% due to new connectivity and electrification infrastructure projects, and to investment in services, particularly technology-based businesses (Chart 2.3). The rapid growth of technology and the digital economy was a boon to online businesses and to the providers of supporting infrastructure services. Increased investment in technology-based businesses was also reflected in mergers and acquisitions data for 2017. Acquisitions rose 5.4% in the first three quarters of 2017, with most attributed to foreign investors. However, investment in expansion of existing businesses shrank in 2017, influenced by a rate of capacity utilization consistently below the threshold 80%, although
several manufacturers did make limited investments in maintenance and replacement of equipment.
Building investment accounted for more than 70% of total investment and grew 6.2% in 2017, up from 5.2% a year earlier, due to infrastructure development. The Government accelerated infrastructure projects in 2017, including power station projects in Sumatra, Kalimantan, and West Nusa Tenggara, and numerous sections of toll road. The private sector also increased its funding of infrastructure projects, but state-owned enterprises dominated. Private property developments, particularly residential property, also bolstered building investment data. Robust building investment fed through to strong cement consumption, up 6.2% in 2017 from 2.3% in 2016.
Non-building investment accelerated on rising exports, primarily commodity-based, and faster energy infrastructure development. Non-building investment grew 5.9% in 2017, increasing markedly from 2.4% in the previous year. Firms operating in the plantation and mining sectors began investing again at the beginning of 2017, with most investment made on maintenance of transport equipment to support plantation and mining operations. This also stimulated investment in vehicles as a component of non-building investment (Chart 2.4). Non-building investment accelerated in the second half of the year, primarily in machinery and equipment, as ongoing electrification projects under Indonesia’s 35,000MW program entered the completion phase. Investment in supporting infrastructure for the digital economy also boosted non-building investment performance in 2017.
Grafik 2.2.
Source: Bank Indonesia
Electricity Equipment and ComponentsChemical
VehicleClothes
-30
-20
-10
0
10
20
30
40
50
2011 2012 2013 2014 2015 2016 2017
Percent, yoy
Chart 2.2. Developments in Real Manufacturing Exports
Grafik 2.3
Source: BKPM, calculated
New Investment Capacity Utilization (%)Current Business ExpansionInvestment-to-GDP (rhs)
30
31
32
33
34
-10
0
10
20
30
40
50
60
70
80
2012 2013 2014 2015 2016 2017
Percent, yoy Percent
Chart 2.3. Types of Investment and Utilization Capacity
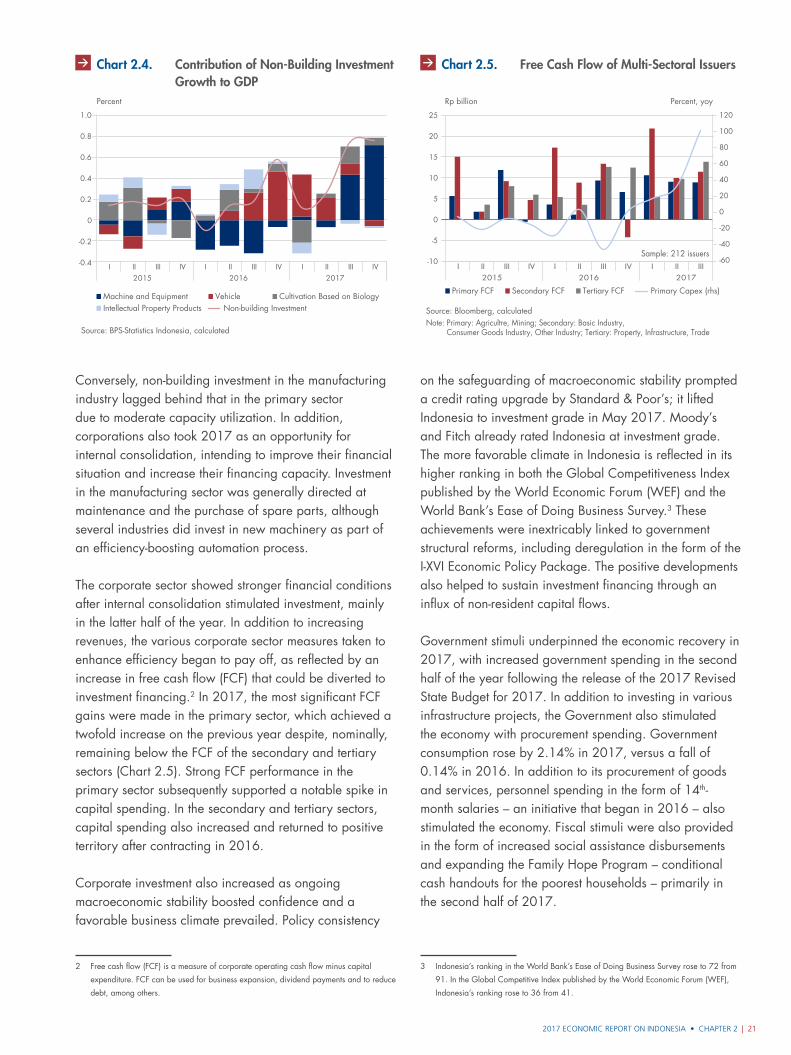
2017 ECONOMIC REPORT ON INDONESIA • CHAPTER 2 | 21
Conversely, non-building investment in the manufacturing industry lagged behind that in the primary sector due to moderate capacity utilization. In addition, corporations also took 2017 as an opportunity for internal consolidation, intending to improve their financial situation and increase their financing capacity. Investment in the manufacturing sector was generally directed at maintenance and the purchase of spare parts, although several industries did invest in new machinery as part of an efficiency-boosting automation process.
The corporate sector showed stronger financial conditions after internal consolidation stimulated investment, mainly in the latter half of the year. In addition to increasing revenues, the various corporate sector measures taken to enhance efficiency began to pay off, as reflected by an increase in free cash flow (FCF) that could be diverted to investment financing.2 In 2017, the most significant FCF gains were made in the primary sector, which achieved a twofold increase on the previous year despite, nominally, remaining below the FCF of the secondary and tertiary sectors (Chart 2.5). Strong FCF performance in the primary sector subsequently supported a notable spike in capital spending. In the secondary and tertiary sectors, capital spending also increased and returned to positive territory after contracting in 2016.
Corporate investment also increased as ongoing macroeconomic stability boosted confidence and a favorable business climate prevailed. Policy consistency
2 Free cash flow (FCF) is a measure of corporate operating cash flow minus capital
expenditure. FCF can be used for business expansion, dividend payments and to reduce
debt, among others.
on the safeguarding of macroeconomic stability prompted a credit rating upgrade by Standard & Poor’s; it lifted Indonesia to investment grade in May 2017. Moody’s and Fitch already rated Indonesia at investment grade. The more favorable climate in Indonesia is reflected in its higher ranking in both the Global Competitiveness Index published by the World Economic Forum (WEF) and the World Bank’s Ease of Doing Business Survey.3 These achievements were inextricably linked to government structural reforms, including deregulation in the form of the I-XVI Economic Policy Package. The positive developments also helped to sustain investment financing through an influx of non-resident capital flows.
Government stimuli underpinned the economic recovery in 2017, with increased government spending in the second half of the year following the release of the 2017 Revised State Budget for 2017. In addition to investing in various infrastructure projects, the Government also stimulated the economy with procurement spending. Government consumption rose by 2.14% in 2017, versus a fall of 0.14% in 2016. In addition to its procurement of goods and services, personnel spending in the form of 14th-month salaries – an initiative that began in 2016 – also stimulated the economy. Fiscal stimuli were also provided in the form of increased social assistance disbursements and expanding the Family Hope Program – conditional cash handouts for the poorest households – primarily in the second half of 2017.
3 Indonesia’s ranking in the World Bank’s Ease of Doing Business Survey rose to 72 from
91. In the Global Competitive Index published by the World Economic Forum (WEF),
Indonesia’s ranking rose to 36 from 41.
Grafik 2.4
Source: BPS-Statistics Indonesia, calculated
-0.4
-0.2
0
0.2
0.4
0.6
0.8
1.0
Percent
2015I II III IV
2016I II III IV
2017I II III IV
Vehicle Cultivation Based on BiologyIntellectual Property Products Non-building InvestmentMachine and Equipment
Chart 2.4. Contribution of Non-Building Investment Growth to GDP
Grafik 2.5
Source: Bloomberg, calculated
Rp billion Percent, yoy
-60
-40
-20
0
20
40
60
80
100
120
-10
-5
0
5
10
15
20
25
Note: Primary: Agricultre, Mining; Secondary: Basic Industry, Consumer Goods Industry, Other Industry; Tertiary: Property, Infrastructure, Trade
Sample: 212 issuers
Secondary FCF Tertiary FCF Primary Capex (rhs)Primary FCF
2015I II III IV
2016I II III IV
2017I II III
Chart 2.5. Free Cash Flow of Multi-Sectoral Issuers
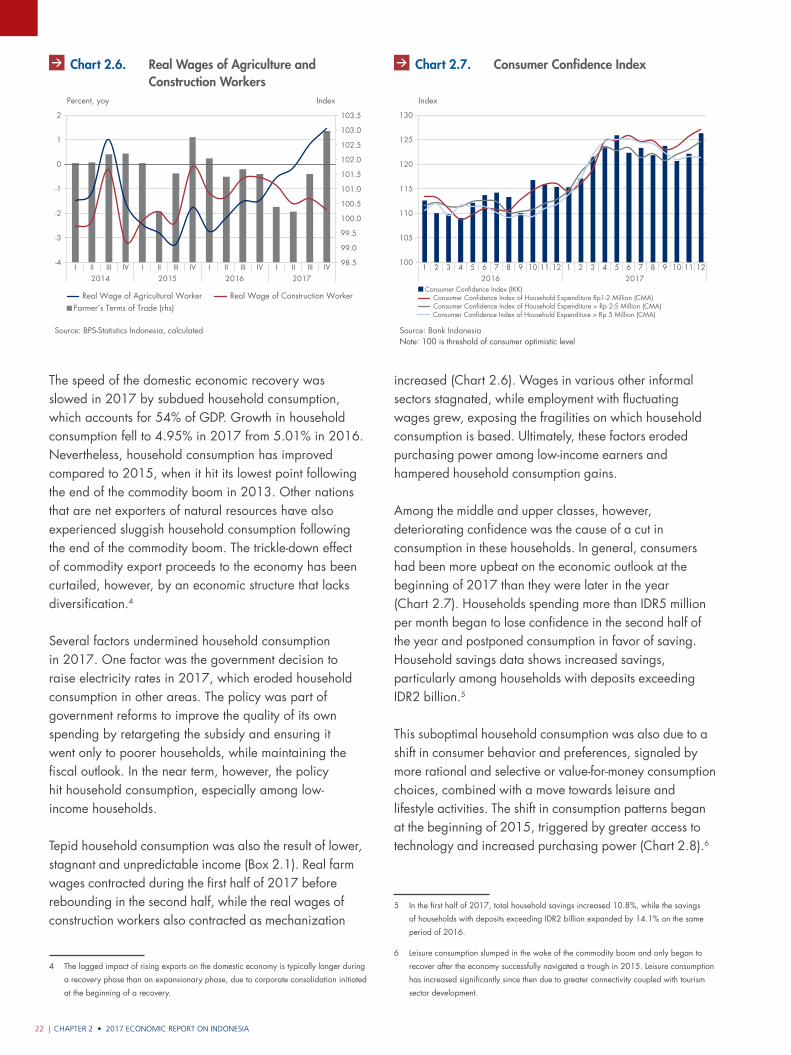
CHAPTER 2 • 2017 ECONOMIC REPORT ON INDONESIA22 |
increased (Chart 2.6). Wages in various other informal sectors stagnated, while employment with fluctuating wages grew, exposing the fragilities on which household consumption is based. Ultimately, these factors eroded purchasing power among low-income earners and hampered household consumption gains.
Among the middle and upper classes, however, deteriorating confidence was the cause of a cut in consumption in these households. In general, consumers had been more upbeat on the economic outlook at the beginning of 2017 than they were later in the year (Chart 2.7). Households spending more than IDR5 million per month began to lose confidence in the second half of the year and postponed consumption in favor of saving. Household savings data shows increased savings, particularly among households with deposits exceeding IDR2 billion.5
This suboptimal household consumption was also due to a shift in consumer behavior and preferences, signaled by more rational and selective or value-for-money consumption choices, combined with a move towards leisure and lifestyle activities. The shift in consumption patterns began at the beginning of 2015, triggered by greater access to technology and increased purchasing power (Chart 2.8).6
5 In the first half of 2017, total household savings increased 10.8%, while the savings
of households with deposits exceeding IDR2 billion expanded by 14.1% on the same
period of 2016.
6 Leisure consumption slumped in the wake of the commodity boom and only began to
recover after the economy successfully navigated a trough in 2015. Leisure consumption
has increased significantly since then due to greater connectivity coupled with tourism
sector development.
The speed of the domestic economic recovery was slowed in 2017 by subdued household consumption, which accounts for 54% of GDP. Growth in household consumption fell to 4.95% in 2017 from 5.01% in 2016. Nevertheless, household consumption has improved compared to 2015, when it hit its lowest point following the end of the commodity boom in 2013. Other nations that are net exporters of natural resources have also experienced sluggish household consumption following the end of the commodity boom. The trickle-down effect of commodity export proceeds to the economy has been curtailed, however, by an economic structure that lacks diversification.4
Several factors undermined household consumption in 2017. One factor was the government decision to raise electricity rates in 2017, which eroded household consumption in other areas. The policy was part of government reforms to improve the quality of its own spending by retargeting the subsidy and ensuring it went only to poorer households, while maintaining the fiscal outlook. In the near term, however, the policy hit household consumption, especially among low-income households.
Tepid household consumption was also the result of lower, stagnant and unpredictable income (Box 2.1). Real farm wages contracted during the first half of 2017 before rebounding in the second half, while the real wages of construction workers also contracted as mechanization
4 The lagged impact of rising exports on the domestic economy is typically longer during
a recovery phase than an expansionary phase, due to corporate consolidation initiated
at the beginning of a recovery.
Source: BPS-Statistics Indonesia, calculated
Grafik 2.8
-4
-3
-2
-1
0
1
2
Percent, yoy Index
2014I II III IV
2015 2016 2017I II III IV I II III IV I II III IV
Farmer’s Terms of Trade (rhs)Real Wage of Agricultural Worker Real Wage of Construction Worker
98.5
99.0
99.5
100.0
100.5
101.0
101.5
102.0
102.5
103.0
103.5
Chart 2.6. Real Wages of Agriculture and Construction Workers
Source: Bank Indonesia
Grafik 2.9
100
105
110
115
120
130
125
1 2 3 42016
5 9 10 11 126 7 8 1 2 3 42017
5 9 10 11 126 7 8
Consumer Confidence Index (IKK)
Consumer Confidence Index of Household Expenditure > Rp 2-5 Million (CMA)Consumer Confidence Index of Household Expenditure > Rp 5 Million (CMA)
Consumer Confidence Index of Household Expenditure Rp1-2 Million (CMA)
Index
Chart 2.7. Consumer Confidence Index
Note: 100 is threshold of consumer optimistic level
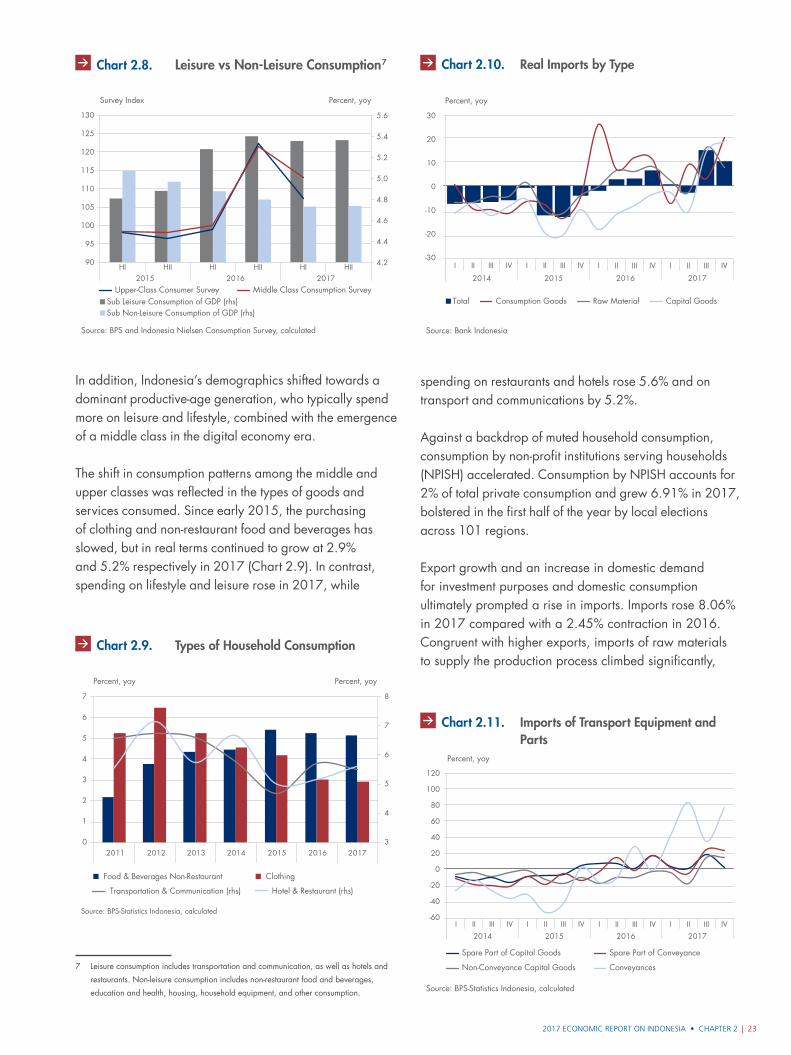
2017 ECONOMIC REPORT ON INDONESIA • CHAPTER 2 | 23
In addition, Indonesia’s demographics shifted towards a dominant productive-age generation, who typically spend more on leisure and lifestyle, combined with the emergence of a middle class in the digital economy era.7
The shift in consumption patterns among the middle and upper classes was reflected in the types of goods and services consumed. Since early 2015, the purchasing of clothing and non-restaurant food and beverages has slowed, but in real terms continued to grow at 2.9% and 5.2% respectively in 2017 (Chart 2.9). In contrast, spending on lifestyle and leisure rose in 2017, while
7 Leisure consumption includes transportation and communication, as well as hotels and
restaurants. Non-leisure consumption includes non-restaurant food and beverages,
education and health, housing, household equipment, and other consumption.
spending on restaurants and hotels rose 5.6% and on transport and communications by 5.2%.
Against a backdrop of muted household consumption, consumption by non-profit institutions serving households (NPISH) accelerated. Consumption by NPISH accounts for 2% of total private consumption and grew 6.91% in 2017, bolstered in the first half of the year by local elections across 101 regions.
Export growth and an increase in domestic demand for investment purposes and domestic consumption ultimately prompted a rise in imports. Imports rose 8.06% in 2017 compared with a 2.45% contraction in 2016. Congruent with higher exports, imports of raw materials to supply the production process climbed significantly,
Source: BPS and Indonesia Nielsen Consumption Survey, calculated
Grafik 2.8. xxx
90
105
100
95
110
115
120
125
130
Survey Index Percent, yoy
HI HIHII HII HI HII2015 2016 2017
Sub Leisure Consumption of GDP (rhs)Sub Non-Leisure Consumption of GDP (rhs)
Upper-Class Consumer Survey Middle Class Consumption Survey
4.2
4.8
4.6
4.4
5.0
5.2
5.4
5.6
Chart 2.8. Leisure vs Non-Leisure Consumption7
Grafik 2.11
Source: BPS-Statistics Indonesia, calculated
2011 2012 2013 2014 2015 2016 20173
4
5
6
7
8
0
1
2
3
4
5
6
7
Food & Beverages Non-Restaurant Clothing
Transportation & Communication (rhs) Hotel & Restaurant (rhs)
Percent, yoy Percent, yoy
Chart 2.9. Types of Household Consumption
Grafik 2.6
Percent, yoy
Source: Bank Indonesia
Consumption Goods Raw Material Capital GoodsTotal
-30
-20
-10
0
10
20
30
I II III IV
2014 2015 2016 2017
I II III IV I II III IV I II III IV
Chart 2.10. Real Imports by Type
Grafik 2.7
Source: BPS-Statistics Indonesia, calculated
-60
-40
-20
0
20
40
60
80
100
120
I II III IV
2014 2015 2016 2017
I II III IV I II III IV I II III IV
Spare Part of Capital Goods
Non-Conveyance Capital Goods
Spare Part of Conveyance
Conveyances
Percent, yoy
Chart 2.11. Imports of Transport Equipment and Parts
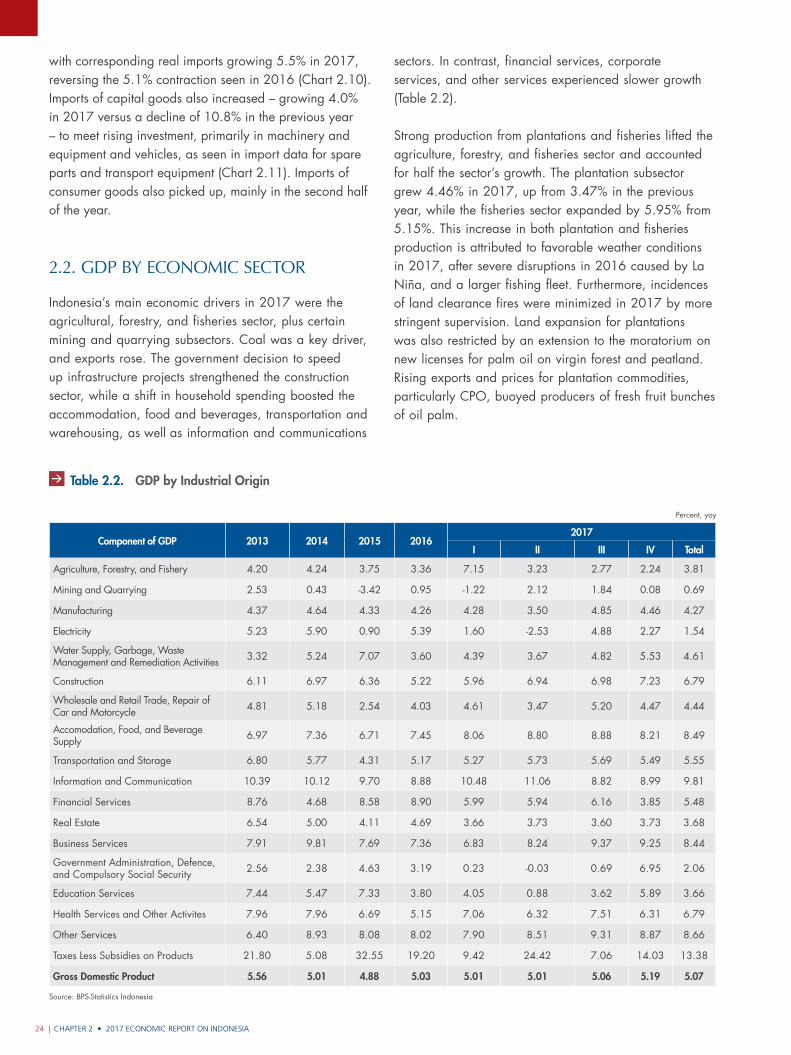
CHAPTER 2 • 2017 ECONOMIC REPORT ON INDONESIA24 |
with corresponding real imports growing 5.5% in 2017, reversing the 5.1% contraction seen in 2016 (Chart 2.10). Imports of capital goods also increased – growing 4.0% in 2017 versus a decline of 10.8% in the previous year – to meet rising investment, primarily in machinery and equipment and vehicles, as seen in import data for spare parts and transport equipment (Chart 2.11). Imports of consumer goods also picked up, mainly in the second half of the year.
2.2. GDP by Economic SEctor
Indonesia’s main economic drivers in 2017 were the agricultural, forestry, and fisheries sector, plus certain mining and quarrying subsectors. Coal was a key driver, and exports rose. The government decision to speed up infrastructure projects strengthened the construction sector, while a shift in household spending boosted the accommodation, food and beverages, transportation and warehousing, as well as information and communications
sectors. In contrast, financial services, corporate services, and other services experienced slower growth (Table 2.2).
Strong production from plantations and fisheries lifted the agriculture, forestry, and fisheries sector and accounted for half the sector’s growth. The plantation subsector grew 4.46% in 2017, up from 3.47% in the previous year, while the fisheries sector expanded by 5.95% from 5.15%. This increase in both plantation and fisheries production is attributed to favorable weather conditions in 2017, after severe disruptions in 2016 caused by La Niña, and a larger fishing fleet. Furthermore, incidences of land clearance fires were minimized in 2017 by more stringent supervision. Land expansion for plantations was also restricted by an extension to the moratorium on new licenses for palm oil on virgin forest and peatland. Rising exports and prices for plantation commodities, particularly CPO, buoyed producers of fresh fruit bunches of oil palm.
Percent, yoy
Component of GDP 2013 2014 2015 20162017
I II III IV Total
Agriculture, Forestry, and Fishery 4.20 4.24 3.75 3.36 7.15 3.23 2.77 2.24 3.81
Mining and Quarrying 2.53 0.43 -3.42 0.95 -1.22 2.12 1.84 0.08 0.69
Manufacturing 4.37 4.64 4.33 4.26 4.28 3.50 4.85 4.46 4.27
Electricity 5.23 5.90 0.90 5.39 1.60 -2.53 4.88 2.27 1.54
Water Supply, Garbage, Waste Management and Remediation Activities 3.32 5.24 7.07 3.60 4.39 3.67 4.82 5.53 4.61
Construction 6.11 6.97 6.36 5.22 5.96 6.94 6.98 7.23 6.79
Wholesale and Retail Trade, Repair of Car and Motorcycle 4.81 5.18 2.54 4.03 4.61 3.47 5.20 4.47 4.44
Accomodation, Food, and Beverage Supply 6.97 7.36 6.71 7.45 8.06 8.80 8.88 8.21 8.49
Transportation and Storage 6.80 5.77 4.31 5.17 5.27 5.73 5.69 5.49 5.55
Information and Communication 10.39 10.12 9.70 8.88 10.48 11.06 8.82 8.99 9.81
Financial Services 8.76 4.68 8.58 8.90 5.99 5.94 6.16 3.85 5.48
Real Estate 6.54 5.00 4.11 4.69 3.66 3.73 3.60 3.73 3.68
Business Services 7.91 9.81 7.69 7.36 6.83 8.24 9.37 9.25 8.44
Government Administration, Defence, and Compulsory Social Security 2.56 2.38 4.63 3.19 0.23 -0.03 0.69 6.95 2.06
Education Services 7.44 5.47 7.33 3.80 4.05 0.88 3.62 5.89 3.66
Health Services and Other Activites 7.96 7.96 6.69 5.15 7.06 6.32 7.51 6.31 6.79
Other Services 6.40 8.93 8.08 8.02 7.90 8.51 9.31 8.87 8.66
Taxes Less Subsidies on Products 21.80 5.08 32.55 19.20 9.42 24.42 7.06 14.03 13.38
Gross Domestic Product 5.56 5.01 4.88 5.03 5.01 5.01 5.06 5.19 5.07
Source: BPS-Statistics Indonesia
Table 2.2. GDP by Industrial Origin
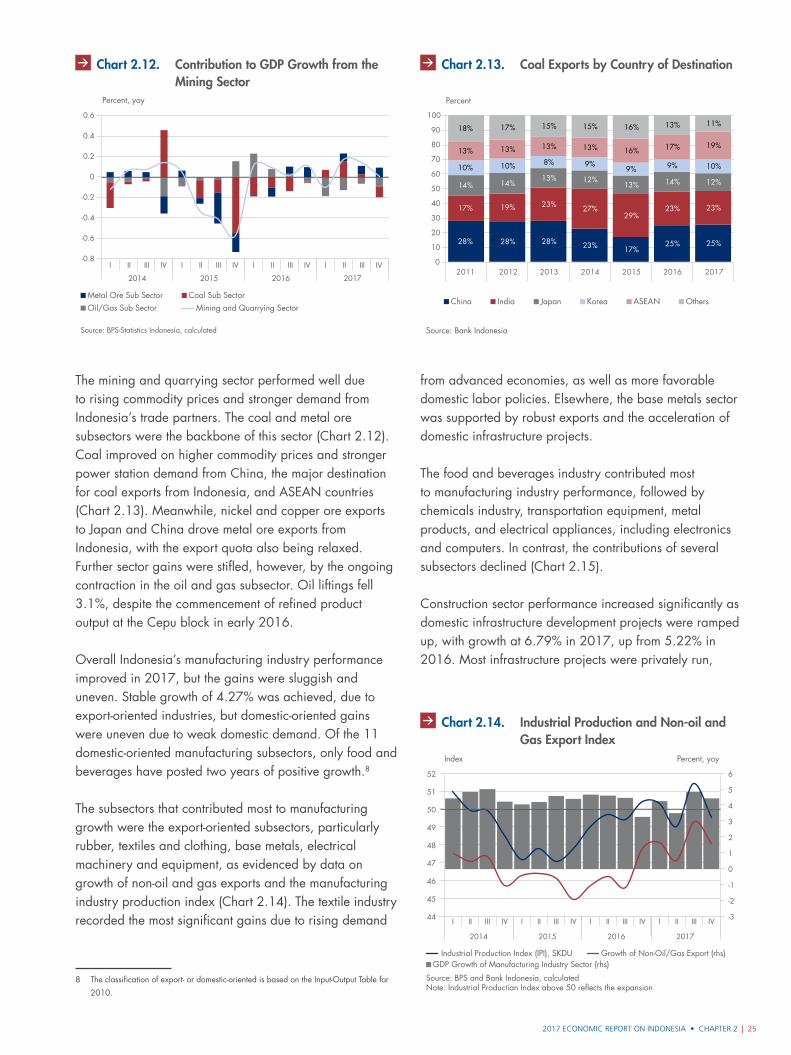
2017 ECONOMIC REPORT ON INDONESIA • CHAPTER 2 | 25
The mining and quarrying sector performed well due to rising commodity prices and stronger demand from Indonesia’s trade partners. The coal and metal ore subsectors were the backbone of this sector (Chart 2.12). Coal improved on higher commodity prices and stronger power station demand from China, the major destination for coal exports from Indonesia, and ASEAN countries (Chart 2.13). Meanwhile, nickel and copper ore exports to Japan and China drove metal ore exports from Indonesia, with the export quota also being relaxed. Further sector gains were stifled, however, by the ongoing contraction in the oil and gas subsector. Oil liftings fell 3.1%, despite the commencement of refined product output at the Cepu block in early 2016.
Overall Indonesia’s manufacturing industry performance improved in 2017, but the gains were sluggish and uneven. Stable growth of 4.27% was achieved, due to export-oriented industries, but domestic-oriented gains were uneven due to weak domestic demand. Of the 11 domestic-oriented manufacturing subsectors, only food and beverages have posted two years of positive growth.8
The subsectors that contributed most to manufacturing growth were the export-oriented subsectors, particularly rubber, textiles and clothing, base metals, electrical machinery and equipment, as evidenced by data on growth of non-oil and gas exports and the manufacturing industry production index (Chart 2.14). The textile industry recorded the most significant gains due to rising demand
8 The classification of export- or domestic-oriented is based on the Input-Output Table for
2010.
from advanced economies, as well as more favorable domestic labor policies. Elsewhere, the base metals sector was supported by robust exports and the acceleration of domestic infrastructure projects.
The food and beverages industry contributed most to manufacturing industry performance, followed by chemicals industry, transportation equipment, metal products, and electrical appliances, including electronics and computers. In contrast, the contributions of several subsectors declined (Chart 2.15).
Construction sector performance increased significantly as domestic infrastructure development projects were ramped up, with growth at 6.79% in 2017, up from 5.22% in 2016. Most infrastructure projects were privately run,
-0.8
-0.6
-0.4
-0.2
0
0.2
0.4
0.6
I II III IV
2014 2015 2016 2017
I II III IV I II III IV I II III IV
Source: BPS-Statistics Indonesia, calculated
Oil/Gas Sub SectorMetal Ore Sub Sector Coal Sub Sector
Mining and Quarrying Sector
Percent, yoy
Grafik 2.12Chart 2.12. Contribution to GDP Growth from the Mining Sector
Source: Bank Indonesia
Grafik 2.13
2011 2012 2013 2014 2015 2016 2017
Japan Korea ASEAN OthersChina India
28% 28% 28% 23% 17%25% 25%
17% 19% 23% 27%29%
23% 23%
14% 14%13% 12%
13% 14% 12%
10% 10% 8% 9%9% 9% 10%
13% 13% 13% 13% 16% 17% 19%
18% 17% 15% 15% 16% 13% 11%
0
10
20
30
40
50
60
70
80
90
100
Percent
Chart 2.13. Coal Exports by Country of Destination
Grafik 2.14
Source: BPS and Bank Indonesia, calculatedNote: Industrial Productian Index above 50 reflects the expansion
-3
-2
-1
0
1
2
3
4
5
6
44
45
46
47
48
49
50
51
52
2014 2015 2016 2017
I II III IV I II III IV I II III IV I II III IV
Index Percent, yoy
Growth of Non-Oil/Gas Export (rhs)Industrial Production Index (IPI), SKDUGDP Growth of Manufacturing Industry Sector (rhs)
Chart 2.14. Industrial Production and Non-oil and Gas Export Index
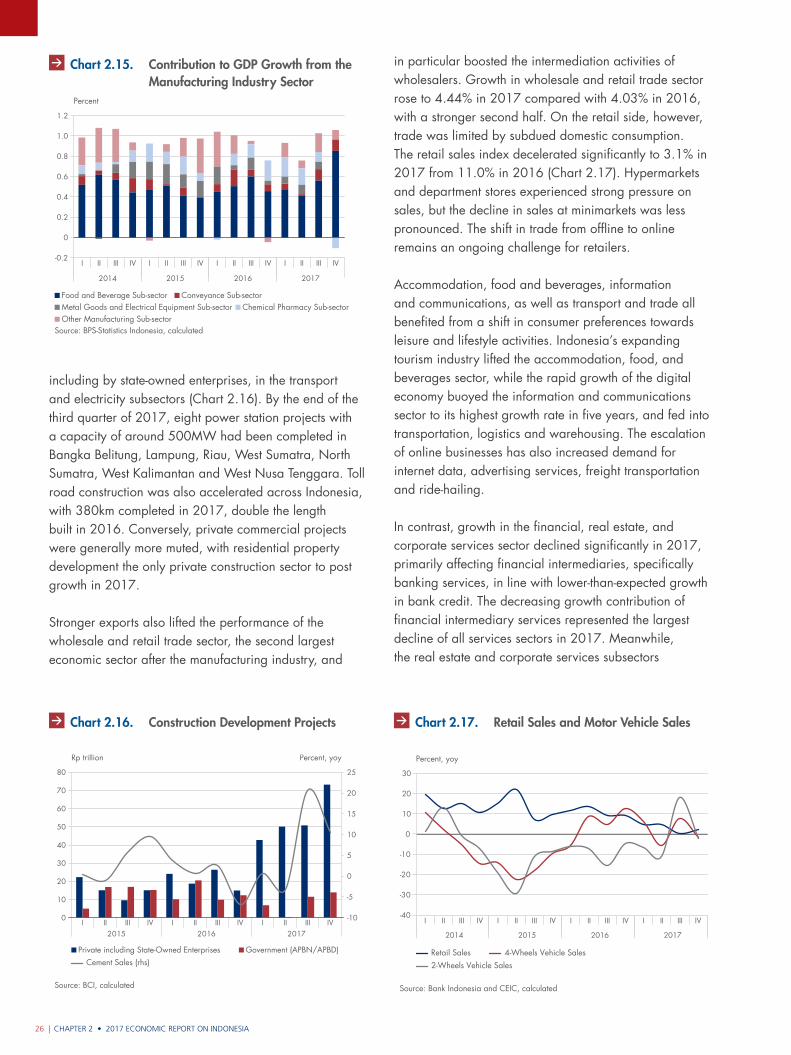
CHAPTER 2 • 2017 ECONOMIC REPORT ON INDONESIA26 |
including by state-owned enterprises, in the transport and electricity subsectors (Chart 2.16). By the end of the third quarter of 2017, eight power station projects with a capacity of around 500MW had been completed in Bangka Belitung, Lampung, Riau, West Sumatra, North Sumatra, West Kalimantan and West Nusa Tenggara. Toll road construction was also accelerated across Indonesia, with 380km completed in 2017, double the length built in 2016. Conversely, private commercial projects were generally more muted, with residential property development the only private construction sector to post growth in 2017.
Stronger exports also lifted the performance of the wholesale and retail trade sector, the second largest economic sector after the manufacturing industry, and
in particular boosted the intermediation activities of wholesalers. Growth in wholesale and retail trade sector rose to 4.44% in 2017 compared with 4.03% in 2016, with a stronger second half. On the retail side, however, trade was limited by subdued domestic consumption. The retail sales index decelerated significantly to 3.1% in 2017 from 11.0% in 2016 (Chart 2.17). Hypermarkets and department stores experienced strong pressure on sales, but the decline in sales at minimarkets was less pronounced. The shift in trade from offline to online remains an ongoing challenge for retailers.
Accommodation, food and beverages, information and communications, as well as transport and trade all benefited from a shift in consumer preferences towards leisure and lifestyle activities. Indonesia’s expanding tourism industry lifted the accommodation, food, and beverages sector, while the rapid growth of the digital economy buoyed the information and communications sector to its highest growth rate in five years, and fed into transportation, logistics and warehousing. The escalation of online businesses has also increased demand for internet data, advertising services, freight transportation and ride-hailing.
In contrast, growth in the financial, real estate, and corporate services sector declined significantly in 2017, primarily affecting financial intermediaries, specifically banking services, in line with lower-than-expected growth in bank credit. The decreasing growth contribution of financial intermediary services represented the largest decline of all services sectors in 2017. Meanwhile, the real estate and corporate services subsectors
-0.2
0
0.2
0.4
0.6
0.8
1.0
1.2
2014 2015 2016 2017
I II III IV I II III IV I II III IV I II III IV
Percent
Grafik 2.15
Source: BPS-Statistics Indonesia, calculated
Metal Goods and Electrical Equipment Sub-sectorFood and Beverage Sub-sector Conveyance Sub-sector
Chemical Pharmacy Sub-sectorOther Manufacturing Sub-sector
Chart 2.15. Contribution to GDP Growth from the Manufacturing Industry Sector
2015 2016 2017I II III IV I II III IV I II III IV
Source: BCI, calculated
Grafik 2.16. Proyek Pembangunan Fisik
0
10
20
30
80
40
50
60
70
Rp trillion Percent, yoy
-10
-5
0
5
10
15
20
25
Private including State-Owned Enterprises Government (APBN/APBD)Cement Sales (rhs)
Chart 2.16. Construction Development Projects Grafik 2.17
Source: Bank Indonesia and CEIC, calculated
-40
-30
-20
-10
0
10
20
30
2014 2015 2016 2017
I II III IV I II III IV I II III IV I II III IV
Retail Sales 4-Wheels Vehicle Sales2-Wheels Vehicle Sales
Percent, yoy
Chart 2.17. Retail Sales and Motor Vehicle Sales
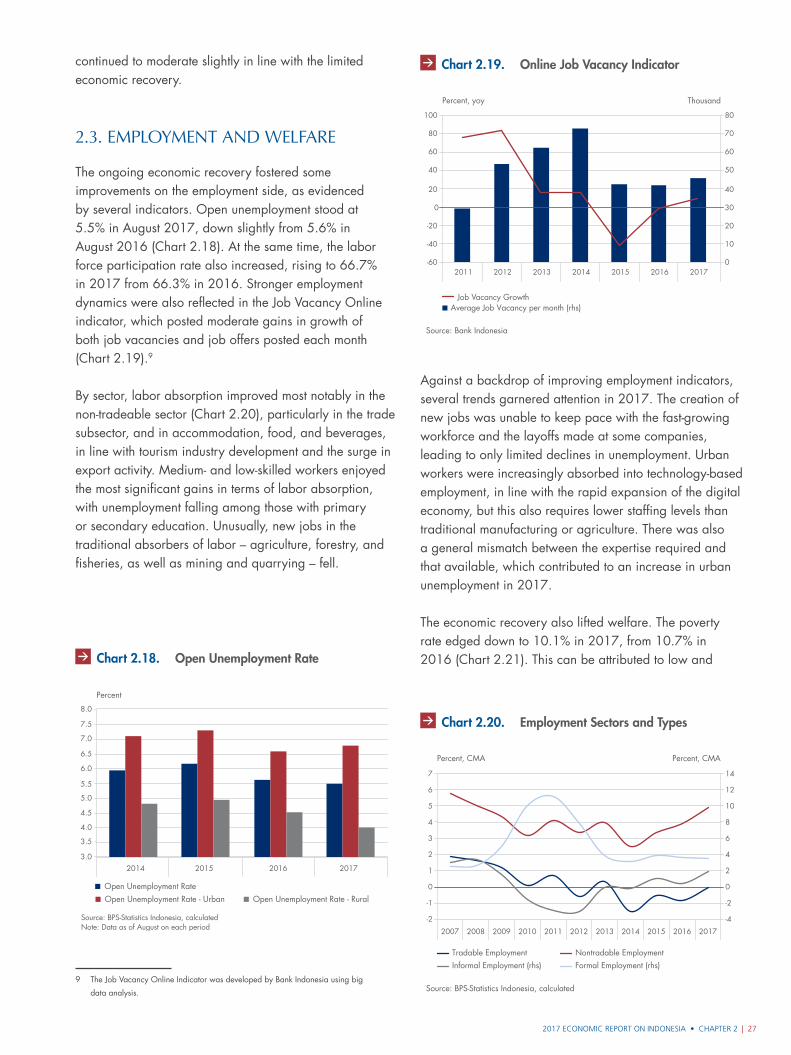
2017 ECONOMIC REPORT ON INDONESIA • CHAPTER 2 | 27
continued to moderate slightly in line with the limited economic recovery.
2.3. EmPloymEnt anD WElfarE
The ongoing economic recovery fostered some improvements on the employment side, as evidenced by several indicators. Open unemployment stood at 5.5% in August 2017, down slightly from 5.6% in August 2016 (Chart 2.18). At the same time, the labor force participation rate also increased, rising to 66.7% in 2017 from 66.3% in 2016. Stronger employment dynamics were also reflected in the Job Vacancy Online indicator, which posted moderate gains in growth of both job vacancies and job offers posted each month (Chart 2.19).9
By sector, labor absorption improved most notably in the non-tradeable sector (Chart 2.20), particularly in the trade subsector, and in accommodation, food, and beverages, in line with tourism industry development and the surge in export activity. Medium- and low-skilled workers enjoyed the most significant gains in terms of labor absorption, with unemployment falling among those with primary or secondary education. Unusually, new jobs in the traditional absorbers of labor – agriculture, forestry, and fisheries, as well as mining and quarrying – fell.
9 The Job Vacancy Online Indicator was developed by Bank Indonesia using big
data analysis.
Against a backdrop of improving employment indicators, several trends garnered attention in 2017. The creation of new jobs was unable to keep pace with the fast-growing workforce and the layoffs made at some companies, leading to only limited declines in unemployment. Urban workers were increasingly absorbed into technology-based employment, in line with the rapid expansion of the digital economy, but this also requires lower staffing levels than traditional manufacturing or agriculture. There was also a general mismatch between the expertise required and that available, which contributed to an increase in urban unemployment in 2017.
The economic recovery also lifted welfare. The poverty rate edged down to 10.1% in 2017, from 10.7% in 2016 (Chart 2.21). This can be attributed to low and
8.0
7.5
7.0
6.5
6.0
5.5
5.0
4.5
4.0
3.5
3.02014 2015 2016 2017
Grafik 2.18
Source: BPS-Statistics Indonesia, calculated
Percent
Open Unemployment RateOpen Unemployment Rate - Urban Open Unemployment Rate - Rural
Note: Data as of August on each period
Chart 2.18. Open Unemployment Rate
0
10
20
30
40
50
60
70
80
-60
-40
-20
0
20
40
60
80
100
2011 2012 2013 2014 2015 2016 2017
Grafik 2.19
Average Job Vacancy per month (rhs)
Source: Bank Indonesia
Job Vacancy Growth
ThousandPercent, yoy
Chart 2.19. Online Job Vacancy Indicator
Grafik 2.20
Percent, CMAPercent, CMA
Source: BPS-Statistics Indonesia, calculated
-4
-2
0
2
4
6
8
10
12
14
-2
-1
0
1
2
3
4
5
6
7
Tradable EmploymentInformal Employment (rhs)
Nontradable EmploymentFormal Employment (rhs)
2007 2008 2009 2010 2011 2012 2013 2014 2015 2016 2017
Chart 2.20. Employment Sectors and Types
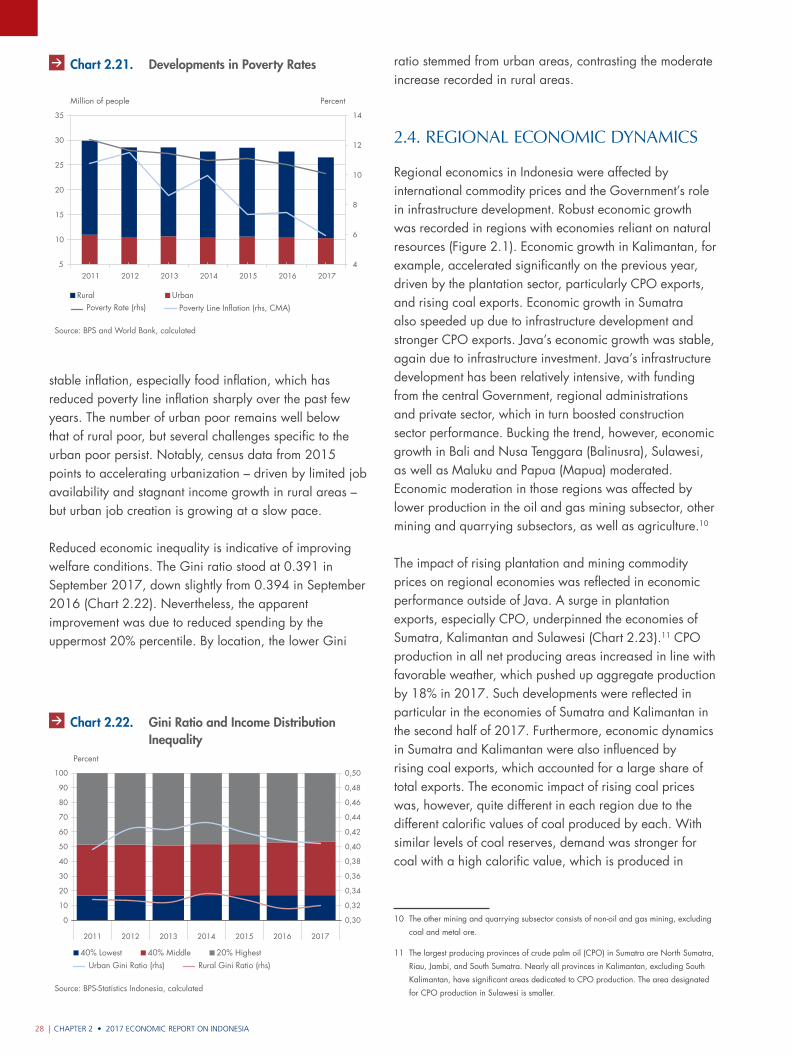
CHAPTER 2 • 2017 ECONOMIC REPORT ON INDONESIA28 |
stable inflation, especially food inflation, which has reduced poverty line inflation sharply over the past few years. The number of urban poor remains well below that of rural poor, but several challenges specific to the urban poor persist. Notably, census data from 2015 points to accelerating urbanization – driven by limited job availability and stagnant income growth in rural areas – but urban job creation is growing at a slow pace.
Reduced economic inequality is indicative of improving welfare conditions. The Gini ratio stood at 0.391 in September 2017, down slightly from 0.394 in September 2016 (Chart 2.22). Nevertheless, the apparent improvement was due to reduced spending by the uppermost 20% percentile. By location, the lower Gini
ratio stemmed from urban areas, contrasting the moderate increase recorded in rural areas.
2.4. rEGional Economic DynamicS
Regional economics in Indonesia were affected by international commodity prices and the Government’s role in infrastructure development. Robust economic growth was recorded in regions with economies reliant on natural resources (Figure 2.1). Economic growth in Kalimantan, for example, accelerated significantly on the previous year, driven by the plantation sector, particularly CPO exports, and rising coal exports. Economic growth in Sumatra also speeded up due to infrastructure development and stronger CPO exports. Java’s economic growth was stable, again due to infrastructure investment. Java’s infrastructure development has been relatively intensive, with funding from the central Government, regional administrations and private sector, which in turn boosted construction sector performance. Bucking the trend, however, economic growth in Bali and Nusa Tenggara (Balinusra), Sulawesi, as well as Maluku and Papua (Mapua) moderated. Economic moderation in those regions was affected by lower production in the oil and gas mining subsector, other mining and quarrying subsectors, as well as agriculture.10
The impact of rising plantation and mining commodity prices on regional economies was reflected in economic performance outside of Java. A surge in plantation exports, especially CPO, underpinned the economies of Sumatra, Kalimantan and Sulawesi (Chart 2.23).11 CPO production in all net producing areas increased in line with favorable weather, which pushed up aggregate production by 18% in 2017. Such developments were reflected in particular in the economies of Sumatra and Kalimantan in the second half of 2017. Furthermore, economic dynamics in Sumatra and Kalimantan were also influenced by rising coal exports, which accounted for a large share of total exports. The economic impact of rising coal prices was, however, quite different in each region due to the different calorific values of coal produced by each. With similar levels of coal reserves, demand was stronger for coal with a high calorific value, which is produced in
10 The other mining and quarrying subsector consists of non-oil and gas mining, excluding
coal and metal ore.
11 The largest producing provinces of crude palm oil (CPO) in Sumatra are North Sumatra,
Riau, Jambi, and South Sumatra. Nearly all provinces in Kalimantan, excluding South
Kalimantan, have significant areas dedicated to CPO production. The area designated
for CPO production in Sulawesi is smaller.
20132011 2012 2014 2015 2016 2017
Source: BPS-Statistics Indonesia, calculated
Grafik 2.22
0
20
40
60
80
10
30
50
70
100
90
Percent
40% Lowest 40% Middle 20% HighestUrban Gini Ratio (rhs) Rural Gini Ratio (rhs)
0,30
0,38
0,36
0,34
0,32
0,40
0,42
0,44
0,46
0,48
0,50
Chart 2.22. Gini Ratio and Income Distribution Inequality
Grafik 2.21
Source: BPS and World Bank, calculated
4
6
8
10
12
14
5
10
15
20
25
30
35
2011 2012 2013 2014 2015 2016 2017
Million of people Percent
Poverty Rate (rhs)Rural
Poverty Line Inflation (rhs, CMA)Urban
Chart 2.21. Developments in Poverty Rates
2017 ECONOMIC REPORT ON INDONESIA • CHAPTER 2 | 29
Central Kalimantan and East Kalimantan.12 Consequently, demand-side dynamics provided a windfall for these two regions, with Central Kalimantan posting the fastest growth in Kalimantan at 6.74%. Rising commodity prices also contributed to economic growth in East Kalimantan, where positive growth returned following a two-year contraction.
Rising commodity prices also benefitted other areas reliant on mining, including Sulawesi, Balinusra and Mapua. Increasing mineral exports were observed from all three regions in the second half of the 2017, after a policy to relax export restrictions was implemented at the
12 Coal with a lower calorific value is produced in South Sumatra, Jambi, East Kalimantan
and South Kalimantan.
beginning of 2017 (Chart 2.24). Those restrictions have been relaxed for the next five years for license holders in the mining industry that have begun to develop smelters. This has prompted investment in nickel smelters in Central Sulawesi and North Maluku. Conversely, mining exports from Papua and Balinusra began to moderate in the latter half of the year after disruptions slowed copper ore production in Papua and West Nusa Tenggara. Labor issues and adjustments to licensing regulations stifled further production and export gains. In West Nusa Tenggara, however, improvements to copper ore production were limited by an ongoing consolidation process following several corporate mergers within the sector.
Source: BPS-Statistics Indonesia, calculated
2015 2016 2017
5.48 5.60Java
2015
3.53
2016
4.29
2017
4.30
Sumatra
2015
1.38
2016
2.02
2017
4.33
Kalimantan
2015
8.19
2016
7.43
2017
6.99
6.28 7.404.89
Sulawesi
2015 2016 2017
Mapua
5.61
5.0% ≤ RGDP < 6.0% 4.0 ≤ RGDP < 5.0% 0% ≤ RGDP < 4.0% RGDP ≥ 7.0% 6.0 ≤ RGDP < 7.0%
ACEH4.19
NORTHSUMATRA
5.12
WESTSUMATRA
5.29
RIAU2.71
JAMBI4.64
SOUTHSUMATRA
5.51
LAMPUNG5.17
WEST JAVA5.29
CENTRAL JAVA5.27
EAST JAVA5.45
PAPUA4.64
WEST PAPUA4.01
2015 2016 2017
10.42
5.923.73
Bali-Nusra
BENGKULU4.99
RIAUISLANDS
2.01BABEL
ISLANDS4.51
BANTEN5.71
DIY5.26
BALI5.59
WESTNUSA TENGGARA
0.11
EASTNUSA TENGGARA
5.16
MALUKU5.81
SOUTH EASTSULAWESI
6.81
NORTHMALUKU
7.67
SOUTHSULAWESI
7.23
WESTSULAWESI
6.67
SOUTHKALIMANTAN
5.29
EASTKALIMANTAN
3.13
NORTHKALIMANTAN
6.59
CENTRALKALIMANTAN
6.74
WESTKALIMANTAN
5.17
CENTRALSULAWESI
7.14
GORONTALO6.74
NORTHSULAWESI
6.32
JAKARTA6.22
Gambar 2.1. / Gra�k 2.4.1 Pertumbuhan Ekonomi Wilayah Tahun 2017Figure 2.1. Regional Economic Growth in 2017
Source: BPS-Statistics Indonesia, calculated
Grafik 2.23
Q I 2017 Q II 2017 Q III 2017 Q IV 2017
-20
-10
0
10
20
30
50
40
Percent, yoy
Sumatra Java Kalimantan Balinusra Sulawesi Mapua
Chart 2.23. Export Growth by Region
1 2 3 42016
5 9 10 11 126 7 8 1 2 3 42017
5 9 10 11 126 7 8
Source: Bank Indonesia
Grafik 2.24
-40
0
-20
20
40
60
100
80
Percent, yoy Percent, yoy
-200
0
-50
-100
-150
50
100
150
200
250
300
CPO-SumatraCopper Ore-Mapua (rhs)
Coal-KalimantanIron/Steel-Balinusra (rhs)
Chart 2.24. Growth in Value of Major Commodity Exports by Region
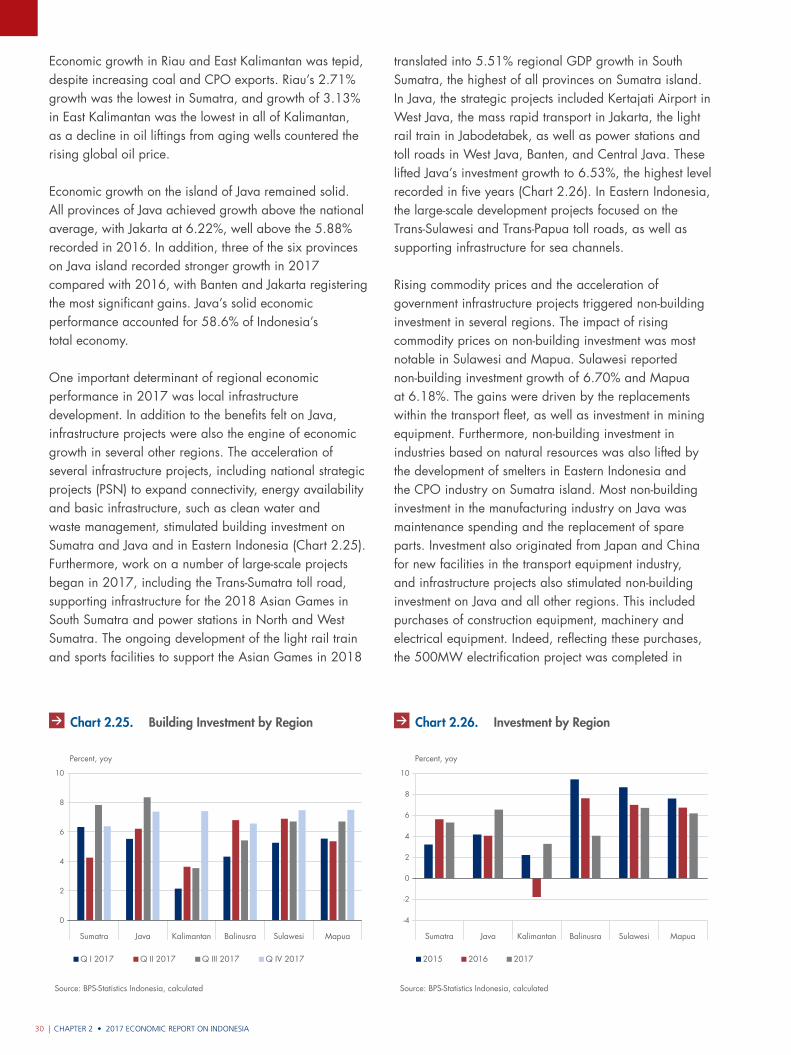
CHAPTER 2 • 2017 ECONOMIC REPORT ON INDONESIA30 |
Economic growth in Riau and East Kalimantan was tepid, despite increasing coal and CPO exports. Riau’s 2.71% growth was the lowest in Sumatra, and growth of 3.13% in East Kalimantan was the lowest in all of Kalimantan, as a decline in oil liftings from aging wells countered the rising global oil price.
Economic growth on the island of Java remained solid. All provinces of Java achieved growth above the national average, with Jakarta at 6.22%, well above the 5.88% recorded in 2016. In addition, three of the six provinces on Java island recorded stronger growth in 2017 compared with 2016, with Banten and Jakarta registering the most significant gains. Java’s solid economic performance accounted for 58.6% of Indonesia’s total economy.
One important determinant of regional economic performance in 2017 was local infrastructure development. In addition to the benefits felt on Java, infrastructure projects were also the engine of economic growth in several other regions. The acceleration of several infrastructure projects, including national strategic projects (PSN) to expand connectivity, energy availability and basic infrastructure, such as clean water and waste management, stimulated building investment on Sumatra and Java and in Eastern Indonesia (Chart 2.25). Furthermore, work on a number of large-scale projects began in 2017, including the Trans-Sumatra toll road, supporting infrastructure for the 2018 Asian Games in South Sumatra and power stations in North and West Sumatra. The ongoing development of the light rail train and sports facilities to support the Asian Games in 2018
translated into 5.51% regional GDP growth in South Sumatra, the highest of all provinces on Sumatra island. In Java, the strategic projects included Kertajati Airport in West Java, the mass rapid transport in Jakarta, the light rail train in Jabodetabek, as well as power stations and toll roads in West Java, Banten, and Central Java. These lifted Java’s investment growth to 6.53%, the highest level recorded in five years (Chart 2.26). In Eastern Indonesia, the large-scale development projects focused on the Trans-Sulawesi and Trans-Papua toll roads, as well as supporting infrastructure for sea channels.
Rising commodity prices and the acceleration of government infrastructure projects triggered non-building investment in several regions. The impact of rising commodity prices on non-building investment was most notable in Sulawesi and Mapua. Sulawesi reported non-building investment growth of 6.70% and Mapua at 6.18%. The gains were driven by the replacements within the transport fleet, as well as investment in mining equipment. Furthermore, non-building investment in industries based on natural resources was also lifted by the development of smelters in Eastern Indonesia and the CPO industry on Sumatra island. Most non-building investment in the manufacturing industry on Java was maintenance spending and the replacement of spare parts. Investment also originated from Japan and China for new facilities in the transport equipment industry, and infrastructure projects also stimulated non-building investment on Java and all other regions. This included purchases of construction equipment, machinery and electrical equipment. Indeed, reflecting these purchases, the 500MW electrification project was completed in
Sumatra Java Kalimantan Balinusra Sulawesi Mapua
Source: BPS-Statistics Indonesia, calculated
Grafik 2.26
0
2
4
6
10
8
Percent, yoy
Q I 2017 Q II 2017 Q III 2017 Q IV 2017
Chart 2.25. Building Investment by Region
Source: BPS-Statistics Indonesia, calculated
Grafik 2.25
2015 2016 2017
-4
-2
0
2
4
6
10
8
Percent, yoy
Sumatra Java Kalimantan Balinusra Sulawesi Mapua
Chart 2.26. Investment by Region
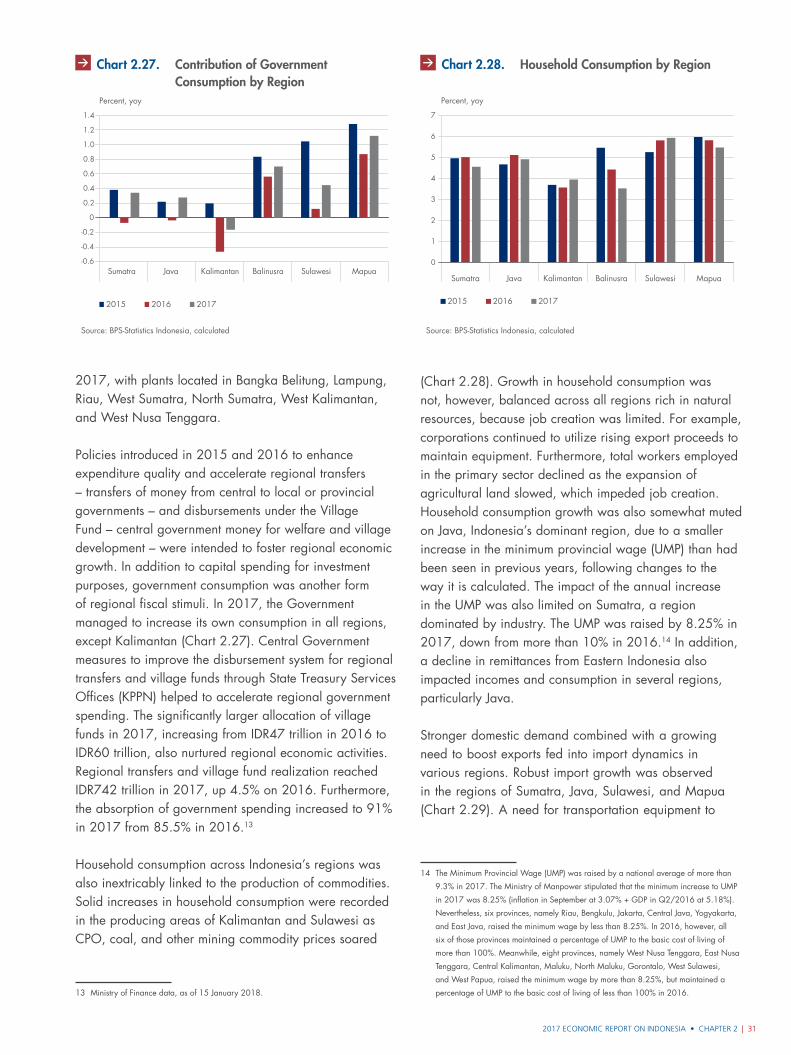
2017 ECONOMIC REPORT ON INDONESIA • CHAPTER 2 | 31
2017, with plants located in Bangka Belitung, Lampung, Riau, West Sumatra, North Sumatra, West Kalimantan, and West Nusa Tenggara.
Policies introduced in 2015 and 2016 to enhance expenditure quality and accelerate regional transfers – transfers of money from central to local or provincial governments – and disbursements under the Village Fund – central government money for welfare and village development – were intended to foster regional economic growth. In addition to capital spending for investment purposes, government consumption was another form of regional fiscal stimuli. In 2017, the Government managed to increase its own consumption in all regions, except Kalimantan (Chart 2.27). Central Government measures to improve the disbursement system for regional transfers and village funds through State Treasury Services Offices (KPPN) helped to accelerate regional government spending. The significantly larger allocation of village funds in 2017, increasing from IDR47 trillion in 2016 to IDR60 trillion, also nurtured regional economic activities. Regional transfers and village fund realization reached IDR742 trillion in 2017, up 4.5% on 2016. Furthermore, the absorption of government spending increased to 91% in 2017 from 85.5% in 2016.13
Household consumption across Indonesia’s regions was also inextricably linked to the production of commodities. Solid increases in household consumption were recorded in the producing areas of Kalimantan and Sulawesi as CPO, coal, and other mining commodity prices soared
13 Ministry of Finance data, as of 15 January 2018.
(Chart 2.28). Growth in household consumption was not, however, balanced across all regions rich in natural resources, because job creation was limited. For example, corporations continued to utilize rising export proceeds to maintain equipment. Furthermore, total workers employed in the primary sector declined as the expansion of agricultural land slowed, which impeded job creation. Household consumption growth was also somewhat muted on Java, Indonesia’s dominant region, due to a smaller increase in the minimum provincial wage (UMP) than had been seen in previous years, following changes to the way it is calculated. The impact of the annual increase in the UMP was also limited on Sumatra, a region dominated by industry. The UMP was raised by 8.25% in 2017, down from more than 10% in 2016.14 In addition, a decline in remittances from Eastern Indonesia also impacted incomes and consumption in several regions, particularly Java.
Stronger domestic demand combined with a growing need to boost exports fed into import dynamics in various regions. Robust import growth was observed in the regions of Sumatra, Java, Sulawesi, and Mapua (Chart 2.29). A need for transportation equipment to
14 The Minimum Provincial Wage (UMP) was raised by a national average of more than
9.3% in 2017. The Ministry of Manpower stipulated that the minimum increase to UMP
in 2017 was 8.25% (inflation in September at 3.07% + GDP in Q2/2016 at 5.18%).
Nevertheless, six provinces, namely Riau, Bengkulu, Jakarta, Central Java, Yogyakarta,
and East Java, raised the minimum wage by less than 8.25%. In 2016, however, all
six of those provinces maintained a percentage of UMP to the basic cost of living of
more than 100%. Meanwhile, eight provinces, namely West Nusa Tenggara, East Nusa
Tenggara, Central Kalimantan, Maluku, North Maluku, Gorontalo, West Sulawesi,
and West Papua, raised the minimum wage by more than 8.25%, but maintained a
percentage of UMP to the basic cost of living of less than 100% in 2016.
Grafik 2.29
Source: BPS-Statistics Indonesia, calculated
2015 2016 2017
Percent, yoy
Sumatra Java Kalimantan Balinusra Sulawesi Mapua-0.6
-0.4
-0.2
0
0.2
0.4
0.6
0.8
1.0
1.2
1.4
Chart 2.27. Contribution of Government Consumption by Region
Sumatra Java Kalimantan Balinusra Sulawesi Mapua
Source: BPS-Statistics Indonesia, calculated
Grafik 2.28
2015 2016 2017
0
2
4
6
1
3
5
7
Percent, yoy
Chart 2.28. Household Consumption by Region
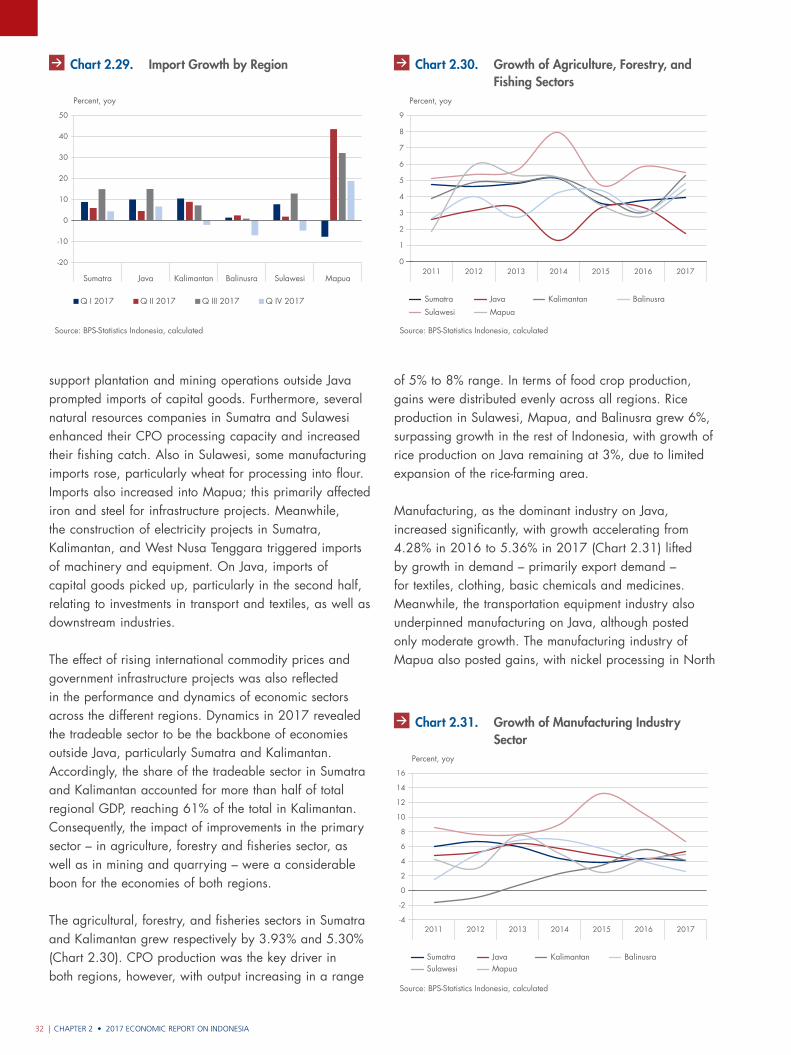
CHAPTER 2 • 2017 ECONOMIC REPORT ON INDONESIA32 |
support plantation and mining operations outside Java prompted imports of capital goods. Furthermore, several natural resources companies in Sumatra and Sulawesi enhanced their CPO processing capacity and increased their fishing catch. Also in Sulawesi, some manufacturing imports rose, particularly wheat for processing into flour. Imports also increased into Mapua; this primarily affected iron and steel for infrastructure projects. Meanwhile, the construction of electricity projects in Sumatra, Kalimantan, and West Nusa Tenggara triggered imports of machinery and equipment. On Java, imports of capital goods picked up, particularly in the second half, relating to investments in transport and textiles, as well as downstream industries.
The effect of rising international commodity prices and government infrastructure projects was also reflected in the performance and dynamics of economic sectors across the different regions. Dynamics in 2017 revealed the tradeable sector to be the backbone of economies outside Java, particularly Sumatra and Kalimantan. Accordingly, the share of the tradeable sector in Sumatra and Kalimantan accounted for more than half of total regional GDP, reaching 61% of the total in Kalimantan. Consequently, the impact of improvements in the primary sector – in agriculture, forestry and fisheries sector, as well as in mining and quarrying – were a considerable boon for the economies of both regions.
The agricultural, forestry, and fisheries sectors in Sumatra and Kalimantan grew respectively by 3.93% and 5.30% (Chart 2.30). CPO production was the key driver in both regions, however, with output increasing in a range
of 5% to 8% range. In terms of food crop production, gains were distributed evenly across all regions. Rice production in Sulawesi, Mapua, and Balinusra grew 6%, surpassing growth in the rest of Indonesia, with growth of rice production on Java remaining at 3%, due to limited expansion of the rice-farming area.
Manufacturing, as the dominant industry on Java, increased significantly, with growth accelerating from 4.28% in 2016 to 5.36% in 2017 (Chart 2.31) lifted by growth in demand – primarily export demand – for textiles, clothing, basic chemicals and medicines. Meanwhile, the transportation equipment industry also underpinned manufacturing on Java, although posted only moderate growth. The manufacturing industry of Mapua also posted gains, with nickel processing in North
2011 2012 2013 2014 2015 2016 2017
Percent, yoy
Grafik 2.30
1
0
2
3
4
5
6
7
8
9
Sumatra Java
Sulawesi Mapua
Kalimantan Balinusra
Source: BPS-Statistics Indonesia, calculated
Chart 2.30. Growth of Agriculture, Forestry, and Fishing Sectors
2011 2012 2013 2014 2015 2016 2017
Percent, yoy
Grafik 2.31
Sumatra JavaSulawesi Mapua
Kalimantan Balinusra
Source: BPS-Statistics Indonesia, calculated
-4
-2
0
2
4
6
8
10
12
14
16
Chart 2.31. Growth of Manufacturing Industry Sector
Source: BPS-Statistics Indonesia, calculated
Grafik 2.27
-20
-10
0
10
20
30
50
40
Percent, yoy
Sumatra Java Kalimantan Balinusra Sulawesi Mapua
Q I 2017 Q II 2017 Q III 2017 Q IV 2017
Chart 2.29. Import Growth by Region
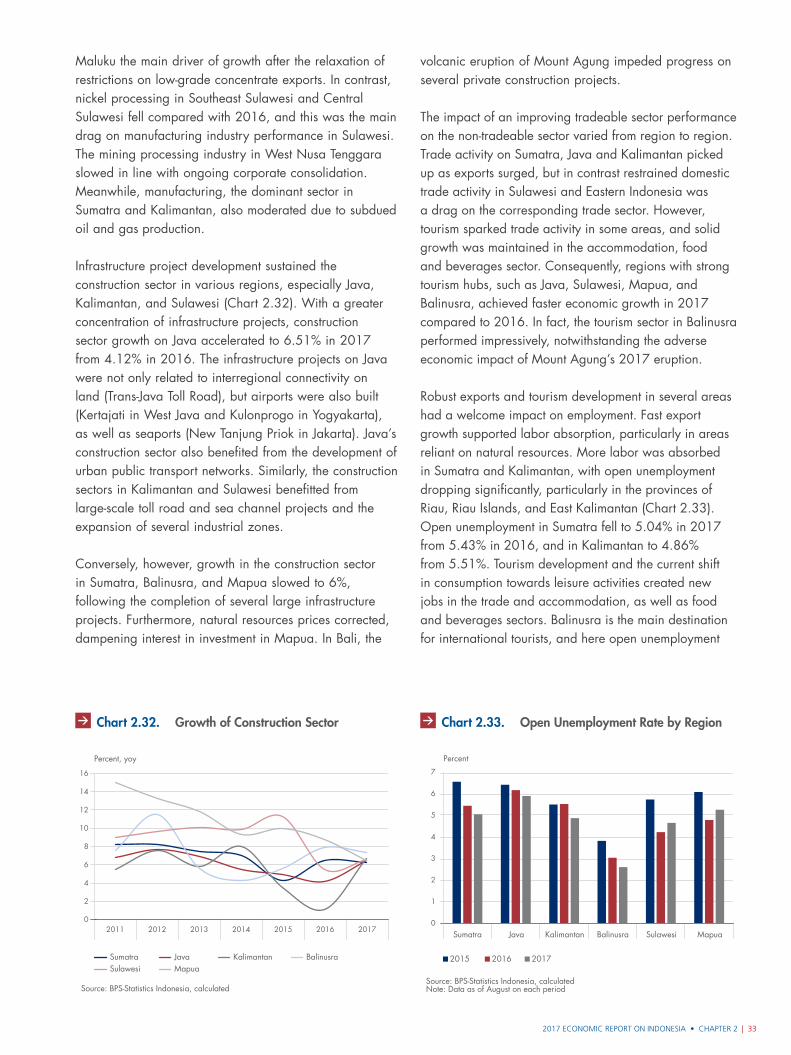
2017 ECONOMIC REPORT ON INDONESIA • CHAPTER 2 | 33
Maluku the main driver of growth after the relaxation of restrictions on low-grade concentrate exports. In contrast, nickel processing in Southeast Sulawesi and Central Sulawesi fell compared with 2016, and this was the main drag on manufacturing industry performance in Sulawesi. The mining processing industry in West Nusa Tenggara slowed in line with ongoing corporate consolidation. Meanwhile, manufacturing, the dominant sector in Sumatra and Kalimantan, also moderated due to subdued oil and gas production.
Infrastructure project development sustained the construction sector in various regions, especially Java, Kalimantan, and Sulawesi (Chart 2.32). With a greater concentration of infrastructure projects, construction sector growth on Java accelerated to 6.51% in 2017 from 4.12% in 2016. The infrastructure projects on Java were not only related to interregional connectivity on land (Trans-Java Toll Road), but airports were also built (Kertajati in West Java and Kulonprogo in Yogyakarta), as well as seaports (New Tanjung Priok in Jakarta). Java’s construction sector also benefited from the development of urban public transport networks. Similarly, the construction sectors in Kalimantan and Sulawesi benefitted from large-scale toll road and sea channel projects and the expansion of several industrial zones.
Conversely, however, growth in the construction sector in Sumatra, Balinusra, and Mapua slowed to 6%, following the completion of several large infrastructure projects. Furthermore, natural resources prices corrected, dampening interest in investment in Mapua. In Bali, the
volcanic eruption of Mount Agung impeded progress on several private construction projects.
The impact of an improving tradeable sector performance on the non-tradeable sector varied from region to region. Trade activity on Sumatra, Java and Kalimantan picked up as exports surged, but in contrast restrained domestic trade activity in Sulawesi and Eastern Indonesia was a drag on the corresponding trade sector. However, tourism sparked trade activity in some areas, and solid growth was maintained in the accommodation, food and beverages sector. Consequently, regions with strong tourism hubs, such as Java, Sulawesi, Mapua, and Balinusra, achieved faster economic growth in 2017 compared to 2016. In fact, the tourism sector in Balinusra performed impressively, notwithstanding the adverse economic impact of Mount Agung’s 2017 eruption.
Robust exports and tourism development in several areas had a welcome impact on employment. Fast export growth supported labor absorption, particularly in areas reliant on natural resources. More labor was absorbed in Sumatra and Kalimantan, with open unemployment dropping significantly, particularly in the provinces of Riau, Riau Islands, and East Kalimantan (Chart 2.33). Open unemployment in Sumatra fell to 5.04% in 2017 from 5.43% in 2016, and in Kalimantan to 4.86% from 5.51%. Tourism development and the current shift in consumption towards leisure activities created new jobs in the trade and accommodation, as well as food and beverages sectors. Balinusra is the main destination for international tourists, and here open unemployment
Percent, yoy
Grafik 2.33
SumatraSulawesi
JavaMapua
Kalimantan Balinusra
Source: BPS-Statistics Indonesia, calculated
2011 2012 2013 2014 2015 2016 20170
2
4
6
8
10
12
14
16
Chart 2.32. Growth of Construction Sector Grafik 2.34
2015 2016 2017
Percent
Source: BPS-Statistics Indonesia, calculatedNote: Data as of August on each period
0
1
2
3
4
5
6
7
Sumatra Java Kalimantan Balinusra Sulawesi Mapua
Chart 2.33. Open Unemployment Rate by Region
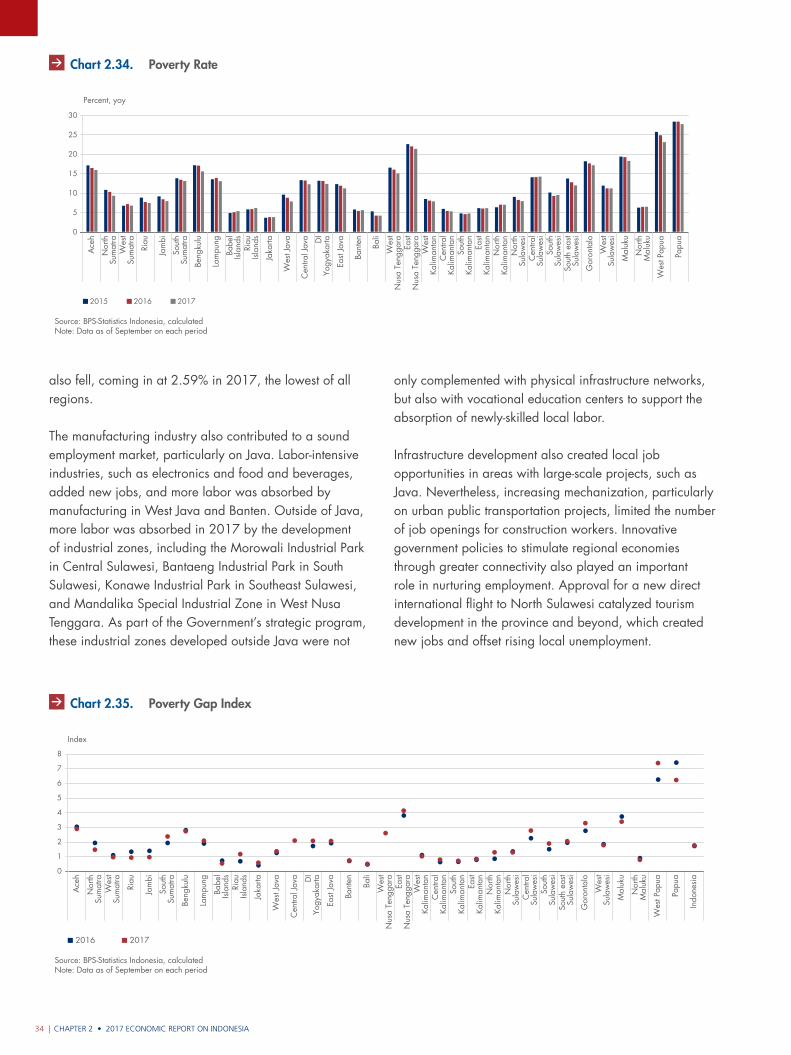
CHAPTER 2 • 2017 ECONOMIC REPORT ON INDONESIA34 |
also fell, coming in at 2.59% in 2017, the lowest of all regions.
The manufacturing industry also contributed to a sound employment market, particularly on Java. Labor-intensive industries, such as electronics and food and beverages, added new jobs, and more labor was absorbed by manufacturing in West Java and Banten. Outside of Java, more labor was absorbed in 2017 by the development of industrial zones, including the Morowali Industrial Park in Central Sulawesi, Bantaeng Industrial Park in South Sulawesi, Konawe Industrial Park in Southeast Sulawesi, and Mandalika Special Industrial Zone in West Nusa Tenggara. As part of the Government’s strategic program, these industrial zones developed outside Java were not
only complemented with physical infrastructure networks, but also with vocational education centers to support the absorption of newly-skilled local labor.
Infrastructure development also created local job opportunities in areas with large-scale projects, such as Java. Nevertheless, increasing mechanization, particularly on urban public transportation projects, limited the number of job openings for construction workers. Innovative government policies to stimulate regional economies through greater connectivity also played an important role in nurturing employment. Approval for a new direct international flight to North Sulawesi catalyzed tourism development in the province and beyond, which created new jobs and offset rising local unemployment.
Ace
h
Nor
thSu
mat
raW
est
Sum
atra
Riau
Jam
bi
Sout
hSu
mat
ra
Beng
kulu
Lam
pung
Babe
lIsl
ands
Riau
Islan
ds
Jaka
rta
Wes
t Jav
a
Cen
tral J
ava DI
Yogy
akar
ta
East
Java
Bant
en Bali
Wes
tN
usa
Teng
gara
East
Nus
a Te
ngga
raW
est
Kalim
anta
nC
entra
lKa
liman
tan
Sout
hKa
liman
tan
East
Kalim
anta
nN
orth
Kalim
anta
nN
orth
Sula
wes
iC
entra
lSu
law
esi
Sout
hSu
law
esi
Sout
h ea
stSu
law
esi
Gor
onta
lo
Wes
tSu
law
esi
Mal
uku
Nor
thM
aluk
u
Wes
t Pap
ua
Papu
a
Grafik 2.39
Source: BPS-Statistics Indonesia, calculated
0
5
10
15
20
25
30
Percent, yoy
2015 2016 2017
Note: Data as of September on each period
Chart 2.34. Poverty Rate
Grafik 2.40
Source: BPS-Statistics Indonesia, calculatedNote: Data as of September on each period
Ace
h
Nor
thSu
mat
raW
est
Sum
atra
Riau
Jam
bi
Sout
hSu
mat
ra
Beng
kulu
Lam
pung
Babe
lIsl
ands
Riau
Islan
ds
Jaka
rta
Wes
t Jav
a
Cen
tral J
ava DI
Yogy
akar
ta
East
Java
Bant
en Bali
Wes
tN
usa
Teng
gara
East
Nus
a Te
ngga
raW
est
Kalim
anta
nC
entra
lKa
liman
tan
Sout
hKa
liman
tan
East
Kalim
anta
nN
orth
Kalim
anta
nN
orth
Sula
wes
iC
entra
lSu
law
esi
Sout
hSu
law
esi
Sout
h ea
stSu
law
esi
Gor
onta
lo
Wes
tSu
law
esi
Mal
uku
Nor
thM
aluk
u
Wes
t Pap
ua
Papu
a
Indo
nesi
a
Index
2016 2017
0
1
2
3
4
5
6
7
8
Chart 2.35. Poverty Gap Index
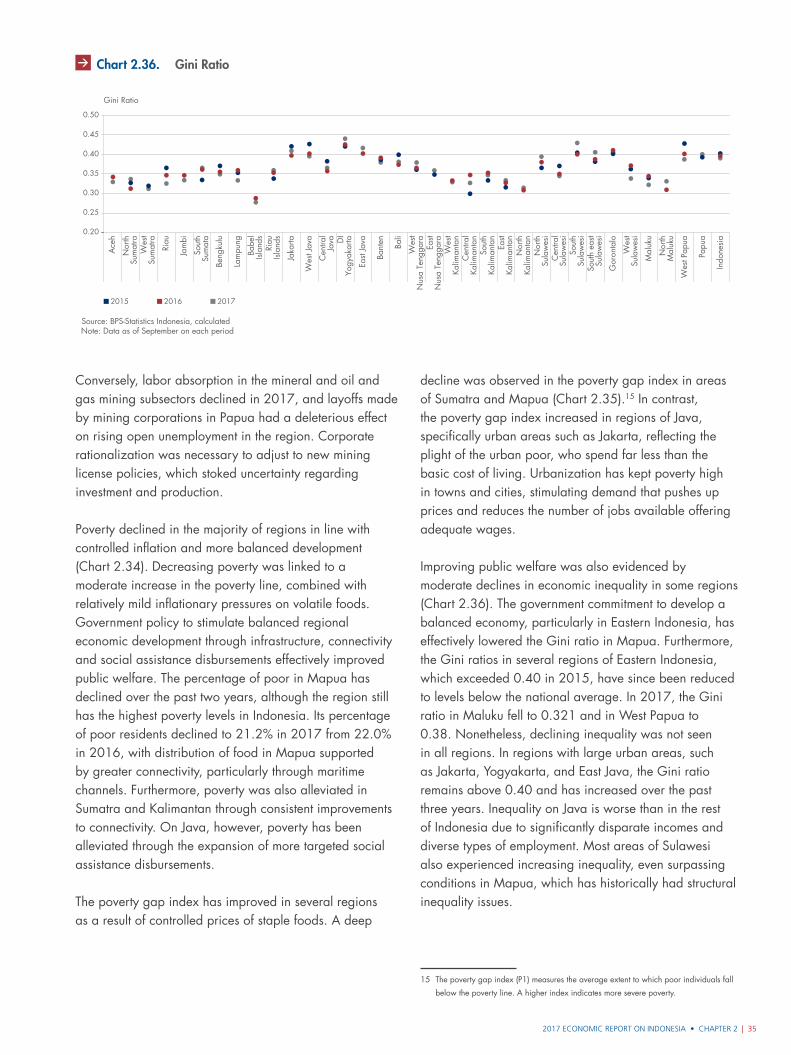
2017 ECONOMIC REPORT ON INDONESIA • CHAPTER 2 | 35
Conversely, labor absorption in the mineral and oil and gas mining subsectors declined in 2017, and layoffs made by mining corporations in Papua had a deleterious effect on rising open unemployment in the region. Corporate rationalization was necessary to adjust to new mining license policies, which stoked uncertainty regarding investment and production.
Poverty declined in the majority of regions in line with controlled inflation and more balanced development (Chart 2.34). Decreasing poverty was linked to a moderate increase in the poverty line, combined with relatively mild inflationary pressures on volatile foods. Government policy to stimulate balanced regional economic development through infrastructure, connectivity and social assistance disbursements effectively improved public welfare. The percentage of poor in Mapua has declined over the past two years, although the region still has the highest poverty levels in Indonesia. Its percentage of poor residents declined to 21.2% in 2017 from 22.0% in 2016, with distribution of food in Mapua supported by greater connectivity, particularly through maritime channels. Furthermore, poverty was also alleviated in Sumatra and Kalimantan through consistent improvements to connectivity. On Java, however, poverty has been alleviated through the expansion of more targeted social assistance disbursements.
The poverty gap index has improved in several regions as a result of controlled prices of staple foods. A deep
decline was observed in the poverty gap index in areas of Sumatra and Mapua (Chart 2.35).15 In contrast, the poverty gap index increased in regions of Java, specifically urban areas such as Jakarta, reflecting the plight of the urban poor, who spend far less than the basic cost of living. Urbanization has kept poverty high in towns and cities, stimulating demand that pushes up prices and reduces the number of jobs available offering adequate wages.
Improving public welfare was also evidenced by moderate declines in economic inequality in some regions (Chart 2.36). The government commitment to develop a balanced economy, particularly in Eastern Indonesia, has effectively lowered the Gini ratio in Mapua. Furthermore, the Gini ratios in several regions of Eastern Indonesia, which exceeded 0.40 in 2015, have since been reduced to levels below the national average. In 2017, the Gini ratio in Maluku fell to 0.321 and in West Papua to 0.38. Nonetheless, declining inequality was not seen in all regions. In regions with large urban areas, such as Jakarta, Yogyakarta, and East Java, the Gini ratio remains above 0.40 and has increased over the past three years. Inequality on Java is worse than in the rest of Indonesia due to significantly disparate incomes and diverse types of employment. Most areas of Sulawesi also experienced increasing inequality, even surpassing conditions in Mapua, which has historically had structural inequality issues.
15 The poverty gap index (P1) measures the average extent to which poor individuals fall
below the poverty line. A higher index indicates more severe poverty.
Grafik 2.41
Source: BPS-Statistics Indonesia, calculated
Ace
h
Nor
thSu
mat
raW
est
Sum
atra
Riau
Jam
bi
Sout
hSu
mat
a
Beng
kulu
Lam
pung
Babe
lIsl
ands
Riau
Islan
ds
Jaka
rta
Wes
t Jav
a
Cen
tral
Java D
IYo
gyak
arta
East
Java
Bant
en Bali
Wes
tN
usa
Teng
gara
East
Nus
a Te
ngga
raW
est
Kalim
anta
nC
entra
lKa
liman
tan
Sout
hKa
liman
tan
East
Kalim
anta
nN
orth
Kalim
anta
nN
orth
Sula
wes
iC
entra
lSu
law
esi
Sout
hSu
law
esi
Sout
h ea
stSu
law
esi
Gor
onta
lo
Wes
tSu
law
esi
Mal
uku
Nor
thM
aluk
u
Wes
t Pap
ua
Papu
a
Indo
nesi
a
Gini Ratio
2015 2016 2017
Note: Data as of September on each period
0.20
0.25
0.30
0.35
0.40
0.45
0.50
Chart 2.36. Gini Ratio
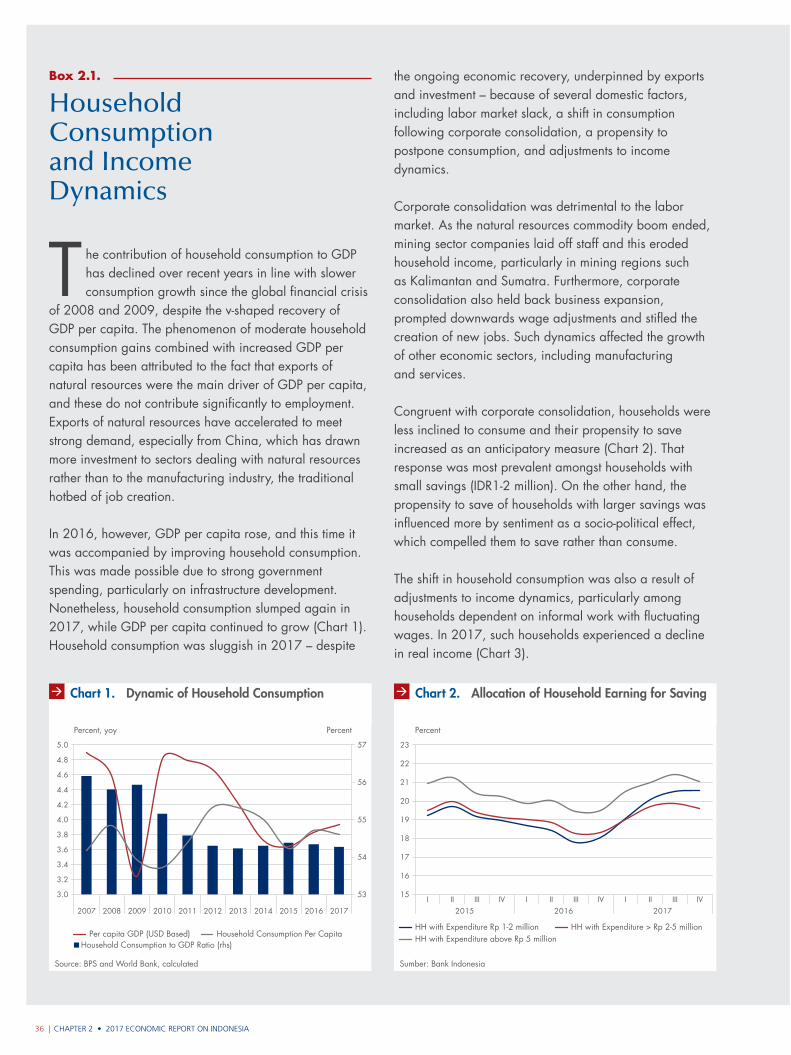
Box 2.1.
36 | CHAPTER 2 • 2017 ECONOMIC REPORT ON INDONESIA
The contribution of household consumption to GDP has declined over recent years in line with slower consumption growth since the global financial crisis
of 2008 and 2009, despite the v-shaped recovery of GDP per capita. The phenomenon of moderate household consumption gains combined with increased GDP per capita has been attributed to the fact that exports of natural resources were the main driver of GDP per capita, and these do not contribute significantly to employment. Exports of natural resources have accelerated to meet strong demand, especially from China, which has drawn more investment to sectors dealing with natural resources rather than to the manufacturing industry, the traditional hotbed of job creation.
In 2016, however, GDP per capita rose, and this time it was accompanied by improving household consumption. This was made possible due to strong government spending, particularly on infrastructure development. Nonetheless, household consumption slumped again in 2017, while GDP per capita continued to grow (Chart 1). Household consumption was sluggish in 2017 – despite
Household Consumption and Income Dynamics
2007 2008 2009 2010 2011 2012 2013 2014 2015 2016 2017
Source: BPS and World Bank, calculated
Grafik 1 Boks 2.1. Dinamika Konsumsi Rumah Tangga
3.0
3.4
3.8
4.2
4.6
3.2
3.6
4.0
4.4
5.0
4.8
Percent, yoy Percent
Household Consumption to GDP Ratio (rhs)Per capita GDP (USD Based) Household Consumption Per Capita
53
54
55
56
57
Chart 1. Dynamic of Household Consumption
2015 2016 2017I II III IV I II III IV I II III IV
Sumber: Bank Indonesia
Grafik 2 Boks 2.1. Alokasi Pendapatan Rumah Tangga
15
16
17
18
19
20
21
22
23
Percent
HH with Expenditure Rp 1-2 million HH with Expenditure > Rp 2-5 millionHH with Expenditure above Rp 5 million
Chart 2. Allocation of Household Earning for Saving
the ongoing economic recovery, underpinned by exports and investment – because of several domestic factors, including labor market slack, a shift in consumption following corporate consolidation, a propensity to postpone consumption, and adjustments to income dynamics.
Corporate consolidation was detrimental to the labor market. As the natural resources commodity boom ended, mining sector companies laid off staff and this eroded household income, particularly in mining regions such as Kalimantan and Sumatra. Furthermore, corporate consolidation also held back business expansion, prompted downwards wage adjustments and stifled the creation of new jobs. Such dynamics affected the growth of other economic sectors, including manufacturing and services.
Congruent with corporate consolidation, households were less inclined to consume and their propensity to save increased as an anticipatory measure (Chart 2). That response was most prevalent amongst households with small savings (IDR1-2 million). On the other hand, the propensity to save of households with larger savings was influenced more by sentiment as a socio-political effect, which compelled them to save rather than consume.
The shift in household consumption was also a result of adjustments to income dynamics, particularly among households dependent on informal work with fluctuating wages. In 2017, such households experienced a decline in real income (Chart 3).
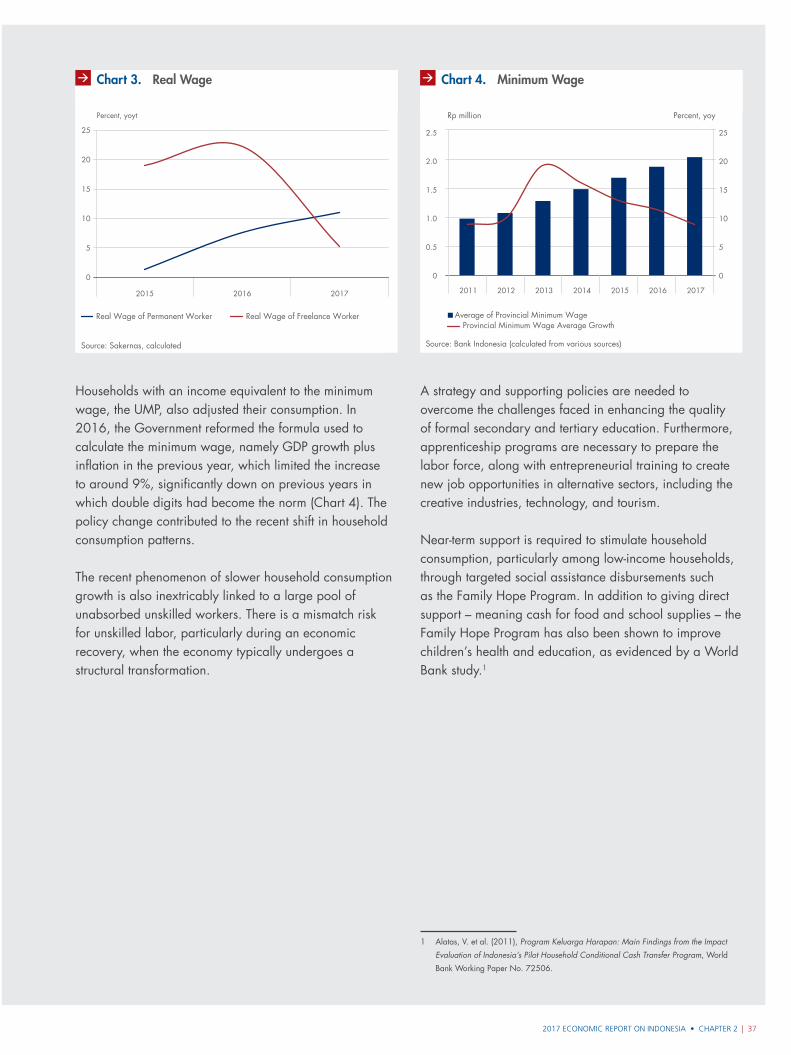
| 372017 ECONOMIC REPORT ON INDONESIA • CHAPTER 2
Source: Bank Indonesia (calculated from various sources)
Grafik 4 Boks 2.1.
Rp million Percent, yoy
Average of Provincial Minimum WageProvincial Minimum Wage Average Growth
0
5
10
15
20
25
0
0.5
1.0
1.5
2.0
2.5
2011 2012 2013 2014 2015 2016 2017
Chart 4. Minimum Wage
Households with an income equivalent to the minimum wage, the UMP, also adjusted their consumption. In 2016, the Government reformed the formula used to calculate the minimum wage, namely GDP growth plus inflation in the previous year, which limited the increase to around 9%, significantly down on previous years in which double digits had become the norm (Chart 4). The policy change contributed to the recent shift in household consumption patterns.
The recent phenomenon of slower household consumption growth is also inextricably linked to a large pool of unabsorbed unskilled workers. There is a mismatch risk for unskilled labor, particularly during an economic recovery, when the economy typically undergoes a structural transformation.
2015 2016 2017
Grafik 3 Boks 2.1. Tren Upah Riil
Source: Sakernas, calculated
0
5
10
15
20
25
Percent, yoyt
Real Wage of Permanent Worker Real Wage of Freelance Worker
Chart 3. Real Wage
A strategy and supporting policies are needed to overcome the challenges faced in enhancing the quality of formal secondary and tertiary education. Furthermore, apprenticeship programs are necessary to prepare the labor force, along with entrepreneurial training to create new job opportunities in alternative sectors, including the creative industries, technology, and tourism.
Near-term support is required to stimulate household consumption, particularly among low-income households, through targeted social assistance disbursements such as the Family Hope Program. In addition to giving direct support – meaning cash for food and school supplies – the Family Hope Program has also been shown to improve children’s health and education, as evidenced by a World Bank study.1
1 Alatas, V. et al. (2011), Program Keluarga Harapan: Main Findings from the Impact
Evaluation of Indonesia’s Pilot Household Conditional Cash Transfer Program, World
Bank Working Paper No. 72506.

| 392017 ECONOMIC REPORT ON INDONESIA
CHAPTER 3
The global economic recovery, coupled with growing optimism regarding Indonesia’s domestic economic outlook, underpinned positive balance of payments (BOP) performance in 2017, which in turn strengthened external sector resilience in Indonesia.
Indonesia’s Balance of Payments
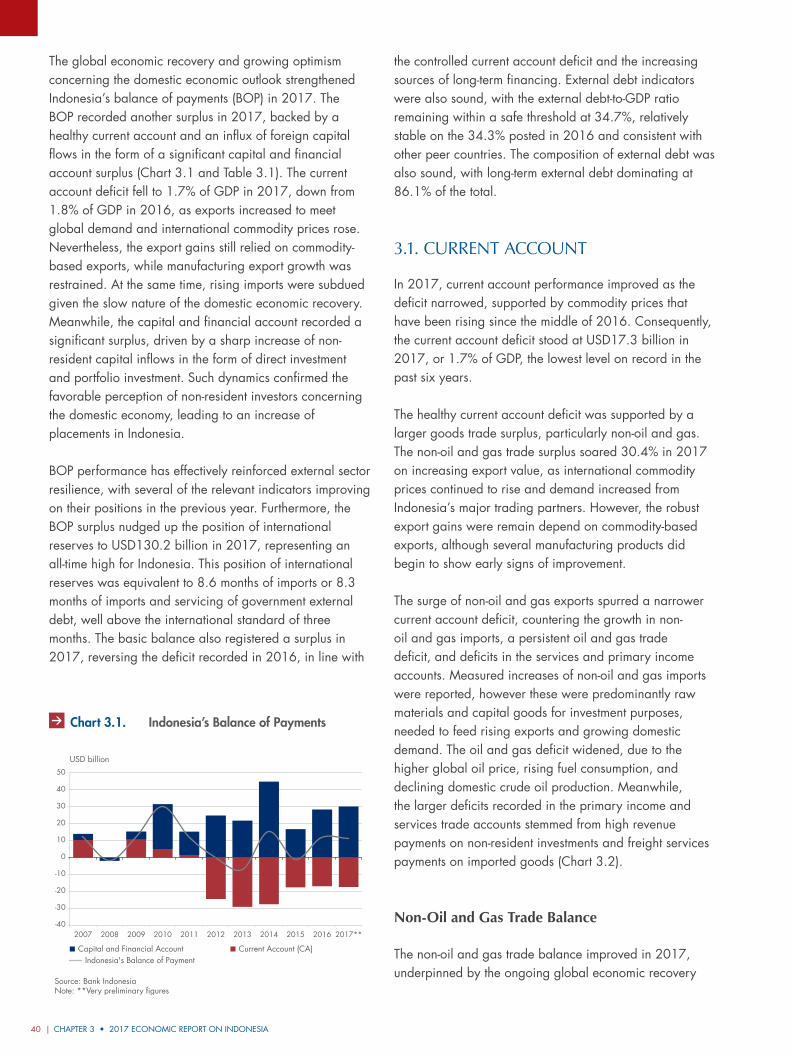
CHAPTER 3 • 2017 ECONOMIC REPORT ON INDONESIA40 |
The global economic recovery and growing optimism concerning the domestic economic outlook strengthened Indonesia’s balance of payments (BOP) in 2017. The BOP recorded another surplus in 2017, backed by a healthy current account and an influx of foreign capital flows in the form of a significant capital and financial account surplus (Chart 3.1 and Table 3.1). The current account deficit fell to 1.7% of GDP in 2017, down from 1.8% of GDP in 2016, as exports increased to meet global demand and international commodity prices rose. Nevertheless, the export gains still relied on commodity-based exports, while manufacturing export growth was restrained. At the same time, rising imports were subdued given the slow nature of the domestic economic recovery. Meanwhile, the capital and financial account recorded a significant surplus, driven by a sharp increase of non-resident capital inflows in the form of direct investment and portfolio investment. Such dynamics confirmed the favorable perception of non-resident investors concerning the domestic economy, leading to an increase of placements in Indonesia.
BOP performance has effectively reinforced external sector resilience, with several of the relevant indicators improving on their positions in the previous year. Furthermore, the BOP surplus nudged up the position of international reserves to USD130.2 billion in 2017, representing an all-time high for Indonesia. This position of international reserves was equivalent to 8.6 months of imports or 8.3 months of imports and servicing of government external debt, well above the international standard of three months. The basic balance also registered a surplus in 2017, reversing the deficit recorded in 2016, in line with
the controlled current account deficit and the increasing sources of long-term financing. External debt indicators were also sound, with the external debt-to-GDP ratio remaining within a safe threshold at 34.7%, relatively stable on the 34.3% posted in 2016 and consistent with other peer countries. The composition of external debt was also sound, with long-term external debt dominating at 86.1% of the total.
3.1. Current ACCount
In 2017, current account performance improved as the deficit narrowed, supported by commodity prices that have been rising since the middle of 2016. Consequently, the current account deficit stood at USD17.3 billion in 2017, or 1.7% of GDP, the lowest level on record in the past six years.
The healthy current account deficit was supported by a larger goods trade surplus, particularly non-oil and gas. The non-oil and gas trade surplus soared 30.4% in 2017 on increasing export value, as international commodity prices continued to rise and demand increased from Indonesia’s major trading partners. However, the robust export gains were remain depend on commodity-based exports, although several manufacturing products did begin to show early signs of improvement.
The surge of non-oil and gas exports spurred a narrower current account deficit, countering the growth in non-oil and gas imports, a persistent oil and gas trade deficit, and deficits in the services and primary income accounts. Measured increases of non-oil and gas imports were reported, however these were predominantly raw materials and capital goods for investment purposes, needed to feed rising exports and growing domestic demand. The oil and gas deficit widened, due to the higher global oil price, rising fuel consumption, and declining domestic crude oil production. Meanwhile, the larger deficits recorded in the primary income and services trade accounts stemmed from high revenue payments on non-resident investments and freight services payments on imported goods (Chart 3.2).
Non-Oil and Gas Trade Balance
The non-oil and gas trade balance improved in 2017, underpinned by the ongoing global economic recovery
Grafik 3.1.
Capital and Financial Account Current Account (CA)Indonesia's Balance of Payment
-40
-30
-20
-10
0
10
20
30
40
50
2007 2008 2009 2010 2011 2012 2013 2014 2015 2016 2017**
USD billion
Source: Bank IndonesiaNote: **Very preliminary figures
Chart 3.1. Indonesia’s Balance of Payments
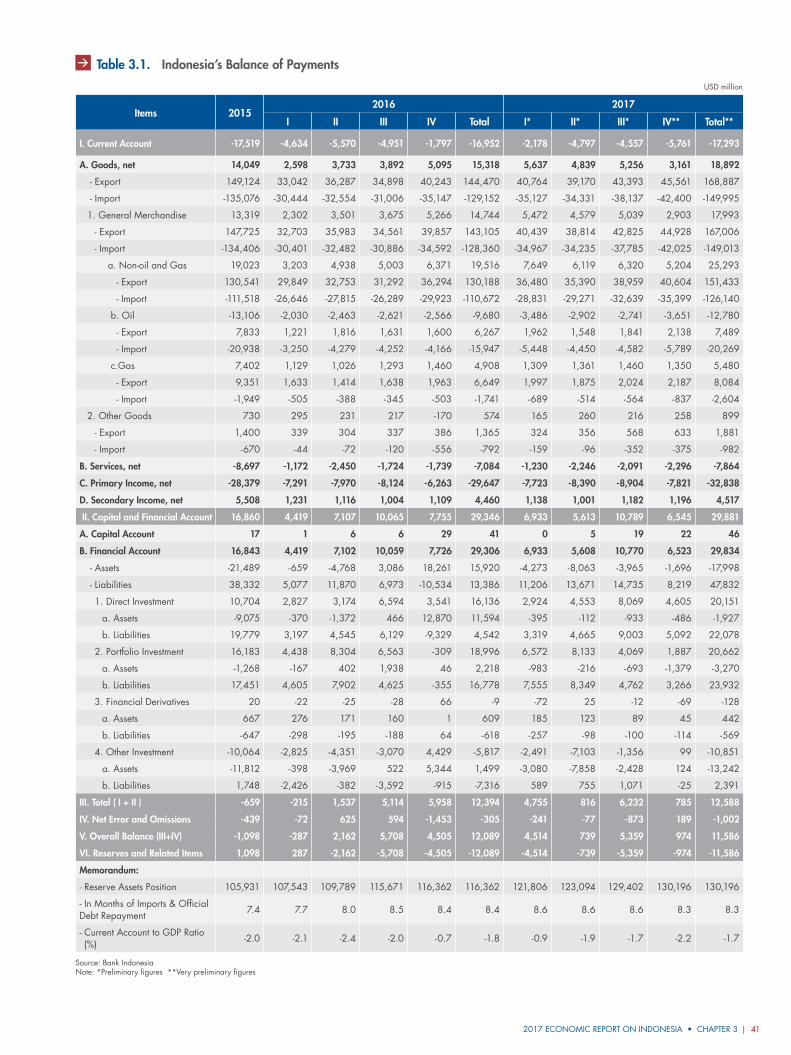
2017 ECONOMIC REPORT ON INDONESIA • CHAPTER 3 | 41
Table 3.1. Indonesia’s Balance of Payments
USD million
Items 20152016 2017
I II III IV Total I* II* III* IV** Total**
I. Current Account -17,519 -4,634 -5,570 -4,951 -1,797 -16,952 -2,178 -4,797 -4,557 -5,761 -17,293
A. Goods, net 14,049 2,598 3,733 3,892 5,095 15,318 5,637 4,839 5,256 3,161 18,892
- Export 149,124 33,042 36,287 34,898 40,243 144,470 40,764 39,170 43,393 45,561 168,887
- Import -135,076 -30,444 -32,554 -31,006 -35,147 -129,152 -35,127 -34,331 -38,137 -42,400 -149,995
1. General Merchandise 13,319 2,302 3,501 3,675 5,266 14,744 5,472 4,579 5,039 2,903 17,993
- Export 147,725 32,703 35,983 34,561 39,857 143,105 40,439 38,814 42,825 44,928 167,006
- Import -134,406 -30,401 -32,482 -30,886 -34,592 -128,360 -34,967 -34,235 -37,785 -42,025 -149,013
a. Non-oil and Gas 19,023 3,203 4,938 5,003 6,371 19,516 7,649 6,119 6,320 5,204 25,293
- Export 130,541 29,849 32,753 31,292 36,294 130,188 36,480 35,390 38,959 40,604 151,433
- Import -111,518 -26,646 -27,815 -26,289 -29,923 -110,672 -28,831 -29,271 -32,639 -35,399 -126,140
b. Oil -13,106 -2,030 -2,463 -2,621 -2,566 -9,680 -3,486 -2,902 -2,741 -3,651 -12,780
- Export 7,833 1,221 1,816 1,631 1,600 6,267 1,962 1,548 1,841 2,138 7,489
- Import -20,938 -3,250 -4,279 -4,252 -4,166 -15,947 -5,448 -4,450 -4,582 -5,789 -20,269
c.Gas 7,402 1,129 1,026 1,293 1,460 4,908 1,309 1,361 1,460 1,350 5,480
- Export 9,351 1,633 1,414 1,638 1,963 6,649 1,997 1,875 2,024 2,187 8,084
- Import -1,949 -505 -388 -345 -503 -1,741 -689 -514 -564 -837 -2,604
2. Other Goods 730 295 231 217 -170 574 165 260 216 258 899
- Export 1,400 339 304 337 386 1,365 324 356 568 633 1,881
- Import -670 -44 -72 -120 -556 -792 -159 -96 -352 -375 -982
B. Services, net -8,697 -1,172 -2,450 -1,724 -1,739 -7,084 -1,230 -2,246 -2,091 -2,296 -7,864
C. Primary Income, net -28,379 -7,291 -7,970 -8,124 -6,263 -29,647 -7,723 -8,390 -8,904 -7,821 -32,838
D. Secondary Income, net 5,508 1,231 1,116 1,004 1,109 4,460 1,138 1,001 1,182 1,196 4,517
II. Capital and Financial Account 16,860 4,419 7,107 10,065 7,755 29,346 6,933 5,613 10,789 6,545 29,881
A. Capital Account 17 1 6 6 29 41 0 5 19 22 46
B. Financial Account 16,843 4,419 7,102 10,059 7,726 29,306 6,933 5,608 10,770 6,523 29,834
- Assets -21,489 -659 -4,768 3,086 18,261 15,920 -4,273 -8,063 -3,965 -1,696 -17,998
- Liabilities 38,332 5,077 11,870 6,973 -10,534 13,386 11,206 13,671 14,735 8,219 47,832
1. Direct Investment 10,704 2,827 3,174 6,594 3,541 16,136 2,924 4,553 8,069 4,605 20,151
a. Assets -9,075 -370 -1,372 466 12,870 11,594 -395 -112 -933 -486 -1,927
b. Liabilities 19,779 3,197 4,545 6,129 -9,329 4,542 3,319 4,665 9,003 5,092 22,078
2. Portfolio Investment 16,183 4,438 8,304 6,563 -309 18,996 6,572 8,133 4,069 1,887 20,662
a. Assets -1,268 -167 402 1,938 46 2,218 -983 -216 -693 -1,379 -3,270
b. Liabilities 17,451 4,605 7,902 4,625 -355 16,778 7,555 8,349 4,762 3,266 23,932
3. Financial Derivatives 20 -22 -25 -28 66 -9 -72 25 -12 -69 -128
a. Assets 667 276 171 160 1 609 185 123 89 45 442
b. Liabilities -647 -298 -195 -188 64 -618 -257 -98 -100 -114 -569
4. Other Investment -10,064 -2,825 -4,351 -3,070 4,429 -5,817 -2,491 -7,103 -1,356 99 -10,851
a. Assets -11,812 -398 -3,969 522 5,344 1,499 -3,080 -7,858 -2,428 124 -13,242
b. Liabilities 1,748 -2,426 -382 -3,592 -915 -7,316 589 755 1,071 -25 2,391
III. Total ( I + II ) -659 -215 1,537 5,114 5,958 12,394 4,755 816 6,232 785 12,588
IV. Net Error and Omissions -439 -72 625 594 -1,453 -305 -241 -77 -873 189 -1,002
V. Overall Balance (III+IV) -1,098 -287 2,162 5,708 4,505 12,089 4,514 739 5,359 974 11,586
VI. Reserves and Related Items 1,098 287 -2,162 -5,708 -4,505 -12,089 -4,514 -739 -5,359 -974 -11,586
Memorandum:
- Reserve Assets Position 105,931 107,543 109,789 115,671 116,362 116,362 121,806 123,094 129,402 130,196 130,196
- In Months of Imports & Official Debt Repayment 7.4 7.7 8.0 8.5 8.4 8.4 8.6 8.6 8.6 8.3 8.3
- Current Account to GDP Ratio (%) -2.0 -2.1 -2.4 -2.0 -0.7 -1.8 -0.9 -1.9 -1.7 -2.2 -1.7
Source: Bank IndonesiaNote: *Preliminary figures **Very preliminary figures
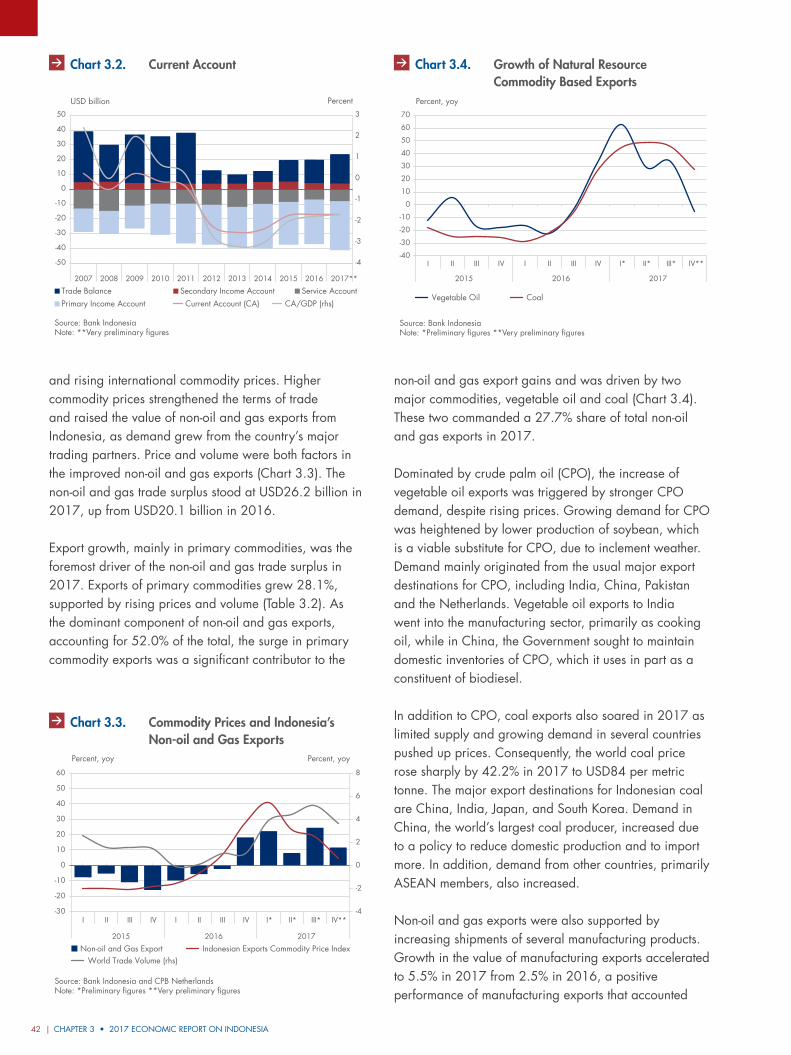
CHAPTER 3 • 2017 ECONOMIC REPORT ON INDONESIA42 |
and rising international commodity prices. Higher commodity prices strengthened the terms of trade and raised the value of non-oil and gas exports from Indonesia, as demand grew from the country’s major trading partners. Price and volume were both factors in the improved non-oil and gas exports (Chart 3.3). The non-oil and gas trade surplus stood at USD26.2 billion in 2017, up from USD20.1 billion in 2016.
Export growth, mainly in primary commodities, was the foremost driver of the non-oil and gas trade surplus in 2017. Exports of primary commodities grew 28.1%, supported by rising prices and volume (Table 3.2). As the dominant component of non-oil and gas exports, accounting for 52.0% of the total, the surge in primary commodity exports was a significant contributor to the
non-oil and gas export gains and was driven by two major commodities, vegetable oil and coal (Chart 3.4). These two commanded a 27.7% share of total non-oil and gas exports in 2017.
Dominated by crude palm oil (CPO), the increase of vegetable oil exports was triggered by stronger CPO demand, despite rising prices. Growing demand for CPO was heightened by lower production of soybean, which is a viable substitute for CPO, due to inclement weather. Demand mainly originated from the usual major export destinations for CPO, including India, China, Pakistan and the Netherlands. Vegetable oil exports to India went into the manufacturing sector, primarily as cooking oil, while in China, the Government sought to maintain domestic inventories of CPO, which it uses in part as a constituent of biodiesel.
In addition to CPO, coal exports also soared in 2017 as limited supply and growing demand in several countries pushed up prices. Consequently, the world coal price rose sharply by 42.2% in 2017 to USD84 per metric tonne. The major export destinations for Indonesian coal are China, India, Japan, and South Korea. Demand in China, the world’s largest coal producer, increased due to a policy to reduce domestic production and to import more. In addition, demand from other countries, primarily ASEAN members, also increased.
Non-oil and gas exports were also supported by increasing shipments of several manufacturing products. Growth in the value of manufacturing exports accelerated to 5.5% in 2017 from 2.5% in 2016, a positive performance of manufacturing exports that accounted
Grafik 3.2.
Source: Bank IndonesiaNote: **Very preliminary figures
USD billion Percent
-4
-3
-2
-1
0
1
2
3
-50
-40
-30
-20
-10
0
10
20
30
40
50
2007 2008 2009 2010 2011 2012 2013 2014 2015 2016 2017**
Service AccountPrimary Income Account Current Account (CA) CA/GDP (rhs)Trade Balance Secondary Income Account
Chart 3.2. Current Account
-4
-2
0
2
4
6
8
-30
-20
-10
0
10
20
30
40
50
60
I II III IV I II III IV I* II* III* IV**
2015 2016 2017
Percent, yoy Percent, yoy
Non-oil and Gas Export Indonesian Exports Commodity Price IndexWorld Trade Volume (rhs)
Grafik 3.3.
Source: Bank Indonesia and CPB NetherlandsNote: *Preliminary figures **Very preliminary figures
Chart 3.3. Commodity Prices and Indonesia’s Non-oil and Gas Exports
Grafik 3.4.
CoalVegetable Oil
Percent, yoy
Source: Bank IndonesiaNote: *Preliminary figures **Very preliminary figures
-40
-30
-20
-10
0
10
20
30
40
50
60
70
I II III IV I II III IV I* II* III* IV**
2015 2016 2017
Chart 3.4. Growth of Natural Resource Commodity Based Exports
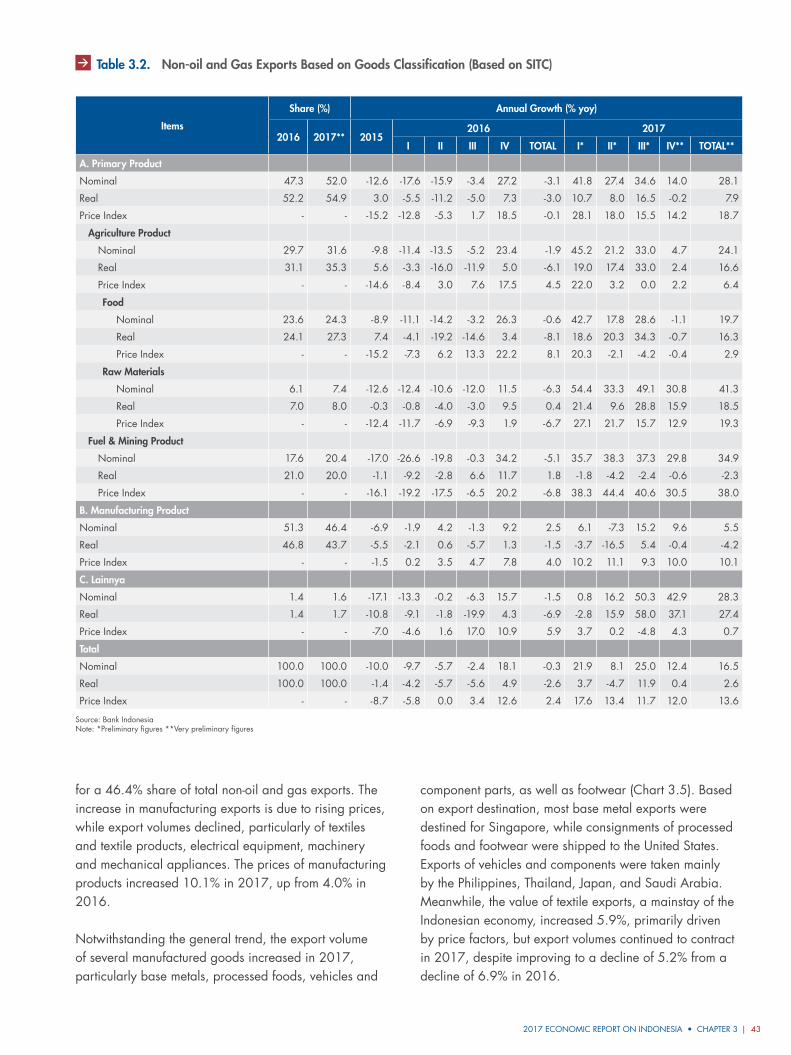
2017 ECONOMIC REPORT ON INDONESIA • CHAPTER 3 | 43
for a 46.4% share of total non-oil and gas exports. The increase in manufacturing exports is due to rising prices, while export volumes declined, particularly of textiles and textile products, electrical equipment, machinery and mechanical appliances. The prices of manufacturing products increased 10.1% in 2017, up from 4.0% in 2016.
Notwithstanding the general trend, the export volume of several manufactured goods increased in 2017, particularly base metals, processed foods, vehicles and
Table 3.2. Non-oil and Gas Exports Based on Goods Classification (Based on SITC)
Items
Share (%) Annual Growth (% yoy)
2016 2017** 20152016 2017
I II III IV TOTAL I* II* III* IV** TOTAL**
A. Primary Product
Nominal 47.3 52.0 -12.6 -17.6 -15.9 -3.4 27.2 -3.1 41.8 27.4 34.6 14.0 28.1
Real 52.2 54.9 3.0 -5.5 -11.2 -5.0 7.3 -3.0 10.7 8.0 16.5 -0.2 7.9
Price Index - - -15.2 -12.8 -5.3 1.7 18.5 -0.1 28.1 18.0 15.5 14.2 18.7
Agriculture Product
Nominal 29.7 31.6 -9.8 -11.4 -13.5 -5.2 23.4 -1.9 45.2 21.2 33.0 4.7 24.1
Real 31.1 35.3 5.6 -3.3 -16.0 -11.9 5.0 -6.1 19.0 17.4 33.0 2.4 16.6
Price Index - - -14.6 -8.4 3.0 7.6 17.5 4.5 22.0 3.2 0.0 2.2 6.4
Food
Nominal 23.6 24.3 -8.9 -11.1 -14.2 -3.2 26.3 -0.6 42.7 17.8 28.6 -1.1 19.7
Real 24.1 27.3 7.4 -4.1 -19.2 -14.6 3.4 -8.1 18.6 20.3 34.3 -0.7 16.3
Price Index - - -15.2 -7.3 6.2 13.3 22.2 8.1 20.3 -2.1 -4.2 -0.4 2.9
Raw Materials
Nominal 6.1 7.4 -12.6 -12.4 -10.6 -12.0 11.5 -6.3 54.4 33.3 49.1 30.8 41.3
Real 7.0 8.0 -0.3 -0.8 -4.0 -3.0 9.5 0.4 21.4 9.6 28.8 15.9 18.5
Price Index - - -12.4 -11.7 -6.9 -9.3 1.9 -6.7 27.1 21.7 15.7 12.9 19.3
Fuel & Mining Product
Nominal 17.6 20.4 -17.0 -26.6 -19.8 -0.3 34.2 -5.1 35.7 38.3 37.3 29.8 34.9
Real 21.0 20.0 -1.1 -9.2 -2.8 6.6 11.7 1.8 -1.8 -4.2 -2.4 -0.6 -2.3
Price Index - - -16.1 -19.2 -17.5 -6.5 20.2 -6.8 38.3 44.4 40.6 30.5 38.0
B. Manufacturing Product
Nominal 51.3 46.4 -6.9 -1.9 4.2 -1.3 9.2 2.5 6.1 -7.3 15.2 9.6 5.5
Real 46.8 43.7 -5.5 -2.1 0.6 -5.7 1.3 -1.5 -3.7 -16.5 5.4 -0.4 -4.2
Price Index - - -1.5 0.2 3.5 4.7 7.8 4.0 10.2 11.1 9.3 10.0 10.1
C. Lainnya
Nominal 1.4 1.6 -17.1 -13.3 -0.2 -6.3 15.7 -1.5 0.8 16.2 50.3 42.9 28.3
Real 1.4 1.7 -10.8 -9.1 -1.8 -19.9 4.3 -6.9 -2.8 15.9 58.0 37.1 27.4
Price Index - - -7.0 -4.6 1.6 17.0 10.9 5.9 3.7 0.2 -4.8 4.3 0.7
Total
Nominal 100.0 100.0 -10.0 -9.7 -5.7 -2.4 18.1 -0.3 21.9 8.1 25.0 12.4 16.5
Real 100.0 100.0 -1.4 -4.2 -5.7 -5.6 4.9 -2.6 3.7 -4.7 11.9 0.4 2.6
Price Index - - -8.7 -5.8 0.0 3.4 12.6 2.4 17.6 13.4 11.7 12.0 13.6
Source: Bank IndonesiaNote: *Preliminary figures **Very preliminary figures
component parts, as well as footwear (Chart 3.5). Based on export destination, most base metal exports were destined for Singapore, while consignments of processed foods and footwear were shipped to the United States. Exports of vehicles and components were taken mainly by the Philippines, Thailand, Japan, and Saudi Arabia. Meanwhile, the value of textile exports, a mainstay of the Indonesian economy, increased 5.9%, primarily driven by price factors, but export volumes continued to contract in 2017, despite improving to a decline of 5.2% from a decline of 6.9% in 2016.
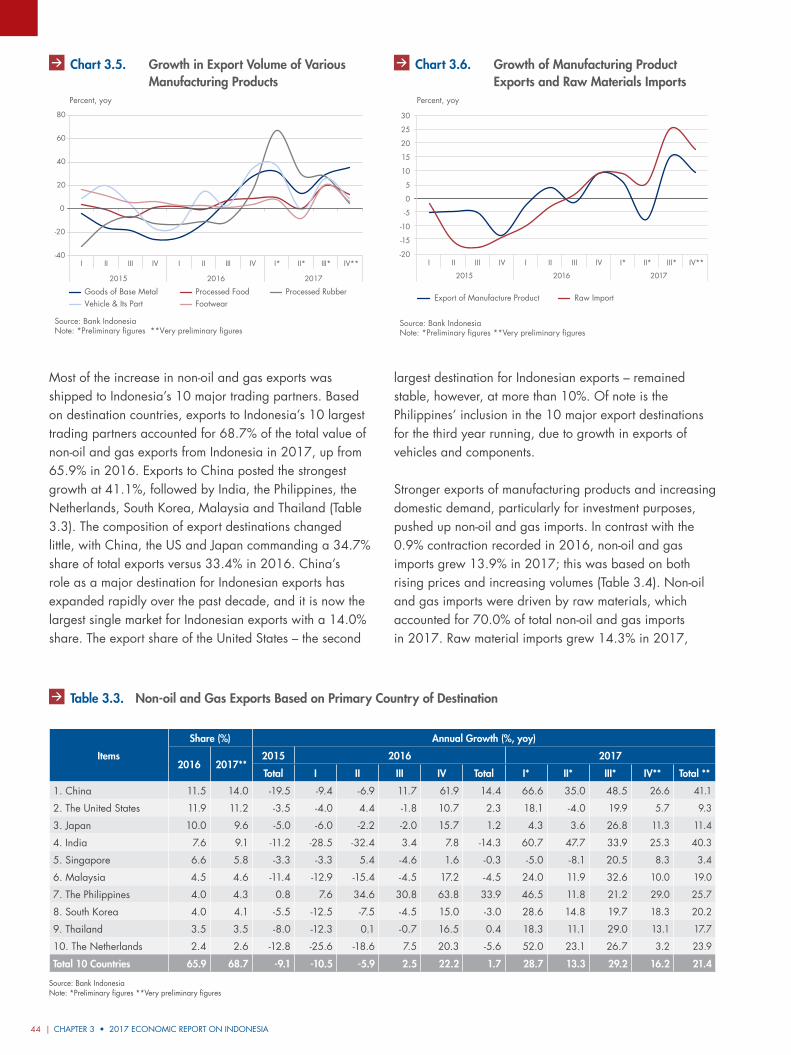
CHAPTER 3 • 2017 ECONOMIC REPORT ON INDONESIA44 |
Table 3.3. Non-oil and Gas Exports Based on Primary Country of Destination
Items
Share (%) Annual Growth (%, yoy)
2016 2017**2015 2016 2017
Total I II III IV Total I* II* III* IV** Total **
1. China 11.5 14.0 -19.5 -9.4 -6.9 11.7 61.9 14.4 66.6 35.0 48.5 26.6 41.1
2. The United States 11.9 11.2 -3.5 -4.0 4.4 -1.8 10.7 2.3 18.1 -4.0 19.9 5.7 9.3
3. Japan 10.0 9.6 -5.0 -6.0 -2.2 -2.0 15.7 1.2 4.3 3.6 26.8 11.3 11.4
4. India 7.6 9.1 -11.2 -28.5 -32.4 3.4 7.8 -14.3 60.7 47.7 33.9 25.3 40.3
5. Singapore 6.6 5.8 -3.3 -3.3 5.4 -4.6 1.6 -0.3 -5.0 -8.1 20.5 8.3 3.4
6. Malaysia 4.5 4.6 -11.4 -12.9 -15.4 -4.5 17.2 -4.5 24.0 11.9 32.6 10.0 19.0
7. The Philippines 4.0 4.3 0.8 7.6 34.6 30.8 63.8 33.9 46.5 11.8 21.2 29.0 25.7
8. South Korea 4.0 4.1 -5.5 -12.5 -7.5 -4.5 15.0 -3.0 28.6 14.8 19.7 18.3 20.2
9. Thailand 3.5 3.5 -8.0 -12.3 0.1 -0.7 16.5 0.4 18.3 11.1 29.0 13.1 17.7
10. The Netherlands 2.4 2.6 -12.8 -25.6 -18.6 7.5 20.3 -5.6 52.0 23.1 26.7 3.2 23.9
Total 10 Countries 65.9 68.7 -9.1 -10.5 -5.9 2.5 22.2 1.7 28.7 13.3 29.2 16.2 21.4
Source: Bank IndonesiaNote: *Preliminary figures **Very preliminary figures
Most of the increase in non-oil and gas exports was shipped to Indonesia’s 10 major trading partners. Based on destination countries, exports to Indonesia’s 10 largest trading partners accounted for 68.7% of the total value of non-oil and gas exports from Indonesia in 2017, up from 65.9% in 2016. Exports to China posted the strongest growth at 41.1%, followed by India, the Philippines, the Netherlands, South Korea, Malaysia and Thailand (Table 3.3). The composition of export destinations changed little, with China, the US and Japan commanding a 34.7% share of total exports versus 33.4% in 2016. China’s role as a major destination for Indonesian exports has expanded rapidly over the past decade, and it is now the largest single market for Indonesian exports with a 14.0% share. The export share of the United States – the second
largest destination for Indonesian exports – remained stable, however, at more than 10%. Of note is the Philippines’ inclusion in the 10 major export destinations for the third year running, due to growth in exports of vehicles and components.
Stronger exports of manufacturing products and increasing domestic demand, particularly for investment purposes, pushed up non-oil and gas imports. In contrast with the 0.9% contraction recorded in 2016, non-oil and gas imports grew 13.9% in 2017; this was based on both rising prices and increasing volumes (Table 3.4). Non-oil and gas imports were driven by raw materials, which accounted for 70.0% of total non-oil and gas imports in 2017. Raw material imports grew 14.3% in 2017,
Percent, yoy
Goods of Base Metal Processed RubberProcessed FoodVehicle & Its Part Footwear
-40
-20
0
20
40
60
80
I II III IV I II III IV I* II* III* IV**
2015 2016 2017
Gra�k 3.5.
Source: Bank IndonesiaNote: *Preliminary figures **Very preliminary figures
Chart 3.5. Growth in Export Volume of Various Manufacturing Products
Export of Manufacture Product Raw Import
Percent, yoy
I II III IV I* II* III* IV**
2015 2016 2017
I II III IV
30
25
20
15
10
5
0
-5
-10
-15
-20
Grafik 3.6.
Source: Bank IndonesiaNote: *Preliminary figures **Very preliminary figures
Chart 3.6. Growth of Manufacturing Product Exports and Raw Materials Imports
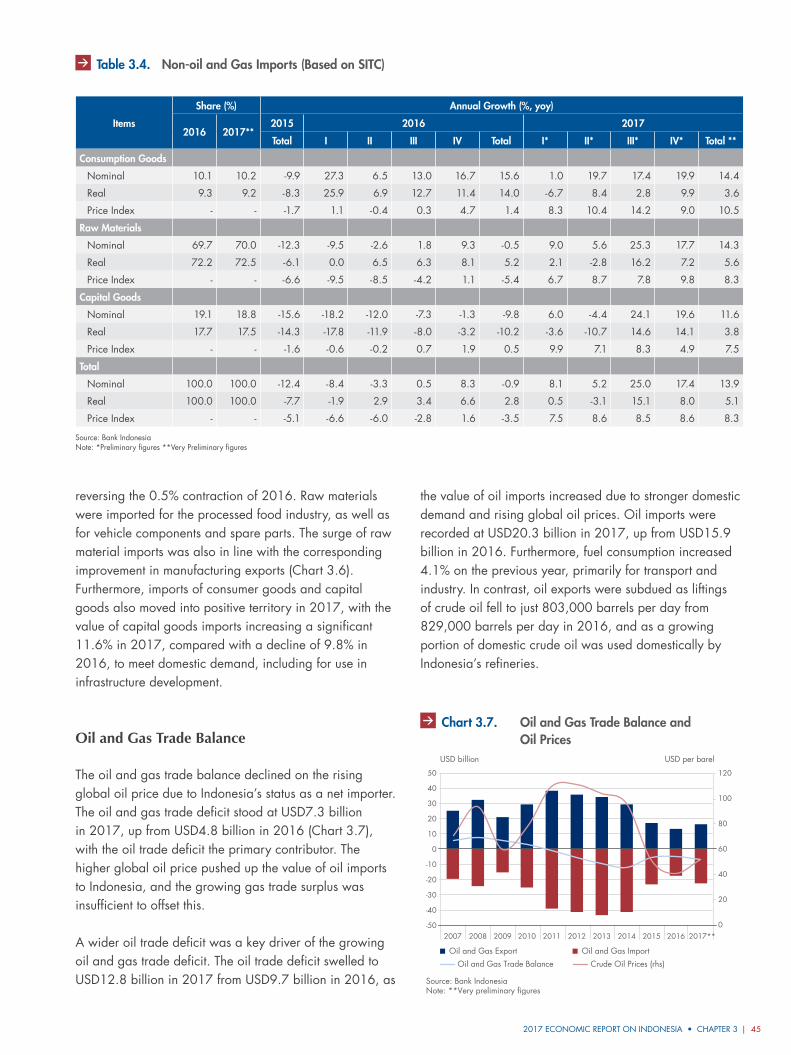
2017 ECONOMIC REPORT ON INDONESIA • CHAPTER 3 | 45
reversing the 0.5% contraction of 2016. Raw materials were imported for the processed food industry, as well as for vehicle components and spare parts. The surge of raw material imports was also in line with the corresponding improvement in manufacturing exports (Chart 3.6). Furthermore, imports of consumer goods and capital goods also moved into positive territory in 2017, with the value of capital goods imports increasing a significant 11.6% in 2017, compared with a decline of 9.8% in 2016, to meet domestic demand, including for use in infrastructure development.
Oil and Gas Trade Balance
The oil and gas trade balance declined on the rising global oil price due to Indonesia’s status as a net importer. The oil and gas trade deficit stood at USD7.3 billion in 2017, up from USD4.8 billion in 2016 (Chart 3.7), with the oil trade deficit the primary contributor. The higher global oil price pushed up the value of oil imports to Indonesia, and the growing gas trade surplus was insufficient to offset this.
A wider oil trade deficit was a key driver of the growing oil and gas trade deficit. The oil trade deficit swelled to USD12.8 billion in 2017 from USD9.7 billion in 2016, as
the value of oil imports increased due to stronger domestic demand and rising global oil prices. Oil imports were recorded at USD20.3 billion in 2017, up from USD15.9 billion in 2016. Furthermore, fuel consumption increased 4.1% on the previous year, primarily for transport and industry. In contrast, oil exports were subdued as liftings of crude oil fell to just 803,000 barrels per day from 829,000 barrels per day in 2016, and as a growing portion of domestic crude oil was used domestically by Indonesia’s refineries.
Table 3.4. Non-oil and Gas Imports (Based on SITC)
Items
Share (%) Annual Growth (%, yoy)
2016 2017**2015 2016 2017
Total I II III IV Total I* II* III* IV* Total **
Consumption Goods
Nominal 10.1 10.2 -9.9 27.3 6.5 13.0 16.7 15.6 1.0 19.7 17.4 19.9 14.4
Real 9.3 9.2 -8.3 25.9 6.9 12.7 11.4 14.0 -6.7 8.4 2.8 9.9 3.6
Price Index - - -1.7 1.1 -0.4 0.3 4.7 1.4 8.3 10.4 14.2 9.0 10.5
Raw Materials
Nominal 69.7 70.0 -12.3 -9.5 -2.6 1.8 9.3 -0.5 9.0 5.6 25.3 17.7 14.3
Real 72.2 72.5 -6.1 0.0 6.5 6.3 8.1 5.2 2.1 -2.8 16.2 7.2 5.6
Price Index - - -6.6 -9.5 -8.5 -4.2 1.1 -5.4 6.7 8.7 7.8 9.8 8.3
Capital Goods
Nominal 19.1 18.8 -15.6 -18.2 -12.0 -7.3 -1.3 -9.8 6.0 -4.4 24.1 19.6 11.6
Real 17.7 17.5 -14.3 -17.8 -11.9 -8.0 -3.2 -10.2 -3.6 -10.7 14.6 14.1 3.8
Price Index - - -1.6 -0.6 -0.2 0.7 1.9 0.5 9.9 7.1 8.3 4.9 7.5
Total
Nominal 100.0 100.0 -12.4 -8.4 -3.3 0.5 8.3 -0.9 8.1 5.2 25.0 17.4 13.9
Real 100.0 100.0 -7.7 -1.9 2.9 3.4 6.6 2.8 0.5 -3.1 15.1 8.0 5.1
Price Index - - -5.1 -6.6 -6.0 -2.8 1.6 -3.5 7.5 8.6 8.5 8.6 8.3
Source: Bank IndonesiaNote: *Preliminary figures **Very Preliminary figures
50
40
30
20
10
0
-10
-20
-30
-40
-50
120
100
80
60
40
20
0
USD billion USD per barel
Grafik 3.7 Judul
Oil and Gas Export Oil and Gas Import
Oil and Gas Trade Balance Crude Oil Prices (rhs)
2007 2008 2009 2010 2011 2012 2013 2014 2015 2016 2017**
Source: Bank IndonesiaNote: **Very preliminary figures
Chart 3.7. Oil and Gas Trade Balance and Oil Prices
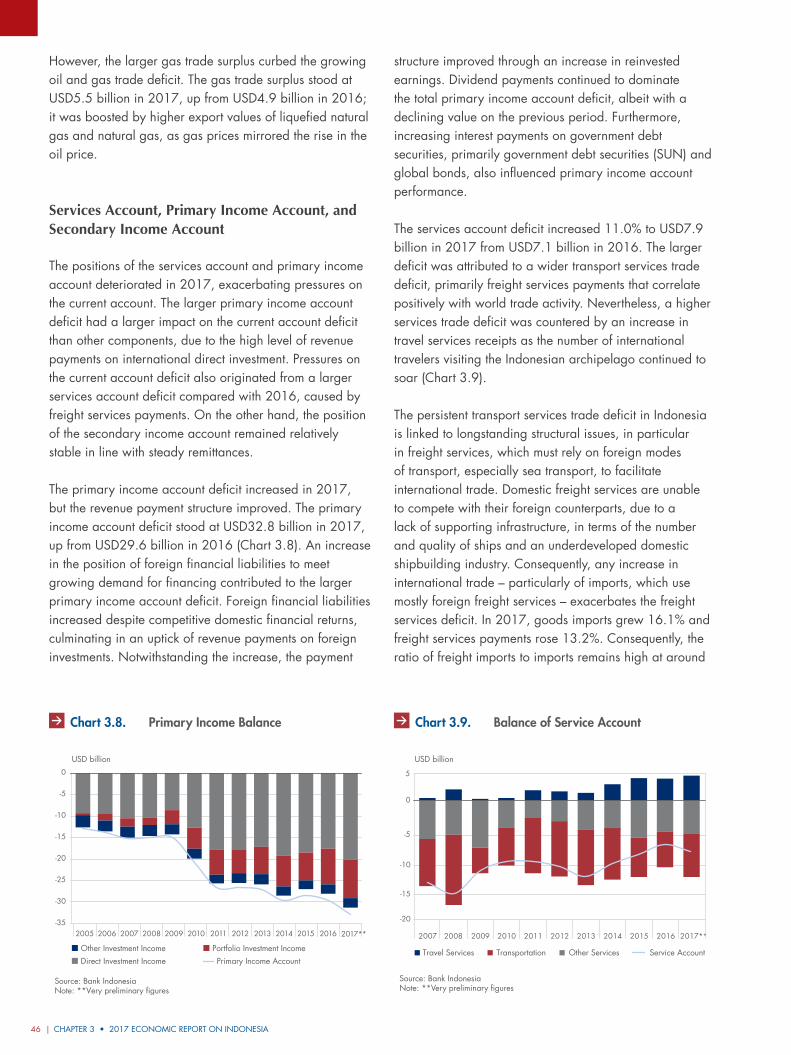
CHAPTER 3 • 2017 ECONOMIC REPORT ON INDONESIA46 |
Grafik 3.8. Transaksi Neraca Pendapatan Primer
USD billion
-35
-30
-25
-20
-15
-10
-5
0
2005 2006 2007 2008 2009 2010 2011 2012 2013 2014 2015 2016 2017**
Primary Income Account
Source: Bank IndonesiaNote: **Very preliminary figures
Other Investment Income Portfolio Investment IncomeDirect Investment Income
Chart 3.8. Primary Income Balance
-20
-15
-10
-5
0
5
Grafik 3.9. Neraca Jasa
USD billion
2007 2008 2009 2010 2011 2012 2013 2014 2015 2016 2017**
Travel Services Transportation Other Services
Source: Bank IndonesiaNote: **Very preliminary figures
Service Account
Chart 3.9. Balance of Service Account
However, the larger gas trade surplus curbed the growing oil and gas trade deficit. The gas trade surplus stood at USD5.5 billion in 2017, up from USD4.9 billion in 2016; it was boosted by higher export values of liquefied natural gas and natural gas, as gas prices mirrored the rise in the oil price.
Services Account, Primary Income Account, and Secondary Income Account
The positions of the services account and primary income account deteriorated in 2017, exacerbating pressures on the current account. The larger primary income account deficit had a larger impact on the current account deficit than other components, due to the high level of revenue payments on international direct investment. Pressures on the current account deficit also originated from a larger services account deficit compared with 2016, caused by freight services payments. On the other hand, the position of the secondary income account remained relatively stable in line with steady remittances.
The primary income account deficit increased in 2017, but the revenue payment structure improved. The primary income account deficit stood at USD32.8 billion in 2017, up from USD29.6 billion in 2016 (Chart 3.8). An increase in the position of foreign financial liabilities to meet growing demand for financing contributed to the larger primary income account deficit. Foreign financial liabilities increased despite competitive domestic financial returns, culminating in an uptick of revenue payments on foreign investments. Notwithstanding the increase, the payment
structure improved through an increase in reinvested earnings. Dividend payments continued to dominate the total primary income account deficit, albeit with a declining value on the previous period. Furthermore, increasing interest payments on government debt securities, primarily government debt securities (SUN) and global bonds, also influenced primary income account performance.
The services account deficit increased 11.0% to USD7.9 billion in 2017 from USD7.1 billion in 2016. The larger deficit was attributed to a wider transport services trade deficit, primarily freight services payments that correlate positively with world trade activity. Nevertheless, a higher services trade deficit was countered by an increase in travel services receipts as the number of international travelers visiting the Indonesian archipelago continued to soar (Chart 3.9).
The persistent transport services trade deficit in Indonesia is linked to longstanding structural issues, in particular in freight services, which must rely on foreign modes of transport, especially sea transport, to facilitate international trade. Domestic freight services are unable to compete with their foreign counterparts, due to a lack of supporting infrastructure, in terms of the number and quality of ships and an underdeveloped domestic shipbuilding industry. Consequently, any increase in international trade – particularly of imports, which use mostly foreign freight services – exacerbates the freight services deficit. In 2017, goods imports grew 16.1% and freight services payments rose 13.2%. Consequently, the ratio of freight imports to imports remains high at around
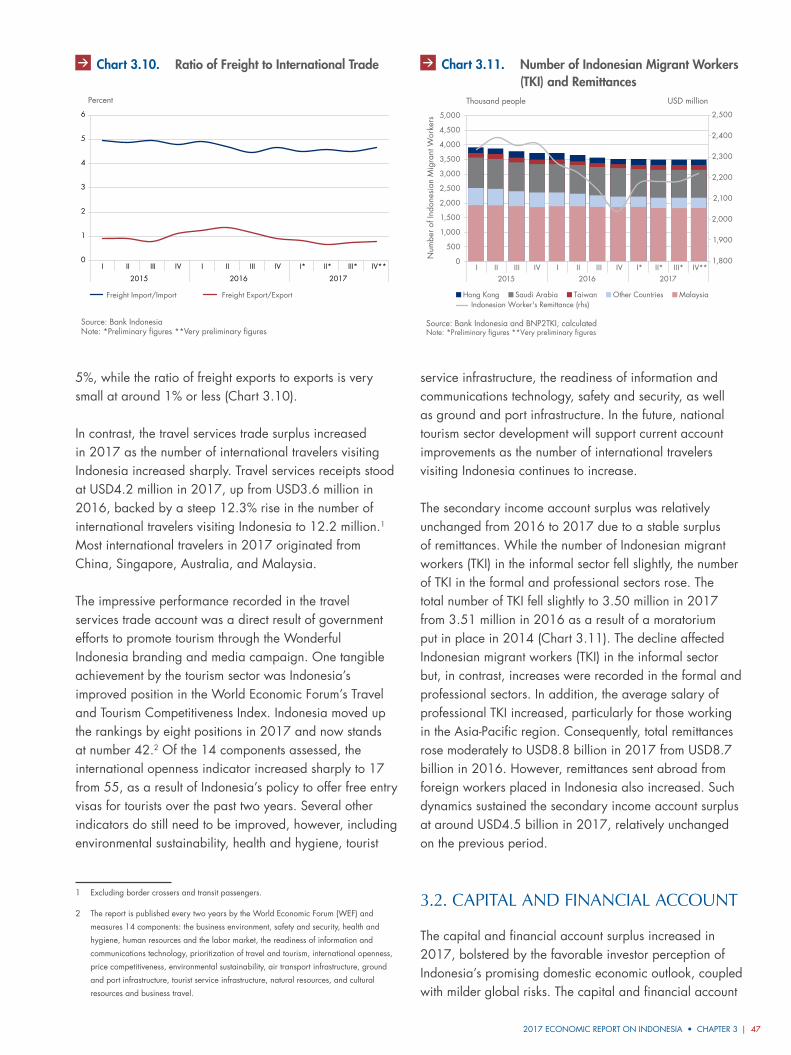
2017 ECONOMIC REPORT ON INDONESIA • CHAPTER 3 | 47
5%, while the ratio of freight exports to exports is very small at around 1% or less (Chart 3.10).
In contrast, the travel services trade surplus increased in 2017 as the number of international travelers visiting Indonesia increased sharply. Travel services receipts stood at USD4.2 million in 2017, up from USD3.6 million in 2016, backed by a steep 12.3% rise in the number of international travelers visiting Indonesia to 12.2 million.1 Most international travelers in 2017 originated from China, Singapore, Australia, and Malaysia.
The impressive performance recorded in the travel services trade account was a direct result of government efforts to promote tourism through the Wonderful Indonesia branding and media campaign. One tangible achievement by the tourism sector was Indonesia’s improved position in the World Economic Forum’s Travel and Tourism Competitiveness Index. Indonesia moved up the rankings by eight positions in 2017 and now stands at number 42.2 Of the 14 components assessed, the international openness indicator increased sharply to 17 from 55, as a result of Indonesia’s policy to offer free entry visas for tourists over the past two years. Several other indicators do still need to be improved, however, including environmental sustainability, health and hygiene, tourist
1 Excluding border crossers and transit passengers.
2 The report is published every two years by the World Economic Forum (WEF) and
measures 14 components: the business environment, safety and security, health and
hygiene, human resources and the labor market, the readiness of information and
communications technology, prioritization of travel and tourism, international openness,
price competitiveness, environmental sustainability, air transport infrastructure, ground
and port infrastructure, tourist service infrastructure, natural resources, and cultural
resources and business travel.
service infrastructure, the readiness of information and communications technology, safety and security, as well as ground and port infrastructure. In the future, national tourism sector development will support current account improvements as the number of international travelers visiting Indonesia continues to increase.
The secondary income account surplus was relatively unchanged from 2016 to 2017 due to a stable surplus of remittances. While the number of Indonesian migrant workers (TKI) in the informal sector fell slightly, the number of TKI in the formal and professional sectors rose. The total number of TKI fell slightly to 3.50 million in 2017 from 3.51 million in 2016 as a result of a moratorium put in place in 2014 (Chart 3.11). The decline affected Indonesian migrant workers (TKI) in the informal sector but, in contrast, increases were recorded in the formal and professional sectors. In addition, the average salary of professional TKI increased, particularly for those working in the Asia-Pacific region. Consequently, total remittances rose moderately to USD8.8 billion in 2017 from USD8.7 billion in 2016. However, remittances sent abroad from foreign workers placed in Indonesia also increased. Such dynamics sustained the secondary income account surplus at around USD4.5 billion in 2017, relatively unchanged on the previous period.
3.2. CApitAl And FinAnCiAl ACCount
The capital and financial account surplus increased in 2017, bolstered by the favorable investor perception of Indonesia’s promising domestic economic outlook, coupled with milder global risks. The capital and financial account
Grafik 3.10.2 Lorem Ipsum
Source: Bank IndonesiaNote: *Preliminary figures **Very preliminary figures
Percent
Freight Import/Import Freight Export/Export
0
1
2
3
4
5
6
I II III IV I II III IV I* II* III* IV**
2015 2016 2017
Chart 3.10. Ratio of Freight to International Trade Grafik 3.11. Lorem Ipsum
Thousand people USD million
1,800
1,900
2,000
2,100
2,200
2,300
2,400
2,500
0
500
1,000
1,500
2,000
2,500
3,000
3,500
4,000
4,500
5,000
I II III IV I II III IV I* II* III* IV**2015 2016 2017
Num
ber o
f Ind
ones
ian
Mig
rant
Wor
kers
Indonesian Worker's Remittance (rhs)Saudi ArabiaHong Kong Taiwan Other Countries Malaysia
Source: Bank Indonesia and BNP2TKI, calculatedNote: *Preliminary figures **Very preliminary figures
Chart 3.11. Number of Indonesian Migrant Workers (TKI) and Remittances
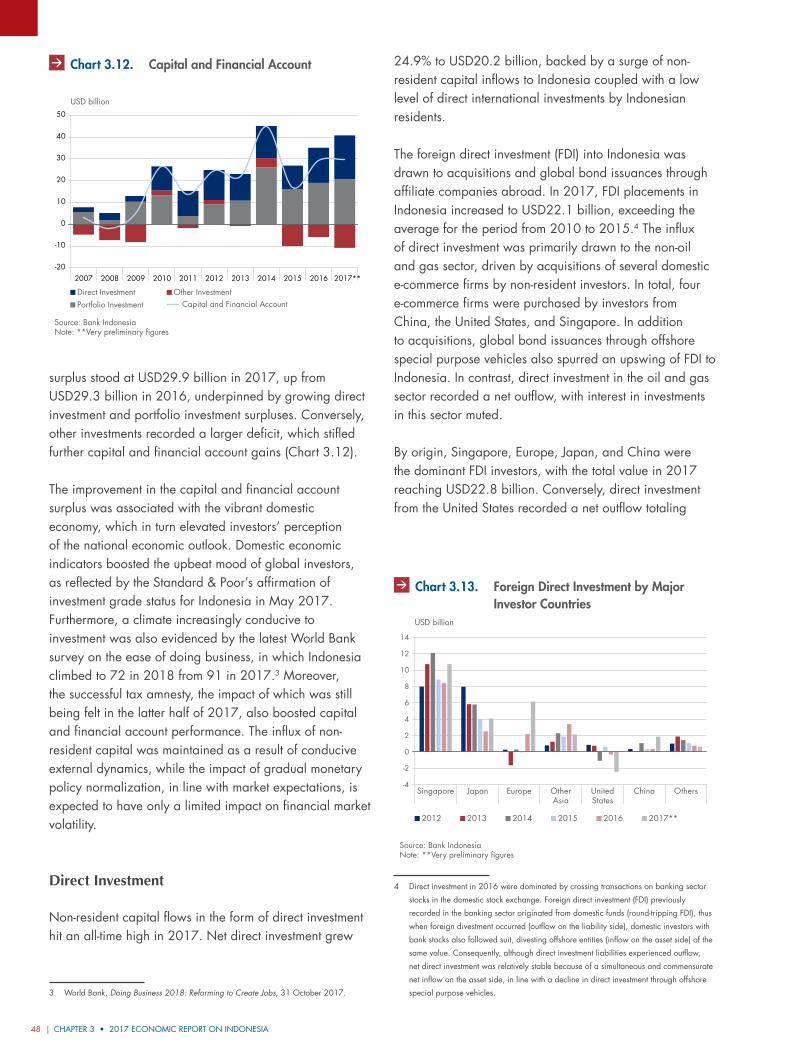
CHAPTER 3 • 2017 ECONOMIC REPORT ON INDONESIA48 |
Grafik 3.12. Lorem Ipsum
USD billion
Portfolio InvestmentDirect Investment Other Investment
Capital and Financial Account
Source: Bank IndonesiaNote: **Very preliminary figures
-20
-10
0
10
20
30
40
50
2007 2008 2009 2010 2011 2012 2013 2014 2015 2016 2017**
Chart 3.12. Capital and Financial Account
surplus stood at USD29.9 billion in 2017, up from USD29.3 billion in 2016, underpinned by growing direct investment and portfolio investment surpluses. Conversely, other investments recorded a larger deficit, which stifled further capital and financial account gains (Chart 3.12).
The improvement in the capital and financial account surplus was associated with the vibrant domestic economy, which in turn elevated investors’ perception of the national economic outlook. Domestic economic indicators boosted the upbeat mood of global investors, as reflected by the Standard & Poor’s affirmation of investment grade status for Indonesia in May 2017. Furthermore, a climate increasingly conducive to investment was also evidenced by the latest World Bank survey on the ease of doing business, in which Indonesia climbed to 72 in 2018 from 91 in 2017.3 Moreover, the successful tax amnesty, the impact of which was still being felt in the latter half of 2017, also boosted capital and financial account performance. The influx of non-resident capital was maintained as a result of conducive external dynamics, while the impact of gradual monetary policy normalization, in line with market expectations, is expected to have only a limited impact on financial market volatility.
Direct Investment
Non-resident capital flows in the form of direct investment hit an all-time high in 2017. Net direct investment grew
3 World Bank, Doing Business 2018: Reforming to Create Jobs, 31 October 2017.
24.9% to USD20.2 billion, backed by a surge of non-resident capital inflows to Indonesia coupled with a low level of direct international investments by Indonesian residents.
The foreign direct investment (FDI) into Indonesia was drawn to acquisitions and global bond issuances through affiliate companies abroad. In 2017, FDI placements in Indonesia increased to USD22.1 billion, exceeding the average for the period from 2010 to 2015.4 The influx of direct investment was primarily drawn to the non-oil and gas sector, driven by acquisitions of several domestic e-commerce firms by non-resident investors. In total, four e-commerce firms were purchased by investors from China, the United States, and Singapore. In addition to acquisitions, global bond issuances through offshore special purpose vehicles also spurred an upswing of FDI to Indonesia. In contrast, direct investment in the oil and gas sector recorded a net outflow, with interest in investments in this sector muted.
By origin, Singapore, Europe, Japan, and China were the dominant FDI investors, with the total value in 2017 reaching USD22.8 billion. Conversely, direct investment from the United States recorded a net outflow totaling
4 Direct investment in 2016 were dominated by crossing transactions on banking sector
stocks in the domestic stock exchange. Foreign direct investment (FDI) previously
recorded in the banking sector originated from domestic funds (round-tripping FDI), thus
when foreign divestment occurred (outflow on the liability side), domestic investors with
bank stocks also followed suit, divesting offshore entities (inflow on the asset side) of the
same value. Consequently, although direct investment liabilities experienced outflow,
net direct investment was relatively stable because of a simultaneous and commensurate
net inflow on the asset side, in line with a decline in direct investment through offshore
special purpose vehicles.
Singapore Japan Europe OtherAsia
UnitedStates
China Others
4
2
0
6
8
10
14
12
-4
-2
USD billion
Gra�k 3.13. xxx
2012 2013 2014 2015 2016 2017**
Source: Bank IndonesiaNote: **Very preliminary figures
Chart 3.13. Foreign Direct Investment by Major Investor Countries
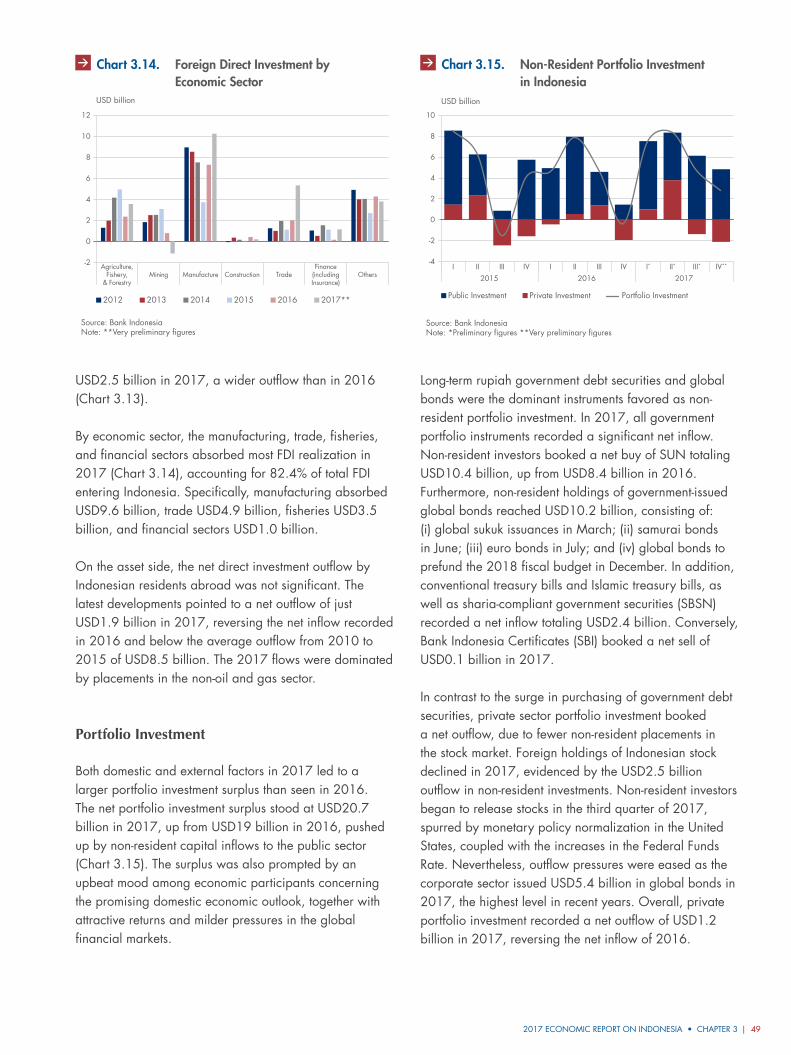
2017 ECONOMIC REPORT ON INDONESIA • CHAPTER 3 | 49
USD2.5 billion in 2017, a wider outflow than in 2016 (Chart 3.13).
By economic sector, the manufacturing, trade, fisheries, and financial sectors absorbed most FDI realization in 2017 (Chart 3.14), accounting for 82.4% of total FDI entering Indonesia. Specifically, manufacturing absorbed USD9.6 billion, trade USD4.9 billion, fisheries USD3.5 billion, and financial sectors USD1.0 billion.
On the asset side, the net direct investment outflow by Indonesian residents abroad was not significant. The latest developments pointed to a net outflow of just USD1.9 billion in 2017, reversing the net inflow recorded in 2016 and below the average outflow from 2010 to 2015 of USD8.5 billion. The 2017 flows were dominated by placements in the non-oil and gas sector.
Portfolio Investment
Both domestic and external factors in 2017 led to a larger portfolio investment surplus than seen in 2016. The net portfolio investment surplus stood at USD20.7 billion in 2017, up from USD19 billion in 2016, pushed up by non-resident capital inflows to the public sector (Chart 3.15). The surplus was also prompted by an upbeat mood among economic participants concerning the promising domestic economic outlook, together with attractive returns and milder pressures in the global financial markets.
Long-term rupiah government debt securities and global bonds were the dominant instruments favored as non-resident portfolio investment. In 2017, all government portfolio instruments recorded a significant net inflow. Non-resident investors booked a net buy of SUN totaling USD10.4 billion, up from USD8.4 billion in 2016. Furthermore, non-resident holdings of government-issued global bonds reached USD10.2 billion, consisting of: (i) global sukuk issuances in March; (ii) samurai bonds in June; (iii) euro bonds in July; and (iv) global bonds to prefund the 2018 fiscal budget in December. In addition, conventional treasury bills and Islamic treasury bills, as well as sharia-compliant government securities (SBSN) recorded a net inflow totaling USD2.4 billion. Conversely, Bank Indonesia Certificates (SBI) booked a net sell of USD0.1 billion in 2017.
In contrast to the surge in purchasing of government debt securities, private sector portfolio investment booked a net outflow, due to fewer non-resident placements in the stock market. Foreign holdings of Indonesian stock declined in 2017, evidenced by the USD2.5 billion outflow in non-resident investments. Non-resident investors began to release stocks in the third quarter of 2017, spurred by monetary policy normalization in the United States, coupled with the increases in the Federal Funds Rate. Nevertheless, outflow pressures were eased as the corporate sector issued USD5.4 billion in global bonds in 2017, the highest level in recent years. Overall, private portfolio investment recorded a net outflow of USD1.2 billion in 2017, reversing the net inflow of 2016.
Agriculture,Fishery,
& ForestryMining Manufacture Construction Trade
Finance(includingInsurance)
Others
4
2
0
6
8
10
12
-2
USD billion
Gra�k 3.14. xxx
2012 2013 2014 2015 2016 2017**
Source: Bank IndonesiaNote: **Very preliminary figures
Chart 3.14. Foreign Direct Investment by Economic Sector
Grafik 3.15. Xxx
Source: Bank IndonesiaNote: *Preliminary figures **Very preliminary figures
USD billion
Public Investment Private Investment Portfolio Investment
-4
-2
0
2
4
6
8
10
I II III IV2015
I II III IV2016
I* II* III* IV**
2017
Chart 3.15. Non-Resident Portfolio Investment in Indonesia
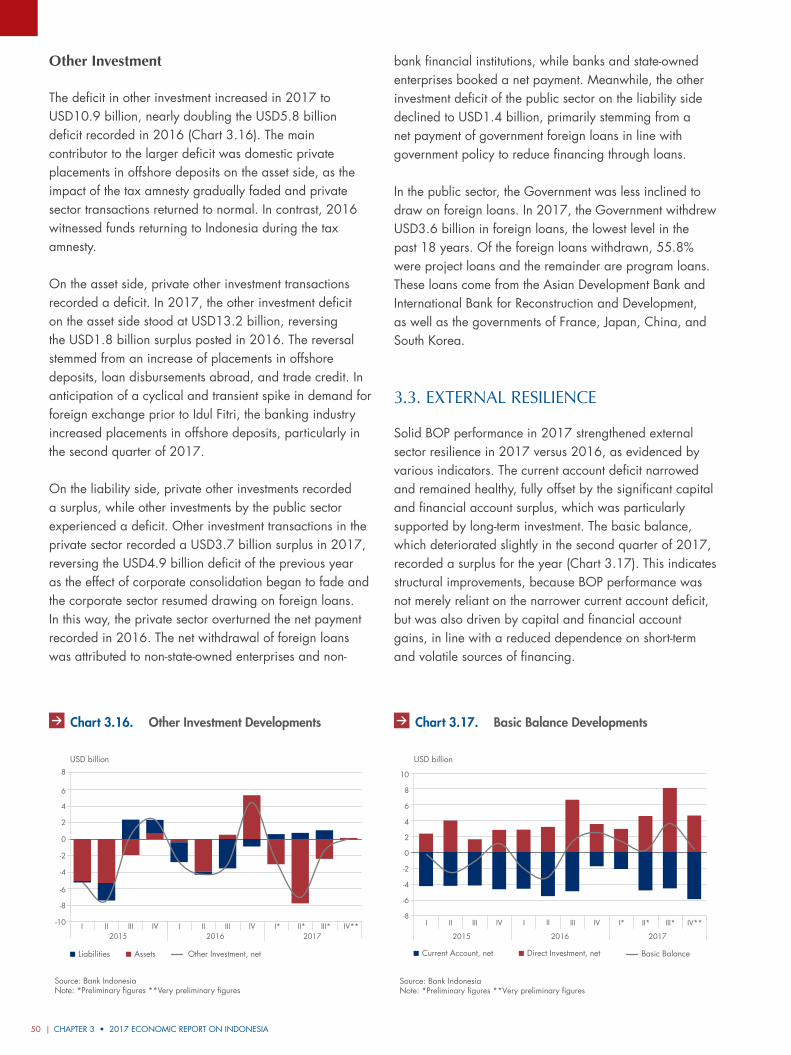
CHAPTER 3 • 2017 ECONOMIC REPORT ON INDONESIA50 |
Grafik 3.16. Xxx
Source: Bank IndonesiaNote: *Preliminary figures **Very preliminary figures
USD billion
Liabilities Assets Other Investment, net
-10
-8
-6
-4
-2
0
2
4
6
8
I II III IV2015
I II III IV2016
I* II* III* IV**2017
Chart 3.16. Other Investment Developments
Other Investment
The deficit in other investment increased in 2017 to USD10.9 billion, nearly doubling the USD5.8 billion deficit recorded in 2016 (Chart 3.16). The main contributor to the larger deficit was domestic private placements in offshore deposits on the asset side, as the impact of the tax amnesty gradually faded and private sector transactions returned to normal. In contrast, 2016 witnessed funds returning to Indonesia during the tax amnesty.
On the asset side, private other investment transactions recorded a deficit. In 2017, the other investment deficit on the asset side stood at USD13.2 billion, reversing the USD1.8 billion surplus posted in 2016. The reversal stemmed from an increase of placements in offshore deposits, loan disbursements abroad, and trade credit. In anticipation of a cyclical and transient spike in demand for foreign exchange prior to Idul Fitri, the banking industry increased placements in offshore deposits, particularly in the second quarter of 2017.
On the liability side, private other investments recorded a surplus, while other investments by the public sector experienced a deficit. Other investment transactions in the private sector recorded a USD3.7 billion surplus in 2017, reversing the USD4.9 billion deficit of the previous year as the effect of corporate consolidation began to fade and the corporate sector resumed drawing on foreign loans. In this way, the private sector overturned the net payment recorded in 2016. The net withdrawal of foreign loans was attributed to non-state-owned enterprises and non-
bank financial institutions, while banks and state-owned enterprises booked a net payment. Meanwhile, the other investment deficit of the public sector on the liability side declined to USD1.4 billion, primarily stemming from a net payment of government foreign loans in line with government policy to reduce financing through loans.
In the public sector, the Government was less inclined to draw on foreign loans. In 2017, the Government withdrew USD3.6 billion in foreign loans, the lowest level in the past 18 years. Of the foreign loans withdrawn, 55.8% were project loans and the remainder are program loans. These loans come from the Asian Development Bank and International Bank for Reconstruction and Development, as well as the governments of France, Japan, China, and South Korea.
3.3. externAl resilienCe
Solid BOP performance in 2017 strengthened external sector resilience in 2017 versus 2016, as evidenced by various indicators. The current account deficit narrowed and remained healthy, fully offset by the significant capital and financial account surplus, which was particularly supported by long-term investment. The basic balance, which deteriorated slightly in the second quarter of 2017, recorded a surplus for the year (Chart 3.17). This indicates structural improvements, because BOP performance was not merely reliant on the narrower current account deficit, but was also driven by capital and financial account gains, in line with a reduced dependence on short-term and volatile sources of financing.
Grafik 3.17. Judul
Source: Bank IndonesiaNote: *Preliminary figures **Very preliminary figures
USD billion
Basic BalanceCurrent Account, net Direct Investment, net
-6
-8
-4
-2
0
2
4
6
8
10
I II III IV I II III IV I* II* III* IV**
2016 2015 2017
Chart 3.17. Basic Balance Developments
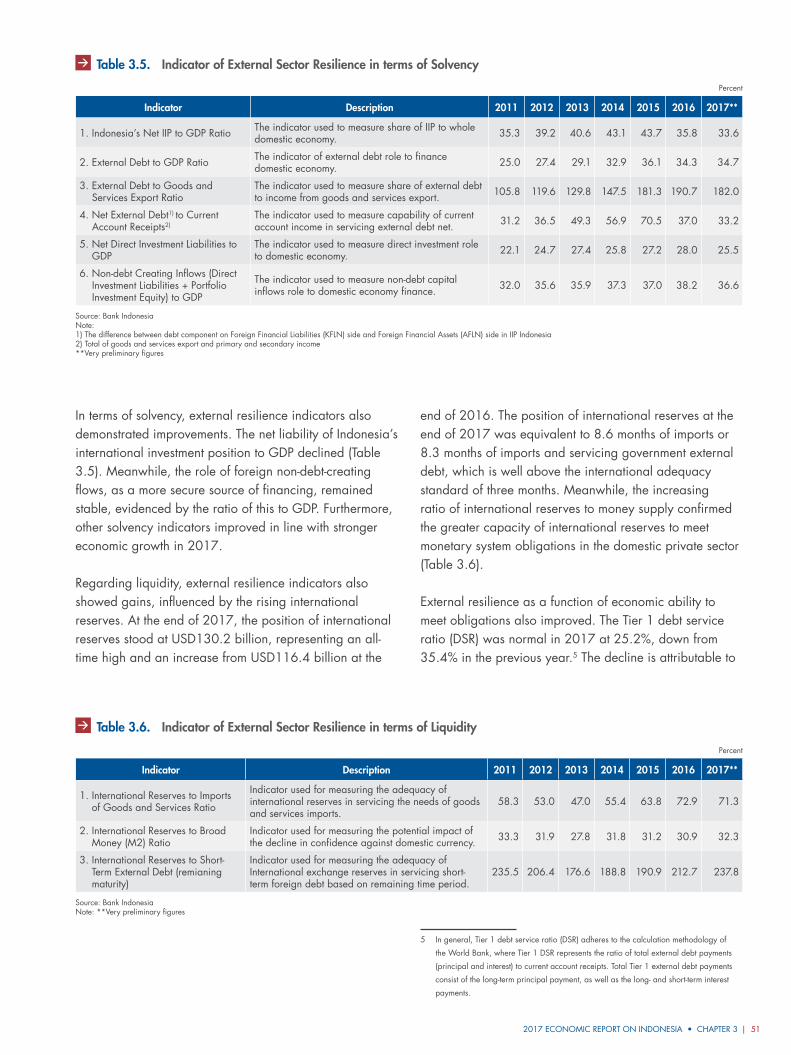
2017 ECONOMIC REPORT ON INDONESIA • CHAPTER 3 | 51
In terms of solvency, external resilience indicators also demonstrated improvements. The net liability of Indonesia’s international investment position to GDP declined (Table 3.5). Meanwhile, the role of foreign non-debt-creating flows, as a more secure source of financing, remained stable, evidenced by the ratio of this to GDP. Furthermore, other solvency indicators improved in line with stronger economic growth in 2017.
Regarding liquidity, external resilience indicators also showed gains, influenced by the rising international reserves. At the end of 2017, the position of international reserves stood at USD130.2 billion, representing an all-time high and an increase from USD116.4 billion at the
end of 2016. The position of international reserves at the end of 2017 was equivalent to 8.6 months of imports or 8.3 months of imports and servicing government external debt, which is well above the international adequacy standard of three months. Meanwhile, the increasing ratio of international reserves to money supply confirmed the greater capacity of international reserves to meet monetary system obligations in the domestic private sector (Table 3.6).
External resilience as a function of economic ability to meet obligations also improved. The Tier 1 debt service ratio (DSR) was normal in 2017 at 25.2%, down from 35.4% in the previous year.5 The decline is attributable to
5 In general, Tier 1 debt service ratio (DSR) adheres to the calculation methodology of
the World Bank, where Tier 1 DSR represents the ratio of total external debt payments
(principal and interest) to current account receipts. Total Tier 1 external debt payments
consist of the long-term principal payment, as well as the long- and short-term interest
payments.
Table 3.5. Indicator of External Sector Resilience in terms of Solvency
Percent
Indicator Description 2011 2012 2013 2014 2015 2016 2017**
1. Indonesia’s Net IIP to GDP Ratio The indicator used to measure share of IIP to whole domestic economy. 35.3 39.2 40.6 43.1 43.7 35.8 33.6
2. External Debt to GDP Ratio The indicator of external debt role to finance domestic economy. 25.0 27.4 29.1 32.9 36.1 34.3 34.7
3. External Debt to Goods and Services Export Ratio
The indicator used to measure share of external debt to income from goods and services export. 105.8 119.6 129.8 147.5 181.3 190.7 182.0
4. Net External Debt1) to Current Account Receipts2)
The indicator used to measure capability of current account income in servicing external debt net. 31.2 36.5 49.3 56.9 70.5 37.0 33.2
5. Net Direct Investment Liabilities to GDP
The indicator used to measure direct investment role to domestic economy. 22.1 24.7 27.4 25.8 27.2 28.0 25.5
6. Non-debt Creating Inflows (Direct Investment Liabilities + Portfolio Investment Equity) to GDP
The indicator used to measure non-debt capital inflows role to domestic economy finance. 32.0 35.6 35.9 37.3 37.0 38.2 36.6
Source: Bank IndonesiaNote:1) The difference between debt component on Foreign Financial Liabilities (KFLN) side and Foreign Financial Assets (AFLN) side in IIP Indonesia 2) Total of goods and services export and primary and secondary income**Very preliminary figures
Table 3.6. Indicator of External Sector Resilience in terms of Liquidity
Percent
Indicator Description 2011 2012 2013 2014 2015 2016 2017**
1. International Reserves to Imports of Goods and Services Ratio
Indicator used for measuring the adequacy of international reserves in servicing the needs of goods and services imports.
58.3 53.0 47.0 55.4 63.8 72.9 71.3
2. International Reserves to Broad Money (M2) Ratio
Indicator used for measuring the potential impact of the decline in confidence against domestic currency. 33.3 31.9 27.8 31.8 31.2 30.9 32.3
3. International Reserves to Short-Term External Debt (remianing maturity)
Indicator used for measuring the adequacy of International exchange reserves in servicing short-term foreign debt based on remaining time period.
235.5 206.4 176.6 188.8 190.9 212.7 237.8
Source: Bank IndonesiaNote: **Very preliminary figures
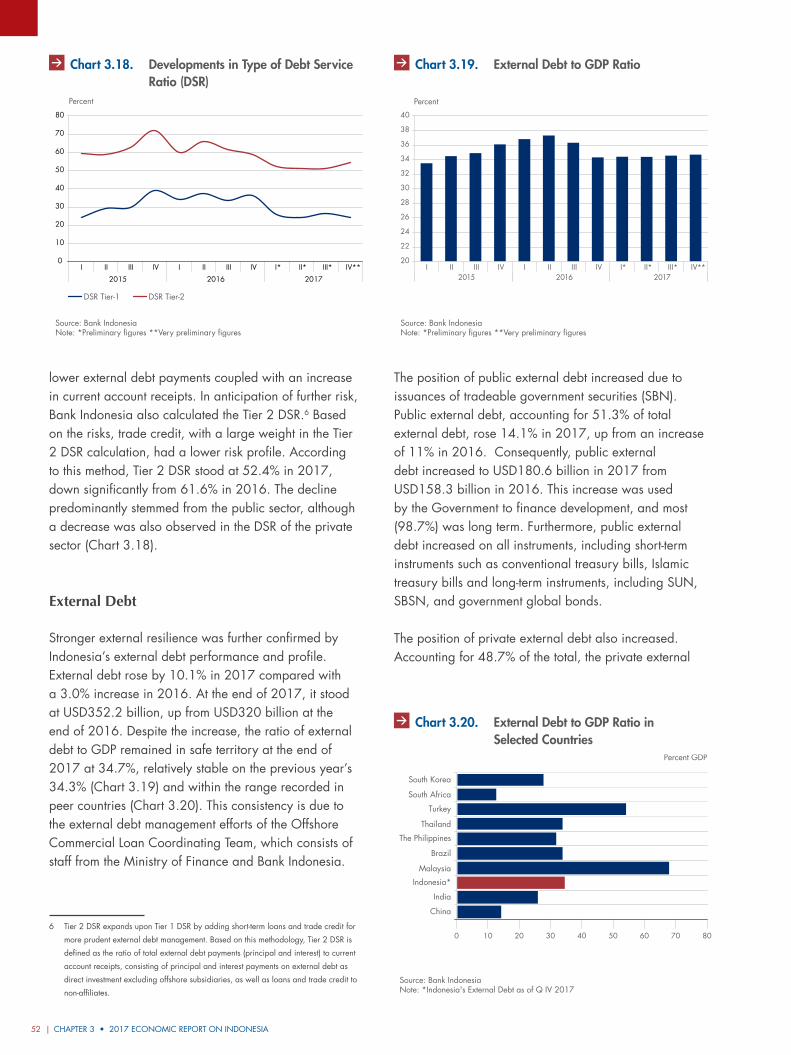
CHAPTER 3 • 2017 ECONOMIC REPORT ON INDONESIA52 |
lower external debt payments coupled with an increase in current account receipts. In anticipation of further risk, Bank Indonesia also calculated the Tier 2 DSR.6 Based on the risks, trade credit, with a large weight in the Tier 2 DSR calculation, had a lower risk profile. According to this method, Tier 2 DSR stood at 52.4% in 2017, down significantly from 61.6% in 2016. The decline predominantly stemmed from the public sector, although a decrease was also observed in the DSR of the private sector (Chart 3.18).
External Debt
Stronger external resilience was further confirmed by Indonesia’s external debt performance and profile. External debt rose by 10.1% in 2017 compared with a 3.0% increase in 2016. At the end of 2017, it stood at USD352.2 billion, up from USD320 billion at the end of 2016. Despite the increase, the ratio of external debt to GDP remained in safe territory at the end of 2017 at 34.7%, relatively stable on the previous year’s 34.3% (Chart 3.19) and within the range recorded in peer countries (Chart 3.20). This consistency is due to the external debt management efforts of the Offshore Commercial Loan Coordinating Team, which consists of staff from the Ministry of Finance and Bank Indonesia.
6 Tier 2 DSR expands upon Tier 1 DSR by adding short-term loans and trade credit for
more prudent external debt management. Based on this methodology, Tier 2 DSR is
defined as the ratio of total external debt payments (principal and interest) to current
account receipts, consisting of principal and interest payments on external debt as
direct investment excluding offshore subsidiaries, as well as loans and trade credit to
non-affiliates.
The position of public external debt increased due to issuances of tradeable government securities (SBN). Public external debt, accounting for 51.3% of total external debt, rose 14.1% in 2017, up from an increase of 11% in 2016. Consequently, public external debt increased to USD180.6 billion in 2017 from USD158.3 billion in 2016. This increase was used by the Government to finance development, and most (98.7%) was long term. Furthermore, public external debt increased on all instruments, including short-term instruments such as conventional treasury bills, Islamic treasury bills and long-term instruments, including SUN, SBSN, and government global bonds.
The position of private external debt also increased. Accounting for 48.7% of the total, the private external
Grafik 3.19.
Source: Bank IndonesiaNote: *Preliminary figures **Very preliminary figures
Percent
I II III IV I II III IV I* II* III* IV**2015 2016 2017
0
10
20
30
40
50
60
70
80
DSR Tier-2DSR Tier-1
Chart 3.18. Developments in Type of Debt Service Ratio (DSR)
Grafik 3.20.
Percent
20
22
24
26
28
30
32
34
36
38
40
I II III IV I II III IV I* II* III* IV**2015 2016 2017
Source: Bank IndonesiaNote: *Preliminary figures **Very preliminary figures
Chart 3.19. External Debt to GDP Ratio
Grafik 8.21. xxxxxxxx
Malaysia
Indonesia*
India
China
Brazil
The Philippines
Thailand
Turkey
South Africa
South Korea
Percent GDP
0 10 20 30 40 50 60 70 80
Source: Bank IndonesiaNote: *Indonesia's External Debt as of Q IV 2017
Chart 3.20. External Debt to GDP Ratio in Selected Countries
2017 ECONOMIC REPORT ON INDONESIA • CHAPTER 3 | 53
debt grew 6.1% to USD171.6 billion in 2017 from USD161.7 billion in 2016. Similar to the public sector, private external debt was dominated by long-term debt, which accounted for 72.9% of the total. Loan agreements continued to dominate private external debt.
Based on remaining maturity, the structure of external debt was sound, indicated by the dominance of long-term debt, which has reached 84.5% of the total and is now at an all-time high. The position of long-term external debt was more dominant than short-term debt in both the public and private sectors.

| 55
CHAPTER 4
2017 ECONOMIC REPORT ON INDONESIA
In 2017, the rupiah exchange rate charted largely stable movement on the strength of a balance of payments surplus. This achievement was also closely linked to Bank Indonesia policy in managing the exchange rate in line with fundamentals, maintaining market mechanisms.
The Exchange Rate
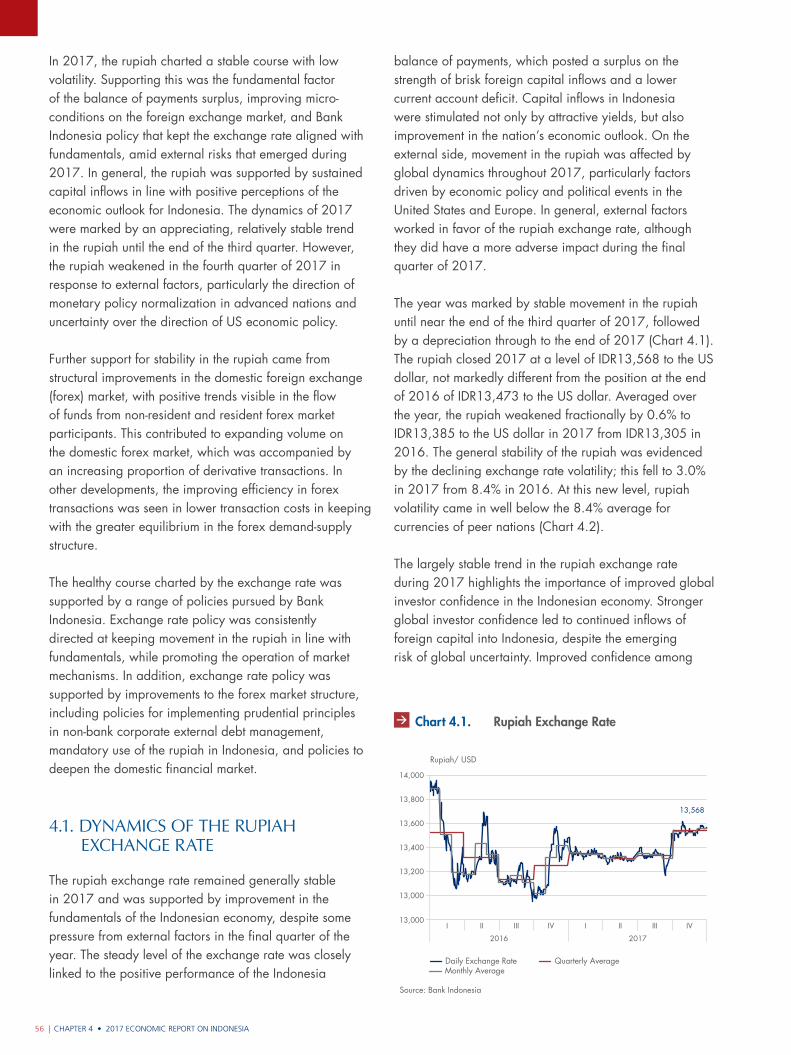
CHAPTER 4 • 2017 ECONOMIC REPORT ON INDONESIA56 |
Source: Bank Indonesia
Grafik 4.1. Nilai Tukar Rupiah
Daily Exchange Rate Quarterly AverageMonthly Average
13,000
13,000
13,200
13,400
13,600
13,800
14,000
13,568
Rupiah/ USD
I II III IV I II III IV
2016 2017
In 2017, the rupiah charted a stable course with low volatility. Supporting this was the fundamental factor of the balance of payments surplus, improving micro-conditions on the foreign exchange market, and Bank Indonesia policy that kept the exchange rate aligned with fundamentals, amid external risks that emerged during 2017. In general, the rupiah was supported by sustained capital inflows in line with positive perceptions of the economic outlook for Indonesia. The dynamics of 2017 were marked by an appreciating, relatively stable trend in the rupiah until the end of the third quarter. However, the rupiah weakened in the fourth quarter of 2017 in response to external factors, particularly the direction of monetary policy normalization in advanced nations and uncertainty over the direction of US economic policy.
Further support for stability in the rupiah came from structural improvements in the domestic foreign exchange (forex) market, with positive trends visible in the flow of funds from non-resident and resident forex market participants. This contributed to expanding volume on the domestic forex market, which was accompanied by an increasing proportion of derivative transactions. In other developments, the improving efficiency in forex transactions was seen in lower transaction costs in keeping with the greater equilibrium in the forex demand-supply structure.
The healthy course charted by the exchange rate was supported by a range of policies pursued by Bank Indonesia. Exchange rate policy was consistently directed at keeping movement in the rupiah in line with fundamentals, while promoting the operation of market mechanisms. In addition, exchange rate policy was supported by improvements to the forex market structure, including policies for implementing prudential principles in non-bank corporate external debt management, mandatory use of the rupiah in Indonesia, and policies to deepen the domestic financial market.
4.1. Dynamics of the Rupiah exchange Rate
The rupiah exchange rate remained generally stable in 2017 and was supported by improvement in the fundamentals of the Indonesian economy, despite some pressure from external factors in the final quarter of the year. The steady level of the exchange rate was closely linked to the positive performance of the Indonesia
balance of payments, which posted a surplus on the strength of brisk foreign capital inflows and a lower current account deficit. Capital inflows in Indonesia were stimulated not only by attractive yields, but also improvement in the nation’s economic outlook. On the external side, movement in the rupiah was affected by global dynamics throughout 2017, particularly factors driven by economic policy and political events in the United States and Europe. In general, external factors worked in favor of the rupiah exchange rate, although they did have a more adverse impact during the final quarter of 2017.
The year was marked by stable movement in the rupiah until near the end of the third quarter of 2017, followed by a depreciation through to the end of 2017 (Chart 4.1). The rupiah closed 2017 at a level of IDR13,568 to the US dollar, not markedly different from the position at the end of 2016 of IDR13,473 to the US dollar. Averaged over the year, the rupiah weakened fractionally by 0.6% to IDR13,385 to the US dollar in 2017 from IDR13,305 in 2016. The general stability of the rupiah was evidenced by the declining exchange rate volatility; this fell to 3.0% in 2017 from 8.4% in 2016. At this new level, rupiah volatility came in well below the 8.4% average for currencies of peer nations (Chart 4.2).
The largely stable trend in the rupiah exchange rate during 2017 highlights the importance of improved global investor confidence in the Indonesian economy. Stronger global investor confidence led to continued inflows of foreign capital into Indonesia, despite the emerging risk of global uncertainty. Improved confidence among
Chart 4.1. Rupiah Exchange Rate
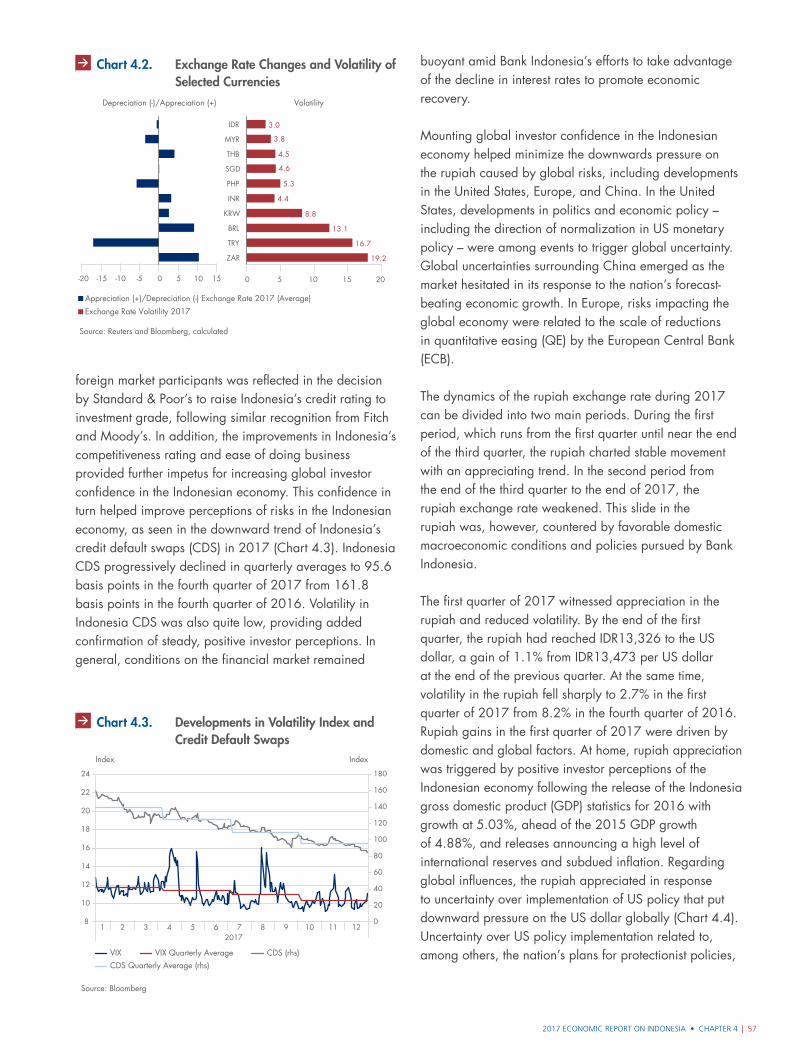
2017 ECONOMIC REPORT ON INDONESIA • CHAPTER 4 | 57
Grafik 4.2. Perbandingan Nilai Tukar Rupiah
Source: Reuters and Bloomberg, calculated
Appreciation (+)/Depreciation (-) Exchange Rate 2017 (Average)
Exchange Rate Volatility 2017
19.2
16.7
13.1
8.8
4.4
5.3
4.6
4.5
3.8
3.0
0 5 10 15 20
ZAR
TRY
BRL
KRW
INR
PHP
SGD
THB
MYR
IDR
-20 -15 -10 -5 0 5 10 15
Depreciation (-)/Appreciation (+) Volatility
foreign market participants was reflected in the decision by Standard & Poor’s to raise Indonesia’s credit rating to investment grade, following similar recognition from Fitch and Moody’s. In addition, the improvements in Indonesia’s competitiveness rating and ease of doing business provided further impetus for increasing global investor confidence in the Indonesian economy. This confidence in turn helped improve perceptions of risks in the Indonesian economy, as seen in the downward trend of Indonesia’s credit default swaps (CDS) in 2017 (Chart 4.3). Indonesia CDS progressively declined in quarterly averages to 95.6 basis points in the fourth quarter of 2017 from 161.8 basis points in the fourth quarter of 2016. Volatility in Indonesia CDS was also quite low, providing added confirmation of steady, positive investor perceptions. In general, conditions on the financial market remained
buoyant amid Bank Indonesia’s efforts to take advantage of the decline in interest rates to promote economic recovery.
Mounting global investor confidence in the Indonesian economy helped minimize the downwards pressure on the rupiah caused by global risks, including developments in the United States, Europe, and China. In the United States, developments in politics and economic policy – including the direction of normalization in US monetary policy – were among events to trigger global uncertainty. Global uncertainties surrounding China emerged as the market hesitated in its response to the nation’s forecast-beating economic growth. In Europe, risks impacting the global economy were related to the scale of reductions in quantitative easing (QE) by the European Central Bank (ECB).
The dynamics of the rupiah exchange rate during 2017 can be divided into two main periods. During the first period, which runs from the first quarter until near the end of the third quarter, the rupiah charted stable movement with an appreciating trend. In the second period from the end of the third quarter to the end of 2017, the rupiah exchange rate weakened. This slide in the rupiah was, however, countered by favorable domestic macroeconomic conditions and policies pursued by Bank Indonesia.
The first quarter of 2017 witnessed appreciation in the rupiah and reduced volatility. By the end of the first quarter, the rupiah had reached IDR13,326 to the US dollar, a gain of 1.1% from IDR13,473 per US dollar at the end of the previous quarter. At the same time, volatility in the rupiah fell sharply to 2.7% in the first quarter of 2017 from 8.2% in the fourth quarter of 2016. Rupiah gains in the first quarter of 2017 were driven by domestic and global factors. At home, rupiah appreciation was triggered by positive investor perceptions of the Indonesian economy following the release of the Indonesia gross domestic product (GDP) statistics for 2016 with growth at 5.03%, ahead of the 2015 GDP growth of 4.88%, and releases announcing a high level of international reserves and subdued inflation. Regarding global influences, the rupiah appreciated in response to uncertainty over implementation of US policy that put downward pressure on the US dollar globally (Chart 4.4). Uncertainty over US policy implementation related to, among others, the nation’s plans for protectionist policies,
Chart 4.2. Exchange Rate Changes and Volatility of Selected Currencies
Source: Bloomberg
Grafik 4.3. Perkembangan VIX dan CDS
VIX VIX Quarterly Average CDS (rhs)
Index Index
0
20
40
60
80
100
120
140
160
180
8
10
12
14
16
18
20
22
24
1 2 3 42017
5 6 7 8 9 10 11 12
CDS Quarterly Average (rhs)
Chart 4.3. Developments in Volatility Index and Credit Default Swaps
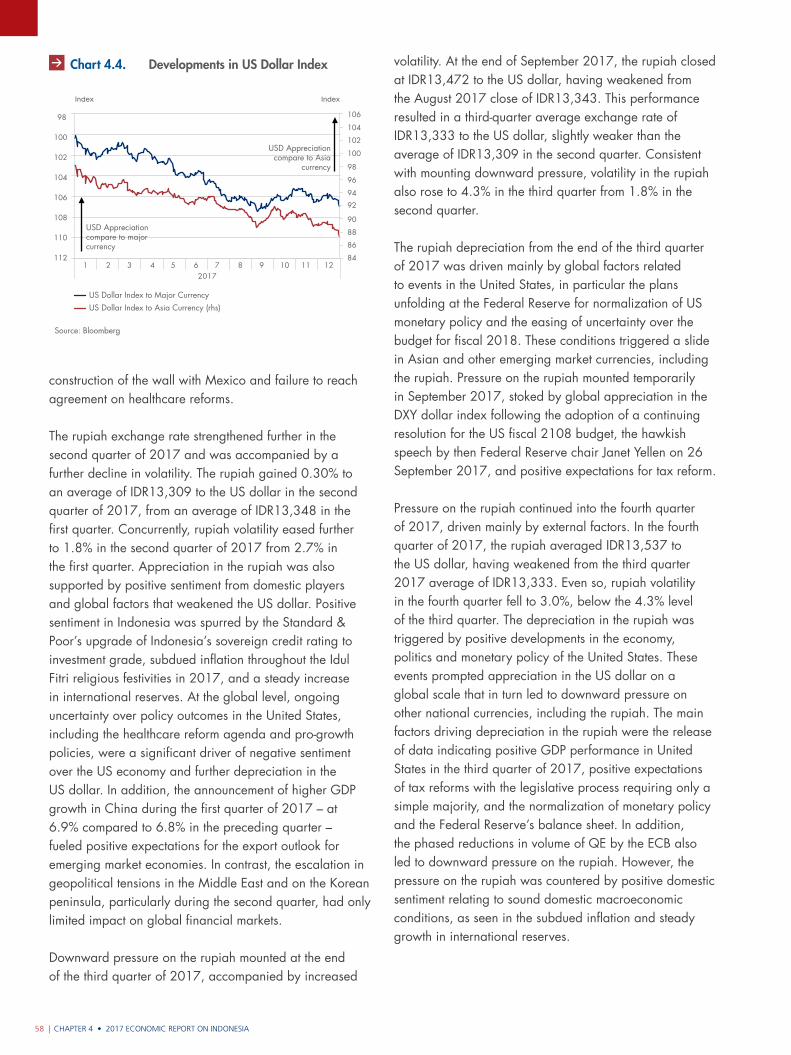
CHAPTER 4 • 2017 ECONOMIC REPORT ON INDONESIA58 |
construction of the wall with Mexico and failure to reach agreement on healthcare reforms.
The rupiah exchange rate strengthened further in the second quarter of 2017 and was accompanied by a further decline in volatility. The rupiah gained 0.30% to an average of IDR13,309 to the US dollar in the second quarter of 2017, from an average of IDR13,348 in the first quarter. Concurrently, rupiah volatility eased further to 1.8% in the second quarter of 2017 from 2.7% in the first quarter. Appreciation in the rupiah was also supported by positive sentiment from domestic players and global factors that weakened the US dollar. Positive sentiment in Indonesia was spurred by the Standard & Poor’s upgrade of Indonesia’s sovereign credit rating to investment grade, subdued inflation throughout the Idul Fitri religious festivities in 2017, and a steady increase in international reserves. At the global level, ongoing uncertainty over policy outcomes in the United States, including the healthcare reform agenda and pro-growth policies, were a significant driver of negative sentiment over the US economy and further depreciation in the US dollar. In addition, the announcement of higher GDP growth in China during the first quarter of 2017 – at 6.9% compared to 6.8% in the preceding quarter – fueled positive expectations for the export outlook for emerging market economies. In contrast, the escalation in geopolitical tensions in the Middle East and on the Korean peninsula, particularly during the second quarter, had only limited impact on global financial markets.
Downward pressure on the rupiah mounted at the end of the third quarter of 2017, accompanied by increased
volatility. At the end of September 2017, the rupiah closed at IDR13,472 to the US dollar, having weakened from the August 2017 close of IDR13,343. This performance resulted in a third-quarter average exchange rate of IDR13,333 to the US dollar, slightly weaker than the average of IDR13,309 in the second quarter. Consistent with mounting downward pressure, volatility in the rupiah also rose to 4.3% in the third quarter from 1.8% in the second quarter.
The rupiah depreciation from the end of the third quarter of 2017 was driven mainly by global factors related to events in the United States, in particular the plans unfolding at the Federal Reserve for normalization of US monetary policy and the easing of uncertainty over the budget for fiscal 2018. These conditions triggered a slide in Asian and other emerging market currencies, including the rupiah. Pressure on the rupiah mounted temporarily in September 2017, stoked by global appreciation in the DXY dollar index following the adoption of a continuing resolution for the US fiscal 2108 budget, the hawkish speech by then Federal Reserve chair Janet Yellen on 26 September 2017, and positive expectations for tax reform.
Pressure on the rupiah continued into the fourth quarter of 2017, driven mainly by external factors. In the fourth quarter of 2017, the rupiah averaged IDR13,537 to the US dollar, having weakened from the third quarter 2017 average of IDR13,333. Even so, rupiah volatility in the fourth quarter fell to 3.0%, below the 4.3% level of the third quarter. The depreciation in the rupiah was triggered by positive developments in the economy, politics and monetary policy of the United States. These events prompted appreciation in the US dollar on a global scale that in turn led to downward pressure on other national currencies, including the rupiah. The main factors driving depreciation in the rupiah were the release of data indicating positive GDP performance in United States in the third quarter of 2017, positive expectations of tax reforms with the legislative process requiring only a simple majority, and the normalization of monetary policy and the Federal Reserve’s balance sheet. In addition, the phased reductions in volume of QE by the ECB also led to downward pressure on the rupiah. However, the pressure on the rupiah was countered by positive domestic sentiment relating to sound domestic macroeconomic conditions, as seen in the subdued inflation and steady growth in international reserves.
Source: Bloomberg
Grafik 4.4. Perkembangan Indeks Dolar
US Dollar Index to Major CurrencyUS Dollar Index to Asia Currency (rhs)
Index Index
98
100
102
104
106
108
110
112 84
86
88
90
92
94
96
98
100
102
104
106
USD Appreciation compare to Asia
currency
USD Appreciation compare to major currency
20171 2 3 4 5 6 7 8 9 10 11 12
Chart 4.4. Developments in US Dollar Index
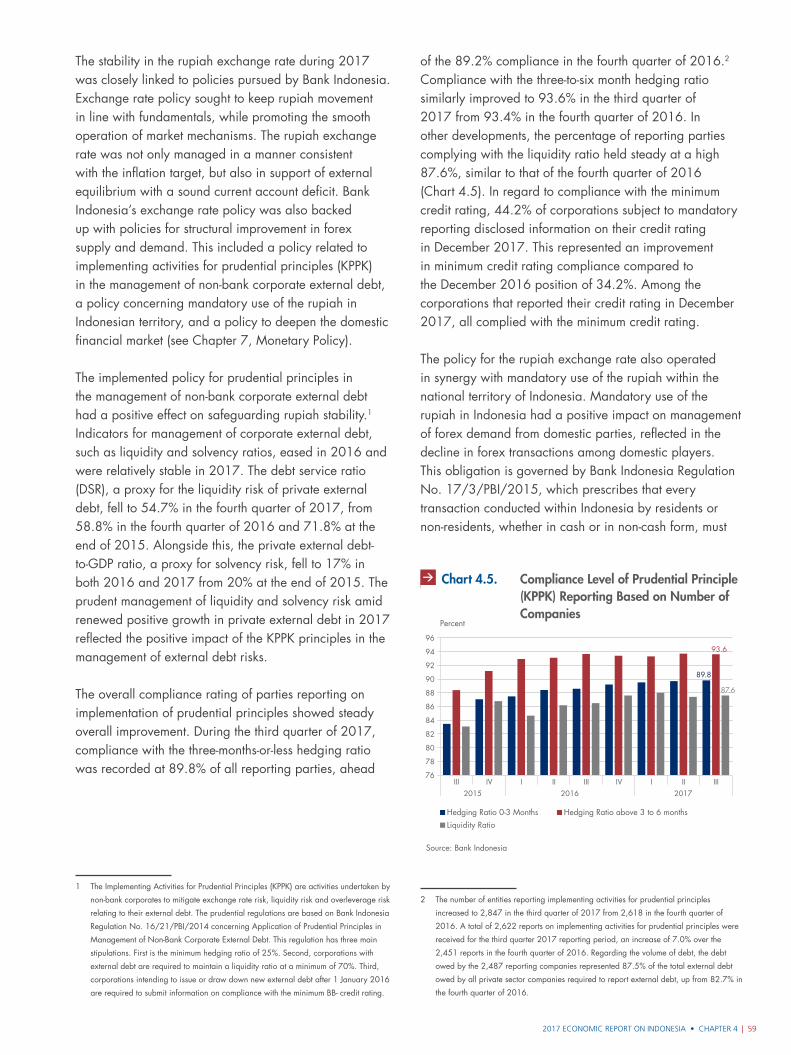
2017 ECONOMIC REPORT ON INDONESIA • CHAPTER 4 | 59
The stability in the rupiah exchange rate during 2017 was closely linked to policies pursued by Bank Indonesia. Exchange rate policy sought to keep rupiah movement in line with fundamentals, while promoting the smooth operation of market mechanisms. The rupiah exchange rate was not only managed in a manner consistent with the inflation target, but also in support of external equilibrium with a sound current account deficit. Bank Indonesia’s exchange rate policy was also backed up with policies for structural improvement in forex supply and demand. This included a policy related to implementing activities for prudential principles (KPPK) in the management of non-bank corporate external debt, a policy concerning mandatory use of the rupiah in Indonesian territory, and a policy to deepen the domestic financial market (see Chapter 7, Monetary Policy).
The implemented policy for prudential principles in the management of non-bank corporate external debt had a positive effect on safeguarding rupiah stability.1 Indicators for management of corporate external debt, such as liquidity and solvency ratios, eased in 2016 and were relatively stable in 2017. The debt service ratio (DSR), a proxy for the liquidity risk of private external debt, fell to 54.7% in the fourth quarter of 2017, from 58.8% in the fourth quarter of 2016 and 71.8% at the end of 2015. Alongside this, the private external debt-to-GDP ratio, a proxy for solvency risk, fell to 17% in both 2016 and 2017 from 20% at the end of 2015. The prudent management of liquidity and solvency risk amid renewed positive growth in private external debt in 2017 reflected the positive impact of the KPPK principles in the management of external debt risks.
The overall compliance rating of parties reporting on implementation of prudential principles showed steady overall improvement. During the third quarter of 2017, compliance with the three-months-or-less hedging ratio was recorded at 89.8% of all reporting parties, ahead
1 The Implementing Activities for Prudential Principles (KPPK) are activities undertaken by
non-bank corporates to mitigate exchange rate risk, liquidity risk and overleverage risk
relating to their external debt. The prudential regulations are based on Bank Indonesia
Regulation No. 16/21/PBI/2014 concerning Application of Prudential Principles in
Management of Non-Bank Corporate External Debt. This regulation has three main
stipulations. First is the minimum hedging ratio of 25%. Second, corporations with
external debt are required to maintain a liquidity ratio at a minimum of 70%. Third,
corporations intending to issue or draw down new external debt after 1 January 2016
are required to submit information on compliance with the minimum BB- credit rating.
of the 89.2% compliance in the fourth quarter of 2016.2 Compliance with the three-to-six month hedging ratio similarly improved to 93.6% in the third quarter of 2017 from 93.4% in the fourth quarter of 2016. In other developments, the percentage of reporting parties complying with the liquidity ratio held steady at a high 87.6%, similar to that of the fourth quarter of 2016 (Chart 4.5). In regard to compliance with the minimum credit rating, 44.2% of corporations subject to mandatory reporting disclosed information on their credit rating in December 2017. This represented an improvement in minimum credit rating compliance compared to the December 2016 position of 34.2%. Among the corporations that reported their credit rating in December 2017, all complied with the minimum credit rating.
The policy for the rupiah exchange rate also operated in synergy with mandatory use of the rupiah within the national territory of Indonesia. Mandatory use of the rupiah in Indonesia had a positive impact on management of forex demand from domestic parties, reflected in the decline in forex transactions among domestic players. This obligation is governed by Bank Indonesia Regulation No. 17/3/PBI/2015, which prescribes that every transaction conducted within Indonesia by residents or non-residents, whether in cash or in non-cash form, must
2 The number of entities reporting implementing activities for prudential principles
increased to 2,847 in the third quarter of 2017 from 2,618 in the fourth quarter of
2016. A total of 2,622 reports on implementing activities for prudential principles were
received for the third quarter 2017 reporting period, an increase of 7.0% over the
2,451 reports in the fourth quarter of 2016. Regarding the volume of debt, the debt
owed by the 2,487 reporting companies represented 87.5% of the total external debt
owed by all private sector companies required to report external debt, up from 82.7% in
the fourth quarter of 2016.
Grafik 4.5. Rasio Kepatuhan Pelaporan KPPK
Source: Bank Indonesia
Percent
Hedging Ratio 0-3 MonthsLiquidity Ratio
Hedging Ratio above 3 to 6 months
89.8
93.6
87.6
76
78
80
82
84
86
88
90
92
94
96
2015 2016 2017III IV I II III IV I II III
Chart 4.5. Compliance Level of Prudential Principle (KPPK) Reporting Based on Number of Companies
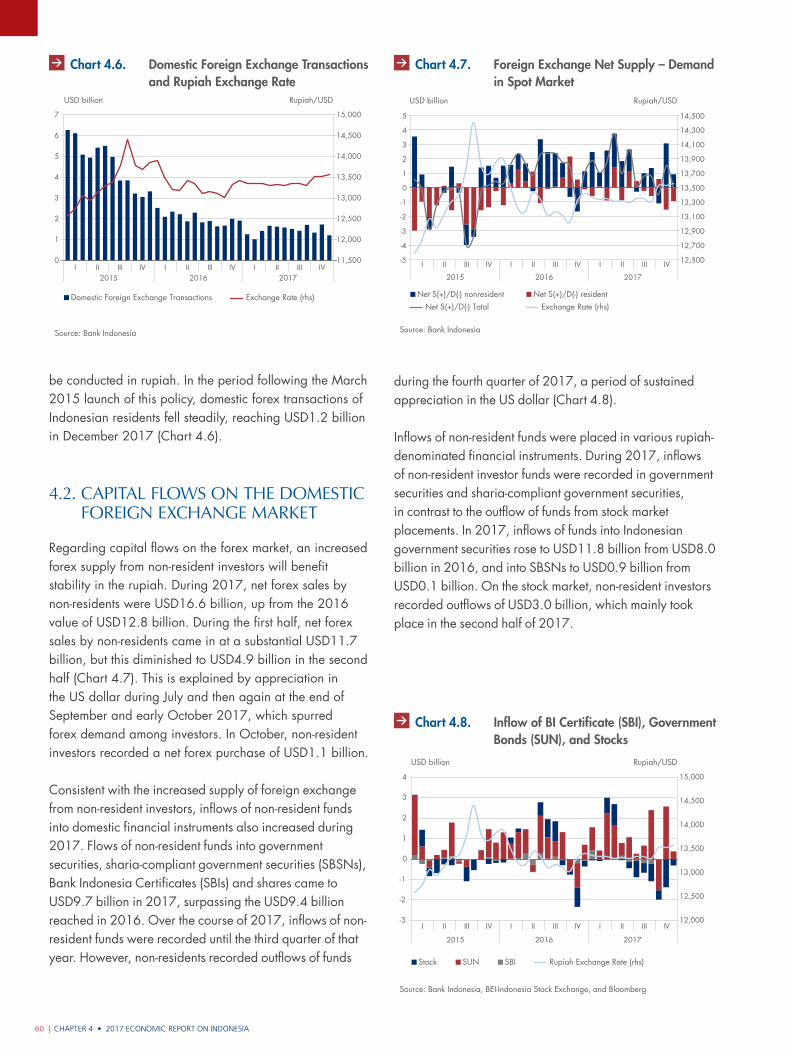
CHAPTER 4 • 2017 ECONOMIC REPORT ON INDONESIA60 |
be conducted in rupiah. In the period following the March 2015 launch of this policy, domestic forex transactions of Indonesian residents fell steadily, reaching USD1.2 billion in December 2017 (Chart 4.6).
4.2. capital flows on the Domestic foReign exchange maRket
Regarding capital flows on the forex market, an increased forex supply from non-resident investors will benefit stability in the rupiah. During 2017, net forex sales by non-residents were USD16.6 billion, up from the 2016 value of USD12.8 billion. During the first half, net forex sales by non-residents came in at a substantial USD11.7 billion, but this diminished to USD4.9 billion in the second half (Chart 4.7). This is explained by appreciation in the US dollar during July and then again at the end of September and early October 2017, which spurred forex demand among investors. In October, non-resident investors recorded a net forex purchase of USD1.1 billion.
Consistent with the increased supply of foreign exchange from non-resident investors, inflows of non-resident funds into domestic financial instruments also increased during 2017. Flows of non-resident funds into government securities, sharia-compliant government securities (SBSNs), Bank Indonesia Certificates (SBIs) and shares came to USD9.7 billion in 2017, surpassing the USD9.4 billion reached in 2016. Over the course of 2017, inflows of non-resident funds were recorded until the third quarter of that year. However, non-residents recorded outflows of funds
during the fourth quarter of 2017, a period of sustained appreciation in the US dollar (Chart 4.8).
Inflows of non-resident funds were placed in various rupiah-denominated financial instruments. During 2017, inflows of non-resident investor funds were recorded in government securities and sharia-compliant government securities, in contrast to the outflow of funds from stock market placements. In 2017, inflows of funds into Indonesian government securities rose to USD11.8 billion from USD8.0 billion in 2016, and into SBSNs to USD0.9 billion from USD0.1 billion. On the stock market, non-resident investors recorded outflows of USD3.0 billion, which mainly took place in the second half of 2017.
Grafik 4.8. Permintaan – Penawaran Neto Valas di
Source: Bank Indonesia
USD billion
Net S(+)/D(-) nonresident Net S(+)/D(-) residentNet S(+)/D(-) Total Exchange Rate (rhs)
Rupiah/USD
12,500
12,700
12,900
13,100
13,300
13,500
13,700
13,900
14,100
14,300
14,500
-5
-4
-3
-2
-1
0
1
2
3
4
5
2015 2016 2017
I II III IV I II III IV I II III IV
Chart 4.7. Foreign Exchange Net Supply – Demand in Spot Market
Grafik 4.6. Transaksi Valas Domestik dan Nilai Tukar
Source: Bank Indonesia
USD billion
Domestic Foreign Exchange Transactions Exchange Rate (rhs)
Rupiah/USD
2015 2016 2017
11,500
12,000
12,500
13,000
13,500
14,000
14,500
15,000
0
1
2
3
4
5
6
7
I II III IV I II III IV I II III IV
Chart 4.6. Domestic Foreign Exchange Transactions and Rupiah Exchange Rate
Grafik 4.8. Aliran Dana Masuk SBI , SUN, dan Saham
Source: Bank Indonesia, BEI-Indonesia Stock Exchange, and Bloomberg
Stock SBISUN Rupiah Exchange Rate (rhs)
USD billion Rupiah/USD
12,000
12,500
13,000
13,500
14,000
14,500
15,000
-3
-2
-1
0
1
2
3
4
2015 2016 2017
I II III IV I II III IV I II III IV
Chart 4.8. Inflow of BI Certificate (SBI), Government Bonds (SUN), and Stocks
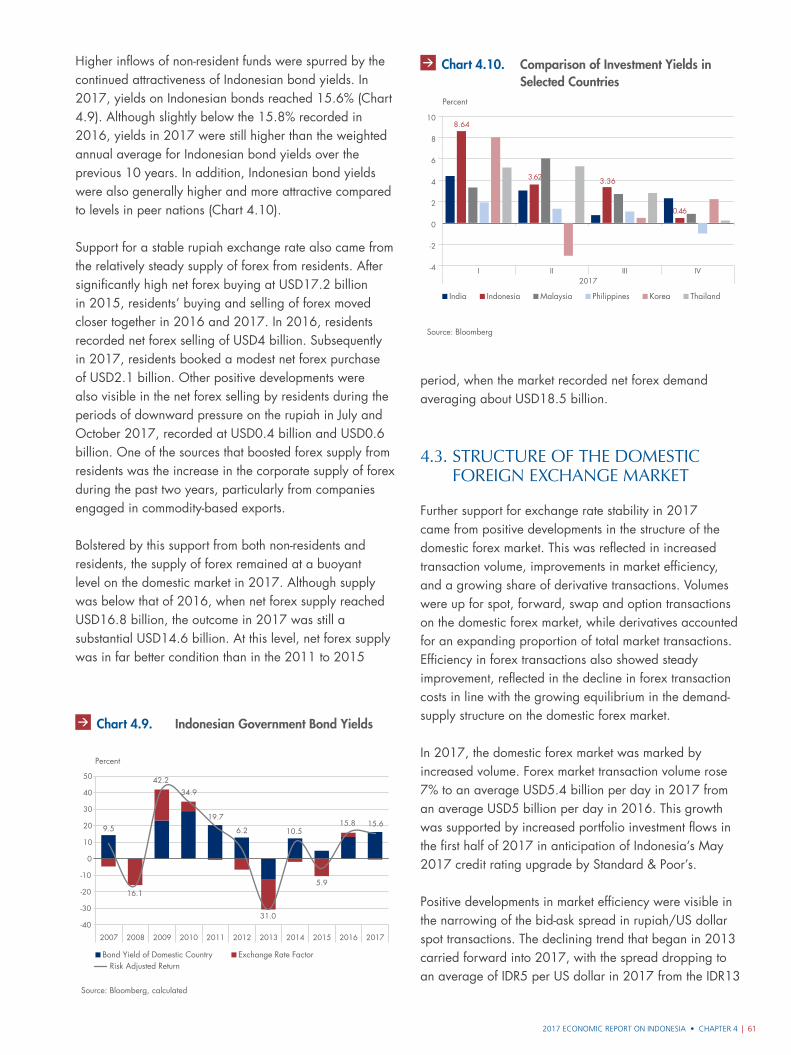
2017 ECONOMIC REPORT ON INDONESIA • CHAPTER 4 | 61
Grafik 4.9. Imbal Hasil Obligasi Negara IndonesIa
Source: Bloomberg, calculated
Percent
Bond Yield of Domestic Country Exchange Rate FactorRisk Adjusted Return
-40
-30
-20
-10
0
10
20
30
40
50
2007 2008 2009 2010 2011 2012 2013 2014 2015 2016 2017
9.5
16.1
42.2
34.9
19.7
6.2
31.0
10.5
5.9
15.8 15.6
Chart 4.9. Indonesian Government Bond Yields
Higher inflows of non-resident funds were spurred by the continued attractiveness of Indonesian bond yields. In 2017, yields on Indonesian bonds reached 15.6% (Chart 4.9). Although slightly below the 15.8% recorded in 2016, yields in 2017 were still higher than the weighted annual average for Indonesian bond yields over the previous 10 years. In addition, Indonesian bond yields were also generally higher and more attractive compared to levels in peer nations (Chart 4.10).
Support for a stable rupiah exchange rate also came from the relatively steady supply of forex from residents. After significantly high net forex buying at USD17.2 billion in 2015, residents’ buying and selling of forex moved closer together in 2016 and 2017. In 2016, residents recorded net forex selling of USD4 billion. Subsequently in 2017, residents booked a modest net forex purchase of USD2.1 billion. Other positive developments were also visible in the net forex selling by residents during the periods of downward pressure on the rupiah in July and October 2017, recorded at USD0.4 billion and USD0.6 billion. One of the sources that boosted forex supply from residents was the increase in the corporate supply of forex during the past two years, particularly from companies engaged in commodity-based exports.
Bolstered by this support from both non-residents and residents, the supply of forex remained at a buoyant level on the domestic market in 2017. Although supply was below that of 2016, when net forex supply reached USD16.8 billion, the outcome in 2017 was still a substantial USD14.6 billion. At this level, net forex supply was in far better condition than in the 2011 to 2015
Grafik 4.10. Perbandingan Imbal Hasil Investasi
Source: Bloomberg
Percent
India MalaysiaIndonesia Philippines ThailandKorea
-4
-2
0
2
4
6
8
108.64
3.62 3.36
0.46
I II III IV2017
Chart 4.10. Comparison of Investment Yields in Selected Countries
period, when the market recorded net forex demand averaging about USD18.5 billion.
4.3. stRuctuRe of the Domestic foReign exchange maRket
Further support for exchange rate stability in 2017 came from positive developments in the structure of the domestic forex market. This was reflected in increased transaction volume, improvements in market efficiency, and a growing share of derivative transactions. Volumes were up for spot, forward, swap and option transactions on the domestic forex market, while derivatives accounted for an expanding proportion of total market transactions. Efficiency in forex transactions also showed steady improvement, reflected in the decline in forex transaction costs in line with the growing equilibrium in the demand-supply structure on the domestic forex market.
In 2017, the domestic forex market was marked by increased volume. Forex market transaction volume rose 7% to an average USD5.4 billion per day in 2017 from an average USD5 billion per day in 2016. This growth was supported by increased portfolio investment flows in the first half of 2017 in anticipation of Indonesia’s May 2017 credit rating upgrade by Standard & Poor’s.
Positive developments in market efficiency were visible in the narrowing of the bid-ask spread in rupiah/US dollar spot transactions. The declining trend that began in 2013 carried forward into 2017, with the spread dropping to an average of IDR5 per US dollar in 2017 from the IDR13
CHAPTER 4 • 2017 ECONOMIC REPORT ON INDONESIA62 |
Positive developments were also visible on the market for forward transactions. Daily average volume of forward transactions reached USD240 million, an increase of 4.1% over 2016 (Chart 4.14). The highest daily average transaction volumes were recorded by domestic players and particularly corporate customers, who were driven by the need to hedge forex exposures.
Developments on the swap market were also positive, although more limited growth was seen compared to the spot and forward markets. In 2017, the daily average volume of swap transactions reached USD1.7 billion, an increase of 4.1% (Chart 4.15). There was also significant growth in swap transactions conducted by domestic participants, especially in interbank trading, compared to the year before. Amid expectations of an increase in
Grafik 4.14. Perkembangan Volume Transaksi Forward
Source: Bank Indonesia
1 2 3 4 5 6 7 8 9 10 11 12 1 2 3 4 5 6 7 8 9 10 11 12
2016 2017
USD billion
Nonresident Resident
0
0.05
0.10
0.15
0.20
0.25
0.30
Chart 4.14. Forward Transaction Volume
Grafik 4.13. Perkembangan Volume Transaksi Spot
Source: Bank Indonesia
USD billion
1 2 3 4 5 6 7 8 9 10 11 12 1 2 3 4 5 6 7 8 9 10 11 12
2016 2017
0
0.5
1.0
1.5
2.0
2.5
3.0
3.5
4.0
4.5
Chart 4.13. Spot Transaction Volume
Grafik 4.12. Bid-Ask Spread Transaksi Spot USD/IDR
Source: Bank Indonesia
25
20
15
10
5
0
2013 2014 2015 2016 2017
Rupiah/USD
Chart 4.12. Bid-Ask Spread in US Dollar/Rupiah Spot Transactions
per US dollar average in 2016 (Chart 4.12). This bears testimony to the growing confidence of market participants in the liquidity of the domestic forex market, which in turn contributed to lower forex transaction costs.
Regarding the composition of forex transactions, growth took place in transactions of all types. In 2017, daily average transaction volume for spot deals was recorded at USD3.4 billion with growth at 7.8% (Chart 4.13). At this level, growth had begun to reach a stable range after improving slightly from the 7.2% growth recorded in 2016. The dominant periods of transactions were in the second and third quarters, commensurate with the inflows of portfolio investment from non-resident clients.
Grafik 4.11. Perkembangan Pasar Valas
Source: Bank Indonesia
Forward OptionSpot Swap
0
2
3
5
6
1 2 3 4 5 6 7 8 9 10 11 12 1 2 3 4 5 6 7 8 9 10 11 12
2016 2017
USD billion
Chart 4.11. Domestic Foreign Exchange Market
2017 ECONOMIC REPORT ON INDONESIA • CHAPTER 4 | 63
short-term US interest rates prompted by the monetary policy of the US Federal Reserve, interest among banks in conducting swap transactions to secure rupiah liquidity remained strong. This behavior became more visible early in the second half of 2017, when the exchange rate maintained a stable trend in the wake of two increases in the Federal Funds Rate in March and June 2017.
For options transactions, conditions were somewhat different. Daily average volume in option transactions reached USD20 million, relatively small in comparison with other transaction types (Chart 4.16). In terms of growth rates however, options transactions grew 40% in 2017, well ahead of growth rates of other types. This brisk growth was driven by domestic corporates, which
Source: Bank Indonesia
Grafik 4.16. Perkembangan Volume Transaksi Options
1 2 3 4 5 6 7 8 9 10 11 12 1 2 3 4 5 6 7 8 9 10 11 12
2016 2017
USD billion
0
0.005
0.010
0.015
0.020
0.025
0.030
0.035
Nonresident Resident
Chart 4.16. Options Transaction Volume
Grafik 4.15. Perkembangan Volume Transaksi Swap
Source: Bank Indonesia
1 2 3 4 5 6 7 8 9 10 11 12 1 2 3 4 5 6 7 8 9 10 11 12
2016 2017
USD billion
0
0.2
0.4
0.6
0.8
1.0
1.2
1.4
1.6
Nonresident Resident
Chart 4.15. Swap Transaction Volume began hedging by using call-spread options (CSO).3 The growing interest among domestic corporates is explained by the greater cost-efficiency when using CSO transactions in hedging compared to costs for conventional derivatives, such as forward transactions.
Taken together, derivative transactions accounted for a 38% share of total forex transactions, not greatly different from the proportion seen in 2016. This represents a heartening development consistent with the Bank Indonesia policy of mandatory hedging on external debt by non-bank corporates meeting certain criteria. Bank Indonesia also worked actively to encourage domestic corporates, and in particular state-owned enterprises, to make use of hedging. Support for this was provided in the completion of standard operating procedures for hedging by state-owned enterprises. This initiative did lead to an increase in hedging by state-owned enterprises that in turn contributed to a slight increase in the proportion of derivative transactions.
3 Call-spread options (CSO) are a combination of buying and selling call options that are
exercised simultaneously in a single transaction contract for the same amount, but at
different strike prices.

| 652017 ECONOMIC REPORT ON INDONESIA
CHAPTER 5
Consumer Price Index (CPI) inflation was kept under control in 2017 and remained within the target range of 4.0±1% for the third consecutive year. This achievement is supported by the consistency of Bank Indonesia’s monetary policy and its success in maintaining macroeconomic stability, as well as policy coordination with the Government.
Inflation
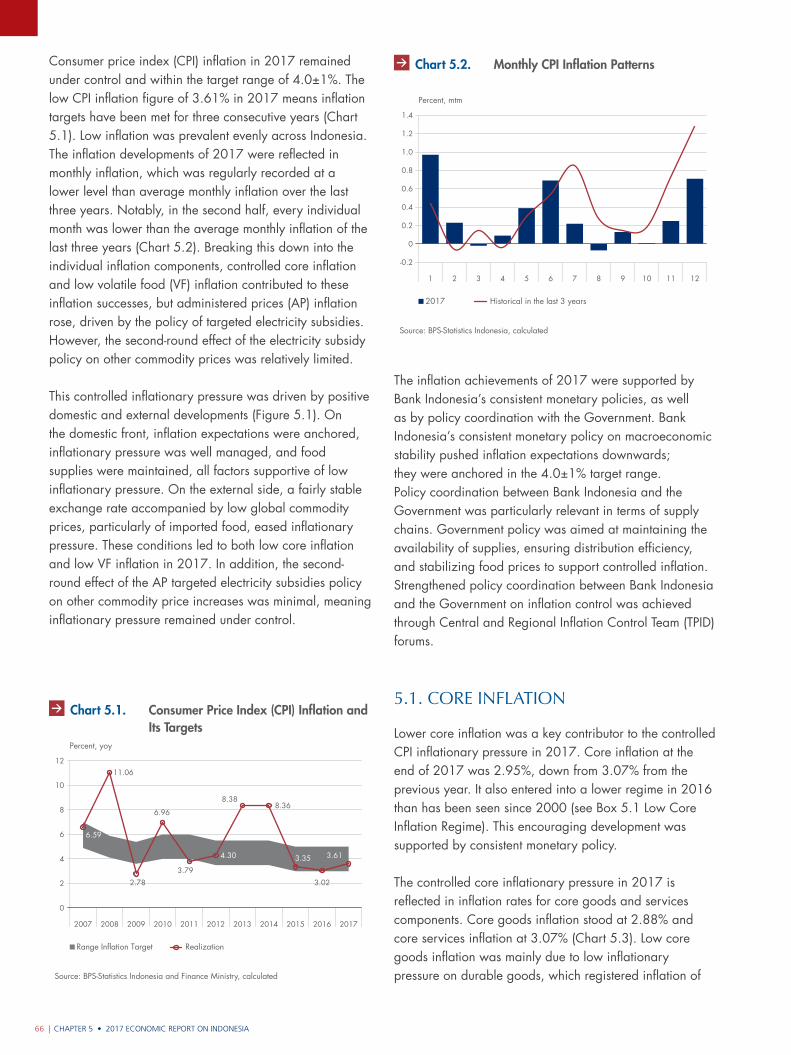
CHAPTER 5 • 2017 ECONOMIC REPORT ON INDONESIA66 |
2007 2008 2009 2010 2011 2012 2013 2014 2015 2016 2017
Source: BPS-Statistics Indonesia and Finance Ministry, calculated
Grafik 5.1. Realisasi Inflasi IHK dan Sasaran Inflasi
0
2
4
6
8
10
12
Range Inflation Target Realization
6.59
11.06
2.78
6.96
3.79
4.30
8.388.36
3.35
3.02
3.61
Percent, yoy
Source: BPS-Statistics Indonesia, calculated
Grafik 5.2. Pola Historis Inflasi IHK
-0.2
0.2
0
0.4
0.6
0.8
1.0
1.2
1.4
Percent, mtm
1 2 3 4 5 6 7 8 9 10 11 12
2017 Historical in the last 3 years
Consumer price index (CPI) inflation in 2017 remained under control and within the target range of 4.0±1%. The low CPI inflation figure of 3.61% in 2017 means inflation targets have been met for three consecutive years (Chart 5.1). Low inflation was prevalent evenly across Indonesia. The inflation developments of 2017 were reflected in monthly inflation, which was regularly recorded at a lower level than average monthly inflation over the last three years. Notably, in the second half, every individual month was lower than the average monthly inflation of the last three years (Chart 5.2). Breaking this down into the individual inflation components, controlled core inflation and low volatile food (VF) inflation contributed to these inflation successes, but administered prices (AP) inflation rose, driven by the policy of targeted electricity subsidies. However, the second-round effect of the electricity subsidy policy on other commodity prices was relatively limited.
This controlled inflationary pressure was driven by positive domestic and external developments (Figure 5.1). On the domestic front, inflation expectations were anchored, inflationary pressure was well managed, and food supplies were maintained, all factors supportive of low inflationary pressure. On the external side, a fairly stable exchange rate accompanied by low global commodity prices, particularly of imported food, eased inflationary pressure. These conditions led to both low core inflation and low VF inflation in 2017. In addition, the second-round effect of the AP targeted electricity subsidies policy on other commodity price increases was minimal, meaning inflationary pressure remained under control.
The inflation achievements of 2017 were supported by Bank Indonesia’s consistent monetary policies, as well as by policy coordination with the Government. Bank Indonesia’s consistent monetary policy on macroeconomic stability pushed inflation expectations downwards; they were anchored in the 4.0±1% target range. Policy coordination between Bank Indonesia and the Government was particularly relevant in terms of supply chains. Government policy was aimed at maintaining the availability of supplies, ensuring distribution efficiency, and stabilizing food prices to support controlled inflation. Strengthened policy coordination between Bank Indonesia and the Government on inflation control was achieved through Central and Regional Inflation Control Team (TPID) forums.
5.1. Core InflatIon
Lower core inflation was a key contributor to the controlled CPI inflationary pressure in 2017. Core inflation at the end of 2017 was 2.95%, down from 3.07% from the previous year. It also entered into a lower regime in 2016 than has been seen since 2000 (see Box 5.1 Low Core Inflation Regime). This encouraging development was supported by consistent monetary policy.
The controlled core inflationary pressure in 2017 is reflected in inflation rates for core goods and services components. Core goods inflation stood at 2.88% and core services inflation at 3.07% (Chart 5.3). Low core goods inflation was mainly due to low inflationary pressure on durable goods, which registered inflation of
Chart 5.1. Consumer Price Index (CPI) Inflation and Its Targets
Chart 5.2. Monthly CPI Inflation Patterns
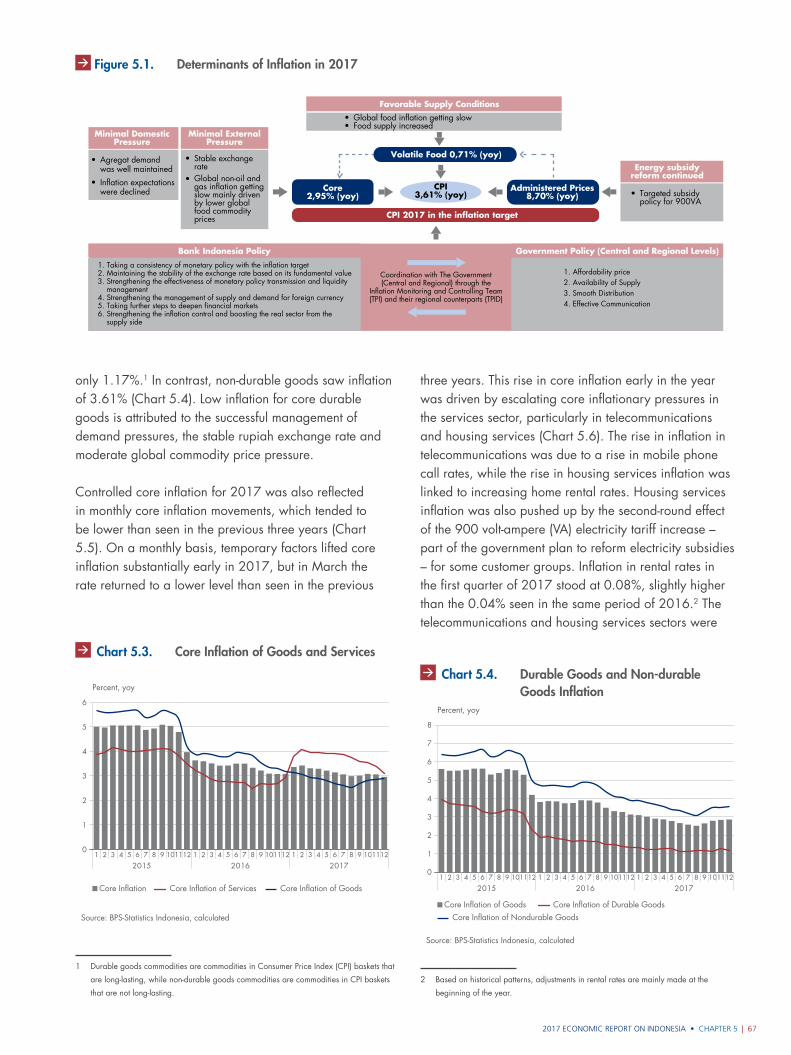
2017 ECONOMIC REPORT ON INDONESIA • CHAPTER 5 | 67
Gambar 5.1. Determinan Inflasi 2017
Global food inflation getting slowFood supply increased
••
Targeted subsidypolicy for 900VA
•
Agregat demandwas well maintained
•
Inflation expectationswere declined
•
Favorable Supply Conditions
Volatile Food 0,71% (yoy)
CPI3,61% (yoy)
Administered Prices8,70% (yoy)
CPI 2017 in the inflation target
Core2,95% (yoy)
Energy subsidyreform continued
Minimal DomesticPressure
1. Taking a consistency of monetary policy with the inflation target2. Maintaining the stability of the exchange rate based on its fundamental value3. Strengthening the effectiveness of monetary policy transmission and liquidity management4. Strengthening the management of supply and demand for foreign currency5. Taking further steps to deepen financial markets6. Strengthening the inflation control and boosting the real sector from the supply side
Stable exchangerate
•
Global non-oil and gas inflation getting slow mainly driven by lower global food commodity prices
•
Minimal ExternalPressure
Bank Indonesia Policy Government Policy (Central and Regional Levels)
1. Affordability price2. Availability of Supply3. Smooth Distribution4. Effective Communication
Coordination with The Government (Central and Regional) through the
Inflation Monitoring and Controlling Team (TPI) and their regional counterparts (TPID)
only 1.17%.1 In contrast, non-durable goods saw inflation of 3.61% (Chart 5.4). Low inflation for core durable goods is attributed to the successful management of demand pressures, the stable rupiah exchange rate and moderate global commodity price pressure.
Controlled core inflation for 2017 was also reflected in monthly core inflation movements, which tended to be lower than seen in the previous three years (Chart 5.5). On a monthly basis, temporary factors lifted core inflation substantially early in 2017, but in March the rate returned to a lower level than seen in the previous
1 Durable goods commodities are commodities in Consumer Price Index (CPI) baskets that
are long-lasting, while non-durable goods commodities are commodities in CPI baskets
that are not long-lasting.
three years. This rise in core inflation early in the year was driven by escalating core inflationary pressures in the services sector, particularly in telecommunications and housing services (Chart 5.6). The rise in inflation in telecommunications was due to a rise in mobile phone call rates, while the rise in housing services inflation was linked to increasing home rental rates. Housing services inflation was also pushed up by the second-round effect of the 900 volt-ampere (VA) electricity tariff increase – part of the government plan to reform electricity subsidies – for some customer groups. Inflation in rental rates in the first quarter of 2017 stood at 0.08%, slightly higher than the 0.04% seen in the same period of 2016.2 The telecommunications and housing services sectors were
2 Based on historical patterns, adjustments in rental rates are mainly made at the
beginning of the year.
Figure 5.1. Determinants of Inflation in 2017
Source: BPS-Statistics Indonesia, calculated
Grafik 5.3. Inflasi Inti Barang Dan Inflasi Inti Jasa
Core Inflation Core Inflation of Services Core Inflation of Goods
1 2 3 4
20155 9 1011126 7 8 1 2 3 4
20165 9 1011126 7 8 1 2 3 4
20175 9 1011126 7 8
0
1
2
3
4
5
6
Percent, yoy
Chart 5.3. Core Inflation of Goods and Services
Source: BPS-Statistics Indonesia, calculated
Grafik 5.4. Inflasi inti Durable Gooddan Non Durable Good
Core Inflation of Goods Core Inflation of Durable Goods
1 2 3 4
20155 9 1011126 7 8 1 2 3 4
20165 9 1011126 7 8 1 2 3 4
20175 9 1011126 7 8
0
1
2
3
4
5
6
7
8
Percent, yoy
Core Inflation of Nondurable Goods
Chart 5.4. Durable Goods and Non-durable Goods Inflation
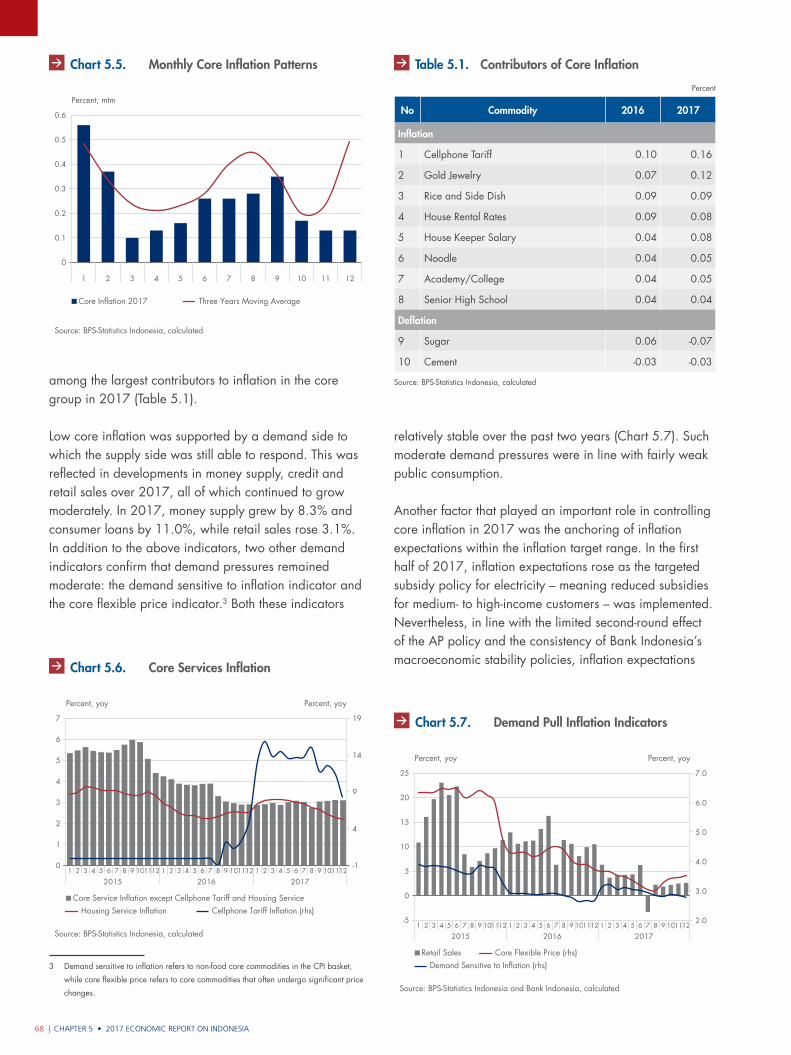
CHAPTER 5 • 2017 ECONOMIC REPORT ON INDONESIA68 |
relatively stable over the past two years (Chart 5.7). Such moderate demand pressures were in line with fairly weak public consumption.
Another factor that played an important role in controlling core inflation in 2017 was the anchoring of inflation expectations within the inflation target range. In the first half of 2017, inflation expectations rose as the targeted subsidy policy for electricity – meaning reduced subsidies for medium- to high-income customers – was implemented. Nevertheless, in line with the limited second-round effect of the AP policy and the consistency of Bank Indonesia’s macroeconomic stability policies, inflation expectations
Source: BPS-Statistics Indonesia and Bank Indonesia, calculated
Grafik 5.8. Indikator Tekanan Permintaan
-5
0
5
10
15
20
25
Percent, yoy Percent, yoy
1 2 3 4
20155 9 1011126 7 8 1 2 3 4
20165 9 1011126 7 8 1 2 3 4
20175 9 1011126 7 8
Retail Sales Core Flexible Price (rhs)Demand Sensitive to Inflation (rhs)
2.0
3.0
4.0
5.0
6.0
7.0
Chart 5.7. Demand Pull Inflation Indicators
among the largest contributors to inflation in the core group in 2017 (Table 5.1).
Low core inflation was supported by a demand side to which the supply side was still able to respond. This was reflected in developments in money supply, credit and retail sales over 2017, all of which continued to grow moderately. In 2017, money supply grew by 8.3% and consumer loans by 11.0%, while retail sales rose 3.1%. In addition to the above indicators, two other demand indicators confirm that demand pressures remained moderate: the demand sensitive to inflation indicator and the core flexible price indicator.3 Both these indicators
3 Demand sensitive to inflation refers to non-food core commodities in the CPI basket,
while core flexible price refers to core commodities that often undergo significant price
changes.
No Commodity 2016 2017
Inflation
1 Cellphone Tariff 0.10 0.16
2 Gold Jewelry 0.07 0.12
3 Rice and Side Dish 0.09 0.09
4 House Rental Rates 0.09 0.08
5 House Keeper Salary 0.04 0.08
6 Noodle 0.04 0.05
7 Academy/College 0.04 0.05
8 Senior High School 0.04 0.04
Deflation
9 Sugar 0.06 -0.07
10 Cement -0.03 -0.03
Source: BPS-Statistics Indonesia, calculated
Table 5.1. Contributors of Core Inflation
1 2 3 4
20155 9 1011126 7 8 1 2 3 4
20165 9 1011126 7 8 1 2 3 4
20175 9 1011126 7 8
Source: BPS-Statistics Indonesia, calculated
Grafik 5.6. Inflasi Inti Jasa
0
1
2
3
4
5
6
7
-1
4
9
14
19
Percent, yoy Percent, yoy
Core Service Inflation except Cellphone Tariff and Housing ServiceHousing Service Inflation Cellphone Tariff Inflation (rhs)
Chart 5.6. Core Services Inflation
Sumber: BPS, diolah
Grafik 5.5. Pola Historis Inflasi Inti Bulanan
0
0,1
0,2
0,3
0,4
0,5
0,6
Persen, mtm
2017 Historis 3 tahun terakhir
1 2 3 4 5 6 7 8 9 10 11 12
Source: BPS-Statistics Indonesia, calculated
Grafik 5.5. Pola Historis Inflasi Inti Bulanan
0
0.1
0.2
0.3
0.4
0.5
0.6
Percent, mtm
Core Inflation 2017 Three Years Moving Average
1 2 3 4 5 6 7 8 9 10 11 12
Chart 5.5. Monthly Core Inflation Patterns
Percent
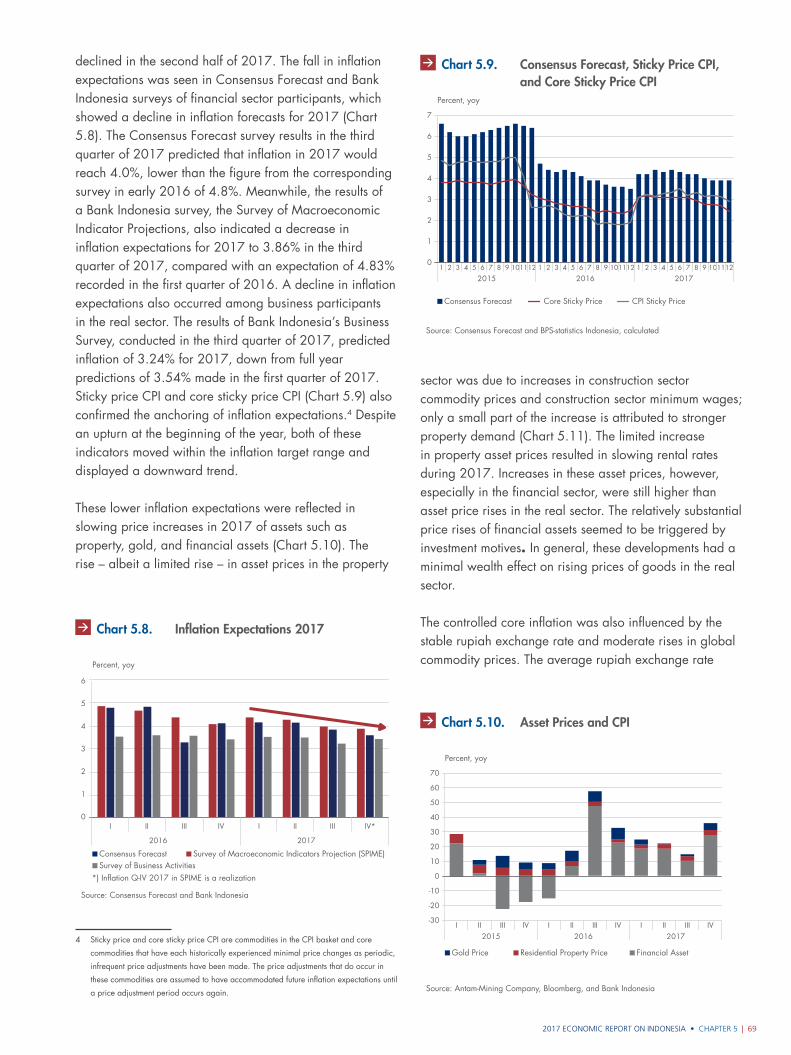
2017 ECONOMIC REPORT ON INDONESIA • CHAPTER 5 | 69
declined in the second half of 2017. The fall in inflation expectations was seen in Consensus Forecast and Bank Indonesia surveys of financial sector participants, which showed a decline in inflation forecasts for 2017 (Chart 5.8). The Consensus Forecast survey results in the third quarter of 2017 predicted that inflation in 2017 would reach 4.0%, lower than the figure from the corresponding survey in early 2016 of 4.8%. Meanwhile, the results of a Bank Indonesia survey, the Survey of Macroeconomic Indicator Projections, also indicated a decrease in inflation expectations for 2017 to 3.86% in the third quarter of 2017, compared with an expectation of 4.83% recorded in the first quarter of 2016. A decline in inflation expectations also occurred among business participants in the real sector. The results of Bank Indonesia’s Business Survey, conducted in the third quarter of 2017, predicted inflation of 3.24% for 2017, down from full year predictions of 3.54% made in the first quarter of 2017. Sticky price CPI and core sticky price CPI (Chart 5.9) also confirmed the anchoring of inflation expectations.4 Despite an upturn at the beginning of the year, both of these indicators moved within the inflation target range and displayed a downward trend.
These lower inflation expectations were reflected in slowing price increases in 2017 of assets such as property, gold, and financial assets (Chart 5.10). The rise – albeit a limited rise – in asset prices in the property
4 Sticky price and core sticky price CPI are commodities in the CPI basket and core
commodities that have each historically experienced minimal price changes as periodic,
infrequent price adjustments have been made. The price adjustments that do occur in
these commodities are assumed to have accommodated future inflation expectations until
a price adjustment period occurs again.
sector was due to increases in construction sector commodity prices and construction sector minimum wages; only a small part of the increase is attributed to stronger property demand (Chart 5.11). The limited increase in property asset prices resulted in slowing rental rates during 2017. Increases in these asset prices, however, especially in the financial sector, were still higher than asset price rises in the real sector. The relatively substantial price rises of financial assets seemed to be triggered by investment motives. In general, these developments had a minimal wealth effect on rising prices of goods in the real sector.
The controlled core inflation was also influenced by the stable rupiah exchange rate and moderate rises in global commodity prices. The average rupiah exchange rate
Source: Consensus Forecast and Bank Indonesia
Grafik 5.9. Ekspektasi Inflasi 2017
Percent, yoy
0
1
2
3
4
5
6
I II III IV I II III IV*
2016 2017
Consensus Forecast Survey of Macroeconomic Indicators Projection (SPIME)Survey of Business Activities
*) Inflation Q-IV 2017 in SPIME is a realization
Chart 5.8. Inflation Expectations 2017
1 2 3 4
20155 9 1011126 7 8 1 2 3 4
20165 9 1011126 7 8 1 2 3 4
20175 9 1011126 7 8
Source: Consensus Forecast and BPS-statistics Indonesia, calculated
Grafik 5.12. Consensus Forecast, IHK Sticky Pricedan Inti Sticky Price
0
1
2
3
4
5
6
7
Percent, yoy
Consensus Forecast Core Sticky Price CPI Sticky Price
Chart 5.9. Consensus Forecast, Sticky Price CPI, and Core Sticky Price CPI
Source: Antam-Mining Company, Bloomberg, and Bank Indonesia
Grafik 5.13. Harga Aset dan IHK
Percent, yoy
-30
-20
-10
0
20
10
30
40
50
70
60
2015 2016 2017I II III IV I II III IV I II III IV
Gold Price Residential Property Price Financial Asset
Chart 5.10. Asset Prices and CPI
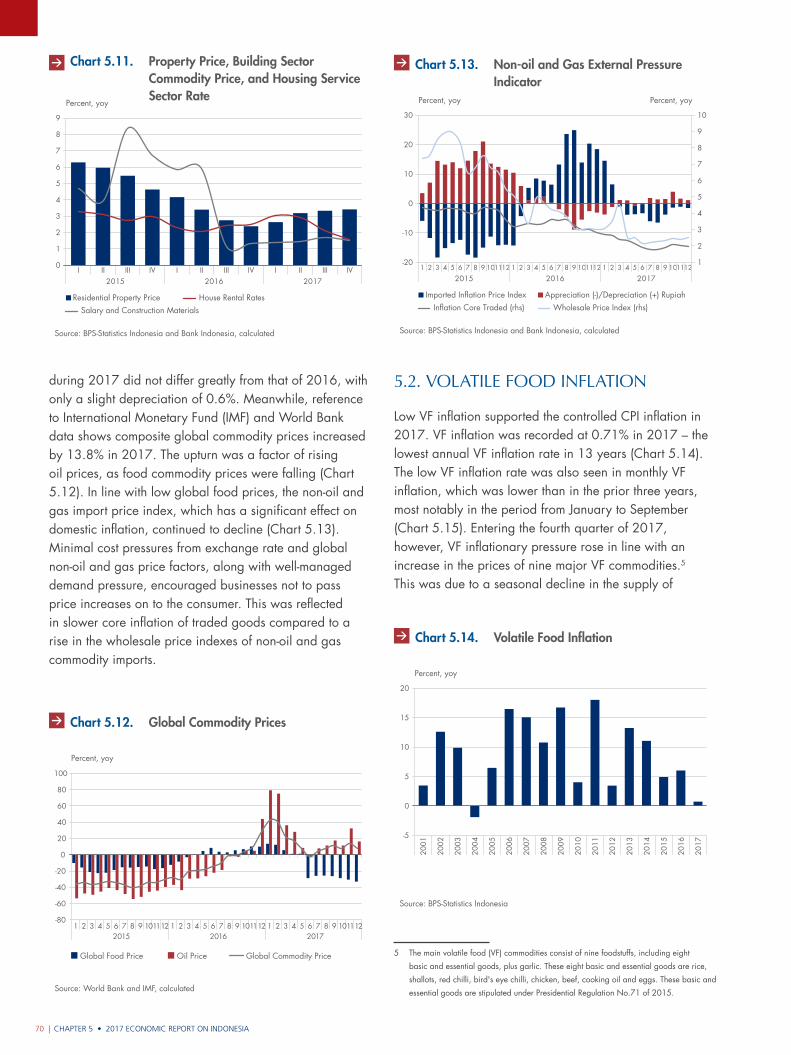
CHAPTER 5 • 2017 ECONOMIC REPORT ON INDONESIA70 |
during 2017 did not differ greatly from that of 2016, with only a slight depreciation of 0.6%. Meanwhile, reference to International Monetary Fund (IMF) and World Bank data shows composite global commodity prices increased by 13.8% in 2017. The upturn was a factor of rising oil prices, as food commodity prices were falling (Chart 5.12). In line with low global food prices, the non-oil and gas import price index, which has a significant effect on domestic inflation, continued to decline (Chart 5.13). Minimal cost pressures from exchange rate and global non-oil and gas price factors, along with well-managed demand pressure, encouraged businesses not to pass price increases on to the consumer. This was reflected in slower core inflation of traded goods compared to a rise in the wholesale price indexes of non-oil and gas commodity imports.
5.2. VolatIle food InflatIon
Low VF inflation supported the controlled CPI inflation in 2017. VF inflation was recorded at 0.71% in 2017 – the lowest annual VF inflation rate in 13 years (Chart 5.14). The low VF inflation rate was also seen in monthly VF inflation, which was lower than in the prior three years, most notably in the period from January to September (Chart 5.15). Entering the fourth quarter of 2017, however, VF inflationary pressure rose in line with an increase in the prices of nine major VF commodities.5 This was due to a seasonal decline in the supply of
5 The main volatile food (VF) commodities consist of nine foodstuffs, including eight
basic and essential goods, plus garlic. These eight basic and essential goods are rice,
shallots, red chilli, bird's eye chilli, chicken, beef, cooking oil and eggs. These basic and
essential goods are stipulated under Presidential Regulation No.71 of 2015.
2015 2016 2017I II III IV I II III IV I II III IV
Source: BPS-Statistics Indonesia and Bank Indonesia, calculated
Grafik 5.14. Kenaikan Harga Properti,Komoditassektor bangunan, dan Jasa sektor Perumahan
0
1
2
3
4
5
6
7
8
9
Percent, yoy
Residential Property Price House Rental RatesSalary and Construction Materials
Chart 5.11. Property Price, Building Sector Commodity Price, and Housing Service Sector Rate
Source: World Bank and IMF, calculated
Grafik 5.9. Indikator Harga Komoditas Global
Percent, yoy
-80
-60
-40
-20
0
20
40
60
80
100
1 2 3 4 5 6 7 8 9 101112 1 2 3 4 5 6 7 8 9 101112 1 2 3 4 5 6 7 8 9 1011122015 2016 2017
Global Food Price Oil Price Global Commodity Price
Chart 5.12. Global Commodity Prices
Source: BPS-Statistics Indonesia and Bank Indonesia, calculated
Grafik 5.10. Indikator Tekanan Eksternal Non Migas
-20
-10
0
10
30
20
Imported Inflation Price Index Appreciation (-)/Depreciation (+) RupiahInflation Core Traded (rhs) Wholesale Price Index (rhs)
Percent, yoy Percent, yoy
1
2
3
4
5
6
7
8
9
10
1 2 3 4
20155 9 1011126 7 8 1 2 3 4
20165 9 1011126 7 8 1 2 3 4
20175 9 1011126 7 8
Chart 5.13. Non-oil and Gas External Pressure Indicator
Source: BPS-Statistics Indonesia
Grafik 5.15. Perkembangan Inflasi VF
-5
0
5
10
15
20
Percent, yoy
2001
2002
2003
2004
2005
2006
2007
2008
2009
2010
2011
2012
2013
2014
2015
2016
2017
Chart 5.14. Volatile Food Inflation
2017 ECONOMIC REPORT ON INDONESIA • CHAPTER 5 | 71
some commodities such as rice and several horticultural products, especially red chillies, amid high demand ahead of Christmas and New Year. Nevertheless, this fourth quarter rise in inflation was still lower than average monthly inflation over the last three years.
Low VF inflation in 2017 was driven by a steady flow of domestic supplies along with more favorable weather conditions than in 2016, with the absence of El Niño and the minimal effect of La Niña (Chart 5.16). The advantageous weather had a positive impact on agricultural commodity production and food supplies. Some of the key climate-affected VF commodities – such as shallots, red chillies and bird’s eye chillies – contributed to deflation in 2017 (Table 5.2). Although generally maintained well throughout the year, the supply of some
food items declined slightly towards the end of the year as weather conditions became less favorable. This caused the price of rice and red chillies to rise in November and December 2017 (Chart 5.17). The weather dynamics at the end of the year also had an adverse impact on the supply and price of fresh fish.
The trend of falling global food prices in 2017 also influenced the low level of VF inflation. This decline in global food prices was driven by abundant production in some producing countries, such as America, China and Australia. However, a deeper decline in global food commodity prices was stifled by an increase in oil prices
Source: BPS-Statistics Indonesia, calculated
Grafik 5.16. Dinamika Inflasi VF 2017
-3
-2
-1
0
1
2
3
4
Percent, mtm
Volatile Food Inflation 2017 Historical at the last 3 years9 Main VF Commodities
1 2 3 4 5 6 7 8 9 10 11 12
Chart 5.15. Dynamics of Volatile Food Inflation
Source: National Weather Centre, USANote: Horizontal Axis shows 3 months period, for exampleDJF : December, January, and February
La NinaEl Nino La Nina
DJF
JFM
FMA
MA
MA
MJ
MJJ
JJA
JAS
ASO
SON
ON
DN
DJ
DJF
JFM
FMA
MA
MA
MJ
MJJ
JJA
JAS
ASO
SON
ON
DN
DJ
20172016
-1.0
0
-0.5
0.5
1.0
1.5
2.0
2.5
3.0
Celcius Degree
Chart 5.16. Climate Indicator
Percent
No Commodity 2016 2017
Deflation
1 Red chili 0.17 -0.18
2 Onion 0.33 -0.16
3 Garlic 0.09 -0.11
4 Bird’s eye chili 0.07 -0.08
5 Beef 0.04 -0.01
Inflation
6 Rice -0.01 0.13
7 Purebred Chicken Egg -0.02 0.09
8 Purebred Chicken Meat 0.00 0.06
9 Cooking Oil 0.06 0.02
10 VF Out of 9 Main Commodities 0.34 0.36
Source: BPS-Statistics Indonesia, calculated
Table 5.2. Contributors of Volatile Food Inflation
1 2 3 4
20175 91011126 7 8 1 2 3 4
20175 91011126 7 8 1 2 3 4
20175 91011126 7 8
Source: Strategic Food Price Information Center (PIHPS), Jakarta Food Station, and Main Market Kramat Jati Jakarta, calculated
Grafik 5.18. Pasokan Komoditas Dari Dalam Negeri
0
10,000
20,000
30,000
40,000
50,000
0
1,000
2,000
3,000
4,000
5,000
Ton Rupiah per kilogram
Rice SupplyRice Price (rhs)
Onion SupplyOnion Price (rhs)
Chilli SupplyChilli Price (rhs)
Chart 5.17. Domestic Food Commodity Supply and Price
CHAPTER 5 • 2017 ECONOMIC REPORT ON INDONESIA72 |
from the beginning of the second half of 2017. This oil price rise resulted in an increase in prices of international food commodities related to biofuels, such as corn.
Global food prices fell by 0.2% in 2017. This decline led to a decrease in the prices of some similar domestic food commodities, as well as in food commodities that are derived from global commodities (Chart 5.18). However, an increase in the international corn price in the fourth quarter of 2017 caused a rise in domestic animal feed prices. This was one of the factors underlying the increased price of chicken and eggs at the end of the year, at a time when demand was high in the lead up to Christmas and New Year (Chart 5.19).
Low VF inflation was also driven by a stronger focus from Indonesia’s Government on stabilizing food prices. The government price stabilization policy was not only enacted over national religious holidays, when food prices tend to rise, but also outside of these periods whenever there were significant price increases of essential commodities (Table 5.3). The price stabilization policy in 2017 was broader in that it not only involved market operations and low-cost markets, but also cooperation with producers and importers to maintain supply. Such cooperation with producers and importers was intended to ensure low prices for consumers, primarily in the period before Ramadan and Idul Fitri in 2017.6 This policy was mainly
6 The Ministry of Trade facilitated a Memorandum of Understanding between the
Indonesian Retailers Association (Aprindo) and producers concerning the provision
of commodities at affordable prices for consumers. The Ministry of Trade also set a
maximum retail prices for cooking oil in the retail market of IDR12,000/liter, and
encouraged importers to supply garlic to the market at a price of IDR25,000 to
IDR27,000 per kg.
aimed at cooking oil and garlic. In addition, as part of efforts to maintain domestic food price stability, the Government continued to import frozen beef and live cattle to increase the domestic beef supply (Chart 5.20). The Government also continued with its policy of importing buffalo meat to provide an alternative protein to beef and to maintain the stability of beef prices.
5.3. admInIstered PrICe InflatIon
Unlike core inflation and VF inflation, AP inflation increased as subsidy reforms continued. AP inflation in 2017 reached 8.70%, higher than the previous year’s level of 0.21%. The rise in AP inflation was driven primarily by the 900 VA electricity tariff adjustment
Source: World Bank and BPS-Statistics Indonesia, calculated
Grafik 5.19. Harga Pangan Global dan Inflasi VF
Global Food Price VF Inflation
-25
-20
-10
-15
-5
0
5
15
10
Percent, yoy
1 2 3 4
20155 9 1011126 7 8 1 2 3 4
20165 9 1011126 7 8 1 2 3 4
20175 9 1011126 7 8
Chart 5.18. Global Food Prices and Volatile Food Inflation
Source: World Bank and BPS-Statistics Indonesia, calculated
Grafik 5.20. Perubahan Harga Jagung, minyakinternasional vs inflasi daging ayam dan telur ayam
-15
-10
-5
0
5
10
15
-6
-4
-2
0
2
4
6
Global Corn Price Global Oil PriceChicken Egg Price (rhs) Chicken Meat Price (rhs)
Percent, mtm Percent, mtm
1 2 3 4 5 6 7 8 9 10 11 12
Chart 5.19. Changes in Global Price (Corn, Oil) and Domestic Price (Chicken and Egg)
Beef Garlic2015 2016 2017 2015 2016 2017
Source: Bank Indonesia, calculated
Grafik 5.21. Pasokan Komoditas dari Luar Negeri
0
20
40
60
80
120
100
Thousand Tons Thousand Tons
Beef Garlic (rhs)
370
410
400
390
380
420
430
440
450
460
470
Chart 5.20. Commodities Supply from Abroad
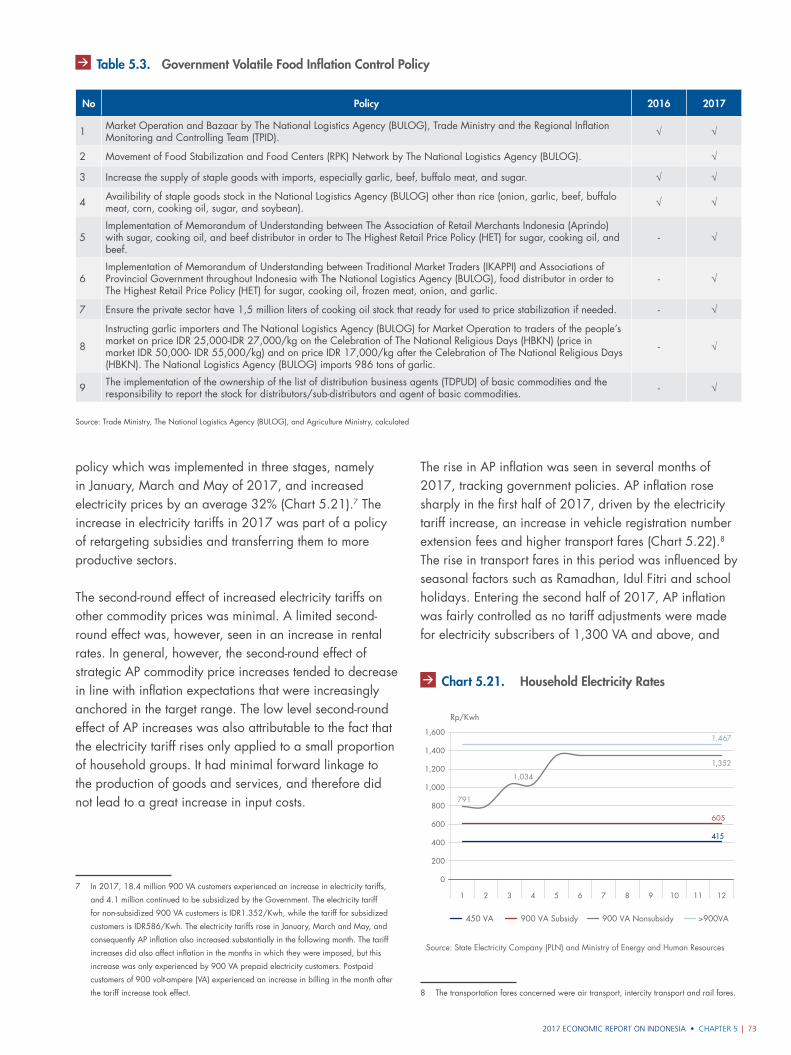
2017 ECONOMIC REPORT ON INDONESIA • CHAPTER 5 | 73
policy which was implemented in three stages, namely in January, March and May of 2017, and increased electricity prices by an average 32% (Chart 5.21).7 The increase in electricity tariffs in 2017 was part of a policy of retargeting subsidies and transferring them to more productive sectors.
The second-round effect of increased electricity tariffs on other commodity prices was minimal. A limited second-round effect was, however, seen in an increase in rental rates. In general, however, the second-round effect of strategic AP commodity price increases tended to decrease in line with inflation expectations that were increasingly anchored in the target range. The low level second-round effect of AP increases was also attributable to the fact that the electricity tariff rises only applied to a small proportion of household groups. It had minimal forward linkage to the production of goods and services, and therefore did not lead to a great increase in input costs.
7 In 2017, 18.4 million 900 VA customers experienced an increase in electricity tariffs,
and 4.1 million continued to be subsidized by the Government. The electricity tariff
for non-subsidized 900 VA customers is IDR1.352/Kwh, while the tariff for subsidized
customers is IDR586/Kwh. The electricity tariffs rose in January, March and May, and
consequently AP inflation also increased substantially in the following month. The tariff
increases did also affect inflation in the months in which they were imposed, but this
increase was only experienced by 900 VA prepaid electricity customers. Postpaid
customers of 900 volt-ampere (VA) experienced an increase in billing in the month after
the tariff increase took effect.
The rise in AP inflation was seen in several months of 2017, tracking government policies. AP inflation rose sharply in the first half of 2017, driven by the electricity tariff increase, an increase in vehicle registration number extension fees and higher transport fares (Chart 5.22).8 The rise in transport fares in this period was influenced by seasonal factors such as Ramadhan, Idul Fitri and school holidays. Entering the second half of 2017, AP inflation was fairly controlled as no tariff adjustments were made for electricity subscribers of 1,300 VA and above, and
8 The transportation fares concerned were air transport, intercity transport and rail fares.
Table 5.3. Government Volatile Food Inflation Control Policy
No Policy 2016 2017
1 Market Operation and Bazaar by The National Logistics Agency (BULOG), Trade Ministry and the Regional Inflation Monitoring and Controlling Team (TPID). √ √
2 Movement of Food Stabilization and Food Centers (RPK) Network by The National Logistics Agency (BULOG). √
3 Increase the supply of staple goods with imports, especially garlic, beef, buffalo meat, and sugar. √ √
4 Availibility of staple goods stock in the National Logistics Agency (BULOG) other than rice (onion, garlic, beef, buffalo meat, corn, cooking oil, sugar, and soybean). √ √
5Implementation of Memorandum of Understanding between The Association of Retail Merchants Indonesia (Aprindo) with sugar, cooking oil, and beef distributor in order to The Highest Retail Price Policy (HET) for sugar, cooking oil, and beef.
- √
6Implementation of Memorandum of Understanding between Traditional Market Traders (IKAPPI) and Associations of Provincial Government throughout Indonesia with The National Logistics Agency (BULOG), food distributor in order to The Highest Retail Price Policy (HET) for sugar, cooking oil, frozen meat, onion, and garlic.
- √
7 Ensure the private sector have 1,5 million liters of cooking oil stock that ready for used to price stabilization if needed. - √
8
Instructing garlic importers and The National Logistics Agency (BULOG) for Market Operation to traders of the people’s market on price IDR 25,000-IDR 27,000/kg on the Celebration of The National Religious Days (HBKN) (price in market IDR 50,000- IDR 55,000/kg) and on price IDR 17,000/kg after the Celebration of The National Religious Days (HBKN). The National Logistics Agency (BULOG) imports 986 tons of garlic.
- √
9 The implementation of the ownership of the list of distribution business agents (TDPUD) of basic commodities and the responsibility to report the stock for distributors/sub-distributors and agent of basic commodities. - √
Source: Trade Ministry, The National Logistics Agency (BULOG), and Agriculture Ministry, calculated
1 2 3 4 5 6 7 8 9 10 11 12
Source: State Electricity Company (PLN) and Ministry of Energy and Human Resources
Grafik 5.22. Tarif Listrik Rumah Tangga
415
605
1,352
1,034
791
1,467
0
800
600
400
200
1,000
1,200
1,400
1,600
450 VA 900 VA Subsidy 900 VA Nonsubsidy >900VA
Rp/Kwh
Chart 5.21. Household Electricity Rates
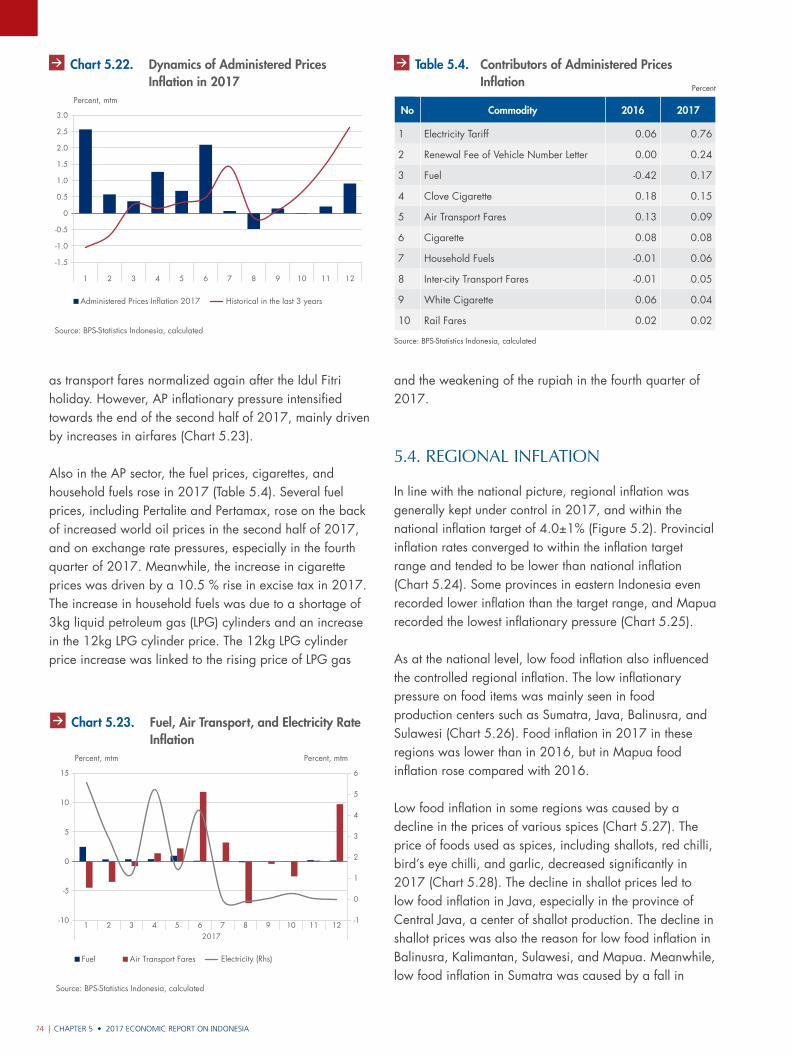
CHAPTER 5 • 2017 ECONOMIC REPORT ON INDONESIA74 |
Source: BPS-Statistics Indonesia, calculated
Grafik 5.24. Inflasi Bahan Bakar Transportasidan Tarif Listrik
-10
-5
0
5
15
10
Percent, mtm Percent, mtm
1 2 3 42017
5 9 10 11 126 7 8-1
0
1
2
3
4
5
6
Fuel Air Transport Fares Electricity (Rhs)
Chart 5.23. Fuel, Air Transport, and Electricity Rate Inflation
as transport fares normalized again after the Idul Fitri holiday. However, AP inflationary pressure intensified towards the end of the second half of 2017, mainly driven by increases in airfares (Chart 5.23).
Also in the AP sector, the fuel prices, cigarettes, and household fuels rose in 2017 (Table 5.4). Several fuel prices, including Pertalite and Pertamax, rose on the back of increased world oil prices in the second half of 2017, and on exchange rate pressures, especially in the fourth quarter of 2017. Meanwhile, the increase in cigarette prices was driven by a 10.5 % rise in excise tax in 2017. The increase in household fuels was due to a shortage of 3kg liquid petroleum gas (LPG) cylinders and an increase in the 12kg LPG cylinder price. The 12kg LPG cylinder price increase was linked to the rising price of LPG gas
and the weakening of the rupiah in the fourth quarter of 2017.
5.4. regIonal InflatIon
In line with the national picture, regional inflation was generally kept under control in 2017, and within the national inflation target of 4.0±1% (Figure 5.2). Provincial inflation rates converged to within the inflation target range and tended to be lower than national inflation (Chart 5.24). Some provinces in eastern Indonesia even recorded lower inflation than the target range, and Mapua recorded the lowest inflationary pressure (Chart 5.25).
As at the national level, low food inflation also influenced the controlled regional inflation. The low inflationary pressure on food items was mainly seen in food production centers such as Sumatra, Java, Balinusra, and Sulawesi (Chart 5.26). Food inflation in 2017 in these regions was lower than in 2016, but in Mapua food inflation rose compared with 2016.
Low food inflation in some regions was caused by a decline in the prices of various spices (Chart 5.27). The price of foods used as spices, including shallots, red chilli, bird’s eye chilli, and garlic, decreased significantly in 2017 (Chart 5.28). The decline in shallot prices led to low food inflation in Java, especially in the province of Central Java, a center of shallot production. The decline in shallot prices was also the reason for low food inflation in Balinusra, Kalimantan, Sulawesi, and Mapua. Meanwhile, low food inflation in Sumatra was caused by a fall in
Source: BPS-Statistics Indonesia, calculated
Grafik 5.23. Inflasi AP 2017 Bulanan
-1.5
-1.0
-0.5
0
0.5
1.0
1.5
2.0
2.5
3.0
Percent, mtm
Administered Prices Inflation 2017 Historical in the last 3 years
1 2 3 4 5 6 7 8 9 10 11 12
Chart 5.22. Dynamics of Administered Prices Inflation in 2017
No Commodity 2016 2017
1 Electricity Tariff 0.06 0.76
2 Renewal Fee of Vehicle Number Letter 0.00 0.24
3 Fuel -0.42 0.17
4 Clove Cigarette 0.18 0.15
5 Air Transport Fares 0.13 0.09
6 Cigarette 0.08 0.08
7 Household Fuels -0.01 0.06
8 Inter-city Transport Fares -0.01 0.05
9 White Cigarette 0.06 0.04
10 Rail Fares 0.02 0.02
Source: BPS-Statistics Indonesia, calculated
Table 5.4. Contributors of Administered Prices Inflation Percent
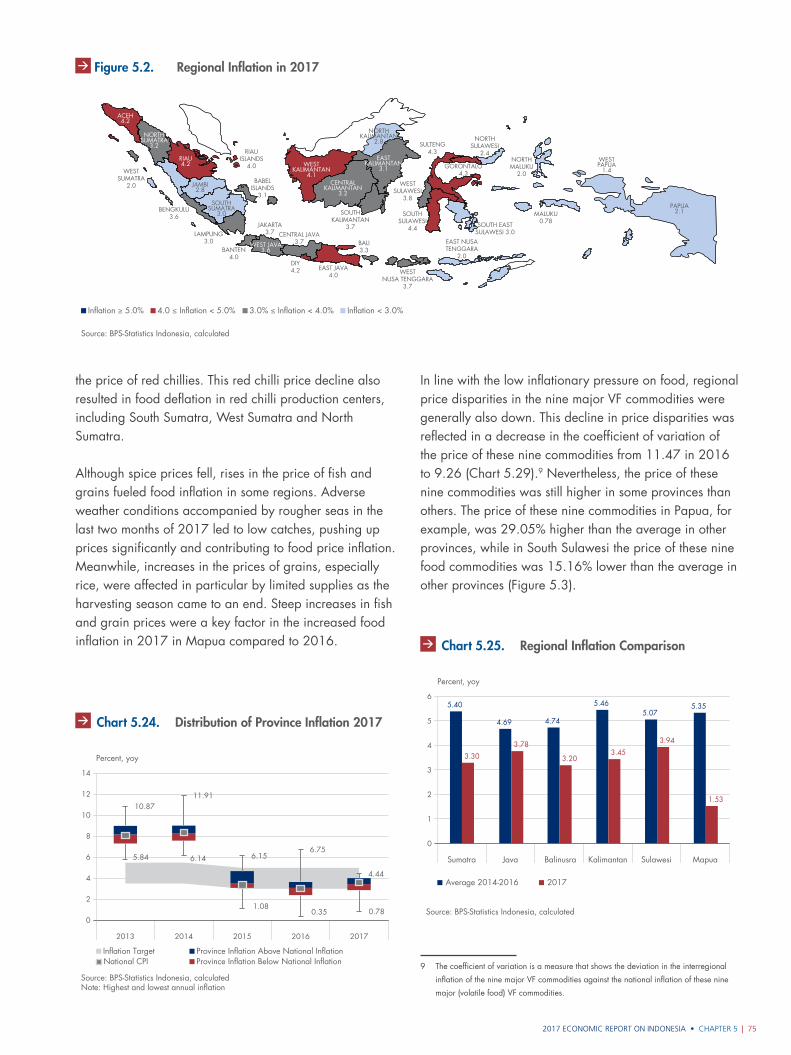
2017 ECONOMIC REPORT ON INDONESIA • CHAPTER 5 | 75
the price of red chillies. This red chilli price decline also resulted in food deflation in red chilli production centers, including South Sumatra, West Sumatra and North Sumatra.
Although spice prices fell, rises in the price of fish and grains fueled food inflation in some regions. Adverse weather conditions accompanied by rougher seas in the last two months of 2017 led to low catches, pushing up prices significantly and contributing to food price inflation. Meanwhile, increases in the prices of grains, especially rice, were affected in particular by limited supplies as the harvesting season came to an end. Steep increases in fish and grain prices were a key factor in the increased food inflation in 2017 in Mapua compared to 2016.
2013 2014 2015 2016 2017
Source: BPS-Statistics Indonesia, calculatedNote: Highest and lowest annual inflation
Grafik 5.26. Sebaran Inflasi Provinsi
5.84 6.14
1.080.35 0.78
10.8711.91
6.156.75
4.44
0
2
4
6
8
10
12
14
Inflation Target Province Inflation Above National InflationProvince Inflation Below National InflationNational CPI
Percent, yoy
Chart 5.24. Distribution of Province Inflation 2017
In line with the low inflationary pressure on food, regional price disparities in the nine major VF commodities were generally also down. This decline in price disparities was reflected in a decrease in the coefficient of variation of the price of these nine commodities from 11.47 in 2016 to 9.26 (Chart 5.29).9 Nevertheless, the price of these nine commodities was still higher in some provinces than others. The price of these nine commodities in Papua, for example, was 29.05% higher than the average in other provinces, while in South Sulawesi the price of these nine food commodities was 15.16% lower than the average in other provinces (Figure 5.3).
9 The coefficient of variation is a measure that shows the deviation in the interregional
inflation of the nine major VF commodities against the national inflation of these nine
major (volatile food) VF commodities.
Source: BPS-Statistics Indonesia, calculated
3.0% ≤ Inflation < 4.0% Inflation < 3.0% Inflation ≥ 5.0% 4.0 ≤ Inflation < 5.0%
Gambar 5.2.Peta Perkembangan Inflasi Daerah (Persen, yoy)
ACEH4.2
NORTHSUMATRA
3.2
RIAU4.2
JAMBI2.8
LAMPUNG3.0 WEST JAVA
3.6
CENTRAL JAVA3.7
PAPUA2.1
WESTPAPUA
1.4
EAST JAVA4.0
SOUTHKALIMANTAN
3.7
CENTRALKALIMANTAN
3.2
WESTKALIMANTAN
4.1
EASTKALIMANTAN
3.1
NORTHKALIMANTAN
2.8
SOUTH EASTSULAWESI 3.0
SOUTHSUMATRA
3.0
WESTSUMATRA
2.0
BENGKULU3.6
RIAUISLANDS
4.0
BABELISLANDS
3.1
BANTEN4.0
DIY4.2
BALI3.3
WESTNUSA TENGGARA
3.7
SOUTHSULAWESI
4.4
WESTSULAWESI
3.8
NORTHSULAWESI
2.4SULTENG
4.3
GORONTALO4.3
EAST NUSATENGGARA
2.0
MALUKU0.78
NORTHMALUKU
2.0
JAKARTA3.7
Figure 5.2. Regional Inflation in 2017
Sumatra Java Kalimantan Sulawesi MapuaBalinusra
Source: BPS-Statistics Indonesia, calculated
Grafik 5.25. Inflasi Regional
5.40
4.69
3.303.78
5.46
3.45
5.07
3.94
5.35
1.53
4.74
3.20
0
1
2
3
4
5
6
Percent, yoy
Average 2014-2016 2017
Chart 5.25. Regional Inflation Comparison
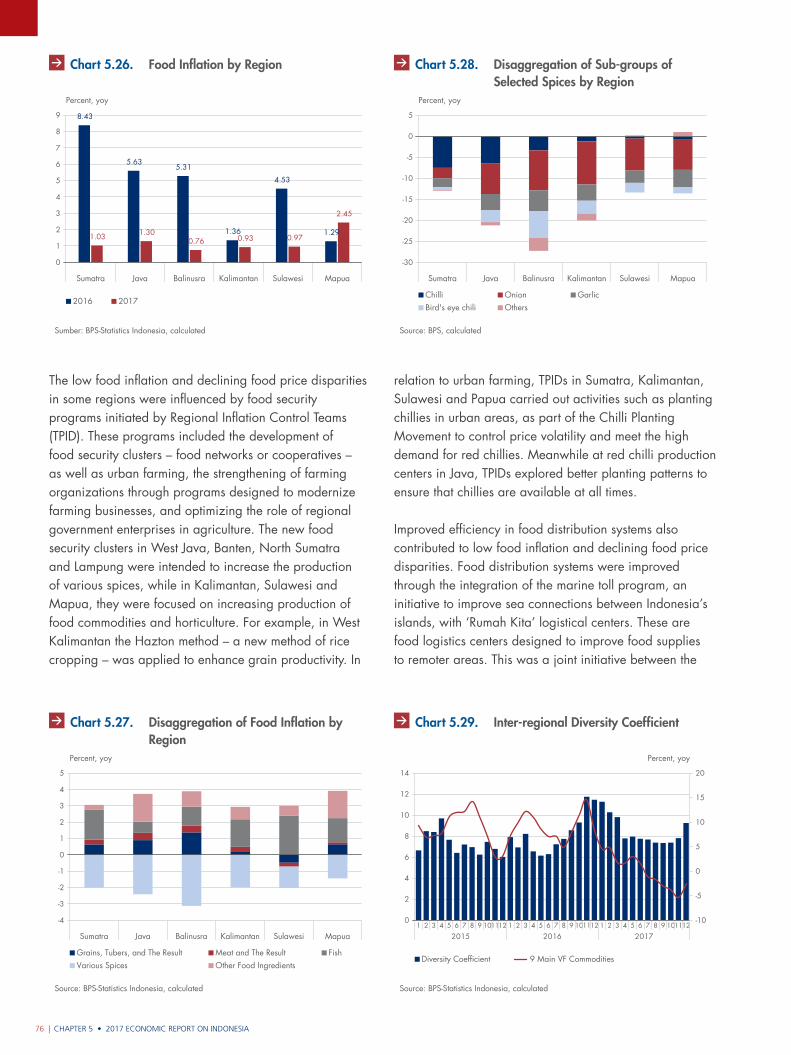
CHAPTER 5 • 2017 ECONOMIC REPORT ON INDONESIA76 |
relation to urban farming, TPIDs in Sumatra, Kalimantan, Sulawesi and Papua carried out activities such as planting chillies in urban areas, as part of the Chilli Planting Movement to control price volatility and meet the high demand for red chillies. Meanwhile at red chilli production centers in Java, TPIDs explored better planting patterns to ensure that chillies are available at all times.
Improved efficiency in food distribution systems also contributed to low food inflation and declining food price disparities. Food distribution systems were improved through the integration of the marine toll program, an initiative to improve sea connections between Indonesia’s islands, with ‘Rumah Kita’ logistical centers. These are food logistics centers designed to improve food supplies to remoter areas. This was a joint initiative between the
The low food inflation and declining food price disparities in some regions were influenced by food security programs initiated by Regional Inflation Control Teams (TPID). These programs included the development of food security clusters – food networks or cooperatives – as well as urban farming, the strengthening of farming organizations through programs designed to modernize farming businesses, and optimizing the role of regional government enterprises in agriculture. The new food security clusters in West Java, Banten, North Sumatra and Lampung were intended to increase the production of various spices, while in Kalimantan, Sulawesi and Mapua, they were focused on increasing production of food commodities and horticulture. For example, in West Kalimantan the Hazton method – a new method of rice cropping – was applied to enhance grain productivity. In
Sumatra Java Balinusra Kalimantan Sulawesi Mapua
Sumber: BPS-Statistics Indonesia, calculated
Grafik 5.27. Inflasi Bahan Pangan
8.43
5.635.31
1.36
4.53
1.291.03 1.300.76 0.93 0.97
2.45
0
1
2
3
4
5
6
7
9
8
2016 2017
Percent, yoy
Chart 5.26. Food Inflation by Region
-4
-2
-3
-1
0
2
1
4
3
5
Percent, yoy
Source: BPS-Statistics Indonesia, calculated
Grafik 5.28. Disagregasi Inflasi Bahan Pangan
Sumatra Java Balinusra Kalimantan Sulawesi Mapua
Various Spices Other Food IngredientsGrains, Tubers, and The Result Meat and The Result Fish
Chart 5.27. Disaggregation of Food Inflation by Region
Source: BPS, calculated
Grafik 5.29. Disagregasi SubKelompokBumbu - bumbuan
-30
-25
-20
-15
-10
-5
0
5
Percent, yoy
Sumatra Java Balinusra Kalimantan Sulawesi Mapua
Bird's eye chili OthersChilli Onion Garlic
Chart 5.28. Disaggregation of Sub-groups of Selected Spices by Region
1 2 3 4
20155 9 1011126 7 8 1 2 3 4
20165 9 1011126 7 8 1 2 3 4
20175 9 1011126 7 8
Source: BPS-Statistics Indonesia, calculated
Grafik 5.30. Koefisien Keragaman Antar Wilayah
-10
-5
0
5
10
20
15
0
2
4
6
8
10
12
14
Diversity Coefficient 9 Main VF Commodities
Percent, yoy
Chart 5.29. Inter-regional Diversity Coefficient
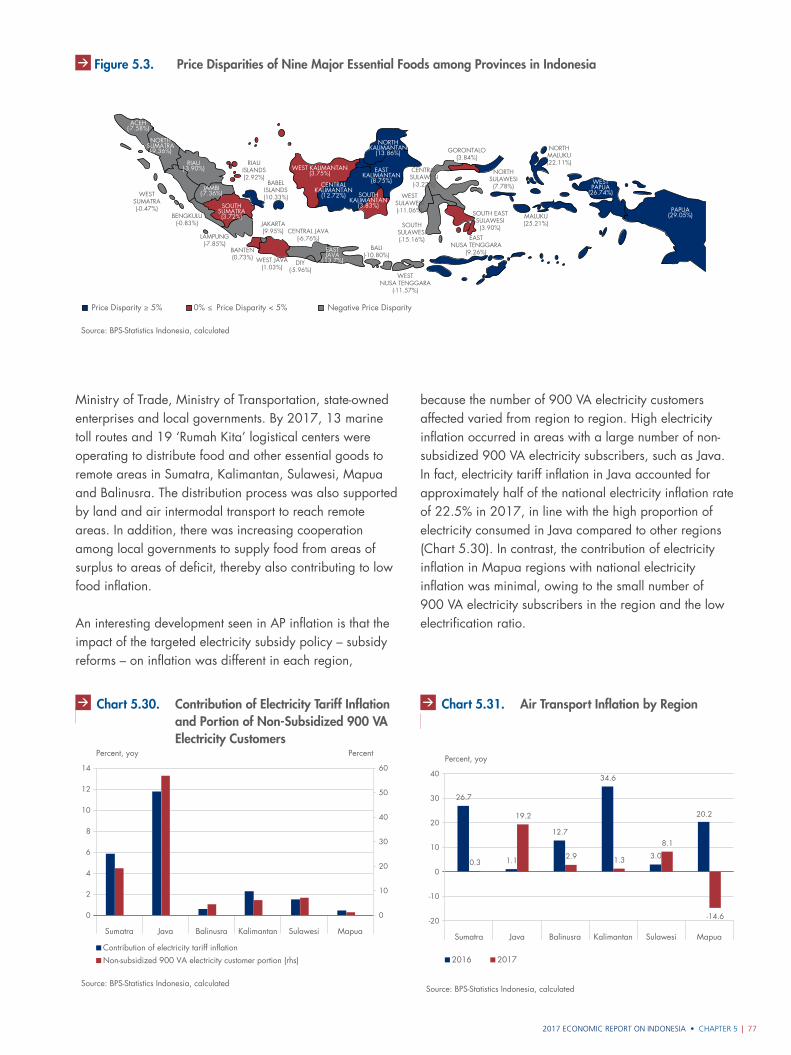
2017 ECONOMIC REPORT ON INDONESIA • CHAPTER 5 | 77
Ministry of Trade, Ministry of Transportation, state-owned enterprises and local governments. By 2017, 13 marine toll routes and 19 ‘Rumah Kita’ logistical centers were operating to distribute food and other essential goods to remote areas in Sumatra, Kalimantan, Sulawesi, Mapua and Balinusra. The distribution process was also supported by land and air intermodal transport to reach remote areas. In addition, there was increasing cooperation among local governments to supply food from areas of surplus to areas of deficit, thereby also contributing to low food inflation.
An interesting development seen in AP inflation is that the impact of the targeted electricity subsidy policy – subsidy reforms – on inflation was different in each region,
because the number of 900 VA electricity customers affected varied from region to region. High electricity inflation occurred in areas with a large number of non-subsidized 900 VA electricity subscribers, such as Java. In fact, electricity tariff inflation in Java accounted for approximately half of the national electricity inflation rate of 22.5% in 2017, in line with the high proportion of electricity consumed in Java compared to other regions (Chart 5.30). In contrast, the contribution of electricity inflation in Mapua regions with national electricity inflation was minimal, owing to the small number of 900 VA electricity subscribers in the region and the low electrification ratio.
Source: BPS-Statistics Indonesia, calculated
Gambar 5.3. Disparitas Harga 9 Bahan Makanan Pokok Penting Antar Provinsi di Indonesia
Negative Price Disparity Price Disparity ≥ 5% 0% Price Disparity < 5%≥
ACEH(-7.58%)
NORTHSUMATRA(-9.36%)
RIAU(-3.90%)
JAMBI(-7.36%)
SOUTHSUMATRA(3.72%)
EASTJAVA
(-13.7%)
PAPUA(29.05%)
WESTPAPUA
(26.74%)WESTSUMATRA(-0.47%)
BENGKULU(-0.83%)
LAMPUNG(-7.85%)
BANTEN(0.73%)
JAKARTA(9.95%) CENTRAL JAVA
(-6.76%)
WEST JAVA(1.03%)
DIY(-5.96%)
BALI(-10.80%)
WESTNUSA TENGGARA
(-11.57%)
NORTHMALUKU(22.11%)
EASTNUSA TENGGARA
(9.26%)
MALUKU(25.21%)SOUTH
SULAWESI(-15.16%)
SOUTH EASTSULAWESI(3.90%)
WESTSULAWESI(-11.06%)
CENTRALSULAWESI(-3.23%)
GORONTALO(3.84%)
NORTHSULAWESI(7.78%)
RIAUISLANDS(2.92%)
BABELISLANDS(10.33%)
WEST KALIMANTAN(3.75%)
CENTRALKALIMANTAN
(12.72%) SOUTHKALIMANTAN
(3.83%)
EASTKALIMANTAN
(8.75%)
NORTHKALIMANTAN
(13.86%)
Figure 5.3. Price Disparities of Nine Major Essential Foods among Provinces in Indonesia
Sumatra Java Balinusra Kalimantan Sulawesi Mapua
Source: BPS-Statistics Indonesia, calculated
Grafik 5.31. Sumbangan Inflasi Tarif Listrik dan PorsiPelanggan Listrik 900 VA Non Subsidi
0
2
4
6
8
10
12
14
Percent, yoy Percent
0
60
50
40
30
20
10
Contribution of electricity tariff inflationNon-subsidized 900 VA electricity customer portion (rhs)
Chart 5.30. Contribution of Electricity Tariff Inflation and Portion of Non-Subsidized 900 VA Electricity Customers
Source: BPS-Statistics Indonesia, calculated
Grafik 5.32. Inflasi Angkutan Udara
26.7
1.1
12.7
34.6
3.0
20.2
0.3
19.2
2.9 1.3
8.1
-14.6-20
-10
0
10
20
30
40
Percent, yoy
Sumatra Java Balinusra Kalimantan Sulawesi Mapua
2016 2017
Chart 5.31. Air Transport Inflation by Region

CHAPTER 5 • 2017 ECONOMIC REPORT ON INDONESIA78 |
In addition to electricity tariff inflation, air transport inflation was also one of the contributors to high AP inflation in the regions. The increase in airfares was influenced by seasonal factors, such as national religious holidays, school holidays and New Year, with the highest inflation seen in Java due to high demand during these periods. In Balinusra, however, air transport inflationary pressure in 2017 was lower than in 2016, because of the decrease in the number of flights as a result of the November 2017 eruption of Mount Agung (Chart 5.31).
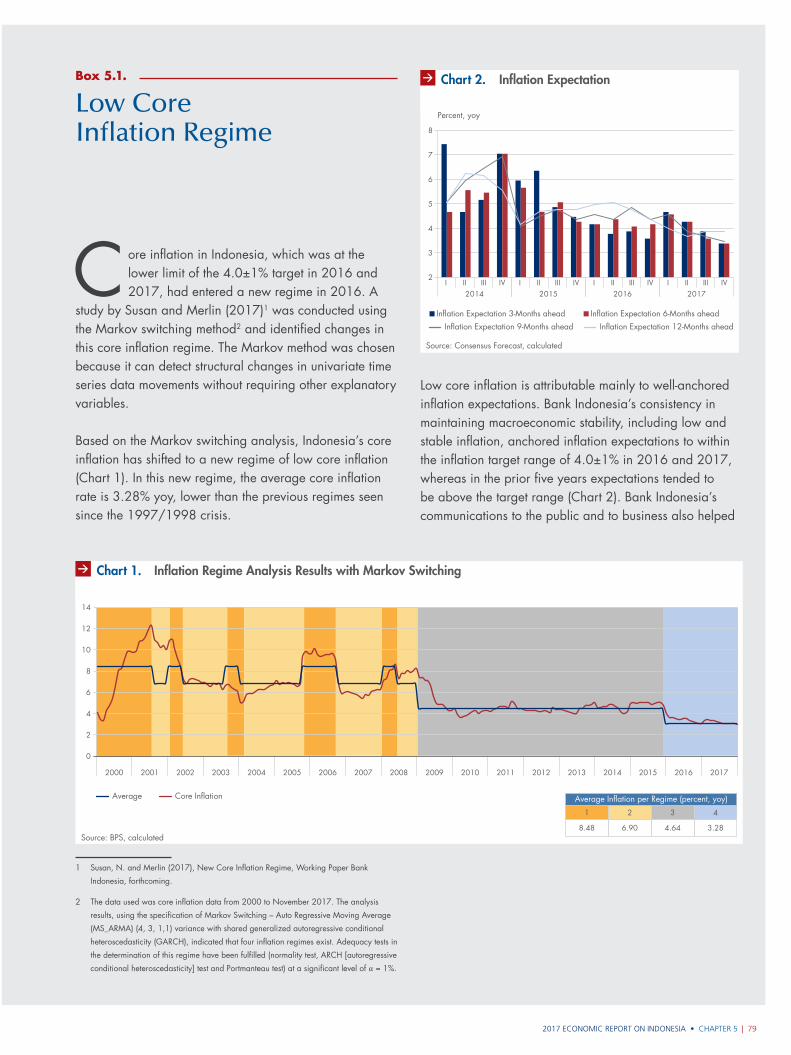
2017 ECONOMIC REPORT ON INDONESIA • CHAPTER 5 | 79
Low core inflation is attributable mainly to well-anchored inflation expectations. Bank Indonesia’s consistency in maintaining macroeconomic stability, including low and stable inflation, anchored inflation expectations to within the inflation target range of 4.0±1% in 2016 and 2017, whereas in the prior five years expectations tended to be above the target range (Chart 2). Bank Indonesia’s communications to the public and to business also helped
Box 5.1.
Core inflation in Indonesia, which was at the lower limit of the 4.0±1% target in 2016 and 2017, had entered a new regime in 2016. A
study by Susan and Merlin (2017)1 was conducted using the Markov switching method2 and identified changes in this core inflation regime. The Markov method was chosen because it can detect structural changes in univariate time series data movements without requiring other explanatory variables.
Based on the Markov switching analysis, Indonesia’s core inflation has shifted to a new regime of low core inflation (Chart 1). In this new regime, the average core inflation rate is 3.28% yoy, lower than the previous regimes seen since the 1997/1998 crisis.
1 Susan, N. and Merlin (2017), New Core Inflation Regime, Working Paper Bank
Indonesia, forthcoming.
2 The data used was core inflation data from 2000 to November 2017. The analysis
results, using the specification of Markov Switching – Auto Regressive Moving Average
(MS_ARMA) (4, 3, 1,1) variance with shared generalized autoregressive conditional
heteroscedasticity (GARCH), indicated that four inflation regimes exist. Adequacy tests in
the determination of this regime have been fulfilled (normality test, ARCH [autoregressive
conditional heteroscedasticity] test and Portmanteau test) at a significant level of α = 1%.
Low Core Inflation Regime
Source: Consensus Forecast, calculated
Grafik 2 Boks 5.1. Ekspektasi Inflasi
Inflation Expectation 3-Months ahead Inflation Expectation 6-Months ahead
Inflation Expectation 9-Months ahead Inflation Expectation 12-Months ahead
Percent, yoy
I II III IV2014
I II III IV2015
I II III IV2016
I II III IV2017
2
3
4
5
6
7
8
Chart 2. Inflation Expectation
2000 2001 2002 2003 2004 2005 2006 2007 2008 2009 2010 2011 2012 2013 2014 2015 2016 2017
Source: BPS, calculated
0
4
2
6
8
10
12
14
Percent, yoy
Average Core Inflation
8.48 6.90 4.64 3.28
Average Inflation per Regime (percent, yoy)
1 2 3 4
Chart 1. Inflation Regime Analysis Results with Markov Switching
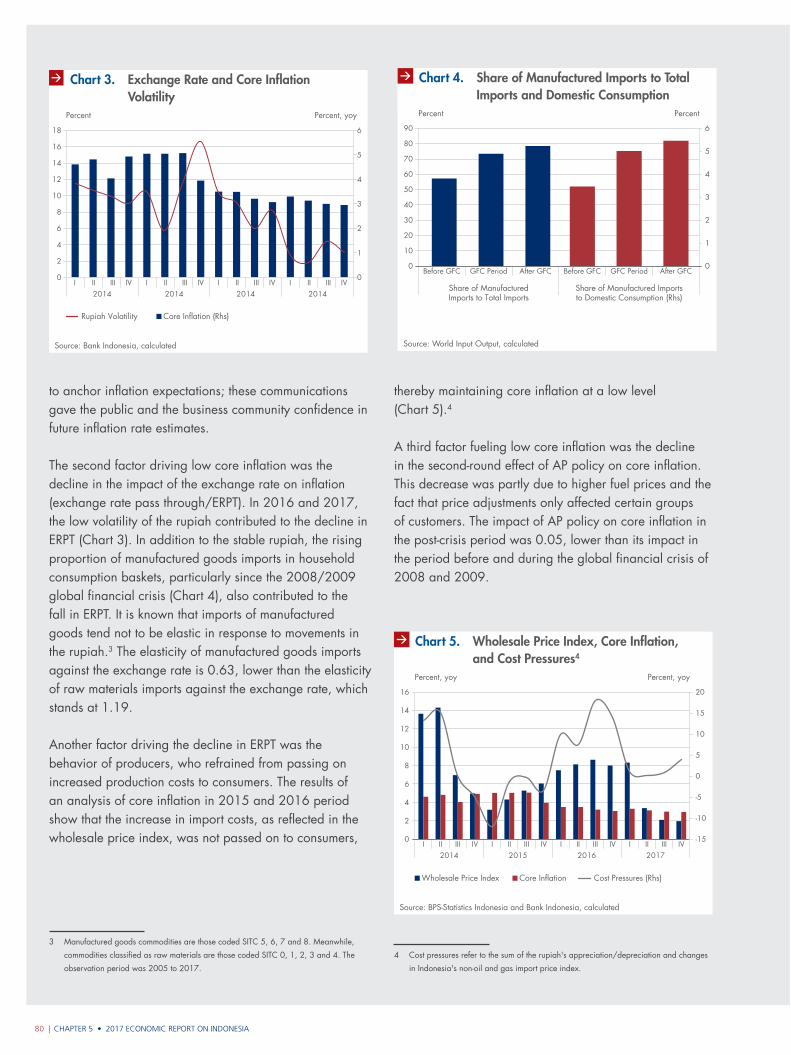
CHAPTER 5 • 2017 ECONOMIC REPORT ON INDONESIA80 |
thereby maintaining core inflation at a low level (Chart 5).4
A third factor fueling low core inflation was the decline in the second-round effect of AP policy on core inflation. This decrease was partly due to higher fuel prices and the fact that price adjustments only affected certain groups of customers. The impact of AP policy on core inflation in the post-crisis period was 0.05, lower than its impact in the period before and during the global financial crisis of 2008 and 2009.
4 Cost pressures refer to the sum of the rupiah's appreciation/depreciation and changes
in Indonesia's non-oil and gas import price index.
to anchor inflation expectations; these communications gave the public and the business community confidence in future inflation rate estimates.
The second factor driving low core inflation was the decline in the impact of the exchange rate on inflation (exchange rate pass through/ERPT). In 2016 and 2017, the low volatility of the rupiah contributed to the decline in ERPT (Chart 3). In addition to the stable rupiah, the rising proportion of manufactured goods imports in household consumption baskets, particularly since the 2008/2009 global financial crisis (Chart 4), also contributed to the fall in ERPT. It is known that imports of manufactured goods tend not to be elastic in response to movements in the rupiah.3 The elasticity of manufactured goods imports against the exchange rate is 0.63, lower than the elasticity of raw materials imports against the exchange rate, which stands at 1.19.
Another factor driving the decline in ERPT was the behavior of producers, who refrained from passing on increased production costs to consumers. The results of an analysis of core inflation in 2015 and 2016 period show that the increase in import costs, as reflected in the wholesale price index, was not passed on to consumers,
3 Manufactured goods commodities are those coded SITC 5, 6, 7 and 8. Meanwhile,
commodities classified as raw materials are those coded SITC 0, 1, 2, 3 and 4. The
observation period was 2005 to 2017.
Source: Bank Indonesia, calculated
Grafik 3 Boks 5.1. Volatilitas Nilai Tukar dan Inflasi In
Core Inflation (Rhs)Rupiah Volatility
Percent Percent, yoy
0
2
4
6
8
10
12
14
16
18
0
1
2
3
4
5
6
I II III IV2014
I II III IV2014
I II III IV2014
I II III IV2014
Chart 3. Exchange Rate and Core Inflation Volatility
Share of ManufacturedImports to Total Imports
Before GFC GFC Period After GFC Before GFC GFC Period After GFC
Share of Manufactured Importsto Domestic Consumption (Rhs)
Source: World Input Output, calculated
Grafik 6 Boks 5.1. Pangsa Impor Barang Manufaktur
0
1
2
3
4
5
6
0
20
10
30
40
50
90
80
70
60
Percent Percent
Chart 4. Share of Manufactured Imports to Total Imports and Domestic Consumption
2014 2015 2016I II III IV I II III IV I II III IV
2017I II III IV
Source: BPS-Statistics Indonesia and Bank Indonesia, calculated
Grafik 4 Boks 5.1. IHPB, Inflasi Inti, dan Kenaikan Bia
-15
-10
-5
0
5
10
15
20
0
2
4
6
8
16
14
12
10
Wholesale Price Index Core Inflation Cost Pressures (Rhs)
Percent, yoy Percent, yoy
Chart 5. Wholesale Price Index, Core Inflation, and Cost Pressures4


| 832017 ECONOMIC REPORT ON INDONESIA
CHAPTER 6
Fiscal policy in 2017 was aimed at speeding up the economic recovery and achieving sustainable and equitable economic growth. This strategy was pursued by balancing stimulus needs over the short and long term and, at the same time, maintaining fiscal sustainability.
Fiscal Policy
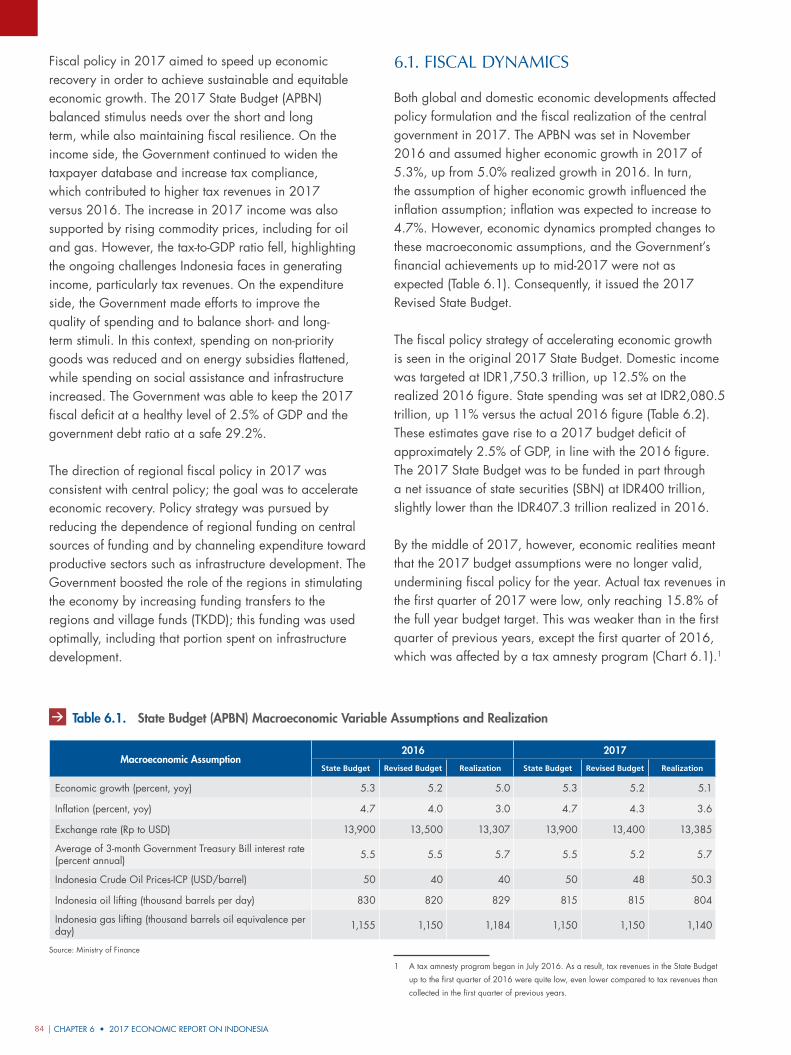
CHAPTER 6 • 2017 ECONOMIC REPORT ON INDONESIA84 |
Fiscal policy in 2017 aimed to speed up economic recovery in order to achieve sustainable and equitable economic growth. The 2017 State Budget (APBN) balanced stimulus needs over the short and long term, while also maintaining fiscal resilience. On the income side, the Government continued to widen the taxpayer database and increase tax compliance, which contributed to higher tax revenues in 2017 versus 2016. The increase in 2017 income was also supported by rising commodity prices, including for oil and gas. However, the tax-to-GDP ratio fell, highlighting the ongoing challenges Indonesia faces in generating income, particularly tax revenues. On the expenditure side, the Government made efforts to improve the quality of spending and to balance short- and long-term stimuli. In this context, spending on non-priority goods was reduced and on energy subsidies flattened, while spending on social assistance and infrastructure increased. The Government was able to keep the 2017 fiscal deficit at a healthy level of 2.5% of GDP and the government debt ratio at a safe 29.2%.
The direction of regional fiscal policy in 2017 was consistent with central policy; the goal was to accelerate economic recovery. Policy strategy was pursued by reducing the dependence of regional funding on central sources of funding and by channeling expenditure toward productive sectors such as infrastructure development. The Government boosted the role of the regions in stimulating the economy by increasing funding transfers to the regions and village funds (TKDD); this funding was used optimally, including that portion spent on infrastructure development.
6.1. Fiscal Dynamics
Both global and domestic economic developments affected policy formulation and the fiscal realization of the central government in 2017. The APBN was set in November 2016 and assumed higher economic growth in 2017 of 5.3%, up from 5.0% realized growth in 2016. In turn, the assumption of higher economic growth influenced the inflation assumption; inflation was expected to increase to 4.7%. However, economic dynamics prompted changes to these macroeconomic assumptions, and the Government’s financial achievements up to mid-2017 were not as expected (Table 6.1). Consequently, it issued the 2017 Revised State Budget.
The fiscal policy strategy of accelerating economic growth is seen in the original 2017 State Budget. Domestic income was targeted at IDR1,750.3 trillion, up 12.5% on the realized 2016 figure. State spending was set at IDR2,080.5 trillion, up 11% versus the actual 2016 figure (Table 6.2). These estimates gave rise to a 2017 budget deficit of approximately 2.5% of GDP, in line with the 2016 figure. The 2017 State Budget was to be funded in part through a net issuance of state securities (SBN) at IDR400 trillion, slightly lower than the IDR407.3 trillion realized in 2016.
By the middle of 2017, however, economic realities meant that the 2017 budget assumptions were no longer valid, undermining fiscal policy for the year. Actual tax revenues in the first quarter of 2017 were low, only reaching 15.8% of the full year budget target. This was weaker than in the first quarter of previous years, except the first quarter of 2016, which was affected by a tax amnesty program (Chart 6.1).1
1 A tax amnesty program began in July 2016. As a result, tax revenues in the State Budget
up to the first quarter of 2016 were quite low, even lower compared to tax revenues than
collected in the first quarter of previous years.
Table 6.1. State Budget (APBN) Macroeconomic Variable Assumptions and Realization
Macroeconomic Assumption2016 2017
State Budget Revised Budget Realization State Budget Revised Budget Realization
Economic growth (percent, yoy) 5.3 5.2 5.0 5.3 5.2 5.1
Inflation (percent, yoy) 4.7 4.0 3.0 4.7 4.3 3.6
Exchange rate (Rp to USD) 13,900 13,500 13,307 13,900 13,400 13,385
Average of 3-month Government Treasury Bill interest rate (percent annual) 5.5 5.5 5.7 5.5 5.2 5.7
Indonesia Crude Oil Prices-ICP (USD/barrel) 50 40 40 50 48 50.3
Indonesia oil lifting (thousand barrels per day) 830 820 829 815 815 804
Indonesia gas lifting (thousand barrels oil equivalence per day) 1,155 1,150 1,184 1,150 1,150 1,140
Source: Ministry of Finance
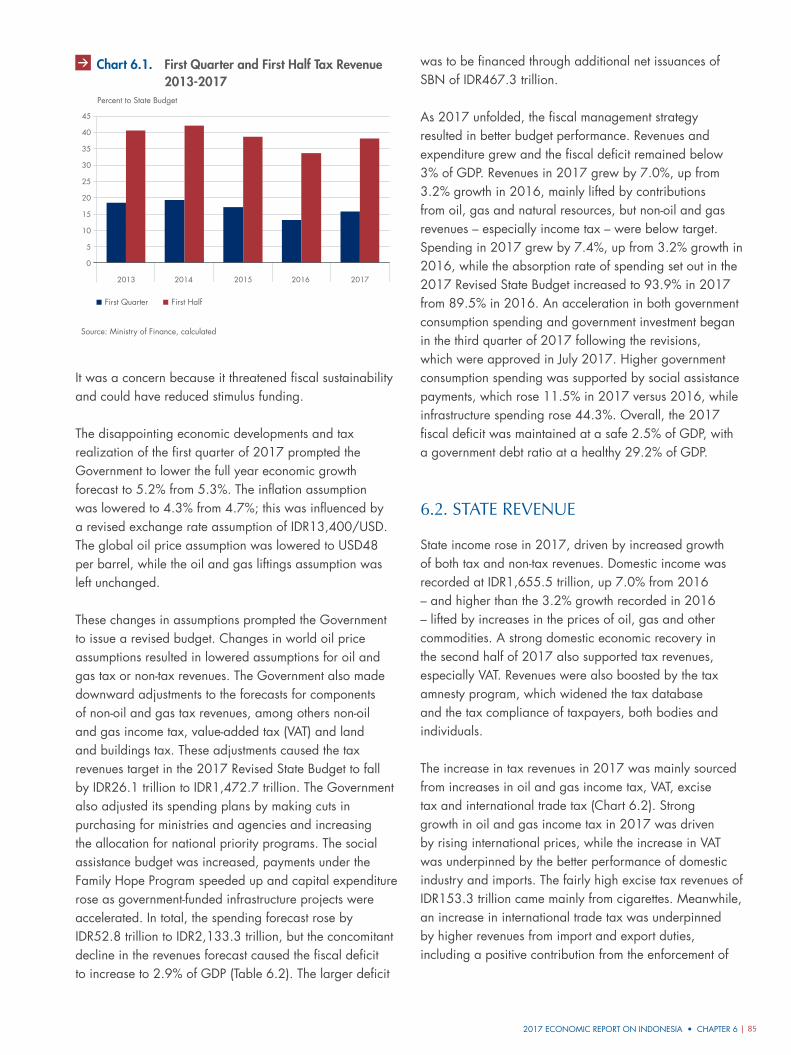
2017 ECONOMIC REPORT ON INDONESIA • CHAPTER 6 | 85
It was a concern because it threatened fiscal sustainability and could have reduced stimulus funding.
The disappointing economic developments and tax realization of the first quarter of 2017 prompted the Government to lower the full year economic growth forecast to 5.2% from 5.3%. The inflation assumption was lowered to 4.3% from 4.7%; this was influenced by a revised exchange rate assumption of IDR13,400/USD. The global oil price assumption was lowered to USD48 per barrel, while the oil and gas liftings assumption was left unchanged.
These changes in assumptions prompted the Government to issue a revised budget. Changes in world oil price assumptions resulted in lowered assumptions for oil and gas tax or non-tax revenues. The Government also made downward adjustments to the forecasts for components of non-oil and gas tax revenues, among others non-oil and gas income tax, value-added tax (VAT) and land and buildings tax. These adjustments caused the tax revenues target in the 2017 Revised State Budget to fall by IDR26.1 trillion to IDR1,472.7 trillion. The Government also adjusted its spending plans by making cuts in purchasing for ministries and agencies and increasing the allocation for national priority programs. The social assistance budget was increased, payments under the Family Hope Program speeded up and capital expenditure rose as government-funded infrastructure projects were accelerated. In total, the spending forecast rose by IDR52.8 trillion to IDR2,133.3 trillion, but the concomitant decline in the revenues forecast caused the fiscal deficit to increase to 2.9% of GDP (Table 6.2). The larger deficit
was to be financed through additional net issuances of SBN of IDR467.3 trillion.
As 2017 unfolded, the fiscal management strategy resulted in better budget performance. Revenues and expenditure grew and the fiscal deficit remained below 3% of GDP. Revenues in 2017 grew by 7.0%, up from 3.2% growth in 2016, mainly lifted by contributions from oil, gas and natural resources, but non-oil and gas revenues – especially income tax – were below target. Spending in 2017 grew by 7.4%, up from 3.2% growth in 2016, while the absorption rate of spending set out in the 2017 Revised State Budget increased to 93.9% in 2017 from 89.5% in 2016. An acceleration in both government consumption spending and government investment began in the third quarter of 2017 following the revisions, which were approved in July 2017. Higher government consumption spending was supported by social assistance payments, which rose 11.5% in 2017 versus 2016, while infrastructure spending rose 44.3%. Overall, the 2017 fiscal deficit was maintained at a safe 2.5% of GDP, with a government debt ratio at a healthy 29.2% of GDP.
6.2. state Revenue
State income rose in 2017, driven by increased growth of both tax and non-tax revenues. Domestic income was recorded at IDR1,655.5 trillion, up 7.0% from 2016 – and higher than the 3.2% growth recorded in 2016 – lifted by increases in the prices of oil, gas and other commodities. A strong domestic economic recovery in the second half of 2017 also supported tax revenues, especially VAT. Revenues were also boosted by the tax amnesty program, which widened the tax database and the tax compliance of taxpayers, both bodies and individuals.
The increase in tax revenues in 2017 was mainly sourced from increases in oil and gas income tax, VAT, excise tax and international trade tax (Chart 6.2). Strong growth in oil and gas income tax in 2017 was driven by rising international prices, while the increase in VAT was underpinned by the better performance of domestic industry and imports. The fairly high excise tax revenues of IDR153.3 trillion came mainly from cigarettes. Meanwhile, an increase in international trade tax was underpinned by higher revenues from import and export duties, including a positive contribution from the enforcement of
0
5
10
15
20
25
30
35
40
45
2013 2014 2015 2016 2017
Grafik 6.1.
First Quarter First Half
Percent to State Budget
Source: Ministry of Finance, calculated
Chart 6.1. First Quarter and First Half Tax Revenue 2013‑2017
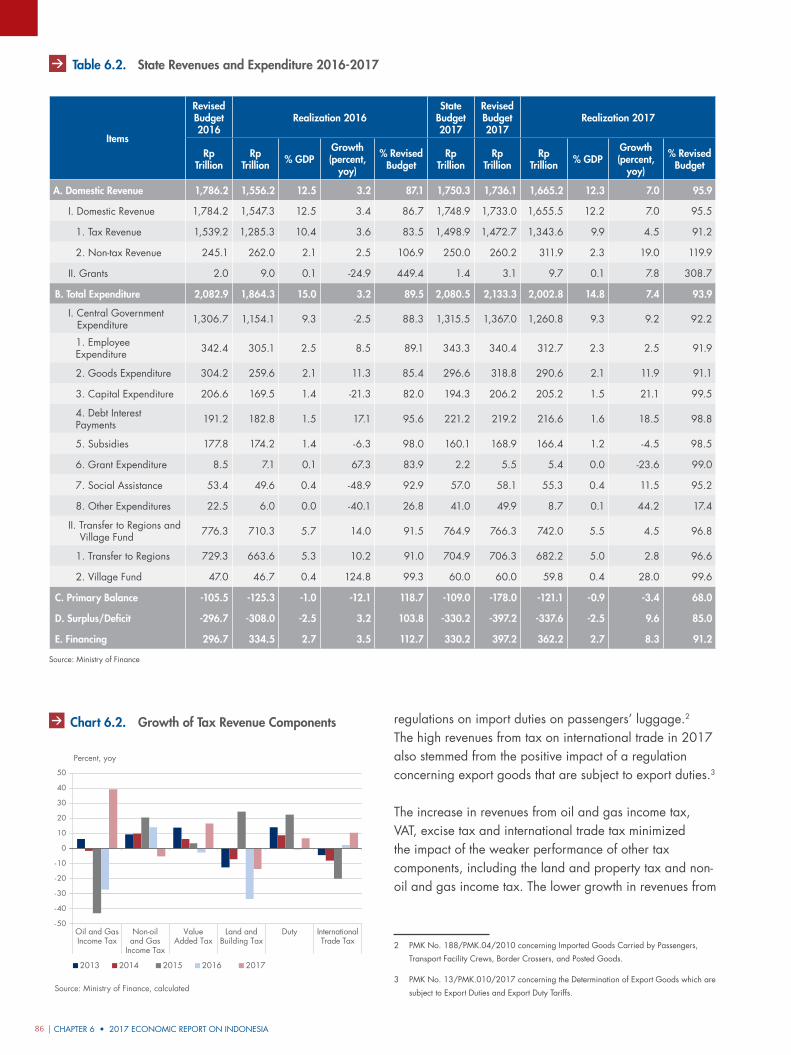
CHAPTER 6 • 2017 ECONOMIC REPORT ON INDONESIA86 |
Grafik 6.2
2013 2014 2015 2016 2017
Percent, yoy
Oil and GasIncome Tax
Non-oiland Gas
Income Tax
ValueAdded Tax
Land andBuilding Tax
Duty InternationalTrade Tax
-50
-40
-30
-20
-10
0
10
20
30
40
50
Source: Ministry of Finance, calculated
Chart 6.2. Growth of Tax Revenue Components regulations on import duties on passengers’ luggage.2 The high revenues from tax on international trade in 2017 also stemmed from the positive impact of a regulation concerning export goods that are subject to export duties.3
The increase in revenues from oil and gas income tax, VAT, excise tax and international trade tax minimized the impact of the weaker performance of other tax components, including the land and property tax and non-oil and gas income tax. The lower growth in revenues from
2 PMK No. 188/PMK.04/2010 concerning Imported Goods Carried by Passengers,
Transport Facility Crews, Border Crossers, and Posted Goods.
3 PMK No. 13/PMK.010/2017 concerning the Determination of Export Goods which are
subject to Export Duties and Export Duty Tariffs.
Table 6.2. State Revenues and Expenditure 2016‑2017
Items
Revised Budget 2016
Realization 2016State
Budget 2017
Revised Budget 2017
Realization 2017
Rp Trillion
Rp Trillion % GDP
Growth (percent,
yoy)
% Revised Budget
Rp Trillion
Rp Trillion
Rp Trillion % GDP
Growth (percent,
yoy)
% Revised Budget
A. Domestic Revenue 1,786.2 1,556.2 12.5 3.2 87.1 1,750.3 1,736.1 1,665.2 12.3 7.0 95.9
I. Domestic Revenue 1,784.2 1,547.3 12.5 3.4 86.7 1,748.9 1,733.0 1,655.5 12.2 7.0 95.5
1. Tax Revenue 1,539.2 1,285.3 10.4 3.6 83.5 1,498.9 1,472.7 1,343.6 9.9 4.5 91.2
2. Non-tax Revenue 245.1 262.0 2.1 2.5 106.9 250.0 260.2 311.9 2.3 19.0 119.9
II. Grants 2.0 9.0 0.1 -24.9 449.4 1.4 3.1 9.7 0.1 7.8 308.7
B. Total Expenditure 2,082.9 1,864.3 15.0 3.2 89.5 2,080.5 2,133.3 2,002.8 14.8 7.4 93.9
I. Central Government Expenditure 1,306.7 1,154.1 9.3 -2.5 88.3 1,315.5 1,367.0 1,260.8 9.3 9.2 92.2
1. Employee Expenditure 342.4 305.1 2.5 8.5 89.1 343.3 340.4 312.7 2.3 2.5 91.9
2. Goods Expenditure 304.2 259.6 2.1 11.3 85.4 296.6 318.8 290.6 2.1 11.9 91.1
3. Capital Expenditure 206.6 169.5 1.4 -21.3 82.0 194.3 206.2 205.2 1.5 21.1 99.5
4. Debt Interest Payments 191.2 182.8 1.5 17.1 95.6 221.2 219.2 216.6 1.6 18.5 98.8
5. Subsidies 177.8 174.2 1.4 -6.3 98.0 160.1 168.9 166.4 1.2 -4.5 98.5
6. Grant Expenditure 8.5 7.1 0.1 67.3 83.9 2.2 5.5 5.4 0.0 -23.6 99.0
7. Social Assistance 53.4 49.6 0.4 -48.9 92.9 57.0 58.1 55.3 0.4 11.5 95.2
8. Other Expenditures 22.5 6.0 0.0 -40.1 26.8 41.0 49.9 8.7 0.1 44.2 17.4
II. Transfer to Regions and Village Fund 776.3 710.3 5.7 14.0 91.5 764.9 766.3 742.0 5.5 4.5 96.8
1. Transfer to Regions 729.3 663.6 5.3 10.2 91.0 704.9 706.3 682.2 5.0 2.8 96.6
2. Village Fund 47.0 46.7 0.4 124.8 99.3 60.0 60.0 59.8 0.4 28.0 99.6
C. Primary Balance ‑105.5 ‑125.3 ‑1.0 ‑12.1 118.7 ‑109.0 ‑178.0 ‑121.1 ‑0.9 ‑3.4 68.0
D. Surplus/Deficit ‑296.7 ‑308.0 ‑2.5 3.2 103.8 ‑330.2 ‑397.2 ‑337.6 ‑2.5 9.6 85.0
E. Financing 296.7 334.5 2.7 3.5 112.7 330.2 397.2 362.2 2.7 8.3 91.2
Source: Ministry of Finance
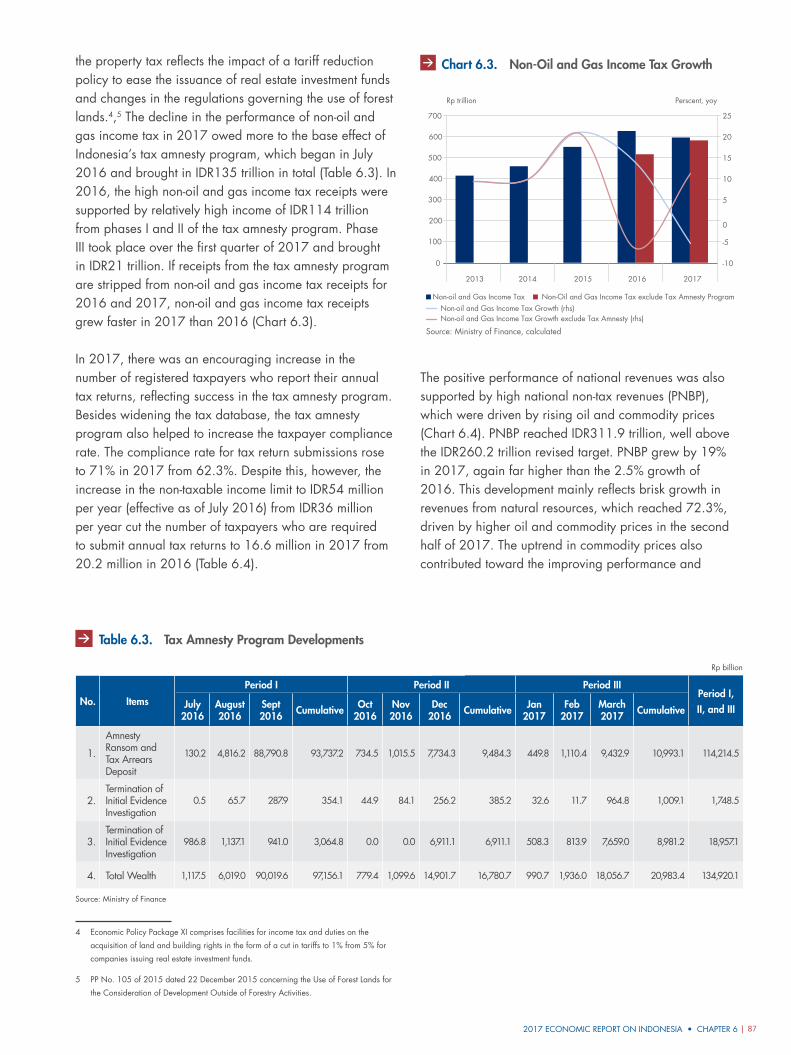
2017 ECONOMIC REPORT ON INDONESIA • CHAPTER 6 | 87
the property tax reflects the impact of a tariff reduction policy to ease the issuance of real estate investment funds and changes in the regulations governing the use of forest lands.4,5 The decline in the performance of non-oil and gas income tax in 2017 owed more to the base effect of Indonesia’s tax amnesty program, which began in July 2016 and brought in IDR135 trillion in total (Table 6.3). In 2016, the high non-oil and gas income tax receipts were supported by relatively high income of IDR114 trillion from phases I and II of the tax amnesty program. Phase III took place over the first quarter of 2017 and brought in IDR21 trillion. If receipts from the tax amnesty program are stripped from non-oil and gas income tax receipts for 2016 and 2017, non-oil and gas income tax receipts grew faster in 2017 than 2016 (Chart 6.3).
In 2017, there was an encouraging increase in the number of registered taxpayers who report their annual tax returns, reflecting success in the tax amnesty program. Besides widening the tax database, the tax amnesty program also helped to increase the taxpayer compliance rate. The compliance rate for tax return submissions rose to 71% in 2017 from 62.3%. Despite this, however, the increase in the non-taxable income limit to IDR54 million per year (effective as of July 2016) from IDR36 million per year cut the number of taxpayers who are required to submit annual tax returns to 16.6 million in 2017 from 20.2 million in 2016 (Table 6.4).
4 Economic Policy Package XI comprises facilities for income tax and duties on the
acquisition of land and building rights in the form of a cut in tariffs to 1% from 5% for
companies issuing real estate investment funds.
5 PP No. 105 of 2015 dated 22 December 2015 concerning the Use of Forest Lands for
the Consideration of Development Outside of Forestry Activities.
The positive performance of national revenues was also supported by high national non-tax revenues (PNBP), which were driven by rising oil and commodity prices (Chart 6.4). PNBP reached IDR311.9 trillion, well above the IDR260.2 trillion revised target. PNBP grew by 19% in 2017, again far higher than the 2.5% growth of 2016. This development mainly reflects brisk growth in revenues from natural resources, which reached 72.3%, driven by higher oil and commodity prices in the second half of 2017. The uptrend in commodity prices also contributed toward the improving performance and
Grafik 6.3
Non-oil and Gas Income Tax Non-Oil and Gas Income Tax exclude Tax Amnesty ProgramNon-oil and Gas Income Tax Growth (rhs)Non-oil and Gas Income Tax Growth exclude Tax Amnesty (rhs)
-10
-5
0
5
10
15
20
25
0
200
300
100
400
500
700
600
2013 2014 2015 2016 2017
Rp trillion Perscent, yoy
Source: Ministry of Finance, calculated
Chart 6.3. Non‑Oil and Gas Income Tax Growth
Rp billion
No. Items
Period I Period II Period IIIPeriod I,II, and IIIJuly
2016August 2016
Sept 2016 Cumulative Oct
2016Nov 2016
Dec 2016 Cumulative Jan
2017Feb
2017March 2017 Cumulative
1.
Amnesty Ransom and Tax Arrears Deposit
130.2 4,816.2 88,790.8 93,737.2 734.5 1,015.5 7,734.3 9,484.3 449.8 1,110.4 9,432.9 10,993.1 114,214.5
2.Termination of Initial Evidence Investigation
0.5 65.7 287.9 354.1 44.9 84.1 256.2 385.2 32.6 11.7 964.8 1,009.1 1,748.5
3.Termination of Initial Evidence Investigation
986.8 1,137.1 941.0 3,064.8 0.0 0.0 6,911.1 6,911.1 508.3 813.9 7,659.0 8,981.2 18,957.1
4. Total Wealth 1,117.5 6,019.0 90,019.6 97,156.1 779.4 1,099.6 14,901.7 16,780.7 990.7 1,936.0 18,056.7 20,983.4 134,920.1
Source: Ministry of Finance
Table 6.3. Tax Amnesty Program Developments
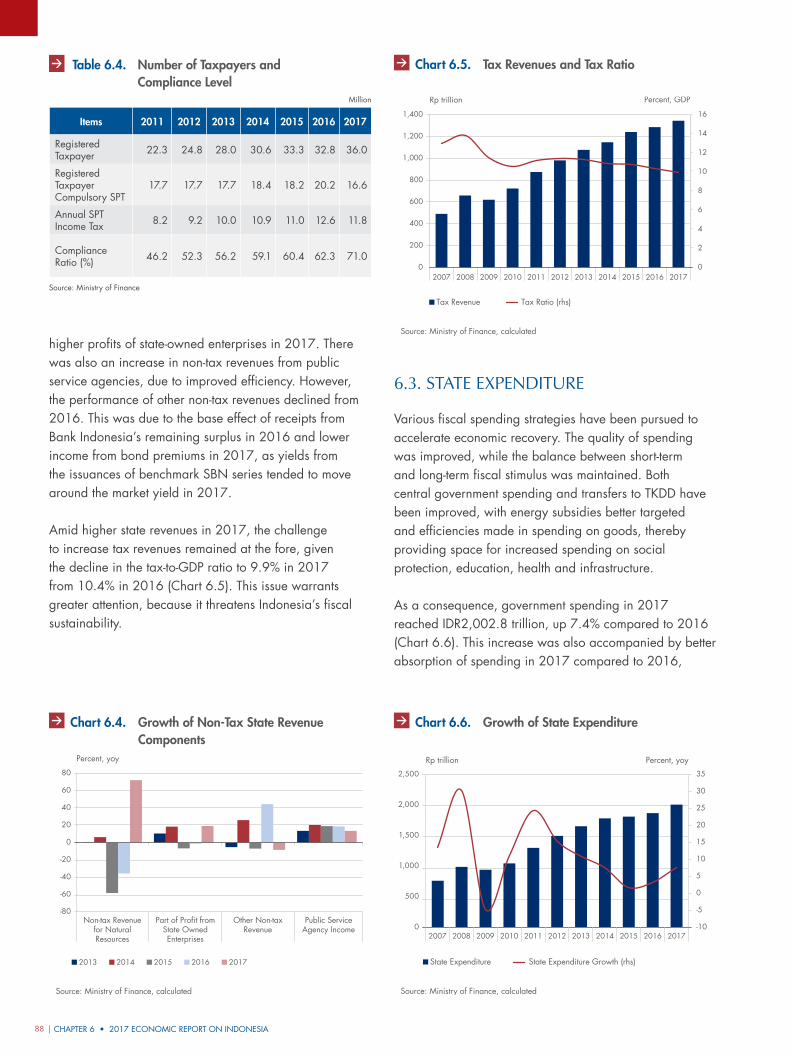
CHAPTER 6 • 2017 ECONOMIC REPORT ON INDONESIA88 |
Grafik 6.4.
Source: Ministry of Finance, calculated
Percent, yoy
2013 2014 2015 2016 2017
-80
-60
-40
-20
0
20
40
60
80
Public Service Agency Income
Other Non-tax Revenue
Part of Profit from State Owned Enterprises
Non-tax Revenue for Natural Resources
Chart 6.4. Growth of Non‑Tax State Revenue Components
Tax Revenue
Rp trillion Percent, GDP
Tax Ratio (rhs)
Source: Ministry of Finance, calculated
2007 2008 2009 2010 2011 2012 2013 2014 2015 2016 2017 0
2
4
6
8
10
12
14
16
0
200
400
600
800
1,000
1,200
1,400
Grafik 6.5. Chart 6.5. Tax Revenues and Tax Ratio
Grafik 6.6. Lorem Ipsum
Source: Ministry of Finance, calculated
State Expenditure
Rp trillion Percent, yoy
State Expenditure Growth (rhs)
-10
-5
0
5
10
15
20
25
30
35
0
500
1,000
1,500
2,000
2,500
2007 2008 2009 2010 2011 2012 2013 2014 2015 2016 2017
Chart 6.6. Growth of State Expenditure
higher profits of state-owned enterprises in 2017. There was also an increase in non-tax revenues from public service agencies, due to improved efficiency. However, the performance of other non-tax revenues declined from 2016. This was due to the base effect of receipts from Bank Indonesia’s remaining surplus in 2016 and lower income from bond premiums in 2017, as yields from the issuances of benchmark SBN series tended to move around the market yield in 2017.
Amid higher state revenues in 2017, the challenge to increase tax revenues remained at the fore, given the decline in the tax-to-GDP ratio to 9.9% in 2017 from 10.4% in 2016 (Chart 6.5). This issue warrants greater attention, because it threatens Indonesia’s fiscal sustainability.
6.3. state expenDituRe
Various fiscal spending strategies have been pursued to accelerate economic recovery. The quality of spending was improved, while the balance between short-term and long-term fiscal stimulus was maintained. Both central government spending and transfers to TKDD have been improved, with energy subsidies better targeted and efficiencies made in spending on goods, thereby providing space for increased spending on social protection, education, health and infrastructure.
As a consequence, government spending in 2017 reached IDR2,002.8 trillion, up 7.4% compared to 2016 (Chart 6.6). This increase was also accompanied by better absorption of spending in 2017 compared to 2016,
Table 6.4. Number of Taxpayers and Compliance Level
Million
Items 2011 2012 2013 2014 2015 2016 2017
Registered Taxpayer 22.3 24.8 28.0 30.6 33.3 32.8 36.0
Registered Taxpayer Compulsory SPT
17.7 17.7 17.7 18.4 18.2 20.2 16.6
Annual SPT Income Tax 8.2 9.2 10.0 10.9 11.0 12.6 11.8
Compliance Ratio (%) 46.2 52.3 56.2 59.1 60.4 62.3 71.0
Source: Ministry of Finance
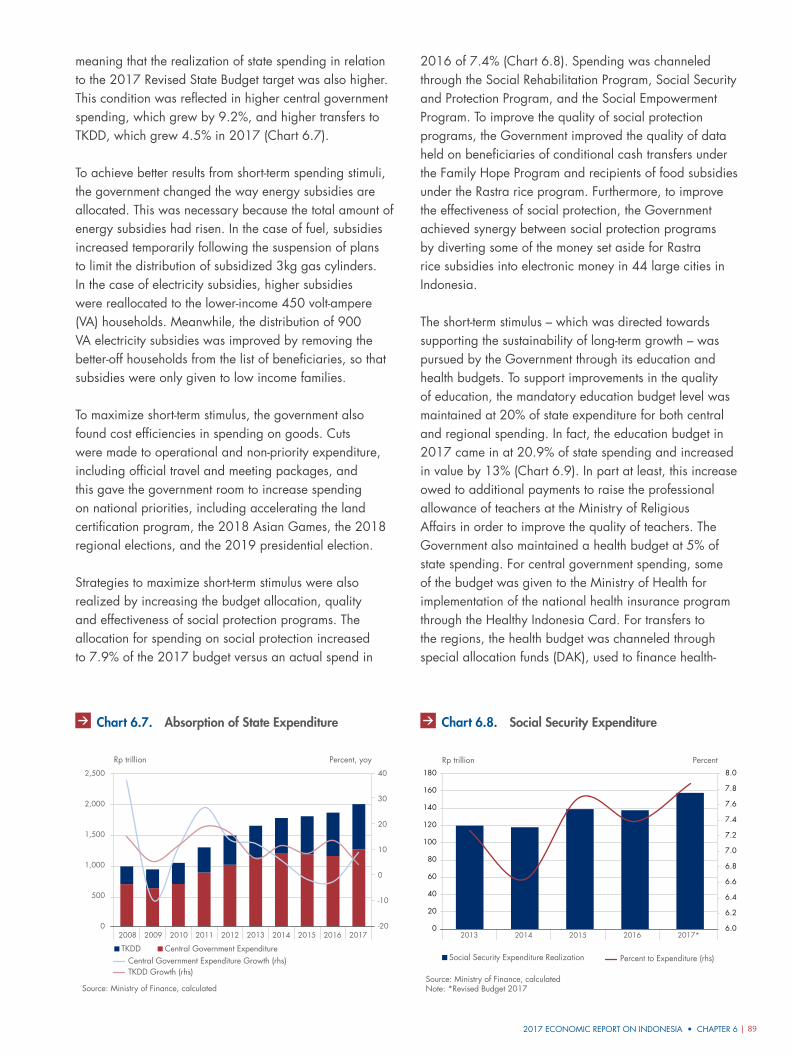
2017 ECONOMIC REPORT ON INDONESIA • CHAPTER 6 | 89
meaning that the realization of state spending in relation to the 2017 Revised State Budget target was also higher. This condition was reflected in higher central government spending, which grew by 9.2%, and higher transfers to TKDD, which grew 4.5% in 2017 (Chart 6.7).
To achieve better results from short-term spending stimuli, the government changed the way energy subsidies are allocated. This was necessary because the total amount of energy subsidies had risen. In the case of fuel, subsidies increased temporarily following the suspension of plans to limit the distribution of subsidized 3kg gas cylinders. In the case of electricity subsidies, higher subsidies were reallocated to the lower-income 450 volt-ampere (VA) households. Meanwhile, the distribution of 900 VA electricity subsidies was improved by removing the better-off households from the list of beneficiaries, so that subsidies were only given to low income families.
To maximize short-term stimulus, the government also found cost efficiencies in spending on goods. Cuts were made to operational and non-priority expenditure, including official travel and meeting packages, and this gave the government room to increase spending on national priorities, including accelerating the land certification program, the 2018 Asian Games, the 2018 regional elections, and the 2019 presidential election.
Strategies to maximize short-term stimulus were also realized by increasing the budget allocation, quality and effectiveness of social protection programs. The allocation for spending on social protection increased to 7.9% of the 2017 budget versus an actual spend in
2016 of 7.4% (Chart 6.8). Spending was channeled through the Social Rehabilitation Program, Social Security and Protection Program, and the Social Empowerment Program. To improve the quality of social protection programs, the Government improved the quality of data held on beneficiaries of conditional cash transfers under the Family Hope Program and recipients of food subsidies under the Rastra rice program. Furthermore, to improve the effectiveness of social protection, the Government achieved synergy between social protection programs by diverting some of the money set aside for Rastra rice subsidies into electronic money in 44 large cities in Indonesia.
The short-term stimulus – which was directed towards supporting the sustainability of long-term growth – was pursued by the Government through its education and health budgets. To support improvements in the quality of education, the mandatory education budget level was maintained at 20% of state expenditure for both central and regional spending. In fact, the education budget in 2017 came in at 20.9% of state spending and increased in value by 13% (Chart 6.9). In part at least, this increase owed to additional payments to raise the professional allowance of teachers at the Ministry of Religious Affairs in order to improve the quality of teachers. The Government also maintained a health budget at 5% of state spending. For central government spending, some of the budget was given to the Ministry of Health for implementation of the national health insurance program through the Healthy Indonesia Card. For transfers to the regions, the health budget was channeled through special allocation funds (DAK), used to finance health-
Gra�k 6.7. Lorem Ipsum
TKDD
Rp trillion Percent, yoy
Central Government ExpenditureCentral Government Expenditure Growth (rhs)TKDD Growth (rhs)
Source: Ministry of Finance, calculated
-20
-10
0
10
20
30
40
0
500
1,000
1,500
2,000
2,500
2008 2009 2010 2011 2012 2013 2014 2015 2016 2017
Chart 6.7. Absorption of State Expenditure
2013 2014 2015 2016 2017*
Social Security Expenditure Realization
Rp trillion Percent
Percent to Expenditure (rhs)
6.0
6.2
6.4
6.6
6.8
7.0
7.2
7.4
7.6
7.8
8.0
0
20
40
60
80
100
120
140
160
180
Source: Ministry of Finance, calculatedNote: *Revised Budget 2017
Chart 6.8. Social Security Expenditure
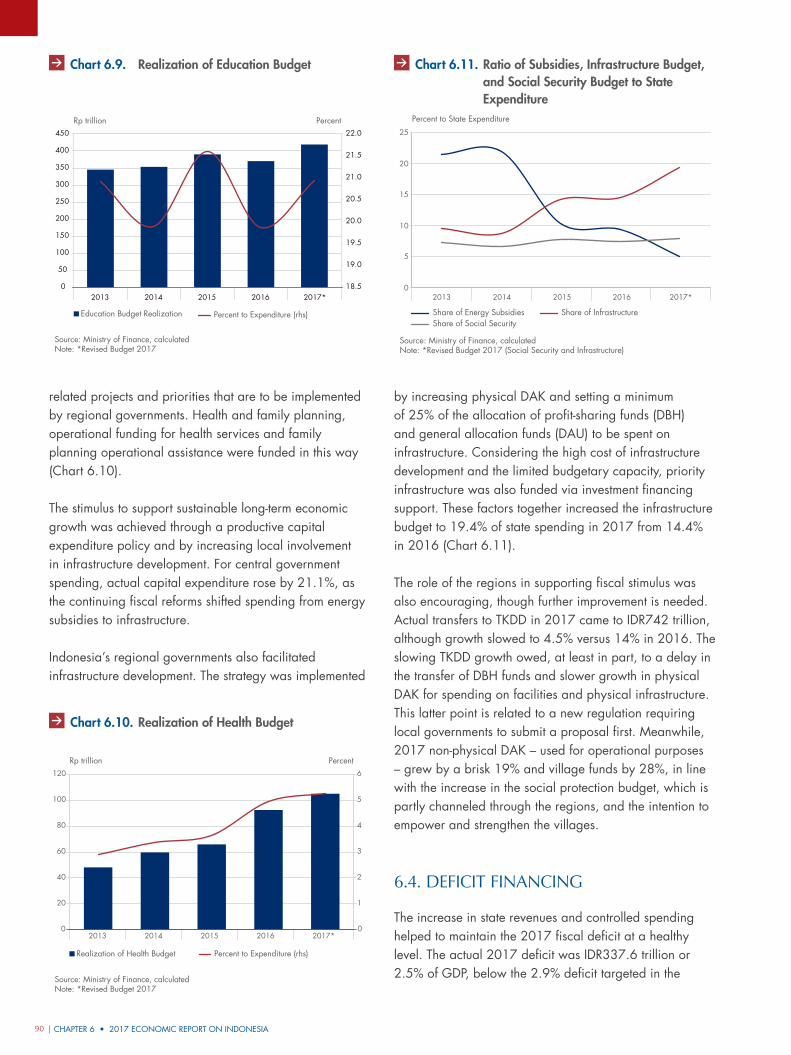
CHAPTER 6 • 2017 ECONOMIC REPORT ON INDONESIA90 |
Education Budget Realization
Rp trillion Percent
Percent to Expenditure (rhs)
18.5
19.0
19.5
20.0
20.5
21.0
21.5
22.0
0
50
100
150
200
250
300
350
400
450
2013 2014 2015 2016 2017*
Source: Ministry of Finance, calculatedNote: *Revised Budget 2017
Chart 6.9. Realization of Education Budget
Gra�k 6.10. Lorem Ipsum
Realization of Health Budget
Rp trillion Percent
Percent to Expenditure (rhs)
0
1
2
3
4
5
6
0
20
40
60
80
100
120
2013 2014 2015 2016 2017*
Source: Ministry of Finance, calculatedNote: *Revised Budget 2017
Chart 6.10. Realization of Health Budget
Grafik 6.11.
5
0
10
15
20
25
2013 2014 2015 2016 2017*
Percent to State Expenditure
Share of Energy Subsidies Share of InfrastructureShare of Social Security
Source: Ministry of Finance, calculatedNote: *Revised Budget 2017 (Social Security and Infrastructure)
Chart 6.11. Ratio of Subsidies, Infrastructure Budget, and Social Security Budget to State Expenditure
related projects and priorities that are to be implemented by regional governments. Health and family planning, operational funding for health services and family planning operational assistance were funded in this way (Chart 6.10).
The stimulus to support sustainable long-term economic growth was achieved through a productive capital expenditure policy and by increasing local involvement in infrastructure development. For central government spending, actual capital expenditure rose by 21.1%, as the continuing fiscal reforms shifted spending from energy subsidies to infrastructure.
Indonesia’s regional governments also facilitated infrastructure development. The strategy was implemented
by increasing physical DAK and setting a minimum of 25% of the allocation of profit-sharing funds (DBH) and general allocation funds (DAU) to be spent on infrastructure. Considering the high cost of infrastructure development and the limited budgetary capacity, priority infrastructure was also funded via investment financing support. These factors together increased the infrastructure budget to 19.4% of state spending in 2017 from 14.4% in 2016 (Chart 6.11).
The role of the regions in supporting fiscal stimulus was also encouraging, though further improvement is needed. Actual transfers to TKDD in 2017 came to IDR742 trillion, although growth slowed to 4.5% versus 14% in 2016. The slowing TKDD growth owed, at least in part, to a delay in the transfer of DBH funds and slower growth in physical DAK for spending on facilities and physical infrastructure. This latter point is related to a new regulation requiring local governments to submit a proposal first. Meanwhile, 2017 non-physical DAK – used for operational purposes – grew by a brisk 19% and village funds by 28%, in line with the increase in the social protection budget, which is partly channeled through the regions, and the intention to empower and strengthen the villages.
6.4. DeFicit Financing
The increase in state revenues and controlled spending helped to maintain the 2017 fiscal deficit at a healthy level. The actual 2017 deficit was IDR337.6 trillion or 2.5% of GDP, below the 2.9% deficit targeted in the
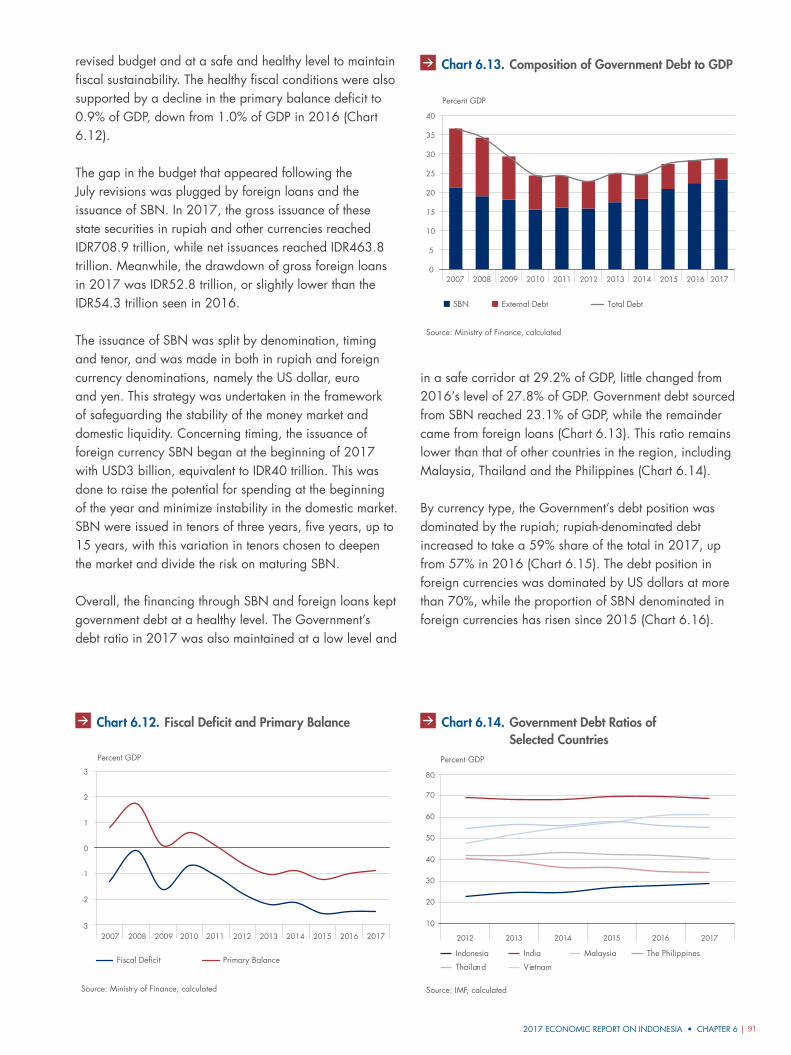
2017 ECONOMIC REPORT ON INDONESIA • CHAPTER 6 | 91
revised budget and at a safe and healthy level to maintain fiscal sustainability. The healthy fiscal conditions were also supported by a decline in the primary balance deficit to 0.9% of GDP, down from 1.0% of GDP in 2016 (Chart 6.12).
The gap in the budget that appeared following the July revisions was plugged by foreign loans and the issuance of SBN. In 2017, the gross issuance of these state securities in rupiah and other currencies reached IDR708.9 trillion, while net issuances reached IDR463.8 trillion. Meanwhile, the drawdown of gross foreign loans in 2017 was IDR52.8 trillion, or slightly lower than the IDR54.3 trillion seen in 2016.
The issuance of SBN was split by denomination, timing and tenor, and was made in both in rupiah and foreign currency denominations, namely the US dollar, euro and yen. This strategy was undertaken in the framework of safeguarding the stability of the money market and domestic liquidity. Concerning timing, the issuance of foreign currency SBN began at the beginning of 2017 with USD3 billion, equivalent to IDR40 trillion. This was done to raise the potential for spending at the beginning of the year and minimize instability in the domestic market. SBN were issued in tenors of three years, five years, up to 15 years, with this variation in tenors chosen to deepen the market and divide the risk on maturing SBN.
Overall, the financing through SBN and foreign loans kept government debt at a healthy level. The Government’s debt ratio in 2017 was also maintained at a low level and
in a safe corridor at 29.2% of GDP, little changed from 2016’s level of 27.8% of GDP. Government debt sourced from SBN reached 23.1% of GDP, while the remainder came from foreign loans (Chart 6.13). This ratio remains lower than that of other countries in the region, including Malaysia, Thailand and the Philippines (Chart 6.14).
By currency type, the Government’s debt position was dominated by the rupiah; rupiah-denominated debt increased to take a 59% share of the total in 2017, up from 57% in 2016 (Chart 6.15). The debt position in foreign currencies was dominated by US dollars at more than 70%, while the proportion of SBN denominated in foreign currencies has risen since 2015 (Chart 6.16).
Grafik 6.12.
-1
-3
-2
0
1
2
3
2007 2008 2009 2010 2011 2012 2013 2014 2015 2016 2017
Percent GDP
Fiscal Deficit Primary Balance
Source: Ministry of Finance, calculated
Chart 6.12. Fiscal Deficit and Primary Balance
Grafik 6.13.
0
5
10
15
20
25
30
35
40
2007 2008 2009 2010 2011 2012 2013 2014 2015 2016 2017
Percent GDP
SBN External Debt Total Debt
Source: Ministry of Finance, calculated
Chart 6.13. Composition of Government Debt to GDP
10
20
30
40
50
60
70
80
2012 2013 2014 2015 2016 2017
Percent GDP
Indonesia India
Thailand Vietnam
Malaysia The Philippines
Gra�k 6.14.
Source: IMF, calculated
Chart 6.14. Government Debt Ratios of Selected Countries
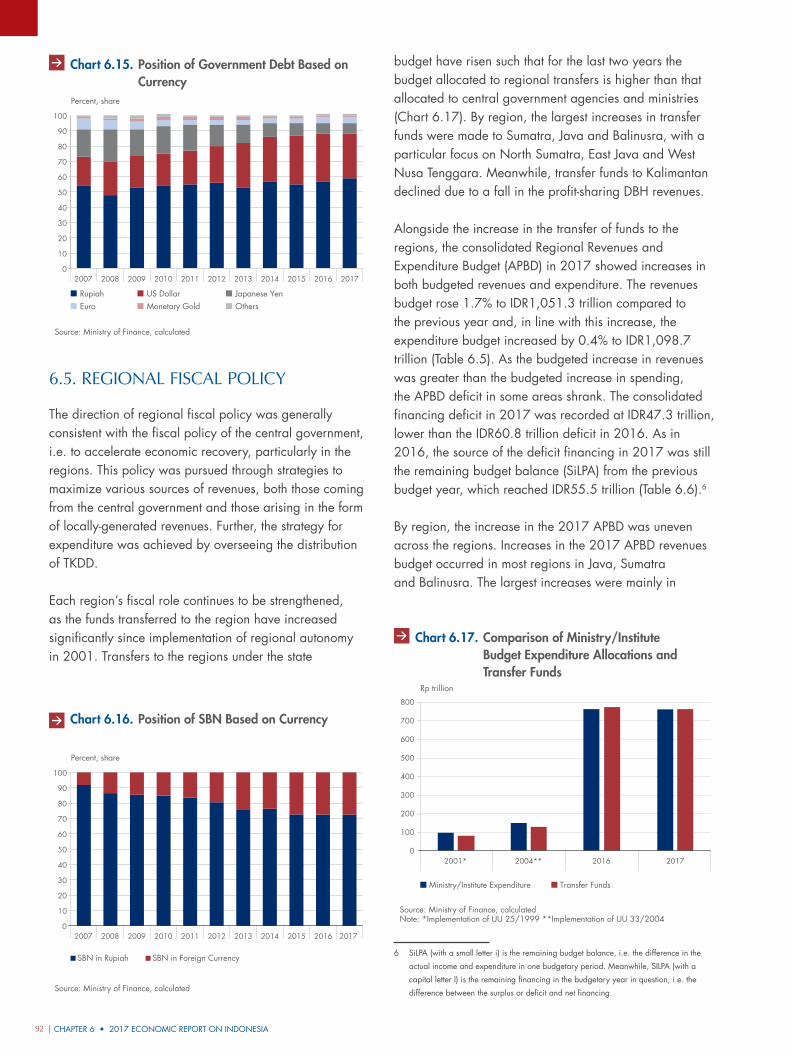
CHAPTER 6 • 2017 ECONOMIC REPORT ON INDONESIA92 |
Grafik 6.15.
0
10
20
30
40
50
60
70
80
90
100
2007 2008 2009 2010 2011 2012 2013 2014 2015 2016 2017
Percent, share
Rupiah US Dollar Japanese YenEuro Monetary Gold Others
Source: Ministry of Finance, calculated
Chart 6.15. Position of Government Debt Based on Currency
6.5. Regional Fiscal policy
The direction of regional fiscal policy was generally consistent with the fiscal policy of the central government, i.e. to accelerate economic recovery, particularly in the regions. This policy was pursued through strategies to maximize various sources of revenues, both those coming from the central government and those arising in the form of locally-generated revenues. Further, the strategy for expenditure was achieved by overseeing the distribution of TKDD.
Each region’s fiscal role continues to be strengthened, as the funds transferred to the region have increased significantly since implementation of regional autonomy in 2001. Transfers to the regions under the state
budget have risen such that for the last two years the budget allocated to regional transfers is higher than that allocated to central government agencies and ministries (Chart 6.17). By region, the largest increases in transfer funds were made to Sumatra, Java and Balinusra, with a particular focus on North Sumatra, East Java and West Nusa Tenggara. Meanwhile, transfer funds to Kalimantan declined due to a fall in the profit-sharing DBH revenues.
Alongside the increase in the transfer of funds to the regions, the consolidated Regional Revenues and Expenditure Budget (APBD) in 2017 showed increases in both budgeted revenues and expenditure. The revenues budget rose 1.7% to IDR1,051.3 trillion compared to the previous year and, in line with this increase, the expenditure budget increased by 0.4% to IDR1,098.7 trillion (Table 6.5). As the budgeted increase in revenues was greater than the budgeted increase in spending, the APBD deficit in some areas shrank. The consolidated financing deficit in 2017 was recorded at IDR47.3 trillion, lower than the IDR60.8 trillion deficit in 2016. As in 2016, the source of the deficit financing in 2017 was still the remaining budget balance (SiLPA) from the previous budget year, which reached IDR55.5 trillion (Table 6.6).6
By region, the increase in the 2017 APBD was uneven across the regions. Increases in the 2017 APBD revenues budget occurred in most regions in Java, Sumatra and Balinusra. The largest increases were mainly in
6 SiLPA (with a small letter i) is the remaining budget balance, i.e. the difference in the
actual income and expenditure in one budgetary period. Meanwhile, SILPA (with a
capital letter I) is the remaining financing in the budgetary year in question, i.e. the
difference between the surplus or deficit and net financing.
Grafik 6.16.
0
10
20
30
40
50
60
70
80
90
100
2007 2008 2009 2010 2011 2012 2013 2014 2015 2016 2017
Percent, share
Source: Ministry of Finance, calculated
SBN in Rupiah SBN in Foreign Currency
Chart 6.16. Position of SBN Based on Currency
Grafik 6.17 Judul
Note: *Implementation of UU 25/1999 **Implementation of UU 33/2004
Rp trillion
800
700
600
500
400
300
200
100
0
Source: Ministry of Finance, calculated
Ministry/Institute Expenditure Transfer Funds
2001* 2004** 2016 2017
Chart 6.17. Comparison of Ministry/Institute Budget Expenditure Allocations and Transfer Funds
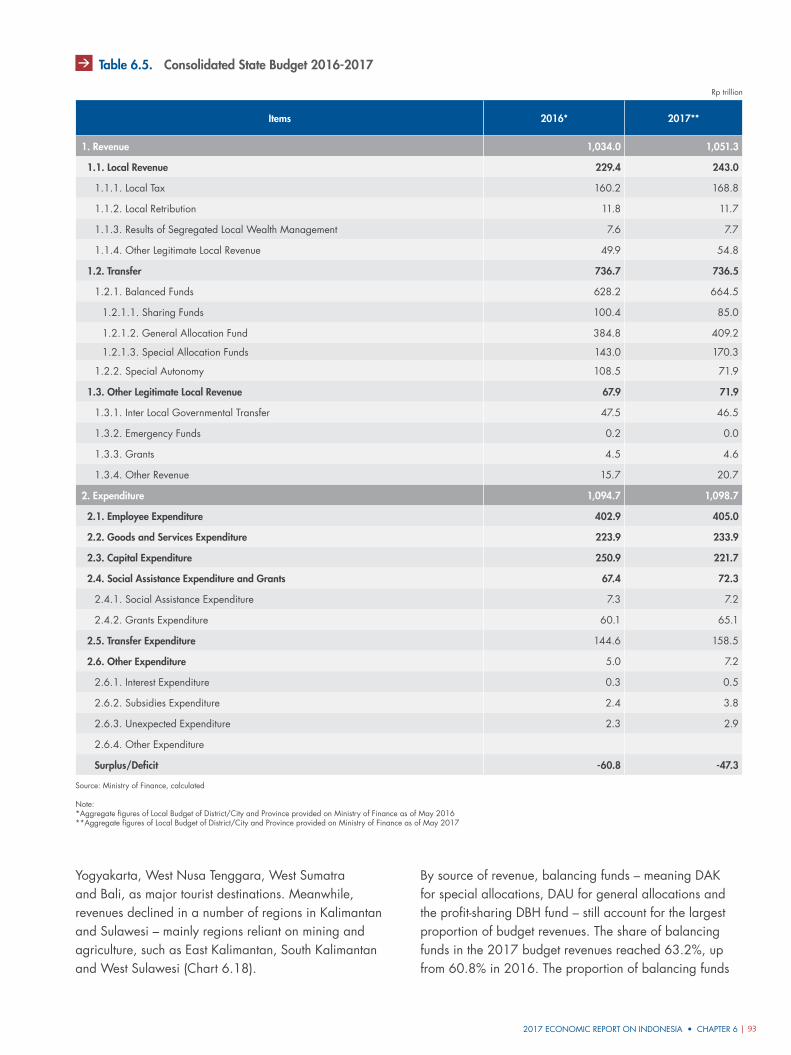
2017 ECONOMIC REPORT ON INDONESIA • CHAPTER 6 | 93
Yogyakarta, West Nusa Tenggara, West Sumatra and Bali, as major tourist destinations. Meanwhile, revenues declined in a number of regions in Kalimantan and Sulawesi – mainly regions reliant on mining and agriculture, such as East Kalimantan, South Kalimantan and West Sulawesi (Chart 6.18).
By source of revenue, balancing funds – meaning DAK for special allocations, DAU for general allocations and the profit-sharing DBH fund – still account for the largest proportion of budget revenues. The share of balancing funds in the 2017 budget revenues reached 63.2%, up from 60.8% in 2016. The proportion of balancing funds
Rp trillion
Items 2016* 2017**
1. Revenue 1,034.0 1,051.3
1.1. Local Revenue 229.4 243.0
1.1.1. Local Tax 160.2 168.8
1.1.2. Local Retribution 11.8 11.7
1.1.3. Results of Segregated Local Wealth Management 7.6 7.7
1.1.4. Other Legitimate Local Revenue 49.9 54.8
1.2. Transfer 736.7 736.5
1.2.1. Balanced Funds 628.2 664.5
1.2.1.1. Sharing Funds 100.4 85.0
1.2.1.2. General Allocation Fund 384.8 409.2
1.2.1.3. Special Allocation Funds 143.0 170.3
1.2.2. Special Autonomy 108.5 71.9
1.3. Other Legitimate Local Revenue 67.9 71.9
1.3.1. Inter Local Governmental Transfer 47.5 46.5
1.3.2. Emergency Funds 0.2 0.0
1.3.3. Grants 4.5 4.6
1.3.4. Other Revenue 15.7 20.7
2. Expenditure 1,094.7 1,098.7
2.1. Employee Expenditure 402.9 405.0
2.2. Goods and Services Expenditure 223.9 233.9
2.3. Capital Expenditure 250.9 221.7
2.4. Social Assistance Expenditure and Grants 67.4 72.3
2.4.1. Social Assistance Expenditure 7.3 7.2
2.4.2. Grants Expenditure 60.1 65.1
2.5. Transfer Expenditure 144.6 158.5
2.6. Other Expenditure 5.0 7.2
2.6.1. Interest Expenditure 0.3 0.5
2.6.2. Subsidies Expenditure 2.4 3.8
2.6.3. Unexpected Expenditure 2.3 2.9
2.6.4. Other Expenditure
Surplus/Deficit ‑60.8 ‑47.3
Source: Ministry of Finance, calculated
Note:*Aggregate figures of Local Budget of District/City and Province provided on Ministry of Finance as of May 2016**Aggregate figures of Local Budget of District/City and Province provided on Ministry of Finance as of May 2017
Table 6.5. Consolidated State Budget 2016‑2017
CHAPTER 6 • 2017 ECONOMIC REPORT ON INDONESIA94 |
in the budget revenues is lowest in Java and in North Sumatra, Riau and the Riau Islands. In comparison, in most other regions of Sumatra, Sulawesi, Mapua, Balinusra (excluding Bali) and Kalimantan (excluding East Kalimantan and South Kalimantan) the share of balancing funds as a proportion of total income exceeds 75%.
Breaking down the balancing funds by component, DAK in the 2017 APBD regional budget increased in line with government policy to raise spending on infrastructure in the regions and improve public services. DAK rose by 19.1% underpinned by a reformulation of the policy on its disbursement. When allocating physical DAK – funds to be spent on infrastructure – the central government also took into account the proposals of the regional governments. Besides physical and non-physical DAK, the central government also allocates funding – known as physical affirmation DAK – for the development of underdeveloped regions, borders, islands and areas of transmigration. In
Grafik 6.18 Judul
Rp trillion
450
400
350
300
250
200
150
100
50
0
2015 2016 2017
Sumatra Java Kalimantan Balinusra Sulawesi Mapua
Source: Ministry of Finance, calculated
Chart 6.18. Revenue Budgets by Region
relation to the mechanism to disburse DAK, disbursement is based on fund absorption performance based on a quarterly review and the region’s output. DAK rose in the 2017 APBD regional budget in most regions, with the highest increases seen in East Java, North Sumatra and South Sumatra at over 50%.
The second balancing funds component, DAU or the general allocation budget, was also increased as part of the drive to strengthen local government. Nonetheless, this increase in DAU in the 2017 APBD regional budget was limited – up 6.3% from 2016 – due to the impact of applying the allocation adjustment policy. In 2017, a more flexible DAU policy ceiling was implemented. This affected the amount of DAU in each region, with the actual distributed DAU adjusted for the ups and downs of net domestic revenues. The limited increase in DAU was also affected by the policy, implemented in 2017, of limiting expenditure on regional civil servant salaries, one component of the DAU calculation.
The use of profit-sharing funds (DBH) as a balancing fund was also expanded to meet regional needs and priorities and bolster regional economic activity, in accordance with Law No.18 of 2016 concerning the 2017 APBN. In essence, 50% of the DBH received by a local government from excise tax on tobacco products can be used for other priorities, as decided by the local government. In the case of additional oil and gas natural resources, the rule allows for 0.50%.
Unlike DAK and DAU, which rose during this period of expansionary policy, the role of DBH fell in the 2017 regional budget, due to the decline in natural resource revenues from oil and gas and non-oil and gas mining. The share of DBH in the regional budget fell 15.3% compared to 2016, as a result of lower oil and gas liftings
Table 6.6. Surplus, Deficit, and Regional Budget Surplus (SiLPA)
Rp trillion
Region2016 2017
Deficit Realization SiLPA Local Budget Deficit SiLPA
Sumatra -13.7 16.2 -9.7 11.9
Java -26.7 36.6 -21.3 27.3
Kalimantan -10.3 11.8 -6.2 5.8
Balinusra -2.6 3.2 -3.7 3.8
Sulawesi -3.7 3.6 -3.3 3.3
Mapua -3.8 4.0 -3.0 3.5
Source: Ministry of Finance, calculated
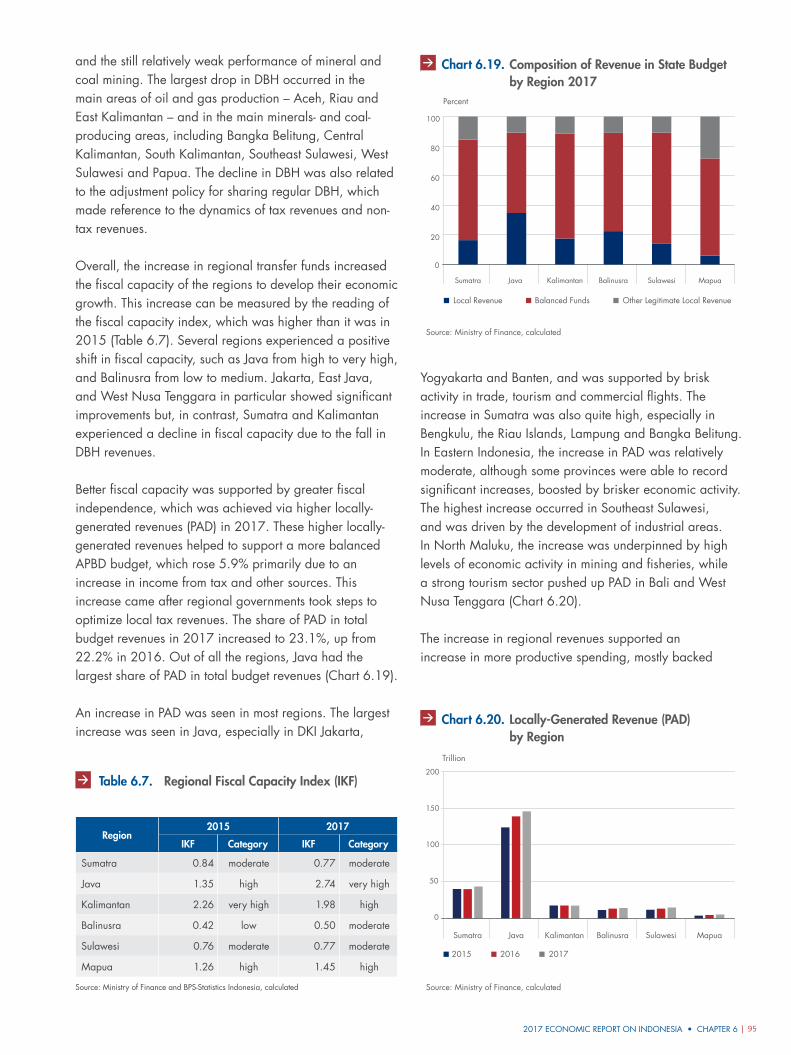
2017 ECONOMIC REPORT ON INDONESIA • CHAPTER 6 | 95
and the still relatively weak performance of mineral and coal mining. The largest drop in DBH occurred in the main areas of oil and gas production – Aceh, Riau and East Kalimantan – and in the main minerals- and coal-producing areas, including Bangka Belitung, Central Kalimantan, South Kalimantan, Southeast Sulawesi, West Sulawesi and Papua. The decline in DBH was also related to the adjustment policy for sharing regular DBH, which made reference to the dynamics of tax revenues and non-tax revenues.
Overall, the increase in regional transfer funds increased the fiscal capacity of the regions to develop their economic growth. This increase can be measured by the reading of the fiscal capacity index, which was higher than it was in 2015 (Table 6.7). Several regions experienced a positive shift in fiscal capacity, such as Java from high to very high, and Balinusra from low to medium. Jakarta, East Java, and West Nusa Tenggara in particular showed significant improvements but, in contrast, Sumatra and Kalimantan experienced a decline in fiscal capacity due to the fall in DBH revenues.
Better fiscal capacity was supported by greater fiscal independence, which was achieved via higher locally-generated revenues (PAD) in 2017. These higher locally-generated revenues helped to support a more balanced APBD budget, which rose 5.9% primarily due to an increase in income from tax and other sources. This increase came after regional governments took steps to optimize local tax revenues. The share of PAD in total budget revenues in 2017 increased to 23.1%, up from 22.2% in 2016. Out of all the regions, Java had the largest share of PAD in total budget revenues (Chart 6.19).
An increase in PAD was seen in most regions. The largest increase was seen in Java, especially in DKI Jakarta,
Yogyakarta and Banten, and was supported by brisk activity in trade, tourism and commercial flights. The increase in Sumatra was also quite high, especially in Bengkulu, the Riau Islands, Lampung and Bangka Belitung. In Eastern Indonesia, the increase in PAD was relatively moderate, although some provinces were able to record significant increases, boosted by brisker economic activity. The highest increase occurred in Southeast Sulawesi, and was driven by the development of industrial areas. In North Maluku, the increase was underpinned by high levels of economic activity in mining and fisheries, while a strong tourism sector pushed up PAD in Bali and West Nusa Tenggara (Chart 6.20).
The increase in regional revenues supported an increase in more productive spending, mostly backed
Region2015 2017
IKF Category IKF Category
Sumatra 0.84 moderate 0.77 moderate
Java 1.35 high 2.74 very high
Kalimantan 2.26 very high 1.98 high
Balinusra 0.42 low 0.50 moderate
Sulawesi 0.76 moderate 0.77 moderate
Mapua 1.26 high 1.45 high
Source: Ministry of Finance and BPS-Statistics Indonesia, calculated
Table 6.7. Regional Fiscal Capacity Index (IKF)
Grafik 6.19. Lorem Ipsum
Source: Ministry of Finance, calculated
Local Revenue Balanced Funds Other Legitimate Local Revenue
0
20
40
60
80
100
Sumatra Java Kalimantan Sulawesi MapuaBalinusra
Percent
Chart 6.19. Composition of Revenue in State Budget by Region 2017
Grafik 6.20. Lorem Ipsum
Source: Ministry of Finance, calculated
Trillion
2015 2016 2017
0
50
100
150
200
Sumatra Java Kalimantan Sulawesi MapuaBalinusra
Chart 6.20. Locally‑Generated Revenue (PAD) by Region
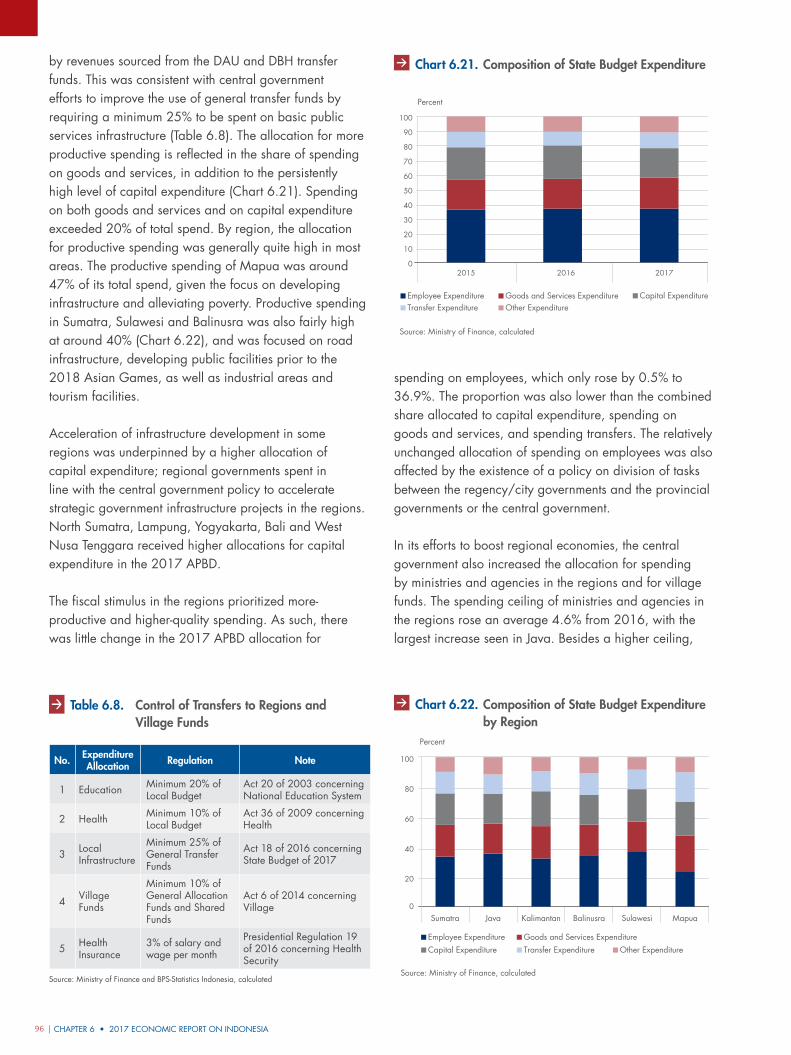
CHAPTER 6 • 2017 ECONOMIC REPORT ON INDONESIA96 |
by revenues sourced from the DAU and DBH transfer funds. This was consistent with central government efforts to improve the use of general transfer funds by requiring a minimum 25% to be spent on basic public services infrastructure (Table 6.8). The allocation for more productive spending is reflected in the share of spending on goods and services, in addition to the persistently high level of capital expenditure (Chart 6.21). Spending on both goods and services and on capital expenditure exceeded 20% of total spend. By region, the allocation for productive spending was generally quite high in most areas. The productive spending of Mapua was around 47% of its total spend, given the focus on developing infrastructure and alleviating poverty. Productive spending in Sumatra, Sulawesi and Balinusra was also fairly high at around 40% (Chart 6.22), and was focused on road infrastructure, developing public facilities prior to the 2018 Asian Games, as well as industrial areas and tourism facilities.
Acceleration of infrastructure development in some regions was underpinned by a higher allocation of capital expenditure; regional governments spent in line with the central government policy to accelerate strategic government infrastructure projects in the regions. North Sumatra, Lampung, Yogyakarta, Bali and West Nusa Tenggara received higher allocations for capital expenditure in the 2017 APBD.
The fiscal stimulus in the regions prioritized more-productive and higher-quality spending. As such, there was little change in the 2017 APBD allocation for
spending on employees, which only rose by 0.5% to 36.9%. The proportion was also lower than the combined share allocated to capital expenditure, spending on goods and services, and spending transfers. The relatively unchanged allocation of spending on employees was also affected by the existence of a policy on division of tasks between the regency/city governments and the provincial governments or the central government.
In its efforts to boost regional economies, the central government also increased the allocation for spending by ministries and agencies in the regions and for village funds. The spending ceiling of ministries and agencies in the regions rose an average 4.6% from 2016, with the largest increase seen in Java. Besides a higher ceiling,
Table 6.8. Control of Transfers to Regions and Village Funds
Employee ExpenditureTransfer Expenditure
Goods and Services ExpenditureOther Expenditure
Grafik 6.22. Lorem Ipsum
Percent
Capital Expenditure
0
10
20
30
40
50
60
70
80
90
100
2015 2016 2017
Source: Ministry of Finance, calculated
Chart 6.21. Composition of State Budget Expenditure
Employee Expenditure Goods and Services ExpenditureCapital Expenditure Transfer Expenditure Other Expenditure
20
0
40
60
80
100
Sumatra Java Kalimantan Sulawesi MapuaBalinusra
Grafik 6.23. Xxx
Source: Ministry of Finance, calculated
Percent
Chart 6.22. Composition of State Budget Expenditure by Region
No. Expenditure Allocation Regulation Note
1 Education Minimum 20% of Local Budget
Act 20 of 2003 concerning National Education System
2 Health Minimum 10% of Local Budget
Act 36 of 2009 concerning Health
3 Local Infrastructure
Minimum 25% of General Transfer Funds
Act 18 of 2016 concerning State Budget of 2017
4 Village Funds
Minimum 10% of General Allocation Funds and Shared Funds
Act 6 of 2014 concerning Village
5 Health Insurance
3% of salary and wage per month
Presidential Regulation 19 of 2016 concerning Health Security
Source: Ministry of Finance and BPS-Statistics Indonesia, calculated
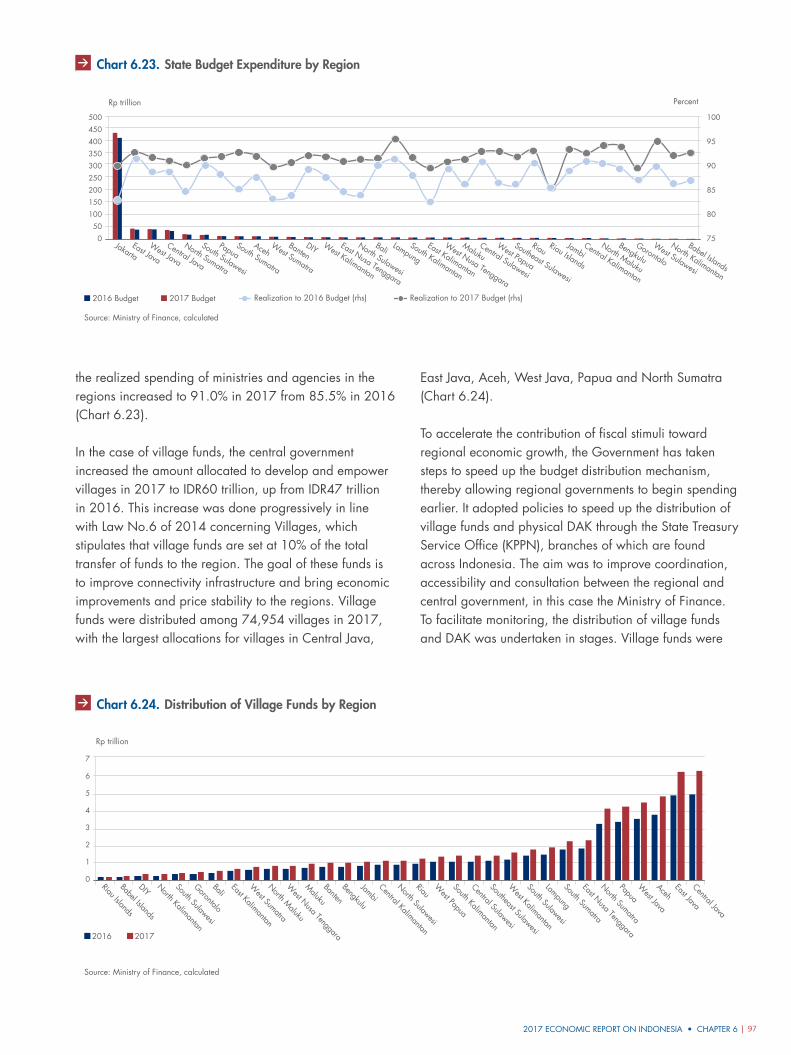
2017 ECONOMIC REPORT ON INDONESIA • CHAPTER 6 | 97
the realized spending of ministries and agencies in the regions increased to 91.0% in 2017 from 85.5% in 2016 (Chart 6.23).
In the case of village funds, the central government increased the amount allocated to develop and empower villages in 2017 to IDR60 trillion, up from IDR47 trillion in 2016. This increase was done progressively in line with Law No.6 of 2014 concerning Villages, which stipulates that village funds are set at 10% of the total transfer of funds to the region. The goal of these funds is to improve connectivity infrastructure and bring economic improvements and price stability to the regions. Village funds were distributed among 74,954 villages in 2017, with the largest allocations for villages in Central Java,
East Java, Aceh, West Java, Papua and North Sumatra (Chart 6.24).
To accelerate the contribution of fiscal stimuli toward regional economic growth, the Government has taken steps to speed up the budget distribution mechanism, thereby allowing regional governments to begin spending earlier. It adopted policies to speed up the distribution of village funds and physical DAK through the State Treasury Service Office (KPPN), branches of which are found across Indonesia. The aim was to improve coordination, accessibility and consultation between the regional and central government, in this case the Ministry of Finance. To facilitate monitoring, the distribution of village funds and DAK was undertaken in stages. Village funds were
Grafik 6.24. Xxx
Source: Ministry of Finance, calculated
75
80
85
90
95
100
0
50
100
150
200
250
300
350
400
450
500
JakartaEast Java
West Java
Central Java
North Sumatra
South Sulawesi
PapuaSouth Sumatra
AcehWest Sumatra
BantenDIY West Kalimantan
East Nusa Tenggara
North Sulawesi
BaliLampung
South Kalimantan
East Kalimantan
West Nusa Tenggara
MalukuCentral Sulawesi
West Papua
Southeast Sulawesi
RiauRiau Islands
JambiCentral Kalimantan
North Maluku
Bengkulu
Gorontalo
West Sulawesi
North Kalimantan
Babel Islands
2016 Budget 2017 Budget Realization to 2017 Budget (rhs)Realization to 2016 Budget (rhs)
Rp trillion Percent
Chart 6.23. State Budget Expenditure by Region
Grafik 6.25. Xxx
Rp trillion
2016 2017
0
1
2
3
4
5
6
7
Riau Islands
Babel Islands
DIYNorth Kalimantan
South Sulawesi
Gorontalo
BaliEast Kalimantan
West Sumatra
North Maluku
West Nusa Tenggara
Maluku
Banten
Bengkulu
Jambi
Central Kalimantan
North Sulawesi
RiauW
est Papua
South Kalimantan
Central Sulawesi
Southeast Sulawesi
West Kalimantan
South Sulawesi
Lampung
South Sumatra
East Nusa Tenggara
North Sumatra
PapuaW
est Java
AcehEast Java
Central Java
Source: Ministry of Finance, calculated
Chart 6.24. Distribution of Village Funds by Region
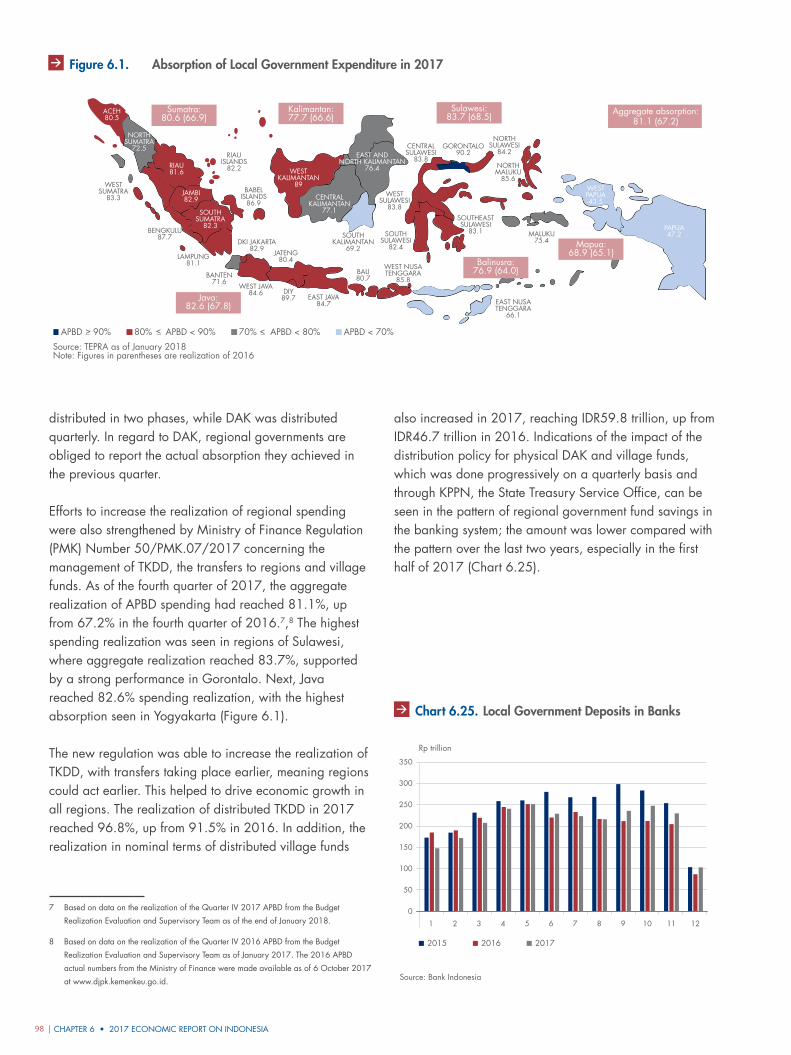
CHAPTER 6 • 2017 ECONOMIC REPORT ON INDONESIA98 |
distributed in two phases, while DAK was distributed quarterly. In regard to DAK, regional governments are obliged to report the actual absorption they achieved in the previous quarter.
Efforts to increase the realization of regional spending were also strengthened by Ministry of Finance Regulation (PMK) Number 50/PMK.07/2017 concerning the management of TKDD, the transfers to regions and village funds. As of the fourth quarter of 2017, the aggregate realization of APBD spending had reached 81.1%, up from 67.2% in the fourth quarter of 2016.7,8 The highest spending realization was seen in regions of Sulawesi, where aggregate realization reached 83.7%, supported by a strong performance in Gorontalo. Next, Java reached 82.6% spending realization, with the highest absorption seen in Yogyakarta (Figure 6.1).
The new regulation was able to increase the realization of TKDD, with transfers taking place earlier, meaning regions could act earlier. This helped to drive economic growth in all regions. The realization of distributed TKDD in 2017 reached 96.8%, up from 91.5% in 2016. In addition, the realization in nominal terms of distributed village funds
7 Based on data on the realization of the Quarter IV 2017 APBD from the Budget
Realization Evaluation and Supervisory Team as of the end of January 2018.
8 Based on data on the realization of the Quarter IV 2016 APBD from the Budget
Realization Evaluation and Supervisory Team as of January 2017. The 2016 APBD
actual numbers from the Ministry of Finance were made available as of 6 October 2017
at www.djpk.kemenkeu.go.id.
also increased in 2017, reaching IDR59.8 trillion, up from IDR46.7 trillion in 2016. Indications of the impact of the distribution policy for physical DAK and village funds, which was done progressively on a quarterly basis and through KPPN, the State Treasury Service Office, can be seen in the pattern of regional government fund savings in the banking system; the amount was lower compared with the pattern over the last two years, especially in the first half of 2017 (Chart 6.25).
Grafik 10.1. Peta Pertumbuhan Ekonomi Daerah 2016
APBD < 70%70% APBD < 80%>_APBD 90%>_ 80% APBD < 90%>_
Source: TEPRA as of January 2018Note: Figures in parentheses are realization of 2016
ACEH80.5
NORTHSUMATRA
72.5
RIAU81.6 WEST
KALIMANTAN89
EAST ANDNORTH KALIMANTAN
76.4
SOUTHKALIMANTAN
69.2
CENTRALKALIMANTAN
77.1
JAMBI82.9
SOUTHSUMATRA
82.3
RIAUISLANDS
82.2
WESTSUMATRA
83.3
BENGKULU87.7
LAMPUNG81.1
DKI JAKARTA82.9
BANTEN71.6
WEST JAVA84.6
JATENG80.4
BALI80.7
WEST NUSATENGGARA
85.8
EAST NUSATENGGARA
66.1
CENTRALSULAWESI
83.8
NORTHSULAWESI
84.2GORONTALO
90.2
WESTSULAWESI
83.8
SOUTHSULAWESI
82.4
SOUTHEASTSULAWESI
83.1
NORTHMALUKU
85.6
MALUKU75.4
WESTPAPUA43.5
PAPUA47.2
EAST JAVA84.7
DIY89.7
BABELISLANDS
86.9
Sumatra:80.6 (66.9)
Java:82.6 (67.8)
Aggregate absorption:81.1 (67.2)
Kalimantan:77.7 (66.6)
Sulawesi:83.7 (68.5)
Balinusra:76.9 (64.0)
Mapua:68.9 (65.1)
Figure 6.1. Absorption of Local Government Expenditure in 2017
Rp trillion
1 2 3 4 5 6 7 8 9 10 11 12
2015 2016 2017
Grafik 6.26. Realisasi Penggunaan Dana Desa Menurut Kegiatan
Source: Bank Indonesia
0
50
100
150
200
250
300
350
Chart 6.25. Local Government Deposits in Banks
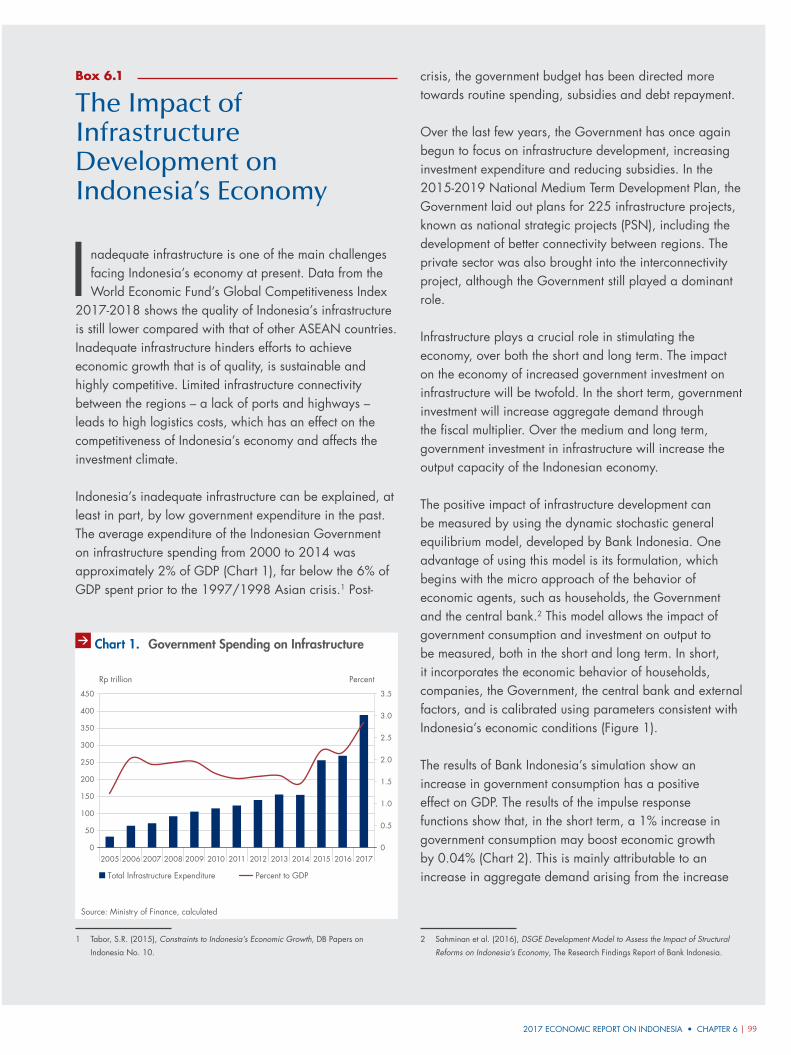
2017 ECONOMIC REPORT ON INDONESIA • CHAPTER 6 | 99
Box 6.1
The Impact of Infrastructure Development on Indonesia’s Economy
I nadequate infrastructure is one of the main challenges facing Indonesia’s economy at present. Data from the World Economic Fund’s Global Competitiveness Index
2017-2018 shows the quality of Indonesia’s infrastructure is still lower compared with that of other ASEAN countries. Inadequate infrastructure hinders efforts to achieve economic growth that is of quality, is sustainable and highly competitive. Limited infrastructure connectivity between the regions – a lack of ports and highways – leads to high logistics costs, which has an effect on the competitiveness of Indonesia’s economy and affects the investment climate.
Indonesia’s inadequate infrastructure can be explained, at least in part, by low government expenditure in the past. The average expenditure of the Indonesian Government on infrastructure spending from 2000 to 2014 was approximately 2% of GDP (Chart 1), far below the 6% of GDP spent prior to the 1997/1998 Asian crisis.1 Post-
1 Tabor, S.R. (2015), Constraints to Indonesia’s Economic Growth, DB Papers on
Indonesia No. 10.
crisis, the government budget has been directed more towards routine spending, subsidies and debt repayment.
Over the last few years, the Government has once again begun to focus on infrastructure development, increasing investment expenditure and reducing subsidies. In the 2015-2019 National Medium Term Development Plan, the Government laid out plans for 225 infrastructure projects, known as national strategic projects (PSN), including the development of better connectivity between regions. The private sector was also brought into the interconnectivity project, although the Government still played a dominant role.
Infrastructure plays a crucial role in stimulating the economy, over both the short and long term. The impact on the economy of increased government investment on infrastructure will be twofold. In the short term, government investment will increase aggregate demand through the fiscal multiplier. Over the medium and long term, government investment in infrastructure will increase the output capacity of the Indonesian economy.
The positive impact of infrastructure development can be measured by using the dynamic stochastic general equilibrium model, developed by Bank Indonesia. One advantage of using this model is its formulation, which begins with the micro approach of the behavior of economic agents, such as households, the Government and the central bank.2 This model allows the impact of government consumption and investment on output to be measured, both in the short and long term. In short, it incorporates the economic behavior of households, companies, the Government, the central bank and external factors, and is calibrated using parameters consistent with Indonesia’s economic conditions (Figure 1).
The results of Bank Indonesia’s simulation show an increase in government consumption has a positive effect on GDP. The results of the impulse response functions show that, in the short term, a 1% increase in government consumption may boost economic growth by 0.04% (Chart 2). This is mainly attributable to an increase in aggregate demand arising from the increase
2 Sahminan et al. (2016), DSGE Development Model to Assess the Impact of Structural
Reforms on Indonesia’s Economy, The Research Findings Report of Bank Indonesia.
Gra�k 1.
Source: Ministry of Finance, calculated
0
0.5
1.0
1.5
2.0
2.5
3.0
3.5
0
50
100
150
200
250
300
350
400
450
2005 2006 2007 2008 2009 2010 2011 2012 2013 2014 2015 2016 2017
Total Infrastructure Expenditure Percent to GDP
PercentRp trillion
Chart 1. Government Spending on Infrastructure
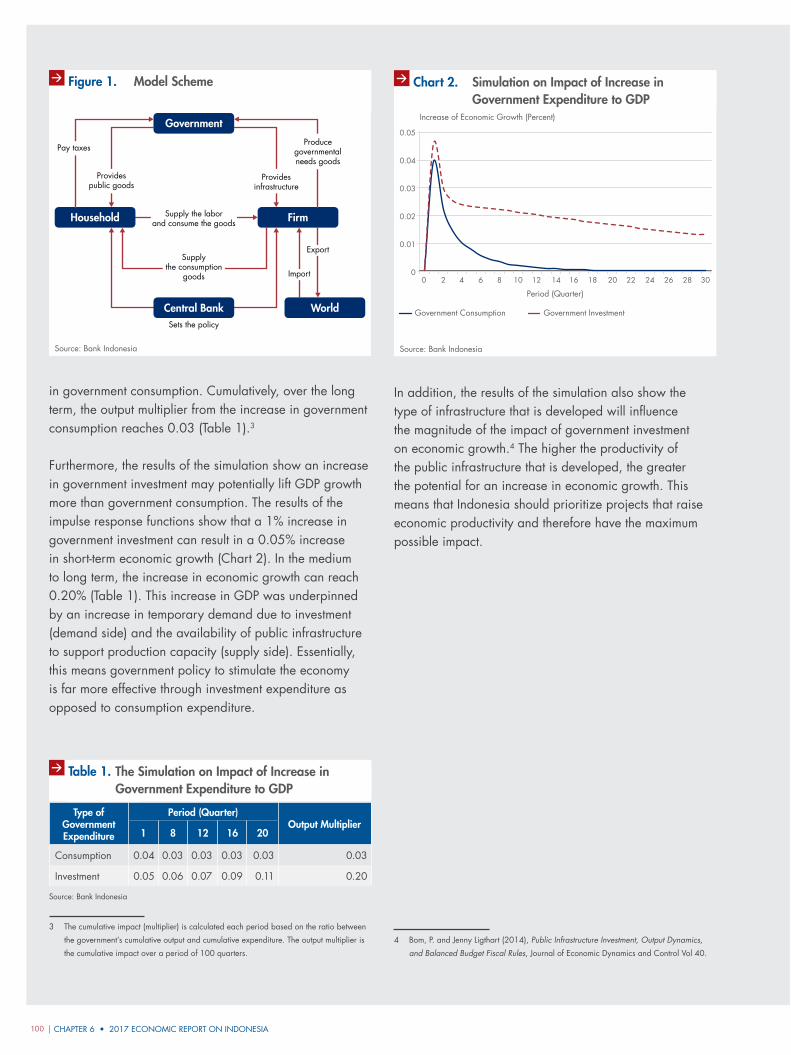
CHAPTER 6 • 2017 ECONOMIC REPORT ON INDONESIA100 |
in government consumption. Cumulatively, over the long term, the output multiplier from the increase in government consumption reaches 0.03 (Table 1).3
Furthermore, the results of the simulation show an increase in government investment may potentially lift GDP growth more than government consumption. The results of the impulse response functions show that a 1% increase in government investment can result in a 0.05% increase in short-term economic growth (Chart 2). In the medium to long term, the increase in economic growth can reach 0.20% (Table 1). This increase in GDP was underpinned by an increase in temporary demand due to investment (demand side) and the availability of public infrastructure to support production capacity (supply side). Essentially, this means government policy to stimulate the economy is far more effective through investment expenditure as opposed to consumption expenditure.
3 The cumulative impact (multiplier) is calculated each period based on the ratio between
the government’s cumulative output and cumulative expenditure. The output multiplier is
the cumulative impact over a period of 100 quarters.
Gra�k 7.15. Hasil Simulasi Dampak PeningkatanPengeluaran Pemerintah Terhadap Output
Source: Bank Indonesia
0.01
0
0.02
0.03
0.04
0.05
20 4 6 8 10 12 14 16 18 20 22 24 26 28 30
Government Consumption Government Investment
Increase of Economic Growth (Percent)
Period (Quarter)
Chart 2. Simulation on Impact of Increase in Government Expenditure to GDP
Type of Government Expenditure
Period (Quarter)Output Multiplier
1 8 12 16 20
Consumption 0.04 0.03 0.03 0.03 0.03 0.03
Investment 0.05 0.06 0.07 0.09 0.11 0.20
Source: Bank Indonesia
Table 1. The Simulation on Impact of Increase in Government Expenditure to GDP
In addition, the results of the simulation also show the type of infrastructure that is developed will influence the magnitude of the impact of government investment on economic growth.4 The higher the productivity of the public infrastructure that is developed, the greater the potential for an increase in economic growth. This means that Indonesia should prioritize projects that raise economic productivity and therefore have the maximum possible impact.
4 Bom, P. and Jenny Ligthart (2014), Public Infrastructure Investment, Output Dynamics,
and Balanced Budget Fiscal Rules, Journal of Economic Dynamics and Control Vol 40.
Gambar 1.
Source: Bank Indonesia
Firm
World
Household
Sets the policy
Government
Central Bank
Pay taxes
Providesinfrastructure
Supply the laborand consume the goods
Supplythe consumption
goods
Export
Import
Produce governmental needs goods
Provides public goods
Figure 1. Model Scheme


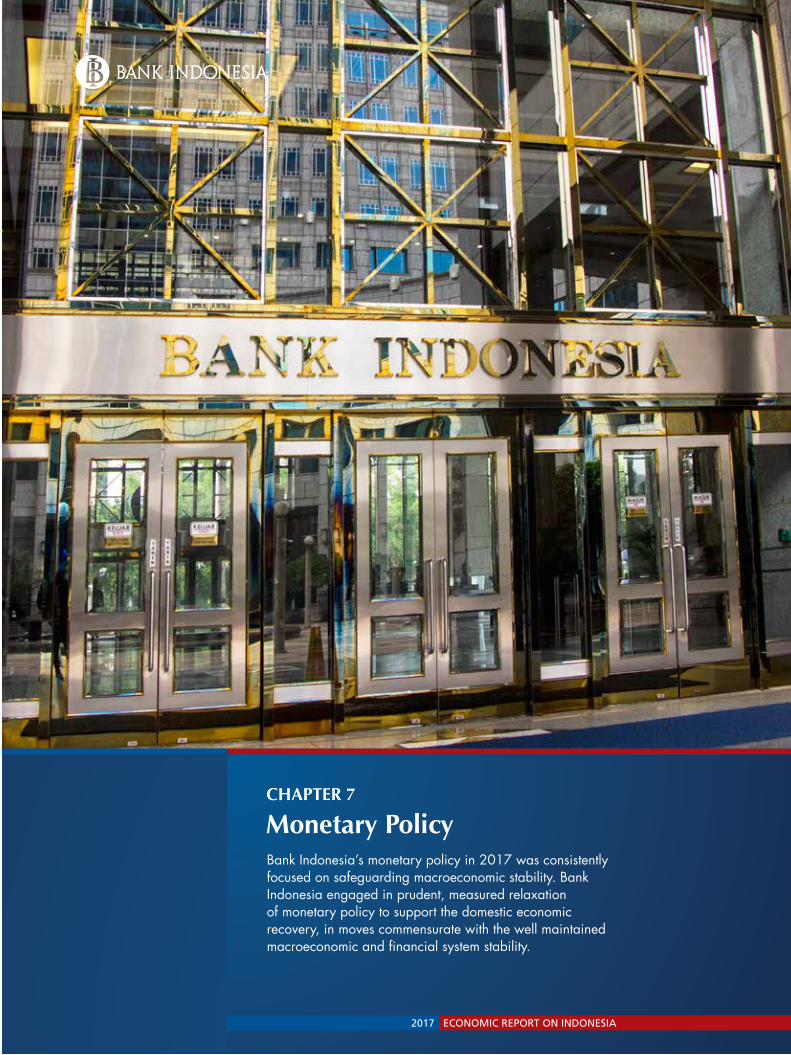
| 1032017 ECONOMIC REPORT ON INDONESIA
CHAPTER 7
Bank Indonesia’s monetary policy in 2017 was consistently focused on safeguarding macroeconomic stability. Bank Indonesia engaged in prudent, measured relaxation of monetary policy to support the domestic economic recovery, in moves commensurate with the well maintained macroeconomic and financial system stability.
Monetary Policy
CHAPTER 7 • 2017 ECONOMIC REPORT ON INDONESIA104 |
In 2017, Bank Indonesia maintained a consistent monetary policy focus on safeguarding macroeconomic stability. Bank Indonesia pursued a monetary policy stance commensurate with efforts to keep inflation within the target range and the current account deficit at a safe level. In line with the comfortably secure macroeconomic and financial system stability, Bank Indonesia pursued a cautious, measured relaxation of monetary policy to complement the relaxation cycle that has been underway since 2016. The monetary policy relaxation was intended to bolster the ongoing momentum for economic recovery. Bank Indonesia also employed exchange rate policy to safeguard macroeconomic stability; which was done by maintaining exchange rate stability in line with fundamentals, while also allowing market mechanisms to prevail. Further, to improve the effectiveness of monetary policy transmission, Bank Indonesia also strengthened monetary operations and took further steps to deepen the financial market. The financial market deepening policy was focused on three pillars of development: (i) sources of economic financing and mitigation of risks; (ii) market infrastructure; and (iii) policy coordination, regulatory harmonization, and education. This area of development has been pursued in part by enriching the variety of instruments used, expanding the market base, and building the integrity of market actors.
Events in 2017 indicate that monetary policy was transmitted well, although transmission through the credit channel was inadequate. Monetary policy relaxation with the lowering of the policy rate, the BI 7-Day (Reverse) Repo Rate (BI7DDR), was followed by downward movement in interbank money market rates and bank interest rates. The reductions in the policy rate also spurred increases in asset prices on the stock and bond markets and an expansion in non-bank financing. However, challenges in monetary policy transmission continued to surface in relation to the still-limited bank credit expansion. From an overall perspective, the monetary policy stance succeeded in maintaining macroeconomic stability in 2017, as inflation remained within the target range and the current account deficit was held at a prudent level. This effective maintenance of macroeconomic stability was due in part to close coordination of inflation control between Bank Indonesia and the central and regional governments.
7.1. Interest rate PolIcIes and MInIMuM reserve requIreMent ratIo
Bank Indonesia has consistently charted a course in monetary policy that is aimed to safeguard macroeconomic stability. Measures to protect macroeconomic stability are crucial, because the stability will provide a solid foundation for economic recovery. In this regard, Bank Indonesia’s measured monetary policy responses were pursued with caution, taking into account the dynamics and risks in both the global and the domestic economy. Broadly speaking, Indonesia successfully maintained macroeconomic stability, despite the emergence of challenges. The global challenge pertains to recovery in the world economy followed by monetary policy normalization in some advanced nations, which may trigger capital reversal to advanced economies. At home, with inflation on a downward trend, the challenge arises in finding measures to accelerate the corporate and banking consolidation, in order to boost momentum in the domestic economic recovery.
The monetary policy stance pursued by Bank Indonesia throughout 2017 was aligned with efforts to keep inflation within the target range and the current account deficit at a safe level. Inflation stayed within the target range throughout 2017 and closed the year at 3.61%, the third consecutive year in which Indonesia has achieved its inflation target. Inflation expectations for one to two years ahead were also anchored and moved stably within the target range. In addition, the current account deficit was managed at a comfortably safe level in 2017, easing to 1.7% of GDP from the 2016 level of 1.8% of GDP.
In policy implementation, Bank Indonesia proceeded in a cautious and measured manner to take advantage of the space available for monetary policy relaxation. During the first half of 2017, Bank Indonesia kept the BI7DRR policy rate on hold at 4.75%. This decision took into consideration the rising inflation expectations in the first half of 2017 (Chart 7.1). During the second half of 2017, Bank Indonesia harnessed the available space for relaxation by lowering the policy rate by 25 basis points in August and again in September 2017, resulting in a new BI7DRR rate level of 4.25% (Chart 7.2). These decisions were made after considering the declining inflation expectations, the safe level of the current account deficit, greater clarity in the direction of monetary policy normalization of the United States and progressive easing
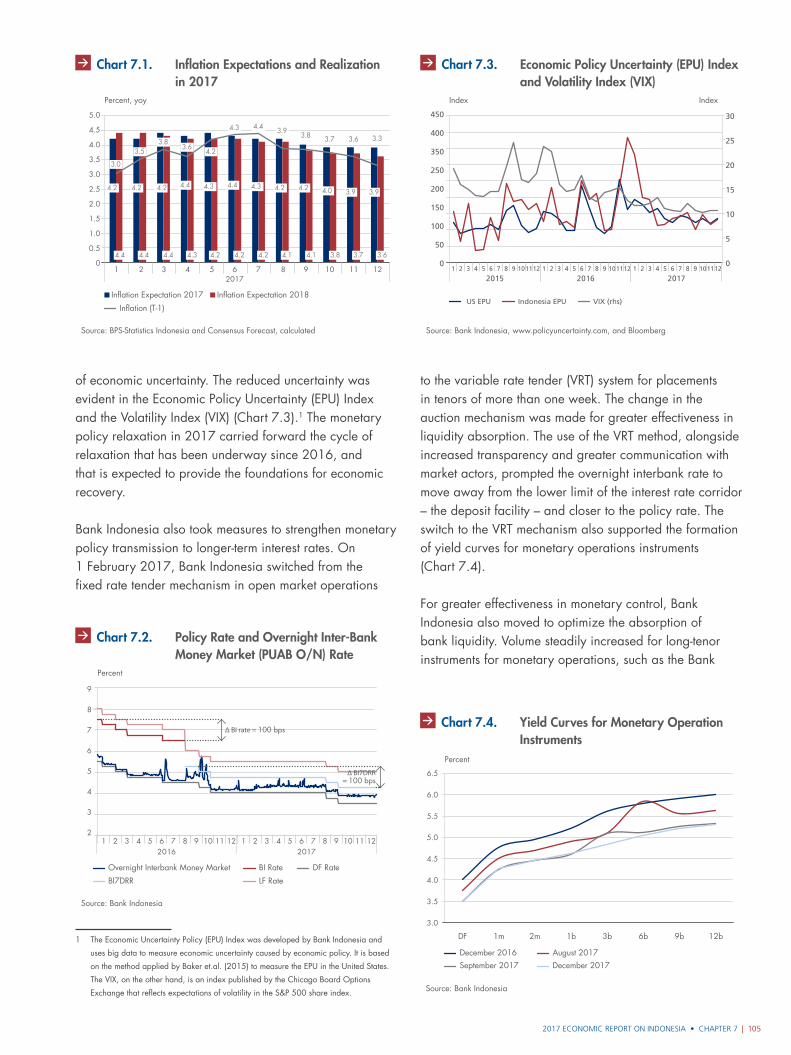
2017 ECONOMIC REPORT ON INDONESIA • CHAPTER 7 | 105
of economic uncertainty. The reduced uncertainty was evident in the Economic Policy Uncertainty (EPU) Index and the Volatility Index (VIX) (Chart 7.3).1 The monetary policy relaxation in 2017 carried forward the cycle of relaxation that has been underway since 2016, and that is expected to provide the foundations for economic recovery.
Bank Indonesia also took measures to strengthen monetary policy transmission to longer-term interest rates. On 1 February 2017, Bank Indonesia switched from the fixed rate tender mechanism in open market operations
1 The Economic Uncertainty Policy (EPU) Index was developed by Bank Indonesia and
uses big data to measure economic uncertainty caused by economic policy. It is based
on the method applied by Baker et.al. (2015) to measure the EPU in the United States.
The VIX, on the other hand, is an index published by the Chicago Board Options
Exchange that reflects expectations of volatility in the S&P 500 share index.
to the variable rate tender (VRT) system for placements in tenors of more than one week. The change in the auction mechanism was made for greater effectiveness in liquidity absorption. The use of the VRT method, alongside increased transparency and greater communication with market actors, prompted the overnight interbank rate to move away from the lower limit of the interest rate corridor – the deposit facility – and closer to the policy rate. The switch to the VRT mechanism also supported the formation of yield curves for monetary operations instruments (Chart 7.4).
For greater effectiveness in monetary control, Bank Indonesia also moved to optimize the absorption of bank liquidity. Volume steadily increased for long-tenor instruments for monetary operations, such as the Bank
Source: BPS-Statistics Indonesia and Consensus Forecast, calculated
Grafik 7.2. Lorem Ipsum
0.5
0
1.0
1.5
2.0
2.5
3.0
3.5
4.0
4.5
5.0
Percent, yoy
Inflation (T-1)
2 31 4 5 62017
7 8 9 10 11 12
Inflation Expectation 2017 Inflation Expectation 2018
4.24.2 4.2 4.4 4.3 4.4 4.3 4.2 4.2 4.0 3.9 3.9
4.44.4 4.4 4.3 4.2 4.2 4.2 4.1 4.1 3.8 3.7 3.6
3.0
3.53.8
3.6 4.2
4.3 4.4 3.9 3.8 3.7 3.6 3.3
Chart 7.1. Inflation Expectations and Realization in 2017
Source: Bank Indonesia
Grafik 7.3. Lorem Ipsum
2
3
4
6
5
7
8
9
Overnight Interbank Money Market BI Rate
BI7DRR
DF Rate
LF Rate
Percent
1 2 3 4 5 6 7 8 9 10 11 12 1 2 3 4 5 6 7 8 9 10 11 122016 2017
Δ BI rate = 100 bps
Δ BI7DRR= 100 bps
Chart 7.2. Policy Rate and Overnight Inter-Bank Money Market (PUAB O/N) Rate
Source: Bank Indonesia, www.policyuncertainty.com, and Bloomberg
Grafik 7.1. Lorem Ipsum
0
50
100
150
200
250
350
400
450
0
5
10
15
20
25
30
US EPU Indonesia EPU VIX (rhs)
1 2 3 4
20155 6 7 8 9 101112 1 2 3 4
20165 6 7 8 9 101112 1 2 3 4
20175 6 7 8 9 101112
IndexIndex
Chart 7.3. Economic Policy Uncertainty (EPU) Index and Volatility Index (VIX)
Source: Bank Indonesia
Grafik 7.4. Yield Curve Operasi Moneter (OPT)
Percent
December 2016 August 2017September 2017 December 2017
3.0
3.5
4.0
4.5
5.0
5.5
6.0
6.5
DF 1m 2m 1b 3b 6b 9b 12b
Chart 7.4. Yield Curves for Monetary Operation Instruments
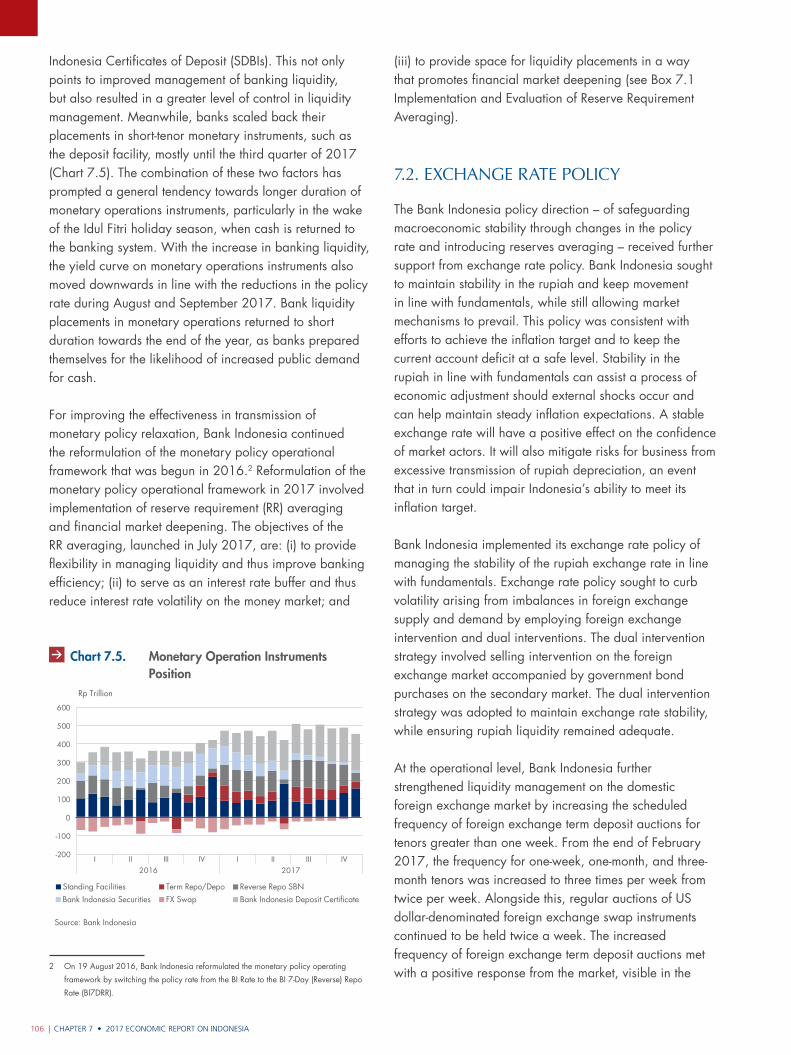
CHAPTER 7 • 2017 ECONOMIC REPORT ON INDONESIA106 |
Indonesia Certificates of Deposit (SDBIs). This not only points to improved management of banking liquidity, but also resulted in a greater level of control in liquidity management. Meanwhile, banks scaled back their placements in short-tenor monetary instruments, such as the deposit facility, mostly until the third quarter of 2017 (Chart 7.5). The combination of these two factors has prompted a general tendency towards longer duration of monetary operations instruments, particularly in the wake of the Idul Fitri holiday season, when cash is returned to the banking system. With the increase in banking liquidity, the yield curve on monetary operations instruments also moved downwards in line with the reductions in the policy rate during August and September 2017. Bank liquidity placements in monetary operations returned to short duration towards the end of the year, as banks prepared themselves for the likelihood of increased public demand for cash.
For improving the effectiveness in transmission of monetary policy relaxation, Bank Indonesia continued the reformulation of the monetary policy operational framework that was begun in 2016.2 Reformulation of the monetary policy operational framework in 2017 involved implementation of reserve requirement (RR) averaging and financial market deepening. The objectives of the RR averaging, launched in July 2017, are: (i) to provide flexibility in managing liquidity and thus improve banking efficiency; (ii) to serve as an interest rate buffer and thus reduce interest rate volatility on the money market; and
2 On 19 August 2016, Bank Indonesia reformulated the monetary policy operating
framework by switching the policy rate from the BI Rate to the BI 7-Day (Reverse) Repo
Rate (BI7DRR).
(iii) to provide space for liquidity placements in a way that promotes financial market deepening (see Box 7.1 Implementation and Evaluation of Reserve Requirement Averaging).
7.2. exchange rate PolIcy
The Bank Indonesia policy direction – of safeguarding macroeconomic stability through changes in the policy rate and introducing reserves averaging – received further support from exchange rate policy. Bank Indonesia sought to maintain stability in the rupiah and keep movement in line with fundamentals, while still allowing market mechanisms to prevail. This policy was consistent with efforts to achieve the inflation target and to keep the current account deficit at a safe level. Stability in the rupiah in line with fundamentals can assist a process of economic adjustment should external shocks occur and can help maintain steady inflation expectations. A stable exchange rate will have a positive effect on the confidence of market actors. It will also mitigate risks for business from excessive transmission of rupiah depreciation, an event that in turn could impair Indonesia’s ability to meet its inflation target.
Bank Indonesia implemented its exchange rate policy of managing the stability of the rupiah exchange rate in line with fundamentals. Exchange rate policy sought to curb volatility arising from imbalances in foreign exchange supply and demand by employing foreign exchange intervention and dual interventions. The dual intervention strategy involved selling intervention on the foreign exchange market accompanied by government bond purchases on the secondary market. The dual intervention strategy was adopted to maintain exchange rate stability, while ensuring rupiah liquidity remained adequate.
At the operational level, Bank Indonesia further strengthened liquidity management on the domestic foreign exchange market by increasing the scheduled frequency of foreign exchange term deposit auctions for tenors greater than one week. From the end of February 2017, the frequency for one-week, one-month, and three-month tenors was increased to three times per week from twice per week. Alongside this, regular auctions of US dollar-denominated foreign exchange swap instruments continued to be held twice a week. The increased frequency of foreign exchange term deposit auctions met with a positive response from the market, visible in the
Grafik 7.5. Posisi Instrumen Operasi Moneter (OPT)
Source: Bank Indonesia
Rp Trillion
2016 2017I II III IV I II III IV
Reverse Repo SBNBank Indonesia Securities FX Swap Bank Indonesia Deposit CertificateStanding Facilities Term Repo/Depo
-200
-100
0
100
200
300
400
500
600
Chart 7.5. Monetary Operation Instruments Position
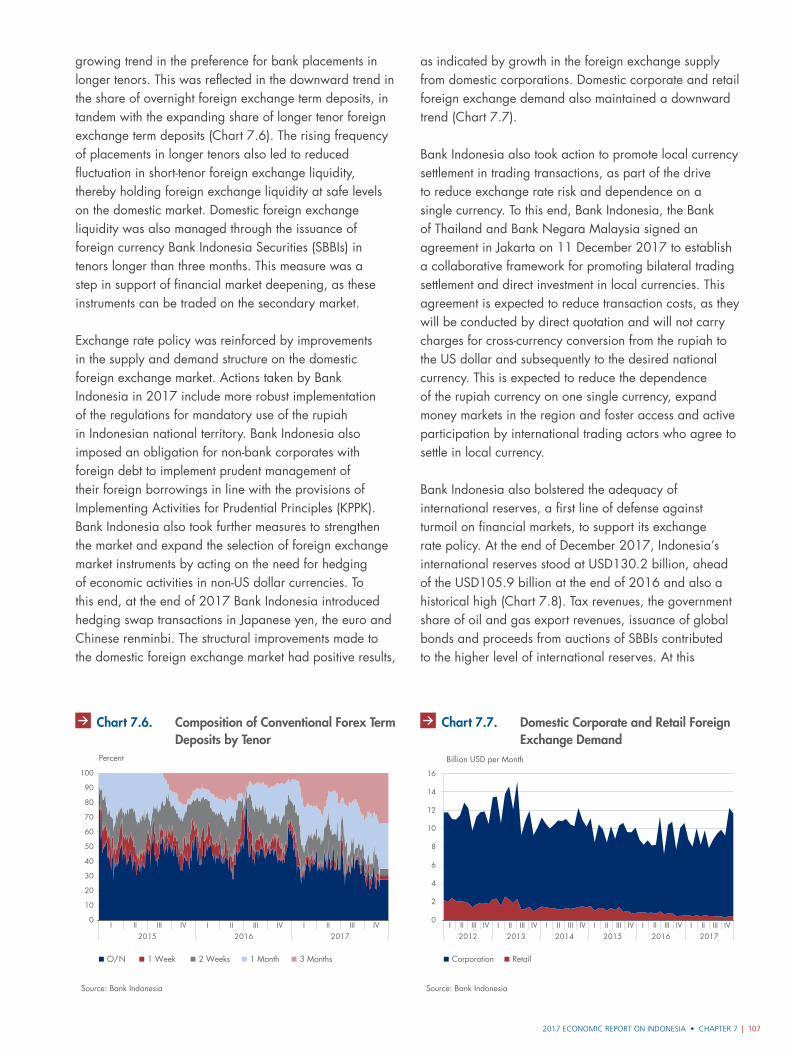
2017 ECONOMIC REPORT ON INDONESIA • CHAPTER 7 | 107
growing trend in the preference for bank placements in longer tenors. This was reflected in the downward trend in the share of overnight foreign exchange term deposits, in tandem with the expanding share of longer tenor foreign exchange term deposits (Chart 7.6). The rising frequency of placements in longer tenors also led to reduced fluctuation in short-tenor foreign exchange liquidity, thereby holding foreign exchange liquidity at safe levels on the domestic market. Domestic foreign exchange liquidity was also managed through the issuance of foreign currency Bank Indonesia Securities (SBBIs) in tenors longer than three months. This measure was a step in support of financial market deepening, as these instruments can be traded on the secondary market.
Exchange rate policy was reinforced by improvements in the supply and demand structure on the domestic foreign exchange market. Actions taken by Bank Indonesia in 2017 include more robust implementation of the regulations for mandatory use of the rupiah in Indonesian national territory. Bank Indonesia also imposed an obligation for non-bank corporates with foreign debt to implement prudent management of their foreign borrowings in line with the provisions of Implementing Activities for Prudential Principles (KPPK). Bank Indonesia also took further measures to strengthen the market and expand the selection of foreign exchange market instruments by acting on the need for hedging of economic activities in non-US dollar currencies. To this end, at the end of 2017 Bank Indonesia introduced hedging swap transactions in Japanese yen, the euro and Chinese renminbi. The structural improvements made to the domestic foreign exchange market had positive results,
as indicated by growth in the foreign exchange supply from domestic corporations. Domestic corporate and retail foreign exchange demand also maintained a downward trend (Chart 7.7).
Bank Indonesia also took action to promote local currency settlement in trading transactions, as part of the drive to reduce exchange rate risk and dependence on a single currency. To this end, Bank Indonesia, the Bank of Thailand and Bank Negara Malaysia signed an agreement in Jakarta on 11 December 2017 to establish a collaborative framework for promoting bilateral trading settlement and direct investment in local currencies. This agreement is expected to reduce transaction costs, as they will be conducted by direct quotation and will not carry charges for cross-currency conversion from the rupiah to the US dollar and subsequently to the desired national currency. This is expected to reduce the dependence of the rupiah currency on one single currency, expand money markets in the region and foster access and active participation by international trading actors who agree to settle in local currency.
Bank Indonesia also bolstered the adequacy of international reserves, a first line of defense against turmoil on financial markets, to support its exchange rate policy. At the end of December 2017, Indonesia’s international reserves stood at USD130.2 billion, ahead of the USD105.9 billion at the end of 2016 and also a historical high (Chart 7.8). Tax revenues, the government share of oil and gas export revenues, issuance of global bonds and proceeds from auctions of SBBIs contributed to the higher level of international reserves. At this
Source: Bank Indonesia
Grafik 7.7. Komposisi TD Valas Konvensional
Per Tenor
O/N 1 Week 2 Weeks 1 Month 3 Months
I II III IV I II III IV I II III IV2015 20172016
Percent
0
10
20
30
40
50
60
70
80
90
100
Chart 7.6. Composition of Conventional Forex Term Deposits by Tenor
Source: Bank Indonesia
Grafik 7.6. Permintaan Valas Korporasi dan Individu
Corporation Retail
I II III IV I II III IV I II III IV I II III IV I II III IV I II III IV2012 20152014 201720162013
0
2
4
6
8
10
12
14
16
Billion USD per Month
Chart 7.7. Domestic Corporate and Retail Foreign Exchange Demand
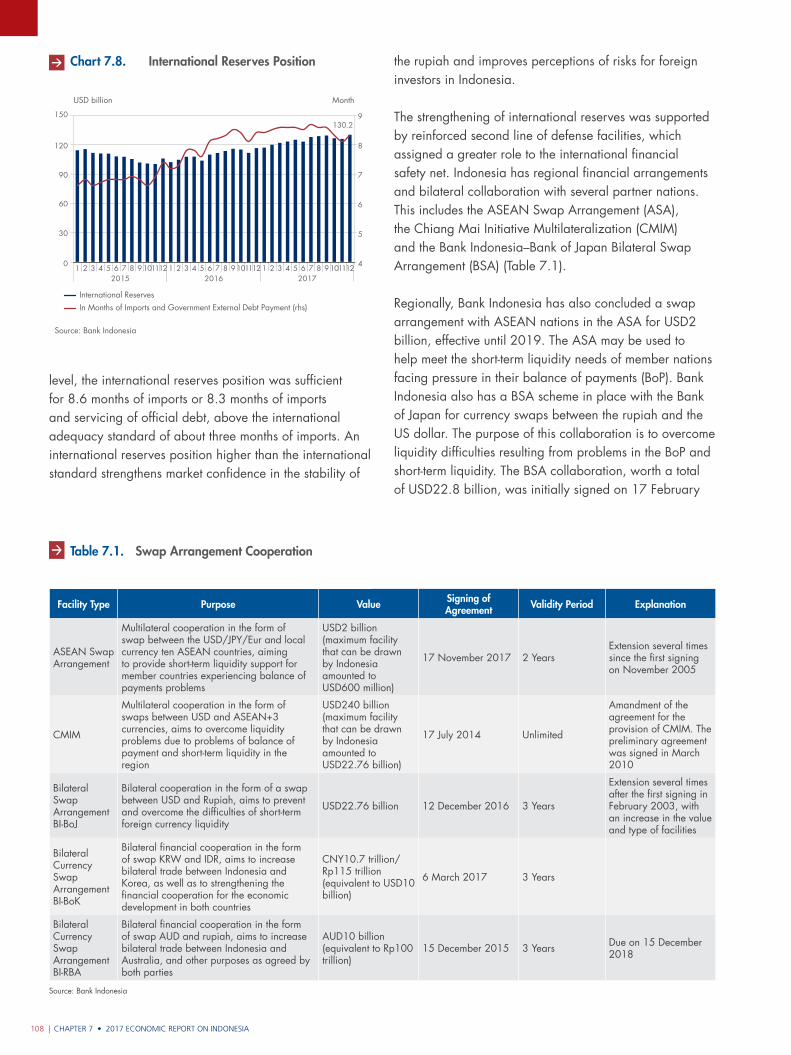
CHAPTER 7 • 2017 ECONOMIC REPORT ON INDONESIA108 |
Facility Type Purpose Value Signing of Agreement Validity Period Explanation
ASEAN Swap Arrangement
Multilateral cooperation in the form of swap between the USD/JPY/Eur and local currency ten ASEAN countries, aiming to provide short-term liquidity support for member countries experiencing balance of payments problems
USD2 billion (maximum facility that can be drawn by Indonesia amounted to USD600 million)
17 November 2017 2 YearsExtension several times since the first signing on November 2005
CMIM
Multilateral cooperation in the form of swaps between USD and ASEAN+3 currencies, aims to overcome liquidity problems due to problems of balance of payment and short-term liquidity in the region
USD240 billion (maximum facility that can be drawn by Indonesia amounted to USD22.76 billion)
17 July 2014 Unlimited
Amandment of the agreement for the provision of CMIM. The preliminary agreement was signed in March 2010
Bilateral Swap Arrangement BI-BoJ
Bilateral cooperation in the form of a swap between USD and Rupiah, aims to prevent and overcome the difficulties of short-term foreign currency liquidity
USD22.76 billion 12 December 2016 3 Years
Extension several times after the first signing in February 2003, with an increase in the value and type of facilities
Bilateral Currency Swap Arrangement BI-BoK
Bilateral financial cooperation in the form of swap KRW and IDR, aims to increase bilateral trade between Indonesia and Korea, as well as to strengthening the financial cooperation for the economic development in both countries
CNY10.7 trillion/Rp115 trillion (equivalent to USD10 billion)
6 March 2017 3 Years
Bilateral Currency Swap Arrangement BI-RBA
Bilateral financial cooperation in the form of swap AUD and rupiah, aims to increase bilateral trade between Indonesia and Australia, and other purposes as agreed by both parties
AUD10 billion (equivalent to Rp100 trillion)
15 December 2015 3 Years Due on 15 December 2018
Source: Bank Indonesia
Table 7.1. Swap Arrangement Cooperation
level, the international reserves position was sufficient for 8.6 months of imports or 8.3 months of imports and servicing of official debt, above the international adequacy standard of about three months of imports. An international reserves position higher than the international standard strengthens market confidence in the stability of
the rupiah and improves perceptions of risks for foreign investors in Indonesia.
The strengthening of international reserves was supported by reinforced second line of defense facilities, which assigned a greater role to the international financial safety net. Indonesia has regional financial arrangements and bilateral collaboration with several partner nations. This includes the ASEAN Swap Arrangement (ASA), the Chiang Mai Initiative Multilateralization (CMIM) and the Bank Indonesia–Bank of Japan Bilateral Swap Arrangement (BSA) (Table 7.1).
Regionally, Bank Indonesia has also concluded a swap arrangement with ASEAN nations in the ASA for USD2 billion, effective until 2019. The ASA may be used to help meet the short-term liquidity needs of member nations facing pressure in their balance of payments (BoP). Bank Indonesia also has a BSA scheme in place with the Bank of Japan for currency swaps between the rupiah and the US dollar. The purpose of this collaboration is to overcome liquidity difficulties resulting from problems in the BoP and short-term liquidity. The BSA collaboration, worth a total of USD22.8 billion, was initially signed on 17 February
Source: Bank Indonesia
Grafik 7.8. Lorem Ipsum
0
30
60
90
120
150
4
5
6
7
8
9
USD billion Month
International ReservesIn Months of Imports and Government External Debt Payment (rhs)
1 2 3 42015
5 6 7 8 9 1 2 3 42016
5 6 7 8 9 1 2 3 42017
5 6 7 8 9
130.2
101112 101112 101112
Chart 7.8. International Reserves Position
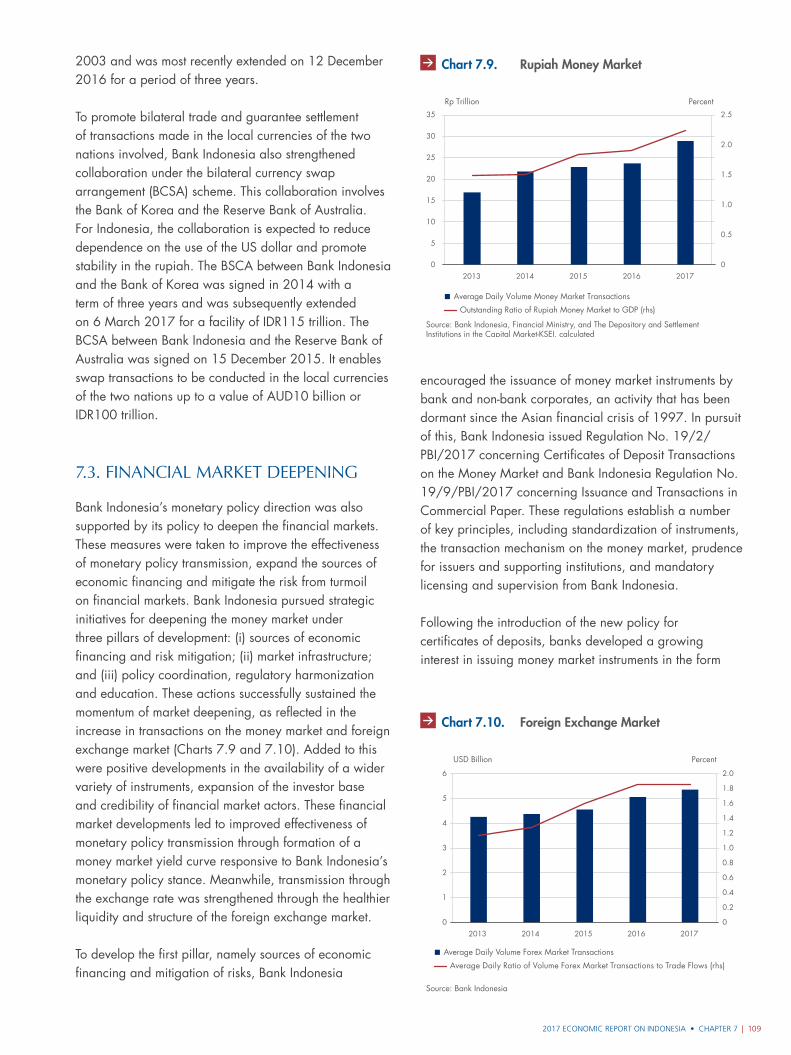
2017 ECONOMIC REPORT ON INDONESIA • CHAPTER 7 | 109
2003 and was most recently extended on 12 December 2016 for a period of three years.
To promote bilateral trade and guarantee settlement of transactions made in the local currencies of the two nations involved, Bank Indonesia also strengthened collaboration under the bilateral currency swap arrangement (BCSA) scheme. This collaboration involves the Bank of Korea and the Reserve Bank of Australia. For Indonesia, the collaboration is expected to reduce dependence on the use of the US dollar and promote stability in the rupiah. The BSCA between Bank Indonesia and the Bank of Korea was signed in 2014 with a term of three years and was subsequently extended on 6 March 2017 for a facility of IDR115 trillion. The BCSA between Bank Indonesia and the Reserve Bank of Australia was signed on 15 December 2015. It enables swap transactions to be conducted in the local currencies of the two nations up to a value of AUD10 billion or IDR100 trillion.
7.3. FInancIal Market deePenIng
Bank Indonesia’s monetary policy direction was also supported by its policy to deepen the financial markets. These measures were taken to improve the effectiveness of monetary policy transmission, expand the sources of economic financing and mitigate the risk from turmoil on financial markets. Bank Indonesia pursued strategic initiatives for deepening the money market under three pillars of development: (i) sources of economic financing and risk mitigation; (ii) market infrastructure; and (iii) policy coordination, regulatory harmonization and education. These actions successfully sustained the momentum of market deepening, as reflected in the increase in transactions on the money market and foreign exchange market (Charts 7.9 and 7.10). Added to this were positive developments in the availability of a wider variety of instruments, expansion of the investor base and credibility of financial market actors. These financial market developments led to improved effectiveness of monetary policy transmission through formation of a money market yield curve responsive to Bank Indonesia’s monetary policy stance. Meanwhile, transmission through the exchange rate was strengthened through the healthier liquidity and structure of the foreign exchange market.
To develop the first pillar, namely sources of economic financing and mitigation of risks, Bank Indonesia
encouraged the issuance of money market instruments by bank and non-bank corporates, an activity that has been dormant since the Asian financial crisis of 1997. In pursuit of this, Bank Indonesia issued Regulation No. 19/2/PBI/2017 concerning Certificates of Deposit Transactions on the Money Market and Bank Indonesia Regulation No. 19/9/PBI/2017 concerning Issuance and Transactions in Commercial Paper. These regulations establish a number of key principles, including standardization of instruments, the transaction mechanism on the money market, prudence for issuers and supporting institutions, and mandatory licensing and supervision from Bank Indonesia.
Following the introduction of the new policy for certificates of deposits, banks developed a growing interest in issuing money market instruments in the form
Source: Bank Indonesia, Financial Ministry, and The Depository and Settlement Institutions in the Capital Market-KSEI, calculated
Grafik 7.9. Perkembangan Pasar Uang
Rp Trillion Percent
0
0.5
1.0
1.5
2.0
2.5
0
5
10
15
20
25
30
35
2013 2014 2015 2016 2017
Outstanding Ratio of Rupiah Money Market to GDP (rhs)
Average Daily Volume Money Market Transactions
Chart 7.9. Rupiah Money Market
Source: Bank Indonesia
Grafik 7.10. Perkembangan Pasar Valas
USD Billion Percent
Average Daily Ratio of Volume Forex Market Transactions to Trade Flows (rhs)
Average Daily Volume Forex Market Transactions
0
0.2
0.4
0.6
0.8
1.0
1.2
1.4
1.6
1.8
2.0
0
1
2
3
4
5
6
2013 2014 2015 2016 2017
Chart 7.10. Foreign Exchange Market
CHAPTER 7 • 2017 ECONOMIC REPORT ON INDONESIA110 |
concerning Foreign Exchange Transactions Against Rupiah between Banks and Domestic Parties, and Bank Indonesia Regulation No. 18/19/PBI/2016 concerning Foreign Exchange Transactions Against Rupiah between Banks and Foreign Parties. Bank Indonesia coordinated closely with the OJK to ensure that an increase in the provision of CSO hedging instruments by domestic banks was accompanied by an upholding of prudential banking principles. In 2017, a total of seven banks offered CSO transaction facilities and recorded steady growth in transaction value (Chart 7.12). Potential demand from non-bank corporations was also strong given that, beginning in 2017, non-bank corporations have been required to arrange hedging through domestic banks under the Bank Indonesia regulation concerning prudential principles on the management of external debt.
Under the second pillar of its goal of deepening financial markets, Bank Indonesia built up market infrastructure by strengthening the credibility of the Jakarta Interbank Offered Rate (JIBOR) as a reference rate for short-term funding. Contributor banks were encouraged to become accustomed to using the mechanism for tradable quotations by placing quotations of a more real nature that would strengthen the credibility of the JIBOR. Positive developments are already visible, as seen in the narrowing of the spread between the JIBOR and the interbank money market rate for tenors ranging from overnight to three months, in comparison to the preceding year (Chart 7.13). In line with this trend, the JIBOR has come into increasing use among market actors as a reference rate in calculating the value of derivative contracts and loans with floating interest rates.
131
0
20
40
60
80
100
120
140
1 2 3 4 5 6 7 8 9 10 11 12
2017
Source: Bank Indonesia
Grafik 7.14. Perkembangan Transaksi CSO
Million USD
Chart 7.12. Value of Call Spread Option (CSO) Transactions
of certificates of deposits. Following a regulation from the Financial Services Authority (OJK) concerning issuance of certificates of deposit by banks in 2015, and a Bank Indonesia regulation concerning certificates of deposit transactions on the money market in 2017, the certificates of deposit position climbed steadily to IDR21.6 trillion at the end of the fourth quarter of 2017 from IDR4.9 trillion in the fourth quarter of 2014 (Chart 7.11). This was matched by growth in the number of issuers to 19 banks in 2017. Looking to the future, there is still potential for further expansion. Based on the experience of other economies, including China, Taiwan, South Korea and Japan, certificates of deposit can serve as a reliable money market instrument for raising funds for banks, and benefit from liquid trading on the secondary market.
In regard to the development of these money market instruments, Bank Indonesia also opened registration for money market supporting institutions intending to provide services in issuing and conducting commercial paper transactions. The purpose of the registration is to ensure the integrity and competence of these institutions so that issuance of commercial paper, beginning in 2018, can be conducted in a prudent and efficient manner.
Further measures for development of the first pillar were also taken forward with foreign exchange market instruments, particularly instruments to encourage domestic corporates to hedge. Bank Indonesia took further steps to encourage the domestic banking system to offer hedging instruments in the form of call-spread option (CSO) structured products. These products are regulated in Bank Indonesia Regulation No. 18/18/PBI/2016
0
5
10
15
20
0
5
10
15
20
25
III IV I II III IV I II III IV I II III IV
2014 2015 2016 2017
Source: The Depository and Settlement Institutions in the Capital Market-KSEI, calculated
Grafik 7.11. Perkembangan Penerbitan Sertifikat
Deposito
Rp Trillion Number of Banks
Cumulative number of issuing banks (rhs)
The Value of Outstanding Issuance
Chart 7.11. Issuances Certificates of Deposit
2017 ECONOMIC REPORT ON INDONESIA • CHAPTER 7 | 111
Bank Indonesia also introduced measures to strengthen the financial market infrastructure and code of ethics for market actors, and set up a task force to establish the Indonesia Derivatives Central Counterparty to reduce credit risk and improve efficiency in derivative transactions. The task force, set up jointly with the Ministry of Finance and OJK, has prepared a roadmap, which will be followed by establishment of an agency, pilot operations and ultimately full implementation.
To bolster the credibility of the financial market, Bank Indonesia issued Regulation No. 19/5/PBI/2017 concerning Treasury Certificates and Adoption of Market Code of Ethics. These provisions stipulate the obligation of market actors to ensure that directors and employees involved in treasury activities hold treasury certification in keeping with specified classifications and levels of certificates. Market actors are also required to have internal procedures to ensure staff adhere to the code of market ethics in treasury activities.
In relation to development of the third pillar – policy coordination, regulatory harmonization and education – Bank Indonesia organized capacity building activities for banks in Business Category 1 and Business Category 2 (commercial banks are divided into four categories based on their assets), as well as regional development banks, in collaboration with the Indonesia Foreign Exchange Market Committee. Capacity building was held to improve understanding about the operations of repo transactions and the Indonesia Global Master Repurchase Agreement
(GMRA).3 The Indonesia GMRA, a Bank Indonesia initiative, was signed by banks in 2016 in accordance with OJK regulations, and the capacity building was the next step. The capacity building succeeded in sustaining the upward trend in the volume of repo transactions, which has been building since 2013. Further, it also led to a better operational understanding of repo transactions, which in turn led to greater variation in the tenor of repo transactions compared to previous years (Chart 7.14).
Coordination with the Government, particularly the Ministry of State Owned Enterprises, occurred in the preparation of guidelines on standard operating procedures in hedging for state-owned corporations that intend to use structured product instruments, such as CSOs. This initiative proved effective in expanding hedging activity by state-owned enterprises, which had previously faced restrictions in accessing more economically priced and flexibly structured CSO hedging instruments.
To deepen the sharia-compliant financial market, Bank Indonesia focused on developing instruments and expanding the market actor base. Bank Indonesia researched the development of waqf-linked sukuk (endowment-linked Islamic bonds) and corporate sukuk for Islamic social institutions. In collaboration with the OJK, Bank Indonesia also discussed the development of sharia-compliant certificates of deposit as an alternative funding source for sharia banks. In regard to building
3 Under OJK Regulation No. 9/POJK.01/2015 concerning Guidelines for Repurchase
Agreement Transactions for Financial Services Institutions, each repo transaction
conducted by a financial services institution must be made using the Indonesia Global
Master Repurchase Agreement (GMRA).
0
5
10
15
20
25
O/N 1 week 1 month 3 months
Source: Bank Indonesia
Grafik 7.13. Spread suku bunga JIBOR dan PUAB
bps
2016 2017
Chart 7.14. Jakarta Interbank Offered Rate (JIBOR) and PUAB Rate Spread
0
200
400
600
800
1,000
1,200
1,400
0
10
20
30
40
50
60
70
80
90
100
2013 2014 2015 2016 2017
Source: Bank Indonesia
Grafik 7.12. Perkembangan Transaksi Repo
Percent Rp Billion
Total Volume (rhs)
O/N >O/N - 1 Week >1 Week - 1 Month >1 Month
Chart 7.13. Repo Transactions
CHAPTER 7 • 2017 ECONOMIC REPORT ON INDONESIA112 |
the market base, Bank Indonesia worked continuously to educate market actors in the use of sharia-compliant hedging instruments.
7.4. Monetary PolIcy transMIssIon
Monetary policy in 2017 was generally transmitted well, notwithstanding insufficiently strong transmission to the credit channel. Monetary policy transmission performed well through the interest rate channel, reflected in downward movement in interest rates commensurate with the decline in the policy rate. Transmission also operated through the asset price channel as indicated by the strengthening performance of the Indonesian Stock Exchange Composite Index (IDX Composite) and the government bonds market, as well as an increase in non-bank financing. However, credit charted more limited expansion at 8.2% in 2017, despite a continuing decline in loan interest rates. The inadequate rate of credit expansion then influenced developments in monetary aggregates and in particular broad money (M2), which maintained stable growth compared to 2016.
Transmission through the Interest Rate Channel
The year 2017 was marked by a steady increase in the strength of monetary policy transmission through the interest rate channel. Movement in the overnight interbank rate came into closer alignment with the policy rate. This steady improvement in transmission of the policy rate to the overnight interbank rate was supported not only by 2016’s reformulation of the monetary policy operational framework, but also by reinforcement of the monetary operations strategy. The 200 basis point decline in the policy rate beginning in 2016 was shadowed by the overnight interbank rate, which fell 192 basis points to stand at 3.90% at the end of December 2017. The daily average spread between the policy rate and the overnight interbank rate after the launching of the BI7DRR was 43 basis points (Chart 7.15)
Bank Indonesia also consistently performed fine tune contraction and expansion operations to curb volatility in overnight interbank rates.4 In 2017, the average spread between minimum and maximum overnight interbank rates
4 In June 2017, Bank Indonesia launched fine tune expansion for non-overnight tenors in
response to bank liquidity needs in the period approaching the Idul Fitri festive season.
came to 16 basis points, down from the average 26 basis point spread in 2016. This indicated steady expansion in liquidity on the interbank market, bolstered by improved efficiency in interbank trading. In addition, the relatively adequate liquidity levels helped keep volatility in the overnight interbank rate at a lower level compared to 2016. A trend toward more relaxed conditions in aggregate banking liquidity was visible in the increase in the average net monetary operations position; this moved to IDR440 trillion in 2017 from IDR338 trillion in 2016.
Transmission of monetary policy relaxation also showed in bank time deposit rates. At the end of December 2017, the weighted average time deposit rate had dropped 187 basis points compared to the beginning of 2016, equal to 94% of the total decline in the policy rate since 2016. This decline in deposit rates was recorded in all tenors, with short tenors experiencing the largest rate reductions (Chart 7.16). By category of bank, Business Category 3 commercial banks recorded the steepest fall in interest rates at 181 basis points, followed by Business Category 1 banks (139 basis points), Business Category 2 banks (130 basis points) and Business Category 4 banks (91 basis points). Deposit rates responded more strongly to the policy rate relaxation in 2017 with support from the more relaxed trend in bank liquidity. Reflecting this was the spread between the policy rate and the weighted average deposit rate that reached 182 basis points at the end of 2017, or 197 basis points narrower than the spread recorded at the end of 2016.
However, lending rates responded more slowly and on a more limited scale to monetary policy relaxation
Grafik 7.15. Lorem Ipsum
Source: Bank Indonesia
bps
Spread of BI rate & O/N Interbank RateSpread of BI-7DRR & O/N Interbank RateAverage of Spread after BI-7DRR Implementation
30
0
80
130
180
230
1 2 3 4 5 6 7 8 9 101112 1 2 3 4 5 6 7 8 9 101112 1 2 3 4 5 6 7 8 9 101112
2015 2016 2017
Chart 7.15. Policy Rate and Overnight Inter-Bank Money Market Rate Spread
2017 ECONOMIC REPORT ON INDONESIA • CHAPTER 7 | 113
compared to the response in time deposit rates. At the end of December 2017, the weighted average loan interest rate stood at 11.3%, having dropped 153 basis points from the level in early 2016. By the end of 2017, transmission of the policy rate cuts onto loan interest rates amounted to 77% of the total decline in the policy rate since 2016, when the current cycle of cuts began. This represents a more robust transmission compared to the range of 66% to 69% seen in the previous relaxation cycle. The slower decline in loan interest rates compared to deposit rates is explained by the ongoing banking consolidation, which has introduced into the system measures that include mitigation of credit risk and improvements in banking efficiency and profitability (see Chapter 8, Macroprudential Policies). Nonetheless, loan interest rates have fallen to their lowest level in several years, prompted by this monetary relaxation (Chart 7.17).
By type of use, the steepest drop was recorded in interest rates for working capital credit at 178 basis points, followed by investment credit at 157 basis points and consumption credit at 122 basis points (Chart 7.17). Analyzed by category of bank, the steepest reductions in loan interest rates took place in Business Category 3 commercial banks (189 basis points), followed by Business Category 2 banks (160 basis points), Business Category 4 banks (132 basis points) and Business Category 1 banks (58 basis points) (Chart 7.18). Accordingly, the spread between loan and deposit rates eased to 523 basis points at the end of 2017 from 532 basis points at the end of 2016 (Chart 7.19).
Monetary relaxation was also transmitted to other interest rates on the financial market. Reflecting this, government bond yields declined an average 161 basis points in 2017. The reduction took place in all tenors and was strongest in short tenors (177 basis points), while yield in medium and long tenors experienced less decline at 166 basis points and 127 basis points (Chart 7.20). The fall in yields prompted an increase in total non-bank financing, which includes issuances of bonds, medium-term notes (MTNs), promissory notes, negotiable certificates of deposit (NCDs) and stocks (see Chapter 8, Macroprudential Policies).
Source: Bank Indonesia
Gra�k 7.16. Lorem Ipsum
Percent
1 Month 3 Months 6 Months12 Months 24 Months Weighted Average of Deposit Interest Rate
5.0
5.5
6.0
6.5
7.0
7.5
8.0
8.5
9.0
9.5
1 2 3 4 5 6 7 8 9 101112 1 2 3 4 5 6 7 8 9 101112 1 2 3 4 5 6 7 8 9 1011122015 2016 2017
Chart 7.16. Time Deposit Rates by Tenor
Source: Bank Indonesia
Gra�k 7.17. Lorem Ipsum
Percent Percent, yoy
Weighted Average of Credit Interest Rate Consumption Credit Interest RateCredit Growth (rhs)
6
7
8
9
10
11
12
13
10.0
10.5
11.0
11.5
12.0
12.5
13.0
13.5
14.0
14.5
1 2 3 4 5 6 7 8 9 101112 1 2 3 4 5 6 7 8 9 101112 1 2 3 4 5 6 7 8 9 1011122015 2016 2017
Working Capital Credit Interest RateInvestment Credit Interest Rate
Chart 7.17. Credit Growth and Credit Interest Rates
Source: Bank Indonesia
Grafik 7.18. Lorem Ipsum
Percent
BUKU 1 BUKU 2 BUKU 3 BUKU 4
8
10
12
14
16
1 2 3 4 5 6 7 8 9 101112 1 2 3 4 5 6 7 8 9 101112 1 2 3 4 5 6 7 8 9 1011122015 2016 2017
Chart 7.18. Credit Interest Rates by Bank Group
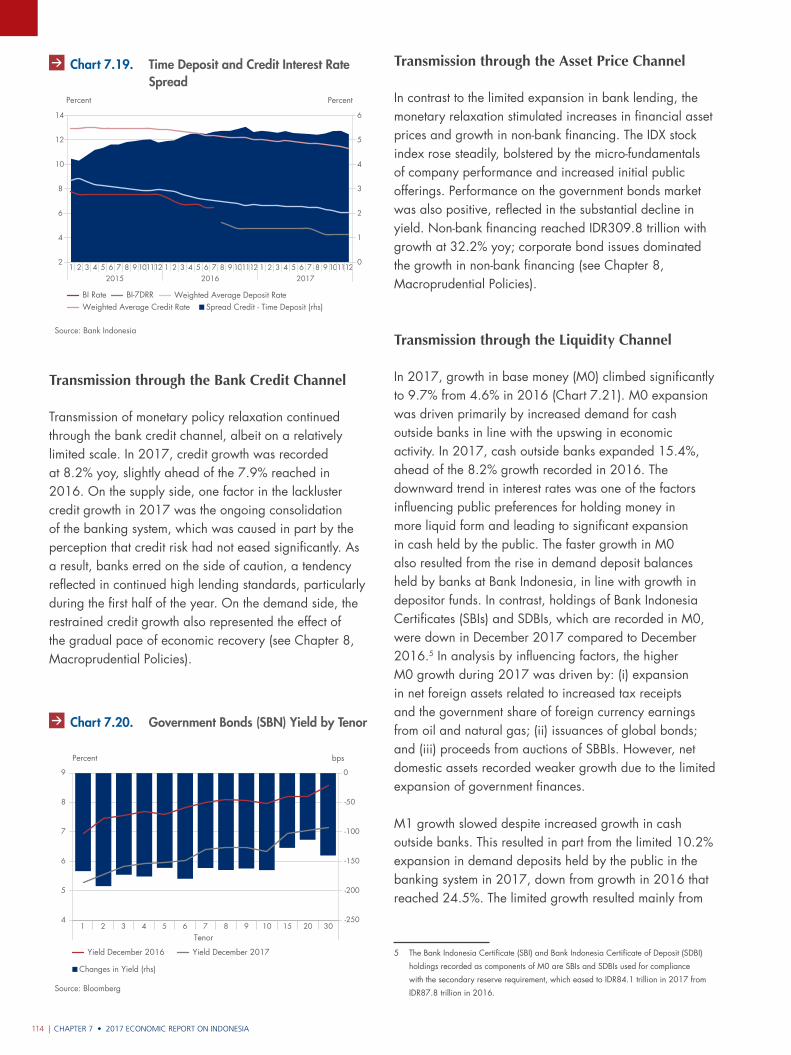
CHAPTER 7 • 2017 ECONOMIC REPORT ON INDONESIA114 |
Transmission through the Bank Credit Channel
Transmission of monetary policy relaxation continued through the bank credit channel, albeit on a relatively limited scale. In 2017, credit growth was recorded at 8.2% yoy, slightly ahead of the 7.9% reached in 2016. On the supply side, one factor in the lackluster credit growth in 2017 was the ongoing consolidation of the banking system, which was caused in part by the perception that credit risk had not eased significantly. As a result, banks erred on the side of caution, a tendency reflected in continued high lending standards, particularly during the first half of the year. On the demand side, the restrained credit growth also represented the effect of the gradual pace of economic recovery (see Chapter 8, Macroprudential Policies).
Transmission through the Asset Price Channel
In contrast to the limited expansion in bank lending, the monetary relaxation stimulated increases in financial asset prices and growth in non-bank financing. The IDX stock index rose steadily, bolstered by the micro-fundamentals of company performance and increased initial public offerings. Performance on the government bonds market was also positive, reflected in the substantial decline in yield. Non-bank financing reached IDR309.8 trillion with growth at 32.2% yoy; corporate bond issues dominated the growth in non-bank financing (see Chapter 8, Macroprudential Policies).
Transmission through the Liquidity Channel
In 2017, growth in base money (M0) climbed significantly to 9.7% from 4.6% in 2016 (Chart 7.21). M0 expansion was driven primarily by increased demand for cash outside banks in line with the upswing in economic activity. In 2017, cash outside banks expanded 15.4%, ahead of the 8.2% growth recorded in 2016. The downward trend in interest rates was one of the factors influencing public preferences for holding money in more liquid form and leading to significant expansion in cash held by the public. The faster growth in M0 also resulted from the rise in demand deposit balances held by banks at Bank Indonesia, in line with growth in depositor funds. In contrast, holdings of Bank Indonesia Certificates (SBIs) and SDBIs, which are recorded in M0, were down in December 2017 compared to December 2016.5 In analysis by influencing factors, the higher M0 growth during 2017 was driven by: (i) expansion in net foreign assets related to increased tax receipts and the government share of foreign currency earnings from oil and natural gas; (ii) issuances of global bonds; and (iii) proceeds from auctions of SBBIs. However, net domestic assets recorded weaker growth due to the limited expansion of government finances.
M1 growth slowed despite increased growth in cash outside banks. This resulted in part from the limited 10.2% expansion in demand deposits held by the public in the banking system in 2017, down from growth in 2016 that reached 24.5%. The limited growth resulted mainly from
5 The Bank Indonesia Certificate (SBI) and Bank Indonesia Certificate of Deposit (SDBI)
holdings recorded as components of M0 are SBIs and SDBIs used for compliance
with the secondary reserve requirement, which eased to IDR84.1 trillion in 2017 from
IDR87.8 trillion in 2016.Source: Bloomberg
Gra�k 7.20.
5
4
6
7
8
9
-200
-250
-150
-100
-50
0
Percent bps
1 2 3 4 5 6 7 8 9 10 15 20 30
Yield December 2016 Yield December 2017
Changes in Yield (rhs)
Tenor
Chart 7.20. Government Bonds (SBN) Yield by Tenor
Source: Bank Indonesia
Gra�k 7.19. Lorem Ipsum
Percent
BI Rate BI-7DRRSpread Credit - Time Deposit (rhs)
Weighted Average Deposit RateWeighted Average Credit Rate
Percent
0
1
2
3
4
5
6
2
4
6
8
10
12
14
1 2 3 4 5 6 7 8 9 101112 1 2 3 4 5 6 7 8 9 101112 1 2 3 4 5 6 7 8 9 1011122015 2016 2017
Chart 7.19. Time Deposit and Credit Interest Rate Spread
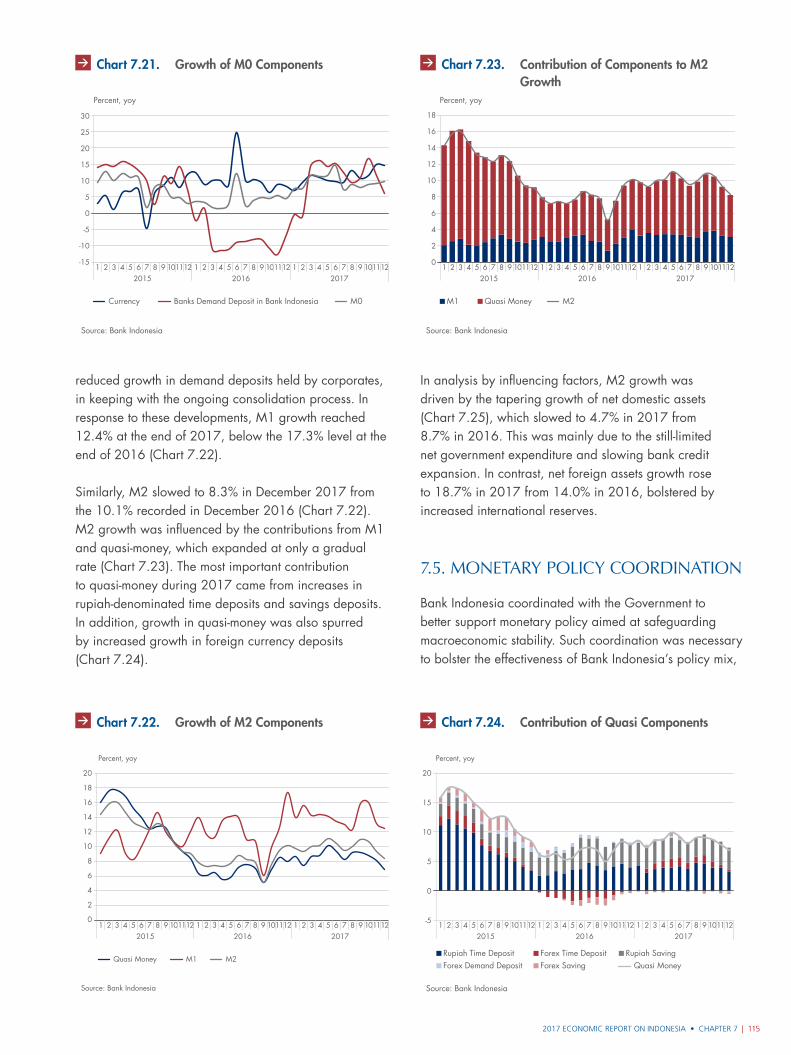
2017 ECONOMIC REPORT ON INDONESIA • CHAPTER 7 | 115
reduced growth in demand deposits held by corporates, in keeping with the ongoing consolidation process. In response to these developments, M1 growth reached 12.4% at the end of 2017, below the 17.3% level at the end of 2016 (Chart 7.22).
Similarly, M2 slowed to 8.3% in December 2017 from the 10.1% recorded in December 2016 (Chart 7.22). M2 growth was influenced by the contributions from M1 and quasi-money, which expanded at only a gradual rate (Chart 7.23). The most important contribution to quasi-money during 2017 came from increases in rupiah-denominated time deposits and savings deposits. In addition, growth in quasi-money was also spurred by increased growth in foreign currency deposits (Chart 7.24).
In analysis by influencing factors, M2 growth was driven by the tapering growth of net domestic assets (Chart 7.25), which slowed to 4.7% in 2017 from 8.7% in 2016. This was mainly due to the still-limited net government expenditure and slowing bank credit expansion. In contrast, net foreign assets growth rose to 18.7% in 2017 from 14.0% in 2016, bolstered by increased international reserves.
7.5. Monetary PolIcy coordInatIon
Bank Indonesia coordinated with the Government to better support monetary policy aimed at safeguarding macroeconomic stability. Such coordination was necessary to bolster the effectiveness of Bank Indonesia’s policy mix,
Source: Bank Indonesia
Grafik 7.21. Pertumbuhan Komponen M0
Percent, yoy
Currency Banks Demand Deposit in Bank Indonesia M0
0
5
-15
-10
-5
10
15
20
25
30
1 2 3 4 5 6 7 8 9 101112 1 2 3 4 5 6 7 8 9 101112 1 2 3 4 5 6 7 8 9 1011122015 2016 2017
Chart 7.21. Growth of M0 Components
Source: Bank Indonesia
Gra�k 7.22. Pertumbuhan Komponen M2
Percent, yoy
Quasi Money M1 M2
0
2
4
6
8
10
12
14
16
18
20
1 2 3 4 5 6 7 8 9 101112 1 2 3 4 5 6 7 8 9 101112 1 2 3 4 5 6 7 8 9 1011122015 2016 2017
Chart 7.22. Growth of M2 Components
Source: Bank Indonesia
Gra�k 7.23. Kontribusi Komponen M2
Percent, yoy
M2M1 Quasi Money
0
2
4
6
8
10
12
14
16
18
1 2 3 4 5 6 7 8 9 101112 1 2 3 4 5 6 7 8 9 101112 1 2 3 4 5 6 7 8 9 1011122015 2016 2017
Chart 7.23. Contribution of Components to M2 Growth
-5
0
5
10
15
20
Source: Bank Indonesia
Gra�k 7.24. Kontribusi Komponen Kuasi
Percent, yoy
Rupiah SavingQuasi Money
Rupiah Time Deposit Forex Demand Deposit
Forex Time DepositForex Saving
1 2 3 4 5 6 7 8 9 101112 1 2 3 4 5 6 7 8 9 101112 1 2 3 4 5 6 7 8 9 1011122015 2016 2017
Chart 7.24. Contribution of Quasi Components
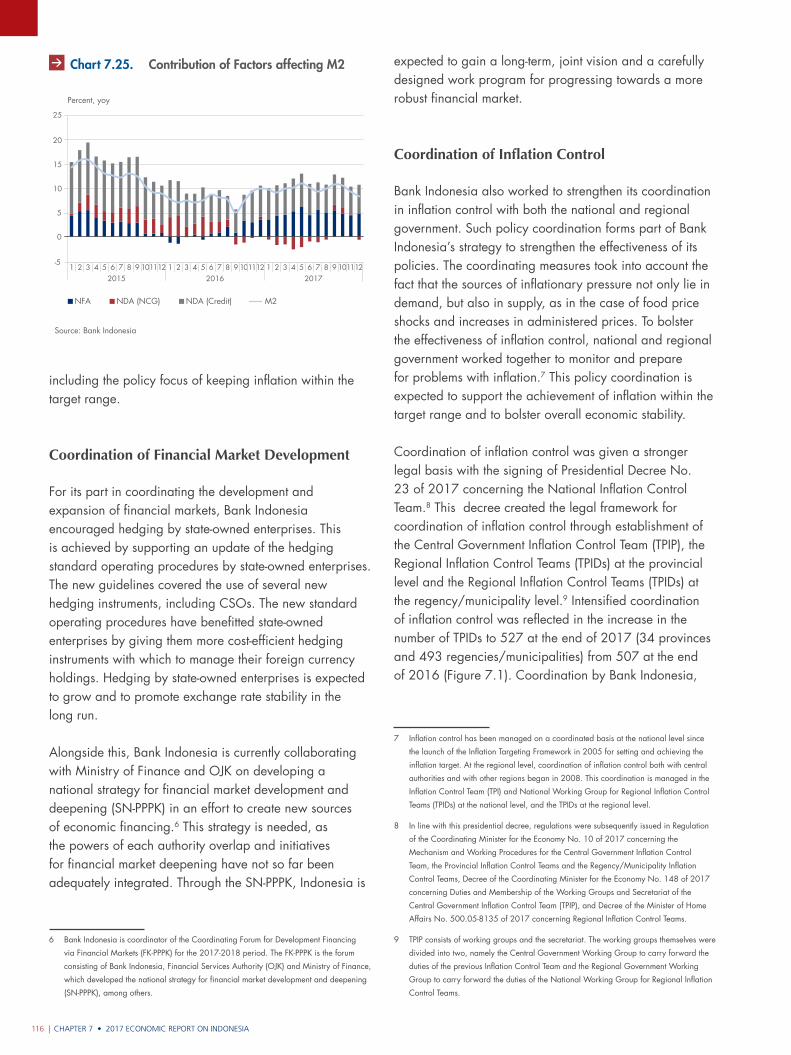
CHAPTER 7 • 2017 ECONOMIC REPORT ON INDONESIA116 |
including the policy focus of keeping inflation within the target range.
Coordination of Financial Market Development
For its part in coordinating the development and expansion of financial markets, Bank Indonesia encouraged hedging by state-owned enterprises. This is achieved by supporting an update of the hedging standard operating procedures by state-owned enterprises. The new guidelines covered the use of several new hedging instruments, including CSOs. The new standard operating procedures have benefitted state-owned enterprises by giving them more cost-efficient hedging instruments with which to manage their foreign currency holdings. Hedging by state-owned enterprises is expected to grow and to promote exchange rate stability in the long run.
Alongside this, Bank Indonesia is currently collaborating with Ministry of Finance and OJK on developing a national strategy for financial market development and deepening (SN-PPPK) in an effort to create new sources of economic financing.6 This strategy is needed, as the powers of each authority overlap and initiatives for financial market deepening have not so far been adequately integrated. Through the SN-PPPK, Indonesia is
6 Bank Indonesia is coordinator of the Coordinating Forum for Development Financing
via Financial Markets (FK-PPPK) for the 2017-2018 period. The FK-PPPK is the forum
consisting of Bank Indonesia, Financial Services Authority (OJK) and Ministry of Finance,
which developed the national strategy for financial market development and deepening
(SN-PPPK), among others.
expected to gain a long-term, joint vision and a carefully designed work program for progressing towards a more robust financial market.
Coordination of Inflation Control
Bank Indonesia also worked to strengthen its coordination in inflation control with both the national and regional government. Such policy coordination forms part of Bank Indonesia’s strategy to strengthen the effectiveness of its policies. The coordinating measures took into account the fact that the sources of inflationary pressure not only lie in demand, but also in supply, as in the case of food price shocks and increases in administered prices. To bolster the effectiveness of inflation control, national and regional government worked together to monitor and prepare for problems with inflation.7 This policy coordination is expected to support the achievement of inflation within the target range and to bolster overall economic stability.
Coordination of inflation control was given a stronger legal basis with the signing of Presidential Decree No. 23 of 2017 concerning the National Inflation Control Team.8 This decree created the legal framework for coordination of inflation control through establishment of the Central Government Inflation Control Team (TPIP), the Regional Inflation Control Teams (TPIDs) at the provincial level and the Regional Inflation Control Teams (TPIDs) at the regency/municipality level.9 Intensified coordination of inflation control was reflected in the increase in the number of TPIDs to 527 at the end of 2017 (34 provinces and 493 regencies/municipalities) from 507 at the end of 2016 (Figure 7.1). Coordination by Bank Indonesia,
7 Inflation control has been managed on a coordinated basis at the national level since
the launch of the Inflation Targeting Framework in 2005 for setting and achieving the
inflation target. At the regional level, coordination of inflation control both with central
authorities and with other regions began in 2008. This coordination is managed in the
Inflation Control Team (TPI) and National Working Group for Regional Inflation Control
Teams (TPIDs) at the national level, and the TPIDs at the regional level.
8 In line with this presidential decree, regulations were subsequently issued in Regulation
of the Coordinating Minister for the Economy No. 10 of 2017 concerning the
Mechanism and Working Procedures for the Central Government Inflation Control
Team, the Provincial Inflation Control Teams and the Regency/Municipality Inflation
Control Teams, Decree of the Coordinating Minister for the Economy No. 148 of 2017
concerning Duties and Membership of the Working Groups and Secretariat of the
Central Government Inflation Control Team (TPIP), and Decree of the Minister of Home
Affairs No. 500.05-8135 of 2017 concerning Regional Inflation Control Teams.
9 TPIP consists of working groups and the secretariat. The working groups themselves were
divided into two, namely the Central Government Working Group to carry forward the
duties of the previous Inflation Control Team and the Regional Government Working
Group to carry forward the duties of the National Working Group for Regional Inflation
Control Teams.
-5
0
5
10
15
20
25
Source: Bank Indonesia
Gra�k 7.25. Kontribusi Faktor M2
Percent, yoy
NDA (Credit) M2NFA NDA (NCG)
1 2 3 4 5 6 7 8 9 101112 1 2 3 4 5 6 7 8 9 101112 1 2 3 4 5 6 7 8 9 1011122015 2016 2017
Chart 7.25. Contribution of Factors affecting M2
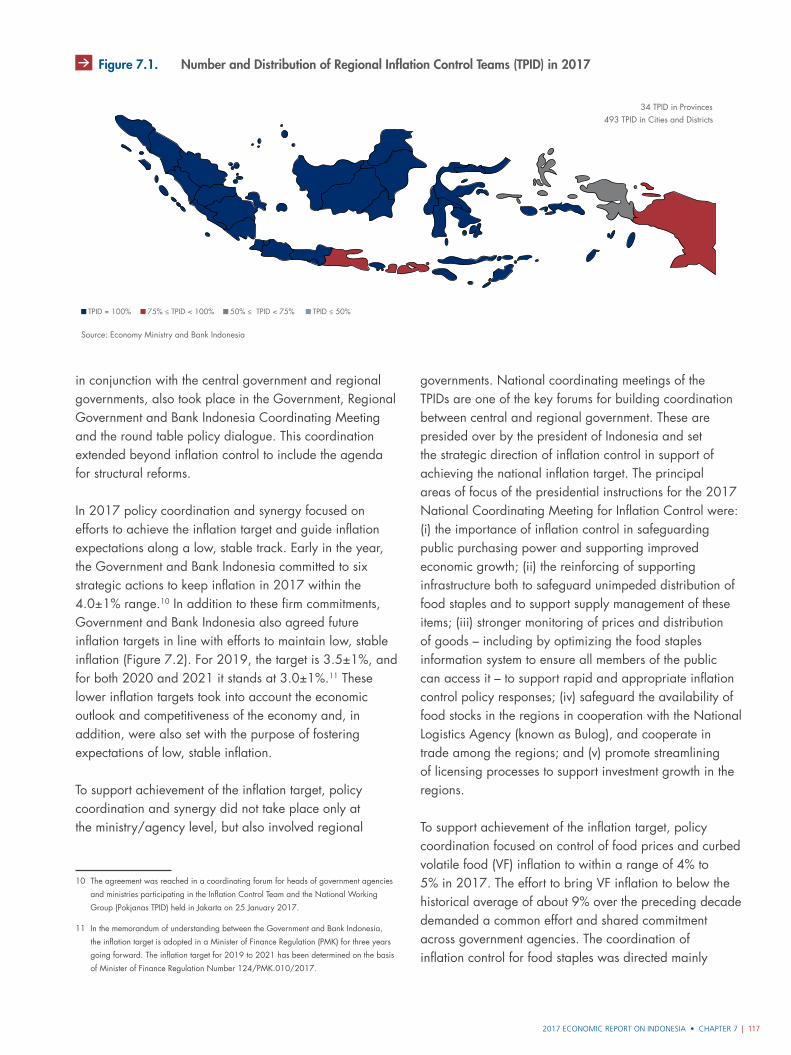
2017 ECONOMIC REPORT ON INDONESIA • CHAPTER 7 | 117
in conjunction with the central government and regional governments, also took place in the Government, Regional Government and Bank Indonesia Coordinating Meeting and the round table policy dialogue. This coordination extended beyond inflation control to include the agenda for structural reforms.
In 2017 policy coordination and synergy focused on efforts to achieve the inflation target and guide inflation expectations along a low, stable track. Early in the year, the Government and Bank Indonesia committed to six strategic actions to keep inflation in 2017 within the 4.0±1% range.10 In addition to these firm commitments, Government and Bank Indonesia also agreed future inflation targets in line with efforts to maintain low, stable inflation (Figure 7.2). For 2019, the target is 3.5±1%, and for both 2020 and 2021 it stands at 3.0±1%.11 These lower inflation targets took into account the economic outlook and competitiveness of the economy and, in addition, were also set with the purpose of fostering expectations of low, stable inflation.
To support achievement of the inflation target, policy coordination and synergy did not take place only at the ministry/agency level, but also involved regional
10 The agreement was reached in a coordinating forum for heads of government agencies
and ministries participating in the Inflation Control Team and the National Working
Group (Pokjanas TPID) held in Jakarta on 25 January 2017.
11 In the memorandum of understanding between the Government and Bank Indonesia,
the inflation target is adopted in a Minister of Finance Regulation (PMK) for three years
going forward. The inflation target for 2019 to 2021 has been determined on the basis
of Minister of Finance Regulation Number 124/PMK.010/2017.
governments. National coordinating meetings of the TPIDs are one of the key forums for building coordination between central and regional government. These are presided over by the president of Indonesia and set the strategic direction of inflation control in support of achieving the national inflation target. The principal areas of focus of the presidential instructions for the 2017 National Coordinating Meeting for Inflation Control were: (i) the importance of inflation control in safeguarding public purchasing power and supporting improved economic growth; (ii) the reinforcing of supporting infrastructure both to safeguard unimpeded distribution of food staples and to support supply management of these items; (iii) stronger monitoring of prices and distribution of goods – including by optimizing the food staples information system to ensure all members of the public can access it – to support rapid and appropriate inflation control policy responses; (iv) safeguard the availability of food stocks in the regions in cooperation with the National Logistics Agency (known as Bulog), and cooperate in trade among the regions; and (v) promote streamlining of licensing processes to support investment growth in the regions.
To support achievement of the inflation target, policy coordination focused on control of food prices and curbed volatile food (VF) inflation to within a range of 4% to 5% in 2017. The effort to bring VF inflation to below the historical average of about 9% over the preceding decade demanded a common effort and shared commitment across government agencies. The coordination of inflation control for food staples was directed mainly
Source: Economy Ministry and Bank Indonesia
Gambar 7.1. Jumlah dan sebaran TPID (Posisi Desember 2017)
34 TPID in Provinces
50% ≤ TPID < 75% TPID ≤ 50% TPID = 100% 75% ≤ TPID < 100%
493 TPID in Cities and Districts
Figure 7.1. Number and Distribution of Regional Inflation Control Teams (TPID) in 2017
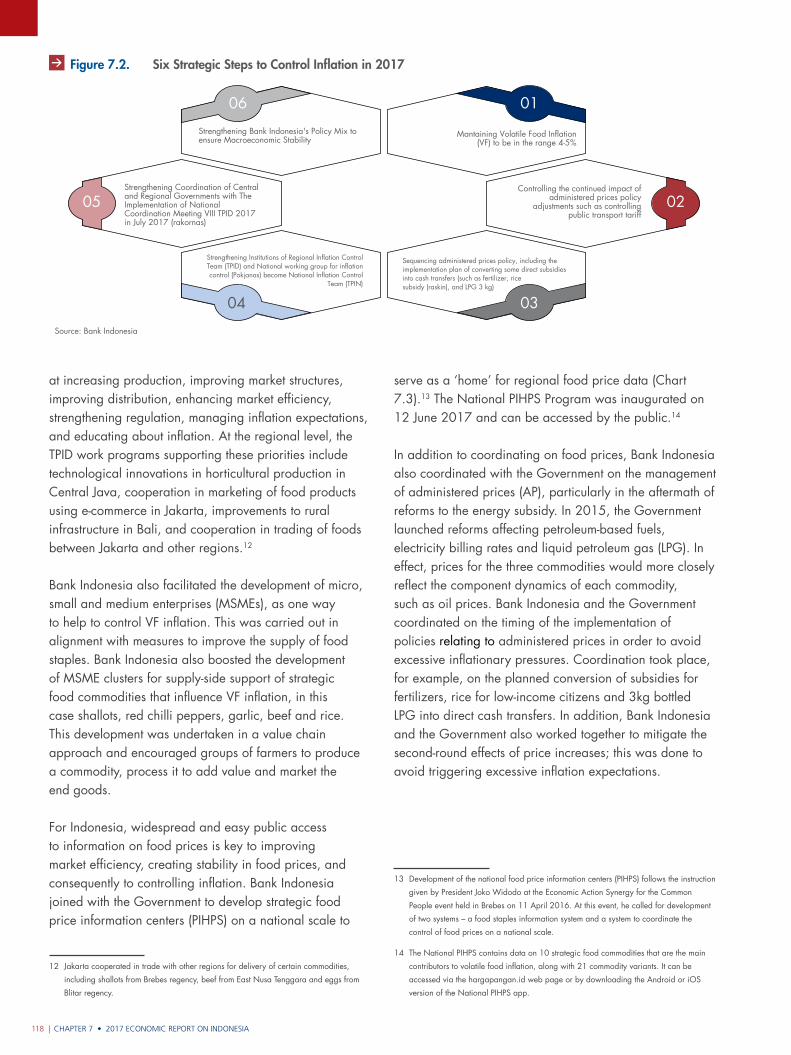
CHAPTER 7 • 2017 ECONOMIC REPORT ON INDONESIA118 |
Source: Bank Indonesia
Gambar 7.2. Enam Langkah Strategis Menjaga Inflasi 2017
Mantaining Volatile Food Inflation(VF) to be in the range 4-5%
01
02
06
05
0304
Strengthening Bank Indonesia's Policy Mix to ensure Macroeconomic Stability
Strengthening Coordination of Central and Regional Governments with The Implementation of National Coordination Meeting VIII TPID 2017 in July 2017 (rakornas)
Controlling the continued impact of administered prices policy
adjustments such as controlling public transport tariff
Sequencing administered prices policy, including the implementation plan of converting some direct subsidies into cash transfers (such as fertilizer, ricesubsidy (raskin), and LPG 3 kg)
Strengthening Institutions of Regional Inflation Control Team (TPID) and National working group for inflation control (Pokjanas) become National Inflation Control
Team (TPIN)
at increasing production, improving market structures, improving distribution, enhancing market efficiency, strengthening regulation, managing inflation expectations, and educating about inflation. At the regional level, the TPID work programs supporting these priorities include technological innovations in horticultural production in Central Java, cooperation in marketing of food products using e-commerce in Jakarta, improvements to rural infrastructure in Bali, and cooperation in trading of foods between Jakarta and other regions.12
Bank Indonesia also facilitated the development of micro, small and medium enterprises (MSMEs), as one way to help to control VF inflation. This was carried out in alignment with measures to improve the supply of food staples. Bank Indonesia also boosted the development of MSME clusters for supply-side support of strategic food commodities that influence VF inflation, in this case shallots, red chilli peppers, garlic, beef and rice. This development was undertaken in a value chain approach and encouraged groups of farmers to produce a commodity, process it to add value and market the end goods.
For Indonesia, widespread and easy public access to information on food prices is key to improving market efficiency, creating stability in food prices, and consequently to controlling inflation. Bank Indonesia joined with the Government to develop strategic food price information centers (PIHPS) on a national scale to
12 Jakarta cooperated in trade with other regions for delivery of certain commodities,
including shallots from Brebes regency, beef from East Nusa Tenggara and eggs from
Blitar regency.
serve as a ‘home’ for regional food price data (Chart 7.3).13 The National PIHPS Program was inaugurated on 12 June 2017 and can be accessed by the public.14
In addition to coordinating on food prices, Bank Indonesia also coordinated with the Government on the management of administered prices (AP), particularly in the aftermath of reforms to the energy subsidy. In 2015, the Government launched reforms affecting petroleum-based fuels, electricity billing rates and liquid petroleum gas (LPG). In effect, prices for the three commodities would more closely reflect the component dynamics of each commodity, such as oil prices. Bank Indonesia and the Government coordinated on the timing of the implementation of policies relating to administered prices in order to avoid excessive inflationary pressures. Coordination took place, for example, on the planned conversion of subsidies for fertilizers, rice for low-income citizens and 3kg bottled LPG into direct cash transfers. In addition, Bank Indonesia and the Government also worked together to mitigate the second-round effects of price increases; this was done to avoid triggering excessive inflation expectations.
13 Development of the national food price information centers (PIHPS) follows the instruction
given by President Joko Widodo at the Economic Action Synergy for the Common
People event held in Brebes on 11 April 2016. At this event, he called for development
of two systems – a food staples information system and a system to coordinate the
control of food prices on a national scale.
14 The National PIHPS contains data on 10 strategic food commodities that are the main
contributors to volatile food inflation, along with 21 commodity variants. It can be
accessed via the hargapangan.id web page or by downloading the Android or iOS
version of the National PIHPS app.
Figure 7.2. Six Strategic Steps to Control Inflation in 2017
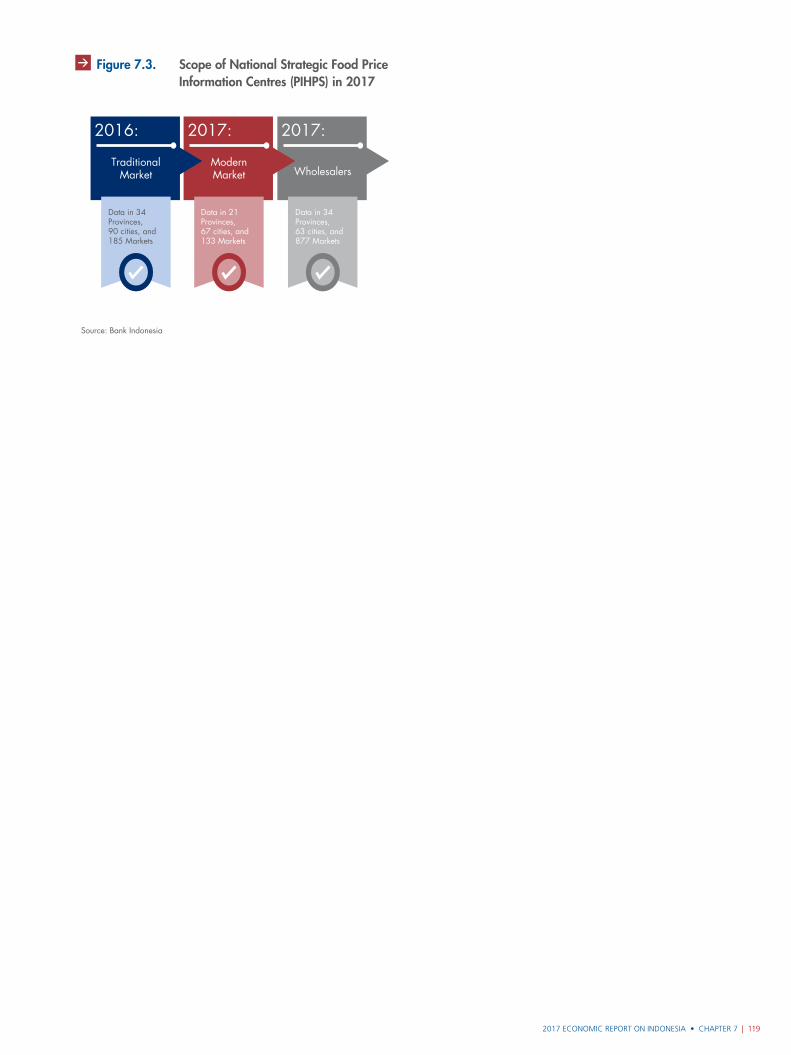
2017 ECONOMIC REPORT ON INDONESIA • CHAPTER 7 | 119
Source: Bank Indonesia
Gambar 7.3. Lorem Ipsum
2016:
TraditionalMarket
Data in 34Provinces,90 cities, and185 Markets
Data in 21Provinces,67 cities, and133 Markets
Data in 34Provinces,63 cities, and877 Markets
ModernMarket Wholesalers
2017: 2017:
Figure 7.3. Scope of National Strategic Food Price Information Centres (PIHPS) in 2017
CHAPTER 7 • 2017 ECONOMIC REPORT ON INDONESIA120 |
Box 7.1.
To improve the effectiveness of monetary policy, Bank Indonesia has undertaken a three-pronged reformulation of the monetary policy operational framework, spanning 2016, 2017 and 2018. First, Bank Indonesia aimed to add strength to monetary policy signals by reformulating the policy rate. Second, Bank Indonesia would reinforce the management of bank liquidity through reserve requirement (RR) averaging. Third, it planned to introduce a broader diversity of instruments and transactions to boost financial market deepening.
On 19 August 2016, Bank Indonesia reformulated the monetary policy operating framework by switching the policy rate from the BI Rate to the BI7DRR. This change accompanied a strengthening of the monetary operation strategy by safeguarding a symmetrical and narrower interest rate corridor on the interbank market.
The reformulation of the policy rate was taken further by implementing the second pillar, namely the introduction of the RR averaging policy on 1 July 2017. The RR averaging was launched in a cautious, phased process that took account of various challenges, including the surplus and unevenly distributed liquidity in the banking system, the minimal availability of instruments on the money market and a lack of equitable access to interbank transactions. Therefore, in the initial stage, the RR averaging applied only to the rupiah primary RR at conventional banks and was carried out with partial averaging.
The RR averaging policy did not change the level of the rupiah primary RR that banks were required to meet, which remained at 6.5% of depositor funds. However, a change was made to how the requirement was to be met; in this case, from the former fixed level (6.5% of depositor funds) to be met on a daily basis to a portion (1.5% of depositor funds) that can be averaged over two weeks. The remaining 5% of depositor funds must still be met on a daily basis.
Implementation and Evaluation of the Minimum Reserve Requirement Averaging Policy
The objectives of RR averaging were to improve bank liquidity management, promote financial market deepening and reduce interest rate volatility on the money market. The introduction of RR averaging provided banks with flexibility regarding the timeframe for compliance, with the previous daily requirement extended to a two-weekly period. Through this flexibility, banks are expected to have greater opportunity to strengthen their liquidity management and make their placements in money market instruments with longer tenors. In this way, banks are expected to operate more efficiently in liquidity management and help support measures for financial market deepening.
The implementation of RR averaging is also expected to provide incentives for banks to scale back their precautionary reserves and reduce dependence on the money market for meeting liquidity requirements, thus easing pressure on the money market and making for greater stability in interbank rates.
Since its inception, banks have taken advantage of the RR averaging policy; the number of banks using it and the volume of funds increased. By the end of 2017, RR averaging was in use at 49 banks, or 48% of the total 102 banks. Over the six months from inception to the end of the year, banks generally opted to use RR averaging in the range of 0.6% to 0.90%, well within the permitted maximum 1.5% RR averaging (Chart 1).
The launching of RR averaging led to improved efficiency in the management of banking liquidity. Reflecting the higher efficiency was the decline in the average position of excess reserves (ER), an indicator of precautionary reserves, at banks taking advantage of RR averaging. During the evaluation period, the average position of ER at banks that used RR averaging fell by 60.1%, a steeper drop when compared to the overall 50.1% decline in ER for the banking industry as a whole.1
The positive impact of RR averaging also started to become visible in reduced volatility in interbank rates. From July to December 2017, volatility in overnight interbank rates was down compared with volatility levels before RR averaging was launched (Chart 2). The longer period for meeting the RR enabled banks to hold back
1 July to December 2017 period compared to January to June 2017.
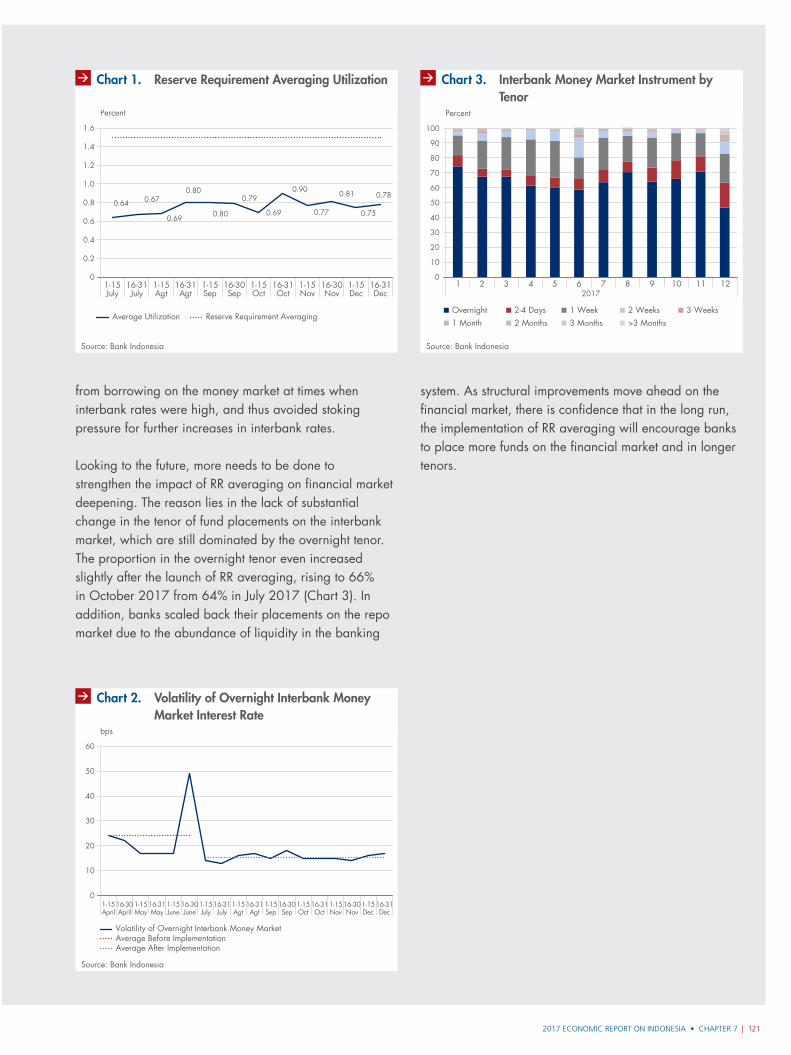
2017 ECONOMIC REPORT ON INDONESIA • CHAPTER 7 | 121
1962
1964
1966
1968
1970
1972
1974
1976
1978
1980
1982
1984
1986
1988
1990
1992
1994
1996
1998
2000
2002
2004
2006
2008
2010
2012
2014
2016
Sumber: UN COMTRADE
Gra�k 1 Box 10.3. Dinamika Sektor Industri Thailand
0
0,5
1,0
1,5
2,0
2,5
Share of World Export
Tekstil Elektrik Mesin Otomotif
Chart 1. Reserve Requirement Averaging Utilization
Source: Bank Indonesia
Grafik 1 Boks 7. Pemanfaatan (Utilisasi) GWM Rata-Rata
0
0.2
0.4
0.6
0.8
1.0
1.2
1.6
1.4
Percent
0.64 0.67
0.69
0.80
0.80
0.79
0.69
0.90
0.77
0.81
0.75
0.78
1-15July
16-31July
1-15Agt
16-31Agt
1-15Sep
16-30Sep
1-15Oct
16-31Oct
1-15Nov
16-30Nov
1-15Dec
16-31Dec
Average Utilization Reserve Requirement Averaging
1962
1964
1966
1968
1970
1972
1974
1976
1978
1980
1982
1984
1986
1988
1990
1992
1994
1996
1998
2000
2002
2004
2006
2008
2010
2012
2014
2016
Sumber: UN COMTRADE
Gra�k 1 Box 10.3. Dinamika Sektor Industri Thailand
0
0,5
1,0
1,5
2,0
2,5
Share of World Export
Tekstil Elektrik Mesin Otomotif
Chart 2. Volatility of Overnight Interbank Money Market Interest Rate
Source: Bank Indonesia
Grafik 2 Boks 7. Volatilitas PUAB O/N
0
10
20
30
40
60
50
bps
Volatility of Overnight Interbank Money MarketAverage Before ImplementationAverage After Implementation
1-15April
16-30April
1-15May
16-31May
1-15June
16-30June
1-15July
16-31July
1-15Agt
16-31Agt
1-15Sep
16-30Sep
1-15Oct
16-31Oct
1-15Nov
16-30Nov
1-15Dec
16-31Dec
from borrowing on the money market at times when interbank rates were high, and thus avoided stoking pressure for further increases in interbank rates.
Looking to the future, more needs to be done to strengthen the impact of RR averaging on financial market deepening. The reason lies in the lack of substantial change in the tenor of fund placements on the interbank market, which are still dominated by the overnight tenor. The proportion in the overnight tenor even increased slightly after the launch of RR averaging, rising to 66% in October 2017 from 64% in July 2017 (Chart 3). In addition, banks scaled back their placements on the repo market due to the abundance of liquidity in the banking
system. As structural improvements move ahead on the financial market, there is confidence that in the long run, the implementation of RR averaging will encourage banks to place more funds on the financial market and in longer tenors.
1962
1964
1966
1968
1970
1972
1974
1976
1978
1980
1982
1984
1986
1988
1990
1992
1994
1996
1998
2000
2002
2004
2006
2008
2010
2012
2014
2016
Sumber: UN COMTRADE
Gra�k 1 Box 10.3. Dinamika Sektor Industri Thailand
0
0,5
1,0
1,5
2,0
2,5
Share of World Export
Tekstil Elektrik Mesin Otomotif
Chart 3. Interbank Money Market Instrument by Tenor
Source: Bank Indonesia
Grafik 2 Boks 7. Tenor Instrumen PUAB
Percent
0
20
30
10
40
70
60
50
90
80
100
1 MonthOvernight
2 Months2-4 Days
3 Months1 Week
>3 Months2 Weeks 3 Weeks
4 5 61 2 3 7 8 9 10 11 122017

| 123LAPORAN PEREKONOMIAN INDONESIA 2017LAPORAN PEREKONOMIAN INDONESIA 2017
CHAPTER 8
2017 ECONOMIC REPORT ON INDONESIA
Bank Indonesia continued to pursue its accommodative macroprudential policy, which is aimed at supporting the intermediation function of banks by maintaining financial system stability. This policy was intended to both support the financial cycle and also the ongoing economic recovery.
Macroprudential Policy
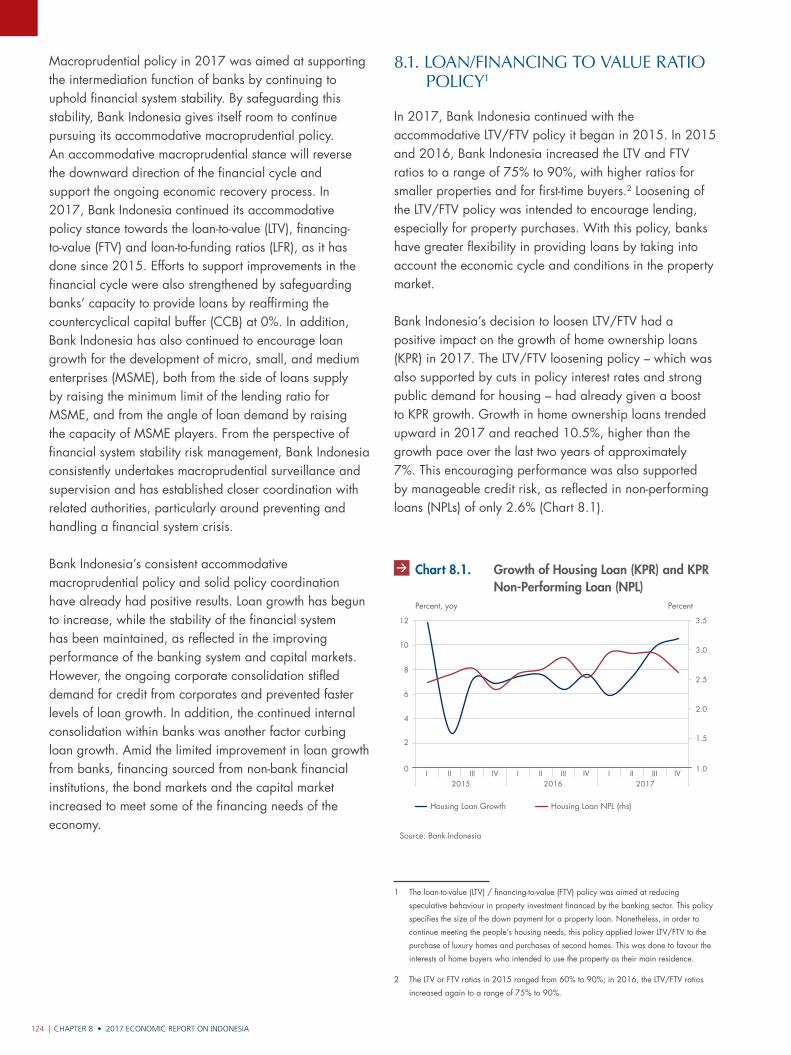
CHAPTER 8 • 2017 ECONOMIC REPORT ON INDONESIA124 |
Macroprudential policy in 2017 was aimed at supporting the intermediation function of banks by continuing to uphold financial system stability. By safeguarding this stability, Bank Indonesia gives itself room to continue pursuing its accommodative macroprudential policy. An accommodative macroprudential stance will reverse the downward direction of the financial cycle and support the ongoing economic recovery process. In 2017, Bank Indonesia continued its accommodative policy stance towards the loan-to-value (LTV), financing-to-value (FTV) and loan-to-funding ratios (LFR), as it has done since 2015. Efforts to support improvements in the financial cycle were also strengthened by safeguarding banks’ capacity to provide loans by reaffirming the countercyclical capital buffer (CCB) at 0%. In addition, Bank Indonesia has also continued to encourage loan growth for the development of micro, small, and medium enterprises (MSME), both from the side of loans supply by raising the minimum limit of the lending ratio for MSME, and from the angle of loan demand by raising the capacity of MSME players. From the perspective of financial system stability risk management, Bank Indonesia consistently undertakes macroprudential surveillance and supervision and has established closer coordination with related authorities, particularly around preventing and handling a financial system crisis.
Bank Indonesia’s consistent accommodative macroprudential policy and solid policy coordination have already had positive results. Loan growth has begun to increase, while the stability of the financial system has been maintained, as reflected in the improving performance of the banking system and capital markets. However, the ongoing corporate consolidation stifled demand for credit from corporates and prevented faster levels of loan growth. In addition, the continued internal consolidation within banks was another factor curbing loan growth. Amid the limited improvement in loan growth from banks, financing sourced from non-bank financial institutions, the bond markets and the capital market increased to meet some of the financing needs of the economy.
8.1. Loan/Financing to VaLue Ratio PoLicy1
In 2017, Bank Indonesia continued with the accommodative LTV/FTV policy it began in 2015. In 2015 and 2016, Bank Indonesia increased the LTV and FTV ratios to a range of 75% to 90%, with higher ratios for smaller properties and for first-time buyers.2 Loosening of the LTV/FTV policy was intended to encourage lending, especially for property purchases. With this policy, banks have greater flexibility in providing loans by taking into account the economic cycle and conditions in the property market.
Bank Indonesia’s decision to loosen LTV/FTV had a positive impact on the growth of home ownership loans (KPR) in 2017. The LTV/FTV loosening policy – which was also supported by cuts in policy interest rates and strong public demand for housing – had already given a boost to KPR growth. Growth in home ownership loans trended upward in 2017 and reached 10.5%, higher than the growth pace over the last two years of approximately 7%. This encouraging performance was also supported by manageable credit risk, as reflected in non-performing loans (NPLs) of only 2.6% (Chart 8.1).
1 The loan-to-value (LTV) / financing-to-value (FTV) policy was aimed at reducing
speculative behaviour in property investment financed by the banking sector. This policy
specifies the size of the down payment for a property loan. Nonetheless, in order to
continue meeting the people’s housing needs, this policy applied lower LTV/FTV to the
purchase of luxury homes and purchases of second homes. This was done to favour the
interests of home buyers who intended to use the property as their main residence.
2 The LTV or FTV ratios in 2015 ranged from 60% to 90%; in 2016, the LTV/FTV ratios
increased again to a range of 75% to 90%.
Source: Bank Indonesia
Grafik 8.1. Pertumbuhan dan Risiko Kredit KPR
0
2
4
6
8
10
12
Percent, yoy Percent
1.0
1.5
2.0
2.5
3.0
3.5
I II III IV2015 2016 2017
I II III IV I II III IV
Housing Loan Growth Housing Loan NPL (rhs)
Chart 8.1. Growth of Housing Loan (KPR) and KPR Non-Performing Loan (NPL)
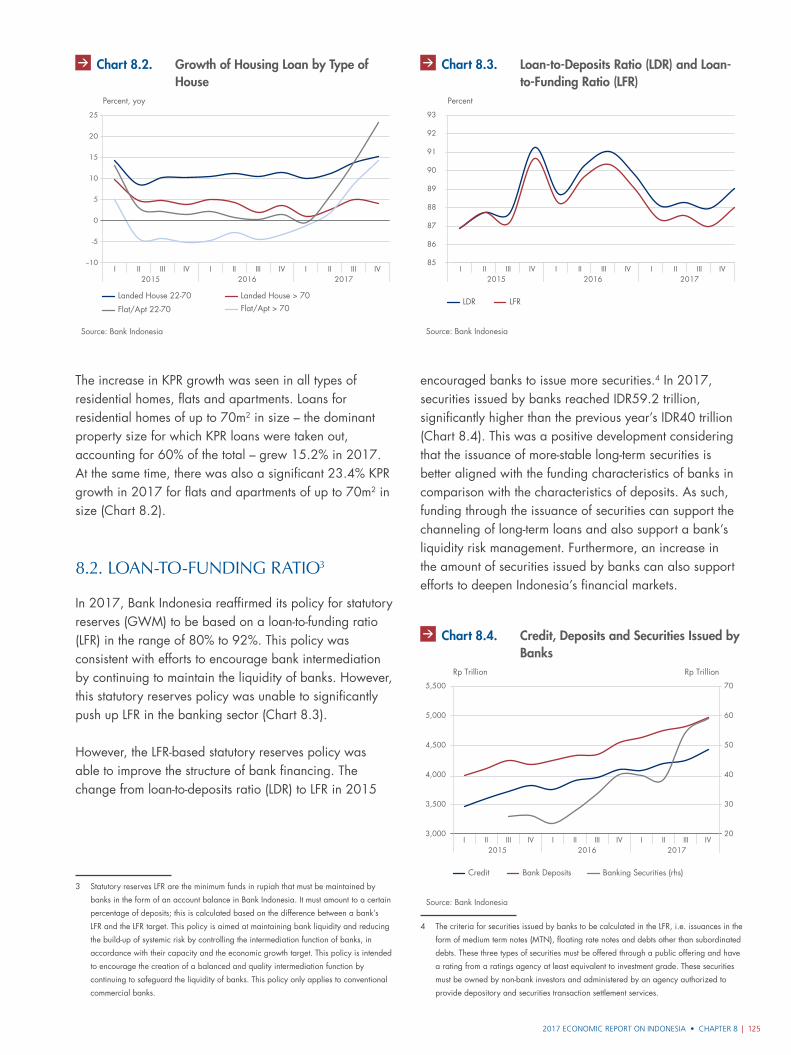
2017 ECONOMIC REPORT ON INDONESIA • CHAPTER 8 | 125
encouraged banks to issue more securities.4 In 2017, securities issued by banks reached IDR59.2 trillion, significantly higher than the previous year’s IDR40 trillion (Chart 8.4). This was a positive development considering that the issuance of more-stable long-term securities is better aligned with the funding characteristics of banks in comparison with the characteristics of deposits. As such, funding through the issuance of securities can support the channeling of long-term loans and also support a bank’s liquidity risk management. Furthermore, an increase in the amount of securities issued by banks can also support efforts to deepen Indonesia’s financial markets.
4 The criteria for securities issued by banks to be calculated in the LFR, i.e. issuances in the
form of medium term notes (MTN), floating rate notes and debts other than subordinated
debts. These three types of securities must be offered through a public offering and have
a rating from a ratings agency at least equivalent to investment grade. These securities
must be owned by non-bank investors and administered by an agency authorized to
provide depository and securities transaction settlement services.
The increase in KPR growth was seen in all types of residential homes, flats and apartments. Loans for residential homes of up to 70m2 in size – the dominant property size for which KPR loans were taken out, accounting for 60% of the total – grew 15.2% in 2017. At the same time, there was also a significant 23.4% KPR growth in 2017 for flats and apartments of up to 70m2 in size (Chart 8.2).
8.2. Loan-to-Funding Ratio3
In 2017, Bank Indonesia reaffirmed its policy for statutory reserves (GWM) to be based on a loan-to-funding ratio (LFR) in the range of 80% to 92%. This policy was consistent with efforts to encourage bank intermediation by continuing to maintain the liquidity of banks. However, this statutory reserves policy was unable to significantly push up LFR in the banking sector (Chart 8.3).
However, the LFR-based statutory reserves policy was able to improve the structure of bank financing. The change from loan-to-deposits ratio (LDR) to LFR in 2015
3 Statutory reserves LFR are the minimum funds in rupiah that must be maintained by
banks in the form of an account balance in Bank Indonesia. It must amount to a certain
percentage of deposits; this is calculated based on the difference between a bank’s
LFR and the LFR target. This policy is aimed at maintaining bank liquidity and reducing
the build-up of systemic risk by controlling the intermediation function of banks, in
accordance with their capacity and the economic growth target. This policy is intended
to encourage the creation of a balanced and quality intermediation function by
continuing to safeguard the liquidity of banks. This policy only applies to conventional
commercial banks.
Source: Bank Indonesia
Grafik 8.2. Pertumbuhan KPR per Tipe
Percent, yoy
I II III IV2015 2016 2017
I II III IV I II III IV
Landed House 22-70 Landed House > 70
Flat/Apt 22-70 Flat/Apt > 70
20
15
10
5
0
-5
--10
25
Chart 8.2. Growth of Housing Loan by Type of House
Source: Bank Indonesia
Grafik 8.3. Perkembangan LDR dan LFR
Percent
I II III IV2015 2016 2017
I II III IV I II III IV
LDR LFR
85
86
87
88
89
90
91
92
93
Chart 8.3. Loan-to-Deposits Ratio (LDR) and Loan-to-Funding Ratio (LFR)
Source: Bank Indonesia
Grafik 8.4. Perkembangan Kredit, DPK dan SSB yang Diterbitkan Bank
Rp Trillion Rp Trillion
I II III IV2015 2016 2017
I II III IV I II III IV
Credit Bank Deposits Banking Securities (rhs)
20
30
40
50
60
70
3,000
3,500
4,000
4,500
5,000
5,500
Chart 8.4. Credit, Deposits and Securities Issued by Banks
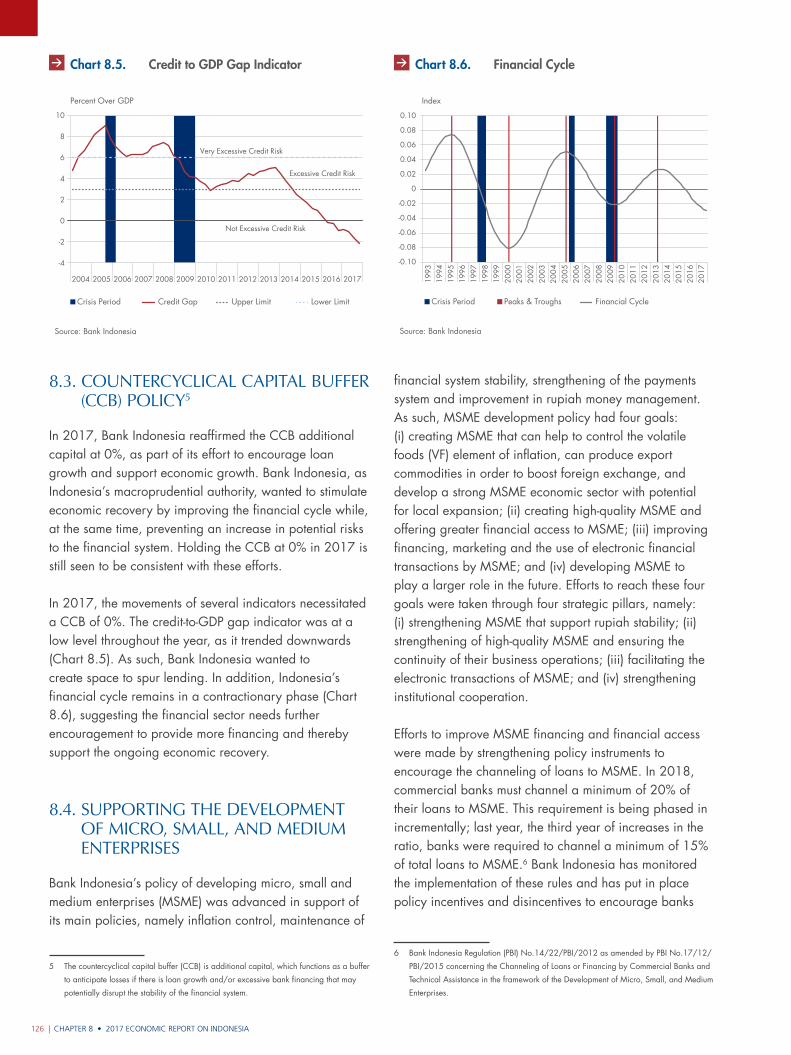
CHAPTER 8 • 2017 ECONOMIC REPORT ON INDONESIA126 |
financial system stability, strengthening of the payments system and improvement in rupiah money management. As such, MSME development policy had four goals: (i) creating MSME that can help to control the volatile foods (VF) element of inflation, can produce export commodities in order to boost foreign exchange, and develop a strong MSME economic sector with potential for local expansion; (ii) creating high-quality MSME and offering greater financial access to MSME; (iii) improving financing, marketing and the use of electronic financial transactions by MSME; and (iv) developing MSME to play a larger role in the future. Efforts to reach these four goals were taken through four strategic pillars, namely: (i) strengthening MSME that support rupiah stability; (ii) strengthening of high-quality MSME and ensuring the continuity of their business operations; (iii) facilitating the electronic transactions of MSME; and (iv) strengthening institutional cooperation.
Efforts to improve MSME financing and financial access were made by strengthening policy instruments to encourage the channeling of loans to MSME. In 2018, commercial banks must channel a minimum of 20% of their loans to MSME. This requirement is being phased in incrementally; last year, the third year of increases in the ratio, banks were required to channel a minimum of 15% of total loans to MSME.6 Bank Indonesia has monitored the implementation of these rules and has put in place policy incentives and disincentives to encourage banks
6 Bank Indonesia Regulation (PBI) No.14/22/PBI/2012 as amended by PBI No.17/12/
PBI/2015 concerning the Channeling of Loans or Financing by Commercial Banks and
Technical Assistance in the framework of the Development of Micro, Small, and Medium
Enterprises.
Grafik 8.6. Siklus Keuangan Indonesia
Source: Bank Indonesia
2004
2005
2006
2007
2008
2009
2010
2011
2012
2013
2014
2015
2016
2017
1993
1994
1995
1996
1997
1998
1999
2000
2001
2002
2003
Financial CycleCrisis Period Peaks & Troughs
Index
-0.10
-0.08
-0.06
-0.04
-0.02
0
0.02
0.04
0.06
0.08
0.10
Chart 8.6. Financial Cycle
8.3. counteRcycLicaL caPitaL BuFFeR (ccB) PoLicy5
In 2017, Bank Indonesia reaffirmed the CCB additional capital at 0%, as part of its effort to encourage loan growth and support economic growth. Bank Indonesia, as Indonesia’s macroprudential authority, wanted to stimulate economic recovery by improving the financial cycle while, at the same time, preventing an increase in potential risks to the financial system. Holding the CCB at 0% in 2017 is still seen to be consistent with these efforts.
In 2017, the movements of several indicators necessitated a CCB of 0%. The credit-to-GDP gap indicator was at a low level throughout the year, as it trended downwards (Chart 8.5). As such, Bank Indonesia wanted to create space to spur lending. In addition, Indonesia’s financial cycle remains in a contractionary phase (Chart 8.6), suggesting the financial sector needs further encouragement to provide more financing and thereby support the ongoing economic recovery.
8.4. SuPPoRting the deVeLoPment oF micRo, SmaLL, and medium enteRPRiSeS
Bank Indonesia’s policy of developing micro, small and medium enterprises (MSME) was advanced in support of its main policies, namely inflation control, maintenance of
5 The countercyclical capital buffer (CCB) is additional capital, which functions as a buffer
to anticipate losses if there is loan growth and/or excessive bank financing that may
potentially disrupt the stability of the financial system.
Grafik 8.5. Kesenjangan Kredit terhadap PDB
Source: Bank Indonesia
-4
-2
0
2
4
6
8
10
Percent Over GDP
20072004 2005 2006 2008 2009 2010 2011 2012 2013 2014 2015 2016 2017
Credit Gap Upper Limit Lower LimitCrisis Period
Very Excessive Credit Risk
Excessive Credit Risk
Not Excessive Credit Risk
Chart 8.5. Credit to GDP Gap Indicator
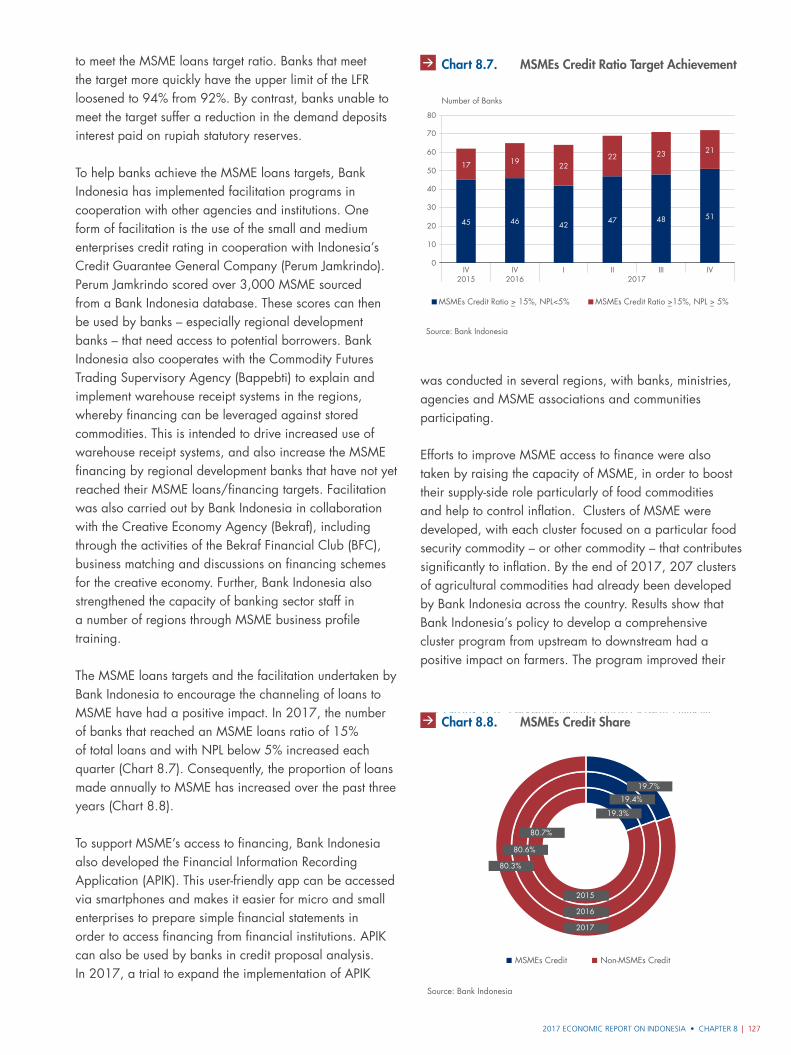
2017 ECONOMIC REPORT ON INDONESIA • CHAPTER 8 | 127
to meet the MSME loans target ratio. Banks that meet the target more quickly have the upper limit of the LFR loosened to 94% from 92%. By contrast, banks unable to meet the target suffer a reduction in the demand deposits interest paid on rupiah statutory reserves.
To help banks achieve the MSME loans targets, Bank Indonesia has implemented facilitation programs in cooperation with other agencies and institutions. One form of facilitation is the use of the small and medium enterprises credit rating in cooperation with Indonesia’s Credit Guarantee General Company (Perum Jamkrindo). Perum Jamkrindo scored over 3,000 MSME sourced from a Bank Indonesia database. These scores can then be used by banks – especially regional development banks – that need access to potential borrowers. Bank Indonesia also cooperates with the Commodity Futures Trading Supervisory Agency (Bappebti) to explain and implement warehouse receipt systems in the regions, whereby financing can be leveraged against stored commodities. This is intended to drive increased use of warehouse receipt systems, and also increase the MSME financing by regional development banks that have not yet reached their MSME loans/financing targets. Facilitation was also carried out by Bank Indonesia in collaboration with the Creative Economy Agency (Bekraf), including through the activities of the Bekraf Financial Club (BFC), business matching and discussions on financing schemes for the creative economy. Further, Bank Indonesia also strengthened the capacity of banking sector staff in a number of regions through MSME business profile training.
The MSME loans targets and the facilitation undertaken by Bank Indonesia to encourage the channeling of loans to MSME have had a positive impact. In 2017, the number of banks that reached an MSME loans ratio of 15% of total loans and with NPL below 5% increased each quarter (Chart 8.7). Consequently, the proportion of loans made annually to MSME has increased over the past three years (Chart 8.8).
To support MSME’s access to financing, Bank Indonesia also developed the Financial Information Recording Application (APIK). This user-friendly app can be accessed via smartphones and makes it easier for micro and small enterprises to prepare simple financial statements in order to access financing from financial institutions. APIK can also be used by banks in credit proposal analysis. In 2017, a trial to expand the implementation of APIK
was conducted in several regions, with banks, ministries, agencies and MSME associations and communities participating.
Efforts to improve MSME access to finance were also taken by raising the capacity of MSME, in order to boost their supply-side role particularly of food commodities and help to control inflation. Clusters of MSME were developed, with each cluster focused on a particular food security commodity – or other commodity – that contributes significantly to inflation. By the end of 2017, 207 clusters of agricultural commodities had already been developed by Bank Indonesia across the country. Results show that Bank Indonesia’s policy to develop a comprehensive cluster program from upstream to downstream had a positive impact on farmers. The program improved their
Grafik 8.7. Pencapaian Target Rasio Kredit UMKMPerbankan sebesar 15%
Source: Bank Indonesia
0
10
20
30
40
50
60
70
80
Number of Banks
IV IV I II2015 2016 2017
III IV
MSMEs Credit Ratio > 15%, NPL<5% MSMEs Credit Ratio >15%, NPL > 5%
45 46 42 47 48 51
17 19 2222 23 21
_ _ _
Chart 8.7. MSMEs Credit Ratio Target Achievement
Source: Bank Indonesia
Grafik 8.8. Perkembangan Pangsa Kredit UMKM
MSMEs Credit Non-MSMEs Credit
2015
80.7%
19.3%
19.4%
19.7%
80.6%
80.3%
2016
2017
Chart 8.8. MSMEs Credit Share
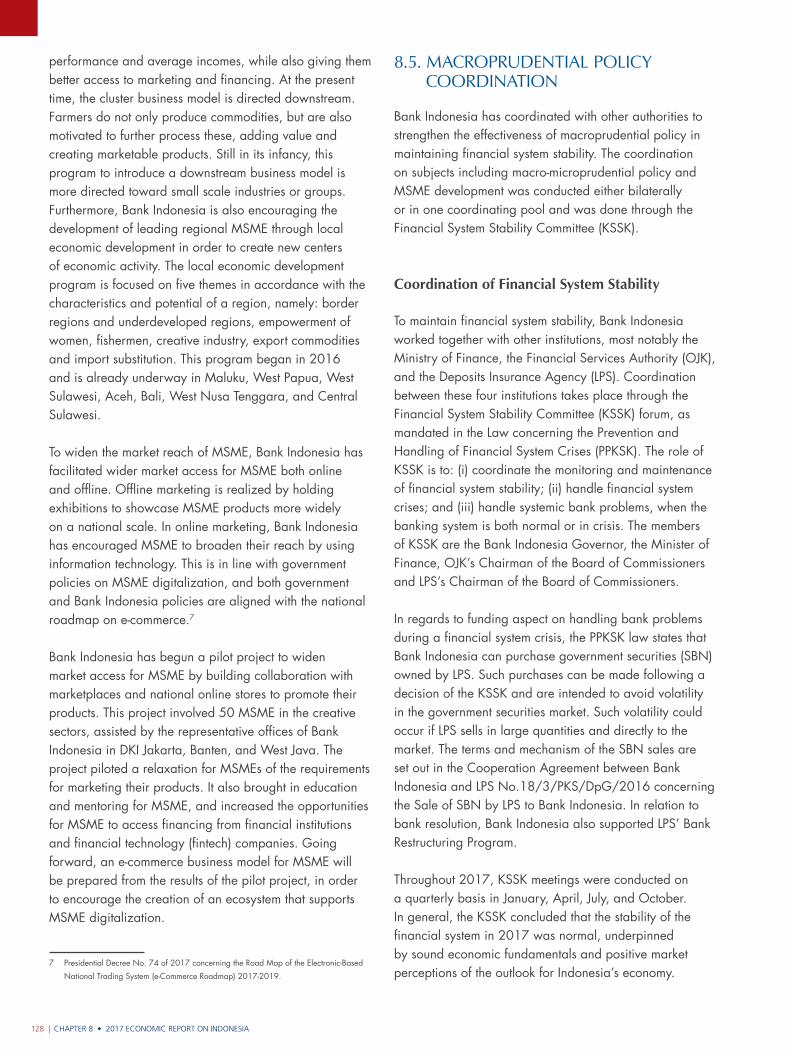
CHAPTER 8 • 2017 ECONOMIC REPORT ON INDONESIA128 |
performance and average incomes, while also giving them better access to marketing and financing. At the present time, the cluster business model is directed downstream. Farmers do not only produce commodities, but are also motivated to further process these, adding value and creating marketable products. Still in its infancy, this program to introduce a downstream business model is more directed toward small scale industries or groups. Furthermore, Bank Indonesia is also encouraging the development of leading regional MSME through local economic development in order to create new centers of economic activity. The local economic development program is focused on five themes in accordance with the characteristics and potential of a region, namely: border regions and underdeveloped regions, empowerment of women, fishermen, creative industry, export commodities and import substitution. This program began in 2016 and is already underway in Maluku, West Papua, West Sulawesi, Aceh, Bali, West Nusa Tenggara, and Central Sulawesi.
To widen the market reach of MSME, Bank Indonesia has facilitated wider market access for MSME both online and offline. Offline marketing is realized by holding exhibitions to showcase MSME products more widely on a national scale. In online marketing, Bank Indonesia has encouraged MSME to broaden their reach by using information technology. This is in line with government policies on MSME digitalization, and both government and Bank Indonesia policies are aligned with the national roadmap on e-commerce.7
Bank Indonesia has begun a pilot project to widen market access for MSME by building collaboration with marketplaces and national online stores to promote their products. This project involved 50 MSME in the creative sectors, assisted by the representative offices of Bank Indonesia in DKI Jakarta, Banten, and West Java. The project piloted a relaxation for MSMEs of the requirements for marketing their products. It also brought in education and mentoring for MSME, and increased the opportunities for MSME to access financing from financial institutions and financial technology (fintech) companies. Going forward, an e-commerce business model for MSME will be prepared from the results of the pilot project, in order to encourage the creation of an ecosystem that supports MSME digitalization.
7 Presidential Decree No. 74 of 2017 concerning the Road Map of the Electronic-Based
National Trading System (e-Commerce Roadmap) 2017-2019.
8.5. macRoPRudentiaL PoLicy cooRdination
Bank Indonesia has coordinated with other authorities to strengthen the effectiveness of macroprudential policy in maintaining financial system stability. The coordination on subjects including macro-microprudential policy and MSME development was conducted either bilaterally or in one coordinating pool and was done through the Financial System Stability Committee (KSSK).
Coordination of Financial System Stability
To maintain financial system stability, Bank Indonesia worked together with other institutions, most notably the Ministry of Finance, the Financial Services Authority (OJK), and the Deposits Insurance Agency (LPS). Coordination between these four institutions takes place through the Financial System Stability Committee (KSSK) forum, as mandated in the Law concerning the Prevention and Handling of Financial System Crises (PPKSK). The role of KSSK is to: (i) coordinate the monitoring and maintenance of financial system stability; (ii) handle financial system crises; and (iii) handle systemic bank problems, when the banking system is both normal or in crisis. The members of KSSK are the Bank Indonesia Governor, the Minister of Finance, OJK’s Chairman of the Board of Commissioners and LPS’s Chairman of the Board of Commissioners.
In regards to funding aspect on handling bank problems during a financial system crisis, the PPKSK law states that Bank Indonesia can purchase government securities (SBN) owned by LPS. Such purchases can be made following a decision of the KSSK and are intended to avoid volatility in the government securities market. Such volatility could occur if LPS sells in large quantities and directly to the market. The terms and mechanism of the SBN sales are set out in the Cooperation Agreement between Bank Indonesia and LPS No.18/3/PKS/DpG/2016 concerning the Sale of SBN by LPS to Bank Indonesia. In relation to bank resolution, Bank Indonesia also supported LPS’ Bank Restructuring Program.
Throughout 2017, KSSK meetings were conducted on a quarterly basis in January, April, July, and October. In general, the KSSK concluded that the stability of the financial system in 2017 was normal, underpinned by sound economic fundamentals and positive market perceptions of the outlook for Indonesia’s economy.
2017 ECONOMIC REPORT ON INDONESIA • CHAPTER 8 | 129
This was reflected in the improving performance of the banking sector and the non-bank financial industry, the stable rupiah exchange rate, and the improving market performance of SBN and government debt securities (SUN). In addition, KSSK found that deposits insurance was adequate and financial system infrastructure remained sound.
Since 2012, KSSK has conducted annual simulations on the prevention and handling of financial system crises in order to assess how members are implementing relevant policies. Simulations for the prevention and handling of financial system crises were last conducted on 2 October 2017 to: (i) test the handling of bank liquidity and solvency (resolution) issues; (ii) test the implementation of Law PPKSK by each KSSK member institution; (iii) test the effectiveness of the decision-making process in KSSK meetings; and (iv) test the effectiveness of coordination among KSSK members.
Simulations to prevent and handle financial system crises involved the most senior leaders (known as a full-dress crisis simulation) from the four KSSK member institutions. In the 2017 simulation, Bank Indonesia was tested on, among others, provisions on crisis management protocol, short-term liquidity loans and the sale of SBN by LPS to Bank Indonesia in order to support the funding of bank resolution efforts. The simulation results received a positive response from the monitoring team, which was drawn from the World Bank, the International Monetary Fund (IMF), and the Australia-Indonesia Partnership for Economic Governance.
As part of efforts to strengthen coordination between authorities in the financial sector, Bank Indonesia established a cross-authority coordinating forum on global financial sector reform in 2016. Members are the Ministry of Finance, Bank Indonesia, OJK, and LPS. The forums aims to facilitate the exchange of information and encourage discussion. Discussion topics have included development issues and the direction of international recommendations, both microprudential or macroprudential, and forums have also followed up on recommendations made by the Financial Stability Board. The main achievement of this forum in 2017 is greater awareness of international recommendations in the financial sector and the status of the implementation of these recommendations in Indonesia. In addition, the forum has also promoted efforts improve the implementation of financial reforms in Indonesia and
formulate a common stance on global financial sector reform.
Financial sector authorities also coordinated to monitor new risks emerging in the financial system, including from fintech innovation, misconduct or a decline in correspondent banking activity.
The IMF and the World Bank believe that coordinating efforts to maintain the stability of the financial system in Indonesia have successfully helped to reform Indonesia’s financial sector. Reforms were also supported by supervision and a crisis management framework, as well as the development and integrity of a stronger financial sector since the last Financial Sector Assessment Program (FSAP) in 2010. In 2017, a second FSAP assessment was carried out on Indonesia in order to meet its commitment as a member of the G20 and Financial Stability Board to ‘lead by example’.
The FSAP 2017 assessment shows Indonesia’s macroeconomic performance has strengthened on the back of a stable financial system, despite global and domestic vulnerabilities. Systemic risk in the domestic financial system was considered low and the banking system resilient in the face of possible severe shocks, supported by strong capital and solid profitability. In addition, corporate sector vulnerabilities were considered to be under control, although there was an increased risk of debt in a number of economic sectors and an increased funding risk from overseas. Authorities are required to continue monitoring systemic risks and be aware of the potential for financial distress.
Coordination of Macro-Microprudential Policy
Coordination of macro-microprudential policy to create a stable financial system occurred bilaterally between Bank Indonesia and OJK, based on mutual decisions and memoranda of understanding.
In line with Bank Indonesia’s policy of maintaining macroeconomic stability, OJK also laid out a series of policies to support financial system stability. OJK’s policies were intended to ensure that all activities in the financial services sector are orderly, fair, transparent and accountable, and to ensure sustainable and stable growth of the financial system. In 2017, OJK issued a number of rulings (POJK) to strengthen the financial services sector.
CHAPTER 8 • 2017 ECONOMIC REPORT ON INDONESIA130 |
Among others, it revoked the regulation that relaxed loan restructuring as set forth in POJK No.11/POJK/03/2015 concerning the Ruling on Prudence in the Framework of National Economic Stimulus for Commercial Banks. This decision was taken in view of the improving banking conditions, along with the internal consolidation of the banking system.
Bank Indonesia and OJK continue to coordinate intensively given the connection between the duties and authority of each institution. In 2017, Bank Indonesia and OJK compiled a guide to cooperation between the two organizations, an important step to facilitate and optimize cooperation and coordination between the two institutions. This document contains procedures and a coordinating mechanism for the two institutions and acts as guidance for the work units at Bank Indonesia and OJK.
One aspect of the cooperation outlined in the document concerns the preparation of policies and regulations that will be issued by either Bank Indonesia or OJK. Through this cooperation, these two institutions have agreed to share opinions and hold discussions. This type of coordination is intended to result in harmonious and complementary regulations in the financial sector that also support effective implementation of policies by the appropriate authority.
For example, the OJK coordinates with Bank Indonesia when issuing policies for financial institutions, particularly those related to crisis-handling. Such coordination took place during the development of the POJK concerning the Implementation of the Status and Follow-up of Commercial Bank Supervision, the POJK concerning Intermediary Banks, and the Regulation concerning the Recovery Plan for Systemic Banks8, 9, 10. These policies were intended to provide clarity on the implementation of crisis management policies in the financial sector.
Bank Indonesia and OJK also cooperated on data and information exchange on the results of the supervision of financial services institutions and macro-surveillance, in
8 POJK No.15/POJK.03/2017 concerning the Determination of the Status and Follow-up
of Commercial Bank Supervision contains rules for handling bank problems facing
systemic banks or other banks.
9 POJK No. 16/POJK.03/2017 concerning Intermediary Banks contains rules concerning
the procedure for the establishment of an intermediary bank, which can only be founded
and owned by LPS as an option to handle bank solvency problems.
10 POJK No. 14/POJK.03/2017 concerning the Recovery Plan for Systemic Banks
contains rules regarding the obligation for systemic banks to prepare a recovery plan to
prevent and overcome financial problems.
addition to management of the capturing report system, which monitors the financial and management reports of financial institutions. The exchange of such data and/or information was done in order to monitor the stability of the financial system as mandated by the PPKSK law.
Coordination of MSMEs Development
To improve the effectiveness of policies to develop MSME, Bank Indonesia strengthened coordination and cooperation with various parties. In 2017, Bank Indonesia signed a memorandum of understanding with the Ministry of Cooperatives and SMEs on joint work to empower cooperatives and SMEs. One form of cooperation was through joint assessment activities to evaluate MSME, based on Law No. 20 of 2008 concerning MSME. This is a necessary first step before empowerment programs can be developed. The evaluation mapped the potential and problems of MSME and also aimed to evaluate and formulate MSME criteria that are in line with the latest economic developments. In other cooperation, Bank Indonesia also worked with the Ministry of Industry and the Creative Economy Agency. This cooperation was designed to empower MSME in order to: help control inflation; improve the access and coverage of MSME financing; develop and empower a sharia economy; conduct research, education and facilitation; and exchange data and information. Bank Indonesia also cooperated with the Ministry of Industry to formulate new supporting policies and to increase growth of small and medium industries and entrepreneurs. This work is undertaken with an eye to more even distribution of welfare, given that most MSME are in the lower-income band of the population. Empowering and boosting growth of MSME will boost lower-income groups.
8.6. deVeLoPmentS in FinanciaL SyStem StaBiLity
Although the stability of the financial system was generally well maintained in 2017, there were still challenges in promoting banking intermediation. Stability of the financial system was underpinned by the good resilience of banks and sound performance of the financial markets. The improving banking resilience can be seen in the healthy capital adequacy ratio (CAR), the strong ratio of liquidity to deposits and increasing profitability. Nonetheless, banking intermediation is not yet optimal, though it is
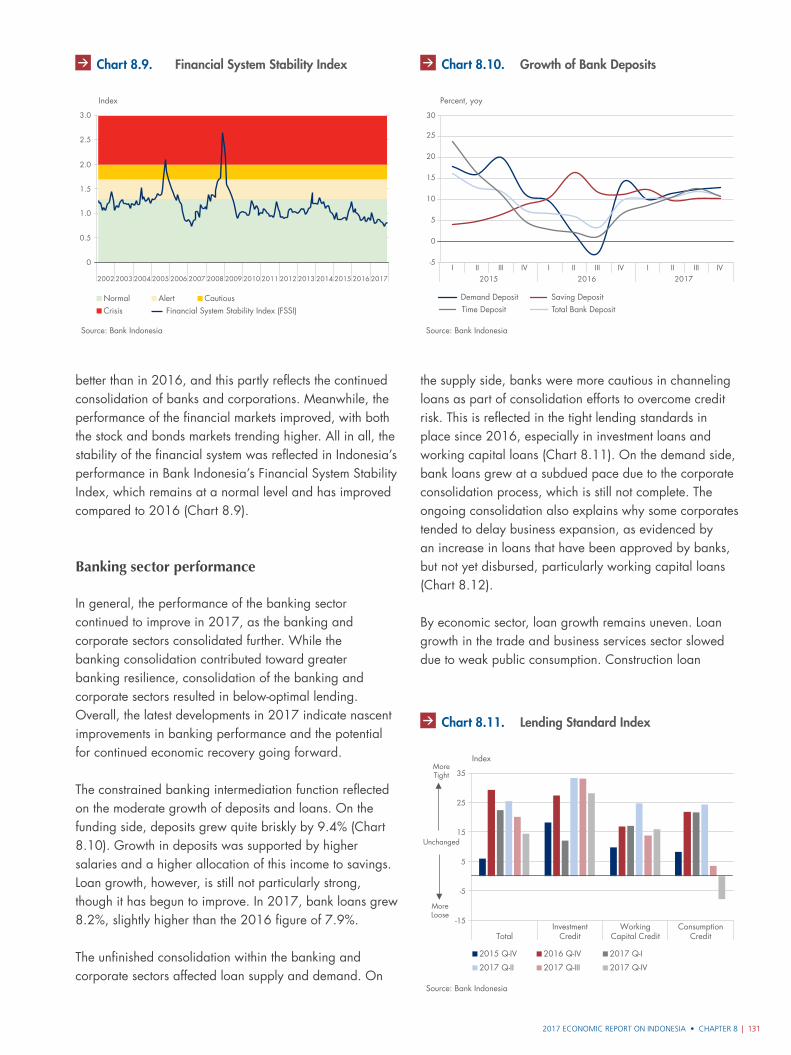
2017 ECONOMIC REPORT ON INDONESIA • CHAPTER 8 | 131
better than in 2016, and this partly reflects the continued consolidation of banks and corporations. Meanwhile, the performance of the financial markets improved, with both the stock and bonds markets trending higher. All in all, the stability of the financial system was reflected in Indonesia’s performance in Bank Indonesia’s Financial System Stability Index, which remains at a normal level and has improved compared to 2016 (Chart 8.9).
Banking sector performance
In general, the performance of the banking sector continued to improve in 2017, as the banking and corporate sectors consolidated further. While the banking consolidation contributed toward greater banking resilience, consolidation of the banking and corporate sectors resulted in below-optimal lending. Overall, the latest developments in 2017 indicate nascent improvements in banking performance and the potential for continued economic recovery going forward.
The constrained banking intermediation function reflected on the moderate growth of deposits and loans. On the funding side, deposits grew quite briskly by 9.4% (Chart 8.10). Growth in deposits was supported by higher salaries and a higher allocation of this income to savings. Loan growth, however, is still not particularly strong, though it has begun to improve. In 2017, bank loans grew 8.2%, slightly higher than the 2016 figure of 7.9%.
The unfinished consolidation within the banking and corporate sectors affected loan supply and demand. On
the supply side, banks were more cautious in channeling loans as part of consolidation efforts to overcome credit risk. This is reflected in the tight lending standards in place since 2016, especially in investment loans and working capital loans (Chart 8.11). On the demand side, bank loans grew at a subdued pace due to the corporate consolidation process, which is still not complete. The ongoing consolidation also explains why some corporates tended to delay business expansion, as evidenced by an increase in loans that have been approved by banks, but not yet disbursed, particularly working capital loans (Chart 8.12).
By economic sector, loan growth remains uneven. Loan growth in the trade and business services sector slowed due to weak public consumption. Construction loan
Grafik 8.9. Indeks Stabilitas Sistem Keuangan
Source: Bank Indonesia
0
0.5
1.0
1.5
2.0
2.5
3.0
2004 2005 2006 2007 2008 2009 2010 2011 2012 2013 2014 2015 2016 20172002 2003
Normal Alert CautiousCrisis Financial System Stability Index (FSSI)
Index
Chart 8.9. Financial System Stability Index
Percent, yoy
I II III IV I II III IV I II III IV2015 2016 2017
Grafik 8.12. Pertumbuhan DPK Per Jenis Simpanan
Source: Bank Indonesia
Demand Deposit Saving DepositTotal Bank Deposit Time Deposit
-5
0
5
10
15
20
25
30
Chart 8.10. Growth of Bank Deposits
Source: Bank Indonesia
Grafik 8.13. Indeks Lending Standard
MoreTight
Unchanged
MoreLoose
-15
-5
5
15
25
35
TotalInvestment
CreditWorking
Capital CreditConsumption
Credit
2017 Q-I
2017 Q-II 2017 Q-III 2017 Q-IV
2015 Q-IV 2016 Q-IV
Index
Chart 8.11. Lending Standard Index
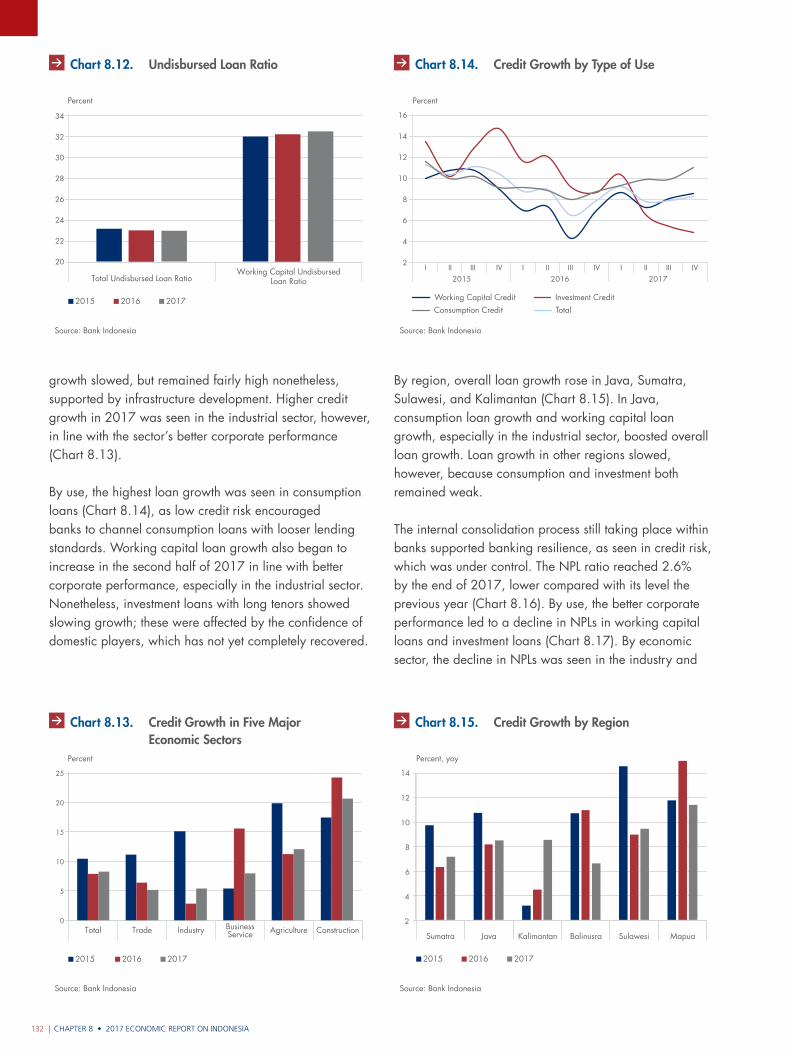
CHAPTER 8 • 2017 ECONOMIC REPORT ON INDONESIA132 |
growth slowed, but remained fairly high nonetheless, supported by infrastructure development. Higher credit growth in 2017 was seen in the industrial sector, however, in line with the sector’s better corporate performance (Chart 8.13).
By use, the highest loan growth was seen in consumption loans (Chart 8.14), as low credit risk encouraged banks to channel consumption loans with looser lending standards. Working capital loan growth also began to increase in the second half of 2017 in line with better corporate performance, especially in the industrial sector. Nonetheless, investment loans with long tenors showed slowing growth; these were affected by the confidence of domestic players, which has not yet completely recovered.
By region, overall loan growth rose in Java, Sumatra, Sulawesi, and Kalimantan (Chart 8.15). In Java, consumption loan growth and working capital loan growth, especially in the industrial sector, boosted overall loan growth. Loan growth in other regions slowed, however, because consumption and investment both remained weak.
The internal consolidation process still taking place within banks supported banking resilience, as seen in credit risk, which was under control. The NPL ratio reached 2.6% by the end of 2017, lower compared with its level the previous year (Chart 8.16). By use, the better corporate performance led to a decline in NPLs in working capital loans and investment loans (Chart 8.17). By economic sector, the decline in NPLs was seen in the industry and
Total Undisbursed Loan RatioWorking Capital Undisbursed
Loan Ratio
Source: Bank Indonesia
Grafik 8.14. Pangsa Undisbursed Loan terhadapUndisbursed Loan dan Kredit
20172015 2016
20
22
24
26
28
30
32
34
Percent
Chart 8.12. Undisbursed Loan Ratio
Grafik 8.15. Pertumbuhan Kredit Lima SektorEkonomi Terbesar
Source: Bank Indonesia
0
5
10
15
20
25
Total Trade Industry BusinessService Agriculture Construction
Percent
20172015 2016
Chart 8.13. Credit Growth in Five Major Economic Sectors
Grafik 8.16. Pertumbuhan Kredit BerdasarkanJenis Penggunaan
Source: Bank Indonesia
Percent
I II III IV I II III IV I II III IV2015 2016 2017
2
4
6
8
10
12
14
16
Working Capital Credit Investment CreditTotalConsumption Credit
Chart 8.14. Credit Growth by Type of Use
Source: Bank Indonesia
Grafik 8.17. Pertumbuhan Kredit Menurut Wilayah
2
4
6
8
10
12
14
Percent, yoy
2015 2016 2017
Sumatra Java Kalimantan Balinusra Sulawesi Mapua
Chart 8.15. Credit Growth by Region
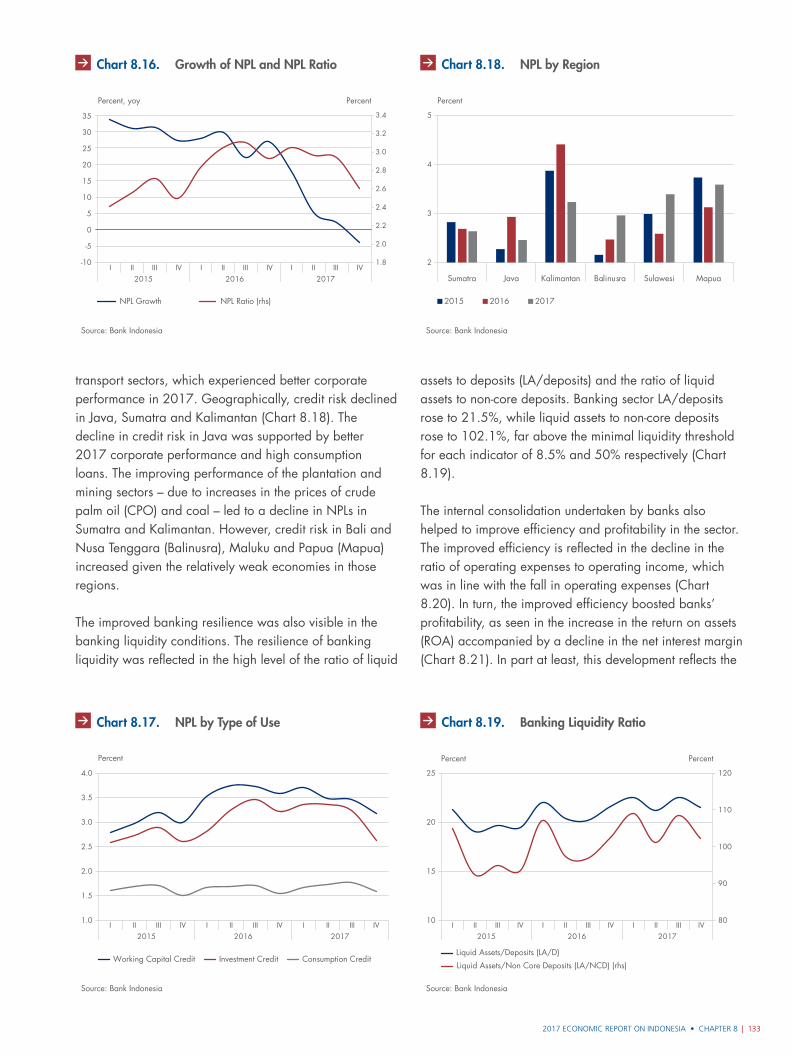
2017 ECONOMIC REPORT ON INDONESIA • CHAPTER 8 | 133
transport sectors, which experienced better corporate performance in 2017. Geographically, credit risk declined in Java, Sumatra and Kalimantan (Chart 8.18). The decline in credit risk in Java was supported by better 2017 corporate performance and high consumption loans. The improving performance of the plantation and mining sectors – due to increases in the prices of crude palm oil (CPO) and coal – led to a decline in NPLs in Sumatra and Kalimantan. However, credit risk in Bali and Nusa Tenggara (Balinusra), Maluku and Papua (Mapua) increased given the relatively weak economies in those regions.
The improved banking resilience was also visible in the banking liquidity conditions. The resilience of banking liquidity was reflected in the high level of the ratio of liquid
assets to deposits (LA/deposits) and the ratio of liquid assets to non-core deposits. Banking sector LA/deposits rose to 21.5%, while liquid assets to non-core deposits rose to 102.1%, far above the minimal liquidity threshold for each indicator of 8.5% and 50% respectively (Chart 8.19).
The internal consolidation undertaken by banks also helped to improve efficiency and profitability in the sector. The improved efficiency is reflected in the decline in the ratio of operating expenses to operating income, which was in line with the fall in operating expenses (Chart 8.20). In turn, the improved efficiency boosted banks’ profitability, as seen in the increase in the return on assets (ROA) accompanied by a decline in the net interest margin (Chart 8.21). In part at least, this development reflects the
Percent, yoy Percent
I II III IV I II III IV I II III IV2015 2016 2017
Source: Bank Indonesia
Grafik 8.18. Pertumbuhan NPL dan Rasio NPL
NPL Growth NPL Ratio (rhs)
-10
0
-5
5
10
15
20
25
30
35
1.8
2.0
2.2
2.4
2.6
2.8
3.0
3.2
3.4
Chart 8.16. Growth of NPL and NPL Ratio
2015 2016 2017I II III IV I II III IV I II III IV
Source: Bank Indonesia
Grafik 8.19. NPL Per Jenis Penggunaan
1.0
1.5
2.0
2.5
3.0
3.5
4.0
Percent
Working Capital Credit Investment Credit Consumption Credit
Chart 8.17. NPL by Type of Use
Sumatra Java Kalimantan Balinusra Sulawesi Mapua
Source: Bank Indonesia
Grafik 8.20. NPL Menurut Wilayah
2015 2016 2017
2
4
3
5
Percent
Chart 8.18. NPL by Region
2015 2016 2017I II III IV I II III IV I II III IV
Source: Bank Indonesia
Grafik 8.21. Ketahanan Likuiditas Perbankan
10
15
25
20
Percent Percent
80
110
100
90
120
Liquid Assets/Deposits (LA/D)
Liquid Assets/Non Core Deposits (LA/NCD) (rhs)
Chart 8.19. Banking Liquidity Ratio
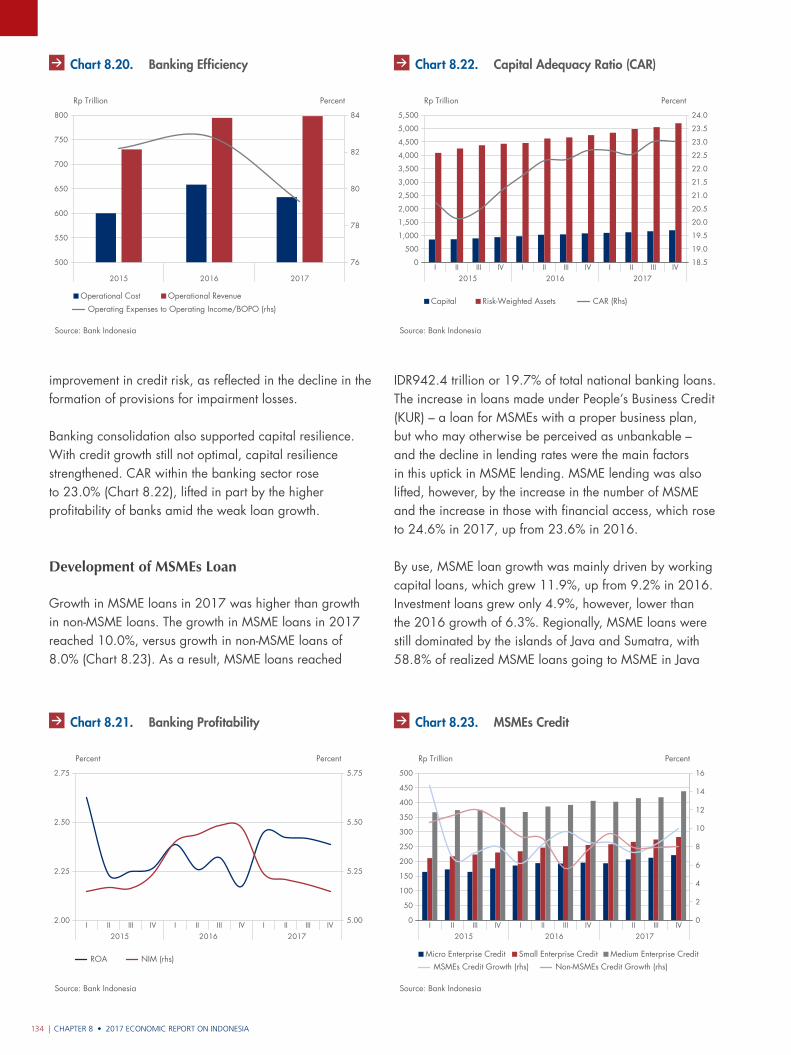
CHAPTER 8 • 2017 ECONOMIC REPORT ON INDONESIA134 |
improvement in credit risk, as reflected in the decline in the formation of provisions for impairment losses.
Banking consolidation also supported capital resilience. With credit growth still not optimal, capital resilience strengthened. CAR within the banking sector rose to 23.0% (Chart 8.22), lifted in part by the higher profitability of banks amid the weak loan growth.
Development of MSMEs Loan
Growth in MSME loans in 2017 was higher than growth in non-MSME loans. The growth in MSME loans in 2017 reached 10.0%, versus growth in non-MSME loans of 8.0% (Chart 8.23). As a result, MSME loans reached
IDR942.4 trillion or 19.7% of total national banking loans. The increase in loans made under People’s Business Credit (KUR) – a loan for MSMEs with a proper business plan, but who may otherwise be perceived as unbankable – and the decline in lending rates were the main factors in this uptick in MSME lending. MSME lending was also lifted, however, by the increase in the number of MSME and the increase in those with financial access, which rose to 24.6% in 2017, up from 23.6% in 2016.
By use, MSME loan growth was mainly driven by working capital loans, which grew 11.9%, up from 9.2% in 2016. Investment loans grew only 4.9%, however, lower than the 2016 growth of 6.3%. Regionally, MSME loans were still dominated by the islands of Java and Sumatra, with 58.8% of realized MSME loans going to MSME in Java
2015 2016 2017
Source: Bank Indonesia
Grafik 8.22. Efisiensi Perbankan
500
550
800
750
700
650
600
Rp Trillion Percent
76
82
80
78
84
Operational Cost Operational Revenue
Operating Expenses to Operating Income/BOPO (rhs)
Chart 8.20. Banking Efficiency
2015 2016 2017I II III IV I II III IV I II III IV
Source: Bank Indonesia
Grafik 8.23. Profitabilitas
2.00
2.25
2.75
2.50
Percent Percent
5.00
5.50
5.25
5.75
ROA NIM (rhs)
Chart 8.21. Banking Profitability
2015 2016 2017I II III IV I II III IV I II III IV
Source: Bank Indonesia
Grafik 8.24. Perkembangan CAR
0
4,000
5,500
5,000
4,500
3,000
3,500
2,000
2,500
1,000
1,500
500
Rp Trillion Percent
18.5
23.0
22.5
22.0
21.5
21.0
20.5
20.0
19.0
19.5
24.0
23.5
Capital Risk-Weighted Assets CAR (Rhs)
Chart 8.22. Capital Adequacy Ratio (CAR)
2015 2016 2017I II III IV I II III IV I II III IV
Source: Bank Indonesia
Grafik 8.25. Perkembangan Kredit UMKM
0
50
500
250
200
350
300
450
400
150
100
Rp Trillion Percent
0
6
8
4
2
16
14
12
10
Micro Enterprise Credit Small Enterprise Credit Medium Enterprise CreditMSMEs Credit Growth (rhs) Non-MSMEs Credit Growth (rhs)
Chart 8.23. MSMEs Credit
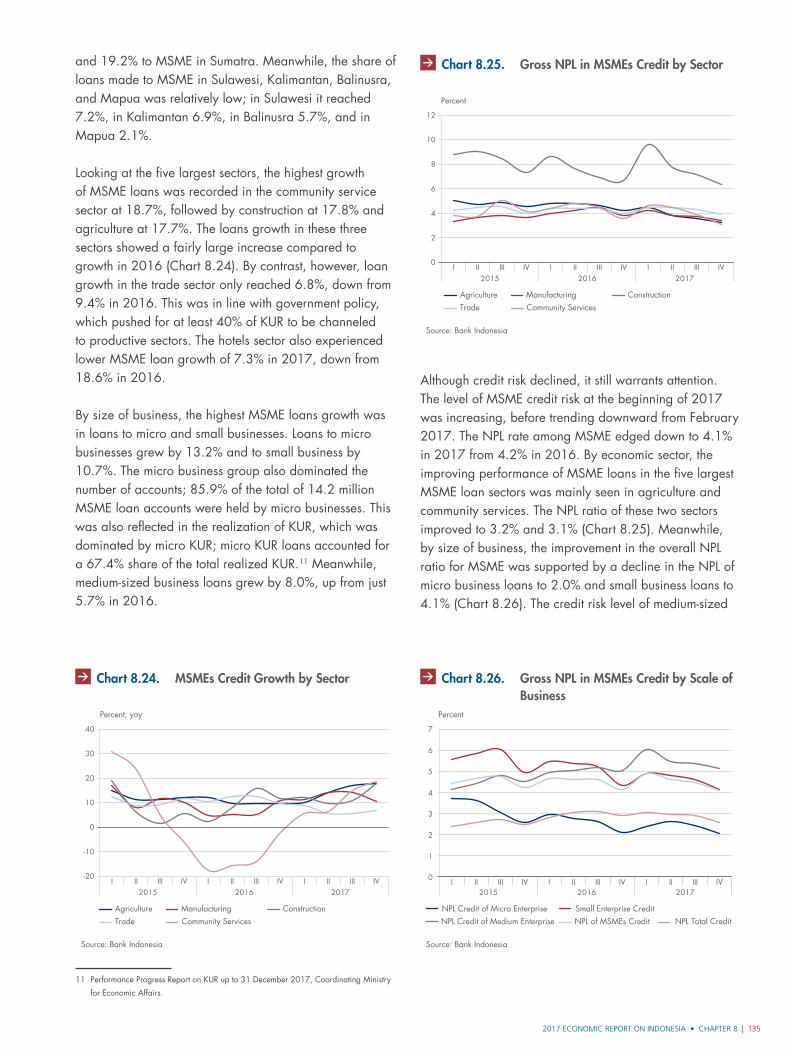
2017 ECONOMIC REPORT ON INDONESIA • CHAPTER 8 | 135
Although credit risk declined, it still warrants attention. The level of MSME credit risk at the beginning of 2017 was increasing, before trending downward from February 2017. The NPL rate among MSME edged down to 4.1% in 2017 from 4.2% in 2016. By economic sector, the improving performance of MSME loans in the five largest MSME loan sectors was mainly seen in agriculture and community services. The NPL ratio of these two sectors improved to 3.2% and 3.1% (Chart 8.25). Meanwhile, by size of business, the improvement in the overall NPL ratio for MSME was supported by a decline in the NPL of micro business loans to 2.0% and small business loans to 4.1% (Chart 8.26). The credit risk level of medium-sized
and 19.2% to MSME in Sumatra. Meanwhile, the share of loans made to MSME in Sulawesi, Kalimantan, Balinusra, and Mapua was relatively low; in Sulawesi it reached 7.2%, in Kalimantan 6.9%, in Balinusra 5.7%, and in Mapua 2.1%.
Looking at the five largest sectors, the highest growth of MSME loans was recorded in the community service sector at 18.7%, followed by construction at 17.8% and agriculture at 17.7%. The loans growth in these three sectors showed a fairly large increase compared to growth in 2016 (Chart 8.24). By contrast, however, loan growth in the trade sector only reached 6.8%, down from 9.4% in 2016. This was in line with government policy, which pushed for at least 40% of KUR to be channeled to productive sectors. The hotels sector also experienced lower MSME loan growth of 7.3% in 2017, down from 18.6% in 2016.
By size of business, the highest MSME loans growth was in loans to micro and small businesses. Loans to micro businesses grew by 13.2% and to small business by 10.7%. The micro business group also dominated the number of accounts; 85.9% of the total of 14.2 million MSME loan accounts were held by micro businesses. This was also reflected in the realization of KUR, which was dominated by micro KUR; micro KUR loans accounted for a 67.4% share of the total realized KUR.11 Meanwhile, medium-sized business loans grew by 8.0%, up from just 5.7% in 2016.
11 Performance Progress Report on KUR up to 31 December 2017, Coordinating Ministry
for Economic Affairs.
Source: Bank Indonesia
Grafik 8.26. Pertumbuhan Kredit UMKM Sektoral
Agriculture Manufacturing ConstructionTrade Community Services
-20
-10
0
10
20
30
40
Percent, yoy
2015 2016 2017I II III IV I II III IV I II III IV
Chart 8.24. MSMEs Credit Growth by Sector
Source: Bank Indonesia
Grafik 8.27. NPL Gross Kredit UMKM Berdasarkan Sek
0
2
4
6
8
10
12
Percent
2015 2016 2017I II III IV I II III IV I II III IV
Agriculture Manufacturing ConstructionTrade Community Services
Chart 8.25. Gross NPL in MSMEs Credit by Sector
Source: Bank Indonesia
Grafik 8.28. NPL Gross Kredit UMKMBerdasarkan Skala Usaha
0
1
2
3
4
7
6
5
Percent
I II III IV2015 2016 2017
I II III IV I II III IV
Small Enterprise CreditNPL Credit of Micro EnterpriseNPL of MSMEs Credit NPL Total Credit NPL Credit of Medium Enterprise
Chart 8.26. Gross NPL in MSMEs Credit by Scale of Business
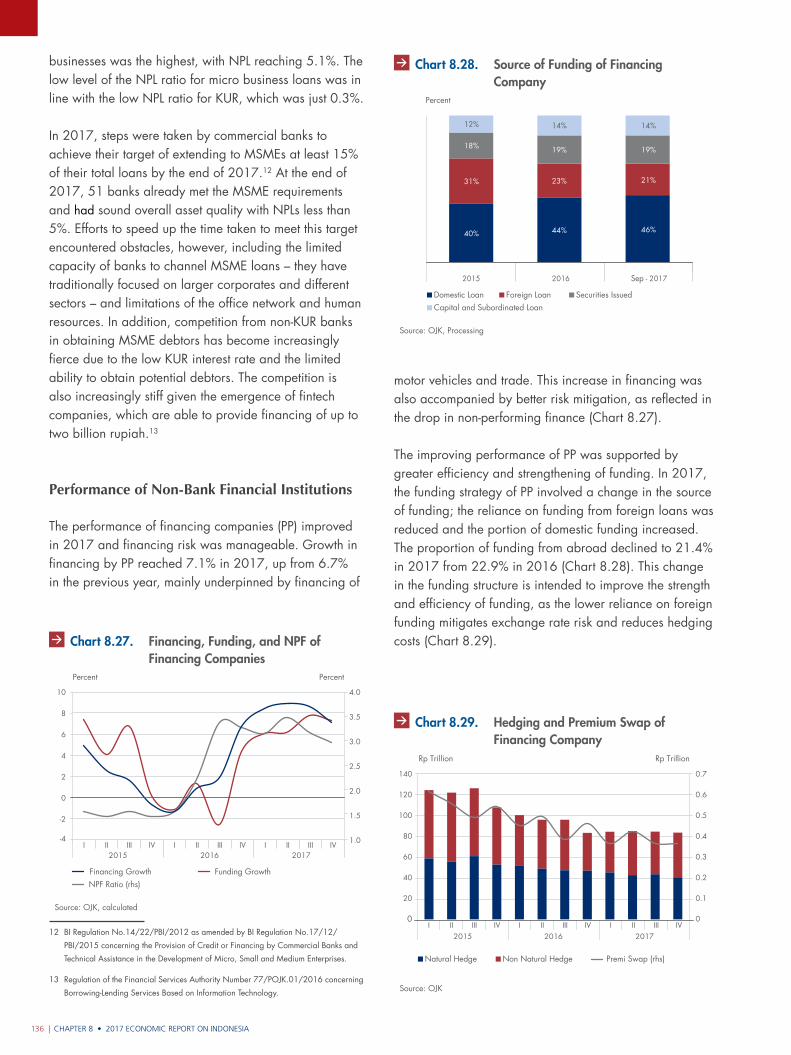
CHAPTER 8 • 2017 ECONOMIC REPORT ON INDONESIA136 |
businesses was the highest, with NPL reaching 5.1%. The low level of the NPL ratio for micro business loans was in line with the low NPL ratio for KUR, which was just 0.3%.
In 2017, steps were taken by commercial banks to achieve their target of extending to MSMEs at least 15% of their total loans by the end of 2017.12 At the end of 2017, 51 banks already met the MSME requirements and had sound overall asset quality with NPLs less than 5%. Efforts to speed up the time taken to meet this target encountered obstacles, however, including the limited capacity of banks to channel MSME loans – they have traditionally focused on larger corporates and different sectors – and limitations of the office network and human resources. In addition, competition from non-KUR banks in obtaining MSME debtors has become increasingly fierce due to the low KUR interest rate and the limited ability to obtain potential debtors. The competition is also increasingly stiff given the emergence of fintech companies, which are able to provide financing of up to two billion rupiah.13
Performance of Non-Bank Financial Institutions
The performance of financing companies (PP) improved in 2017 and financing risk was manageable. Growth in financing by PP reached 7.1% in 2017, up from 6.7% in the previous year, mainly underpinned by financing of
12 BI Regulation No.14/22/PBI/2012 as amended by BI Regulation No.17/12/
PBI/2015 concerning the Provision of Credit or Financing by Commercial Banks and
Technical Assistance in the Development of Micro, Small and Medium Enterprises.
13 Regulation of the Financial Services Authority Number 77/POJK.01/2016 concerning
Borrowing-Lending Services Based on Information Technology.
motor vehicles and trade. This increase in financing was also accompanied by better risk mitigation, as reflected in the drop in non-performing finance (Chart 8.27).
The improving performance of PP was supported by greater efficiency and strengthening of funding. In 2017, the funding strategy of PP involved a change in the source of funding; the reliance on funding from foreign loans was reduced and the portion of domestic funding increased. The proportion of funding from abroad declined to 21.4% in 2017 from 22.9% in 2016 (Chart 8.28). This change in the funding structure is intended to improve the strength and efficiency of funding, as the lower reliance on foreign funding mitigates exchange rate risk and reduces hedging costs (Chart 8.29).
Source: OJK, calculated
Grafik 8.29. Pembiayaan, Pendanaan dan NPF PP
-2
-4
0
2
4
10
8
6
Percent Percent
I II III IV2015 2016 2017
I II III IV I II III IV
Funding GrowthFinancing GrowthNPF Ratio (rhs)
1.0
1.5
2.0
2.5
3.0
3.5
4.0
Chart 8.27. Financing, Funding, and NPF of Financing Companies
Source: OJK, Processing
Grafik 8.30. Sumber Pendanaan PP
Percent
2015 2016 Sep - 2017
Capital and Subordinated LoanSecurities IssuedDomestic Loan Foreign Loan
40% 44% 46%
31%
18%
12%
19% 19%
14% 14%
21%23%
Chart 8.28. Source of Funding of Financing Company
Grafik 8.31. Hedging dan Premi Swap PP
0.1
0
0.2
0.3
0.4
0.5
0.6
0.7
0
20
40
60
80
100
120
140
I II III IV2015
I II III IV2016
I II III IV2017
Natural Hedge Non Natural Hedge Premi Swap (rhs)
Rp Trillion Rp Trillion
Source: OJK
Chart 8.29. Hedging and Premium Swap of Financing Company
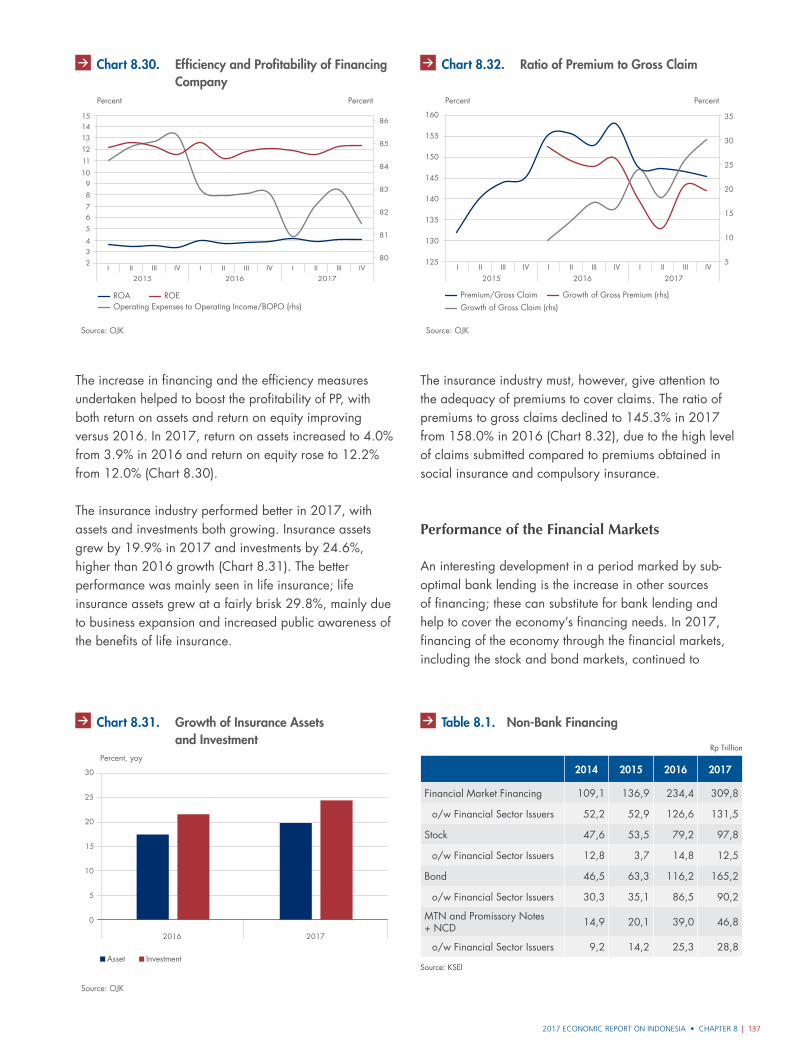
2017 ECONOMIC REPORT ON INDONESIA • CHAPTER 8 | 137
The increase in financing and the efficiency measures undertaken helped to boost the profitability of PP, with both return on assets and return on equity improving versus 2016. In 2017, return on assets increased to 4.0% from 3.9% in 2016 and return on equity rose to 12.2% from 12.0% (Chart 8.30).
The insurance industry performed better in 2017, with assets and investments both growing. Insurance assets grew by 19.9% in 2017 and investments by 24.6%, higher than 2016 growth (Chart 8.31). The better performance was mainly seen in life insurance; life insurance assets grew at a fairly brisk 29.8%, mainly due to business expansion and increased public awareness of the benefits of life insurance.
The insurance industry must, however, give attention to the adequacy of premiums to cover claims. The ratio of premiums to gross claims declined to 145.3% in 2017 from 158.0% in 2016 (Chart 8.32), due to the high level of claims submitted compared to premiums obtained in social insurance and compulsory insurance.
Performance of the Financial Markets
An interesting development in a period marked by sub-optimal bank lending is the increase in other sources of financing; these can substitute for bank lending and help to cover the economy’s financing needs. In 2017, financing of the economy through the financial markets, including the stock and bond markets, continued to
Grafik 8.32. Efisiensi dan Profitabilitas PP
ROA ROEOperating Expenses to Operating Income/BOPO (rhs)
Percent Percent
Source: OJK
80
81
82
83
84
85
86
2
43
5
76
8
910
11
12
13
1415
I II III IV2015
I II III IV2016
I II III IV2017
Chart 8.30. Efficiency and Profitability of Financing Company
Grafik 8.33. Pertumbuhan Aset dan InvestasiAsuransi
0
5
10
15
20
30
25
Asset Investment
Percent, yoy
Source: OJK
2016 2017
Chart 8.31. Growth of Insurance Assets and Investment
Grafik 8.34. Rasio Premi terhadap Klaim Bruto
Source: OJK
5
10
15
20
25
30
35
125
130
135
140
145
150
155
160
I II III IV2015
I II III IV2016
I II III IV2017
Percent Percent
Premium/Gross Claim Growth of Gross Premium (rhs)Growth of Gross Claim (rhs)
Chart 8.32. Ratio of Premium to Gross Claim
Table 8.1. Non-Bank Financing
Rp Trillion
2014 2015 2016 2017
Financial Market Financing 109,1 136,9 234,4 309,8
o/w Financial Sector Issuers 52,2 52,9 126,6 131,5
Stock 47,6 53,5 79,2 97,8
o/w Financial Sector Issuers 12,8 3,7 14,8 12,5
Bond 46,5 63,3 116,2 165,2
o/w Financial Sector Issuers 30,3 35,1 86,5 90,2
MTN and Promissory Notes + NCD 14,9 20,1 39,0 46,8
o/w Financial Sector Issuers 9,2 14,2 25,3 28,8
Source: KSEI
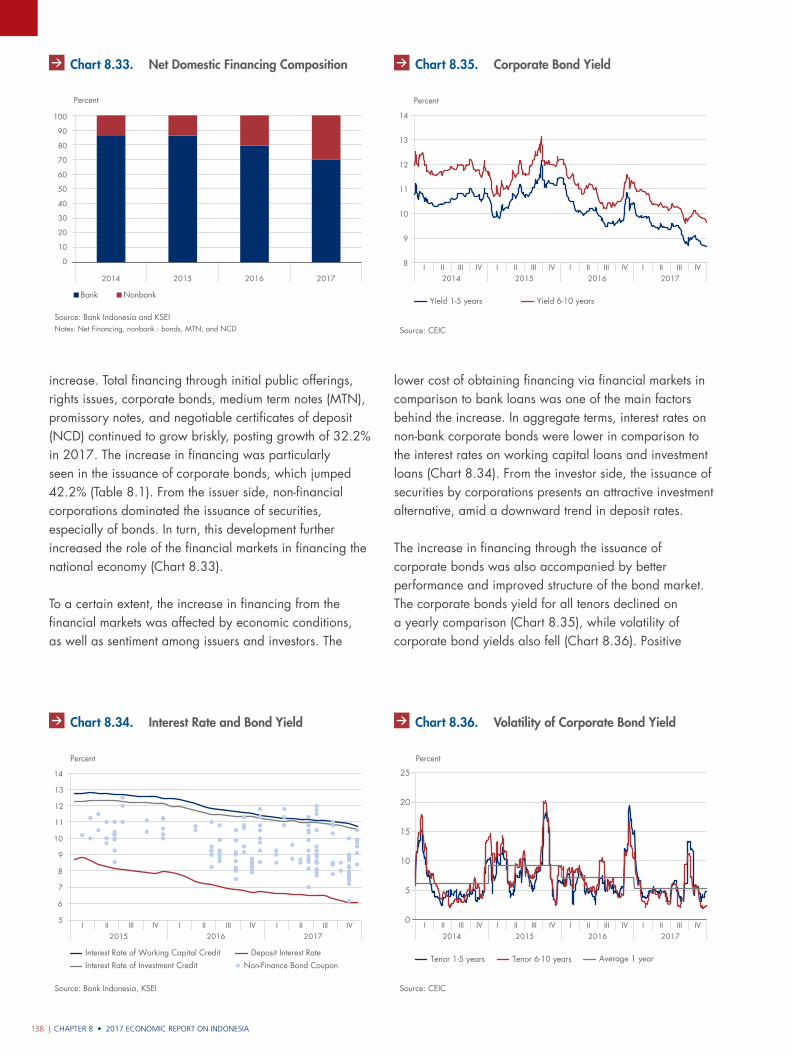
CHAPTER 8 • 2017 ECONOMIC REPORT ON INDONESIA138 |
lower cost of obtaining financing via financial markets in comparison to bank loans was one of the main factors behind the increase. In aggregate terms, interest rates on non-bank corporate bonds were lower in comparison to the interest rates on working capital loans and investment loans (Chart 8.34). From the investor side, the issuance of securities by corporations presents an attractive investment alternative, amid a downward trend in deposit rates.
The increase in financing through the issuance of corporate bonds was also accompanied by better performance and improved structure of the bond market. The corporate bonds yield for all tenors declined on a yearly comparison (Chart 8.35), while volatility of corporate bond yields also fell (Chart 8.36). Positive
increase. Total financing through initial public offerings, rights issues, corporate bonds, medium term notes (MTN), promissory notes, and negotiable certificates of deposit (NCD) continued to grow briskly, posting growth of 32.2% in 2017. The increase in financing was particularly seen in the issuance of corporate bonds, which jumped 42.2% (Table 8.1). From the issuer side, non-financial corporations dominated the issuance of securities, especially of bonds. In turn, this development further increased the role of the financial markets in financing the national economy (Chart 8.33).
To a certain extent, the increase in financing from the financial markets was affected by economic conditions, as well as sentiment among issuers and investors. The
0
10
20
30
40
50
60
70
80
90
100
2014 2015 2016 2017
Grafik 8.35. Pangsa Pembiayaan Neto Dalam Negeri
Bank Nonbank
Percent
Notes: Net Financing, nonbank : bonds, MTN, and NCDSource: Bank Indonesia and KSEI
Chart 8.33. Net Domestic Financing Composition
Grafik 8.36. Suku Bunga Bank dan ObligasiKorporasi
Source: Bank Indonesia, KSEI
5
6
7
8
9
10
11
12
13
14
I II III IV2015 2016 2017
I II III IV I II III IV
Percent
Interest Rate of Working Capital Credit Deposit Interest RateInterest Rate of Investment Credit Non-Finance Bond Coupon
Chart 8.34. Interest Rate and Bond Yield
Grafik 8.37. Yield Obligasi Korporasi
8
9
10
11
12
13
14
I II III IV2014 2015 2016 2017
I II III IV I II III IV I II III IV
Yield 1-5 years Yield 6-10 years
Source: CEIC
Percent
Chart 8.35. Corporate Bond Yield
Grafik 8.38. Volatilitas Yield Obligasi Korporasi
5
0
10
15
20
25
I II III IV2014 2015 2016 2017
I II III IV I II III IV I II III IV
Tenor 1-5 years Tenor 6-10 years Average 1 year
Percent
Source: CEIC
Chart 8.36. Volatility of Corporate Bond Yield
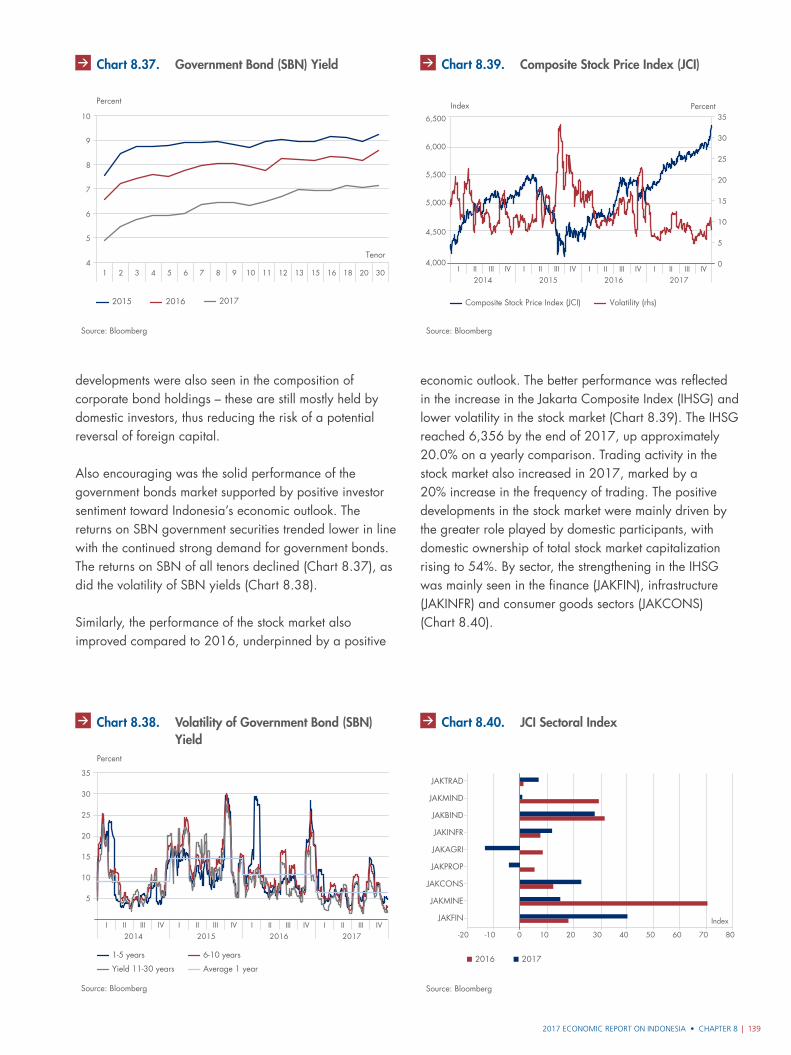
2017 ECONOMIC REPORT ON INDONESIA • CHAPTER 8 | 139
developments were also seen in the composition of corporate bond holdings – these are still mostly held by domestic investors, thus reducing the risk of a potential reversal of foreign capital.
Also encouraging was the solid performance of the government bonds market supported by positive investor sentiment toward Indonesia’s economic outlook. The returns on SBN government securities trended lower in line with the continued strong demand for government bonds. The returns on SBN of all tenors declined (Chart 8.37), as did the volatility of SBN yields (Chart 8.38).
Similarly, the performance of the stock market also improved compared to 2016, underpinned by a positive
economic outlook. The better performance was reflected in the increase in the Jakarta Composite Index (IHSG) and lower volatility in the stock market (Chart 8.39). The IHSG reached 6,356 by the end of 2017, up approximately 20.0% on a yearly comparison. Trading activity in the stock market also increased in 2017, marked by a 20% increase in the frequency of trading. The positive developments in the stock market were mainly driven by the greater role played by domestic participants, with domestic ownership of total stock market capitalization rising to 54%. By sector, the strengthening in the IHSG was mainly seen in the finance (JAKFIN), infrastructure (JAKINFR) and consumer goods sectors (JAKCONS) (Chart 8.40).
Grafik 8.39. Yield SBN
4
5
6
7
8
9
10
Tenor
2015 2016 2017
Source: Bloomberg
1 2 3 4 5 6 7 8 9 10 11 12 13 15 16 18 20 30
Percent
Chart 8.37. Government Bond (SBN) Yield
Grafik 8.40. Volatilitas Yield SBN
5
10
15
20
25
30
35
I II III IV2014 2015 2016 2017
I II III IV I II III IV I II III IV
1-5 years 6-10 years
Yield 11-30 years Average 1 year
Source: Bloomberg
Percent
Chart 8.38. Volatility of Government Bond (SBN) Yield
Grafik 8.41. Perkembangan dan Volatilitas IHSG
Source: Bloomberg
Index Percent
I II III IV2014 2015 2016 2017
I II III IV I II III IV I II III IV
Composite Stock Price Index (JCI) Volatility (rhs)
0
5
10
15
20
25
30
35
4,000
4,500
5,000
5,500
6,000
6,500
Chart 8.39. Composite Stock Price Index (JCI)
Source: Bloomberg
Grafik 8.42. Perkembangan Indeks Sektoral
20172016
-20 -10 0 10 20 30 40 50 60 70 80
JAKTRAD
JAKINFR
JAKBIND
JAKMINE
JAKFIN
JAKAGRI
JAKMIND
JAKCONS
JAKPROP
Index
Chart 8.40. JCI Sectoral Index
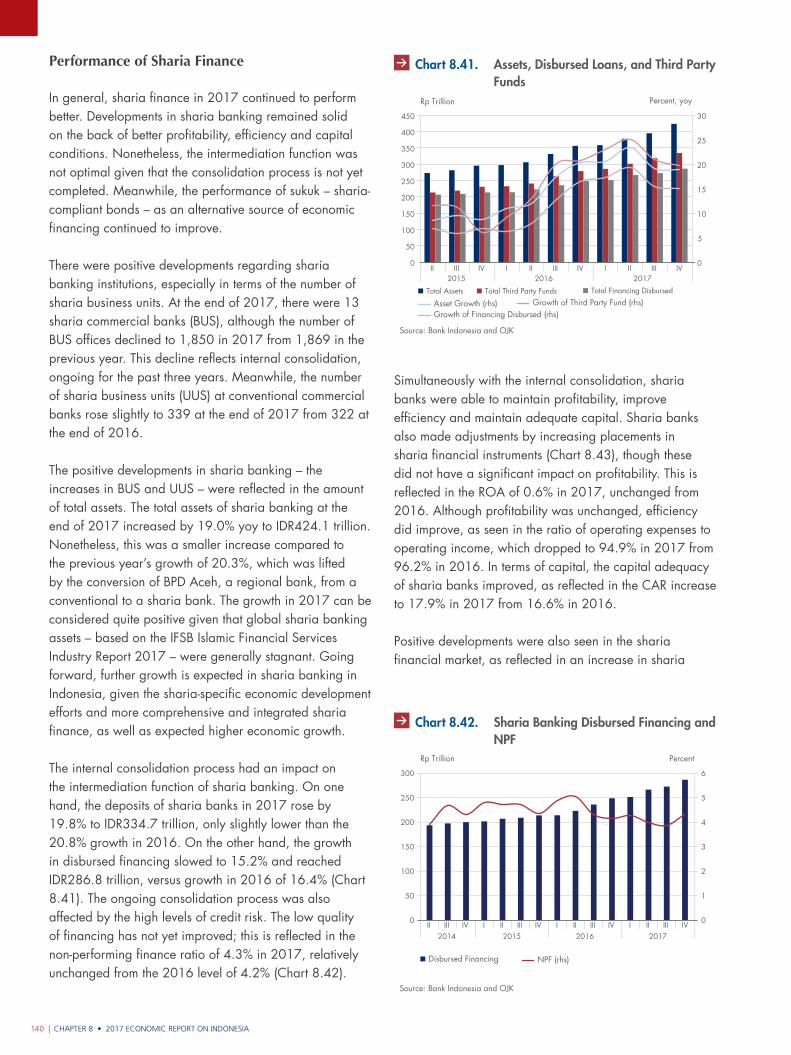
CHAPTER 8 • 2017 ECONOMIC REPORT ON INDONESIA140 |
Performance of Sharia Finance
In general, sharia finance in 2017 continued to perform better. Developments in sharia banking remained solid on the back of better profitability, efficiency and capital conditions. Nonetheless, the intermediation function was not optimal given that the consolidation process is not yet completed. Meanwhile, the performance of sukuk – sharia-compliant bonds – as an alternative source of economic financing continued to improve.
There were positive developments regarding sharia banking institutions, especially in terms of the number of sharia business units. At the end of 2017, there were 13 sharia commercial banks (BUS), although the number of BUS offices declined to 1,850 in 2017 from 1,869 in the previous year. This decline reflects internal consolidation, ongoing for the past three years. Meanwhile, the number of sharia business units (UUS) at conventional commercial banks rose slightly to 339 at the end of 2017 from 322 at the end of 2016.
The positive developments in sharia banking – the increases in BUS and UUS – were reflected in the amount of total assets. The total assets of sharia banking at the end of 2017 increased by 19.0% yoy to IDR424.1 trillion. Nonetheless, this was a smaller increase compared to the previous year’s growth of 20.3%, which was lifted by the conversion of BPD Aceh, a regional bank, from a conventional to a sharia bank. The growth in 2017 can be considered quite positive given that global sharia banking assets – based on the IFSB Islamic Financial Services Industry Report 2017 – were generally stagnant. Going forward, further growth is expected in sharia banking in Indonesia, given the sharia-specific economic development efforts and more comprehensive and integrated sharia finance, as well as expected higher economic growth.
The internal consolidation process had an impact on the intermediation function of sharia banking. On one hand, the deposits of sharia banks in 2017 rose by 19.8% to IDR334.7 trillion, only slightly lower than the 20.8% growth in 2016. On the other hand, the growth in disbursed financing slowed to 15.2% and reached IDR286.8 trillion, versus growth in 2016 of 16.4% (Chart 8.41). The ongoing consolidation process was also affected by the high levels of credit risk. The low quality of financing has not yet improved; this is reflected in the non-performing finance ratio of 4.3% in 2017, relatively unchanged from the 2016 level of 4.2% (Chart 8.42).
Simultaneously with the internal consolidation, sharia banks were able to maintain profitability, improve efficiency and maintain adequate capital. Sharia banks also made adjustments by increasing placements in sharia financial instruments (Chart 8.43), though these did not have a significant impact on profitability. This is reflected in the ROA of 0.6% in 2017, unchanged from 2016. Although profitability was unchanged, efficiency did improve, as seen in the ratio of operating expenses to operating income, which dropped to 94.9% in 2017 from 96.2% in 2016. In terms of capital, the capital adequacy of sharia banks improved, as reflected in the CAR increase to 17.9% in 2017 from 16.6% in 2016.
Positive developments were also seen in the sharia financial market, as reflected in an increase in sharia
Source: Bank Indonesia and OJK
Grafik 8.43. Perkembangan Aset, Pembiayaan YangDisalurkan, Dana Pihak Ketiga
Total Assets Total Third Party Funds Total Financing Disbursed
Percent, yoyRp Trillion
Growth of Third Party Fund (rhs)Asset Growth (rhs)Growth of Financing Disbursed (rhs)
0
5
10
15
20
25
30
0
50
100
150
200
250
300
350
400
450
II III IV I II III IV I II III IV2015 2016 2017
Chart 8.41. Assets, Disbursed Loans, and Third Party Funds
Grafik 8.44. Perkembangan PYD dan NPF PerbankanSyariah
Source: Bank Indonesia and OJK
Disbursed Financing NPF (rhs)
PercentRp Trillion
0
1
2
3
4
5
6
0
50
100
150
200
250
300
II III IV I II III IV I II III IV I II III IV2014 2015 2016 2017
Chart 8.42. Sharia Banking Disbursed Financing and NPF
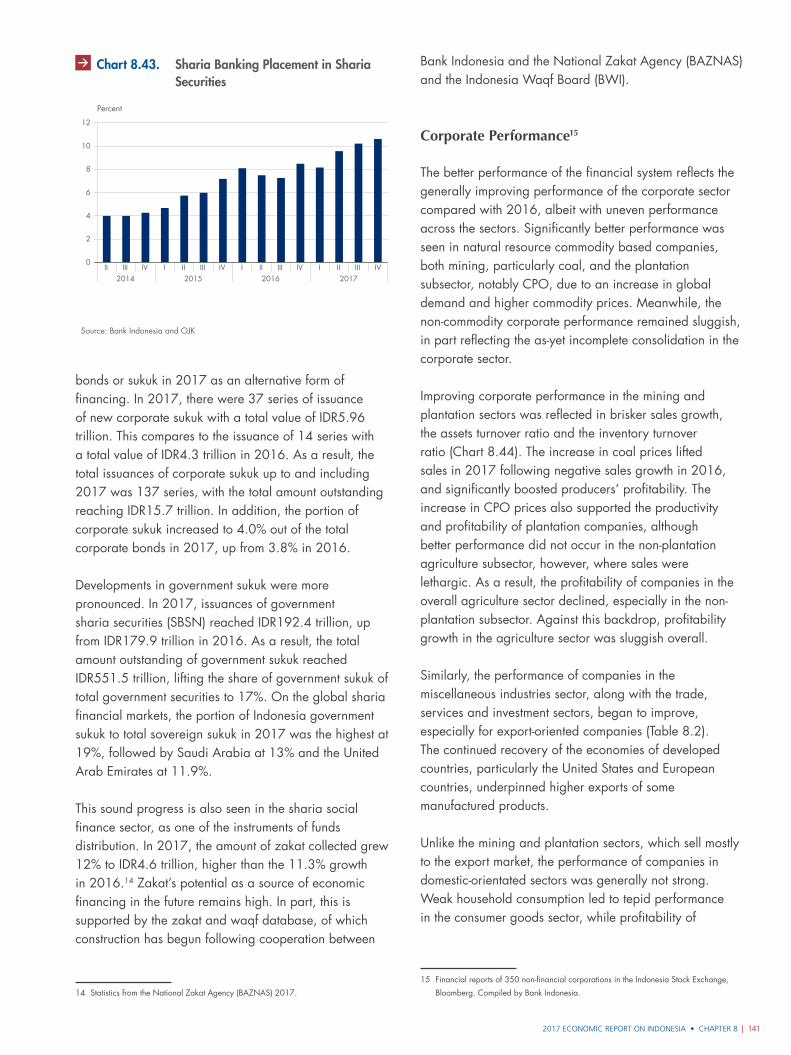
2017 ECONOMIC REPORT ON INDONESIA • CHAPTER 8 | 141
bonds or sukuk in 2017 as an alternative form of financing. In 2017, there were 37 series of issuance of new corporate sukuk with a total value of IDR5.96 trillion. This compares to the issuance of 14 series with a total value of IDR4.3 trillion in 2016. As a result, the total issuances of corporate sukuk up to and including 2017 was 137 series, with the total amount outstanding reaching IDR15.7 trillion. In addition, the portion of corporate sukuk increased to 4.0% out of the total corporate bonds in 2017, up from 3.8% in 2016.
Developments in government sukuk were more pronounced. In 2017, issuances of government sharia securities (SBSN) reached IDR192.4 trillion, up from IDR179.9 trillion in 2016. As a result, the total amount outstanding of government sukuk reached IDR551.5 trillion, lifting the share of government sukuk of total government securities to 17%. On the global sharia financial markets, the portion of Indonesia government sukuk to total sovereign sukuk in 2017 was the highest at 19%, followed by Saudi Arabia at 13% and the United Arab Emirates at 11.9%.
This sound progress is also seen in the sharia social finance sector, as one of the instruments of funds distribution. In 2017, the amount of zakat collected grew 12% to IDR4.6 trillion, higher than the 11.3% growth in 2016.14 Zakat’s potential as a source of economic financing in the future remains high. In part, this is supported by the zakat and waqf database, of which construction has begun following cooperation between
14 Statistics from the National Zakat Agency (BAZNAS) 2017.
Bank Indonesia and the National Zakat Agency (BAZNAS) and the Indonesia Waqf Board (BWI).
Corporate Performance15
The better performance of the financial system reflects the generally improving performance of the corporate sector compared with 2016, albeit with uneven performance across the sectors. Significantly better performance was seen in natural resource commodity based companies, both mining, particularly coal, and the plantation subsector, notably CPO, due to an increase in global demand and higher commodity prices. Meanwhile, the non-commodity corporate performance remained sluggish, in part reflecting the as-yet incomplete consolidation in the corporate sector.
Improving corporate performance in the mining and plantation sectors was reflected in brisker sales growth, the assets turnover ratio and the inventory turnover ratio (Chart 8.44). The increase in coal prices lifted sales in 2017 following negative sales growth in 2016, and significantly boosted producers’ profitability. The increase in CPO prices also supported the productivity and profitability of plantation companies, although better performance did not occur in the non-plantation agriculture subsector, however, where sales were lethargic. As a result, the profitability of companies in the overall agriculture sector declined, especially in the non-plantation subsector. Against this backdrop, profitability growth in the agriculture sector was sluggish overall.
Similarly, the performance of companies in the miscellaneous industries sector, along with the trade, services and investment sectors, began to improve, especially for export-oriented companies (Table 8.2). The continued recovery of the economies of developed countries, particularly the United States and European countries, underpinned higher exports of some manufactured products.
Unlike the mining and plantation sectors, which sell mostly to the export market, the performance of companies in domestic-orientated sectors was generally not strong. Weak household consumption led to tepid performance in the consumer goods sector, while profitability of
15 Financial reports of 350 non-financial corporations in the Indonesia Stock Exchange,
Bloomberg. Compiled by Bank Indonesia.
Grafik 8.45. Perkembangan Paksa Penempatan padaSSB
Source: Bank Indonesia and OJK
Percent
0
2
4
6
8
10
12
II III IV I II III IV I II III IV I II III IV2014 2015 2016 2017
Chart 8.43. Sharia Banking Placement in Sharia Securities
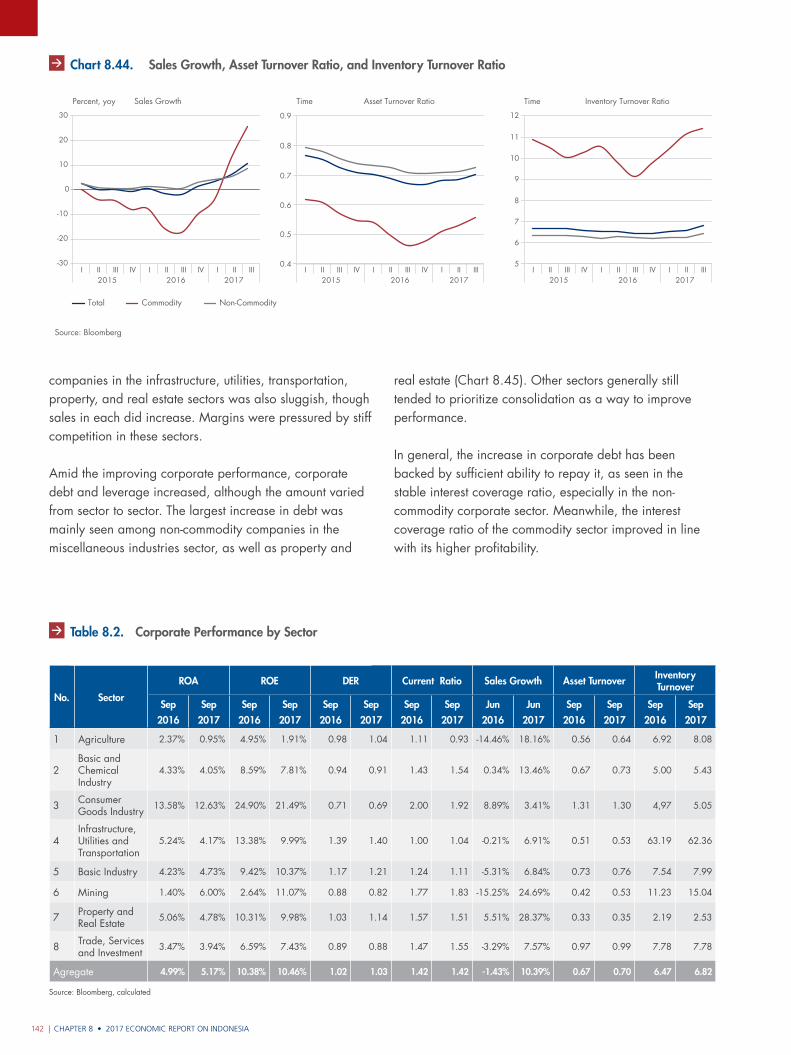
CHAPTER 8 • 2017 ECONOMIC REPORT ON INDONESIA142 |
companies in the infrastructure, utilities, transportation, property, and real estate sectors was also sluggish, though sales in each did increase. Margins were pressured by stiff competition in these sectors.
Amid the improving corporate performance, corporate debt and leverage increased, although the amount varied from sector to sector. The largest increase in debt was mainly seen among non-commodity companies in the miscellaneous industries sector, as well as property and
real estate (Chart 8.45). Other sectors generally still tended to prioritize consolidation as a way to improve performance.
In general, the increase in corporate debt has been backed by sufficient ability to repay it, as seen in the stable interest coverage ratio, especially in the non-commodity corporate sector. Meanwhile, the interest coverage ratio of the commodity sector improved in line with its higher profitability.
Source: Bloomberg
Grafik 8.10. Pertumbuhan Penjualan, Rasio Asset dan Inventory Turnover
Total Commodity Non-Commodity
Percent, yoy
I II III IV2015 2016 2017
I II III IV I II III0.4
0.5
0.6
0.7
0.8
0.9
Time
I II III IV2015 2016 2017
I II III IV I II III5
6
7
8
9
10
11
12
Time
I II III IV2015 2016 2017
I II III IV I II III
Sales Growth Asset Turnover Ratio Inventory Turnover Ratio
-30
-20
-10
0
10
20
30
Chart 8.44. Sales Growth, Asset Turnover Ratio, and Inventory Turnover Ratio
No. Sector
ROA ROE DER Current Ratio Sales Growth Asset Turnover Inventory Turnover
Sep2016
Sep2017
Sep2016
Sep2017
Sep2016
Sep2017
Sep2016
Sep2017
Jun2016
Jun2017
Sep2016
Sep2017
Sep2016
Sep2017
1 Agriculture 2.37% 0.95% 4.95% 1.91% 0.98 1.04 1.11 0.93 -14.46% 18.16% 0.56 0.64 6.92 8.08
2Basic and Chemical Industry
4.33% 4.05% 8.59% 7.81% 0.94 0.91 1.43 1.54 0.34% 13.46% 0.67 0.73 5.00 5.43
3 Consumer Goods Industry 13.58% 12.63% 24.90% 21.49% 0.71 0.69 2.00 1.92 8.89% 3.41% 1.31 1.30 4,97 5.05
4Infrastructure, Utilities and Transportation
5.24% 4.17% 13.38% 9.99% 1.39 1.40 1.00 1.04 -0.21% 6.91% 0.51 0.53 63.19 62.36
5 Basic Industry 4.23% 4.73% 9.42% 10.37% 1.17 1.21 1.24 1.11 -5.31% 6.84% 0.73 0.76 7.54 7.99
6 Mining 1.40% 6.00% 2.64% 11.07% 0.88 0.82 1.77 1.83 -15.25% 24.69% 0.42 0.53 11.23 15.04
7 Property and Real Estate 5.06% 4.78% 10.31% 9.98% 1.03 1.14 1.57 1.51 5.51% 28.37% 0.33 0.35 2.19 2.53
8 Trade, Services and Investment 3.47% 3.94% 6.59% 7.43% 0.89 0.88 1.47 1.55 -3.29% 7.57% 0.97 0.99 7.78 7.78
Agregate 4.99% 5.17% 10.38% 10.46% 1.02 1.03 1.42 1.42 -1.43% 10.39% 0.67 0.70 6.47 6.82
Source: Bloomberg, calculated
Table 8.2. Corporate Performance by Sector
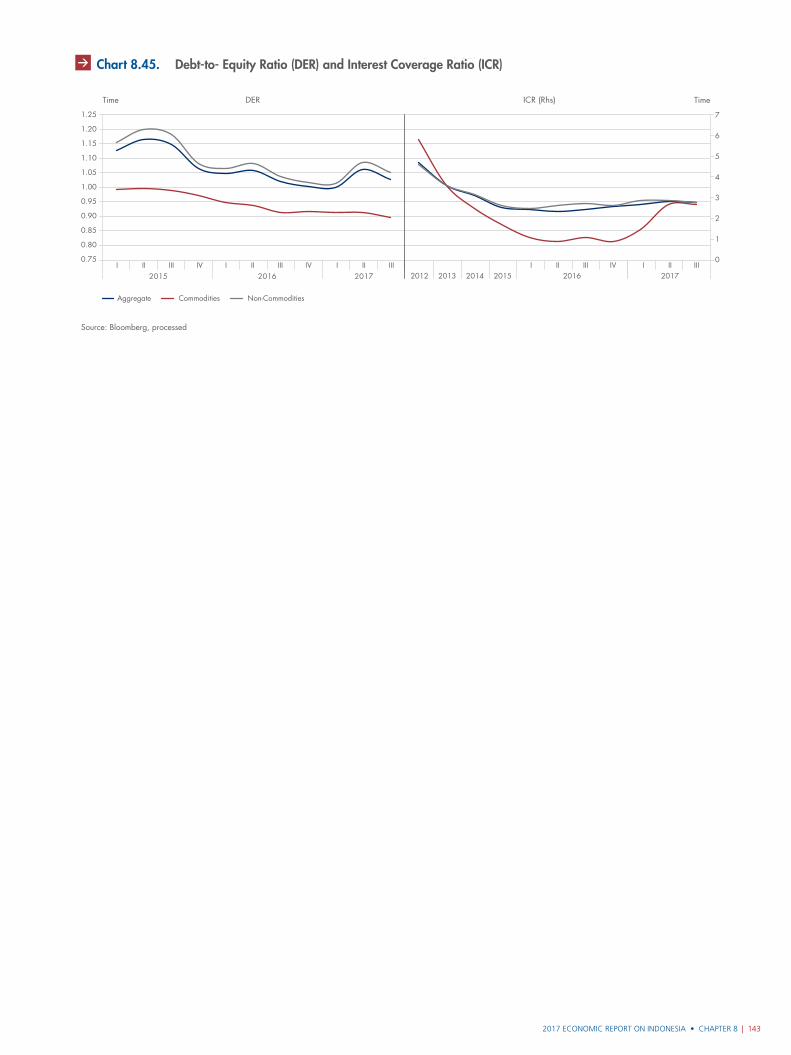
2017 ECONOMIC REPORT ON INDONESIA • CHAPTER 8 | 143
Grafik 8.11. Debt to Equity Ratio (DER) dan Interest Coverage Ratio (ICR)
Time TimeDER ICR (Rhs)
I II III IV I II III IV I II III2015 2016 2017
0
1
2
3
4
5
6
7
I II III IV I II III2012 2013 2014 2015 2016 2017
Aggregate Commodities Non-Commodities
0.75
0.80
0.85
0.90
0.95
1.00
1.05
1.10
1.15
1.20
1.25
Source: Bloomberg, processed
Chart 8.45. Debt-to- Equity Ratio (DER) and Interest Coverage Ratio (ICR)
Box 8.1.
144 | CHAPTER 8 • 2017 ECONOMIC REPORT ON INDONESIA
Box 8.1.
Bank Indonesia has a supervisory role to ensure the effectiveness of its policies as the central bank.1 It undertakes supervision of business people, the
general public and systems that are subject to its policies. This supervision is not intended to restrict movement, but to provide guidance for economic actors so that economic growth takes place appropriately. This role is now more strategic following the transfer of the supervisory function of the banking sector to OJK. Bank Indonesia now supervises macroprudential and monetary issues as well as payment systems.
Supervision is risk-based in nature and monitors the compliance of those subject to supervision by Bank Indonesia. Supervision is based on a strong framework of surveillance or offsite supervision combined with examination or onsite supervision. Through surveillance, Bank Indonesia monitors, identifies, and analyzes risks that could affect financial system stability. The results of the surveillance determine the focus of any follow-up surveillance or supervisory action. Onsite supervision is generally thematic and is used to confirm offsite surveillance results and ensure regulatory compliance of those subject to Bank Indonesia supervision. The results of the supervision, whether surveillance or examination, help to evaluate policies.
Bank Indonesia’s supervisory function now covers macroprudential supervision, monetary supervision, and the monitoring of payments systems.
Macroprudential supervision is designed to maintain the health of the financial system through the early
1 The role of Bank Indonesia as the monetary authority and payments system authority
is set out in Law No. 24 of 1999 concerning Foreign Exchange Movements and the
Exchange Rate System, Law No. 7 of 2011 concerning Currencies, Law No. 3 of 2011
concerning Fund Transfers and Law No. 9 of 2016 concerning the Prevention and
Handling of Financial System Crises. The role of Bank Indonesia as the macroprudential
authority is set out in Law No.21 of 2011 concerning the Financial Services Authority.
Strengthening Bank Indonesia’s Supervisory Function
identification of risks. It supports the intermediation function, the creation of an efficient financial system, and better public access to the financial system. All financial systems are subject to macroprudential supervision, but there is a particular focus on the banking system with the aim of mitigating systemic risk originating from banks’ business activities.2 Offsite supervision is undertaken through assessment tools such as solvency and liquidity stress tests, bank industry ratings, as well as monitoring the compliance of banks with Bank Indonesia regulations.
The macroprudential supervision theme in 2017 was liquidity and the implementation of the loan-to-value (LTV) policy. The results of thematic liquidity supervision on a sample of banks concluded that banks have already responded well to movements in the BI 7-Day (Reverse) Repo Rate (BI7DRR) policy rate. The response was reflected in the decline in the deposit rates and lending rates of those banks. Nonetheless, the results of the supervision also show that the decline in interest rates did not necessarily result in an increase in bank lending; demand for loans was low and banks became increasingly selective in channeling loans. For LTV policy, the results of the supervision show that the banks have already responded to the LTV policy relaxation, so that a further slowdown in property lending in 2017 had been successfully averted.
Monetary supervision was intended to prevent and mitigate monetary risk, including exchange rate risk and liquidity risk. The main approach used in monetary supervision was the compliance approach. In 2017, monetary supervision was focused on banking institutions as the dominant entities in the financial system, as well as supporting money market institutions, such as money market brokers. Supervision of exchange rate risk was achieved through monitoring foreign loans, the position of net reserves, and the indicators of crisis management protocol regarding the exchange rate, among others. Meanwhile, supervision of liquidity risk was party conducted by monitoring transactions in the interbank money market and GWM compliance.
2 Supervision is carried out on systemic banks and other banks. A systemic bank is a
bank that can trigger operational or financial failure of some or all other banks or the
financial services sector if it itself experiences difficulties or failure. This potential impact
on other banks may be due to the size of the assets, capital, liabilities and network of
the systemic bank, the complexity of transactions it carries out or its linkages to other
financial sectors. The principles of supervision are based on BI Regulation No.16/11/
PBI/2014 concerning Macroprudential Regulation and Supervision.
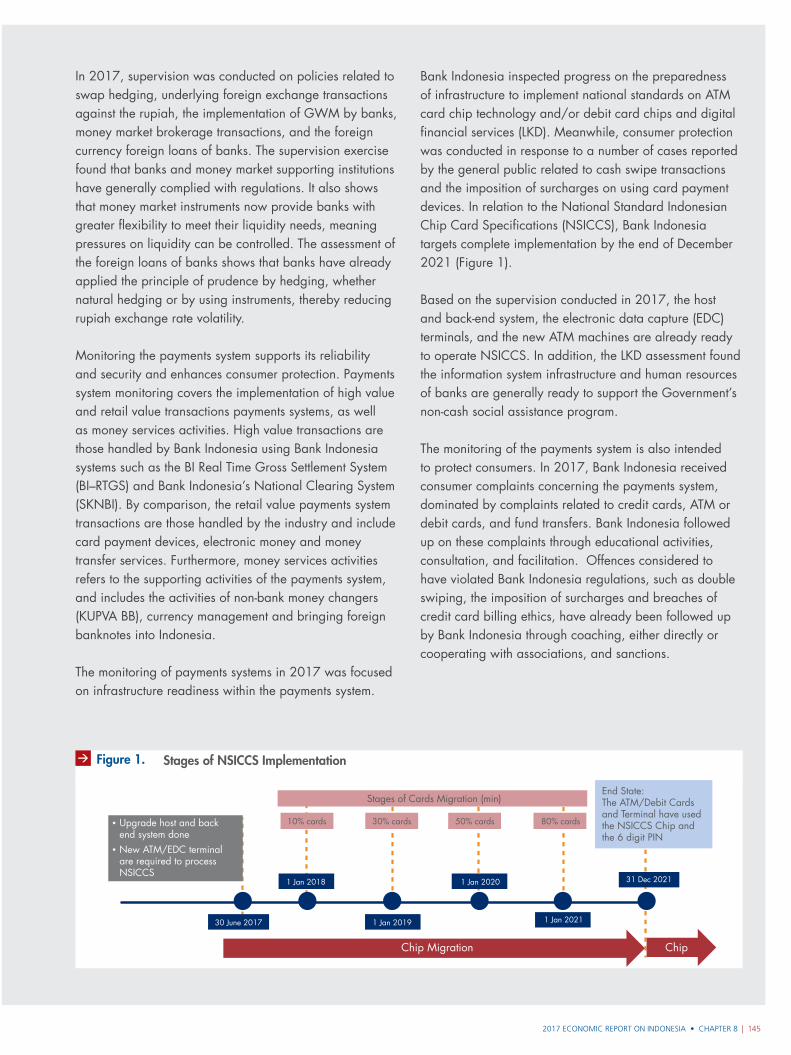
| 1452017 ECONOMIC REPORT ON INDONESIA • CHAPTER 8
Chip Migration
1 Jan 2019
1 Jan 2020
1 Jan 2021
31 Dec 2021
30 June 2017
1 Jan 2018
Chip
Upgrade host and backend system doneNew ATM/EDC terminalare required to processNSICCS
10% cards 30% cards
Stages of Cards Migration (min)
50% cards 80% cards
End State:The ATM/Debit Cardsand Terminal have usedthe NSICCS Chip andthe 6 digit PIN
Figure 1. Stages of NSICCS Implementation
In 2017, supervision was conducted on policies related to swap hedging, underlying foreign exchange transactions against the rupiah, the implementation of GWM by banks, money market brokerage transactions, and the foreign currency foreign loans of banks. The supervision exercise found that banks and money market supporting institutions have generally complied with regulations. It also shows that money market instruments now provide banks with greater flexibility to meet their liquidity needs, meaning pressures on liquidity can be controlled. The assessment of the foreign loans of banks shows that banks have already applied the principle of prudence by hedging, whether natural hedging or by using instruments, thereby reducing rupiah exchange rate volatility.
Monitoring the payments system supports its reliability and security and enhances consumer protection. Payments system monitoring covers the implementation of high value and retail value transactions payments systems, as well as money services activities. High value transactions are those handled by Bank Indonesia using Bank Indonesia systems such as the BI Real Time Gross Settlement System (BI–RTGS) and Bank Indonesia’s National Clearing System (SKNBI). By comparison, the retail value payments system transactions are those handled by the industry and include card payment devices, electronic money and money transfer services. Furthermore, money services activities refers to the supporting activities of the payments system, and includes the activities of non-bank money changers (KUPVA BB), currency management and bringing foreign banknotes into Indonesia.
The monitoring of payments systems in 2017 was focused on infrastructure readiness within the payments system.
Bank Indonesia inspected progress on the preparedness of infrastructure to implement national standards on ATM card chip technology and/or debit card chips and digital financial services (LKD). Meanwhile, consumer protection was conducted in response to a number of cases reported by the general public related to cash swipe transactions and the imposition of surcharges on using card payment devices. In relation to the National Standard Indonesian Chip Card Specifications (NSICCS), Bank Indonesia targets complete implementation by the end of December 2021 (Figure 1).
Based on the supervision conducted in 2017, the host and back-end system, the electronic data capture (EDC) terminals, and the new ATM machines are already ready to operate NSICCS. In addition, the LKD assessment found the information system infrastructure and human resources of banks are generally ready to support the Government’s non-cash social assistance program.
The monitoring of the payments system is also intended to protect consumers. In 2017, Bank Indonesia received consumer complaints concerning the payments system, dominated by complaints related to credit cards, ATM or debit cards, and fund transfers. Bank Indonesia followed up on these complaints through educational activities, consultation, and facilitation. Offences considered to have violated Bank Indonesia regulations, such as double swiping, the imposition of surcharges and breaches of credit card billing ethics, have already been followed up by Bank Indonesia through coaching, either directly or cooperating with associations, and sanctions.

| 1472017 ECONOMIC REPORT ON INDONESIA
CHAPTER 9
Bank Indonesia’s 2017 policy in the field of payment system and currency management aimed to ensure a secure, efficient, seamless and reliable payment system as access expands, while also protecting consumers.
Payment System and Currency Management Policy
CHAPTER 9 • 2017 ECONOMIC REPORT ON INDONESIA148 |
Bank Indonesia’s payment system and currency management (SP–PUR) policy was aimed at ensuring a secure, efficient, seamless and reliable payment system as access expands, while also protecting consumers. The policy was guided by Bank Indonesia’s 2017–2024 SP–PUR blueprint and faced two major challenges. First, domestic non-cash payment systems were inefficient and, second, the availability of currency fit for circulation was not evenly distributed across Indonesia. Bank Indonesia’s SP–PUR policy sought to overcome these two challenges in 2017.
SP–PUR policy was divided into non-cash payment systems and currency management. On the non-cash payment system side, Bank Indonesia has three strategies: (i) encouraging the interconnection and interoperability of domestic retail payment instruments – these include debit and credit cards – and channels – for example, automated teller machines (ATM), electronic data capturing machines (EDC) and online – as part of the National Payment Gateway (NPG); (ii) expanding electronification programs; and (iii) providing a balanced response to developments in the digital economy. These three policy strategies were supported by the implementation of Bank Indonesia’s supervisory function in payment systems. Meanwhile, on the currency management side, Bank Indonesia committed to three strategy pillars: (i) the provision of good-quality and trusted currency; (ii) the secure and optimal distribution and handling of currency; and (iii) the provision of first-rate cash services. The implementation of this policy was supported by integrated information systems and strong collaboration with relevant parties.
Supported by this policy direction, the performance of the non-cash and cash payment systems both improved in 2017. The non-cash payment system – the Bank Indonesia Real Time Gross Settlement (BI–RTGS), Bank Indonesia National Clearing System (SKNBI) and Bank Indonesia Scripless Securities Settlement System (BI–SSSS) systems – ran smoothly and reliably, with an increase in transactions compared to 2016. This enhanced performance was also seen in non-cash retail transactions through ATM/debit cards, electronic money, and credit cards. A better performance was also seen in terms of cash payments, with greater availability of good-quality currency fit for circulation. Currency in circulation (UYD) increased as the economy improved and was distributed more widely across Indonesia. The destruction of currency unfit for
circulation also increased, and discoveries of counterfeit money declined.
9.1. NoN-cash PaymeNt system Policy
Bank Indonesia aims to provide optimal support for the creation of a national payment system that is secure, efficient, inclusive, competitive and innovative, and has the ability to grow. In this regard, payment system policy in 2017 focused on three simultaneous strategies; first, encouraging the interconnection and interoperability of domestic retail payment methods as part of the NPG; second, expanding electronification programs; and third, responding to the acceleration of the digital economy, especially financial technology (fintech), in a balanced manner. These three policy strategies were fully supported by Bank Indonesia’s supervisory function in the field of payment systems.
This policy direction strengthened the development of non-cash payment systems, but challenges persist nonetheless. The national payment system, for example, still has to deal with low efficiency in the payment system industry, particularly in the area of non-cash retail payment systems, and this slows public acceptance of non-cash transactions. In addition, the rapid development of digital technology poses new challenges. In the face of these issues, all parties must commit to support stronger payment system policy.
National Payment Gateway (NPG)
Amid formidable challenges, the industry around non-cash retail payments has developed rapidly, and there is a growing number of payment system industry participants and instruments. As it develops, however, this domestic industry still faces the challenge of fragmentation, whereby each non-cash issuer has its own payment platform, which is closed to other issuers. This is an unwelcome situation, both for issuers and the public. It means that issuers must maintain their own infrastructure, such as ATM and EDC machines, so as to limit their capacity for expansion and to reduce potential transaction uncertainty and inconvenience. It also means the public must maintain multiple cards or accounts to ensure they can carry out all the transactions they want, and also face costly administration fees. In addition, no domestic arrangement
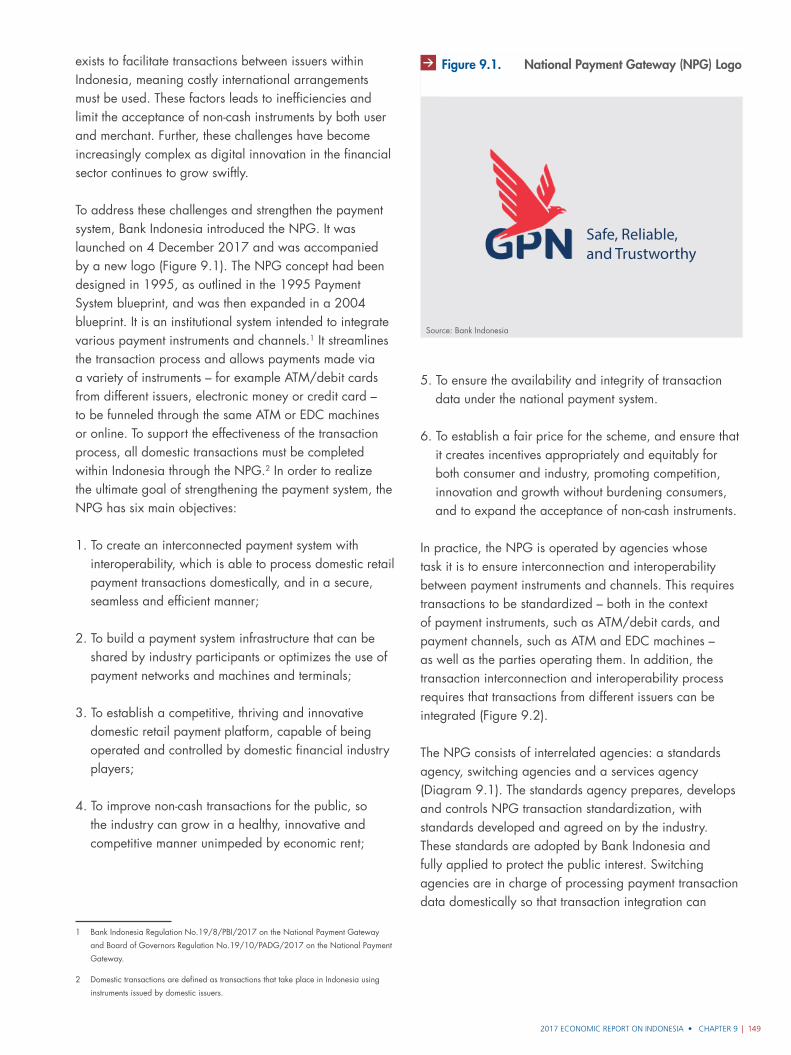
2017 ECONOMIC REPORT ON INDONESIA • CHAPTER 9 | 149
exists to facilitate transactions between issuers within Indonesia, meaning costly international arrangements must be used. These factors leads to inefficiencies and limit the acceptance of non-cash instruments by both user and merchant. Further, these challenges have become increasingly complex as digital innovation in the financial sector continues to grow swiftly.
To address these challenges and strengthen the payment system, Bank Indonesia introduced the NPG. It was launched on 4 December 2017 and was accompanied by a new logo (Figure 9.1). The NPG concept had been designed in 1995, as outlined in the 1995 Payment System blueprint, and was then expanded in a 2004 blueprint. It is an institutional system intended to integrate various payment instruments and channels.1 It streamlines the transaction process and allows payments made via a variety of instruments – for example ATM/debit cards from different issuers, electronic money or credit card – to be funneled through the same ATM or EDC machines or online. To support the effectiveness of the transaction process, all domestic transactions must be completed within Indonesia through the NPG.2 In order to realize the ultimate goal of strengthening the payment system, the NPG has six main objectives:
1. To create an interconnected payment system with interoperability, which is able to process domestic retail payment transactions domestically, and in a secure, seamless and efficient manner;
2. To build a payment system infrastructure that can be shared by industry participants or optimizes the use of payment networks and machines and terminals;
3. To establish a competitive, thriving and innovative domestic retail payment platform, capable of being operated and controlled by domestic financial industry players;
4. To improve non-cash transactions for the public, so the industry can grow in a healthy, innovative and competitive manner unimpeded by economic rent;
1 Bank Indonesia Regulation No.19/8/PBI/2017 on the National Payment Gateway
and Board of Governors Regulation No.19/10/PADG/2017 on the National Payment
Gateway.
2 Domestic transactions are defined as transactions that take place in Indonesia using
instruments issued by domestic issuers.
5. To ensure the availability and integrity of transaction data under the national payment system.
6. To establish a fair price for the scheme, and ensure that it creates incentives appropriately and equitably for both consumer and industry, promoting competition, innovation and growth without burdening consumers, and to expand the acceptance of non-cash instruments.
In practice, the NPG is operated by agencies whose task it is to ensure interconnection and interoperability between payment instruments and channels. This requires transactions to be standardized – both in the context of payment instruments, such as ATM/debit cards, and payment channels, such as ATM and EDC machines – as well as the parties operating them. In addition, the transaction interconnection and interoperability process requires that transactions from different issuers can be integrated (Figure 9.2).
The NPG consists of interrelated agencies: a standards agency, switching agencies and a services agency (Diagram 9.1). The standards agency prepares, develops and controls NPG transaction standardization, with standards developed and agreed on by the industry. These standards are adopted by Bank Indonesia and fully applied to protect the public interest. Switching agencies are in charge of processing payment transaction data domestically so that transaction integration can
Source: Bank Indonesia
Safe, Reliable, and Trustworthy
Figure 9.1. National Payment Gateway (NPG) Logo
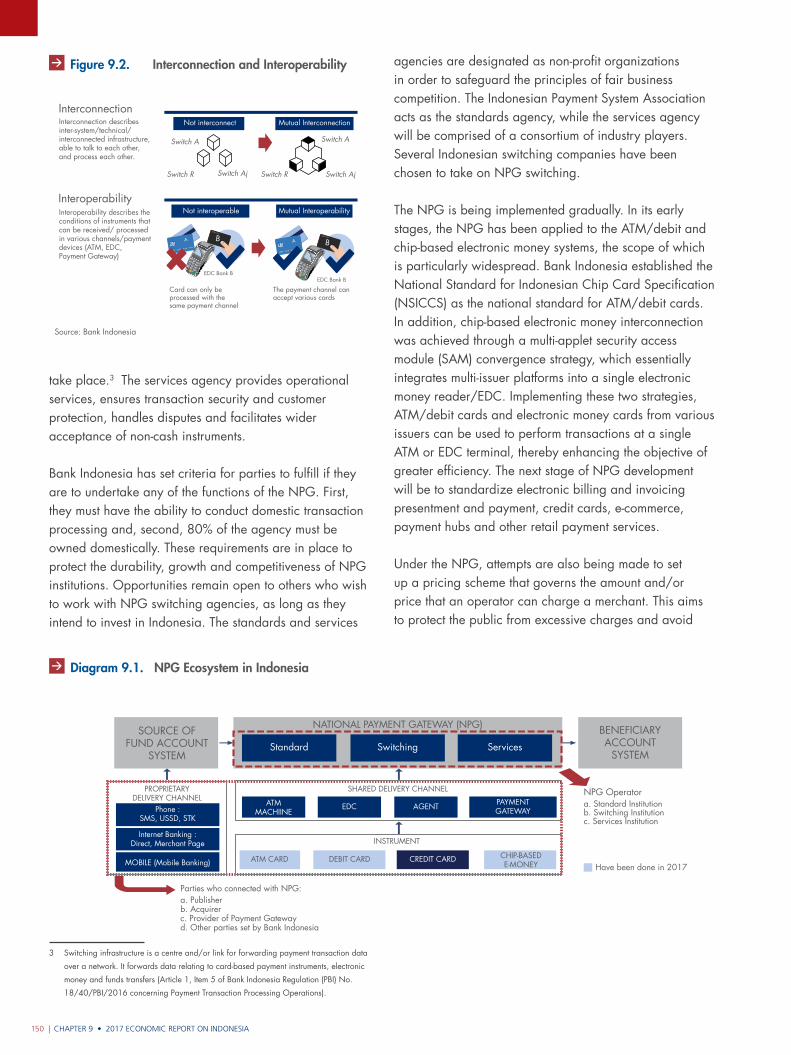
CHAPTER 9 • 2017 ECONOMIC REPORT ON INDONESIA150 |
Gambar 9.2. Interkoneksi dan Interoperabilitas
Source: Bank Indonesia
Interconnection
Interoperability
Card can only beprocessed with thesame payment channel
EDC Bank BEDC Bank B
The payment channel canaccept various cards
Not interconnect
Not interoperable Mutual Interoperability
Mutual Interconnection
Switch A Switch A
Switch R Switch RSwitch Aj Switch Aj
BCREDIT CARD
A BCREDIT CARD
A
Interconnection describes inter-system/technical/interconnected infrastructure, able to talk to each other,and process each other.
Interoperability describes the conditions of instruments that can be received/ processedin various channels/payment devices (ATM, EDC,Payment Gateway)
take place.3 The services agency provides operational services, ensures transaction security and customer protection, handles disputes and facilitates wider acceptance of non-cash instruments.
Bank Indonesia has set criteria for parties to fulfill if they are to undertake any of the functions of the NPG. First, they must have the ability to conduct domestic transaction processing and, second, 80% of the agency must be owned domestically. These requirements are in place to protect the durability, growth and competitiveness of NPG institutions. Opportunities remain open to others who wish to work with NPG switching agencies, as long as they intend to invest in Indonesia. The standards and services
3 Switching infrastructure is a centre and/or link for forwarding payment transaction data
over a network. It forwards data relating to card-based payment instruments, electronic
money and funds transfers (Article 1, Item 5 of Bank Indonesia Regulation (PBI) No.
18/40/PBI/2016 concerning Payment Transaction Processing Operations).
Gambar 9.1. Ekosistem GPN di Indonesia
Source: Bank Indonesia
SOURCE OFFUND ACCOUNT
SYSTEM
PROPRIETARYDELIVERY CHANNEL
SHARED DELIVERY CHANNEL
INSTRUMENT
NATIONAL PAYMENT GATEWAY (NPG) BENEFICIARYACCOUNT
SYSTEMStandard
Phone :SMS, USSD, STK
ATMMACHIINE
ATM CARD CREDIT CARD CHIP-BASEDE-MONEY
DEBIT CARD
EDC AGENT PAYMENTGATEWAY
Internet Banking :Direct, Merchant Page
MOBILE (Mobile Banking)
Switching Services
Parties who connected with NPG:a. Publisherb. Acquirerc. Provider of Payment Gatewayd. Other parties set by Bank Indonesia
NPG Operatora. Standard Institutionb. Switching Institutionc. Services Institution
Have been done in 2017
Diagram 9.1. NPG Ecosystem in Indonesia
Figure 9.2. Interconnection and Interoperability agencies are designated as non-profit organizations in order to safeguard the principles of fair business competition. The Indonesian Payment System Association acts as the standards agency, while the services agency will be comprised of a consortium of industry players. Several Indonesian switching companies have been chosen to take on NPG switching.
The NPG is being implemented gradually. In its early stages, the NPG has been applied to the ATM/debit and chip-based electronic money systems, the scope of which is particularly widespread. Bank Indonesia established the National Standard for Indonesian Chip Card Specification (NSICCS) as the national standard for ATM/debit cards. In addition, chip-based electronic money interconnection was achieved through a multi-applet security access module (SAM) convergence strategy, which essentially integrates multi-issuer platforms into a single electronic money reader/EDC. Implementing these two strategies, ATM/debit cards and electronic money cards from various issuers can be used to perform transactions at a single ATM or EDC terminal, thereby enhancing the objective of greater efficiency. The next stage of NPG development will be to standardize electronic billing and invoicing presentment and payment, credit cards, e-commerce, payment hubs and other retail payment services.
Under the NPG, attempts are also being made to set up a pricing scheme that governs the amount and/or price that an operator can charge a merchant. This aims to protect the public from excessive charges and avoid
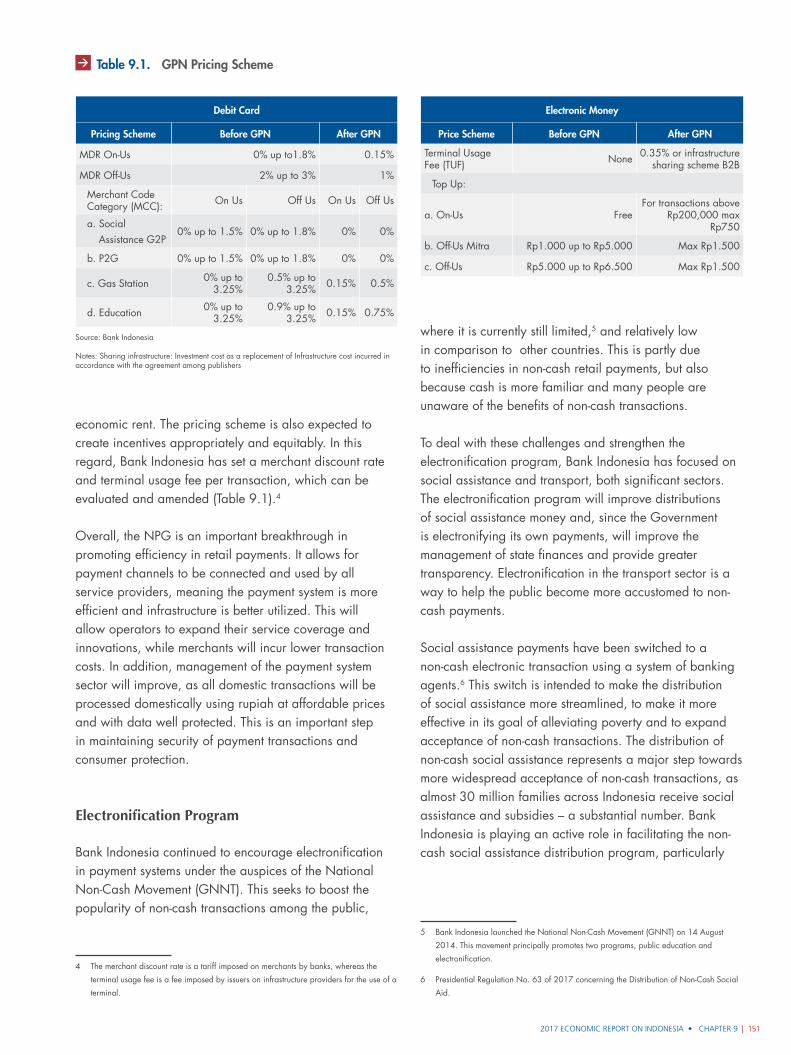
2017 ECONOMIC REPORT ON INDONESIA • CHAPTER 9 | 151
economic rent. The pricing scheme is also expected to create incentives appropriately and equitably. In this regard, Bank Indonesia has set a merchant discount rate and terminal usage fee per transaction, which can be evaluated and amended (Table 9.1).4
Overall, the NPG is an important breakthrough in promoting efficiency in retail payments. It allows for payment channels to be connected and used by all service providers, meaning the payment system is more efficient and infrastructure is better utilized. This will allow operators to expand their service coverage and innovations, while merchants will incur lower transaction costs. In addition, management of the payment system sector will improve, as all domestic transactions will be processed domestically using rupiah at affordable prices and with data well protected. This is an important step in maintaining security of payment transactions and consumer protection.
Electronification Program
Bank Indonesia continued to encourage electronification in payment systems under the auspices of the National Non-Cash Movement (GNNT). This seeks to boost the popularity of non-cash transactions among the public,
4 The merchant discount rate is a tariff imposed on merchants by banks, whereas the
terminal usage fee is a fee imposed by issuers on infrastructure providers for the use of a
terminal.
where it is currently still limited,5 and relatively low in comparison to other countries. This is partly due to inefficiencies in non-cash retail payments, but also because cash is more familiar and many people are unaware of the benefits of non-cash transactions.
To deal with these challenges and strengthen the electronification program, Bank Indonesia has focused on social assistance and transport, both significant sectors. The electronification program will improve distributions of social assistance money and, since the Government is electronifying its own payments, will improve the management of state finances and provide greater transparency. Electronification in the transport sector is a way to help the public become more accustomed to non-cash payments.
Social assistance payments have been switched to a non-cash electronic transaction using a system of banking agents.6 This switch is intended to make the distribution of social assistance more streamlined, to make it more effective in its goal of alleviating poverty and to expand acceptance of non-cash transactions. The distribution of non-cash social assistance represents a major step towards more widespread acceptance of non-cash transactions, as almost 30 million families across Indonesia receive social assistance and subsidies – a substantial number. Bank Indonesia is playing an active role in facilitating the non-cash social assistance distribution program, particularly
5 Bank Indonesia launched the National Non-Cash Movement (GNNT) on 14 August
2014. This movement principally promotes two programs, public education and
electronification.
6 Presidential Regulation No. 63 of 2017 concerning the Distribution of Non-Cash Social
Aid.
Table 9.1. GPN Pricing Scheme
Debit Card
Pricing Scheme Before GPN After GPN
MDR On-Us 0% up to1.8% 0.15%
MDR Off-Us 2% up to 3% 1%
Merchant Code Category (MCC): On Us Off Us On Us Off Us
a. Social Assistance G2P
0% up to 1.5% 0% up to 1.8% 0% 0%
b. P2G 0% up to 1.5% 0% up to 1.8% 0% 0%
c. Gas Station 0% up to 3.25%
0.5% up to 3.25% 0.15% 0.5%
d. Education 0% up to 3.25%
0.9% up to 3.25% 0.15% 0.75%
Source: Bank Indonesia
Notes: Sharing infrastructure: Investment cost as a replacement of Infrastructure cost incurred in accordance with the agreement among publishers
Electronic Money
Price Scheme Before GPN After GPN
Terminal Usage Fee (TUF) None 0.35% or infrastructure
sharing scheme B2B
Top Up:
a. On-Us FreeFor transactions above
Rp200,000 max Rp750
b. Off-Us Mitra Rp1.000 up to Rp5.000 Max Rp1.500
c. Off-Us Rp5.000 up to Rp6.500 Max Rp1.500
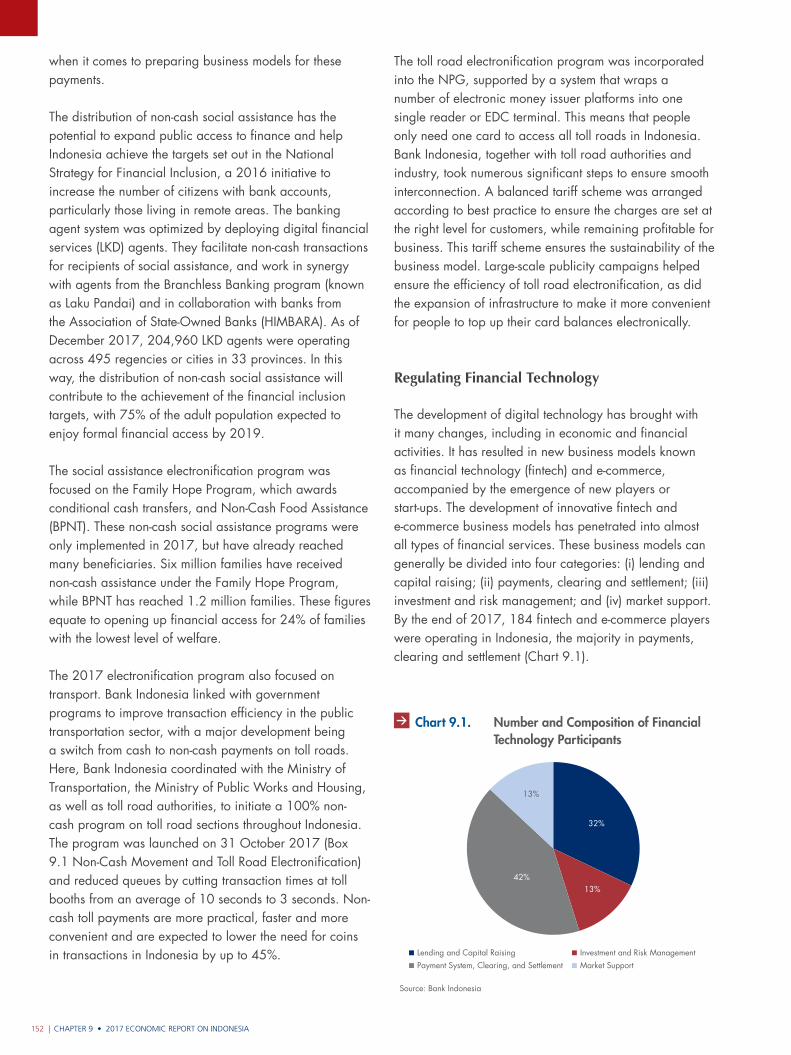
CHAPTER 9 • 2017 ECONOMIC REPORT ON INDONESIA152 |
when it comes to preparing business models for these payments.
The distribution of non-cash social assistance has the potential to expand public access to finance and help Indonesia achieve the targets set out in the National Strategy for Financial Inclusion, a 2016 initiative to increase the number of citizens with bank accounts, particularly those living in remote areas. The banking agent system was optimized by deploying digital financial services (LKD) agents. They facilitate non-cash transactions for recipients of social assistance, and work in synergy with agents from the Branchless Banking program (known as Laku Pandai) and in collaboration with banks from the Association of State-Owned Banks (HIMBARA). As of December 2017, 204,960 LKD agents were operating across 495 regencies or cities in 33 provinces. In this way, the distribution of non-cash social assistance will contribute to the achievement of the financial inclusion targets, with 75% of the adult population expected to enjoy formal financial access by 2019.
The social assistance electronification program was focused on the Family Hope Program, which awards conditional cash transfers, and Non-Cash Food Assistance (BPNT). These non-cash social assistance programs were only implemented in 2017, but have already reached many beneficiaries. Six million families have received non-cash assistance under the Family Hope Program, while BPNT has reached 1.2 million families. These figures equate to opening up financial access for 24% of families with the lowest level of welfare.
The 2017 electronification program also focused on transport. Bank Indonesia linked with government programs to improve transaction efficiency in the public transportation sector, with a major development being a switch from cash to non-cash payments on toll roads. Here, Bank Indonesia coordinated with the Ministry of Transportation, the Ministry of Public Works and Housing, as well as toll road authorities, to initiate a 100% non-cash program on toll road sections throughout Indonesia. The program was launched on 31 October 2017 (Box 9.1 Non-Cash Movement and Toll Road Electronification) and reduced queues by cutting transaction times at toll booths from an average of 10 seconds to 3 seconds. Non-cash toll payments are more practical, faster and more convenient and are expected to lower the need for coins in transactions in Indonesia by up to 45%.
The toll road electronification program was incorporated into the NPG, supported by a system that wraps a number of electronic money issuer platforms into one single reader or EDC terminal. This means that people only need one card to access all toll roads in Indonesia. Bank Indonesia, together with toll road authorities and industry, took numerous significant steps to ensure smooth interconnection. A balanced tariff scheme was arranged according to best practice to ensure the charges are set at the right level for customers, while remaining profitable for business. This tariff scheme ensures the sustainability of the business model. Large-scale publicity campaigns helped ensure the efficiency of toll road electronification, as did the expansion of infrastructure to make it more convenient for people to top up their card balances electronically.
Regulating Financial Technology
The development of digital technology has brought with it many changes, including in economic and financial activities. It has resulted in new business models known as financial technology (fintech) and e-commerce, accompanied by the emergence of new players or start-ups. The development of innovative fintech and e-commerce business models has penetrated into almost all types of financial services. These business models can generally be divided into four categories: (i) lending and capital raising; (ii) payments, clearing and settlement; (iii) investment and risk management; and (iv) market support. By the end of 2017, 184 fintech and e-commerce players were operating in Indonesia, the majority in payments, clearing and settlement (Chart 9.1).
Source: Bank Indonesia
Graph 9.1.
Payment System, Clearing, and Settlement Market SupportLending and Capital Raising Investment and Risk Management
32%
13%42%
13%
Chart 9.1. Number and Composition of Financial Technology Participants
2017 ECONOMIC REPORT ON INDONESIA • CHAPTER 9 | 153
Fintech and e-commerce innovations offer various benefits to consumers, including the ability to perform transactions with almost no territorial restrictions. Fintech and e-commerce can encourage financial inclusion by providing easy, fast and inexpensive access to financial services. Furthermore, fintech business models tend to promote the decentralization of financial services and disperse risk which, in conventional business models, is centralized with a single point of failure. Consequently, fintech and e-commerce business models are deemed more secure than conventional models.
The swift development of fintech is supported by rapid digital penetration in Indonesia. Total fintech transactions in Indonesia in 2017 are predicted to amount to USD18.6 billion, up 24.6% from 2016. This is consistent with the escalation in the number of fintech players, which now number 184 – an increase of more than 65% from the end of 2016. Meanwhile, total e-commerce transactions are expected to amount to USD6.96 billion in 2017, up 23% from 2016. This positive performance is due to the rapid penetration of digital technology in Indonesia as the middle class grows. There are 88.1 million internet users in Indonesia – 34% of the total population – and of these, 64.1 million are active users. Growth of mobile phone and internet users is expected to reach 8% per year by 2022, by which time it will encompass 113.5 million people. The rapid development of fintech has proved very attractive to investors, especially foreign investors, who are aggressively putting money into various Indonesian digital platforms. This trend is expected to continue given the positive outlook in the Indonesian market.
In addition to the impact from the electronification of social assistance distribution and toll road payments, the rise in electronic money transactions in 2017 was also boosted by this growing number of fintech and e-commerce transactions. Electronic money instruments often serve as the basis for fintech and e-commerce payments. One clear indication of this was the escalating value and volume of proprietary channel transactions conducted through mobile and internet banking – increases of 33.7% yoy and 16.1% yoy respectively.7
The rapid development of fintech and e-commerce needs to be watched closely because it involves risks. The digital revolution has the potential to change the structure of
7 Besides contributions from transactions related to the use of server-based electronic
money, proprietary channel transaction data also contains transactions derived from
electronic non-cash credit transfers.
the financial system and its risk profiles. Ever-evolving technological innovations give consumers greater room to control how they conduct economic transactions, but also have the potential to disrupt the intermediary function of the banking industry, which is currently well regulated and systematic. These threatened disruptions could affect aspects of risk management and consumer protection. Financial innovation can lead to risks, including excessive risk-taking and moral hazard, along with lax risk management. Other risks that could arise include the potential for money laundering and terrorism financing, most notably in anonymous virtual currency-based transactions. The risk of cyber-attacks also exists, and the dangers are not only limited to fraud, but extend to threats to privacy and data protection. In addition, there is a risk of contagion and increased volatility of capital flows as interconnectedness increases among players.
Bank Indonesia has responded to the development of fintech and e-commerce in a cautious and balanced manner. In 2017, Bank Indonesia strengthened the functions of the Bank Indonesia Fintech Office and introduced a regulatory sandbox.8 This sandbox is a testing ground for fintech, a program under which fintech companies can test their innovations while supervised by Bank Indonesia. Bank Indonesia’s Fintech Office regulates, among other things, the criteria and procedures for fintech registration. In addition, Bank Indonesia also formulated the rules of play in the sandbox.9 These rules are expected to ensure compliance with prudential principles, fair business competition, risk control and consumer protection.
Bank Indonesia has banned the use of virtual currency for fintech and e-commerce operators and payment system service providers. This policy was intended to maintain the sovereignty of the rupiah as legal tender in all regions of Indonesia in accordance with Law No. 7 of 2011 on Currency. The policy also aims to maintain financial system stability, prevent money laundering and terrorism financing, and protect consumers.
Bank Indonesia also continued to work with the Financial Services Authority, the Ministry of Communications and Information Technology, the Indonesian Police, the Ministry of Trade and the Ministry of Finance on policy responses to the development of digital technology. Good
8 Bank Indonesia Regulation Number 19/12/PBI/2017 concerning the Operation
of Financial Technology.
9 Board of Governors Regulation No. 19/14/PADG/2017 concerning the Financial
Technology Regulatory Sandbox.
CHAPTER 9 • 2017 ECONOMIC REPORT ON INDONESIA154 |
inter-authority policy synergy plays an important role in building a robust national financial industry.
Other Policies for Strengthening Payment Systems
Bank Indonesia pursued several other policies in the field of payment systems. These policies were related to credit cards, payment integrity, SKNBI infrastructure and central bank money. In addition to supporting payment systems, these policies were also expected to encourage economic recovery.
With regard to credit cards, Bank Indonesia lowered the maximum limit for credit card interest rates with effect from June 2017.10 This stipulated a reduction to 2.25% per month or 26.95% per year, from 2.95% per month or 35.40% per year. This policy is expected to cause a decline in credit card interest rates, in line with other rate reductions. In addition, Bank Indonesia also made it mandatory for credit card issuers to deliver a formal closing statement to customers who are closing their credit card accounts. This policy also came into effect in June 2017 and was intended to strengthen consumer protection and boost public confidence in credit cards.
In order to strengthen the integrity of payment transactions, Bank Indonesia issued new rules to prevent money laundering and terrorism financing. This step was taken because money laundering and terrorism financing are becoming increasingly complex as new information technology changes the risk landscape.11 These new provisions regulate all unlicensed, non-bank foreign exchange business activities (KUPVA BB) operators, non-bank fund transfer operators and payment system service providers (PJSP) other than banks, including fintech operators. The subjects of these regulations are required to adopt a risk-based approach, and identify the risks associated with service users, countries or geographic areas, products or services, and transaction channels or networks. This policy is expected to improve the integrity of national payment transactions, while also bolstering consumer protection.
10 Bank Indonesia Circular Letter (SEBI) No.18/33/DKSP of 2 December, 2016
concerning the Fourth Amendment to SEBI No.11/10/DASP of 13 April, 2009 on the
Operation of Card-Based Payment Instrument (APMK) Activities.
11 Bank Indonesia Regulation No. 19/10/PBI/2017 concerning the Application of Anti-
Money Laundering and Terrorism Financing Prevention Measures for Payment System
Service Providers Besides Banks and Non-Bank Foreign Exchange Business Activities
(KUPVA) Operators (PBI APU-PPT).
In another step taken to strengthen payment systems, Bank Indonesia moved to optimize the use of the bulk payment feature in the second generation of the Indonesian clearing system. This feature improves the efficiency of regular payments and billing services, including salary payments, aid distribution, and the realization of Regional Revenue and Expenditure Budgets (APBD). Bank Indonesia has been educating banks, corporations and the public on regular billing services and also established a development program that was able to increase bulk payment transactions by an average monthly 30.7%. In 2017, 157,758 SKNBI bulk payment service transactions were made with a total value of IDR1,599 billion.
Bank Indonesia also expanded the implementation of Central Bank Money (CeBM),12 in 2017, Bank Indonesia began implementing phrase three. Prior to phase three, CeBM was only used for the settlement of government securities (SBN), non-SBN by custodian banks and SBN settlements by securities companies. With phase three, fund settlements by securities companies were extended to include non-SBN transactions, a policy implemented to minimize settlement risks. By the end of 2017, five securities companies had implemented CeBM for fund settlements of non-SBN transactions in the capital market.
Strengthening of Payment System Supervision
Bank Indonesia’s payment system policy has been fortified by good supervision. In 2017, supervision was focused on strengthening consumer protection and tackling illegal practices, part of Bank Indonesia’s anti-money laundering and terrorism financing prevention commitment. The supervision was intended to ensure compliance with Bank Indonesia regulations; parties subject to these regulations include payment system service providers (PJSP).
Consumer protection efforts were focused on implementing a ban on the double swiping of non-cash cards, a practice previously common in Indonesia. The first swipe was to the bank’s EDC and the second to the retailer’s own computer. Bank Indonesia now prohibits the second swipe. PJSP are now not allowed to obtain or use customer data other than for payment transaction processing purposes, and are prohibited from acquiring customer data in the
12 The use of CeBM refers to the transaction settlement process at Bank Indonesia.
2017 ECONOMIC REPORT ON INDONESIA • CHAPTER 9 | 155
payment process.13 The aim of this double-swipe ban is to protect the public from the risk of theft and misuse of their data and information contained in payment instruments. This policy move reinforces previous consumer protection measures, such as the ban on credit card surcharges and the ban on credit card cash withdrawals at merchants.
These improvements to consumer protection met with a positive response from business, which developed a method that does away with the need for the transaction authorization on a cash register to involve a second swipe. This technical innovation has mitigated the risk of customer data being improperly acquired without making the payment process any longer. Both Bank Indonesia and PJSP have informed the public of the ban on double swiping, and hope that increased awareness will help people reduce risks when making payments.
Bank Indonesia took a firm stand in supervising and combating illegal financial transactions, particularly money laundering and terrorism financing. Its supervision and control was directed towards compliance on the part of KUPVA BB operators, which tend to be used for these activities. Action was conducted in cooperation with the Indonesian National Police, the National Narcotics Agency, the Financial Transaction Reporting and Analysis Center and other relevant central and regional agencies. Bank Indonesia identified 783 unlicensed KUPVA BBs operating across Java, Sumatra, Balinusra, Kalimantan, Sulawesi and Papua. By the end of 2017, 91% of these operators had been disciplined.
Bank Indonesia also continued to raise public awareness on the use of licensed fund transfer and foreign exchange services. A significant change made by Bank Indonesia in this regard was to customize a logo for licensed KUPVA BB operators to make it easier for people to recognize them.
International assessors have responded favorably to Bank Indonesia’s efforts to counter money laundering and terrorism financing. In 2017, Indonesia, as a member of Financial Action Task Force-style regional bodies, including the Asia/Pacific Group on Money Laundering, underwent periodic mutual evaluations by the Financial Action Task Force-Asia Pacific Group on Money Laundering. Indonesia was found to have applied anti-money laundering and
13 Bank Indonesia Regulation Number 18/40/PBI/2016 concerning Payment Transaction
Processing Operations.
terrorism financing prevention principles effectively. This is reflected, among other things, by the availability of sectoral risk assessments, the application of risk-based assessments and the adoption of measures aimed at controlling unlicensed KUPVA BB operators.
9.2. curreNcy maNagemeNt Policy
Bank Indonesia’s currency management policy in 2017 remained directed at optimizing the role of cash in supporting the Indonesian economy. Bank Indonesia aimed to meet public demand for cash in sufficient quantities and in appropriate denominations, in a timely manner. It also aimed to ensure the money was in a condition fit for circulation.
Policy implementation falls under three pillars: (i) making available good-quality and trusted currency; (ii) the secure and optimal distribution and handling of currency; and (iii) first-rate cash services. Bank Indonesia wanted to ensure an even distribution of currency across Indonesia, with availability measured in terms of sufficiency of quantity, appropriateness of denominations, suitability of quality and security from counterfeiting.
First Pillar: Availability of good-quality and trusted currency
Demand for rupiah currency rose in line with the continuing expansion of the national economy and it was required in all areas of Indonesia. To ensure the availability of good-quality and trusted currency, Bank Indonesia pursued three main strategies: (i) maintaining the sufficiency of currency and expanding the circulation of 2016 emission year (EY) rupiah, (ii) a ‘clean money’ policy to improve the quality of currency in circulation, and (iii) preventing and combating the circulation of counterfeit rupiah, including through public awareness work.
To ensure sufficient currency and to expand the circulation of 2016 EY rupiah, Bank Indonesia strengthened currency planning by focusing on macroeconomic assumptions, on the amount of currency unfit for circulation, and the management of currency supply. Bank Indonesia then printed currency in accordance with this. As mandated by the Currency Law, Bank Indonesia appointed Perum Peruri, the Indonesian State Mint, as its currency printer.
CHAPTER 9 • 2017 ECONOMIC REPORT ON INDONESIA156 |
Thereafter, Bank Indonesia, both at its headquarters and at all regional representative offices, consistently maintained sufficient cash to meet demand from banks and the public. As in previous years, Bank Indonesia’s cash adequacy levels were aligned with the national iron stock (ISN) and minimum cash (KM) indicators.14 Over the course of 2017, Bank Indonesia was able to maintain the sufficiency of cash nationally at an average of 3.5 months of outflow.
Sufficient currency was available in 2017 to satisfy demand from banks and the public, with enough to cover the significant rise in withdrawals over religious holidays and New Year. Currency withdrawals over the 2017 Ramadhan and Idul Fitri period totaled IDR163.2 trillion, up 11.7% yoy. Meanwhile, over the Christmas and 2017 end-of-year period, currency withdrawals rose 14.1% yoy to IDR91.7 trillion. Bank Indonesia successfully met the seasonal spike in demand for currency across the whole of Indonesia.
To maintain the sufficiency of currency and expand the circulation of 2016 EY rupiah, Bank Indonesia also cooperated with banks and other institutions on distribution and circulation. Banks continued to improve their supply of currency fit for circulation, with these efforts underscored by cooperation in currency management activities through the optimization of interbank currency transactions and the dropshot mechanism.15 In addition, cooperation also extended the reach of new currency exchange activities to various communities. This was done to ensure that the need for currency was met, especially in remote areas, in terms of amounts, denominations and quality. Due to this collaboration with Bank Indonesia, banks have been able to improve the efficiency of their cash management, especially in terms of currency storage, transportation and handling. Bank Indonesia consistently seeks to ensure banks and currency handling service providers follow its established standards on currency
14 The national iron stock (ISN) is a standby inventory in anticipation of an unexpected
increase in demand for currency due to an unseen event, such as a natural disaster, a
rush on banks or other circumstances. The ISN is set at 20% of projected currency in
circulation (UYD) in the current period. Meanwhile, minimum cash (KM) refers to the
minimum reserves maintained by cash work units at Bank Indonesia headquarters and
all regional representative offices (KPwBI) to meet the demand for cash of each region in
a monthly period. KM is set at an average of 1.5 months of outflow.
15 Interbank currency transactions cover the demand, supply and exchange of currency fit
for circulation (ULE), in order to meet the demand for sufficient amounts of money and/
or types of denominations. Dropshot is a payment policy of currency fit for circulation
(ULE) by which Bank Indonesia applies payments of ULE from un-itemized bank deposits
to the same bank or to another bank located in the same area. The cash is not counted
in detail or sorted by Bank Indonesia, but is directly exchanged, still wrapped in
transparent plastic and sealed with the bank's label.
handling. Bank Indonesia also worked with transport agencies, including PT. Kereta Api Indonesia (KAI), PT. Pelayaran Nasional Indonesia (Pelni) and other private entities, to streamline distribution.
The circulation of 2016 EY currency was further expanded in 2017.16 Since the release of the new currency at the end of 2016, Bank Indonesia has distributed IDR199.7 trillion of 2016 EY currency, consisting of 5.6 billion banknotes with a value of IDR199.1 trillion, and 642.9 million coins with a value of IDR0.6 trillion. Bank Indonesia also made successful efforts to increase public understanding of the new 2016 emission year currency, with a survey conducted across 82 cities/regencies showing that 95.1% of respondents knew about 2016 EY currency.17
Bank Indonesia took several steps under its clean money policy, the second strategy under the availability pillar. The clean money policy is intended to improve the quality of currency in circulation, by sorting and destruction of currency deemed unfit for circulation. Bank Indonesia’s consistent efforts to improve the quality of circulating currency continues to show positive results. A survey conducted in 82 cities/regencies showed improving quality – as reflected by improvements in soil levels – of both large and small denomination currency in the second half of 2017 compared with the same period of 2016 (Table 9.2).18 This positive development demonstrates Bank Indonesia’s commitment to providing currency fit for circulation (ULE) to the public – that is, authentic rupiah currency that meets Bank Indonesia’s quality standards. The provision of good-quality currency is important in maintaining the integrity of the rupiah as a symbol of Indonesian state sovereignty, and is also more convenient in transactions.
16 Bank Indonesia issued simultaneously 11 (eleven) 2016 emission year (EY) rupiah
currency denominations, as launched by the President of the Republic of Indonesia on
19 December 2016.
17 Survey on the fitness level of currency in circulation in 2017 with a total of 4100
respondents.
18 Soil level indicates the physical condition of currency. The soil levels used by Bank
Indonesia range from 1 to 16. Soil level 1 is money that is completely unfit for
circulation, while soil level 16 is perfectly printed new money from Perum Peruri, the
Indonesian state mint. For 2017, Bank Indonesia set a minimum soil level of 8 as the
standard for large currency banknotes to be considered fit for circulation, meaning
banknotes with a soil level of 1 to 7 were considered unfit for circulation. A minimum
soil level of 6 was set for small denominations to be considered fit for circulation,
meaning any of this money with a soil level of 1 to 5 was considered unfit for
circulation.
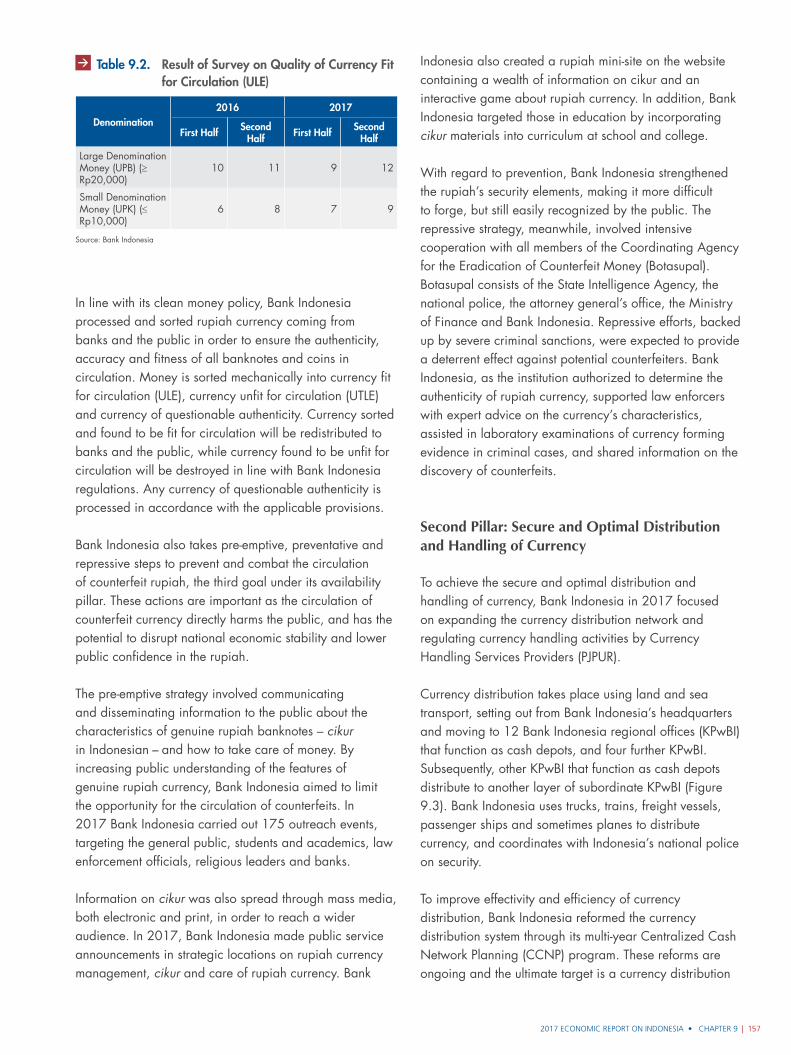
2017 ECONOMIC REPORT ON INDONESIA • CHAPTER 9 | 157
In line with its clean money policy, Bank Indonesia processed and sorted rupiah currency coming from banks and the public in order to ensure the authenticity, accuracy and fitness of all banknotes and coins in circulation. Money is sorted mechanically into currency fit for circulation (ULE), currency unfit for circulation (UTLE) and currency of questionable authenticity. Currency sorted and found to be fit for circulation will be redistributed to banks and the public, while currency found to be unfit for circulation will be destroyed in line with Bank Indonesia regulations. Any currency of questionable authenticity is processed in accordance with the applicable provisions.
Bank Indonesia also takes pre-emptive, preventative and repressive steps to prevent and combat the circulation of counterfeit rupiah, the third goal under its availability pillar. These actions are important as the circulation of counterfeit currency directly harms the public, and has the potential to disrupt national economic stability and lower public confidence in the rupiah.
The pre-emptive strategy involved communicating and disseminating information to the public about the characteristics of genuine rupiah banknotes – cikur in Indonesian – and how to take care of money. By increasing public understanding of the features of genuine rupiah currency, Bank Indonesia aimed to limit the opportunity for the circulation of counterfeits. In 2017 Bank Indonesia carried out 175 outreach events, targeting the general public, students and academics, law enforcement officials, religious leaders and banks.
Information on cikur was also spread through mass media, both electronic and print, in order to reach a wider audience. In 2017, Bank Indonesia made public service announcements in strategic locations on rupiah currency management, cikur and care of rupiah currency. Bank
Indonesia also created a rupiah mini-site on the website containing a wealth of information on cikur and an interactive game about rupiah currency. In addition, Bank Indonesia targeted those in education by incorporating cikur materials into curriculum at school and college.
With regard to prevention, Bank Indonesia strengthened the rupiah’s security elements, making it more difficult to forge, but still easily recognized by the public. The repressive strategy, meanwhile, involved intensive cooperation with all members of the Coordinating Agency for the Eradication of Counterfeit Money (Botasupal). Botasupal consists of the State Intelligence Agency, the national police, the attorney general’s office, the Ministry of Finance and Bank Indonesia. Repressive efforts, backed up by severe criminal sanctions, were expected to provide a deterrent effect against potential counterfeiters. Bank Indonesia, as the institution authorized to determine the authenticity of rupiah currency, supported law enforcers with expert advice on the currency’s characteristics, assisted in laboratory examinations of currency forming evidence in criminal cases, and shared information on the discovery of counterfeits.
Second Pillar: Secure and Optimal Distribution and Handling of Currency
To achieve the secure and optimal distribution and handling of currency, Bank Indonesia in 2017 focused on expanding the currency distribution network and regulating currency handling activities by Currency Handling Services Providers (PJPUR).
Currency distribution takes place using land and sea transport, setting out from Bank Indonesia’s headquarters and moving to 12 Bank Indonesia regional offices (KPwBI) that function as cash depots, and four further KPwBI. Subsequently, other KPwBI that function as cash depots distribute to another layer of subordinate KPwBI (Figure 9.3). Bank Indonesia uses trucks, trains, freight vessels, passenger ships and sometimes planes to distribute currency, and coordinates with Indonesia’s national police on security.
To improve effectivity and efficiency of currency distribution, Bank Indonesia reformed the currency distribution system through its multi-year Centralized Cash Network Planning (CCNP) program. These reforms are ongoing and the ultimate target is a currency distribution
Table 9.2. Result of Survey on Quality of Currency Fit for Circulation (ULE)
Denomination2016 2017
First Half Second Half First Half Second
Half
Large Denomination Money (UPB) (≥ Rp20,000)
10 11 9 12
Small Denomination Money (UPK) (≤ Rp10,000)
6 8 7 9
Source: Bank Indonesia
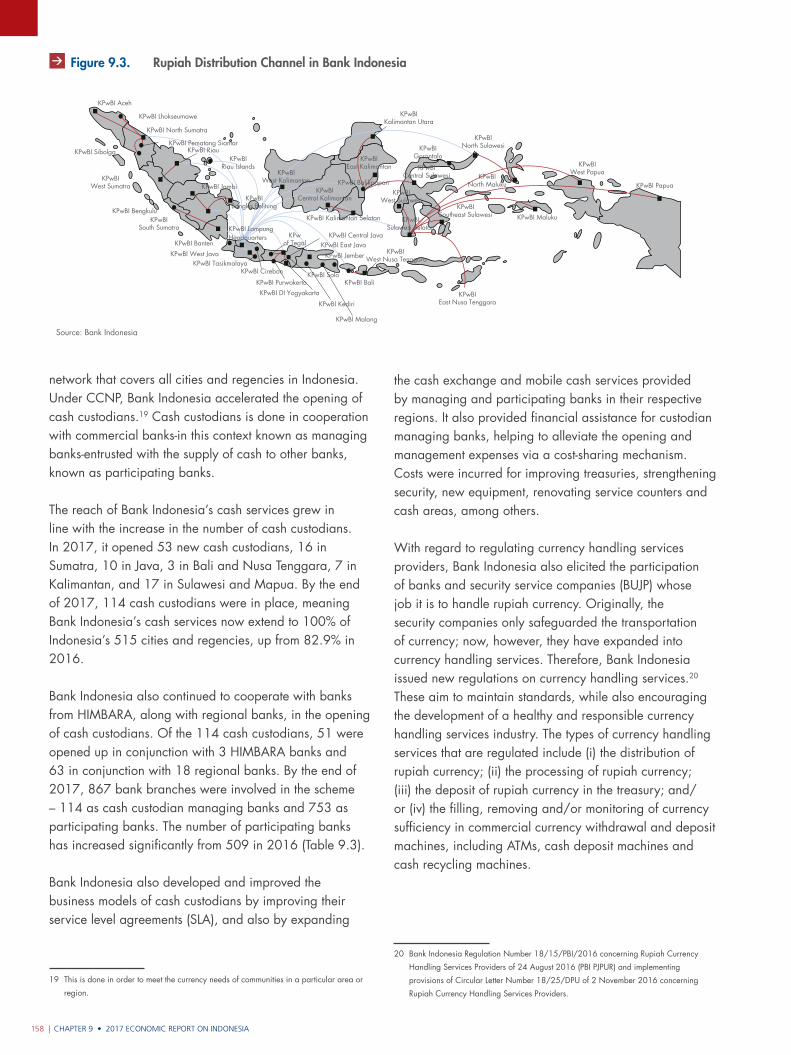
CHAPTER 9 • 2017 ECONOMIC REPORT ON INDONESIA158 |
network that covers all cities and regencies in Indonesia. Under CCNP, Bank Indonesia accelerated the opening of cash custodians.19 Cash custodians is done in cooperation with commercial banks-in this context known as managing banks-entrusted with the supply of cash to other banks, known as participating banks.
The reach of Bank Indonesia’s cash services grew in line with the increase in the number of cash custodians. In 2017, it opened 53 new cash custodians, 16 in Sumatra, 10 in Java, 3 in Bali and Nusa Tenggara, 7 in Kalimantan, and 17 in Sulawesi and Mapua. By the end of 2017, 114 cash custodians were in place, meaning Bank Indonesia’s cash services now extend to 100% of Indonesia’s 515 cities and regencies, up from 82.9% in 2016.
Bank Indonesia also continued to cooperate with banks from HIMBARA, along with regional banks, in the opening of cash custodians. Of the 114 cash custodians, 51 were opened up in conjunction with 3 HIMBARA banks and 63 in conjunction with 18 regional banks. By the end of 2017, 867 bank branches were involved in the scheme – 114 as cash custodian managing banks and 753 as participating banks. The number of participating banks has increased significantly from 509 in 2016 (Table 9.3).
Bank Indonesia also developed and improved the business models of cash custodians by improving their service level agreements (SLA), and also by expanding
19 This is done in order to meet the currency needs of communities in a particular area or
region.
the cash exchange and mobile cash services provided by managing and participating banks in their respective regions. It also provided financial assistance for custodian managing banks, helping to alleviate the opening and management expenses via a cost-sharing mechanism. Costs were incurred for improving treasuries, strengthening security, new equipment, renovating service counters and cash areas, among others.
With regard to regulating currency handling services providers, Bank Indonesia also elicited the participation of banks and security service companies (BUJP) whose job it is to handle rupiah currency. Originally, the security companies only safeguarded the transportation of currency; now, however, they have expanded into currency handling services. Therefore, Bank Indonesia issued new regulations on currency handling services.20 These aim to maintain standards, while also encouraging the development of a healthy and responsible currency handling services industry. The types of currency handling services that are regulated include (i) the distribution of rupiah currency; (ii) the processing of rupiah currency; (iii) the deposit of rupiah currency in the treasury; and/or (iv) the filling, removing and/or monitoring of currency sufficiency in commercial currency withdrawal and deposit machines, including ATMs, cash deposit machines and cash recycling machines.
20 Bank Indonesia Regulation Number 18/15/PBI/2016 concerning Rupiah Currency
Handling Services Providers of 24 August 2016 (PBI PJPUR) and implementing
provisions of Circular Letter Number 18/25/DPU of 2 November 2016 concerning
Rupiah Currency Handling Services Providers.
Source: Bank Indonesia
Gambar 9.10. Jalur distribusi uang rupiah di Bank Indonesia
KPwBI Aceh
KPwBI Lhokseumawe
KPwBI North Sumatra
KPwBI Pematang SiantarKPwBI Riau
KPwBIRiau Islands
KPwBIBangka Belitung
KPwBIWest Kalimantan
KPwBICentral Kalimantan
KPwBIGorontalo
KPwBICentral Sulawesi
KPwBINorth Sulawesi
KPwBISulawesi Selatan
KPwBIWest Sulawesi
KPwBI Southeast Sulawesi KPwBI Maluku
KPwBINorth Maluku
KPwBIWest Papua
KPwBI Papua
KPwBIEast Kalimantan
KPwBIKalimantan Utara
KPwBI Balikpapan
KPwBI Kalimantan Selatan
KPwBI LampungHeadquarters
KPwBI Banten
KPwBI West JavaKPwBI Tasikmalaya
KPwBI Cirebon
KPwBI Purwokerto
KPwBI Central JavaKPwof Tegal KPwBI East Java
KPwBI Jember
KPwBI DI Yogyakarta
KPwBI Kediri
KPwBI Solo
KPwBI Malang
KPwBI Bali
KPwBI West Nusa Tenggara
KPwBIEast Nusa Tenggara
KPwBI Sibolga
KPwBIWest Sumatra
KPwBI BengkuluKPwBI
South Sumatra
KPwBI Jambi
Figure 9.3. Rupiah Distribution Channel in Bank Indonesia
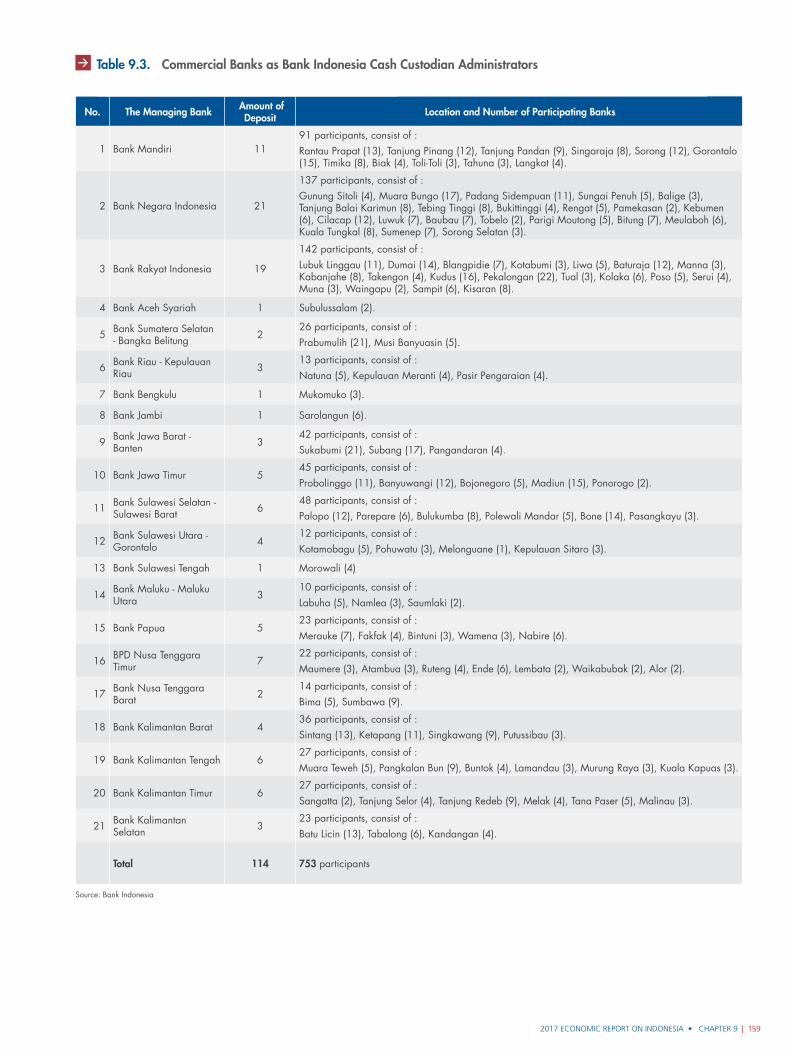
2017 ECONOMIC REPORT ON INDONESIA • CHAPTER 9 | 159
No. The Managing Bank Amount of Deposit Location and Number of Participating Banks
1 Bank Mandiri 1191 participants, consist of : Rantau Prapat (13), Tanjung Pinang (12), Tanjung Pandan (9), Singaraja (8), Sorong (12), Gorontalo (15), Timika (8), Biak (4), Toli-Toli (3), Tahuna (3), Langkat (4).
2 Bank Negara Indonesia 21
137 participants, consist of : Gunung Sitoli (4), Muara Bungo (17), Padang Sidempuan (11), Sungai Penuh (5), Balige (3), Tanjung Balai Karimun (8), Tebing Tinggi (8), Bukittinggi (4), Rengat (5), Pamekasan (2), Kebumen (6), Cilacap (12), Luwuk (7), Baubau (7), Tobelo (2), Parigi Moutong (5), Bitung (7), Meulaboh (6), Kuala Tungkal (8), Sumenep (7), Sorong Selatan (3).
3 Bank Rakyat Indonesia 19
142 participants, consist of : Lubuk Linggau (11), Dumai (14), Blangpidie (7), Kotabumi (3), Liwa (5), Baturaja (12), Manna (3), Kabanjahe (8), Takengon (4), Kudus (16), Pekalongan (22), Tual (3), Kolaka (6), Poso (5), Serui (4), Muna (3), Waingapu (2), Sampit (6), Kisaran (8).
4 Bank Aceh Syariah 1 Subulussalam (2).
5 Bank Sumatera Selatan - Bangka Belitung 2
26 participants, consist of : Prabumulih (21), Musi Banyuasin (5).
6 Bank Riau - Kepulauan Riau 3
13 participants, consist of : Natuna (5), Kepulauan Meranti (4), Pasir Pengaraian (4).
7 Bank Bengkulu 1 Mukomuko (3).
8 Bank Jambi 1 Sarolangun (6).
9 Bank Jawa Barat - Banten 3
42 participants, consist of : Sukabumi (21), Subang (17), Pangandaran (4).
10 Bank Jawa Timur 545 participants, consist of : Probolinggo (11), Banyuwangi (12), Bojonegoro (5), Madiun (15), Ponorogo (2).
11 Bank Sulawesi Selatan - Sulawesi Barat 6
48 participants, consist of : Palopo (12), Parepare (6), Bulukumba (8), Polewali Mandar (5), Bone (14), Pasangkayu (3).
12 Bank Sulawesi Utara - Gorontalo 4
12 participants, consist of : Kotamobagu (5), Pohuwatu (3), Melonguane (1), Kepulauan Sitaro (3).
13 Bank Sulawesi Tengah 1 Morowali (4)
14 Bank Maluku - Maluku Utara 3
10 participants, consist of : Labuha (5), Namlea (3), Saumlaki (2).
15 Bank Papua 523 participants, consist of : Merauke (7), Fakfak (4), Bintuni (3), Wamena (3), Nabire (6).
16 BPD Nusa Tenggara Timur 7
22 participants, consist of : Maumere (3), Atambua (3), Ruteng (4), Ende (6), Lembata (2), Waikabubak (2), Alor (2).
17 Bank Nusa Tenggara Barat 2
14 participants, consist of : Bima (5), Sumbawa (9).
18 Bank Kalimantan Barat 436 participants, consist of : Sintang (13), Ketapang (11), Singkawang (9), Putussibau (3).
19 Bank Kalimantan Tengah 627 participants, consist of : Muara Teweh (5), Pangkalan Bun (9), Buntok (4), Lamandau (3), Murung Raya (3), Kuala Kapuas (3).
20 Bank Kalimantan Timur 627 participants, consist of : Sangatta (2), Tanjung Selor (4), Tanjung Redeb (9), Melak (4), Tana Paser (5), Malinau (3).
21 Bank Kalimantan Selatan 3
23 participants, consist of : Batu Licin (13), Tabalong (6), Kandangan (4).
Total 114 753 participants
Source: Bank Indonesia
Table 9.3. Commercial Banks as Bank Indonesia Cash Custodian Administrators
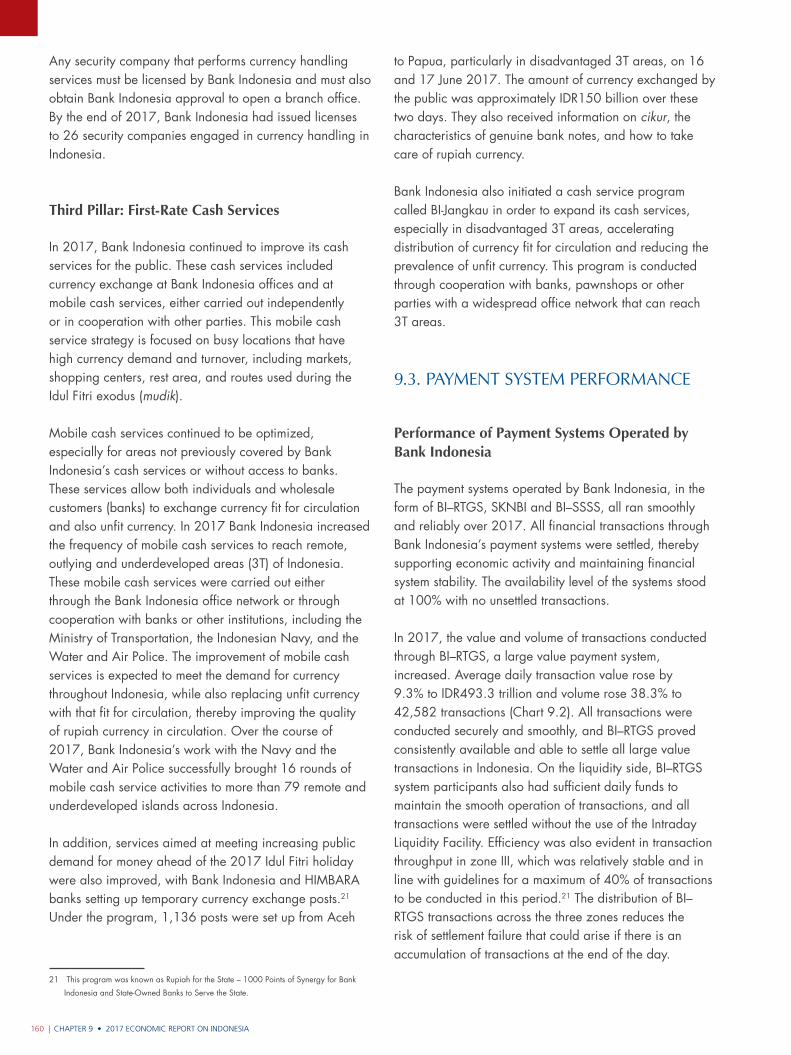
CHAPTER 9 • 2017 ECONOMIC REPORT ON INDONESIA160 |
Any security company that performs currency handling services must be licensed by Bank Indonesia and must also obtain Bank Indonesia approval to open a branch office. By the end of 2017, Bank Indonesia had issued licenses to 26 security companies engaged in currency handling in Indonesia.
Third Pillar: First-Rate Cash Services
In 2017, Bank Indonesia continued to improve its cash services for the public. These cash services included currency exchange at Bank Indonesia offices and at mobile cash services, either carried out independently or in cooperation with other parties. This mobile cash service strategy is focused on busy locations that have high currency demand and turnover, including markets, shopping centers, rest area, and routes used during the Idul Fitri exodus (mudik).
Mobile cash services continued to be optimized, especially for areas not previously covered by Bank Indonesia’s cash services or without access to banks. These services allow both individuals and wholesale customers (banks) to exchange currency fit for circulation and also unfit currency. In 2017 Bank Indonesia increased the frequency of mobile cash services to reach remote, outlying and underdeveloped areas (3T) of Indonesia. These mobile cash services were carried out either through the Bank Indonesia office network or through cooperation with banks or other institutions, including the Ministry of Transportation, the Indonesian Navy, and the Water and Air Police. The improvement of mobile cash services is expected to meet the demand for currency throughout Indonesia, while also replacing unfit currency with that fit for circulation, thereby improving the quality of rupiah currency in circulation. Over the course of 2017, Bank Indonesia’s work with the Navy and the Water and Air Police successfully brought 16 rounds of mobile cash service activities to more than 79 remote and underdeveloped islands across Indonesia.
In addition, services aimed at meeting increasing public demand for money ahead of the 2017 Idul Fitri holiday were also improved, with Bank Indonesia and HIMBARA banks setting up temporary currency exchange posts.21 Under the program, 1,136 posts were set up from Aceh
21 This program was known as Rupiah for the State – 1000 Points of Synergy for Bank
Indonesia and State-Owned Banks to Serve the State.
to Papua, particularly in disadvantaged 3T areas, on 16 and 17 June 2017. The amount of currency exchanged by the public was approximately IDR150 billion over these two days. They also received information on cikur, the characteristics of genuine bank notes, and how to take care of rupiah currency.
Bank Indonesia also initiated a cash service program called BI-Jangkau in order to expand its cash services, especially in disadvantaged 3T areas, accelerating distribution of currency fit for circulation and reducing the prevalence of unfit currency. This program is conducted through cooperation with banks, pawnshops or other parties with a widespread office network that can reach 3T areas.
9.3. PaymeNt system PerformaNce
Performance of Payment Systems Operated by Bank Indonesia
The payment systems operated by Bank Indonesia, in the form of BI–RTGS, SKNBI and BI–SSSS, all ran smoothly and reliably over 2017. All financial transactions through Bank Indonesia’s payment systems were settled, thereby supporting economic activity and maintaining financial system stability. The availability level of the systems stood at 100% with no unsettled transactions.
In 2017, the value and volume of transactions conducted through BI–RTGS, a large value payment system, increased. Average daily transaction value rose by 9.3% to IDR493.3 trillion and volume rose 38.3% to 42,582 transactions (Chart 9.2). All transactions were conducted securely and smoothly, and BI–RTGS proved consistently available and able to settle all large value transactions in Indonesia. On the liquidity side, BI–RTGS system participants also had sufficient daily funds to maintain the smooth operation of transactions, and all transactions were settled without the use of the Intraday Liquidity Facility. Efficiency was also evident in transaction throughput in zone III, which was relatively stable and in line with guidelines for a maximum of 40% of transactions to be conducted in this period.21 The distribution of BI–RTGS transactions across the three zones reduces the risk of settlement failure that could arise if there is an accumulation of transactions at the end of the day.
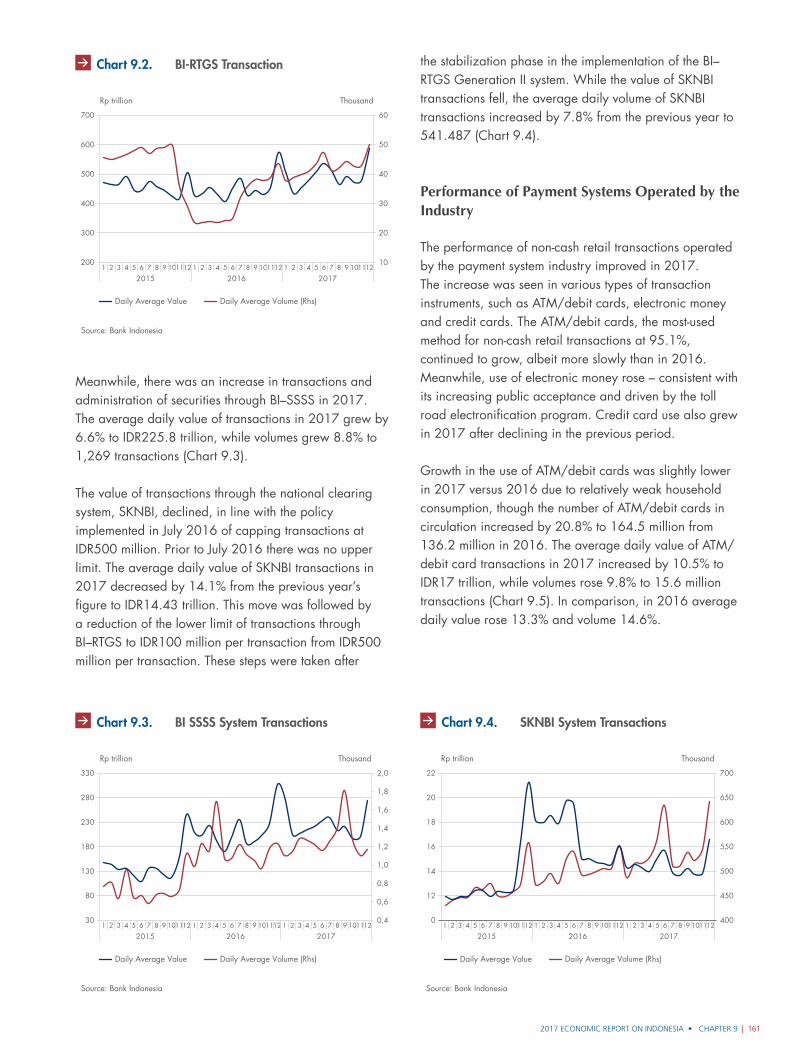
2017 ECONOMIC REPORT ON INDONESIA • CHAPTER 9 | 161
Meanwhile, there was an increase in transactions and administration of securities through BI–SSSS in 2017. The average daily value of transactions in 2017 grew by 6.6% to IDR225.8 trillion, while volumes grew 8.8% to 1,269 transactions (Chart 9.3).
The value of transactions through the national clearing system, SKNBI, declined, in line with the policy implemented in July 2016 of capping transactions at IDR500 million. Prior to July 2016 there was no upper limit. The average daily value of SKNBI transactions in 2017 decreased by 14.1% from the previous year’s figure to IDR14.43 trillion. This move was followed by a reduction of the lower limit of transactions through BI–RTGS to IDR100 million per transaction from IDR500 million per transaction. These steps were taken after
the stabilization phase in the implementation of the BI–RTGS Generation II system. While the value of SKNBI transactions fell, the average daily volume of SKNBI transactions increased by 7.8% from the previous year to 541.487 (Chart 9.4).
Performance of Payment Systems Operated by the Industry
The performance of non-cash retail transactions operated by the payment system industry improved in 2017. The increase was seen in various types of transaction instruments, such as ATM/debit cards, electronic money and credit cards. The ATM/debit cards, the most-used method for non-cash retail transactions at 95.1%, continued to grow, albeit more slowly than in 2016. Meanwhile, use of electronic money rose – consistent with its increasing public acceptance and driven by the toll road electronification program. Credit card use also grew in 2017 after declining in the previous period.
Growth in the use of ATM/debit cards was slightly lower in 2017 versus 2016 due to relatively weak household consumption, though the number of ATM/debit cards in circulation increased by 20.8% to 164.5 million from 136.2 million in 2016. The average daily value of ATM/debit card transactions in 2017 increased by 10.5% to IDR17 trillion, while volumes rose 9.8% to 15.6 million transactions (Chart 9.5). In comparison, in 2016 average daily value rose 13.3% and volume 14.6%.
10
20
30
40
50
60
1 2 3 4
20155 9 1011126 7 8 1 2 3 4
20165 9 1011126 7 8 1 2 3 4
20175 9 1011126 7 8
Source: Bank Indonesia
Grafik 9.2. Perkembangan Transaksi BI-RTGS
200
300
400
500
700
600
Rp trillion Thousand
Daily Average Value Daily Average Volume (Rhs)
Chart 9.2. BI-RTGS Transaction
0,4
0,6
0,8
1,8
1,6
1,4
1,2
1,0
2,0
1 2 3 4
20155 9 1011126 7 8 1 2 3 4
20165 9 1011126 7 8 1 2 3 4
20175 9 1011126 7 8
Source: Bank Indonesia
Gra�k 9.3. Perkembangan Transaksi BI-SSSS
30
80
130
180
230
280
330
Rp trillion Thousand
Daily Average Value Daily Average Volume (Rhs)
Chart 9.3. BI SSSS System Transactions
1 2 3 4
20155 9 1011126 7 8 1 2 3 4
20165 9 1011126 7 8 1 2 3 4
20175 9 1011126 7 8
450
400
500
550
600
650
700
Source: Bank Indonesia
Gra�k 9.4. Perkembangan Transaksi SKNBI
Rp trillion Thousand
0
12
14
16
20
18
22
Daily Average Value Daily Average Volume (Rhs)
Chart 9.4. SKNBI System Transactions
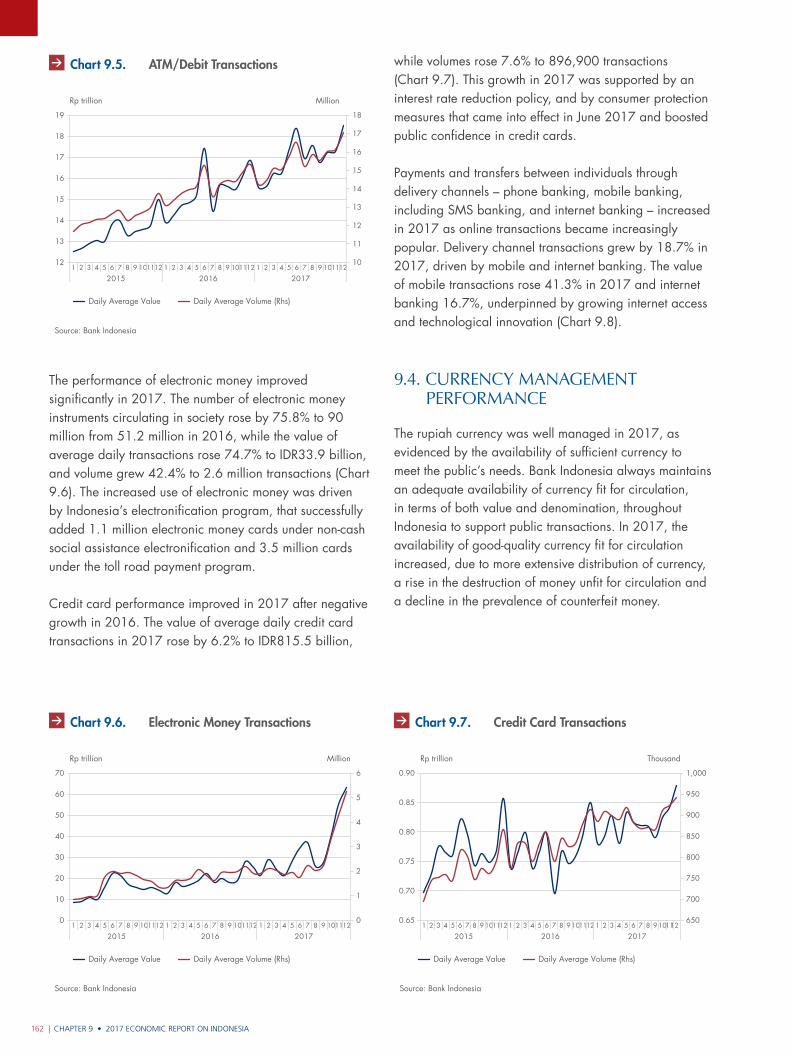
CHAPTER 9 • 2017 ECONOMIC REPORT ON INDONESIA162 |
The performance of electronic money improved significantly in 2017. The number of electronic money instruments circulating in society rose by 75.8% to 90 million from 51.2 million in 2016, while the value of average daily transactions rose 74.7% to IDR33.9 billion, and volume grew 42.4% to 2.6 million transactions (Chart 9.6). The increased use of electronic money was driven by Indonesia’s electronification program, that successfully added 1.1 million electronic money cards under non-cash social assistance electronification and 3.5 million cards under the toll road payment program.
Credit card performance improved in 2017 after negative growth in 2016. The value of average daily credit card transactions in 2017 rose by 6.2% to IDR815.5 billion,
while volumes rose 7.6% to 896,900 transactions (Chart 9.7). This growth in 2017 was supported by an interest rate reduction policy, and by consumer protection measures that came into effect in June 2017 and boosted public confidence in credit cards.
Payments and transfers between individuals through delivery channels – phone banking, mobile banking, including SMS banking, and internet banking – increased in 2017 as online transactions became increasingly popular. Delivery channel transactions grew by 18.7% in 2017, driven by mobile and internet banking. The value of mobile transactions rose 41.3% in 2017 and internet banking 16.7%, underpinned by growing internet access and technological innovation (Chart 9.8).
9.4. curreNcy maNagemeNt PerformaNce
The rupiah currency was well managed in 2017, as evidenced by the availability of sufficient currency to meet the public’s needs. Bank Indonesia always maintains an adequate availability of currency fit for circulation, in terms of both value and denomination, throughout Indonesia to support public transactions. In 2017, the availability of good-quality currency fit for circulation increased, due to more extensive distribution of currency, a rise in the destruction of money unfit for circulation and a decline in the prevalence of counterfeit money.
1 2 3 4
20155 9 1011126 7 8 1 2 3 4
20165 9 1011126 7 8 1 2 3 4
20175 9 1011126 7 8
10
11
12
13
14
15
16
17
18
Source: Bank Indonesia
Gra�k 9.5. Perkembangan Transaksi RRH ATM/Debit
Rp trillion Million
12
14
13
15
16
18
17
19
Daily Average Value Daily Average Volume (Rhs)
Chart 9.5. ATM/Debit Transactions
1 2 3 4
20155 9 1011126 7 8 1 2 3 4
20165 9 1011126 7 8 1 2 3 4
20175 9 1011126 7 8
0
1
2
3
5
4
6
Source: Bank Indonesia
Gra�k 9.6. Perkembangan Transaksi RRH Uang Elektronik
Rp trillion Million
0
20
10
30
40
60
50
70
Daily Average Value Daily Average Volume (Rhs)
Chart 9.6. Electronic Money Transactions
1 2 3 4
20155 9 1011126 7 8 1 2 3 4
20165 9 1011126 7 8 1 2 3 4
20175 9 1011126 7 8
650
700
750
800
850
950
900
1,000
Source: Bank Indonesia
Gra�k 9.7. Perkembangan Transaksi RRH Kartu Kredit
Rp trillion Thousand
0.65
0.85
0.90
0.75
0.80
0.70
Daily Average Value Daily Average Volume (Rhs)
Chart 9.7. Credit Card Transactions
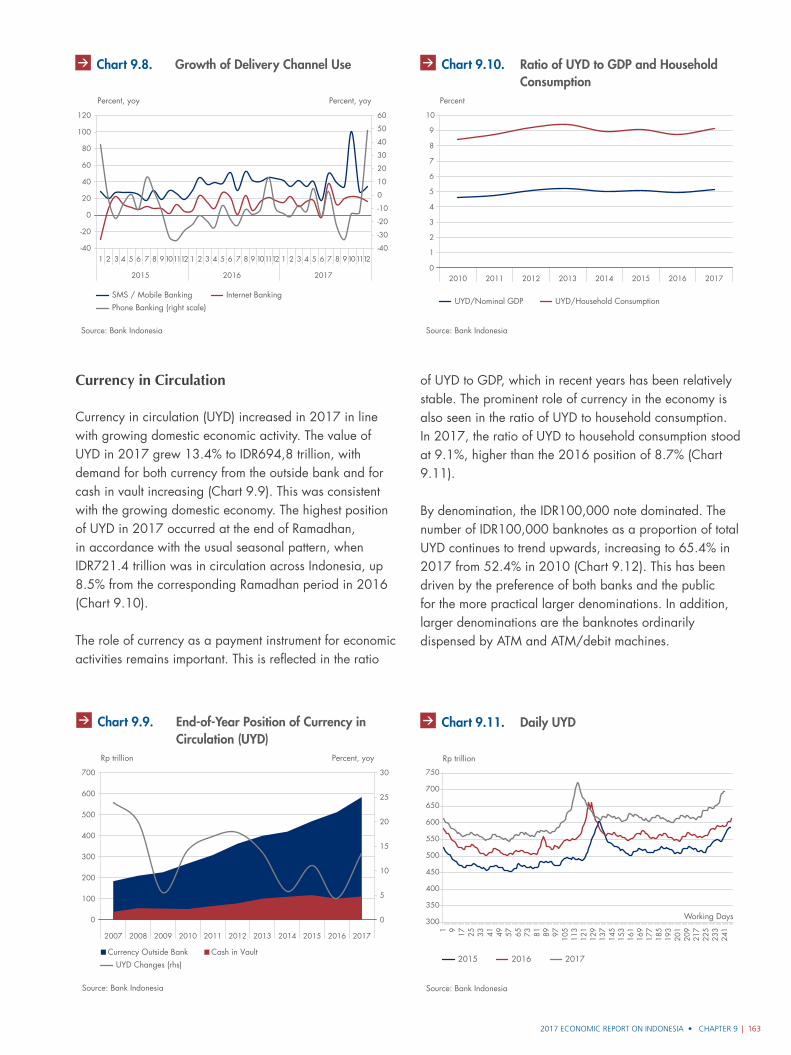
2017 ECONOMIC REPORT ON INDONESIA • CHAPTER 9 | 163
Currency in Circulation
Currency in circulation (UYD) increased in 2017 in line with growing domestic economic activity. The value of UYD in 2017 grew 13.4% to IDR694,8 trillion, with demand for both currency from the outside bank and for cash in vault increasing (Chart 9.9). This was consistent with the growing domestic economy. The highest position of UYD in 2017 occurred at the end of Ramadhan, in accordance with the usual seasonal pattern, when IDR721.4 trillion was in circulation across Indonesia, up 8.5% from the corresponding Ramadhan period in 2016 (Chart 9.10).
The role of currency as a payment instrument for economic activities remains important. This is reflected in the ratio
of UYD to GDP, which in recent years has been relatively stable. The prominent role of currency in the economy is also seen in the ratio of UYD to household consumption. In 2017, the ratio of UYD to household consumption stood at 9.1%, higher than the 2016 position of 8.7% (Chart 9.11).
By denomination, the IDR100,000 note dominated. The number of IDR100,000 banknotes as a proportion of total UYD continues to trend upwards, increasing to 65.4% in 2017 from 52.4% in 2010 (Chart 9.12). This has been driven by the preference of both banks and the public for the more practical larger denominations. In addition, larger denominations are the banknotes ordinarily dispensed by ATM and ATM/debit machines.
Source: Bank Indonesia
Grafik 7.16. Lorem Ipsum
Percent, yoy Percent, yoy
Phone Banking (right scale)SMS / Mobile Banking Internet Banking
-40
-20
0
20
40
60
80
100
120
1 2 3 4 5 6 7 8 9101112 1 2 3 4 5 6 7 8 9 101112 1011121 2 3 4 5 6 7 8 9
2015 2016 2017
-40
-10
-20
-30
0
10
20
30
40
50
60
Chart 9.8. Growth of Delivery Channel Use
2007 2008 2009 2010 2011 2012 2013 2014 2015 2016 2017
0
5
10
15
20
25
30
Source: Bank Indonesia
Grafik 9.11. Posisi UYD Akhir Tahun
0
100
200
300
400
500
700
600
Rp trillion Percent, yoy
Currency Outside Bank Cash in VaultUYD Changes (rhs)
Chart 9.9. End-of-Year Position of Currency in Circulation (UYD)
Grafik 9.13. Rasio UYD terhadap PDB dan Konsumsi Rumah Tangga
Source: Bank Indonesia
0
1
2
3
4
5
6
7
8
9
10
2010 2011 2012 2013 2014 2015 2016 2017
Percent
UYD/Nominal GDP UYD/Household Consumption
Chart 9.10. Ratio of UYD to GDP and Household Consumption
Grafik 9.12. Perkembangan UYD Harian
Source: Bank Indonesia
300
350
400
450
500
550
600
650
700
750
1 9 17 25 33 41 49 57 65 73 81 89 97 105
113
121
129
137
145
153
161
169
177
185
193
201
209
217
225
233
241
Rp trillion
2015 2016 2017
Working Days
Chart 9.11. Daily UYD
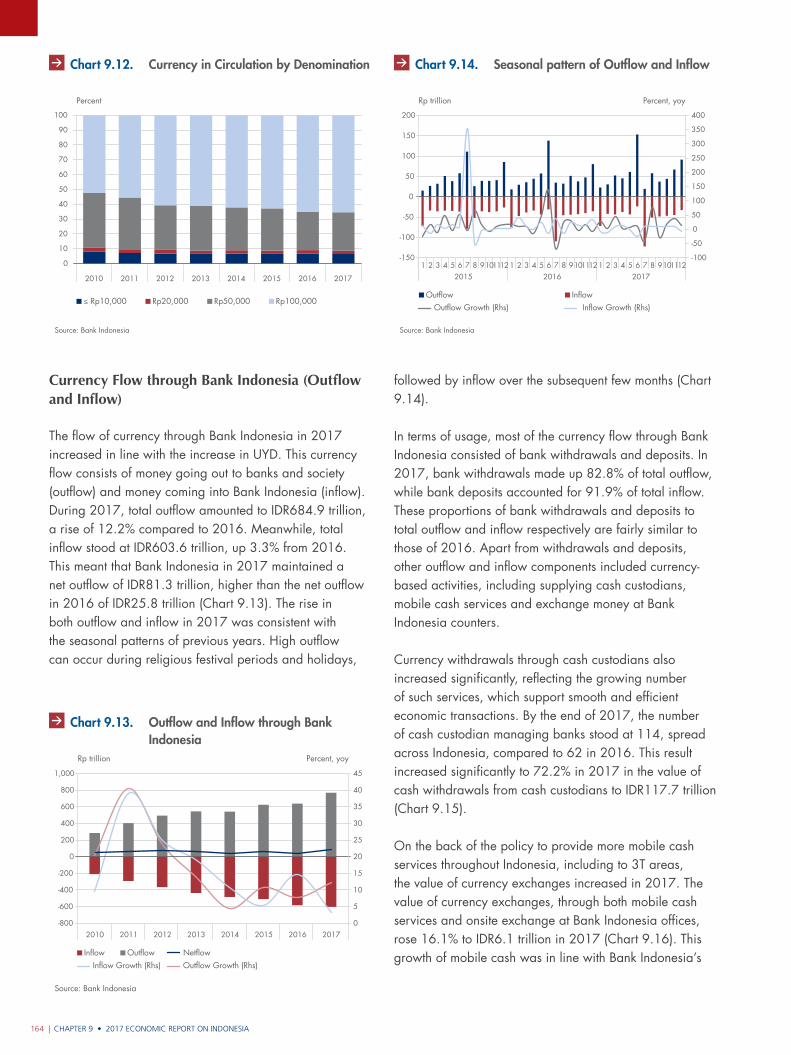
CHAPTER 9 • 2017 ECONOMIC REPORT ON INDONESIA164 |
Currency Flow through Bank Indonesia (Outflow and Inflow)
The flow of currency through Bank Indonesia in 2017 increased in line with the increase in UYD. This currency flow consists of money going out to banks and society (outflow) and money coming into Bank Indonesia (inflow). During 2017, total outflow amounted to IDR684.9 trillion, a rise of 12.2% compared to 2016. Meanwhile, total inflow stood at IDR603.6 trillion, up 3.3% from 2016. This meant that Bank Indonesia in 2017 maintained a net outflow of IDR81.3 trillion, higher than the net outflow in 2016 of IDR25.8 trillion (Chart 9.13). The rise in both outflow and inflow in 2017 was consistent with the seasonal patterns of previous years. High outflow can occur during religious festival periods and holidays,
followed by inflow over the subsequent few months (Chart 9.14).
In terms of usage, most of the currency flow through Bank Indonesia consisted of bank withdrawals and deposits. In 2017, bank withdrawals made up 82.8% of total outflow, while bank deposits accounted for 91.9% of total inflow. These proportions of bank withdrawals and deposits to total outflow and inflow respectively are fairly similar to those of 2016. Apart from withdrawals and deposits, other outflow and inflow components included currency-based activities, including supplying cash custodians, mobile cash services and exchange money at Bank Indonesia counters.
Currency withdrawals through cash custodians also increased significantly, reflecting the growing number of such services, which support smooth and efficient economic transactions. By the end of 2017, the number of cash custodian managing banks stood at 114, spread across Indonesia, compared to 62 in 2016. This result increased significantly to 72.2% in 2017 in the value of cash withdrawals from cash custodians to IDR117.7 trillion (Chart 9.15).
On the back of the policy to provide more mobile cash services throughout Indonesia, including to 3T areas, the value of currency exchanges increased in 2017. The value of currency exchanges, through both mobile cash services and onsite exchange at Bank Indonesia offices, rose 16.1% to IDR6.1 trillion in 2017 (Chart 9.16). This growth of mobile cash was in line with Bank Indonesia’s
Grafik 9.15. Pangsa UYD Berdasarkan Denominasi
Source: Bank Indonesia
0
10
20
30
40
50
60
70
80
90
100
2010 2011 2012 2013 2014 2015 2016 2017
Percent
≤ Rp10,000 Rp20,000 Rp50,000 Rp100,000
Chart 9.12. Currency in Circulation by Denomination
Grafik 9.16. Aliran Uang Kartal melalui Bank Indonesia
Source: Bank Indonesia
0
5
10
15
20
25
30
35
40
45
-800
-600
-400
-200
0
200
400
600
800
1,000
2010 2011 2012 2013 2014 2015 2016 2017
Percent, yoyRp trillion
Inflow OutflowInflow Growth (Rhs) Outflow Growth (Rhs)
Netflow
Chart 9.13. Outflow and Inflow through Bank Indonesia
Grafik 9.17. Pola Musiman Aliran Uang Kartal melalui Bank Indonesia
Source: Bank Indonesia
-100
-50
0
50
100
150
200
250
300
350
400
-150
-100
-50
0
50
100
150
200
1 2 3 4 5 6 7 8 91011121 2 3 4 5 6 7 8 91011121 2 3 4 5 6 7 8 91011122015 2016 2017
Percent, yoyRp trillion
Outflow InflowOutflow Growth (Rhs) Inflow Growth (Rhs)
Chart 9.14. Seasonal pattern of Outflow and Inflow
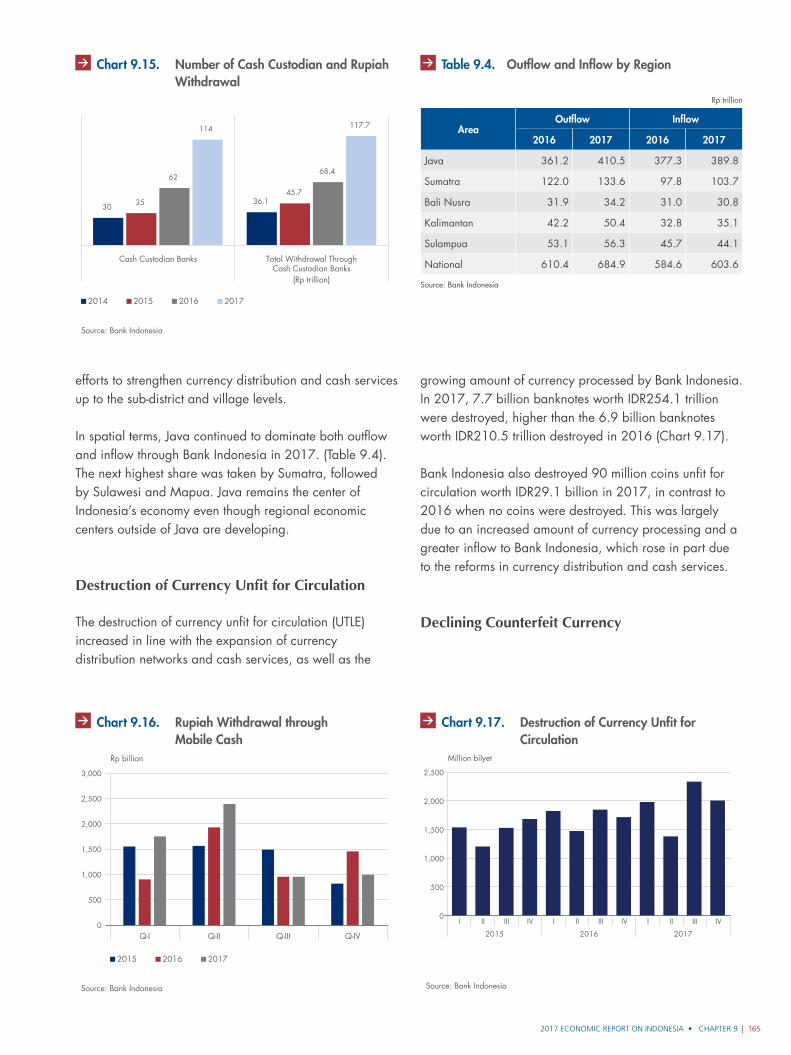
2017 ECONOMIC REPORT ON INDONESIA • CHAPTER 9 | 165
efforts to strengthen currency distribution and cash services up to the sub-district and village levels.
In spatial terms, Java continued to dominate both outflow and inflow through Bank Indonesia in 2017. (Table 9.4). The next highest share was taken by Sumatra, followed by Sulawesi and Mapua. Java remains the center of Indonesia’s economy even though regional economic centers outside of Java are developing.
Destruction of Currency Unfit for Circulation
The destruction of currency unfit for circulation (UTLE) increased in line with the expansion of currency distribution networks and cash services, as well as the
growing amount of currency processed by Bank Indonesia. In 2017, 7.7 billion banknotes worth IDR254.1 trillion were destroyed, higher than the 6.9 billion banknotes worth IDR210.5 trillion destroyed in 2016 (Chart 9.17).
Bank Indonesia also destroyed 90 million coins unfit for circulation worth IDR29.1 billion in 2017, in contrast to 2016 when no coins were destroyed. This was largely due to an increased amount of currency processing and a greater inflow to Bank Indonesia, which rose in part due to the reforms in currency distribution and cash services.
Declining Counterfeit Currency
Grafik 9.18. Jumlah dan Penarikan Uang Kartal melalui Kas Titipan
Source: Bank Indonesia
3036.1 35
45.7
6268.4
114 117.7
Cash Custodian Banks Total Withdrawal ThroughCash Custodian Banks
(Rp trillion)
2014 2015 2016 2017
Chart 9.15. Number of Cash Custodian and Rupiah Withdrawal
Grafik 9.19. Jumlah Nominal Penukaran Uang melalui Kas Keliling
Source: Bank Indonesia
0
500
1,000
1,500
2,000
2,500
3,000
Q-I Q-II Q-III Q-IV
Rp billion
2015 2016 2017
Chart 9.16. Rupiah Withdrawal through Mobile Cash
Table 9.4. Outflow and Inflow by Region
Rp trillion
AreaOutflow Inflow
2016 2017 2016 2017
Java 361.2 410.5 377.3 389.8
Sumatra 122.0 133.6 97.8 103.7
Bali Nusra 31.9 34.2 31.0 30.8
Kalimantan 42.2 50.4 32.8 35.1
Sulampua 53.1 56.3 45.7 44.1
National 610.4 684.9 584.6 603.6
Source: Bank Indonesia
Gra�k 9.1. Lorem Ipsum
Source: Bank Indonesia
0
500
1,000
1,500
2,000
2,500
I II III IV
2015 2016 2017
I II III IV I II III IV
Million bilyet
Chart 9.17. Destruction of Currency Unfit for Circulation
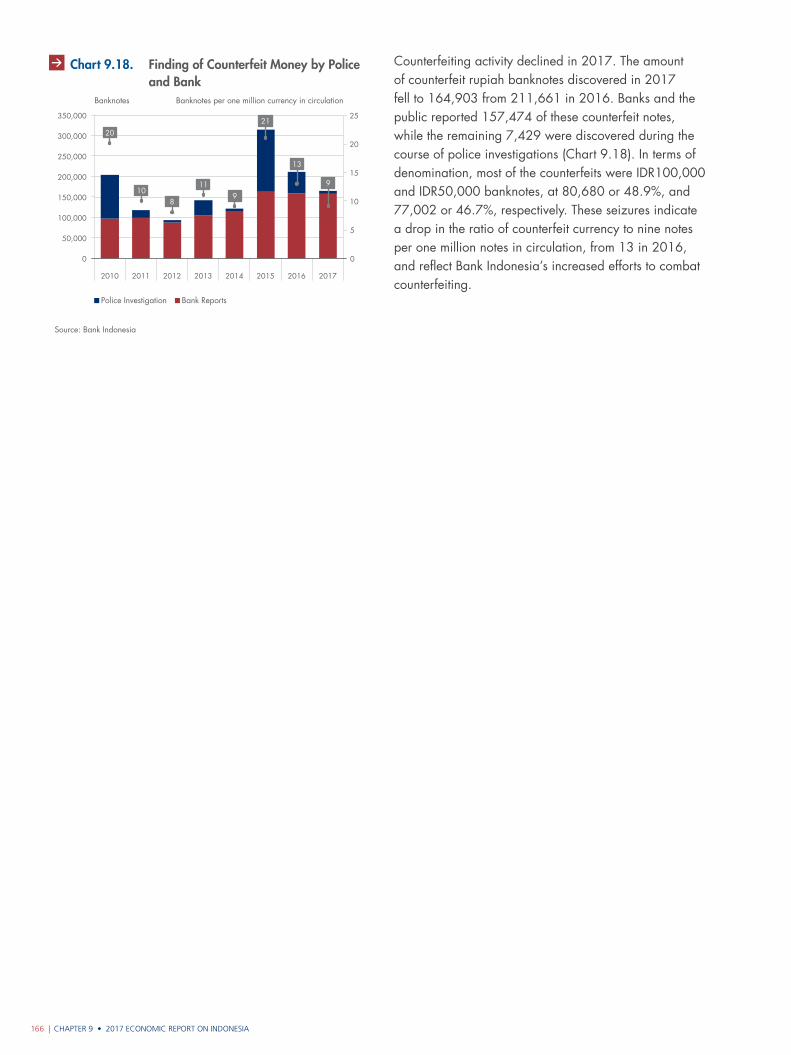
CHAPTER 9 • 2017 ECONOMIC REPORT ON INDONESIA166 |
Counterfeiting activity declined in 2017. The amount of counterfeit rupiah banknotes discovered in 2017 fell to 164,903 from 211,661 in 2016. Banks and the public reported 157,474 of these counterfeit notes, while the remaining 7,429 were discovered during the course of police investigations (Chart 9.18). In terms of denomination, most of the counterfeits were IDR100,000 and IDR50,000 banknotes, at 80,680 or 48.9%, and 77,002 or 46.7%, respectively. These seizures indicate a drop in the ratio of counterfeit currency to nine notes per one million notes in circulation, from 13 in 2016, and reflect Bank Indonesia’s increased efforts to combat counterfeiting.
Grafik 9.1. Lorem Ipsum
Source: Bank Indonesia
Banknotes Banknotes per one million currency in circulation
Police Investigation Bank Reports
11
0
5
10
15
20
25
0
50,000
100,000
150,000
200,000
250,000
300,000
350,000
2010 2011 2012 2013 2014 2015 2016 2017
20
8
21
13
910
9
Chart 9.18. Finding of Counterfeit Money by Police and Bank
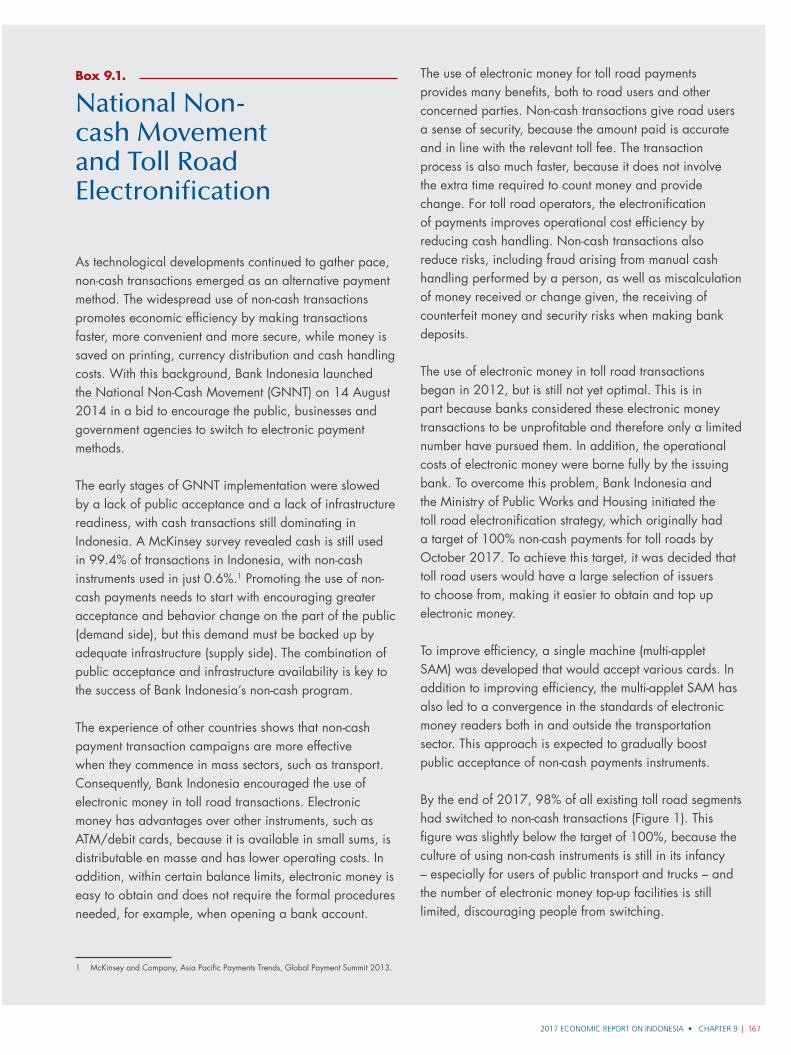
2017 ECONOMIC REPORT ON INDONESIA • CHAPTER 9 | 167
As technological developments continued to gather pace, non-cash transactions emerged as an alternative payment method. The widespread use of non-cash transactions promotes economic efficiency by making transactions faster, more convenient and more secure, while money is saved on printing, currency distribution and cash handling costs. With this background, Bank Indonesia launched the National Non-Cash Movement (GNNT) on 14 August 2014 in a bid to encourage the public, businesses and government agencies to switch to electronic payment methods.
The early stages of GNNT implementation were slowed by a lack of public acceptance and a lack of infrastructure readiness, with cash transactions still dominating in Indonesia. A McKinsey survey revealed cash is still used in 99.4% of transactions in Indonesia, with non-cash instruments used in just 0.6%.1 Promoting the use of non-cash payments needs to start with encouraging greater acceptance and behavior change on the part of the public (demand side), but this demand must be backed up by adequate infrastructure (supply side). The combination of public acceptance and infrastructure availability is key to the success of Bank Indonesia’s non-cash program.
The experience of other countries shows that non-cash payment transaction campaigns are more effective when they commence in mass sectors, such as transport. Consequently, Bank Indonesia encouraged the use of electronic money in toll road transactions. Electronic money has advantages over other instruments, such as ATM/debit cards, because it is available in small sums, is distributable en masse and has lower operating costs. In addition, within certain balance limits, electronic money is easy to obtain and does not require the formal procedures needed, for example, when opening a bank account.
1 McKinsey and Company, Asia Pacific Payments Trends, Global Payment Summit 2013.
Box 9.1.
National Non-cash Movement and Toll Road Electronification
The use of electronic money for toll road payments provides many benefits, both to road users and other concerned parties. Non-cash transactions give road users a sense of security, because the amount paid is accurate and in line with the relevant toll fee. The transaction process is also much faster, because it does not involve the extra time required to count money and provide change. For toll road operators, the electronification of payments improves operational cost efficiency by reducing cash handling. Non-cash transactions also reduce risks, including fraud arising from manual cash handling performed by a person, as well as miscalculation of money received or change given, the receiving of counterfeit money and security risks when making bank deposits.
The use of electronic money in toll road transactions began in 2012, but is still not yet optimal. This is in part because banks considered these electronic money transactions to be unprofitable and therefore only a limited number have pursued them. In addition, the operational costs of electronic money were borne fully by the issuing bank. To overcome this problem, Bank Indonesia and the Ministry of Public Works and Housing initiated the toll road electronification strategy, which originally had a target of 100% non-cash payments for toll roads by October 2017. To achieve this target, it was decided that toll road users would have a large selection of issuers to choose from, making it easier to obtain and top up electronic money.
To improve efficiency, a single machine (multi-applet SAM) was developed that would accept various cards. In addition to improving efficiency, the multi-applet SAM has also led to a convergence in the standards of electronic money readers both in and outside the transportation sector. This approach is expected to gradually boost public acceptance of non-cash payments instruments.
By the end of 2017, 98% of all existing toll road segments had switched to non-cash transactions (Figure 1). This figure was slightly below the target of 100%, because the culture of using non-cash instruments is still in its infancy – especially for users of public transport and trucks – and the number of electronic money top-up facilities is still limited, discouraging people from switching.
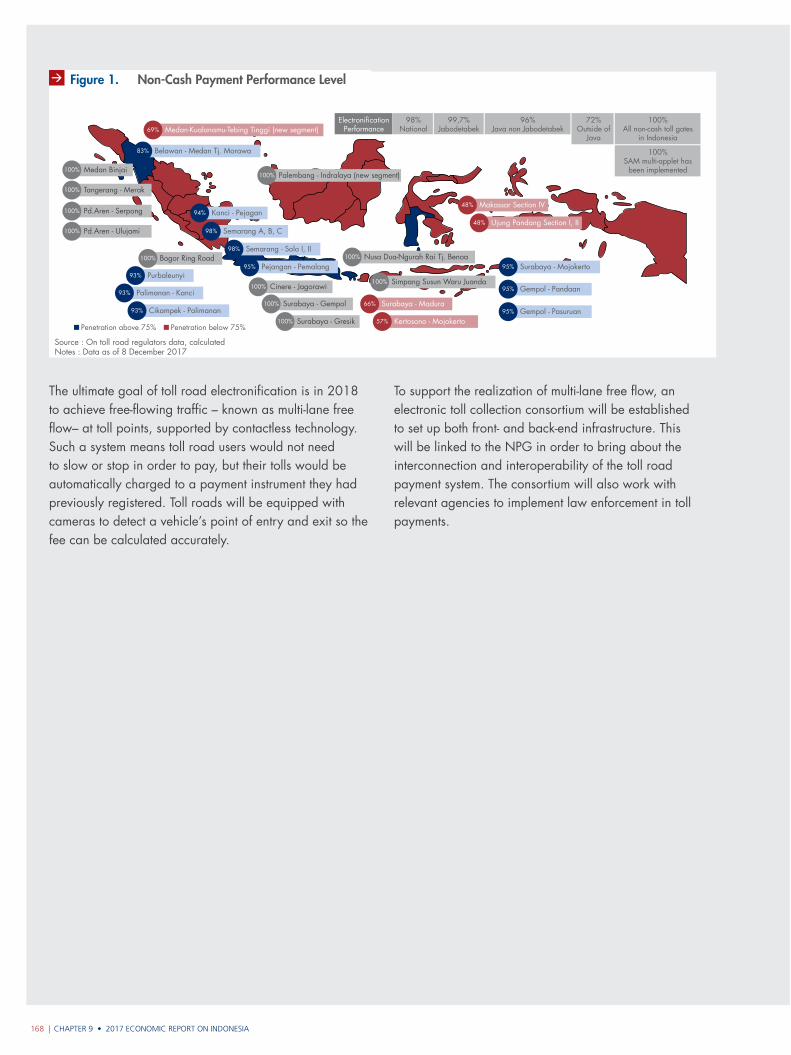
CHAPTER 9 • 2017 ECONOMIC REPORT ON INDONESIA168 |
Source : On toll road regulators data, calculatedNotes : Data as of 8 December 2017
Gambar Boks 9.1
Penetration above 75% Penetration below 75%
100% Medan Binjai
100% Bogor Ring Road
100% Cinere - Jagorawi
100% Surabaya - Gempol
100% Surabaya - Gresik
100% Simpang Susun Waru Juanda
100% Nusa Dua-Ngurah Rai Tj. Benoa
100% Palembang - Indralaya (new segment)
83% Belawan - Medan Tj. Morawa
69% Medan-Kualanamu-Tebing Tinggi (new segment)
48% Makassar Section IV
48% Ujung Pandang Section I, II
66% Surabaya - Madura
57% Kertosono - Mojokerto
94% Kanci - Pejagan
98% Semarang A, B, C
98% Semarang - Solo I, II
93% Purbaleunyi
93% Palimanan - Kanci
95% Pejangan - Pemalang 95% Surabaya - Mojokerto
95% Gempol - Pandaan
95% Gempol - Pasuruan
100% Tangerang - Merak
100% Pd.Aren - Serpong
100% Pd.Aren - Ulujami
93% Cikampek - Palimanan
Electronification Performance
98%National
99,7%Jabodetabek
72%Outside of
Java
96%Java non Jabodetabek
100%All non-cash toll gates
in Indonesia
100%SAM multi-applet has
been implemented
Figure 1. Non-Cash Payment Performance Level
The ultimate goal of toll road electronification is in 2018 to achieve free-flowing traffic – known as multi-lane free flow– at toll points, supported by contactless technology. Such a system means toll road users would not need to slow or stop in order to pay, but their tolls would be automatically charged to a payment instrument they had previously registered. Toll roads will be equipped with cameras to detect a vehicle’s point of entry and exit so the fee can be calculated accurately.
To support the realization of multi-lane free flow, an electronic toll collection consortium will be established to set up both front- and back-end infrastructure. This will be linked to the NPG in order to bring about the interconnection and interoperability of the toll road payment system. The consortium will also work with relevant agencies to implement law enforcement in toll payments.


| 1712017 ECONOMIC REPORT ON INDONESIA
CHAPTER 10
The Indonesian economy is on an upward trajectory. Nonetheless, consistent and anticipatory macroeconomic policies are still needed to safeguard the economy and ensure it develops in a stronger, more balanced and sustainable manner.
Outlook, Challenges, and Policy Direction
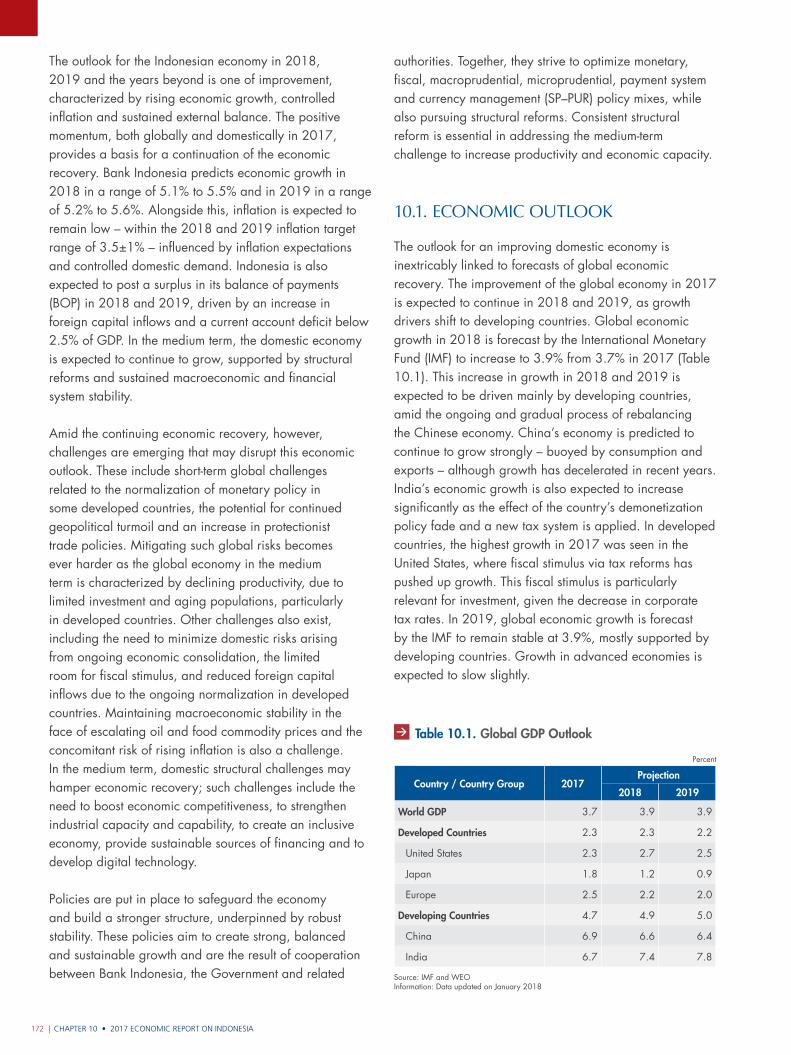
CHAPTER 10 • 2017 ECONOMIC REPORT ON INDONESIA172 |
Country / Country Group 2017Projection
2018 2019
World GDP 3.7 3.9 3.9
Developed Countries 2.3 2.3 2.2
United States 2.3 2.7 2.5
Japan 1.8 1.2 0.9
Europe 2.5 2.2 2.0
Developing Countries 4.7 4.9 5.0
China 6.9 6.6 6.4
India 6.7 7.4 7.8
Source: IMF and WEOInformation: Data updated on January 2018
Table 10.1. Global GDP Outlook
The outlook for the Indonesian economy in 2018, 2019 and the years beyond is one of improvement, characterized by rising economic growth, controlled inflation and sustained external balance. The positive momentum, both globally and domestically in 2017, provides a basis for a continuation of the economic recovery. Bank Indonesia predicts economic growth in 2018 in a range of 5.1% to 5.5% and in 2019 in a range of 5.2% to 5.6%. Alongside this, inflation is expected to remain low – within the 2018 and 2019 inflation target range of 3.5±1% – influenced by inflation expectations and controlled domestic demand. Indonesia is also expected to post a surplus in its balance of payments (BOP) in 2018 and 2019, driven by an increase in foreign capital inflows and a current account deficit below 2.5% of GDP. In the medium term, the domestic economy is expected to continue to grow, supported by structural reforms and sustained macroeconomic and financial system stability.
Amid the continuing economic recovery, however, challenges are emerging that may disrupt this economic outlook. These include short-term global challenges related to the normalization of monetary policy in some developed countries, the potential for continued geopolitical turmoil and an increase in protectionist trade policies. Mitigating such global risks becomes ever harder as the global economy in the medium term is characterized by declining productivity, due to limited investment and aging populations, particularly in developed countries. Other challenges also exist, including the need to minimize domestic risks arising from ongoing economic consolidation, the limited room for fiscal stimulus, and reduced foreign capital inflows due to the ongoing normalization in developed countries. Maintaining macroeconomic stability in the face of escalating oil and food commodity prices and the concomitant risk of rising inflation is also a challenge. In the medium term, domestic structural challenges may hamper economic recovery; such challenges include the need to boost economic competitiveness, to strengthen industrial capacity and capability, to create an inclusive economy, provide sustainable sources of financing and to develop digital technology.
Policies are put in place to safeguard the economy and build a stronger structure, underpinned by robust stability. These policies aim to create strong, balanced and sustainable growth and are the result of cooperation between Bank Indonesia, the Government and related
authorities. Together, they strive to optimize monetary, fiscal, macroprudential, microprudential, payment system and currency management (SP–PUR) policy mixes, while also pursuing structural reforms. Consistent structural reform is essential in addressing the medium-term challenge to increase productivity and economic capacity.
10.1. Economic outlook
The outlook for an improving domestic economy is inextricably linked to forecasts of global economic recovery. The improvement of the global economy in 2017 is expected to continue in 2018 and 2019, as growth drivers shift to developing countries. Global economic growth in 2018 is forecast by the International Monetary Fund (IMF) to increase to 3.9% from 3.7% in 2017 (Table 10.1). This increase in growth in 2018 and 2019 is expected to be driven mainly by developing countries, amid the ongoing and gradual process of rebalancing the Chinese economy. China’s economy is predicted to continue to grow strongly – buoyed by consumption and exports – although growth has decelerated in recent years. India’s economic growth is also expected to increase significantly as the effect of the country’s demonetization policy fade and a new tax system is applied. In developed countries, the highest growth in 2017 was seen in the United States, where fiscal stimulus via tax reforms has pushed up growth. This fiscal stimulus is particularly relevant for investment, given the decrease in corporate tax rates. In 2019, global economic growth is forecast by the IMF to remain stable at 3.9%, mostly supported by developing countries. Growth in advanced economies is expected to slow slightly.
Percent
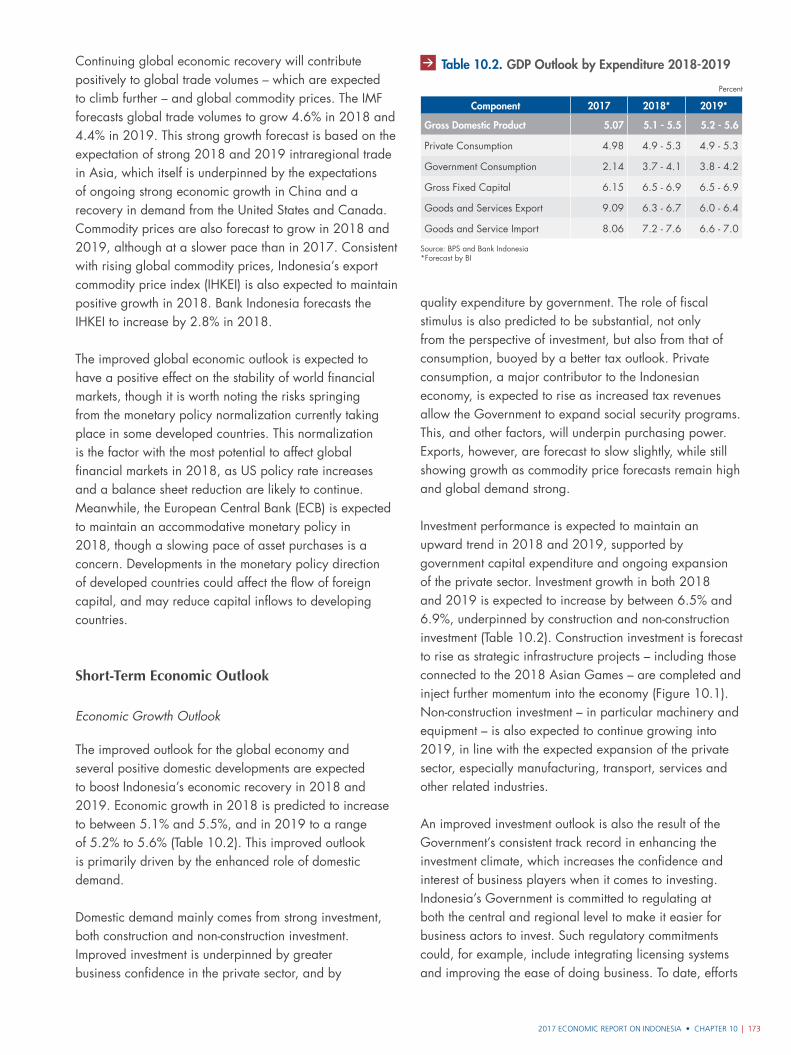
2017 ECONOMIC REPORT ON INDONESIA • CHAPTER 10 | 173
Continuing global economic recovery will contribute positively to global trade volumes – which are expected to climb further – and global commodity prices. The IMF forecasts global trade volumes to grow 4.6% in 2018 and 4.4% in 2019. This strong growth forecast is based on the expectation of strong 2018 and 2019 intraregional trade in Asia, which itself is underpinned by the expectations of ongoing strong economic growth in China and a recovery in demand from the United States and Canada. Commodity prices are also forecast to grow in 2018 and 2019, although at a slower pace than in 2017. Consistent with rising global commodity prices, Indonesia’s export commodity price index (IHKEI) is also expected to maintain positive growth in 2018. Bank Indonesia forecasts the IHKEI to increase by 2.8% in 2018.
The improved global economic outlook is expected to have a positive effect on the stability of world financial markets, though it is worth noting the risks springing from the monetary policy normalization currently taking place in some developed countries. This normalization is the factor with the most potential to affect global financial markets in 2018, as US policy rate increases and a balance sheet reduction are likely to continue. Meanwhile, the European Central Bank (ECB) is expected to maintain an accommodative monetary policy in 2018, though a slowing pace of asset purchases is a concern. Developments in the monetary policy direction of developed countries could affect the flow of foreign capital, and may reduce capital inflows to developing countries.
Short-Term Economic Outlook
Economic Growth Outlook
The improved outlook for the global economy and several positive domestic developments are expected to boost Indonesia’s economic recovery in 2018 and 2019. Economic growth in 2018 is predicted to increase to between 5.1% and 5.5%, and in 2019 to a range of 5.2% to 5.6% (Table 10.2). This improved outlook is primarily driven by the enhanced role of domestic demand.
Domestic demand mainly comes from strong investment, both construction and non-construction investment. Improved investment is underpinned by greater business confidence in the private sector, and by
quality expenditure by government. The role of fiscal stimulus is also predicted to be substantial, not only from the perspective of investment, but also from that of consumption, buoyed by a better tax outlook. Private consumption, a major contributor to the Indonesian economy, is expected to rise as increased tax revenues allow the Government to expand social security programs. This, and other factors, will underpin purchasing power. Exports, however, are forecast to slow slightly, while still showing growth as commodity price forecasts remain high and global demand strong.
Investment performance is expected to maintain an upward trend in 2018 and 2019, supported by government capital expenditure and ongoing expansion of the private sector. Investment growth in both 2018 and 2019 is expected to increase by between 6.5% and 6.9%, underpinned by construction and non-construction investment (Table 10.2). Construction investment is forecast to rise as strategic infrastructure projects – including those connected to the 2018 Asian Games – are completed and inject further momentum into the economy (Figure 10.1). Non-construction investment – in particular machinery and equipment – is also expected to continue growing into 2019, in line with the expected expansion of the private sector, especially manufacturing, transport, services and other related industries.
An improved investment outlook is also the result of the Government’s consistent track record in enhancing the investment climate, which increases the confidence and interest of business players when it comes to investing. Indonesia’s Government is committed to regulating at both the central and regional level to make it easier for business actors to invest. Such regulatory commitments could, for example, include integrating licensing systems and improving the ease of doing business. To date, efforts
Table 10.2. GDP Outlook by Expenditure 2018‑2019
Component 2017 2018* 2019*
Gross Domestic Product 5.07 5.1 ‑ 5.5 5.2 ‑ 5.6
Private Consumption 4.98 4.9 - 5.3 4.9 - 5.3
Government Consumption 2.14 3.7 - 4.1 3.8 - 4.2
Gross Fixed Capital 6.15 6.5 - 6.9 6.5 - 6.9
Goods and Services Export 9.09 6.3 - 6.7 6.0 - 6.4
Goods and Service Import 8.06 7.2 - 7.6 6.6 - 7.0
Percent
Source: BPS and Bank Indonesia*Forecast by BI
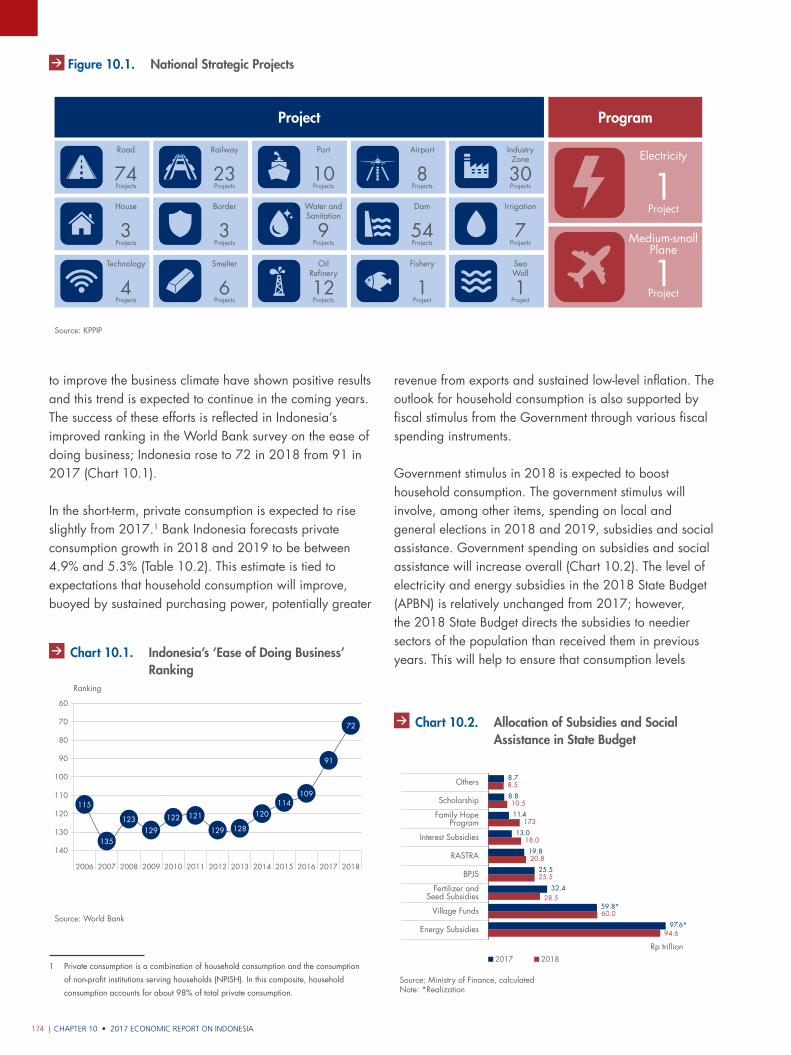
CHAPTER 10 • 2017 ECONOMIC REPORT ON INDONESIA174 |
to improve the business climate have shown positive results and this trend is expected to continue in the coming years. The success of these efforts is reflected in Indonesia’s improved ranking in the World Bank survey on the ease of doing business; Indonesia rose to 72 in 2018 from 91 in 2017 (Chart 10.1).
In the short-term, private consumption is expected to rise slightly from 2017.1 Bank Indonesia forecasts private consumption growth in 2018 and 2019 to be between 4.9% and 5.3% (Table 10.2). This estimate is tied to expectations that household consumption will improve, buoyed by sustained purchasing power, potentially greater
1 Private consumption is a combination of household consumption and the consumption
of non-profit institutions serving households (NPISH). In this composite, household
consumption accounts for about 98% of total private consumption.
revenue from exports and sustained low-level inflation. The outlook for household consumption is also supported by fiscal stimulus from the Government through various fiscal spending instruments.
Government stimulus in 2018 is expected to boost household consumption. The government stimulus will involve, among other items, spending on local and general elections in 2018 and 2019, subsidies and social assistance. Government spending on subsidies and social assistance will increase overall (Chart 10.2). The level of electricity and energy subsidies in the 2018 State Budget (APBN) is relatively unchanged from 2017; however, the 2018 State Budget directs the subsidies to needier sectors of the population than received them in previous years. This will help to ensure that consumption levels
Gambar 10.3. Lorem Ipsum
Source: KPPIP
Project Program
Road
Projects74
Railway
Projects23
Port
Projects10
Airport
Projects8
IndustryZone
Projects30
House
Projects3
Border
Projects3
Water andSanitation
Projects9
Dam
Projects54
Irrigation
Projects7
Technology
Projects4
Smelter
Projects6
OilRefinery
Projects12
Fishery
Project1
SeaWall
Project1
Electricity
Project1
Medium-smallPlane
Project1
Figure 10.1. National Strategic Projects
Source: World Bank
Gra�k 10.2. Peringkat Ease of Doing Business Indone
140
130
120
110
100
90
80
60
70
Ranking
2006 20082007 2009 2010 2011 2012 2013 2014 2015 2016 2017 2018
115
135
123 129
122 121
129 128
120 114
109
91
72
Chart 10.1. Indonesia’s ‘Ease of Doing Business’ Ranking
Gra�k 10.1. Program Pengentasan Kemiskinan
Source: Ministry of Finance, calculatedNote: *Realization
Energy Subsidies
Village Funds
Fertilizer andSeed Subsidies
Family HopeProgram
BPJS
RASTRA
Interest Subsidies
Scholarship
Others
2017 2018
Rp trillion
94.6
60.0
28.5
25.5
20.8
18.0
17.3
10.5
8.5
97.6*
59.8*
32.4
25.5
19.8
13.0
11.4
8.8
8.7
Chart 10.2. Allocation of Subsidies and Social Assistance in State Budget
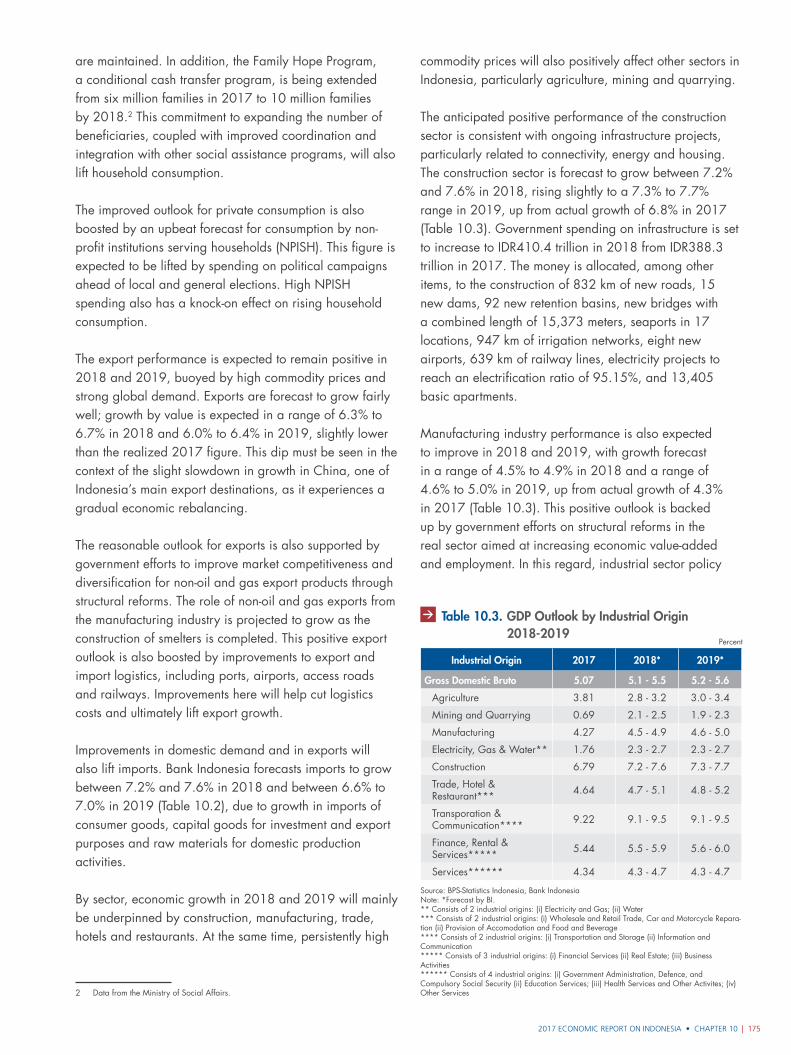
2017 ECONOMIC REPORT ON INDONESIA • CHAPTER 10 | 175
are maintained. In addition, the Family Hope Program, a conditional cash transfer program, is being extended from six million families in 2017 to 10 million families by 2018.2 This commitment to expanding the number of beneficiaries, coupled with improved coordination and integration with other social assistance programs, will also lift household consumption.
The improved outlook for private consumption is also boosted by an upbeat forecast for consumption by non-profit institutions serving households (NPISH). This figure is expected to be lifted by spending on political campaigns ahead of local and general elections. High NPISH spending also has a knock-on effect on rising household consumption.
The export performance is expected to remain positive in 2018 and 2019, buoyed by high commodity prices and strong global demand. Exports are forecast to grow fairly well; growth by value is expected in a range of 6.3% to 6.7% in 2018 and 6.0% to 6.4% in 2019, slightly lower than the realized 2017 figure. This dip must be seen in the context of the slight slowdown in growth in China, one of Indonesia’s main export destinations, as it experiences a gradual economic rebalancing.
The reasonable outlook for exports is also supported by government efforts to improve market competitiveness and diversification for non-oil and gas export products through structural reforms. The role of non-oil and gas exports from the manufacturing industry is projected to grow as the construction of smelters is completed. This positive export outlook is also boosted by improvements to export and import logistics, including ports, airports, access roads and railways. Improvements here will help cut logistics costs and ultimately lift export growth.
Improvements in domestic demand and in exports will also lift imports. Bank Indonesia forecasts imports to grow between 7.2% and 7.6% in 2018 and between 6.6% to 7.0% in 2019 (Table 10.2), due to growth in imports of consumer goods, capital goods for investment and export purposes and raw materials for domestic production activities.
By sector, economic growth in 2018 and 2019 will mainly be underpinned by construction, manufacturing, trade, hotels and restaurants. At the same time, persistently high
2 Data from the Ministry of Social Affairs.
commodity prices will also positively affect other sectors in Indonesia, particularly agriculture, mining and quarrying.
The anticipated positive performance of the construction sector is consistent with ongoing infrastructure projects, particularly related to connectivity, energy and housing. The construction sector is forecast to grow between 7.2% and 7.6% in 2018, rising slightly to a 7.3% to 7.7% range in 2019, up from actual growth of 6.8% in 2017 (Table 10.3). Government spending on infrastructure is set to increase to IDR410.4 trillion in 2018 from IDR388.3 trillion in 2017. The money is allocated, among other items, to the construction of 832 km of new roads, 15 new dams, 92 new retention basins, new bridges with a combined length of 15,373 meters, seaports in 17 locations, 947 km of irrigation networks, eight new airports, 639 km of railway lines, electricity projects to reach an electrification ratio of 95.15%, and 13,405 basic apartments.
Manufacturing industry performance is also expected to improve in 2018 and 2019, with growth forecast in a range of 4.5% to 4.9% in 2018 and a range of 4.6% to 5.0% in 2019, up from actual growth of 4.3% in 2017 (Table 10.3). This positive outlook is backed up by government efforts on structural reforms in the real sector aimed at increasing economic value-added and employment. In this regard, industrial sector policy
Table 10.3. GDP Outlook by Industrial Origin 2018‑2019
Industrial Origin 2017 2018* 2019*
Gross Domestic Bruto 5.07 5.1 ‑ 5.5 5.2 ‑ 5.6
Agriculture 3.81 2.8 - 3.2 3.0 - 3.4
Mining and Quarrying 0.69 2.1 - 2.5 1.9 - 2.3
Manufacturing 4.27 4.5 - 4.9 4.6 - 5.0
Electricity, Gas & Water** 1.76 2.3 - 2.7 2.3 - 2.7
Construction 6.79 7.2 - 7.6 7.3 - 7.7
Trade, Hotel & Restaurant*** 4.64 4.7 - 5.1 4.8 - 5.2
Transporation & Communication**** 9.22 9.1 - 9.5 9.1 - 9.5
Finance, Rental & Services***** 5.44 5.5 - 5.9 5.6 - 6.0
Services****** 4.34 4.3 - 4.7 4.3 - 4.7
Source: BPS-Statistics Indonesia, Bank IndonesiaNote: *Forecast by BI. ** Consists of 2 industrial origins: (i) Electricity and Gas; (ii) Water*** Consists of 2 industrial origins: (i) Wholesale and Retail Trade, Car and Motorcycle Repara- tion (ii) Provision of Accomodation and Food and Beverage**** Consists of 2 industrial origins: (i) Transportation and Storage (ii) Information and Communication***** Consists of 3 industrial origins: (i) Financial Services (ii) Real Estate; (iii) Business Activities ****** Consists of 4 industrial origins: (i) Government Administration, Defence, and Compulsory Social Security (ii) Education Services; (iii) Health Services and Other Activites; (iv) Other Services
Percent
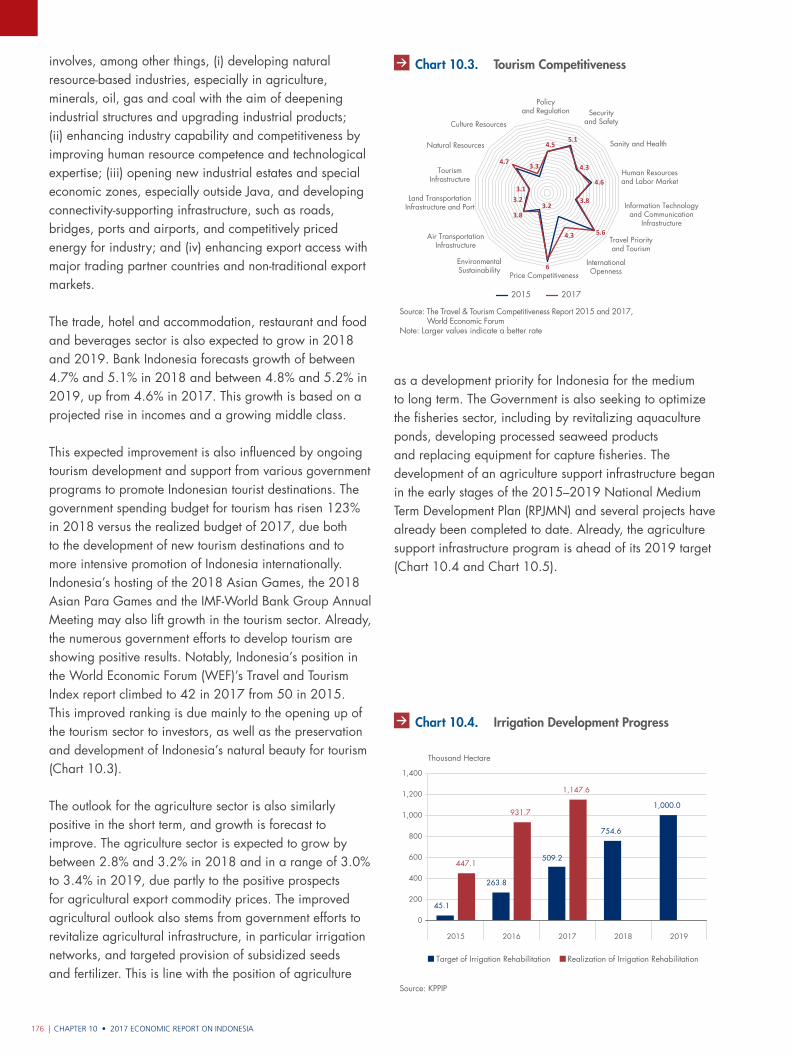
CHAPTER 10 • 2017 ECONOMIC REPORT ON INDONESIA176 |
2015 2016 2017 2018 2019
0
600
400
200
800
1,000
1,200
1,400
45.1
263.8
509.2
754.6
1,000.0
447.1
931.7
1,147.6
Thousand Hectare
Target of Irrigation Rehabilitation Realization of Irrigation Rehabilitation
Source: KPPIP
Gra�k 10.4. Progres Pembangunan IrigasiChart 10.4. Irrigation Development Progress
involves, among other things, (i) developing natural resource-based industries, especially in agriculture, minerals, oil, gas and coal with the aim of deepening industrial structures and upgrading industrial products; (ii) enhancing industry capability and competitiveness by improving human resource competence and technological expertise; (iii) opening new industrial estates and special economic zones, especially outside Java, and developing connectivity-supporting infrastructure, such as roads, bridges, ports and airports, and competitively priced energy for industry; and (iv) enhancing export access with major trading partner countries and non-traditional export markets.
The trade, hotel and accommodation, restaurant and food and beverages sector is also expected to grow in 2018 and 2019. Bank Indonesia forecasts growth of between 4.7% and 5.1% in 2018 and between 4.8% and 5.2% in 2019, up from 4.6% in 2017. This growth is based on a projected rise in incomes and a growing middle class.
This expected improvement is also influenced by ongoing tourism development and support from various government programs to promote Indonesian tourist destinations. The government spending budget for tourism has risen 123% in 2018 versus the realized budget of 2017, due both to the development of new tourism destinations and to more intensive promotion of Indonesia internationally. Indonesia’s hosting of the 2018 Asian Games, the 2018 Asian Para Games and the IMF-World Bank Group Annual Meeting may also lift growth in the tourism sector. Already, the numerous government efforts to develop tourism are showing positive results. Notably, Indonesia’s position in the World Economic Forum (WEF)’s Travel and Tourism Index report climbed to 42 in 2017 from 50 in 2015. This improved ranking is due mainly to the opening up of the tourism sector to investors, as well as the preservation and development of Indonesia’s natural beauty for tourism (Chart 10.3).
The outlook for the agriculture sector is also similarly positive in the short term, and growth is forecast to improve. The agriculture sector is expected to grow by between 2.8% and 3.2% in 2018 and in a range of 3.0% to 3.4% in 2019, due partly to the positive prospects for agricultural export commodity prices. The improved agricultural outlook also stems from government efforts to revitalize agricultural infrastructure, in particular irrigation networks, and targeted provision of subsidized seeds and fertilizer. This is line with the position of agriculture
as a development priority for Indonesia for the medium to long term. The Government is also seeking to optimize the fisheries sector, including by revitalizing aquaculture ponds, developing processed seaweed products and replacing equipment for capture fisheries. The development of an agriculture support infrastructure began in the early stages of the 2015–2019 National Medium Term Development Plan (RPJMN) and several projects have already been completed to date. Already, the agriculture support infrastructure program is ahead of its 2019 target (Chart 10.4 and Chart 10.5).
Gra�k 10.3. Daya Saing Pariwisata
Source: The Travel & Tourism Competitiveness Report 2015 and 2017, World Economic Forum
Note: Larger values indicate a better rate
2015 2017
4.55.1
4.3
4.6
3.8
5.64.3
6
3.23.8
3.23.1
4.7 3.3
Policyand Regulation Security
and Safety
Sanity and Health
Human Resourcesand Labor Market
Information Technologyand Communication
Infrastructure
Travel Priorityand Tourism
InternationalOpennessPrice Competitiveness
EnvironmentalSustainability
Air TransportationInfrastructure
Land TransportationInfrastructure and Port
TourismInfrastructure
Natural Resources
Culture Resources
Chart 10.3. Tourism Competitiveness
2017 ECONOMIC REPORT ON INDONESIA • CHAPTER 10 | 177
Inflation Outlook
Inflation in 2018 and 2019 is expected to remain low and stable in the 3.5±1% range (Table 10.4). This forecast is based on indications that Indonesia has entered a low and stable inflation regime. Developments in the last four years indicate a downward trend in inflation, despite pressure from administered prices (AP) inflation. Indonesia’s success in consistently keeping inflation on target over the last three years has helped to anchor inflation expectations to inflation targets. Maintained inflation expectation levels are evident in the inflation projections of various international agencies, which fall within the 3.5±1% target range set by Indonesia (Chart 10.6). These inflation expectations will, in turn, support continuing inflation control. The outlook for controlled inflation is supported by all inflation components, namely AP inflation, volatile food (VF) inflation and core inflation. However, the outlook for inflation in the short term still includes risks related to the potential for ongoing food and oil price increases. In order to mitigate these risks, Bank Indonesia continues to strengthen coordination with central and local government through the Central Inflation Control Team (TPIP) and Regional Inflation Control Teams (TPID).
Core inflation is expected to remain under control in 2018 and 2019 in line with moderate global price pressures, controlled rising domestic demand and well-anchored inflation expectations. Non-oil and gas commodity prices are also predicted to remain under control, despite rising global oil prices, therefore adding only minimal pressure to inflation. Meanwhile, the rise in domestic demand in line with economic growth is expected to be met by domestic production capacity. Furthermore, the risk of second-round effects from AP inflation and VF inflation is low as both these components remain under control.
Administered prices inflation in 2018 and 2019 is predicted to be lower than in recent years. Any increase in inflationary pressures resulting from fuel and energy price adjustments is expected to be minimal, as indicated by the unchanged level of the subsidy budget within the 2018 APBN. This AP prediction for helps overall inflation to remain under control, given the considerable weight of fuel and energy in the inflation basket.
Meanwhile, VF inflation in 2018 and 2019 is projected to be moderate, supported by a government drive to maintain food supplies and price stability with adequate food stocks and increased food crop production, amid uncertain weather conditions. The Government also continually strives to reinforce food trade regulations, develop and improve irrigation systems and enhance stock management and distribution networks in order to reduce inflationary pressure. Coordination between Bank Indonesia and the Government through the TPIP and TPID inflation control teams plays an important role in controlling food price inflation.
2015 2016 2017 2018 2019
0
1,500
1,000
500
2,000
2,500
3,000
3,500
205.8
834.2
1,556.1
2,278.1
3,000.0
1,171.7
1,952.3
2,535.9
Thousand Hectare
Source: KPPIP
Gra�k 10.5. Progres Rehabilitasi Irigasi
Target of Irrigation RehabilitationRealization of Irrigation Rehabilitation
Chart 10.5. Irrigation Rehabilitation Progress
Component 2017 2018* 2019*
Gross Domestic Product Growth 5.07 5.1 - 5.5 5.2 - 5.6
Inflation 3.61 2.5 - 4.5 2.5 - 4.5
CA Deficit (%GDP) 1.7 2.0 - 2.5 2.0 - 2.5
Credit Growth 8.2 10.0 - 12.0
Source: BPS and Bank Indonesia*Forecast by BI
Table 10.4. Indonesian Economic Outlook 2018‑2019
Percent
2018 2019
3.5±1%
Gra�k 10.6. Perkiraan In�asi Lembaga Internasional
2.0
2.5
3.0
3.5
4.5
4.0
5.0
Consensus Forecast WEO Inflation Target
Source: Consensus Forecast and WEO, calculated
Percent, yoy
Chart 10.6. Inflation Forecasts
CHAPTER 10 • 2017 ECONOMIC REPORT ON INDONESIA178 |
Indonesia’s Balance of Payments Outlook
Indonesia’s BOP in 2018 and 2019 is expected to continue at a surplus with stronger structures that bolster the external resilience of the national economy. The BOP outlook is buoyed by a healthy current account deficit that is expected within a range of 2.0% to 2.5% of GDP in 2018 and 2019. The slightly higher current account deficit range compared to 2017 is due to an increase in imports to meet expanding domestic demand, as well as a rise in the payment of foreign returns in line with the inflow of foreign capital. Nonetheless, the current account will remain at a healthy level as exports are also predicted to increase – albeit by a slightly lower level than in 2017 – driven by world economic growth and rising commodity prices.
In addition to the healthy current account, Indonesia’s BOP outlook is also influenced by the capital and financial account, which not only continues to post a surplus but is also better structured. The capital and financial account is expected to record a surplus in 2018 and 2019, albeit lower than that of the previous year. The surplus will be underpinned by rising foreign direct investment (FDI), as improvements to the business climate drive higher investment growth. The increase in FDI is expected to outweigh portfolio capital inflows, thus enhancing the composition of the capital and financial account with more sustainable financing sources. Foreign capital in portfolio form is still expected to flow to Indonesia, although possibly at a lower level than the previous year. This continuing portfolio flow is supported by substantial global excess liquidity, investors’ positive perceptions of Indonesia’s economic prospects and still-attractive rupiah yields.
Banking Outlook
Growth of credit and deposits in 2018 is expected to improve in line with the outlook for an improved domestic economy. Loans are projected to grow in a 10% to 12% range, and deposits in a 9% to 11% range. A decline in bank credit risk and the prospect of stronger loan demand – linked to predictions that corporate consolidation is coming to an end – will boost credit growth.
As banking intermediation increases, the resilience of banks and the stability of the financial system are expected to remain solid. This forecast is supported by banks’ known ability to manage credit risk satisfactorily, thereby contributing to maintaining profitability and
capital adequacy. In addition, bank liquidity is also predicted to improve on the back of substantial government financial operations.
Medium-Term Economic Outlook
In the medium term, Indonesia’s economic outlook is expected to continue to improve. Economic growth from 2020 to 2022 is forecast to continue upwards, accompanied by falling inflation and a sound current account deficit. These positive developments are supported by the consistency of the macroeconomic policies of Bank Indonesia and the Government, and their commitment to structural reforms. Structural reforms will help to improve the efficiency, productivity and competitiveness of the economy, reinforcing the ongoing economic strengthening in the medium term.
The outlook for the domestic economy is positive at a time when global economic growth is not expected to change much from its current level. Global economic growth from 2020 to 2022 is forecast by the IMF to reach about 3.9%. It is thought that developing countries will play a greater role than developed countries in driving global economic growth in the medium term. Developing countries are expected to post robust growth, with China and India likely to be the major growth engines. Meanwhile, developed economies including the US, Europe and Japan will experience lower growth due to productivity problems resulting from aging populations and limited investment.
Indonesia’s economic growth is expected to continue upwards in the medium term, hitting a growth rate in the range of 5.8% to 6.2% by the end of 2022. The outlook for steady economic growth in the medium term is boosted by improvement in all factors of production. In the medium term, capital accumulation will be mainly supported by continuing infrastructure investment. Infrastructure projects included in the RPJMN are estimated to cost around IDR4,800 trillion. In line with efforts to improve infrastructure, the Government has established a series of national strategic projects (PSN) as development priorities. These PSN consist of 245 projects and development programs for electricity and the aircraft industry, worth a total of approximately IDR4.417 trillion. Only 2% of these had been completed by the end of 2017 and approximately 59% is under construction. In the electricity program, 3% of the targeted 35,000MW has been completed, and 46% remains under construction (Chart
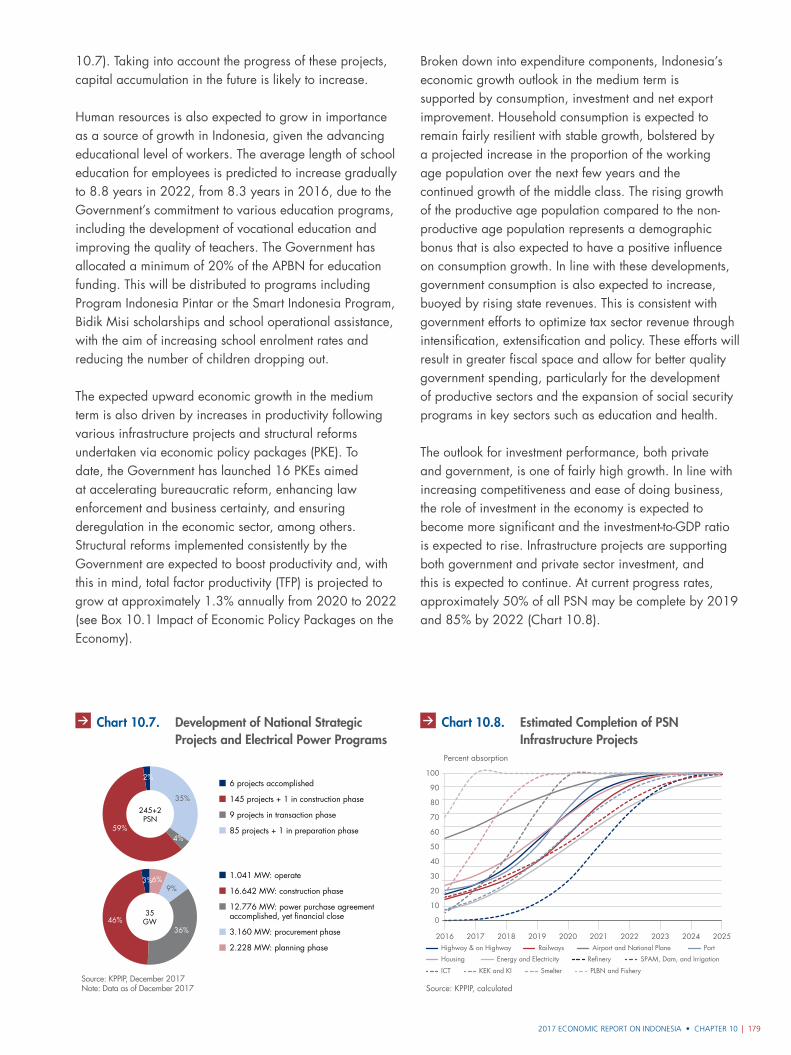
2017 ECONOMIC REPORT ON INDONESIA • CHAPTER 10 | 179
10.7). Taking into account the progress of these projects, capital accumulation in the future is likely to increase.
Human resources is also expected to grow in importance as a source of growth in Indonesia, given the advancing educational level of workers. The average length of school education for employees is predicted to increase gradually to 8.8 years in 2022, from 8.3 years in 2016, due to the Government’s commitment to various education programs, including the development of vocational education and improving the quality of teachers. The Government has allocated a minimum of 20% of the APBN for education funding. This will be distributed to programs including Program Indonesia Pintar or the Smart Indonesia Program, Bidik Misi scholarships and school operational assistance, with the aim of increasing school enrolment rates and reducing the number of children dropping out.
The expected upward economic growth in the medium term is also driven by increases in productivity following various infrastructure projects and structural reforms undertaken via economic policy packages (PKE). To date, the Government has launched 16 PKEs aimed at accelerating bureaucratic reform, enhancing law enforcement and business certainty, and ensuring deregulation in the economic sector, among others. Structural reforms implemented consistently by the Government are expected to boost productivity and, with this in mind, total factor productivity (TFP) is projected to grow at approximately 1.3% annually from 2020 to 2022 (see Box 10.1 Impact of Economic Policy Packages on the Economy).
Broken down into expenditure components, Indonesia’s economic growth outlook in the medium term is supported by consumption, investment and net export improvement. Household consumption is expected to remain fairly resilient with stable growth, bolstered by a projected increase in the proportion of the working age population over the next few years and the continued growth of the middle class. The rising growth of the productive age population compared to the non-productive age population represents a demographic bonus that is also expected to have a positive influence on consumption growth. In line with these developments, government consumption is also expected to increase, buoyed by rising state revenues. This is consistent with government efforts to optimize tax sector revenue through intensification, extensification and policy. These efforts will result in greater fiscal space and allow for better quality government spending, particularly for the development of productive sectors and the expansion of social security programs in key sectors such as education and health.
The outlook for investment performance, both private and government, is one of fairly high growth. In line with increasing competitiveness and ease of doing business, the role of investment in the economy is expected to become more significant and the investment-to-GDP ratio is expected to rise. Infrastructure projects are supporting both government and private sector investment, and this is expected to continue. At current progress rates, approximately 50% of all PSN may be complete by 2019 and 85% by 2022 (Chart 10.8).
Gra�k 10.7. Perkembangan Proyek Strategis Nasional dan Program Ketenaglistrikan
Source: KPPIP, December 2017Note: Data as of December 2017
2%
35%
4%59%
245+2PSN
3%6%9%
36%46%
35GW
6 projects accomplished
145 projects + 1 in construction phase
9 projects in transaction phase
85 projects + 1 in preparation phase
1.041 MW: operate
16.642 MW: construction phase
12.776 MW: power purchase agreementaccomplished, yet financial close
3.160 MW: procurement phase
2.228 MW: planning phase
Chart 10.7. Development of National Strategic Projects and Electrical Power Programs
2016 2017 2018 2019 2020 2021 2022 2023 2024 2025
Source: KPPIP, calculated
Gra�k 10.6. Estimasi Penyelesaian Proyek-proyekInfrastruktur PSN
Percent absorption
0
20
10
30
40
50
100
70
80
90
60
Highway & on Highway Railways Airport and National Plane Port
Housing Energy and Electricity Refinery SPAM, Dam, and Irrigation
ICT KEK and KI Smelter PLBN and Fishery
Chart 10.8. Estimated Completion of PSN Infrastructure Projects
CHAPTER 10 • 2017 ECONOMIC REPORT ON INDONESIA180 |
International trade is also expected to continue to perform well. Exports are projected to register an improved performance in both value and volumes, and the composition of exports will become increasingly robust. The expected increase in exports will also be supported by non-oil and gas exports from the manufacturing sector as economic productivity expands. Imports are also expected to increase due to growing domestic demand and also to fulfil manufacturers’ needs for inputs for their exports. Imports of raw materials for inputs are predicted to remain under control as the level of import dependence declines. However, imports of other goods – including machinery, equipment and components, among others – will increase to meet the needs of infrastructure projects.
Inflation in the medium term is forecast to remain low due to the positive effects of rising efficiency and economic productivity. Inflation from 2020 to 2022 is expected in the range of 3.0±1%. This inflation outlook is influenced by improving supply-side growth and a greater economic capacity to respond to rising domestic demand. Further, global inflationary pressure is not expected to be particularly forceful, in line with global economic growth and moderate price rises in imported commodities.
The improved medium-term outlook for the domestic economy is also attributable to the positive performance of Indonesia’s BOP. In the medium term, this is expected to continue showing a surplus, thereby boosting foreign exchange reserves. The expectation of a strengthening external sector is closely linked to the positive effects of structural reforms undertaken by the Government. These structural reforms have enhanced the economy’s productivity and efficiency which, in turn, have improved the competitiveness and overall outlook of the Indonesian economy. All of this serves to attract foreign investment into Indonesia and, overall, these factors have resulted in a more optimistic BOP projection for the future.
Indonesia’s improved BOP outlook in the medium term can also be credited to an increasingly healthy current account deficit, as well as a capital and financial account that remains in surplus. The current account deficit is expected to be maintained at a healthy level on a downward trend, partly due to favorable global economic developments and the positive impact of the Government’s structural reforms. Improved efficiency and productivity as a result of these structural reforms may improve the competitiveness of Indonesian products. Enhanced competitiveness would boost exports and control imports, ultimately reducing the
current account deficit further. Furthermore, the decrease in the services account deficit will also lead to a falling current account deficit, in line with the positive impact of government policies in supporting leading sectors, especially tourism.
The improvement to the capital and financial account is expected to continue. A capital and financial account surplus is predicted as a result of increased FDI inflows and a moderate rise in portfolio capital inflows. The increase in FDI is fueled by infrastructure projects and the positive impact of the Government’s economic policy packages. Portfolio capital inflows in the medium term are forecast to rise only modestly, due to anticipated rising global interest rates on expectations of an increase in the US Federal Reserve policy rate. Further, in line with the increasing need for infrastructure funding and the expanding export–import activities, other investment flows, such as loans and foreign exchange deposits, are likely to increase moderately.
10.2. Economic challEngEs
Amid optimism about the future economic outlook, challenges are emerging that require attention. Identifying such challenges is important in supporting policy formulation, which is aimed not only at mitigating risks that arise, but also at strengthening the structure of the economy. This, in turn, ensures continuing economic recovery in the future.
The challenges to the Indonesian economy stem from both global and domestic issues, both in the short and medium term. On the global front, short-term challenges concern efforts to mitigate risks from the tightening of monetary policy in developed countries, ongoing geopolitical turmoil and an escalating tendency towards protectionist trade policies. The first and second risks must be carefully observed as they can trigger uncertainties in global financial markets and increase the risk of capital reversals from developing countries. The growing protectionism could disrupt the outlook for the sustainability of global economic growth and international trade, which would have a negative impact on the Indonesian economy.
Medium-term challenges arising from global issues relate to mitigating the negative impact of risks to global productivity that could once again weaken the world economy. Recent developments show that the global
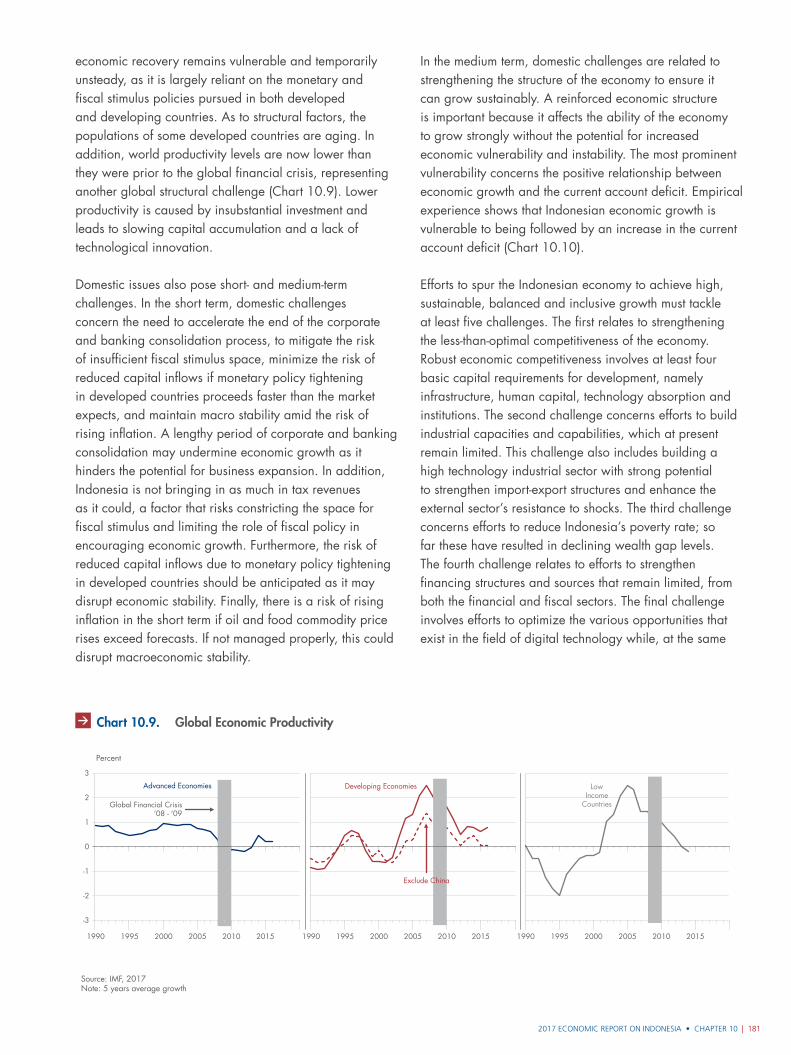
2017 ECONOMIC REPORT ON INDONESIA • CHAPTER 10 | 181
economic recovery remains vulnerable and temporarily unsteady, as it is largely reliant on the monetary and fiscal stimulus policies pursued in both developed and developing countries. As to structural factors, the populations of some developed countries are aging. In addition, world productivity levels are now lower than they were prior to the global financial crisis, representing another global structural challenge (Chart 10.9). Lower productivity is caused by insubstantial investment and leads to slowing capital accumulation and a lack of technological innovation.
Domestic issues also pose short- and medium-term challenges. In the short term, domestic challenges concern the need to accelerate the end of the corporate and banking consolidation process, to mitigate the risk of insufficient fiscal stimulus space, minimize the risk of reduced capital inflows if monetary policy tightening in developed countries proceeds faster than the market expects, and maintain macro stability amid the risk of rising inflation. A lengthy period of corporate and banking consolidation may undermine economic growth as it hinders the potential for business expansion. In addition, Indonesia is not bringing in as much in tax revenues as it could, a factor that risks constricting the space for fiscal stimulus and limiting the role of fiscal policy in encouraging economic growth. Furthermore, the risk of reduced capital inflows due to monetary policy tightening in developed countries should be anticipated as it may disrupt economic stability. Finally, there is a risk of rising inflation in the short term if oil and food commodity price rises exceed forecasts. If not managed properly, this could disrupt macroeconomic stability.
In the medium term, domestic challenges are related to strengthening the structure of the economy to ensure it can grow sustainably. A reinforced economic structure is important because it affects the ability of the economy to grow strongly without the potential for increased economic vulnerability and instability. The most prominent vulnerability concerns the positive relationship between economic growth and the current account deficit. Empirical experience shows that Indonesian economic growth is vulnerable to being followed by an increase in the current account deficit (Chart 10.10).
Efforts to spur the Indonesian economy to achieve high, sustainable, balanced and inclusive growth must tackle at least five challenges. The first relates to strengthening the less-than-optimal competitiveness of the economy. Robust economic competitiveness involves at least four basic capital requirements for development, namely infrastructure, human capital, technology absorption and institutions. The second challenge concerns efforts to build industrial capacities and capabilities, which at present remain limited. This challenge also includes building a high technology industrial sector with strong potential to strengthen import-export structures and enhance the external sector’s resistance to shocks. The third challenge concerns efforts to reduce Indonesia’s poverty rate; so far these have resulted in declining wealth gap levels. The fourth challenge relates to efforts to strengthen financing structures and sources that remain limited, from both the financial and fiscal sectors. The final challenge involves efforts to optimize the various opportunities that exist in the field of digital technology while, at the same
1990 1995 2000 2005 2010 2015 1990 1995 2000 2005 2010 2015
Source: IMF, 2017Note: 5 years average growth
Gra�k 10.9. Produktivitas Dunia
-3
2
3
0
1
-1
-2
Percent
LowIncome
Countries
Exclude China
Developing Economies
1990 1995 2000 2005 2010 2015
Advanced Economies
Global Financial Crisis‘08 - ‘09
Chart 10.9. Global Economic Productivity
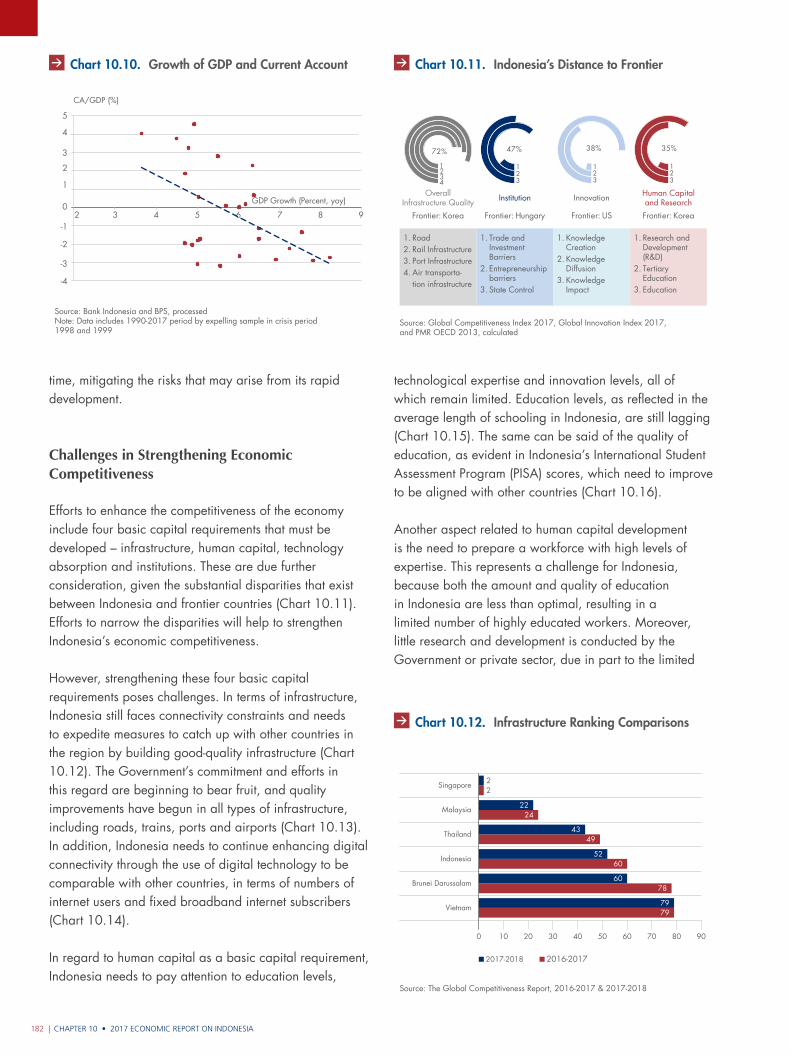
CHAPTER 10 • 2017 ECONOMIC REPORT ON INDONESIA182 |
time, mitigating the risks that may arise from its rapid development.
Challenges in Strengthening Economic Competitiveness
Efforts to enhance the competitiveness of the economy include four basic capital requirements that must be developed – infrastructure, human capital, technology absorption and institutions. These are due further consideration, given the substantial disparities that exist between Indonesia and frontier countries (Chart 10.11). Efforts to narrow the disparities will help to strengthen Indonesia’s economic competitiveness.
However, strengthening these four basic capital requirements poses challenges. In terms of infrastructure, Indonesia still faces connectivity constraints and needs to expedite measures to catch up with other countries in the region by building good-quality infrastructure (Chart 10.12). The Government’s commitment and efforts in this regard are beginning to bear fruit, and quality improvements have begun in all types of infrastructure, including roads, trains, ports and airports (Chart 10.13). In addition, Indonesia needs to continue enhancing digital connectivity through the use of digital technology to be comparable with other countries, in terms of numbers of internet users and fixed broadband internet subscribers (Chart 10.14).
In regard to human capital as a basic capital requirement, Indonesia needs to pay attention to education levels,
technological expertise and innovation levels, all of which remain limited. Education levels, as reflected in the average length of schooling in Indonesia, are still lagging (Chart 10.15). The same can be said of the quality of education, as evident in Indonesia’s International Student Assessment Program (PISA) scores, which need to improve to be aligned with other countries (Chart 10.16).
Another aspect related to human capital development is the need to prepare a workforce with high levels of expertise. This represents a challenge for Indonesia, because both the amount and quality of education in Indonesia are less than optimal, resulting in a limited number of highly educated workers. Moreover, little research and development is conducted by the Government or private sector, due in part to the limited
Source: Bank Indonesia and BPS, processedNote: Data includes 1990-2017 period by expelling sample in crisis period1998 and 1999
Gra�k 10.7. Perkembangan Pertumbuhan PDB dan Tr
-4
-2
-3
0
-1
1
5
4
3
2
CA/GDP (%)
GDP Growth (Percent, yoy)
32 4 5 6 7 8 9
Chart 10.10. Growth of GDP and Current Account Gra�k 10.8. Distance to Frontier Indonesia
Source: Global Competitiveness Index 2017, Global Innovation Index 2017,and PMR OECD 2013, calculated
1234
72%
Frontier: Korea
123
47%
Frontier: Hungary
123
35%
Frontier: Korea
123
38%
Frontier: US
1.2.3.4.
RoadRail InfrastructurePort InfrastructureAir transporta-tion infrastructure
1.
2.
3.
Trade and Investment BarriersEntrepreneurship barriersState Control
1. 2.
3.
Research and Development (R&D)Tertiary EducationEducation
1.
2.
3.
Knowledge CreationKnowledge DiffusionKnowledge Impact
OverallInfrastructure Quality Institution Human Capital
and ResearchInnovation
Chart 10.11. Indonesia’s Distance to Frontier
0 10 20 30 40 50 60 70 80 90
Gra�k 10.12.
Source: The Global Competitiveness Report, 2016-2017 & 2017-2018
Vietnam
Brunei Darussalam
Indonesia
Thailand
Malaysia
Singapore
2017-2018 2016-2017
79
78
60
49
24
2
79
60
52
43
22
2
Chart 10.12. Infrastructure Ranking Comparisons
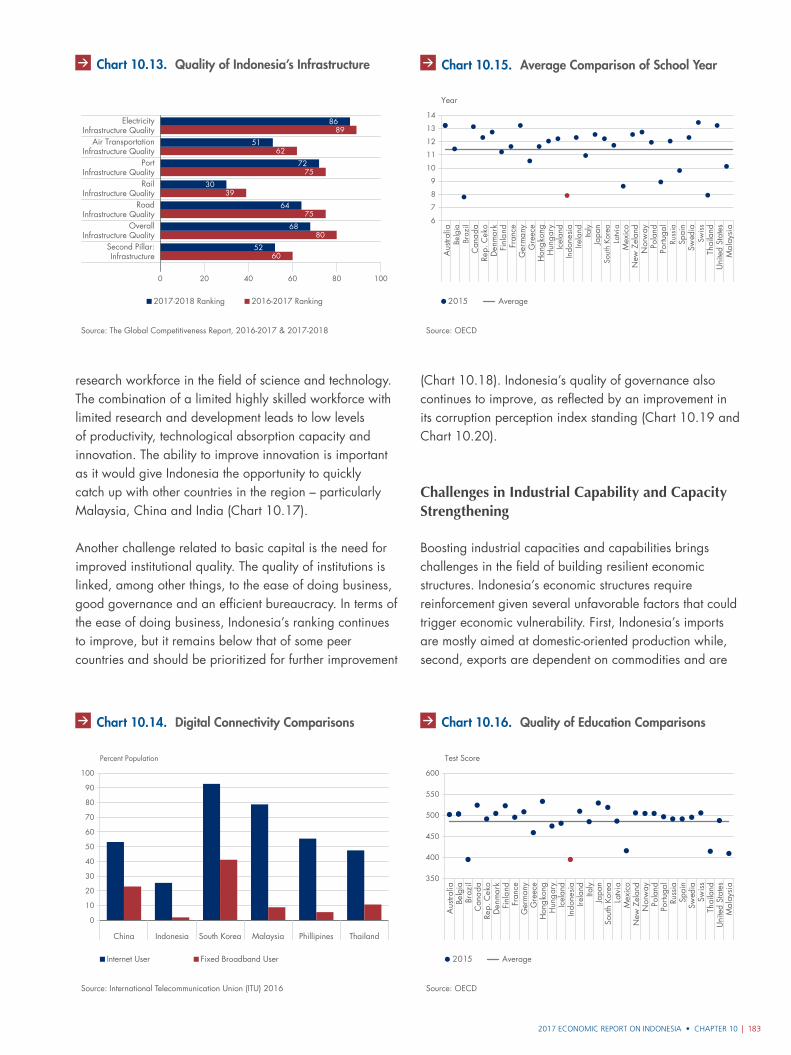
2017 ECONOMIC REPORT ON INDONESIA • CHAPTER 10 | 183
research workforce in the field of science and technology. The combination of a limited highly skilled workforce with limited research and development leads to low levels of productivity, technological absorption capacity and innovation. The ability to improve innovation is important as it would give Indonesia the opportunity to quickly catch up with other countries in the region – particularly Malaysia, China and India (Chart 10.17).
Another challenge related to basic capital is the need for improved institutional quality. The quality of institutions is linked, among other things, to the ease of doing business, good governance and an efficient bureaucracy. In terms of the ease of doing business, Indonesia’s ranking continues to improve, but it remains below that of some peer countries and should be prioritized for further improvement
(Chart 10.18). Indonesia’s quality of governance also continues to improve, as reflected by an improvement in its corruption perception index standing (Chart 10.19 and Chart 10.20).
Challenges in Industrial Capability and Capacity Strengthening
Boosting industrial capacities and capabilities brings challenges in the field of building resilient economic structures. Indonesia’s economic structures require reinforcement given several unfavorable factors that could trigger economic vulnerability. First, Indonesia’s imports are mostly aimed at domestic-oriented production while, second, exports are dependent on commodities and are
60
80
75
39
75
62
89
52
68
64
30
72
51
86
0 20 40 60 80 100
Gra�k 10.10. Kualitas Infrastruktur Indonesia
Source: The Global Competitiveness Report, 2016-2017 & 2017-2018
Second Pillar:Infrastructure
OverallInfrastructure Quality
RoadInfrastructure Quality
RailInfrastructure Quality
PortInfrastructure Quality
Air TransportationInfrastructure Quality
ElectricityInfrastructure Quality
2017-2018 Ranking 2016-2017 Ranking
Chart 10.13. Quality of Indonesia’s Infrastructure
Source: International Telecommunication Union (ITU) 2016
Gra�k 5.11. Perbandingan Konektivitas Digital
0
20
40
60
80
10
30
50
70
100
90
China Indonesia South Korea Malaysia Phillipines Thailand
Internet User Fixed Broadband User
Percent Population
Chart 10.14. Digital Connectivity Comparisons
Source: OECD
Gra�k 10.12. Perbandingan Rata-rata Masa Sekolah
Aus
tralia
Belg
iaBr
azil
Can
ada
Rep.
Cek
oD
enm
ark
Finl
and
Fran
ceG
erm
any
Gre
ece
Hon
gkon
gH
unga
ryIc
elan
dIn
done
sia
Irela
nd Italy
Japa
nSo
uth
Kore
aLa
tvia
Mex
ico
New
Zel
and
Nor
way
Pola
ndPo
rtuga
lRu
ssia
Spai
nSw
edia
Swis
sTh
aila
ndU
nite
d St
ates
Mal
aysi
a
2015 Average
6
7
8
9
10
11
12
13
14
Year
Chart 10.15. Average Comparison of School Year
Source: OECD
Gra�k 10.13. Perbandingan Kualitas Pendidikan
Aus
tralia
Belg
iaBr
azil
Can
ada
Rep.
Cek
oD
enm
ark
Finl
and
Fran
ceG
erm
any
Gre
ece
Hon
gkon
gH
unga
ryIc
elan
dIn
done
sia
Irela
ndIta
lyJa
pan
Sout
h Ko
rea
Latv
iaM
exic
oN
ew Z
elan
dN
orw
ayPo
land
Portu
gal
Russ
iaSp
ain
Swed
iaSw
iss
Thai
land
Uni
ted
Stat
esM
alay
sia
2015 Average
350
400
450
500
550
600
Test Score
Chart 10.16. Quality of Education Comparisons
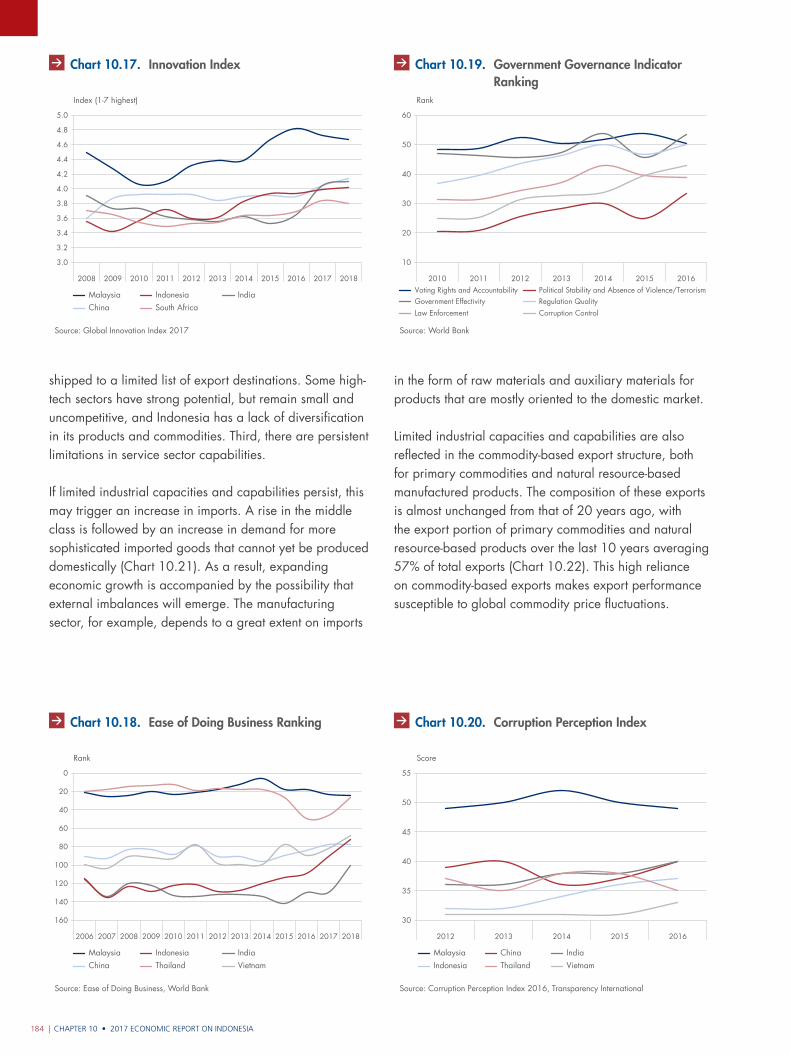
CHAPTER 10 • 2017 ECONOMIC REPORT ON INDONESIA184 |
Source: Global Innovation Index 2017
Gra�k 10.14. Indeks Inovasi
3.0
3.2
3.4
3.6
3.8
4.0
4.2
4.4
4.6
4.8
5.0
Index (1-7 highest)
2008 2009 2010 2011 2012 2013 2014 2015 2016 2017 2018
Malaysia Indonesia IndiaChina South Africa
Chart 10.17. Innovation Index
Source: Ease of Doing Business, World Bank
Gra�k 10.15. Peringkat Kemudahan Berusaha
160
140
120
100
80
60
40
20
0
Rank
2008 2009 2010 2011 2012 2013 2014 2015 2016 2017 201820072006
Malaysia Indonesia IndiaChina Thailand Vietnam
Chart 10.18. Ease of Doing Business Ranking
Source: World Bank
Gra�k 10.16. Indikator Tata Kelola Pemerintahan
10
60
50
40
30
20
Rank
2010 2011 2012 2013 2014 2015 2016Voting Rights and Accountability Government EffectivityLaw Enforcement
Political Stability and Absence of Violence/TerrorismRegulation QualityCorruption Control
Chart 10.19. Government Governance Indicator Ranking
shipped to a limited list of export destinations. Some high-tech sectors have strong potential, but remain small and uncompetitive, and Indonesia has a lack of diversification in its products and commodities. Third, there are persistent limitations in service sector capabilities.
If limited industrial capacities and capabilities persist, this may trigger an increase in imports. A rise in the middle class is followed by an increase in demand for more sophisticated imported goods that cannot yet be produced domestically (Chart 10.21). As a result, expanding economic growth is accompanied by the possibility that external imbalances will emerge. The manufacturing sector, for example, depends to a great extent on imports
in the form of raw materials and auxiliary materials for products that are mostly oriented to the domestic market.
Limited industrial capacities and capabilities are also reflected in the commodity-based export structure, both for primary commodities and natural resource-based manufactured products. The composition of these exports is almost unchanged from that of 20 years ago, with the export portion of primary commodities and natural resource-based products over the last 10 years averaging 57% of total exports (Chart 10.22). This high reliance on commodity-based exports makes export performance susceptible to global commodity price fluctuations.
Source: Corruption Perception Index 2016, Transparency International
Gra�k 10.17. Indeks Persepsi Korupsi
30
55
50
45
40
35
Score
2012 2013 2014 2015 2016
Malaysia China IndiaIndonesia Thailand Vietnam
Chart 10.20. Corruption Perception Index
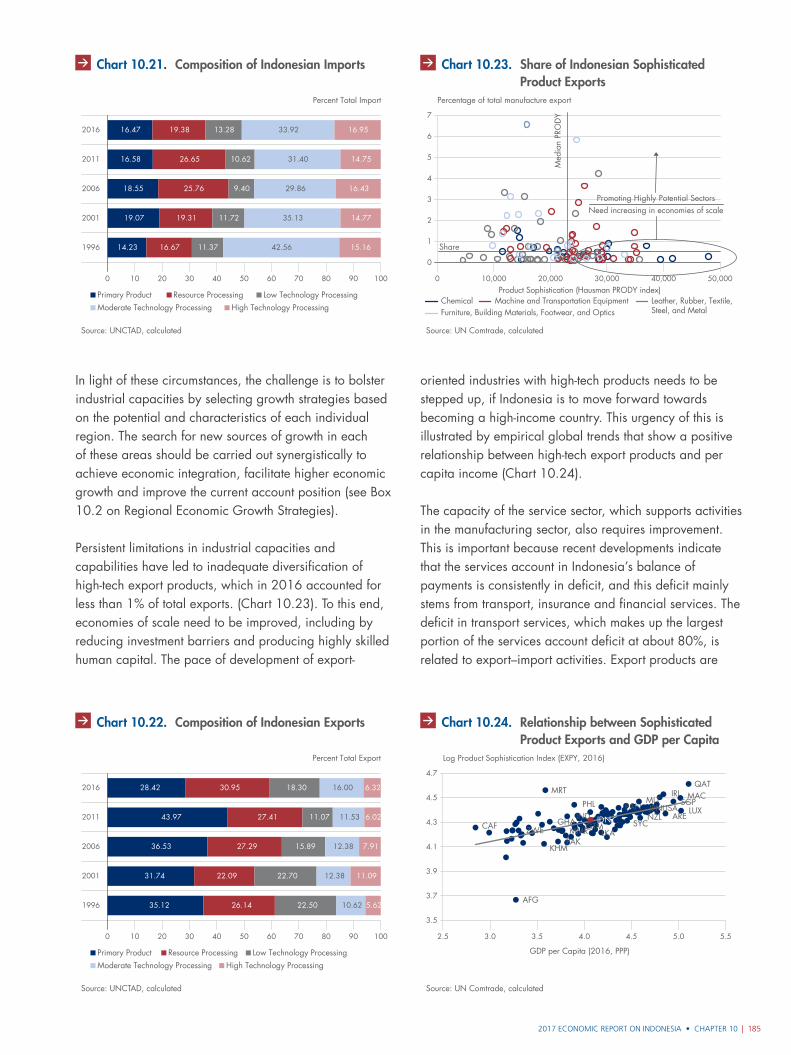
2017 ECONOMIC REPORT ON INDONESIA • CHAPTER 10 | 185
In light of these circumstances, the challenge is to bolster industrial capacities by selecting growth strategies based on the potential and characteristics of each individual region. The search for new sources of growth in each of these areas should be carried out synergistically to achieve economic integration, facilitate higher economic growth and improve the current account position (see Box 10.2 on Regional Economic Growth Strategies).
Persistent limitations in industrial capacities and capabilities have led to inadequate diversification of high-tech export products, which in 2016 accounted for less than 1% of total exports. (Chart 10.23). To this end, economies of scale need to be improved, including by reducing investment barriers and producing highly skilled human capital. The pace of development of export-
oriented industries with high-tech products needs to be stepped up, if Indonesia is to move forward towards becoming a high-income country. This urgency of this is illustrated by empirical global trends that show a positive relationship between high-tech export products and per capita income (Chart 10.24).
The capacity of the service sector, which supports activities in the manufacturing sector, also requires improvement. This is important because recent developments indicate that the services account in Indonesia’s balance of payments is consistently in deficit, and this deficit mainly stems from transport, insurance and financial services. The deficit in transport services, which makes up the largest portion of the services account deficit at about 80%, is related to export–import activities. Export products are
14.23
19.07
18.55
16.58
16.47
16.67
19.31
25.76
26.65
19.38
11.37
11.72
9.40
10.62
13.28
42.56
35.13
29.86
31.40
33.92
15.16
14.77
16.43
14.75
16.95
0 10 20 30 40 50 60 70 80 90 100
Gra�k 10.18. Komposisi Impor Indonesia
Source: UNCTAD, calculated
1996
2001
2006
2011
2016
Primary Product Resource ProcessingModerate Technology Processing High Technology Processing
Low Technology Processing
Percent Total Import
Chart 10.21. Composition of Indonesian Imports
0 10 20 30 40 50 60 70 80 90 100
Gra�k 10.19. Komposisi Ekspor Indonesia
Source: UNCTAD, calculated
1996
2001
2006
2011
2016
Primary Product Resource ProcessingModerate Technology Processing High Technology Processing
Low Technology Processing
Percent Total Export
35.12
31.74
36.53
43.97
28.42
26.14
22.09
27.29
27.41
30.95
22.50
22.70
15.89
11.07
18.30
10.62
12.38
12.38
11.53
16.00
5.62
11.09
7.91
6.02
6.32
Chart 10.22. Composition of Indonesian Exports
Share
Promoting Highly Potential SectorsNeed increasing in economies of scale
0 10,000 20,000 30,000 40,000 50,000
Source: UN Comtrade, calculated
Gra�k 10.20. Pangsa Ekspor Produk Sophisticated Ind
Percentage of total manufacture export
0
1
2
7
4
5
6
3
Chemical Machine and Transportation Equipment Leather, Rubber, Textile,Steel, and MetalFurniture, Building Materials, Footwear, and Optics
Product Sophistication (Hausman PRODY index)
Med
ian
PRO
DY
Chart 10.23. Share of Indonesian Sophisticated Product Exports
2.5 3.5 4.53.0 4.0 5.0 5.5
Source: UN Comtrade, calculated
Gra�k 10.21. Hubungan antara Ekspor Produk Sophis
Log Product Sophistication Index (EXPY, 2016)
3.5
3.7
3.9
4.7
4.3
4.5
4.1
GDP per Capita (2016, PPP)
MRT
PHLIND
SYC
PANNZLJPNUSA
ARELUX
IRISGP
MACQAT
MLT
ZWE
KHM
AFG
PAKMMR
GHA GTMLKA
IDNCAF
Chart 10.24. Relationship between Sophisticated Product Exports and GDP per Capita
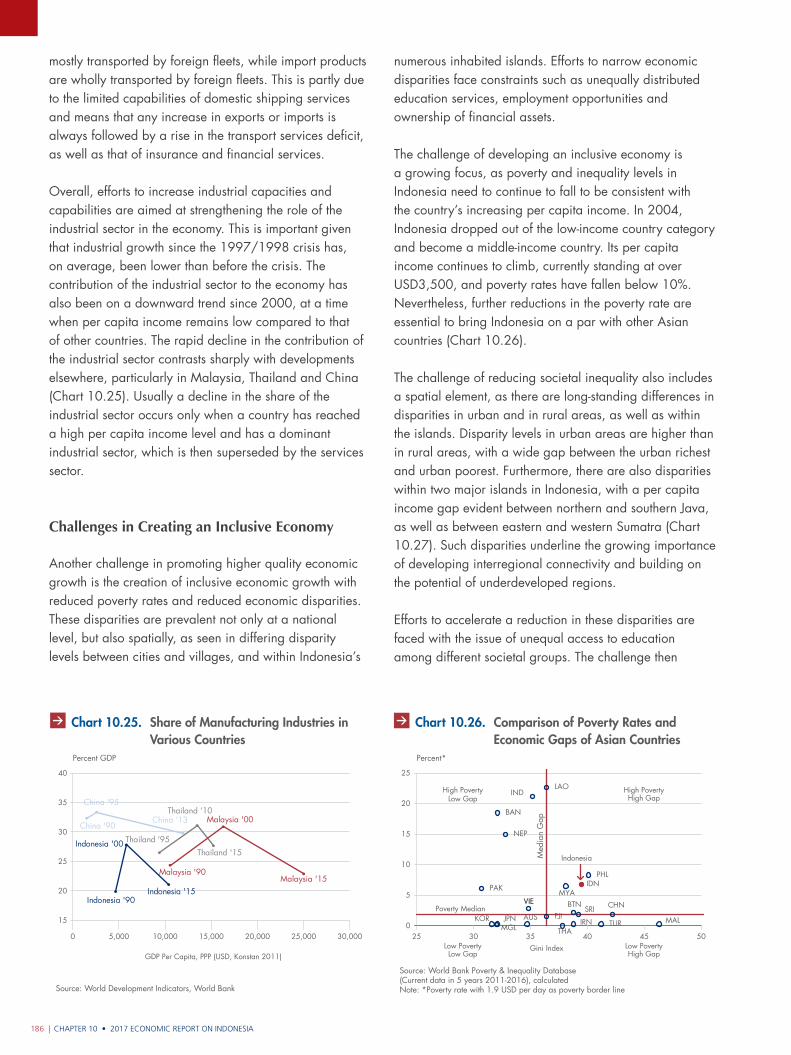
CHAPTER 10 • 2017 ECONOMIC REPORT ON INDONESIA186 |
China '90
China '95
China ‘13
Indonesia '90
Indonesia '00
Indonesia '15
Thailand ‘95
Thailand ‘10
Thailand '15
Malaysia '90
Malaysia '00
Malaysia '15
Gra�k 10.22. Pangsa Industri Pengolahan terhadap P
Source: World Development Indicators, World Bank
Percent GDP
0 10,0005,000 15,000 20,000 25,000 30,000
15
40
35
30
25
20
GDP Per Capita, PPP (USD, Konstan 2011)
Chart 10.25. Share of Manufacturing Industries in Various Countries
mostly transported by foreign fleets, while import products are wholly transported by foreign fleets. This is partly due to the limited capabilities of domestic shipping services and means that any increase in exports or imports is always followed by a rise in the transport services deficit, as well as that of insurance and financial services.
Overall, efforts to increase industrial capacities and capabilities are aimed at strengthening the role of the industrial sector in the economy. This is important given that industrial growth since the 1997/1998 crisis has, on average, been lower than before the crisis. The contribution of the industrial sector to the economy has also been on a downward trend since 2000, at a time when per capita income remains low compared to that of other countries. The rapid decline in the contribution of the industrial sector contrasts sharply with developments elsewhere, particularly in Malaysia, Thailand and China (Chart 10.25). Usually a decline in the share of the industrial sector occurs only when a country has reached a high per capita income level and has a dominant industrial sector, which is then superseded by the services sector.
Challenges in Creating an Inclusive Economy
Another challenge in promoting higher quality economic growth is the creation of inclusive economic growth with reduced poverty rates and reduced economic disparities. These disparities are prevalent not only at a national level, but also spatially, as seen in differing disparity levels between cities and villages, and within Indonesia’s
numerous inhabited islands. Efforts to narrow economic disparities face constraints such as unequally distributed education services, employment opportunities and ownership of financial assets.
The challenge of developing an inclusive economy is a growing focus, as poverty and inequality levels in Indonesia need to continue to fall to be consistent with the country’s increasing per capita income. In 2004, Indonesia dropped out of the low-income country category and become a middle-income country. Its per capita income continues to climb, currently standing at over USD3,500, and poverty rates have fallen below 10%. Nevertheless, further reductions in the poverty rate are essential to bring Indonesia on a par with other Asian countries (Chart 10.26).
The challenge of reducing societal inequality also includes a spatial element, as there are long-standing differences in disparities in urban and in rural areas, as well as within the islands. Disparity levels in urban areas are higher than in rural areas, with a wide gap between the urban richest and urban poorest. Furthermore, there are also disparities within two major islands in Indonesia, with a per capita income gap evident between northern and southern Java, as well as between eastern and western Sumatra (Chart 10.27). Such disparities underline the growing importance of developing interregional connectivity and building on the potential of underdeveloped regions.
Efforts to accelerate a reduction in these disparities are faced with the issue of unequal access to education among different societal groups. The challenge then
25
20
15
10
5
025 30 35 40 45 50
Source: World Bank Poverty & Inequality Database(Current data in 5 years 2011-2016), calculatedNote: *Poverty rate with 1.9 USD per day as poverty border line
Gra�k 10.24. Perbandingan Tingkat Kemiskinan dan
AUS
BAN
BTN CHN FJI
IND
IDN
IRN JPN KOR
LAO
MAL MGL
MYA
NEP
PAK
PHL
SRI
THA TUR
VIE
Gini Index
Indonesia Med
ian
Gap
Poverty Median
Low PovertyLow Gap
Low PovertyHigh Gap
High PovertyLow Gap
High PovertyHigh Gap
Percent*
Chart 10.26. Comparison of Poverty Rates and Economic Gaps of Asian Countries
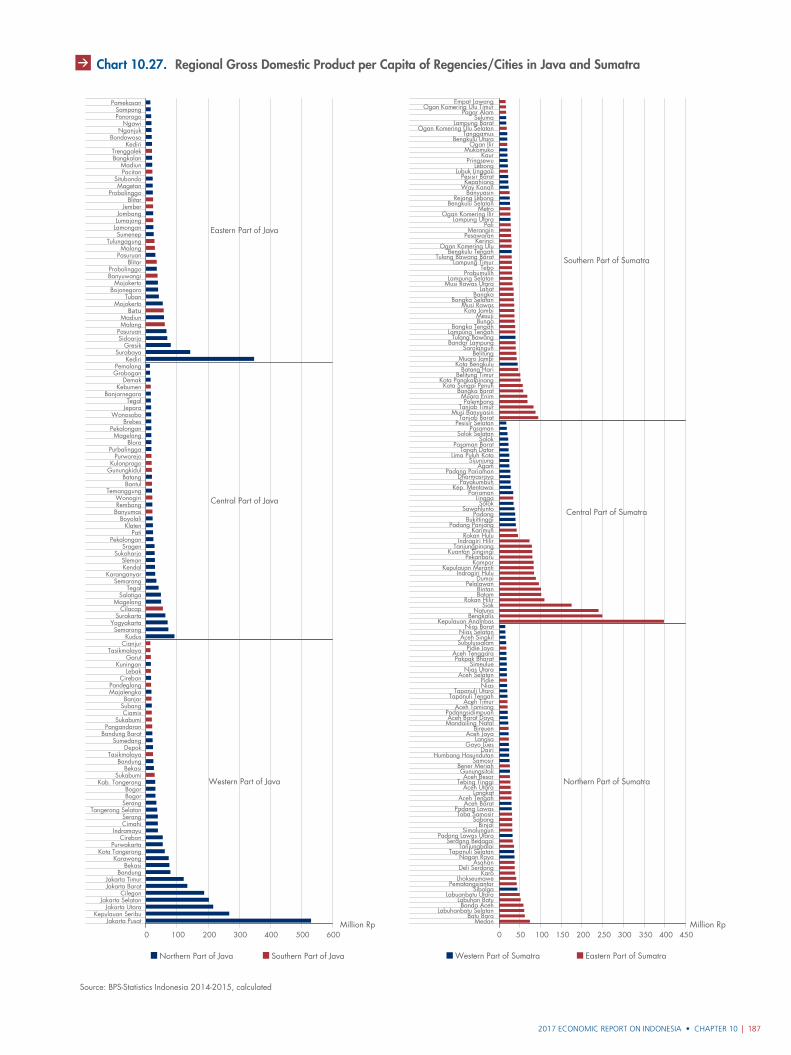
2017 ECONOMIC REPORT ON INDONESIA • CHAPTER 10 | 187
Chart 10.27. Regional Gross Domestic Product per Capita of Regencies/Cities in Java and Sumatra
Source: BPS-Statistics Indonesia 2014-2015, calculated
Northern Part of Java Southern Part of Java Western Part of Sumatra Eastern Part of Sumatra
Northern Part of Sumatra
Central Part of Sumatra
0 100 200 300 400 500 600
Jakarta PusatKepulauan Seribu
Jakarta UtaraJakarta Selatan
CilegonJakarta BaratJakarta Timur
BandungBekasi
KarawangKota Tangerang
PurwakartaCirebon
IndramayuCimahiSerang
Tangerang SelatanSerangBogorBogor
Kab. TangerangSukabumi
BekasiBandung
TasikmalayaDepok
SumedangBandung BaratPangandaran
SukabumiCiamis
SubangBanjar
MajalengkaPandeglang
CirebonLebak
KuninganGarut
TasikmalayaCianjurKudus
SemarangYogyakarta
SurakartaCilacap
MagelangSalatiga
TegalSemarang
KaranganyarKendalSleman
SukoharjoSragen
PekalonganPati
KlatenBoyolali
BanyumasRembangWonogiri
TemanggungBantul
BatangGunungkidulKulonprogo
PurworejoPurbalingga
BloraMagelang
PekalonganBrebes
WonosoboJeparaTegal
BanjarnegaraKebumen
DemakGroboganPemalang
KediriSurabaya
GresikSidoarjoPasuruanMalangMadiun
BatuMojokerto
TubanBojonegoro
MojokertoBanyuwangiProbolinggo
BlitarPasuruanMalang
TulungagungSumenep
LamonganLumajangJombang
JemberBlitar
ProbolinggoMagetan
SitubondoPacitanMadiun
BangkalanTrenggalek
KediriBondowoso
NganjukNgawi
PonorogoSampang
Pamekasan
Million Rp Million Rp0 10050 200150 250 300 350 400 450
MedanBatu Bara
Labuhanbatu SelatanBanda Aceh
Labuhan BatuLabuanbatu Utara
SibolgaPematangsiantar
LhokseumaweKaro
Deli SerdangAsahan
Nagan RayaTapanuli Selatan
TanjungbalaiSerdang Bedagai
Padang Lawas UtaraSimalungun
BinjaiSabang
Toba SamosirPadang Lawas
Aceh BaratAceh Tengah
LangkatAceh Utara
Tebing TinggiAceh Besar
GunungsitoliBener Meriah
SamosirHumbang Hasundutan
DairiGayo Lues
LangsaAceh Jaya
BireuenMandailing NatalAceh Barat Daya
PadangsidimpuanAceh Tamiang
Aceh TimurTapanuli Tengah
Tapanuli UtaraNiasPidie
Aceh SelatanNias Utara
SimeuluePakpak Bharat
Aceh TenggaraPidie Jaya
SubulussalamAceh SingkilNias Selatan
Nias BaratKepulauan Anambas
BengkalisNatuna
SiakRokan Hilir
BatamBintan
PelalawanDumai
Indragiri HuluKepulauan Meranti
KamparPekanbaru
Kuantan SingingiTanjungpinang
Indragiri HilirRokan Hulu
KarimunPadang Panjang
BukittinggiPadang
SawahluntoSolok
LinggaPariaman
Kep. MentawaiPayakumbuh
DharmasrayaPadang Pariaman
AgamSijunjung
Lima Puluh KotaTanah Datar
Pasaman BaratSolok
Solok SelatanPasaman
Pesisir SelatanTanjab Barat
Musi BanyuasinTanjab Timur
PalembangMuara Enim
Bangka BaratKota Sungai Penuh
Kota PangkalpinangBelitung Timur
Batang HariKota BengkuluMuaro Jambi
BelitungSarolangun
Bandar LampungTulang Bawang
Lampung TengahBangka Tengah
BungoMesuji
Kota JambiMusi Rawas
Bangka SelatanBangka
LahatMusi Rawas UtaraLampung Selatan
PrabumulihTebo
Lampung TimurTulang Bawang Barat
Bengkulu TengahOgan Komering Ulu
KerinciPesawaranMerangin
PaliLampung Utara
Ogan Komering IlirMetro
Bengkulu SelatanRejang Lebong
BanyuasinWay KananKepahiang
Pesisir BaratLubuk Linggau
LebongPringsewu
KaurMukomuko
Ogan IlirBengkulu Utara
TanggamusOgan Komering Ulu Selatan
Lampung BaratSeluma
Pagar AlamOgan Komering Ulu Timur
Empat Lawang
Western Part of Java
Central Part of Java
Eastern Part of Java
Southern Part of Sumatra
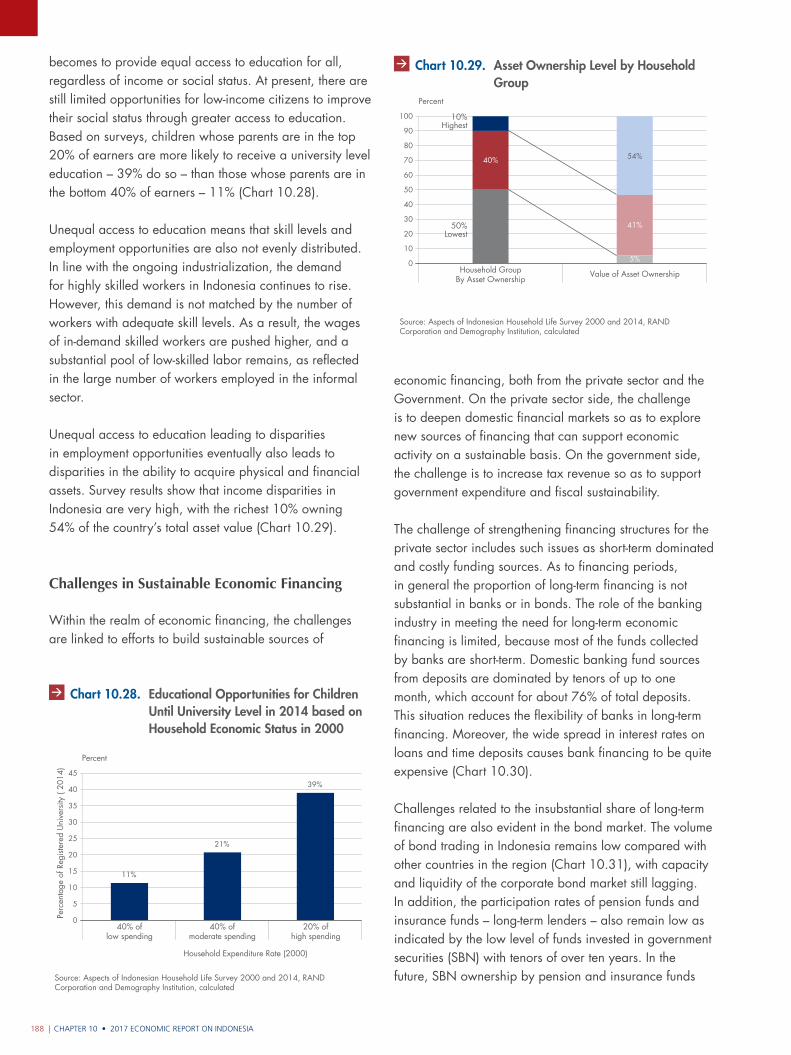
CHAPTER 10 • 2017 ECONOMIC REPORT ON INDONESIA188 |
Source: Aspects of Indonesian Household Life Survey 2000 and 2014, RAND Corporation and Demography Institution, calculated
Gra�k 10.26. Peluang Pendidikan Anak Hingga Univ
Percent
0
15
10
5
45
40
35
30
25
20
40% oflow spending
40% ofmoderate spending
20% ofhigh spending
Perc
enta
ge o
f Reg
iste
red
Uni
vers
ity (
2014
)
Household Expenditure Rate (2000)
11%
21%
39%
Chart 10.28. Educational Opportunities for Children Until University Level in 2014 based on Household Economic Status in 2000
Gra�k 10.27. Tingkat Kepemilikan Aset Berdasarkan
Source: Aspects of Indonesian Household Life Survey 2000 and 2014, RAND Corporation and Demography Institution, calculated
0
60
50
40
30
20
10
70
80
90
100
Percent
5%
40%
41%
54%
10%Highest
50%Lowest
Household GroupBy Asset Ownership
Value of Asset Ownership
Chart 10.29. Asset Ownership Level by Household Group
becomes to provide equal access to education for all, regardless of income or social status. At present, there are still limited opportunities for low-income citizens to improve their social status through greater access to education. Based on surveys, children whose parents are in the top 20% of earners are more likely to receive a university level education – 39% do so – than those whose parents are in the bottom 40% of earners – 11% (Chart 10.28).
Unequal access to education means that skill levels and employment opportunities are also not evenly distributed. In line with the ongoing industrialization, the demand for highly skilled workers in Indonesia continues to rise. However, this demand is not matched by the number of workers with adequate skill levels. As a result, the wages of in-demand skilled workers are pushed higher, and a substantial pool of low-skilled labor remains, as reflected in the large number of workers employed in the informal sector.
Unequal access to education leading to disparities in employment opportunities eventually also leads to disparities in the ability to acquire physical and financial assets. Survey results show that income disparities in Indonesia are very high, with the richest 10% owning 54% of the country’s total asset value (Chart 10.29).
Challenges in Sustainable Economic Financing
Within the realm of economic financing, the challenges are linked to efforts to build sustainable sources of
economic financing, both from the private sector and the Government. On the private sector side, the challenge is to deepen domestic financial markets so as to explore new sources of financing that can support economic activity on a sustainable basis. On the government side, the challenge is to increase tax revenue so as to support government expenditure and fiscal sustainability.
The challenge of strengthening financing structures for the private sector includes such issues as short-term dominated and costly funding sources. As to financing periods, in general the proportion of long-term financing is not substantial in banks or in bonds. The role of the banking industry in meeting the need for long-term economic financing is limited, because most of the funds collected by banks are short-term. Domestic banking fund sources from deposits are dominated by tenors of up to one month, which account for about 76% of total deposits. This situation reduces the flexibility of banks in long-term financing. Moreover, the wide spread in interest rates on loans and time deposits causes bank financing to be quite expensive (Chart 10.30).
Challenges related to the insubstantial share of long-term financing are also evident in the bond market. The volume of bond trading in Indonesia remains low compared with other countries in the region (Chart 10.31), with capacity and liquidity of the corporate bond market still lagging. In addition, the participation rates of pension funds and insurance funds – long-term lenders – also remain low as indicated by the low level of funds invested in government securities (SBN) with tenors of over ten years. In the future, SBN ownership by pension and insurance funds
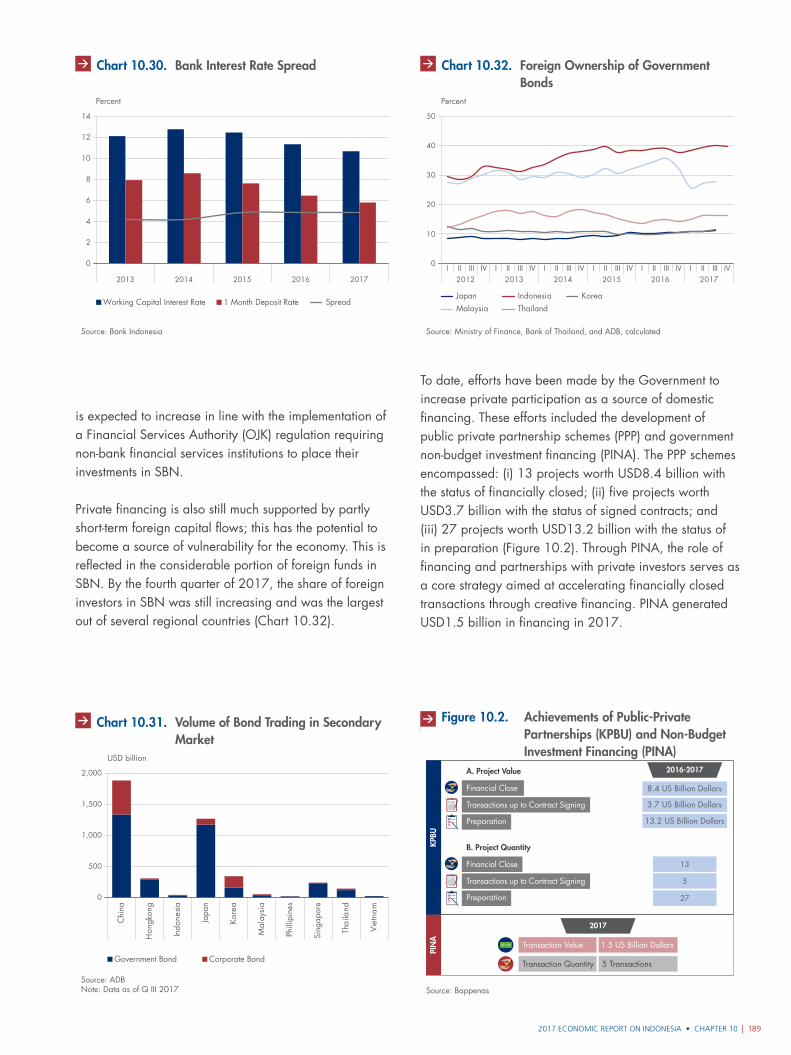
2017 ECONOMIC REPORT ON INDONESIA • CHAPTER 10 | 189
is expected to increase in line with the implementation of a Financial Services Authority (OJK) regulation requiring non-bank financial services institutions to place their investments in SBN.
Private financing is also still much supported by partly short-term foreign capital flows; this has the potential to become a source of vulnerability for the economy. This is reflected in the considerable portion of foreign funds in SBN. By the fourth quarter of 2017, the share of foreign investors in SBN was still increasing and was the largest out of several regional countries (Chart 10.32).
To date, efforts have been made by the Government to increase private participation as a source of domestic financing. These efforts included the development of public private partnership schemes (PPP) and government non-budget investment financing (PINA). The PPP schemes encompassed: (i) 13 projects worth USD8.4 billion with the status of financially closed; (ii) five projects worth USD3.7 billion with the status of signed contracts; and (iii) 27 projects worth USD13.2 billion with the status of in preparation (Figure 10.2). Through PINA, the role of financing and partnerships with private investors serves as a core strategy aimed at accelerating financially closed transactions through creative financing. PINA generated USD1.5 billion in financing in 2017.
2013 2014 2015 2016 2017
Source: Bank Indonesia
Gra�k 10.28. Spread Suku Bunga Perbankan
0
12
14
8
10
4
2
6
Working Capital Interest Rate 1 Month Deposit Rate Spread
Percent
Chart 10.30. Bank Interest Rate Spread
Gambar 10.2. Capaian KPBU dan PINA
Source: Bappenas
2016-2017
8.4 US Billion Dollars
3.7 US Billion Dollars
13.2 US Billion Dollars
13
5
27
A. Project Value
Financial Close
Transactions up to Contract Signing
Preparation
B. Project Quantity
Financial Close
Transactions up to Contract Signing
Preparation
2017
Transaction Quantity 5 Transactions
Transaction Value 1.5 US Billion Dollars
KPBU
PIN
A
Figure 10.2. Achievements of Public‑Private Partnerships (KPBU) and Non‑Budget Investment Financing (PINA)
Gra�k 10.29. Volume Perdagangan Obligasi di Pasar
Source: ADBNote: Data as of Q III 2017
0
500
1,000
1,500
2,000
Chi
na
Hon
gkon
g
Indo
nesia
Japa
n
Kore
a
Mal
aysi
a
Phill
ipin
es
Sing
apor
e
Tha
iland
Viet
nam
Government Bond Corporate Bond
USD billion
Chart 10.31. Volume of Bond Trading in Secondary Market
2012 2013 2014I II III IV I II III IV I II III IV
2015 2016 2017I II III IV I II III IV I II III IV
Source: Ministry of Finance, Bank of Thailand, and ADB, calculated
Gra�k 10.31. Pangsa Kepemilikan Asing pada Obliga
0
10
20
30
40
50
Percent
KoreaJapanMalaysia
IndonesiaThailand
Chart 10.32. Foreign Ownership of Government Bonds
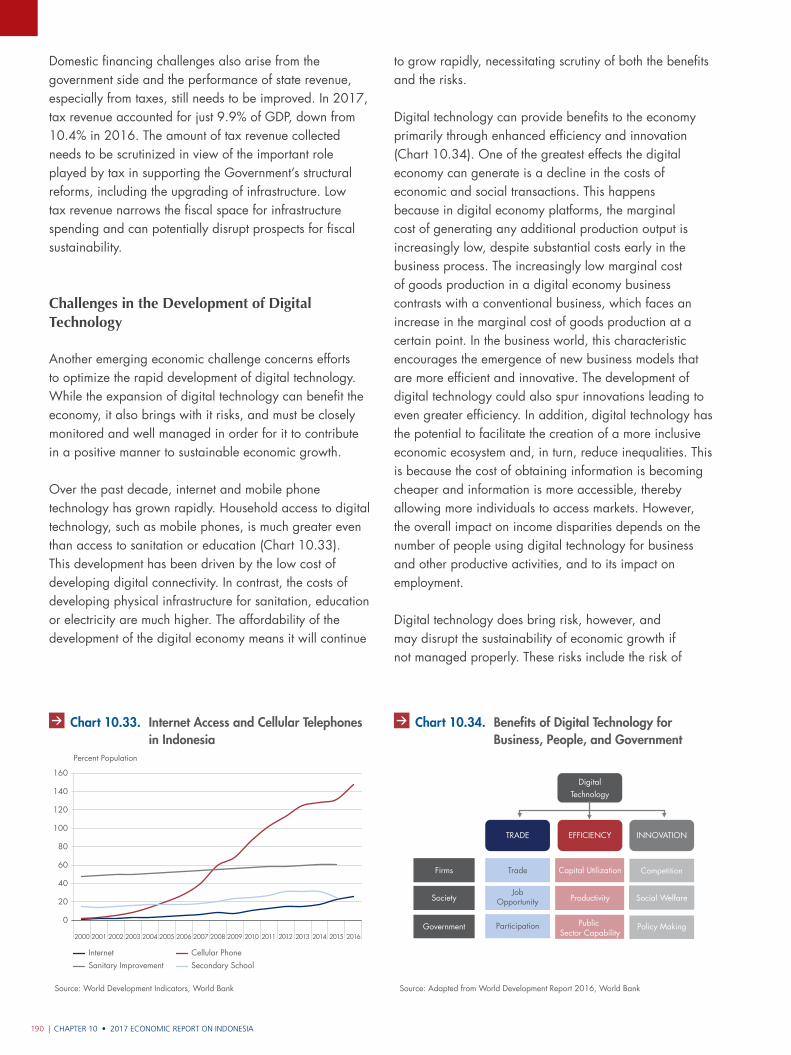
CHAPTER 10 • 2017 ECONOMIC REPORT ON INDONESIA190 |
Domestic financing challenges also arise from the government side and the performance of state revenue, especially from taxes, still needs to be improved. In 2017, tax revenue accounted for just 9.9% of GDP, down from 10.4% in 2016. The amount of tax revenue collected needs to be scrutinized in view of the important role played by tax in supporting the Government’s structural reforms, including the upgrading of infrastructure. Low tax revenue narrows the fiscal space for infrastructure spending and can potentially disrupt prospects for fiscal sustainability.
Challenges in the Development of Digital Technology
Another emerging economic challenge concerns efforts to optimize the rapid development of digital technology. While the expansion of digital technology can benefit the economy, it also brings with it risks, and must be closely monitored and well managed in order for it to contribute in a positive manner to sustainable economic growth.
Over the past decade, internet and mobile phone technology has grown rapidly. Household access to digital technology, such as mobile phones, is much greater even than access to sanitation or education (Chart 10.33). This development has been driven by the low cost of developing digital connectivity. In contrast, the costs of developing physical infrastructure for sanitation, education or electricity are much higher. The affordability of the development of the digital economy means it will continue
to grow rapidly, necessitating scrutiny of both the benefits and the risks.
Digital technology can provide benefits to the economy primarily through enhanced efficiency and innovation (Chart 10.34). One of the greatest effects the digital economy can generate is a decline in the costs of economic and social transactions. This happens because in digital economy platforms, the marginal cost of generating any additional production output is increasingly low, despite substantial costs early in the business process. The increasingly low marginal cost of goods production in a digital economy business contrasts with a conventional business, which faces an increase in the marginal cost of goods production at a certain point. In the business world, this characteristic encourages the emergence of new business models that are more efficient and innovative. The development of digital technology could also spur innovations leading to even greater efficiency. In addition, digital technology has the potential to facilitate the creation of a more inclusive economic ecosystem and, in turn, reduce inequalities. This is because the cost of obtaining information is becoming cheaper and information is more accessible, thereby allowing more individuals to access markets. However, the overall impact on income disparities depends on the number of people using digital technology for business and other productive activities, and to its impact on employment.
Digital technology does bring risk, however, and may disrupt the sustainability of economic growth if not managed properly. These risks include the risk of
2000 2009 2010 2011 2012 2013 2014 2015 20162001 2002 2003 2004 2005 2006 2007 2008
Source: World Development Indicators, World Bank
Gra�k 10.32. Perkembangan Akses Internet dan Mob
0
20
40
60
80
100
120
140
160
Percent Population
Internet Cellular PhoneSanitary Improvement Secondary School
Chart 10.33. Internet Access and Cellular Telephones in Indonesia
Gra�k 10.33. Manfaat Teknologi Digital bagi Dunia U
Source: Adapted from World Development Report 2016, World Bank
TRADE EFFICIENCY INNOVATION
Firms
Society
Government
Trade
JobOpportunity
Participation
Capital Utilization
Productivity
Public Sector Capability
Competition
DigitalTechnology
Social Welfare
Policy Making
Chart 10.34. Benefits of Digital Technology for Business, People, and Government
2017 ECONOMIC REPORT ON INDONESIA • CHAPTER 10 | 191
monopolistic behavior, low employment and risks to the stability of the financial system. Monopolies can emerge when expanded markets and information from digital technology can only be accessed by some economic actors. Low employment can occur if the development of digital literacy among the workforce does not keep up with the rapid development of technology, and the number of highly skilled workers is limited. Indeed, this will exacerbate inequality.
Digital technology offers expanded access to the financial system, with enhanced transaction speeds and low costs. However, business model innovations and digital technology are also changing conventional functions, especially those of the banking industry, which if not anticipated could disrupt the stability of the financial system. Risks in the financial sector are also becoming more complex. These include the risk of money laundering and potential terrorism financing, cyber threats, risks to aspects of consumer protection, along with systemic risks that may upset financial system stability. These risks have implications for the importance of developing a digital connectivity infrastructure across all regions, improving the quality of human capital and strengthening financial system stability.
10.3. Policy DirEction
In general, policy is aimed at guiding the economy towards strong, balanced and sustainable growth. Policy direction is pursued through a policy mix stemming from Bank Indonesia, the Government and relevant authorities. This policy mix includes monetary policy, macroprudential and microprudential policy, payment system and currency management policy, fiscal policy and structural policies. Policy strategies are undertaken while maintaining macroeconomic and financial system stability such that they serve as a basis for sustainable economic growth. Policy strategies are also carried out to mitigate various short-term risks, so as not to disrupt the ongoing process of economic recovery. In addition, policy strategies are aimed at overcoming numerous medium-term challenges so as to create an increasingly robust and resilient economic structure.
Monetary Policy
Bank Indonesia will pursue a policy mix that remains focused on maintaining the macroeconomic stability and financial system stability that has already been achieved, because economic stability is a fundamental prerequisite for sustainable economic recovery. Bank Indonesia’s policy mix consists of three policy pillars – monetary policy, macroprudential policy and payment system and currency management policy (SP–PUR).
As to monetary policy, Bank Indonesia will maintain a measured monetary policy stance consistent with efforts to keep inflation within its target range, and will control the current account deficit at a safe level. To improve the effectiveness of monetary policy, Bank Indonesia will continue to strengthen its monetary operations, pursue an exchange rate policy in line with fundamentals, and move ahead with efforts to deepen financial markets.
Bank Indonesia will also continue to bolster monetary operations to improve the effectiveness of monetary policy. This ongoing strengthening provides space for flexibility in managing bank liquidity and supporting the stability of money market interest rates. In this regard, Bank Indonesia will strengthen the implementation of the rupiah reserve requirement (GWM) averaging mechanism. This policy, implementation of which began in July 2017, is having a positive impact on both the macroeconomy and microeconomy for banks. On the macro side, the policy helps accelerate the deepening of financial markets through the creation of new instruments to absorb additional liquidity when fulfilling the rupiah average reserve requirement, and also boosts money market stability. On the micro side, the policy helps banks improve the efficiency of daily liquidity management and optimize revenue, while maintaining prudential principles. The policy will be refined by expanding the implementation of average reserve requirements so as to include a rupiah reserve requirement and foreign currency reserve requirement for both conventional and Islamic banks. Refinements will also include the adjustment of average reserve requirement ratios and extension of the period for fulfilling average reserve requirements. These refinements will be carried out gradually and in a measured manner, taking into account the condition of financial markets and the readiness of banks.
CHAPTER 10 • 2017 ECONOMIC REPORT ON INDONESIA192 |
Exchange rate policy will aim to maintain the stability of the rupiah in accordance with its fundamental value, while still supporting the operations of market mechanisms. To better manage rupiah stability, Bank Indonesia continues to encourage efforts aimed at reducing dependence on certain currencies. Bank Indonesia will reinforce bilateral cooperation to improve the settlement of bilateral trade transactions using local currency, or local currency settlement (LCS). This is being done by developing LCS schemes facilitated by the authorities or central bank, such as a bilateral currency swap arrangement (BCSA) and an LCS scheme based on appointed cross currency dealers involving both the authorities and the private sector. These schemes will be implemented from early 2018.
Bank Indonesia will also continue to develop non-dollar currency swap hedging transactions with commercial banks by expanding the types of currencies that can be traded. Furthermore, the mitigation of exchange rate risks arising from external debt will be further strengthened. Bank Indonesia will improve the application of prudential principles in managing non-bank corporate external debt, in particular the expansion of external debt coverage. In the same vein, Bank Indonesia will continue to encourage domestic banks to ensure they can provide more efficient hedging instruments to corporations, including through the use of structured products such as call-spread options (CSO).
Bank Indonesia continues to improve efficiency and credibility in financial markets by strengthening both regulations and institutions. On the regulatory side, Bank Indonesia is set to issue regulations on money market and foreign exchange market operators in order to create fair, organized and transparent financial markets. On the institutional side, Bank Indonesia and the relevant authorities are set to establish a central clearing counterparty for over-the-counter derivative financial transactions. Moreover, Bank Indonesia continues to strengthen the credibility of financial markets by encouraging market participants to fulfil their treasury certification obligations, thereby enhancing professionalism and competitiveness at the global level.
Macroprudential and Financial Sector Policy
Bank Indonesia will continue to reinforce macroprudential policy to boost the intermediary function of banks amid well-maintained financial system stability. An
accommodative macroprudential policy stance will be retained as a countercyclical measure to improve the direction of the financial cycle and support the ongoing economic recovery. The strengthening of macroprudential policy will focus on three important aspects: strengthening liquidity, strengthening the intermediary function and enhancing the effectiveness of instruments.
In terms of liquidity strengthening, Bank Indonesia will implement a macroprudential liquidity buffer (MLB) as a means of bolstering the secondary reserve requirement. The MLB requires banks to maintain liquid instruments with a ratio of 4% of deposits in rupiah. Liquid instruments counted in the calculation of MLB are all bank-owned securities in rupiah that can be repurchased by Bank Indonesia in accordance with monetary operation provisions. Under certain conditions and to meet liquidity requirements, such securities may be repurchased by Bank Indonesia – in the framework of open market operations – to a maximum amount of 2% of deposits in rupiah. This policy is expected to support the liquidity management of banks in accordance with their needs, thus mitigating liquidity risks.
To enhance the quality of the intermediary function, Bank Indonesia will implement a macroprudential intermediation ratio (MIR) as a means of strengthening the loan-to-funding ratio (LFR). The target range of the MIR will be 80% to 92%. Unlike the LFR concept, the MIR will accommodate a diversity of banking intermediation forms. It will incorporate bank investments into securities – such as corporate bonds – that meet certain requirements in their calculation. This policy is expected to boost the intermediary function of banks in the real sector in accordance with economic growth and capacity, while maintaining prudential principles and supporting the deepening of financial markets. Meanwhile, in terms of increasing the effectiveness of instruments, Bank Indonesia will continue to improve the effectiveness of macroprudential instruments, including via a targeted loan-to-value (LTV) implementation as a way to mitigate certain sector bubble risks more specifically.
In line with Bank Indonesia’s mandate to manage price stability, its policy to develop micro, small and medium enterprises (MSMEs) will be aligned with efforts to control supply-side inflation. Bank Indonesia will continue to strengthen the development of MSME clusters linked with supply-side inflation control, particularly for food commodities that affect VF inflation. Bank Indonesia
2017 ECONOMIC REPORT ON INDONESIA • CHAPTER 10 | 193
will devise further innovations for existing clusters, and will also add new clusters. This cluster development is mainly for areas that experience difficulty in developing VF commodities, as revealed by the mapping results for each region contained in the Regional Inflation Control Roadmap.
To enhance the capabilities of MSMEs, Bank Indonesia will also prepare policies and infrastructure in various fields, including ease of doing business, production, marketing and finance. In this regard, Bank Indonesia will strengthen its entrepreneurship development program. This program aims to foster the creation of new entrepreneurs who are reliable and innovative, thereby encouraging the growth of new economic centers and creating new jobs. The enhancement of the capabilities of MSMEs requires additional intermediation on the part of banks with MSMEs. To this end, Bank Indonesia will reinforce its commitment to encourage banks to extend credit to MSMEs in accordance with their risk management ability.
As with conventional commercial banks, Bank Indonesia will also implement an MIR and a MLB for Islamic banks. Bank Indonesia will encourage the development of an Islamic economy through the implementation of a 2017 blueprint for Islamic economic and financial development. It will also strengthen cooperation with all relevant stakeholders to consistently promote the three strategy pillars for Islamic economic and finance development. These three pillars are: (i) empowerment of an Islamic economy; (ii) deepening of Islamic financial markets; and (iii) strengthening of research, assessment and education for Islamic economic and finance development (Box 10.3: Bank Indonesia’s Blueprint for Islamic Economic and Financial Development).
Payment System and Currency Management Policy
Bank Indonesia will continue to support economic efficiency in payment systems by referring to the policy guidance contained in the 2017–2024 blueprint on payment system and currency management (SP–PUR). Bank Indonesia will ensure that every economic transaction, both cash and non-cash, takes place securely, efficiently and smoothly. This will enhance Bank Indonesia’s ability to carry out its duty of maintaining macroeconomic and financial system stability.
With regard to non-cash payment systems, Bank Indonesia’s policy direction remains focused on continuing efforts to establish an interconnected, affordable, innovative, competitive non-cash payment ecosystem that protects customers. As to the formation of the National Payment Gateway (NPG), Bank Indonesia will ensure that the functions of standards, services and switching agencies – the three main institutional elements in the NPG – work efficiently. Bank Indonesia will also continue to encourage these NPG agencies to expand the scope of interconnection and interoperability. In 2018, there will be a focus on expanding the development of electronic bill invoicing, presentment and payment for the purpose of integrating routine bill payments, particularly those related to government revenue and expenditure.
Through the electronification program, Bank Indonesia will help to ensure that the beneficiaries of non-cash assistance are more widespread. In 2018, the target is to increase the number of beneficiaries of non-cash assistance from the Family Hope Program and Non-Cash Food Assistance (BPNT) to 10 million beneficiary families.
Bank Indonesia will also support the Government’s efforts to strengthen the efficiency and governance of central and regional government financial transactions from January 2018, as instructed by the Minister of Home Affairs. This will be achieved through the expansion of electronification programs, including in the distribution of non-cash village funds and school operational assistance, as well as smart cities, urban areas that use technology to optimize resources and services.
Electronification will be expanded to public transport and infrastructure through the use of non-cash payment instruments to improve efficiency and good governance. Bank Indonesia and the payment system industry are reviewing a proposal to establish an overarching entity responsible for electronic fare collection from the various transport operators. This entity will be able to integrate intermodal and inter-operator payment systems. Further, the initiative also helps to prepare for the integration of transport that is set to begin in the Greater Jakarta (Jabodetabek) area in 2018. Bank Indonesia and the industry also plan to set up an electronic toll collection consortium with the goal of using multi-lane free flow technology for toll road transactions from December 2018.
CHAPTER 10 • 2017 ECONOMIC REPORT ON INDONESIA194 |
On the supervision front, Bank Indonesia continues to strengthen payment system policy and supervision. In 2018, Bank Indonesia’s policy is focused on bolstering the payment system supervisory framework by implementing risk-based supervision.
In the area of currency management, Bank Indonesia will ensure there is an adequate supply of currency fit for circulation in all corners of Indonesia through its centralized cash network planning (CCNP). It will also protect the public from counterfeit currency, and will not only ensure there is enough currency in circulation, but also that the right denominations are available. To achieve this, Bank Indonesia will continue to strengthen cash services by working with its partners. Bank Indonesia collaborated with banks that act as cash custodians to bring cash services to all of Indonesia’s regencies and cities by the end of 2017. Bank Indonesia is also extending the reach of cash services to the sub-districts and to remote, outlying and underdeveloped (3T) areas through the BI-Jangkau (BI-Reach) and Kas Kepulauan (Archipelago Cash) programs. Further, Bank Indonesia will ensure that the supply of good-quality currency is maintained and that currency security is strengthened. Bank Indonesia will also continue to improve the quality of rupiah currency and protect the public from counterfeits, in part by intensified training for rupiah currency handling service providers (PJPUR).
Policy Coordination
To boost the effectiveness of the policies it pursues, Bank Indonesia continues to strengthen coordination with both central and regional stakeholders. Coordination between Bank Indonesia and the Government has been effective and will be further enhanced, including via: (i) Round Table Policy Dialogues; (ii) the Central Inflation Control Team (TPIP) and Regional Inflation Control Teams (TPID); (iii) Central Government, Local Government and Bank Indonesia Coordination Meetings (Rakorpusda); (iv) investor relations units at both the central and regional levels; (v) The Financial System Stability Committee (KSSK); (vi) the National Committee for Islamic Finance (KNKS); (vii) the Indonesia Payment System Forum; and (viii) the Coordination Forum for Development Financing through Financial Markets (FK-PPPK). Further, in order to encourage structural reforms, Bank Indonesia is coordinating with the Government through working groups to evaluate and
analyze the impact of implemented economic policy packages.
In order to deepen financial markets through the FK-PPPK, Bank Indonesia, the Ministry of Finance and OJK will prepare the National Strategy for Financial Market Development and Deepening (SN-PPPK). This will set out a work plan developed from three development pillars: (i) sources of economic financing and risk management; (ii) development of financial market infrastructure; and (iii) policy coordination, harmonization of provisions, and education. Through the SN-PPPK, for the first time Indonesia will have a shared vision and a measurable work program towards the creation of more robust Indonesian financial markets.
Bank Indonesia will continue to coordinate with the Government to manage liquidity optimally, in order to strengthen the stability of the money market. Joint communications to market participants about the commitment to maintaining liquidity will also be further strengthened. Good communications allow market actors – including authorities – to anticipate changes, especially when there is a spike in demand for liquidity.
Bank Indonesia will also continue to enhance coordination with OJK and the Deposit Insurance Corporation (LPS) to ensure stability of the financial system. Coordinating on information derived from the supervision of systemic banks has taken place periodically, as mandated by Article 17 of the Financial System Crisis Prevention and Mitigation Law. Cooperation between Bank Indonesia and the LPS will be stepped up, most notably in terms of the exchange of data and information on the ownership of LPS government securities (SBN LPS), following the approval of the SBN LPS Purchase Cooperation Agreement by Bank Indonesia.
In the area of payment system functions, authorities need to synergize policies to respond to the rapid development of digital technology. Bank Indonesia will ensure a smooth registration process for financial technology (fintech) providers, including e-commerce companies, as outlined in the Bank Indonesia Regulation on Fintech. Bank Indonesia has set up a regulatory sandbox, a testing ground for fintech innovation, and is collaborating on this with the OJK, Ministry of Trade, Ministry of Manpower and Ministry of Communications and Informatics.
2017 ECONOMIC REPORT ON INDONESIA • CHAPTER 10 | 195
Elsewhere, efforts are also increasing to improve the quality of rupiah currency in circulation and reduce counterfeit currency. This is being achieved through coordination between Bank Indonesia and all partners in the Coordinating Agency for Counterfeit Money Eradication, which comprises: (i) the State Intelligence Agency; (ii) the police force; (iii) the Attorney General’s Office; and (iv) the Ministry of Finance. This coordination includes efforts to prevent, expose and crack down on the crime of creating and circulating counterfeiting currency. This is complemented by attempts to improve the quality of education about counterfeiting and the characteristics of genuine rupiah notes. It is also achieved by enhanced coordination among relevant authorities and agencies, including by integrating the BI-Counterfeit Analysis Center information system with banks and the police and establishing counterfeit money analysis laboratories in West Java, Central Java and East Java.
Bank Indonesia is strengthening its coordination with the Government as the number of looming free trade agreements mounts. Intensive cooperation on these agreements is needed between Bank Indonesia and the Government, amid a growing tendency of peer countries also to implement free trade agreements. It is necessary to design a comprehensive working strategy and mechanism so that Indonesia can gain the maximum benefit from this openness. In the context of broader international cooperation, Bank Indonesia’s involvement in the Government’s free trade agreements / Comprehensive Economic Partnership Agreement (CEPA) is aimed at securing policy space. In addition, Bank Indonesia is also involved to ensure that the commitment to liberalization is in line with its own programs on developing payment system services and fintech. In this regard, Bank Indonesia actively supports the Government in integration of the financial services sector, pursuant to the goals of the ASEAN Economic Community. Furthermore, to strengthen the process of formulating Indonesia’s position and coordination at the national level, Bank Indonesia will continue to organize dedicated team meetings in the financial sector as a means of coordinating and calibrating the positions of each related agency with regard to FTA/CEPA cooperation.
Coordination is also being carried out consistently by Bank Indonesia to boost Indonesia’s sovereign credit rating and to shape a positive perception of the Indonesian economy. Bank Indonesia will continue to strengthen its regional and global investor relations units and this in turn
is expected to help facilitate the flow of foreign capital into Indonesia and support regional economic development. This strengthening is achieved by linkage between the three types of investor relations units, namely at the head office, domestic Bank Indonesia representative offices and Bank Indonesia representative offices abroad. The three main elements of the investor relations units – institutions, investor relations strategies, and data and information dissemination – are all being reinforced.
Fiscal Policy
The Government has established three fiscal policy strategies to accelerate Indonesia’s economic growth. The first is to optimize state revenue while preserving the investment climate. Secondly, it will ensure efficient spending and ramp up productive spending to support priority programs. The third strategy focuses on encouraging efficient, innovative and sustainable financing.
To optimize state revenue, the Government will continue with tax reforms to improve tax revenues. This is to be done partly through (i) the exchange of tax information/automatic exchange of information to increase the tax base and prevent tax avoidance; (ii) using data and an up-to-date and integrated tax information system; and (iii) the granting of tax incentives to promote investment and business enthusiasm. Non-tax state revenue (PNBP) is to be optimized. However, the Government should not only focus on collecting PNBP, but should also concern itself with citizens’ satisfaction with services, and with the preservation of natural resources. The PNBP optimization policy is to be partly carried out through regulatory revisions (Revised Law on PNBP and Government Regulation/PP on non-tax state revenue types and tariffs) and the application of gross split production sharing contracts.
Elsewhere, the Government will strengthen the quality and efficiency of state spending by improving the quality of capital expenditure. This will be done by increasing productive spending, such as the development of infrastructure and interregional connectivity, construction of electricity infrastructure and facilities, and the provision of housing, sanitation and clean water. In addition, the efficiency of non-priority expenditure is continuously being enhanced through: (i) targeted goods and subsidy spending; (ii) synergies of social security programs; (iii)
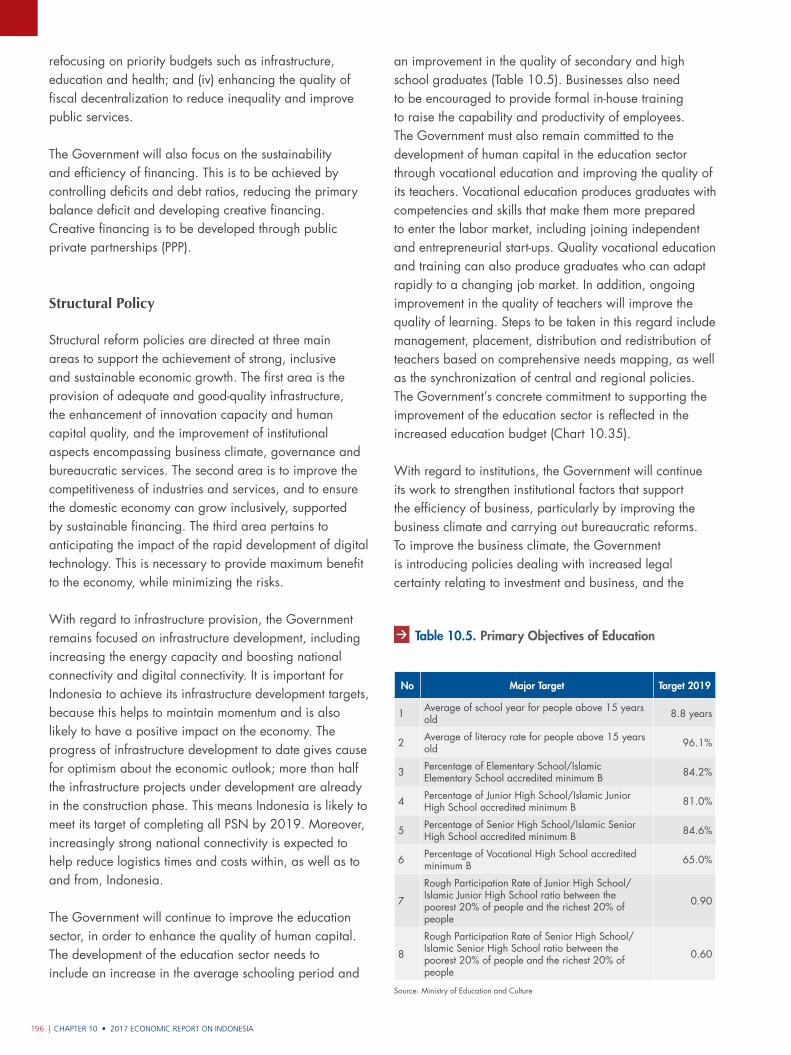
CHAPTER 10 • 2017 ECONOMIC REPORT ON INDONESIA196 |
refocusing on priority budgets such as infrastructure, education and health; and (iv) enhancing the quality of fiscal decentralization to reduce inequality and improve public services.
The Government will also focus on the sustainability and efficiency of financing. This is to be achieved by controlling deficits and debt ratios, reducing the primary balance deficit and developing creative financing. Creative financing is to be developed through public private partnerships (PPP).
Structural Policy
Structural reform policies are directed at three main areas to support the achievement of strong, inclusive and sustainable economic growth. The first area is the provision of adequate and good-quality infrastructure, the enhancement of innovation capacity and human capital quality, and the improvement of institutional aspects encompassing business climate, governance and bureaucratic services. The second area is to improve the competitiveness of industries and services, and to ensure the domestic economy can grow inclusively, supported by sustainable financing. The third area pertains to anticipating the impact of the rapid development of digital technology. This is necessary to provide maximum benefit to the economy, while minimizing the risks.
With regard to infrastructure provision, the Government remains focused on infrastructure development, including increasing the energy capacity and boosting national connectivity and digital connectivity. It is important for Indonesia to achieve its infrastructure development targets, because this helps to maintain momentum and is also likely to have a positive impact on the economy. The progress of infrastructure development to date gives cause for optimism about the economic outlook; more than half the infrastructure projects under development are already in the construction phase. This means Indonesia is likely to meet its target of completing all PSN by 2019. Moreover, increasingly strong national connectivity is expected to help reduce logistics times and costs within, as well as to and from, Indonesia.
The Government will continue to improve the education sector, in order to enhance the quality of human capital. The development of the education sector needs to include an increase in the average schooling period and
an improvement in the quality of secondary and high school graduates (Table 10.5). Businesses also need to be encouraged to provide formal in-house training to raise the capability and productivity of employees. The Government must also remain committed to the development of human capital in the education sector through vocational education and improving the quality of its teachers. Vocational education produces graduates with competencies and skills that make them more prepared to enter the labor market, including joining independent and entrepreneurial start-ups. Quality vocational education and training can also produce graduates who can adapt rapidly to a changing job market. In addition, ongoing improvement in the quality of teachers will improve the quality of learning. Steps to be taken in this regard include management, placement, distribution and redistribution of teachers based on comprehensive needs mapping, as well as the synchronization of central and regional policies. The Government’s concrete commitment to supporting the improvement of the education sector is reflected in the increased education budget (Chart 10.35).
With regard to institutions, the Government will continue its work to strengthen institutional factors that support the efficiency of business, particularly by improving the business climate and carrying out bureaucratic reforms. To improve the business climate, the Government is introducing policies dealing with increased legal certainty relating to investment and business, and the
No Major Target Target 2019
1 Average of school year for people above 15 years old 8.8 years
2 Average of literacy rate for people above 15 years old 96.1%
3 Percentage of Elementary School/Islamic Elementary School accredited minimum B 84.2%
4 Percentage of Junior High School/Islamic Junior High School accredited minimum B 81.0%
5 Percentage of Senior High School/Islamic Senior High School accredited minimum B 84.6%
6 Percentage of Vocational High School accredited minimum B 65.0%
7
Rough Participation Rate of Junior High School/Islamic Junior High School ratio between the poorest 20% of people and the richest 20% of people
0.90
8
Rough Participation Rate of Senior High School/Islamic Senior High School ratio between the poorest 20% of people and the richest 20% of people
0.60
Source: Ministry of Education and Culture
Table 10.5. Primary Objectives of Education
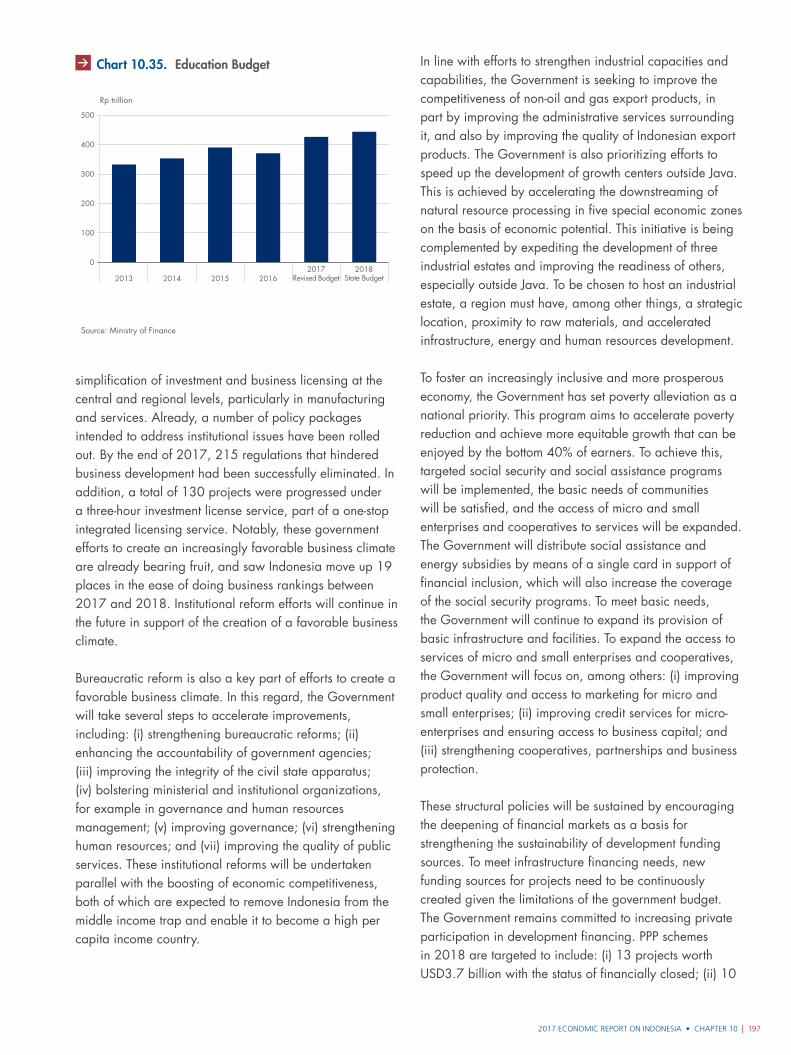
2017 ECONOMIC REPORT ON INDONESIA • CHAPTER 10 | 197
simplification of investment and business licensing at the central and regional levels, particularly in manufacturing and services. Already, a number of policy packages intended to address institutional issues have been rolled out. By the end of 2017, 215 regulations that hindered business development had been successfully eliminated. In addition, a total of 130 projects were progressed under a three-hour investment license service, part of a one-stop integrated licensing service. Notably, these government efforts to create an increasingly favorable business climate are already bearing fruit, and saw Indonesia move up 19 places in the ease of doing business rankings between 2017 and 2018. Institutional reform efforts will continue in the future in support of the creation of a favorable business climate.
Bureaucratic reform is also a key part of efforts to create a favorable business climate. In this regard, the Government will take several steps to accelerate improvements, including: (i) strengthening bureaucratic reforms; (ii) enhancing the accountability of government agencies; (iii) improving the integrity of the civil state apparatus; (iv) bolstering ministerial and institutional organizations, for example in governance and human resources management; (v) improving governance; (vi) strengthening human resources; and (vii) improving the quality of public services. These institutional reforms will be undertaken parallel with the boosting of economic competitiveness, both of which are expected to remove Indonesia from the middle income trap and enable it to become a high per capita income country.
In line with efforts to strengthen industrial capacities and capabilities, the Government is seeking to improve the competitiveness of non-oil and gas export products, in part by improving the administrative services surrounding it, and also by improving the quality of Indonesian export products. The Government is also prioritizing efforts to speed up the development of growth centers outside Java. This is achieved by accelerating the downstreaming of natural resource processing in five special economic zones on the basis of economic potential. This initiative is being complemented by expediting the development of three industrial estates and improving the readiness of others, especially outside Java. To be chosen to host an industrial estate, a region must have, among other things, a strategic location, proximity to raw materials, and accelerated infrastructure, energy and human resources development.
To foster an increasingly inclusive and more prosperous economy, the Government has set poverty alleviation as a national priority. This program aims to accelerate poverty reduction and achieve more equitable growth that can be enjoyed by the bottom 40% of earners. To achieve this, targeted social security and social assistance programs will be implemented, the basic needs of communities will be satisfied, and the access of micro and small enterprises and cooperatives to services will be expanded. The Government will distribute social assistance and energy subsidies by means of a single card in support of financial inclusion, which will also increase the coverage of the social security programs. To meet basic needs, the Government will continue to expand its provision of basic infrastructure and facilities. To expand the access to services of micro and small enterprises and cooperatives, the Government will focus on, among others: (i) improving product quality and access to marketing for micro and small enterprises; (ii) improving credit services for micro-enterprises and ensuring access to business capital; and (iii) strengthening cooperatives, partnerships and business protection.
These structural policies will be sustained by encouraging the deepening of financial markets as a basis for strengthening the sustainability of development funding sources. To meet infrastructure financing needs, new funding sources for projects need to be continuously created given the limitations of the government budget. The Government remains committed to increasing private participation in development financing. PPP schemes in 2018 are targeted to include: (i) 13 projects worth USD3.7 billion with the status of financially closed; (ii) 10
Source: Ministry of Finance
0
100
200
300
400
500
Rp trillion
2013 2014 2015 20162017
Revised Budget2018
State Budget
Chart 10.35. Education Budget
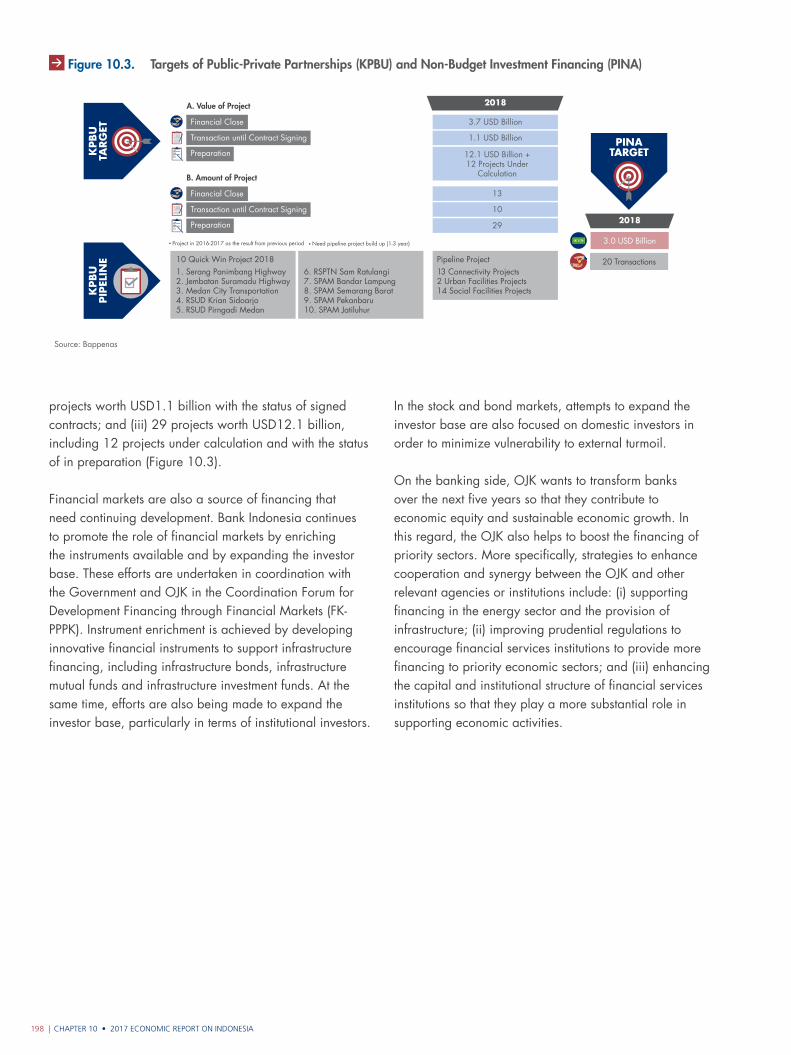
CHAPTER 10 • 2017 ECONOMIC REPORT ON INDONESIA198 |
projects worth USD1.1 billion with the status of signed contracts; and (iii) 29 projects worth USD12.1 billion, including 12 projects under calculation and with the status of in preparation (Figure 10.3).
Financial markets are also a source of financing that need continuing development. Bank Indonesia continues to promote the role of financial markets by enriching the instruments available and by expanding the investor base. These efforts are undertaken in coordination with the Government and OJK in the Coordination Forum for Development Financing through Financial Markets (FK-PPPK). Instrument enrichment is achieved by developing innovative financial instruments to support infrastructure financing, including infrastructure bonds, infrastructure mutual funds and infrastructure investment funds. At the same time, efforts are also being made to expand the investor base, particularly in terms of institutional investors.
Gambar 10.3. PINA
Source: Bappenas
KPBU
TARG
ETK
PBU
PIP
ELIN
E 10 Quick Win Project 20181. Serang Panimbang Highway2. Jembatan Suramadu Highway3. Medan City Transportation4. RSUD Krian Sidoarjo5. RSUD Pirngadi Medan
Pipeline Project13 Connectivity Projects2 Urban Facilities Projects14 Social Facilities Projects
6. RSPTN Sam Ratulangi7. SPAM Bandar Lampung8. SPAM Semarang Barat9. SPAM Pekanbaru10. SPAM Jatiluhur
A. Value of Project
Financial Close
Transaction until Contract Signing
Preparation
B. Amount of Project
Financial Close
Transaction until Contract Signing
Preparation
Project in 2016-2017 as the result from previous period Need pipeline project build up (1-3 year)
2018
3.7 USD Billion
1.1 USD Billion
13
10
29
12.1 USD Billion + 12 Projects Under
Calculation
PINATARGET
3.0 USD Billion
20 Transactions
2018
Figure 10.3. Targets of Public‑Private Partnerships (KPBU) and Non‑Budget Investment Financing (PINA)
In the stock and bond markets, attempts to expand the investor base are also focused on domestic investors in order to minimize vulnerability to external turmoil.
On the banking side, OJK wants to transform banks over the next five years so that they contribute to economic equity and sustainable economic growth. In this regard, the OJK also helps to boost the financing of priority sectors. More specifically, strategies to enhance cooperation and synergy between the OJK and other relevant agencies or institutions include: (i) supporting financing in the energy sector and the provision of infrastructure; (ii) improving prudential regulations to encourage financial services institutions to provide more financing to priority economic sectors; and (iii) enhancing the capital and institutional structure of financial services institutions so that they play a more substantial role in supporting economic activities.
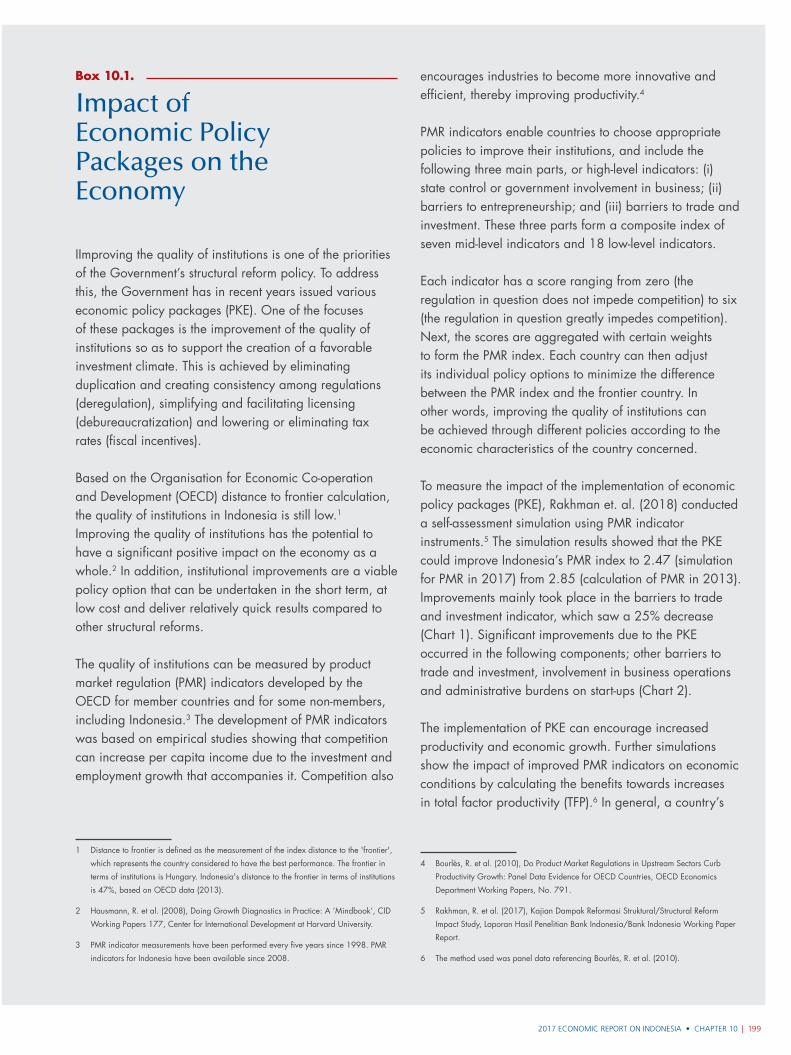
2017 ECONOMIC REPORT ON INDONESIA • CHAPTER 10 | 199
Box 10.1.
Impact of Economic Policy Packages on the Economy
IImproving the quality of institutions is one of the priorities of the Government’s structural reform policy. To address this, the Government has in recent years issued various economic policy packages (PKE). One of the focuses of these packages is the improvement of the quality of institutions so as to support the creation of a favorable investment climate. This is achieved by eliminating duplication and creating consistency among regulations (deregulation), simplifying and facilitating licensing (debureaucratization) and lowering or eliminating tax rates (fiscal incentives).
Based on the Organisation for Economic Co-operation and Development (OECD) distance to frontier calculation, the quality of institutions in Indonesia is still low.1 Improving the quality of institutions has the potential to have a significant positive impact on the economy as a whole.2 In addition, institutional improvements are a viable policy option that can be undertaken in the short term, at low cost and deliver relatively quick results compared to other structural reforms.
The quality of institutions can be measured by product market regulation (PMR) indicators developed by the OECD for member countries and for some non-members, including Indonesia.3 The development of PMR indicators was based on empirical studies showing that competition can increase per capita income due to the investment and employment growth that accompanies it. Competition also
1 Distance to frontier is defined as the measurement of the index distance to the 'frontier',
which represents the country considered to have the best performance. The frontier in
terms of institutions is Hungary. Indonesia's distance to the frontier in terms of institutions
is 47%, based on OECD data (2013).
2 Hausmann, R. et al. (2008), Doing Growth Diagnostics in Practice: A ‘Mindbook’, CID
Working Papers 177, Center for International Development at Harvard University.
3 PMR indicator measurements have been performed every five years since 1998. PMR
indicators for Indonesia have been available since 2008.
encourages industries to become more innovative and efficient, thereby improving productivity.4
PMR indicators enable countries to choose appropriate policies to improve their institutions, and include the following three main parts, or high-level indicators: (i) state control or government involvement in business; (ii) barriers to entrepreneurship; and (iii) barriers to trade and investment. These three parts form a composite index of seven mid-level indicators and 18 low-level indicators.
Each indicator has a score ranging from zero (the regulation in question does not impede competition) to six (the regulation in question greatly impedes competition). Next, the scores are aggregated with certain weights to form the PMR index. Each country can then adjust its individual policy options to minimize the difference between the PMR index and the frontier country. In other words, improving the quality of institutions can be achieved through different policies according to the economic characteristics of the country concerned.
To measure the impact of the implementation of economic policy packages (PKE), Rakhman et. al. (2018) conducted a self-assessment simulation using PMR indicator instruments.5 The simulation results showed that the PKE could improve Indonesia’s PMR index to 2.47 (simulation for PMR in 2017) from 2.85 (calculation of PMR in 2013). Improvements mainly took place in the barriers to trade and investment indicator, which saw a 25% decrease (Chart 1). Significant improvements due to the PKE occurred in the following components; other barriers to trade and investment, involvement in business operations and administrative burdens on start-ups (Chart 2).
The implementation of PKE can encourage increased productivity and economic growth. Further simulations show the impact of improved PMR indicators on economic conditions by calculating the benefits towards increases in total factor productivity (TFP).6 In general, a country’s
4 Bourlès, R. et al. (2010), Do Product Market Regulations in Upstream Sectors Curb
Productivity Growth: Panel Data Evidence for OECD Countries, OECD Economics
Department Working Papers, No. 791.
5 Rakhman, R. et al. (2017), Kajian Dampak Reformasi Struktural/Structural Reform
Impact Study, Laporan Hasil Penelitian Bank Indonesia/Bank Indonesia Working Paper
Report.
6 The method used was panel data referencing Bourlès, R. et al. (2010).
CHAPTER 10 • 2017 ECONOMIC REPORT ON INDONESIA200 |
TFP changes are modelled as a result of changes in global TFP (spillover effect), TFP differences with frontier countries (technology catch up effect) and regulatory barriers (PMR index). Based on the estimates made, the contribution of rises in TFP due to the Government’s economic policy packages will continue to increase over the next few years (Table 1). The contribution of increases in TFP is estimated at 0.03% in 2017, rising to 0.62% by 2022. The impact of such rises in TFP can also be translated as an increase in economic growth.7
7 The elasticity of TFP to economic growth is assumed to be equal to one.
PMR 2013 2017 Scenario
Gra�k 2 Boks 10.1. Perkembangan PMR Indonesia –
Other barriers to tradeand investmentExplicit barriers to tradeand investmentRegulatory protectionof incumbentsAdministrativeburdens onComplexity ofregulatory proceduresInvolvement inbusiness operationPublic ownership
PMR Score
0
3.5
2.5
3.0
1.5
2.0
0.5
1.0
0.92 0.88
0.43 0.34
0.15 0.13
0.31 0.24
0.45 0.42
0.27
0.25
0.33
0.21
Source: Bank Indonesia
Chart 2. Indonesia PMR Simulation – Medium Level
Table 1. PMR Impact on TFP
Year Contribution of TFP Hike
2017 0.03%
2018 0.24%
2019 0.38%
2020 0.49%
2021 0.57%
2022 0.62%
Source: Bank Indonesia
PMR 2013 2017 Scenario
0
3.5
2.5
3.0
1.5
2.0
0.5
1.0
State controlBarriers to trade and investment Barriers to entrepreneurship
PMR Score
1.35 1.23
0.910.79
0.6
0.45
Gra�k 1 Boks 10.1. Perkembangan PMR Indonesia –
Source: Bank Indonesia
Chart 1. Indonesia PMR Simulation – High Level
The implementation of these economic policy packages or PKE is backed up by the formation of the PKE Implementation Task Force.8 Bank Indonesia plays an active role in this task force, especially in Working Group (Pokja) III, which is responsible for the evaluation and analysis of the impact of economic policies. In general, the duties of Pokja III include: (i) monitoring and inventorying problems and obstacles in the implementation of economic policies; (ii) evaluating and analyzing the effectiveness and impact of economic policy implementation; (iii) reviewing new proposals for deregulation; and (iv) preparing and submitting policy recommendations to the task force regarding evaluations and analyses of the impact of economic policies.
8 The task force was formed as part of the implementation of Presidential Instruction
(Inpres) No.12 of 2015 on Increasing Industrial Competitiveness, Industrial
Independence, and Business Certainty. The PKE Implementation Task Force consists of
leaders, support units and Working Groups I-IV.
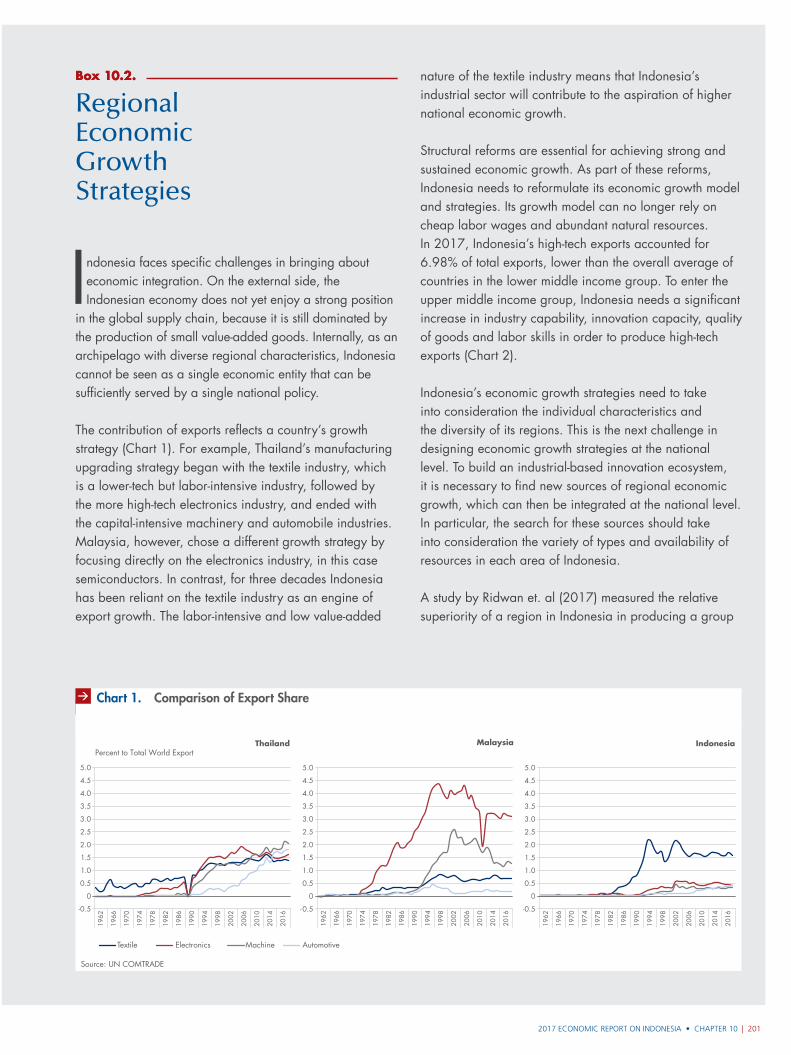
2017 ECONOMIC REPORT ON INDONESIA • CHAPTER 10 | 201
Box 10.2.
Regional Economic Growth Strategies
Indonesia faces specific challenges in bringing about economic integration. On the external side, the Indonesian economy does not yet enjoy a strong position
in the global supply chain, because it is still dominated by the production of small value-added goods. Internally, as an archipelago with diverse regional characteristics, Indonesia cannot be seen as a single economic entity that can be sufficiently served by a single national policy.
The contribution of exports reflects a country’s growth strategy (Chart 1). For example, Thailand’s manufacturing upgrading strategy began with the textile industry, which is a lower-tech but labor-intensive industry, followed by the more high-tech electronics industry, and ended with the capital-intensive machinery and automobile industries. Malaysia, however, chose a different growth strategy by focusing directly on the electronics industry, in this case semiconductors. In contrast, for three decades Indonesia has been reliant on the textile industry as an engine of export growth. The labor-intensive and low value-added
Box 10.2.
-0.5
0
0.5
1.0
1.5
2.0
2.5
3.0
3.5
4.0
4.5
5.0
Source: UN COMTRADE
Gra�k 1 Box 10.3. Dinamika Sektor Industri Thailand
Percent to Total World ExportThailand Malaysia Indonesia
Textile Electronics Machine Automotive
-0.5
0
0.5
1.0
1.5
2.0
2.5
3.0
3.5
4.0
4.5
5.0
1962
1966
1970
1974
1978
1982
1986
1990
1994
1998
2002
2006
2010
2014
2016
1962
1966
1970
1974
1978
1982
1986
1990
1994
1998
2002
2006
2010
2014
2016
-0.5
0
0.5
1.0
1.5
2.0
2.5
3.0
3.5
4.0
4.5
5.0
1962
1966
1970
1974
1978
1982
1986
1990
1994
1998
2002
2006
2010
2014
2016
Chart 1. Comparison of Export Share
nature of the textile industry means that Indonesia’s industrial sector will contribute to the aspiration of higher national economic growth.
Structural reforms are essential for achieving strong and sustained economic growth. As part of these reforms, Indonesia needs to reformulate its economic growth model and strategies. Its growth model can no longer rely on cheap labor wages and abundant natural resources. In 2017, Indonesia’s high-tech exports accounted for 6.98% of total exports, lower than the overall average of countries in the lower middle income group. To enter the upper middle income group, Indonesia needs a significant increase in industry capability, innovation capacity, quality of goods and labor skills in order to produce high-tech exports (Chart 2).
Indonesia’s economic growth strategies need to take into consideration the individual characteristics and the diversity of its regions. This is the next challenge in designing economic growth strategies at the national level. To build an industrial-based innovation ecosystem, it is necessary to find new sources of regional economic growth, which can then be integrated at the national level. In particular, the search for these sources should take into consideration the variety of types and availability of resources in each area of Indonesia.
A study by Ridwan et. al (2017) measured the relative superiority of a region in Indonesia in producing a group
CHAPTER 10 • 2017 ECONOMIC REPORT ON INDONESIA202 |
of goods with regard to international trade (exports).1 The study used the RCPA (revealed comparative product advantage) and LQ (location quotient) approaches.2 Subsequently, identified potential economic sectors were selected to serve as regional competitive potential industries (IPKD) based on a number of criteria (Figure 1).3
1 Ridhwan, MHA. et al. (2017), Regional Growth Strategy, Working Paper Bank
Indonesia, forthcoming.
2 Balassa, B. and Marcus Noland (1989), Revealed Comparative Advantage in Japan
and the United States, Journal of International Economic Integration, 2(2): 8–22.
3 These criteria were: (i) To provide employment and support welfare improvement and
poverty alleviation; (ii) To have a comparative advantage with the potential for local
raw materials and markets (highly competitive); (iii) To encourage the progress of other
sectors (high level of forward and backward linkages); (iv) To provide high value-added
products, sustain export performance and generate foreign exchange; (v) To serve as an
agent of transformation of the national economic structure.
The study concluded that the manufacturing industry is still required as a driver of growth, but the Indonesian economy needs to promote and develop a number of other economic sectors, such as the creative industry and tourism. The United Nations World Tourism Organization, the global tourism agency under the auspices of the UN, even predicts the tourism sector will become Indonesia’s main source of foreign exchange in the coming years.
The development of regional competitive potential industries requires the attention of various parties. Bank Indonesia, through its 45 domestic representative offices (KPwDN) spread across 34 provinces, is playing an active role in bringing about strong and good-quality regional economic growth. It is doing this by acting as a strategic advisor to regional governments, especially with regard to managing inflation and financial system stability in the regions.4 In addition, the KPwDN are actively implementing programs to empower regional economies, including through the development of MSMEs and the enhancement of financial inclusion.
4 The role forms part of the nine functions of Bank Indonesia's domestic representative
offices (KPwDN), as mandated by Bank Indonesia's Strategic Functions Architecture
(AFSBI).
Gambar 1. Boks 10.3. Industri Potensial Kompetitif Daerah
KALIMANTAN
Strengthening Current Industry*
• CPO Downstream Industry• Food and Drugs Industry• Wooden Goods Industry• Chemical Industry
Potential Industrial Development
• Tourism Services
SULAWESI
Strengthening Current Industry*
• Food and Beverage Industry• Shipping Industry• Basic Metals Industry
Potential Industrial Development
• Tourism Services
MALUKU - PAPUA
Strengthening Current Industry*
• Food and Beverage Industry• Shipping Industry
Potential Industrial Development
• Tourism Services
BALI - NUSA TENGGARA
Strengthening Current Industry*
• Food and Beverage Industry
Potential Industrial Development
• Creative Industry and Agro Tourism • Tourism Services
JAVA
Strengthening Current Industry*
• Automotive Industry• Pharmacy Industry*• Food and Beverage Industry• Textile and Textile Product Industry• Electronic Industry• Shipping Industry
Potential Industrial Development
• Tourism Services• Creative Industry (Animation, Games,
Films, Application, Fashion)
SUMATRA
Strengthening Current Industry*
• Food and Beverage Industry• Electronic Industry• Base Metals Industry• Chemical Industry
Potential Industrial Development
• Tourism Services
Source: Bank IndonesiaNote: *Labor intensive industry with comparative advantage and high export
Figure 1. Regional Competitive Potential Industry
Source: WDI, World Bank, calculated
Percent
Gra�k 4 Boks 10.3. Proporsi Teknologi Tinggi terhad
0
25
15
20
5
10
Lowincome
LowerMiddleIncome
UpperMiddleIncome
Highincome
Indonesia6.98
Chart 2. High Technology Proportion to Indonesia’s Export Manufacture in 2017
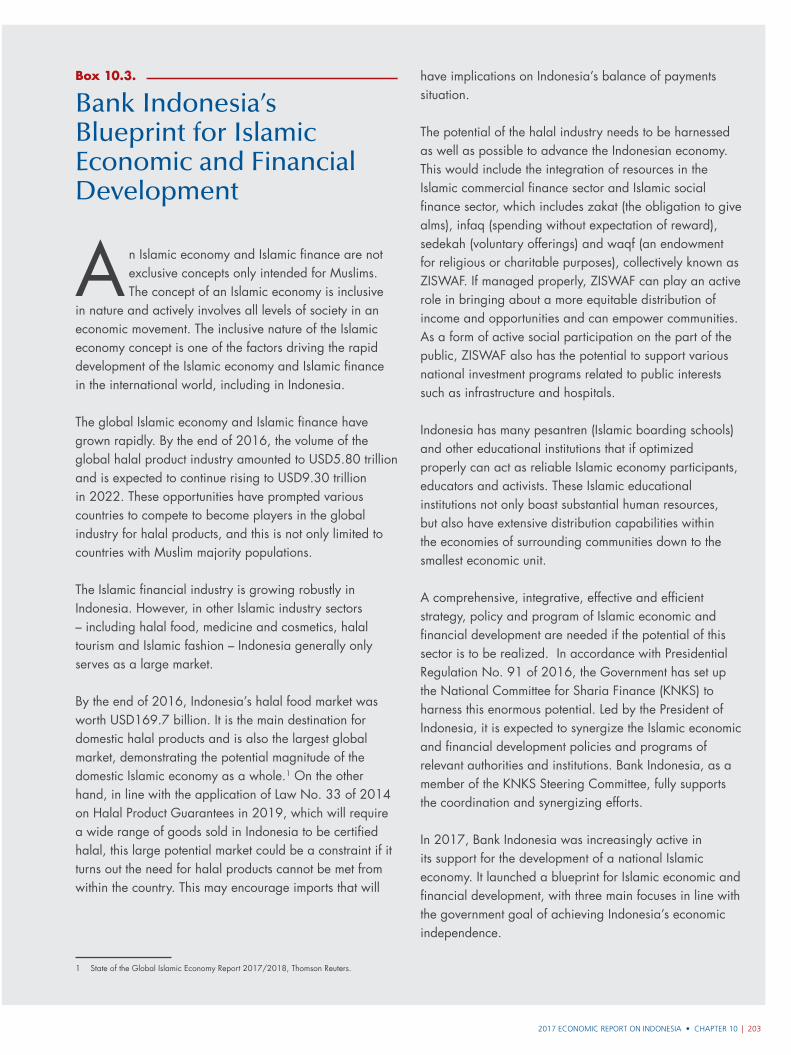
2017 ECONOMIC REPORT ON INDONESIA • CHAPTER 10 | 203
Box 10.3.
Bank Indonesia’s Blueprint for Islamic Economic and Financial Development
An Islamic economy and Islamic finance are not exclusive concepts only intended for Muslims. The concept of an Islamic economy is inclusive
in nature and actively involves all levels of society in an economic movement. The inclusive nature of the Islamic economy concept is one of the factors driving the rapid development of the Islamic economy and Islamic finance in the international world, including in Indonesia.
The global Islamic economy and Islamic finance have grown rapidly. By the end of 2016, the volume of the global halal product industry amounted to USD5.80 trillion and is expected to continue rising to USD9.30 trillion in 2022. These opportunities have prompted various countries to compete to become players in the global industry for halal products, and this is not only limited to countries with Muslim majority populations.
The Islamic financial industry is growing robustly in Indonesia. However, in other Islamic industry sectors – including halal food, medicine and cosmetics, halal tourism and Islamic fashion – Indonesia generally only serves as a large market.
By the end of 2016, Indonesia’s halal food market was worth USD169.7 billion. It is the main destination for domestic halal products and is also the largest global market, demonstrating the potential magnitude of the domestic Islamic economy as a whole.1 On the other hand, in line with the application of Law No. 33 of 2014 on Halal Product Guarantees in 2019, which will require a wide range of goods sold in Indonesia to be certified halal, this large potential market could be a constraint if it turns out the need for halal products cannot be met from within the country. This may encourage imports that will
1 State of the Global Islamic Economy Report 2017/2018, Thomson Reuters.
have implications on Indonesia’s balance of payments situation.
The potential of the halal industry needs to be harnessed as well as possible to advance the Indonesian economy. This would include the integration of resources in the Islamic commercial finance sector and Islamic social finance sector, which includes zakat (the obligation to give alms), infaq (spending without expectation of reward), sedekah (voluntary offerings) and waqf (an endowment for religious or charitable purposes), collectively known as ZISWAF. If managed properly, ZISWAF can play an active role in bringing about a more equitable distribution of income and opportunities and can empower communities. As a form of active social participation on the part of the public, ZISWAF also has the potential to support various national investment programs related to public interests such as infrastructure and hospitals.
Indonesia has many pesantren (Islamic boarding schools) and other educational institutions that if optimized properly can act as reliable Islamic economy participants, educators and activists. These Islamic educational institutions not only boast substantial human resources, but also have extensive distribution capabilities within the economies of surrounding communities down to the smallest economic unit.
A comprehensive, integrative, effective and efficient strategy, policy and program of Islamic economic and financial development are needed if the potential of this sector is to be realized. In accordance with Presidential Regulation No. 91 of 2016, the Government has set up the National Committee for Sharia Finance (KNKS) to harness this enormous potential. Led by the President of Indonesia, it is expected to synergize the Islamic economic and financial development policies and programs of relevant authorities and institutions. Bank Indonesia, as a member of the KNKS Steering Committee, fully supports the coordination and synergizing efforts.
In 2017, Bank Indonesia was increasingly active in its support for the development of a national Islamic economy. It launched a blueprint for Islamic economic and financial development, with three main focuses in line with the government goal of achieving Indonesia’s economic independence.
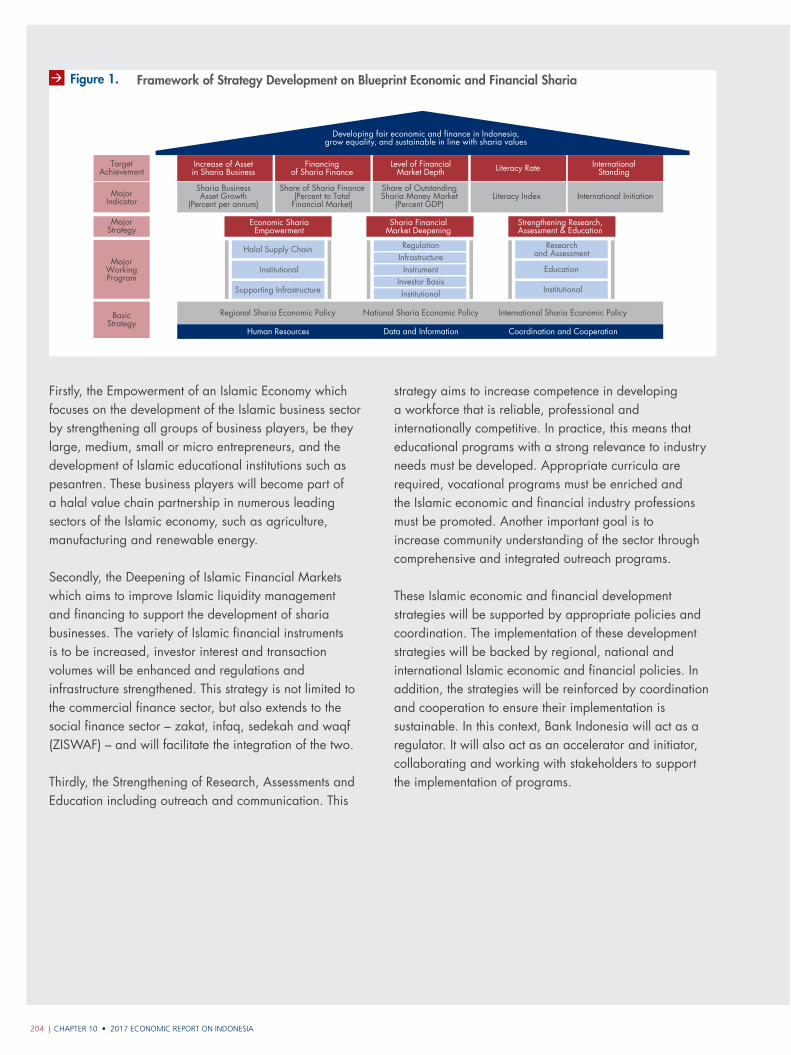
CHAPTER 10 • 2017 ECONOMIC REPORT ON INDONESIA204 |
Gambar 1. Boks 8.2
Developing fair economic and finance in Indonesia,grow equality, and sustainable in line with sharia values
Increase of Assetin Sharia Business
Sharia BusinessAsset Growth
(Percent per annum)
Share of Sharia Finance(Percent to Total
Financial Market)
Share of OutstandingSharia Money Market
(Percent GDP)Literacy Index International Initiation
Financingof Sharia Finance
Level of FinancialMarket Depth
InternationalStandingLiteracy Rate
Economic ShariaEmpowerment
Sharia FinancialMarket Deepening
Strengthening Research,Assessment & Education
Halal Supply Chain
Institutional
RegulationInfrastructureInstrument
Investor BasisInstitutional InstitutionalSupporting Infrastructure
Researchand Assessment
Education
Regional Sharia Economic Policy National Sharia Economic Policy International Sharia Economic Policy
Human Resources Data and Information Coordination and Cooperation
TargetAchievement
MajorIndicator
MajorStrategy
MajorWorkingProgram
BasicStrategy
Figure 1. Framework of Strategy Development on Blueprint Economic and Financial Sharia
Firstly, the Empowerment of an Islamic Economy which focuses on the development of the Islamic business sector by strengthening all groups of business players, be they large, medium, small or micro entrepreneurs, and the development of Islamic educational institutions such as pesantren. These business players will become part of a halal value chain partnership in numerous leading sectors of the Islamic economy, such as agriculture, manufacturing and renewable energy.
Secondly, the Deepening of Islamic Financial Markets which aims to improve Islamic liquidity management and financing to support the development of sharia businesses. The variety of Islamic financial instruments is to be increased, investor interest and transaction volumes will be enhanced and regulations and infrastructure strengthened. This strategy is not limited to the commercial finance sector, but also extends to the social finance sector – zakat, infaq, sedekah and waqf (ZISWAF) – and will facilitate the integration of the two.
Thirdly, the Strengthening of Research, Assessments and Education including outreach and communication. This
strategy aims to increase competence in developing a workforce that is reliable, professional and internationally competitive. In practice, this means that educational programs with a strong relevance to industry needs must be developed. Appropriate curricula are required, vocational programs must be enriched and the Islamic economic and financial industry professions must be promoted. Another important goal is to increase community understanding of the sector through comprehensive and integrated outreach programs.
These Islamic economic and financial development strategies will be supported by appropriate policies and coordination. The implementation of these development strategies will be backed by regional, national and international Islamic economic and financial policies. In addition, the strategies will be reinforced by coordination and cooperation to ensure their implementation is sustainable. In this context, Bank Indonesia will act as a regulator. It will also act as an accelerator and initiator, collaborating and working with stakeholders to support the implementation of programs.


| 2072017 ECONOMIC REPORT ON INDONESIA
Appendices
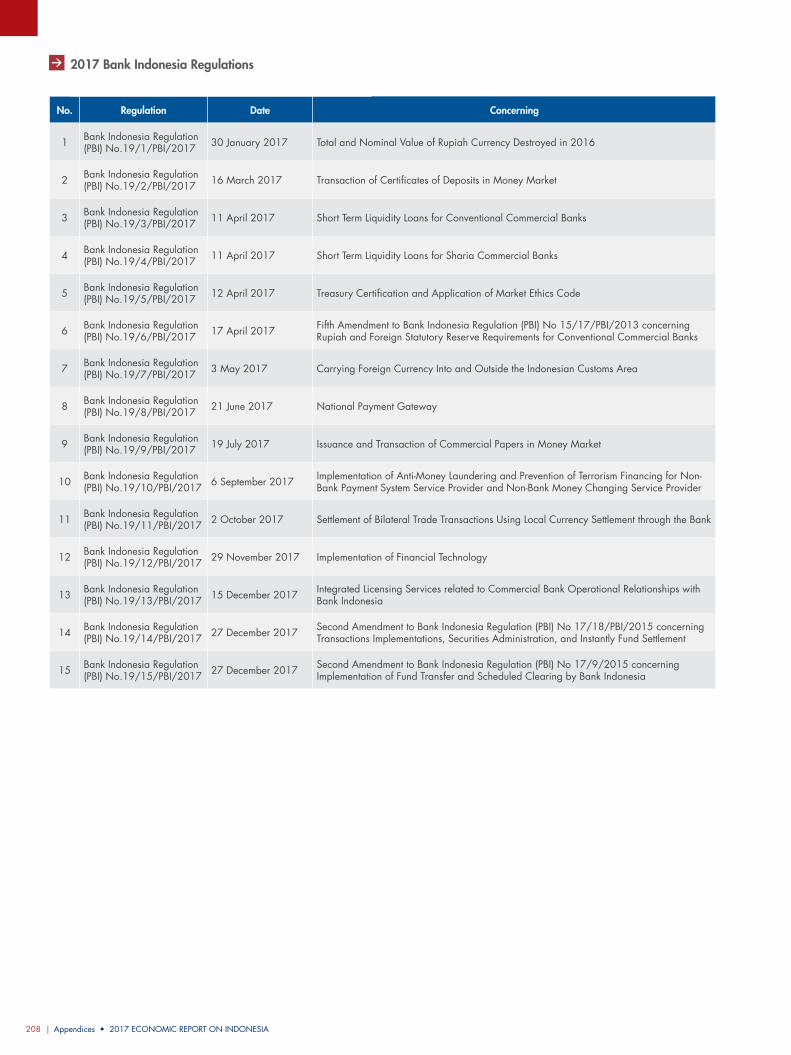
Appendices • 2017 ECONOMIC REPORT ON INDONESIA208 |
No. Regulation Date Concerning
1 Bank Indonesia Regulation (PBI) No.19/1/PBI/2017 30 January 2017 Total and Nominal Value of Rupiah Currency Destroyed in 2016
2 Bank Indonesia Regulation (PBI) No.19/2/PBI/2017 16 March 2017 Transaction of Certificates of Deposits in Money Market
3 Bank Indonesia Regulation (PBI) No.19/3/PBI/2017 11 April 2017 Short Term Liquidity Loans for Conventional Commercial Banks
4 Bank Indonesia Regulation (PBI) No.19/4/PBI/2017 11 April 2017 Short Term Liquidity Loans for Sharia Commercial Banks
5 Bank Indonesia Regulation (PBI) No.19/5/PBI/2017 12 April 2017 Treasury Certification and Application of Market Ethics Code
6 Bank Indonesia Regulation (PBI) No.19/6/PBI/2017 17 April 2017 Fifth Amendment to Bank Indonesia Regulation (PBI) No 15/17/PBI/2013 concerning
Rupiah and Foreign Statutory Reserve Requirements for Conventional Commercial Banks
7 Bank Indonesia Regulation (PBI) No.19/7/PBI/2017 3 May 2017 Carrying Foreign Currency Into and Outside the Indonesian Customs Area
8 Bank Indonesia Regulation (PBI) No.19/8/PBI/2017 21 June 2017 National Payment Gateway
9 Bank Indonesia Regulation (PBI) No.19/9/PBI/2017 19 July 2017 Issuance and Transaction of Commercial Papers in Money Market
10 Bank Indonesia Regulation (PBI) No.19/10/PBI/2017 6 September 2017 Implementation of Anti-Money Laundering and Prevention of Terrorism Financing for Non-
Bank Payment System Service Provider and Non-Bank Money Changing Service Provider
11 Bank Indonesia Regulation (PBI) No.19/11/PBI/2017 2 October 2017 Settlement of Bilateral Trade Transactions Using Local Currency Settlement through the Bank
12 Bank Indonesia Regulation (PBI) No.19/12/PBI/2017 29 November 2017 Implementation of Financial Technology
13 Bank Indonesia Regulation (PBI) No.19/13/PBI/2017 15 December 2017 Integrated Licensing Services related to Commercial Bank Operational Relationships with
Bank Indonesia
14 Bank Indonesia Regulation (PBI) No.19/14/PBI/2017 27 December 2017 Second Amendment to Bank Indonesia Regulation (PBI) No 17/18/PBI/2015 concerning
Transactions Implementations, Securities Administration, and Instantly Fund Settlement
15 Bank Indonesia Regulation (PBI) No.19/15/PBI/2017 27 December 2017 Second Amendment to Bank Indonesia Regulation (PBI) No 17/9/2015 concerning
Implementation of Fund Transfer and Scheduled Clearing by Bank Indonesia
2017 Bank Indonesia Regulations
2017 ECONOMIC REPORT ON INDONESIA • Appendices | 209
Number Title
Table 1 Gross Domestic Product by Expenditures
Table 2 Gross Domestic Product by Industrial Origin at Constant Prices
Table 3 Gross Domestic Product by Industrial Origin at Current Prices
Table 4 Indonesia’s Consumer Price Index
Table 5 Inflation in 82 cities
Table 6 Indonesia’s Wholesale Price Index
Table 7 Indonesia’s Balance of Payments
Table 8 Interest Rate on Time Deposits in Rupiah and Foreign Currency by Group of Banks
Table 9 Interest Rates of Credit on Rupiah (IDR) by Group of Banks
Table 10 Flow of Bank Notes within Bank Indonesia Head Office and Regional Offices
Tables
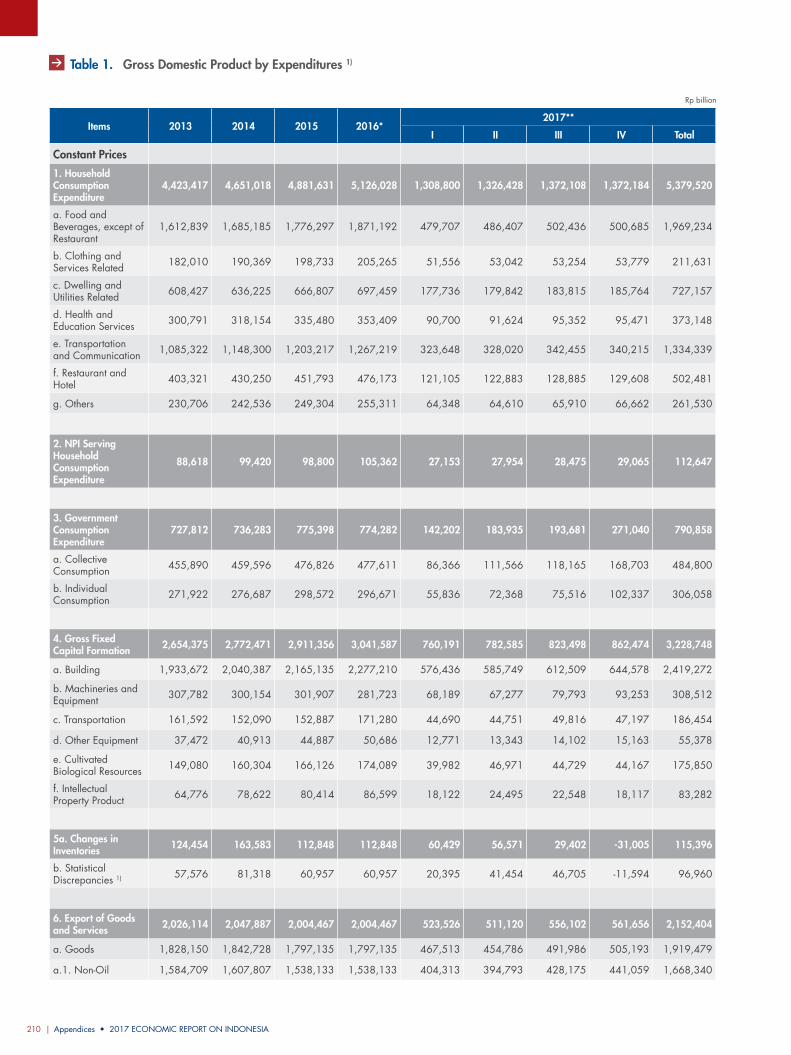
Appendices • 2017 ECONOMIC REPORT ON INDONESIA210 |
Rp billion
Items 2013 2014 2015 2016*2017**
I II III IV Total
Constant Prices
1. Household Consumption Expenditure
4,423,417 4,651,018 4,881,631 5,126,028 1,308,800 1,326,428 1,372,108 1,372,184 5,379,520
a. Food and Beverages, except of Restaurant
1,612,839 1,685,185 1,776,297 1,871,192 479,707 486,407 502,436 500,685 1,969,234
b. Clothing and Services Related 182,010 190,369 198,733 205,265 51,556 53,042 53,254 53,779 211,631
c. Dwelling and Utilities Related 608,427 636,225 666,807 697,459 177,736 179,842 183,815 185,764 727,157
d. Health and Education Services 300,791 318,154 335,480 353,409 90,700 91,624 95,352 95,471 373,148
e. Transportation and Communication 1,085,322 1,148,300 1,203,217 1,267,219 323,648 328,020 342,455 340,215 1,334,339
f. Restaurant and Hotel 403,321 430,250 451,793 476,173 121,105 122,883 128,885 129,608 502,481
g. Others 230,706 242,536 249,304 255,311 64,348 64,610 65,910 66,662 261,530
2. NPI Serving Household Consumption Expenditure
88,618 99,420 98,800 105,362 27,153 27,954 28,475 29,065 112,647
3. Government Consumption Expenditure
727,812 736,283 775,398 774,282 142,202 183,935 193,681 271,040 790,858
a. Collective Consumption 455,890 459,596 476,826 477,611 86,366 111,566 118,165 168,703 484,800
b. Individual Consumption 271,922 276,687 298,572 296,671 55,836 72,368 75,516 102,337 306,058
4. Gross Fixed Capital Formation 2,654,375 2,772,471 2,911,356 3,041,587 760,191 782,585 823,498 862,474 3,228,748
a. Building 1,933,672 2,040,387 2,165,135 2,277,210 576,436 585,749 612,509 644,578 2,419,272
b. Machineries and Equipment 307,782 300,154 301,907 281,723 68,189 67,277 79,793 93,253 308,512
c. Transportation 161,592 152,090 152,887 171,280 44,690 44,751 49,816 47,197 186,454
d. Other Equipment 37,472 40,913 44,887 50,686 12,771 13,343 14,102 15,163 55,378
e. Cultivated Biological Resources 149,080 160,304 166,126 174,089 39,982 46,971 44,729 44,167 175,850
f. Intellectual Property Product 64,776 78,622 80,414 86,599 18,122 24,495 22,548 18,117 83,282
5a. Changes in Inventories 124,454 163,583 112,848 112,848 60,429 56,571 29,402 -31,005 115,396
b. Statistical Discrepancies 1) 57,576 81,318 60,957 60,957 20,395 41,454 46,705 -11,594 96,960
6. Export of Goods and Services 2,026,114 2,047,887 2,004,467 2,004,467 523,526 511,120 556,102 561,656 2,152,404
a. Goods 1,828,150 1,842,728 1,797,135 1,797,135 467,513 454,786 491,986 505,193 1,919,479
a.1. Non-Oil 1,584,709 1,607,807 1,538,133 1,538,133 404,313 394,793 428,175 441,059 1,668,340
Table 1. Gross Domestic Product by Expenditures 1)
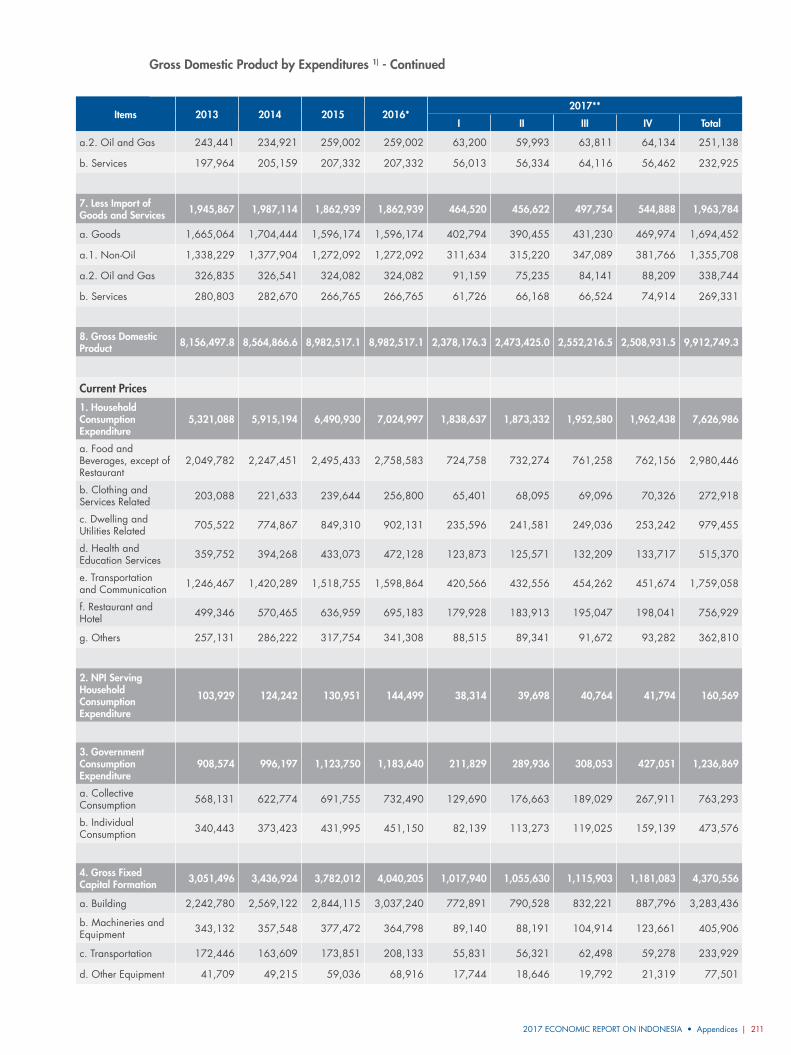
2017 ECONOMIC REPORT ON INDONESIA • Appendices | 211
Items 2013 2014 2015 2016*2017**
I II III IV Total
a.2. Oil and Gas 243,441 234,921 259,002 259,002 63,200 59,993 63,811 64,134 251,138
b. Services 197,964 205,159 207,332 207,332 56,013 56,334 64,116 56,462 232,925
7. Less Import of Goods and Services 1,945,867 1,987,114 1,862,939 1,862,939 464,520 456,622 497,754 544,888 1,963,784
a. Goods 1,665,064 1,704,444 1,596,174 1,596,174 402,794 390,455 431,230 469,974 1,694,452
a.1. Non-Oil 1,338,229 1,377,904 1,272,092 1,272,092 311,634 315,220 347,089 381,766 1,355,708
a.2. Oil and Gas 326,835 326,541 324,082 324,082 91,159 75,235 84,141 88,209 338,744
b. Services 280,803 282,670 266,765 266,765 61,726 66,168 66,524 74,914 269,331
8. Gross Domestic Product 8,156,497.8 8,564,866.6 8,982,517.1 8,982,517.1 2,378,176.3 2,473,425.0 2,552,216.5 2,508,931.5 9,912,749.3
Current Prices
1. Household Consumption Expenditure
5,321,088 5,915,194 6,490,930 7,024,997 1,838,637 1,873,332 1,952,580 1,962,438 7,626,986
a. Food and Beverages, except of Restaurant
2,049,782 2,247,451 2,495,433 2,758,583 724,758 732,274 761,258 762,156 2,980,446
b. Clothing and Services Related 203,088 221,633 239,644 256,800 65,401 68,095 69,096 70,326 272,918
c. Dwelling and Utilities Related 705,522 774,867 849,310 902,131 235,596 241,581 249,036 253,242 979,455
d. Health and Education Services 359,752 394,268 433,073 472,128 123,873 125,571 132,209 133,717 515,370
e. Transportation and Communication 1,246,467 1,420,289 1,518,755 1,598,864 420,566 432,556 454,262 451,674 1,759,058
f. Restaurant and Hotel 499,346 570,465 636,959 695,183 179,928 183,913 195,047 198,041 756,929
g. Others 257,131 286,222 317,754 341,308 88,515 89,341 91,672 93,282 362,810
2. NPI Serving Household Consumption Expenditure
103,929 124,242 130,951 144,499 38,314 39,698 40,764 41,794 160,569
3. Government Consumption Expenditure
908,574 996,197 1,123,750 1,183,640 211,829 289,936 308,053 427,051 1,236,869
a. Collective Consumption 568,131 622,774 691,755 732,490 129,690 176,663 189,029 267,911 763,293
b. Individual Consumption 340,443 373,423 431,995 451,150 82,139 113,273 119,025 159,139 473,576
4. Gross Fixed Capital Formation 3,051,496 3,436,924 3,782,012 4,040,205 1,017,940 1,055,630 1,115,903 1,181,083 4,370,556
a. Building 2,242,780 2,569,122 2,844,115 3,037,240 772,891 790,528 832,221 887,796 3,283,436
b. Machineries and Equipment 343,132 357,548 377,472 364,798 89,140 88,191 104,914 123,661 405,906
c. Transportation 172,446 163,609 173,851 208,133 55,831 56,321 62,498 59,278 233,929
d. Other Equipment 41,709 49,215 59,036 68,916 17,744 18,646 19,792 21,319 77,501
Gross Domestic Product by Expenditures 1) - Continued
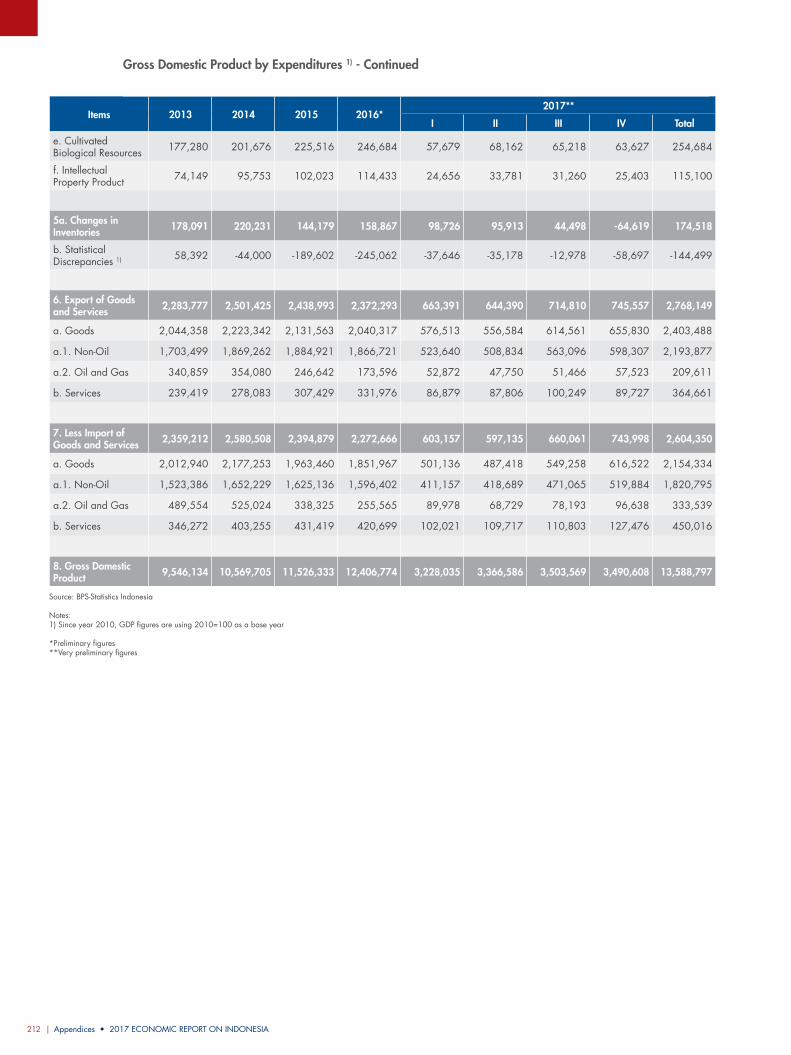
Appendices • 2017 ECONOMIC REPORT ON INDONESIA212 |
Items 2013 2014 2015 2016*2017**
I II III IV Total
e. Cultivated Biological Resources 177,280 201,676 225,516 246,684 57,679 68,162 65,218 63,627 254,684
f. Intellectual Property Product 74,149 95,753 102,023 114,433 24,656 33,781 31,260 25,403 115,100
5a. Changes in Inventories 178,091 220,231 144,179 158,867 98,726 95,913 44,498 -64,619 174,518
b. Statistical Discrepancies 1) 58,392 -44,000 -189,602 -245,062 -37,646 -35,178 -12,978 -58,697 -144,499
6. Export of Goods and Services 2,283,777 2,501,425 2,438,993 2,372,293 663,391 644,390 714,810 745,557 2,768,149
a. Goods 2,044,358 2,223,342 2,131,563 2,040,317 576,513 556,584 614,561 655,830 2,403,488
a.1. Non-Oil 1,703,499 1,869,262 1,884,921 1,866,721 523,640 508,834 563,096 598,307 2,193,877
a.2. Oil and Gas 340,859 354,080 246,642 173,596 52,872 47,750 51,466 57,523 209,611
b. Services 239,419 278,083 307,429 331,976 86,879 87,806 100,249 89,727 364,661
7. Less Import of Goods and Services 2,359,212 2,580,508 2,394,879 2,272,666 603,157 597,135 660,061 743,998 2,604,350
a. Goods 2,012,940 2,177,253 1,963,460 1,851,967 501,136 487,418 549,258 616,522 2,154,334
a.1. Non-Oil 1,523,386 1,652,229 1,625,136 1,596,402 411,157 418,689 471,065 519,884 1,820,795
a.2. Oil and Gas 489,554 525,024 338,325 255,565 89,978 68,729 78,193 96,638 333,539
b. Services 346,272 403,255 431,419 420,699 102,021 109,717 110,803 127,476 450,016
8. Gross Domestic Product 9,546,134 10,569,705 11,526,333 12,406,774 3,228,035 3,366,586 3,503,569 3,490,608 13,588,797
Source: BPS-Statistics Indonesia
Notes:1) Since year 2010, GDP figures are using 2010=100 as a base year
*Preliminary figures**Very preliminary figures
Gross Domestic Product by Expenditures 1) - Continued
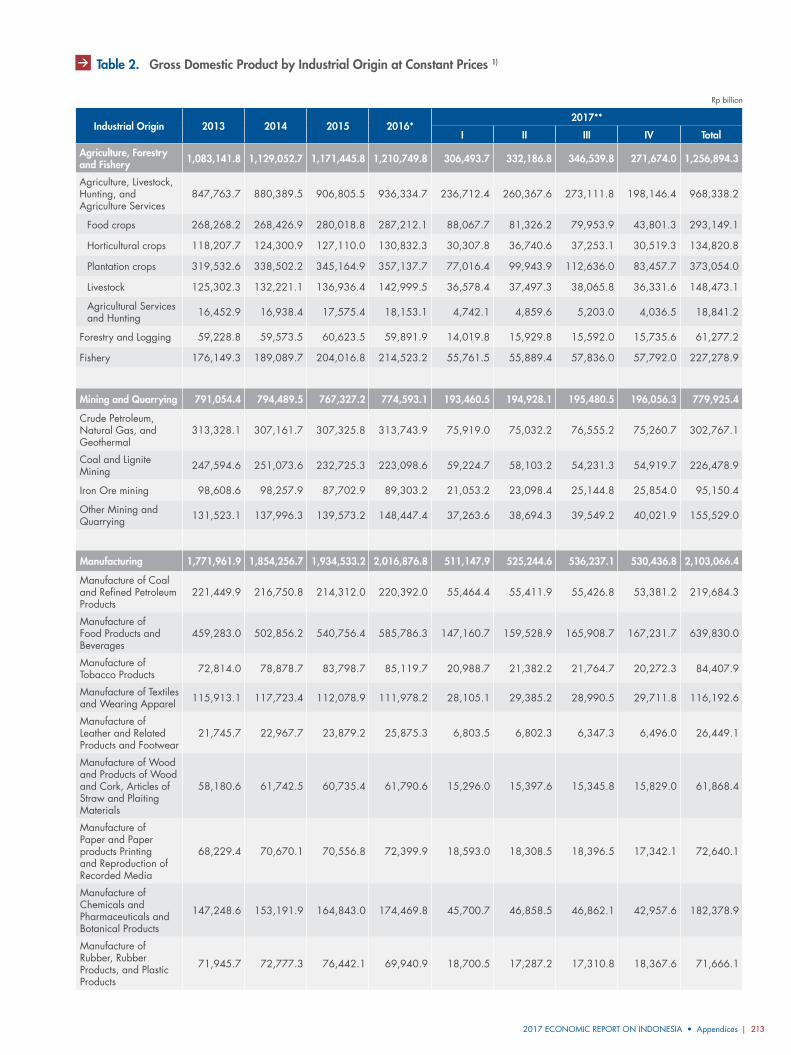
2017 ECONOMIC REPORT ON INDONESIA • Appendices | 213
Rp billion
Industrial Origin 2013 2014 2015 2016*2017**
I II III IV Total
Agriculture, Forestry and Fishery 1,083,141.8 1,129,052.7 1,171,445.8 1,210,749.8 306,493.7 332,186.8 346,539.8 271,674.0 1,256,894.3
Agriculture, Livestock, Hunting, and Agriculture Services
847,763.7 880,389.5 906,805.5 936,334.7 236,712.4 260,367.6 273,111.8 198,146.4 968,338.2
Food crops 268,268.2 268,426.9 280,018.8 287,212.1 88,067.7 81,326.2 79,953.9 43,801.3 293,149.1
Horticultural crops 118,207.7 124,300.9 127,110.0 130,832.3 30,307.8 36,740.6 37,253.1 30,519.3 134,820.8
Plantation crops 319,532.6 338,502.2 345,164.9 357,137.7 77,016.4 99,943.9 112,636.0 83,457.7 373,054.0
Livestock 125,302.3 132,221.1 136,936.4 142,999.5 36,578.4 37,497.3 38,065.8 36,331.6 148,473.1
Agricultural Services and Hunting 16,452.9 16,938.4 17,575.4 18,153.1 4,742.1 4,859.6 5,203.0 4,036.5 18,841.2
Forestry and Logging 59,228.8 59,573.5 60,623.5 59,891.9 14,019.8 15,929.8 15,592.0 15,735.6 61,277.2
Fishery 176,149.3 189,089.7 204,016.8 214,523.2 55,761.5 55,889.4 57,836.0 57,792.0 227,278.9
Mining and Quarrying 791,054.4 794,489.5 767,327.2 774,593.1 193,460.5 194,928.1 195,480.5 196,056.3 779,925.4
Crude Petroleum, Natural Gas, and Geothermal
313,328.1 307,161.7 307,325.8 313,743.9 75,919.0 75,032.2 76,555.2 75,260.7 302,767.1
Coal and Lignite Mining 247,594.6 251,073.6 232,725.3 223,098.6 59,224.7 58,103.2 54,231.3 54,919.7 226,478.9
Iron Ore mining 98,608.6 98,257.9 87,702.9 89,303.2 21,053.2 23,098.4 25,144.8 25,854.0 95,150.4
Other Mining and Quarrying 131,523.1 137,996.3 139,573.2 148,447.4 37,263.6 38,694.3 39,549.2 40,021.9 155,529.0
Manufacturing 1,771,961.9 1,854,256.7 1,934,533.2 2,016,876.8 511,147.9 525,244.6 536,237.1 530,436.8 2,103,066.4
Manufacture of Coal and Refined Petroleum Products
221,449.9 216,750.8 214,312.0 220,392.0 55,464.4 55,411.9 55,426.8 53,381.2 219,684.3
Manufacture of Food Products and Beverages
459,283.0 502,856.2 540,756.4 585,786.3 147,160.7 159,528.9 165,908.7 167,231.7 639,830.0
Manufacture of Tobacco Products 72,814.0 78,878.7 83,798.7 85,119.7 20,988.7 21,382.2 21,764.7 20,272.3 84,407.9
Manufacture of Textiles and Wearing Apparel 115,913.1 117,723.4 112,078.9 111,978.2 28,105.1 29,385.2 28,990.5 29,711.8 116,192.6
Manufacture of Leather and Related Products and Footwear
21,745.7 22,967.7 23,879.2 25,875.3 6,803.5 6,802.3 6,347.3 6,496.0 26,449.1
Manufacture of Wood and Products of Wood and Cork, Articles of Straw and Plaiting Materials
58,180.6 61,742.5 60,735.4 61,790.6 15,296.0 15,397.6 15,345.8 15,829.0 61,868.4
Manufacture of Paper and Paper products Printing and Reproduction of Recorded Media
68,229.4 70,670.1 70,556.8 72,399.9 18,593.0 18,308.5 18,396.5 17,342.1 72,640.1
Manufacture of Chemicals and Pharmaceuticals and Botanical Products
147,248.6 153,191.9 164,843.0 174,469.8 45,700.7 46,858.5 46,862.1 42,957.6 182,378.9
Manufacture of Rubber, Rubber Products, and Plastic Products
71,945.7 72,777.3 76,442.1 69,940.9 18,700.5 17,287.2 17,310.8 18,367.6 71,666.1
Table 2. Gross Domestic Product by Industrial Origin at Constant Prices 1)
Appendices • 2017 ECONOMIC REPORT ON INDONESIA214 |
Industrial Origin 2013 2014 2015 2016*2017**
I II III IV Total
Manufacture of Other Nonmetallic Mineral Products
61,228.7 62,706.8 66,485.2 70,118.7 17,138.1 16,482.3 17,629.1 18,264.2 69,513.7
Manufacture of Basic Metals 67,972.4 72,059.1 76,532.1 77,293.0 19,595.0 20,616.9 20,871.2 20,750.2 81,833.3
Manufacture of Fabricated Metal Products, Computer, Optical Products, and Electronic Devices
173,452.4 178,544.2 192,528.0 200,860.9 51,489.2 51,347.8 52,613.9 51,017.7 206,468.6
Manufacture of Machinery and Equipment
24,163.8 26,259.7 28,250.5 29,676.6 7,456.4 8,013.0 8,013.8 7,841.4 31,324.6
Manufacture of Transport Equipment 171,165.5 178,022.5 182,289.1 190,523.4 48,347.2 48,103.4 50,324.9 50,751.9 197,527.4
Manufacture of Furniture 22,375.4 23,179.9 24,377.4 24,489.8 6,284.2 6,352.1 6,429.9 6,331.1 25,397.3
Other Manufacturing, Repair and Installation of Machinery and Equipment
14,793.7 15,925.9 16,668.4 16,161.7 4,025.2 3,966.8 4,001.1 3,891.0 15,884.1
Electricity and Gas Supply 88,805.1 94,047.2 94,894.8 100,009.9 24,816.6 24,570.5 25,878.3 26,285.9 101,551.3
Electricity 75,050.7 79,581.5 81,407.0 86,580.3 21,458.8 21,679.2 22,523.4 23,002.0 88,663.4
Gas Supply and Production of Ice 13,754.4 14,465.7 13,487.8 13,429.6 3,357.8 2,891.3 3,354.9 3,283.9 12,887.9
Water Supply, Sewerage, Waste Management and Remediation Activities
6,539.9 6,882.5 7,369.0 7,634.5 1,953.0 1,977.7 2,008.7 2,047.0 7,986.4
Construction 772,719.6 826,615.6 879,163.9 925,062.5 233,883.1 239,717.6 251,101.1 263,181.7 987,883.5
Wholesale and Retail Trades, Repair of Motor Vehicles and Motorcycles
1,119,272.1 1,177,297.5 1,207,164.5 1,255,759.4 317,304.5 326,455.7 336,182.0 331,521.5 1,311,463.7
Wholesale and Retail Trade and Repair of Motor Vehicles and Motorcycles
218,291.1 229,228.4 229,967.5 239,089.3 60,921.4 61,944.5 63,695.3 63,987.9 250,549.1
Wholesale and Retail Trades, except of Motor Vehicles and Motorcycles
900,981.0 948,069.1 977,197.0 1,016,670.1 256,383.1 264,511.2 272,486.7 267,533.6 1,060,914.6
Transport and Storage 304,506.2 326,933.0 348,855.9 374,843.4 96,679.5 99,593.1 104,949.3 105,457.5 406,679.4
Railways Transport 2,336.9 2,823.1 2,948.6 3,050.6 827.2 874.4 955.6 973.0 3,630.2
Land Transport 167,559.5 180,367.4 192,631.0 206,218.1 54,122.5 55,015.5 56,330.3 57,119.0 222,587.3
Sea Transport 27,372.4 29,473.7 30,174.0 30,550.9 7,325.2 7,868.9 8,253.2 8,521.8 31,969.1
River, Lake and Ferry Transport 9,469.2 10,117.6 10,222.2 10,371.9 2,678.2 2,697.5 2,779.0 2,840.4 10,995.1
Air Transport 49,263.2 52,255.1 57,671.8 65,295.4 16,830.5 17,493.1 19,702.4 19,058.2 73,084.2
Gross Domestic Product by Industrial Origin at Constant Prices 1) - Continued
2017 ECONOMIC REPORT ON INDONESIA • Appendices | 215
Industrial Origin 2013 2014 2015 2016*2017**
I II III IV Total
Warehousing and Support Services for Transportation, Postal and Courier
48,505.0 51,896.1 55,208.3 59,356.5 14,895.9 15,643.7 16,928.8 16,945.1 64,413.5
Accommodation and Food Service Activities 243,748.3 257,815.5 268,922.4 282,823.4 72,875.9 74,094.2 75,146.7 76,398.1 298,514.9
Accommodation 47,699.6 51,426.7 54,340.3 57,440.8 14,674.5 14,924.2 15,206.5 15,504.0 60,309.2
Food and Beverages Service Activities 196,048.7 206,388.8 214,582.1 225,382.6 58,201.4 59,170.0 59,940.2 60,894.1 238,205.7
Information and Communication 349,150.1 384,475.6 421,769.8 459,208.1 120,874.5 126,316.2 127,285.8 129,802.4 504,278.9
Financial and Insurance Services 305,515.1 319,825.5 347,269.0 378,193.1 97,562.7 99,472.6 102,464.3 99,419.4 398,919.0
Financial Intermediary Services 192,098.0 197,712.2 216,631.2 237,896.4 61,580.6 62,055.8 62,109.2 60,286.2 246,031.8
Insurance and Pension Fund 64,661.3 69,794.6 74,398.1 79,230.2 20,070.5 20,990.9 22,912.9 22,668.7 86,643.0
Other Financial Services 41,371.7 44,464.7 48,013.8 52,449.1 13,681.1 14,198.7 15,219.7 14,181.8 57,281.3
Financial Supporting Services 7,384.1 7,854.0 8,225.9 8,617.4 2,230.5 2,227.2 2,222.5 2,282.7 8,962.9
Real Estate Activities 244,237.5 256,440.2 266,979.6 279,500.5 71,675.6 72,419.6 72,651.3 73,042.9 289,789.4
Business Services 125,490.7 137,795.3 148,395.5 159,321.7 41,662.4 42,733.4 43,853.2 44,514.8 172,763.8
Public Administration and Defence; Compulsory Social Security
289,448.9 296,329.7 310,054.6 319,946.1 77,971.3 78,071.7 79,925.8 90,558.0 326,526.8
Education 250,016.2 263,685.0 283,020.1 293,779.7 71,525.3 73,700.3 74,725.3 84,574.1 304,525.0
Human Health and Social Work Activities 84,621.4 91,357.1 97,465.8 102,487.8 26,619.3 26,775.0 27,247.8 28,805.9 109,448.0
Other Services Activities 123,083.1 134,070.1 144,904.2 156,523.4 40,999.6 42,043.6 43,178.7 43,851.8 170,073.7
Gross Value Added At Basic Price 7,953,312.3 8,351,368.7 8,699,535.3 9,097,313.2 2,307,505.4 2,380,300.7 2,444,855.7 2,397,628.1 9,530,289.9
Taxes less Subsides on Products 203,185.5 213,497.9 282,981.8 337,319.1 70,670.9 93,124.3 107,360.8 111,303.4 382,459.4
GROSS DOMESTIC PRODUCT 8,156,497.8 8,564,866.6 8,982,517.1 9,434,632.3 2,378,176.3 2,473,425.0 2,552,216.5 2,508,931.5 9,912,749.3
Source: BPS-Statistics Indonesia
Notes:1) Since year 2010, GDP figures are using 2010=100 as a base year
*Preliminary figures**Very preliminary figures
Gross Domestic Product by Industrial Origin at Constant Prices 1) - Continued
Appendices • 2017 ECONOMIC REPORT ON INDONESIA216 |
Rp billion
Industrial Origin 2013 2014 2015 2016* 2017**
Agriculture, Forestry and Fishery 1,275,048 1,409,656 1,555,207 1,671,330 1,785,881
Agriculture, Livestock, Hunting, and Agriculture Services 994,778 1,089,550 1,183,969 1,266,849 1,344,732
Food crops 332,112 343,252 397,409 425,179 437,804
Horticultural crops 137,369 160,569 174,453 187,403 196,132
Plantation crops 358,172 398,261 405,292 428,783 471,308
Livestock 147,982 167,008 184,152 201,086 213,468
Agricultural Services and Hunting 19,143 20,460 22,664 24,399 26,021
Forestry and Logging 69,599 74,618 82,322 87,390 91,618
Fishery 210,671 245,488 288,917 317,092 349,530
Mining and Quarrying 1,050,746 1,039,423 881,694 890,868 1,028,772
Crude Petroleum, Natural Gas, and Geothermal 520,088 509,783 384,516 364,986 390,480
Coal and Lignite Mining 282,193 259,767 229,974 231,698 323,365
Iron Ore mining 98,468 93,615 74,264 73,301 94,322
Other Mining and Quarrying 149,996 176,258 192,940 220,884 220,605
Manufacturing 2,007,427 2,227,584 2,418,892 2,545,204 2,739,415
Manufacture of Coal and Refined Petroleum Products 314,216 337,201 320,845 286,400 309,142
Manufacture of Food Products and Beverages 491,142 562,017 647,072 740,810 834,403
Manufacture of Tobacco Products 82,684 95,668 108,652 117,086 121,986
Manufacture of Textiles and Wearing Apparel 129,912 139,032 139,394 143,545 150,427
Manufacture of Leather and Related Products and Footwear 24,810 28,600 31,441 35,214 36,988
Manufacture of Wood and Products of Wood and Cork, Articles of Straw and Plaiting Materials 66,958 76,072 77,993 80,078 81,583
Manufacture of Paper and Paper products, Printing and Reproduction of Recorded Media 74,319 84,373 87,760 89,650 97,060
Manufacture of Chemicals and Pharmaceuticals; and Botanical Products 157,042 180,037 209,788 223,405 236,186
Manufacture of Rubber, Rubber Products and Plastic Products 76,466 80,263 85,951 79,101 85,869
Manufacture of Other Nonmetallic Mineral Products 69,401 76,852 83,371 89,056 89,606
Manufacture of Basic Metals 74,495 82,119 90,159 89,560 98,847
Manufacture of Fabricated Metal Products, Computer, Optical Products and Electronic Devices 186,195 198,081 226,678 241,757 252,740
Manufacture of Machinery and Equipment 25,504 33,079 37,288 40,170 43,092
Manufacture of Transport Equipment 192,768 207,401 220,511 236,559 246,915
Manufacture of Furniture 24,931 28,118 31,340 32,124 33,869
Other Manufacturing, Repair and Installation of Machinery and Equipment 16,584 18,673 20,649 20,690 20,702
Electricity and Gas Supply 98,687 114,905 129,834 142,344 162,340
Electricity 74,358 84,151 100,645 112,792 132,976
Gas Supply and Production of Ice 24,329 30,754 29,189 29,552 29,364
Water Supply, Sewerage, Waste Management and Remediation Activities 7,209 7,841 8,546 8,943 9,720
Construction 905,991 1,041,950 1,177,084 1,287,659 1,409,834
Table 3. Gross Domestic Product by Industrial Origin at Current Prices
2017 ECONOMIC REPORT ON INDONESIA • Appendices | 217
Industrial Origin 2013 2014 2015 2016* 2017**
Wholesale and Retail Trades, Repair of Motor Vehicles and Motorcycles 1,261,146 1,419,239 1,532,877 1,635,259 1,767,718
Wholesale and Retail Trade and Repair of Motor Vehicles and Motorcycles 258,942 292,839 311,606 334,788 356,588
Wholesale and Retail Trades, except of Motor Vehicles and Motorcycles 1,002,203 1,126,400 1,221,271 1,300,471 1,411,130
Transport and Storage 375,306 466,969 578,464 645,000 735,230
Railways Transport 3,143 4,228 6,577 7,319 9,172
Land Transport 190,201 225,882 281,079 300,985 328,307
Sea Transport 30,062 36,075 39,307 39,907 41,986
River, Lake and Ferry Transport 11,165 13,137 14,267 14,185 15,078
Air Transport 77,722 108,792 143,664 177,904 220,967
Warehousing and Support Services for Transportation, Postal and Courier 63,014 78,855 93,570 104,699 119,721
Accommodation and Food Service Activities 289,498 321,062 341,556 363,056 387,467
Accommodation 63,489 74,255 80,791 86,421 91,823
Food and Beverages Service Activities 226,009 246,807 260,765 276,634 295,644
Information and Communication 341,009 369,457 406,017 449,189 515,889
Financial and Insurance Services 370,132 408,439 464,400 520,088 571,129
Financial Intermediary Services 237,170 256,029 290,943 327,378 353,060
Insurance and Pension Fund 76,005 87,337 99,041 109,269 124,062
Other Financial Services 48,279 55,245 63,465 71,825 81,422
Financial Supporting Services 8,679 9,829 10,950 11,616 12,585
Real Estate Activities 264,275 294,573 327,601 350,488 379,783
Business Services 144,604 165,991 190,268 211,624 238,217
Public Administration and Defence; Compulsory Social Security 372,195 404,630 449,382 479,794 502,239
Education 307,862 341,818 387,611 418,347 446,785
Human Health and Social Work Activities 96,881 109,147 123,192 132,545 144,967
Other Services Activities 140,316 163,549 190,581 211,456 239,122
GROSS DOMESTIC PRODUCT 9,546,134 10,569,705 11,526,333 12,406,774 13,588,797
Source: BPS-Statistics Indonesia
Notes:*Preliminary figures**Very preliminary figures
Gross Domestic Product by Industrial Origin at Current Prices - Continued
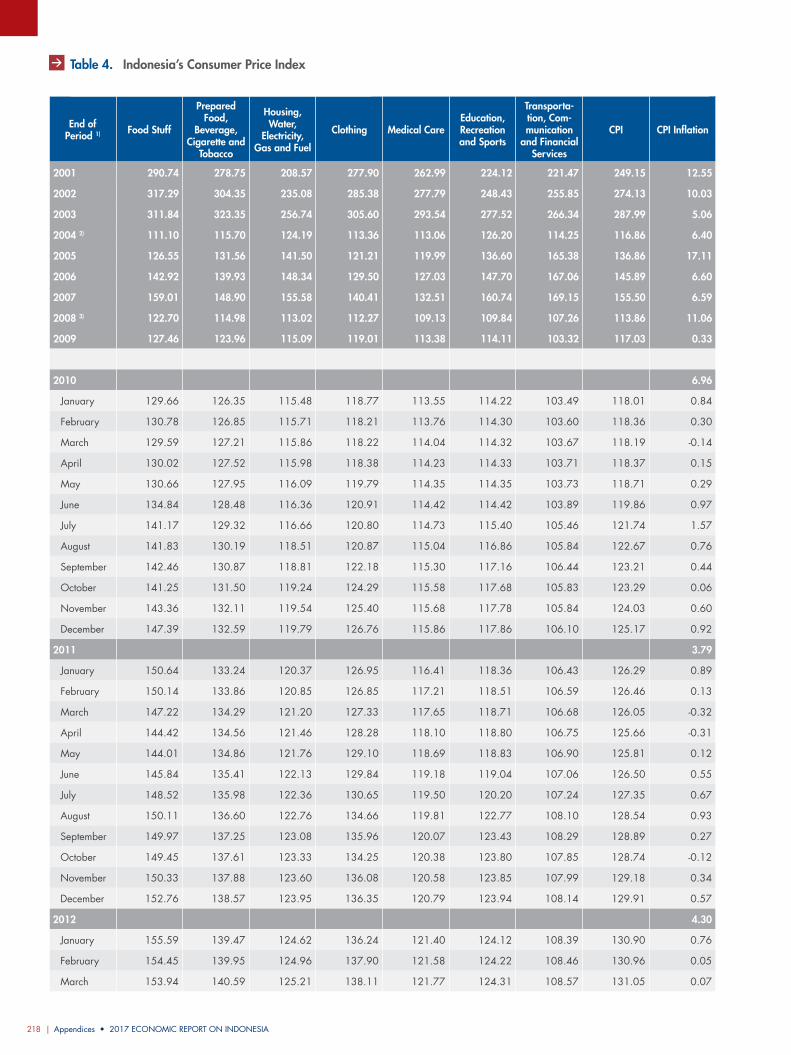
Appendices • 2017 ECONOMIC REPORT ON INDONESIA218 |
End of Period 1) Food Stuff
Prepared Food,
Beverage, Cigarette and
Tobacco
Housing, Water,
Electricity, Gas and Fuel
Clothing Medical CareEducation, Recreation and Sports
Transporta-tion, Com-munication
and Financial Services
CPI CPI Inflation
2001 290.74 278.75 208.57 277.90 262.99 224.12 221.47 249.15 12.55
2002 317.29 304.35 235.08 285.38 277.79 248.43 255.85 274.13 10.03
2003 311.84 323.35 256.74 305.60 293.54 277.52 266.34 287.99 5.06
2004 2) 111.10 115.70 124.19 113.36 113.06 126.20 114.25 116.86 6.40
2005 126.55 131.56 141.50 121.21 119.99 136.60 165.38 136.86 17.11
2006 142.92 139.93 148.34 129.50 127.03 147.70 167.06 145.89 6.60
2007 159.01 148.90 155.58 140.41 132.51 160.74 169.15 155.50 6.59
2008 3) 122.70 114.98 113.02 112.27 109.13 109.84 107.26 113.86 11.06
2009 127.46 123.96 115.09 119.01 113.38 114.11 103.32 117.03 0.33
2010 6.96
January 129.66 126.35 115.48 118.77 113.55 114.22 103.49 118.01 0.84
February 130.78 126.85 115.71 118.21 113.76 114.30 103.60 118.36 0.30
March 129.59 127.21 115.86 118.22 114.04 114.32 103.67 118.19 -0.14
April 130.02 127.52 115.98 118.38 114.23 114.33 103.71 118.37 0.15
May 130.66 127.95 116.09 119.79 114.35 114.35 103.73 118.71 0.29
June 134.84 128.48 116.36 120.91 114.42 114.42 103.89 119.86 0.97
July 141.17 129.32 116.66 120.80 114.73 115.40 105.46 121.74 1.57
August 141.83 130.19 118.51 120.87 115.04 116.86 105.84 122.67 0.76
September 142.46 130.87 118.81 122.18 115.30 117.16 106.44 123.21 0.44
October 141.25 131.50 119.24 124.29 115.58 117.68 105.83 123.29 0.06
November 143.36 132.11 119.54 125.40 115.68 117.78 105.84 124.03 0.60
December 147.39 132.59 119.79 126.76 115.86 117.86 106.10 125.17 0.92
2011 3.79
January 150.64 133.24 120.37 126.95 116.41 118.36 106.43 126.29 0.89
February 150.14 133.86 120.85 126.85 117.21 118.51 106.59 126.46 0.13
March 147.22 134.29 121.20 127.33 117.65 118.71 106.68 126.05 -0.32
April 144.42 134.56 121.46 128.28 118.10 118.80 106.75 125.66 -0.31
May 144.01 134.86 121.76 129.10 118.69 118.83 106.90 125.81 0.12
June 145.84 135.41 122.13 129.84 119.18 119.04 107.06 126.50 0.55
July 148.52 135.98 122.36 130.65 119.50 120.20 107.24 127.35 0.67
August 150.11 136.60 122.76 134.66 119.81 122.77 108.10 128.54 0.93
September 149.97 137.25 123.08 135.96 120.07 123.43 108.29 128.89 0.27
October 149.45 137.61 123.33 134.25 120.38 123.80 107.85 128.74 -0.12
November 150.33 137.88 123.60 136.08 120.58 123.85 107.99 129.18 0.34
December 152.76 138.57 123.95 136.35 120.79 123.94 108.14 129.91 0.57
2012 4.30
January 155.59 139.47 124.62 136.24 121.40 124.12 108.39 130.90 0.76
February 154.45 139.95 124.96 137.90 121.58 124.22 108.46 130.96 0.05
March 153.94 140.59 125.21 138.11 121.77 124.31 108.57 131.05 0.07
Table 4. Indonesia’s Consumer Price Index
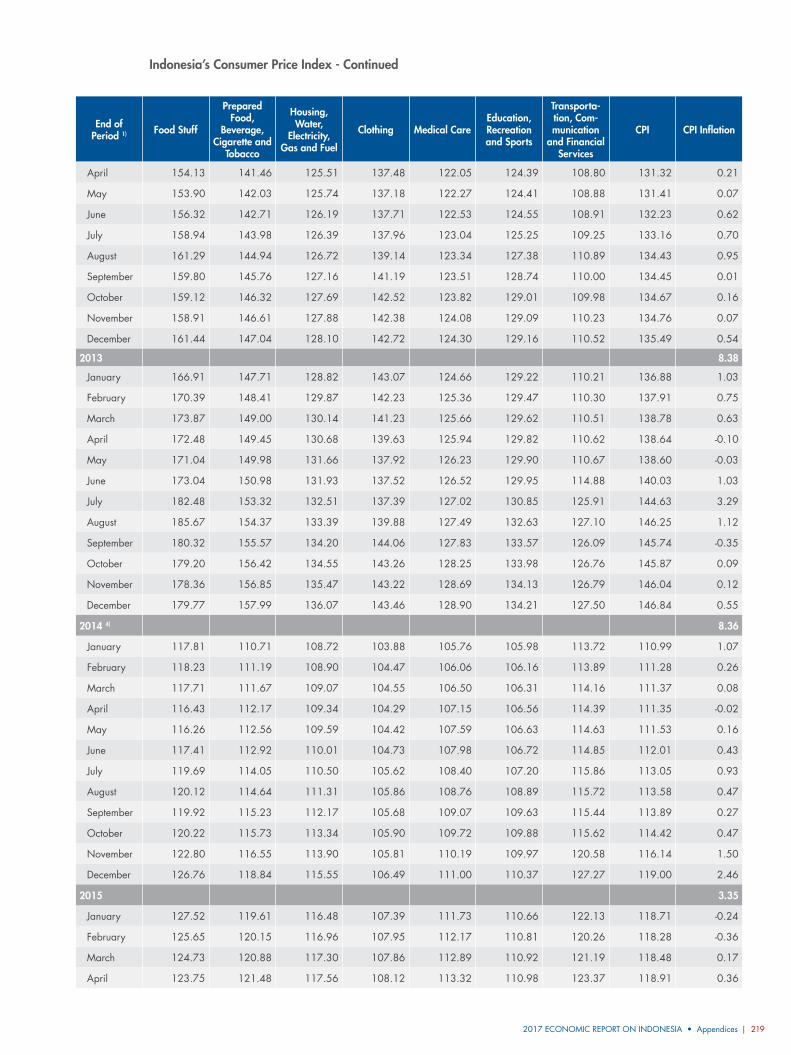
2017 ECONOMIC REPORT ON INDONESIA • Appendices | 219
Indonesia’s Consumer Price Index - Continued
End of Period 1) Food Stuff
Prepared Food,
Beverage, Cigarette and
Tobacco
Housing, Water,
Electricity, Gas and Fuel
Clothing Medical CareEducation, Recreation and Sports
Transporta-tion, Com-munication
and Financial Services
CPI CPI Inflation
April 154.13 141.46 125.51 137.48 122.05 124.39 108.80 131.32 0.21
May 153.90 142.03 125.74 137.18 122.27 124.41 108.88 131.41 0.07
June 156.32 142.71 126.19 137.71 122.53 124.55 108.91 132.23 0.62
July 158.94 143.98 126.39 137.96 123.04 125.25 109.25 133.16 0.70
August 161.29 144.94 126.72 139.14 123.34 127.38 110.89 134.43 0.95
September 159.80 145.76 127.16 141.19 123.51 128.74 110.00 134.45 0.01
October 159.12 146.32 127.69 142.52 123.82 129.01 109.98 134.67 0.16
November 158.91 146.61 127.88 142.38 124.08 129.09 110.23 134.76 0.07
December 161.44 147.04 128.10 142.72 124.30 129.16 110.52 135.49 0.54
2013 8.38
January 166.91 147.71 128.82 143.07 124.66 129.22 110.21 136.88 1.03
February 170.39 148.41 129.87 142.23 125.36 129.47 110.30 137.91 0.75
March 173.87 149.00 130.14 141.23 125.66 129.62 110.51 138.78 0.63
April 172.48 149.45 130.68 139.63 125.94 129.82 110.62 138.64 -0.10
May 171.04 149.98 131.66 137.92 126.23 129.90 110.67 138.60 -0.03
June 173.04 150.98 131.93 137.52 126.52 129.95 114.88 140.03 1.03
July 182.48 153.32 132.51 137.39 127.02 130.85 125.91 144.63 3.29
August 185.67 154.37 133.39 139.88 127.49 132.63 127.10 146.25 1.12
September 180.32 155.57 134.20 144.06 127.83 133.57 126.09 145.74 -0.35
October 179.20 156.42 134.55 143.26 128.25 133.98 126.76 145.87 0.09
November 178.36 156.85 135.47 143.22 128.69 134.13 126.79 146.04 0.12
December 179.77 157.99 136.07 143.46 128.90 134.21 127.50 146.84 0.55
2014 4) 8.36
January 117.81 110.71 108.72 103.88 105.76 105.98 113.72 110.99 1.07
February 118.23 111.19 108.90 104.47 106.06 106.16 113.89 111.28 0.26
March 117.71 111.67 109.07 104.55 106.50 106.31 114.16 111.37 0.08
April 116.43 112.17 109.34 104.29 107.15 106.56 114.39 111.35 -0.02
May 116.26 112.56 109.59 104.42 107.59 106.63 114.63 111.53 0.16
June 117.41 112.92 110.01 104.73 107.98 106.72 114.85 112.01 0.43
July 119.69 114.05 110.50 105.62 108.40 107.20 115.86 113.05 0.93
August 120.12 114.64 111.31 105.86 108.76 108.89 115.72 113.58 0.47
September 119.92 115.23 112.17 105.68 109.07 109.63 115.44 113.89 0.27
October 120.22 115.73 113.34 105.90 109.72 109.88 115.62 114.42 0.47
November 122.80 116.55 113.90 105.81 110.19 109.97 120.58 116.14 1.50
December 126.76 118.84 115.55 106.49 111.00 110.37 127.27 119.00 2.46
2015 3.35
January 127.52 119.61 116.48 107.39 111.73 110.66 122.13 118.71 -0.24
February 125.65 120.15 116.96 107.95 112.17 110.81 120.26 118.28 -0.36
March 124.73 120.88 117.30 107.86 112.89 110.92 121.19 118.48 0.17
April 123.75 121.48 117.56 108.12 113.32 110.98 123.37 118.91 0.36
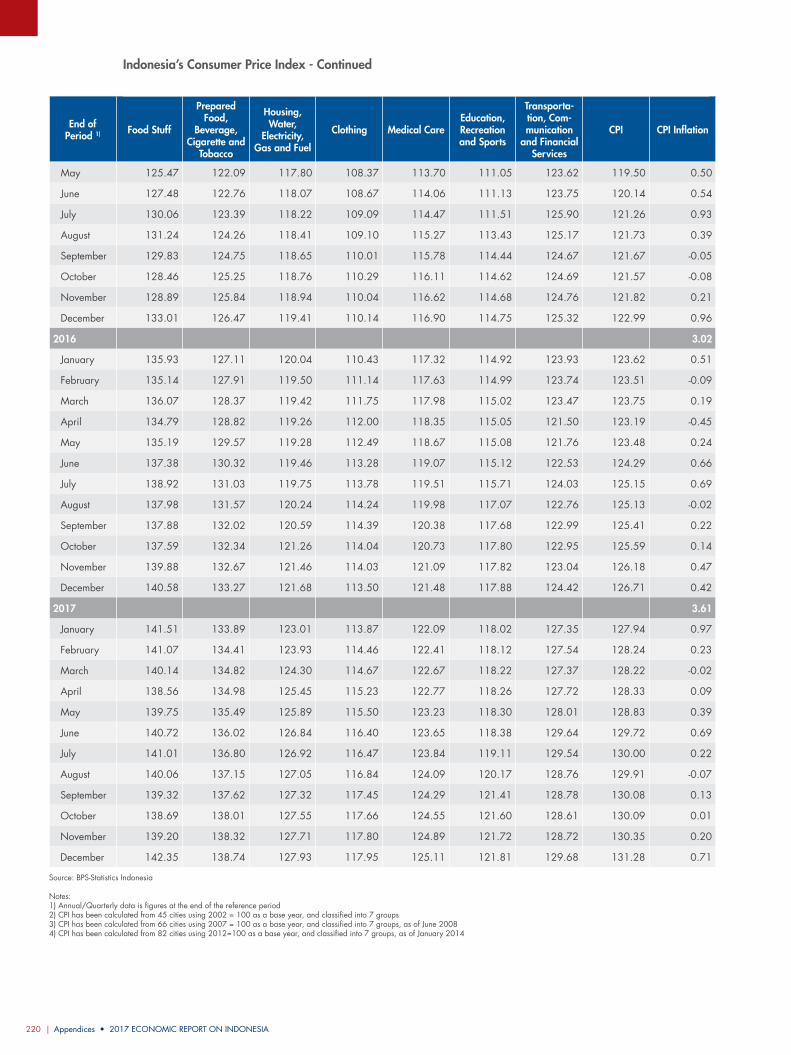
Appendices • 2017 ECONOMIC REPORT ON INDONESIA220 |
End of Period 1) Food Stuff
Prepared Food,
Beverage, Cigarette and
Tobacco
Housing, Water,
Electricity, Gas and Fuel
Clothing Medical CareEducation, Recreation and Sports
Transporta-tion, Com-munication
and Financial Services
CPI CPI Inflation
May 125.47 122.09 117.80 108.37 113.70 111.05 123.62 119.50 0.50
June 127.48 122.76 118.07 108.67 114.06 111.13 123.75 120.14 0.54
July 130.06 123.39 118.22 109.09 114.47 111.51 125.90 121.26 0.93
August 131.24 124.26 118.41 109.10 115.27 113.43 125.17 121.73 0.39
September 129.83 124.75 118.65 110.01 115.78 114.44 124.67 121.67 -0.05
October 128.46 125.25 118.76 110.29 116.11 114.62 124.69 121.57 -0.08
November 128.89 125.84 118.94 110.04 116.62 114.68 124.76 121.82 0.21
December 133.01 126.47 119.41 110.14 116.90 114.75 125.32 122.99 0.96
2016 3.02
January 135.93 127.11 120.04 110.43 117.32 114.92 123.93 123.62 0.51
February 135.14 127.91 119.50 111.14 117.63 114.99 123.74 123.51 -0.09
March 136.07 128.37 119.42 111.75 117.98 115.02 123.47 123.75 0.19
April 134.79 128.82 119.26 112.00 118.35 115.05 121.50 123.19 -0.45
May 135.19 129.57 119.28 112.49 118.67 115.08 121.76 123.48 0.24
June 137.38 130.32 119.46 113.28 119.07 115.12 122.53 124.29 0.66
July 138.92 131.03 119.75 113.78 119.51 115.71 124.03 125.15 0.69
August 137.98 131.57 120.24 114.24 119.98 117.07 122.76 125.13 -0.02
September 137.88 132.02 120.59 114.39 120.38 117.68 122.99 125.41 0.22
October 137.59 132.34 121.26 114.04 120.73 117.80 122.95 125.59 0.14
November 139.88 132.67 121.46 114.03 121.09 117.82 123.04 126.18 0.47
December 140.58 133.27 121.68 113.50 121.48 117.88 124.42 126.71 0.42
2017 3.61
January 141.51 133.89 123.01 113.87 122.09 118.02 127.35 127.94 0.97
February 141.07 134.41 123.93 114.46 122.41 118.12 127.54 128.24 0.23
March 140.14 134.82 124.30 114.67 122.67 118.22 127.37 128.22 -0.02
April 138.56 134.98 125.45 115.23 122.77 118.26 127.72 128.33 0.09
May 139.75 135.49 125.89 115.50 123.23 118.30 128.01 128.83 0.39
June 140.72 136.02 126.84 116.40 123.65 118.38 129.64 129.72 0.69
July 141.01 136.80 126.92 116.47 123.84 119.11 129.54 130.00 0.22
August 140.06 137.15 127.05 116.84 124.09 120.17 128.76 129.91 -0.07
September 139.32 137.62 127.32 117.45 124.29 121.41 128.78 130.08 0.13
October 138.69 138.01 127.55 117.66 124.55 121.60 128.61 130.09 0.01
November 139.20 138.32 127.71 117.80 124.89 121.72 128.72 130.35 0.20
December 142.35 138.74 127.93 117.95 125.11 121.81 129.68 131.28 0.71
Source: BPS-Statistics Indonesia
Notes:1) Annual/Quarterly data is figures at the end of the reference period2) CPI has been calculated from 45 cities using 2002 = 100 as a base year, and classified into 7 groups3) CPI has been calculated from 66 cities using 2007 = 100 as a base year, and classified into 7 groups, as of June 20084) CPI has been calculated from 82 cities using 2012=100 as a base year, and classified into 7 groups, as of January 2014
Indonesia’s Consumer Price Index - Continued
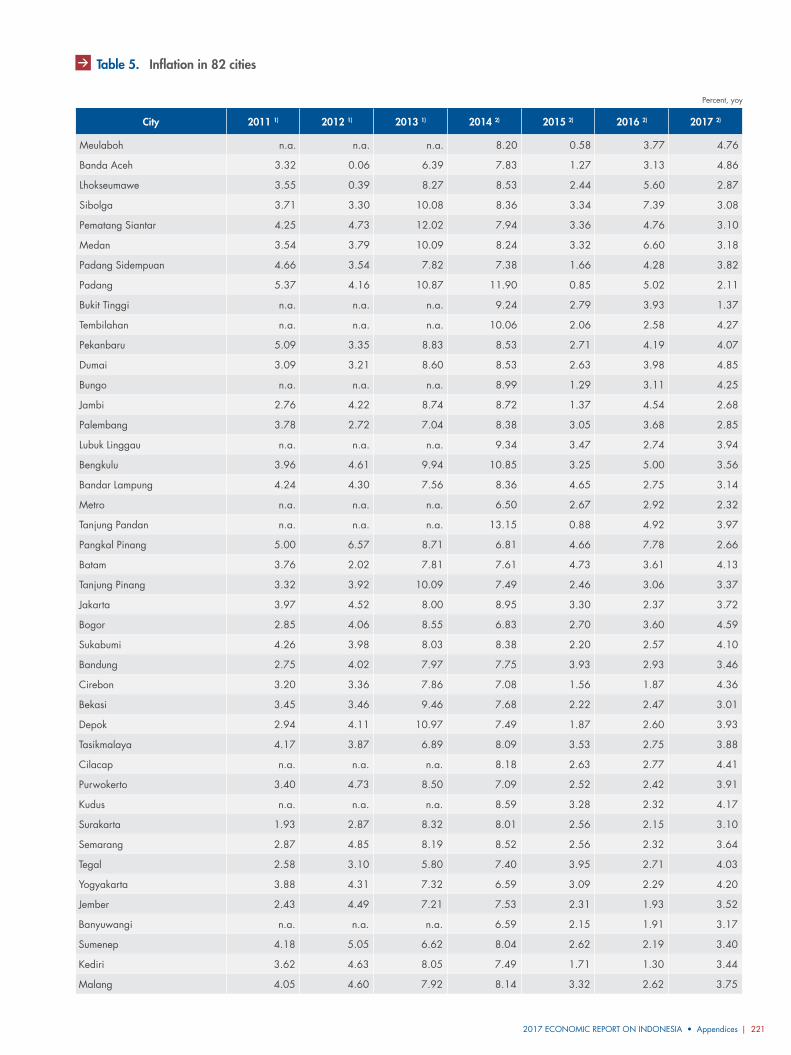
2017 ECONOMIC REPORT ON INDONESIA • Appendices | 221
Percent, yoy
City 2011 1) 2012 1) 2013 1) 2014 2) 2015 2) 2016 2) 2017 2)
Meulaboh n.a. n.a. n.a. 8.20 0.58 3.77 4.76
Banda Aceh 3.32 0.06 6.39 7.83 1.27 3.13 4.86
Lhokseumawe 3.55 0.39 8.27 8.53 2.44 5.60 2.87
Sibolga 3.71 3.30 10.08 8.36 3.34 7.39 3.08
Pematang Siantar 4.25 4.73 12.02 7.94 3.36 4.76 3.10
Medan 3.54 3.79 10.09 8.24 3.32 6.60 3.18
Padang Sidempuan 4.66 3.54 7.82 7.38 1.66 4.28 3.82
Padang 5.37 4.16 10.87 11.90 0.85 5.02 2.11
Bukit Tinggi n.a. n.a. n.a. 9.24 2.79 3.93 1.37
Tembilahan n.a. n.a. n.a. 10.06 2.06 2.58 4.27
Pekanbaru 5.09 3.35 8.83 8.53 2.71 4.19 4.07
Dumai 3.09 3.21 8.60 8.53 2.63 3.98 4.85
Bungo n.a. n.a. n.a. 8.99 1.29 3.11 4.25
Jambi 2.76 4.22 8.74 8.72 1.37 4.54 2.68
Palembang 3.78 2.72 7.04 8.38 3.05 3.68 2.85
Lubuk Linggau n.a. n.a. n.a. 9.34 3.47 2.74 3.94
Bengkulu 3.96 4.61 9.94 10.85 3.25 5.00 3.56
Bandar Lampung 4.24 4.30 7.56 8.36 4.65 2.75 3.14
Metro n.a. n.a. n.a. 6.50 2.67 2.92 2.32
Tanjung Pandan n.a. n.a. n.a. 13.15 0.88 4.92 3.97
Pangkal Pinang 5.00 6.57 8.71 6.81 4.66 7.78 2.66
Batam 3.76 2.02 7.81 7.61 4.73 3.61 4.13
Tanjung Pinang 3.32 3.92 10.09 7.49 2.46 3.06 3.37
Jakarta 3.97 4.52 8.00 8.95 3.30 2.37 3.72
Bogor 2.85 4.06 8.55 6.83 2.70 3.60 4.59
Sukabumi 4.26 3.98 8.03 8.38 2.20 2.57 4.10
Bandung 2.75 4.02 7.97 7.75 3.93 2.93 3.46
Cirebon 3.20 3.36 7.86 7.08 1.56 1.87 4.36
Bekasi 3.45 3.46 9.46 7.68 2.22 2.47 3.01
Depok 2.94 4.11 10.97 7.49 1.87 2.60 3.93
Tasikmalaya 4.17 3.87 6.89 8.09 3.53 2.75 3.88
Cilacap n.a. n.a. n.a. 8.18 2.63 2.77 4.41
Purwokerto 3.40 4.73 8.50 7.09 2.52 2.42 3.91
Kudus n.a. n.a. n.a. 8.59 3.28 2.32 4.17
Surakarta 1.93 2.87 8.32 8.01 2.56 2.15 3.10
Semarang 2.87 4.85 8.19 8.52 2.56 2.32 3.64
Tegal 2.58 3.10 5.80 7.40 3.95 2.71 4.03
Yogyakarta 3.88 4.31 7.32 6.59 3.09 2.29 4.20
Jember 2.43 4.49 7.21 7.53 2.31 1.93 3.52
Banyuwangi n.a. n.a. n.a. 6.59 2.15 1.91 3.17
Sumenep 4.18 5.05 6.62 8.04 2.62 2.19 3.40
Kediri 3.62 4.63 8.05 7.49 1.71 1.30 3.44
Malang 4.05 4.60 7.92 8.14 3.32 2.62 3.75
Table 5. Inflation in 82 cities
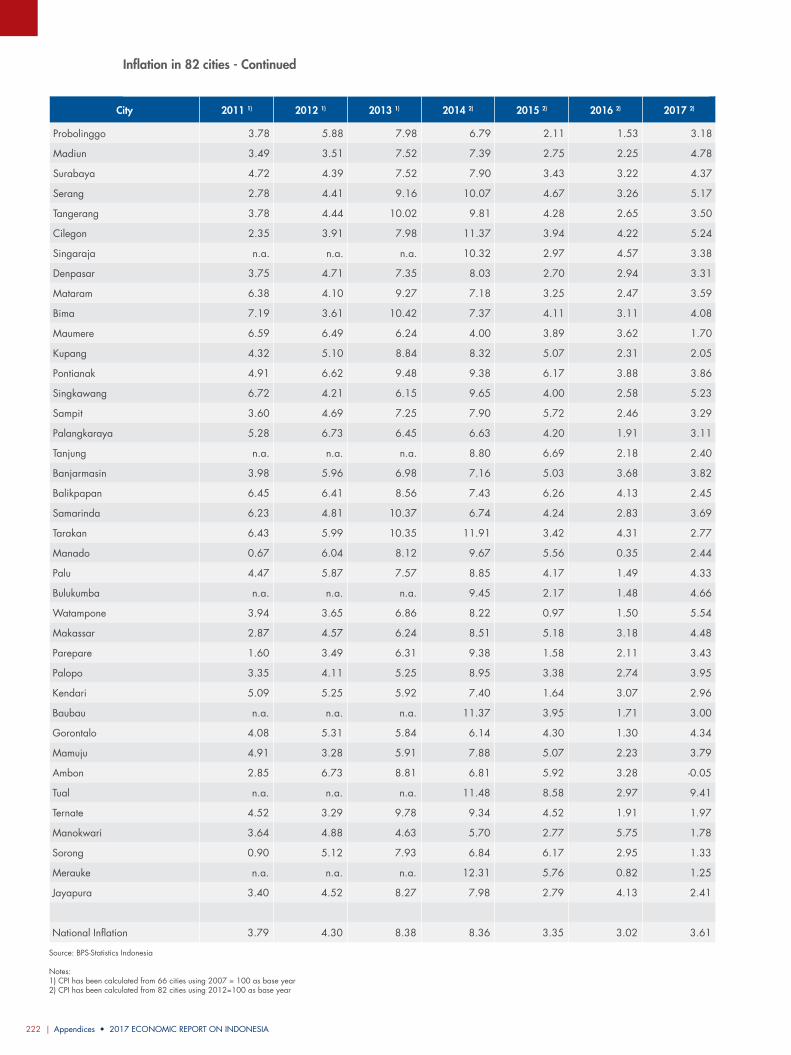
Appendices • 2017 ECONOMIC REPORT ON INDONESIA222 |
City 2011 1) 2012 1) 2013 1) 2014 2) 2015 2) 2016 2) 2017 2)
Probolinggo 3.78 5.88 7.98 6.79 2.11 1.53 3.18
Madiun 3.49 3.51 7.52 7.39 2.75 2.25 4.78
Surabaya 4.72 4.39 7.52 7.90 3.43 3.22 4.37
Serang 2.78 4.41 9.16 10.07 4.67 3.26 5.17
Tangerang 3.78 4.44 10.02 9.81 4.28 2.65 3.50
Cilegon 2.35 3.91 7.98 11.37 3.94 4.22 5.24
Singaraja n.a. n.a. n.a. 10.32 2.97 4.57 3.38
Denpasar 3.75 4.71 7.35 8.03 2.70 2.94 3.31
Mataram 6.38 4.10 9.27 7.18 3.25 2.47 3.59
Bima 7.19 3.61 10.42 7.37 4.11 3.11 4.08
Maumere 6.59 6.49 6.24 4.00 3.89 3.62 1.70
Kupang 4.32 5.10 8.84 8.32 5.07 2.31 2.05
Pontianak 4.91 6.62 9.48 9.38 6.17 3.88 3.86
Singkawang 6.72 4.21 6.15 9.65 4.00 2.58 5.23
Sampit 3.60 4.69 7.25 7.90 5.72 2.46 3.29
Palangkaraya 5.28 6.73 6.45 6.63 4.20 1.91 3.11
Tanjung n.a. n.a. n.a. 8.80 6.69 2.18 2.40
Banjarmasin 3.98 5.96 6.98 7.16 5.03 3.68 3.82
Balikpapan 6.45 6.41 8.56 7.43 6.26 4.13 2.45
Samarinda 6.23 4.81 10.37 6.74 4.24 2.83 3.69
Tarakan 6.43 5.99 10.35 11.91 3.42 4.31 2.77
Manado 0.67 6.04 8.12 9.67 5.56 0.35 2.44
Palu 4.47 5.87 7.57 8.85 4.17 1.49 4.33
Bulukumba n.a. n.a. n.a. 9.45 2.17 1.48 4.66
Watampone 3.94 3.65 6.86 8.22 0.97 1.50 5.54
Makassar 2.87 4.57 6.24 8.51 5.18 3.18 4.48
Parepare 1.60 3.49 6.31 9.38 1.58 2.11 3.43
Palopo 3.35 4.11 5.25 8.95 3.38 2.74 3.95
Kendari 5.09 5.25 5.92 7.40 1.64 3.07 2.96
Baubau n.a. n.a. n.a. 11.37 3.95 1.71 3.00
Gorontalo 4.08 5.31 5.84 6.14 4.30 1.30 4.34
Mamuju 4.91 3.28 5.91 7.88 5.07 2.23 3.79
Ambon 2.85 6.73 8.81 6.81 5.92 3.28 -0.05
Tual n.a. n.a. n.a. 11.48 8.58 2.97 9.41
Ternate 4.52 3.29 9.78 9.34 4.52 1.91 1.97
Manokwari 3.64 4.88 4.63 5.70 2.77 5.75 1.78
Sorong 0.90 5.12 7.93 6.84 6.17 2.95 1.33
Merauke n.a. n.a. n.a. 12.31 5.76 0.82 1.25
Jayapura 3.40 4.52 8.27 7.98 2.79 4.13 2.41
National Inflation 3.79 4.30 8.38 8.36 3.35 3.02 3.61
Source: BPS-Statistics Indonesia
Notes:1) CPI has been calculated from 66 cities using 2007 = 100 as base year2) CPI has been calculated from 82 cities using 2012=100 as base year
Inflation in 82 cities - Continued
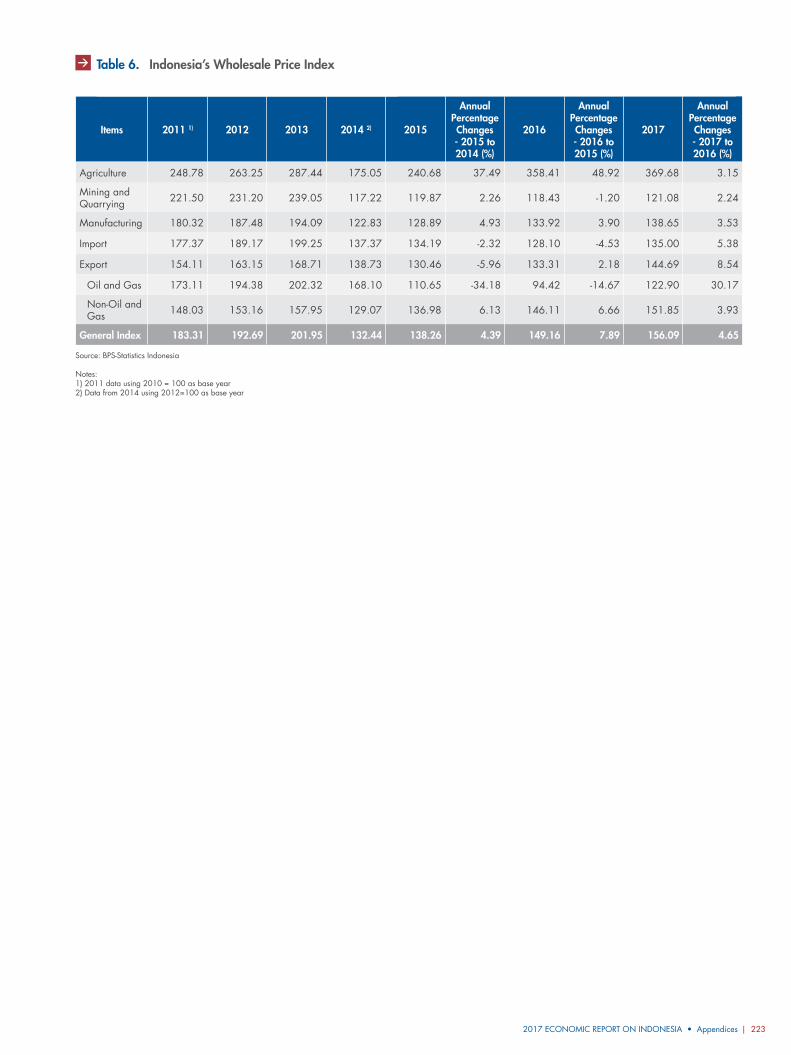
2017 ECONOMIC REPORT ON INDONESIA • Appendices | 223
Items 2011 1) 2012 2013 2014 2) 2015
Annual Percentage Changes - 2015 to 2014 (%)
2016
Annual Percentage Changes - 2016 to 2015 (%)
2017
Annual Percentage Changes - 2017 to 2016 (%)
Agriculture 248.78 263.25 287.44 175.05 240.68 37.49 358.41 48.92 369.68 3.15
Mining and Quarrying 221.50 231.20 239.05 117.22 119.87 2.26 118.43 -1.20 121.08 2.24
Manufacturing 180.32 187.48 194.09 122.83 128.89 4.93 133.92 3.90 138.65 3.53
Import 177.37 189.17 199.25 137.37 134.19 -2.32 128.10 -4.53 135.00 5.38
Export 154.11 163.15 168.71 138.73 130.46 -5.96 133.31 2.18 144.69 8.54
Oil and Gas 173.11 194.38 202.32 168.10 110.65 -34.18 94.42 -14.67 122.90 30.17
Non-Oil and Gas 148.03 153.16 157.95 129.07 136.98 6.13 146.11 6.66 151.85 3.93
General Index 183.31 192.69 201.95 132.44 138.26 4.39 149.16 7.89 156.09 4.65
Source: BPS-Statistics Indonesia
Notes:1) 2011 data using 2010 = 100 as base year 2) Data from 2014 using 2012=100 as base year
Table 6. Indonesia’s Wholesale Price Index
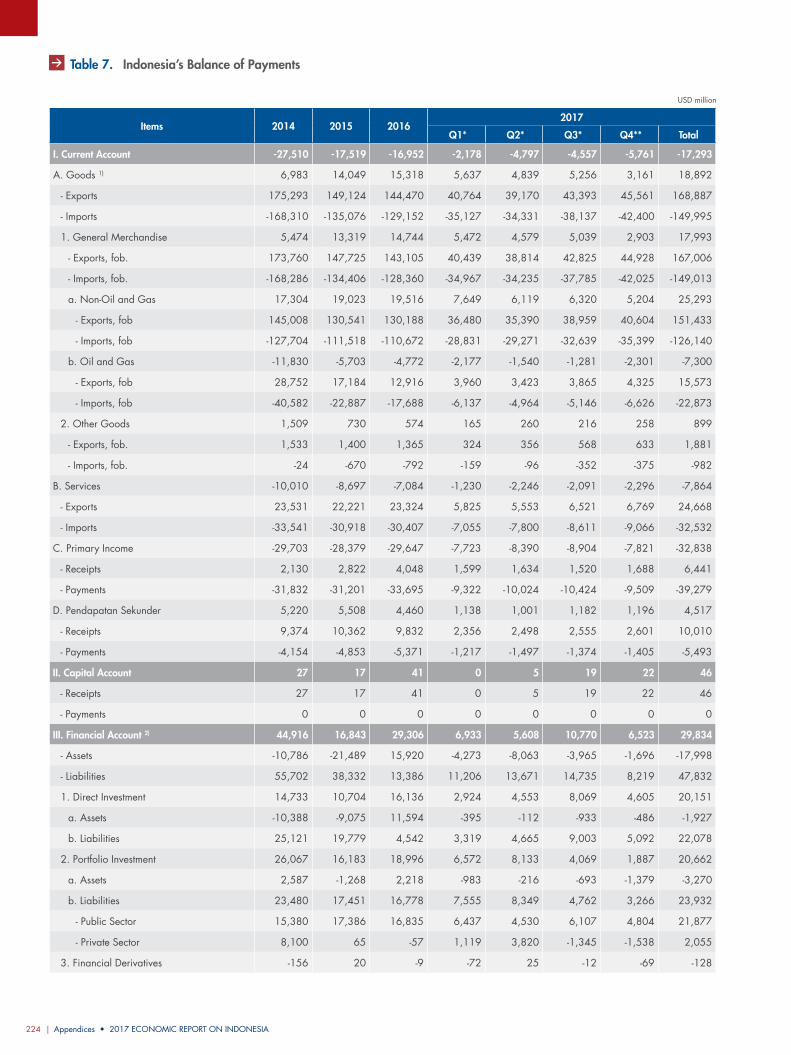
Appendices • 2017 ECONOMIC REPORT ON INDONESIA224 |
USD million
Items 2014 2015 20162017
Q1* Q2* Q3* Q4** Total
I. Current Account -27,510 -17,519 -16,952 -2,178 -4,797 -4,557 -5,761 -17,293
A. Goods 1) 6,983 14,049 15,318 5,637 4,839 5,256 3,161 18,892
- Exports 175,293 149,124 144,470 40,764 39,170 43,393 45,561 168,887
- Imports -168,310 -135,076 -129,152 -35,127 -34,331 -38,137 -42,400 -149,995
1. General Merchandise 5,474 13,319 14,744 5,472 4,579 5,039 2,903 17,993
- Exports, fob. 173,760 147,725 143,105 40,439 38,814 42,825 44,928 167,006
- Imports, fob. -168,286 -134,406 -128,360 -34,967 -34,235 -37,785 -42,025 -149,013
a. Non-Oil and Gas 17,304 19,023 19,516 7,649 6,119 6,320 5,204 25,293
- Exports, fob 145,008 130,541 130,188 36,480 35,390 38,959 40,604 151,433
- Imports, fob -127,704 -111,518 -110,672 -28,831 -29,271 -32,639 -35,399 -126,140
b. Oil and Gas -11,830 -5,703 -4,772 -2,177 -1,540 -1,281 -2,301 -7,300
- Exports, fob 28,752 17,184 12,916 3,960 3,423 3,865 4,325 15,573
- Imports, fob -40,582 -22,887 -17,688 -6,137 -4,964 -5,146 -6,626 -22,873
2. Other Goods 1,509 730 574 165 260 216 258 899
- Exports, fob. 1,533 1,400 1,365 324 356 568 633 1,881
- Imports, fob. -24 -670 -792 -159 -96 -352 -375 -982
B. Services -10,010 -8,697 -7,084 -1,230 -2,246 -2,091 -2,296 -7,864
- Exports 23,531 22,221 23,324 5,825 5,553 6,521 6,769 24,668
- Imports -33,541 -30,918 -30,407 -7,055 -7,800 -8,611 -9,066 -32,532
C. Primary Income -29,703 -28,379 -29,647 -7,723 -8,390 -8,904 -7,821 -32,838
- Receipts 2,130 2,822 4,048 1,599 1,634 1,520 1,688 6,441
- Payments -31,832 -31,201 -33,695 -9,322 -10,024 -10,424 -9,509 -39,279
D. Pendapatan Sekunder 5,220 5,508 4,460 1,138 1,001 1,182 1,196 4,517
- Receipts 9,374 10,362 9,832 2,356 2,498 2,555 2,601 10,010
- Payments -4,154 -4,853 -5,371 -1,217 -1,497 -1,374 -1,405 -5,493
II. Capital Account 27 17 41 0 5 19 22 46
- Receipts 27 17 41 0 5 19 22 46
- Payments 0 0 0 0 0 0 0 0
III. Financial Account 2) 44,916 16,843 29,306 6,933 5,608 10,770 6,523 29,834
- Assets -10,786 -21,489 15,920 -4,273 -8,063 -3,965 -1,696 -17,998
- Liabilities 55,702 38,332 13,386 11,206 13,671 14,735 8,219 47,832
1. Direct Investment 14,733 10,704 16,136 2,924 4,553 8,069 4,605 20,151
a. Assets -10,388 -9,075 11,594 -395 -112 -933 -486 -1,927
b. Liabilities 25,121 19,779 4,542 3,319 4,665 9,003 5,092 22,078
2. Portfolio Investment 26,067 16,183 18,996 6,572 8,133 4,069 1,887 20,662
a. Assets 2,587 -1,268 2,218 -983 -216 -693 -1,379 -3,270
b. Liabilities 23,480 17,451 16,778 7,555 8,349 4,762 3,266 23,932
- Public Sector 15,380 17,386 16,835 6,437 4,530 6,107 4,804 21,877
- Private Sector 8,100 65 -57 1,119 3,820 -1,345 -1,538 2,055
3. Financial Derivatives -156 20 -9 -72 25 -12 -69 -128
Table 7. Indonesia’s Balance of Payments
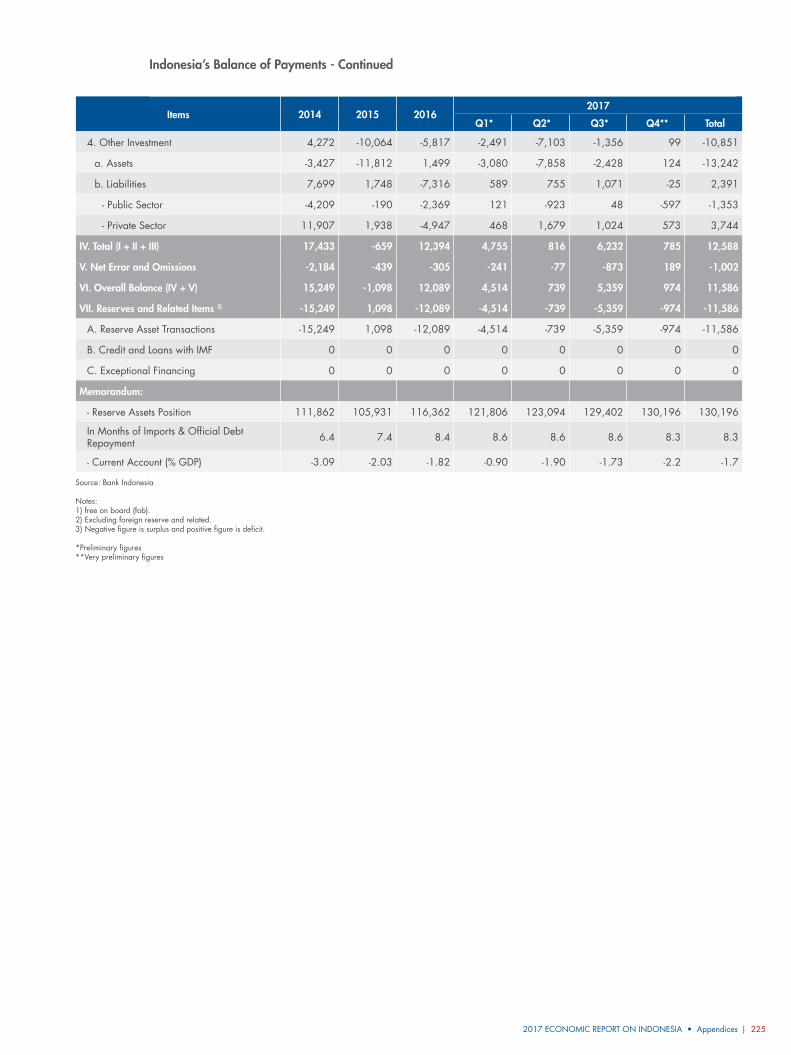
2017 ECONOMIC REPORT ON INDONESIA • Appendices | 225
Items 2014 2015 20162017
Q1* Q2* Q3* Q4** Total
4. Other Investment 4,272 -10,064 -5,817 -2,491 -7,103 -1,356 99 -10,851
a. Assets -3,427 -11,812 1,499 -3,080 -7,858 -2,428 124 -13,242
b. Liabilities 7,699 1,748 -7,316 589 755 1,071 -25 2,391
- Public Sector -4,209 -190 -2,369 121 -923 48 -597 -1,353
- Private Sector 11,907 1,938 -4,947 468 1,679 1,024 573 3,744
IV. Total (I + II + III) 17,433 -659 12,394 4,755 816 6,232 785 12,588
V. Net Error and Omissions -2,184 -439 -305 -241 -77 -873 189 -1,002
VI. Overall Balance (IV + V) 15,249 -1,098 12,089 4,514 739 5,359 974 11,586
VII. Reserves and Related Items 3) -15,249 1,098 -12,089 -4,514 -739 -5,359 -974 -11,586
A. Reserve Asset Transactions -15,249 1,098 -12,089 -4,514 -739 -5,359 -974 -11,586
B. Credit and Loans with IMF 0 0 0 0 0 0 0 0
C. Exceptional Financing 0 0 0 0 0 0 0 0
Memorandum:
- Reserve Assets Position 111,862 105,931 116,362 121,806 123,094 129,402 130,196 130,196
In Months of Imports & Official Debt Repayment 6.4 7.4 8.4 8.6 8.6 8.6 8.3 8.3
- Current Account (% GDP) -3.09 -2.03 -1.82 -0.90 -1.90 -1.73 -2.2 -1.7
Source: Bank Indonesia
Notes:1) free on board (fob).2) Excluding foreign reserve and related.3) Negative figure is surplus and positive figure is deficit.
*Preliminary figures **Very preliminary figures
Indonesia’s Balance of Payments - Continued
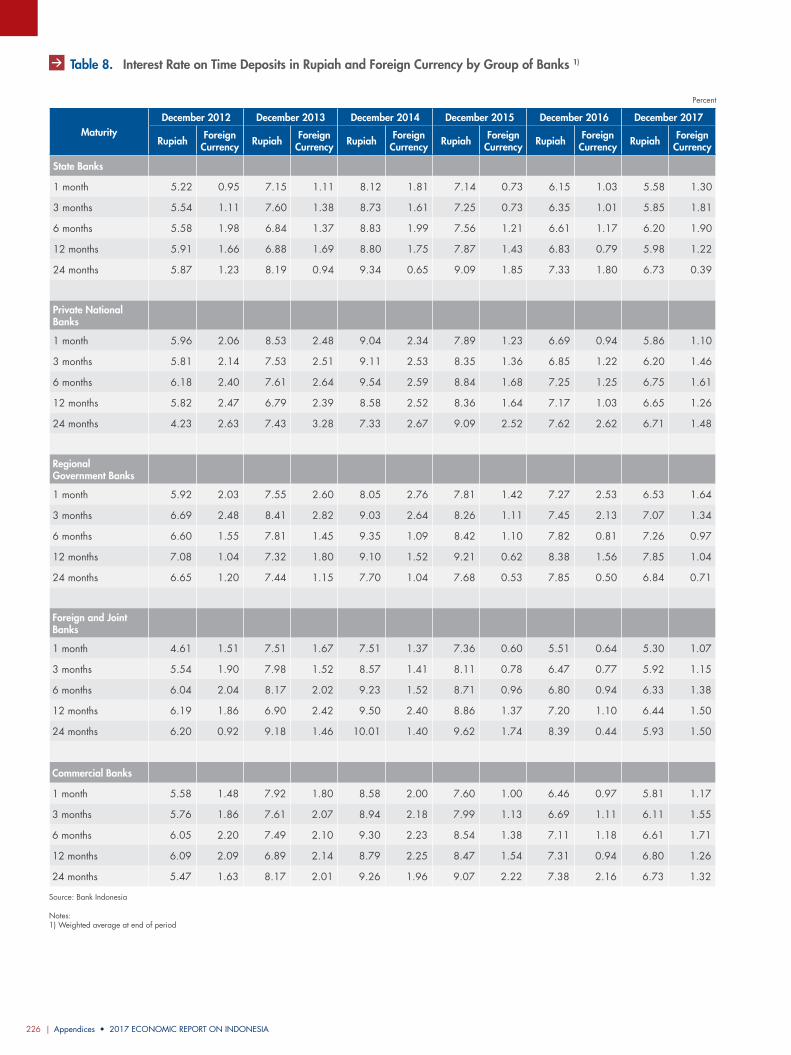
Appendices • 2017 ECONOMIC REPORT ON INDONESIA226 |
Table 8. Interest Rate on Time Deposits in Rupiah and Foreign Currency by Group of Banks 1)
Percent
MaturityDecember 2012 December 2013 December 2014 December 2015 December 2016 December 2017
Rupiah Foreign Currency Rupiah Foreign
Currency Rupiah Foreign Currency Rupiah Foreign
Currency Rupiah Foreign Currency Rupiah Foreign
Currency
State Banks
1 month 5.22 0.95 7.15 1.11 8.12 1.81 7.14 0.73 6.15 1.03 5.58 1.30
3 months 5.54 1.11 7.60 1.38 8.73 1.61 7.25 0.73 6.35 1.01 5.85 1.81
6 months 5.58 1.98 6.84 1.37 8.83 1.99 7.56 1.21 6.61 1.17 6.20 1.90
12 months 5.91 1.66 6.88 1.69 8.80 1.75 7.87 1.43 6.83 0.79 5.98 1.22
24 months 5.87 1.23 8.19 0.94 9.34 0.65 9.09 1.85 7.33 1.80 6.73 0.39
Private National Banks
1 month 5.96 2.06 8.53 2.48 9.04 2.34 7.89 1.23 6.69 0.94 5.86 1.10
3 months 5.81 2.14 7.53 2.51 9.11 2.53 8.35 1.36 6.85 1.22 6.20 1.46
6 months 6.18 2.40 7.61 2.64 9.54 2.59 8.84 1.68 7.25 1.25 6.75 1.61
12 months 5.82 2.47 6.79 2.39 8.58 2.52 8.36 1.64 7.17 1.03 6.65 1.26
24 months 4.23 2.63 7.43 3.28 7.33 2.67 9.09 2.52 7.62 2.62 6.71 1.48
Regional Government Banks
1 month 5.92 2.03 7.55 2.60 8.05 2.76 7.81 1.42 7.27 2.53 6.53 1.64
3 months 6.69 2.48 8.41 2.82 9.03 2.64 8.26 1.11 7.45 2.13 7.07 1.34
6 months 6.60 1.55 7.81 1.45 9.35 1.09 8.42 1.10 7.82 0.81 7.26 0.97
12 months 7.08 1.04 7.32 1.80 9.10 1.52 9.21 0.62 8.38 1.56 7.85 1.04
24 months 6.65 1.20 7.44 1.15 7.70 1.04 7.68 0.53 7.85 0.50 6.84 0.71
Foreign and Joint Banks
1 month 4.61 1.51 7.51 1.67 7.51 1.37 7.36 0.60 5.51 0.64 5.30 1.07
3 months 5.54 1.90 7.98 1.52 8.57 1.41 8.11 0.78 6.47 0.77 5.92 1.15
6 months 6.04 2.04 8.17 2.02 9.23 1.52 8.71 0.96 6.80 0.94 6.33 1.38
12 months 6.19 1.86 6.90 2.42 9.50 2.40 8.86 1.37 7.20 1.10 6.44 1.50
24 months 6.20 0.92 9.18 1.46 10.01 1.40 9.62 1.74 8.39 0.44 5.93 1.50
Commercial Banks
1 month 5.58 1.48 7.92 1.80 8.58 2.00 7.60 1.00 6.46 0.97 5.81 1.17
3 months 5.76 1.86 7.61 2.07 8.94 2.18 7.99 1.13 6.69 1.11 6.11 1.55
6 months 6.05 2.20 7.49 2.10 9.30 2.23 8.54 1.38 7.11 1.18 6.61 1.71
12 months 6.09 2.09 6.89 2.14 8.79 2.25 8.47 1.54 7.31 0.94 6.80 1.26
24 months 5.47 1.63 8.17 2.01 9.26 1.96 9.07 2.22 7.38 2.16 6.73 1.32
Source: Bank Indonesia
Notes:1) Weighted average at end of period
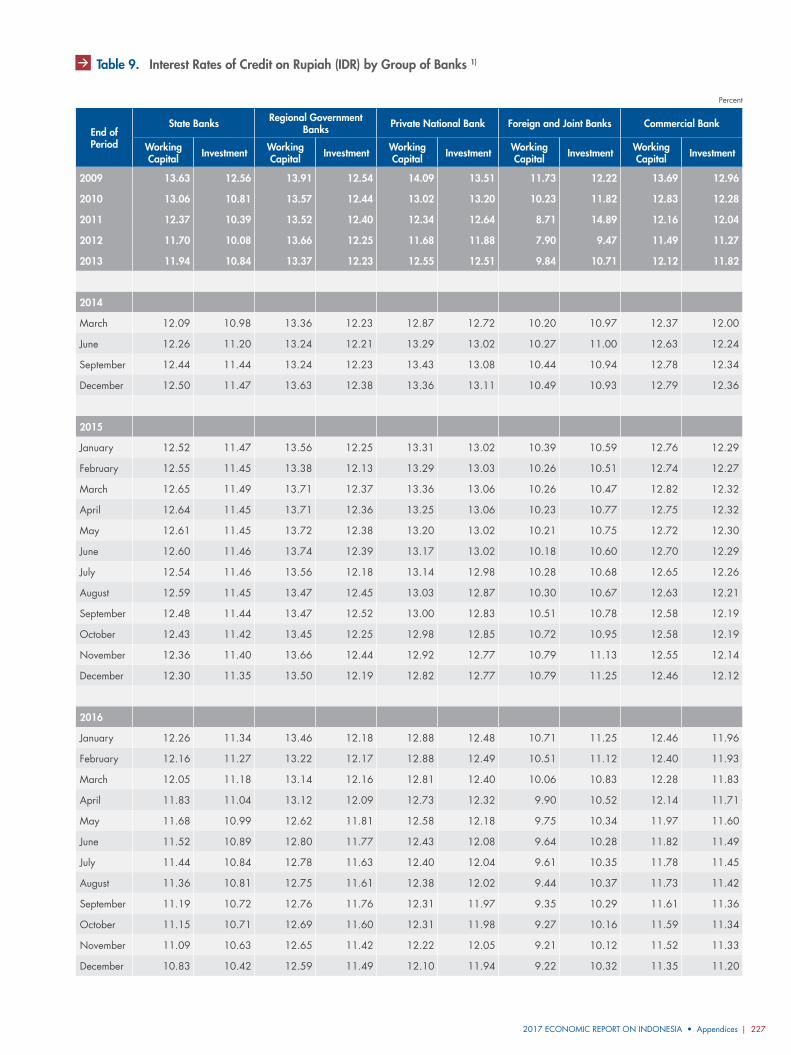
2017 ECONOMIC REPORT ON INDONESIA • Appendices | 227
Percent
End of Period
State Banks Regional Government Banks Private National Bank Foreign and Joint Banks Commercial Bank
Working Capital Investment Working
Capital Investment Working Capital Investment Working
Capital Investment Working Capital Investment
2009 13.63 12.56 13.91 12.54 14.09 13.51 11.73 12.22 13.69 12.96
2010 13.06 10.81 13.57 12.44 13.02 13.20 10.23 11.82 12.83 12.28
2011 12.37 10.39 13.52 12.40 12.34 12.64 8.71 14.89 12.16 12.04
2012 11.70 10.08 13.66 12.25 11.68 11.88 7.90 9.47 11.49 11.27
2013 11.94 10.84 13.37 12.23 12.55 12.51 9.84 10.71 12.12 11.82
2014
March 12.09 10.98 13.36 12.23 12.87 12.72 10.20 10.97 12.37 12.00
June 12.26 11.20 13.24 12.21 13.29 13.02 10.27 11.00 12.63 12.24
September 12.44 11.44 13.24 12.23 13.43 13.08 10.44 10.94 12.78 12.34
December 12.50 11.47 13.63 12.38 13.36 13.11 10.49 10.93 12.79 12.36
2015
January 12.52 11.47 13.56 12.25 13.31 13.02 10.39 10.59 12.76 12.29
February 12.55 11.45 13.38 12.13 13.29 13.03 10.26 10.51 12.74 12.27
March 12.65 11.49 13.71 12.37 13.36 13.06 10.26 10.47 12.82 12.32
April 12.64 11.45 13.71 12.36 13.25 13.06 10.23 10.77 12.75 12.32
May 12.61 11.45 13.72 12.38 13.20 13.02 10.21 10.75 12.72 12.30
June 12.60 11.46 13.74 12.39 13.17 13.02 10.18 10.60 12.70 12.29
July 12.54 11.46 13.56 12.18 13.14 12.98 10.28 10.68 12.65 12.26
August 12.59 11.45 13.47 12.45 13.03 12.87 10.30 10.67 12.63 12.21
September 12.48 11.44 13.47 12.52 13.00 12.83 10.51 10.78 12.58 12.19
October 12.43 11.42 13.45 12.25 12.98 12.85 10.72 10.95 12.58 12.19
November 12.36 11.40 13.66 12.44 12.92 12.77 10.79 11.13 12.55 12.14
December 12.30 11.35 13.50 12.19 12.82 12.77 10.79 11.25 12.46 12.12
2016
January 12.26 11.34 13.46 12.18 12.88 12.48 10.71 11.25 12.46 11.96
February 12.16 11.27 13.22 12.17 12.88 12.49 10.51 11.12 12.40 11.93
March 12.05 11.18 13.14 12.16 12.81 12.40 10.06 10.83 12.28 11.83
April 11.83 11.04 13.12 12.09 12.73 12.32 9.90 10.52 12.14 11.71
May 11.68 10.99 12.62 11.81 12.58 12.18 9.75 10.34 11.97 11.60
June 11.52 10.89 12.80 11.77 12.43 12.08 9.64 10.28 11.82 11.49
July 11.44 10.84 12.78 11.63 12.40 12.04 9.61 10.35 11.78 11.45
August 11.36 10.81 12.75 11.61 12.38 12.02 9.44 10.37 11.73 11.42
September 11.19 10.72 12.76 11.76 12.31 11.97 9.35 10.29 11.61 11.36
October 11.15 10.71 12.69 11.60 12.31 11.98 9.27 10.16 11.59 11.34
November 11.09 10.63 12.65 11.42 12.22 12.05 9.21 10.12 11.52 11.33
December 10.83 10.42 12.59 11.49 12.10 11.94 9.22 10.32 11.35 11.20
Table 9. Interest Rates of Credit on Rupiah (IDR) by Group of Banks 1)
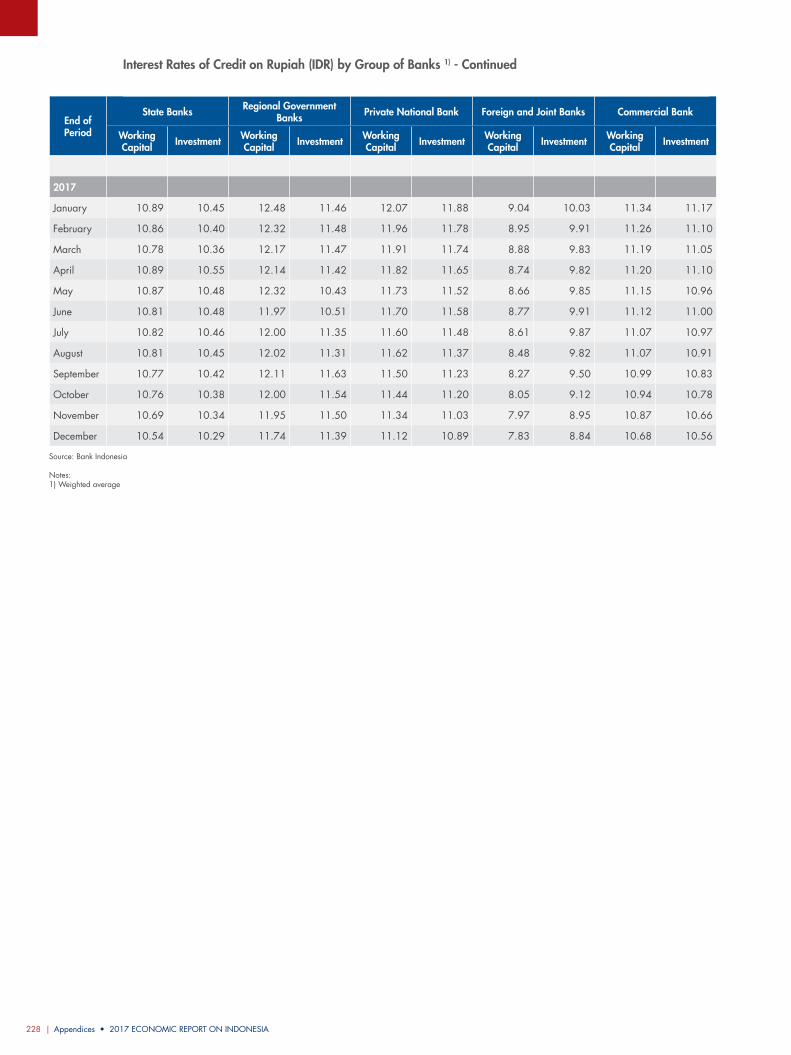
Appendices • 2017 ECONOMIC REPORT ON INDONESIA228 |
End of Period
State Banks Regional Government Banks Private National Bank Foreign and Joint Banks Commercial Bank
Working Capital Investment Working
Capital Investment Working Capital Investment Working
Capital Investment Working Capital Investment
2017
January 10.89 10.45 12.48 11.46 12.07 11.88 9.04 10.03 11.34 11.17
February 10.86 10.40 12.32 11.48 11.96 11.78 8.95 9.91 11.26 11.10
March 10.78 10.36 12.17 11.47 11.91 11.74 8.88 9.83 11.19 11.05
April 10.89 10.55 12.14 11.42 11.82 11.65 8.74 9.82 11.20 11.10
May 10.87 10.48 12.32 10.43 11.73 11.52 8.66 9.85 11.15 10.96
June 10.81 10.48 11.97 10.51 11.70 11.58 8.77 9.91 11.12 11.00
July 10.82 10.46 12.00 11.35 11.60 11.48 8.61 9.87 11.07 10.97
August 10.81 10.45 12.02 11.31 11.62 11.37 8.48 9.82 11.07 10.91
September 10.77 10.42 12.11 11.63 11.50 11.23 8.27 9.50 10.99 10.83
October 10.76 10.38 12.00 11.54 11.44 11.20 8.05 9.12 10.94 10.78
November 10.69 10.34 11.95 11.50 11.34 11.03 7.97 8.95 10.87 10.66
December 10.54 10.29 11.74 11.39 11.12 10.89 7.83 8.84 10.68 10.56
Source: Bank Indonesia
Notes:1) Weighted average
Interest Rates of Credit on Rupiah (IDR) by Group of Banks 1) - Continued
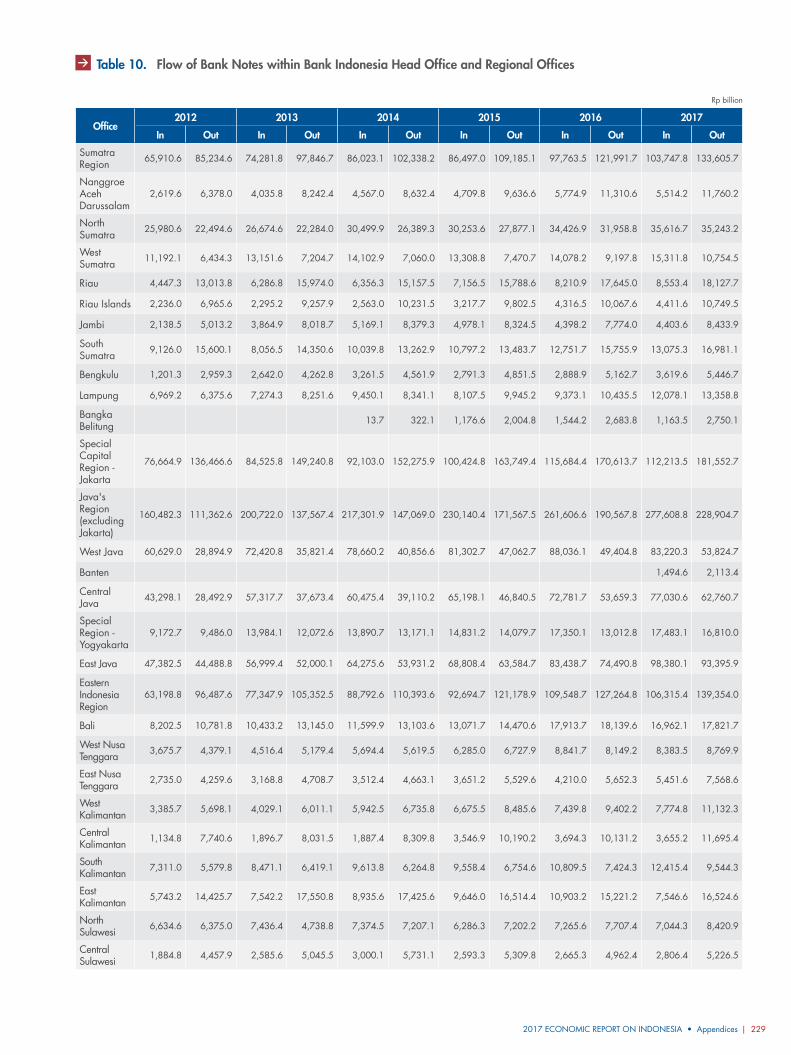
2017 ECONOMIC REPORT ON INDONESIA • Appendices | 229
Rp billion
Office2012 2013 2014 2015 2016 2017
In Out In Out In Out In Out In Out In Out
Sumatra Region 65,910.6 85,234.6 74,281.8 97,846.7 86,023.1 102,338.2 86,497.0 109,185.1 97,763.5 121,991.7 103,747.8 133,605.7
Nanggroe Aceh Darussalam
2,619.6 6,378.0 4,035.8 8,242.4 4,567.0 8,632.4 4,709.8 9,636.6 5,774.9 11,310.6 5,514.2 11,760.2
North Sumatra 25,980.6 22,494.6 26,674.6 22,284.0 30,499.9 26,389.3 30,253.6 27,877.1 34,426.9 31,958.8 35,616.7 35,243.2
West Sumatra 11,192.1 6,434.3 13,151.6 7,204.7 14,102.9 7,060.0 13,308.8 7,470.7 14,078.2 9,197.8 15,311.8 10,754.5
Riau 4,447.3 13,013.8 6,286.8 15,974.0 6,356.3 15,157.5 7,156.5 15,788.6 8,210.9 17,645.0 8,553.4 18,127.7
Riau Islands 2,236.0 6,965.6 2,295.2 9,257.9 2,563.0 10,231.5 3,217.7 9,802.5 4,316.5 10,067.6 4,411.6 10,749.5
Jambi 2,138.5 5,013.2 3,864.9 8,018.7 5,169.1 8,379.3 4,978.1 8,324.5 4,398.2 7,774.0 4,403.6 8,433.9
South Sumatra 9,126.0 15,600.1 8,056.5 14,350.6 10,039.8 13,262.9 10,797.2 13,483.7 12,751.7 15,755.9 13,075.3 16,981.1
Bengkulu 1,201.3 2,959.3 2,642.0 4,262.8 3,261.5 4,561.9 2,791.3 4,851.5 2,888.9 5,162.7 3,619.6 5,446.7
Lampung 6,969.2 6,375.6 7,274.3 8,251.6 9,450.1 8,341.1 8,107.5 9,945.2 9,373.1 10,435.5 12,078.1 13,358.8
Bangka Belitung 13.7 322.1 1,176.6 2,004.8 1,544.2 2,683.8 1,163.5 2,750.1
Special Capital Region - Jakarta
76,664.9 136,466.6 84,525.8 149,240.8 92,103.0 152,275.9 100,424.8 163,749.4 115,684.4 170,613.7 112,213.5 181,552.7
Java's Region (excluding Jakarta)
160,482.3 111,362.6 200,722.0 137,567.4 217,301.9 147,069.0 230,140.4 171,567.5 261,606.6 190,567.8 277,608.8 228,904.7
West Java 60,629.0 28,894.9 72,420.8 35,821.4 78,660.2 40,856.6 81,302.7 47,062.7 88,036.1 49,404.8 83,220.3 53,824.7
Banten 1,494.6 2,113.4
Central Java 43,298.1 28,492.9 57,317.7 37,673.4 60,475.4 39,110.2 65,198.1 46,840.5 72,781.7 53,659.3 77,030.6 62,760.7
Special Region - Yogyakarta
9,172.7 9,486.0 13,984.1 12,072.6 13,890.7 13,171.1 14,831.2 14,079.7 17,350.1 13,012.8 17,483.1 16,810.0
East Java 47,382.5 44,488.8 56,999.4 52,000.1 64,275.6 53,931.2 68,808.4 63,584.7 83,438.7 74,490.8 98,380.1 93,395.9
Eastern Indonesia Region
63,198.8 96,487.6 77,347.9 105,352.5 88,792.6 110,393.6 92,694.7 121,178.9 109,548.7 127,264.8 106,315.4 139,354.0
Bali 8,202.5 10,781.8 10,433.2 13,145.0 11,599.9 13,103.6 13,071.7 14,470.6 17,913.7 18,139.6 16,962.1 17,821.7
West Nusa Tenggara 3,675.7 4,379.1 4,516.4 5,179.4 5,694.4 5,619.5 6,285.0 6,727.9 8,841.7 8,149.2 8,383.5 8,769.9
East Nusa Tenggara 2,735.0 4,259.6 3,168.8 4,708.7 3,512.4 4,663.1 3,651.2 5,529.6 4,210.0 5,652.3 5,451.6 7,568.6
West Kalimantan 3,385.7 5,698.1 4,029.1 6,011.1 5,942.5 6,735.8 6,675.5 8,485.6 7,439.8 9,402.2 7,774.8 11,132.3
Central Kalimantan 1,134.8 7,740.6 1,896.7 8,031.5 1,887.4 8,309.8 3,546.9 10,190.2 3,694.3 10,131.2 3,655.2 11,695.4
South Kalimantan 7,311.0 5,579.8 8,471.1 6,419.1 9,613.8 6,264.8 9,558.4 6,754.6 10,809.5 7,424.3 12,415.4 9,544.3
East Kalimantan 5,743.2 14,425.7 7,542.2 17,550.8 8,935.6 17,425.6 9,646.0 16,514.4 10,903.2 15,221.2 7,546.6 16,524.6
North Sulawesi 6,634.6 6,375.0 7,436.4 4,738.8 7,374.5 7,207.1 6,286.3 7,202.2 7,265.6 7,707.4 7,044.3 8,420.9
Central Sulawesi 1,884.8 4,457.9 2,585.6 5,045.5 3,000.1 5,731.1 2,593.3 5,309.8 2,665.3 4,962.4 2,806.4 5,226.5
Table 10. Flow of Bank Notes within Bank Indonesia Head Office and Regional Offices
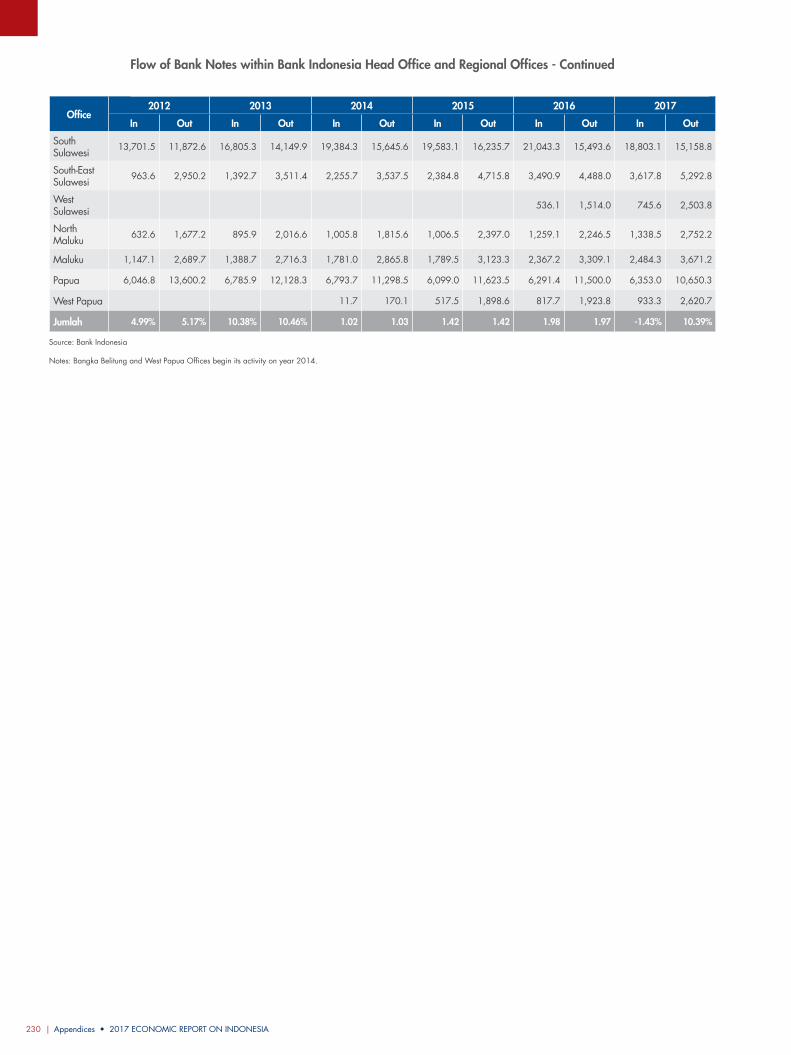
Appendices • 2017 ECONOMIC REPORT ON INDONESIA230 |
Office2012 2013 2014 2015 2016 2017
In Out In Out In Out In Out In Out In Out
South Sulawesi 13,701.5 11,872.6 16,805.3 14,149.9 19,384.3 15,645.6 19,583.1 16,235.7 21,043.3 15,493.6 18,803.1 15,158.8
South-East Sulawesi 963.6 2,950.2 1,392.7 3,511.4 2,255.7 3,537.5 2,384.8 4,715.8 3,490.9 4,488.0 3,617.8 5,292.8
West Sulawesi 536.1 1,514.0 745.6 2,503.8
North Maluku 632.6 1,677.2 895.9 2,016.6 1,005.8 1,815.6 1,006.5 2,397.0 1,259.1 2,246.5 1,338.5 2,752.2
Maluku 1,147.1 2,689.7 1,388.7 2,716.3 1,781.0 2,865.8 1,789.5 3,123.3 2,367.2 3,309.1 2,484.3 3,671.2
Papua 6,046.8 13,600.2 6,785.9 12,128.3 6,793.7 11,298.5 6,099.0 11,623.5 6,291.4 11,500.0 6,353.0 10,650.3
West Papua 11.7 170.1 517.5 1,898.6 817.7 1,923.8 933.3 2,620.7
Jumlah 4.99% 5.17% 10.38% 10.46% 1.02 1.03 1.42 1.42 1.98 1.97 -1.43% 10.39%
Source: Bank Indonesia
Notes: Bangka Belitung and West Papua Offices begin its activity on year 2014.
Flow of Bank Notes within Bank Indonesia Head Office and Regional Offices - Continued
2017 ECONOMIC REPORT ON INDONESIA • Appendices | 231
Term Description
Acquirer Banks or non-bank institutions that cooperating with merchants to process electronic money data issued by other parties.
Administered Prices Inflation of goods and services predominantly influenced or regulated by government policy
Advanced Economy (AE) Group of developed countries, among others, reflected by the GDP and the high level of industrialization
Aging Population Increasing median age in the population of a region due to declining fertility rates and/or rising life expectancy
Currency Appreciation Strengthening of the domestic currency exchange rate (the rupiah for Indonesia) against foreign currency.
Balance sheet reduction The policy of the Fed to reduce the Fed's ownership of securities instruments.
Systemically important bank Banks that have significant impact on the domestic financial system
Basel III Principles The regulatory framework of the banking sector issued by the Basel Committee on Banking Supervision.
Base effect The consequences of the abnormally (either high or low) from previous period, thus affecting the growth rate in the current period
Bid-ask spread The difference between the highest price buyers want to pay for an asset and the lowest price the seller wants to receive.
BI-7DRR The policy rate reflecting the monetary policy stance adopted by Bank Indonesia
Bond connect A market access scheme that allows investors in mainland China and abroad to trade in each other's obliga- tions market.
Brexit Stand for British Exit; a commonly used term for the United Kingdom's withdrawal from the European Union (EU)
BUKU Grouping of banks in Indonesia based on banks’ core capital
Call spread option The combination of buy and sell call option is done simultaneously in one contract with the same nominal but with different strike price.
Capital flows The movement of capital funds can be either inflow to the country or outflow from the country
Clean money policy Policy for replacement of damaged or soiled currency with currency fit for circulation in order to improve the quality standard of currency in circulation
Compact With Africa Framework to encourage private investment and infrastructure provision in Africa.
Consumption smoothing Tendency of consumer to have stable path of consumption over time
Core flexible price The core commodities in the CPI basket that have a higher frequency of price changes.
Core sticky price The core commodities in the CPI basket that are historically experiencing minimal price changes along with periodic price adjustments and not in high frequency.
Cost-push inflation Inflation caused by a substantial increase in cost or input production of goods or services.
Counter cyclical Movement in the opposite direction of the economic cycle.
Counter cyclical capital buffer (CCB)
A policy aimed at preventing the occurrence of systemic risk due to periods of excessive channeling of loans through the establishment of additional capital for bank
Affirmation-Special Allocation Fund/DAK
Special Allocation Fund/DAK directed to finance the acceleration of infrastructure and infrastructure provision in the areas of underdeveloped regions, borders, islands and transmigration.
Physical - Special Allocation Fund/DAK State budget/APBN allocated to local governments with the aim of assisting in funding physical development activities.
Non-Physical - Special Allocation Fund/DAK
State budget/APBN allocated to local governments with the aim of assisting in funding activities other than physical development activities.
Village Fund State budget/APBN devoted to Indigenous Villages and Villages are transferred through the Regency / Municipal Revenue and Expenditure Budget and are used to finance governance, development, and community empowerment.
Balancing Fund State budget/APBN allocated to regions (autonomous) to fund regional needs in the context of decentralization implementation.
Deflation General decline in prices of goods and services
Deleveraging The action of a country to reduce its debt in large quantities in order to promote its economic growth.
Demonetization Removal or recall of monetary standard functions and means of payment.
Deposit Facility Placement of rupiah funds (overnight) by banks at Bank Indonesia
Time deposit Deposit product with a predetermined withdrawal period, based on an agreement between the bank and the customer.
Currency Depreciation Weakening of the domestic currency exchange rate (the rupiah for Indonesia) against foreign currency.
Durable Goods Commodities in the CPI basket that are durable.
Divestment Reduction on a company's capital.
Glossary
Appendices • 2017 ECONOMIC REPORT ON INDONESIA232 |
Term Description
Double Swipe A transaction/payment by double scraping the card
e-Commerce Online trading
El Nino and La Nina El Nino is a warm phase and La Nina is a cool phase of a recurring seasonal pattern in the Pasific tropics. El Nino and La Nina caused changes in global temperature and precipitation.
Emerging Market (EM) Group of nations with rapidly growing economies, reflected among others in their financial markets development and industrialization
Issuer Companies, both private and state-owned, seek capital from the stock exchange by issuing securities (stocks, bonds, rights issue, warrant, etc).
Exchange Rate Pass Through Impact of Rupiah exchange rate to inflation
Financial Inclusion Provision of affordable financial services access for all segments in society.
Fiscal Multiplier Used to determine the change in government spending or tax policy increases or decreases the gross domestic product (GDP)
Forward Sales contract to buy or sell the asset at a certain price in the future (future date).
Poverty Line Amount of minimum spending to fulfill basic needs for food and non-food.
Gen-Y or Millenials Generations who were born in the early 1980s to early 2000s, in general this generation is more intensive in using digital technology and internet.
Geopolitics Political condition affected by geographical conditions
Demand Deposit Deposits in banks which the withdrawals may be made at any time by using checks or other payment orders or by book-entry.
Reserve Requirement Funds or minimum deposits that must be maintained by banks in demand deposit placed at Bank Indonesia.
Reserve Requirement Loan to Funding Ratio
Minimum deposit in Rupiah that must be maintained by the Bank in a Demand Deposit Account balance at Bank Indonesia by certain percentage of Deposits calculated based on the difference between the LFR owned by the Bank and the target LFR.
Hedging Hedging Transactions in a way or technique to reduce the risks which arise or expected to arise due to price fluctuations in financial markets.
Imported inflation Inflation caused by rising prices of imported goods.
Indonesia Export Commodity Price Index Composite index of Indonesia's export prices which consists of commodities with the largest export value.
Poverty Depth Index The average measurement of the spending disparity of each poor people to the poverty line.
Poverty Severity index Measurement of expenditure spread among the poor people.
Production Index The measurement of output from the industrial sector in the economy. Industrial sectors include manufacturing, mining and equipment.
Core InflationComponent of inflation which is likely to be persistent in the inflation movement and influenced by fundamental factors such as demand-supply interactions, exchange rates, international commodity prices, trading partner inflation and Inflation Expectations.
Integrated cash register link EDC connected to the cash register.
Investment grade Investment grade rating
Iron Stock Nasional Standby money supply in order to anticipate the force majeur conditions, such as natural disasters, bank rush, and other unpredictable conditions that resulted in increasing demand for money.
Cash Custodian Provision of rupiah money owned by Bank Indonesia deposited to a bank (bank manager) to cover the cash reserves of banks (bank participant) in order to meet the society needs in a particular region / region.
Implementation of Prudential Principles (KPPK)
Non-bank corporate activities which is carried out in order to mitigate exchange rate risk, liquidity risk, and overleverage of foreign debt.
Primary Balance Total revenue minus total expenditures by expelling interest payment components.
Financial Inclusion Financial services deepening for low income people to be able for benefiting formal financial products.
Diversity Coefficient The measurement to show inflation deviation of major volatile food among regions towards the national volatile food commodity inflation.
Compensation per worker All remuneration paid by the company as a return to the employee (including salary, bonus, overtime, and social security net costs)divided by the number of workers.
Standard Institution Nonprofits institution which is in charge for making, developing and managing standards to ensure interconnection and interoperability of payment instruments, payment channels and switching and security.
Services Institution Nonprofits institution which responsible for maintaining transaction security, customer protection, optimal operational services, handling transaction disputes for consumer protection, and developing acceptance expansions.
Switching Institution Institutions assigned to process payment transactions data domestically
Lending Facility Financial services deepening for low income people to be able for benefiting formal financial products.
2017 ECONOMIC REPORT ON INDONESIA • Appendices | 233
Term Description
Lifting Volume of oil taken from the storage tank, transported by tanker or via pipeline, and sold to buyers. In other words, oil lifting is the production of ready-to-sell oil.
Liquidity The ability of a company to pay its short-term liabilities.
Financial Literacy Knowledge of financial management.
M1 Narrowed money (currency and demand deposit).
M2 Broad money (currency, demand deposit and deposit).
Macroprudential A financial regulatory approach aimed in mitigating the financial system risk as a whole.
Medium term budgetary objective
Balanced budget target set by the European Commission specifically to the member states of the European Union to ensure sound and sustainable fiscal policy.
Merchant Discount Rate Tariff charged on merchant / merchant by bank.
Metode Markov Switching The method used to model time series data on the economic and financial variables undergoing changing conditions.
Hazton Method Technological method in cultivation of rice plants with the number of seedlings 20 to 30 seedlings and planting seedlings age old enough about 30-35 days.
Microprudential Prudential associated with the financial institution management individually in order not to endanger the sustainability of its business.
Money Supply The total amount of money in the society and circulating in the economy.
Multiplier Tools to improve the multiplier effect for a thing / policy.
Current account balance Part of balance of payments that records a nation’s flow of goods and services
Non-durable goods See definition of durable goods.
Non-tradable See definition of tradable.
Offshore Foreign exchange transactions conducted outside the territory of the country that issues the currency
Off-balance sheet Financing techniques that make assets or debt not recorded in the balance sheet.
Onshore Foreign exchange transactions conducted within the territory of the country that issues the currency
Options An agreement that gives the buyer the option to purchase or sell the contract at a specified price in the future.
Output gap The difference between actual GDP and potential GDP
Peer countries Group of countries with similar characteristics
Tax amnesty Tax abolition for taxpayers who do not meet the obligation to pay taxes in exchange for paying taxes at a lower rate
Purchasing Manager IndexIndex obtained based on survey results to sample corporations in the manufacturing industry sector from the purchasing managers side to predict future conditions for economic growth. PMI above 50 indicates improvement, while PMI below 50 indicates deterioration.
Quantitative Easing Policy for loosening or augmenting the monetary stimulus by the central bank by purchasing financial assets in a certain volume from commercial banks or other private institutions.
Quasi-fiscal Fiscal activities but carried out outside the government budget.
Gini Ratio Coefficient that measures the degree of inequality income distribution in society.
Refinancing Replace a loan with another loan.
Return one of the factors that motivate investors to invest and also rewarding an investor’s courage in assuming the risks of his investment.
Reverse Repo Transaction for purchase of securities with a commitment to resell at an agreed term and price.
Second round effect Impact of propagation.
Shadow banking Non-bank financial institutions that perform like banking functions.
Smelter Mineral processing and refining plant
Soil Level Rate / standard money riots.
Solvability The ability of the company to pay all its obligations.
Spot Forex transactions with settlement on the same day or maximum within two days.
Statutory Liquidity Ratio The bank's obligation to provide current assets in the form of money, gold, or securities recognized by the Central Bank amounting to a certain percentage of its liabilities.
Fiscal Stimulus The government's fiscal policy aimed at encouraging aggregate demand is further expected to impact on short-term economic activity
Stock connect Cross-border investment channel which connecting Shanghai Stock Exchange and Hong Kong Stock Exchange. In that program, investors in each market can trade stocks in other markets using local brokers and clearing at home.
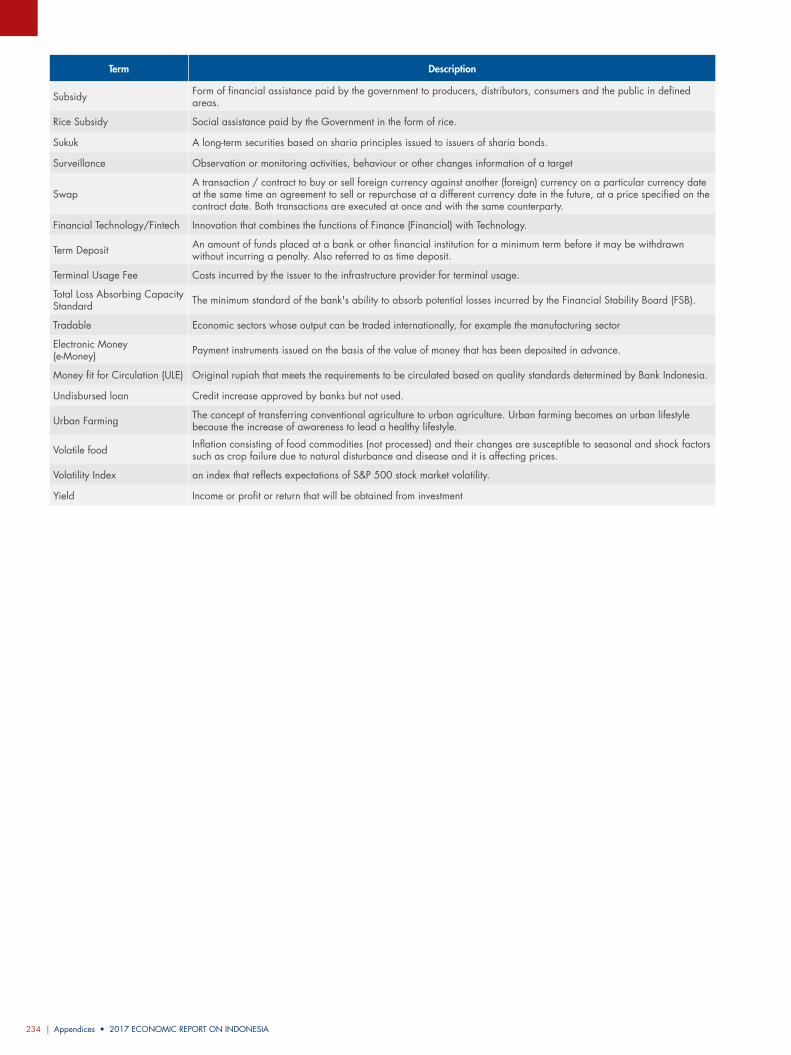
Appendices • 2017 ECONOMIC REPORT ON INDONESIA234 |
Term Description
Subsidy Form of financial assistance paid by the government to producers, distributors, consumers and the public in defined areas.
Rice Subsidy Social assistance paid by the Government in the form of rice.
Sukuk A long-term securities based on sharia principles issued to issuers of sharia bonds.
Surveillance Observation or monitoring activities, behaviour or other changes information of a target
SwapA transaction / contract to buy or sell foreign currency against another (foreign) currency on a particular currency date at the same time an agreement to sell or repurchase at a different currency date in the future, at a price specified on the contract date. Both transactions are executed at once and with the same counterparty.
Financial Technology/Fintech Innovation that combines the functions of Finance (Financial) with Technology.
Term Deposit An amount of funds placed at a bank or other financial institution for a minimum term before it may be withdrawn without incurring a penalty. Also referred to as time deposit.
Terminal Usage Fee Costs incurred by the issuer to the infrastructure provider for terminal usage.
Total Loss Absorbing Capacity Standard The minimum standard of the bank's ability to absorb potential losses incurred by the Financial Stability Board (FSB).
Tradable Economic sectors whose output can be traded internationally, for example the manufacturing sector
Electronic Money (e-Money) Payment instruments issued on the basis of the value of money that has been deposited in advance.
Money fit for Circulation (ULE) Original rupiah that meets the requirements to be circulated based on quality standards determined by Bank Indonesia.
Undisbursed loan Credit increase approved by banks but not used.
Urban Farming The concept of transferring conventional agriculture to urban agriculture. Urban farming becomes an urban lifestyle because the increase of awareness to lead a healthy lifestyle.
Volatile food Inflation consisting of food commodities (not processed) and their changes are susceptible to seasonal and shock factors such as crop failure due to natural disturbance and disease and it is affecting prices.
Volatility Index an index that reflects expectations of S&P 500 stock market volatility.
Yield Income or profit or return that will be obtained from investment
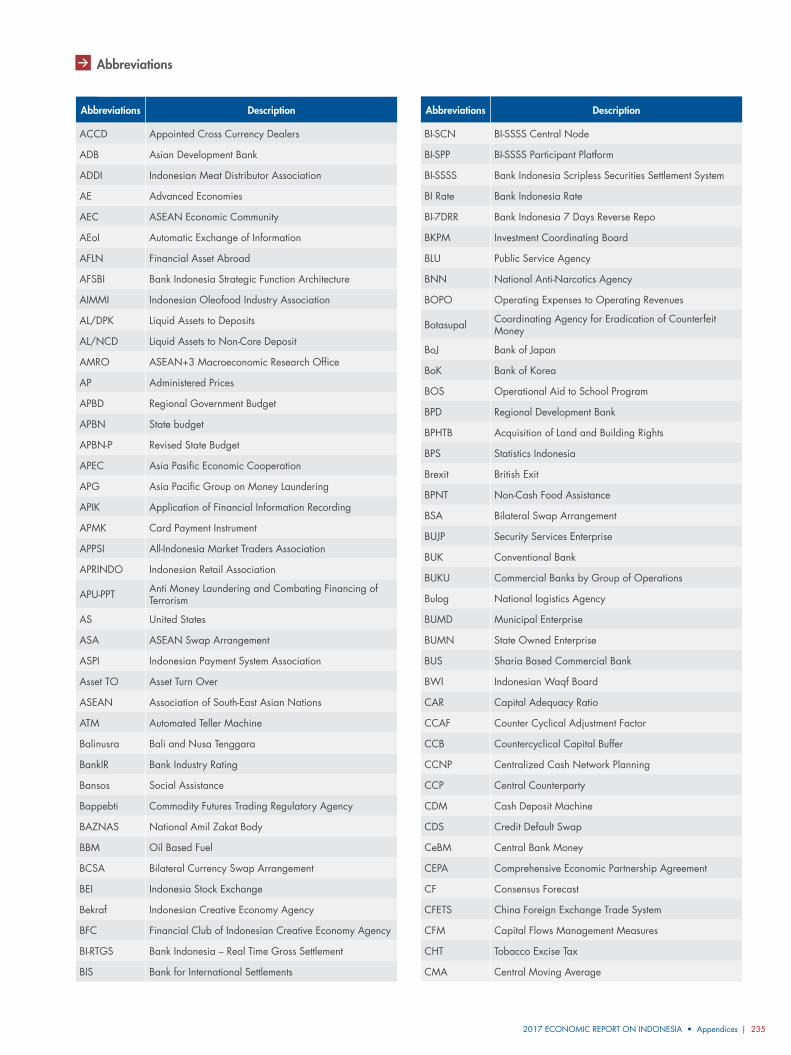
2017 ECONOMIC REPORT ON INDONESIA • Appendices | 235
Abbreviations Description
ACCD Appointed Cross Currency Dealers
ADB Asian Development Bank
ADDI Indonesian Meat Distributor Association
AE Advanced Economies
AEC ASEAN Economic Community
AEoI Automatic Exchange of Information
AFLN Financial Asset Abroad
AFSBI Bank Indonesia Strategic Function Architecture
AIMMI Indonesian Oleofood Industry Association
AL/DPK Liquid Assets to Deposits
AL/NCD Liquid Assets to Non-Core Deposit
AMRO ASEAN+3 Macroeconomic Research Office
AP Administered Prices
APBD Regional Government Budget
APBN State budget
APBN-P Revised State Budget
APEC Asia Pasific Economic Cooperation
APG Asia Pacific Group on Money Laundering
APIK Application of Financial Information Recording
APMK Card Payment Instrument
APPSI All-Indonesia Market Traders Association
APRINDO Indonesian Retail Association
APU-PPT Anti Money Laundering and Combating Financing of Terrorism
AS United States
ASA ASEAN Swap Arrangement
ASPI Indonesian Payment System Association
Asset TO Asset Turn Over
ASEAN Association of South-East Asian Nations
ATM Automated Teller Machine
Balinusra Bali and Nusa Tenggara
BankIR Bank Industry Rating
Bansos Social Assistance
Bappebti Commodity Futures Trading Regulatory Agency
BAZNAS National Amil Zakat Body
BBM Oil Based Fuel
BCSA Bilateral Currency Swap Arrangement
BEI Indonesia Stock Exchange
Bekraf Indonesian Creative Economy Agency
BFC Financial Club of Indonesian Creative Economy Agency
BI-RTGS Bank Indonesia – Real Time Gross Settlement
BIS Bank for International Settlements
Abbreviations Description
BI-SCN BI-SSSS Central Node
BI-SPP BI-SSSS Participant Platform
BI-SSSS Bank Indonesia Scripless Securities Settlement System
BI Rate Bank Indonesia Rate
BI-7DRR Bank Indonesia 7 Days Reverse Repo
BKPM Investment Coordinating Board
BLU Public Service Agency
BNN National Anti-Narcotics Agency
BOPO Operating Expenses to Operating Revenues
Botasupal Coordinating Agency for Eradication of Counterfeit Money
BoJ Bank of Japan
BoK Bank of Korea
BOS Operational Aid to School Program
BPD Regional Development Bank
BPHTB Acquisition of Land and Building Rights
BPS Statistics Indonesia
Brexit British Exit
BPNT Non-Cash Food Assistance
BSA Bilateral Swap Arrangement
BUJP Security Services Enterprise
BUK Conventional Bank
BUKU Commercial Banks by Group of Operations
Bulog National logistics Agency
BUMD Municipal Enterprise
BUMN State Owned Enterprise
BUS Sharia Based Commercial Bank
BWI Indonesian Waqf Board
CAR Capital Adequacy Ratio
CCAF Counter Cyclical Adjustment Factor
CCB Countercyclical Capital Buffer
CCNP Centralized Cash Network Planning
CCP Central Counterparty
CDM Cash Deposit Machine
CDS Credit Default Swap
CeBM Central Bank Money
CEPA Comprehensive Economic Partnership Agreement
CF Consensus Forecast
CFETS China Foreign Exchange Trade System
CFM Capital Flows Management Measures
CHT Tobacco Excise Tax
CMA Central Moving Average
Abbreviations
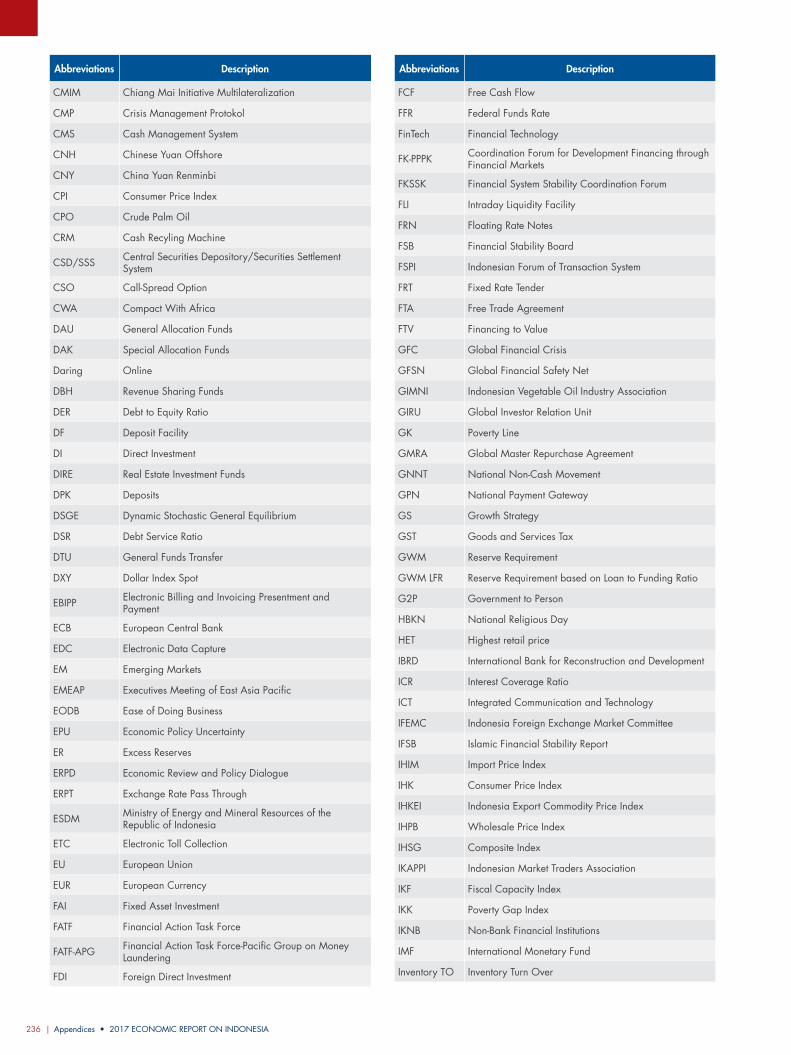
Appendices • 2017 ECONOMIC REPORT ON INDONESIA236 |
Abbreviations Description
CMIM Chiang Mai Initiative Multilateralization
CMP Crisis Management Protokol
CMS Cash Management System
CNH Chinese Yuan Offshore
CNY China Yuan Renminbi
CPI Consumer Price Index
CPO Crude Palm Oil
CRM Cash Recyling Machine
CSD/SSS Central Securities Depository/Securities Settlement System
CSO Call-Spread Option
CWA Compact With Africa
DAU General Allocation Funds
DAK Special Allocation Funds
Daring Online
DBH Revenue Sharing Funds
DER Debt to Equity Ratio
DF Deposit Facility
DI Direct Investment
DIRE Real Estate Investment Funds
DPK Deposits
DSGE Dynamic Stochastic General Equilibrium
DSR Debt Service Ratio
DTU General Funds Transfer
DXY Dollar Index Spot
EBIPP Electronic Billing and Invoicing Presentment and Payment
ECB European Central Bank
EDC Electronic Data Capture
EM Emerging Markets
EMEAP Executives Meeting of East Asia Pacific
EODB Ease of Doing Business
EPU Economic Policy Uncertainty
ER Excess Reserves
ERPD Economic Review and Policy Dialogue
ERPT Exchange Rate Pass Through
ESDM Ministry of Energy and Mineral Resources of the Republic of Indonesia
ETC Electronic Toll Collection
EU European Union
EUR European Currency
FAI Fixed Asset Investment
FATF Financial Action Task Force
FATF-APG Financial Action Task Force-Pacific Group on Money Laundering
FDI Foreign Direct Investment
Abbreviations Description
FCF Free Cash Flow
FFR Federal Funds Rate
FinTech Financial Technology
FK-PPPK Coordination Forum for Development Financing through Financial Markets
FKSSK Financial System Stability Coordination Forum
FLI Intraday Liquidity Facility
FRN Floating Rate Notes
FSB Financial Stability Board
FSPI Indonesian Forum of Transaction System
FRT Fixed Rate Tender
FTA Free Trade Agreement
FTV Financing to Value
GFC Global Financial Crisis
GFSN Global Financial Safety Net
GIMNI Indonesian Vegetable Oil Industry Association
GIRU Global Investor Relation Unit
GK Poverty Line
GMRA Global Master Repurchase Agreement
GNNT National Non-Cash Movement
GPN National Payment Gateway
GS Growth Strategy
GST Goods and Services Tax
GWM Reserve Requirement
GWM LFR Reserve Requirement based on Loan to Funding Ratio
G2P Government to Person
HBKN National Religious Day
HET Highest retail price
IBRD International Bank for Reconstruction and Development
ICR Interest Coverage Ratio
ICT Integrated Communication and Technology
IFEMC Indonesia Foreign Exchange Market Committee
IFSB Islamic Financial Stability Report
IHIM Import Price Index
IHK Consumer Price Index
IHKEI Indonesia Export Commodity Price Index
IHPB Wholesale Price Index
IHSG Composite Index
IKAPPI Indonesian Market Traders Association
IKF Fiscal Capacity Index
IKK Poverty Gap Index
IKNB Non-Bank Financial Institutions
IMF International Monetary Fund
Inventory TO Inventory Turn Over
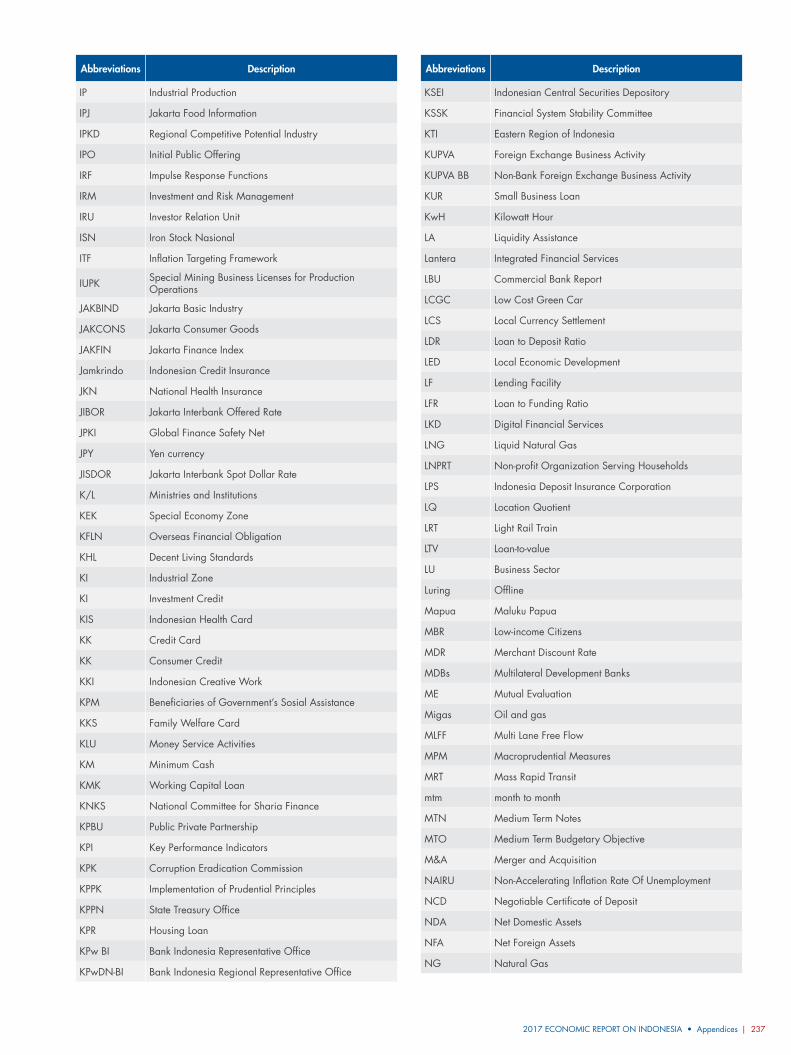
2017 ECONOMIC REPORT ON INDONESIA • Appendices | 237
Abbreviations Description
IP Industrial Production
IPJ Jakarta Food Information
IPKD Regional Competitive Potential Industry
IPO Initial Public Offering
IRF Impulse Response Functions
IRM Investment and Risk Management
IRU Investor Relation Unit
ISN Iron Stock Nasional
ITF Inflation Targeting Framework
IUPK Special Mining Business Licenses for Production Operations
JAKBIND Jakarta Basic Industry
JAKCONS Jakarta Consumer Goods
JAKFIN Jakarta Finance Index
Jamkrindo Indonesian Credit Insurance
JKN National Health Insurance
JIBOR Jakarta Interbank Offered Rate
JPKI Global Finance Safety Net
JPY Yen currency
JISDOR Jakarta Interbank Spot Dollar Rate
K/L Ministries and Institutions
KEK Special Economy Zone
KFLN Overseas Financial Obligation
KHL Decent Living Standards
KI Industrial Zone
KI Investment Credit
KIS Indonesian Health Card
KK Credit Card
KK Consumer Credit
KKI Indonesian Creative Work
KPM Beneficiaries of Government’s Sosial Assistance
KKS Family Welfare Card
KLU Money Service Activities
KM Minimum Cash
KMK Working Capital Loan
KNKS National Committee for Sharia Finance
KPBU Public Private Partnership
KPI Key Performance Indicators
KPK Corruption Eradication Commission
KPPK Implementation of Prudential Principles
KPPN State Treasury Office
KPR Housing Loan
KPw BI Bank Indonesia Representative Office
KPwDN-BI Bank Indonesia Regional Representative Office
Abbreviations Description
KSEI Indonesian Central Securities Depository
KSSK Financial System Stability Committee
KTI Eastern Region of Indonesia
KUPVA Foreign Exchange Business Activity
KUPVA BB Non-Bank Foreign Exchange Business Activity
KUR Small Business Loan
KwH Kilowatt Hour
LA Liquidity Assistance
Lantera Integrated Financial Services
LBU Commercial Bank Report
LCGC Low Cost Green Car
LCS Local Currency Settlement
LDR Loan to Deposit Ratio
LED Local Economic Development
LF Lending Facility
LFR Loan to Funding Ratio
LKD Digital Financial Services
LNG Liquid Natural Gas
LNPRT Non-profit Organization Serving Households
LPS Indonesia Deposit Insurance Corporation
LQ Location Quotient
LRT Light Rail Train
LTV Loan-to-value
LU Business Sector
Luring Offline
Mapua Maluku Papua
MBR Low-income Citizens
MDR Merchant Discount Rate
MDBs Multilateral Development Banks
ME Mutual Evaluation
Migas Oil and gas
MLFF Multi Lane Free Flow
MPM Macroprudential Measures
MRT Mass Rapid Transit
mtm month to month
MTN Medium Term Notes
MTO Medium Term Budgetary Objective
M&A Merger and Acquisition
NAIRU Non-Accelerating Inflation Rate Of Unemployment
NCD Negotiable Certificate of Deposit
NDA Net Domestic Assets
NFA Net Foreign Assets
NG Natural Gas
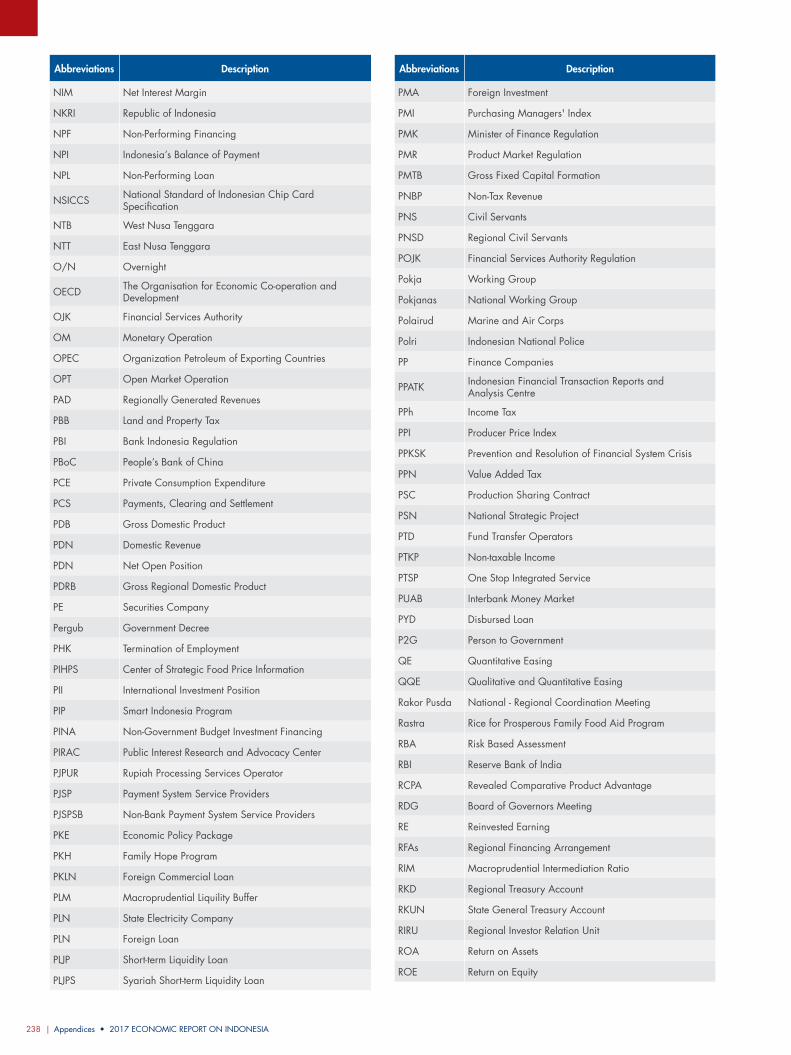
Appendices • 2017 ECONOMIC REPORT ON INDONESIA238 |
Abbreviations Description
NIM Net Interest Margin
NKRI Republic of Indonesia
NPF Non-Performing Financing
NPI Indonesia’s Balance of Payment
NPL Non-Performing Loan
NSICCS National Standard of Indonesian Chip Card Specification
NTB West Nusa Tenggara
NTT East Nusa Tenggara
O/N Overnight
OECD The Organisation for Economic Co-operation and Development
OJK Financial Services Authority
OM Monetary Operation
OPEC Organization Petroleum of Exporting Countries
OPT Open Market Operation
PAD Regionally Generated Revenues
PBB Land and Property Tax
PBI Bank Indonesia Regulation
PBoC People’s Bank of China
PCE Private Consumption Expenditure
PCS Payments, Clearing and Settlement
PDB Gross Domestic Product
PDN Domestic Revenue
PDN Net Open Position
PDRB Gross Regional Domestic Product
PE Securities Company
Pergub Government Decree
PHK Termination of Employment
PIHPS Center of Strategic Food Price Information
PII International Investment Position
PIP Smart Indonesia Program
PINA Non-Government Budget Investment Financing
PIRAC Public Interest Research and Advocacy Center
PJPUR Rupiah Processing Services Operator
PJSP Payment System Service Providers
PJSPSB Non-Bank Payment System Service Providers
PKE Economic Policy Package
PKH Family Hope Program
PKLN Foreign Commercial Loan
PLM Macroprudential Liquility Buffer
PLN State Electricity Company
PLN Foreign Loan
PLJP Short-term Liquidity Loan
PLJPS Syariah Short-term Liquidity Loan
Abbreviations Description
PMA Foreign Investment
PMI Purchasing Managers' Index
PMK Minister of Finance Regulation
PMR Product Market Regulation
PMTB Gross Fixed Capital Formation
PNBP Non-Tax Revenue
PNS Civil Servants
PNSD Regional Civil Servants
POJK Financial Services Authority Regulation
Pokja Working Group
Pokjanas National Working Group
Polairud Marine and Air Corps
Polri Indonesian National Police
PP Finance Companies
PPATK Indonesian Financial Transaction Reports and Analysis Centre
PPh Income Tax
PPI Producer Price Index
PPKSK Prevention and Resolution of Financial System Crisis
PPN Value Added Tax
PSC Production Sharing Contract
PSN National Strategic Project
PTD Fund Transfer Operators
PTKP Non-taxable Income
PTSP One Stop Integrated Service
PUAB Interbank Money Market
PYD Disbursed Loan
P2G Person to Government
QE Quantitative Easing
QQE Qualitative and Quantitative Easing
Rakor Pusda National - Regional Coordination Meeting
Rastra Rice for Prosperous Family Food Aid Program
RBA Risk Based Assessment
RBI Reserve Bank of India
RCPA Revealed Comparative Product Advantage
RDG Board of Governors Meeting
RE Reinvested Earning
RFAs Regional Financing Arrangement
RIM Macroprudential Intermediation Ratio
RKD Regional Treasury Account
RKUN State General Treasury Account
RIRU Regional Investor Relation Unit
ROA Return on Assets
ROE Return on Equity
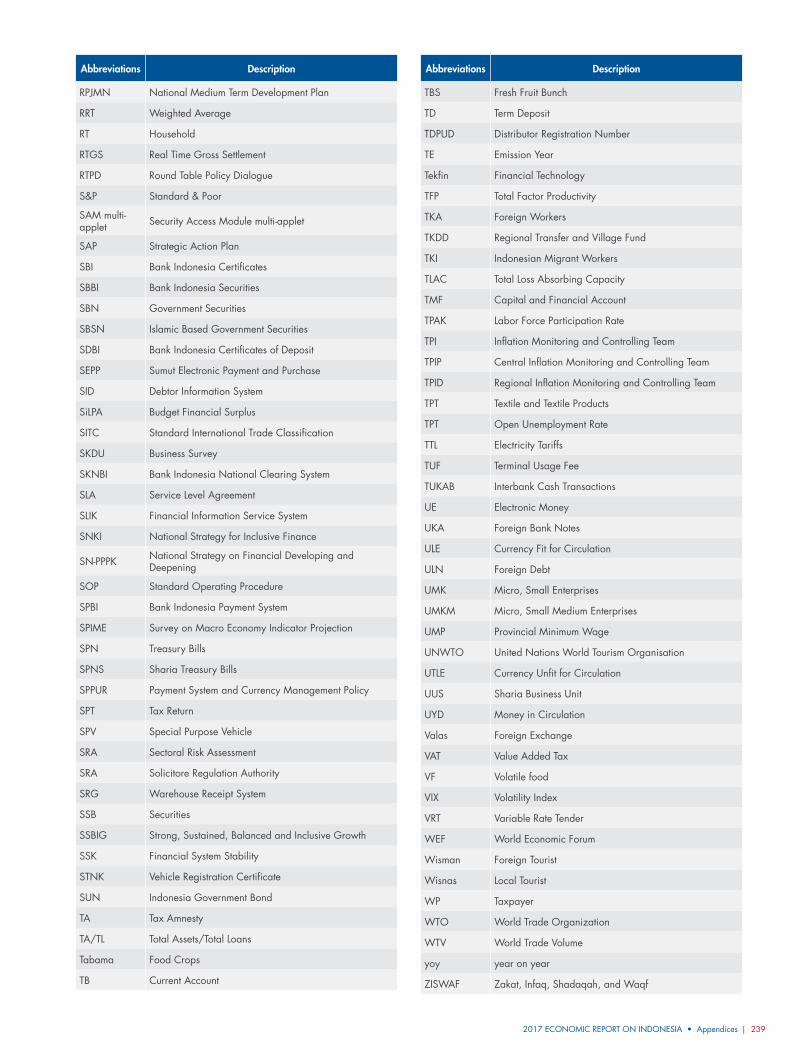
2017 ECONOMIC REPORT ON INDONESIA • Appendices | 239
Abbreviations Description
RPJMN National Medium Term Development Plan
RRT Weighted Average
RT Household
RTGS Real Time Gross Settlement
RTPD Round Table Policy Dialogue
S&P Standard & Poor
SAM multi-applet Security Access Module multi-applet
SAP Strategic Action Plan
SBI Bank Indonesia Certificates
SBBI Bank Indonesia Securities
SBN Government Securities
SBSN Islamic Based Government Securities
SDBI Bank Indonesia Certificates of Deposit
SEPP Sumut Electronic Payment and Purchase
SID Debtor Information System
SiLPA Budget Financial Surplus
SITC Standard International Trade Classification
SKDU Business Survey
SKNBI Bank Indonesia National Clearing System
SLA Service Level Agreement
SLIK Financial Information Service System
SNKI National Strategy for Inclusive Finance
SN-PPPK National Strategy on Financial Developing and Deepening
SOP Standard Operating Procedure
SPBI Bank Indonesia Payment System
SPIME Survey on Macro Economy Indicator Projection
SPN Treasury Bills
SPNS Sharia Treasury Bills
SPPUR Payment System and Currency Management Policy
SPT Tax Return
SPV Special Purpose Vehicle
SRA Sectoral Risk Assessment
SRA Solicitore Regulation Authority
SRG Warehouse Receipt System
SSB Securities
SSBIG Strong, Sustained, Balanced and Inclusive Growth
SSK Financial System Stability
STNK Vehicle Registration Certificate
SUN Indonesia Government Bond
TA Tax Amnesty
TA/TL Total Assets/Total Loans
Tabama Food Crops
TB Current Account
Abbreviations Description
TBS Fresh Fruit Bunch
TD Term Deposit
TDPUD Distributor Registration Number
TE Emission Year
Tekfin Financial Technology
TFP Total Factor Productivity
TKA Foreign Workers
TKDD Regional Transfer and Village Fund
TKI Indonesian Migrant Workers
TLAC Total Loss Absorbing Capacity
TMF Capital and Financial Account
TPAK Labor Force Participation Rate
TPI Inflation Monitoring and Controlling Team
TPIP Central Inflation Monitoring and Controlling Team
TPID Regional Inflation Monitoring and Controlling Team
TPT Textile and Textile Products
TPT Open Unemployment Rate
TTL Electricity Tariffs
TUF Terminal Usage Fee
TUKAB Interbank Cash Transactions
UE Electronic Money
UKA Foreign Bank Notes
ULE Currency Fit for Circulation
ULN Foreign Debt
UMK Micro, Small Enterprises
UMKM Micro, Small Medium Enterprises
UMP Provincial Minimum Wage
UNWTO United Nations World Tourism Organisation
UTLE Currency Unfit for Circulation
UUS Sharia Business Unit
UYD Money in Circulation
Valas Foreign Exchange
VAT Value Added Tax
VF Volatile food
VIX Volatility Index
VRT Variable Rate Tender
WEF World Economic Forum
Wisman Foreign Tourist
Wisnas Local Tourist
WP Taxpayer
WTO World Trade Organization
WTV World Trade Volume
yoy year on year
ZISWAF Zakat, Infaq, Shadaqah, and Waqf
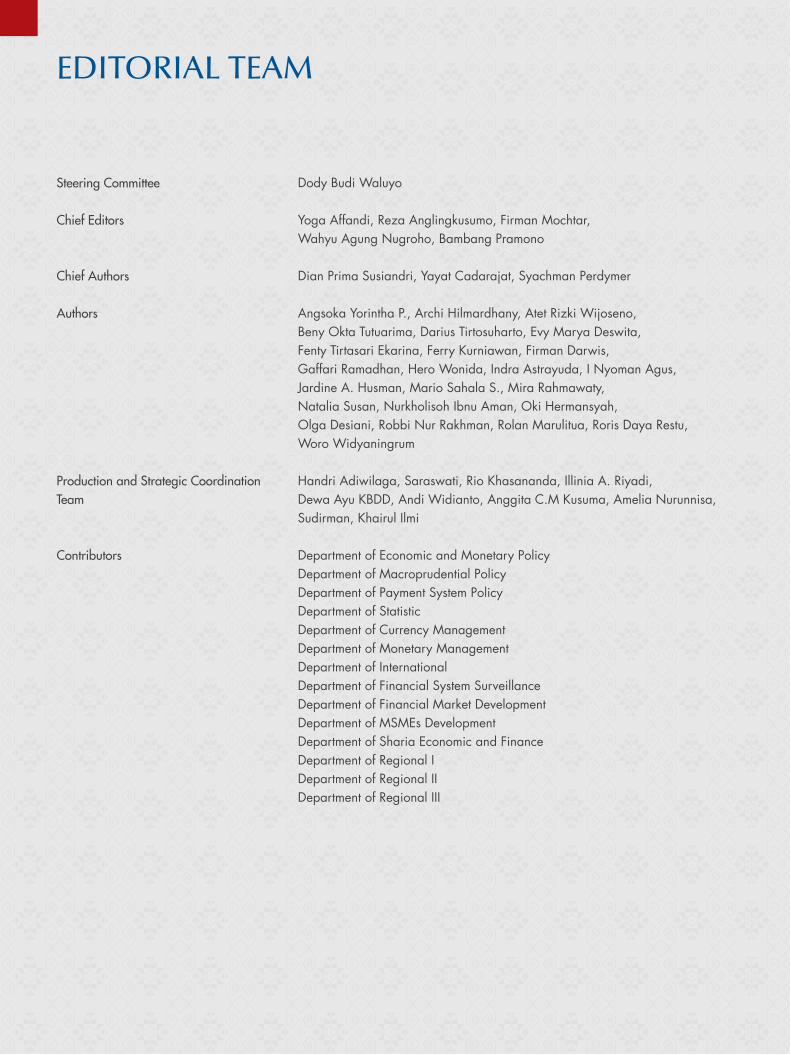
Steering Committee
Chief Editors
Chief Authors
Authors
Production and Strategic Coordination Team
Contributors
EDITORIAL TEAM
Dody Budi Waluyo
Yoga Affandi, Reza Anglingkusumo, Firman Mochtar, Wahyu Agung Nugroho, Bambang Pramono
Dian Prima Susiandri, Yayat Cadarajat, Syachman Perdymer
Angsoka Yorintha P., Archi Hilmardhany, Atet Rizki Wijoseno, Beny Okta Tutuarima, Darius Tirtosuharto, Evy Marya Deswita, Fenty Tirtasari Ekarina, Ferry Kurniawan, Firman Darwis, Gaffari Ramadhan, Hero Wonida, Indra Astrayuda, I Nyoman Agus, Jardine A. Husman, Mario Sahala S., Mira Rahmawaty, Natalia Susan, Nurkholisoh Ibnu Aman, Oki Hermansyah, Olga Desiani, Robbi Nur Rakhman, Rolan Marulitua, Roris Daya Restu, Woro Widyaningrum
Handri Adiwilaga, Saraswati, Rio Khasananda, Illinia A. Riyadi, Dewa Ayu KBDD, Andi Widianto, Anggita C.M Kusuma, Amelia Nurunnisa, Sudirman, Khairul Ilmi
Department of Economic and Monetary Policy Department of Macroprudential Policy Department of Payment System Policy Department of Statistic Department of Currency Management Department of Monetary Management Department of International Department of Financial System Surveillance Department of Financial Market Development Department of MSMEs Development Department of Sharia Economic and Finance Department of Regional I Department of Regional II Department of Regional III
Copyright © 2022 FDOKUMEN