ISSN 2217-9739 No. 3-4 / 2017 - International review
177
ISSN 2217-9739 No. 3-4 / 2017 Faculty of Business Economics and Entrepreneurship T H O M S O N R E U T E R S I N D E X E D I N
-
Upload
khangminh22 -
Category
Documents
-
view
0 -
download
0
Transcript of ISSN 2217-9739 No. 3-4 / 2017 - International review

ISSN 2217-9739No. 3-4 / 2017
Faculty ofBusiness Economicsand Entrepreneurship
THOM S O N R E U T E R S
INDEXED IN

Faculty of Business Economics and Entrepreneurship International Review (2017 No.3-4) 1
© Filodiritto Editore – Proceedings
ISSN 2217-9739 No. 3-4/2017
Editor
Prof. Dr. Mirjana Radovic-Markovic
FILODIRITTO
INTERNATIONAL PROCEEDINGS

2 Faculty of Business Economics and Entrepreneurship International Review (2017 No.3-4)
© Filodiritto Editore – Proceedings
Twice a Year Scientific Journal
ISSN 2217-9739 COBISS.SR-ID 192516620
ISBN: 978-88-85813-00-7
PUBLISHER
Faculty of Business Economics and Entrepreneurship 8 Mitropolita Petra Street
11000 Belgrade, Serbia
www.vspep.edu.rs
CO PUBLISHER
Filodiritto Editore (inFOROmatica S.r.l.) Via Castiglione 81
40124, Bologna
C.F./P.IVA 02575961202 www.filodirittoeditore.com
EDITOR-IN-CHIEF
Academician Professor Mirjana Radovic Markovic, PhD, Faculty of Business Economics and Entrepreneurship,
Belgrade, Serbia
EDITORIAL OFFICE
Faculty of Business Economics and Entrepreneurship
8, Mitropolita Petra str., Belgrade, Serbia Tel. +381 11 2762-194; fax: +381 11 2762-194
www.vspep.edu.rs, [email protected]
BUSINESS SECRETARY
Sladjana Vujicic, PhD, Faculty of Business Economics and Entrepreneurship, Belgrade, Serbia,
PERSON RESPONSIBLE FOR PUBLISHING
Full Professor Jovan Živadinović, PhD, Director of Faculty of Business Economics and Entrepreneurship, Belgrade,
Serbia

Faculty of Business Economics and Entrepreneurship International Review (2017 No.3-4) 3
© Filodiritto Editore – Proceedings
EDITORIAL BOARD
Academican Professor Rajko Tomaš, PhD, Faculty of Economics, Banja Luka, Bosnia and
Herzegovina
Academician Professor Slavko Karavidic, PhD, Faculty of Business Economics and
Entrepreneurship, Belgrade, Serbia
Full Professor Carl Edwin Lindgren, PhD, American School of Genealogy, Heraldry and
Documentary Sciences, USA
Full Professor Brenda Nelson-Porter, PhD, Brigette’s Technology Consulting and Research
Firm, USA
Full Professor Ayinla Omolaja Muhammed, PhD, International College of Management and
Technology, Nigeria
Full Professor Ugur Demiray, PhD, Anadolia University, Turkey
Full Professor Emine Demiray, PhD, Anadolia University, Turkey
Full Professor Nezameddin Faghih, PhD, Editor-In-Chief “Journal of Global
Entrepreneurship Research” (JGER), Faculty of Entrepreneurship, University of Tehran, Iran
Full Professor Radovan Pejanovic, PhD, University of Novi Sad, Serbia
Full professor Žarko Pavić, PhD, Faculty of Business Economics and Entrepreneurship, Belgrade,
Serbia
Full Professor Radojko Lukić, PhD, Faculty of Economics, University of Belgrade, Serbia
Full Professor Snezhana Ilieva, PhD, St. Kliment Ohridski University in Sofia, Bulgaria
Full professor Rossitsa Chobanova, PhD, Economic research institute, Bulgarian academy of
sciences, Sofia, Bulgaria
Full Professor Boufeldja Ghiat, PhD, Faculty of Social Sciences Oran University, Oran,
Algeria
Full Professor José G. Vargas-Hernández PhD, University Center for Economic and
Managerial
Sciences, University of Guadalajara, Guadalajara, Jalisco, México
Full Professor Ballet Jérôme, PhD, Center of Ethocs and Economics for Environment and
Development in Madagascar, University of Antananarivo, Madagascar
Full Professor Sreten Miladinoski, PhD, MIT University, Skopje, Former Yugoslav Republic
Macedonia
Full Professor Cane Capragoski, PhD, MIT University, Skopje, The Former Yugoslav Republic
Macedonia
Full Professor N Sandhya, PhD, Nagarjuna College of Engineering & Technology, India
Full Professor Marijan Stevanovski, PhD, MIT University, Skopje, Former Yugoslav Republic
Macedonia
Full Professor Edita Kastratovic, PhD, Faculty of Business Economics and
Entrepreneurship, Belgrade, Serbia
Full Professor, Milan Krstić, PhD, Faculty of Business Economics and Entrepreneurship, Belgrade,
Serbia
Full professor Slavoljub Šljivić, PhD, Faculty of Business Economics and Entrepreneurship, Belgrade,
Serbia
Full Professor Vlado Radić, PhD, Faculty of Business Economics and Entrepreneurship,
Belgrade, Serbia
Associate Professor Isiaka Esema, PhD, Pebble Hills University and Coordinator of
International Community Education Association, Nigeria Chapter, Nigeria
Associate Professor Chee Seng, Leow, PhD, IIC University of Technology, Cambodga
Associate Professor Darko Vuković, PhD, Tomsk Polytechnic University, Tomsk, Russia
Associate Professor Natalija Vuković, PhD, Ural State Forest Engineering University, Yekaterinburg,
Russia
Associate Professor Almir Peštek, PhD, School of Economics and Business, Sarajevo, Bosnia
and Herzegovina

4 Faculty of Business Economics and Entrepreneurship International Review (2017 No.3-4)
© Filodiritto Editore – Proceedings
Associate Professor Marija Čukanović Karavidić, PhD, Faculty for Business Economics and
Entrepreneurship, Belgrade, Serbia
Associate Professor Dragana Vojteški - Kljenak, PhD, Faculty of Business Economics and
Entrepreneurship, Belgrade, Serbia
Associate Professor Vladimir Ristanović, PhD, Faculty for Business Economics and
Entrepreneurship, Belgrade, Serbia
Associate Professor Ana Skorup, Faculty for Business Economics and Entrepreneurship,
Belgrade, Serbia
Assistant Professor Raghu Bir Bista, PhD, Professor, Tribhuvan University, Nepal
Assistant Professor Sandro Nuno Ferreira de Serpa, PhD, University of the Azores, Portugal
Assistant Professor Muhammad Shoaib Farooq, PhD, Universiti Malaysia Sarawak (UNIMAS),
Malaysia
Assistant Professor Agrawal Reena, PhD, Jaipuria Institute of Management, Luckow, Uttar Pradesh,
India
Assistant Professor Dušan Marković, PhD, Belgrade Business School, Belgrade, Serbia
Assistant Professor Zélia Breda, PhD, Department of Economics, Management and Industrial
Engineering of the University of Aveiro, Aveiro, Portugal
Assistant Professor Carmine D’Arconte, PhD, Faculty of Economics, University of Rome
Three, Italy
Assistant Professor Neven Vidaković, PhD, Zagreb School of Economics and Management,
Croatia
Assistant Professor Aidin Salamzadeh, PhD, Faculty of Entrepreneurship, University of
Tehran 16th Street, North Kargar Avenue, Tehran, Iran
Assistant professor Ahmed Rhif, PhD, High Institute of Applied Sciences and Technologies
(ISSAT Kairouan), Tunis
Assistant Professor Maja Cogoljević, PhD, Faculty of Business Economics and
Entrepreneurship, Belgrade, Serbia
Assistant Professor Zorana Nikitović, PhD, Faculty of Business Economics and
Entrepreneurship, Belgrade, Serbia
Assistant Professor Ana Opačić, PhD, Faculty of Business Economics and Entrepreneurship,
Belgrade, Serbia
Assistant Professor Tatjana Papić-Brankov, PhD, Institute of Agricultural Economics,
Belgrade, Serbia
Assistant Professor Slavica Andjelić, PhD, Faculty of Business Economics and
Entrepreneurship, Belgrade, Serbia
Miloš Vučeković, MA, IT expert, Singidunum University, Belgrade, Serbia
Sladjana Vujičić, PhD, Faculty of Business Economics and Entrepreneurship, Belgrade, Serbia
Hiroko Kawamorita Kesim, Ondokuz Mayis University, Turkey

Faculty of Business Economics and Entrepreneurship International Review (2017 No.3-4) 5
© Filodiritto Editore – Proceedings
PUBLISHING BOARD
Full Professor Jovan Živadinović. PhD, Director of aculty of Business Economics and
Entrepreneurship, Belgrade, Serbia
Academican Professor Mirjana Radović-Marković, PhD, Faculty of Business Economics and
Entrepreneurship, Belgrade, Serbia
Assistant Professor Dušan Cogoljević, PhD, president of Faculty of Business Economy and
Entrepreneurship, Belgrade, Serbia
Academican Professor Slavko Karavidić, PhD, Faculty of Business Economics and
Entrepreneurship, Belgrade, Serbia
Full Professor Sofronija Miladinoski, PhD, Faculty of Tourism and Hospitality, Ohrid,
Former Yugoslav Republic Macedonia
Printing 300 copies
CIP – Каталогизација у публикацији Народна
библиотека Србије, Београд
37+33+327
INTERNATIONAL review/editor-in-chief Mirjana
Radović-Marković. 2012, no. 1/2. Belgrade:
Faculty of Business Economics and
Entrepreneurship; Pianoro: Medimond, 2012
(Valjevo: Valjevo print). 24 cm
Dva puta godišnje
ISSN 2217-9739 = International review (Faculty of
Business and Entrepreneurship) COBISS.SR-ID
192516620
Copyright© 2017
by Faculty of Business Economics and Entrepreneurship, Belgrade.
All rights reserved

6 Faculty of Business Economics and Entrepreneurship International Review (2017 No.3-4)
© Filodiritto Editore – Proceedings
Notes from of Editor-in-Chief
It has been an enjoyable experience and I have been lucky to
have worked with such good colleagues and members of the
editorial board since 2012. Looking back, as the editor in chief of
International Review, I realized just how many changes there have
been over the last five years. In the meantime, the Journal has
progressed, and it is now referred by Emerging Sources Citation
Index (ESCI). The Emerging Sources Citation Index (ESCI) was
launched in late 2015 as a new database within Clarivate Analytics’
(formerly Thomson Reuters’). Indexing in the ESCI will improve
the visibility of a journal, provides a mark of quality and is good for
authors.
I must point out that Journals indexed in the ESCI will not receive Impact Factors; however,
the citations from the ESCI will now be included in the citation counts for the Journal Citation
Reports, therefore contributing to the Impact Factors of other journals. So, quote the papers
from our Journal.
Finally, thank you for all your help and trust in me over the years. I am waiting for your
articles in New 2018!
November, 2017
Editor-in-Chief
Acad. Prof. Mirjana Radovic-Markovic, PhD
Faculty of Business Economics and Entrepreneurship International Review (2017 No.3-4) 7
© Filodiritto Editore – Proceedings
CONTENTS
A Descriptive Study of Organizational Citizenship Behavior in Peruvian Companies 9
DÍAZ Rosario Almenara, ALECCHI Beatrice Avolio
Examining and comparing the economic effects of spillovers of investment risk in Iran:
Computable General Equilibrium Model Approach 24
SEYEDMASHHADI Pardis Alsadat, JALAEE Seyed Abdolmajid, NEJATI Mehdi,
ZAYANDERODI Mohsen
Identifying and structuring the factors affecting sustainable banking resources with using
interpretive structural modeling 34
MOUSAVI Seyed Mahdi, YAMOULA Alireza, KHOSHROO Mohsen
Features of cash flow compared to profit 50
KASTRATOVIĆ Edita, KALIČANIN Milica, KALIČANIN Zoran
Identifying productive leadership model to increase employees’ job motivation 57
NOBAKHT Mohammad Bagher, EBRAHIMI Mohamad, BABAEE Mohammad Hooshmand,
DAVAR Saeed
Proclivity for open innovation in the case of agricultural and food companies in Serbia 64
ZAKIĆ Nebojša, BUGARČIĆ Marina, MILOVANOVIĆ Marina
Emission of carbon dioxide of selected retailers 72
LUKIC Radojko
The Analysis of Effect of Aspiration to Growth of Managers for SMEs Growth Case Study:
Exporting Manufacturing SMEs in Iran 88
HANIFZADEH Faezeh, TALEBI Kambeiz, SAJADI Mojtaba
Customer Service Quality Management in Public Transport: The Case of Rail Transport in
Tanzania 102
LWESYA Francis, JAFFU Richard
Evaluate the Effectiveness of Advertising on Customers’ Willingness to Buy (Case Study:
Goldiran Products Customers) 118
Peyman Ghafari Ashtiani, Fatemeh Bahmanzadeh
Retro brands in the retailing enviroment: a review and research propositions 130
VOJVODIĆ Katija
Constituent elements of political marketing in creating a positive attitude for voiting for a
particular candidate 137
SOLEIMANI Ali Gholipour, MONEM Sadegh
An Examination of Agreement between the Parties on preceding the Time of Transfer the
ownership from the Moment of Signing the Contract 147
MASKONI Ali Arefi, POOR CHANGIZ Mohammad Amin

8 Faculty of Business Economics and Entrepreneurship International Review (2017 No.3-4)
© Filodiritto Editore – Proceedings
Improving society through the decisions of the human rights committee on the protection of
human dignity 154
JOVANOVIĆ Ljiljana
Investigate the most important causes of job burnout of employees (Case Study: Youth and
Sports General Directorate of Qom) 167
RAD Raheleh Tayyebi, JAMSHIDI Mina
Editorial Paper Retraction 175
Faculty of Business Economics and Entrepreneurship International Review (2017 No.3-4) 9
© Filodiritto Editore – Proceedings
ORIGINAL RESEARCH PAPERS
A Descriptive Study of Organizational Citizenship
Behavior in Peruvian Companies
DÍAZ Rosario Almenara1, ALECCHI Beatrice Avolio2
Abstract
This research identifies the factors that have an impact on Organizational Citizenship
Behavior (OCB) in Peruvian Companies and studies how the employees exhibit or adopt an
OCB in the different stages of the business life cycle; identify the context in which the
employees adopt an OCB; identify the most relevant forms of OCB for organizational
effectiveness; and recognize the main obstacles that hinder the achievement of an OCB. This
study uses the qualitative paradigm and the case study method. The purpose of the study is
descriptive; it is based on seven propositions related to two phases of the business life cycle: the
growth stage and the mature stage. Seven companies that correspond to six different economic
sectors have been studied.
According to the study results, the factors and dimensions that have impact on OCB in
Peruvian companies are different to the ones used in United States, other western countries, and
China, due to the economic phase and to social and cultural aspects in Peru and in the
organizations. Other conclusion of the study is that there is not a unique typology of Peruvian
companies. Although the research established the company profiles considering the stage of the
business life cycle in order to identify comparisons and some patterns of OCB, it has been
observed that the proper characterization of each company and other factors or difficulties also
have an impact on OCB. The study proposes a model of the factors that determine OCB: the
stage of the business life cycle and the level of exhibition of the seven dimensions of OCB, the
characteristics of the company, and the factors that contribute and difficulties that hinder the
achievement of an OCB. This research will analyze the factors that impact the OCB, which will
influence the improvement of organizational efficacy.
Keywords: Organizational Citizenship Behavior
JEL: D23
UDK: 005.73:334.7(85)
005.96:005.336.1
COBISS.SR-ID 253488908
Introduction
Prestigious international organizations, such as the World Economic Forum, the Institute for
Management Development, and the World Bank, have measured the level of competitiveness of
the economies. In particular, the Global Competitiveness Index published by the World
Economic Forum (2011) indicates that the 12 pillars of economic competitiveness are
associated not only to the basic requirements, but also to factors that increase innovation,
sophistication and efficiency. The factors that increase the labor market efficiency are:
1 CENTRUM Católica Graduate Business School, [email protected] 2 CENTRUM Católica Graduate Business School, [email protected]

10 Faculty of Business Economics and Entrepreneurship International Review (2017 No.3-4)
© Filodiritto Editore – Proceedings
flexibility in the labor policies and practices, the efficient use of talent, and, particularly, the
cooperation between the worker-employer relationship and the Organizational Citizenship
Behavior (OCB) because these relationships can influence the organizational effectiveness, it
can enhance the coworker and managerial productivity, the organization's ability to attract and
retain the best people, the stability of organizational performance, and the organization’s ability
to adapt to environmental changes, among others (Podsakoff, MacKenzie, 1997; Organ,
Podsakoff, MacKenzie, 2006). In this sense, it is important to understand the factors that
determine the level of cooperation within the companies, and to identify and assess the factors
that impact the OCB.
The purpose of this research is to study, from a qualitative approach, the OCB in Peruvian
companies in order to: (a) identify how the employees exhibit or adopt an OCB in the different
stages of the business life cycle; (b) identify the context in which the employees adopt an OCB
(for the sake of the individual, group, organization or society); (c) identify the most relevant
forms of OCB for organizational effectiveness; and (d) recognize the main obstacles that hinder
the achievement of an OCB. A conceptual model of the factors that determine and influence the
OCB is also proposed.
The empirical research on OCB is based on studies conducted in developed western
countries and in China. The concept of OCB is relatively new in Latin America; therefore, the
social and cultural contexts may have impact on the OCB (Farh, Earley, Lin, 1997; Farh,
Zhong, Organ, 2004). It is important to add empirical evidence of OCB in different contexts.
This study expands the knowledge of OCB in a social and cultural context different than the
existing literature, and uses the case of companies in Peru. Peru, according to the Global
Competitiveness Index developed by the World Economic Forum (2011), is ranked 67 th out of
142 countries. In regard to the cooperation in employer-employee relations, Peru has a score of
4.6 (1 is generally considered to be confrontational and 7 is generally cooperative). The level of
cooperation increases the competitiveness and the OCB is part of these employer-employee
relations.
Background
The OCB is the set of behaviors that contribute to the organizational effectiveness and it is
one of the precedents of the organizational performance. According to Barker (2006), it is
important to assess and have a realistic view of the organizational processes, the nature and
meaning of citizenship within organizations, because it is “an attempt to understand the
interactions experienced among humans within the workplace structure” (p. 126). Therefore, the
OCB is defined as “an individual behavior that is discretionary, not directly or explicitly
recognized by the formal reward system which, in the aggregate, promotes the effective
functioning of the organization” (Organ et al., 2006, p. 8). The first component is discretionary,
which means that the behavior is a personal choice; it is not required in the job description.
The second component is not directly or explicitly recognized by the organizational reward
system, i.e. it is not contractually guaranteed by any formal policy and procedure. The third
component promotes the efficient and effective operation of the organization.
Prior research on OCB is manly focused on the following aspects: (a) The underlying
concepts of the OCB construct, (b) the dimensions of OCB, (c) the background of OCB, (d) the
determinants of OCB in the organizations, and (e) the impact of OCB on organizational
performance.
Robbins and Judge (2009) studied the behavior of individuals, groups and organizations in
order to improve their efficiency. The authors analyzed several factors, such as productivity,
absenteeism, rotation and OCB. They defined the latter as a discretionary behavior that
promotes the effective functioning in organizations and it is not part of the formal requirements
of the job. Several authors studied the variables that impact the organizational behavior and the
underlying OCB construct, such as interpersonal cooperation, coordination among the players,

Faculty of Business Economics and Entrepreneurship International Review (2017 No.3-4) 11
© Filodiritto Editore – Proceedings
reputation, trust, and team work. Interpersonal cooperation is a key component for the success
of the organization.
Griesinger (1990) noted that the economic role of cooperation is an “interpersonal resource
that promises a clear economic advantage for many organizations and significant betterment for
most participants” (p. 497). In addition, in regard to the coordination among agents, Crowston
(1997) emphasized that the “design of a process depends on the coordination mechanisms
chosen to manage dependencies among tasks and resources involved in the process.” (p. 157).
The reputation and trust among people, employers, employees, peers and partners are also
relevant in organizations. In addition, Sobel (1985), Jones and George (1998), Shmatikov and
Talcott (2005), Bottom, Holloway, Miller, Mislin, and Whitford (2006), and Tucker (2008)
described the situation in which the person is not sure how to trust the people with whom he/she
interacts, conditional and unconditional confidence, the role of agents in the trust relationship,
and trust based on the reputation. The characteristics and contextual variables that have an
impact on team work have been studied by Dailey (1978), Campion, Papper, and Medsker
(1996), Hollenbeck, DeRue, and Guzzo (2004), Mathieu, Maynard, Taylor, Gilson, and Ruddy
(2007).
Several researchers have identified the dimensions of OCB (Podsakoff, MacKenzie,
Moorman, & Fetter, 1990; Williams & Anderson, 1991; Podsakoff & MacKenzie, 1994; Van
Dyne, Graham, & Dienesch, 1994; Moorman & Blakely, 1995; Farh et al., 1997; Van Dyne &
LePine, 1998; Podsakoff, MacKenzie, Paine, & Bachrach (2000); LePine, Erez, & Johnson,
2002; Farh et al., 2004; and Organ et al., 2006). Podsakoff et al., (2000) pointed out that there
is a lack of consensus on the dimensionality of OCB and they organized it in seven dimensions:
(a) Helping behavior: when employees voluntarily help others and prevent the occurrence of
work-related problems; (b) Sportsmanship: when employees, who are “good sportsmen”, do not
complain, maintain a positive attitude and are not offended when others reject their suggestions;
(c) Organizational loyalty: when employees promote the organization to outsiders, protecting it
against external threats and remaining committed to it even under adverse conditions; (d)
Organizational compliance: when employees follow the organizational rules and procedures,
even when nobody is watching or supervising them; (e) Individual initiative, when the
employees carry out higher level tasks than the expected, they improve their tasks showing
extra effort, voluntarily engage in additional responsibilities and encourage others to do so; (f)
Civic virtue: when the employees are committed to the organization as a whole, to the policies,
to monitoring the threats and opportunities, and to do what’s best for the organization even at a
personal cost; and (g) Self-development: when the employees are voluntarily committed to
improve their knowledge, skills and abilities, and to increase the level of contribution to the
organization.
Jahangir, Akbar, and Haq (2004) studied the background of OCB, i.e. the factors that
promote or hinder the employee’s performance in an organization, which will help “to enrich
the understanding of how various work conditions affect an employee’s willingness to engage
in OCB” (p. 82) so that managers can encourage the OCB among the employees in order to
achieve the best performance. The variables identified by Jahangir et al., (2004) that may affect
the employees’ willingness to engage in OCB were: job satisfaction, organizational
commitment, leaders’ behavior, fairness perception, individual disposition, motivational
theories, and the employee’s age (p. 81). The authors also emphasized that if managers know
the background of the antecedents of OCB, they will be able to promote it among their
employees and monitor those behaviors that go beyond the job description and that contribute to
the organizational effectiveness.
Personality, leadership and job satisfaction were the studied factors that determined the
OCB in the organizations. Organ et al., (2006) mentioned that the theory suggests that
personality will predict the OCB better than any other indicator of work performance
productivity or technical excellence; however, this prediction is not supported in all research
studies. Organ et al., (2006) stated that leaders can influence the employees’ motivation and the
ability or opportunity to engage in OCB. Podsakoff et al., (1990) found that transformational

12 Faculty of Business Economics and Entrepreneurship International Review (2017 No.3-4)
© Filodiritto Editore – Proceedings
leadership influences the OCB through trust. With regard to job satisfaction, Robbins and Judge
(2009) found that when the employees perceive that organizational processes are fair, their
confidence is boosted and this generates a greater willingness to voluntarily engage in behaviors
that go beyond the formal requirements. Organ et al., (2006) studied the level of commitment of
an employee with OCB either for the sake of the employee, for the good of others, or for the
good of the organization.
In regard to the impact that OCB has on organizational performance, Podsakoff and
MacKenzie (1997) identified the following elements: “(a) enhancing coworker and managerial
productivity, (b) freeing up resources so they can be used for more productive purposes, (c)
reducing the need to devote scarce resources to purely maintenance functions, (d) helping to
coordinate the activities both within and across work groups, (e) strengthening the
organization’s ability to attract and retain the best employees, (f) increasing the stability of the
organization’s performance, and (g) enabling the organization to more effectively adapt to
environmental changes.”
Propositions
The stage of the business life cycle is crucial in order to study the factors that have an
impact on OCB in Peruvian companies. The case study has relied on the theoretical
propositions related to the stage of the business life cycle, as a way to guide the case study
analysis, help to focus attention on certain data, and define alternative explanations. Two types
of companies have been selected in this research: Peruvian companies in a growth stage and
Peruvian companies in a mature stage. As Schein (2004) highlighted, the organizational culture
and leadership will depend on the organizational stage of the company. In a young company in
the growth stage, the culture embedded by the founder who acts as a leader is very important;
while in a mature company the culture and leadership are more embedded in the organization.
Leaders embed the beliefs, values, and assumptions through mechanisms that vary among
the companies in the way they: (a) pay attention, measure and control; (b) react to critical
incidents and crisis; (c) allocate resources; (d) role modeling, teaching, and coaching; (e)
allocate rewards and status; and (f) recruit, select, promote, and excommunicate. In young
organizations, “design and structure, systems and procedures, rites and rituals, architecture,
stories, and formal statements of philosophy, creeds, and charters, are cultural reinforcers, not
cultural creators” (Schein, 2004, p. 262). Smith and Gannon (1987) studied the different stages
of organizational growth and development, and assessed the organizational structure, reward
system, communication process, planning process, formalization and adherence level, judgment
level and method of decision making, top level management, organizational growth rate, and
organizational age and size, for the entrepreneurial stage, high-growth stage, and maturity stage.
Young companies are in a growth stage and mature companies are in a mature stage.
The seven dimensions of OCB-helping behavior, sportsmanship, organizational loyalty,
organizational compliance, individual initiative, civic virtue, and self-development have been
evaluated in the two types of companies, identifying how employees behave in companies in a
growth stage and in companies in a mature stage.
In the case of helping behavior i.e. when employees voluntarily help others and prevent the
occurrence of work-related problems employees in Peruvian companies in the growth stage will
tend to help their coworkers more as a result of its early stage of growth and the necessities of
this stage. In these companies there is more collectivism, diffuse roles, and individuals have less
unilateral actions. According to Quinn and Cameron (1983) who presented a four-stage model,
in the second stage of the organizational life cycle the collectivity stage human relation models
are important and are related to informal communication and structure, a sense of family and
cooperativeness, commitment and personalized leadership.
Proposition 1a: Employees at Peruvian companies in the growth stage will likely exhibit
helping behavior more than the employees at Peruvian companies in mature stage.

Faculty of Business Economics and Entrepreneurship International Review (2017 No.3-4) 13
© Filodiritto Editore – Proceedings
Lester and Parnell (2008) highlighted the third Success (Maturity) stage where formalization
and bureaucracy are the norm. There is a formal organization structure, job descriptions,
procedures, and reporting relationships, and the top management focuses on planning and
strategy, leaving daily operations to middle managers. Employees in companies in the mature
stage will tend to show sportsmanship behavior when employees who are “good sportsmen”, do
not complain, maintain a positive attitude, and are not offended when others do not follow their
suggestions. Employees at companies in the growth stage will tend to have less sportsmanship,
because they are strongly pressured for doing their job and no committee or groups are
responsible for important decisions.
Proposition 1b: Employees at Peruvian companies in the growth stage will likely exhibit
sportsmanship behavior less than employees at Peruvian companies in the mature stage.
In the case of organizational loyalty i.e. when employees promote the organization to
outsiders, protecting against external threats, and remain committed to the organization even
under adverse conditions employees at companies in the growth stage will be less likely to have
this OCB dimension. Since these companies are in their early stage, they have closed systems,
are secretive and are not open to newcomers and outsiders. As Gray and Ariss (1985) pointed
out, in the early stage there is a symbolic management policy due to the centralization of power
and few connections to external agents, in contrast to the maturity phase, where there are
institutionalization power and ideology policies because of the second generation of leadership,
i.e. the company is bigger, is managed bureaucratically, and hierarchy and specialization are
used to efficiently accomplishing the goals.
Proposition 1c: Employees at Peruvian companies in the growth stage will less likely
perform organizational loyalty in comparison with the employees at Peruvian companies in the
mature stage.
The organizational compliance which refers to the employee’s acceptance and adherence to
the rules, regulations, and procedures, even when no one is supervising is more likely to occur
at Peruvian companies in the growth stage. Usually, in these companies there is no flexibility
and the founder/leader are the one that embedded the culture. Harris and Raviv (2002)
emphasized that young firms have a centralized flat structure when the CEO is highly involved
in coordination activities.
Proposition 1d: Employees at Peruvian companies in the growth stage will likely
demonstrate organizational compliance more than the employees at Peruvian companies in the
mature stage.
According to Quinn and Cameron (1983), in the third organizational life cycle (the
formalization stage) effectiveness is defined on two models, internal process and rational goals
models, which means goal setting and attainment, productivity, information management,
communication, and control. In the case of an individual initiative, i.e. when employees engage
in task-related behaviors at a level that goes beyond the minimally required, improving one’s
task, showing extra effort, volunteering on extra responsibilities, and encouraging others to do
it. In contrast, employees at companies in the mature stage are more likely to engage in this
behavior. These employees are more result oriented and comfortable in unfamiliar situation;
each day is a new challenge for them. Employees at companies in the growth stage are less
likely to have this behavior.
Proposition 1e: Employees at Peruvian companies in the growth stage will likely engage in
individual initiative less than the employees at Peruvian companies in the mature stage.
In the case of civic virtue i.e. when the employee is committed to the organization as a
whole, to its governance, to its threats and opportunities, and to look out for the best interest of
the organization even at a personal cost the employees at companies in the growth stage are less
likely to engage in this behavior. In these companies, the decisions made by the founder/leader
change and are usually not predictable. Gupta and Chin (1994) stated that the concern on
organizational effectiveness is important in the late growth and maturity stages.
Proposition 1f: Employees at Peruvian companies in the growth stage are likely to exhibit
civic virtue less than the employees at Peruvian companies in the mature stage.

14 Faculty of Business Economics and Entrepreneurship International Review (2017 No.3-4)
© Filodiritto Editore – Proceedings
In the case of self-development i.e. when the employees are voluntarily committed to
improve their knowledge, skills, and abilities and increase their contribution level in the
organization employees at companies in the growth phase are more likely to engage in this
behavior. Usually, employees at companies in the early stage of development need to improve
their capabilities. It is important to mention that Gupta and Chin (1994), in a three-stage model
emphasized that individual effectiveness is important in the early stages. In addition, Randolph
and Posner (1982) developed a four-stage model to state that in the second phase (growth
phase) the efforts are directed to rationalization, institutionalization, and improving
performance.
Proposition 1g: Employees at Peruvian companies in the growth phase are likely to
demonstrate self-development more than employees at Peruvian companies in the mature
phase.
Method
The study used a qualitative approach to explore the factors that determine the OCB in the
companies and to develop a model that could explain the constructs of OCB in these
enterprises. The used qualitative strategy was the case study and the applied technique was the
design of multiple case studies embedded by the analysis units evaluated in each case study
(Yin, 2003). Multiple sources of evidence (interviews, documentation, files, direct observation,
and physical evidence) were also analyzed to interpret each organization considered in the
study.
The case studies have been selected based on the 2009 edition of “Peru: The Top 10,000
Companies”. From this group, seven companies from different economic sectors were selected.
The “homogeneous sampling of people who are members of a subgroup with distinctive
characteristics” (Creswell & Plano Clark, 2007, p. 112), and “a type of stratified sampling with
a specific purpose that illustrates subgroups and facilitates comparisons” (Miles & Huberman,
1994, p. 28) were used in this study. The aspects considered to select the sample were: (a) large
companies which are representative of their economic sector and show a significant growth in
recent years; (b) companies concerned in corporate governance; (c) companies that have a
significant number of workers; and (d) companies that have implemented human resources
management policies and are aware of people management. The informants of the case studies
belong to the directive and management level. The number of evaluated case studies has been
determined by saturation, which is the decreasing marginal contribution of each additional case
(Gummesson, 2000). Logical replication was also used. The research included seven case
studies (twenty-four interviews) considering Peruvian companies in the growth and maturity
stages (Table 1).
The cases were individually and crosswise analyzed to identify the patterns related to the
OCB and the stages of the business life cycle (growth and maturity). The following strategies
were used to ensure construct validity: (a) triangulation of the information; (b) a chain of
evidence was maintained in the analysis; (c) the researcher’s bias was clearly specified; (d)
quasi-statistics were carried out to analyze the information related to each particular conclusion
(Maxwell, 1996; Creswell, 2003); (e) one pilot case was carried out. To ensure internal validity,
the study used the pattern matching strategy; patterns emerging from the comparison of cases
provided the bases to establish the conclusions of the research. To ensure reliability, the study
used the following strategies: the use of a protocol case, the use of a data base in each case, the
of use of an external researcher to verify the contents and logic of the information analysis and
to compare the conclusions with the ones the researcher considered as emerging from the
information.

Faculty of Business Economics and Entrepreneurship International Review (2017 No.3-4) 15
© Filodiritto Editore – Proceedings
Table 1. Overview of Case Studies Background
Case 1 Case 2 Case
3 Case 4 Case 5 Case 6 Case 7
Sector it
belongs
to
Mining Banking Banki
ng
Insura
nce Retail
Equipment
and
Machinery
Trade
Foods and
beverages
Type of
Activity
Producti
on of
Goods
Producti
on of
services
Produ
ction
of
Servi
ces
Produc
tion of
Servic
es
Production of
Services
Production of
Services
Production of
Goods
Number
of
Informant
s
6 4 3 1 4 2 4
Years in
Operation
Between
20 and
60
More
than 60
Less
than
20
Less
than
20
Less than 20 More than 60 More than 60
Income
Range
2010
(Million
Soles)
More
than
3,000
More
than
3,000
Betw
een
1,001
and
2,000
Up to
1,000
Between
2,001 and
3,000
Between
2,001 and
3,000
Between
1,001 and
2,000
Number
of
workers
Between
7,001
and
10,000
More
than
10,000
Betw
een
4,001
and
7,000
Up to
1,000
More than
10,000
Between
1,001 and
4,000
Between
1,001 and
4,000
Most
representa
tive
category
Manual
workers
Employe
es
Empl
oyees
Emplo
yees
Service
Representativ
es
Mechanics Manual
workers
Gender
with the
highest
participati
on in the
labor
force
Mainly
men
More
women
than men
More
wome
n than
men
More
woma
n than
men
More men
than women Mainly men Mainly men
Case analysis and results
OCB in the companies
The study analyzed how the forms of OCB organized by Podsakoff et al., (2000) helping
behavior, sportsmanship, organizational loyalty, organizational compliance, individual
initiative, civic virtue and self-development are exhibited or realized in the case studies. For the
assessment, the used methodology has made it possible to qualify the presence or absence of the
twenty dimensions and to classify the seven forms of OCB as high, medium or low (Table 2).
For the analysis of behavior patterns, the propositions about the seven OCB have been used,
in case the company is in a growing stage or in a mature stage.
Based on the informants’ testimonies, the study results show that four propositions have
been supported, two have been partially supported, and one of them has no impact on the
organizational life cycle. These results would reflect that there are certain considerations of the
company itself, which have a considerable impact on the exhibition of certain OCB.

16 Faculty of Business Economics and Entrepreneurship International Review (2017 No.3-4)
© Filodiritto Editore – Proceedings
According to the informants’ statements, Proposition 1a has been supported. In helping
behavior, the spirit of cohesion shown by certain companies has an important influence as a
result of the work characteristics or the culture. However, in several case studies, a special
mention has been made to the fact that it is not only necessary to promote cooperation, but it is
also necessary to train the supervisors to promote cooperation. With regard to the preventive
actions taken by the employees, this does not happen in all the cases, since they tend to be more
reactive than preventive and, in some cases, these only happen at a corporate level.
In the sportsmanship behavior, two dimensions have been assessed. First, the willingness to
do a better job even though there are inconveniences at work. Second, the expression of
dissatisfaction due to changes. Based on the informants’ statements, Proposition 1b is
supported. In this aspect, a special emphasis was placed on the importance of communication
when changes are made. In some cases, the culture and the characteristics of the company itself
make an influence.
In the case of organizational loyalty, according to the business life cycle, Proposition 1c is
partially supported as stated by the informants. This is so, because pride towards the company
and the employee’s commitment, even under adverse conditions, is highly recognized in all the
case studies. One factor that has also been mentioned in this behavior is the communication
channels and how employees feel they are informed about the important events in the company.
Clarify everything. Look, here we face the world. Not only when there is good news. We
have to know the bad news quickly and address them even more quickly. (Case 1 Informant 2
103:103).
In the case of organizational compliance, the focus was on the dimension of rules, standards
and procedures compliance even though the employee is not supervised, and the dimension of
the good use of the resources. In this behavior, the company culture might have an influence.
According to the informants’ statement, Proposition 1d would not apply, since the life cycle
has no impact on the measure of this behavior.
According to the informants’ statement, Proposition 1e regarding the individual initiative
has been supported in the study. It is observed mainly in companies in the mature stage. The
aspects to be highlighted in this behavior are the performance of tasks that go beyond the
requested duties, the promotion of ideas, opinions and the introduction of improvements among
the employees.
We have not done it formally and I believe that is a mistake. I would like to promote that a
lot. It is not that I am thinking all day about the employee or the executive, instead the
executives shall think about themselves and their development in regard to mine security (Case
1 Informant 5 98:98).
According to the informants’ statement, the civic virtue behavior is the least observed in the
case studies. This behavior has a smaller presence in companies in a growing stage, which
supports the Proposition 1f. From the studied dimensions, the active participation in the
governability of the company and the follow-up of threats and opportunities, the level of
participation is low or only exhibited by some groups within the company.
Yes, the maximum that can be lowered, especially in the aspects that are part of the vision
and mission. During these strategic planning processes, we review the vision and mission every
year. This is very interesting, because in this case it is lowered a lot. We give them this and they
review it. We don’t start from the ground up; we start from what we have nowadays. (Case 7
Informant 1 162:163).
Self-development behavior and its relation with the business life cycle is what Proposition
1g refers to and it is not fully supported according to the informants. This result comes from the
fact that the employees’ desire to improve their knowledge, skills and abilities will be mainly
determined by the desire for self-improvement shown by employees in certain companies and
because they work in more competitive sectors and not so much because of the life cycle of the
company.
The study results of the seven propositions have provided researchers with a vision of
organizational processes and of the nature and meaning of citizenship in the organizations. In

Faculty of Business Economics and Entrepreneurship International Review (2017 No.3-4) 17
© Filodiritto Editore – Proceedings
line with Barker (2006), the results show the importance of knowing the managers’ scope of the
influence and their skill to influence on the desired direction. In addition, the research results
would contribute to the conceptualization of the OCB and to build a theory in the future (LePine
et al., 2002).
Table 2. Patterns of OCB dimensions
Companies in growth stage Companies in maturity stage
Case 1 Case 3 Case 4 Case 5 Case 2 Case 6 Case 7
1a Helping behavior High High High High High High Medium
Helping behavior (+) (+) (+) (+) (+/-) (+) (+/-)
If Supervisors Promote
Cooperation (+/-) (+/-) (+) (+) (+) (+/-) (+/-)
Preventive Actions taken
by the Employees (+/-) (+/-) (+/-) (+/-) (+) (+) (+/-)
Level of Excessive
Cooperation that Affects
Work Performance
(+/-) ( - ) (+) ( - ) ( - ) (+/-) ( - )
1b Sportsmanship Medium High Low High High High Low
Willingness to Do Better
even in the Presence of
Problems
(+) (+) ( - ) (+) (+) (+) ( - )
Expression of
dissatisfaction due to
changes
(+) ( - ) (+) ( - ) (+/-) ( - ) (+/-)
1c Organizational loyalty Medium High High High High High Medium
Promotion of the
organization to third
parties
(+/-) (+) (+) (+) (+) (+) (+/-)
The employees
communicate important
facts in the organization
(+/-) (+/-) (+) (+) (+/-) (+/-) (+/-)
Willingness of
employees to clarify
misunderstandings
(+/-) (+) (+) (+/-) (+) (+/-) (+/-)
Employee’s Commitment
even under adverse
circumstances
(+) (+) (+) (+) (+/-) (+) (+)
1d Organizational
compliance Medium High High High High High High
Compliance with Rules,
Standards and Procedures
even without being
observed
( - ) (+/-) (+) (+) (+) (+) (+/-)
Good use of the
organization resources (+) (+) (+) (+) (+/-) (+) (+)
1e Individual initiative Low High Medium High High High High
Performance of tasks that
go beyond the requested
duties
(+/-) (+) (+/-) (+/-) (+/-) (+) (+)
The company promotes
the expression of ideas
and opinions
( - ) (+) (+) (+) (+/-) (+/-) (+)
The company encourages
among employees to
introduce improvements
at work
( - ) (+) ( - ) (+/-) (+) (+/-) (+)
1f Civic virtue Medium Medium Low Low Medium High Medium

18 Faculty of Business Economics and Entrepreneurship International Review (2017 No.3-4)
© Filodiritto Editore – Proceedings
Companies in growth stage Companies in maturity stage
Case 1 Case 3 Case 4 Case 5 Case 2 Case 6 Case 7
Level of organizational
commitment as a whole (+) (+) (+) (+) (+) (+) (+)
Employees’ willingness
to participate actively in
governance
(+/-) (+/-) ( - ) ( - ) (+/-) (+/-) (+/-)
Employees follow up
with the Organizational
opportunities and threats
(+/-) (+/-) (+/-) ( - ) (+/-) (+) (+)
Employees watch the
company’s interest at a
personal cost
(+) (+) (+) (+) (+/-) (+) (+/-)
1g Self-development Medium High Medium Medium High Medium Medium
Improvement of
Knowledge, Skills and
Abilities by the
Employees
(+/-) (+) (+/-) (+/-) (+) (+/-) (+/-)
Scope of the OCB
Organ et al., (2006) studied whether the employee’s commitment to an OCB is generated
for the sake of the employee (personal gain), for the sake of others (support to the leader and
co-workers), or for the sake of the organization (the impact it has on the relevant organizational
aspects) and the society in general. Therefore, the study analyzed if the OCB emerge from the
employees or not and its scope of action (Table 3). The results show that the prevailing OCB is
related to the organization’s best interests. This is explained by the employees who feel proud
of the company, by their identification with the company, and acknowledge that they’re going
to grow to the extent that the organization will also grow, as shown in the following cases:
I would say that he wants to feel good and he wants to be in an organization that works well
in order to feel good as a person and good in regard to the organization, because he cannot be
in an organization that is not good, so to speak. (Case 2 Informant 1 94:94).
I believe that what they want is to grow and develop along with the organization themselves
and as an organization. Exactly. I have seen when the spirit of growth appears. They do not
want to stay behind. If the company is growing, there are new opportunities and they want to be
prepared to take them, i.e. they grow hand in hand with the company. (Case 5 Informant 4
244:246).
The sake of the group is also important because many employees are identified with the
department, group or unit where they work. The sake of the person is ranked third in importance
and is determined by the desire for improvement and professional development. Finally, the
results show that the sake of the society occurs less frequently and is only relevant for those
companies in which the social aspects and the relationship with the environment constitute a
crucial part of the corporate policies and strategies.
Table 3. Scope of the employees’ OCB
For the person’s
sake
For the group’s
sake
For the organization’s
sake
For the society’s
sake
Case 1
Case 2
Case 3
Case 4
Case 5
Case 6
Case 7
x
x
x
x
x
x
x
x
x
x
x
x
x
x
x
x
x
x
x
x
x

Faculty of Business Economics and Entrepreneurship International Review (2017 No.3-4) 19
© Filodiritto Editore – Proceedings
Forms of OCB and the Impact on Business Management
The study analyzed which dimensions of OCB were considered to be the most relevant in
order to improve the business management and effectiveness. The results show that loyalty and
self-development are the behaviors with the greatest impact on organizational management. In
four of the seven case studies, loyalty is the most important, while self-development is the most
relevant in the other three cases (Table 4), as shown in the following cases:
I believe that self-development and helping behavior are the core subjects. The help, group
work and personal growth or self-development make people want to grow, and they use the
bank or the organization as a means to accomplish this. (Case 3 Informant 2 122:124)
Table 4. Forms of OCB and the impact on business management
Organizational Citizenship Behaviors
Case 1
Case 2
Case 3
Case 4
Case 5
Case 6
Case 7
Loyalty is most important. Then optimism, initiative, solidarity, civility and self-development.
Self-development and individual initiative. Then compliance, loyalty and helping.
Self-development and helping. Also, innovation, sportsmanship and sense of humor.
Loyalty and helping. Then sportsmanship, compliance and self-development.
Emphasis on self-development. At a lower level, compliance, sportsmanship, helping and team
work. At a higher level, self-development, sportsmanship, adaptability to changes.
Organizational loyalty and self-development, the strongest.
Today loyalty, initiative and compliance. What the company wants is for self-development to
be the driver.
Obstacles for OCB
The obstacles that may prevent employees from engaging in an OCB are the behaviors that
affect efficacy, conflictual situations, constant changes in the company, and a stress level due to
changes. Robbins and Judge (2009) mentioned that the deviant behavior in the workplace, the
changes and stress may impact the organizational behavior.
According to the informants, the study results show that in three of the seven case studies
there are behaviors that affect efficacy, such as the employees’ behavior, lack of closeness and
communication, union actions, the work environment and the company culture. These factors
do no help to achieve an OCB. In the other case studies, the informants mentioned that these
behaviors were almost inexistent and were more related to some work-related situations in each
specific area that may affect other areas within the organization.
Conflictual situations may also pose obstacles to achieve OCBs. According to the
informants, in three case studies there were no conflictual situations. Two case studies had
conflictual situations mainly due to union actions or to very different positions among the areas.
In one case study, the informants stated that there were few conflictual situations which
might be caused by the lack of communication or by a situation with the supervisor.
With regard to the constant changes in the companies, the informants of five case studies
mentioned that changes in the company were a constant feature, and these would continue
because the company is growing, it is very dynamic sector, and innovations are constantly
introduced into the company. One characteristic of this kind of companies is that they work
along with the employees to accept and adapt to each of these changes.
The level of stress is high in six of the seven case studies, according to the informants’
statements. Many of these companies are taking action to mitigate the stress with strict work
schedule policies, anti-stress programs, coupon books to allow certain schedule flexibility for
the collaborator to deal with personal matters, among other activities. Table 5 shows the study
results.

20 Faculty of Business Economics and Entrepreneurship International Review (2017 No.3-4)
© Filodiritto Editore – Proceedings
Table 5. Obstacles that hinder the engagement in an OCB
Behaviors
affecting
efficacy
Conflict situations Constant changes
in the company
Level of stress
because of
changes
Case 1
Case 2
Case 3
Case 4
Case 5
Case 6
Case 7
There is some
Minimal
Minimal
There is none
There is some
There is none
There is some
There is some
There is none
There is none
There is none
Minimal
There is none
There is some
Few changes
Constant
Constant
Few changes
Constant
Constant
Constant
A little
High
High
High
High
High
High
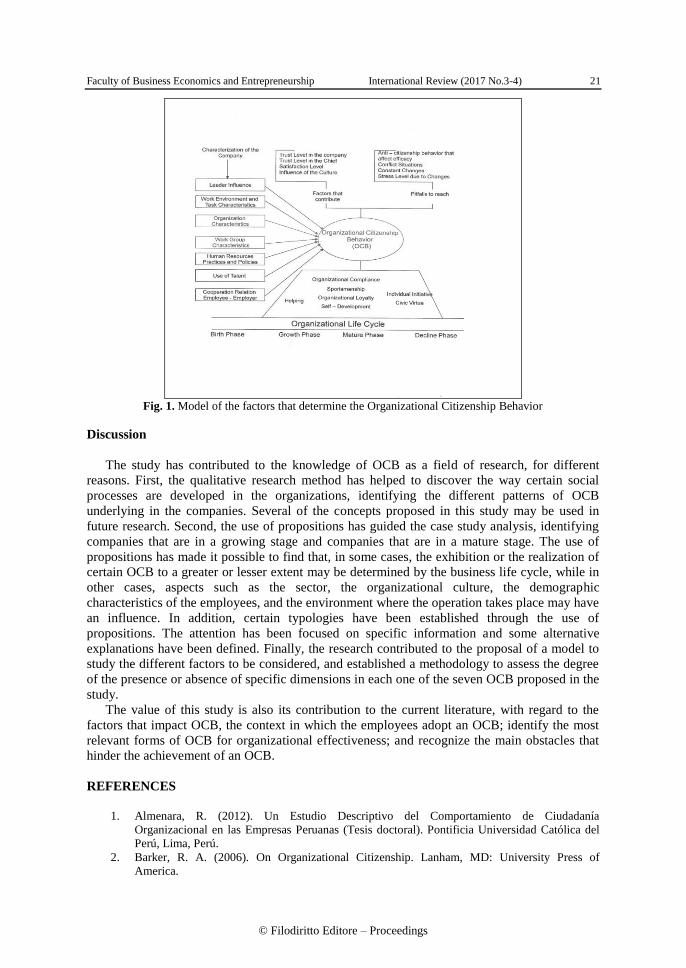
Conceptual Framework based on OCB
The results of the research and the literature review about Organizational Citizenship
Behavior (OCB) have allowed proposing a model that includes the factors that determine the
OCB (Fig. 1). Three aspects have been taken into account to formulate the model. First, the use
of the organizational life cycles a four-stage model to measure the presence or exhibition of the
seven OCB dimensions: helping behavior, sportsmanship, organizational loyalty, organizational
compliance, individual initiative, civic virtue, and self-development. From the seven
propositions studied, four of them were supported, two propositions were partially supported,
and one of them has no impact on the organizational life cycle. Second, the characteristics of
the companies which includes the leader’s influence, the work environment and characteristics
of the task the characteristics of the organization, the characteristics of the group work, human
resources practices and policies, the use of the talent, and the cooperation relation between the
employee and the employer are the variables that influence the OCB and the exhibition of each
of the seven dimensions of OCB in the companies. The study results show the importance of
these variables in the case studies, regardless of the organizational life cycle. Therefore, it is
important to know the level of influence of each characteristic in the OCB. Third, the
identification of the factors that contribute to achieve OCBs, which are the following: the level
of trust in the company, the level of trust in the boss, the level of satisfaction, and the cultural
influence, as well as those that hinder the achievement of OCB, such as behaviors that affect
efficacy, conflictual situations, constant changes and stress due to changes. The study shows the
factors that contribute to achieve OCBs and the obstacles that prevent companies to achieve
OCBs in each study case.
The study of the three aspects has made it possible to identify different patterns of OCB in
Peruvian companies, and to assess the tendency to show each of the seven dimensions of OCB,
according to the stage of the organizational life cycle. There is not a single typology. The
characterizations of each company and the factors or obstacles that hinder the achievement of
OCBs in each of them are relevant in the study results.
Faculty of Business Economics and Entrepreneurship International Review (2017 No.3-4) 21
© Filodiritto Editore – Proceedings
Fig. 1. Model of the factors that determine the Organizational Citizenship Behavior
Discussion
The study has contributed to the knowledge of OCB as a field of research, for different
reasons. First, the qualitative research method has helped to discover the way certain social
processes are developed in the organizations, identifying the different patterns of OCB
underlying in the companies. Several of the concepts proposed in this study may be used in
future research. Second, the use of propositions has guided the case study analysis, identifying
companies that are in a growing stage and companies that are in a mature stage. The use of
propositions has made it possible to find that, in some cases, the exhibition or the realization of
certain OCB to a greater or lesser extent may be determined by the business life cycle, while in
other cases, aspects such as the sector, the organizational culture, the demographic
characteristics of the employees, and the environment where the operation takes place may have
an influence. In addition, certain typologies have been established through the use of
propositions. The attention has been focused on specific information and some alternative
explanations have been defined. Finally, the research contributed to the proposal of a model to
study the different factors to be considered, and established a methodology to assess the degree
of the presence or absence of specific dimensions in each one of the seven OCB proposed in the
study.
The value of this study is also its contribution to the current literature, with regard to the
factors that impact OCB, the context in which the employees adopt an OCB; identify the most
relevant forms of OCB for organizational effectiveness; and recognize the main obstacles that
hinder the achievement of an OCB.
REFERENCES
1. Almenara, R. (2012). Un Estudio Descriptivo del Comportamiento de Ciudadanía
Organizacional en las Empresas Peruanas (Tesis doctoral). Pontificia Universidad Católica del
Perú, Lima, Perú.
2. Barker, R. A. (2006). On Organizational Citizenship. Lanham, MD: University Press of
America.

22 Faculty of Business Economics and Entrepreneurship International Review (2017 No.3-4)
© Filodiritto Editore – Proceedings
3. Bottom, W. P., Holloway, J., Miller, G. J., Mislin, A., Whitford, A. (2006). Building a Pathway
to Cooperation: Negotiation and Social Exchange between Principal and Agent. Administrative
Science Quarterly, 51(1), 29-58.
4. Campion, M. A., Papper, E. M., & Medsker, G. J. (1996). Relations Between Work Team
Characteristics and Effectiveness: A Replication and Extension. Personnel Psychology, 49, 429-
452.
5. Cavanagh, J. (Ed.). (2009). Peru: The top 10,000 companies. Lima, Peru: Peru Top Publications.
6. Creswell, J. (2003). Research design: Qualitative, quantitative and mixed methods approaches.
Thousand Oaks, CA: Sage Publications.
7. Creswell, J. W., Plano Clark, V. L. (2007). Designing and Conducting Mixed Methods
Research. Thousand Oaks, CA: Sage Publications.
8. Crowston, K. (1997). A Coordination Theory Approach to Organizational Process Design.
Organization Science, 8(2), 157-175.
9. Dailey, R.C. (1978). The Role of Team and Task Characterictics in R&D Team Collaborative
Problem Solving and Productivity. Management Science 24(15), 1579-1588.
10. Farh, J. L., Earley, P. C., Lin, S. C. (1997). Impetus for Action: A Cultural Analysis of Justice
and Organizational Citizenship Behavior in Chinese Society. Administrative Science Quarterly,
42(3), 421-444.
11. Farh, J. L., Zhong, C. B., Organ, D. W. (2004). Organizational Citizenship Behavior in the
People’s Republic of China. Organization Science, 15(2), 241-253.
12. Gray, B., Ariss, S. S. (1985). Politics and Strategic Change across Organizational Life Cycles.
The Academy of Management Review, 10(4), 707-723.
13. Griesinger, D. W. (1990). The Human Side of Economic Organization. Academy of
Management Review, 15(3), 478-499.
14. Gummesson, E. (2000). Qualitative Methods in Management Research (2nd ed.). Thousand
Oaks, CA: Sage Publications.
15. Gupta, Y. P., Chin, D. C. W. (1994). Organizational Life Cycle: A Review and Proposed
Directions for Research. The Mid-Atlantic Journal of Business, 30(3), 269-294.
16. Harris, M., Raviv, A. (2002). Organization Design. Management Science, 48(7), 852-865.
17. Hollenbeck, J. R., DeRue, D. S., Guzzo, R. (2004). Bridging the Gap between I/O Research and
HR Practice: Improving Team Composition, Team Training, and Team Task Design. Human
Resource Management, 43(4), 353-366.
18. Jahangir, N., Akbar, M. M., Haq, M. (2004). Organizational Citizenship Behavior: Its Nature
and Antecedents. Brac University Journal, I (2), 75-85.
19. Jones, G. R., George, J. M. (1998). The Experience and Evolution of Trust: Implications for
Cooperation and Teamwork. Academy of Management Review, 23(3), 531-546.
20. LePine, J. A., Erez, A., Johnson, D. E. (2002). The Nature and Dimensionality of Organizational
Citizenship Behavior: A Critical Review and Meta- Analysis. Journal of Applied Psychology,
87(1), 52-65.
21. Lester, D. L., Parnell, J. A. (2008). Firm size and environmental scanning pursuits across
organizational life cycle stages. Journal of Small Business and Enterprise Development, 15(3),
540-554.
22. Mathieu, J. E., Maynard, M. T., Taylor, S. R., Gilson, L. L., Ruddy, T. M. (2007). An
examination of the effects of organizational district and team contexts on team processes and
performance: a meso- mediational model. Journal of Organizational Behavior, 28, 891-910.
23. Maxwell, J. (1996). Qualitative research design: An integrative approach. Thousand Oaks, CA:
Sage Publications.
24. Miles, M. B., Huberman, A. M. (1994). Qualitative Data Analysis: An Expanded Sourcebook.
Thousand Oaks, CA: Sage Publications.
25. Moorman, R. H., Blakely, G. L. (1995). Individualism – collectivism as an individual difference
predictor of organizational citizenship behavior. Journal of Organizational Behavior, 16(2), 127-
142.
26. Organ, D. W., Podsakoff, P. M., MacKenzie, S. B. (2006). Organizational Citizenship Behavior
Its Nature, Antecedents, and Consequences. Thousand Oaks, CA: Sage Publications.
27. Podsakoff, P. M., MacKenzie, S. B. (1994). Organizational Citizenship Behaviors and Sales
Unit Effectiveness. Journal of Marketing Research, 31(3), 351-363.
28. Podsakoff, P. M., MacKenzie, S. B. (1997). Impact of Organizational Citizenship Behavior on
Organizational Performance: A Review and Suggestions for Future Research. Human
Performance, 10(2), 133-151.

Faculty of Business Economics and Entrepreneurship International Review (2017 No.3-4) 23
© Filodiritto Editore – Proceedings
29. Podsakoff, P. M., MacKenzie, S. B., Moorman, R. H., Fetter, R. (1990). Transformational
Leader Behaviors and Their Effects on Followers' Trust in Leader, Satisafction, and
Organizational Citizenship Behaviors. Leadership Quarterly, 1(2), 107-142.
30. Podsakoff, P. M., MacKenzie, S. B., Paine, J. B., Bachrach, D. G. (2000). Organizational
Citizenship Behaviors: A Critical Review of the Theoretical and Empirical Literature and
Suggestions for Future Research. Journal of Management, 26(3), 513-563.
31. Quinn, R. E., Cameron, K. (1983). Organizational Life Cycles and Shifting Criteria of
Effectiveness: Some Preliminary Evidence. Management Science, 29(1), 33-51.
32. Randolph, W. A., Posner, B. Z. (1982). The Effects of an Intergroup Development OD
Intervention as Conditioned by the Life Cycle Stage of Organizations: A Laboratory
Experiment. Group & Organization Studies, 7 (3), 335-352.
33. Robbins, S. P., Judge, T. A. (2009). Organizational Behavior. Upper Saddle River, NJ: Pearson
Prentice Hall.
34. Schein, E. H. (2004). Organizational Culture and Leadership (3rd ed.). San Francisco: Jossey –
Bass.
35. Shmatikov, V., Talcott, C. (2005). Reputation – based trust management. Journal of Computer
Security, 13, 167-190.
36. Smith, K. G., Gannon, M. J. (1987). Organizational Effectiveness in Entrepreneurial and
Professionally Managed Firms. Journal of Small Business Management, 25(3), 14-21.
37. Sobel, J. (1985). A Theory of Credibility. Review of Economic Studies, LII, 557-573.
38. Switzerland: IMD International World Competitiveness Center.
39. Tucker, A. (2008). Trade Associations as Industry Reputation Agents: A Model of Reputational
Trust. Business and Politics, 10(1), 1-26.
40. Van Dyne, L., LePine, J. A. (1998). Helping and voice extra – role behaviors: Evidence of
construct and predictive validity. Academy of Management Journal, 41(1), 108-119.
41. Van Dyne, L., Graham, J. W., Dienesch, R. M. (1994). Organizational citizenship behavior:
Construct redefinition, measurement, and validation. Academy of Management Journal, 37(4),
765-802.
42. Williams, L. J., Anderson, S. E. (1991). Job Satisfaction and Organizational Commitment as
Predictors of Organizational Citizenship and in – Role Behaviors. Journal of Management,
17(3), 601-617.
43. World Economic Forum. (2011). In K. Schwab (Ed.), The Global Competitiveness Report 2011
- 2012. Retrieved from http://www3.weforum.org/docs/WEF_GCR_Report_2011-12.pdf
44. Yin, R. K. (2003). Case Study Research Design and Methods (3rd ed.). Thousand Oaks, CA:
Sage Publications.
Article history:
• Received 15 June 2017
• Accepted 20 August 2017

24 Faculty of Business Economics and Entrepreneurship International Review (2017 No.3-4)
© Filodiritto Editore – Proceedings
ORIGINAL RESEARCH PAPERS
Examining and Comparing the Economic Effects of
Spillovers of Investment Risk in Iran: Computable
General Equilibrium Model Approach3
SEYEDMASHHADI Pardis Alsadat4, JALAEE Seyed Abdolmajid5,
NEJATI Mehdi6, ZAYANDERODI Mohsen7
Abstract
Investment is as much as important for economic and social development that it is
considered as one of the powerful levers for achieving the development. Accordingly, it is of
great importance to assess the investment risk and its spillovers in all developed and developing
countries because the risk phenomenon is one of the key features of decision making in the field
of investment, affairs related to financial markets and a variety of economic activities. In this
regard, the present paper evaluates the effect of investment risk spillover on key economic
indicators using a computable general equilibrium model and the GTAP.9 database and the
2011 social accounting matrix (SAM) have been used for this purpose. Two scenarios of 10%
and 3% increase in investment risk are considered in order to investigate the effect of these
changes according to a recent trend analysis of economic indicators in Iran and the trend of the
Iranian economy towards globalization and opening of the economy windows. The results show
that both scenarios reduce investment risk, inflation, gross domestic product and total
investment. Government expenditures are reduced in all sectors of the economy except for the
service sector, which is almost unchanged. The exports are increased in all sectors and the
imports are declined in sectors of agriculture, industry and services. As well as, the results show
that the import of the oil and gas sector has not been heavily influenced by the investment risk
due to its governmental status. By assessing these two scenarios and the sensitivity of the
macroeconomic indicators to the degree of risk change, it can be stated that the key economic
indicators will be significantly improved by managing the risk of investment; and the country
will ultimately follow the development path more quickly.
Keywords: Risk spillover, Investment, Computable General Equilibrium Model
JEL: D58, F02
UDK: 005.334:330.322(55)
005.311:004
COBISS.SR-ID 253492492
3 This paper is derived from the PhD thesis of Pardis Alsadat Seyedmashhadi, Kerman branch of Islamic
Azad University, Kerman 4 Kerman Branch, Islamic Azad University, Kerman, Iran 5 Shahid Bahonar, University, Kerman, Iran, [email protected] 6 Shahid Bahonar, University, Kerman, Iran 7 Kerman Branch, Islamic Azad University, Kerman, Iran
Faculty of Business Economics and Entrepreneurship International Review (2017 No.3-4) 25
© Filodiritto Editore – Proceedings
Introduction
Controlling and monitoring the financial risk have been considered by many businessmen,
policy makers and financial market researchers in recent years. The main concern of the
activists is related to the large incompatible movement in the market through financial risk
monitoring. Extreme market dynamics indicate a huge movement of capital among market
participants, in which the bankruptcy of some market participants will be inevitable. The
presence of extensive communication between financial markets vindicates the monitoring and
control of risk in various markets. In trade and exchanges between the two countries, as there
are some spillovers such as technology and investment spillovers that could have beneficial
effects for the country, it could also lead to spillover of risk, which such this could have adverse
effects on the economic structure of the country. Risk spillovers in Iran’s economy can affect
the economy of the country through the oil and foreign exchange markets, but given the fact
that these two spillovers result in spillovers of investment risk, the focus of the spillovers in this
study are based on investment risk spillover. Global literature suggests that, generally, as
technological and investment spillovers are from large economies to small economies, risk
spillovers are also moving in the same direction. The research seeks to answer the following
questions: (1) Do investment risk spillovers affect macroeconomic indicators in Iran? and (2)
How much is the extent of the impact of risk spillovers on the indicators of inflation,
production, government expenses, imports, exports, total investment, and the welfare index? To
answer the questions, the framework of the article is presented in the way as follows: (1) The
introduction; (2) The subject literature; (3) The theoretical foundations, (4) The model
estimation; and in the end, (5) The conclusion.
Literature
Several studies have been conducted in the world literature and literature inside Iran about
the subject matter of the paper, some of which are dealt with in this section.
Du and He (2015) have investigated the spillovers of extreme risks between crude oil and
stock markets. Based on the method of Granger causality in risk, Value at Risk (VaR) is
employed to measure market risk. Empirical results revealed that there are significant risk
spillovers between the two markets.
Lin and Li (2015) have investigated both price and volatility spillover effects across natural
gas and oil markets of US, Europe and Japan in a comprehensive VEC–MGARCH framework.
In all cases, the results support the presence of price spillover from crude oil markets to
natural gas markets, but a reverse relationship does not exist. It was also found that the volatility
in oil market seems to spillover to the natural gas market, and vice versa, in both US and
Europe. On the contrary, volatility seems to be independent in natural gas and oil markets in
Japan.
Shakeibaei and Teimori (2012) have applied new risk management tool, VaR methodology,
and Granger causality test in risk to examine the risk spillover effect in both crude oil market
and US dollar exchange market. Results have shown that, from the perspective of market risk,
interaction between crude oil market and US dollar exchange rate does not seem strong.
Mc Dougall et al., (2012) in an article entitled General equilibrium mechanisms and the real
exchange rate in the GTAP model have suggested that, because different economic sectors are
interconnected, the impact of shock in one part of the economy can be found in another parts
sight. According to the results of this paper, the initial increase in the exchange rate will
increase exports and change the trade balance.
Jalaee et al., (2016) have examined the effects of the exchange rate shocks on investment
and employment in Iran, using a CGE Model, based on the GTAP 8 dataset. The results have
shown that the total investment in all areas examined is aligned with exchange rate changes.
Also, positive exchange rate shocks can increase overall employment rate.

26 Faculty of Business Economics and Entrepreneurship International Review (2017 No.3-4)
© Filodiritto Editore – Proceedings
Heidari et al., (2017) have investigated macroeconomic and sectoral effects of labor
immigration in Iran, applying a CGE model. The results have showed that both skilled and
unskilled labor immigration, lead to reduction in economic growth, investment and capital
return. This also reduces the production of various economic sectors.
Gharibnavaz and Waschik (2017) have detailed recent international sanctions against the
Iranian economy and its government imposed by a subset of developed countries, using a CGE
model. Their study has found, based on the GTAP 8 dataset, that international sanctions
reduced aggregate Iranian welfare by 14%-15%. The government of Iran sees a decrease in real
revenue of 40%-50%, due to the large negative effect of sanctions on the Iranian oil sector.
Phimister and Roberts (2017) have explored the importance of allowing for uncertainty in
the magnitude of exogenous shocks in Computable General Equilibrium (CGE) models. The
results have shown that the extent to which allowing for uncertainty can influence the
magnitude of estimated impacts with some variables more sensitive to the uncertainty than
others.
Farajzadeh et al., (2017) have developed a CGE model to study the potential welfare and
environmental impacts of Iran’s trade reform for accession to the World Trade Organization
(WTO). The results have shown that removing trade barriers not only results in higher welfare
and GDP as well as lower prices due to efficiency gains, but also reduces emissions of
greenhouse gases in terms of CO2 equivalent.
Theoretical foundation
Introduction of the GTAP A Multi Regional General Equilibrium Model (Nejati, 2012)
The “Global Trade Analysis Project” model is a static model and does not include any
dynamic effects of technological change, population growth and capital stock. Behavioral
activities and inter-departmental and inter-regional exchanges consist of two components of the
main equations consisting of accounting relationships and behavioral equations. The accounting
relationships include the data available in the social accounting, data-output matrix tables, and
behavioral equations indicate the behavior of economic factors in the model that relates to
production, consumption, savings and regional investment. Its mathematical model consists of a
set of nonlinear equations derived from the theory of microeconomic maximization by the Doug
all method with accounting relationships. Each region consists of four economic factors,
including the household representative of the region, private households, government, and
enterprises. The regional household has the basic elements used in the production of enterprises.
The regional household income is the sum of the sales value of the production factors and
the types of taxes and tariffs allocated these revenues to savings, the private household and the
state based on a Cobb Douglas function. Private households and the government, having
received income from the regional household, buy the goods and services they need from
domestic and foreign markets. The demand for private households is evaluated based on the
functional form of the Constant Difference Elasticity Function (CDE function), which was
originally provided by Hanoch (1975); therefore, the private household demand will have a
Non-Homothetic type, which, along with income changes, will not be a constant share of the
cost of various goods in the household budget. The government’s consumption demand
functions are extracted using a Cobb Douglas utility function, which has a constant share of the
cost of various goods. Firms use intermediate goods and, Factor inputs including labor, capital,
land, and natural resources for the production of goods and services, and by combining these
factors produce various types of goods and services. There are five factors of production,
including land, skilled labor, unskilled labor, capital and natural resources. All factors, except
for land and natural resources, are fully mobile across different sectors, but none of the factors
of production is tradable or has international mobility. Selling these goods happens inside and
outside of each region. Based on Standard Closure for the Global Trade Analysis Project, the
production of all sectors, land, labor, capital and natural resources, and all prices are determined
within the framework of the model or, in other words, are endogenous. The Numeracies in the

Faculty of Business Economics and Entrepreneurship International Review (2017 No.3-4) 27
© Filodiritto Editore – Proceedings
“Global Trade Analysis Project” model is the world price index of primary factors, which is
usually exogenous and is the weighted average of the price of the factors of production in all
regions. It should be noted that depending on the type of research, it is possible to assume a
different macro closures. Finally, the model is the percentage change, using the GEMPACK8
software (Harrison, Pearson, 1994) (Hertel et al., 1997).
In the general equilibrium model that can be calculated for the implementation and
application of each scenario, a change is required in the model standard closure. In other words,
the combination of the endogenous and exogenous variables of the model must be changed.
In addition, the number of functions must be equal to the number of unknowns so that the
system can be solved. Therefore, the classification of variables in the closing of each model
depends on the economic problem, in a way that is in line with the purpose and policy.
Moreover, this classification should have economic logic. Although users are free to choose
the closure, it should be noted that the standard is the neoclassical global trade analysis project,
so that all markets are in balance, the activity of all firms are under the premise of zero profit
and the regional household on the budget line.
The first new function that is considered in the table and shows the effect of internal
equilibrium on product changes is the function of the initial factors.
Qo (i, r) = qocom (i) + qoreg (r) + qoall (i, r) (1)
In function (1), qo (i, r) is the change percentage in the amount of product related to the
initial commodity i in the region r and are determined by three primary factors that are normally
exogenous in the standard GTAP. Adding this new function and primary shifter makes it easier
to isolate the internal and external balance. These three primary factors in the regions r and
quall are the change percentage in the amount of the product related to the primary factor in the
region r.
The second new function introduces another closure variable, which is the total actual per
capita consumption (uc) as the sum of government and private sector spending. It should be
noted that for the separation of curves FE and BP, the variable uc is used. Adding a function to
define this variable expresses its endogenousity in the GTAP standard closure.
AGGEXPAND (r). uc(r) = PRIVEXP (r). up(r) + GOVEXP (r). ug (r) (2)
In function (2), uc(r), is the per capita consumption utility of the government and private
sector in the region r. This endogenous variable is divided into up(r) and ug(r), which are the
per capita consumption of the private sector and the government, respectively.
The two remaining variables that are effective in the closure are dpsave and pfactor(r).
dpsave represents the growth rate of a part of the income that affects the savings distribution
based on the savings function in the region r. Also, the change in dpsave affects the balance of
investment-savings.
Psave (r)+ qsave (r)- y (r)=uelas (r)+dpsave (r) (3)
In function (3), psave is the change percentage in the savings price in the region r, qsave (r)
is the change percentage in regional demand for net savings, y(r) is the change percentage in the
regional household income in the region r, uels is the elasticity of the cost relative to the
changes in desirability. dpsave (r) is the savings distribution parameter.
The intended shock is applied by the variable pfactor which is the weighted average of the
relative price of the production factors. This variable, which is an appropriate index to show the
real exchange rate, is considered by the equations (4), (5) and (6) in the standard closure.
),,()( ripmriVOMrpfactorVENDWWLDCOMENDi
(4)
Function (4) calculates the percentage of changes in the primary price index in each region.
In this function, pfactor(r) is the primary market price index in the region r (average weight of
the variety of production factors receivables), VENDWWLD(r) is the global value of the
8 General Equilibrium Modeling Package

28 Faculty of Business Economics and Entrepreneurship International Review (2017 No.3-4)
© Filodiritto Editore – Proceedings
primary factors, VOM (i, r) is the value of the product i in the market price in the region r, pm
(i, r) is the market price of the commodity i in the region r.
Equation (5) specifies the actual return rate of the primary factor i in the region r.
Pfactorreal (i, s) = pm (i, s) -ppriv(s) (5)
In function (5), pfactorreal (i, r) is the difference between the rate of return of the primary
factor i from the growth rate CPI (Consumer Price Index), pm (i, s) is the market price of the
factor i in the region s, pprive(s) is the price index for the private sector’s consumption
expenditure.
The function (6) calculates the percentage of change in the global price index of the primary
factors.
. ( ( ). ( ))r REG
VENDWWLD pfactwld VENDWrEG r pfactor r
(6)
In function (6), pfactwld is the percentage of change in the global price index of the primary
factors.
( ( )i END COMM
VENDWWLD VENDWrEG r
(7)
n function (7), VENDWREG(r), the value of the primary factors for the market price in each
region, is obtained endogenously through function 8.
( , )i ENDw COMM
VENDWrEG VOM i r
(8)
In the standard closure of the global trade analysis project model, qoreg and dpsave are
exogenous; while pfactor and uc(r) are defined endogenously. On the other hand, the curve FE
and BP are analyzed through the relationship between consumption and real exchange rate.
Hence, the exogeneity of consumption and the real exchange rate in the model are essential. To
apply these modifications, you also need to change the model closure; so that the transition
parameters are endogenous. So, using the replacement functions, consider uc exogenous and
dpsave endogenous; so that these functions enable the model to change the total savings. It also
makes pfactor exogenous and qoreg endogenous so that makes it possible to change at the level
of the primary factors.
The labor is one of the primary factors behind which price has been changed followed by
the exogenous changes of pfactor in this study. In the general equilibrium model, demand and
supply of labor are determined, respectively, by the regional firm and household. Therefore,
according to equations (9) and (10), the demand and supply of this factor and employment in
general are affected.
Qfe (i, j, r) = -afe (i, j, r) + qva (j, r) - ESUBVA(j)*[pfe (i, j, r)-afe (i, j, r)- pva (j, r)] (9)
In Equation (9), qfe (i, j, r) are the demand for the factor i in the section j and the region r,
afe (i, j, r) is the technical progress related to factor i in the section j and the region r, pva (j, r)
is the value-added price of the firm in section j in the region r, pfe (i, j, r) is the price of
production factor i in section j and the region r.
ps (i, r) to (i, r) pm (i, r) (10)
In equation (10), ps (i, r) is the supply price of the primary production factor i in the region
r, to (i, r) is the tax on the supply of the primary factor and pm (i, r) is the market price of the
factors. With the change in regional household income, one of the ways to achieve it, is the sale
of primary production factors, savings will also change. On the other hand, in the GTAP model,
according to Walras law, savings and investment are equal. So, looking to change the regional
household income, investment will also change. Equations (11) and (12) illustrate how the
regional household income changes, following the change in the price of the primary factors of
production, and the allocation of that income between private consumption expenditure,
government, and savings.
FY(r)*fincome(r)VDEP(r) * [pcgds(r) + kb(r)] (11)

Faculty of Business Economics and Entrepreneurship International Review (2017 No.3-4) 29
© Filodiritto Editore – Proceedings
FY(r) is the net income from sales of the production factors in the region r, fincome(r) is the
growth rate of FY. Vom (i, r) is the value of selling the factors of production to the market
price, qo (i, r) is the amount of the supply of factor i in the region r, VDEP(r) is the value of
depreciation of capital in the region r. kb(r) is the growth rate of the beginning capital stock in
the region r and pcgds(r) is the price of capital goods.
Regional household income is distributed on the basis of a Cobb-Douglas function, between
private households, government and savings. Therefore, the regional household demand system
is expressed in accordance with Equation (12).
dpav(r)= XSHRPRIV(r) *dppriv(r)+ XSHRGOV(r) *dpgov(r)+ XSHRSAVE(r) *dpsave(r)
(12)
dpav(r) is the average transmission of distribution parameter in the region r, XSHRPRIV (r)
is the share of private households cost in total cost (or total regional household income),
XSHRGOV(r) is the share of government expenditure. XSHRSAVE(r) is the savings share,
dpprive(r) is the private household consumption distribution parameter, dpgov(r) is the
government consumption distribution parameter and dpsave(r) is the saving distribution
parameter in the region r.
Modeling risk
We assume that the global bank equalizes expected risk-adjusted rates of return, so that risk-
adjusted rates for all regions are equal to some global average.
RORE(r)/RISK(r) = RORG
Where, in accordance with GTAP notation convention, these capitalized variables represent
levels, while lower-case variables represent percentage rates of change from initial levels.
RORE(r) is a non-risk-adjusted expected rate of return, i.e. it is the expected rate of return in
the absence of any default by the borrower.
RISK(r) represents the ratio of equilibrium returns in region r to the global average rate of
return. For relatively high-risk countries, this ratio will be above 1, and for relatively safe
countries below 1. It is important to note that this variable represents a ratio rather than a certain
number of basis points – it is better called a “risk ratio” than a “risk premium”.
RORG does not represent a risk-free return but a weighted average of returns around the
world. This formulation differs from the more familiar representation of required rate of return
in a country being equal to the risk-free return plus some risk margin.
If we rewrite this as
RORE(r) = RORG * RISK(r)
Then by total differentiation and division through by RORE(r) we can obtain
rore(r) = rorg + risk(r)
where these variables are percentage changes in their levels equivalents. This is
the analogue of equation (11') in the standard GTAP model in the case where
RORDELTA=1:
rore(r) = rorg + cgdslack(r)
This equation states that the percentage change in the rate of return on investment in region r
is equal to the percentage change in the global rate of return plus a disequilibrium factor which
is generally exogenous and set at zero in a general equilibrium closure. Normally, the cgdslack
variable is only non-zero when we allow disequilibrium to exist in the market for capital goods.
The main proposition of this paper is that cgdslack can be interpreted to represent a risk
premium as defined above, although it was not originally designed for this purpose. In a general
equilibrium closure, cgdslack is unused for any other purpose (being exogenous and
unshocked), and therefore we do not disturb any other components of the model by using it in
this way.

30 Faculty of Business Economics and Entrepreneurship International Review (2017 No.3-4)
© Filodiritto Editore – Proceedings
Model estimation
In this study, the criterion of risk spillover and its channel is investment. Given that one part
of the investment comes from external sources, it can transfer the risk from the outside to the
other or from part to the other. In this study, the effect of spillover risk is studied on the
indicators firstly affected by risk and, secondly, these indicators can affect other variables.
Aggregate gtap data
Data in GTAP is introduced AS 8 production factors, 57 sectors and 140 regions. In this
research, the information is in the form of the 2011 Social Accounting Matrix, which uses the
latest version of GTAP (www.gtap.agecon.purdue.edu/databases/v9/default.asp). The model
database contains the values of all exogenous variables and parameters and the equilibrium
values of the endogenous variables. Estimation of the model was done using the GEMPACK
software package (Harrison and Pearson, 1994). In Table 1, details of sectors, regions, and
factors of production in this paper are presented. The reason why we did not differentiate other
countries in the region is that Iran is economically a small country, which is why creating
investment risk in the Iranian economy would not affect other regions such as the European
Union, the United States, the Middle East, etc. very much affected.
Table 1. Model Details
Subset Aggregate Agriculture, Oil and Gas, Industry, Services Sectors
Iran, Rest of world Regions Labor, Capital, Land, Natural Resources production factors
The scenarios in this study are two scenarios of an increase of 10% and 3% of investment
risk. In each of these scenarios, we will deal with the analysis of the effects of the investment
risk on inflation, GDP, government expenditures, imports, exports, total investment and the
welfare index quantitatively calculated using the global trade Computable General Equilibrium
Model.
First scenario: 10% increase in investment risk spillover
In this scenario, we consider 10% of the imported risk based on the past trend of the Iranian
economic system, which, of course, can be achieved by using the VaR9 method.
Considering the statehood of the Iranian economy and the role played by open economics in
the country, government spending imports and exports has examined by economic sector. As
Table 2 shows, the spillover of investment risk has had a negative impact on government
spending related to agriculture, oil and gas and industry, with the largest share of agriculture, oil
and gas sectors. This is due to the agricultural sector because of the alternative role for the
government and contributing to the oil and gas sector. Nevertheless, the service sector
inherently has not only been negatively affected, but also positive, due to sluggish changes. One
of the reasons is that the activities of this sector are more applied.
Shocked, imports in agriculture, industry and services have declined. Given that about 85
percent of Iran’s imports are intermediate and capital goods, as well as agricultural and
industrial sectors are dependent on imports of these types of goods; therefore, due to the
shrinking investment, the import volumes of these sectors due to the decrease in the ability to
buy them will be reduced. However, the oil and gas sector has not only diminished, but also
increased due to its oil revenues and government spending. The service sector, like the
industrial and agricultural sector, has been less able to buy and, as a result, has decreased its
imports.
9 Value at Risk

Faculty of Business Economics and Entrepreneurship International Review (2017 No.3-4) 31
© Filodiritto Editore – Proceedings
Exports have increased in all sectors as these sectors compensate for investment-related
shortages in investment through increased exports. On the other hand, the effect of investment
on exports will take place over a long period. The reason why the increase in exports in the oil
and gas sector is lower than in other sectors is that the oil and gas sector is a public sector and
less under the influence of investment.
Table 2. The results of a 10% increase in investment risk on Government Expenditure, Imports, Exports
(percent)
Agriculture Sector Oil and Gas Sector Industry Sector Service Sector
Government Expenditure -2.15 -2.55 -1.92 0.06 Imports -3.99 0.79 -5.53 -5.57 Exports 10.17 1.34 11.43 9.58
Resource: Researcher finding
As shown in Table 3, with a 10% investment risk shock, inflation dropped to 2.02%. Given
the indirect relationship between risk and investment, the risk involved will reduce the
investment that stimulates the demand side of the economy, thereby affecting the demand side
of the economy and therefore has a negative impact on inflation.
GDP declined by 0.34%. The reason is that in the Iranian economy, because of the
government’s economy and the high share of the state in the economy, production is more
based on sectors that are state-owned. Therefore, the overwhelming impact of the risk of
investment by the nongovernmental sector on production is diminishing, but this decline is not
very significant due to the higher share of the government.
The total investment dropped to 7.76 percent, which is quite natural because there is always
a significant and indirect relationship between investment risk and amount of investment.
Reducing investment is more likely to decrease other indicators, and the reason is that the
impact of spillover risks directly on investment itself. Therefore, considering that the impact of
spillover of investment risk on the investment is negative and also negatively affects the main
sectors of the economy, including the agricultural sector, the welfare index also decreases. As
investment through government expenditures as well as imports has negative effects on
agricultural and industrial sectors and, on the other hand, much of the population is dependent
on these two economic areas, and the welfare index is directly related to people’s lives;
therefore, the total welfare decreased 757.14 million dollars.
Table 3. The results of a 10% increase in investment risk on Inflation, GDP, Total Investment (percent)
And Welfare Index (million dollar)
Inflation GDP Investment Welfare
Iran -2.02 -0.34 -7.76 -757.14 Rest of world 0.01 0 0.04 515.35
Resource: Researcher finding
Second scenario: 3% increase in investment risk spillover
In this scenario, we reduced the risk from 10 to 3 percent to know if the sensitivity of the
research indicators to degree of risk change is significant.
As shown in Tables 4 and 5, sectors firstly show a large response in the same direction, and
secondly, determine how much modulation policies in the area of investment risk can affect
making decisions on the effect of investing in economic sectors. Therefore, adjusting the risk
index can substantially modulate the sectors of GDP, government spending, inflation, imports,
exports, total investment, and welfare.

32 Faculty of Business Economics and Entrepreneurship International Review (2017 No.3-4)
© Filodiritto Editore – Proceedings
Table 4. The results of a 3% increase in investment risk on Government Expenditure, Imports, Exports
(percent)
Agriculture Sector Oil and Gas Sector Industry Sector Service Sector
Government Expenditure -0.69 -0.81 -0.61 0.01 Imports -1.28 0.24 -1.75 -1.79 Exports 3.11 0.44 3.47 2.9
Resource: Researcher finding
Table 5. The results of a 3% increase in investment risk on Inflation, GDP, Total Investment(percent) And
Welfare Index (million dollar)
Inflation GDP Investment Welfare
Iran -0.64 -0.11 -2.42 -243.48 Rest of world 0 0 0.01 167.54
Resource: Researcher finding
Conclusion
As regards today’s world moves towards to open more economy doors and the process of
globalization occurs with greater acceleration, that one of the factors resulted from the process
of globalization on the economies, that is discussing risk spillover. The risks spill from different
regions of the world to a country or a region. This research was looking for the answer to these
questions; that 1- Do the investment risk spillover influence macro-economic indexes in Iran?
And, 2- How and how much are the impact of risk spillover on the indexes of inflation,
production, government spending, import, export, total investment, and welfare index?
It was done the proper estimated to answer the two questions of the research, which the
results have shown that the existence of the original economic variables of the investment risk
have influenced the cases such as the inflation, gross domestic product, government spending,
import, export, total investment, and the welfare index. Due to the existence of the alternative
role between the government spending and the investment, so it has negatively affected
different economic sectors by creation of investment risk. It reduces the inflation and grass
domestic production and because the total investment is directly under the influence of
investment risks, it has reduced greatly.
Welfare, which is a function of income and the prices; by reducing the amount of
investment because of the risk, and followed by reducing the level of real prices and the
reduction of real income led to decrease the income of private households and this led to
reduced private consumption by them and so, the total welfare is reduced. With arisen shock,
the import of all economic sectors except for the rock oil and gas sector have been reduced,
because this section is completely state-owned. In return, the export has increased in all sectors.
This study, in order to measure the sensitivity of indexes towards the risk variable has
studied the impact of risk spillover on the desired variables of the research in two scenarios of 3
and 10 percent. It has concluded that, firstly, the main indexes of the economy react towards the
change of the risk extent, and secondly, their sensitivity is remarkable. So, if in the economic
system of Iran, the risk extent be managed, then the macroeconomic indexes will show notable
reaction towards improving.
REFERENCES
1. Du, L., He, Y. (2015). Extreme risk spillovers between crude oil and stock markets. Energy
Economics. Vol 51: 455-465.
2. Farajzadeh, Z., Zhu, X., Bakhshoodeh, M. (2017). Trade reform in Iran for accession to the
World Trade Organization: Analysis of welfare and environmental impacts. Economic
Modelling. Vol 63: 75-85.
3. Gharibnavaz, M.R., Waschik, R. (2017). A computable general equilibrium model of
international sanctions in Iran. The world economy. Vol 40.

Faculty of Business Economics and Entrepreneurship International Review (2017 No.3-4) 33
© Filodiritto Editore – Proceedings
4. Heidari, H., Davoudi, N., Talebi, F. (2017). Macroeconomic and sectoral effects of labor
immigration: application of CGE model. Research and Planning in Higher Education. Vol 4: 25-
42. 5. Hertel, T.W., Tsigas, M.E. (1997). Structure of GTAP, in T.W. Hertel (ed.), Global Trade
Analysis; Modeling and Applications. Cambridge University Press.
6. Jalaee S.A., Nejati, M., Bagheri, F. (2016). Examining the effects of the exchange rate shocks on
investment and employment in Iran, Using a Computable General Equilibrium Models. The
Economic research of Iran. Vol 16: 201-220.
7. Lin, B., Li, J. (2015). The spillover effects across natural gas and oil markets: Based on the
VEC–MGARCH framework. Applied Energy. Vol 155: 229-241.
8. Malcolm, G. (1998). Modeling country risk and capital flows in GTAP. GTAP Technical Paper
No. 13.
9. Mc Dougall, R., Akgul, Z., Walmsley, T., Hertel, T., Villoria, N. (2012). General equilibrium
mechanisms and real exchange rate in the GTAP model. Third Draft of a Technical Document:
1-40.
10. Phimister, E., Roberts, D. (2017). Allowing for uncertainty in exogenous shocks to CGE
models: the case of a new renewable energy sector. Economic Systems Research: 1-19. 11. Shakeibaei, A., and Teimori, E. (2012). Risk spillover effect of US dollar exchange rate on oil
prices. The Economic research of Iran. Vol 12: 99-121.
Article history:
• Received 20 September 2017
• Accepted 1 December 2017
34 Faculty of Business Economics and Entrepreneurship International Review (2017 No.3-4)
© Filodiritto Editore – Proceedings
ORIGINAL RESEARCH PAPERS
Identifying and Structuring the Factors Affecting
Sustainable Banking Resources with Using Interpretive
Structural Modeling
MOUSAVI Seyed Mahdi10, YAMOULA Alireza11,
KHOSHROO Mohsen12
Abstract
Considering the recent developments in banking system, banks are able to increase their
power of partnership in different areas of manufacturing, industrial, agricultural and else by
attracting more resource approach, and creating competitive advantage, which result in
expansion and increase of earnings or benefits of the bank as well as creating competitive
advantage. Considering the limitation on resources and time, the ability to jointly invest in all of
the influential factors on creating sustainable banking resources cannot be achieved. The main
aim of the present research is to provide a model of the influential factors on creating
sustainable banking resources so with usage of which, managers can identify the factors that
have the highest influence on the others and plan on the them. For this purpose, 10 influencing
factors on creating sustainable banking resources such as financial risks, amount and quality of
equity, amount of assets, etc. by taking into account the relevant studies as well as benefiting
from specialist’s opinions are chosen. Then the influential structure of these factors with usage
of interpretive structural modeling method is drawn. The obtained results show that
management of equities and human resources, are the most influential factors on providing
sustainable banking resources.
Keywords: Sustainable Banking Resources, Equity & Asset Management, Interpretive Structural Modeling
JEL: E50
UDK: 005.336.1:336.71
005.52:330.14
COBISS.SR-ID 253493516
Introduction
The extremely heavy responsibility of banking system on economy based on market is not
hidden from the public eye and is continuously one of the important parts of country’s economy
which directly impacts on the growth or depression of economic structure with its activity.
Because the available assets in banks are the main resources for purchasing products and
services, also given loans are the resources for creating credit for all of the economic units such
as families, jobs, companies, and government. Therefore, banks’ better activities and usage of
practical marketing tools for the purpose of fulfilling their goals such as return on the assets and
equipping the same will have an impact on different economic activities and generally the
10 Islamic Azad University, Arak Branch, Iran, [email protected] 11 Islamic Azad University, Naragh Branch, Iran, [email protected] 12 Islamic Azad University, Naragh Branch, Iran, [email protected]

Faculty of Business Economics and Entrepreneurship International Review (2017 No.3-4) 35
© Filodiritto Editore – Proceedings
whole of the economic situation (Safaeian & Venus, 2005). In banking system, implementing
the affairs as fast as possible and not wasting any time are considered as the most important
successful elements in banking competition, and customers as the main determining parts of this
competition value the speed and improved technology to a large extent. Banking these days
require innovative methods, effective customer care, providing practical technology and proper
customer requirement fulfillment and services which shows that each bank that is more
successful in these affairs will be also successful in attracting more resources in the competitive
market and consequently permanent durability and therefore more returns (Jafarpour &
Amadeh, 2009). Usually, attracting financial resources are of high priority in banking activities,
because success in this field can be effective on being successful in other fields and areas.
Attracting financial resources in each bank depends on both internal and external affairs,
therefore knowing these factors and the amount of influence that each of them has in order to
succeed in this area is very much fundamental and important. In the whole world nowadays
attracting financial resources is so important and vital to the banks that there has been a creation
of great competition amongst them. A very obvious and main witness to this issue is providing
updated and innovative services for achieving trust and attention of people to invest in banks.
Therefore, in the recent few decades, new grounds are made for attracting more banking
resources and providing better and faster services to the customers. As a result, it’s imperative
that we have a better and more practical use of these resources by investigating different
influential factors on attracting banking resources (Rahnamai et al., 2012). The implemented
surveys show that banks invest their own investments on buildings and skyscrapers as well as
commercial and luxury complexes via their own established companies that act as brokers and
middle companies. In the other words, they act by choice in housing sector and transfer part of
their investment to the trading sector. International relations between countries have developed
to a large scale that use of one unified word should be taken into account as a world Stock
Exchange for the whole exchanges around the world. These worldwide markets are webbed
together and are affected by each other. It’s obvious that the country that has more flexible and
logical rules and regulations in terms of foreign investment has better chance and attraction for
a foreign investor. Development of sustainable banking resources with consideration of the
main role of the banks on economic expansion has a special importance. Banks play a key role
in decreasing inflation, economic expansion with usage of providing financial and credential
aids, playing the middle role in communicating amongst economic agencies both internal and
foreign, exit from depression by expanding small and middle-sized agencies and other issues.
As a result, in order to expand sustainable banking resources, there is a need to identify the
influential factors on it to plan and improve these factors and provoke them so to achieve better
sustainable banking resources. Considering the time, ability, and expenses of each organ, it
cannot be expected that managers and system planners can have all of the influential factors
under control at the same time. In any case there are a lot of limitations that managers of
organizations face. Considering the recent changes in banking system, the bank of City Bank
has drawn the attention of high experts and managers by using the resource attracting approach
as well as making the benefit of competition in this bank, because attracting banking resources
results in partnership of the bank in different areas of manufacturing, industrial, agricultural and
else and this issue will result in expansion of the bank as well as profit making and also making
the benefit of competition. Therefore, the purpose of this research is to identify the influential
factors on attracting sustainable resources at City Bank branches and then providing the
effective module of these factors in order to improve the decision-making conditions of the
managers of the bank by using the interpretive structural modeling method.
36 Faculty of Business Economics and Entrepreneurship International Review (2017 No.3-4)
© Filodiritto Editore – Proceedings
Literature review
Concepts & theories
Banking system
Monetary and banking system together count as one of the main pillars of governmental
interference in economic affairs because of its role in determining monetary issues on economy
and importance of banking organizations in managing the amounts. Monetary and banking
pillars along with budget and planning pillars provide an important economic power in the
possession of government, which in accordance to the government nature; can influence the
society’s whole economy. Money as a tool for evaluating the value of commodity and services,
a tool for payments, trading as well as being a tool for saving and accumulating the values is
counted as an important tool for economy development (Masoud & Ashraf, 2012).
Sustainable Banking Resources
In a not very far past the major part of banks’ earnings were made as a result of paid
facilitations but in the past recent years more than 50 percent of European countries as well as
USA’s income of the banks were made from banking services and fees. Banks have been able
to reduce their earnings’ dependency on interest rates which comes along with high levels of
fluctuations by, successfully using this method and on the other hand reduced interest rates on
facilitations and also reduced gap between receiving and paying interest rates or marginal
profits to less than 2 percent. These days most of the services such as money transfer, getting
money out of ATM machines, cheque deposit and foreign exchange services are subject to
banking fees. This change is also favored and satisfactory by bank customers because even if
investing in banks is less than a certain number then is subject to fees and for those who seldom
use cheque as a payment method have less cost. Instead they get paid the profit for current
investment. Consequently, banks for the purpose of expanding their activities look for long
lasting resources for themselves in order to benefit from competition advantages. Meaning that
like interest-free investment which was once a suitable resource for banking activities and now
is neither suitable nor sustainable, banks should take other measures and changes into account
for attracting resources (Masoud & Ashraf, 2012). In the following there will be more
explanation on each sustainable banking resource.
Equity Management
Equity management is referred to a collection of system and methodical process for keeping,
using, and expansion of bank equity. Management of equity – debt is an effort to match equities
and debts in relevance to credits and their sensitivity towards the interest rates and
fundamentally risks of liquidity and interest rates that are resulted from this non-compliance of
the two. In this framework generally, there will be a combination of engineering methods with
experience and theoretical economy with completion of which there will be a creation of a tool
that will be used in harmony and with logical process for future decisions. In the other words,
equity management specifies a framework for designing and delivering long or short-term plans
of a group. Simply the aim of this act is to increase benefits and profits of a group in order to
advance its defined purposes on the basis of available facilities and resources.
This method combines the economic evaluation on the levels of projects’ investment
management, network and systematic. Achieved information of this method helps the decision
making in future profitable investments of the group (Karimzadeh, 2013).

Faculty of Business Economics and Entrepreneurship International Review (2017 No.3-4) 37
© Filodiritto Editore – Proceedings
Human resources
Expansion of human resources in a bank means creation of ideas and thoughts by the
employees of that organization and the new meaning of it requires the employees to equip with
qualities and skills in banks so that they can provide their abilities, energy, expertise and their
thought for the purpose of fulfilling organizations mission with total enthusiasm and continually
creating new values of both intellectual and qualitative.
In new concept, human resource development in banks has the following components;
• Creating scientific awareness and increasing the knowledge of employees.
• Producing scientific and balanced behavior in employees.
• Creating added value as a quality in employees.
• Increasing abilities in employees.
• Development of skill of implementing jobs.
• Updating employee information.
• Ability to solve in a scientific way.
• Correct way of implementing jobs.
• Rational decision making.
• Harmonic character growth in employees.
• Ability to combine information and creating new groups (Davami & Haghighi, 2012),
(Khodadadi et al., 2011).
Equity Quality
Since banks have to make decisions for the purpose of allocating the investments made
available at their disposal, the decision forms their level of credit risk and exceptions.
Therefore, with criteria such as checking the banks equity quality which include loans and
bonds of the banks we can achieve a dimension of these aimed assessments. With consideration
of the equity quality importance, presentation of the following categories which are also the
categories of United States’ bank equity can be provided;
• Capacity; Loaners ability of payment.
• Deposit; Equity quality of the loan bankroll.
• Conditions: Situation and conditions on which the necessity for loan is created.
• Asset: Difference between equity value of the loaners and their debts.
• Nature: Tendency of the loaners to repay the loans, which are evaluated on the basis of
their previous payments of loans and credit. (Paltayian et al., 2012).
Financial Risks
Financial risks can affect credit and value of the banks to a large scale. For the purpose of
decreasing the financial risks, banks should use modern methods of managing financial risks
(Mirtabar Darzi, 2011).
Operational Productivity
Operational productivity of banks is possible via operational budget allocating,
improvement of working methods as well as internal procedures. Also, one of the most
important duties of organizations high management and human resources is to determine the
duties of each section for the purpose of getting to the main aim of the organization. In
determination of these duties, the position of the organization and human resources and the
process of each of these units and the sub-sectors of the organization are specified and the
design of the strategic plan is drawn. With usage of the strategic plan drawing, the possibility to
check and prioritizing the strategic aims with each other, duties of each employee, obstacles,

38 Faculty of Business Economics and Entrepreneurship International Review (2017 No.3-4)
© Filodiritto Editore – Proceedings
evaluation and measure as well as feedback of the mentioned process can be prepared (Masoud
& Ashraf, 2012).
Equity Amount
The amount of equity in increasing assets and successful implementation of bank’s plans has
a direct effect. For this purpose, the bank should try to increase the foreign and internal equities
(Davami & Haghighi, 2012).
Asset Amount
The experts believe that one of the necessary conditions for a healthy performance and
guarantee on sustainable operations of banks or credit institutions is having appropriate assets.
Asset provides the possibility to the bank to be properly protected and covered when faced
with possible and unpredicted losses and also protect the investors in case of possible losses and
consequently increase the public trust towards the bank (Karimzadeh, 2013).
Although in accordance to the beliefs of banking system activists, banks increase of assets
will result in improvement of working and trading environment as well as economic conditions,
also will strengthen the manufacturing and industrial sectors of the country and will increase the
production and decrease unemployment along with it, but it seems in conditions that any
increase of assets that result in irregular fluctuation rates, compensation of liquidity shortage of
banks are more logical with consideration of the following ways. (Karimzadeh, 2013).
Liquidity
Nowadays, liquidity management is one of the biggest challenges that the banking system is
facing. The main reason for this challenge is that majority of banking resources are provided
from short term deposits. Additionally, vested facilitations of banks are spent on investing in
equities that have lower degree of liquiditation. For better and right management of liquidity,
it’s imperative that proper tools and effective factors for this purpose are rightfully identified.
One of the most important influential factors on bank’s liquidity is the equity position and
bank’s debts. On the other hand, management of equity-debt is one of the key factors in
expressing the financial stability of banking and economy (Kamarolzaman & Madun, 2013).
Deposits
Increase in bank deposits can result in increase of banks equities. There are many solutions
for increasing bank deposits which include effective advertising, providing financial aids,
leisure services and from distance, providing modern and new banking services (Davami &
Haghighi, 2012).
Absorbing Rate of Financial Losses
Absorbing financial losses will give the assurance to the customers and account owners so
that in case the financial risks occur, the possibility of absorbing these losses by banks is
available. The increase of absorbing rate of financial losses via substitute investments and
advertisement of the same in order to increase the banking deposits can be beneficial (Masoud
& Ashraf, 2012).

Faculty of Business Economics and Entrepreneurship International Review (2017 No.3-4) 39
© Filodiritto Editore – Proceedings
Table 1. Sustainable Banking Resources
Identified Factors Resource
Financial Risks Mirtabar Darzi, 2011; Masoud & Ashraf, 2012
Equity Amount Davami & Haghighi, 2012; Masoud & Ashraf, 2012
Absorbing Rate of Financial
Losses Masoud & Ashraf, 2012; Karimzadeh, 2013
Asset Amount Masoud & Ashraf, 2012; Karimzadeh, 2013
Operational Productivity Masoud & Ashraf, 2012; Karimzadeh, 2013
Equity Quality Masoud & Ashraf, 2012; Karimzadeh, 2013
Management of Equities Masoud & Ashraf, 2012; Karimzadeh, 2013
Liquidity Masoud & Ashraf, 2012; Kamarulzaman & Madun, 2013
Deposits Davami & Haghighi, 2012; Masoud & Ashraf, 2012
Human resources Khodadai et al., 2011; Davami & Haghighi, 2012; Masoud & Ashraf,
2012
Research Background
Karimzadeh (2013) in an article “Surveying the influential factors on plenishing banking
resources from the Bank Refah branches of Isfahan managerial point of view” expressed that
this study will consider the effective factors on providing resources on the basis of importance
and priority at branches of Refah Banks of Isfahan. The achieved results of this research
indicated that all of the five considered factors in research were effective in plenishing
resources at Refah bank branches were more than medium limit. Service, communication and
human resource factors, physical factors, financial factors and organizations dependency factors
respectively were the influential factors for attracting resources.
Rahnamai et al., (2012) in an article called “Surveying the influential factors on plenishing
banking resources from the Bank Melli branches of Mazandaran province managerial point of
view” expressed that this study will consider the effective factors on providing resources on the
basis of importance and priority at branches of Melli Bank at Mazandaran province branches.
The achieved results of this research indicated that all of the five considered factors in
research were effective in plenishing resources at Melli bank branches more than medium.
Masoud & Ashraf (2012) in their study concentrated on the effective factors on profitability
in Islamic banks. They expressed that some of the effective sources on creating sustainable
banking resources are financial risks, equity amount, absorbing rate of financial losses, amount
of assets, operational productivity, equity quality, management of equities, liquidity, deposits
and human resources. They also surveyed the Marco-economic components such as monetary
politics, liquidity, etc. and their effect on Islamic banks’ profit making. Results of their research
pointed to the effect of mentioned sources on creating sustainable banking resources.
Research Method
In this research for the reason and nature of the subject and in compliance with research
predictions, the use of expressional-geodesic research method is taken into account.
Considering that one of the aims of the research is to use the found results for solving the
current subject issues in banking industry, then this is an applicable research and on the other
hand has a fieldwork nature, meaning that major part of information is gathered by managers
and experts in a form of questionnaire. Therefore, it can be summed up that the method of this
research is of an expressional-geodesic and positioned in framework of applicable research.
Expert Population
For the purpose of determining the level and prioritizing the identified factors, there has
been usage of expert opinions of 25 of the professionals and specialists in the field of banking
and financing and also university professors. Because of the limitations in expert population,
40 Faculty of Business Economics and Entrepreneurship International Review (2017 No.3-4)
© Filodiritto Editore – Proceedings
the usage of all the expert opinions was considered and in fact there was no sampling. The
experts of this group include 18 men and 7 women, whom are actively working with positions
at Tehran university science board and the authorities of City Bank of Qom. Amongst them, 6
have PhD in different fields, 13 have Master Degree and other have University Degree and with
high levels of experience in banking services.
Method and Tool for Collecting Information and Data
In order to collect and analyze data and information of this research, there’s been usage of
various methods and tools which in the following will be divided in relevance to different needs
of the research model.
Library studies to identify the effective factors on sustainable banking resources.
The interpretive structural modeling questionnaire for the purpose of checking the
effectiveness level of each factor. This questionnaire is special for interpretive structural
modeling method that in the following will be looking at its design method. In this
questionnaire, coupling comparison between 2 variables or factors will be specified and the
method of their effect on the basis of 4 possible forms will be determined (Azar et al., 2013).
Analysis of Data
For the purpose of dividing and analyzing the gathered data, the usage of interpretive
structural modeling (ISM) is taken into consideration for which we will continue to provide the
method in the following:
Firstly, the main effective factors on creating sustainable banking resources at City Bank
branches in Qom which are extracted from articles, studies, and examination of expert opinions.
Then by using the matrix questionnaire of interpretive structural technique which will be
spread amongst experts, coupling comparison between each couple factors will be done and
eventually by using this technique sequence and also leveling of these factors to be done. In the
end also by using division and analysis (MICMAC) the power of guiding and dependency of
the factors will be checked.
ISM technique and achieving the internal relations and priority of elements in a system
should be process covered. Primary stages and general framework of this work is in accordance
to the picture. Now with using this picture and checking the subject literature in this regard, we
can name the stages of implementing the ISM technique as follows (Azar et al., 2013).
Entering Variables
Interpretive structural modeling starts by identifying the variables that are related to the
subject matter. In the present research we are looking to find the relation between the effective
factors on creating sustainable banking resources at City Bank branches in Qom by using the
interpretive structural modeling, therefore the first step should be to identify these factors via
subject literature.
Achieving Internal Relations of Matrix Structure
This matrix is a matrix with variable dimensions, variables of which will be expressed
respectively on the first row and column. Then relations between coupling variables will be
specified with symbols. To determine the type of relations we can use the expert opinions
whom can be managers or experts of the considered industry. The general picture of this matrix
is as the following:

Faculty of Business Economics and Entrepreneurship International Review (2017 No.3-4) 41
© Filodiritto Editore – Proceedings
M ... 2 1 Variables
1
2
...
M
To determine the type of relation the following symbols can be used;
V: Variable i (Row) helps to reach to variable j (Column).
A: Variable j (Row) helps to reach to variable i (Column).
X: Variables i & j help to reach each other (Two-way relations).
O: Variables i & j have no relations with each other.
Achieving Accessing Matrix
By converting symbols of matrix relation (SSIM) to numbers of zero and one considering
the following rules, accessing matrix can be reached. These regulations are as follows:
A) If square (i, j) in matrix (SSIM) got V symbol then related square in accessing matrix
will get number 1 and the opposite square of it (j, i) will get the number 0.
B) If square (i, j) in matrix (SSIM) got A symbol then related square in accessing matrix
will get number 0 and the opposite square of it (j, i) will get the number 1.
C) If square (i, j) in matrix (SSIM) got X symbol then related square in accessing matrix
will get number 1 and the opposite square of it (j, i) will get the number 1.
D) If square (i, j) in matrix (SSIM) got O symbol then related square in accessing matrix
will get number 0 and the opposite square of it (j, i) will get the number 0.
Adjusting Accessing Matrix
After the first accessing matrix is achieved then the internal adjustment should be
established. For example, if variable 1 results in variable 2 and variable 2 results in variable 3
then variable 1 should result in variable 3 and if such situation was not established in accessing
matrix then the corrected matrix and the missed relations should be substituted.
Determination of Level and Priority of Variables
In order to determine the level and priority of variables, collection of accessibles and
collection of pre-requirements for each variable will be determined. Accessible collection of
each variable consists of variables which can be reached via this variable and pre-requirement
collection consists of variables via which can reach this variable. This act can be done by using
accessing matrix. After determination of accessible collection and pre-requirement for each
variable, the joint elements of both collections for each variable will be identified. The result of
this action will be as the following table:
Elements Accessing Collection Pre-Requirement Collection Overlapping elements Level
1
2
…
N
After determining collections of accessing and pre-requirement and joint elements, it is time
to determine the level of variables (Elements). In the first table, the variable has the highest
level that it’s accessing collection and joint elements are equal. After determination of this
variable or variables, they will be eliminated from the table and with the rest of the variables we
will form another table. In the second table also like the first table we will specify the second

42 Faculty of Business Economics and Entrepreneurship International Review (2017 No.3-4)
© Filodiritto Editore – Proceedings
level variable and we will continue these actions until the level of all the variables are
determined.
Diagram Drawing
After determining levels of variables, its time to draw the diagram of relations and levels of
variables. Primarily on this basis of variable levels, we will draw them on the basis of priority
and from top to bottom on circles and then on the basis of compatible accessible matrix, the
relations between variables and the pointing line will be specified.
Division & Analysis (MICMAC)
This model will address the variables analysis on the basis of their influential power and
dependency. Thus, the amount of power will be placed on the horizontal diagram and the
amount of dependency will be placed on the vertical diagram and the amount of power and
influential dependency appear on the diagram like coordinates (Azar et al., 2013). Then on the
basis of influential power and dependency, 4 areas will be made on diagram. The place where
both effect and dependency are low, the place where both effect and dependency are high, the
place that effect is low but dependency is high, and eventually the place where effect is high
and dependency is low. Therefore, each variable is placed in one area and on the basis, that,
where in which area it’s present, a different approach should be made on that variable. The first
group consists of autonomous variables (Area 1) which have weak power of influence and
dependency. These variables to some extent are separate from other variables and have lesser
relations. The second group consists of dependent variables (Area 2) which have weaker
influential power but high levels of dependency. The third group is the linked variables which
have high levels of influential power and dependency. In fact, any action on these variables will
result in changes on the other variables. The fourth group is the independents (Area 4). These
variables have high levels of influential power and low dependency. The variables that have
high levels of influential power are expressly called Key Variables. It is obvious that these
variables are placed in either groups of independent variables or linked. By adding the inputs of
“1” on each row and column, the influential power and the amount of dependency will be
achieved. On this basis the diagram of influential power-dependency is drawn (Azar et al.,
2013).
Research Findings
After the 10 fundamental effective factors on development of sustainable banking resources
were identified, the interpretive structural modeling questionnaire was handed to experts and
they were requested to specify the relation between these factors. In accordance to experts’
definition and for specifying the relation between them, four options were made available to
them. First was that the factor A will have an effect on factor B. Second was that the factor B
would have an effect on factor A. Thirdly was that both factors would have an effect on each
other and fourthly was that there was no relation between the two factors. A request was made
to each expert to compare factors by coupling. If the row factor is a pre-requirement for column
factor and this relation is shown by V. If the column factor is a pre-requirement for row factor
and this relation is shown by A. If both factors need each other, this relation would be shown by
X and if they don’t need each other than the relation would be shown by O. Experts then
considering their knowledge and experience specified the relations between the influential
factors on creating development of sustainable banking resources.
Faculty of Business Economics and Entrepreneurship International Review (2017 No.3-4) 43
© Filodiritto Editore – Proceedings
Results of Opinion Polling from Experts on Variable Relations
After collecting all of the questionnaires, expert opinions were gathered. Totality of
opinions was done on the grounds of frequency. For this reason, the numbers of 1 to 4 were
given to each of the 4 relations. Number 1 related to the one without relation (O). Number 2
relates to mutual needs and joint relations (X). Number 3 related to the relation of column to
row (A) and number 4 related to the relation of row and column (V). Then averaging was done.
If the resulted number was between 1 and 2 without relation, between 2 and 3 mutual needs,
between 3 and 4 relations of column on row, and when between 4 and 5 then relation of row on
column was considered. Eventually, result of opinions was calculated which is shown on the
table 2.
Forming the Primary and Final Accessing Matrix
In accordance to provided explanations, in table 3 the relation between 1 and 6 is specified
by V. V means that row is a pre-requirement of column. Meaning that factor number 1 is a pre-
requirement to factor number 6 and effects on it. For this purpose, in the eighth square of first
row the number 1 and on the first square of sixth row the number 0 are placed. Also, relation
between 1 and 9 is specified by letter O, meaning that there is no relation between the two
factors and none are the pre-requirements of the other. Therefore, the number 0 should be
placed in the ninth square of first row and first square of ninth row. In the following table all of
the specified relations are entered by number.
After the primary matrix is achieved, its internal compatibility should be maintained. For
example, if variable 1 results in variable 2 and variable 2 results is variable 3 then its imperative
that variable 1 results in variable 3 and if in the final accessing matrix of this relation was not
maintained, then the corrected matrix and the missed relations should be substituted. In the final
matrix the amendments are shown by 1*. 1 is pre-requirement of 4 and 4 is pre-requirement of
6. So therefore 1 should surely be pre-requirement to 6. However, in the previous table and in
the sixth square of first row number 0 is inserted. In the next table this relation is amended.
Meaning that instead of number 0, number 1* is inserted. This relation is calculated for all
of the factors separately and anywhere there was a need for correction, this amendment was
done manually by hand (table 4).

44 Faculty of Business Economics and Entrepreneurship International Review (2017 No.3-4)
© Filodiritto Editore – Proceedings
Table 2. Result of Opinion Poll on Variables Relations
10 9 8 7 6 5 4 3 2 1
1 O V V A A V V V V
2 V V V A O A V O
3 O V X A A A A
4 V V V A V O
5 A V V A V
6 O V V A
7 A V V
8 O X
9 O
10
Table 3. Formation of the Accessing Matrix
1 2 3 4 5 6 7 8 9 10
1 1 1 1 1 1 0 0 1 1 0
2 0 1 0 1 0 0 0 1 1 1
3 0 0 1 0 0 0 0 1 1 0
4 0 0 1 1 0 1 0 1 1 1
5 0 1 1 0 1 1 0 1 1 0
6 1 0 1 0 0 1 0 1 1 0
7 1 1 1 1 1 1 1 1 1 0
8 0 0 1 0 0 0 0 1 1 0
9 0 0 0 0 0 0 0 1 1 0
10 0 0 0 0 1 0 1 0 0 1
Table 4. Formation of Final Accessing Matrix
1 2 3 4 5 6 7 8 9 10 Penetration
1 1 1 1 1 1 *1 0 1 1 *1 9
2 0 1 *1 1 0 *1 0 1 1 1 7
3 0 0 1 0 0 0 0 1 1 0 3
4 *1 0 1 1 *1 1 *1 1 1 1 9
5 *1 1 1 *1 1 1 0 1 1 *1 9
6 1 *1 1 *1 *1 1 0 1 1 0 8
7 1 1 1 1 1 1 1 1 1 *1 10
8 0 0 1 0 0 0 0 1 1 0 3
9 0 0 *1 0 0 0 0 1 1 0 3
10 *1 *1 *1 *1 1 *1 1 *1 *1 1 10
Dependence 6 6 10 7 6 7 3 10 10 6

Faculty of Business Economics and Entrepreneurship International Review (2017 No.3-4) 45
© Filodiritto Editore – Proceedings
Drawing Model and Diagram
After determination of levels and assignment of influential factors, the final research model
is drawn as below.
Fig. 1. Final five-dimensional model of influential factors on creating development of sustainable banking
resources
MICMAC Diagram
The aim of analyzing MICMAC is to recognize and analyze the influential power and
dependency between factors. Factors are divided into 4 categories depending on their influential
power and dependency. The first category includes independent factors which have weak
influential power and dependency. These factors are rather un-attached to the system and have
weak and low relations with the system. Dependant factors are the second category which have
low influential power but high dependency. Third category is the attached factors which have
high influential power as well as dependency. These factors are unsustainable because any
alteration in them can affect the system and in the end outcome of the system can also change
these factors again. Fourth category includes independent factors which have strong influential
power but weak dependency.
After the 6-surfaced model is defined, the diagram of influential power-dependency is
drawn as per figure 2.
Equity Quality Operational Productivity Financial Risks
Equity Amount
Asset Amount
Liquidity
Human resources
Management of Equities
Absorbing Rate of Financial
Losses
Deposits

46 Faculty of Business Economics and Entrepreneurship International Review (2017 No.3-4)
© Filodiritto Editore – Proceedings
Description of areas in diagram
1. Autonomous Zone
Criteria that possess weak influential power and dependency. These variables almost detach
from the model, because they have weak connections to the model. Amongst the surveyed
factors, there is no factor placed in this area.
2. Dependent Zone
These are variables which have weak influential power but strong dependency. These
dimensions in general consist of factors for creation of which, a lot of factors are interfered and
they themselves can seldom pave grounds for other variables.
Liquidity, deposits, and the absorbing rate of financial losses are placed in this area. These
three factors are also placed at the lowest level of effectiveness. Meaning that there are a lot of
factors priory required for occurrence of these three factors and these factors themselves have
less effect on the other factors.
Fig. 2. MICMAC Diagram
3. Linkage Zone
Variables that have high influential power and dependency are placed in this area. Variables
that are put in this area are not sustainable. Any change that is done on them, both on them and
other variables has direct affect. Most of the factors meaning 6 factors are placed in this area.
By looking at this model can understand that these factors are placed in the middle of the
model. The available factors on these levels can both be affected or influenced. Both the
previous level of factors are pre-requirements to this level as well as these factors themselves
that are pre-requirements for occurrence of next level. Therefore, the influential power on the
next levels and dependency on previous levels in these factors are high. Of course, the human
resources factor is also amongst them which is placed on the first level of model and its
influence is equal to 10 but its dependency is also equal to 6.
4. Independent Zone
Factors that have high influential power but low dependency are placed in this area. These
factors along with linked factors are key variables that form the foundation of the model and for
the system to start working these issues have to be paid attention to in the first place (Attri et
al., 2013). The equity management factor is the only one in this area. The factor that is present
on the first level and is also a pre-requirement for occurrence of other factors. This factor has
Independent
Zone
Autonomous
Zone
Dependent
Zone
Linkage Zone
Penetration
De
pen
den
ce
Faculty of Business Economics and Entrepreneurship International Review (2017 No.3-4) 47
© Filodiritto Editore – Proceedings
the highest influential power amongst other factors and should be considered as the most
important factor in the model, occurrence of which can have high affect in occurrence of other
factors.
Conclusions and Discussions
Development of sustainable banking resources has special importance considering the key
role of banks in expansion of economy. Banks also play and have a key role in reduction of
inflation, economy development with usage of providing financial and credential aids, middle
party role or brokers in establishing communication with domestic and foreign economic
agencies, exit from depression by development of small and middle-sized agencies and other
issues. Thus, in order to develop sustainable banking resources, it is necessary to identify the
effective factors on it so by planning to improve those factors and provoking them, improved
sustainable banking factors can be achieved. Considering time, ability, and expenses of each
organization, we cannot expect that managers and planners at the same time control all the
influential factors. In any case there are many limitations that the managers of organizations
face. For this purpose, a list of most important and influential factors was identified so the
manager by holding this list can plan for the most important an influential factor and therefore
with consideration of available limits in the system, can achieve the best result. In this respect
and for better understanding of what factors have explanation effects on creation of sustainable
banking resources and how their relations to each other are, different studies were done and
benefits were achieved from opinions of experts and specialists. Also, a 5-surfaced model was
drawn which gave the possibility to the bank managers to amongst the surveyed and checked
factors, they identify the most effective factors and in order to improve their condition, they
employ some applications. Also in continuation some of the researched practical suggestions
were given to managers and authorities;
For the purpose of improving equity management in banks, system of equity management
can be used.
Steps of establishment and exploitation of the equity management system include:
1-Production of base for data and information of equities:
Before managing the equities, there is a need for awareness of all of the related information
on equities.
2-Prioritization of equities;
Since normally the budget of an equity management system is limited, equities should be
specified with consideration of their exploiting importance and storing, then and in accordance
to that priority of source allocation.
3-Developmentof equity management plan;
In development of equity management plan, the annual storing expenditure of equities will
be estimated.
4-Implementation of equity management plan;
After development of equity management plan, the equity management plan should be
exploited and implemented in a processing form and by using database and information of
equities and the required technology.
5-Review and revision in equity management plan;
While exploiting the equity management system, the operation and possible faults of the
system will be observed and new information will be emerged which can be used for
improvement of the system operation.
Solutions for development of human resources in banks:
• Educating Personnel:
Continuous training and benefiting from participation of individuals in organization has
direct connection with training and flourishing the talents of personnel and can play a general
role in expansion of human resources. Using different methods of training like training while

48 Faculty of Business Economics and Entrepreneurship International Review (2017 No.3-4)
© Filodiritto Editore – Proceedings
working, distance training, participation in educational courses, seminars and conferences,
using educational packages and else all can be effective.
• Use of Information Technology (IT):
These days providing the necessary knowledge, altering and directing the same in human
resources with usage of IT is being done simply and develops personnel of an organization and
society in different dimensions.
Quality of equities in a bank had direct relations with their financial operations.
Facilitation’s value depends on the value of collaterals’ liquidity, whereas the value of
investments depends on the market value. It is expected from the bank to use sustainable equity
in its portfolio and consider time managed plan in order to reduce the value of its equities and
appropriate development to compensate its value.
Modern methods of managing financial risks are identified as 4 risks:
• Market Risks (Profit Amount, Shares, and Commodity Prices & …).
• Credential Risks (Repayment of Loans, Profit Fluctuations).
• Operational Risks (Office Corruption, System Dis-functionality & …).
• Tenure Risks (Rules & Regulations).
Considering each one of created categories and bank situation, the risks will be identified
and the management of financial risks will be directed in a way of solving them. This issue is
fortified by bank consultants.
Methods of compensating bank’s liquidity.
1. Fast application of banks to sell their fixed assets and allocating these assets and
equities in production of country.
2. Retrieval of delayed lending, specially the large amount of it which is blocked by the
hands of profiteers.
3. Necessity to amend structures in the process of decision making for allocation of loans
and granting aids and facilities to production sector in line with regulations of retrieval
of delayed lending.
Increase of bank deposits can result in increase of bank equities. There are different
solutions for increasing bank deposits such as effective advertisement, providing financial aids,
leisure services, and from distance, providing modern banking etc.
Increase of absorbing rate of financial losses by investment substitution and advertising the
same to increase the amount of bank deposits can be very much beneficial.
REFERENCES
1. Attri, R., Dev, N., Sharma, V. (2013). Interpretive structural modelling (ISM) approach: an
overview. Research Journal of Management Sciences, 2(2), 3-8.
2. Azar, A., Khosravani, F., Jalali, R. (2013). Soft OR: Problem Structuring Methods, Industrial
Management Publication Co., 1st edition, Tehran.
3. Davami, F., Haghighi, M. (2012). A model to improve electronic banking services through
improved resources in Iran, National Congress of electronics, 2012.
4. Jafarpour, M., Amadeh, H. (2009). Examine the barriers and strategies for the development of
electronic banking in the country’s private banks; Journal of executive management of
Mazandaran University, 9 (2), 131-149.
5. Kamarulzaman, Y., Madun, A. (2013). Marketing Islamic banking products: Malaysian
perspective. Business Strategy Series, 14(2/3), 60-66.
6. Karimzadeh, S., Alimoradi Rizi, M., Habibipour, H. (2013). The factors affecting the banking
Resource Mobilization: A Case Study (Prosperity Bank branches in Isfahan), TMBA Journal, 14
(1), 110-124.
7. Khodadadi V., Taker, R., Zarezadeh Mehrizi, MS. (2010). Effect of Earnings Management on
the relevance of earnings and book value: compared to the long-term and short-term
discretionary accruals, Journal of Financial Accounting.

Faculty of Business Economics and Entrepreneurship International Review (2017 No.3-4) 49
© Filodiritto Editore – Proceedings
8. Masood, O., Ashraf, M. (2012). Bank-specific and macroeconomic profitability determinants of
Islamic banks: The case of different countries. Qualitative Research in Financial Markets,
4(2/3), 255-268.
9. Mirtabar Darzi, A. (2011). Factors affecting the banking non-performing loans: A Case Study of
Bank Sepah Mazandaran Province, Master's thesis, Faculty of Science, University of
Mazandaran.
10. Paltayian, G.N., Georgiou, A.C., Gotzamani, K.D., Andronikidis, A.I. (2012). An integrated
framework to improve quality and competitive positioning within the financial services context.
International Journal of Bank Marketing, 30(7), 527-547.
11. Rahnemai Roodposhti, F., Heybati, F., Talebnia, G.H., Nabavi Chashemi, S.A. (2012). Present a
model of corporate governance mechanisms to measure the impact on Earnings Management,
Journal of Management Accounting, 15 (3) 79-100.
12. Safaeian, M., Venus, D. (2005). Marketing banking services, Negah Danesh Pub Co.
Article history:
• Received 15 July 2017
• Accepted 25 August 2017
50 Faculty of Business Economics and Entrepreneurship International Review (2017 No.3-4)
© Filodiritto Editore – Proceedings
SCIENTIFIC REVIEW
Features of Cash Flow Compared to Profit
KASTRATOVIĆ Edita13, KALIČANIN Milica14,
KALIČANIN Zoran15
Abstract
Taking into account modern business circumstances, it is easy to conclude that money
represents the most significant and the most deficient of goods. One of the most important
conditions for such a situation, among other things, is the irresponsibility of numerous business
organization leaders. Due to a high degree of competitiveness and the globalization of the
modern market, each business segment must be thoroughly planned. The problem of liquidity is
one of the most modern issues that modern economic organizations encounter. The starting
point for solving a large number of organizational-business problems are the financial
statements of the organization, in the forms of a balance sheet, an income statement and a cash
flow statement. The topic of this paper is the presenting of a real economic situation in which a
business organization realizes, at the same time, profit but also negative cash flows. The
necessary and essential roots to address this disparity are the proper planning of operations. It is
necessary to apply some of the basic balance rules of financing that are reflected in the
matching of fund maturity and funding sources. It is necessary to finance short-term funds
exclusively from short-term sources. Otherwise, the liquidity of the organization can be
seriously disrupted.
Keywords: income statement, profit, cash flow, income, expenses, maturity, effectiveness, globalization
JEL: G10
UDK: 657.422
005.52:330.143
COBISS.SR-ID 253496076
Introduction
In modern business conditions, each company has at its disposal a large number of data and
reports. Some are designed to regulate legal obligations, while others are the product of
management information needs used to make management decisions. The cash flow statement
and the income statement represent one of the basic financial statements, the composition of
which is determined by the legal provisions and the International Accounting Standards. Simply
speaking, the cash flow statement represents the inflow and outflow of cash and cash
equivalents. On the other hand, the income statement is a financial statement showing the
income and expenses of a company in order to determine the operating results (realized profit or
loss) over a specific period of time. The content of the profit and loss account, naturally,
consists of revenues and expenditures, with a particular emphasis on their structure.
13 Faculty for Business Economics and Entrepreneurship, Belgrade, Serbia 14 Faculty of business studies and law, University Union – Nikola Tesla, Belgrade, Serbia 15 Faculty of business studies and law, University Union – Nikola Tesla, Belgrade, Serbia

Faculty of Business Economics and Entrepreneurship International Review (2017 No.3-4) 51
© Filodiritto Editore – Proceedings
Apparently, these are similar indicators, but the financial statements have largely different
meanings. Taking into account the fact that the accounting principle applies in economic
conditions and not the collection, there is a certain level of mismatch between the income and
the inflow of money, on the one hand, as well as the expenditure and the cash outflow on the
other.
Income statement
The income statement represents a two-sided review of revenue and expenditure for a
specific accounting period, and most often it relates to one business year. The information that
is the main product of the profit and loss account is a financial result, which may be positive or
negative. A positive financial result, profit or profit arises in a situation where the sum of
revenues is higher than the sum of expenditures of a business organization. A negative financial
result, or loss, arises in the situation where the expenditures are higher than the revenues.
To a large extent, the calculation of the financial result exerts depends on the structure of the
income and expenses that are an integral part of the income statement. Revenues and
expenditures, according to their characteristics, can be as follows, according to Djukić (2005):
1. operating,
2. financial,
3. extraordinary,
4. non-operating.
Operating revenues or expenses represent the exponent of the core business of the
organization. Financial, as their name implies, are the result of operations based on financial
activities. Extraordinary income or expenses are based on factors that are the result of
unforeseen circumstances. Non-operating income or expenses arise from additional and
secondary business activities.
Cash flow statement
A cash flow statement is one of the essential financial statements that presents in detail the
monetary effects derived from operating, the investment and financial activities of a business
organization over a certain period of time. Cash flow information is the basis for internal and
external users for issues related to the ability of businesses to generate cash.
The decisions made by the management on the basis of these reports concern the following,
according to Epstein, Jermakowicz (2007):
1. liquidity,
2. profitability,
3. indebtedness.
Cash flow, in its most significant part, involves liquidity. Liquidity represents the ability of
an organization to settle its obligations in accordance with the maturities. When compiling a
cash flow statement, it is necessary to indicate the sources of the money (which is reflected by
the inflows), and what the money was used for (represented by the outflows). In addition to the
liquidity analysis, the application of cash flow is very intensive when analyzing the
creditworthiness, according to Libby, Libby Daniel (2011). In this case, cash flow projections
are realized, whereupon a prediction of the cash flow movement is carried out in the subsequent
time periods. Also, very often, cash flow multipliers are applied when valuing the company’s
value. The most appropriate way to evaluate the value of the company is to discount future cash
inflows and outflows, i.e. carry out an analysis of the future cash flow of the company and its
reduction to the present value.
From the methodological aspect, there are two ways to create a cash flow statement,
according to Delaney et al., (2003):
1. the indirect method,

52 Faculty of Business Economics and Entrepreneurship International Review (2017 No.3-4)
© Filodiritto Editore – Proceedings
2. the direct method.
The essential difference between these methodological approaches is in the valuation of
cash flow from business activities, while the indicators of financial and investment activities do
not differ. The direct method is stipulated by the law and all companies in Serbia must use the
said method when submitting the final accounts. However, the indirect method has a wide range
of uses in practice for reasons of its simplicity and speed required for compilation. Despite such
characteristics, the cash flow statement has a high degree of information power for the
managerial sector when making management decisions. In order to compile a cash flow
statement based on a direct method, it is necessary to dispose with the following data, according
to Đukić (2005):
1. two successive balance sheets (for the end and the beginning of the observed period),
2. an income statement for the accounting period,
3. other significant data which can be obtained from the main accounts of the
organization.
Applying this method involves adjusting the positions of the profit and loss account to the
changes that have occurred on individual balance sheet positions in two consecutive accounting
periods in order to obtain the appropriate positions in the cash flow statement.
In using the indirect method when compiling a cash flow statement, the starting point is the
net operating result, which is adjusted for the effects of non-cash transactions, i.e. for the
income and expenses that do not lead to inflow and outflow in the accounting period for which
this report is compiled.
Unlike the direct method by which users are informed about the inflow and outflow of cash
from business activities, using the indirect method can explain why the net cash flow from
business activities differs from the other measure of business performance – net profit,
according to Auerbach, Devereux (2013).
The correlation between profit and cash flow
As already noted in the text, accounting records in the economy are based on invoicing. This
practically means that when selling goods, finished goods or services, there are bookkeeping
and income records. Most often, the sale is operatively realized and contracted with different
delivery and payment terms and thus there is a certain discontinuity of flows.
When goods are shipped and invoiced, revenue and receivables are recorded in the income
statement, but if payment is agreed with some future date, there is no cash flow. Only when the
payment is realized is the cash flow recorded in the cash flow report. An identical movement
pattern occurs when recording expenditures or cash outflow.
Both cash flow and the financial result are crucial aspects of business. The cash flow shows
the movement of money, which is essential for the daily and operational management of the
financial operations of the organization. In this way, information about the financial assets used
for payments to suppliers, taxes, employees and the like is obtained. The financial result,
specifically speaking – the profit that is the topic of this paper, reflects the general economic
success of the business and represents the basis for calculating taxes. Taking into account such a
constellation of relationships, the financial image of the company’s business success can take
on paradoxical forms, according to Kimmel, Weygandt, Kieso (2011). In case of a lack of fresh
money despite a positive financial result, a company can end up in bankruptcy, in the extreme
case.
An organization can continuously realize its accounting profits, but profit and money may
be engaged in some other non-cash form, such as receivables. In such a situation, when the
dynamics of collecting receivables and money circulation is initiated, cash flow enters into a
positive segment. Profit loss, in the long run, has a negative impact on the movement of cash
flow. However, what is important to note is that the flow of money can be artificially generated.
In particular, this involves loans and borrowings. In today’s business conditions, money has
become the most deficient of goods. Commercial banks have recognized such movements and

Faculty of Business Economics and Entrepreneurship International Review (2017 No.3-4) 53
© Filodiritto Editore – Proceedings
offer a wide range of possible loans for resolving liquidity issues. Of course, such solutions
have sound economic support only in cases of profit, or the possibility of profit in the balance
sheets of the organization. In addition to cooperating with banks, the company can access fresh
financial assets through a loan from a founder, through the sale of a fixed asset, or the sale of a
claim with a certain discount. Such sources can contribute to the positive flows of monetary
movements, but they do not constitute profit.
From all the mentioned, we can conclude that negative movements concerning cash flows
have a high degree of negative impact on the business organization. One of the main factors that
could influence such activities is the incorrectly designed commercial activities of the
organization. Specifically, this involves inadequately arranged payment terms with customers
and suppliers. Payment deadlines for suppliers are considerably shorter than the time limits for
collecting receivables by customers, and such a dynamic exists with a constant deficit of cash.
Also, an inadequate inventory policy and inventory management process can lead to a large
share of assets in the form of inventory and create a lack of fresh money. Drawing profits
through payments to owners and founders can contribute to creating negative trends in the cash
flow statement.
It is also interesting to mention the issue of the impact of depreciation costs on cash flows,
as well as the correlation between profit and cash flow. One of the more important
characteristics of depreciation costs is that it is a non-monetary expense. Depreciation is a
gradual process of spending fixed assets. For this reason, the cost of depreciation is added to the
inflow of cash from operating activities. The same is true with other non-cash expenses, such as
write-offs.
Taking into account the above facts, it is possible to determine the great importance of the
time determinant of creating cash flows. This results in the importance of activities related to
planning in management and strategic activities related to business.
Cash flow and the financial results of the Coca-Cola Company
The influence of the Coca-Cola brand on literally the whole planet is well known, as well as
the extent to which it impacts the everyday life of an enormous number of people. Table 1
shows the data from the Coca-Cola cash flow statement for 2015 and 2016.
Table 1. Cash flow of the Coca-Cola Company for 2015 and 2016. (mil. $) Cash Flow 2016 2015
Net income 6.527 7.351
Depreciation 1.787 1.970
Correction of net income 680 1.349
Changes in other operative activities 221 157
Cash flow from operative activities 8.796 10.528
Capital expenditure (CAPEX) 2.262 2.553
Investments 1.125 1.752
Other cash flow from investment activities 138 1.881
Cash flow from investment activities 999 6.186
Dividends paid 6.043 5.741
Own shares purchased 2.247 2.319
Net loans 1.666 2.696
Other cash flow from financial activities 79 251
Cash flow from financial activities 6.545 5.113
Effect of changes in foreign exchange rates 6 878
Changes in cash and cash equivalents 1.246 1.649
Source: https://finance.yahoo.com/quote/KO/financials?p=KO
The 2015 analysis is especially specific when observing the results of these two financial
reports. In that year, there was a theoretical discontinuity between profit and cash flows and

54 Faculty of Business Economics and Entrepreneurship International Review (2017 No.3-4)
© Filodiritto Editore – Proceedings
cash equivalents. The profit was $7.351 billion, while the amount of money and cash
equivalents was reduced by $1.499 billion.
The main reason for this is the high degree of capital intensity that was realized in 2015.
Investment activities were at an extremely high level, and a large amount of money was
used to finance investments. Based on investment activities, a net outflow of $6.186 billion was
generated. In order to compare the size, the net outflow of money from investment activities
covered as much as 84% of the net profit realized in the observed year. Observing 2015, the
most significant item of outflow of money from investment activities is the capital expenditure
item (CAPEX). This involved money funds that are in use with the aim of expanding physical
forms of property or fixed assets. With such an investment policy, which is reflected in a high
degree of pro-activity, the Coca-Cola Company created an extremely good basis for the future
implementation of business operations and allowed conditions for the realization of future
profits, which is the basis for generating positive cash flows.
In the following year, 2016, there was a return on investment activity, which can be
interpreted by the fact that a part of the investment began to produce a profit. However, what
was specific is the fact that CAPEX remained almost at the same level. In the annual period
characterized by investment inflows, CAPEX had experienced the relatively low decline of only
11%. This means that Coca-Cola is highly oriented towards the investment business. The
breakdown of investment activity from $6.186 billion in 2015 fell to $999 million in 2016.
Looking at the financial statements of Coca-Cola, it can be ascertained that, taking into
account its core business which in the cash flow statement and in the income statement is
represented through the cash flow from operational activities and the operating profit, it has
achieved extremely successful results. From such a position, the fact that a short-term liquidity
imbalance can successfully be solved by some types of bank loans ensues, i.e. that there are
some objectively healthy conditions for this to occur. If profit from core activities was not
realized, the company would not be able to apply for a liquidity loan.
Taking into account the financial activities, the general tendency is that almost all the most
successful global companies have negative results in this domain. Coca-Cola joins this group,
where it belongs. In 2015, the dividend paid out amounted to $5.741 billion. Also, the company
bought its own shares in the amount of $2,319 billion. And in this way, Coca-Cola again clearly
demonstrates the principles of its business policy that are reflected in its orientation towards
capitalization.
Table 2 shows data on the Coca-Cola income statement for 2015 and 2016.
Table 2. The income statement of Coca-Cola for 2015 and 2016. (mil. $)
Income statement 2016 2015
Total income 41.863 44.294
Cost of sold products 16.465 17.482
Gross income 25.398 26.812
Cost of sales and administration 15.262 16.427
Other operative costs 1.510 1.657
Operative profit 8.626 8.728
Interest income 642 613
Interest expenses 733 856
Dividend income 835 489
Other expenditures 1.234 631
Pre-tax profit 8.136 9.605
Income tax 1.586 2.239
Profit after taxation 6.550 7.366
Payments to minority shareholders 23 15
Net profit 6.527 7.351
Source: https://finance.yahoo.com/quote/KO/financials?p=KO

Faculty of Business Economics and Entrepreneurship International Review (2017 No.3-4) 55
© Filodiritto Editore – Proceedings
Looking at the 2015 cash flow statement, one item is atypical for core business and
operational operations. This involves the effects of foreign exchange rate changes. However,
since this is a company that is, in the fullest sense, a global one, it is subject to the influence of
world movements. The year of 2015 was characterized by an increase in the value of the US
dollar, so there is a high degree of possibility that the depreciation of a number of domicile
currencies have contributed to the outflow of money.
Looking at 2016, we can also notice a significant paradox in the financial statements, from
the aspect of realized profit and cash flow. As far as financial flows are concerned, it can be
established that there has been an improvement in the cash flow. Outflows changed their forms
and were transformed into inflows – $1.649 billion of a negative cash flow in 2015 turned into
$1.246 billion positive. On the other hand, the net profit fell from $7.351 billion to $6.527
billion.
The main factor in the decline in net profits, looking at the 2016 income statement, is the
decline in the total revenue. An analogy can be seen by analyzing the cash flow statement, as
there was decline in inflow from operating activities.
Conclusion
The preparation and concept of company financial statements entails a legal obligation
defined by the normative regulations. In addition to the character of the obligation to be met,
financial statements, if they are created according to certain standards, are some kind of mine of
information. By proper and adequate analysis, it is possible to establish certain bottlenecks and
perform a re-optimization of operations.
One of the important segments is the cash flow statement and the income statement. The
main products of the cash flow statement are information relating to items representing the basis
by which cash inflows and outflows occur. The income statement represents the financial result
of the organization in the form of profit or loss. In contemporary economic circumstances, it is
possible to realize certain paradoxical situations. A large number of companies make a profit,
that is, a positive financial result, but it entails a significant deficit with regard to fresh money.
Taking into account such a fact, it has also happened that financially profitable companies
were brought to the brink of extinction. The main factor in this unnatural situation is the
accounting principle represented in the economy.
The fastest short-term solution to similar problems is reflected in the use of bank loans for
liquidity. Such loans make sense in those cases where the company achieved a positive
financial result from operational activities that relate to the core business of the organization. A
fundamental solution to this problem is reflected in the transformation of the basic postulates of
business, financial and commercial policies. It is necessary to carry out a thorough analysis of
the maturity of the positions of funds and sources of funds and to consider them in a proper
manner. Also, it is extremely important to possess concise information on the state of the
supplies, so as not to have a worst-case engagement of assets and thus create a liquidity risk.
REFERENCES
1. Auerbach, A. J., Devereux, M. P. (2013). “Consumption and cash-flow taxes in an international
setting.” Oxford University Centre for Business Taxation.
2. Delaney, R. P., Nach, R., Epstein, J. B., Weiss Budak, S. (2003). “GAAP: Interpretation and
Application of Generally Accepted Accounting Principles”. John Wiley & Sons Inc.
3. Đukić, T. D. (2005). “Bilans tokova gotovine kao instrument upravljanja likvidnošću
preduzeća”. Ekonomski fakultet Niš.
4. Epstein, B., Jermakowicz, E. (2007). “Interpretation and Application of International Financial
Reporting Standards.” John Wiley & Sons Inc.
5. Kimmel, P. D., Weygandt, J. J., Kieso, D. E. (2011). “Financial accounting,” 6th ed. John Wiley
& Sons Inc.
6. Libby, R., Libby, A. P., Short, D. (2011) “Financial Accounting,” Whitby, 7th ed. McGraw-Hill.

56 Faculty of Business Economics and Entrepreneurship International Review (2017 No.3-4)
© Filodiritto Editore – Proceedings
https://finance.yahoo.com/quote/KO/financials?p=KO
Article history:
• Received 25 October 2017
• Accepted 12 December 2017

Faculty of Business Economics and Entrepreneurship International Review (2017 No.3-4) 57
© Filodiritto Editore – Proceedings
ORIGINAL SCIENTIFIC PAPER
Identifying Productive Leadership Model to Increase
Employees’ Job Motivation
NOBAKHT Mohammad Bagher16, EBRAHIMI Mohamad17,
BABAEE Mohammad Hooshmand18, DAVAR Saeed19
Abstract
Today it is believed that organizations can compete and adopt themselves with situations
when they have employees with ability, obligation, skill and motivation. This is not limited to
organizations but power of nations’ competition will be reached in their human resource.
Improving employees’ motivation is one of the most effective techniques to increase
employees’ productivity and to use their capacity and individual abilities along with
organizational goals.
Among these it is inevitable to count on managers and leaders’ effective role in changing
and fundamental changes in organization. Effective Leadership style is an inseparable part of
creating a training environment for skillful employees. In this article it was assessed kinds of
leadership styles for increasing organizational motivation in management and strategical
planning which is an organization depended on government. Finally, 11 leadership models were
measured according to elites’ vote and by using of fuzzy analysis of TOPSIS and democratic
leadership model was determined as productive leadership model.
Keywords: leadership model, motivation scales, increasing employees’ motivation, TOPSIS fuzzy analysis,
improving organization productivity
JEL: M12
UDK: 005.32:331.101.3
005.961:005.336.1
COBISS.SR-ID 253496844
Introduction
The effective role of managers and leaders in changing and fundamental evolutions in
organization is inevitable. The new theories of leadership open new horizons in executing
organizations and their moves in progression and development path every day and give
essential knowledge managers and leaders for confronting environmental changes and
evolutions (Chapman, 2017). Todays, individual works are decreasing and team works’
importance is increasing. This shapes new management approach which its importance is
evolving day to day. Management and organization theorists believe that it must be provided
essential conditions and foundations in order that employees feel power and efficiency.
16 Strategic research center, Iran, nobakht@csr. ir 17 Shiraz University, Iran 18 University, Science and Research Branch, Iran 19 Faculty of Architecture and Urban Planning, Shahid Beheshti University, Iran
58 Faculty of Business Economics and Entrepreneurship International Review (2017 No.3-4)
© Filodiritto Editore – Proceedings
Organizations, management and employees must have essential readiness (Tamir et al.,
2015).
Leadership style as a behavioral pattern which describes behavioral characteristics of
leaders. In this new world, role of manager as a leader so important that it is being tried hard in
all fields to find persons who have abilities of leadership. Actually, nothing will be happened if
this role isn’t performed. As a duty, leader should examine ability and preference of individual
and group, and choose one od leadership’s style in dealing with them (Wipulanusat,
Panuwatwanich, Stewart, 2017). Leadership style also shows ideology, worldview and
personality of leaders. If this style is not chosen properly, on one hand it will led to organization
and individuals’ productivity and in other hand it will perform as a reason of mental tension
caused by job or mental pressure in employees (Wilson, 2017).
In this study kinds of leadership styles will be assessed from point of view of elites of Iran
planning and management organization where is a strategical organization for determining
governmental organs’ strategy in different provinces.
Review of literatures
Mangers’ leadership style is one of effective factors in increasing productivity, effectiveness
and finally efficiency of organizations. Leaders’ proper behavioral pattern in every organization
cause creating powerful motivation in employees and finally increasing their satisfaction of job
and profession (Shao, Feng, Hu, 2017). By studying previous literature, leadership styles
categorized in table 1. Mentioned codes under each style is used in analysis.
Table 1. Leadership style
Leadership style Explanation
Authoritarian
M1
Authoritarian leadership is executed in organizations which are in serious
crisis and need urgent decision and their processes are routine and non-
specialized. This style is good for military and its advantages are quick
decision making and undeniable power in leadership.
Bureaucratic
M2
This style is useful for organizations that perform academic and exact and
unsafe works and it is serious for them to pay attention to rules and
instructions for doing serious safety. Its advantages are increasing safety
and decreasing risks resulted from functions which are not determined.
Charismatic
M3
This style is useful for organizations which are dissatisfied incuriosity
among their employees. Choosing this style can be useful to make
employees change organization atmosphere with their energy. This style is
proper for organization which need inside change and leader must motivate
others to do their best with making himself as a pattern.
Collaborative
M4
This style is useful in organizations where innovation and collaboration are
the most important factor. This style is proper for non-crisis situations and
its response to crisis situations is negative. It is also useful for organizations
which concentrate on operational improvement. But its disadvantages are
longing decision making and it also does not clear some unproductivity.
Non-interventionism
M5
This style is used for organizations where need self-management methods
and time management is important. It is useful for works which do not need
guidance and we are sure that works will be performed with minimum
errors. If employees do not have enough knowledge, these methods will
have high risks.
People-oriented
M6
This style develops team work. Leader’s look on employees is equal and
strong groups will be formed. The main disadvantage of this style is
forgetting individual responsibilities and this causes employees’ capability
will be neglected.
Servant
M7
This style is useful for educational and service organizations like hospital
and university. Leader is committed to cultural indicators. Commitment,

Faculty of Business Economics and Entrepreneurship International Review (2017 No.3-4) 59
© Filodiritto Editore – Proceedings
Leadership style Explanation
honesty, truthfulness and sympathy are main values in this style. Its
advantage is creating valuable culture, although decision making is so slow.
Task-oriented
M8
This style is focused on work control, tasks and instructions. It is useful for
organizations where dissatisfaction is developed among employees because
of not paying attention to their problems.
Interactive
M9
It is useful for organizations where works are performed as projects and
organizations where need innovations and creativities can’t adopt
themselves with style.
Transformative
M10
This style determines view and clear targets in organization and tries to
attract employees’ collaboration. This happens with a good understanding
of around changes and motivation methods. Leader, with his emotional
intelligence, creates new capability for organization.
Democratic
M11
In this style, leader focuses on thoughts and propositions of group members
to reach group’s target. All the decisions are made on group’s consensus.
Table 2. Motivation theories
Motivation theories Explanation
Content theories These theories describe “being” and “needs”. Theorists are trying to know
and recognize factors which cause human’s motivation.
Process theories
These theories are more cognitive and respond to why questions. These
theories are trying to find mutual action of these variables with dependent
variables like employees’ job satisfaction.
Job satisfaction
theories
These theories determine that people look at different jobs that they can
choose, before choosing their jobs. The choose like this because they are
looking for favorite rewards.
Many scholars have examined kinds of leadership style in organization process area. Among
similar researches which have assessed leadership styles in motivation scales there is table 3.
Table 3. Leadership styles in motivation scales
Example of
researches Kind of test
Binfor et al.,
2013
In this study, the influence of authoritarian, democratic and non-
interventionism styles are assessed. This study which performed in Ghana
showed superior of democratic, non-interventionism and authoritarian on
motivation rate.
Chaudhry, Javed,
2012
This study showed influence of non-interventionism on motivation rate using
questionnaire distribution among 278 persons among elites. The results were
reached with SPSS analysis. These results showed meaningful use of non-
interventionism style in Pakistan weaponry industry.
Barbuto,2005
In this study, influence of interactive, charismatic and exchange on motivation
rate was assessed. It showed the most adoption of transformative style in
comparison with other styles.
Stone, Russell,
Patterson, 2004
In this study, exchange and servant styles were assessed in comparison with
behavioural characteristics and employees’ motivation rate. The results
showed that exchange style is more popular.
Research Methodology
Motivation scales for analysing kinds of leadership style has been evaluated in another study
of this scholar. For examining leadership styles in this article, it has been used 34 main
measures of motivation promotion which was assessed in this research.
In next step, we will examine leadership styles preferences against motivation scales by
using fuzzy TOPSIS analysis method. Using this approach, we can reach a comprehensive
understanding of evolved styles preferences from research literature against success rate in

60 Faculty of Business Economics and Entrepreneurship International Review (2017 No.3-4)
© Filodiritto Editore – Proceedings
promoting employees’ motivation. It has been used coding in MATLAB and EXCELL software
to analyse data and using fuzzy TOPSIS analysis in this step. Scales’s code is decision matrices.
In fuzzy TOPSIS analysis of options which are matrices analysis’s rows which are presented
in table 1.
In next step TOPSIS analysis steps will be presented by using of mathematics equations
constraints.
1 2( , ,..., )nW w w w
In above equation w presents each indicators’ weight.
1 21
11 12 1
2
11 22 1
3
1 1
4
...
...
...
...
nC C C
n
n
m m mn
Ax x x
Ax x x
AD
x x xA
Which in above equation present questioning leadership styles and present questioning
motivation scales for mentioned options. It is important to say that all numbers in above
equation are entered as fuzzy. In following matrix, fuzzy definition of above matrix elements is
presented.
( , , )ij ij ij ijx a b c
According to above equations, matrix elements are in accordance with table 4 and scales
element are defined as fuzzy triangular.
Table 4. Matrix elements
weights 0.2 0.6 0.9 0.6 0.7 0.9 0.6 0.7 0.9 0.3 0.7 0.9 0.1 0.5 0.9 ...
Scales A1 A2 B1 B2 C1 ...
M1 1 4 6 1 3 6 2 4 6 1 4 5 1 4 5 ...
M2 1 4 6 2 4 6 1 4 5 1 4 5 1 5 6 ...
M3 1 4 9 2 6 8 2 6 7 3 4 8 2 6 7 ...
M4 1 5 6 2 4 8 1 5 7 1 4 8 1 4 6 ...
M5 1 4 6 1 5 7 1 4 6 1 4 6 2 5 7 ...
... ... ... ... ... ... ... ... ... ... ... ... ... ... ... ... ...
a-
...
c+ 9 9 9 9 9 9 9 9 9 9 9 9 8 8 8 ...
After making decision matrix as fuzzy type and for solving it in fuzzy TOPSIS method,
firstly matrix numbers of fuzzy decision are normalized by using following normalization
equation.
* * *, ,
ij ij ij
ij
j j j
a b cr
c c c
* maxj ij
ic c
According to above equation, indicators will be scalable in this step. Since evaluated
indicators in previous section are maximum type and by increasing in these indicators’ amount
we are closer to ideal solution, equation 4 is the only defined maximum equation. The example
of normalized decision matrix is presented in table 5.

Faculty of Business Economics and Entrepreneurship International Review (2017 No.3-4) 61
© Filodiritto Editore – Proceedings
Table 5. Normalized decision matrix
Weights 0.2 0.6 0.9 0.6 0.7 0.9 0.6 0.7 0.9 0.3 0.7 0.9 ...
Scales A1 A2 B1 B2 ...
M1 0.11 0.44 0.67 0.11 0.33 0.67 0.22 0.44 0.67 0.11 0.44 0.56 ... M2 0.11 0.44 0.67 0.22 0.44 0.67 0.11 0.44 0.56 0.11 0.440 0.56 ... M3 0.11 0.44 1.00 0.22 0.67 0.89 0.22 0.67 0.78 0.33 0.44 0.89 ... M4 0.11 0.56 0.67 0.22 0.44 0.89 0.11 0.56 0.78 0.11 0.44 0.89 ... M5 0.11 0.44 0.67 0.11 0.56 0.78 0.11 0.44 0.67 0.11 0.44 0.67 ...
... ... ... ... ... ... ... ... ... ... ... ... ... ...
In next step from equation 5, we designate fuzzy weights for scales to normal scalable
matrix in previous step. According to following equation weighted fuzzy matrix will be
concluded as table 6.
.ij ij jr w
Table 6. Weighted fuzzy matrix
In next step and according to Euclidean equations, we compute distances of each element
from ideal and snit-ideal and finally distances matrices from ideal and anti-ideal will be in
tables 7 and 8.
*, 1,2,...,i
i
i i
dCC i m
d d
Table 7. Distances of each element from ideal and snit-ideal
A1 A2 B1 I6 ... J1 J3 J4 DP
M1 0.64849 0.64002 0.58440 0.83789 ... 0.83789 0.83789 0.83789 24.11370
M2 0.64849 0.58440 0.63278 0.80750 ... 0.75373 0.75373 0.78021 22.89919
M3 0.62493 0.51171 0.52139 0.58377 ... 0.55943 0.56518 0.61027 19.42454
M4 0.62759 0.56112 0.57610 0.62634 ... 0.61831 0.61299 0.61299 20.41928
M5 0.64849 0.57610 0.61407 0.63951 ... 0.63951 0.63951 0.63951 20.96298
... ... ... ... ... ... ... ... ... ...
Table 8. Finally, distances matrices from ideal and anti-ideal
A1 A2 B1 I6 ... J1 J3 J4 DN
M1 0.36221 0.32261 0.34090 0.04303 ... 0.06415 0.07172 0.06086 7.81947
M2 0.36221 0.34090 0.28725 0.11349 ... 0.18648 0.18922 0.16997 9.65546
M3 0.52607 0.48381 0.43419 0.49860 ... 0.57682 0.57724 0.53287 17.09472
M4 0.37887 0.44795 0.41026 0.40460 ... 0.48729 0.48796 0.47752 14.62228
M5 0.36221 0.41026 0.33872 0.35329 ... 0.38157 0.38292 0.36952 12.94739
M6 0.49922 0.53368 0.43248 0.40481 ... 0.43400 0.43457 0.42281 16.18653
... ... ... ... ... ... ... ... ... ...
weights 0.2 0.6 0.9 0.6 0.7 0.9 0.6 0.7 0.9 0.3 0.7 0.9 ...
scales A1 A2 B1 B2
M1 0.02 0.27 0.60 0.07 0.23 0.60 0.13 0.31 0.60 0.03 0.31 0.50 ...
M2 0.02 0.27 0.60 0.13 0.31 0.60 0.07 0.31 0.50 0.03 0.31 0.50 ...
M3 0.02 0.27 0.90 0.13 0.47 0.80 0.13 0.47 0.70 0.10 0.31 0.80 ...
M4 0.02 0.33 0.60 0.13 0.31 0.80 0.07 0.39 0.70 0.03 0.31 0.80 ...
M5 0.02 0.27 0.60 0.07 0.39 0.70 0.07 0.31 0.60 0.03 0.31 0.60 ...
... ... ... ... ... ... ... ... ... ... ... ... ... ...

62 Faculty of Business Economics and Entrepreneurship International Review (2017 No.3-4)
© Filodiritto Editore – Proceedings
Conclusion
According to ideal and anti-ideal distances in tables 7 and 8 and with presented coefficient
of proximity in equation 6, leadership styles ranking will be shown in table 9.
Table 9. Leadership styles ranking
Leadership style code Proximity index (CC) Score
Democratic M11 0.4904183 11.23931
Chaurismatic M3 0.4681015 10.727858
Interactive M9 0.4649305 10.655186
People-oriented M6 0.4494461 10.300318
Servant M7 0.4236172 9.7083758
Collaborative M4 0.417284 9.5632329
Transformative M10 0.417284 9.5632329
Non-interventionism M5 0.3818122 8.7502973
Task-oriented M8 0.3090637 7.0830617
Boroucratic M2 0.2965924 6.7972469
Authoritian M1 0.2448699 5.61188
It is clear, with fuzzy TOPSIS analysis, that leadership styles are distributed closer to
selected indicators in previous section with a domain in./25 different from each other.
According to table 9 results, democratic leadership has the most proximity indicator with
promotion of employees’ motivation scales among assessed leadership styles and is
recommended as proposal option in organizations where expect leadership approach grounded
in promoting employees’ motivation. The reason of good adaption of democratic leadership
style with motivation scales is due to leaders’ cooperation to reach a collective agreement for a
common target in organization and at the same time it will be estimated supervision of
organization’s leader on employees’ performance. As it is presented in Table 9, Charismatic
and interactive leadership styles are in second and third places and it may be resulted from
creating motivation among employees with motivation factors using leader charisma in
charismatic leadership, and creating interactive relation with employees in interactive style
which cause leader and employees’ relation exit from organization obligations and increase
interaction between them. The main point in data analysis of elites in this research shows that
non-interventionism leadership, although it has the least intervention of leader in organization’s
processes, has not caused to increase motivation. Its reason is lack of superior supervision on
work progression procedure which cause this style to depend on interaction and expertise and
team morale of employees. According to the results in table 9, we can describe that non-
interventionism leadership style may be effective in organizations where exist the ground for
employees’ ability and capability of reliability among all employees and also organizational
works has a little complexity and only is short time processes, but when there is complexity in
processes and organizational actions, relations and group hierarchy will be confused and
therefore this style won’t have any productivity. Ranking results of leadership style in table 9
shows the leadership styles in which leader’s role is as superior supervision and is a kind of
consular and leader presence of leader validates organization hierarchy, leadership style in
comparison with absolute and non-interventionism leadership will have a proper ground in the
area of increasing employees’ motivation. According to the results of authoritarian leadership
which has absolute leadership has been estimated as the weakest leadership style. Following
cases are proposed for more research in this area to researchers.
1. Prioritizing motivation scales in each of motivation theories area and explaining sub-
scales according to fuzzy hierarchy approach.
2. Evaluating kinds of leadership styles in organizations with complexity and high
process change with fuzzy hierarchy approach.

Faculty of Business Economics and Entrepreneurship International Review (2017 No.3-4) 63
© Filodiritto Editore – Proceedings
3. Assessing kinds of leadership style productivity with data envelopment analysis
technique.
REFERENCES
1. Chapman, C. L. (2017). “The influence of leadership on business continuity planning: A
qualitative phenomenological study”, University of Phoenix. 2. Tamir, M., Bigman, Y. E., Rhodes, E., Salerno, J., Schreier, J. (2015). “An expectancy-value
model of emotion regulation: Implications for motivation, emotional experience, and decision
making”. Emotion, 15(1): p. 90. 3. Wipulanusat, W., Panuwatwanich, K., Stewart, R. A. (2017). “Exploring leadership styles for
innovation: an exploratory factor analysis”. Ekonomia i Zarzadzanie, 9(1): p. 7-17.
4. Wilson, F. M. (2017). “Organizational behaviour and gender”, Routledge. 5. Shao, Z., Feng, Y., Hu, Q. (2017). “Impact of top management leadership styles on ERP
assimilation and the role of organizational learning”. Information & Management.
6. Puni, A., Agyemang, C. B., Asamoah, E. S. (2016). “Leadership Styles, Employee Turnover
Intentions and Counterproductive Work Behaviours”. International Journal of Innovative
Research and Development ISSN 2278–0211, 5 (1.) 7. Schratz, M. (2016). “Austria: Overcoming a Bureaucratic Heritage as a Trigger for Research on
Leadership in Austria”, in A Decade of Research on School Principals. Springer. p. 307-329. 8. Conger, J. A., Kanungo, R. N. (1988). “Charismatic leadership: The elusive factor in
organizational effectiveness”, Jossey-Bass.
9. Bass, B. M., Stogdill, R. M. (1990). “Handbook of leadership”. Vol. 11., New York: Free Press. 10. Chaudhry, A. Q., Javed, H. (2012). “Impact of transactional and laissez faire leadership style on
motivation”. International Journal of Business and Social Science, 3(7). 11. Greenleaf, R. K., Spears, L. C. (2002). “Servant leadership: A journey into the nature of
legitimate power and greatness”, Paulist Press. 12. Kriger, M., Zhovtobryukh, Y. (2016). “The Role of Charismatic, Transformational, and
Transactional Leadership”, in Strategic Leadership for Turbulent Times, Springer. p. 83-92. 13. Dvir, T., Eden, D., Avolio, B. J., Shamir, B. (2015). “The impact of Transformational
Leadership”. 2015. 14. Kane, J., Patapan, H. (2012). “The democratic leader: How democracy defines, empowers and
limits its leaders”. 2012: Oxford University Press. 15. Lehman, D. (2016). “A Case Study Describing How Servant Leadership Attributes Impact
Superintendent Longevity and Leadership Styles”.
16. Barron, K. E., Hulleman, C. S. (2015). “Expectancy-value-cost model of motivation”.
Psychology, 84: p. 261-271. 17. Schunk, D. H., Meece, J. R., Pintrich, P. R. (2012). “Motivation in education: Theory, research,
and applications”, Pearson Higher Ed. 18. Binfor, F., Boateng, S., Abbey, E., Osei, S., Swanzy, F., Gyepi-Garbrah, T. (2013). “The Effect
Of Leadership Styles And Motivation On Employee Performance In Public Institutions:
Evidence From Ghana”. International Journal of Current Research, 5(09): p. 2667-2670. 19. Barbuto, J. E. (2005). “Motivation and transactional, charismatic, and transformational
leadership: A test of antecedents”. Journal of Leadership & Organizational Studies,11(4): p. 26-
40. 20. Stone, G., Russell, R. F., Patterson, K. (2004). “Transformational versus servant leadership: A
difference in leader focus”. Leadership & Organization Development Journal, 25(4): p. 349-361.
Article history:
Received 17 July 2017
Accepted 10 December 2017

64 Faculty of Business Economics and Entrepreneurship International Review (2017 No.3-4)
© Filodiritto Editore – Proceedings
ORIGINAL SCIENTIFIC PAPER
Proclivity for Open Innovation in the Case of
Agricultural and Food Companies in Serbia
ZAKIĆ Nebojša20, BUGARČIĆ Marina21,
MILOVANOVIĆ Marina22
Abstract
The approach to open innovation presents one of the major trends in terms of constant
change and accelerating technological innovation. The given construct proclivity for open
innovation involves measuring technology exploration and technology exploitation involving
different inside-out and outside-in open innovation activities. In this paper, we are researching
the tendency for open innovation on a sample of 102 companies in the agriculture and food
sectors in Serbia. The research has shown that companies in the agro-food sector are inclined to
open innovation, not just those in high-tech industries that are often the subject of innovation
literature. The food sector shows greater proclivity for open innovation in comparison with
agriculture in all elements apart from the question of willingness to sell intellectual property.
The study was limited to Serbia and cross-countries research would allow establishing the
specificities and differences of the proclivity for open innovation in the agro-food sector by
regions.
Keywords: Proclivity for open innovation, Technology exploitation, Technology exploration, Agro-food
sector, Serbia
JEL: O31, M13, L24, L66, Q10
UDK: 005.591.6
005.521:334.72:631.1(497.11)
COBISS.SR-ID 253499148
Introduction
Open innovation as a new paradigm for managing innovation, introduced by Chesbrough
(2003), shortly thereafter developed into a special research area and has become one of the most
current subjects in innovation management (Huizingh 2011). In accordance with Chesbrough et
al., (2006) open innovation is defined as “the use of purposive inflows and outflows of
knowledge to accelerate internal innovation, and expand the markets for external use of
innovation, respectively.” The basic idea behind open innovation is to open up the innovation
process to other organizations (Chesbrough et al., 2006) in order to allow the unimpeded flow
of ideas within and outside the organization and, in this way, bring out the advantage of
exploration of external and exploitation of internal resources (Chesbrough 2003).
20 Faculty of entrepreneurial business, “Union – Nikola Tesla” University, Belgrade, Serbia,
[email protected] 21 Faculty of entrepreneurial business, “Union – Nikola Tesla” University, Belgrade, Serbia,
[email protected] 22 Faculty of entrepreneurial business, “Union – Nikola Tesla” University, Belgrade, Serbia,

Faculty of Business Economics and Entrepreneurship International Review (2017 No.3-4) 65
© Filodiritto Editore – Proceedings
The literature points out that the prospect of open innovation first found its place in
multinational companies and high-technology industries and in situations where the focus is on
emerging technologies (van de Vrande et al., 2009; Herzog 2011). Although Open Innovation
approach started to evolve from the research of high-tech multinationals, Chesbrough and
Crowther (2006) found that firms through a wide range of low technology and mature industries
can also apply open innovation. In addition, the size of the company is not an obstacle for the
implementation of open innovation. According to van de Vrande et al., (2009) open innovations
are relevant and present in business practice in much broader group of small and medium-sized
enterprises. Small companies often lack the resources to develop and commercialize new
products that encourage them to cooperate with other organizations (van de Vrande et al.,
2009). Accordingly, a research base has increased. Hossain (2015) finds out that 61 articles
published between 2003 and 2014 can be found in the relevant scientific databases on the
subject of small businesses and open innovation.
The evidence proving the approach of open innovation spread to agro-industrial sector has
been growing (Sarkar, Costa 2008; Matras-Bolibok, Kiss 2014). Agriculture is becoming more
complex by its nature existing in an environment characterized by rapid global, technological,
market and social changes. Continuous and consistent improvement of technological and
organizational skills, putting a strong emphasis on innovation, which are crucial for the
organization’s sustainability, development and competitive advantage (Pishbin et al., 2015).
According to Matras-Bolibok and Kiss (2014) open systems approach to agricultural
innovation becomes an adequate vehicle for invigorated farmers to explore new options in order
to make their businesses more viable and sustainable.
In the food industry, which is considered to be traditional and low tech, there has been a big
change from the beginning of the 21st century. Innovations in this area are moving towards open
innovation as Acosta et al., (2011) explains by the fact that innovations are initially introduced
in small companies that lack the know-how necessary for commercialization; food industry
does not rely only on its own R & D, but learns and interacts with different participants; and
knowledge useful for companies in the food industry comes from various sectors such as
agriculture, pharmaceuticals, chemical industry, process industry and emergent scientific and
technological fields such as biotechnology.
Agro-industrial sector plays an important role in the economy of Serbia. According to the
Strategy of Agriculture and Rural Development of Serbia for the period 2014-2024 (2014) in
2024, agriculture should be the sector whose development is based on knowledge, modern
technologies and standards, domestic and demanding foreign markets offering innovative
products and manufacturers provide a viable and stable income. Similarly, Strategy and policy
development of the industry of the Republic of Serbia 2011-2020 (2011) predicts the growth of
industrial production, investment, innovation and exports, as well as speeding up the reform
process. If we take into account environmental factors that have a strong influence on
agriculture and food industry of Serbia, such as globalization, the rise of competition, the
process of Serbia’s European integration, technological changes, changes in the needs and
preferences of customers, etc., as well as the projections of strategic documents, innovation is
one of the keys of profitability and competitive advantage in the agro-industrial sector in Serbia.
Innovations are the most important drivers in contemporary economies (Vukovic et al.,
2016) and much of the efforts policy makers and many other stakeholders aim to support
innovation. Although, today in Serbia, the importance of innovation is understood as one of the
main levers of success in enterprises of agro-industrial sector in Serbia, innovation processes in
small and medium-sized enterprises are still ineffective and unsystematic. According to the
approach to open innovation, an organization cannot innovate in isolation; it must be connected
with different types of partners to gain ideas and resources from the environment to keep pace
with the competition (Dahlander, Gann 2010). The question is whether the concept of open
innovation finds its place in agricultural food sphere in Serbia, whether small, medium and
large companies in the agro-industrial sector are prone to open innovation or traditionally the
sector is still closed and reluctant for such innovations. According to Schoeffel (2014),

66 Faculty of Business Economics and Entrepreneurship International Review (2017 No.3-4)
© Filodiritto Editore – Proceedings
preference for open innovation is defined as the inclination or predisposition of organizations to
use different elements of open innovation in the innovation process. Preference for open
innovation is conceptualized by Huang and Chiang (2010) as the evaluation of the inclination of
companies to integrate external ideas to supplement its business model in order to pursue
innovation success and gauge the tendency for companies to profit from outsiders’ underutilized
use of its intellectual property. However, the construct the authors have developed to measure
firm-level open proclivity is incomplete, including collaboration and selling/buying intellectual
property, but ignoring some important open innovation activities that have been highlighted in
previous literature as venturing, engaging the customer and external participation. Rangus
(2014) develops a proclivity for open innovation construct a more multi-dimensional in nature
and is based on the basic work of previous authors (van de Vrande et al., 2009;
Chesbrough/Crowter, 2006, etc.).
In accordance with Venturiny et al., (2013) the approach to open innovation is based on two
main dimensions: technology exploitation and exploration technology involving different kinds
of practice outside-in (inbound) and inside-out (outbound) open innovation activities. In the
first set of innovational practices (technology exploitation), according to van de Vrande et al.,
(2009) venturing refers to starting up new organizations relying on internal know-how and other
support services from the organization concerned; outward IP licensing is selling or offering
licenses to other organizations to better benefit from the intellectual property of concerned
organizations and employee involvement is leveraging the knowledge and initiative of
employees by enabling them to implement ideas and participate in the implementation of
innovations. In the second set of innovative practices, according to van de Vrande et al., (2009)
customer involvement is a direct involvement of customers in the innovation processes of the
organization concerned; external networking is relying on cooperation with network partners to
support the innovation process; external participation has equity investments in other companies
to obtain access to their knowledge; outsourcing R & D is buying R & D services from other
organizations (notably knowledge institutions) and inward licensing IP is the purchase or use of
intellectual property from other organizations. The review of open innovation practices
according to de Vrande et al., (2009) is given in Table 1 (first column).
Practically, the construct readiness for open innovation should include each of the above
activities. Rangus (2014) introduces a simplification for the part that relates to exploration
technology, emphasizing that external participation and inward IP licensing in essence reflect
one dimension of open innovation. This also applies to external networking and outsourcing R
& D. In accordance with the Rangus (2014), a review of open innovation practices is given in
Table 1 (second column). Table 1. Overview of open innovation practices
Source: Adapted from van de Vrande et al. (2009) and Rangus (2014)
In this way, the construct proclivity for open innovation consists of two dimensions and six
elements: venturing, outward IP licensing, employee involvement, customer involvement,
outsourcing R & D & external networking and external participation inward & IP licensing.
Technology exploitation
Van de Vrande et al. (2009) and Rangus (2014)
Venturing
Outward IP licencing
Employee involvement
Technology exploration
Van de Vrande et al. (2009) Rangus (2014)
Customer involment Customer involvement
External networking Outsourcing R&D & External networking
External participation External participation & Inward IP licensing
Outsourcing R&D
Inward IP licencing

Faculty of Business Economics and Entrepreneurship International Review (2017 No.3-4) 67
© Filodiritto Editore – Proceedings
Based on this, we developed a research instrument with twelve items, two for each of the
elements, using the relevant literature (Rangus 2014; Hung/Chiang 2010; van de Vrande 2009;
Chesbrough/Crowter 2006, etc.). The study included professors, external experts, company
executives, experts in companies and farmers who estimated that 6 out of 12 items may have
been excluded due to redundancy, similarities and reflecting the same aspect of proclivity for
open innovation.
Material and methods
In the study included a hundred and four (104) participants (companies) divided into two
groups of fifty-two (52). The first group was comprised of participants from the agricultural
sector (perennial crops cultivation, perennial crops growing, planting material growing,
farming, mixed farming), while the second group was comprised of participants from the
sectors of food products (meat and meat products processing and preserving, processing and
preserving of fruits and vegetables, production of vegetable and animal oils and fats, dairy
production, grain mill products, starches and starch products, bakery products and pasta,
production of other food products). Ten respondents were from large enterprises, others were
from small and medium-sized enterprises.
The final list of questions was the following:
1. We use external sources of knowledge/technology when developing new activities.
(Venturing)
2. We are willing to sell a part of our intellectual property rights to other organizations.
(Outward IP licensing)
3. We provide information to employees about the importance of innovation for our
business? (Employee Involvement)
4. Our organization is willing to invest in a new company to achieve access to
knowledge/technology. (External participation & IP licensing inward)
5. Our customers are involved in the process of testing a new product/service? (Customer
involvement)
6. We work with universities, institutes, laboratories and similar organizations providing
knowledge in order to acquire new knowledge/technology? (Outsourcing R & D &
external networking)
Replies to the questionnaire were designed based on the Likert scale (reference) of seven
divisions so that each respondent could express their level of agreement or disagreement.
The questions in our research were planned in the form of the following six variables:
var 1 – readiness to use external sources of knowledge/technology to develop new activities;
var 2 – measures of willingness to sell part of its intellectual property to other organizations;
var 3 – willingness to inform employees about the importance of information for business;
var 4 – willingness to invest in a new company to achieve access to knowledge/technology;
var 5 – degree of willingness of respondents to involve users in the process of testing new
products/services;
var 6 – measures of cooperation with universities, institutes, laboratories and similar
organizations of knowledge in order to acquire new knowledge/technology.
Results and discussion
Using a statistical method – Mann-Whitney test for independent samples and the software
package SPSS for Windows (version 16.0), we compared the differences between the two
independent groups of respondents from mentioned sectors (Table 1). The result was considered
statistically significant if the probability p <0.05.
A detailed overview of the frequency of respondents for each of the questions (variables)
can be seen from Tables 2 and 3.

68 Faculty of Business Economics and Entrepreneurship International Review (2017 No.3-4)
© Filodiritto Editore – Proceedings
Results of Mann-Whitney test show that there is a statistically significant difference
between the groups of respondents from agricultural sector and in the sector of food production
with regard to:
• the degree of readiness to use external sources of knowledge/technology (var 1), (Z = -
2,120, p = 0.034); 41.2% of respondents in the agricultural sector and 56.8% in the
food sector expressed readiness to use external sources of knowledge/technology to
develop new activities;
• measures of willingness to sell intellectual property rights to other organizations (var
2), (Z = -3,214, p = 0.001); 28.4% of respondents from the agricultural sector stated
that they were willing to sell part of their intellectual property, while the percentage is
much lower in the food sector (15.7%);
• readiness to inform employees about the importance of information for business (var
3), (Z = -3,582, p = 0.000); the study showed that 17.6% of respondents in the
agricultural sector considers it necessary to inform employees about the importance of
information for business, while the percentage in the food sector was significantly
higher (34.3%);
• the degree of willingness of respondents to involve users in the process of testing a
new product/service (VAR 5), (Z = -3,268, p = 0.000); 39.2% of the employed in the
agricultural sector, and even 64.6% of employees in the food sector is ready to rely on
setting up a new business relying on internal knowledge/technology.
The results of Mann-Whitney test for two independent samples also showed no statistically
significant difference in terms of:
• willingness to invest in a new company to achieve access to knowledge/technology (var
4), (Z = -1,258, p = 0.208) and
• extent of cooperation with universities, institutes, laboratories and similar organizations
providing knowledge in order to acquire new knowledge/technology (var 6), (Z = -1,309,
p = 0.191).
Table 2. The results of Mann-Whitney test for two independent groups of respondents from agricultural
sector and the sector of food production by variables
var 1 var 2 var 3 var 4 var 5 var 6
Mann-
Whitney U 988.000 827.000 773.500 1115.000 820.500 1108.000
Wilcoxon W 2314.000 2153.000 2099.500 2441.000 2146.500 2434.000
Z -2.120 -3.214 -3.582 -1.258 -3.268 -1.309
Asymp. Sig.
(2-tailed) 0.034 0.001 0.000 0.208 0.001 0.191
Source: Own research
Table 3. Frequency response to the above-mentioned questions (by marked variables) of respondents from
agricultural sector and the sector of food production
Offered responses
Frequency N
(Percent %)
1
N
(%)
2
N
(%)
3
N
(%)
4
N
(%)
5
N
(%)
6
N
(%)
7
N
(%)
var
1
Agricultural
sector
5
(9.81)
8
(15.69)
7
(13.73)
10
(19.61)
6
(11.77)
12
(23.50)
3
(5.88)
Food produ-
ction sector
0
(0)
4
(7.84)
10
(19.61)
8
(15.69)
9
(17.65)
10
(19.61)
10
(19.61)
var
2
Agricultural
sector
5
(9.81)
2
(3.92)
9
(17.65)
6
(11.76)
11
(21.57)
10
(19.61)
8
(15.69)
Food produ-
ction sector
16
(31.37)
5
(9.81)
3
(5.88)
11
(21.57)
9
(17.65)
7
(13.73)
0
(0)
var Agricultural 5 10 11 7 8 7 3

Faculty of Business Economics and Entrepreneurship International Review (2017 No.3-4) 69
© Filodiritto Editore – Proceedings
3 sector (9.81) (19.61) (21.57) (13.73) (15.69) (13.73) (5.88)
Food produ-
ction sector
0
(0)
6
(11.77)
5
(9.80)
5
(9.80)
10
(19.61)
18
(35.29)
7
(13.73)
var
4
Agricultural
sector
7
(13.73)
6
(11.76)
9
(17.65)
10
(19.61)
8
(15.69)
7
(13.73)
4
(7.84)
Food produ-
ction sector
1
(1.96)
7
(13.73)
10
(19.61)
8
(15.69)
11
(21.57)
11
(21.57)
3
(5.88)
Legend 1:1 - strongly disagree, 2 - disagree, 3 - slightly disagree, 4 - neither agree nor disagree, 5 - to
some extent agree, 6 - agree, 7 - totally agree
Source: Own research
Table 4. Frequency response to the above-mentioned questions (by marked variables) of respondents from
agricultural sector and the sector of food production
Offered responses
Frequency N
(Percent %)
1
N
(%)
2
N
(%)
3
N
(%)
4
N
(%)
5
N
(%)
6
N
(%)
7
N
(%)
var 5
Agricultural sector 6
(11.76)
7
(13.73)
9
(17.65)
9
(17.65)
13
(25.49)
5
(9.80)
2
(3.92)
Food produ-ction sector 1
(1.96)
4
(7.84)
4
(7.84)
9
(17.65)
15
(29.41)
9
(17.65)
9
(17.65)
var 6
Agricultural sector 8
(15.69)
6
(11.76)
9
(17.65)
7
(13.73)
9
(17.65)
11
(21.57)
1
(1,96)
Food produ-ction sector 1
(1.96)
4
(7.84)
10
(19.61)
15
(29.41)
9
(17.65)
9
(17.65)
3
(5.88)
Legend 2:1 - never, 2 - rarely, 3 - from time to time, 4 - sometimes, 5 - often, 6 - usually, 7 - always
Source: Own research
Industry is turning to other priorities that include innovation and development. Although the
agriculture in Serbia went through similar processes, some of the problems remained present,
such as unfavorable agrarian structure, unresolved property relations, the lack of organization of
agricultural producers and lack of competitiveness. The Strategy for Agriculture and Rural
Development of the Republic of Serbia for the period 2014-2024 (2014) aims to define the
directions of future development based on the sustainable management of natural resources, if
you look at the results obtained during the research of agricultural and food sectors, we can
conclude that the food sector (31.38%) tend to be more open to innovation in relation to
agricultural one (23.86%). The reasons for this may lie in the traditionally more conservative
nature of the participants in agriculture compared to those in the industry, but also somewhat
different processes that occurred in these two sectors during the process of transition to a
market economy. Some of the key processes in the past in the food industry in Serbia were
related to ownership transformation of enterprises, restructuring, taking into account the
technological excess, assistance programs, return to profitability and this period is about to end.
Now the food increasing production, competitiveness and accelerated development and
introduction of agrarian policy instruments that allow dynamic restructuring of the agricultural
sector.
Seen by elements from both major dimensions of access to open innovation, technology
exploitation and exploration technology, the food sector has an advantage in terms of venturing,
employee involvement, outsourcing R & D & external networking, customer involvement and
external participation. However, in terms of willingness to sell intellectual property to other
organizations the agricultural sector shows a lot higher score. In accordance with this result,
companies in the food industry are still averse to sell the intellectual property rights that present
one source of their competitive advantage to other organizations.
This study has several limitations. The research of proclivity for open innovation has been
carried out on a sample of companies in the agricultural and food sectors in Serbia. The
research sample of companies from several countries could be compared in order to determine

70 Faculty of Business Economics and Entrepreneurship International Review (2017 No.3-4)
© Filodiritto Editore – Proceedings
the differences in organizational and environmental settings of different countries. Furthermore,
this study did not take into account the differences between enterprises in terms of size, year of
establishment, realized profits and other parameters. Future studies could determine whether
there are differences in the proclivity for open innovation between different groups of
companies. Sure, the very construct and measures of the proclivity for open innovation may be
a subject of change.
Conclusion
Proclivity for open innovation in the agro-food sector in the researched sample of companies
in the agro-food sector in Serbia is 27.62%. This result supports the attitude in literature that a
preference for open innovation is also shown in companies that are not in high tech industries,
and also in small and medium-sized enterprises.
A greater preference for open innovation in the researched sample was shown by companies
in the food sector compared to companies in agriculture. We believe that the problem here is
less in connection with the general food industry being more prone to innovation than
agriculture. A part of the reasons is of local nature due to slower restructuring of agricultural
sector in Serbia in the period of transition compared to the food sector.
Food industry in Serbia on the researched sample of enterprises has an advantage in five
elements of the proclivity for open innovation in comparison with agriculture. However, the
difference was significantly decreased by the question of willingness to sell intellectual property
which indicates that the concept of open innovation presents a challenge for managers and that
the traditional paradigm of innovation as a closed firm-level activity is still strong especially
when it comes to intellectual property.
It is recommended to research the proclivity for open innovation in the agro-food sector in
different countries with a uniform research instrument.
REFERENCES
1. Acosta, M., Coronado, D., Toribio, M.R. (2011). The use of scientific knowledge by Spanish
agrifood firms. Food Policy, 36,4, 507-516.
2. Chesbrough, H.W. (2003). Open innovation: the new imperative for creating and profiting from
technology. Boston, US, Harvard Business School Press.
3. Chesbrough, H.W., Crowther, A.K. (2006). Beyond high tech: early adopters of open innovation
in other industries. R & D Management, 36,3, 229-236.
4. Chesbrough, H.W, Vanhaverbeke, W., West, J. (2006). Open innovation: researching a new
paradigm. London, UK, Oxford University Press.
5. Dahlander, L., Gann, D.M. (2010): How open is innovation? Research Policy, 39,6, 699-709.
6. Government of the Republic of Serbia (2011). Strategy and policy development of the industry
of the Republic of Serbia 2011-2020. Official Gazette of the Republic of Serbia, 55/2011.
Belgrade.
7. Government of the Republic of Serbia, (2014). Strategy for agriculture and rural development of
the Republic of Serbia for the period 2014-2024. Official Gazette of the Republic of Serbia,
85/2014. Belgrade.
8. Hossain, M. (2015). A review of literature on open innovation in small and medium-sized
enterprises. Journal of Global Entrepreneurship Research, 5,6, 2-12.
9. Huizingh, E.K.R.E. (2011). Open innovation: state of the art and future perspectives.
Technovation, 31,1, 2-9.
10. Hung, K.P., Chiang, Y.H. (2010). Open innovation proclivity, entrepreneurial orientation, and
perceived firm performance. International Journal of Technology Management, 52,3/4, 257-274.
11. Matras-Bolibok, A., Kis, K. (2014). European innovation partnership as a framework for open
innovation in agriculture. Annals of The Polish Association of Agribusiness Economists, 16,6,
339-344.

Faculty of Business Economics and Entrepreneurship International Review (2017 No.3-4) 71
© Filodiritto Editore – Proceedings
12. Pishbin, S.A.R., Alambeigi, A., Iravani. H. (2015). Investigation of the role of structural,
leadership, and strategy factors in cooperatives entrepreneurship. Journal of Agricultural Science
and Technology, 17, 1115-1125.
13. Rangus, K. (2014). Proclivity for open innovation: construct development, determinants and
outcomes. Doctoral thesis. Ljubljana, Slovenia: University of Ljubljana.
14. Sarkar, S., Costa, A.I.A. (2008). Dynamic of open innovation in the food industry. Trends in
Food, Science and Technology, 19,11, 574-580.
15. Schueffel, P. (2014). The effects of entrepreneurial orientation on innovation performance, open
innovation proclivity and openness. 2014 Annual Meeting of the Academy of Management, 1-5
August 2014, Philadelphia, US.
16. Van de Vrande, V., de Jongb, J.P.J., Vanhaverbeke, W., de Rochemont M. (2009). Open
innovation in SMEs: trends, motives and management challenges. Technovation, 29,6-7, 423-
437.
17. Venturiny, K., Verbano, C., Bron, A. (2013). Openness and innovation: an empirical analysis in
firms located in Republic of San Marino. International Journal of Engineering, Science and
Technology, 5,4, 60-70.
18. Vukovic, D., Markovic, D., Hanic, A. (2016). Snowflake model of regional competitiveness –
evidence from Serbia. International Review, 1-2, 59-73.
Article history:
• Received 17 May 2017
• Accepted 10 October 2017

72 Faculty of Business Economics and Entrepreneurship International Review (2017 No.3-4)
© Filodiritto Editore – Proceedings
ORIGINAL SCIENTIFIC PAPER
Emission of Carbon Dioxide of Selected Retailers
LUKIC Radojko23
Abstract
Increased attention has been paid recently to the analysis of the effects of applying the
concept of sustainable development in retail. In that context we have particularly considered
greenhouse gases emission in retail. This is achieved through the use of modern ecological
technology in business – through the whole value chain. The ultimate goal is to achieve the
planned reductions of carbon dioxide in retail, which positively reflects the overall performance
of retailers, environmental in particular. The costs of carbon dioxide emission reduction affect
the performance of retailers. Continuous empirical research shows that almost all global
retailers achieve a significant reduction in carbon dioxide emissions from year to year.
Empirical research conducted in this paper on the example of global retailers in the United
States, Europe and the European Union, the United Kingdom, Mexico, China, Croatia and
Serbia shows significant and planned reduction of carbon dioxide emissions in retail, especially
in countries with developed market economies. This empirical research is mainly based on the
analysis of the original sustainable (environmental and ecological) reports officially disclosed
by selected retailers, primarily from the countries of a developed market economies, which they
started to publish with regular annual financial statements. They are now an integral part of the
so-called integrated reporting on performance of global retailers. Due to the general importance,
harmonized regulations on sustainable retail reporting are being increasingly applied as a data
source for more efficient environmental management. In perspective, this will ease the
comparative analysis of the carbon dioxide emission of global and other retailers.
Keywords: greenhouse gas emissions, carbon dioxide, CO2 emission sources, renewable energy sources,
sustainable reporting
JEL: I10, L81, M14, M41, Q42, Q56, Q57
UDK: 005.346:504.5
658.26
COBISS.SR-ID 253500684
Introduction
Close attention has been recently devoted to the analysis of environmental performance in
all sectors, including wholesale and retail trade. Within this, greenhouse gases emission (GHG)
in retail is briefly considered. The overall goal of global retailers is to reduce carbon dioxide
emissions through the entire value chain. The costs of carbon dioxide emission reduction are
significant and affect the performance of retailers.
The subject of research in this paper is the significance and trend of carbon dioxide
emissions in retail. Based on a comparative analysis of the original officially disclosed
sustainable reports of global selective retailers, the aim of the research is to comprehensively
examine the problem of carbon dioxide emissions in retail through an entire value chain and to
23 Faculty of Economics, Belgrade, University of Belgrade, Serbia, [email protected]

Faculty of Business Economics and Entrepreneurship International Review (2017 No.3-4) 73
© Filodiritto Editore – Proceedings
take appropriate measures to achieve the target reduction. The effects of this are the
improvement of the overall, especially environmentally-friendly performances of retailers. In
this we find the scientific and professional contribution of this work, due to the fact that there is
scarce literature fully devoted to the issue of carbon dioxide emissions in retail.
Numerous factors undoubtedly influence carbon dioxide emissions in retail, and these are:
type of store, product category, nature of the item itself, sales, location and distance (type of
settlement: urban, suburban and rural), carbon policy (Wang et al., 2017), as well as energy
sources, type of ventilation and heating of sales and other premises, cooling devices, mode of
transport (logistics), waste treatment, and others. Taxation is also a factor in carbon dioxide
emissions in all sectors, including retail (Qin, 2015). Regarding retail formats (types of stores,
classical or modern – Internet shops) on-line sales have insignificant carbon dioxide emissions
and, viewed through a value chain, it occurs only in warehousing, while in distribution and in
the store, equals zero, contrary to the other types of stores (Seebauer et al., 2016). Carbon
dioxide emissions vary by product category (food and non-food products) and within one
product category, by individual articles, depending on their nature (Linda, 2014; Eriksson,
2017).
All in all, the main sources of carbon dioxide emissions in retail are: electricity, transport,
ventilation and heating, refrigeration and waste. Effective control of the factors that influence
the emission of carbon dioxide can significantly affect the improvement of economic, social
and, in particular, environmental performance in retail. For these reasons, it is necessary to
know the size and intensity of carbon dioxide emissions in modern retail, which is the focus of
this work.
There is voluminous literature devoted to analyzing the way company's performance is
affected by general problems and effects of carbon dioxide emission reduction through the
whole chain (Jones, 2005; Martinuzzi, 2011; Kahn, 2014; Congcong, 2016; Li, 2016; Seebauer
et al., 2016; Bazan, 2017, Clune, 2017), as well as consumer preferences (Ji, 2017). In other
words, it is generally known that carbon dioxide reduction increases the economic performance
of companies (Cusshiella, 2017), the profitability of producers and retailers, as well as
consumer preferences (Eagle, 2017). In view of the significance of the problem of carbon
dioxide emissions, generally speaking, as far as we know, the number of papers dedicated to the
specificities and impacts of carbon dioxide emission reduction on the performance of retail
companies is modest (Patten, 2014; Makarov, 2015; Riboldazzi, 2016; Sullian, 2016).
In Serbian literature this issue is only partially considered in some works (Lukic, 2011a, b,
2012, 2014, 2016a, b, c, 2017). For that reason, this paper attempts to make thorough analysis
of specific issues of carbon dioxide emissions in the retail sector, firstly on the example of
global retailers from different countries, primarily developed market economies, which, due to
the general importance of the matter, publish reports on sustainable development with regular
annual financial reports. This practice of global retailers provides them with more reliable
information base for efficient management of carbon dioxide emissions through the whole value
chain. This is particularly true for retailers in Serbia whose practice of making the reports on
environment and sustainable development publicly available is at the very beginning.
The general research hypothesis in this paper is that the reduction of carbon dioxide
emissions positively reflects on overall (integrated, especially environmental) performance of
retailers. The methodology of the study of the given hypothesis is primarily based on the
comparative analysis of the carbon dioxide emission of global selected retailers from various
comparable countries of the developed market economy. The problem of comprehensiveness of
the research on carbon dioxide emissions in retail is that, at the time being, there is no unified
system of sustainable (environmental) reporting for all retailers. In addition, many retailers still
do not publish this report, what as a consequence, has an incomplete “comparability” of data on
carbon dioxide emissions by individual retailers. Nevertheless, knowledge of the importance
and trend of carbon dioxide emissions from global retailers is very important in order to manage
overall, integrated and, in particular, environmental performance in (concrete) retail. In view of

74 Faculty of Business Economics and Entrepreneurship International Review (2017 No.3-4)
© Filodiritto Editore – Proceedings
the global, other retailers will increasingly publish reports on sustainable development (with
data on carbon dioxide emissions). In this way, they will increase its information base for more
efficient management of total business, including environmental protection. This will have a
positive impact on the achievement of the target profit.
Main data sources for the research of the treated problem in this paper are literature, articles,
publications, studies, OECD, Eurostat and, in particular, officially disclosed annual financial
and sustainable reports of (global) retailers. They were processed in such a way that is easy to
comprehend the significance and trend of carbon dioxide emission in retail.
Carbon dioxide emissions in retail companies
Different is the carbon dioxide emissions of individual retailers. This is shown by the results
of the research in this paper.
At WalMart (United States of America, Dominant operational format:
Hypermarket/Supercenter/Superstore), a great significance is given to reducing carbon dioxide
emissions (Table 1). This is achieved by: investing in renewable energy sources, reducing
energy demand, improving energy efficiency, improving refrigeration in stores and maximizing
the efficiency of the vehicle fleet.
Table 1. Carbon dioxide emission (Scope 1 and 2) and retail area at WalMart, 2005-2014
2005 2006 2007 2008 2009 2010 2011 2012 2013 2014
Carbon dioxide
emission (million-
ton CO2e)
18,9 19,3 20,1 20,8 20,3 20,6 20,8 21,2 21,0 21,9
Retail area (million
square meters)
740 805 867 921 952 985 1,037 1,072 1,102 1,134
Carbon dioxide
intensity (million
tons CO2e/million
m2) *
0,025 0,024 0,023 0,022 0,021 0,021 0,020 0,020 0,019 0,019
Note: *Calculations performed by the author
Source: Wal-Mart Stores, Inc. 2016 Global Responsibility Report,
https://cdn.corporate.walmart.com/9c/73/3f9abcef444397f2c771e081e095/2016-global-responsibility-
report.pdf#page=58&zoom=auto,-130,628
In generating greenhouse gas emissions, WalMart participates with: electricity supply 69%,
refrigeration 18%, fuel transport 5.9%, fuel on the site 7% and mobile refrigerators with 0.1 %
(Wal-Mart Stores, Inc. 2016 Global Responsibility Report,
https://cdn.corporate.walmart.com/9c/73/3f9abcef444397f2c771e081e095/2016-global
responsibility-report.pdf#page=58&zoom=auto, -130,628. Therefore, the main source of
greenhouse gas emissions in WalMart is electricity supply. With the increased application of the
ecological operation principles, WalMart reduced carbon dioxide emissions from year to year,
which reflects favourably on its overall performance, especially environmental.
In Kroger (United States, Dominant operational format:
Hypermarket/Supercenter/Superstore) carbon dioxide emissions amounted to 32.9 (tonnes of
CO2e/1,000 sq ft) in 2015, and 36.3 in 2006. This means that there was a 9.3% reduction
achieved (2016 Sustainability Report/Kroger, http://sustainability.kroger.com/environment-
energy-carbon.html. The effects of this decrease are the improvement of environmental and
overall performance in the company Kroger.
In Best Buy (United States, Dominant operational format: Electronics Specialty),
considerable attention is paid to the reduction of greenhouse gas emissions. This is shown in
Table 2.

Faculty of Business Economics and Entrepreneurship International Review (2017 No.3-4) 75
© Filodiritto Editore – Proceedings
Table 2. Energy and greenhouse gas emissions at Best Buy
Key performance indicators Data
Energy consumption within organisation Fuel consumption: 2,883,506,400,000,000 joules
Electric energy consumption: 1,074,586 MWh
Total Scope 1&2: 1,975,560 MWh
Energy intensity 0,0332275 MWh/Sq Ft
Energy consumption reduction 34,415 MWh or 1,8% reductions from year to year
Direct emission of greenhouse gasses (GHG)
(Scope 1)
219,869 MT CO2e
Indirect emission of greenhouse gasses (GHG)
(Scope 2)
*354,451 MTCO2e
Other indirect emission of greenhouse gasses
(GHG) (Scope 3)
1,019,791 MT CO2e
Green House Gasses emission (GHG) intensity 0.01017468 MTCO2e/Sq Ft
Green House Gasses emission reduction (GHG) *120,444 MTCO2e, or 17,3% reductions from year to
year
Note: *RECs (Renewable Energy Credits) not included
Source: Best Buy Fiscal Year 2016 Corporate Responsibility & Sustainability Report,
https://corporate.bestbuy.com/wp-content/uploads/2016/06/fy16-full-report-final.pdf
The data in the given table show that it is planned to achieve a significant reduction in
emission of greenhouse gasses in Best Buy primarily by using renewable energy sources.
At Tesco (United Kingdom, Dominant operational format:
Hypermarket/Supercenter/Superstore), as with WalMart, considerable attention is paid to the
research and control of carbon dioxide emissions. This positively reflects on its overall
performance, including the surrounding ones. In Figure 1, an illustration of the specificity of
carbon dioxide emissions measurement at Tesco is shown.
Fig. 1. Tesco’s emission limit
Source: Carbon Footprint 101: A Guide for Food Retailers,
https://www.fmi.org/docs/sustainability/carbon-footprint-101-a-guide-for-food-
retailers.pdf?sfvrsn=4#page=11&zoom=auto,-121.85
Table 3 and Figure 2 show the greenhouse gas emissions in Tesco.
Table 3. Emission of greenhouse gases in Tesco
Total ton CO2e
2016/17 2015/16 Base year
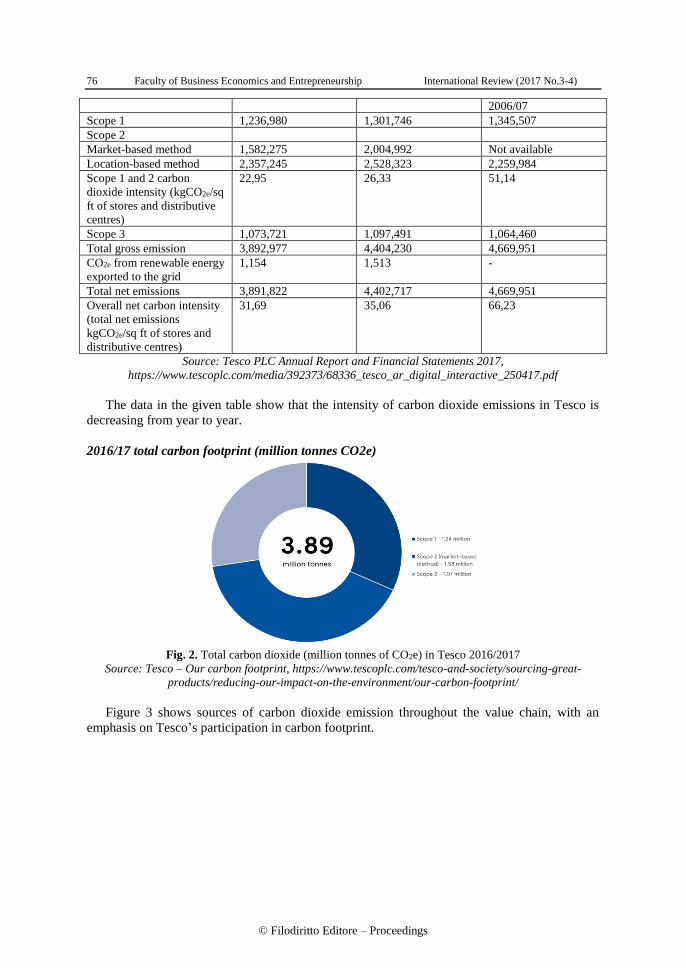
76 Faculty of Business Economics and Entrepreneurship International Review (2017 No.3-4)
© Filodiritto Editore – Proceedings
2006/07
Scope 1 1,236,980 1,301,746 1,345,507
Scope 2
Market-based method 1,582,275 2,004,992 Not available
Location-based method 2,357,245 2,528,323 2,259,984
Scope 1 and 2 carbon
dioxide intensity (kgCO2e/sq
ft of stores and distributive
centres)
22,95 26,33 51,14
Scope 3 1,073,721 1,097,491 1,064,460
Total gross emission 3,892,977 4,404,230 4,669,951
CO2e from renewable energy
exported to the grid
1,154 1,513 -
Total net emissions 3,891,822 4,402,717 4,669,951
Overall net carbon intensity
(total net emissions
kgCO2e/sq ft of stores and
distributive centres)
31,69 35,06 66,23
Source: Tesco PLC Annual Report and Financial Statements 2017,
https://www.tescoplc.com/media/392373/68336_tesco_ar_digital_interactive_250417.pdf
The data in the given table show that the intensity of carbon dioxide emissions in Tesco is
decreasing from year to year.
2016/17 total carbon footprint (million tonnes CO2e)
Fig. 2. Total carbon dioxide (million tonnes of CO2e) in Tesco 2016/2017
Source: Tesco – Our carbon footprint, https://www.tescoplc.com/tesco-and-society/sourcing-great-
products/reducing-our-impact-on-the-environment/our-carbon-footprint/
Figure 3 shows sources of carbon dioxide emission throughout the value chain, with an
emphasis on Tesco’s participation in carbon footprint.

Faculty of Business Economics and Entrepreneurship International Review (2017 No.3-4) 77
© Filodiritto Editore – Proceedings
Fig. 3. Emissions of carbon dioxide by source in Tesco
Source: Tesco – Our Carbon Footprint, https://www.tescoplc.com/tesco-and-society/sourcing-great-
products/reducing-our-impact-on-the-environment/our-carbon-footprint/
Therefore, Tesco participated in total emission of carbon dioxide through entire value chain
with 9%. Table 4 shows ecological performances at Tesco.
Table 4. Global ecological performances at Tesco
2016/17 2015/16 2014/15 2013/14
Carbon dioxide (million-ton CO2e) 3,9 5,1 5,26 -
Emission of CO2 reduction (stores and distributional centres)
compared to 2006/07
40,5% 39,5% 38,3% -
Emission of CO2 reduction (distribution) compared to
2011/12
19,7% 17.4% 14,47% 7,8%
Direct water consumption (million m3) 23,5 25,5 32,6 32,9
Waste percentage (food and non-food) which is recycled,
used again or turn into energy
93% 88% 84% 86%
Source: Reducing our impact on the environment,
https://www.tescoplc.com/tesco-and-society/sourcing-great-products/reducing-our-impact-on-the-
environment/
Tesco has tendency to improve ecological performances (carbon dioxide emission reduction,
direct water consumption reduction and waste treatment improvement). This reflects favourably
on its market, economic and financial performances.
Due to the increasing importance, special attention is paid to carbon dioxide emissions in
Marks & Spencer (M & S) (United Kingdom, Dominant Operating Format: Department
Store), as shown in Table 5.
Table 5. Emission of carbon dioxide in Marks & Spencer
Plan A
baseline
2006/7
(000
tCO2e)
Legal
baseline
2013/14
(000
tCO2e)
Last year
2014/15
(000
tCO2e)
2015/16
000
tCO2e
Achievement in
relation to 2006/7
Total gross/location-based
emission CO2e
732 567 592 566 -23%
Total carbon intensity measure
(per 1000 sq ft of sales floor (ton
CO2e/1,000 sq ft)
46 30 30 29 -47%
Source: M & S Plan Report 2016,
http://annualreport.marksandspencer.com/M&S_PlanA_Report_2016.pdf

78 Faculty of Business Economics and Entrepreneurship International Review (2017 No.3-4)
© Filodiritto Editore – Proceedings
At Marks & Spencer, a decrease in carbon dioxide emissions was recorded in 2014/15 in
relation to 2006/7. Reduction was achieved by improving energy efficiency using the so-called
“green energy” through the whole value chain. In Kingfisher (United Kingdom, Dominant
operational format: Home improvement), significant attention is paid to carbon dioxide
emissions. Table 6 shows the dynamics of greenhouse gas emissions at Kingfisher.
Table 6. Emission of greenhouse gases in Kingfisher (tons of CO2e)
2010/1 2013/14 2014/15 2015/16
Carbon footprint from fuel combustion and factories
(scope 1)
157,590,10 164,172,96 146,806,65 156,062
Carbon footprint from electricity, heating and steam
(scope 2)
247,774,97 230,759,93 258,392,29 246,775
Absolute carbon footprint (scope 1 and 2) (aimed at
25% reduction until 2020)
405,365,07 394,932,89 405,198,94 402,837
Carbon footprint per m2 of sales area 61,00 56,27 53,26 51,9
Source: Kingfisher – Sustainability Report 15/16,
http://www.kingfisher.com/sustainability/files/reports/cr_report_2016/2016_Sustainability_Report.pdf
Company Kingfisher achieved a reduction of greenhouse gas emissions by 5% 2015/16
compared to 2010/11. Their goal is to achieve a reduction of up to 25% by 2020. Kingfisher has
been decreasing greenhouse gas emissions from year to year. In IKEA company (Sweden,
Dominant operational format: Other Specialty) that operates with furniture, considerable
attention is paid to improving the research methodology and the greenhouse gas emission
control system. This is shown in Table 7.
Table 7. Emissions of carbon dioxide in IKEA, 2016
FY2016
Carbon footprint (tonnes CO2)
Scope 1 209,484
Scope 2 621,932
Scope 3 39,161,131
Total 39,992,548
Carbon footprint at each stage of value chain (tonnes CO2)
Raw material 16, 562,759
Production and distribution 3,142,796
Suppliers (home furnishing and catalogue) 2,199,035
Goods transport 943,761
IKEA Group operations 1,020,366
Scope 1 and 2 from IKEA operations 831,416
Business travel 52,368
Co-worker commuting 136,582
Shopping centre tenants 172,373
Customers 18,162,615
Transportation to stores 3,480,107
Product use (light sources and appliances) 14,682,507
Products’ “end of life” 931,639
Total 39,992,548
Source: IKEA Group – Sustainability Report FY16,
http://www.ikea.com/ms/en_US/img/ad_content/IKEA_Group_Sustainability_Report_FY16.pdf
Table 8 shows the efficiency of carbon footprint in IKEA.

Faculty of Business Economics and Entrepreneurship International Review (2017 No.3-4) 79
© Filodiritto Editore – Proceedings
Table 8. Carbon efficiency in the company IKEA
Carbon efficiency for Scope 1 and 2 emissions
FY10 FY14 FY15 FY16 (excluding
IKEA centres)
FY16 (including
IKEA centres)
Kg CO2 per m3 product sold 34,3 27,5 24,4 17,5 32,8
Carbon efficiency (% improvement against FY10 baselines)
FY10 FY14 FY15 FY16 FY20 goal
Retail 37,8 39,6 48,0 50
Distribution centres 51,2 54,1 58,2 50
IKEA Industry Group Divisions
flat line and Solid Wood
18,3 30,9 71,0 50
IKEA Industry Group Division
Board
3,0 18,7 36,4 50
IKEA components (base year
FY13)
7,8 33,8 35,8 50
Total 19,8 28,9 49,0 50
IKEA Carbon footprint from consumed electricity in FY16 FY16
Consumed electricity (MWh) 3,008,893
Location based emissions (tonnes CO2) 1,266,578
Market based emissions (tonnes CO2) 578,551
Footprint reduction from using electricity from renewable sources (%) 54,3
Source: IKEA Group – Sustainability Report FY16,
http://www.ikea.com/ms/en_US/img/ad_content/IKEA_Group_Sustainability_Report_FY16.pdf
In IKEA, significant reduction in carbon footprint is achieved through the growing use of
renewable energy. The share of renewable resources in the total consumption of electricity in
IKEA year after year was as follows: FY14 – 40%, FY15 – 53.4% and FY16 – 71.0% (IKEA
Group – Sustainability Report FY16, http://www.ikea.com/ms/en_US/img/ad_
content/IKEA_Group_Sustainability_Report_FY16.pdf. Increased consumption of the so-called
“green energy” has had a positive impact on the IKEA’s environmental and overall
performance. Also, company IKEA pays significant attention to improving the transport system
(logistics) in order to reduce carbon dioxide emissions. This is shown in Table 9.
Table 9. Product transport efficiency (impact on carbon dioxide emissions) in IKEA
FY14 FY15 FY16 FY20
goal
CO2 per cubic meter of products transported 32,7 28,2 26,6 -
Reduction in CO2 per cubic meter of products transported compared
with FY11 (%)
12,3 24,4 26,7 30
Source: IKEA Group – Sustainability Report FY16,
http://www.ikea.com/ms/en_US/img/ad_content/IKEA_Group_Sustainability_Report_FY16.pdf
It is a general conclusion that IKEA has increased reduction of carbon dioxide emissions,
which reflects favourably on its overall performance, in particular its environment.
At H & M Group (Sweden, Dominant operational format: Apparel/Footwear Specialty),
considerable attention is paid to the reduction of carbon dioxide emissions. This is shown in
Table 10.

80 Faculty of Business Economics and Entrepreneurship International Review (2017 No.3-4)
© Filodiritto Editore – Proceedings
Table 10. Carbon dioxide emission at H & M Group
2012 2013 2014 2015 2016
Carbon emissions per million SEK sales turnover
including VAT (constant exchange rate)
2,04t 2,05t 1,72t 0,69t 0,36t
Total CO2e emissions to previous year in % (Scope 1
and 2) versus growth in sales (in local currencies)
Net sales 9% 14% 11% 7%
Emissions 356,373t 341,675t 151,753t 80,54t
Note: SEC – Swedish crown
Source: The H & M Group sustainability report 2016,
http://sustainability.hm.com/content/dam/hm/about/documents/en/CSR/Report%202016/HM_group_Sustai
nabilityReport_2016_FullReport_en.pdf
In 2016, H & M made a reduction of carbon dioxide emissions by 47% compared to 2015.
In Inditex Group (Spain, Dominant Operating Format: Apparel/Footwear Specialty), to
which Zara also belongs, considerable attention is paid to research on carbon dioxide emissions
and its reduction. This is shown in Table 11.
Table 11. Emission of greenhouse gases in Inditex
2012 2013 2014 2015
Scope 1 (tCO2eq) 24,479 22,528 21,347 22,996
Scope 2 (tCO2eq) 589,758 627,982 666,188 622,879
Number of clothes sold on the market 869,167,058 948,745,988 1,018,995,911 1,177,784,343
CO2 per item sold on market 706,70 685,65 674,72 548,38
Avoided emissions by using generators
of thermal energy (tCO2eq)
NA NA NA 5,339,59
Scope 3 Downstream transportation
(tCO2eq)
398,168 462,120 596,316 672,307
Scope 3 Upstream transportation
(tCO2eq)
NA NA NA 42,258
Scope 3 Franchise stores (tCO2eq) 100,143 108,035 113,094 94,262
Note. NA – not available
Source: Inditex – Annual Report 2015
https://www.inditex.com/documents/10279/205236/Inditex+Annual+Report+2015+web.pdf/9979097b-
9e63-489a-ad16-a141b6b665b4
Therefore, the result of efficient management is the reduction of carbon dioxide emissions in
Inditex.
In 2015, Carefour (France, Dominant operational format:
Hypermarket/Supercenter/Superstore) emitted 3.61 million tonnes of CO2e. In 2015, carbon
dioxide emissions were reduced by 29.7% compared to 2010. The aim is to achieve a reduction
in carbon dioxide emissions by 40% until 2025 and 70% until 2050 (Unique and Multiple/2015
Annual Activity and Responsible Commitment Report,
http://www.carrefour.com/sites/default/files/carrefour_2015_annual_activity_and_responsible_
commitment_report.pdf. This will have a positive impact on Careffour’s environmental and
overall performance).
Metro Group (Germany, Dominant operational format: Cash & Carry/Warehouse Club)
regularly discloses reports on corporate responsibility, in which carbon dioxide emissions are
represented in particular, as shown in the Table 12.

Faculty of Business Economics and Entrepreneurship International Review (2017 No.3-4) 81
© Filodiritto Editore – Proceedings
Table 12. Greenhouse gas emissions in Metro Group (tonnes of CO2e)
Year of
reference
2011
2013/14 2014/15 2015/16
Scope 1 – direct emission of greenhouse gasses 1,084,509 1,015,598 871,837 760,186
Scope 2 – indirect emission of greenhouse
gasses
2,432,102 1,786,594 1,495,710 1,416,418
Scope 3 – other indirect emission of greenhouse
gasses
6,113,122 5,562,362 5,151,775 4,589,161
Total emission of greenhouse gasses 9,629,733 8,364,553 7,519,322 6,765,764
Source: Metro Group – Corporate Responsibility Report 2015/16 – Key Performance
Indicators and Goals, https://www.metrogroup.de/.../reports/metro-group-corporate-responsibility-report-
2015
Data in this table show that Metro Group reduces emissions of greenhouse gases from year
to year. The intensity of carbon dioxide emissions is reduced from year after year (Fig. 4).
This reflects favourably on its overall performance, including environmental.
Fig. 4. Emission of carbon dioxide in Metro Group
(kgCO2/m2 of sales area (referring to total sales space 2,003,960 m2)
Source: Metro Group - Corporate Responsibility Report 2015/16 - Key Performance Indicators and
Goals, https://www.metrogroup.de/.../reports/metro-group-corporate-responsibility-report-2015
Aldi (Germany, Dominant operational format: Discount Store) also publishes reports on
sustainable development, in which special attention is paid to the emission of carbon dioxide.
Table 12 shows the greenhouse gas emissions at Aldi.
Table 12. Greenhouse gases emission in Aldi (tons CO2e)
2014 2015
Scope 1 284,831 312,940
Scope 2 369,961 567,424
Total 654,792 680,364
Source: Aldi – Sustainability Report 2015, https://www.cr-aldinord.com/2015/wp-
content/uploads/sites/2/2016/04/ALDI_North_Group_NHB_Sustainability_Report_2015.pdf
At Aldi, greenhouse gases emissions by sectors (in percent) in 2015 were as follows:
electricity 53.1%, cooling equipment 20.0%, heating energy 14.3% and logistics 12.6% (Aldi –
Sustainability Report 2015, https://www.cr-aldinord.com/2015/wp-
content/uploads/sites/2/2016/04/ALDI_North_Group_NHB_Sustainability_Report_2015.pdf.

82 Faculty of Business Economics and Entrepreneurship International Review (2017 No.3-4)
© Filodiritto Editore – Proceedings
In order to reduce greenhouse gas emissions, special attention is paid to the use of energy
from renewable sources (LED lamps).
At Ahold (Germany, Dominant operational format: Supermarket), considerable attention is
paid to the reduction of carbon dioxide emissions. This is shown in Table 13.
Table 13. Carbon dioxide emission at Ahold
2008 2009 2010 2011 2012 2013 2014 2015
Carbon dioxide emissions (thousand
tons)
2,176 2,106 2,107 2,090 2,019
Carbon dioxide emissions (kg CO2/m2
sales area)
567 574 543 507 480 473 465 420
Sources (%)
Electricity 49%
Refrigerant appliances 29%
Fuel 12%
Gas 10%
Source: Ahold – Responsible Retailing Report 2015,
https://www.aholddelhaize.com/media/1934/ahold-responsible-retailing-report-2015.pdf
Carbon dioxide emissions at Ahold has been decreasing year after year. Since 2016, Ahold
has been operating under the name of Ahold Delhaize. In view of this, Table 14 shows data on
carbon dioxide emissions for Ahold Delhaize (Belgium, Dominant operational format:
Supermarket) in 2016.
Table 14. Carbon dioxide emission at Ahold Delhaize
2016
Actuals
2020
Target
% reduction in CO2 equivalent emissions per m2 of sales area (from 2008
baseline)
-22% -30%
Total CO2 equivalent emissions per m2 of sales area – location-based
approach
496 n/a
Total CO2 equivalent emissions (thousand tonnes) – location-based approach 4,505 n/a
Total Scope 1 CO2 equivalent emissions (thousand tonnes) – location-based
approach
1,940 n/a
Total Scope 2 CO2 equivalent emissions (thousand tonnes) – location-based
approach
2,420 n/a
Total Scope 3 CO2 equivalent emissions (thousand tonnes) – location-based
approach
144 n/a
Offset CO2 equivalent emissions (thousand tonnes) 241 n/a
Avoided grid electricity CO2 emissions (thousand tonnes) 31 n/a
Source: Ahold Delhaize Supplementary report on Sustainable Retailing performance 2016,
https://www.aholddelhaize.com/media/3984/supplementary-report-on-sustainable-retailing-performance-
2016.pdf
Significant reduction in carbon dioxide emissions by 2020 (30%) is expected at Ahold
Delhaize. This will be achieved by using so-called “green energy” in business operations.
Sources of carbon dioxide emissions were: electricity 60%, cooling devices 31% and
transport 9% (Ahold Delhaize Supplementary Report on Sustainable Retailing performance
2016, https://www.aholddelhaize.com/media/3984/supplementary-report-on-sustainable-
retailing-performance-2016.pdf. Delhaize Serbia is also part of Ahold Delhaize which employs
the same sustainable development strategy and environment reporting as well as company at its
higher organizational level.

Faculty of Business Economics and Entrepreneurship International Review (2017 No.3-4) 83
© Filodiritto Editore – Proceedings
In the Fast Retailing (Japan, Dominant Operating Format: Apparel/Footwear Specialty),
exceptional attention is devoted to the issue of carbon dioxide emission reduction. Figure 5
shows carbon dioxide emissions through the entire value chain in Fast Retailing.
Fig. 5. Sustainable reporting – Carbon dioxide emission through value chain in Fast Retailing
Source. Fast Retailing – Sustainability Report,
http://www.fastretailing.com/eng/sustainability/environment/co2_popup.html
In 2016, at Fast Retailing, carbon dioxide emissions amounted to 2,917,069 (tCO2e). In
logistics it was 17,707 (tCO2e). Table 15 presents carbon dioxide emission (tCO2e) in stores and
management offices by sources (generators) at Fast Retailing for 2016.
Table 15. Carbon dioxide emission in stores and management according to sources (generators) at Fast
Retailing for 2016 (tCO2e)
Store gas 11,436
HQ gas 38
Total
Scope 1
11,474
Store electricity 123,932
HQ electricity 2,466
Total
Scope 2
126,398
Source: Fast Retailing –- Sustainability Report 2017,
http://www.fastretailing.com/eng/sustainability/report/pdf/sustainability2017_en.pdf#page=1&pagemode
=thumbs&zoom=80
Fast Retailing plans to reduce carbon dioxide emissions in stores by 10% by 2020 (Fast
Retailing – Sustainability Report 2017, http://www.fastretailing.com/eng/sustainability
/report/pdf/sustainability2017_en.pdf#page=1&pagemode=thumbs&zoom=80.
For the purpose of more complex analyzes of greenhouse gas emissions by selected
retailers, Table 16 shows the trend of greenhouse gas emissions for retailers in the United States
and Great Britain.

84 Faculty of Business Economics and Entrepreneurship International Review (2017 No.3-4)
© Filodiritto Editore – Proceedings
Table 16. Trend of greenhouse gases in US and UK
Company Annual Change in GHG Emissions (%/year)
UK Retailers
Asda -3.67 (over 3 years)
Co-operative -7.69 (4 years)
Marks and Spencer -3.21 (4 years)
Morrisons -2.22 (5 years)
Sainsbury’s -0.88 (5 years)
Tesco +5.28 (4 years)
US Retailers
Costco 5.23 (over 3 years)
Kroger 2.71 (5 years)
Lowe's -2.11 (4 years)
Sears -6.05 (4 years)
Target 0.98 (4 years)
Wal-Mart 2.19 (6 years)
Notes: a UK company based on Sullivan and Gouldson (2013).
b US company data based on company responses to the 2012 CDP survey
Source: Sullivan, (2016)
In order to have more comprehensive understanding on differences Figure 12 presents
comparative analysis of the greenhouse gas emission of US and UK retailers for the period
2006-2011.
Fig. 6. Comparative trend of greenhouse gas emissions of US and UK retailers
Source: Sullivan, (2016)
As well as in Fig. 6, the data in the given table show various annual changes in the
greenhouse gas emissions between retailers UK and US. Thus, for example, in the UK, the
highest annual positive percentage changes in greenhouse gas emissions are in Tesco (+5.28),
and in US in the retailer Costco (5.23). Concerning the negative annual changes in the
greenhouse gas emissions, the largest are in the UK in Cooperative (-7.69) and in the US in
Sears (-6.05). The conclusion is that there is, to some extent, higher reduction in greenhouse gas
emissions from retailers in the UK than in the US.

Faculty of Business Economics and Entrepreneurship International Review (2017 No.3-4) 85
© Filodiritto Editore – Proceedings
Carbon dioxide emissions in retail companies of Serbia
In Serbia there is a significantly smaller number of (domestic) retailers who disclose
sustainable development reports compared to other countries, with the expectation that this
number will increase significantly in the future. In this regard, the company of the Naftna
Industija Srbije (NIS) is leading and for or a long period of time, it has regularly published a
sustainable development reports, compiled in accordance with the G4 Global Reporting
Initiative (GRI) Guidelines. Table 17 shows the amount of air pollutants emitted in the Naftna
Industija Srbije for 2014, 2015 and 2016.
Table 17. Amount of emitted air pollutants in Naftna Industija Srbije
2014 2015 2016
Emission CO2 (t) 1457 3464 3649
Emission NO2 (t) 601 1064 905
Emission of powdery materials (t) 30 74 51
Source: NIS Sustainable Development Report 2015 a 2016
In Naftna Industija Srbije, appropriate measures are continuously being undertaken in order
to reduce the emissions of greenhouse gases in the future.
Conclusion
A growing number of retailers in the world are increasingly publishing reports on
sustainable development. By their reputation, and because of its importance, other retailers will
certainly tend to publish this report in the future. It provides the basis for a comparative analysis
of environmental performance in retail from various aspects. In this report, special significance
is given to trend of greenhouse gas emissions, in particular, carbon dioxide.
Carbon dioxide emissions in trade, in total and by sectors, vary by country. It is significantly
higher in China than in Europe or the European Union. Likewise, carbon dioxide emissions are
significantly higher in trade of France, Germany and Great Britain than in Greece, Croatia,
Turkey and Serbia. Carbon dioxide emissions are higher in Croatia’s trade than in Serbian.
These differences are due to the application of various ecological measures in business.
Carbon dioxide emissions differ in individual stages of the product life cycle, retail
companies and product categories. Carbon dioxide emission generators in retail companies are:
electricity, transport, ventilation, heating and cooking, refrigeration, and waste. The goal of all
retailers is to take appropriate measures, primarily ecological in nature, to reach a planned
reduction of carbon dioxide emissions in the future. Among other things, this is achieved with
the increasing use of electricity from renewable sources (so-called “green energy”), by using
modern ventilation, heating and cooking systems, refrigeration units, green logistics (ecological
vehicles) and more efficient waste treatment. The effect of this is to improve the overall
performance of retail companies, especially environmental.
REFERENCES
1. Ali Y et al. (2017). An analysis of CO2 emissions in Italy through the Macro Multiplier (MM)
approach. Journal of Cleaner Production, 149, 238-250.
2. Bazan, E., Jaber, M. Y., & Zanoni, S. (2017). Carbon emissions and energy effects on a two-
level manufacturer-retailer closed-loop supply chain model with remanufacturing subject to
different coordination mechanisms. International Journal of Production Economics, 183, 394-
408.
3. Chatellier- Lorentzen, D. and Sheinbaum- Parado, C. (2017). Assessing the Impacts of Final
Demand on CO2-eq Emissions in the Mexican Economy: An Input-Output Analysis. Energy and
Power Engineering, 9, 40-54.

86 Faculty of Business Economics and Entrepreneurship International Review (2017 No.3-4)
© Filodiritto Editore – Proceedings
4. Congcong, L. and Xiaojun, L. (2016). Simulation Research on Supply Chain Carbon Emission
Model with SD. Management Science and Engineering, 10(4), 87-99.
5. Clune, C., Crossin, E. and Verghese, K. (2017). Systematic review of greenhouse gas emissions
for different fresh food categories. Journal of Cleaner Production, 140 (2), 766-783.
6. Cucchiella, F., Gastaldi, M. and Miliacca, M. (2017). The management of greenhouse gas
emissions and effects on firm performance. Journal of Cleaner production, xxx, 1-14,
http://dx.doi.org/10.1016/j.jclepro.2017.02.170.
7. Eriksson, M. and Spångberg, J. (2017). Carbon footprint and energy use of food waste
management options for fresh fruit and vegetables from supermarkets. Waste Management, 60,
786-799.
8. Igl, J. and Keller; F. (2017). Exploring greenhouse gas reduction opportunities for retailers in
Fast Moving Consumer goods distribution networks. Transportation research Part D50, 55-69.
9. Ji, J., Zhang, Z. and Yang, L. (2017). Carbon emission reduction decisions in the retail – dual
channel supply chain with consumers preference. Journal of Cleaner Production, 141, 852-867.
10. Jones, P., Comfort, D., Hiller, D. and Eastwood, I. (2005). Retailers and Sustainable
development in the UK. International Journal of Retail & Distribution Management, 33(3), 207-
214.
11. Kahn, M.E. and Kok, N. (2014). Big-Box retailers and urban Carbon emissions: The case of
Wal-Mart. Working Papers # 5, 1-28.
12. Linda, K. and Donal, M-B. (2014). Reducing greenhouse gas emissions in the food sector:
Effects of corporate responsibility. Kiel Working Paper, No. 1967, 1-39.
13. Li, F., Schwarz; L. and Haasis, H.D. (2016). A framework and risk analysis for supply chain
emission trading. Journal Logistics. Research, 9 (1), 1-10.
14. Lukic, R. (2011). Evaluacija poslovnih performansi u maloprodaji. Beograd: Ekonomski
fakultet.
15. Lukic, R. (2012). Sustainable Development of Retail in Serbia. Review of International
Comparative Management, 13 (4). 574-586.
16. Lukic, R. (2013). Sustainable Cost Management in Retail. Review of International Comparative
Management, 14(2), 268-280.
17. Lukic, R., Vojteski-Kljenak, D. and Jovancevic D. (2014). Food waste management.
Management Research and Practice, 6(4), 23-39.
18. Lukic, R. (2016a). The impact of energy efficiency on performance in service sector. Economic
and Environmental Studies, 16(2), 169-190.
19. Lukic, R. (2016b). Analysis of energy costs in retail trade. Management Research and Praktice,
8(4), 5-28.
20. Lukic, R. and Lalic, S. (2016c). Energy Efficiency Food Retailers. In: 7th International
Agriculture Symposium “Agrosym 2016” Jahorina, 06-09 October 2016, Bosnia and
Herzegovina, 2710-2717.
21. Lukic, R. (2017). Računovodstvo trgovinskih preduzeća. Beograd: Ekonomaki fakultet.
22. Makarov, I.A. and Sokolova, A.K. (2015). Carbon emissions embodied in Russia’s trade. FIW
Working Paper No 149, 1-33.
23. Martinuzzi, A. et al., (2011). “CSR Activities and Impacts of the Retail Sector”, RIMAS
Working Papers, No. 4, 1-31.
24. Patten, D. M., & Zhao, N. (2014). Stand-alone reporting by U.S. retail companies. Accounting
Forum, 38(2), 132-144.
25. Riboldazzi, S. (2016). Corporate Governance and Sustainability in Italian Large-Scale Retail
Companies. European Scientific Journal, 12(16), 1-23.
26. Qin, J., Bai, X. and Xia, L. (2015). Sustainable Trade Credit and replenishment policies under
the Cap-And-Trade and Carbon Tax Regulations. Sustainability, 7, 16340-16361.
27. Schönberger, H., Martos, J.L.G. and Styles, D (2013). Best Environmental Management Practice
in the Retail Trade Sector. Join Research Centre, Report EUR 25998 EN, European Union.
28. Seebauer, S., Kulmer, V., Bruckner, M. and Winkler, E. (2016). Carbon emissions of retail
channels: the limits of available policy instruments to achieve absolute reductions. Journal of
Cleaner Production, 132, 192-203.
29. Solilová, V., Nerudová, D. (2015), Evaluation of Greenhouse Gas Emissions and Related
Aspects: Case of the Czech Republic, Acta Universitatis Agriculturae et Silviculturae
Mendelianae Brunensis, 63(1), 281-292.

Faculty of Business Economics and Entrepreneurship International Review (2017 No.3-4) 87
© Filodiritto Editore – Proceedings
30. Sullian, R. and Gouldson, A. (2016). Comparing the Climate Change Actions, Targets and
Performance of UK and US Retailers. Corporate Social Responsibility and Environmental
Management, 23(3),129-136.
31. Wang, M., Gündüz, H.I., Herty, M. and Zhao, L. (2017). Quantity and location decision of fresh
food distribution centres for a supermarket chain under carbon policies. In: Proceedings of the
50th Annual Hawaii International Conference on System Sciences, IEEE, Piscataway, 1361-
1370.
32. Zhang, G., Liu, M. and Gao, X. (2014). Dynamic Characteristic Analysis of Indirect Carbon
Emissions Caused by Chinese Urban and Rural Residential Consumption Based on Time Series
Input-Output Tables from 2002 to 2011. Mathematical Problems in Engineering, 2014, Article
Id 297637, 1-11.
33. Zheng, H. et al., (2017). China’s Carbon Footprint Based on Input-Output Table Series: 1992-
2010. Sustainability, 9, 307, 1-17.
34. https://cdn.corporate.walmart.com/9c/73/3f9abcef444397f2c771e081e095/2016-global-
responsibility-report.pdf#page=58&zoom=auto,-130,628 (May 5, 2017)
35. http://sustainability.kroger.com/environment-energy-carbon.html (May 8, 2017).
36. https://corporate.bestbuy.com/wp-content/uploads/2016/06/fy16-full-report-final.pdf (May 8,
2017)
37. https://www.fmi.org/docs/sustainability/carbon-footprint-101-a-guide-for-food-
retailers.pdf?sfvrsn=4#page=11&zoom=auto,-121.85
38. https://www.tescoplc.com/media/392373/68336_tesco_ar_digital_interactive_250417.pdf
39. https://www.tescoplc.com/tesco-and-society/sourcing-great-products/reducing-our-impact-on-
the-environment/our-carbon-footprint/
40. http://annualreport.marksandspencer.com/M&S_PlanA_Report_2016.pdf
41. http://www.kingfisher.com/sustainability/files/reports/cr_report_2016/2016_Sustainability_Repo
rt.pdf
42. https://www.tescoplc.com/tesco-and-society/sourcing-great-products/reducing-our-impact-on-
the-environment/
43. http://www.ikea.com/ms/en_US/img/ad_content/IKEA_Group_Sustainability_Report_FY16.pf
44. http://sustainability.hm.com/content/dam/hm/about/documents/en/CSR/Report%202016/HM_gr
oup_SustainabilityReport_2016_FullReport_en.pdf
45. https://www.inditex.com/documents/10279/205236/Inditex+Annual+Report+2015+web.pdf/997
9097b-9e63-489a-ad16-a141b6b665b4
46. http://www.carrefour.com/sites/default/files/carrefour__2015_annual_activity_and_responsible_
commitment_report.pdf .
47. https://www.metrogroup.de/.../reports/metro-group-corporate-responsibility-report-2015
48. https://www.cr-aldinord.com/2015/wp-
content/uploads/sites/2/2016/04/ALDI_North_Group_NHB_Sustainability_Report_2015.pdf
49. https://www.cr-aldinord.com/2015/wp-
content/uploads/sites/2/2016/04/ALDI_North_Group_NHB_Sustainability_Report_2015.pdf.
50. https://www.aholddelhaize.com/media/1934/ahold-responsible-retailing-report-2015.pdf
51. https://www.aholddelhaize.com/media/3984/supplementary-report-on-sustainable-retailing-
performance-2016.pdf
52. http://www.fastretailing.com/eng/sustainability/environment/co2_popup.html
53. http://www.fastretailing.com/eng/sustainability/report/pdf/sustainability2017_en.pdf#page=1&p
agemode=thumbs&zoom=80
Article history:
• Received 1 October 2017
• Accepted 10 November 2017
http://www.kingfisher.com/sustainability/files/reports/cr_report_2016/2016_Sustainability_Report.pdf
88 Faculty of Business Economics and Entrepreneurship International Review (2017 No.3-4)
© Filodiritto Editore – Proceedings
ORIGINAL SCIENTIFIC PAPER
The Analysis of Effect of Aspiration to Growth of
Managers for Smes Growth Case Study: Exporting
Manufacturing Smes in Iran
HANIFZADEH Faezeh24, TALEBI Kambeiz25, SAJADI Mojtaba26
Abstract
The present paper seeks to examine the effect of aspiration to growth of managers on their
behavior, which translates into business growth. Furthermore, the aspiration to growth of
managers are investigated and the relationship between their aspiration to growth and their
behavior (business growth) are examined within the framework of the theory of planned
behavior. In order to form a clear understanding of aspiration to growth of managers and its
effect on their behavior (business growth), the study reviews the literature related to the theory
of planned behavior and business growth, with regards to the mediating variables. To this end,
the selected exporting SMEs of Tehran Province were investigated and the data collected from
the questionnaires and interviews with the managers of these firms were analyzed and
interpreted.
The present paper reviews the existing literature on growth of small and medium-sized
enterprises, theory of planned behavior as well as previous studies on business growth of small
and medium-sized enterprises within the framework of planned behavior theory. The conceptual
model of the research was compiled from the models of two previous studies. The mixed
approach is implemented and the statistical population of the research comprises of the
managers of exporting manufacturing SMEs. In qualitative section, data were analyzed using
open codification technique and the PLS software package was utilized to conduct the
quantitative data analysis.
Research confirms the aspiration to growth of a manager has direct positive effect on his
behavior, namely business growth. Thus, the higher the aspiration to growth, the more growth
the manager attains in his business. Because the increase of aspiration level pushes the manager
to try harder to reach his goal, which in here is business growth. In this study, three effective
factors on the aspiration to growth of managers were examined: personal characteristics of
manager, business environment characteristics, and business characteristics. The relationship
and the effect of these factors on the aspiration to growth of managers were analyzed.
The present paper greatly benefits managers, entrepreneurs, policymakers, experts,
researchers and professors since it provides a deeper and clearer understanding of the factors
effective on the aspiration to growth of managers of small and medium-sized enterprises which
affect their behavior (business growth). This understanding could help influencing the factors
effective on the aspiration to growth of managers and therefore speeding up the growth of
SMEs.
This study adds up to the very limited number of research that are conducted on
psychological factors effective on the growth of small and medium-sized enterprises influenced
24 Educated Entrepreneurship Faculty of Tehran University, Iran, [email protected] 25 Faculty of Entrepreneurship, Tehran University, Iran 26 Faculty of Entrepreneurship, Tehran University, Iran

Faculty of Business Economics and Entrepreneurship International Review (2017 No.3-4) 89
© Filodiritto Editore – Proceedings
by the aspiration to growth of the business manager. This paper suggests the aspiration to
growth of the manager positively affects business growth. Thus, the higher the aspiration to
growth of the manager, the more growth the business enjoys.
Keywords: Growth of Small and Medium-Sized Enterprises, Planned Behavior, Aspiration to Growth,
Exporting Manufacturing Small and Medium-Sized Enterprises
JEL: L26
UDK: 005.412:334.7(55) 005.32
COBISS.SR-ID 253509132
Introduction
In today’s dynamic and fast-growing economy, business growth has significant importance
both from micro and macro-economic perspectives. Business growth and expansion are
influenced by many factors and most studies on business growth have only examined the
economic aspects of the factors affecting business growth. Paying attention to the stimulating
effects of money and profitability on behavior and decision making is essential but it is
important to note that they are not the only behavioral stimulants for business growth and
probably they are not even the most significant ones (Shepherd and Wiklund, 2005).
Therefore, the present study attempts to analyze the internal and psychological factors that
stimulate the aspirations of managers to grow their businesses. While it is very likely that small
business managers have various motivations for business expansion, their capabilities for
controlling the outcomes are also probably diverse. It means if two individuals have the same
motivation for growing their businesses but one of them is more capable than the other, it is
expected that the individual with more capability and control over the results should reach his
desired outcome, namely business growth. Therefore, even though the motivation of a manager
for business expansion could be a reason for business growth, this is just one side of the story
and the capabilities of the manager in expanding the business and controlling the outcomes
should also be considered (Shepherd, Wiklund, 2005). Thus, personal capabilities also play
significant roles in the expansion of small and medium-sized businesses, and in order to reach a
deeper understanding of the role of individual’s motivation in business growth, both personal
and organizational capabilities must be examined. The theory of planned behavior that was first
proposed by Icek Ajzen, is a proven psychological theory that describes specific activities in
specific domains. According to this theory, people have incomplete control over the outcome of
their performance. This theory is based on an understanding of motivation which reveals the
part a goal plays for an individual. If a goal is motivating, it will affect behavior and the
individual will have high inclination to work hard and achieve the motivating goal. It is one of
the basic principles of TPB that the stronger the intention for a behavior, the more is the
likelihood of its performance (Ajzen, 1991). Goals planned according to attitude and mental
norms can be predictive of behaviors (Sheperd, Wiklund, 2005). By examining the effect of
aspiration to growth of managers on business growth level, the present research seeks to
achieve a deeper understanding of the effect of personal motivations (aspiration to growth) on
growth behavior (business growth). This study aims to form a complete understanding of the
relationship between aspiration to growth of business managers and their behavior toward
business growth with regards to the mediating variables that affect this relationship and by
mentioning the theory of planned behavior. Then, the study presents the results of experiments
based on the given relationships.

90 Faculty of Business Economics and Entrepreneurship International Review (2017 No.3-4)
© Filodiritto Editore – Proceedings
Theoretical framework, previous studies, and hypotheses
Small and Medium-Sized Enterprises
The extensive literature of small and medium-sized businesses has spawned various
definitions for these entities based on their traditional, cultural and population structure and the
level of development for different countries. Comparative study of this type of business in
various countries reveals their numerous structural similarities. However, proposing a single
definition for them is not possible. The European Union uses the following three criteria to
define and identify small and medium-sized enterprises: number of employees, annual turnover,
and the amount of assets and liabilities of the enterprise. Small and medium-sized enterprises
have unique functions, including job creation, distribution of wealth in society, development of
marginal regions, supply of products required by countries, train human resources required by
the large enterprises and industries (Langenberg, 2004). Research indicates that this type of
enterprise has a six-stage life cycle, through which one can predict their performance pattern in
growth and profitability condition. Generally, in growth and profitability condition small and
medium-sized enterprises outperform their larger counterparts. The decision-making style of
their managers and their strategy depends on the various stages of business life cycle and this
way of thinking helps to enhance their business performance over time (Yazdanfar, Öhman,
2014).
Exporting Small and Medium-Sized Enterprises
The word “export” is defined as sending or shipping goods across national borders of a
country (Kiani, Hasanvand, 1998). Also, export entails contacting and working with
professional markets and market professionals overseas and is the starting point of establishing
a contact with others (El-Gohary, Edwards, Huang, 2013). Developed countries pay special
attention to enhance export activities since export could improve firm's performance,
profitability, sales volume and market share. Managers of exporting firms could easily change
their market direction and design appropriate market strategies to respond to the changes in the
market (Haluk, 2008). Research suggests that most owners of small and medium-sized
enterprises have limited knowledge of marketing and sales management. These enterprises
adopt different methods to export; but in current conditions regarding the process of
globalization, not only do they have to compete with local and national rivals, they need to be
competitive on a global level if they ever wish to achieve success.
However, in practice the ability to carry out export activities depends on such factors as
proper understanding of marketing in foreign environments, possessing the required resources
to work on a global level, owning multilingual websites for communicating with the target
customers, identifying legal and cultural barriers and having a full understanding of the industry
of the business (Edwards, Huang, 2013).
Research indicates that Iranian firms do not have a lasting presence in export markets and
therefore it is important for these firms to adopt long term export strategies. Besides, to be
active in global markets, general and specialized Iranian exporting firms need to establish
holdings and consult foreign advisors and attract foreign investments (Sadeghi, 2011).
Business Growth
Business growth is one of the most important discussions in business management since it is
indicative of market acceptance and success of the firm (McMahon, 2013). Different studies
have defined growth from various perspectives. In studies based on governmental policies,
growth is defined as the increase in staff headcount and recruitment; but from the perspective of

Faculty of Business Economics and Entrepreneurship International Review (2017 No.3-4) 91
© Filodiritto Editore – Proceedings
business owners and managers, growth means increased financial performance of the
organization and is often expressed in financial figures and ratios (Robson, Bennett, 2000). In
general, business growth means an increase in the size of an organization. Many studies
consider growth as a (positive) change in financial turnover and staff headcount. Growth studies
have often considered large firms and ventures and paid little attention to small firms since they
often fail to reach growth stage. Prerequisites of growth for small and medium-sized enterprises
are growth orientation of the entrepreneur, sufficient sources for growth and available market
opportunities for growth (David Sun, 1991).
In his initial definition, Penrose defines growth as “an evolutionist process based on
cumulative growth of collective knowledge” (Penrose, 1959). In this regard, Johnson (2009) is
interested in the methods of growth measurement. The two criteria often used for growth
measurement are staff headcount and growth volume, of which the first one creates social
interests and the second one managerial interests (Chanut, Gilles, 2014). In general, growth of
the firms is evaluated in terms of management and development of new activities as well as
serious reconsideration of company goals and problems (Littunen, Niittykangas, 2010).
According to Davidsson and Wiklund (2000), the growth-related studies include four main
perspectives:
1. The resource based perspective;
2. The motivation perspective;
3. The strategic adoption perspective; and
4. The configuration perspective (Littunen, Niittykangas, 2010).
Davidsson and Wiklund (2000), believe the first three perspectives are related to the factors
effective on growth while the forth perspective deals with the process of growth (Littunen,
Niittykangas, 2010). The wide range of literature on the subject of life cycle indicates that
companies grow and develop with unchanging and predictable methods (Littunen, Niittykangas,
2010).
Lastly, Wiklund et al., (2009) have formulated one of the most advanced integrated models
to this date. Using internal and external factors, their model can explain 30% of growth. The
attitude of the manager along with some environmental facts (dynamism, hostility and increased
dynamism) have a direct effect on the growth of SMEs. Furthermore, resources, special
environmental factors, attitudes and the industry also influence growth indirectly through
entrepreneurial orientation of the company leader (Chanut, Gilles, 2014).
Theory of Planned Behavior
The theory of planned behavior is based on the theory of reasoned action. Theory of
reasoned action is applicable to conditions where there is significant volitional control over
behavior. In other words, the success of the theory of reasoned action depends on the degree of
volitional control over behavior and once this control decreases (the individual is unable to
perform the action despite existing behavioral intention), the theory loses its applicability.
Ajzen et al., noticed this flaw and founded a new paradigm called the theory of planned
behavior. Apart from the two factors of behavioral intention and volitional control both
mentioned in the theory of reasoned action, the theory of planned behavior also includes a third
factor called perceived control. In conditions where behavioral intention is enough to perform
an action or when there is high volitional control over a behavior (the factors of reasoned
action), the third factor (perceived action) becomes less strong. When attitudes and subjective
norms remain constant, the difficulty level of performing an action will have strong effect on its
intention. These three constructs have different relative weights in various societies and various
behaviors (Gird, Bagraim, 2013). Of course, there are numerous psychological theories that are
being developed and focused on volitionally controlled behaviors and they all share a common
feature: they model the behavioral outcomes as a dual function of motivation and individual
92 Faculty of Business Economics and Entrepreneurship International Review (2017 No.3-4)
© Filodiritto Editore – Proceedings
capability. There are strong theoretical reasons to accept the influence of individual capability
on the relationship between motivation and outcome (e.g. resource accessibility and necessary
opportunities for the display of behavior). More specifically, the theory of planned behavior has
been successful in predicting the other sub-group behaviors of volitional control. Therefore,
with a deeper understanding of the effect of motivations on growth, one can benefit from
simultaneous evaluation of resources and the accessibility of opportunities for growth
(Wiklund, Shepherd, 2003). The role of intentions in this theory is central, since intentions
determine the motivational factors that affect behavior. Intentions show signs of the individual’s
work intensity and amount of planned efforts to produce behavior. As a general rule, the
stronger the intention involved in a behavior, the more likely the behavior is to occur. Along
with personal evaluations of behavioral control, intentions predict a range of behaviors
(Wiklund, Shepherd, 2003). Attitude toward behavior is a result of how an individual evaluates
the desirability of his behavior and what outcome he expects to receive as the feedback of his
behavior (behavioral beliefs). Subjective norms refer to the social pressures perceived by the
individual. These pressures are applied by key people in life to institutionalize specific
behaviors (Ajzen, 1988). Behavioral control refers to the perception of the difficulty of
performing that behavior; besides, existing deficiencies in personal perception and the external
obstacles can hinder the ability to perform a behavior. Therefore, the perception an individual
has of controlling his behavior before performing an action affects the results of his behavior.
The foundation of the beliefs that lead to behavioral control are rooted in the past experience
of an individual and his prediction of future obstacles (Ajzen, 1988).
The Relationship between the Theory of Planned Behavior and Business Growth
In entrepreneurship literature, Sexton and Bowman (1991) argue that the motivation and
aspiration to growth of managers or founders of small and medium-sized enterprises could
cause a series of limitations to the growth of such businesses. While some of these businesses
have significant growth potentials, the motivation of the manager could prevent the business
from reaching the expected growth level and slow down the business growth rate. However,
motivations and aspiration of the manager is not the only reason for growth limitation and the
following factors could also limit the growth of small and medium-sized enterprises:
inappropriate business environment, the mismatch between motivations and aspiration of the
manager and his capabilities, and the deficiency of business resources. Therefore, this argument
shows that in the model of planned behavior in which growth is a function of aspiration to
growth, other factors such as market, entrepreneurial capabilities and abilities as well as
organizational resources could also affect business growth (Shepherd, Wiklund, 2005). Studies
indicate a relationship between some of the motivational patterns of the managers and founders
of small and medium-sized entrepreneurial enterprises and the growth of their businesses. These
motivational patterns include: need for power, need for success, and internal locus of control.
These are the motivational characteristics of entrepreneurs; in other words, in a proper
environment with abundant opportunities, entrepreneurs with such motivations tend to have
higher chances of success. Studying the motivational factors of the managers of high growth
and low growth businesses, Miner et al., (1994) identified manager’s motivation for future
planning of the business and innovation as the two critical factors resulting in the growth of
high growth businesses (Shepherd, Wiklund, 2005). Furthermore, the effect of motivations on
behavior is a function of the willingness of an individual to decide for acting toward the
intended behavior as well as the possibility that the action to perform the behavior would lead to
desired outcome. In other words, the control of an individual over his behavior affects the
intensity of the relationship between aspiration and behavior. On the other hand, behavioral
control is affected by individual’ access to resources and opportunities for displaying the
intended behavior (Wiklund, Shepherd, 2003).

Faculty of Business Economics and Entrepreneurship International Review (2017 No.3-4) 93
© Filodiritto Editore – Proceedings
Regarding the literature review, the following hypotheses are proposed:
H1: aspiration to growth of a business manager has a positive significant effect on his
behavior (i.e. business growth).
H2: personal characteristics of a business manager have a positive significant effect on his
aspiration to growth.
H3: business environment characteristics have a positive significant effect on aspiration to
growth of the business manager.
H4: business characteristics have a positive significant effect on aspiration to growth of the
business manager.
H5: the aspiration to growth of a manager has a positive significant effect on behavioral
control variables that affect business growth.
Fig. 1. Conceptual Framework of the Study
Based on the above discussion, Fig. 1 shows the conceptual framework of the study which
depicts the relationship between aspiration to growth of a business manager and his behavior
toward business growth, and also shows how the components affecting aspiration to growth of
the manager indirectly affect his behavior toward business growth and how behavioral
moderating variables could accelerate or hinder growth. This conceptual framework employs
Wiklund and Shepherd’s model (Shepherd, Wiklund, 2005) in order to assess the direct
relationship between aspiration to growth of the manager and his behavior toward business
growth, and to determine the effect of behavioral moderating variables; also, to examine the
effect of the components affective on aspiration to growth of the manager, a GEM study model
has been used.
Selection of the Variables, Data Collection and Data Analyses
Selection of the Variables
The dependent variable in this study is the behavior of the manager toward business growth
which could be described and measured using various methods. For Example, increase in the
number of employees, market share, financial turnover, added value, sales, profitability and the
increase in the size of the business all imply business growth which results from the manager’s

94 Faculty of Business Economics and Entrepreneurship International Review (2017 No.3-4)
© Filodiritto Editore – Proceedings
behavior toward business growth (McMahon, 2013). Unlike previous studies, the present
research examines the psychological factors (aspiration to growth of managers) that affect
business growth.
In line with the previous studies (Shepherd, Wiklund, 2005), although there is a relationship
between the aspiration to growth of a business manager and the real business growth, this
relationship is complicated and depends on the manager’s level of training and experience as
well as the business environmental dynamism. The high level of the training and experience of
the manager as well as the high dynamism of the business environment result in a positive
relationship between aspiration to growth of the manager and the real business growth. To
explain the nature of the relationship between growth motivation of the manager and the growth
of the small business, this chapter emphasized the importance of the human capital of a small
business manager, accessibility to financial resources and business environmental dynamism.
Sample, Data Collection and Data Analyses
In terms of purpose, this study is an applied research; and in terms of conduct, it is a mixed
method (qualitative – quantitative) research. The required data were gathered through design
and distribution of questionnaire, then the theoretical framework of the research was tested and
the factors were prioritized.
The statistical population of the study includes the following two groups:
Group 1: High growth exporting manufacturing firms – selected exporting
manufacturing firms in the province of Tehran that met one or more criteria of growth. Deep
interviews were conducted with 6 manager of manufacturing firms until data saturation was
reached.
Group 2: Exporting manufacturing firms without considering growth level – in this
stage of sampling, in order to test the results from the previous stage, regardless of any criteria,
the study questionnaires were sent randomly to exporting manufacturing firms in the province
of Tehran.
To determine the sample size in stage 1, sampling continued to the point of saturation, and
in stage 2 a total of 100 exporting manufacturing firms in the province of Tehran were
randomly selected.
Convenience sampling is the sampling technique used in the present study and to identify
factors and motivations effective on business growth, semi-structured interviews were
conducted with the managers of the selected exporting manufacturing firms.
Distribution of the Questions inside Questionnaire
Table 1. The Distribution of the Questions inside Questionnaire
Question No. Issue Examined
1,2,3,4,16 Type and level of growth and the factors affecting growth
5,6,7,8 Challenges and obstacles on the way to growth
8 Growth challenges on a new path
10,11 Level of satisfaction from the growth of business and revenue 28,12,27,29,30,33 Level of challenge acceptance, types of challenges and overcoming challenges
13 Factors effective on risk taking
14 Level of using skills and energy
18,19 Level of independence and impressionability of the manager in decision making
21,22 New goals for future growth of the business
23,33 Methods of opportunity recognition
23,24 Level of cooperation of other organization members for growth
25,26 The effect of economic and political conditions on growth

Faculty of Business Economics and Entrepreneurship International Review (2017 No.3-4) 95
© Filodiritto Editore – Proceedings
Table 2. Interviewees
Company Name Position of the
Interviewee Experience
Iran Boress Co. CEO 38 years of experience as a manager
and 20 years at the previous position
Chemie Ma-dani Hamadan Co.
(CMHCO) CEO 30 years of experience as a manager
Sanaye Varagh Iran Co. CEO 34 years of experience as a manager
Vanda CEO 15 years of experience as a manager
Khorram Paint Brush Production Co. CEO 10 years of experience as a manager
Kaleh Co. CEO 40 years of experience as a manager
The questionnaire in the present study is designed by the researcher based on interview
results and with the help of the professors and the experts.
Study variables
Fig. 2. Division of Questions inside the Questionnaire Based the on Conceptual Framework
Fig. 2. shows separately which questions in the questionnaire evaluate which elements in the
conceptual framework
Empirical results
Demographic characteristics of subjects
Age of the managers
The distribution and frequency of the age of managers, which is one of the demographic
characteristics, are shown separately in the table below.
Table 3. Age of the Managers
Age Frequency Percentage Valid Percentage Cumulative Percentage
30 or less 11 15.9 15.9 15.9
30 – 35 7 10.1 10.1 26.1
35 – 40 15 21.7 21.7 47.8
40 – 45 13 18.8 18.8 66.7
45 or more 23 33.3 33.3 100.0
Total 69 100.0 100.0

96 Faculty of Business Economics and Entrepreneurship International Review (2017 No.3-4)
© Filodiritto Editore – Proceedings
Education Level of the Participants
The table below compares the frequency of study participants based on their education level.
Table 4. Education Level of the Participants
Level of Education Frequency Percentage Valid Percentage Cumulative Percentage
Undergraduate 41 59.4 59.4 59.4
Graduate 24 34.8 34.8 94.2
PhD and above 4 5.8 5.8 100.0
Total 69 100.0 100.0
Work Experience of the Participants
The table below compares the frequency of the subjects based on their work experience.
Table 5. Work Experience of the Participants
Work Experience Frequency Percentage Valid Percentage Cumulative Percentage
5 years or less 4 5.8 5.8 5.8
5 – 10 years 12 17.4 17.4 23.2
10 – 15 years 8 11.6 11.6 34.8
15 – 20 years 16 23.2 23.2 58.0
20 years or more 29 42.0 42.0 100.0
Total 69 100.0 100.0
Managerial Work Experience of the Participants
The table below compares the frequency of the subjects based on their Managerial Work
Experience.
Table 6. Managerial Work Experience of the Participants
Managerial Work Experience Frequency Percentage Valid Percentage Cumulative Percentage
5 years or less 20 29.0 30.8 30.8
5 – 10 years 15 21.7 23.1 53.8
10 – 15 years 8 11.6 12.3 66.2
15 – 20 years 13 18.8 20.0 86.2
20 years or more 9 13.0 13.8 100.0
Total answered 65 94.2 100.0
Unanswered 4 5.8
Total 69 100.0
Business Launch Experience
The table below compares the frequency of the subjects based on their business launch
experience. Table 7. Business Launch Experience of the Participants
Business Launch
Experience Frequency Percentage Valid Percentage Cumulative Percentage
Without business launch
experience 30 43.5 43.5 43.5
One business 12 17.4 17.4 60.9
More than one business 27 39.1 39.1 100.0
Total 69 100.0 100.0

Faculty of Business Economics and Entrepreneurship International Review (2017 No.3-4) 97
© Filodiritto Editore – Proceedings
Descriptive Indices of Study Variables
The descriptive indices of study variables are presented in the table below. This table shows
the frequency of the answers and the maximum score given by the participants to each
questionnaire statement. To determine the central tendency of the scores, the mean index for
each statement is calculated and the standard deviation index is used to determine the frequency
of the scores.
In terms of purpose, this study is an applied research; and in terms of conduct, it is a mixed
method (qualitative – quantitative) research. The required data were gathered through design
and distribution of questionnaire, then the theoretical framework of the research was tested and
the factors were prioritized. The statistical population of the study is divided in two groups. The
first group were the selected exporting manufacturing firms in the province of Tehran that met
one or more criteria of growth and deep interviews were conducted with 6 manager of exporting
manufacturing firms until data saturation was reached. In the second stage of sampling, in order
to test the results from the previous stage, regardless of any criteria, a number of exporting
manufacturing firms in the province of Tehran were randomly selected using the questionnaire
tool.
Validity and Reliability of the Measurement Tool
The Reliability Analysis of Measures and Constructs
To determine the reliability of measures in PLS, we calculate their factor loadings. This
criterion shows the correlation of these measures in the associated construct. According to
Hulland (1999) the minimum acceptable loading value for each measure is 0.4 and the measures
with less loading values should be eliminated from the testing process (Hulland, 1999). To
determine the reliability of the constructs, Cronbach’s Alpha index and Composite Reliability
index are used. The table below, presents these indices for each construct in the study:
Table 8. The Reliability of the Constructs (The Final Model)
Construct Composite Reliability Cronbach’s Alpha
BControl 0.840 0.762
Business 0.819 0.667
Environment 0.854 0.783
Behavior 0.831 0.721
Aspiration 0.896 0.867
Aspiration 0.838 0.759
Statistical research references believe the minimum acceptable value for Cronbach’s Alpha
is 0.6 (Moss et al., 1998) and the minimum acceptable value for Composite Reliability index is
0.707 (Chin, 1998). As shown in the table above, all of the study constructs meet these
requirements and are even well beyond those minimum values. Therefore, the reliability of
study constructs is supported.
Convergent validity of Study Constructs
According to Chin (1998) Average Variance Extracted is a proper index to determine the
convergent validity of study constructs. He believes the minimum acceptable value for this
coefficient is 0.5 (Chin, 1998). Examining this index among study constructs shows that for all
the constructs in this study, the value of this index is much higher than the mentioned threshold
and therefore, in terms of convergent validity, the constructs of the study are in very good
shape. The details of this analysis are given in the table below.

98 Faculty of Business Economics and Entrepreneurship International Review (2017 No.3-4)
© Filodiritto Editore – Proceedings
Table 9. Convergent Validity of Study Constructs
Construct AVE
BControl 0.520
Business 0.603
Environment 0.537
Behavior 0.623
Aspiration 0.520
Aspiration 0.511
Discriminant validity of Study Constructs
As maintained by Akin et al., (2009), measures chosen to explain a specific variable must
only explain that variable. To this end, the square root of average variance extracted for each
construct is compared to the inter-construct correlation coefficients (Akin et al., 2009(. The
table below shows this comparison for the constructs of the present study:
Table 10. Discriminant Validity of Study Constructs
BControl Business Environment Behavior Aspiration Aspiration
BControl 0.721
Business 0.571 0.776
Environment 0.496 0.653 0.732
Behavior 0/511 0.441 0.382 0.788
Aspiration 0/563 0.716 0.674 0.439 0.721
Aspiration -0.449 -0.560 -0.666 -0.291 -0.627 0.714
Because the square root of average variance extracted for all constructs are higher compared
to the correlation of that construct with other constructs of the study, discriminant validity is
supported for all of the study constructs.
Research Findings
By applying the theory of planned behavior on business growth, the present research seeks
to achieve a deeper understanding of the effect of personal motivations (aspiration to growth of
managers) on their growth behavior (business growth). By discussing the theory of planned
behavior, this study aims to identify the relationship between aspiration to growth of business
managers and their behavior toward business growth with regards to the mediating variables
that affect this relationship and by mentioning the theory of planned behavior. Then, the study
presents the results of experiments based on the given relationships.
The descriptive indices for the study variables include the frequency of the statements, the
minimum and maximum scores given by the respondents to each statement, to determine the
central tendency of the scores the mean index for each statement is calculated and the standard
deviation index is used to determine the frequency of the scores. In the next stage of data
analysis, the distribution of the scores of the variables are examined in terms of normality, since
normal distribution is an essential requirement to use parametric approach in data analysis. If
the distribution of the scores of the variables are not normal, one should use non-parametric
approaches and other proper methods for data analysis. To determine the distribution of
variables in this study, the two tests of Kolmogorov-Smirnov and Shapiro-Wilk are used
simultaneously. Because the significance level for all the variables in both tests are equal to
0.00 and smaller than 0.05, the zero hypothesis (the normality of the distribution) is rejected and
its negation is supported for all the variables. In other words, these variables could not be
considered to have normal distributions. Therefore, the data of the present model and the

Faculty of Business Economics and Entrepreneurship International Review (2017 No.3-4) 99
© Filodiritto Editore – Proceedings
hypotheses of the study must not be analyzed with parametric statistical assumptions and one
must implement the proper approach to deal with such data.
Table 11. Summary Results of Hypotheses Testing
Hypothesis Descriptions Rejection/Acceptance of
the Hypothesis
1 - Aspiration to growth of a
business manager has a positive
significant effect on his behavior
(i.e. business growth).
Aspiration has a positive (γ=0/439)
significant (T=6/857, <1/96) effect on
behavior (business growth) and the main
study hypothesis is supported.
Accepted
2 - Personal characteristics of a
business manager have a positive
significant effect on his
aspiration to growth.
Personal characteristics have a positive
(γ=0.034) significant (T=3/757, <1/96)
effect on the aspiration to growth of a
manager and the second study hypothesis
is supported.
Accepted
3 - Business environment
characteristics have a positive
significant effect on aspiration to
growth of the business manager.
Business environment characteristics
have a positive (γ=0/639) significant
(T=21/678, <1/96) effect on aspiration to
growth of the manager and the third study
hypothesis is supported.
Accepted
4 - Business characteristics have
a positive significant effect on
aspiration to growth of the
business manager.
Business characteristics have a positive
(γ=0/420) significant (T=14/548, <1/96)
effect on aspiration to growth of the
manager and the fourth study hypothesis
is supported.
Accepted
5 - The aspiration to growth of a
manager has a positive
significant effect on behavioral
control variables that affect
business growth.
The aspiration to growth of a manager
has a positive (γ=0/564) significant
(T=9/772, <1/96) effect on behavioral
control variables and the fifth study
hypothesis is supported.
Accepted
Conclusion
Based on the study hypotheses and the results of the questionnaire data analysis, it is evident
that the aspiration to growth of a manager has direct positive effect on his behavior toward
business growth. Thus, the higher the aspiration to growth, the more growth the manager attains
in his business. Because the increase of aspiration level pushes the manager to try harder to
reach his goal, which in here is business growth. In this study, three effective factors on the
aspiration to growth of managers were examined: personal characteristics of manager, business
environment characteristics, and business characteristics. Regarding the personal characteristics
of manager which affect his aspiration to business growth, it was found that managers with
higher levels of education and more experience in launching and managing businesses have
higher motivations to grow their own businesses. Besides, those managers with higher levels of
skills required for business growth, those who are more risk taking and those who possess
higher human and social capital, have shown more aspiration to grow their own businesses and
this aspiration has affected their behavior toward business growth and therefore they have
achieved more and faster growth in their businesses (compared to those managers who have
lower levels of these characteristics). Regarding the business environment characteristics, those
managers who have their businesses in proper environments have shown higher aspirations to
grow their businesses compared to those who did not enjoy such environmental desirability.
Here environmental desirability refers to environmental dynamism, level of environmental
friendliness, the existence of supporting policies and the level of business specialty in relation
to the environment. It also entails the level of professional practice of the business within the
environment, possession of high competitive advantage in relation to brand power, technology

100 Faculty of Business Economics and Entrepreneurship International Review (2017 No.3-4)
© Filodiritto Editore – Proceedings
level and human and social capital. This aspiration to growth affects the behavior of managers
toward business growth and therefore they achieve more and faster growth in their businesses.
The findings of this research suggest that the factor of environment characteristics has more
effect on the aspiration to growth of managers compared to the other two factors of personal
and business characteristics.
The findings of the present research support the previous studies. Those studies indicated
that although there is a relationship between the aspiration to growth of a business manager and
the real business growth, this relationship is complicated and depends on the manager’s level of
training and experience as well as the business environmental dynamism. The high level of the
training and experience of the manager as well as the high dynamism of the business
environment result in a positive relationship between aspiration to growth of the manager and
the real business growth. To explain the nature of the relationship between growth motivation
of the manager and the growth of the small business, this chapter emphasized the importance of
the human capital of a small business manager, accessibility to financial resources and business
environmental dynamism (Shepherd, Wiklund, 2005). The overall findings of the study suggest
that the managers of small and medium-sized enterprises who have higher aspirations to grow
their businesses achieve higher levels of business growth; however, human capital (higher
levels of education and specific experience in relation to business launch and management),
manager’s motivations for growth, the skill level of managers and employees, the level of risk
taking of the manager, environmental desirability, the level of professional practice within the
environment, as well as possessing enough knowledge and expertise could increase the
aspiration to growth of a manager toward reaching higher levels of business growth.
REFERENCES
1. Akin–T, M., Bloemhof-Ruwaard, J., Wynstra, F., Raaij, E. V. (2009). The impact of supply
chain-related factors on the environmental performance of manufacturing firms in Turkey. Paper
presented at the 18 th IPSERA Conference Supply Management owards an Academic. 2. Autry, C. W., Griffis, S. E., Goldsby, T. J., Bobbitt, L. M. (2005). Warehouse management
systems: resource commitment, capabilities, and organizational performance. Journal of
Business Logistics, 26(2), 165-183. 3. Bradley, S.W., Wiklund, J., Shepherd, D.A. (2011). Swinging a double-edged sword: The effect
of slack on entrepreneurial management and growth. 4. Chanut-Guieu, C., Guieu, G.C. (2014). High growth trajectories in small and medium sized
enterprises: a comparative study.
5. Chin, W. W. (1998). The partial least squares approach to structural equation modeling. Modern
methods for business research, 295(2), 295-336 . 6. Dang-Duc, S. (2011). Compliance with accounting standards by SMEs in transitional
economies: evidence from Vietnam
7. El-Gohary, H., Eid, R. (2013). Choice of export entry mode by developing economies SMEs an
empirical investigation of Egyptian SMEs.
8. Gird, A., Bagraim, J.J. (2008). the theory of planned behavior as predictor of entrepreneurial
intent amongst final-year university students.
9. Hulland, J. (1999). Use of partial least squares (PLS) in strategic management research: a review
of four recent studies. Strategic management journal, 20(2), 195-204. 10. Iraj Hashi and Besnik A. Krasniqi, (2010). Entrepreneurship and SME growth: evidence from
advanced and laggard transition economies.
11. Jackson, D. L., Voth, J. Frey, M. P. (2013). A note on sample size and solution propriety for
confirmatory factor analytic models. Structural Equation Modeling: A Multidisciplinary Journal,
20(1), 86-97. 12. Kautonena, T., Van Gelderen, M. (2013). Predicting entrepreneurial behavior: a test of the
theory of planned behavior.
13. Littunen, H., Niittykangas, H. (2010). the rapid growth of young firms during various stages of
entrepreneurship.
Faculty of Business Economics and Entrepreneurship International Review (2017 No.3-4) 101
© Filodiritto Editore – Proceedings
14. Majocchia, A., Bacchiocchib, E., Mayrhofer, U. (2005). Firm size, business experience and
export intensity in SMEs: A longitudinal approach to complex relationships.
15. Moss, S., Prosser, H., Costello, H., Simpson, N., Patel, P., Rowe, S., Hatton, C. (1998).
Reliability and validity of the PAS‐ADD Checklist for detecting psychiatric disorders in adults
with intellectual disability. Journal of Intellectual Disability Research, 42(2), 173-183. 16. Schmidt, S. J., Mueller, D. R., Roder, V. (2011). Social cognition as a mediator variable between
neurocognition and functional outcome in schizophrenia: empirical review and new results by
structural equation modeling. Schizophrenia bulletin, 37(suppl 2), S41-S54.
17. Shepherd, D.A., Wiklund, J. (2005). Entrepreneurial Small Businesses, chapter 2 and 3.
18. Van Gelderen, M., Brand, M. (2008). Explaining entrepreneurial intentions by means of the
theory of planned behavior.
19. Wiklund, J., Shepherd, D.A. (2003). Aspiring for, and Achieving Growth: The Moderating Role
of Resources and Opportunities.
20. Wiklund, J., Davidsson, P. (2003). What Do They Think and Feel about Growth? An
Expectancy-Value Approach to Small Business Managers’ Attitudes toward Growth.
21. Wiklund, J., Patzelt, H., Shepherd, D.A. (2007). Building an integrative model of small business
growth.
22. Yazdanfar, D., Öhman, P. (2014). Life cycle and performance among SMEs: Swedish empirical
evidence.
Article history:
• Received 1 September 2017
• Accepted 29 November 2017

102 Faculty of Business Economics and Entrepreneurship International Review (2017 No.3-4)
© Filodiritto Editore – Proceedings
ORIGINAL SCIENTIFIC PAPER
Customer Service Quality Management in Public
Transport: The Case of Rail Transport in Tanzania
LWESYA Francis27, JAFFU Richard28
Abstract
The main objective of the study was to assess customer service quality management by
taking into account the factors affecting the service quality in rail transport sector. To achieve
the study objectives, we use descriptive statistics and regression analysis. We adopted a dual
pronged view of internal customers (employees) and external customers (clients) by focusing on
the skills and qualifications of customer contact personnel in service encounters, incentives,
staff training, working tools and other operational facilities. For the case of external customers,
quality service dimensions as synthesized in SERVQUAL model were used.
The results show that customers’ expectations of service quality are accurately predicted by
service providers along each of the service quality dimensions except the reliability dimension.
This shows that there is a gap between service delivered and external communication of rail
transport services and this difference is related to the performance of the promised service
accurately and dependably. This gap seemed to be attributed to by the shortage of working
tools, aging equipments and other operational facilities on the part of customer contact
personnel thereby distracting clients in assessing rail transport services and thus creating the
difference on what is expected by clients and what is really provided by service providers.
Thus, the study recommends incorporating total quality management in the delivery of rail
transport services. Working tools and other operational facilities should be provided to
employees in order to enhance performance and job satisfaction. Employees particularly the
customer contact personnel should be regularly trained to keep them abreast with current trends
in clients handling techniques consistent to meeting their requirements and wants. Drawing
lessons from other competitors like what is happening in road transport or air transport will help
setting quality standards.
Keywords: Customer Service Quality Management, Quality Service, SERVQUAL, Quality Gap
JEL: M10, L10, L80
UDK: 005.336.3:656.222(678)
005.346
COBISS.SR-ID 253511948
Introduction
Today due to embracing globalization and trade liberalization policies in the world, the
business environment has become more competitive. Customers on the other hand are more
27 Department of Business Administration, School of Business Studies and Economics, University of
Dodoma, Tanzania, [email protected] 28 Department of Business Administration, School of Business Studies and Economics, University of
Dodoma, Tanzania

Faculty of Business Economics and Entrepreneurship International Review (2017 No.3-4) 103
© Filodiritto Editore – Proceedings
alert and conscious of the prevailing business environment; as a result, they tend to prioritize
quality in determining where to acquire a certain service or where a certain product is to be
bought. This in turn has necessitated putting quality at the centre in the delivery of services in
both public and private organizations. However, according to Anable (2005) and Oliver (1981),
many public-sector organizations including transportation services are created by governments
with an intention not to compete in the open market, instead their objective is to fulfill the needs
of the common public. In contrast to this earlier view, Behwal (2010) and Dridi et al., (2005)
argue that public transport services, must follow regular schedules, be safe and rapid, guarantee
high service quality, utilize resources efficiently and meet users’ need. Thus, in order to keep
and attract more customers and fulfill their needs, public transport must have high service
quality to satisfy and meet a wider range of customers’ needs. Nashappi et al., (2014), state that
service providers who are unable to effectively cater to the needs and wants of customers, are
risking not only by losing dissatisfied customers to competitors, but also an ultimate erosion of
profits and consequently failure.
Rail transport can be one of the most reliable means of transportation for both passengers
and traffic in developing countries. This is because it is relatively cheaper, convenient and can
cater the needs of the poor people. According to African Development Bank report (2015), rail
transport as a result of its energy efficiency, reduced greenhouse gas emissions and lower cost
per ton kilometer, is expected to play an increasingly important role in the conveyance of
freight over long distances. In comparison to other means of transportation, railways are
particularly useful in mass transit systems for both inter-city and urban settings. Olievschi
(2013) argues that increasing the volumes of traffic is not sufficient to make a railway system
financially viable, it is also necessary to make it competitive. This means providing quality
transport services (price, speed, availability, punctuality, etc) which are ultimately superior to
the competition; only then can railway systems become an attractive option for shifting part of
the existing road traffic to rail, or for putting on rail the new volumes of freight generated by the
economic development of the countries.
Tanzania enjoys two forms of railway transport systems with a total of 3676 kilometers of
railway lines. One is run jointly between Tanzania and Zambia (Tanzania and Zambia Railway
Authority-TAZARA) and the other one is owned and run by United Republic of Tanzania,
namely the Tanzania Railway Corporation (TRC). TAZARA line is 1860 kilometers in length,
of which 975 kilometers is in Tanzania and 885 kilometers in Zambia. It is handling cargo for
the countries of Malawi, Zambia, Zimbabwe and Democratic Republic of Congo. The mainline
of TRC comprises the central corridor between the port of Dar-Es-salaam in the east, linking
central and western areas of the country and terminating at Kigoma on Lake Tanganyika in the
west. It handles cargo for landlocked countries of Burundi, Rwanda, and eastern part of
People’s Republic of Congo. Railway transport is the second most important mode of transport
after road and is critical for long distance freight along the main transport corridors. However,
recently the performance of railway transport has not been impressive and since railway
transport is run by government organizations in many developing countries, there are concerns
over neglecting the concept of total quality management in their day to day operations, a factor
which to some extent deters clients from using railway transportation systems. Therefore, this
paper is set to take stock the services offered by railway transport in light of customer service
quality management and fills the study gap that exists in Tanzania.
Objectives of the Study
The overall objective of the study is to assess customer service quality management in
public transport. The specific objectives of the study were:
1. To examine the customer service satisfaction or dissatisfaction
2. To assess quality management systems

104 Faculty of Business Economics and Entrepreneurship International Review (2017 No.3-4)
© Filodiritto Editore – Proceedings
3. To determine the problems facing rail transport customers
Research Questions
1. What factors are responsible for quality service shortfalls?
2. What is the gap between customer expectations and management perception of
customers’ expectation?
3. Are service quality specifications different from the actual service delivered?
Research Hypothesis
• H0= There is no positive relationship between service quality dimensions and client’s
satisfaction
• H1= There is a positive relationship between service quality dimensions and client’s
satisfaction
Literature Review
Service have been defined as originally intangible and relatively quickly perishable
activities whose buying take place in an interaction process aimed at creating customer
satisfaction but during this interactive consumption this does not always lead to material
possession (Kasper et al., 1990). Ramaswamy (1996), described service as business transactions
that take place between a donor (services provider) and receiver (customer) in order to produce
an outcome that satisfies the customers. While Gronroos (1990), pointed out that a service is an
activity or series of activities of more or less intangible nature that normally, but not necessary,
take place in interaction between customer and service employees and or service provider,
which are provided as solutions to customer problems. On the other hand, Lahtinem (1983)
defines service quality as a result from a comparison of what customer feel service provider
should offer (expectation) with provider actual performance. Parasiraman, Zeitham, and Berry
(1985) viewed quality as the degree and direction of discrepancy between customers’ services
perception and expectations while Denton (1996:91) defines service quality, as a one, which is
measured by the different between the expectation of customer and customer perceived level of
service delivered.
Provision of quality service to customers has become of focus of many organizations.
Customer satisfaction is recognized as being of paramount importance for the existence of any
organization. Eboli and Mazulla (2007) investigated service quality attributes important for
customer satisfaction with a bus transit service in Cosenza, Italia. According to them,
respondent was asked to rate the importance and satisfaction with 16 service quality attributes
(bus stop availability, route characteristic, frequency, reliability, bus stop furniture, bus
overcrowding, cleanliness, cost, information, promotion, safety on board (drivers character),
personal security, personnel, complains and its handling, environmental protection and bus stop
maintenance). According to the result of the research customers’ satisfaction is closely related
with transport service planning which is reflected in reliability, frequency, information,
promotion, personnel and complaint. Rasheed (2016), states that excellent service affects the
retention of existing customers and inducement of new customers. As a result, it brings high
customer retention and satisfaction that helps them for sustainable development of the
company. Traditionally, the performance indicators for public transport are divided into two
categories: efficiency and effectiveness. Under the efficiency category, the measures are
concerned with the process that produce the services while the effectiveness category are used
to determine how well the services provided are with respect to the objectives that are set for
them (Pullen,1993). William and James (1995) in understanding service management discussed
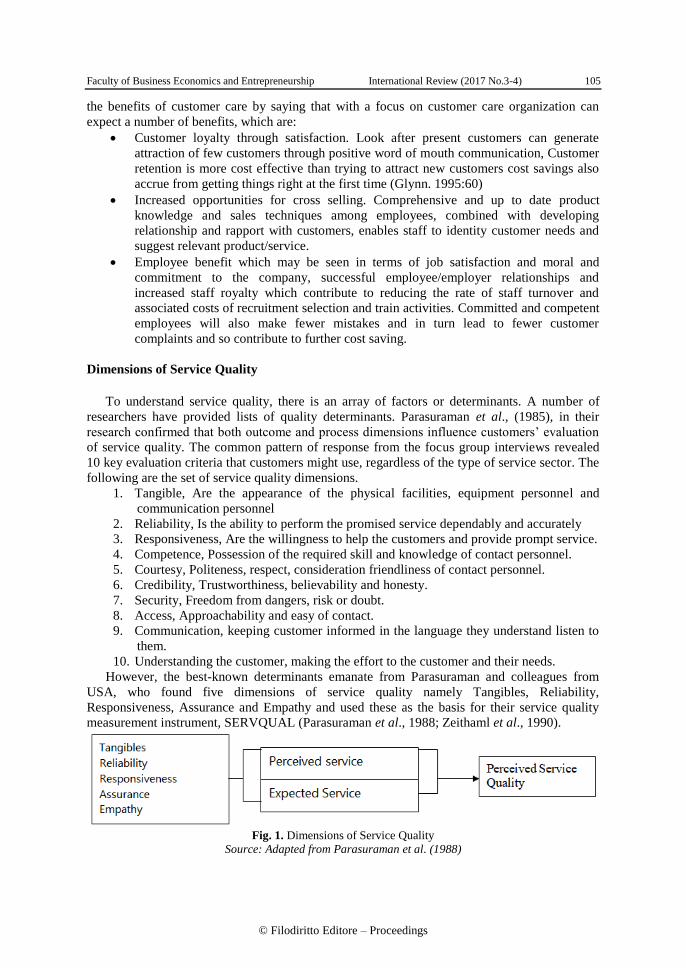
Faculty of Business Economics and Entrepreneurship International Review (2017 No.3-4) 105
© Filodiritto Editore – Proceedings
the benefits of customer care by saying that with a focus on customer care organization can
expect a number of benefits, which are:
• Customer loyalty through satisfaction. Look after present customers can generate
attraction of few customers through positive word of mouth communication, Customer
retention is more cost effective than trying to attract new customers cost savings also
accrue from getting things right at the first time (Glynn. 1995:60)
• Increased opportunities for cross selling. Comprehensive and up to date product
knowledge and sales techniques among employees, combined with developing
relationship and rapport with customers, enables staff to identity customer needs and
suggest relevant product/service.
• Employee benefit which may be seen in terms of job satisfaction and moral and
commitment to the company, successful employee/employer relationships and
increased staff royalty which contribute to reducing the rate of staff turnover and
associated costs of recruitment selection and train activities. Committed and competent
employees will also make fewer mistakes and in turn lead to fewer customer
complaints and so contribute to further cost saving.
Dimensions of Service Quality
To understand service quality, there is an array of factors or determinants. A number of
researchers have provided lists of quality determinants. Parasuraman et al., (1985), in their
research confirmed that both outcome and process dimensions influence customers’ evaluation
of service quality. The common pattern of response from the focus group interviews revealed
10 key evaluation criteria that customers might use, regardless of the type of service sector. The
following are the set of service quality dimensions.
1. Tangible, Are the appearance of the physical facilities, equipment personnel and
communication personnel
2. Reliability, Is the ability to perform the promised service dependably and accurately
3. Responsiveness, Are the willingness to help the customers and provide prompt service.
4. Competence, Possession of the required skill and knowledge of contact personnel.
5. Courtesy, Politeness, respect, consideration friendliness of contact personnel.
6. Credibility, Trustworthiness, believability and honesty.
7. Security, Freedom from dangers, risk or doubt.
8. Access, Approachability and easy of contact.
9. Communication, keeping customer informed in the language they understand listen to
them.
10. Understanding the customer, making the effort to the customer and their needs.
However, the best-known determinants emanate from Parasuraman and colleagues from
USA, who found five dimensions of service quality namely Tangibles, Reliability,
Responsiveness, Assurance and Empathy and used these as the basis for their service quality
measurement instrument, SERVQUAL (Parasuraman et al., 1988; Zeithaml et al., 1990).
Fig. 1. Dimensions of Service Quality
Source: Adapted from Parasuraman et al. (1988)

106 Faculty of Business Economics and Entrepreneurship International Review (2017 No.3-4)
© Filodiritto Editore – Proceedings
Service Quality Gap
Quality of service is measured by difference between expectations of the customer on the
one hand and the customer perceived level of service delivered on the other hand, the gap
between two points represents the size of service problem. Feedback from the customer is
necessary for maintaining or improving the quality of service being delivered. Deviation or
service problem could occur because of the following reasons;
• Service standard may be too high to be achieved, in which case the standards need to
be changed.
• The personnel may not be in position to deliver the required service because they were
not trained properly. If the front-line service provided are not properly trained or
qualified to do the job then the service performance standard cannot be met.
• It could be the neglect of service provider, it is possible to train and motivate service
providers.
• Could occur because the service provider could notify too late about the services
needed by customer.
Kotler (1997) identified five gaps of service quality that cause unsuccessful service delivery,
these are;
• A gap between the customer expectation and management perceptions. Here
management does not always receive correctly what customer want.
• A gap between management perception and service quality specification. Here
management might correctly perceive the customer want but do not set specific
performance standards.
• A gap between service quality specification and actual service delivered. Here the
personnel might be poorly trained or incapable of, or unwilling to meet the standard or
they may be held to conflicting standards.
• A gap between perceived service and expected service. This gap occurs when
customer misperceives quality.
In order to address quality service gaps in a company/organization, internal marketing is
key. Internal marketing signifies the work done by the company to train and motivate the
employees to save the customers. The company must treat the employees as the first customers
by training the so as to be able and willing to deliver desired level of service to their external
customers. Also, organization should carry out research among employees to identify their
needs and attitude with respect to working conditions benefits and company policies this
research will motivate the employees by giving them rewards and fringe benefits i.e. cafeteria
benefit, health insurance, pension, housing etc. This means, satisfying the needs of internal
customers upgrade the capability to satisfy the needs of external customers. Groonroos (1985),
outlined three objectives of internal marketing which are as follows;
• Overall – To achieve motivated customer conscious and care oriented personnel
• Strategies – To create an internal environment that supports customer consciousness
and sales mindless among personnel
• Tactical – To sale service campaigns and marketing phase efforts of the company via
staff training programs and seminars
Managing Service Quality
Kotel (1991:463) states that one of the major ways to differentiate a service firm is to
deliver consistently higher quality service than competitors. The key is to meet or exceed the
target customer service quality expectations. Customer satisfaction are formed by their past
experiences, word of mouth and service firm advertising. The customer chooses service
provider on this base and after receiving the service compare the perceived service with

Faculty of Business Economics and Entrepreneurship International Review (2017 No.3-4) 107
© Filodiritto Editore – Proceedings
expected service. If the perceived service falls below the expected service, customers lose
interest in the provider. As a result, companies find that effectively handling customers with
problem is critical to their reputations as well as their bottom lines. When customer complains
and they are satisfied with the way their complaints are handled, they are more likely to
purchase another product or service from the same company. Kotler P (1997:481), States that
studies of customer dissatisfaction show that customer are dissatisfied with their purchases
about 25% of the time, only 5% complain and the rest either feel that is not worth to complain
or that they do not know to whom to complain. For all these reasons companies should need to
develop a service recovery program. As a first step, companies should make easy for
dissatisfied and complain. They should provide suggestions and complaints form. Second, the
company should empower the employees. Employees who receive complaints must be trained
and empowered to resolve customer problems speedily and satisfactorily. Studies show that the
faster the company responds to the complaints, the higher the customers’ satisfaction with the
company. Third the company should go beyond satisfying particular customers to discovering
and correcting the roots cause of the frequent problems. By studying the Patten of complaints,
the company can correct system failures that give raise to these complaints.
Methodology
This study uses descriptive statistics and regression analysis. To achieve the study
objectives, we make internal and external customers analyses. The analysis of internal
customers dwelt on the skills and qualifications of customer contact personnel in service
encounters, incentives, staff training, working tools and other operational facilities. On the other
hand, the basis of analysis for external customers was quality service dimensions as synthesized
in SERVQUAL model (Parasuraman et al., 1988; Zeithaml et al., 1990). Several studies have
provided evidence on the superiority of SERVQUAL model over others as Carrillat et al.,
(2007) suggested that both scales (i.e., SERVPERF and SERVQUAL) are adequate and equally
valid predictors of overall service quality. However, the authors believe that the SERVQUAL
scale could be of greater interest for practitioners due to its richer diagnostic value (i.e.,
comparing customer expectations of service versus perceived service across dimensions). Also,
the results of the study revealed that the need to adapt the measure to the context of the study in
the case of SERVPERF is less than in the case of SERVQUAL. It is from these views that this
study uses SERVQUAL model to assess customer service quality management in public
transport. In light of the quality service dimensions, rail transport services were evaluated in the
following perspective. Table 1. Dimensions of Service Quality
N0 Dimension Measurement
1.0 Tangible. The appearance of the
physical facilities, equipment,
personnel and communication
materials are summarized here as
under,
Physical facilities include station buildings wagons
passenger coaches, which are supposed to be physical
appealing and cleaned to reflect good ambient/
surroundings.
Equipment include computerized freight services, the
computerized advance cargo information system used for
the tracking the movement of wagons and consignment.
The contact personnel must be credible, trustworthy, and
friendly and dressed appropriately.
Communication tools should be operational i.e. in good
working condition; these are rail track (way), Radio calls,
Telephone, fax and internet to simplify communication
2.0 Reliability dimension – This is the
ability to perform the promised
service dependably and accurately,
it means to perform service right the
Supply of empty wagon for loading correct quantity,
suitable type and observing punctuality.
Removal of wagons as quickly as possible after loading.
Movement of goods and passenger train from the original
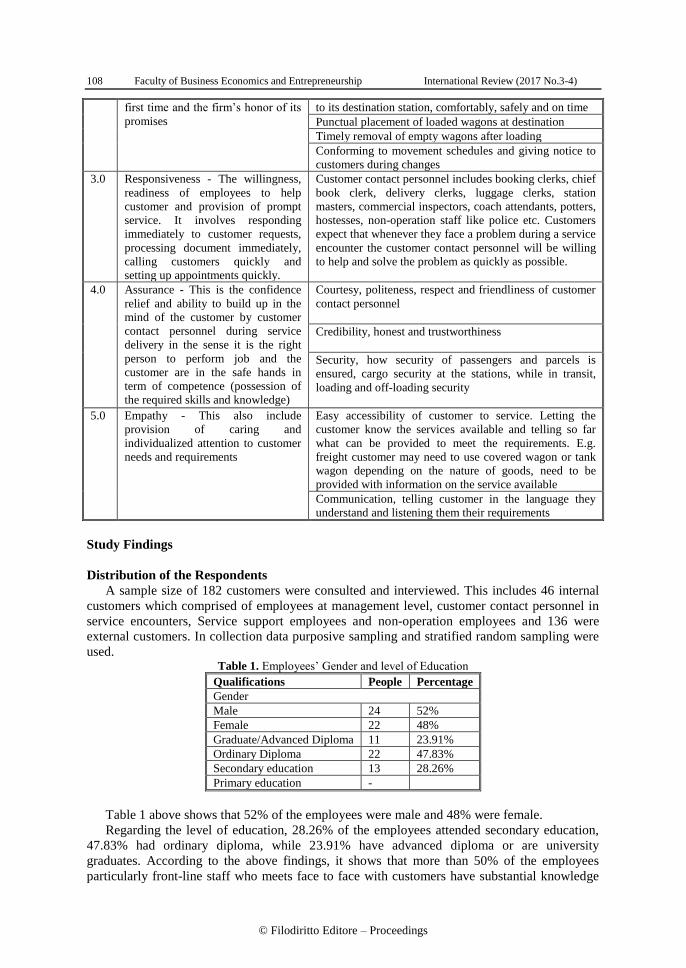
108 Faculty of Business Economics and Entrepreneurship International Review (2017 No.3-4)
© Filodiritto Editore – Proceedings
first time and the firm’s honor of its
promises
to its destination station, comfortably, safely and on time
Punctual placement of loaded wagons at destination
Timely removal of empty wagons after loading
Conforming to movement schedules and giving notice to
customers during changes
3.0 Responsiveness - The willingness,
readiness of employees to help
customer and provision of prompt
service. It involves responding
immediately to customer requests,
processing document immediately,
calling customers quickly and
setting up appointments quickly.
Customer contact personnel includes booking clerks, chief
book clerk, delivery clerks, luggage clerks, station
masters, commercial inspectors, coach attendants, potters,
hostesses, non-operation staff like police etc. Customers
expect that whenever they face a problem during a service
encounter the customer contact personnel will be willing
to help and solve the problem as quickly as possible.
4.0 Assurance - This is the confidence
relief and ability to build up in the
mind of the customer by customer
contact personnel during service
delivery in the sense it is the right
person to perform job and the
customer are in the safe hands in
term of competence (possession of
the required skills and knowledge)
Courtesy, politeness, respect and friendliness of customer
contact personnel
Credibility, honest and trustworthiness
Security, how security of passengers and parcels is
ensured, cargo security at the stations, while in transit,
loading and off-loading security
5.0 Empathy - This also include
provision of caring and
individualized attention to customer
needs and requirements
Easy accessibility of customer to service. Letting the
customer know the services available and telling so far
what can be provided to meet the requirements. E.g.
freight customer may need to use covered wagon or tank
wagon depending on the nature of goods, need to be
provided with information on the service available
Communication, telling customer in the language they
understand and listening them their requirements
Study Findings
Distribution of the Respondents
A sample size of 182 customers were consulted and interviewed. This includes 46 internal
customers which comprised of employees at management level, customer contact personnel in
service encounters, Service support employees and non-operation employees and 136 were
external customers. In collection data purposive sampling and stratified random sampling were
used. Table 1. Employees’ Gender and level of Education
Qualifications People Percentage
Gender
Male 24 52%
Female 22 48%
Graduate/Advanced Diploma 11 23.91%
Ordinary Diploma 22 47.83%
Secondary education 13 28.26%
Primary education -
Table 1 above shows that 52% of the employees were male and 48% were female.
Regarding the level of education, 28.26% of the employees attended secondary education,
47.83% had ordinary diploma, while 23.91% have advanced diploma or are university
graduates. According to the above findings, it shows that more than 50% of the employees
particularly front-line staff who meets face to face with customers have substantial knowledge

Faculty of Business Economics and Entrepreneurship International Review (2017 No.3-4) 109
© Filodiritto Editore – Proceedings
which relevant in providing good service to customers. This includes booking clerks, delivery
clerks, station masters, commercial inspectors, coach attendants, luggage clerks, train
conductors and information desktop. In analyzing the perceptions of internal customers, the
paper uses descriptive statistics. Coefficient of variation is used to measure the dispersion of
data points in a data series around the mean. It is a useful statistic for comparing the degree of
variation from one data series to another. It is calculated by Standard Deviation/Mean.
Table 2. Perceptions of the Employees
No Item Mean Standard
Deviation
Coefficient of
Variation
1.0 The employees cooperate among departments and
within departments, each department really links with
the other departments on issues that are affecting the
organization; managers are working and listening to
other managers, which lead to sharing problems and
solutions
3.8043 1.10794 29%
2.0 The management is offering employees incentives and
are given in form of free houses; leave benefits, medical
facilities when become sick, transport assistance is
provided to them, education relief and meals
allowances
3.7391 1.10423 29.5%
3.0 We are given training in order to equip us in day to day
activities in form of courses and seminars in areas like
management, marketing and traffic, commercial
inspection etc and the training given improve our
customer service knowledge and feel well trained to
interact with customers
3.5217 1.18770 33.7%
4.0 We have enough working tools necessary for customer
service, tools like gentry cranes for goods handling,
computers for keeping customers information, and
parcel weight measuring equipments
2.8478 1.24664 43.78%
5.0 We often interact with our clients to understand their
satisfaction with the services offered
4.0435 0.94178 25.9%
6.0 clients are following rules and regulations and comply
with terms set by the organization to avoid unnecessary
problems
3.8696 1.00241 25.9%
7.0 Service providers are keeping its promises to customer
satisfactorily
4.0870 0.78390 19.18%
8.0 Employees feel satisfied with the jobs they perform 3.8043 0.93380 24.5%
9.0 The employees have substantial knowledge on the
works they perform (technical know-how)
3.1957 1.36006 42.6%
10 Good supervision is the means of good performance
evaluation and that does not cause shortfalls in actual
service performance
3.9348 1.06254 27%
11 Horizontal communication leads to improved service
performance. This because customer contact personnel
might have instructions from their supervisor on how to
carry certain functions and these instructions are not
meant to conflict with customer demands
3.8043 1.20406 31.6%
12 External communication does not contribute to quality
service shortfalls. This is because communication made
to customers raises their expectations about the service
provision, the external communication made to
customers through advertisements, promotional
brochures and promises help in creating awareness to
customers of what is being provided.
4.0652 0.77179 19%

110 Faculty of Business Economics and Entrepreneurship International Review (2017 No.3-4)
© Filodiritto Editore – Proceedings
Table 2 shows the perceptions of employees. The employees gave varied opinions. In terms
of the cooperation among employees, this item had 3.8043 (76%) mean and the views of the
employees in this component were consistent with coefficient of variation of 29%. This
suggests that cooperation among departments and within departments is good, each department
really links with the other departments on issues that are affecting the organization; managers
are working and listening to other managers, which lead to sharing problems and solutions. In
terms of provision of incentives, the employees agreed that the management is offering
incentives in form of free houses; leave benefits, medical facilities when become sick, transport
assistance, education relief and meals allowances. The views expressed had the mean of 3.7391
(74%) and were consistent with the coefficient of variation of 29.5%. Regarding training, the
employees agreed that are given training in order to equip them in day to day activities in form
of courses and seminars in areas like management, marketing and traffic, commercial inspection
etc, also customer contact personnel are given training to improve their customer service
knowledge and feel well trained to interact with customers. However, regarding the working
tools, this item had the lowest mean of 2.8478 (59.9%) and the views were consistent with a
coefficient of variation of 43.78%. This suggests that employees do not have enough working
tools such as computers, loading equipments, motor vehicles and there exists a problem of
ageing equipments and other operational facilities. Lack of sufficient working tools and the
tendency of relying on aged equipments may lead to services being provided to become
substandard thereby inhibiting promptness and effectiveness in the delivery of services. In
terms of the interaction with customers, the employees agreed that they interact with customers.
This item had relatively higher mean of 4.0435 (80.9%) and the views were consistent by
25.9% coefficient of variation.
Table 3. Distribution of the Respondents
Item People Percentage
Gender
Male 84 61.8
Female 52 38.2
Education
Graduate/Advanced Diploma 22 16
Ordinary Diploma 33 24
Secondary Education 54 39.7
Primary Education 28 20.6
Age of the respondents
18-30 22 16
31-40 38 27.9
41-50 40 29.4
51-65 15 11
>66 21 15
Occupation
Civil/public 33 24
Student 21 15
Business man 58 42.6
Others 24 17.6
Monthly Income (Tanzania Shillings)
< 200,000 20 14.7
201,000-400,000 22 16
401,000-600,000 25 18
601,000-800,000 21 15
801,000-1000,000 18 13
> 1,001,000 30 22
Total 136 100%
Source: Field Survey (2017)

Faculty of Business Economics and Entrepreneurship International Review (2017 No.3-4) 111
© Filodiritto Editore – Proceedings
Of the total 136, respondents 84 (61.8%) were male and 52(38.2%) were female (Ttable 1).
Age wise, 41 to 50 years (29.4%) a group with the most respondents, followed by those
between 31 to 40 years (27.9%). Respondents between 18 to 30 years were 22 (16%) and the
relatively lower number of respondents was between 55 to 65 years (11%). This suggests that
most of the external clients who use rail transport services are below 50 years of age. The age
that is quite sensitive in terms of the kind and quality of services being provided. In terms of the
level of education most of the respondents had secondary education (39.7%), followed by those
who had diploma education (24%). Respondents who had university education were (16%) and
those who had the least education were the primary school education holders (20.6%). This
suggests that most of the respondents had at least formal education which shows that most of
the respondents could make rational decision.
In terms of the reliability test for the dimension, the items yielded a Cronbach’s alpha from
0.807 to 0.816 which is above the minimum threshold level of 0.60. Bush et al., (2006) suggest
a Cronbach’s alpha valued at less than 0.6 as unsatisfactory. According to Msabila and Nalaila
(2013), reliability has to do with quality of measurement i.e consistency or repeatability of your
measures (table 4). Table 4. Reliability Test Results
Multi-Item Scale
(Dimensions)
Cronbach’s Alpha Number of Items
Tangible 0.816 4
Reliability 0.815 6
Responsiveness 0.807 1
Assurance 0.816 3
Emphathy 0.812 2
Table 5. Results based on Dimensions of Service Quality Assessment
N0 Dimension Measurement Mean
Std
Dev
Average
Mean
Average
Std
1.0 Tangible Physical facilities include station
buildings wagons passenger
coaches, which are supposed to be
physical appealing and cleaned to
reflect good ambient/surroundings.
3.7353 1.0344
3.9448 0.8979
Equipment include computerized
freight services, the computerized
advance cargo information system
used for the tracking the movement
of wagons and consignment.
4.0441 0.8061
The contact personnel must be
credible, trustworthy, and friendly
and dressed appropriately.
3.8750 0.9770
Communication tools should be
operational i.e. in good working
condition; these are rail track (way),
Radio calls, Telephone, fax and
internet to simplify communication
4.1250 0.7740
2.0 Reliability
dimension
Supply of empty wagon for loading
correct quantity, suitable type and
observing punctuality
3.0221 1.8072
3.31618 3.1943 Removal of wagons as quickly as
possible after loading 3.0074 2.0129
Movement of goods and passenger
train from the original to its
destination station, comfortably,
3.1176 3.5674
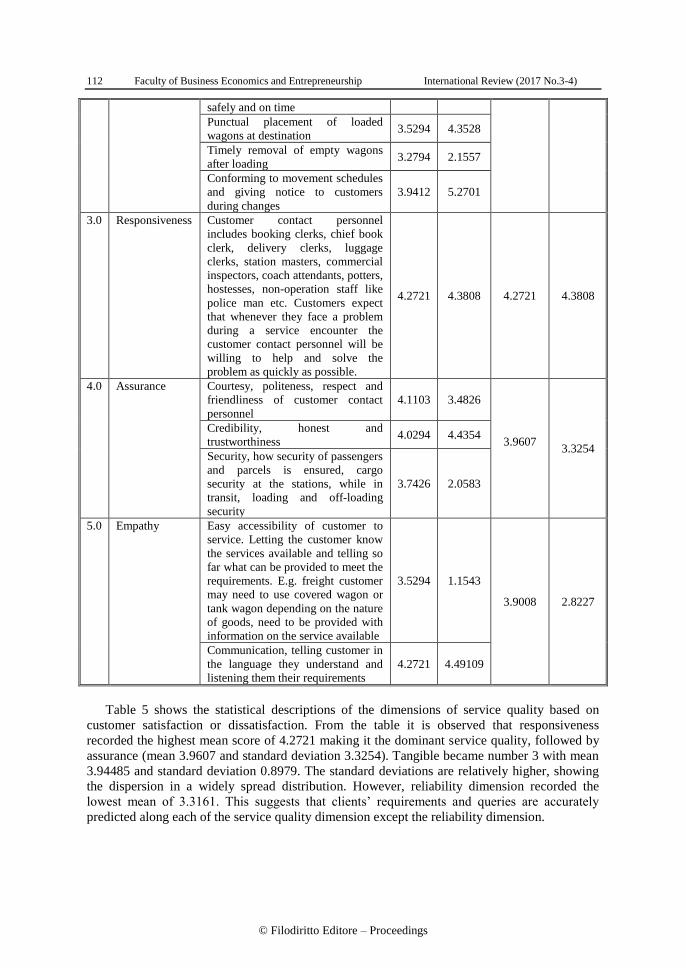
112 Faculty of Business Economics and Entrepreneurship International Review (2017 No.3-4)
© Filodiritto Editore – Proceedings
safely and on time
Punctual placement of loaded
wagons at destination 3.5294 4.3528
Timely removal of empty wagons
after loading 3.2794 2.1557
Conforming to movement schedules
and giving notice to customers
during changes
3.9412 5.2701
3.0 Responsiveness Customer contact personnel
includes booking clerks, chief book
clerk, delivery clerks, luggage
clerks, station masters, commercial
inspectors, coach attendants, potters,
hostesses, non-operation staff like
police man etc. Customers expect
that whenever they face a problem
during a service encounter the
customer contact personnel will be
willing to help and solve the
problem as quickly as possible.
4.2721 4.3808 4.2721 4.3808
4.0 Assurance Courtesy, politeness, respect and
friendliness of customer contact
personnel
4.1103 3.4826
3.9607
3.3254
Credibility, honest and
trustworthiness 4.0294 4.4354
Security, how security of passengers
and parcels is ensured, cargo
security at the stations, while in
transit, loading and off-loading
security
3.7426 2.0583
5.0 Empathy Easy accessibility of customer to
service. Letting the customer know
the services available and telling so
far what can be provided to meet the
requirements. E.g. freight customer
may need to use covered wagon or
tank wagon depending on the nature
of goods, need to be provided with
information on the service available
3.5294 1.1543
3.9008 2.8227
Communication, telling customer in
the language they understand and
listening them their requirements
4.2721 4.49109
Table 5 shows the statistical descriptions of the dimensions of service quality based on
customer satisfaction or dissatisfaction. From the table it is observed that responsiveness
recorded the highest mean score of 4.2721 making it the dominant service quality, followed by
assurance (mean 3.9607 and standard deviation 3.3254). Tangible became number 3 with mean
3.94485 and standard deviation 0.8979. The standard deviations are relatively higher, showing
the dispersion in a widely spread distribution. However, reliability dimension recorded the
lowest mean of 3.3161. This suggests that clients’ requirements and queries are accurately
predicted along each of the service quality dimension except the reliability dimension.

Faculty of Business Economics and Entrepreneurship International Review (2017 No.3-4) 113
© Filodiritto Editore – Proceedings
Correlation and regression analysis
Correlation
The relationship between tangible, reliability, responsiveness, assurance and empathy was
examined by Pearson Correlation Coefficient. Correlation is used to interpret whether the
relationship of two variables is strong or weak, in terms of the power of relationship and the
direction (Pallant, 2001, p.116). The analysis of correlation is derived and shown in table 6.
Table 6. Correlations
Dimensions Tangible Reliability Responsiveness Assurance Empathy
Tangible
Pearson Correlation 1
Sig. (1-tailed)
N 136
Reliability
Pearson Correlation 0.431 1
Sig. (1-tailed) 0.001
N 136 136
Responsiveness
Pearson Correlation 0.337 0.136 1
Sig. (1-tailed) 0.002 0.000
N 136 136 136
Assurance
Pearson Correlation 0.95 0.345 0.843 1
Sig. (1-tailed) 0.000 0.001 0.000
N 136 136 136 136
Empathy
Pearson Correlation 0.034 0.654 0.624 0.856 1
Sig. (1-tailed) 0.001 0.000 0.000 0.001
N 136 136 136 136 136
NB: Correlation is significant at the 0.05 level of significance (2- tailed)
Based on the analysis in table 6, the results show the existence of positive and significant
relationship among the service quality dimensions. For example, the relationship between
tangible and reliability is positive and significant with correlation coefficient r=0.431 at
p<0.001 level. The correlation between reliability and responsiveness, indicates that there is a
significant correlation between the two variables with correlation coefficient r= 0.136 at
P<0.000. The correlation between Assurance and Tangible, indicates that there is a significant
correlation between the two variables with correlation coefficient r= 0.95 at P<0.000. Similarly,
the correlation between empathy and responsiveness, indicates that there is a significant
correlation between the two variables with correlation coefficient r= 0.624 at P<0.000.
Multiple regression analysis
The data collected was regressed by the Statistical Package for Social Science (SPSS). The
multiple regression model used in the analysis was as shown below.
Quality service (client satisfaction) =β0+β1Tangible+β2Reliability+β3+
Responsiveness+β4Assurance+β5Emphathy+ε
Table 7. Model Summary
Model R R Square Adjusted R Square Std. Error of the Estimate
1 0.957a 0.915 0.909 0.30897
a. Predictors: (Constant), Tangibles, Reliability, Responsiveness, Assurance, Empathy
The model summary comes from multiple regression analysis. The result shows that
adjusted R square is 0.90. This means out of 136 respondents, their perception of quality service

114 Faculty of Business Economics and Entrepreneurship International Review (2017 No.3-4)
© Filodiritto Editore – Proceedings
management accounts for 90% of total variation in customer service quality satisfaction or
dissatisfaction. This means that Tangibles, Reliability, Responsiveness, Assurance, Empathy
have a strong relationship.
Analysis of variance (ANOVA)
Variance analysis (ANOVA), tests the hypothesis in that the means of two or more
populations whether are the same or not. ANOVAs assess the significance of one or more
factors by comparing the response variable means at different factor levels.
Table 8. Analysis of Variance (ANOVA)
Model Sum of Squares Df. Mean Square F Sig.
1
Regression 47.273 3 15.758 165.070 0.000b
Residual 4.391 46 0.095
Total 51.664 49
Source: Field data (2017)
a. Dependent Variable: Average customer satisfaction
b. Predictors: (Constant), Tangibles, Reliability, Responsiveness, Assurance, Empathy
Table 8 above proves Tangibles, Reliability, Responsiveness, Assurance, Empathy had a
significance level of 0.000 (b), hence the model is statistically significant in depicting how a
customer service quality management is influenced by the independent variables in this study.
Table 9. Coefficients
Model Un-standardized Coefficients Standardized Coefficients T Sig.
B Std. Error Beta
(Constant) 0.833 0.291 2.864 0.006
Tangible 0.804 0.088 0.807 9.106 0.000
Reliability 0.229 0.122 0.209 1.874 0.100
Responsiveness 1.015 0.049 0.943 20.788 0.000
Assurance 0.471 0.441 0.312 5.453 0.001
Empathy 0.612 0.236 0.403 6.986 0.000
Dependent variable: Average client satisfaction
In table 9, standardized coefficients indicate how much the dependent variable varies with
an independent variable when all other independent variables are held constant. The beta
coefficient indicates that how and to what extent SERVQUAL dimensions (Tangibles,
Reliability, Responsiveness, Assurance, and Empathy) influence client satisfaction. It has been
found that responsiveness (β=0.943, t=20.788, P<0.000) and Tangible (β=0.807, t=9.106,
P<0.000) and empathy (β=0.403, t=6.986, P<0.000) recorded the highest influence on client
satisfaction. However, reliability (β=0.209, t=1.874, P<0.100) recorded the lowest impact on
client satisfaction.
Then the fitted regression model is given as follows;
Overall client satisfaction (Y) = 0.833 + 0.804 (Tangible) + 0.229 (Reliability) + 1.015
(Responsiveness) + 0.471 (Assurance) + 0.612 (Empathy).
Discussion of Research Findings
Basing on quality service as gaps identified by Kotler (1997), that cause unsuccessful
service delivery, there is the gap between service delivered and external communication of
public rail services, this discrepancy in quality of public rail transport service is related to
reliability dimension i.e. performance of the promised service accurately and dependably.

Faculty of Business Economics and Entrepreneurship International Review (2017 No.3-4) 115
© Filodiritto Editore – Proceedings
External communication made to customers helps in creating awareness to customers of
what is being provided. External communication made through promotional campaigns,
advertisements and promises given by service contact personnel, management and their agents
are not specifically converted to perceived service which leads to gap 5, where there is a
difference between perceived service and expected service and thus customer misperceives
service which leads to dissatisfaction.
Gap 1, exists when there is difference between customer expectation and management
perceptions, the results suggest that there is no significant difference between customer
expectations and management perceptions since marketing research is conducted to identify
customer wants and requirements, regular visits to customers offering high volume of traffic are
made, communication and regular interaction with customers by service contact personnel help
management to capture what the organization is expected of by customers.
Gap 2, exists when there is a difference between management perception and service quality
specification, the results suggest that specification, since management does job evaluation,
commit resources for quality service, facilitates fast upward communication, levels of
management do not hinder communication also service standardization seemed to be acceptable
to the customer contact personnel.
Gap 3, exists when there is difference between quality specification and service delivered,
the result suggests that there is likelihood of having a significant difference between quality
specification and service delivered, in some cases management may understand customers
expectations and set appropriate specifications either formally or informally, still however the
service delivery fall short of customer expectations, this is experienced when the customer
contact personnel are unable, unwilling or may not have the ability to perform the services at
desired level. In some cases, service provider may not have the ability to perform the functions
properly given that the equipments and facilities are not available.
Internal factor contributing to the difference between external communication and service
delivered and hence the difference between perceived service and expected service and
ultimately customer dissatisfaction. The results show that customer contact personnel
experienced a shortage of working tools; this includes computers, loading equipments,
communication tools and other operational facilities. These lag the performance of the promised
service accurately and dependably.
Conclusion and recommendations
The objective of the study was to assess customer service quality management, by taking
into account factors affecting quality service so as to be able to track quality and thus
highlighting the importance of service quality management in public transport. The study
reveals that customers’ expectations of service quality are accurately predicted by organizations
management along each of the service quality dimensions except the reliability dimension. That
is the ability to perform the promised service dependably and accurately. As a result of this
management specifies quality standards that fall below customer expectations and hence causes
service quality shortfalls.
Managers in service organization often experience difference difficulties in trying to match
or exceed customers’ expectations. This is due to the factors like some functions require change
of organizations system of service delivery to enhance customer perception. This might require
altering the process by which the work is accomplished, in some cases change requires new
equipments and technology, change also necessitates aligning executives from different part of
organization to collectively understand the big picture from the customer point of view, also
requires a willingness to be open to different ways of structuring, calibrating and monitoring the
provision of service. The study recommends the following:

116 Faculty of Business Economics and Entrepreneurship International Review (2017 No.3-4)
© Filodiritto Editore – Proceedings
• The management should continuously monitor customer satisfaction by carrying
market surveys frequently to determine customer requirements, since customer needs
and wants keep on changing from time to time and within different age groups, so
these surveys should be as frequent as possible, so as to enable to provide the right
service the first time.
• The management should incorporate total quality management in the provision of
services, so that all departments within organizations are coordinated with the single
purpose of satisfying customers, this will instill a marketing orientation establishment
among employees and thus proper adherence to the corporate objectives of the
organization.
• There should be frequent training sessions or seminars for employees especially the
customer contact personnel to update them on current trends in customer requirements
and wants; this will enable them to provide the right packaged service to customers
consistent to handling their complaints.
• Improving working tools, the organization should ensure that working tools are
reliable. In offices there are enough computers, maximizing the operational capacity of
equipments by making a review and development of equipments according to the
requirements, these will help to improve the internal working environment and thus
help an organization to cope with the current situation in the area of technology.
• Assessing what other competitors are doing such as road transport concerning
customer expectations. This will help setting quality standards.
• External communication made to customers should be realistic and portray to
customers a realistic picture of the service as such promises influence customer
expectations and impact on satisfaction.
• The management should commit important resources for quality provision to
customers, in doing this management should consider long run benefits.
REFERENCES
1. Anable, J. (2005). “Complacent car addicts” or “aspiring environmentalist”? Identifying travel
behavior segments using attitude theory. Transport Policy, 12(1), 65-78.
2. African Development Bank report (2015). Rail Infrastructure in Africa, Financing Policy
Options.
3. Bush, R.P., Hair, J.F., Ortnan, D.J. (2006). Marketing research: Within a changing information
environment (3rd ed.). London: McGraw-Hill, Irwin.
4. Carrillat, F.A., Jaramillo, F., Mulki, J.P. (2007). The validity of the SERVQUAL and
SERVPERF scales: A meta-analytic view of 17 years of research across five continents.
International Journal of Service Industry Management, 18(5), 472-490.
5. Eboli L., Mazzulla G. (2007). Service Quality Attributes Affecting Customer Satisfaction for
Bus Transit, University of Calabria.
6. Glynn. W.J and GARMS, J.G (1995). Understanding Service Management. John Wiley.
Chichester.
7. Groomnroos, C (1984). A servce quality model and its marketing implications. European
Journal of Marketing.
8. Groonroos, C (1990). Service Management and Marketing: Managing the Moment of Truth in
service Competition. Lexington, MASS: Lexington Books.
9. Kotler. P (1991). Marketing Management, Planning, Analysis, Implementation and control 7th
Ed. Prentice Hall of India private LTD, New Dehhi.
10. Krajewski R. M. (1993). Operations Management, Strategic and Analysis 3th Ed. Addison
Wesley.
11. Malcon, H.B et al., (1993), Small Business In Third World Countries, John Wiley and Sons,
Cichester.

Faculty of Business Economics and Entrepreneurship International Review (2017 No.3-4) 117
© Filodiritto Editore – Proceedings
12. Nashappi, N. G, Omari S and Nyamonaa, A. R. (2014). Attributes That Influence Customer
Satisfaction with Service Quality at Kenya Power Company, International Journal of Innovation
Research and Development, vol 3 Issue 4, April, 2014 p 239-247.
13. Oliver, R. L. (1981). Measurement and evaluation of satisfaction process in retail Setting
Journal of Retailing, 57(3), 18-48.
14. Olievschi V. N (2013), Railway Transport, Framework for Improving Railway Sector
Performance in Sub-Saharan Africa. Africa Transport Policy Program.
15. OECD, (2001). Citizens as Partners: Information, Consultation and Public Participation in
Policymaking, Scotland.
16. Parasuraman A, Zeithamal V.A and Berry L.L (1985), A conceptual model of service Quality
and its marketing implications for futre research, Journal of Marketing.
17. Ramaswamy, R. (1996). Design and Management of Service Processes: Keeping Customers for
Life. Reading, MA: Addison-Wesley Publishing Co.
18. Rasheed F (2016), Impact of Total Quality Management on Customer Satisfaction, International
Journal of Management and Commerce Innovations ISSN 2348-7585 (Online) Vol. 4, Issue 2,
pp: (702-709).
19. Stanton. W (1994), Fundamentals of Marketing, 6th Ed. McGraw Hill inco U.S.A
20. Internet: www.rim.ed bt/RIM publication/Rigphel 1/Index.htm-8k-
21. http//www.customer expressions.com/CEX web.nsf/menu international open form.
Article history:
• Received 19 June 2017
• Accepted 29 August 2017
118 Faculty of Business Economics and Entrepreneurship International Review (2017 No.3-4)
© Filodiritto Editore – Proceedings
ORIGINAL SCIENTIFIC PAPER
Evaluate the Effectiveness of Advertising on Customers’
Willingness to Buy (Case Study: Goldiran Products
Customers)
ASHTIANI Peyman Ghafari29, BAHMANZADEH Fatemeh30
Abstract
This research had been done to evaluate the effectiveness of advertising on customers’
willingness to buy. The aim of this research was applied and the method of data collection was
descriptive and causal-effect. The statistical population of this research was customers of
Goldiran products in Tehran who visited the company’s representatives to buy. The sample size
with the help of Cochran formula was 384 people and sampling method was random, stratified
based on geographic area was calculated. Data gathering tool included two questionnaires by
Jafari (1393) to measure advertising effectiveness and customers’ willingness to buy and
questionnaire by Boyle et al., (2013) to measure brand image and brand equity. The validity of
these two questionnaires were confirmed by content and construct validity. As well as,
reliability of 4 variables were obtained higher than 7/0 with the help of Cronbach’s alpha
coefficient. Data from distributing questionnaires were analyzed using LISREL software. For
this purpose, using confirmatory factor analysis test, accuracy of measurement variables was
confirmed. Then, it turned out through track analysis test that although brand equity was
effective on the willingness of customers to buy, however it could not be reached through
company’s advertising. Also, although advertising caused brand image; however, the image had
little effect on customers' willingness to buy company’s products.
Keywords: Advertising Effectiveness, Customer Willingness to Buy, Brand Image, Brand Equity
JEL: D12, M31
UDK: 659.113.7
005.336.1
COBISS.SR-ID 253513228
Introduction
Nowadays, Customer’s right to choose has had a significant increase due to increasing
competition between the companies to discover, customer retention and ultimately profitability,
(Coon et al., 2014). Therefore, customers are trying to obtain their needed information before
buying in different ways from different companies and suppliers and comparing them to make
the best choice. One of the most common ways to provide this information is advertising. “The
purpose of advertising is communications tools that companies use to communicate with people
who want to buy product or service” (Pita, Flavler, 2013). In other words, “propaganda is a tool
to build a relationship with the customer to inform and influence their attitudes and behavior”
29 Department of Management, Arak Branch, Islamic Azad University, Arak, Iran, [email protected] 30 Arak Branch, Islamic Azad University, Arak, Iran

Faculty of Business Economics and Entrepreneurship International Review (2017 No.3-4) 119
© Filodiritto Editore – Proceedings
(Nikookar et al., 1388). On the other hand, although the advertising is mentioned as an
investment, but there is no doubt that costs a fortune to the company; Therefore, advertisers and
marketers are always interested in evaluating the effect of their advertising on end customers.
“In fact, they are increasingly seeking to prove the effectiveness of their ads” (Morley,
2007).
Because, there is a variety of devices including TV, radio, internet commercials, social
networks, install banners in the city, sponsor sports teams and the company needs to recognize
that how much profit gain when investment on advertising (Ghouchani et al., 1392). In general,
advertisers have defined the advertising effectiveness “to deliver the company’s messages to
customers with the objectives of notification, reminders, stimulate purchases, competition and
respond to competitors” (Campbell, Wright, 2008). On the other hand, researchers believe that
despite the importance of advertising on the increase of sale, evaluating it effectiveness is not
simply take place. The reason is that advertising is a complex process and ad performance is
completely dependent on customer response (Buil et al., 2013). However, some other
researchers believe that ways of measuring the effectiveness of advertising, including direct and
medium scales (Ghouchani et al., 1392). On the one hand, direct scales, tests and examines the
actual behavior of watching ads and assuming the hierarchy of effects, assess the impact of an
ad is relevant with the attention or gain knowledge of the advertiser message and on the other
hand, intermediate scale evaluates the impact message has on the memory, (Morley, 2007).
However, what is important for companies; stimulate the desire of potential customers to
buy their products. Therefore, in this study will be carried out on Goldiran products, advertising
effectiveness to create the willingness of customers to purchase the company's products is done.
The researchers also believe that the brand image related to factors beyond the physical
aspects of product and is built from a combination of product physical reality and emotional and
personal beliefs arise about it that this issue is concerned with how a person familiar with the
product or brand. Because the customer between different brands for buying a product, select
what has on its mind from a brand, not necessarily an accurate and complete comparison
between brands available. Therefore, create the perfect image of a brand in customers’ mind in
selecting and deciding to choose one to buy can be effective (Dyndar farkush and Hydarbiegy,
1390).
According to what was said; the study aims to first, which one of Goldiran company
advertising tools is more effective? Secondly, due to the fact that in this study the efficacy of
research has been operating with two concept of brand equity and brand image, it turns out that
what is advertising effect on willingness customers to purchase Goldiran products?
Literature review
Review of concepts and theories Advertising effectiveness
Marketing communication is a two-way conversation between the company and potential
and actual customers of product and brand (Tong, Alley, 2009). Promoting activities is the
bridge between the buyer and the seller and has the role of creating awareness, persuasion and
influencing on the consumer decisions (Trehan, 2007). Supremacy in today competitive world
needs proper marketing strategies; however, complicated conditions of the market, the
introduction of new information technologies, constant changes in competition condition and in
the automotive industry market caused it cannot be easily decide on the type of marketing
strategy. Several factors that can affect the choice of marketing strategy among them the
behavior of competitors and customers willingness can be noted. The behavior of buyers is one
of the key factors that can play an effective role in selecting marketing strategy (Nikookar et al.,
1388).
Buyer behavior is one of the newest subjects in the marketing area and the first book on the
subject was written in 1960; however, records on this subject can be seen among which we can

120 Faculty of Business Economics and Entrepreneurship International Review (2017 No.3-4)
© Filodiritto Editore – Proceedings
mention marketers using of Freud’s ideas in the 1950s (Golchinfar, Bakhtiari, 1385). The buyer
psychology in the 1980s was also discussed that in management literature known as buyer
behavior. J.C Mowen, L. G Schiff man and M.R. Solomon have recently written significant
works on buyer behavior (Asadi, 1379). Willkie and Solomon had defined buyer behavior in
this way: physical, emotional, and mental activities that people are doing while select, purchase,
use and dispose goods and services in order to satisfy their needs and desires. However, in
another definition buyer behavior refers to a set of interlocking actions and deeds that the
consumer does to choose goods or services, buy and use it (Iranmanesh, 1382). As well as,
Thomas defined buying behavior in this way: a set of activities that are directly done in order to
buy, use and disposal of goods and services (Assuel, 1995). From the moment that the person
recognizes the need for goods or services until he or she buys and consumes it; a process of
continuous operation is done which say it decision making process to buy (Blacwel et al.,
2001).
One of the most important theories in the study of business is people’s attitudes towards the
ads. An attitude toward advertising is defined as: fields for response to a particular advertising
stimulus in desirable or undesirable way in a special display position. Attitudes that are shaped
toward advertising are effective on consumer attitudes toward the brand and also the purchase
aim (Lord, 1995). If the final goal of advertising has been creating positive attitude toward
advertising and brand, increasing the likelihood of purchase or a positive emotional response to
an ad can be used as the best indicator of evaluating the effectiveness of advertising (Brown,
Stymene, 1992).
Brand
Brand concept was also defined in the nineteenth century with the advent of Packaging
industry. According to some statements, Pears soap was the first registered brand. The first
definition for brand advertising was introduced about 1900 by James Walter Thompson which
today has turned into the definition of branding. Very early, big companies also invented
advertising slogans which were seen and heard in radio and the first television ads. In 1940,
customers recognized the concept of social, psychological, anthropological and their
relationship with brands and this led to manufacturers recognize other brand values and the
need to take advantage of them and therefore so far, researchers paid attention to several
concepts such as brand image, brand association, brand equity, brand loyalty and …
(Ghouchani et al., 1392).
Measuring brand equity requires consideration of several criteria along a number of
different dimensions. Measures that are most effective in evaluating brand equity of products
and market are as follows (Simon, 2006).
Brand management is the application of marketing techniques to a specific product or
product line. Brand management tries to increase value for customers and ultimately, increase
sales volume. Brand management is a tool to increase the desired quality of the customer and
increase buying and building loyalty in customers. One of the major advantages of brand
management for the company is that it can add to the price of goods and services in certain
markets, without the loss of customers. In fact, brand management is a tool to differentiation
(Borehan, 2010).
Research Background
Ghouchani et al., (1392) in a study examined the effect of media advertising as a marketing
strategy on the behavior of passenger car buyers. The obtained results indicate that a variety of
advertising such as visual, audio and written has effects on the behavior of passenger car buyers
and their impact on the behavior of buyers had different priorities. Based on the results

Faculty of Business Economics and Entrepreneurship International Review (2017 No.3-4) 121
© Filodiritto Editore – Proceedings
obtained, managers have been advised to dedicate each kind of advertisements with appropriate
content to the relevant market and avoid this notion that some form of advertising does not
work in this industry. Dehghani and Tomer (2015) study the impact of Facebook advertising
effectiveness on the willingness of customers to purchase. This study was conducted among
university graduates in Cyprus. The research was quantitative and the research strategy was
descriptive, survey type. The questionnaire of this study was researcher made. The results of
this study which was performed with the help of average comparing test of a community
showed that the advertising effectiveness had a significant impact on brand image and brand
equity. As well as, the brand image and brand equity had significant impact on customer’s
willingness to buy.
Varadrajan and Yadav (2013) in an article entitled “Marketing strategy in a virtual
environment” study the relationship between advertising and the Internet. The results indicate
that advertisements which were the most effective and efficient way to create willingness in
people to consume a particular commodity at one time, today due to their growth and
development have been threatened and on the other hand, Internet advertising due to lack of
confidence in the community had not been succeeding in creating a position in many
communities as an affective factor in the minds of customers.
Cohen et al (2014) in their study concluded that the impact of television on children’s eating
habits were usually justified based on the pattern of stimulus – response (conditioning). This
means that the more minutes or hours watching ads (stimulus), it is more likely the person
request and eats the advertised food (response).
Theoretical framework of research
In general, advertising has been evaluated using various tools and the researches in this area
can be divided into two categories: quantitative and qualitative. In the first category, the effects
of advertising on variables such as sales and profits are evaluated and in the second category,
factors such as brand, consumer behavior, attitudes and consumer willingness have been
studied. In this research, based on Dehghani and Tumer model (2015), the researcher has
defined the goal of advertising creating brand image and brand equity. On the other hand, it can
be claimed that advertising is effective, if cause willingness and stimulates potential customers
to buy the company product. Therefore, in this study in addition to evaluate the effects of
advertising on brand image and brand equity, the effect of advertising on brand image and
brand equity on willingness of customers to purchase the Goldiran company’s products are also
addressed.
Fig. 1. The conceptual model of Dehghani and Tumer (2015)
Advertising Tools
Brand Image
Brand Equity
Willingness to Buy

122 Faculty of Business Economics and Entrepreneurship International Review (2017 No.3-4)
© Filodiritto Editore – Proceedings
Research Hypothesis
Brand equity, as a mediator variable has a significant effect on the relationship between the
advertising effectiveness and customer willingness to buy Goldyiran products.
Brand image, as a mediator variable has a significant effect on the relationship between the
advertising effectiveness and customer willingness to buy Goldyiran products.
Advertising tools (in separation) has a significant effect on brand image.
Advertising tools (in separation) has a significant effect on brand equity.
Brand image has a significant effect on the willingness of consumers to purchase.
Brand equity has a significant effect on the willingness of consumers to purchase.
Brand image has a significant effect on the brand equity.
Research Methodology
This research is a quantitative research type because hypotheses will be examined using data
from questionnaires and statistical tests. Researchers also consider three overall directions such
as fundamental, developmental and applicable for a research which this is an applied research
type due to the aim; because the results of this study offered to the Goldiran Company and lead
them to have a better understanding of consumer behavior. Also, given that the researcher
described the situation of the research variables without altering the research, the research
strategy is descriptive. On the other hand, considering that researcher used a sample for
evaluating hypothesis and generalize its result to all community, so that descriptive strategy in
this research is a survey type. In addition, in this study, the effect of independent variable (s) on
the dependent variable is analyzed. Therefore, the research strategy is cause and effect,
therefore it can be claimed that the research strategy is divided into two parts of descriptive-
survey and cause-effect.
Community and the statistical sample
The population of this research includes buyers of Goldiran Company products in Tehran.
Due to the impossibility of reviewing all the statistical population, some samples were
selected using sampling formula of Cochran unlimited society. According to the following
formula, the sample size is:
The statistical sample is consisting of 384 people. Given the extent of Tehran and economic,
social and ... differences between different areas of Tehran, the researcher used cluster random
sampling method to select the sample group.for this purpose, the researcher divided the city of
Tehran to five sections of the North, South, Central, West and East and the questionnaire
randomly distributed in each section (in sales representatives LG products).
Methods and tools for data collection
The researcher among the methods of collecting information used the library method and
collected the theoretical foundations with the help of articles, journals, reliable web sites and
scientific books and to test research hypotheses used field method and the questionnaire for
collecting required data.

Faculty of Business Economics and Entrepreneurship International Review (2017 No.3-4) 123
© Filodiritto Editore – Proceedings
Questionnaire
Danaeefard and et al., (1389) know questionnaire a pre-established collection that
respondents select their answers within a certain range of options. To gather the desired data to
test hypotheses as well as measuring customer opinions, the researcher used two questionnaires
of Gafari (1393) and Boyle et al., (2013). In total, the questionnaire is composed of two parts of
general questions and specific questions.
Table 1. Structure of the questionnaire
Dimensions Questions Reference
Advertising effectiveness 1-5 Jafari (1393)
Brand image 6-9 Boyle et al. (2013)
Brand equity 10-13 Boyle et al. (2013)
Customer willingness to buy 14-19 Jafari (1393)
Validity of the questionnaire
Validity means that measuring tool can measure the desired features and characteristics
(khaki, 1382). The concept of validity answers this question that measuring tool to what extent
measure the desired characteristic? Considering that questionnaire is used in this study, the
researcher to ensure the accuracy of transfer right questions tried to evaluate the validity of the
questionnaire with the help of content validity. In this way, the questionnaire was given to the
eleven experts, including Supervisor and asked them about each question and its ability to
assess the related purpose of the study and due to the expert’s opinions, minor adjustments have
been done in the questionnaire and finally the Validity of questionnaire was confirmed by them.
Reliability of the questionnaire
The reliability of a measure shows logic stability of responses in measuring tool and helps to
properly evaluate a measure. Stability, pointing out that if a test measures individual
intelligence, its results has been the same on the individual at different times. “The ability is” a
measure to maintain stability over time (despite the uncontrollable condition of the test and the
status of the respondents) and an indicator of its stability and low vulnerability to changes. This
ability indicates the appropriateness of measurement tool because each time measurement take
place, the same results will be obtained. Basically, humanities researchers using Cronbach’s
alpha to assess the reliability of their questionnaire. For this purpose, the researcher distributed
30 questionnaires and using this technique, the following results were obtained.
Table 2. The reliability of research variables
Dimensions Cronbach's alpha coefficient Advertising effectiveness 0.84
Brand image 0.89
Brand equity 0.94
Customer willingness to buy 0.84
According to Cronbach’s alpha amount obtained for each variable, research questionnaire
has the enough reliability.

124 Faculty of Business Economics and Entrepreneurship International Review (2017 No.3-4)
© Filodiritto Editore – Proceedings
Research Findings
Analysis confirmatory factor of model variables
The researchers first examined the confirmatory factor analysis of the independent variable;
then dependent variable and the mediator confirmatory factor analysis are examined.
Analysis confirmatory factor of independent variable
Because in this study the advertising effectiveness variable is as the independent variable
which is without dimension, so its factor analysis should be done in one step.
In one step factor analysis, the relationship between the questions and variable is called
factor loadings. All factor loadings should be greater than 5.0 to be accepted. In the above
figure, all factor loadings are greater than 0.5, so it can be said that advertising effectiveness
variable is measured well by questions.
Being a significance coefficient means that the number should be greater than 1.96 or
smaller than -1.96. In the above figure, all significant coefficients are greater than 1.96 which
represents confirming the confirmatory factor analysis. Therefore, we can say that this variable
is measured well by its questions.
Fig. 3. Confirmatory factor analysis of independent
variable in significant coefficients mode Fig. 2. Confirmatory factor analysis of independent
variable in standard estimation mode
Confirmatory factor analysis of brand image mediator variable
As mentioned, after confirmatory factor analysis of the independent variable, it turns to
confirmatory factor analysis of brand image mediator variable that because in this research has
not any dimension and directly have been measured with questions, then it is one-stage variable
and just only has one factor analysis.
Fig. 5. Confirmatory factor analysis of brand image
mediator variable in significant coefficients mode Fig. 4. Confirmatory factor analysis of brand image
mediator variable in standard estimation mode
Due to this fact that all factor loadings are higher than 0.5, it can be claimed that the
questions measured well brand image variable.

Faculty of Business Economics and Entrepreneurship International Review (2017 No.3-4) 125
© Filodiritto Editore – Proceedings
Factor loadings between mediator variable and questions in a significant coefficients mode
are all have relatively high significant coefficient (greater than 1.96) and therefore confirm a
confirmatory factor analysis of this variable. In other words, questions have been able to
measure well brand image mediator variable.
Confirmatory factor analysis of brand equity mediator variable
After investigating confirmatory factor analysis of brand image mediator variable, it turns to
confirmatory factor analysis of brand equity mediator variable that because in this research has
not any dimension and directly have been measured with questions, then it is one-stage variable
and just only has one factor analysis.
Fig. 7. Confirmatory factor analysis of brand equity
mediator variable in significant coefficients mode Fig. 6. Confirmatory factor analysis of brand
equity mediator variable in standard estimation
mode
Due to this fact that all factor loadings are higher than 0.5, it can be claimed that the
questions measured well brand equity variable.
Factor loadings between mediator variable and questions in a significant coefficients mode
are all have relatively high significant coefficient (greater than 1.96) and therefore confirm a
confirmatory factor analysis of this variable. In other words, questions have been able to
measure well brand equity mediator variable.
Confirmatory factor analysis of dependent variable
After investigating confirmatory factor analysis of independent and mediator variables, it
turns to confirmatory factor analysis of dependent variable that because in this research has not
any dimension and directly have been measured with questions, then it is one-stage variable and
just only has one factor analysis.
Fig. 9. Confirmatory factor analysis of dependent
variable in significant coefficients mode Fig. 8. Confirmatory factor analysis of dependent
variable in standard estimation mode

126 Faculty of Business Economics and Entrepreneurship International Review (2017 No.3-4)
© Filodiritto Editore – Proceedings
Due to this fact that all factor loadings are higher than 0.5, it can be claimed that the
questions measured well dependent variable.
Factor loadings between mediator variable and questions in a significant coefficients mode
are all have relatively high significant coefficient (greater than 1.96) and therefore confirm a
confirmatory factor analysis of this variable. In other words, questions have been able to
measure well dependent variable.
Evaluation Structural equations model
Fig. 10. Significant model of research hypotheses in the standard estimation mode
Fig. 11. Significant model of research hypotheses in significant coefficients mode

Faculty of Business Economics and Entrepreneurship International Review (2017 No.3-4) 127
© Filodiritto Editore – Proceedings
Evaluating the main research hypotheses
Primary and secondary hypotheses were evaluated in the following table:
Table 3. The results of structural equation modeling analysis: the first main hypothesis of the study
Hypothesis Direction Independent
variable
Dependent
variable
Standard
coefficient
T-
value Test result
Main 1
Path 1 Advertising
effectiveness Brand Equity 0.07 0.52 Confirmed
Path 2 Brand Equity Willingness to
buy 0.8 8.25 Rejected
Brand
Equity
Advertising
effectiveness
Willingness to
buy
0.056 = 0.8×
0.07 -- Confirmed
Main 2
Path 1 Advertising
effectiveness Brand Image 0.87 14.42 Rejected
Path 2 Brand Image Willingness to
buy 0.2 2.31 Rejected
Brand
Image
Advertising
effectiveness
Willingness to
buy
0.17 = 0.2×
0.87 -- Confirmed
Sub 1 - Advertising
effectiveness Brand Equity 0.07 0.52 Confirmed
Sub 2 - Advertising
effectiveness Brand Image 0.87 14.42 Rejected
Sub 3 - Brand Image Willingness to
buy 0.2 2.31 Rejected
Sub 4 - Brand Equity Willingness to
buy 0.8 8.25 Rejected
Sub 5 - Brand Image Brand Equity 0.78 5.59 Rejected
Discussion and conclusion
Discussion
In the first hypothesis of this study, the effect of brand equity on the relationship between
advertising effectiveness and the customer’s willingness to buy Goldiran products were
examined. This research in studies such as Ghouchani and et al., (1392), Dindarfarkoosh and
Heidarbiegy (1390), Shah Mohammadi and Ahmad Oskooi (1390), Cohen et al., (2014), Pine
and Nash (2009), Pita and Flawler (2013), Varadarjan and Yadav (2013), Dehghani and Tomer
(2015) has been directly or indirectly noted that was found by comparing the results of these
studies with the present study. The obtained result showed that advertising had effect on the
behavior of passenger car buyers that compared to the results of the present study; it was found
that the results of two studies are not consistent with each other. In fact, advertising on Goldiran
products through two mediator variables did not cause stimulate demand and the willingness of
individual to purchase. The results of Dehghani and Tomer (2015) on the effectiveness of
Facebook ads on the willingness of customers to buy revealed that brand equity mediator is
effective on this relationship that is contrary to the present results.
In the second hypothesis of this study, the effect of brand image on the relationship between
advertising effectiveness and the customer's willingness to buy Goldiran products were
examined. This research had been done in studies such as Dindarfarkoosh and Heidarbiegy
(1390).
In this study, which examined the impact of commercial advertising Persian-language
satellite networks on audience attitude and their actions to purchase, it was found that
advertising had a significant effect on the audience attitude. This can be due to the fact that in
principle commercial advertising of Persian-language satellite channels promote products that

128 Faculty of Business Economics and Entrepreneurship International Review (2017 No.3-4)
© Filodiritto Editore – Proceedings
pay less in the official TV of the country; therefore, there is less possibility of comparison in
mind of audience and so he or she may create deeper and more effective image about that
product in his, her mind.
In the first secondary hypothesis of this study, the effect of advertising effectiveness on
brand equity of Goldiran products was examined. This research had been done in studies such
as Mira and Karim (1391) (1390). In that study, the effect of media and non-media advertising
on brand equity, name and logo of Pars Khazar was discussed. The results showed that
commercial advertisements have the greatest impact on brand equity. This may be because there
is no competitor company for Pars Khazar in public media ad (to the same number of Pars
Khazar Company), therefore this advertisement reflects the strength and credibility of the
company. While competitors such as LG make extensive advertising, therefore advertising
brand equity simply does not promote the company’s brand.
In the second secondary hypothesis of this study, the effect of advertising effectiveness on
brand image of Goldiran products was examined. The results of structural equation model in
LESREL software suggests that the effectiveness of advertising on brand image of of Goldiran
products had a positive, direct and significant (0.87) effect. The results Dehghani and Tomer
research (2015) showed that advertising has a significant impact on brand image that the results
of both studies are parallel to each other.
In the third secondary hypothesis of this study, the effect of brand image on willingness to
buy Goldiran products was examined. This research also was conducted on studies such as
Varadarjan and Yadav (2013) and it was found that due to the influx of Internet advertising and
a lack of confidence to these ads, there is no proper image in the customer’s mind from Internet
advertising. This is partly consistent with the results of the present study that may be due to the
influx of deceptive business advertising and loss of public confidence to the business
advertising.
In the fourth secondary hypothesis of this study, the effect of brand equity on willingness to
buy Goldiran products was examined. Although considering the first secondary hypothesis, it
was turned out that advertising did not lead to brand equity for the company’s products;
However, brand equity (be obtained any other way for the brand of this company) tends to
significantly increase the customer’s willingness to buy.
In the fifth secondary hypothesis of this study, the effect of brand image on brand equity of
Goldiran products was examined. The results of Dehghani and Tomer (2015) were also in line
with the results of this study.
Research suggestions
According to the first and second hypothesis of the study, it was found that the company’s
advertisement through brand equity and brand image does not lead to customers’ willingness to
buy; so that, the researcher suggests the managers of these companies if their purpose of
advertising is to create a willingness to buy through these two concepts, have fundamental
review of the concept, appearance, text, songs, etc. of their ads.
According to the first secondary hypothesis which demonstrated the company’s advertising
does not lead to increase brand equity; so that, the researcher suggests the managers of these
companies to emphasize in their advertisement on services and unique features that other
competitors does not. (This becomes important because according to the fourth secondary
hypothesis; if there is any brand equity, tend to buy Goldiran products increases).
According to the first secondary hypothesis which demonstrated the company’s advertising
does not lead to increase brand equity; so that, the researcher suggests the managers of these
companies to emphasize in their advertisement on services and unique features that other
competitors does not.

Faculty of Business Economics and Entrepreneurship International Review (2017 No.3-4) 129
© Filodiritto Editore – Proceedings
According to the third and fourth secondary hypothesis that it was found the brand image
and brand equity has effect on willingness to buy Goldiran products, so that, the researcher
suggests the managers of these companies to work more on the development of company’s
brand.
REFERENCES
1. Aaker, D.A. (1996). Measuring brand equity across products and markets. California
management review, 38(3), 102-120. 2. Asadi, K. (2000). The effect of hygiene detergent commercials on buyer behavior, MSc thesis,
Business Administration, Shahid Beheshti University.
3. Assuel, H. (1995). Consumer behavior and marketing action, In Lain, Hong, Lu, Duoc and Tu.
Li(eds.), Kristianstand University the Department of Business Studies. 4. Buil, I., Martinez, E., Chernatony, L. (2013). The influence of brand equity on consumer
responses, Vol. 30, No. 1, pp: 62-74.
5. Campbell, E., Wright, T. (2008). »Shut-up I don’t care: understanding the role of relevance and
interactivity on customer attitudes toward repetitive online advertising«, Journal of Electronic
Commerce Research, Vol l9, No1, pp. 62-74.
6. Coon, K.A., Goldberg, J., Rogers, B.L., Tucker, K. L. (2014). »Relationships between Use of
Television during Meals and Children’s Food Consumption Patterns Pediatrics«. Vol 1, No 107, PP: 1-17.
7. Dehghani, M., Tumer, M. (2015). A research on effectiveness of Facebook advertising on
enhancing purchase intention of consumers. Computers in Human Behavior, Vol. 49. pp: 597-
600. 8. Esmi, R., Sadipour, E., Asadzadeh, H. (2010). The relationship between watching TV ads and
consumption pattern in children and adolescents in Tehran, Journal of Communication Research.
(1) (61). 117-93.
9. Gil, R., Brave Fraj, A., Martinez Salinas, E. (2007). »Family as a source of consumer-based
brand equity«, Journal of Product & Brand Management, Vol. 16, No. 3, pp. 188-199.
10. Golchinfar, Sh., Bakhtiari, A. (2006). Marketing Clinic, Journal of Tadbir, No. 170, pp. 110-
115.
11. Hosseini Anjadali, M. (2000). Evaluation of the impact theory TV ads on children's behavior
and attitude. Tehran, IRIB Research Center. (48).
12. Iranmanesh, M. (2003). Understanding how consumer behavior in the market of health care
products – cosmetics and detergents, Eighth International Conference on Industrial Health &
Beauty, Tehran, 78-74.
13. Jafari, Z. (2014). Compare the effectiveness of advertising external network and internal
network Persian language in Iran (Case Study: Compare and market network TMTV). Master of
Science thesis Karshasy communication. Islamic Azad University. Science research.
14. Khaki, Gh. (2003). The method of approach to the dissertation, Tehran, Baztab publications,
Second Edition.
15. Morley, B (2007). »National Community Survey of TV Food Advertising to Children«. Cancer
Control Research Institute, The Cancer Council Victoria.
16. Nash, A.S., Pine, K.J., Messer, D.J. (2009). Television alcohol advertising: do children really
mean what they say? British Journal of Developmental Psychology. 27, pp: 85-104 Article history:
• Received 10 September 2017
• Accepted 24 November 2017

130 Faculty of Business Economics and Entrepreneurship International Review (2017 No.3-4)
© Filodiritto Editore – Proceedings
SCIENTIFIC REVIEW
Retro Brands in the Retailing Enviroment: A Review
and Research Propositions
VOJVODIĆ Katija31
Abstract
Since the turn of the 21st century, the rise of retro brands has been generating considerable
interest in terms of stimulating positive emotions and influencing consumers’ attitudes and
retail buying behaviour. The paper presents the results of an extensive review of the recent
literature on the role of retro brands in the retail context and consumer-related behaviour. As
such, it provides a framework for an improved understanding of the overall retro phenomenon
in the retailing environment. Useful insights for both retailers and marketers are provided in
order to better understand the concept of retro branding and to enhance the overall retail
experience of retro consumers. In addition, recommendations for further research are offered.
Keywords: retro brands, retailing environment, consumer nostalgia, retro marketing
JEL: M31
UDK: 658.625
659.113.25
COBISS.SR-ID 253514508
Introduction
Scholarly interest toward the retro marketing phenomenon, also referred as retromania and
retro marketing revolution, started at the turn of the 21st century (Brown, 1999; Brown, 2001a;
Brown, 2001b; Brown, 2001c; Brown, 2003; Brown, Kozinets, Sherry, 2003b; Brown, 2013).
Nowadays, retro marketing is perceived as rampant (Stephen Brown, 2015). Looking back
approach is increasingly becoming a way to accommodate changing consumer behaviour.
Although a retro-marketing approach involves looking to the past for marketing inspiration
(Dacko, 2008), retro is not just a marginal movement (Castellano et al., 2013). Furthermore, the
future of marketing is argued to lie in its past (Brown, 2001b).
In the context of the retail space, it has been suggested that the essential interplay between
product, ritual and aesthetics creates positive moods of belonging and sharing and may increase
satisfaction (Hamilton, Wagner, 2014). In addition to brand’s physical attributes, brands that are
associated with life event experiences can be stored in consumer memory (Ratnayake, Andrews,
2016).
Consequently, brands can acquire deep meaning for consumers by their involvement in the
socialization process of growing up, and can evoke profound feelings of nostalgia and provide
comfort from insecurity (Rosenbaum-Elliott, Percy, Pervan, 2015).
As stressed by Hallegatte and Marticotte (2016), consumption related to the past is trendy.
Nowadays, retail environments are designed intentionally to evoke memories of the past
(Babin an, Borges, 2009). In general, nostalgia is widely considered to influence attitudes and
31 University of Dubrovnik, Department of Economics and Business Economics, Dubrovnik, Croatia

Faculty of Business Economics and Entrepreneurship International Review (2017 No.3-4) 131
© Filodiritto Editore – Proceedings
behaviours (Clay Routledge, 2015). Therefore, nostalgia evoked by brands is at the forefront of
contemporary marketing theory and practice (Bartier, Friedman, 2013).
To advance understanding of retro brands in the retail environment, the paper presents the
results of an extensive review of the recent literature on retro branding phenomenon. The
purpose of the paper is to identify the main features of retro branding and retro consumers in the
retail environment and to determine a framework for further analysis. To this end, the paper is
divided into five sections. Following the introduction, the concept of retro branding is presented
in the second section. The third section looks at the features of retro consumers, whereas
directions of future work on both retro brands and consumers are analysed in the fourth section.
Finally, some conclusions are drawn in the last section.
The concept of retro branding
The term “retro branding” is generally defined as an alternative form of brand extension
(Solomon et al., 2006). Retro brands usually refer to relaunched historical brands with updated
features (Stephen Brown, Robert V. Kozinets, and John F. Sherry, 2003a). According to Kral
(2012, p. 115), “retro branding refers to the revival or re-launch of a product or service brand
from a prior historical period, which is usually, but not always, updated to contemporary
standards of performance, functioning or taste”. Similarly, Fons Van Dyck (2014) underlined
that retro brands integrate old-fashioned design with modern functionality. With these new
features, retro brands are “refitted into the market as a hip, new contemporary brand” (Franzen,
Moriarty, 2015).
In that context, retro brands are recognised as a relatively safe and less-costly way to
introduce a new product by reducing the risk of failure (Kral, 2012). As described by Kardes,
Cronley, Cline (2011), marketers are taking successful old brands, updating them, and
relaunching them with the hope of leveraging consumer nostalgia. On the other hand, Shetty,
Raghavendra, Jyothis (2014) stressed that reviving the brands could be very risky and complex,
especially when they inherited negative perceptions.
It is important to highlight that nostalgic brands are sometimes mistaken for retro brands.
Although retro brands are perceived as nostalgic (Hemetsberger, Kittinger-Rosanelli,
Mueller, 2010), a distinction should be made between retro brands and pure nostalgic brands.
As stressed earlier, the major difference is that retro brands include the attribute of updating.
Further, Dahlen, Lange, Smith (2010) linked the trend for retro brands with “nostalgic
associations which transfer us to a different place or time in our lives through memories of
family, youth or formative years”. In the sense of nostalgic attachment, it is argued that the
brand should evoke pleasant memories because the consumer used it in the past (Chernatony,
McDonald, Wallace, 2011).
In addition, Brown, Kozinets, and Sherry (2003a) emphasized that retro brand management
involves an uneasy, cocreative, and occasionally clamorous alliance between producers and
consumers. Moreover, Brown (2016) addressed boomerang brands as a suitable metaphor for
the rise of retro brands. Apart from being nostalgic objects, retro brands can be seen as identity
building by providing strong historical value systems to identify with (Hemetsberger, Kittinger-
Rosanelli, Mueller, 2010). Likewise, Brown, Kozinets, Sherry (2003a) emphasised that retro
brands invoke brand heritage that triggers personal and communal nostalgia.
Additionally, Strauss (2008) argued that the current boom in retro brands had a strong
foundation in the trustworthiness of, and experience with, old brands. Further, Balmer (2017)
noted that retro brands celebrate an idealised and, sometimes imagined, past. In light of this,
Hartmann, Brunk, Giesler (2016) developed a conceptual model of brand retrofication
highlighting co-constitutive identity and retro branding relationship of commercial and political
mythmaking.

132 Faculty of Business Economics and Entrepreneurship International Review (2017 No.3-4)
© Filodiritto Editore – Proceedings
Revealing retro consumers in the retail environment
As observed by Levy, Weitz, Grewal (2014), the value of the brand is largely based on the
associations that customers make with the brand name. With this in mind, many researchers
associated retro brand consumption with feelings of nostalgia (Brown, Kozinets, Sherry, 2003a;
Brown, Kozinets, and Sherry, 2003b; Dahlen, Lange, Smith, 2010; Schlegelmilch, Bodo, 2016;
Solomon et al., 2014; Hemetsberger, Kittinger-Rosanelli, Mueller, 2010). However, Andrew
Higson (2014) pointed out that the post-modern version of nostalgia erases the sense of distance
between the past and the present. Furthermore, Baines, Fill (2014) addressed feelings of
pseudo-nostalgia as many consumers are unlikely to have experienced the original brand.
Notwithstanding, as stressed by Shaughnessy (2015), what is nostalgic for one audience is
not necessarily nostalgic for another.
Consumers are said to search for the brands that deliver additional value connected with
feeling of security and calm (Grebosz, Pointet, 2015). Likewise, Ling Zhou et al. (2013) noticed
that existential insecurity and social insecurity enhanced consumers' preference for nostalgic
products. In addition, Bartier (2012) outlined three characteristics that form the power of
nostalgia toward the brand, i.e., perceived oldness of brand, recall of consumers lived or learned
past memories and elicitation of feelings. Further, Lemmetti, Tuominen (2017) pointed out that
nostalgic brand associations could be drawn from either consumer’s personal or communal
associations.
Retro product consumption is often considered with psychological factors contributing to
individuals’ desires to live in the past (Cartwright, Besson, Maubisson 2013). It is also argued
that nostalgia is intensely personal and that it works the best for current consumers who have
personal attachments with the brand that they used during childhood (Sultan, Muehling, Sprott,
2010).
Furthermore, LaTour, LaTour, Zinkhan (2010) found that memories from early childhood
were more predictive for understanding current brand attitudes than memories coming from
adolescence.
Specifically, Muehling (2013) reported that responses of a personally nostalgic nature
tended to predominate and were more influential in shaping brand attitudes. According to
Schlegelmilch (2016), personal nostalgia is associated with individual life cycles.
Consequently, a growing number of older people is likely to be more interested in retro
brands that help them to remember their youth. For example, i Kusumi, Matsuda, Sugimori
(2010) claimed that aging facilitates a predisposition toward nostalgia. On the other hand,
Hemetsberger, Kittinger-Rosanelli, Mueller (2010) confirmed that young consumers perceived
retro brands to be special possessions that helped them coping with ambiguities in their search
for identity.
In addition, retro consumers are considered to be tourists consuming a form of cultural
heritage (Franklin, 2002). In light of this, Brown (2003, p. 131.) outlined that retro cunningly
appeals to consumers’ anti-marketing sentiments. The results of the study by Dogerlioglu-
Demir et al., (2017) revealed that high value integration consumers compared to low value
integration consumers evaluated retro brands more favourably. In terms of eco-consciousness,
consumers of retro style are often involved in reuse and renovation, and are less likely to
purchase newly produced goods (Southerton, 2011).
Looking back – seeing ahead: research propositions
Bearing in mind the distinction between nostalgic brands and retro brands, the
characteristics of retro consumers have not been dealt with in depth. Although nostalgia has a
strong presence in the marketing of goods and services (Lasaleta, Sedikides, Vohs, 2014), the
impact of nostalgic emotions on retro brand consumption is still poorly understood. In general,
little is known about the role of nostalgia in shaping consumer behaviour for retro products.

Faculty of Business Economics and Entrepreneurship International Review (2017 No.3-4) 133
© Filodiritto Editore – Proceedings
In fact, what is known about retro consumers is largely based on the links between retro
brands consumption and feelings of nostalgia.
However, what directions should future retro branding research take? The role of
consumers’ affective state on their responses to retro brands are an intriguing area of research.
The effect of nostalgic feelings on customers’ attitudes toward retro brands should be
analysed. In that sense, previous work has failed to address the effects of personal and historical
nostalgia on consumers’ responses to retro brands. Likewise, the question arises how the type of
nostalgia evoked influences consumers’ attitudes toward retro brands. Gender differences
appear to be worthy of future research, especially in terms of the impact of nostalgic feelings on
consumer preference for retro brands. In addition to exploring gender differences, future
research attention should also be devoted toward examining the impact of culture on the
consumer relationship with retro brands and the overall cultural consumer environment of retro
brands.
Nonetheless, little academic research has attempted to determine whether past brand
associations influence purchase intentions of retro consumers and their attitudes toward retro
brands. In addition, further work needs to be carried out to examine the impact of retail
atmospherics on consumer behaviour associated with retro brand consumption. In light of this,
Foster, McLelland (2015) proposed a brand dictated “theme” to create a more interactive,
immersive, and authentic environment. Further, it is argued that evoking nostalgic feelings
through design can generate positive emotions to enhance consumer satisfaction (Chen, 2014).
As regards packaging-related experiences, future work should also concentrate on the
impact of nostalgic emotions on consumer satisfaction with retro packaging design.
Evidence suggests that consumers having nostalgic feelings toward a specific brand
sometimes respond negatively to updated or modified versions of the brand Shields, Johnson,
2016).
In that context, the field of retro branding requires improved knowledge about effect of
consumers’ brand nostalgia on their responses to changes to a brand. The findings would
provide insightful implications for marketers and retailers by identifying meaningful
relationships between nostalgic feelings and retro brands.
In addition, deeper understanding of consumer behaviour in retro context in needed.
Moreover, the links between consumer age and preferences for retro brands are worth
examining. Further studies on the topic should also address the main differences in retro brand
attitudes between different generational cohorts (e.g., Baby Boomers, Generation X and
Generation Y). Additional research is also needed in the area of consumer decisions, in
particular the effects of retro marketing on consumer decisions. This is especially relevant for
marketers in order to choose appropriate marketing and communication strategies to approach
retro consumers.
Conclusions
As discussed earlier, over the past two decades, there has been a growing interest in the
issue of retro marketing, in particular retro branding. In general terms, it can be argued that the
concept of retro branding is well defined. On the other hand, there has been little discussion on
retro consumers and, in particular, on determinants of consumer behaviour related to retro
brands. Specifically, the evidence from the previous sections implies that the issue of retro
consumers remains an under-researched topic. Nevertheless, due to the complexity of
consumers’ nostalgic feelings, thoughts and memories, an interdisciplinary approach should be
considered to cover the issue in more depth.
The paper provides the synthesis of the most current theoretical and practical knowledge
available on retro branding in the retailing environment. As such, the paper can serve as a basis
for conducting future empirical research in the field. The findings presented in the paper may be
useful to all subjects involved in creating retro philosophy of a brand. It also provides useful

134 Faculty of Business Economics and Entrepreneurship International Review (2017 No.3-4)
© Filodiritto Editore – Proceedings
insights for retailers and marketers approaching retro consumers and developing retro products
to meet their requirements.
However, in the context of retail environment, future work should primarily deal with
triggers affecting retro brands consumption, as well as memories related to retailing
experiences. Additionally, Hamilton, Wagner (2014) underlined that the emotional value of
everyday experiences might directly influence consumer loyalty. Consequently, enhancing
consumers’ relationship with retro brands may result in improving brand loyalty. For these
reasons, understanding retro consumers is crucial for both retailers and marketers in order to
target this market segment more effectively. Finally, bearing in mind that no empirical analysis
has been undertaken, the paper lacks a contribution to the field from an empirical point of view.
To this end, additional research is needed to provide empirical support to broaden current
knowledge of both retro brands and retro consumers in the retail environment.
REFERENCES
1. Babin, B. J., Adilson, B. (2009). “Oh yeah, I remember that store! Memory, experience, and
value.” In Memorable Customer Experiences: A Research Anthology, eds. Adam Lindgreen,
Joelle Vanhamme, Joelle and Michael B. Beverland, 161-176. Burlington: Gower Publishing.
2. Baines, P., Fill, C. (2014). Marketing. Oxford: Oxford University Press.
3. Balmer, J. M. T. (2017). “Corporate heritage identities, corporate heritage brands and the
multiple heritage identities of the British Monarchy.” In Foundations of Corporate Heritage, ed.
John M. T. Balmer, 21-43. New York: Routledge.
4. Bartier, A.L. (2012). “Things were better before: what is the power of nostalgia toward the
brand?” Paper presented at 11th International Marketing Trends Conference, Venice, Italy, 19-
21 January 2012
5. Bartier, A.L., Friedman, M. (2013). “Nostalgia Evoked by Brands: A First Step Towards Scale
Development and Validation”, Ideas in Marketing: Finding the New and Polishing the Old, ed.
Krzysztof Kubacki, Proceedings of the 2013 Academy of Marketing Science (AMS) Annual
Conference, 392-392.
6. Brown, S. (1999). “Retro‐marketing: yesterday’s tomorrows, today!” Marketing Intelligence &
Planning, 17(7): 363-376.
7. Brown, S. (2001a). “Marketing for Muggles: Harry Potter and the Retro Revolution.” Journal of
Marketing Management, 17(5-6): 463-479.
8. Brown, S. (2001b). Marketing – The Retro Revolution. London: Sage Publications Ltd.
9. Brown, S. (2001c). “The retromarketing revolution: l'imagination au pouvoir.” International
Journal of Management Reviews, 3(4): 303-320.
10. Brown, S. (2003). “Let’s do the time warp again: a marketing manifesto for retro
revolutionaries.” In The Future of Marketing: Critical 21st Century Perspectives, ed. Philip J.
Kitchen, 125-139. London: Palgrave Macmillan.
11. Brown, S. (2013). “Retro from the get-go: reactionary reflections on marketing's yestermania.”
Journal of Historical Research in Marketing, 5(4): 521-536.
12. Brown, S. (2015). “When innovation met renovation: Back to the future of branding.” Marketing
Intelligence and Planning, 33(5): 634-655.
13. Brown, S. (2016). Brands and Branding. London: SAGE Publications Ltd
14. Brown, S., Kozinets, R.V., Sherry, J.F. (2003a). “Teaching old brands new tricks: Retro
branding and the revival of brand meaning.” Journal of Marketing, 67(3): 19-33.
15. Brown, S., Kozinets, R.V., Sherry, J.F. (2003b). “Sell Me the Old, Old Story: Retromarketing
Management and the Art of Brand Revival.” Journal of Customer Behaviour, 2(2): 133-147.
16. Cartwright, P. A., Besson, E., Maubisson, L. (2013). “Nostalgia and technology innovation
driving retro music consumption.” European Journal of Innovation Management, 16(4): 459-
494.
17. Castellano, S., Ivanova, O., Adnane, M., Safraou, I., Schiavone, F. (2013). “Back to the future:
adoption and diffusion of innovation in retro-industries.” European Journal of Innovation
Management, 16(4): 385-404.
18. Chen, J. C.C. (2014). “The impact of nostalgic emotions on consumer satisfaction with
packaging design.” Journal of Business and Retail Management Research, 8(2): 71-79.

Faculty of Business Economics and Entrepreneurship International Review (2017 No.3-4) 135
© Filodiritto Editore – Proceedings
19. Dacko, S., G. (2008). The Advanced Dictionary of Marketing: Putting Theory to Use. Oxford:
Oxford University Press.
20. Dahlen, M., Lange, F., Smith, T. (2010). Marketing Communications: A Brand Narrative
Approach. West Sussex: John Wiley & Sons Ltd.
21. De Chernatony, L., Malcolm McDonald, M., Wallace, E. (2011). Creating Powerful Brands.
Oxford: Butterworth-Heinemann.
22. Dogerlioglu-Demir, K., Tansuhaj, P, Cote, J., Akpinar, E. (2017). “Value integration effects on
evaluations of retro brands.” Journal of Business Research, 77: 124-130.
23. Dyck, F. V. (2014). Advertising Transformed: The New Rules for the Digital Age. London:
Kogan Page Limited.
24. Foster, J., McLelland, M.A. (2015). “Retail atmospherics: The impact of a brand dictated
theme.” Journal of Retailing and Consumer Services, 22: 195-205.
25. Franklin, A. (2002). “Consuming design: consuming retro.” In The Changing Consumer:
Markets and Meanings, eds. Steven Miles, Alison Anderson, Kevin Meethan, 90-103. London:
Routledge.
26. Franzen, G., Moriarty, S. (2015). The Science and Art of Branding. New York: Routledge.
27. Grebosz, M., Pointet, J.M. (2015). “The Retro” Trend in Marketing Communication Strategy of
Global Brands.” Journal of Intercultural Management, 7(3): 119-132.
28. Hallegatte D., Marticotte, F. (2016). “Nostalgia’s Role in Retromarketing”. In Celebrating
America’s Pastimes: Baseball, Hot Dogs, Apple Pie and Marketing? ed. Kacy K. Kim,
Developments in Marketing Science: Proceedings of the Academy of Marketing Science. 747-
748. Cham: Springer.
29. Hamilton, K., Wagner, B.A. (2014). “Commercialised nostalgia: Staging consumer experiences
in small businesses.” European Journal of Marketing, 48(5/6): 813-832.
30. Hartmann, B. J., Brunk, K.H., Giesler, M. (2016). “Brand Retrofication: How East German
Consumers Animate a Retro Brand Market to Create a Revisionist Eastern Consumption
Culture”. In NA – Advances in Consumer Research, eds. Page Moreau, and Stefano Puntoni,
Duluth, MN: Association for Consumer Research, 44: 257-263.
31. Hemetsberger, A., Kittinger-Rosanelli, C., Mueller, B. (2010). “Grandma’s fridge is cool – The
meaning of retro brands for young consumers.” Advances in Consumer Research, 38: 242-248.
32. Higson, A. (2014). “Nostalgia is not what it used to be: heritage films, nostalgia websites and
contemporary consumers.” Consumption Markets & Culture, 17(2): 120-142.
33. Kardes, F. R., Cronley, M.L., Cline, T.W. (2011). Consumer Behaviour, Mason: South-Western
Cengage Learning.
34. Kral, P. (2012). “Nostalgic Branding in Central Europe.” In Diversity in European Marketing:
Text and Cases, eds. Thomas Rudolph, Bodo B. Schlegelmilch, Josep Franch, Andras Bauer,
and Jan N. Meise, 113-130. Wiesbaden: Springer Gabler.
35. Kusumi, T., Matsuda, K., Sugimori, E. (2010). “The effects of aging on nostalgia in consumers'
advertisement processing.” Japanese Psychologic Research, 52(3): 150-162.
36. Lasaleta, J. D., Sedikides, C., Vohs, K. D. (2014). “Nostalgia weakens the desire for money.”
Journal of Consumer Research, 41 (3): 713-729.
37. LaTour, K., LaTour, M.S., Zinkhan, G.M. (2010). “Coke is It: How stories in childhood
memories illuminate an icon.” Journal of Business Research, 63(3): 328-336.
38. Lemmetti, H., Tuominen, P. (2017). “Expatriates’ Nostalgic Brand Relationships. Case Fazer
Blue Chocolate.” In Regional Studies on Economic Growth, Financial Economics and
Management, Proceedings of the 19th Euroasia Business and Economics Society Conference,
eds. Mehmet Huseyin Bilgin, Hakan Danis, Ender Demir, and Ugur Can, 401-422.
39. Levy, M., Weitz, B.A., Grewal, D. (2014). Retailing Management. New York: McGraw-Hill
Education.
40. Muehling, D. D. (2013). “The relative influence of advertising-evoked personal and historical
nostalgic thoughts on consumers’ brand attitudes. “Journal of Marketing Communications”,
19(2), 98-113.
41. Nikoukar, Gh., Divandari, A., Ebrahimi, A., Esfidani, M.R. (2009). Patterns of consumer
behavior and internet marketing strategies: Household Iran. College of Business Administration.
No. 2. 150-135.
42. O'Shaughnessy, J. (2015). Competitive Marketing (RLE Marketing): A Strategic Approach.
London: Routledge.
43. Pitta, D.A., Fowler, D.E. (2013). Online consumer communities and their value to new product
developers, Journal of product and Brand Management, Vol.14 (5), PP. 283-291.
136 Faculty of Business Economics and Entrepreneurship International Review (2017 No.3-4)
© Filodiritto Editore – Proceedings
44. Ratnayake, N., Andrews, P. (2016). “Power of Brands in Recalling Nostalgic Memories Among
Young Adults: An Exploratory Study.” In Let’s Get Engaged! Crossing the Threshold of
Marketing’s Engagement Era, Proceedings of the 2014 Academy of Marketing Science (AMS)
Annual Conference, eds. Michael W. Obal, Nina Krey, and Christian Bushardt, 349-354.,
Springer International Publishing.
45. Rosenbaum-Elliott, R., Percy, L., Pervan, S. (2015). Strategic Brand Management. Oxford:
Oxford University Press.
46. Roshandel, A. T., Sotovvati, F. (2012). Iranian television commercial advertising the effects on
investment incentives. Volume 7. Number 2. Ss.194-159.
47. Routledge, C. (2015). Nostalgia: A Psychological Resource. New York: Psychology Press –
Taylor & Francis.
48. Schlegelmilch, B. B. (2016). Global Marketing Strategy: An Executive Digest. Springer
International Publishing Switzerland.
49. Shah Mohammadi, A., Ahmadi Oskouie, N. (2011). The city of Mashhad measure people’s
attention to the commercials broadcast by local television. 13. Number Media Studies pp. 231-
217.
50. Shetty, A. S., Raghavendra, A.N., Jyothis, M. (2014). “Revival of the Relics: How to Find Gold
in the Brand Cemetery?” Global Management Journal, 6(1-2): 12-21.
51. Shields, A. B., Johnson, J.W. (2016). “What Did You Do to My Brand? The Moderating Effect
of Brand Nostalgia on Consumer Responses to Changes in a Brand.” Psychology and Marketing,
33 (9): 713-728.
52. Solomon, M. R., Bamossy, G., Askegaard, S., Hogg, M.K. (2006). Consumer Behaviour: A
European Perspective. Harlow: Prentice Hall.
53. Solomon, M., Hughes, A., Chitty, B., Marshall, G., Stuart, E. (2014). Marketing: Real People,
Real Choices. Frenchs Forest, NSW: Pearson Australia.
54. Southerton, D. (2011). Encyclopedia of Consumer Culture. London: Sage Publications Ltd.
55. Strauss, R. E. (2008). Marketing Planning by Design: Systematic Planning for Successful
Marketing Strategy. West Sussex: John Wiley & Sons Ltd.
56. Sultan, A. J., Muehling, D.D., Sprott, D.E. (2010). “The effect of personal attachment and usage
on consumers’ response to nostalgia”. The Academy of Marketing Studies Proceedings, 15(2): 1-
3., Allied Academies International Conference, Las Vegas.
57. Tong, X., Hawley, J. (2009). Measuring customer-based brand equity: empirical evidence from
the sportswear market in China, Journal of Product & Brand Management, Vol 18(4), PP. 262-
271.
58. Trehan, M., Trehan, R. (2007). Advertising and Sales Management, New Delhi: India enterprise.
59. Yoo, B., Lee, S.H. (2009). Buy genuine luxury fashion products or counterfeits? Advances in
Consumer Research, 36, 280-286.
60. Zhou, L., Wang, T., Zhang, Q., Mou. Y. (2013). “Consumer insecurity and preference for
nostalgic products: Evidence from China.” Journal of Business Research, 66(12): 2406-2411.
Article history:
• Received 9 December 2017
• Accepted 19 December 2017

Faculty of Business Economics and Entrepreneurship International Review (2017 No.3-4) 137
© Filodiritto Editore – Proceedings
SCIENTIFIC REVIEW
Constituent Elements of Political Marketing in Creating
a Positive Attitude for Voiting for a Particular
Candidate
SOLEIMANI Ali Gholipour32, MONEM Sadegh33
Abstract
This study was conducted to draw the structural model of constituent elements of political
marketing in one of the large governmental organizations in Gilan of Iran. For this purpose, we
randomly selected 217 subjects who completed the questionnaire. The results showed that seven
major factors, economic, political, social, cultural, marketing mix, personality, and supporting
individuals and factions, are involved in political marketing. Moreover, the strongest factor
influencing political marketing has been economic indicators (p<0.01). Political, social, and
cultural factors, as well as marketing mix with standard coefficients of 0.39, 0.30, 0.32, and
0.33, respectively, are the factors that directly predict political marketing (p<0.01), and
variables such as personality and supporting individuals and factions indirectly affect political
marketing.
Keywords: marketing mix, political marketing, economic factors
JEL: G32
UDK: 659.3/.4
32.019.5:324
COBISS.SR-ID 253515788
Intoduction
In current political world, competition to achieve important positions, directly or indirectly,
gained by People’s votes (Abramowitz, 1989). Thus, the process of creating desirable social
attitudes in area in question is very important for each candidate that determines his future in
reaching the target and specific post. Various management and psychological policies are
involved that lead and manage this process to achieve this goal and to win the popular vote.
Among these elements, functional positive publicities to achieve the goal and win the
popular vote are of the most effective factors. One of these techniques in this process is political
marketing that has specific plans to achieve specific political and management goals directly
with simultaneous application of management, political, and psychological techniques
(Abramson et al., 1992). The first use of political marketing is attributed to Kelly (1957). In
many ways, political marketing is similar to marketing in business world. In business
marketing, vendors release goods, services, and communications (advertising) to the market and
in exchange for money (through customers’ purchase), information (through market research),
and customer loyalty (Aharony, 2012). In political campaigns, candidates offer promises,
32 Faculty of Management and Accounting, Rasht Branch, Islamic Azad University, Rasht, Iran 33 Faculty of Management and Accounting, Rasht Branch, Islamic Azad University, Rasht, Iran
138 Faculty of Business Economics and Entrepreneurship International Review (2017 No.3-4)
© Filodiritto Editore – Proceedings
advocacy, policies, and their personal features to their voters, and in return receive votes and
voluntary contributions (Andrews, Kaplan, 2015). Therefore, although these two processes have
the same general principles, in enforcement of tactics sometimes use different techniques
according to their goals. Political marketing is generally defined as facilitator of social process
of political exchanges, whereas management of political marketing is defined as the art and the
science of successful management of this exchange process (Bendle, 2014). There are different
discussions and opinions about the use of political marketing in elections campaign (Bendle,
Cotte, 2016). Using fields and management components in elections and political marketing is
not something completely new, but combining this method with psychological skills and
guiding public opinion towards advertising is something new in the area.
Differences in commercial marketing and political marketing
The first difference between commercial and political marketing is related to work load of
these two areas: unlike commercial marketing, in political marketing, a few groups and small
parties are active (Bendle, Nastasoiu, 2014). The second difference is in indicator of time.
Unlike commercial marketing that is done on an ongoing basis (Bendle, Ryoo, Nastasoiu,
2017), political marketing is sometimes done with long intervals. The third difference is in the
need to get public opinion (Bendle, Wang, 2016). As specified, in business marketing, even one
percent or much less is acceptable and sufficient, whereas in the political sphere, the effort is to
achieve more than 50% of the votes and tendency of society. Concerning the most important
differences between political marketing and business components, (Berenson, 2016) have
referred to deployment time, cost, market, rate of control, complexity, loyalty, and change of
attitude.
Political marketing encompasses a variety of traditional and modern tools. The major
traditional tools in this area include the presence of celebrities, comparative advertising,
destructive promotional projects, catching red handed, and so on. Some new methods include
network advertising, call centers, bogus surveys, and so on. Political branding and marketing
are concepts tied to the elections. Branding and political marketing are concepts that strengthen
trust between the characters, leaders, political parties, media, voters, and audience. Trust plays
an important role in any market whether political or commercial in connection with trade and
political consumers. Thus, trust is a crucial element and this principle is important because now
trust in politicians and political parties has declined (Berg, Nelson, Rietz, 2008). Several studies
have investigated the role of political marketing, of which (Bode, Dalrymple, 2015) can be
noted. In his study, on political marketing in Indonesia, he showed that different candidates
repeatedly use techniques based on political marketing to win votes, and he considered this
effective in gaining results and receiving the public votes. In studying people’s attitudes
towards voting for a particular candidate, based on a survey by Zaverata in Mexico, (Chang et
al., 2009) showed that political marketing and proper advertising derived from this management
component play a very effective and important role in the selection of candidates by people.
In a study with the aim of behavioral examining of voters in America and Poland and
delineating the structural model of this series, (Collinson, 2015) showed that the set of
components related to political marketing in management and psychological areas affects the
behavior of voters and their choices. In a study to investigate the role of politics in trade and
vice versa in a part of their study, (Conway, Kenski, Wang, 2013) showed that commercial and
political variables are involved in each other and each of them is involved in another variable.
In other words, political variables manipulate trade variables, and different variables such as
political marketing are involved in people's opinions and their economic and political elections.
What is identifiable from previous research and existing components of political marketing
is its very influential role in the electoral process and attracting people towards the person
concerned. In other words, the purpose of commercial marketing is to gain consent and receive

Faculty of Business Economics and Entrepreneurship International Review (2017 No.3-4) 139
© Filodiritto Editore – Proceedings
money and material resources of the people, but in the field of political marketing, the trend is
toward people’s vote and selection of the concerned candidate by people
Research model
Fig. 1. Conceptual model
As the model shows, overall, many factors are invloved in political marketing that given the
main components forming these issues, in this study political marketing includes economic
factors, supporting individuals and factions, marketing mix, personality, social, political, and
cultural conditions. When slogans of political and social reform as well as the supporting
factors and fractions, and the factors affecting the society support a particular person in society,
they provide the ground for the selection of the candidates in question. Moreover, marketing
mix and so on are involved in this process and creating a positive attitude one way or another.
In describing the model and research components about political marketing, seven factors
were described as the following:
Economic factors: this factor is directly involved with financial condition and people’s
economic power. Indices based on economic factors in community are the main indices of
social welfare and welfare of people (Bode, Dalrymple, 2015). Various studies indicate the
effectiveness and impact of economic factors on life satisfaction and social satisfaction in
society and positive attitude towards politicians with optimal economic attitude (Andrews,
Kaplan, 2015).
Supporting individuals and factions: figures and celebrities supporting are primarily
divided into two main branches: politicians and artists. About art figures, in other words,
advertising brands, research has demonstrated that give their votes due to the superficial and
andvetising apsects of the figure in question who is supported by these people (Bendle, Cotte,
2016). If ideas, and principles of these goups and implementation history of factions and
political patron supporting one person are discussed among people, and if they are appropriate
to the particular person who is approved, they will vote for him (Bendle, 2014).
Economic issues
Supporting individuals
and factions
Marketing mix
Social conditions
Political
conditions
Personality
Cultural
conditions
Political
marketing
Positive attitude
to vote for a
specific
candidate

140 Faculty of Business Economics and Entrepreneurship International Review (2017 No.3-4)
© Filodiritto Editore – Proceedings
Marketing mix: marketing mix is the combination of different methods in this field, or it
means that a systemic and coordinated attitude should be established among the members to
affect the customer. In fact, in this method, the combined principles applied are based on
attracting the votes of the people not retention and attraction of income. In this method based on
composition, people’s mind is focused on the intended candidate's by combining psychological
principles (Aharony, 2012).
Personality: personality includes identifiable patterns of thinking, emotion, and behavior
that make up the style of the person’s personal interaction with social and material environment
(Bendle, Nastasoiu, 2014). About personality components of the candidates in question, it is
noteworthy that according to research conducted primarily social, extroverted, and cheerful
figures are more charming and attract people more. In political figures, research has shown that
people show tendency towards those who are primarily steadfast, cheerful, social, and have high
self-confidence (Bendle, Ryoo, Nastasoiu. 2017). Thus, character and personality factors are
very important for people.
Social conditions: Social status and conditions associated with it, such as the form of
education, per capita studies, social organization, and so on are of the factors influencing public
opinion and their support of the ruling party and the people under their rule or against it.
In other words, this component encompasses partisan issue more rather than the person
himself and people. Therefore, this component is very effective in the attitude of people (Bode,
Dalrymple, 2015).
Political condition: A political party can only gain and maintain public support when the
time of scheduling and decision on the nomination, it maintains its relationship with the public.
Therefore, this indirect political effect of opinions and beliefs of people with direct result of
the political situation, which arose from political slogans and titles based on the relationship and
policy of reform and restructuring will directly affect public opinion (Collinson, 2015).
Social conditions: in a structural way, while having a clear association with social and
political issues, cultural conditions include common principles and foundations of any society
and traditional beliefs of any society (Bendle, Ryoo, Nastasoiu, 2017). In other words, people
from different nationalities have definite basic cultural principles they adhere to and value their
traditions and values greatly. Various studies have shown that always in the electoral process
for popular vote, candidates with slogans and programs based on preservation of cultural issues
have more chances to win votes and support (Bendle, Wang, 2016).
Materials and methods
In this study, according to the area, we collected the required information through field
study and library methods. In the field method, research questionnaire was distributed among
the research subjects and the results were obtained from analysis of questionnaire. However, in
the library method, we used to take notes and referred to the library to get the most recent
available resources in this field. The population in this study includes the employees of a state-
owned enterprise of Gilan in iran with its subsets. We need sampling to conduct research and to
complete the questionnaires. We have used Cochran's formula with error level of 5% and the
result is 170. In this study, 217 employees were randomly selected and completed the
questionnaire. We used a questionnaire to assess political marketing. The questionnaire has 30
questions, whose content validity was confirmed by professors, and after deleting and
modifying some of the questions, the 30-question questionnaire was administered to 30 subjects
as a pilot and after removing and correcting content deficiencies, the final questionnaire was
conducted on the main sample. We used Spss and Amos to check the validity of the
questionnaire.
First, we used factor analysis to evaluate its construct validity, and using it, we determined
factor structure of the questionnaire. The adequate size of sampling, Kaiser-Meyer-Olkin

Faculty of Business Economics and Entrepreneurship International Review (2017 No.3-4) 141
© Filodiritto Editore – Proceedings
(KMO) is the test of variance within the data, which can be explained by factors. As KMO
value is closer to one, it is better. According to Kesser, KMO higher than 0.9 is excellent, 0.8 is
qualified, 0.7 is better than average, 0.6 is average, 0.5 is bad, and less that is unacceptable. The
KMO for political marketing questionnaire was 0.902 that is at excellent level. Thus, factor
analysis showed seven main factors for the questionnaire: economic factors, supporting
individuals and factions, marketing mix, personality, social, political, and cultural conditions.
Internal consistency of the data for the whole test is 0.915 according to Cronbach's alpha. This
measure for the sub-scales economic factors, political conditions, cultural conditions,
personality, marketing mix, supporting individuals and factions, and social conditions and
cultural conditions is, respectively, 0.708, 0.756, 0.830, 0.873, 0.724, 0.705, and 0.814. As the
value of Cronbach's alpha for the whole questionnaire and all subscales is more than 0.7, the
questionnaire is reliable and appropriate tools for measuring political marketing.
Results and discussion
Components of political marketing and their relationships with each other
The key components of political marketing, as stated in the research tool, are economic
factors, supporting individuals and factions, marketing mix, personality, social, political, and
cultural conditions. The following table shows the relationship between the variables
investigated.
Table 1. Correlation matrix between variables
Ro
w
Variables
Mea
n
SD
1 2 3 4 5 6 7 8
1 Political
Marketing 81.6 7.11 1
2 Economic
factors 0.8213 2.61 0.79** 1
3 Supporting
individuals
and
factions
0.1514 3.11 0.71** 0.42** 1
4 Marketing
mix 0.6512 2.21 0.44** 0.39** 0.41** 1
5 Personality 15.8 3.75 0.64** 0.52** 0.43** 0.31** 1
6 Social
conditions 12.8 2.38 0.59** 0.63** 0.58** 0.61** 0.33* 1
7 Political
conditions 14.4 3.15 0.70** 0.56** 0.59** 0.64** 0.32* 0.64** 1
8 Cultural
conditions 16.8 5.32 0.81** 0.74** 0.71** 0.70** 0.29* 0.57** 0.60** 1
0.05 p *0.01 p**
As seen in Table 1, there is a significant positive correlation between all variables. From
among all components of political marketing, including economic factors, supporting
individuals and factions, marketing mix, personality, social, political, and cultural conditions,
and political marketing, except the relationship between personality and marketing mix that is
significant at 0.05 level, in other components and sub-correlation, this is 0.01. We used
structural equation modeling (SEM) to evaluate the model. As advised by (Bendle, Cotte,
2016), we first evaluated all possible direct and indirect routes of independent variables
(exogenous) and dependent variables (endogenous). Structural model considered in this study
included 7 latent factors and economic factors, supporting individuals and factions, marketing

142 Faculty of Business Economics and Entrepreneurship International Review (2017 No.3-4)
© Filodiritto Editore – Proceedings
mix, personality, social, political, and cultural conditions were evaluated as independent
variables and political marketing as the dependent variable.
The purpose of this model is to study the direct and indirect effects of economic, political,
social, and cultural factors on mediator variables of personality, marketing mix, and supporting
individuals and factions on political marketing.
Fig. 1. Structural model of constituent elements of political marketing
The strongest factor affecting political marketing is economic factor (p<0.01). Political,
social, and cultural factors, as well as marketing mix with standard coefficients of 0.39, 0.30,
0.32, and 0.33, respectively, are the factors that directly predict political marketing (p<0.01).
Variables such as personality and supporting individuals and factions indirectly affect the
political marketing. Based on the results of the final model, latent variables personality, factors
and factions supporting effect coefficients are, respectively (B=0.26, P<0.01) and (B=0.30
P<0.01) is.
Table 2. Fitness indices of SEM
Statistical indicators AGFI GFI CFI RMSEA
Fit value 0.85 0.91 0.76 0.05
Table 2 shows the fitness of the model. SEM has fitness indices and structural modeling.
The most common way to estimate the best fit in SEM is maximum likelihood method.
From among five fitting statistics related to the model, we measured Adjusted Goodness of
Fit Index (AGFI), Goodness of Fit Index (GFI), Comparative Fit Index (CFI), and Root Mean
Square Error of Approximation (RMSEA) in this model. The closer GFI and AGFI are, the
more complete the fit of the model is, and low RMSEA means the utility of the model fit. As
the value of this index is closer to one, CFI utility shows more comparative fitness of the model
(Allen Yen, 2008). Since AGFI=0.85, GFI=0.91, and CFI=0.76 and as the fitness indices
obtained are closer to 1, it shows a better fit, and RMSEA equals to 0.05, the closer it is to zero,
the more appropriate the fit is. This model has a very good fit and all structures are meaningful
conforming to the model.
Economic
factors
Personality 0.47
0.49
0.42
Political
conditions
0.25
0.26
0.39
Supporting
individuals and
factions
Political
Marketing 0.39
0.30
0.22 0.30
Social
conditions 0.33 Marketing mix
Cultural
conditions
0.31
0.32
0.3
4

Faculty of Business Economics and Entrepreneurship International Review (2017 No.3-4) 143
© Filodiritto Editore – Proceedings
Table 3. Direct and indirect effects of exogenous variables on outcome variable
Indirect effect Direct effect Structural relationships
0.12 0.45 Economic factors
0.11 0.42 Political factors
0.11 0.31 Social factors
0.09 0.36 Cultural factors
0.13 0.33 Marketing mix
0.32 0.11 Supporting characters
0.31 0.09 Personality
Table 3 shows the results of economic, political, social, and cultural indicators (0.45, 0.42,
0.31, and 0.36) have a direct effect on the structure and their indirect effect are 0.12, 0.11, 0.11,
and 0.09, respectively, so economic factor has greatest influence on political marketing.
Political marketing is a new variable with many components that in politics and elections is
used with the aim of using techniques based on psychological marketing and management to
guide public opinion and votes to the intended candidate (Bendle, 2014). In this method,
principles based on business and psychology, which are mainly used in sales of merchandise,
are applied to draw positive attention to a particular candidate based on clear political and
managerial rules (Bendle, Nastasoiu. 2014). In other words, these managerial rules enter
emotional aspects of the public opinion and thus try to push people to vote for the person
concerned. In other words, the person replaces the product and customer’s money is replaced by
vote. Although the whole picture is similar in political and business marketing, there are certain
differences in the use of techniques. In this study, based on comments and questionnaire, and
the results of research, the structural model was formed of factors affecting the formation of
political marketing. The results showed that seven main components of political marketing are
economic, political, social, cultural factors, marketing mix, supporting individuals and factions,
and personality. Moreover, results obtained from this model showed the strongest factor
affecting political marketing is economic factor. Political, social, and cultural factors, as well as
marketing mix are the factors that directly predict political marketing, and variables such as
personality and supporting individuals and factions indirectly affect political marketing.
Moreover, the results from fitness of the model showed that the model is efficient and
satisfactory. The research findings are consistent with the findings by (4-8). These results prove
that the factors forming political marketing have general definite elements, and in many
situations similar ones (according to its specific theory), by proper applying which and related
solutions, one can guide the thought and public opinion in the intended direction.
REFERENCES
1. Abramowitz, A. I. (1989). “Viability, Electability, and Candidate Choice in a Presidential
Primary Election: A Test of Competing Models.” The Journal of Politics 51 (4):977-92.
doi:10.2307/2131544.
2. Abramson, P. R., Aldrich, J.H., Paolino, P., Rohde, D.W. (1992). Sophisticated’ Voting in the
1988 Presidential Primaries. The American Political Science Review 86 (1):55-69.
doi:10.2307/1964015.
3. Aharony, N. (2012). “Twitter Use by Three Political Leaders: An Exploratory Analysis.” Online
Information Review 36 (4):587-603. doi:10.1108/14684521211254086.
4. Andrews, W., Kaplan, T. (2015). “Where the Candidates Stand on 2016’s Biggest Issues.” The
New York Times, Accessed August 12, 2016.
5. Bendle, N. T. (2014). “Reference Dependence in Political Primaries.” Journal of Political
Marketing13 (4):307-33. doi:10.1080/15377857.2012.721738.
6. Bendle, N. T., Cotte, J. (2016). “Assumptions of Rationality in Political Marketing: The Case of
the Republican Autopsy.” Journal of Nonprofit & Public-Sector Marketing 28 (1):66-83.
doi:10.1080/10495142.2016.1131481.

144 Faculty of Business Economics and Entrepreneurship International Review (2017 No.3-4)
© Filodiritto Editore – Proceedings
7. Bendle, N. T., Nastasoiu, M.A. (2014). “Primary Elections and US Political Marketing.” In
Political Marketing in the United States, edited by J. Lees-Marshment B. Conley and K.
Cosgrove 85-111.New York, NY, USA: Routledge.
8. Bendle, N. T., Wang, X. (2016). “Uncovering the Message from the Mess of Big Data.”
Business Horizons 59 (1):115-24. doi: 10.1016/j.bushor.2015.10.001.
9. Bendle, N. T., Ryoo, J., Nastasoiu, M.A. (2017). “The 2016 U.S. Primaries: Parties and
Candidates in a World of Big Data.” In Political Marketing in the United States 2016, edited by
J. Gillies 65-80. London: Plagrave Macmillan.
10. Berenson, T. (2016). “Donald Trump’s Tweets are Getting More Polished.” Time, Accessed
October 3, 2016.
11. Berg, J. E., Nelson, F.D., Rietz, T.A. (2008). “Prediction Market Accuracy in the Long Run.”
International Journal of Forecasting 24 (2):285-300. doi: 10.1016/j.ijforecast.2008.03.007.
12. Bode, L., Dalrymple, K.E. (2015). “Politics in 140 Characters or Less: Campaign
Communication, Network Interaction, and Political Participation on Twitter.” Journal of
Political Marketing 15:311-32. doi:10.1080/15377857.2014.959686.
13. Chang, J., Boyd-Graber, J.L., Gerrish, S. Wang, C., Blei, D.M. (2009). “Reading Tea Leaves:
How Humans Interpret Topic Models.” NIPS (Neural Information Processing Systems) 31:1-9.
14. Collinson, S. (2015). “Joe Biden Won’t Run for President.” CNN, Accessed 08/11/2016.
15. Conway, B., A.K., Wang, D. (2013). “Twitter Use by Presidential Primary Candidates during
the 2012 Campaign.” American Behavioral Scientist 57:1596-610.
doi:10.1177/0002764213489014.

Faculty of Business Economics and Entrepreneurship International Review (2017 No.3-4) 145
© Filodiritto Editore – Proceedings
QUESTIONNAIRE
In the name of God
Dear respondent
Greetings and Regards,
The questionnaire is presented to investigate a proposed research project and all information
is confidential and non-numbered, and there is no need to be introduced. Thus, please have the
best cooperation and honesty in completing the questionnaire to achieve the research aims.
The questionnaire consists of two parts:
The first part includes demographic information: age, gender, education, and income.
The second part includes questions that measure the components of political marketing. In
this section, according to your personal opinion, choose one of the options from very low to
very high.
Thank you in advance for your sincere cooperation.
Sadegh Monem
• Gender: Male Female
• Education level: to Diploma Associate’s degree bachelor’s degree Master’s PhD
• Age less than 25 years 25 to 39 40 to 59 60 years and over
• Income: up to 2 million tomans 2 to 4 million tomans 4 to 6 million tomans 6 million
tomans and more
ver
y l
ittl
e
Lit
tle
Av
era
ge
A l
ot
ver
y m
uch
Questions
ma
in
fact
ors
1. Advertising of the candidate regarding the aims of increasing the
domestic production, supporting domestic industries and exports
persuade me to vote for the person.
Eco
no
mic
con
dit
ion
s
Po
liti
cal
con
dit
ion
s 2. Economic slogans and financial welfare affect my vote a lot.
3. Advertising declining commodity prices and reduction of inflation
and improving economic distribution affects my vote.
4. Financial pledges and increased pay or benefits by the candidate
attract my attention and affect my vote for him.
5. Campaign promises to reduce the pressure (sanctions at the macro
level and partially favorable market circulation) affect my voting for
the candidate in question
6. Advertising for changes in opaque and discriminatory rules (or the
correct application of laws in problematic cases) make me sure to vote
for the candidate
Po
liti
cal
con
dit
ion
s
7. Activities of political and social groups and public and private
institutions supporting the candidates affect my vote.
8. Slogan of political relations with other countries (political centers
enhancing exchanges) has an effect on my vote.
9. Advertising political justice and getting public positions (partial
and total) by capable people influence my vote.

146 Faculty of Business Economics and Entrepreneurship International Review (2017 No.3-4)
© Filodiritto Editore – Proceedings
10. Advertising slogans of political and expression freedom (within a
city, state or country) influence my vote to the candidates.
11. The use of cultural and advertising groups aimed at aculturation
affects my vote to a particular candidate.
Cu
ltu
ral
cond
itio
ns
and
com
pet
ito
rs
12 Advertising, cultural history and intended policies formulated by
the candidate has affects my vote.
13. Cultural activities of the groups supporting the candidate affect
my vote.
14. Advertising and cultural-based events for suitable use of resources
affect my vote.
15. Advertising in responsibility and doing previous duties of the
candidate affects my vote
Per
son
alit
y
16. Advertising and expressing the agility and activity (dynamic,
innovative, active and willing to serve) of the candidate affect my
vote
17. Power of speech, and performing duties with seriousness and
perseverance and advertising on it affect my vote to the candidate.
18. Programs and advertisement in the field simplicity and quiet life
of candidate affect my vote
19. The rhetoric of the advertisement in regarding people and social
responsibilities affect my vote to a particular candidate.
Mar
ket
ing
mix
20. My impression of honesty in advertising affects my vote to the
candidate.
21. The notification and transparency of information provided by the
candidate affect my vote.
22. Making face to face connections with people and building
relationships and specific and clear objectives affect my vote.
23. Support of famous people of the country and city and province
affects my vote to the candidate.
Su
pp
ort
ing
peo
ple
and
frac
tio
ns
24. Support of a specific group of the candidate affects my vote.
25. The coterie and friends history of the affect candidate affect my
vote.
26. The quality of setting up campaigns and organizations supporting
and backing the candidate affect my vote.
27. Advertisement in the field of social and people-oriented programs
affect my vote to a candidate.
So
cial
sit
uat
ion
28. Social attitudes and social foundations of the candidate affect my
vote.
29. Advertisement about social relations and social customs and
propaganda used by the candidates affect my vote.
30. Social status (education and employment) of candidate affects my
vote.

Faculty of Business Economics and Entrepreneurship International Review (2017 No.3-4) 147
© Filodiritto Editore – Proceedings
SCIENTIFIC REVIEW
An Examination of Agreement Between the Parties on
Preceding the Time of Transfer the Ownership from the
Moment of Signing the Contract
MASKONI Ali Arefi34, POOR CHANGIZ Mohammad Amin35
Abstract
Based on their consequences, contracts are divided into different types, one of them being
“possessory contract”. The basic consequence of these kinds of contracts is actually alienating
possession from one party to another. Since alienation – as the most perfect example of
objective rights, which give the owner the authority to possess all the possession – can be the
source of various rights and obligations for the transferor and the grantee, the way and time of
transfer, including sale, has always been of interest to lawyers. Following the jurisprudence,
Iranian law has accepted alienation as a principle in the concept of possessory contracts from
the moment of signing the contract (which can be different in consented, objective or
ceremonial contracts regarding the cause). But the effect of the interactive parties’ will and
agreement in advancing or postponing this time has rather been ignored.
This paper examines validity in the condition of advancing alienation from the time of
signing the contract in order to resolve disagreements and reach a proper solution in this regard.
This has been done through searching through library resources including juridical and law
books and related laws in descriptive analysis method and gave us the results that, firstly, at the
time of signing the contract, alienation requires assigning possessory contracts and not the
contract itself.
Keywords: possessory contracts, Transfer the ownership, The Condition of Advancing Alienation, Iran’s
Law
UDK: 347.47
005.591.43
COBISS.SR-ID 253517324
Introduction
Iranian civil code does not mention classifying contracts into promissory and possessory
contracts in the chapter regarding types of contracts and commitments (articles 184-189). But in
article 825 on wills according to jurisprudence, it divides wills into two types of promissory and
Accrual. It also mentions or explains the effects of certain contracts while defining them;
including contract of sale (article 338), lease (article 466), donation (article 795) and debt
(article 648) in possessory contracts, and contract of reward, (article 561), guarantee (article
684), bailment (article 734) and assignment (article 724) in promissory contracts. But
apparently, the civil law has taken the promissory and Accrual concepts for granted, or put the
34 Law at the Faculty of Law and Theology, Shahid Bahonar University of Kerman, Iran,
[email protected] 35 Ferdowsi University, Mashhad, Iran, [email protected]
148 Faculty of Business Economics and Entrepreneurship International Review (2017 No.3-4)
© Filodiritto Editore – Proceedings
jurists in charge of explaining them, so it gives no definition of these two words in the articles
above. Iranian law literature states the following on promissory and possessory contracts: “a
possessory contract is a contract through which alienation is done; i.e. the object of transaction
is taken out of one party’s possession, which is the transferor, and is brought into the other
party’s possession, which is the grantee. A promissory contract is one that creates religious right
and obligation for a party regarding the other party; or for each of the parties regarding each
other” (Emami; 1366, p. 67). Regarding the time of alienation in possessory contracts, and
without specifying any conditions, the first clause in article 362 of Iranian determines, through a
general law, that the possession of the object of sale is transferred to the purchaser “upon the
sale”. It seems as if this article is an implication of the famous opinion of Shia Jurisprudents
who believe the alienation of the object of sale to be instant and simultaneous to signing the
contract. The Jurisprudents explain this famous theory on their stands through this sentence:
“The sold possession is taken into the purchaser’s possessions as soon as the contract is signed”.
Using this theory through this sentence is so common that it can be known as a rule (Jafari
Langeroodi; 1381, p. 226), and in this paper, we also use it as the rule of instant alienation.
The subject of this paper is whether the aforementioned rule and the rules regarding the
alienation of some contracts in Iranian law and jurisprudence is known as a peremptory rule, or
it is one of the alienative rules of choice and therefore, a mutual consent and agreement against
them is also possible. Of course, considering the fact that agreement on changing the time of
alienation includes the two states of advancing and postponing the alienation time and it is not
possible to study both of these hypotheses in this paper, we only examine the two parties’
agreement on alienation before signing the contract. For this purpose, we first need to examine
whether the two parties’ will be principally capable of totally changing the effects of the
contract, including the time of alienation (speech 1), and then examine the effect of the two
parties’ agreement on the subject of this paper, which is advancing the time of alienation
(speech 2).
Speech 1: The Effect of the Two Parties’ Agreement in Changing the Contract’s
Consequences
This session is mainly about studying the two parties’ willpower to change the contract’s
consequences. The purpose is to see whether the two parties are able to separate the time of
alienation from the time of signing the contract. To find the answer, a study of the two parties’
willpower regarding general rules in contracts is required. We know that signing the contract,
and the contract’s consequences are two separate issues and the parties’ will be usually
dominant in signing the contract. For instance, acceptance should correspond with
requirements, and through the requirements, the parties can specify conditions for acceptance;
however, what is required, and the correspondence between the requirement and acceptance etc.
are rules that depend on the condition of the contract’s accuracy, and therefore the parties have
no authority for changing them. In this regard, one of the discussions worth paying attention is
suspending the contract’s consequences, and its validity or invalidity. Iranian civil law does not
give an explicit answer to this question. The Shia jurisprudence, which is one of the basic
inspirations for Iranian legal system, has dispersed opinions as well. In general, there are two
views regarding the two parties’ authority: Some consider the contract’s consequences to be
lawful, and also believe separating the cause from the caused to be logically impossible. On the
other hand, rejecting the aforementioned reasons, another group of Jurisprudents and lawyers
respect the parties’ will in changing the contracts’ consequences. The following sessions
explain each of these two views:

Faculty of Business Economics and Entrepreneurship International Review (2017 No.3-4) 149
© Filodiritto Editore – Proceedings
A. The View of Negating the Parties’ Authority
This view questions the parties’ authority in determining the contract’s consequences in two
aspects: One being the lawful nature of the contract, and the other, believing the separation of
the cause from the caused to be illogical. Each of these aspects is described as follows:
1. The Lawfulness of the Contract’s Consequences
Some believe that the contract’s consequences have lawful nature. In this view, the
contract’s consequences are not caused from the parties’ will, but they are lawfully regulated.
The role of parties’ will be to merely create a seeming cause called a contract to have its
specific consequences according to the rule of the law and lawyer. Therefore, the role of will is
limited to signing the contract: “Contracts are lawful causes and their consequences are by
virtue of laws of scripture (Qare-Daaqi; 2002, p. 61). Accordingly, the parties’ agreement
cannot determine the time of alienation, and determining this time is exclusively based on law.
2. Impossibility of Separating the Cause from the Caused
As soon as the cause is created, the result and caused is also ascertained. Separating the
cause from the caused is impossible (Najafi,1394). The contract of sale is the cause of
possession, and as soon as the sale is done, the purchaser should become the owner, and the
seller should be the price owner. The author of “Javaher al-Kalam” (Priceless Words) writes the
following mandate contract: “One of the conditions is that, like other contracts, it will be
incontrovertible… due to the conflicts of the condition of suspension with the necessity of
connection between cause and the caused, which is one of the reasons of causality in acquired
contracts” (Najafi,1394). By the connection between the cause and the caused, the author means
the separation of cause from caused: i.e. the caused will be created as soon as the cause
happens, and separating them is impossible.
B. The View of Accepting the Parties’ Authority
The first view has been criticized, saying that firstly, the contracts’ consequences have a
willful nature, and secondly, there is no rational prohibition for accepting the separation of the
contract’s consequences (caused) from the contract itself (cause), according to the following
reasons:
1. The Willfulness of Legal Actions
Some of the Jurisprudents and lawyers consider convention as the source of knowing the
contracts’ consequences and requirements, and limit the role of laws of scripture only to the
conditions of their validity and obstacles. In this regard, in order to know the consequences of a
contract as well as finding whether the rules regarding contracts are imperious, we should refer
to conventions (Khouei, 1414). In other words, people have made contracts based on their
needs, and they determine a contract’s consequences based on the same needs. This process was
done for specific contracts in the past, so that today people sign unspecified contracts with the
same method and determine the consequences on their own. Therefore, here people create these
contracts and determine their consequences based on their needs. However, there are cases
where law has also a significant role in determining the contract’s consequences: In contracts
regarding job, family, insurance, social security, business companies etc. But it seems law does
not have a significant role in determining the consequences in financial contracts. Basically, the
role of law in the contract’s consequences is a signature role as well as interpretive,
supplementary and deterrent (Katoozian, 1380). When law introduces the contract’s
consequences, it actually shows the individuals’ typical and common demand from a specific
contract, and is sometimes in order to complete the contract. On the other hand, it does not
accept contracts that will result in violating ethics, public order and peremptory norms.
The view of considering the contracts’ consequences to be lawful actually reminds one of
the view that contracts are social. In this view in law, the contracts are rules for administration
of justice or avoiding injustice, and not just an explanation of the parties’ agreement. Based on
this interpretation about contracts, and due to the legislators’ interference in making regulations
regarding public order, ethics, and supporting the rights of the third parties, insuring
commutative justice between the contract’s parties has been restricted and the parties’

150 Faculty of Business Economics and Entrepreneurship International Review (2017 No.3-4)
© Filodiritto Editore – Proceedings
agreement is still determinative. If we consider the contracts’ requirements to be lawful, we
have assumed the contract to be a legal event in a way. However, all legal systems can be
divided into legal event and legal action (Katoozian, 1380). The consequences of usurpation are
determined by law, but the same law leaves the consequences of contracts to the parties. It is as
though the existence and nature of the contract is a creation of the parties’ will. Therefore, the
same creating will can omit or change the contract’s non-essential consequences. Hence, we
should say that basically, the law of scriptures or law does not determine the contract’s
requirements (Ansari, 1425); since the contract’s requirement depends on the people’s needs.
The role of law is just to verify and sign this means in order to reach the wanted results.
Therefore, what is important in the beginning is not that a specific contract necessarily
requires a specific result, but it actually should make sure that it will result in what the parties
intended.
2. Accepting the Separation of Cause from Caused in Credential Affairs
The impossibility to separate cause from caused as one of the reasons in the first view, has
two arguments by itself: On one hand, according to general intellectual rules, it is impossible
for the caused to violate the cause. As soon as a cause happens, the caused is instantly created.
On the other hand, the consequences of contracts will be reached as soon as they are
required and accepted: signing the contract is the cause and its consequences are caused (Qare-
Daaqi, 2002). In this regard, it is said that, firstly, there is a difference between the cause and
the requirement: the final cause is created from the requirement and lack of obstacles (Jafari
Langeroodi, 1382), and what is connected to the caused is the final cause. But the cause can be
separated from its requirement. An example is pending contract, which has accepted validity in
Iran, but its consequences are postponed until the time of receiving the pending object
(Ghasemi, 1382). Secondly, assuming the definite causality is accepted for requiring and
accepting the contract, we should say that law is the world of interests and validity, and the rule
of natural cause and effect should not be used in contracts and rhythmic (Langeroodi, idem).
“The form of credit balance is no more than the world of credit; therefore, these are created
upon credit and they do not need to be materially existent. Hence, credit is suddenly dependent
to present time. So, the validator validates his house’s ownership to someone else at present
time. In another instance, the credit is a matter in the future, such as property credit for a person
after a specific time, in a way that the testator’s will gives credence to the legatee. Here the
present’s validity and its effect are related to the future” (Khouei, 1414).
In other words, the experts who agree on advancing alienation in sale believe that the idea of
contrast is because the ownership is considered to be an external reality; while it is a concept
made by mind and also a means for better representing the authority to exclusive exploitation of
property. By agreeing upon advancing the alienation, we mean that the seller will not only give
the customer the exclusive authority for the object of sale, but he also gives the results of
privileges that he had considered in the intended advanced date. The convention’s simple mind
accepts this consent and doesn’t consider it to be impossible. Article 258 in Iranian civil law
also states: “In regard of financial interests which are under unauthorized transactions and also
the interests gained from its alternative, authority or rejection will be effective from the day of
signing the contract” and verifies the same view. Of course, some may say that the article 258 is
about interests and does not speak of the object itself (Shahidi, 1380). Therefore, the legislator
actually validates the authority in relation to the ownership of the object of transporter and the
ownership of interests. Assuming this is true; the legislator still considers the previous benefits
of the object of sale to be the purchaser’s property, and the purchase money’s previous benefits
to be the seller’s property. When authority can transfer the benefits from the past, which do not
exist now, to the purchaser, then the theory of willpower in the past is verified. Therefore, we
can expand what this article means by “in relation to interests” to object ownership and the
benefits of the object of sale and the personal purchase price from the first day, and say that the
legislator knows the ownership of interests to be credential. Using this article and the fact that

Faculty of Business Economics and Entrepreneurship International Review (2017 No.3-4) 151
© Filodiritto Editore – Proceedings
legal natures are credential, we can accept the principle of freewill to create any legal nature at
any time (Katoozian,1366).
Speech 2: The Parties’ Agreement on Advancing the Alienation time in Possessory
contracts
In the previous session, we discussed the credence of the parties’ agreement regarding the
changing of the contract’s consequences in general, and after discussing the reasons of two
groups of Jurisprudents and lawyers, we found out that accepting the two parties’ authority in
changing the contract’s consequences seem logical. In this article, we examine whether the
parties’ agreements in advancing the time of alienation in possessory contracts corresponds to
these contracts’ specific characterization. In other words, we should see whether the condition
of advancing the time of alienation contrasts with the requirements of creating it. I.e. is “time”
matter of the nature of possessory contracts for alienation, or is it a matter of using them?
In this regard, some believe that instant alienation is part of the nature of possessory
contracts such as selling, and therefore, not only agreeing upon them is invalid, but it also
cancels the contract. While another group believe that the contract’s requirement and the real
intention of possessory contracts is transferring the ownership of the object of sale and the
purchased price, and not necessarily transferring them in a specific time (Ansari, 1425).
As some masters have said in this regard, “we should not assume that instant alienation
without any conditions about the object of sale and the purchase price is a requirement of the
sale: The alienation is done, but only through the condition that the subject of the contract has
the capability” (Katoozian, 1380).
According to what has been said, the requirement of the nature of contract of sale is only
alienating the object to the certain alternative. If the object of sale is specified at the time of
signing the contract, this alienation can be instantly being done (instant alienation) and it can
also be done after signing the contract and at the time of determining the applicable object for
the described object of sale (general sales). Therefore, when the object of sale is determined,
there is no problem in alienation after the parties’ intended conditions are reached. Article 469
in Iranian civil law also explicitly mentions this latter part and states: “the time of lease starts
from the day determined between the two parties. If the beginning of the time is not mentioned
in the lease contract, the time of signing the contract will be considered”. This shows that the
condition of target date in alienation will be valid if the alienation is postponed for a while.
Accordingly, many lawyers believe that the two parties can postpone the alienation for some
time.
Of course, the truth is that the requirement of the contract of sale and other possessory
contracts is not the urgency of alienation, but the transferring itself, with no regard to the time
of signing the contract. At that time, since the cause of alienation, meaning the parties’ will is
there and this will has demanded the alienation at the same time, then the alienation will be
done at this time. But there will be no obstacles if the same will demands the alienation to be
done in another time and under better conditions.
On this basis, we should state that agreement upon advancing alienation from the time of
signing the contract, for instance, in a way that the two parties sign the contract of sale today
under the condition that the consequences, i.e. alienation are done beforehand, is valid in
Iranian law.
Another question is whether it is necessary that the agreement is made as a consequential
condition at the time of possessory contract and in the form of an obligation in the contract
itself. Or will this agreement still be valid and effective if it is done independently apart from
this contract or upon signing another contract? It seems like the parties’ agreement should be
reached conditionally at the time of signing the original contract, since this condition lacked a
subject before signing the contract, and the alienation has been completely done after signing it
and therefore, there is no consequence to it. Also, we should find how the effect of this
condition would show in practice. When someone says that he will sell you his car and set the
152 Faculty of Business Economics and Entrepreneurship International Review (2017 No.3-4)
© Filodiritto Editore – Proceedings
date of contract to two months ago, it means that he will give you the results of interests he has
received for two months ago (Katoozian, 1384).
The ownership of the car has had consequences in the past two months: for instance, its
interests belonged to the owner at that time, and if any harm has been done to someone through
this property, the owner of that time has been taken responsible (article 333 of civil law); the
property tax of those two months has been assigned as debt. In this case, the ownership of the
interests of the object of sale, which have been established two months ago, in case they
actually exist (e.g. fruit), will be transferred today; and if the usurper or tenant have lost it, their
alternative has been established in the seller’s property and the demand exists at the moment,
which the seller will transfer to the purchaser. Moreover, the two parties have right of lien. Any
danger can occur to the two parties, and transferring the danger depends on submission (article
387 of civil law). But a delay in paying the purchase price is effective from the day of signing
the contract, and the compensation of debt delay will not depend on the past days. In other
words, the obligatory effects will be established from the day of signing the contract, but the
situational effects will be established from the day that the two parties have assigned.
Conclusion
Transfer the ownership is one of the most important issues in the contracts Law, which
regarding the peculiar situation of possessory contracts in jurisprudence and therefore Iran’s law
(which states that the alienation starts from the time of signing the contract and not from the
time of submission), has also been the source of other important issues such as exchange
guarantee, loss of sales before the purchase etc. Therefore, examining the related issues and
discussions can be one of the most common and useful discussions in practical and theoretical
areas. This paper examined the effect of the two parties’ will in advancing the time of alienation
in possessory contracts. The studies show that instant alienation in possessory contracts is a
requirement of the contract’s assignment and not a requirement of its nature. In other words,
whenever the contract is signed in this area by itself and without any condition, it is assumed
that the parties’ implied will is that the created cause (the so-called contract) will have its legal
effect instantly and without any delay. Nut if the parties of the contract agree in a different way
at the time of signing the contract, there is no prohibition to accepting the agreement and
condition while signing the contract. Of course, as it was shown, there is more disagreement on
the condition of advancing the alienation, and avoiding the creation of the caused (alienation)
before the existence of cause (contract) or opposition of such a condition with the peremptory
norms, including article 362 in contract of sales etc. has been said to be likely. But based on
what has been said, the preferred view is the one which considers instant alienation to be a
requirement of assigning the contract and validates an agreement against this. Accepting this
view, regarding the fact that the rules of transactions are usually among alternative choice and
not mandatory ones, and also considering the principle of freewill in contracts in order to supply
the social needs in people’s relationships, can help reducing the theoretical and practical
problems in this subject. However, the silence of Iranian civil law in this regard, which some
define as a silence in expression, has resulted in the continuation of disagreements in this area.
Therefore, we suggest a modification of rules and admitting to accept the agreement
between parties in changing the time of alienation, to remove any doubts in this regard.
REFERENCES
1. Ansari, S. M. (1425). Almakaseb, Vol. 3 & 6, 1st edition, Qom, World Congress for Sheikh
Azam Ansari’s Commemoration.
2. Emami, S. H. (1366). Civil Law, vol. 1 & 3, 10th edition, Tehran, Eslamieh Bookshop.
3. Katoozian, A. (1366). Will in Iranian Civil Law, 2nd edition, Tehran, Central Lawyers Club.
4. Katoozian, A. (1380). Legal Actions, 11th edition, Tehran, Joint publicatin co.

Faculty of Business Economics and Entrepreneurship International Review (2017 No.3-4) 153
© Filodiritto Editore – Proceedings
5. Katoozian, A. (1384). General Rules of Contracts, 5 vols. 8th edition, Tehran, Katoozian Law
Foundation.
6. Khouei, A. (1414). Mesbah al-faghahe, vol. 33, Qom, Imam Khouei Revival Institute.
7. Langeroodi, J., Jafar, M. (1381). An Encyclopedia of Civil Law and Business, 1st edition,
Tehran, Ganje Danesh Publication.
8. Langeroodi, J., Jafar, M. (1382). Supreme Philosophy in the Science of Law, 1st edition, Tehran,
Ganje Danesh Publication.
9. Najafi, M. H. (1394). Javaher al-Kalam fi Sharaei al-Islam, vol. 28, Lebanon.
10. Shahidi, M. (1380), The Effects of Contracts and Commitments, vol. 3, 2nd edition, Tehran,
Majd Community of Science and Culture.
Article history:
• Received 25 August 2017
• Accepted 10 December 2017

154 Faculty of Business Economics and Entrepreneurship International Review (2017 No.3-4)
© Filodiritto Editore – Proceedings
SCIENTIFIC REVIEW
Improving Society Through the Decisions of the Human
Rights Committee on the Protection of Human Dignity
JOVANOVIĆ Ljiljana36
Abstract
The idea of protecting the dignity of human beings as individuals and members of the
human species, the recognition of human rights is one of the most important achievements of
modern social systems. It is result of deep aspirations of humanization of moral and physical
integrity of a person. Inherent dignity rests on the peculiarities of human nature and is its
existential value. Legal protection of the dignity is continuously improving its mechanisms and
instruments in an international environment, with the aim of respecting the individuality of
individuals. The Human Rights Committee (HRC) force the provisions of the International
Convent of Civil and Political Rights for the protection of human rights and fundamental
freedoms and its decisions form a separate human rights protection system. The research
particularly included the researching the HRC recommendations that invoke the protection of
human dignity in their statements of reasons when establishing a violation of a certain human
right and by analysing their contents I found the areas guaranteed by the ICCPRwhich are most
prone to violation of human dignity. Analysing the HRC case law, one becomes aware of the
evolving humanisation of access to protection of human dignity. Harmonization of legal
systems of the state parties to the Convention, creates strong support of human rights and
improving the sociological structure of modern social systems.
Keywords: dignity, human rights, Human Rights Committee
JEL: I00
UDK: 341.231.14
COBISS.SR-ID 253517836
Introduction
The Human Rights Committee (HRC) force the provisions of the International Convent of
Civil and Political Rights (ICCPR) for the protection of human rights and fundamental
freedoms and its decisions form a separate human rights protection system. Under article 28 of
the Covenant, Committee members must be “persons of high moral character and recognized
competence in the field of human rights” with “consideration given to the usefulness of the
participation of some persons having legal experience” (hhtps://treaties.un.org/publication
/volume999/). Starting from the assumption that the dignity of each individual must be
respected in all life circumstances and that the HRC with its objective and just assessment of
facts and evidence in interpreting the ICCPR provisions helps change legal systems of state
parties, I will endeavour to objectively assess the influence of the HRC recommendations on
improving the legal systems of state parties to protect human dignity, as an ethical value and the
36 Department for academical and general affairs at the University of Montenegro, Montenegro,

Faculty of Business Economics and Entrepreneurship International Review (2017 No.3-4) 155
© Filodiritto Editore – Proceedings
source of human rights. At the same time, I will endeavour to determine whether the
conceptualisation of the term of dignity extends the structure of human rights in legal and
sociological elements.
The main goal of the research is to determine the impact of the HRC case law and its
recommendations is seen in the individualisation and conceptualisation of the notion of dignity
thus creating new levels of protection for human dignity by individualising specific
circumstances. In the first part of the paper, the term dignity will be defined through relevant
theoretical presentations, and then in the second part will be continue with a look at the
evolution of human rights through theoretical considerations that shaped the social awareness of
understanding the essence of human rights. The third part section will present the research
conducted with its findings and the discussion thereof, and finally end with conclusions.
The protection of human rights was first set globally following World War Two with the
establishment of the United Nations. The United Nations Charter was adopted on 26 June 1945
with the aim: “To reaffirm faith in fundamental human rights, in the dignity and worth of the
human person, in the equal rights of men and women and of nations large and small”
(http://www.un.org/en/charter-united-nations/).The Charter is the first treaty in the international
law that established the internationalisation of human rights. Further evolution of contemporary
international human rights protection was seen through the adoption of the 1948 Universal
Declaration of Human Rights, that compiled all human rights provisions available at the time
and gave a boost to further development of human rights. Article 1 of the Declaration states
that: “All human beings are born free and equal in dignity and rights. They are endowed with
reason and conscience and should act towards one another in a spirit of brotherhood” (http:
www.un/org/en/universal-declaration-human – rights). Recognition of dignity and its protection
in legal regulation of contemporary states is a reflection of the degree of democratisation of
each society. The Declaration aim of protecting dignity and human rights is pursued by
invoking international instruments ratified by state parties, which implies, first and foremost,
substantial changes in their respective legal and judicial frameworks, aspiring to align their
legislation and practice with the commitments made by ratifying those international
instruments. The HRC is implementing the ICCPR provisions, thus developing its case law in
human rights protection.
In the present research, I will use the historical method, the induction and deduction
methods, as well as the sociological method.
Dignity
Dignity has always been the subject of interest among philosophers, lawyers, sociologists,
members of different religious denominations, and the like. Dignity is a term applied to
highlight specific features of human beings, noble and elevated values, embraced as such in the
system of ethical norms. Through out history, it was interpreted differently by different
religions, cultures and civilisations in different parts of the world. In Christina tradition, the
oldest grounds for human dignity may be found in the biblical revelation Imago dei, or in God’s
image, and has the power over nature given the existence of human intellect. According to Lutz,
this view was reiterated by the French philosopher Jacques Maritain who believed that: “The
deepest layer of the human person’s dignity consists in its property of resembling God” (Lutz,
1995). In early days of human community’s development, dignity was mostly linked with the
relation of the state towards specific societal groups, where higher classes were privileged and
shown more respect compared to lower classes. The ancient thinkers endeavoured to align the
ethical and moral principles of their time with the state and political agendas. For Ancient
Greeks, as well as for Romans, the world is hierarchical in its essence, with privileges for men
from higher classes deserving dignity due to their noble descent, wealth and social status.
The rest were regarded as lower humans – barbarians – who had no value nor deserved any
respect for their dignity. In the early views of ancient Greek philosophers, based on laws of
nature, we encounter the study of a human being as a spiritual and moral being. For Heraclitus,

156 Faculty of Business Economics and Entrepreneurship International Review (2017 No.3-4)
© Filodiritto Editore – Proceedings
ethical values of a man are particularly valuable, since “a man’s character is his daemon”
(Heraklitus, 2006), and the life of a man is moral and happy if subordinated to general law.
In Ancient Rome, dignity was not defined as an inherent feature of human beings, rather as
a social status that each individual attains within the society. The common feature between the
views in the Ancient Rome and Greek, and the contemporary understanding of dignity is in
their shared core, i.e. the sense of value requiring respect. Through the dark period of the
Middle Ages, Thomas Aquinas considered the nature of human existence and believed that the
“the notion of species pertains to human nature according to the existence human nature has in
the intellect.” (Aquinas, 2003). He sees reason as the essential and universal feature of all
human beings which ensures their uniqueness and peculiarity in nature. After the Middle Ages,
the era of Renaissance and Enlightenment brought along the ideas that gave each individual the
right to freedom, happiness and progress. Awareness of human rights has been formed on
theories of Locke, Rousseau, Kant.
John Locke, developed the idea of natural law implying life, liberty and property. He
believed that state should support the pursuit of the natural rights of men. Tom Bingham
reminded that “fundamental truth propounded by the great English philosopher John Locke in
1960 that “Wherever law ends, tyranny begins” (Bingham, 2011). In this period, Jean-Jacque
Rousseau promoted the liberal ideas of dignity and equality among individuals and the
individual right to liberty. For Kant, dignity is above all other values, since individual dignity is
priceless, unlike the commodities which may be purchased and which have their market value.
Expressing his views on morality and dignity Kant believes that “Now, morality is the
condition under which alone an Intelligent can be figured as an end in himself, since by it alone
can he become a legislator in the realm of ends. Wherefore morality, and humanity in so far as
it is susceptible of that morality, is alone that which has the dignity.” (Kant, 1993) According to
Kjatran, Kant respect for the personality of each individual. For the mutual respect of the
personality, the most important behavior is in accordance with: “…universal laws – that is, rules
which, first, restrict every person equally and, second, do not merely represent the choice of one
particular person or group” (Kjatran, 2011).
John Stuart Mill advocated individual rights and personal freedoms of human beings and
suffrage rights of women. He appreciated the peculiarities of each human being, their
uniquenessand originality: “It is not by wearing down into uniformity all that is individual in
themselves, but by cultivating it and calling it forth, within the limits imposed by the rights and
interests of others, that human beings become a noble and beautiful object of contemplation”
(Mill, 2007).
Mill advocated self-development and defence of individuality and autonomy of individuals
and the least possible influence of social structures on the opinions and behaviours of
individuals. Today this endeavour to limit the social impact on free development of personality,
on pursuing personal happiness and guarantees of individual autonomy is recognised as human
rights protection, since the basis of inherent dignity of human beings is freedom, which includes
physical and spiritual integrity of a person.
Subliming the above understandings of the term dignity, a single position emerges that
dignity is a concept applied for highlighting special features of men as noble, elevated and
special values, accepted as such in the social system of ethical and moral norms. “The subject of
human dignity is the worth of human beings or their high rank, or even their special place in
nature” (Kateb, 2011).
Human rights
Human rights as a legal instrument are based on international and national treaties and
pertinent case law. As a moral category, human rights are demands of individuals to be
recognised certain rights by the state for the sake of protection of inherent dignity. The notion
of human rights was frequently in history the way of pursuing and ending revolutionary
demands for respecting human beings and citizens. The essence of human beings has been the

Faculty of Business Economics and Entrepreneurship International Review (2017 No.3-4) 157
© Filodiritto Editore – Proceedings
same at all times. What changed was the relation of the authorities to human beings. Human
rights, unalienable from the essence of human beings, exist independently from the will of the
ruler. These are the rights “which are not owed to the state or its will, but are possessed by
human beings by the mere fact of being a human being, hence independently form any state and
without the state” (Dimitrijevich, Paunovich, 1997). These are the rights “which belong to each
individual simply by being a human being, independently of any legal texts” (Radonjic, 2004).
The exercise of human rights in a society, their implementation in a legal order of a state
means the protection of the inherent human dignity. Inherent dignity of each human being is the
source of human rights, since human rights stem from the need to protect human dignity.
Today, legal regulations in contemporary social systems enable the manifestation of
fundamental human values, recognition of human rights as the essence of human beings.
An Brief Overview of the History of Human Rights
Through early history of human society, in the absence of legal regulations, the sense of
justice in adjudication is based on moral values and religious commandments. “Religious
doctrines are an important substantive source of human rights, they offer common elements
from different traditions in the form of universally accepted values as important building blocks
for constructing a wider intellectual and cultural concept for the protection of human life,
freedom and dignity (Vucinic, 2001).” Justness in court decisions is found and in the Bible:
“You shall not do unjustly in judgment. Thou shalt not favor the person of the poor, nor honor
the person of the mighty, but thou shalt judge thy neighbor justly (Bible-Old and New
Testament, Leviticus) 1968).”
The first formal recognition of certain rights by the rulers, enshrined in legal regulations,
emerged in 13c. in England, through the act known as Magna Carta Libertatum (1215),
proclaiming that: “No free man shall be seized or imprisoned, or stripped of his rights or
possessions, or outlawed or exiled, or deprived of his standing in any way, nor will we proceed
with force against him, or send others to do so, except by the lawful judgment of his equals or
by the law of the land” (https://www.bl.uk/magna-carta/articles/magna-carta).
The idea of human rights originated from the revolution in the Great Britain in 17c.,
continued with the revolutions in America and France, then the philosophy of Kant and the
political philosophy of John Rolls, as well as Ronald Dworkin’s theory of justice in 20c. The
French Revolution brought the new political embodiment of the notion of human rights and
human dignity in its contemporary meaning. The exercise of rights and freedoms are treated as
natural human rights, not as traditional rights. Sovereignty is embedded not in the monarch or
the House of Representatives, but in people who are free to change governments and forms of
government. In early 18c, the liberal principles of forms of government and the idea of natural
rights were presented in the works of Jean-Jacques Rousseau. He supported the true human
nature and the natural resistance to inequality and injustice and stood for creating a civil state
that would to the greatest extent possible respect the natural human state, considering that the
civic form of government gives moral freedom to human beings since “moral liberty, which
alone makes him truly master of himself; for the mere impulse of appetite is slavery, while
obedience to a law which we prescribe to ourselves is liberty” (Jrousseau, 1993). Such his
theories had a substantial impact on shaping the republic as a form of government after the
French Bourgeois Revolution, when it became a symbol for the rule of the majority, denying
any form of absolute power of the political elite. The American Declaration of Independence
from1776 is not based on traditional rights and privileges, but refers to the rights belonging to
all people by nature. According to the Declaration: reads as follows: “We hold these truths to be
self-evident, that all men are created equal, that they are endowed by their Creator with certain
unalienable Rights, that among these are Life, Liberty and the pursuit of Happiness”
(http://www.ushistory.org/declaration/document/). This landmark document paved the way for
international protection of human rights, which today constitute one of the most important
segments of the international legal order. The law is the expression of the general will. All the
citizens, being equal in its eyes, are equally admissible to all public dignities, places and

158 Faculty of Business Economics and Entrepreneurship International Review (2017 No.3-4)
© Filodiritto Editore – Proceedings
employments, according to their capacity and without distinction other than that of their virtues
and of their talents.
The theoretical aspects of the development of human rights included several interpretations
for the existence of human rights: positivist theories advocated the views of human rights
existing based on a high legal act of domestic and international law by which the legislator
enables citizens to enjoy human rights. Positivists believe that there is no higher order above or
beyond stipulated legal norms created by the authorised legislator. Thus, the positivist Hans
Kelsen developed the notion of “positive” law as opposed to the “natural” law (Kelsen, 2003).
John Finnis believes that the issue of morality and human existence does not consist of
“making the distinction between the basic aspects of human wellbeing, but in integrating these
different aspects in intelligent and reasonable obligations, projects and actions which make one
ot the other of many wonderful forms of human life” (Finnis, 2003). According to Dimitrijevich
(1997): “This law wich is not positive, is called natural law, and thus, not with standing mutual
differences, the theories which believe that in addition to the positive law is some other legal
order are called natural law theories – naturalism”.
A moderate positivist, Lon L. Fuler, after World War Two, expressed his views of the need
to apply the moral dimension in the legal system of states, as well as the need for the legal
system to be based on the balance of moral and legal criteria. Discussing legal morality and the
notion of positive law and their application in court adjudication, he stated that “law is the
enterprise of subjugating human conduct to the reign of rules” (Fuler, 1999), citing Holmes’s
prediction theory of law: “Prediction what courts will actually do, nothing more pretentious
than that, is what I consider law.” (Fuler ,1999) According to Fuler, it is obvious that the
prediction of court’s actions “presume some sort of order” (Fuler,1999), and that it should
contain a moral dimension which refers those who pass judicial decisions, in addition to the
law, also to the value judgements of the correctness of the ruling made. The application of legal
and moral norms in reaching legal decisions, according to them, is the best administration of
justice.
The idea of natural rights which claims that, apart from the legal regulations created and
sanctioned by the state, there is the order of natural law which emerged before the written law
and continues independently of the will of rulers and men is based on the Ancient Greek
philosophical ideas of the division of law into the general and particular. The general law exists
independently of any written law and is based on the nature of things, and thus has the character
of natural law. The natural law theories linked the existence of human rights with human nature
and considered human rights to exist regardless of the legislator’s will to formulate them in
legal acts. John Rolls talked about the equal nature of all human beings and their equal rights to
freedom and justice. The principles of justice refer to equal rights of all to freedom and
economic equality. Rolls believed that through social contracts a high degree of individual
freedom and their better economic position can be achieved. He believed that: “Quite a complex
set of rights and duties characterises any particular fundamental freedom, not only should it be
allowed to individuals to do or not do something, but the authorities and other individuals must
have the duty not to prevent them from doing so.” (Rawls, 1998). The exercise of the right to
freedom would depend on conditions and circumstances in which these are exercised, and that
care should be taken of the ability to “protect the most fundamental interests” (Rawls, 1998).
Ronald Dworkin introduced the terms moral, ethics, and politics in law. Dworkin advocated
the theory of natural law by which law exists independently of any state law and should have
supremacy in application over the state law. According to Dworkin, human rights exist per se,
they do not exist because of the state or of the law, but both the state and the law exist for the
sake of human beings and pursuit of human rights. Dworkin believes that the concept of
constitutional protection of individual rights is the best protection against the tyranny of
majority. This concept brings together the majority and individual rightsof all citizens and is the
ideal environment for the protection of human rights and principles for all citizens. Over this
period law became not only a public, but also a private matter, thus leading to the expansion of
the field of human rights, and by extension, to the limitation of state powers. According to

Faculty of Business Economics and Entrepreneurship International Review (2017 No.3-4) 159
© Filodiritto Editore – Proceedings
Dworkin: “By reference to moral principles, which act a s a limitation of law, rather than by
citing the conflicting goals of law” (Dworkin, 2001). According to the doctrine of
constitutionalism, which advocates respects for human dignity and human rights: “Human
rights are a value per se, … if such rights and freedoms are to be regulated at all, it can only be
the subject matter of the legal act of the highest order (constitution), not the individual acts of
the supreme legislature” (Radonjic, 2004).
The intensive evolution of human rights started after World War Two as a response to all
atrocities done by human beings to the detriment of other human beings. Finally, the
recognition of respect for human rights was given its rightful place in the social structure of the
international community. The United Nations were established giving human rights protection
the global character. Thus, human rights ceased to be an internal matter of states. The UN
Charter, adopted on 26 June 1945 refers to: “Promoting and encouraging respect for human
rights and for fundamental freedoms for all without distinction as to race, sex, language, or
religion” (Tomovich, Bogićevich, 2003). The UN Charter was the first contractual regulation in
international law which established the internationalisation of human rights. Further evolution
in international protection of human rights happened with the adoption of the Universal
Declaration of Human Rights in 1948, which compiled all previous human rights provisions and
gave an impetus for further development of human rights protection. According to Art.1 of the
Declaration: “All human beings are born free and equal in dignity and rights. They are endowed
with reason and conscience and should act towards one another in a spirit of brotherhood.”
Human rights may be seen as inherent, naturally bestowed and unalienable, but also as
rights given by states, as a form of limiting the state powers over individuals and guarantee their
natural rights: “Subjective rights rest on the norms of objective law, which give and guarantee
those rights. Constitution and laws of a state set forth for a very wide range of people, for all
citizens of age, some rights, such as the right to contest in elections” (Dimitrijevich, Paunovich
1997).
International instruments implementing the provisions on human rights protection in the
legal systems of state parties are particularly important for the respect for human rights. “Social
justice refers to the fairness of all social structures, and human rights are implemented in society
and their equal and inalienable achievement contributes to social justice and dignified life of an
individual in the community” (Ghai, Cottrel, 2011).
By ratifying international treaties, state parties undertake to implement international human
rights law and are obliged to align their legal system with the commitments assumed through
international treaties. Thus, a single system of international human rights protection is created
giving each individual safety and trust in equality and justice in the world. “Justice is essential
to our social functioning as is indicated by the fact that the concept of justice (as well as its
violation) often dominates our daily experiences and discussions De Cremer, Kees Van den Bos
(2007) “Justice and Feelings: Toward a new era in Justice Research”, Social Justice Research,
20,1.
International agreements in the center of their interests put a man and his need to protect his
own personality, as a natural and social being. “In discussing the mobilization of international
human rights in a specific social and cultural context, one can draw on an ever-expanding socio-
scientific literature on international rights.” (Oomen, 2013) “The rights for others: The
Contested Homecoming of Human Rights in the Netherlands”, Netherlands Quarterly of
Human Rights, 31/1,41-73.)
The recognition of human rights limits the state powers and offers to each individual an
equal and just legal protection. Such rights are universal and belong to all people equally,
acquired upon birth and exist independently of the will of the state and may not be abolished by
the state. Today, human rights are differently recognised and guaranteed to citizens. Developed
democracies attach particular attention to human rights protection, unlike the less developed
ones, which do not embrace the wide recognition of human rights.

160 Faculty of Business Economics and Entrepreneurship International Review (2017 No.3-4)
© Filodiritto Editore – Proceedings
Research of the human rights committee case law
State parties to the Optional Protocol to the ICCPR agree that persons under their
jurisdiction may address the United Nations Human Rights Committee (HRC) through
communications if they believe any of their rights guaranteed by the Covenant has been
violated.
An essential issue in all legal structures is to put all the different circumstances and
situations that occur in life under the effect of legal norms. Given that life circumstances often
go ahead of law, the interpretation of legal provisions is one of the most responsible tasks of
those acting upon applications or communications. Researching the given subject in the varied
HRC case law I analysed the communications of compatible ratione temporis, ratione materie
and ratione personae, in which the HRC established violations of rights guaranteed by the
ICCPR invoking the violation of inherent human dignity in their statements of reasons. The
HRC is the only: “Universal body dealing with individual issues of human rights violations in
facing the situations that no one could have envisaged and which only life can bring about in all
its complexity, fullness and uniqueness. The HRC must apply creatively the ICCPR provisions,
interpreting it in the global sense, i.e. taking care that the standards it takes into account should
not be particular or linked with a specific ideology of understanding life” (Dimitrijevich, 1989)
“Komitet za ljudska prava” (The Human Rights Committee).
Once the HRC has established violation of rights guaranteed by the ICCPR, it requires from
the state party, concerned to provide adequate remedy to the author of the communication,
proper compensation and other necessary measures to prevent further similar violations. When
considering the reports by state parties, the HRC adopts general comments noting deficiencies
or difficulties in respecting and implementing the ICCPR provisions and issues
recommendations in which: “The HRC in a general form indicates the shortcomings and
deficiencies in those reports and takes a position on those ICCPR provisions which are
differently interpreted in such country reports” (Dimitrijevich (1989) “Delatnosti Komiteta za
ljudska prava” (Activities of the Human Rights Committee) which, through their moral
authority, affect more consistent implementation of the ICCPR provisions by state parties and
ensure enjoyment of human rights thus guaranteed because the HRC, where the representatives
of different civilisations, schools of legal thought and ideologies sit, adopts them by consensus.
The aim of adopting general comments of HRC is to make the experiences of treaty bodies
available to state parties and to serve as guidance for further improvement of the state of human
rights in the country.“Committees help state parties to overcome the difficulties occurring in
implementing international treaties, in addition to interpreting some specific rights guaranteed
by international treaties, by giving guidance in general comments for further enhancement of
human rights, proposing measures to be undertaken and improvements to be made”
(Dimitrijevich et al., 2007).
The HRC establishes whether the state party concerned violated any of the rights guaranteed
by the ICCPR against the author of the communication and publishes its decision in its periodic
reports (Reports of the Human Rights Committee:
(http://www.ohchr.org/EN/HRBodies/CCPR/Pages/CCPRIndex.aspx).
Studying the HRC practice in implementing the provisions of the ICCPR, I singled out those
communications where the HRC established that due to the violation of human dignity some of
the rights guaranteed by the ICCPR were violated. The applications lodged are stated in the
chronological order, together with the relevant Convention articles and HRC reports upon
considering the communications:
1. Comm., No. 481/1991, Jorge Villacanes v. Ecuador, art. 7 i 10 par. 1, 14 par. 3(c),
A/52/40.
2. Comm.No. 523/1992, Clyde v. Trinidad and Tobago, art. 9 par. 3 and 14 par. 3(c),
A/51/40.
3. Comm., No. 512/1992, Daniel Pinto v. Trinidad and Tobago, art. 7 and 10 par. 1,
A/51/40.

Faculty of Business Economics and Entrepreneurship International Review (2017 No.3-4) 161
© Filodiritto Editore – Proceedings
4. Comm., No.571/1994, Eustance Henry and Everald Douglas v. Jamaica, art. 7 and 9
par.3,10 par.1,14par.3(c), A/51/40.
5. Comm., No. 707/1996, Patrick Taylor v. Jamaica, art.9 par. 2 i 3,10 par. 1, art. 14
par.1and14 par.3(c), and 6, A/51/40.
6. Comm., No.695/1996, Simpson v. Jamaica, art. 2, 10 par. 1 and art. 14 par. 3 (d),
A/57/40.
7. Comm., No. 683/1996, Wanza v. Trinidad and Tobago, art. 10 par. 1, art.14 par. 3(c),
A/57/40.
8. Comm., No. 721/1997, Boodo v. Trinidad and Tobago, art. 7 i 9 par. 3, 10 par. 1, 14
par. 3(c), 17 and 18, A/57/40.
9. Comm., No 793/1998, Pryse v. Jamaica, art. 7 and 10, par. 1, A/59/40.
10. Comm., No. 798/1998, Howelly v. Jamaica, art. 7 and 10 par. 1, A/59/40.
11. Comm., No. 868/1999, Wilson v. Jamaica, art. 7, 9 par, 1, 2 i 3, art. 10 par. 1 i 2,
A/59/40.
12. Comm., No. 899/1999, Francis et. al. v. Trinidad and Tobago, art. 9 par. 3, 10 par. 1,
14 par. 3(c), A/57/40.
13. Comm., No. 927/2000, Svetlik v. Belorus, art. 19 par. 2 and 3, A/59/40.
14. Comm., No. 931/2000, Hodoyberganova v. Uzbekistan, art. 14, A/59/40.
15. Comm., No.938/2000, GirjadatSiwpersud et al. v. Trinidad and Tobago, art. 9 par. 3,
10 par. 1 and art. 14 par. 5 in 3(c).A/59/40.
16. Comm., No.1033/2001, Nallaratnam v. Sri Lanka, art. 5 and 14, par .5, A/59/40.
17. Comm., No.992/2001, Bousround v. Algeria, art. 7 and art. 9 par. 1, 3, 4 and 10,
A/61/40.
18. Comm., No.1050/2002, D. and E. v. Australia, art. 9 par. 1 and 2, 19, 12 par. 1,
A/61/40.
19. Comm., No.1069/2002, Bakhtairi v. Australia, art. 9 par. 1 and 4 and art. 24 par. 1,
A/59/40.
20. Comm., No.1167/2003, RamilRayos v. The Philippines, art. 6, par. 1, and art. 14, par. 3
(b), A/59/40.
21. Comm., No.1128/2002, Marques v. Angola, art. 9 par. 1 and 2, 19, 12 par. 1, A/60/40.
22. Comm., No.1126/2002, Carranza v. Peru, art. 9, 7, 10 and 14, A/61/40.
23. Comm., No.1196/2003, Boucherf v. Algeria, art. 2 par. 3, 7, 8 and 9, 16. A/61/40.
24. 24.Comm., No.1232/2003, Pustovalov v. Russian Federation, art. 7and art. 14 par. 3
(b, d and e), A/65/40.
25. Comm., No.1439/2005, Aber v. Algeria, art. 7 and 9 par 3, 10 par. 1, A/62/40.
26. Comm., No.1327/2004, Grioua v. Algeria, art. 2 par. 3, 7, 8, 9, 16, A/62/40.
27. Comm., No.1328/2004, Kimouche v. Algeria, art. 2 par. 3, 7, 8, 9, 16, A/62/40.
28. Comm., No.1373/2005, Dissanakye v. Sri Lanka, art. 9 par. 1, 19, 25 (b),A/63/40.
29. Comm.,No.1422/2005, El Hassy v. The Libyan Arab Jamahiriya, art. 5, 7, 9, 10,
A/63/40.
30. Comm., No. 1406/2005, Weerawansa v. Sri Lanka, art. 9 par. 1, art. 19, art. 25 (b),
A/64/40.
31. Comm., No.1369/2005, Kulov v. Kirgistan, art. 7, 9 par.1, 3, 4, art. 14 par. 1, 2, 3 (b),
(c),(d) and(e), A/65/40.
32. Comm., No.1442/2005, Kvok v. Australija, art. 9, A/65/40.
33. Comm., No.1402/2005, Tatiana Krasnova v. Kirgistan, art.7, 9 par.2 i art. 14 par. 1, 3
(b), and 3(c), A/66/40.
34. Comm., No.1410/2005, Ievdokimov and Rezanov v. Russian Federation, art. 2, par. 1
and 3, 25, A/66/40.
35. Comm., No.1412/2005, Butovenko v. Ukraine, art. 7, 9 par. 1, art. 10 par. 2 and 14 par.
1, 3(b),(d),(e) and(g), A/66/40.
36. Comm., No.1449/2006, Umarov v. Uzbekistan, art.7,9 par. 1,3,4, 10 par. 1 and 19 par.
2, 26, A/66/40.

162 Faculty of Business Economics and Entrepreneurship International Review (2017 No.3-4)
© Filodiritto Editore – Proceedings
37. Comm., No.1450/2006, Komorovski v. Turkmenistan, art. 9 par. 1, 19, 25 (b), A/63/40.
38. Comm., No. 1520/2006, Mvamba v. Zambia, art. 6, 7, 10 par.1, 14 par. 2 and 3 (c) and
5, A/65/40.
39. Comm., No 1588/2007, Benzaiza v. Algeria, art.7, 9, 16, 2, 6 par. 1, A/65/40.
40. Comm., No 1640/2007, El Abani v. Libia, art. 2 par. 3, 6 par. 1, 16, A/65/40.
41. Comm., No 1870/2009, Sobhraj v. Nepal, art. 10 par. 1, 14 par. 1, 2, 3, 5 i 7, A/65/40.
42. Comm., No. 1759/2008, Traore v. Cote d’Ivoire, art. 2 par. 3; 6, par. 1; 9; and 10,
par.1, A/67/40.
43. Comm., No. 1781/2008, Bergizv.Algeria, art. 2 par. 3; 6, par. 1; 7, 9 (1-4); and 10, par.
1, 16, A/67/40.
44. Comm., No. 1782/2008, Aboufaied v.Libya, art. 2 par. 3; 6, par.1; 7,9 (1-4); and 10,
par. 1, 12 par. 2, 14, 16, 19, 21. A/67/40.
45. Comm., No.1811/2008, Djebar and Chihoub v.Algeria, art. 2, par. 3, t. 6, par. 1, 7. 9
par.1 to 4, 10 par. 1, 16, 17, 23 par. 1, 24, A/67/40.
46. Comm., No. 1834/2009, A.P. v. Ukraine, art. 2 par. 1 and 3(a) and (c), art. 4 par. 2; 7;
9; par. 1 and 3; art. 14 par. 1, 3 (b) (d) and (e) and 7; 19. par. 2, A/68/40.
47. Comm., No. 1858/2009, Y.M. v. Russian Federation, art. 2, par. 3, 7, 9 par. 1, 3 and 5,
10 par. 1, 14, par.1, 16 and 26, A/67/40.
48. Comm., No. 1962/2010, S.N.A. v. Cameron, art. 1, 7, 9, 10, 17 and 19, A/68/40.
49. (Reports on Human Rights Committee:
http://www.ohchr.org/EN/HRBodies/CCPR/Pages/ CCPRIndex.aspx).
The research is completed with the review of the Report on Human Rights Committee:
A/71/40 (31st March 2017).
Results and discussion
1. By examining and analysing the 48 HRC decisions stated above, where the HRC
established the infringement of human rights due to the violation of inherent human dignity, I
established that the violation of human dignity in the largest number of cases referred to the
following ICCPR provisions: Art. 7 in 25 cases (52.08%); Art. 10 para. 1in 22 cases (45.83%);
art. 9 para. 1 in 18 cases (37.5%); Art. 9 para. 3 in 16 cases (33.33%); Art. 14 para. 3(c) in 12
cases (25%); Art. 9 para. 2 in 8cases (16.66%); Art. 14 para. 1 in7cases (14.58%); Art. 19
in.8cases (16.66%); Art. 9 in5cases (10.41%); Art. 16 in7cases (14.58%); Art. 9 para. 4 in
5cases (10.42%); Art. 14 para. 2 in 4 cases (8.33%); Art. 2 para.3 in 9 cases (18.75%); Art. 14
in 6 cases (12.5%); Art. 10 in 4cases (8.33%); Art. 14 para. 5in 3 cases (6.25%); Art. 2 para. 7
in 3 cases (6.25%); Art. 2 para. 8 in 3 cases (6.25%); Art. 2 para. 9 in 3 cases (6.25%); Art. 12
para. 1 in 3 cases (6.25%); Art. 25 para. (b) in 3 cases (6.25%); Art. 19 para. 2 in 2 cases
(4.16%); Art. 5 in 2 cases (4.16%); Art .6 in5cases (10.41%); Art. 26 in 2 cases (4.16%); Art 25
para. b in 3 cases (6.25%); Art. 24 in 2 cases (4.16%); Art. 19 para. 3 in 1 case (2.08%); Art. 14
para. 3 (b) in 2 cases, (4.16%); Art. 14(c) in 1 case (2.08%); Art. 25 in 1 case (2.08%); and Art.
14(e) in 2 cases (4.16%).
2. The results of researching shows the largest number of cases establishing violation of
human dignity (52.08%) refer to ICCPR, Art. 7 which reads: “No one shall be subjected to
torture or to cruel, inhuman or degrading treatment or punishment. In particular, no one shall be
subjected without his free consent to medical or scientific experimentation”.
Under item 2 of the General Comment no.20: “The aim of the provisions of article 7 of the
International Covenant on Civil and Political Rights is to protect both the dignity and the
physical and mental integrity of the individual” (UN Human Rights Committee, General
Comment no. 20: Article 7 (Prohibition of Torture, or Other Cruel, Inhuman or Degrading
Treatment or Punishment; http://www.refworld.org/docid/). General Comment no. 20 further
states: “The prohibition in article 7 is complemented by the positive requirements of article 10,
paragraph 1, of the Covenant, which stipulates that “All persons deprived of their liberty shall

Faculty of Business Economics and Entrepreneurship International Review (2017 No.3-4) 163
© Filodiritto Editore – Proceedings
be treated with humanity and with respect for the inherent dignity of the human person (CCPR,
General Comment no. 20: http://www.refworld.org/docid/).
3. During the analysis, I singled out the reasons which made the HRC invoke the violation
of human dignity in reference to the infringements of Art. 7 of the ICCPR, and these include:
physical assaults, torture, cruel treatment, intimidation, administering unidentified substances,
the cases where medical condition exacerbated during incarceration, enforced disappearance,
failure to report incarceration or detention, when inflicting pain, stress, suffering, being forced
to stay in unlit, small, over-crowded prison cells, prohibition to take medication, maltreatment
to coerce to admission of guilt, being detained incommunicado (prolonged prohibition of
visitations, correspondence).
4. Art. 10 para 1 was violated in 40% the cases where the HRC established infringement on
the account of violation of human dignity: horrible prison conditions (small and crowded cells,
no light, no beds), physical punishment and torture, failure to provide medical assistance and
treatment, enforced disappearance, being shackled while incarcerated with no food and water,
etc.)since these actions violate inherent human dignity protected by Art. 10 of the International
Covenant on Civil and Political Rights, which reads: “All persons deprived of their liberty shall
be treated with humanity and with respect for the inherent dignity of the human person
(U.N.T.S., 1976: no. 14668, vol. 999, p. 171).”
In actions taken by states against their own citizens, apart from most common violations of
Art. 7 and Art. 10 para. 1, another quite common violation is that of Art. 9 para. 1(11%) and
para. 3 (11%), which refers to liberty and security of person and reads as follows: “Everyone
has the right to liberty and security of person. No one shall be subjected to arbitrary arrest or
detention. No one shall be deprived of his liberty except on such grounds and in accordance
with such procedure as are established by law (U.N.T.S., 1976: no. 14668, vol. 999, p. 171)”.
In its General Comments, (UN Human Rights Committee (HRC), General comment no. 35,
Article 9 (Liberty and security of person), http://www.refworld.org/docid/), the HRC considers
liberty of person to be the right of profound importance. The ICCPR Art. 9 recognises and
protects liberty and security of person. Liberty of person in terms of this provision refers to
freedom from physical incarceration, not the general liberty of actions, and security refers to
being free form bodily injuries and preservation of physical integrity and the right to personal
security, independent of the right to liberty of person. Art. 9 guarantees this right to everyone:
“Everyone” includes, among others, girls and boys, soldiers, persons with disabilities, lesbian,
gay, bisexual and transgender persons, aliens, refugees and asylum seekers, stateless persons,
migrant workers, persons convicted of crime, and persons who have engaged in terrorist
activity.
5. Further, by examining the HRC case law, I established that the Committee in its decisions
interprets the term dignity in different ways, conceptualising its meaning according to the facts
and circumstances of each individual case. As particularly aggravating, the HRC took to be the
circumstances involving a person never brought before the court or if that has not been done
within the statutory deadlines, then the disappearance of a person in prison, prolonged
incommunicado, limitation of the rights to habeas corpus, unnecessary delays of trial, the period
of three years before pre-trial detention and trial, imposing detention without being heard before
competent persons, denying the right to an attorney throughout the proceedings, arbitrary arrest
or prolonged solitary confinement (12 years). The HRC individualises the criteria for
establishing violations of the rights guaranteed by the ICCPR, particularly taking care of
mental, physical and health status of the person, of the applied measures of repression, duress,
fear, threat or coercion to specific acts that undermine the dignity of each individual, and how
the facts and circumstances that the applicant alleges are reflected on the violation of their
inherent dignity.
6. Given the number of applications lodged with the HRC from around the world, by
interpreting and conceptualising the notion of dignity and through individualisation of specific
circumstances of each individual case, the structure of existing human rights norms is
expanding and current national and international legal system further developed. Thus, the

164 Faculty of Business Economics and Entrepreneurship International Review (2017 No.3-4)
© Filodiritto Editore – Proceedings
protection of dignity as an inherent human value, and the source of human rights, is becoming a
common standard and the basis for further development of national and international legal
regulation.
A particular challenge for all interpreters of legal norms is how to put new and different
circumstances and situations under the impact of legal regulation. Therefore, holders of social
authorities that interpret legal regulations and apply them to specific situations, have the very
important task to extend the effect of the legal norm through their interpretation, thus creating
new aspects and levels of human rights protection which protect human dignityin the best way
possible, building specific systems of values for respecting human beings in all life
circumstances. Thus, through its case law, the HRC helps the alignment of state parties’legal
regulations with the international one and creates a common basis for ever more effective
human rights protection. Under Art. 4 para. 2 state parties are obliged to: “Within six months,
the receiving State shall submit to the Committee written explanations or statements clarifying
the matter and the remedy, if any, that may have been taken by that State (Optional Protocol to
the International Covenant on Civil and Political Rights
http://www.ohchr.org/EN/ProfessionalInterest//OPCCPR1).
When to confirm once the violation of any of the rights guaranteed by the ICCPR is
established, State party is given recommendations which, in addition to the compensation for
the author of the communication, also impose obligations for the State party to have legislative
changes, which may refer to laws and other legislation, and to align them with international
regulations. The HRC with its recommendations, for instance in reference to Art 7 and 9 of the
ICCPR, instructs the state concerned, that violated any of the rights guaranteed by the ICCPR,
to ensure in its legislation, instead of detention and incarceration, other measures of
enforcement (bail, mandatory reporting to relevant institutions and electronic bracelets).
In reference to Art. 9, the HRC constantly demands relevant states to respect the right to fair
trial (inform the persons of the reasons of arrest, mandatory interrogation, presence of an
attorney throughout the proceedings, reasonable times for pre-trial detention and other measures
in reference to specific cases).
7. The HRC recommendations have particular significance for the population of
underdeveloped democracies, since the improvement of the respect for each individual by
implementing the new legal instruments develops the rule of law domestically.
As final considerations, in addition to the above, I would like to point to the sociological
importance of General Recommendations and HRC recommendations which assist state parties
to establish the practice of reaching decisions in specific cases by indicating the elements of
legal and social culture in need of improvement, thus complementing the protection of human
rights of persons under their jurisdiction. The sociological aspect of human rights protection is
seen primarily in the respect for human beings in all life circumstances and in all societal
structures and encouraging state parties with relevant legal instruments to improve the
legislation and social status of their populations.
The specific significance of the HRC case law and its recommendations is seen in the
individualisation and conceptualisation of the notion of dignity thus extending the effect of the
legal norm and creating new levels of protection for human dignity by individualising specific
circumstances.
Conclusion
In the introduction I cited the examination of the influence of the HCR recommendations in
the implementation of the ICCPR as one of the motifs for the paper. The paper links the historic
development of human rights and the contemporary human rights protection through the HRC
decision, particularly focusing on the protection of dignityas the ethical value and the source of
human rights. Natural features of an individual are the same in all times, but their manifestation
and recognition has come a long waythrough social evolution positioning human dignity as an
aim aspired to in the functioning of the global human rights protection system. I particularly

Faculty of Business Economics and Entrepreneurship International Review (2017 No.3-4) 165
© Filodiritto Editore – Proceedings
highlighted the HRC recommendations that invoke the protection of human dignity in their
statements of reasons when establishing a violation of a certain human right and by analysing
their contents I found the areas guaranteed by the ICCPRwhich are most prone to violation of
human dignity. Analysing the HRC case law, one becomes aware of the evolving humanisation
of access to protection of human dignity. Assessing individual facts and circumstances of each
case, and by conceptualising dignity, the HRC creates new aspects and levels of human rights
protection and protects human dignity in the most objective way. Ratifying human rights
treaties, modern states express their readiness to guarantee to the citizens under their
jurisdiction the recognition of rights guaranteed by international instruments. By cherishing the
value of respect for human beings in all living circumstances, the HRC effectuates the
humanisation of legal orders of state parties in the sense of having just evaluation of protection
for human dignity and just balance between applying the legal regulation and moral values.
REFERENCES
1. Aquinas, T. (2003) On Being and Essence, Dereta, Belgrade.
2. American declaration of independes (http://www.ushistory.org/declaration/document/).
3. Bible-Old and New Testament, Leviticus, (1968), Stvarnost, Zagreb.
4. Bingham, T. (2011) The Rule of Law, Penguin books, London.
5. Charter of the United Nations (https://www.un.org/en/charter-united-nations/).
6. De Cremer D. and Kees van den Bos (2007) “Justice and Feelings: Toward a new era in Justice
Research”, Social Justice Research, Vol. 20, 1, 1-9, p.1.
7. Dimitrijevich, V.and Paunovich, M. (1997) Human Rights, Center for Human Rights, Belgrade.
8. Dimitrijevich, V. (1989) “Komitet za ljudska prava” (The Human Rights Committee),
Jugoslovenska revija za međunarodno pravo, vol. 1-2, p. 73.
9. Dimitrijevich, V. (1989) “Delatnosti Komiteta za ljudska prava” (Activities of the Human Rights
Committee)., Jugoslovenska revija za kriminlogiju i krivičnopravo, vol. 27, 1, p. 5.
10. Dimitrijevich, V. Popovich, D. Papich, T. Petrovich, V. (2007) Međunarodno pravo ljudskih
prava (International Human Rights Law), Dosije, Belgrade.
11. Dworkin, R. (2001Taking Rights Seriously, Institut za otvoreno društvo Crne Gore, CID,
Podgorica.
12. Finnis, J. (2003) The Natural Law and Natural Rights, CID, Podgorica.
13. Ghai Y. and Cottrel, J. (2011) The Millenum Declaration, Rights, and Constitutions, Oxford
University Press, Oxford.
14. Hobbes, T. (2004) Leviathan, Jesenkii Turk Hughes, Zagreb.
15. International Covenant on Civil and Political Rights (ICCPR). United Nations Treaty Series
(1976), 999, I-14668,171. Aviable at: hhtps://treaties.un.org/volume 999/I-14668.
16. Kateb, G. (2011) Human Dignity, Harvard University Press, Cambridge, Massachusetts and
London.
17. Kjatran Koch Mikalsen (2011) “Indeference of Kant s League of states”, Law and Philosophy,
vol. 30, 291-317.
18. Heraclitus, (2006) On the nature, Oktoih, Podgorica.
19. Kant, I. (1993) The Metaphysics of Etics, Izdavačka knjižarnica Zorana Stojanovića, Novi Sad.
20. Kelzen, Hans (2003) The problem of sovereignty and the theory of international law, Službeni
list Srbije i Crne Gore, Beograd.
21. Lutz, A. Mark (1995) “Centering Social Economics on Human dignity”. Review of Social
Economy, vol. 53, 2, pp. 171-194.
22. Magna Carta Libertatum (https://www.bl.uk/magna-carta/articles/magna-carta).
23. Mill J.S. (2007) On Liberty, Center for the Publications of the Law Faculty, University of
Belgrade, Belgrade.
24. Oomen, B. (2013) The rights for others: The Contested Homecoming of Human Rights in the
Netherlands, Netherlands Quarterly of Human Rights, Vol. 31/1, 41-73, p. 52.
25. Optional Protocol to the International Covenant on Civil and Political Rights, available at:
www.ohchr.org/OPCCPR1.
26. Radonjich, R. (2004) Demokracy, CID, Podgorica.
27. Rawls, J. (1998) The Theory of Justice, Službeni list Srbije i Crne Gore, Podgorica, Beograd.
28. Rousseau, J.J. (1993) Social Contract, Filip Višnjić, Beograd.

166 Faculty of Business Economics and Entrepreneurship International Review (2017 No.3-4)
© Filodiritto Editore – Proceedings
29. Tomovich, Z. and Bogichevich, C. (2003) Human rights – international documents, Oktoih,
Podgorica.
30. UN Human Rights Committee (HRC), CCPR General Comment No. 20: Article 7 (Prohibition
of Torture, or Other Cruel, Inhuman or Degrading Treatment or Punishment), 10 March 1992,
available at: http://www.refworld.org/docid/.
31. UN Human Rights Committee (HRC), General comment no. 35, Article 9 (Liberty and security
of person), 16 December 2014, CCPR/C/GC/35, available at: http://www.refworld.org/.
32. Universal declaration of Human Rights, adopted 10 Decembar 1948 UNGA Res 217 A(III)
(UDHR) art. 1. (https: www.un/org/en/universal-declaration-human – rights)
33. Vucinić, N. (2001) Fundamentals of human rights and freedoms), CID, Podgorica.

Faculty of Business Economics and Entrepreneurship International Review (2017 No.3-4) 167
© Filodiritto Editore – Proceedings
ORIGINAL SCIENTIFIC PAPER
Investigate the Most Important Causes of Job Burnout
of Employees (Case Study: Youth and Sports General
Directorate of Qom)
RAD Raheleh Tayyebi37, JAMSHIDI Mina38
Abstract
Human resources of any organization are precious resource of that organization that can
assist it in achieving its goals. Specialist staff, loyal, consistent with the values and
organizational objectives have strong motivation and willing and committed to maintain and
continue organizational membership are basic and essential needs of any organization. Hence,
we decided to take a step in in this important by providing this work; This study have been
developed in descriptive analytical method with aim of fulfilling to create communication
between the components and characteristics of job burnout of some of department of sport and
youth personnel of Qom, using a standardized questionnaire SPSS software. The population of
this study consisted of 230 personnel of the General Directorate of Youth and Sports of Qom on
two levels of employees and the President and the results indicate that existence of job features
including variety of tasks, conscientiousness, the nature of the task, independence and feedback
on job have significant impact on reducing burnout syndrome of employees.
Keywords: human resources, organizational goals, job burnout, Qom
JEL: O15
UDK: 159.944.4.072
613.86
COBISS.SR-ID 253518860
Introduction
In today’s competitive world, organizations are constantly seeking new ways to maximize
employee performance and efforts. Changing and dominant conditions on organizations,
increasing competition and the need for effectiveness in such circumstances, reveal their need
for the valuable generation of staff, generation that are called as (organizational veterans).
One of the factors affecting decrease in performance and effectiveness of human resources
in organizations, is the phenomenon of job burnout. It seems that job burnout be associated with
psychological pressures. psychological pressures occur when there is an imbalance between
environmental demands and individual’s ability to respond them. Whatever the environmental
demands increase and individual’s ability to respond them decrease the psychological pressures
is created which causes negative experience in individual and job burnout. In fact, job burnout
occurs as a result of constant psychological pressure (Farber 1983). Job burnout is also caused a
deterioration in the quality of service provided by the staff (Saatchi, 1382).
37 Islamic Azad University, Tehran, Iran 38 Islamic Azad University, Tehran, Iran

168 Faculty of Business Economics and Entrepreneurship International Review (2017 No.3-4)
© Filodiritto Editore – Proceedings
Problem statement
Job burnout is a professional risk that is associated with reduction in employees’ physical
and mental energy. Nowadays job burnout has attracted much attention by researchers and
corporate leaders that mainly is associated with important individual and organizational
outcomes such as job performance, organizational behavior, job attitudes and negative
psychological consequences (Martinkou, 2004). Job burnout has negative impact on employees,
family, friends and those around them and in general has a negative impact on society, and can
reduce quality of life for employees both at work and in their home. Over time, job burnout can
lead to increased problems at home and also the withdrawal from family and friends. Job
burnout is a painful experience for individuals and a costly phenomenon for organizations.
Costs of job burnout for employees and their families is also very heavy which includes
direct costs such as lack of membership and participation of employees, absenteeism, turnover,
strikes, reduced job performance, reducing the quality and quantity of output and job accident
and indirect costs such as loss of vitality, job dissatisfaction, low commitment, reducing the
quality of relationships, distrust, hostility and aggression. Hence biggest concern of researchers
is to investigate the causes and control of this important which will be discussed in the
following.
Job characteristics
The prelude to job characteristics attitude was Turner and Lawrence studies. They put a
major project into action to assess the staff react to different jobs. They believed that employees
prefer complex and working jobs to monotonous and uninteresting jobs and believe that will be
followed by complexity of the job, satisfaction and the presence of employees (Moorhead,
Griffin, 1382). Job characteristics refers to activities, tasks, assignments and various aspects of
a job. Some of the jobs, are conventional and ongoing because their activities are homogeneous
and repeated and some other are unusual; Some require different skills and some other limited
practical field; Some tires employees by making theme to strict compliance of trends and some
other gives employees the freedom to do their work willingly. Some jobs are most successful
when are done collectively by a group of employees and some other are done by people who are
essentially independent and work (Keshtidar, 2002).
Job characteristics theory
There are at least seven theories on the characteristics of job. Fortunately, they have a lot in
common. For example, hygiene motivation theory of Herzberg's and research was conducted on
the need for achievement by McClelland are both among the job characteristics theories.
Herzberg suggests that if the job can lead to success, reputation, responsibility and such
things, will cause an increase in job satisfaction of workers or employees. McClelland proved
that those who achieved more opportunities will have great performance and will accept great
responsibility (Parsaeian, Arabi, 1386).
Here we will point three job characteristics theories:
1. Attribution theory of job
2. Social information processing model
3. Job Characteristics Model
Job burnout and its creation
To address the issue of job burnout and express opinions on the issue should first define two
terms of “job strain and psychological stress”.
Job strain and psychological stress are two words often used interchangeably, but do not
have the same meaning. Job strain is necessary for advancement in life. But if go beyond the

Faculty of Business Economics and Entrepreneurship International Review (2017 No.3-4) 169
© Filodiritto Editore – Proceedings
necessary limit leads the psychological stress. Psychological stress does not lead to
advancement. Neumann and Pierre defined job strain as: a condition that arises in the effect of
employment situation and distract individual from the usual action. Inavcevich and Matteson
believe that job strain is an adaptive response that is realized by personal characteristics or
psychological processes. So, can be said that Psychological stress, is his reaction against the
wrong amount of pressure (Moshabbaki, 1376).
Job Burnout
What is Job Burnout?
The term burnout been applied by Herbert J. Freudenberger for the first time in the year
1974 AD to describe a particular kind of job burnout. He used this term to explain the
progressive states of emotional discharge, loss of motivation and decreased commitment among
young volunteer employees who worked with commitment in a medical clinic. In 1976,
Maslach after a long time listening to issues of social service employees mentioned the
phenomenon of indifference and neglect feel about the client’s (Zarei Matin, Anvari, 1391). But
in the years 80’s and 90’s this disorder was recognized as a distinct disorder and also separate
strategies must be recommended to fix it. Job burnout is used to describe a syndrome that
mainly affects people working in social sanitary centers. Such as lawyers, managers, doctors,
counselors, teachers and people who are active in law enforcement, considered jobs have
particular respect in the society and are dealing with patients that have important needs and are
suffering difficult conditions. In these jobs, change and interaction is high and there is a direct
and continuous and repetitive relationship with clients. So, considered syndrome in professions
that provide help, appears more in profession helping, however, burnout is not specific to these
professions and also is seen in other professions. The term burnout is used among several
Persian equivalents that are proposed for Burnout. Among other proposed equivalents can be
mentioned exhausted, power failure, stroke work, burnout, job fall, detachment, job exhaustion
and mental erosion (Asgari, 1383). Nowadays job burnout has attracted great attention by
researchers and corporate leaders that mainly is associated with important individual and
organizational outcomes such as job performance, organizational behavior, job attitudes and
negative psychological consequences.
Stages of job burnout
Four stages of job burnout include:
• Honeymoon State
• Fuel Shortage State
• Chronic Symptom State
• Crisis state
• Hit the wall state
The causes of job burnout
Individual factors
Organizational Factors
Environmental factors
Social factors
Job factors

170 Faculty of Business Economics and Entrepreneurship International Review (2017 No.3-4)
© Filodiritto Editore – Proceedings
Fig. 1. Circumstances establishing job burnout in staff
The signs of job burnout
Person who has job burnout his self-respect descends, his personal relationships disappears,
he may feel that too much works and is not able to control his much work. He knows himself as
a swimmer against the water moves and is unable to keep his head above water. This condition
causes a person's sense of hopelessness and helplessness. Job burnout happens periodically and

Faculty of Business Economics and Entrepreneurship International Review (2017 No.3-4) 171
© Filodiritto Editore – Proceedings
it is essential that we come to accept such a period and is easily treatable if recognized at an
early stage. But the first step in dealing with this case is being aware of its symptoms (Geldard,
1374).
The first stage of Job burnout, is physical burnout. This type of burnout, is one of the
constituents of the disability. A person who is exhausted, complains about extreme boredom
(often associated with insomnia). In addition, the person usually experiences signs indicating
lack of energy, chronic fatigue and also weakness.
The second aspect of job burnout, is emotional burnout. When person’s physical reserves
are finished due to continued stressful job conditions, it may be parallel to that person’s
emotional force, ends. Worker or employee who has lost his power and is exhausted, expresses
feelings such as depression, helplessness and frustration by itself. In these conditions,
satisfaction that acquired before and at the time of leisure or beside family and friends’
decreases and as a result, the overall satisfaction with life decreases.
The third aspect of job burnout, is mental burnout. In this case, the worker deal with the
negative view towards work, customers or client of the organization and colleagues. The fact
that such a person is exhausted and is not able to observe the feelings and needs of others, in
fact, indicate that his dealing is free of humanitarian aspects. These negative attitudes and
inhuman attitude may extend to family environment and friendly circles of the person with job
burnout (Saatchi, 1387). L-Moss (1981) in his efforts to classify effects and results of job
burnout, has classified these effects into three categories of physical indicators, behavioral
changes and job performance.
Warning signs of job burnout
Feeling of emptiness
Negative feelings and emotions
Loss of motivation
Depression
Drug abuse
Vicious cycle
Emotional withdrawal
Decreased performance
Reduced levels of physical health
Interpersonal problems
Despair and frustration
Confronting strategies with job burnout
Coping strategies with job burnout can generally be classified in two categories, namely,
individual strategies and organizational strategies.
Organizational strategies to cope with job burnout
Employ people who in addition to being interested to a particular job, also have necessary
personality traits to fulfill the duties of the job.
Holding training courses appropriate to operators of various occupations.
Reduce using either methods reprimand and punishment.
Reduce dangerous conditions in the organization.
Improving communication networks and interaction in the organization.
Identify stressors in the organization and try to eliminate those factors.
Provide the most suitable conditions for the growth of the abilities and talents of employees.

172 Faculty of Business Economics and Entrepreneurship International Review (2017 No.3-4)
© Filodiritto Editore – Proceedings
Identify workers, employees, professionals and especially managers who have a moderate
or severe behavioral disorders or psychological distress, and the help of Psychiatry and Clinical
Psychology to treat them.
Providing health care services to help regain mental health of employees and restoring their
psychological competence.
Design and implementation of effective education programs in the field of mental health in
the work environment (Saatchi, 1390).
Materials and Methods
At the stage data analysis, the researchers are forced to use statistical methods to identify the
characteristics of the studied phenomenon or relationships of phenomena and variables and
calculate and estimate required indicators to for a researcher to identify the status of variables in
the sample and to find the necessary knowledge. Also, to study the relationship between
variables, the researcher has to use inferential statistical methods.
For this reason, demographic variables were studied at first. To test the normality of the
population we used K-S test and then addition to multivariate test (t-test) then investigated the
status of research variables and using confirmatory factor analysis research variables construct
validity was confirmed over two times. Finally, using structural equation modeling investigated
research hypotheses. According to the results of the structural equation, a significant positive
impact on job characteristics and its components on the lack of job burnout and all research
hypotheses were confirmed. Also, should be noted that no significant difference was observed
between these two components.
Conclusion
Our world is organizations world and the main driver of this wheel is humans. The ones who
give life to the organization will permit the realization of goals. Without human the
organization is meaningless and management is an imaginary (Griffin, 1382). Human resources
are as the main and the largest and most valuable asset of an organization, community and
country, so because of that countries and organizations has long invested on this valuable force
and try to fertilize it and societies reach progress, prosperity and excellence which can thrive
these forces and talents behind them (Nasrollahpour, 1385). Humans by undertaking the
organizational tasks are reviving the organization, of course, each of the tasks and jobs in the
the organization has its own specific characteristics. Attitude of job characteristics in job design
was superior attitude in the 1970s and early 1980s. This attitude that was concluded from
studies on job motivation characteristics (such as autonomy and feedback) have an evolved
form that explicitly considered status of individual differences in response of employees to a job
and finally become as job characteristics theories (Griffin, 1382).
However, nowadays, the emergence of threatening areas of human resources in different
organizations are known as one of inevitable defects in organizational efficiency. One factor
that reduces the efficiency of precious human capital, is the phenomenon of job burnout.
Destructive effects of this phenomenon on individual and social life is evident and
educational organizations staff are considered as one of the most vulnerable segments of society
against job burnout. Psychological, occupational stress and its consequences are one of the most
critical issues of work life in today's industrial complex world. Job pressures on organizational
forces have large costs for the organization and may be harmful and malignant and have serious
effects sought and undermine the mobility and attempts of human and cause lack of efficiencies
and productivity and efficient use of resources and finally effectiveness of the organizations.
Nowadays because of the dramatic changes that job burnout can leave on the quality of
personal, family and professional life of a person is considered as a serious problem.

Faculty of Business Economics and Entrepreneurship International Review (2017 No.3-4) 173
© Filodiritto Editore – Proceedings
Suggestions
1. Job Characteristics model of Oldham and Hackman focuses on jobs and does not pay
attention employment and since in this study considered job characteristics model is
Oldham and Hackman’s model, thus employee's personality and his personal
characteristics is not considered, however in the real world there is no job without
employee and in addition to job characteristics employee’s characteristics and
personality should be considered. So, we hope that these factors be seen in further
research and employee’s features be added to job characteristics, and these two factors
be considered together.
2. Researchers can implement the same issue in other organizations or other production
and service centers and comparatively compare the results.
3. Other researchers can simultaneously implement this issue in the public and private
sectors and compare obtained results with each other.
4. Researchers can examine relationship between work factors (based on job
characteristics) with productivity, efficiency, quality of performance, effectiveness,
motivation, absenteeism and staff turnover.
REFERENCES
1. Abzaari, M., Seraydaryan, H. (1376). Management and Psychological stress, Isfahan, Arkan
publications.
2. Alwani, M. (1386). Public administration, Tehran, Ney publication.
3. Blood. M.R., Hultin. C. L (1967). “Alienation Environmental Characteristic and Worker
Response”. Journal of Applied Psychology. 51. 284-290.
4. Cooper, C. L., Dewe., P. J., O’Driscoll, M.P. (2001). “Organizational stress: a review and
critique of theory, research, andapplications”. Sage publications. Inc.
5. Dehghan Marvast, A. (1378). analyze the relationship between occupational factors with
organizational committing based on job characteristics, Tehran’s Allameh Tabatabai University,
Master’s thesis of Management.
6. Farber, B. A. (1983). “Stress and Burnout in The Human Service Professions”. New York:
Pergamon Press.
7. Fedai, M., Yeter, D. (2010). “The Impacts of Structural and Psychological Empowerment on
Burnout: A Research on Staff Nurses in Turkish State Hospitals”, Canadian Social Science, Vol.
6, No. 4, pp. 63-72.
8. Freudenberger, H. J. (1974). “Staff Burnout”. Journal of Social Issues, Vol. 30, pp. 159-65.
9. Freudenberger, H. J. (1975). “The Staff Burn-Out Syndrome in Alternative Institutions”,
Psychoterapy: Theory, Research and Practice. 12 (1), 73-82.
10. Garg, P., Rastogi, R. (2006). “New Model of Job Design: Motivating Employees’performance”,
Journal of Management Development, Vol. 25, pp. 572-587.
11. Hackman, J. R., Lawler, E. E. (1971). “Employee Reactions to Jobcharacteristics”. J. of Applied
Psychology 55: 259.286.
12. Hackman, J. R., Oldham, G. R. (1976). “Motivation Through the Design of Work: Test of A
Theory”. Organizational Behavior Andhuman Performance, 250-279.
13. Hackman, J.R., Oldham, R.G. (1980). “Work Redesign”, Reading, Ma: Adisson – Wesley
14. Hackman, J.R., Oldham, R.G. (1975). “Development of The Job Diagnosticsurve”, Journal
Applied Psychology, Vol. 60 (2), pp. 159-170.
15. Jeldkar, M. (1379). Compare the psychiatric and non-psychiatric nurses job burnout in Noor,
Farabi medical centers and Modarres rehabilitation, Khuzestan: Islamic Azad University
psychology master’s thesis.
16. Keshtidar, M. (2002). “A Study of the Relationship Between Source of Control a Stress and
Compare Between Faculty Managers and Sporting Groups and Non- Sporting Group”, Ph.D.
Dissertation, Tehran University, Tehran, Iran. (In Pesian).
17. Khairi, T. (1382). Self-control in organization, Tehran: Tadbir publication.
18. Khalifeh, S., Eftekhar, A. (1377). Review job burnout in educational managers in Isfahan,
Isfahan, Isfahan University, a master’s thesis in Educational Management.

174 Faculty of Business Economics and Entrepreneurship International Review (2017 No.3-4)
© Filodiritto Editore – Proceedings
19. Rahimi, S. (1379). Manager’s burnout and about how it is, No. 109, Tadbir monthly magazine,
Tehran.
20. Robbins, S. P. (1376). organization theory (translation Seyed Mehdi Alwan and Hassan
Danaeefard), Tehran, Moj publishing, Saffar publishing.
21. Robbins, S. P. (1384). Management of Organizational Behavior (translator Farzad Omidvaryan),
Tehran, Ketabe Mehraban institution publishing.
22. Robbins, S. P. (1386). Organizational Behavior, Volume III (translated by Ali Parsaeian and
Seyyed Mohammad Arabi), Tehran, Cultural Research Bureau.
23. Teimouri Nasab, A. Rashidi, M. M. (1390). Job burnout syndrome of human resources in the oil
industry, Tehran, Institute for International Energy Studies.
24. Zarei Matin, H. Seyedkalaly, N., Akhavan Anvari, M. (1391). Investigate the effect of job
burnout on the employee’s job implications, No. 9, the prospect of public administration,
Tehran.
Article history:
• Received 15 October 2017
• Accepted 12 December 2017

Faculty of Business Economics and Entrepreneurship International Review (2017 No.3-4) 175
© Filodiritto Editore – Proceedings
Editorial Paper Retraction
We have to inform our respected reading public that, to our deep regret, a case of scientific
plagiarism has appeared for the first time in our Journal. This is to notify you that the Editorial
Board of the Journal International Review has retracted from publication the following article:
“The Impact of Organizational Culture on Knowledge Sharing” by Sahar Khazaei Poul,
Foad Khanlarzadeh, Vida Samiei, International Review (2016 No.3-4), pp.9-24.
The Publisher would like to reveal that this paper has been few times rewritten, but still
contains several sentences and paragraphs directly or almost directly and even verbatim copied
from an original paper written by Raid Moh’d Al-adaileh “The Impact of Organozational
Culture on Knowledge Sharing: The Context of Jordan’s Phosphate Mines Company”
International Research Journal of Finance and Economics ISSN 1450-2887 Issue 63 (2011), pp.
216-228.
Moreover, no acknowledgements of reference have been made.
The Editorial Board asks, therefore, all the respective readers to accept their apology for not
having found out this very unfortunate case during the review procedure.
Editorial Board
International Review


![arXiv:1707.01183v1 [cs.CL] 4 Jul 2017](https://static.fdokumen.com/doc/165x107/633c4c56516eefee880e2362/arxiv170701183v1-cscl-4-jul-2017.jpg)


![arXiv:1705.01759v1 [cs.CV] 4 May 2017](https://static.fdokumen.com/doc/165x107/63233c4f887d24588e0490fc/arxiv170501759v1-cscv-4-may-2017.jpg)