
Chinese Business Review (ISSN 1537-1506) Vol.12, No.4, 2013
88
-
Upload
independent -
Category
Documents
-
view
0 -
download
0
Transcript of Chinese Business Review (ISSN 1537-1506) Vol.12, No.4, 2013


Chinese Business Review
Volume 12, Number 4, April 2013 (Serial Number 118)
David
David Publishing Company
www.davidpublishing.com
PublishingDavid

Publication Information: Chinese Business Review is published monthly in hard copy (ISSN 1537-1506) and online by David Publishing Company located at 9460 Telstar Ave Suite 5, EL Monte, CA 91731, USA.
Aims and Scope: Chinese Business Review, a monthly professional academic journal, covers all sorts of researches on Economic Research, Management Theory and Practice, Experts Forum, Macro or Micro Analysis, Economical Studies of Theory and Practice, Finance and Finance Management, Strategic Management, and Human Resource Management, and other latest findings and achievements from experts and scholars all over the world. Editorial Board Members: Moses N. Kiggundu (Canada) Yener COŞKUN (Turkey) Helena Maria Baptista Alves (Portugal) Marcello Signorelli (Italy) Doaa Mohamed Salman (Egypt) Amitabh Deo Kodwani (Poland) Lorena Blasco-Arcas (Spain) Yutaka Kurihara (Japan) Ahmad Zafarullah Abdul Jalil (Malaysia) Salvatore Romanazzi (Italy) Saeb Farhan Al Ganideh (Jordan) Tulus Tahi Hamonangan TAMBUNAN (Indonesia)
GEORGE ASPRIDIS (Greece) Agnieszka Izabela Baruk (Poland) Goran Kutnjak (Croatia) Elenica Pjero (Albania) Cafer TOPALOĞLU (Turkey) Indah Susilowati (Indonesia) LI Kui-Wai (Hong Kong) Mohamed Nabil MZOUGHI (Tunisia) Mary RÉDEI (Hungary) Shelly SHEN (China)
Manuscripts and correspondence are invited for publication. You can submit your papers via Web Submission, or E-mail to [email protected], [email protected]. Submission guidelines and Web Submission system are available at http://www.davidpublishing.org, http://www.davidpublishing.com. Editorial Office: 9460 Telstar Ave Suite 5, EL Monte, CA 91731, USA Tel: +1-323-984-7526, 323-410-1082 Fax: +1-323-984-7374, 323-908-0457 E-mail: [email protected]
Copyright©2013 by David Publishing Company and individual contributors. All rights reserved. David Publishing Company holds the exclusive copyright of all the contents of this journal. In accordance with the international convention, no part of this journal may be reproduced or transmitted by any media or publishing organs (including various websites) without the written permission of the copyright holder. Otherwise, any conduct would be considered as the violation of the copyright. The contents of this journal are available for any citation, however, all the citations should be clearly indicated with the title of this journal, serial number and the name of the author.
Abstracted / Indexed in: Database of EBSCO, Massachusetts, USA Ulrich’s Periodicals Directory ProQuest/CSA Social Science Collection, Public Affairs Information Service (PAIS), USA Norwegian Social Science Data Services (NSD), Database for Statistics on Higher Education (DBH), Norway Index Copernicus, Poland Summon Serials Solutions
Chinese Database of CEPS, Airiti Inc. & OCLC Chinese Scientific Journals Database, VIP Corporation, Chongqing, P. R. China
Subscription Information: Print $520 Online $360 Print and Online $680 David Publishing Company 9460 Telstar Ave Suite 5, EL Monte, CA 91731, USA Tel: +1-323-984-7526, 323-410-1082 Fax: +1-323-984-7374, 323-908-0457 E-mail: [email protected]
David Publishing Company
www.davidpublishing.com
DAVID PUBLISHING
D

Chinese Business Review
Volume 12, Number 4, April 2013 (Serial Number 118)
Contents Economics
Incentives to Invest in Improving Quality in the Telecommunications Industry 223
François Jeanjean
The Dilemma Between the Heterodox-the Orthodox Economics and Its Ideology 242
Ilkben Akansel
Analysis on China’s Economic Transformation and Its Relevance to Global Economy 258
Wenfu Zhou, Jianqiang Peng
Management
A Bicycle Design Model Based on Young Women’s Fashion Combined With
CAD and Statistical Science 266
Kaori Koizumi, Shinji Kawahara, Yuki Kizu, Kakuro Amasaka
Competitiveness of Travel Agencies in the European Tourism Market 278
Iris Mihajlović
Compassion in Buddhism and Guanxi: Can There Be a Synergy for Western
Companies in China 287
Tashi Gelek, Gration David
The Driving Forces of CO2 Emission in China: 2002-2007 298
Libo Yuan, Yinchuan Xu


Chinese Business Review, ISSN 1537-1506 April 2013, Vol. 12, No. 4, 223-241
Incentives to Invest in Improving Quality in the
Telecommunications Industry*
François Jeanjean
France Telecom Orange, Paris, France
This paper investigates the incentives of invest in improving quality (as opposed to investments in new activities) in
the telecommunications industry, based on the example of wireless markets. What is the impact of competition on
incentives to invest, and on capacities to invest? What is the role of the rate of penetration and technical progress?
This paper highlights the fact that investment incentives are positively related to potential for technical progress.
Investment incentives also depend on market structure, competition intensity, and penetration rate, but not
monotonically. This paper consists of a theoretical part which, under assumptions of full market coverage and
market share symmetry, shows that for each national market, there is a target level of investment which companies
strive to achieve but had not exceeded, and an empirical part that confirms the findings of the theoretical part and
explains the differences with the theoretical part by relaxing the assumptions of full coverage and market share
symmetry. This target level on the one hand depends on the potential for technical progress and on the other hand,
depends on the rate of penetration. From a social perspective, this target level is the best amount that companies are
encouraged to invest. Non-achievement of the target level entails underinvestment and a decrease in consumer
surplus and welfare and may slow down technical progress. A data set covering 30 countries over a period of eight
years is used to empirically prove the existence of a change in investment behavior depending on whether or not the
target level is achieved. A low margin per user may hamper achievement of the target level. As a result, maximum
consumer surplus and welfare occur under imperfect competition but not under perfect competition.
Keywords: competition, investment, investment incentives, technical progress, regulation, telecommunications
Introduction
Information technologies are characterized by the regular exponential growth of data usage, as exemplified
by Moore’s law. The telecommunications sector is no exception, and shows an impressive increase in
consumption, with annual growth rates often well into the double digits. This is made possible by the sector’s
tremendous technological progress, as well as regular and ongoing investments by operators. These investments
are essential to allow consumers to benefit from technical progress.
It is therefore crucial for policy makers and the competition authorities to ensure that investment
incentives and capacities are sufficient for investments to continue.
This paper examines telecommunications companies’ investments in wireless markets in 30 countries * This paper represents the analysis of the author and not necessarily a position of France Telecom Orange.
François Jeanjean, Economist, France Telecom Orange. Correspondence concerning this article should be addressed to François Jeanjean, 78, rue Olivier de Serres 75015 Paris, France.
E-mail: [email protected].
D DAVID PUBLISHING

IMPROVING QUALITY IN THE TELECOMMUNICATIONS INDUSTRY
224
around the world from 2002 to 2010.
It will show empirically that in all studied countries, companies strive to achieve target investment levels
based on market conditions (competition, standard of living, penetration rate, technological progress, etc.).
However, only companies which generate adequate margins succeed. Companies with lower margins invest
only what they can and find themselves threatened by the technology gap.
Target investment levels those which maximize expected corporate profits. They are closely related to the
potential for technical progress: high potential provides more investment opportunities and makes investment
more efficient, thus increasing the target level.
Investments in quality improvement, which represent a significant portion of telecommunications
operators’ investments, must be distinguished from investments in new activities or markets. The decision
processes involved differ significantly.
Investments in new activities are expected to ultimately provide new revenues and profits. The decision to
invest is based on the estimated net present value and return on investment. The decision to invest in improving
the quality of existing services, on the other hand, it depends more on competition than on expected profits.
Indeed, this paper shows that when the market is fully covered and symmetrical, investment in improving the
quality does not increase profits.
Improving quality means improving network performance for users (bandwidth, availability, quality and
ease of use, customer care, etc.) and leads to an increase in consumers’ willingness to pay.
The operator which most improves its performance gains a competitive advantage and increases its profits.
However, if all competitors improve their performances to the same extent, none of them creates a competitive
advantage. In practice, competitive advantages are relatively weak because they are difficult to obtain and even
more difficult to maintain over time. All operators can buy the same equipment and invest under similar
conditions, meaning that this type of investment generally does not significantly increase corporate profits;
however, these investments do dramatically increase consumer surplus and social welfare.
Competition based on quality improvement grows fiercer as the potential for technical progress increases.
An increase in the potential for technical progress increases the profit margin required to achieve the target
investment levels. It is impossible to achieve target investment levels if profit margins are too low, thus slowing
technical progress at the expense of consumers and their welfare.
Our study revealed that this occurs not only in emerging countries but also in developed countries when
price-based competition is so fierce that companies are unable to achieve their target investment levels. A Chow
test shows that companies’ investment behavior varies depending on whether or not they have the means to
attain their target levels.
Competition plays a crucial role in investment behavior. More specifically, there are two types of
competition, which have very different impacts: competition on pricing and competition on quality
improvement. The former tends to decrease margins, while the latter tends to increase investments. As long as
companies’ margins remain sufficient to achieve their target investment levels, the competition is sustainable;
otherwise it is too fierce and companies will underinvest.
A trade-off seems to exist between the two types of competition. An increase in the potential for technical
progress encourages competition based on quality improvement by increasing the target investment levels,
implying a decrease in price-based competition. In a sense, these two types of competition are in competition
with one another.

IMPROVING QUALITY IN THE TELECOMMUNICATIONS INDUSTRY
225
This paper will show that consumer surplus and welfare are maximized at investment levels which exceed
the target. A trade-off should therefore be made in favor of competition based on quality improvement until the
target levels are achieved, and in favor of competition based on pricing in other cases. Companies will not
invest more once they have achieved their target levels.
Another key parameter which impacts investments in quality improvement is the user penetration rate.
Investment increases consumers’ willingness to pay, allowing consumers with lower willingness to pay to enter
the market. This increases revenues and profits for all competitors, even without generating a competitive
advantage. However, this phenomenon depends on the market’s potential for growth. When a market is fully
covered, it no longer offers any growth potential.
It will be shown that investments in quality improvement do not actually increase profits when the market
is close to full coverage. A Granger test reveals that investment does not generate margins, except when the size
of the market is increasing fast enough. On the other hand, margins always generate investments. Margins
mainly depend on competition, market structure, and standards of living, and have a major influence on target
levels of investment.
Because investments in quality improvement do not have a major impact on margins, companies cannot
rely on future additional margins to finance them, meaning that they must generate an adequate margin. This
explains why the corporate investment behavior varies when companies’ margins are insufficient to attain target
investment levels. Companies aim to reach their target levels, and try to come as close as possible when
reaching their goal is impossible.
Our paper is organized as follows: Part two is a literature review on the relationship between competition
and investment. Part three provides a theoretical framework which explains how investment incentives, and
target investment levels are determined in the specific and particular relevant case of markets with full coverage.
Part four describes the empirical model used, and part five lays out conclusions and discusses its policy
implications.
Literature Review
The literature on the relationship between competition and investment is quite rich, but mainly focuses on
investments in research and development (R&D). These studies differ from ours, since R&D investment leads
to uncertain outcomes while investments in quality improvement are much more predictable. The issues are,
however, closely related and the findings are very similar. There are two conflicting traditions in the field
(Loury, 1979). The first is the Schumpeterian Effect, which highlights the competition’s negative impact on
innovation. Schumpeter (1942) emphasized that a monopoly gives entrepreneurs the greatest incentive to invest
in innovation. The second is the Escape Effect, which highlights the positive impact of competition on
innovation. In a competitive structure, companies are encouraged to innovate in order to escape from the
competition. Innovation provides a competitive advantage, thus restoring a portion of their monopoly rents.
Adam Smith’s “invisible hand” supports the idea that monopolies should be restrained and competitive market
structures promoted in order to foster innovation.
The trade-off between the Schumpeterian and Escape Effects raises the question of whether there is an
optimal intermediate degree of competition located somewhere on the spectrum between monopoly and perfect
competition. Several empirical and theoretical studies support this view (Kaminen & Schwartz, 1975; Dasgupta
& Stiglitz, 1980), as well as the famous inverted U relationship between competition and innovation
IMPROVING QUALITY IN THE TELECOMMUNICATIONS INDUSTRY
226
demonstrated by Aghion et al. (2005).
The Escape Effect is true for relatively low levels of competition, but the Schumpeterian Effect prevails
after a certain saturation point is reached.
The idea of a trade-off between competition and innovation has been extended to the trade-off between
competition and investment (Friederiszick, Grajek, & Röller, 2008), as the concepts of innovation and
investment are often closely linked. The inverted “U” relationship has also been observed between competition
and investment (Kim et al., 2010; Bouckaert, Van Dijk, & Verboven, 2010). The Escape and Schumpeterian
Effects also apply to investments in quality improvement, but in a rather different way. The Escape Effect is
more prevalent in this case, since investments in quality never lead to radical innovation and a competitive
advantage is more difficult to obtain. Competition based on quality improvement drives companies to make
regular investments, although these investments do not significantly increase their profits. However, it always
increases both consumer surplus and social welfare. The Schumpeterian Effect also works differently in this
case. Competition reduces margins, thus decreasing both the expected profits and investment capabilities.
The literature has consequences for regulatory authorities and policy makers, who must adjust their
decisions depending on whether the Schumpeterian Effect or the Escape Effect prevails.
When the Escape Effect prevails, static regulation (Antitrust policies, entry promotion, increased price
competition, reduced switching costs, etc.) will increase the intensity of competition, thus encouraging
investment. When the Schumpeterian Effect prevails, on the other hand, dynamic regulation (regulatory
vacancies, laissez faire, etc.) will decrease competition in order to increase investment. The debate surrounding
the trade-off between static and dynamic regulations has changed over time.
Pakes and Schankerman (1984) noted the positive impact of technological opportunities on R&D
investments. High levels of technical potential improve the effectiveness of investments, encouraging
companies to invest more and requiring greater investment capacities. This shifts the balance between the
Escape and Schumpeterian Effects towards the latter.
Pure static regulation has come under increasing criticism in recent years (Audretsch, Baumol, & Burke,
2001; Valletti, 2003; Bauer, 2010). Its main drawback is the fact that it is best applied to situations with a very
stable demand and market structure, at a time when the telecommunications sector is changing rapidly.
The need for significant investments in telecommunications networks such as the Next Generation
Network has led regulatory authorities to increasingly take the issues of investment and dynamic efficiency into
account. Bauer and Bohlin (2008) observed this shift in the USA. Furthermore, Cambini and Jiang (2009) note
that, “Nowadays, the urgency to spread broadband access calls for a large amount of capital expenditure.
Therefore more and more regulatory concerns are attracted to the investment issue in the broadband market”.
Dynamic regulation seeks to encourage investments in order to improve consumer appeal and surplus, as
well as welfare. However, dynamic regulation is not a panacea for regulatory policies (Salop, 1979; Gilbert &
Newbery, 1982; Sutton, 1991) refute this assumption and highlight the fact that dynamic regulation may reduce
the intensity of competition and does not necessarily lead to improved consumer welfare.
Theoretical Background
This section provides a theoretical framework for understanding the incentives to invest in quality
improvement. In particular, it explains the origin of the target investment levels and the impact of the different
parameters on these levels.

IMPROVING QUALITY IN THE TELECOMMUNICATIONS INDUSTRY
227
Our model is based on the spoke model described by Chen and Riordan (2007), a competing model with
horizontal differentiation among companies.
The model highlights telecommunications operators’ incentives to invest. They invest in order to improve
the quality of their offers and increase consumers’ willingness to pay. This boosts the total number of
consumers who make purchases, thus expanding the market. Furthermore, the companies which most improve
their quality gain a competitive advantage, although if all of them improve their quality to the same extent none
of them gains a competitive advantage. Competition will, however, encourage them to invest anyway. This
constitutes competition based on quality improvement. The amount that companies are willing to invest
depends on their investment’s impact on consumer utility. The model shows that a certain amount of investment
maximizes corporate profits. This is the target investment level. Companies invest this amount when they have
the ability to do so; otherwise they invest as much as they can but are unable to reach their target and invest less
than they would like to.
The model shows that the socially optimal level of investment has been always higher than the financially
optimal amount that companies seek to invest. Companies which can achieve their target levels of investment
therefore come closest to the socially optimal level.
The model also reviews the ideal margin level, which maximizes consumer surplus and welfare.
The relevant case of a fully covered market has been chosen in order to analyze the role of competition
based on quality improvement in investment incentives. The market size is normalized to 1. When the market is
not fully covered, its potential for growth encourages investment. This factor should be set aside in order to
focus solely on the impact of competition on quality improvement.
The market is represented by a spoke wheel where consumers are uniformly distributed. Each company is
located at the end of a spoke. The wheel’s diameter is normalized to 1; the length of each spoke is thus 1/2.
Each consumer located within a spoke compares the utility of purchasing an offer from the company located at
the end of the spoke and an offer from one of the other companies, which all have an equal probability of being
chosen. Since all of the spokes converge at the center of the wheel, the companies can be compared on a
one-to-one basis. If there are N companies, there will be 1 2⁄ comparisons. Each company is involved
in 1 comparisons.
It is assumed that and are respectively the consumer’s willingness to pay and the price of company
i’s offer. The focus will be on the comparison between companies i and j. The combined length of the two
spokes is 1. A consumer located at a distance of x from company i is located at a distance of 1 from
company j. For the customer, the utility of purchasing company i and company j’s offers respectively is:
where t is the differentiation coefficient (transportation cost). Considering the following two-stage game, which
comprise an investment stage and a competitive stage:
In the investment stage, each company decides on an investment level I per customer, which will improve
the quality of its offer;
In the competition stage, companies compete on the basis of price. The game is solved by backward
induction. In order to simplify the situation, it is assumed that at the beginning of the game, the market is
)1( xtpvU
txpvU
jjj
iii

IMPROVING QUALITY IN THE TELECOMMUNICATIONS INDUSTRY
228
symmetrical which is not so far from actual markets1.
All companies have the same market share and earn the same profit. In that case, , and
⁄ . Each company has an equal market share: 1⁄ customers.
The consumer hesitating between i and j is located at /2 Company i’s
market share is written: ∑ .
It is assumed that all companies incur the same marginal cost c. Company i’s profit is: .
The first order condition allows us to determine : ∑
(1)
and therefore: ∑
(2)
Investment Incentives
It is assumed that the investment I per customer at the investment stage increases willingness to pay by
during the competition stage. Function V characterizes the impact of investment on consumers’
willingness to pay. It is assumed that function is increasing, concave and tends toward a horizontal
asymptote: increasing because the greater the investment, the greater its impact; concave because the marginal
increase in investment is less and less efficient. According to the Weber Fechner law, consumers are sensitive to
the logarithm of a stimulus (Reichl, Tuffin, & Schatz, 2010). It tends toward a horizontal asymptote because the
impact of investment cannot be infinite. These conditions define the target amount that companies are
encouraged to invest (Jeanjean, 2011). As the impact of the marginal investment decreases and tends to zero
(horizontal asymptote), there is a threshold above which the cost of investment is higher than the expected
gains. This threshold is the target investment level, provided that the initial marginal investment is lower than
expected gains.
Assume that company i decides to invest and improves its consumers’ willingness to pay from v to
. In the competition stage, company i attempts to maximize , its profit minus the cost of the
investments made during the previous stage, depending on the discount rate :
)1(1
12
)()()1(1
2
iji
ji
i INN
IVIVN
tNt
(3)
The level of investment which maximizes equation (3) is . If all companies play an equal role in the
market, they will all invest the same amount .
The first order condition leads to:
)1(2
)12)(1()( *
N
N
dI
IdV (4)
(See Proof of equation (4) in Appendix)
Let us denote T, the right side of equation (4). As can be seen, T does not depend on the difference
1 The asymmetry index used in the empirical section, the variable IOA, shows that markets are generally relatively close to symmetrical (see descriptive statistics in Appendix Table A1). The average IOA is under 15% and less than 10% of the markets observed have an asymmetry index above 30%.

IMPROVING QUALITY IN THE TELECOMMUNICATIONS INDUSTRY
229
between companies, parameter t. It depends only on the discount rate and the number of companies N. For a
given market, when and N are fixed, T does not depend on the level of investment.
As V is increasing, concave and the marginal increase of V tends to zero, ⁄ is positive, decreasing,
and lim 0⁄ . Therefore the higher the value of T, the lower the value of . If 0 ⁄ is
higher than T, equation (4) has a solution, and companies are encouraged to invest . However, if 0 ⁄
is lower, equation (4) has no solution and companies decide not to invest, as shown in the graph below (see
Figure 1). T is thus the triggering threshold for investment.
Figure 1. Threshold triggering of investment.
The amount of investment which maximizes corporate profits is obtained when the curve ⁄
crosses T. At this point, equation (4) is fulfilled. For lower levels of investment, ⁄ is higher than T,
consumer utility increases faster than the corresponding cost of investment, and companies are encouraged to
invest more. For higher levels of investment, where ⁄ is lower than T, consumer utility increases more
slowly than the corresponding cost of investment so companies are encouraged to invest less.
The discount rate tends to reduce investment because the investment is riskier or the value of money is
higher in the short run.
The number of companies N tends to increase investment. N strengthens competition, as the difference in
quality between competitors, the competitive advantage, becomes more important. The variation in margin per
user generated by a higher investment increases with N.
As the market is symmetrical, all companies invest the same amount, meaning that none of them gains a
competitive advantage. They would therefore have been better off not investing but are driven to invest anyway
by fear of competition. This is non-price-based competition. This type of investment benefits consumers more
than companies.
Budget Constraints and Effective Investment Levels
At the end of the game, given the assumption of a symmetrical market, all companies have invested the
same amount, so the market remains symmetrical. The investments made have increased quality, but prices and
margins remain stable. In a symmetrical market, equation (1) becomes and industry margin
which does not depend on investment.
In this case, companies cannot rely on future profits to finance their investments; they must solely rely on
Firms do not invest
Firms invest
T
I*Investment I

IMPROVING QUALITY IN THE TELECOMMUNICATIONS INDUSTRY
230
self-investment. Indeed, investment does not increase profits and profits are fully mobilized for investment,
thus there remains nothing to repay a loan. Companies try to invest a target amount . When their profits are
sufficient to achieve , they invest ; otherwise they invest as much as possible but are unable to achieve
their target investment levels.
Given the assumption of a symmetrical market, the margin (profit per customer) equals the transportation
cost: ⁄ .
The relationship between investments and margins is as follows:
When the margin is low, i.e., , companies do not make enough profits to invest , so they invest
I = t.
When investment capabilities are high enough, i.e., , companies invest .
Figure 2 illustrates the relationship.
Figure 2. Investment according to the margin I(t).
The drop in investment for low margin is due to budgetary restrictions. This decrease in investment is
empirically observed in the next section.
Socially Optimal Investment Levels
Consumer surplus increases with investment. When the market is symmetrical, all companies benefit from
the same willingness to pay vvvNji ji ,,...,2,1, .
)4
5( tcvcs Investment increases willingness to pay by V(I), thus:
)4
5)(()( tcIVvIcs (5)
(See Proof of equation (5) in Appendix)
and as a result )()( IVcsIcs .
Social welfare, defined as the sum of consumer surplus and total profits generated in the market, is written
as: )()()( IIcsIw .
The market size is normalized to 1, so the profit generated in the market is 1 . The
market’s symmetry encourages all companies to invest the same amount and prevents them from winning a
competitive advantage. Investment ultimately increases consumer surplus but decreases corporate profits. What
level of investment maximizes welfare?
*I
I
t
Target amount achieved
Target
amoun
t
Not ach
ieved
Margin** It

IMPROVING QUALITY IN THE TELECOMMUNICATIONS INDUSTRY
231
Welfare is written as:
)1()4
)(()( It
cIVvIw (6)
The first order condition leads to the following equation (7):
)1()( **
dI
IdV (7)
A comparison of equations (4) and (7) shows that ** *( ) ( ) .dV I dI dV I dI As a result, *** II .
The socially optimal level of investment is always greater than the investment level which maximizes corporate
profits. As we saw in subsection 3.2, companies are never encouraged to exceed the target level, meaning that
they always invest less than the socially optimal level **I . They come closest to achieving **I when they can
afford to invest *I .
Socially Optimal Margins
Equations (5) and (6) represent consumer surplus and welfare according to the margin t (see Figure 3).
Figure 3. Optimal margin which maximizes consumer surplus and welfare2.
Derivatives of equations (5) and (6) provide variations of consumer surplus and welfare according to t:
and 1
Figure 2 indicates that investment depends on whether the value of the margin is lower or higher than the
target level. If , then and 1⁄ . If then and ⁄ 0 .
If , and , any margin growth is used to invest. As long as the
impact of investment on consumers is high enough, and so as long as the dynamic effects outweigh the static
effects: ( 5 4⁄⁄ for consumer surplus and 5 4⁄⁄ for welfare), the margin’s growth
increases both consumer surplus and welfare.
If , 5 4⁄⁄ , and 1 4⁄⁄ , however, the margin’s growth is no longer used to
make investments. The dynamic effects disappear, leaving only static effects, so both consumer surplus and
welfare decrease with the margin.
2 The graph is based on the assumption that the impact of investment on consumers is high enough that 45)( * dIIdV .
Consumer surplus and welfare increase as long as *tt .
t** It
Surplus
)(tcs
)(tw
cv margin

IMPROVING QUALITY IN THE TELECOMMUNICATIONS INDUSTRY
232
When the dynamic effects are high enough ( 5 4⁄⁄ for consumer surplus and ⁄ 5 4⁄
for welfare), the margin values which maximize consumer surplus or welfare are both strictly positive. The
socially optimal margin value is therefore not equal to zero. The socially optimal situation is not perfect
competition. A certain degree of margin t, which reduces market fluidity, can be socially efficient.
The greater the potential for technical progress, the higher the socially optimal margin value.
Moreover, if 3 2 , then ⁄ 5 4⁄ , and consumer surplus and welfare are maximum for
the same value (see Figure 3).
Remark: Investment mainly benefits the telecommunications sector and equipment suppliers. Considering
the welfare without investment, equation (6) becomes: 4⁄ . In that case, welfare is
always maximum when .
Quality improvement based competition can be characterized by the target amount of investment and
price-based competition by the level of margin t or rather by 1⁄ , the level of substitutability.
Maximum welfare occurs in ⁄ 1 which means that the level of quality improvement based
competition is inversely proportional to the level of price-based competition.
Empirical Analysis
This section provides an empirical analysis of the relationship between investment and margin per user for
in wireless markets in 30 countries between 2002 and 2010. It highlights the existence of a breaking point in the
relationship between margin and investment. Companies’ investment behavior in a country tends to change
when their margins reach a certain threshold. Below the threshold, investment increases sharply with the
margin, while the increase is slower above the threshold. The theoretical model in the previous section predicts
this type of change in a symmetrical and fully covered market (see Figure 2). In that specific case, beyond the
threshold (the target level), growth in investment is nil.
Section three addresses the problem in terms of the firm’s problem, however, because the market is
assumed to be symmetrical, all firms play the same role. As a result the industry behavior is totally defined by a
representative firm. In this section, the analysis is conducted at the industry level and the results could be
compared at the theoretical results of section three.
In markets which are not fully covered, investment may increase the number of consumers and profits.
The observed growth of investment, although relatively low, therefore remains positive. The model also
underscores the role of other factors including market structure, level of service adoption, level of technology,
and standard of living.
Data Set
The data set used here is a panel data set of 30 countries (cf. list in Appendix, which includes annual data
by country from 2002 to 2010). The data set should comprise 270 observations, however 29 observations are
unavailable. The data set therefore comprises 241 observations. The financial figures used (Revenue, Capex,
Ebitda, HHI, and the number of companies) are drawn from the Informa “World Cellular Information Service”.
The number of wireless users, the population, and the level of technology come from the strategy analytics
report “Broadband cellular user forecasts 2011-2016 (September 2011)”3, while the standard of living (GNI per
3 This report provides not only forecast data but also data from 2002 to 2010.

IMPROVING QUALITY IN THE TELECOMMUNICATIONS INDUSTRY
233
Capita) is taken from the World Bank (see Appendix Table A1).
The dependent variable in the linear regression model is the yearly Capex per user by country, CAPU in
US$. Capex per user is a proxy of investment.
There are two categories of explanatory variables: financial figures, which depend on the wireless market
in the country, and country figures, which are based on the specificities of each country. A time trend is
included, YEAR, which indicates the number of years counting from 2001 (the value of year in 2002 is 2, and
in 2003 is 3, etc.), as is a squared time trend (see Appendix Table A1).
These variables are presented as follows.
Financial Figures
These variables aim to evaluate the market’s impact on investment incentives. First, the margin per user,
MAPU, defined as annual Ebitda divided by the number of users. Second, the number of companies on the
market: N. Third, the asymmetry index, which measures the degree of asymmetry among companies present on
the market: IOA. This index is calculated as follows: 1
1)(
N
HHINIOA . IOA may range from 0 to 1. In a
perfectly symmetrical market, IOA = 0; IOA increases with market’s asymmetry. HHI, the Herfindahl index, is
expressed as a percentage. When the market is absolutely symmetrical, all companies have an equal market
share: HHI = 1/N, thus IOA = 0. When the market is absolutely asymmetrical, it tends towards a monopoly;
HHI tends towards 1, so IOA tends towards 1 as well. Fourth, the potential for market growth, PMG. PMG
depends on the penetration rate q, defined as the number of users divided by the total population of the country.
Assuming that the demand function, which expresses the penetration rate according to price, is sigmoid shaped,
which is a common assumption in telecommunications (Fildes & Kumar, 2002) potential for market growth is
close to its maximum at the middle of market coverage. When q is low or high, close to 0 or 1, the potential for
market growth is low. )1( qqPMG . The potential for market growth increases with PMG, which seems
more relevant than simply q. The strength of the competition is given by COMP, which is defined by 1-L,
where L is the Lerner index. The Lerner index is calculated yearly by country; it is defined as Ebitda divided by
total revenue on the market.
Table 1
Descriptive Statistics
CAPU MAPU COMP N IOA PMG 3G DPOP YEAR GNICAP
Mean 62.24 172.61 60.72% 5.94 14.50% 18.13% 14.88% 564 5.33 26,579
Standard error 2.10 5.78 0.69% 0.60 0.69% 0.26% 1.29% 102 0.16 810
Median 60.99 173.55 61.33% 4.00 12.38% 17.20% 5.29% 108 5.00 29,893
Standard deviation 32.58 89.79 10.76% 9.25 10.76% 3.97% 20.05% 1,582 2.45 12,575
Variance 1,061.57 8,061.65 1.16% 85.65 1.16% 0.16% 4.02% 2,501,646 6.01 158,135,179
Kurstosis coefficient (flattening) 3.12 -0.24 0.94 38.21 1.43 -1.16 2.58 9.41 -1.11 -0.41
Skewness 1.31 0.44 -0.36 6.05 1.27 0.29 1.67 3.35 -0.12 0.07
Minimum 5.32 12.92 23.76% 2 0.05% 9.35% 0.00% 2.65 1 4,064
Maximum 211.11 466.51 93.43% 71 51.99% 25.00% 95.38% 6,812.24 9 68,547
Sum 15,000 41,599 146 1,432 35 44 36 135,976 1,285 6,405,424
Observations 241 241 241 241 241 241 241 241 241 241

IMPROVING QUALITY IN THE TELECOMMUNICATIONS INDUSTRY
234
Country-Specific Figures
These variables aim to take into account the specific situation of each country. First, the density of
population, DPOP, defined as the total population divided by the country’s surface area. Density may have an
impact on investment. Second, the standard of living, given by the Gross National Income per capita, GNICAP,
expressed in PPP. Finally, the level of technical advances integrated into the network, 3GT, defined as the
proportion of subscriptions using 3G technologies as CDMA 2000, WCDMA or LTE.
Table 1 represents the descriptive statistics of the variables.
Econometric Model
First the determinants of the margin will be estimated and the impact of investment on future margin will
be discussed. The theoretical model shows that in a symmetrical and fully covered market, investment did not
increase the margin. However, since markets are neither perfectly symmetrical nor fully covered, it will be seen
to what extend investments actually affect margin.
Margin Equation
A panel data regression OLS is used in order to estimate the coefficients of the following equation:
(8)
where represents the control variables and represents the investment variables
, , , , , ,
, 1 , 1 , 1
where is the error term. CAPU-1 is the Capex per user CAPU lagged one year. CAPU-1*PMG and
CAPU-1*IOA are the lagged values of CAPU multiplied respectively by the potential for market growth PMG
and index of asymmetry IOA. These variables aim to assess the impact of the remoteness of assumption of
symmetry and full coverage on the margin. The subscripts of the variables denote country i at year y. The
results are presented in Table 2.
The first specification is the regression on the full sample (241 observations). The second specification
represents the same model with lagged CAPU, that is why 30 observations are lost (one per country). The
results of the second specification are very similar to the first. In this case, Investment seems to have no
significant impact on margin. However, three observations show an abnormally high Capex. For those
observations, Capex is significantly higher than margin. It is possible that these Capex do not only represent
investments in improving the quality or that these values are incorrect. Anyway, in the following columns, these
three values are removed leaving 238 observations for CAPU and 208 for CAPU-1. In the third and the fourth
specification, the investment has a significant impact on margin. There is no significant difference between the
coefficients estimated in these two specifications which suggest that an investment remains relatively steady
over time. The fifth specification provides both CAPU and CAPU-1 in order to compare the respective impact
of the past year and current year investment on margin. As expected, although both CAPU and CAPU-1 are
significant, the impact of the past year is higher and more significant. Consequently, in the following model, the
lagged values of investment CAPU-1 is chosen rather than CAPU. In the sixth specification CAPU-1 is
replaced by the product CAPU-1*PMG, and in the seventh CAPU-1 is replaced by the product CAPU-1*IOA.
These variables indicate respectively the impact of the Potential for Market Growth PMG and the asymmetry of
the market on the relationship between investment and margin. These two variables have a positive and
significant impact on margin. This means that PMG and IOA both increase the impact of investment on margin.

IMPROVING QUALITY IN THE TELECOMMUNICATIONS INDUSTRY
235
This is consistent with section three and the hypothesis of market symmetry and full coverage. Under such
hypothesis, PMG = IOA = 0, Investment has no impact on margin. Therefore, the highlighted impact is caused
by the fact that markets are neither fully covered nor symmetrical, even though they often approach close to
symmetry and full coverage. PMG increases profits and thus encourages investment. Indeed, when PMG is
high, investment in quality improvement encourages customers who were not yet in the market to enter. This
increases the market size and thus profits. Asymmetry of the market also encourages investment because
asymmetry means there are leader firms, and leader firms can expect their investment to provide them a
competitive advantage and increase their profits.
The coefficients of control variables are robust to the different specifications. As expected, competition
COMP and the number of firms N have a negative impact on margin. The density of the population DPOP and
the GNI per capita have a positive one. The time trend YEAR, indicates a decline of margin over time.
Table 2
Margin Equation
Variables MAPU (1) MAPU (2) MAPU (3) MAPU (4) MAPU (5) MAPU (6) MAPU (7)
COMP -195.1*** -182.2*** -182.3*** -183.9*** -184.9*** -181.9*** -184.1***
(25.13) (25.86) (24.03) (24.59) (24.41) (24.84) (24.67)
DPOP 0.0755*** 0.0812*** 0.0716*** 0.0807*** 0.0748*** 0.0806*** 0.0804***
(0.0254) (0.0255) (0.0241) (0.0239) (0.0240) (0.0242) (0.0240)
GNICAP 0.00458*** 0.00489*** 0.00426*** 0.00455*** 0.00450*** 0.00461*** 0.00399***
(0.000873) (0.000885) (0.000832) (0.000835) (0.000829) (0.000844) (0.000871)
N 0.0148 -0.288 -0.153 -0.525* -0.581** -0.483* -0.656**
(0.288) (0.276) (0.278) (0.267) (0.266) (0.272) (0.286)
YEAR -0.0121 -2.364* -0.109 -2.684** -2.579** -2.171* -1.837
(1.220) (1.255) (1.162) (1.189) (1.181) (1.211) (1.215)
CAPU 0.0449 0.223** 0.171*
(0.0740) (0.0913) (0.0902)
CAPU-1 0.0374 0.277*** 0.253***
(0.0687) (0.0924) (0.0926)
CAPU-1*PMG 1.127**
(0.497)
CAPU-1*IOA 1.216***
(0.428)
CONSTANT 124.0*** 121.6*** 117.5*** 120.5*** 116.6*** 119.3*** 139.0***
(27.16) (27.59) (26.06) (26.29) (26.18) (26.66) (26.75)
Observations 241 211 238 208 208 208 208
R-squared 0.433 0.384 0.428 0.408 0.420 0.395 0.405
Number of Countries 30 30 30 30 30 30 30
Notes. Standard errors are in parentheses. *** p < 0.01; ** p < 0.05; and * p < 0.1.
Investment Equation
The investment equation emphasizes the difference in behavior between companies according to their
margins. In order to do so, two hypotheses will be compared: The first hypothesis, H0 supposes there is no
change in firms’ behavior according to their margin. The corresponding equation is as follows:
(9)
The Capex per user CAPU is explained by the margin per user MAPU. is the error term. The alternative

IMPROVING QUALITY IN THE TELECOMMUNICATIONS INDUSTRY
236
hypothesis, Ha suppose there is a break in firms’ behavior. Before the break, for the low values of margin,
Capex per user follows the equation (9) and after the break, Capex per users follows the following equation:
(10)
where ∆ , ∆ , and ∆ .
A Chow test will be performed to choose the most likely hypothesis. The model with all the 241
observations will be tested first then the three abnormal observations will be removed like in margin equation.
The model for 0 which suggests there is no investment when there is no margin will also be tested.
The results are presented in Table 3.
Table 3
Investment Equation
Variables CAPU (1) CAPU (2) CAPU (3) CAPU (4) CAPU (5)
MAPU 0.253** 0.502*** 0.255*** 0.478*** 0.478***
(0.108) (0.0366) (0.0868) (0.0296) (0.0308)
△ Constant 31.30*** 52.89*** 24.46** 43.96*** 38.89***
(11.61) (7.599) (9.506) (6.364) (6.521)
△ MAPU -0.357*** -0.606*** -0.303*** -0.526*** -0.331***
(0.124) (0.0713) (0.100) (0.0586) (0.0415)
△ MAPU*PMG 1.151*** 1.151*** 1.016*** 1.016***
(0.271) (0.274) (0.221) (0.224)
Constant 21.59** 19.50***
(8.848) (7.138)
Observations 241 241 238 238 238
R-squared 0.327 0.852 0.438 0.892 0.883
Chow test 8.46 27.9 8.9 30.27 32.42
Prob. (H0) 0.00002 0.00000 0.00001 0.00000 0.00000
Notes. Standard errors are in parentheses. *** p < 0.01; ** p < 0.05; and * p < 0.1.
Specifications (1) and (2) use all the 241 observations. Specifications (3), (4), and (5) removed the three
abnormal observations.
Specifications (1) and (3) have a coefficient 0, specifications (2), (4), and (5) have a coefficient
0. Those specifications reflect the fact that there should be no investment when there is no margin4. The
specification (5) has the coefficient ∆ 0 in order to compare the impact of the potential
for market growth between specifications (4) and (5).
Removal of abnormal observations does not change significantly the results, however, it improves the
accuracy of the model.
The Chow test indicates that in all specifications, the hypothesis H0 is highly unlikely. This means that the
alternative hypothesis Ha is confirmed: There is actually a structural change. Under a certain threshold of
margin, Capex per user CAPU is proportional to the margin per user CAPU and follows the equation (9).
Beyond the threshold, CAPU follows the equation (10). The margin threshold is chosen for the value of MAPU
that maximizes the fisher’s statistic of the Chow test. This occurs for a value of MAPU = 117$/user/year.
Equation (10) does not depend on the initial specification of the coefficient . One can notice that
4 This is theoretically exact when the market is symmetrical and fully covered because in that case investment does not provide an increase in profits (see section three).
and in speci
The str
framework o
For low
increase in m
For hig
does not nec
0.505
(and negati
specification
because the
coefficient o
variation of
only if the P
margin has
market grow
Thereby, an
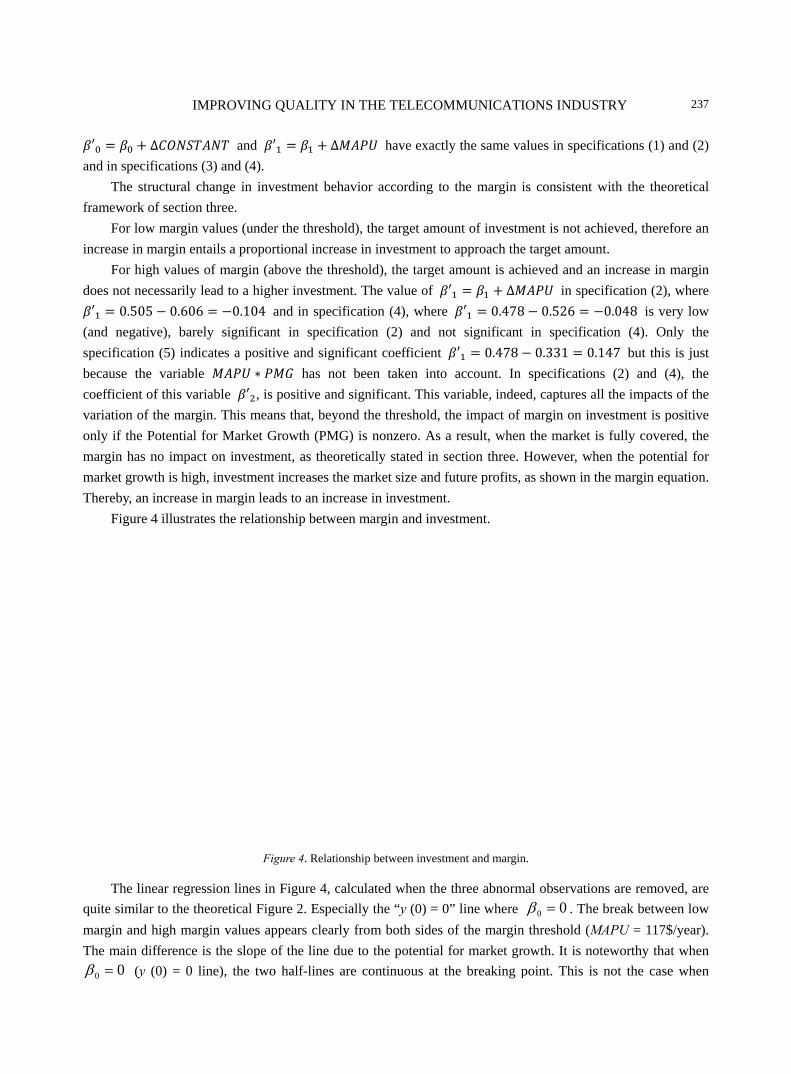
Figure
The lin
quite similar
margin and
The main di
00 (y
IMPR
∆
ifications (3) a
ructural chang
of section thre
w margin valu
margin entails
gh values of m
cessarily lead
5 0.606
ive), barely s
n (5) indicate
e variable
of this variabl
f the margin. T
Potential for M
no impact on
wth is high, in
increase in m
4 illustrates th
near regression
r to the theore
high margin
ifference is th
(0) = 0 line)
ROVING QUA
and
and (4).
ge in investm
ee.
ues (under the
s a proportion
margin (above
d to a higher in
0.104 and
significant in
es a positive a
le , is posi
This means th
Market Grow
n investment,
nvestment incr
margin leads to
he relationshi
Figure
n lines in Fig
etical Figure 2
values appear
he slope of th
, the two hal
ALITY IN TH
∆
ment behavior
e threshold), th
al increase in
e the threshold
nvestment. Th
in specificatio
n specification
and significan
has not bee
itive and signi
hat, beyond th
wth (PMG) is n
as theoretical
reases the mar
o an increase i
ip between ma
4. Relationship
ure 4, calcula
2. Especially
rs clearly from
e line due to
lf-lines are co
HE TELECOM
have exactl
r according to
he target amou
investment to
d), the target
he value of
on (4), where
n (2) and no
nt coefficient
n taken into
ificant. This v
he threshold, t
nonzero. As a
lly stated in s
rket size and f
in investment
argin and inve
between investm
ated when the
the “y (0) = 0
m both sides
the potential
ontinuous at t
MMUNICATI
ly the same va
o the margin
unt of investm
o approach the
amount is ach
∆
e 0.478
ot significant
0.478
account. In
variable, indee
the impact of
a result, when
section three.
future profits,
.
estment.
ment and margin
three abnorm
0” line where
of the margin
for market gr
the breaking p
IONS INDUS
alues in speci
is consistent
ment is not ac
e target amoun
hieved and an
in spec
8 0.526
t in specifica
0.331 0.
specification
ed, captures a
margin on in
n the market i
However, wh
as shown in t
n.
mal observatio
00 . The
n threshold (M
rowth. It is no
point. This is
STRY
fications (1) a
with the theo
hieved, theref
nt.
n increase in m
cification (2),
0.048 is ve
ation (4). On
.147 but this
ns (2) and (4
all the impacts
nvestment is p
is fully cover
hen the potent
the margin equ
ons are remov
e break betwe
MAPU = 117$
oteworthy that
s not the case
237
and (2)
oretical
fore an
margin
where
ery low
nly the
is just
4), the
s of the
positive
red, the
tial for
uation.
ved, are
en low
$/year).
t when
e when

IMPROVING QUALITY IN THE TELECOMMUNICATIONS INDUSTRY
238
00 . Thus the hypothesis 00 is consistent with the trend beyond the threshold. The fact that markets
are neither fully covered nor perfectly symmetrical could explain the constant.
Investment behavior is different from either side of the breaking threshold. Before the breaking threshold,
margin is too low to achieve the target amount of investment. Thereby, in this case, an increase in margin
results in a proportional increase in investment in order to approach the target amount. Beyond the breaking
threshold, the target amount is achieved. An increase in margin does not result in an increase in investment if
the market is not fully covered. When the market is fully covered, the target amount is achieved and the
investment is no more linked to the margin as indicated by equation (4) in the theoretical framework. When the
market is not fully covered, target amount depends on the margin. An increase in investment allows an increase
in market size and profits, and therefore, margin is reinvested proportional to the potential for market growth.
Impact of Competition on Investment
Considering that beyond the margin threshold the target amount is achieved, investment does not exceed
this target amount. As a result, it is considered that, in such case, CAPU equals the target amount. The impact
of the other variables will now be tested: (COMP, N, and 3G+) on the target amount. Beyond the threshold
MAPU > 117$/year.
(11)
With X, the vector of variables , , , , 3 , and β the coefficients to be
estimated. The results are presented in Table 4.
Table 4
Target Amount of Investment
Variable CAPU (1) CAPU (2) CAPU (3) CAPU (4)
COMP 58.16*** 39.43** 49.15*** 35.18***
(21.45) (17.36) (9.826) (8.036)
N 2.833*** 2.760*** 2.758*** 2.724***
(0.714) (0.574) (0.694) (0.558)
3G+ 26.65*** 33.62*** 27.88*** 34.21***
(9.698) (7.829) (9.319) (7.515)
MAPU -0.0177 0.0129 -0.0332 0.00564
(0.0659) (0.0532) (0.0571) (0.0461)
MAPU*PMG 0.844*** 0.776*** 0.872*** 0.789***
(0.299) (0.240) (0.292) (0.235)
Constant -7.950 -3.743
(16.81) (13.53)
Observations 158 156 158 156
R-squared 0.357 0.477 0.914 0.941
Note. Standard errors are in parentheses. *** p < 0.01; ** p < 0.05; and * p < 0.1.
Specifications (1) and (3) use all the 241 observations, specifications (2) and (3) removed the three
abnormal observations. Specifications (1) and (2) use the constant term while specifications (3) and (4) do not.
Coefficients of competition COMP and number of firms N are positive and significant in all the
specifications in Table 4.
Competition has an ambiguous impact on investment. On the one hand, Table 4 indicates that competition
tends to increase; however, on the other hand, Table 2 highlights that competition decreases margin.

IMPROVING QUALITY IN THE TELECOMMUNICATIONS INDUSTRY
239
The overall impact of competition on target amount seems to be positive provided the potential for market
growth is not too high, because the variable MAPU, as in equation (10), is not significant. Although variable
MAPU*PMG is positive and significant, its impact becomes negligible when market approach the full
coverage.
However, when competition is fierce enough to reduce the margin below the threshold, then the target
amount is no more achievable. In this case, margin is pushed below the threshold where investment is
proportional to the margin. As a result, investment decreases.
In other words, competition has a positive impact on investment as long as the target amount can be
reached; otherwise it has a negative impact.
Discussion
As discussed in the theoretical model, the target investment level is lower than the socially optimal level of
investment, but is the highest amount that companies are encouraged to invest. Non-achievement of the target
level thus means underinvestment and a decrease in consumer surplus and social welfare. A low margin may
cause non-achievement of the target investment level. This could explain the inverted U relationship between
investment and competition. As seen, competition and the number of companies have a positive impact on
investment when the margin is sufficient to achieve the target investment level. However, they also have a
negative impact on the margin. If this negative impact is strong enough to decrease the margin to a point below
the level which makes it possible to achieve the target investment level, the overall impact may be negative.
Otherwise the overall impact remains positive.
Conclusions and Policy Implications
Competition based on quality improvement leads to a target investment level which companies strive to
achieve in order to maximize their profits. This target level is lower than the socially optimal level, meaning
that the target level is, in social terms, the best level of investment that companies are encouraged to make.
However, companies need to have adequate margins to achieve their target amounts. A lack of resources causes
non-achievement of the target level and entails a decrease in technical progress, consumer surplus, and welfare.
The potential for technical progress increases investment’s impact on quality. The target level is thus even
higher than the potential for technical progress. This potential is particularly high for information technologies
and telecommunications, meaning that the target investment level is particularly high and difficult to achieve.
There are many examples where the target level is not achieved, not only in emerging countries where
standards of living are low, but also in developed countries when price-based competition is too fierce.
There is a trade-off between competition based on quality improvement, which represents the dynamic
side of competition, and competition based on pricing, which represents the static side of competition. These
two types of competition can be seen as competitors. Welfare is maximized when the target investment level is
exactly achieved. For a given potential for technical progress providing a given target investment level and thus
a given level of dynamic competition, the static side of competition should be adjusted in order to allow
achievement of the target level.
Regulatory and competition authorities in the sector should avoid underinvestment by ensuring that
companies are able to achieve their target levels.
In terms of market tools, competition and entry have a positive impact on investment but only when
companies can achieve their target levels, otherwise they may have a negative impact.

IMPROVING QUALITY IN THE TELECOMMUNICATIONS INDUSTRY
240
References Aghion, P., Bloom, N., Blundell, R., Griffith, R., & Howitt, P. (2005). Competition and innovation: An inverted-U relationship.
Quarterly Journal of Economics, 120(2), 701-728. Audretsch, D. B., Baumol, W. J., & Burke, A. E. (2001). Competition policy in dynamic markets. International Journal of
Industrial Organization, 19(5), 613-634. Bauer, J. M. (2010). Regulation, public policy, and investment in communications infrastructure. Telecommunications Policy,
34(1-2), 65-79. Bauer, J. M., & Bohlin, E. (2008). From static to dynamic regulation. Intereconomics, 43(1), 38-50. Bouckaert, J., Van Dijk, T., & Verboven, F. (2010). Access regulation, competition, and broadband penetration: An international
study. Telecommunications Policy, 34(11), 661-671. Cambini, C., & Jiang, Y. (2009). Broadband investment and regulation: A literature review. Telecommunications Policy,
33(10-11), 559-574. Chen, Y., & Riordan, M. H. (2007). Price and variety in the spokes model. The Economic Journal, 117(522), 897-921. Dasgupta, P., & Stiglitz, J. (1980). Industrial structure and the nature of innovative activity. The Economic Journal, 90(358),
266-293. Fildes, R., & Kumar, V. (2002). Telecommunications demand forecasting—A review. International Journal of Forecasting, 18(4),
489-522. Friederiszick, H., Grajek, M., & Röller, L. H. (2008). Analyzing the relationship between regulation and investment in the
telecom sector. ESMT White Paper WP-108-01. Gilbert, R. J., & Newbery, D. M. (1982). Preemptive patenting and the persistence of monopoly. The American Economic Review,
72(3), 514-526. Jeanjean, F. (2011). Competition through technical progress. Proceedings from the 10th Conference of Telecommunication, Media
and Internet Techno-Economics (CTTE) (pp. 1-15). VDE. Kaminen, M., & Schwartz, N. (1975). Market structure and innovation: A survey. The Journal of Economics Literature, 13(1),
1-37. Kim, J., Kim, Y., Gaston, N., Kim, Y., & Lestage, R. (2010). Access regulation, competition, and the investment of network
operators in the mobile telecommunications industry. Globalisation and Development Centre, Working Paper Series No. 34. Loury, G. C. (1979). Market structure and innovation. The Quarterly Journal of Economics, 93(3), 395-410. Pakes, A., & Schankerman, M. (1984). An exploration into the determinants of research intensity. Chicago: University of Chicago
Press. Reichl, P., Tuffin, B., & Schatz, R. (2010). Economics of logarithmic quality-of-experience in communication networks.
Proceedings from the 9th Conference on Telecommunications Internet and Media Techno Economics (CTTE) (pp. 1-8). IEEE.
Salop, S. C. (1979). Monopolistic competition with outside goods. The Bell Journal of Economics, 10(1), 141-156. Schumpeter, J. A. (1942). Socialism, capitalism and democracy. New York: Harper and Bros. Sutton, J. (1991). Sunk costs and market structure: Price competition, advertising, and the evolution of concentration. Cambridge:
The MIT press. Valletti, T. M. (2003). The theory of access pricing and its linkage with investment incentives. Telecommunications Policy,
27(10-11), 659-675.
Appendix
List of countries:
Argentina 2004-2010; Australia 2005-2010; Austria 2002-2010; Belgium 2003-2010; Brazil 2002-2010; Canada 2002-2010;
China 2005-2010; Colombia 2005-2010; Egypt 2006-2010; France 2003-2010; Germany 2002-2010; Hong-Kong 2002-2010;
Hungary 2002-2010; Italy 2002-2010; Japan 2004-2010; Korea 2002-2010; Mexico 2003-2010; Netherland 2003-2010; Norway
2002-2010; Poland 2002-2010; Portugal 2002-2010; Russia 2002-2010; Singapore 2003-2010; South Africa 2002-2010; Spain
2004-2010; Sweden 2002-2010; Switzerland 2003-2008; Turkey 2003-2010; UK 2002-2010; USA 2002-2010.

IMPROVING QUALITY IN THE TELECOMMUNICATIONS INDUSTRY
241
Proof of equation (4):
)1(1
12
)()()1(
12
)1(2
NN
IVIVN
tdI
dV
N
N
NtdI
d jiji
ii
i
If the market is symmetrical III ji ; in that case,
ji
ji IVIVN )()()1( and therefore:
)1(1)(
12
)1(2
NdI
IdV
N
N
NdI
d
ii
i
.
The first order condition 0
dI
d
dI
d i
i
i leads to )1(2
)12)(1()( *
N
N
dI
IdV equation (4).
Proof of equations (5) and (6):
There are N spokes and 1 2⁄ different i, j pairs. There are ⁄ consumers on each spoke or 2 ⁄ customer for
each pair. Each company appears in 1 pairs. Let us denote the consumer surplus of the pair i, j. Total consumer
surplus is: 1
22
1
When market is symmetrical, ; 1 2⁄ :
Welfare is the sum of consumer surplus and industry profits.
In a symmetrical market, industry profits are 1 . Welfare is written as follows:
Table A1
Correlation Matrix
CAPU MAPU COMP N IOA PMG 3GT DPOP YEAR GNICAP
CAPU 1
MAPU 0.505 1
COMP 0.003 -0.314 1
N 0.119 -0.166 -0.087 1
IOA -0.068 -0.192 -0.155 0.190 1
PMG -0.114 -0.307 -0.027 0.096 0.416 1
3GT 0.324 0.363 0.142 -0.119 -0.139 -0.443 1
DPOP -0.021 -0.038 0.138 -0.050 -0.211 -0.352 0.119 1
YEAR -0.084 0.075 0.033 -0.153 -0.021 -0.311 0.609 -0.002 1
GNICAP 0.469 0.783 0.069 -0.148 -0.376 -0.457 0.447 0.227 0.136 1
1
0 ij
ij
x
j
x
iij dxUdxUcs
)4
5()2()(
1
21
21
0
tcvdxtxtcvdxtxtcvqcscs ij
)1()4
1( Itcvw

Chinese Business Review, ISSN 1537-1506 April 2013, Vol. 12, No. 4, 242-257
The Dilemma Between the Heterodox-the Orthodox
Economics and Its Ideology
Ilkben Akansel
Artvin Coruh University Hopa Economics and Administrative Sciences Faculty, Hopa/Artvin, Turkey
Economic movements have close relation with historical transformations. Historical and social transformations
have seriously determined economic views, so, economic movements have been the indicators of economic wars of
social classes. But no concept can describe sharp contrast in economics better than the two opponent concepts in
economics: “orthodox” and “heterodox” economics. In this article, the reason why neo-classic economics, also
called as orthodox economics, has a serious place in economic literature while the opponent’s economic
movements, named heterodox economics, do not defend only one “truth” and are not as important as orthodox
economics will be examined. While doing this examination, Louis Althusser’s “ideology” and Antonio Gramsci’s
“hegemony” will help us as these two concepts are quite instructive in understanding the irreplaceable significance
of orthodox economics. As a result, by discussing alternative point of views about economics, positive emphasis of
multivocality in economics literature will be revealed. On the other hand, every heterodox economics cannot
criticize orthodox economics in the same way. In this study, institutional economics, which is accepted to be part of
heterodox economics, will be discussed thoroughly. Institutional economics had a serious attitude against orthodox
economics. In this study, generally the points in orthodox economics that institutional economics opposes will be
emphasized, and although both economics approaches’ ideological attitude will be attempted to be discussed
generally, it will become easy to discuss the reason why heterodox economics developed an opposing ideology
against the ideology of orthodox economics.
Keywords: orthodox economics, neo-classical economics, heterodox economics, institutional economics, ideology,
hegemony
Introduction
History of economic thought is very important as it shows the economic evolution of humanity. Besides,
economic transformations in the last century witnessed the sharpest divisions. These divisions especially based
on two basic points. A very general division can be made as neo-classical economics, which is the continuation
of classical economics and other economics thoughts that cannot be analyzed as a part of classical economics.
It is possible to say that economics can be basically divided into two parts in terms of economics structure:
orthodox economics and heterodox economics. Generally, orthodox economics is associated with neo-classical
economics; but heterodox economics include almost all the economic thoughts except neo-classical economics.
Ilkben Akansel, Ph.D., Assistant Professor, Business and Management Department, Artvin Coruh University Hopa Economics
and Administrative Faculty. Correspondence concerning this article should be addressed to Ilkben Akansel, Artvin Coruh Universitesi Hopa Iktisadi ve Idari
Bilimler Fakultesi, 08600 Hopa/Artvin, Turkey. E-mail: [email protected]; [email protected].
D DAVID PUBLISHING
THE DILEMMA BETWEEN THE HETERODOX-THE ORTHODOX ECONOMICS
243
But, even when changes between classical economic thoughts and between thoughts in neo-classical views are
taken into consideration, exact categorizations about any economic view can change.
Shortly, no one can claim that an economic movement that is a part of heterodox economics will not
become a part of orthodox economics in the future. So, it should be known that orthodox economics implies a
view that has defined and strict rules and that do not (cannot) go out of these boundaries. In this context,
orthodox and heterodox economics can be defined as below:
Orthodox economics: It means giving neo-classical economics apprehension, as it has a hegemonic way which dominates whole economics education, institutions and politics and all other thoughts. Neo-classical economics has a widespread superiority. Since 1970’s Keynesian economics has not produced any alternatives to solve the problems of economics in praxis and as a result of this, the theory has been argued. Neo-classical theory has gained superiority. (Emiroğlu, 2006, pp. 661-662)
Heterodox economics: Economists who claim that orthodox economics’ political approach is disadvantageous and such political opinions have come together under an opinion called “heterodox economics”. We can call the heterodox economics like as such: Austrian Economics, Behaviorist Economics, Black Politics Economics, Ecological Economics, Evolutionist Economics, Feminist Economics, Historian Economics, Georgics Economics, Institutional Economics, Marxist Economics, Post-Keynesian Economics, Post-modern Economics, Post-colonial Economics, Rhetoric Economics, Social Economics, and Sraffa Economics. (Emiroğlu, 2006, p. 346)
When we put up its religious connotations, Orthodox means “correct” (orthos) and “belief, teaching” (doxa), namely, correct belief in Greek. It is used for applications that are about generally accepted views and traditions in economics; economic policies that are made of generally accepted applications are named orthodox economic policies. Heterodox is made of Latin words of “different” (heteros) and “belief, teaching” (doxa); and the word is used for naming applications except traditional views and approaches. (Eğilmez, 2013, p. 1)
In this article, ideological logic of two opposing economy concepts, whose meaning are shortly explained
above, will be discussed; because there are two basic reasons why a view is generally accepted. The first of
these is that a generally accepted view attempts to ensure that its ideology dominates life completely. The
second is that it takes some precautions in order to prevent any other ideology’s dominance. In economy, the
first resource of orthodox economics’ dominance is its union with the desire of being a science which is
attempted to be limited with indisputable shapes specially formed at the end of the 19th century (Çakır, 2001):
“[…] orthodox economics does not regard any criticisms except the ones made within […] the only way to
make criticisms from within and to reveal its deficiencies is to speak the same language with economists” (pp.
96-97).
So, it can be said that the first ideological aspect of orthodox economics is that it does not accept criticisms;
of course this criticism is the ones made outside of orthodox economics. The ideological reason of this is that
ideology does not represent reality and the relation between them is symbolic. Reflection of precision in
physics of economics is that it developed a belief as “economics can explain every economical phenomenon
through mathematics”. This limited the field of economics and restricted labor-value concept theory and
excluded distribution problem (Çakır, 2001, pp. 99-100). The attitude of orthodox economic that ignores the
theory of distribution caused ignoring the problems of labor class which is a big part of social classes and this
situation created a consuming based structure.
In other words, economics that is defined as orthodox economics is named as mainstream in economics
literature which means that main-stream dominates both processing of state economies and every kind of
institutionalization in the system of that economy.

THE DILEMMA BETWEEN THE HETERODOX-THE ORTHODOX ECONOMICS
244
Mainstream economics here serves to denote the powerful common disciplinary element that has been criticized variously in recent years for its methods and conceptualization of “economic” phenomena. The critiques have come from methodologists and from diverse heterodox theoretical approaches such as feminist, Marxist, post-Keynesian, ecological, Austrian and so on. (Kaul, 2002, p. 709)
The most important criticism made on any view named mainstream is that it does not accept any criticism in
terms of its method and information-theory, and it does not regard different voices. In the most general terms, a
mainstream view that does not accept any other view can be explained with the concepts of “hegemony” and
“ideology”. But before analyzing concepts’ contents and why do they explain orthodox economics that are
accepted as mainstream, we should analyze the contents of heterodox and orthodox economics in a more detailed
way.
In this study, in order to observe how heterodox economics ideologically differs from orthodox economics,
“institutional economics”, which is included in heterodox economics, will be shortly emphasized.
So, in this study, firstly orthodox and heterodox economics’ contents will be discussed, reasons of
opposing assumptions and general basic points of these opponents will be analyzed; secondly both economics
movements’ relations with the concepts of “hegemony” and “ideology” will be discussed. The goal of this
study is to touch on differences of different economic views in order to show that any economic view can easily
become mainstream, and the most important of all, to discuss transitivity of the benefit of economics between
the dilemmas of market-society.
The Dilemma of Orthodox-Heterodox Economics
If one reads the heterodox literature in economics these days, one gets the impression that modern mainstream economics is much like the economics of 50 years ago; it is called “neoclassical economics” and is criticized in almost the same way that earlier heterodox economists criticized the mainstream economics of the 1950s or 1960s. (Colander, Holt, & Rosser, 2004, p. 485)
It can be said that orthodox-heterodox economics’ conflicts dates back to old times; it can even be said
that neo-classical economics’ criticism started within itself.
It has recently been argued that mainstream economics is in a process of transformation driven by the emergence of a collection of new research programs over the last two decades all of which make important departures from standard neoclassical economics. (Colander, 2000; Colander et al., 2004; Davis, 2006)
These new research programs—including classical game theory, evolutionary game theory, behavioral game theory, evolutionary economics, behavioral economics, experimental economics, neuro-economics and agent-based complexity economics—currently exhibit considerable heterogeneity, reflecting their separate origins primarily in different sciences outside economics and their pursuit by relatively distinct communities of researchers within economics. This development might consequently be taken as evidence that economics is becoming more pluralistic, perhaps under the impact of a “reverse imperialism”. (Frey & Benz, 2004)
But areas of overlap and shared concerns between these new approaches are becoming increasingly evident, creating the possibility of a new general research program for economics that would abandon much of neoclassicism. Thus, the proliferation of new approaches in economics may reflect a transitional state of affairs, which may give way to new orthodoxy and a new mainstream in the future rather than a more pluralistic economics. (Davis, 2008, pp. 349-350)
As we will see in the following paragraphs, birth of new movements in economics agrees with the
pluralism principle as each economics approach formed as a result of each criticism of orthodox economics,
brought new influences and ensured pluralism in views and approaches.

THE DILEMMA BETWEEN THE HETERODOX-THE ORTHODOX ECONOMICS
245
For example, it can be said that institutional economics, which is accepted to be a part of heterodox
economics, reflects pluralism. One of the most important reasons of these is that it has an evolutionary structure
based on Darwinist views, which is also emphasized by Veblen. So, orthodox economics are affected from
Newton, who recommends that social scientists can follow their ways and who discovers “the divine order in
the universe” (Çakır, 2001, p. 98), and sets off by making a connection between physics-economics; after that
defends the claim that “market” will solve every problem without the need of any intervention and differs from
heterodox economics as it is not evolutionary. This situation brings this problem with it: Every ideology surely
defends that its idea is correct. But the ideologies which can see the mistakes within and let some other ideas
enter its discussion can foresee the future and continue. This is why, although the existence of an order that is
“divine in the universe” is reflected in the science of economics, nature of human beings that is in a continuous
motion is ignored by neo-classical economics. While this human being continues production and consuming by
developing caused neo-classical economics become distanced from evolution. This is the side of neo-classical
economics that is to be criticized as it is a kind of ideological blindness.
“For instance, in terms of fundamental economics (mainstream economics), companies that are the most
basic decision-making unit, are conceptualized as ‘black boxes’ that transforms production input to products”
(Mas-Collel, Whinston, & Green, 1995, p. 127).
“Fundamental economists (mainstream economists), … accept that a complete definition of company
should include information such as the organization of production, who owns the company; but they limit their
analysis with the question of what does a company do” (Binger & Hoffman, 1988, pp. 230-231).
“... in neo-classical approach, production function that defines product as a function of input… is
determined by ‘rules of physics’” (Hodgson, 1988, p. 14).
“This approach ignores the fact that production is an institutional activity that includes relations between
people and between people and nature, and accepts production as an isolated activity, not being affected from
social relations and organizations” (Pirgan Matur, 2007, pp. 283-284).
Besides, both opposing and newly produced mentalities reflect an “institutional” structure ideologically.
For instance, if “neo-classical economics” is accepted to be an orthodox structure generally, even if it is thought
to be a reinterpretation of “classical economics” in the background, it should be known that it also reflects an
opposition to classical economics. The thought of liberalization of commerce defended by classical economists
may not reflect the same thought defended by neo-classical economists. Namely, the solution suggestions of an
institutional structure depend on its content, requirements, and oppositions.
“Another point that differs is that while—for instance—physics is a source for inspiration as a method, it
can become an ideal for 19th century economists in their analysis” (Çakır, 2001, p. 100).
On the other hand, it should not be forgotten that each economic view is formed either within a previous
economic movement or against an economic movement. Being formed within an economic movement is a kind
of opposition to make up for the points that are thought to be deficient in that economic movement. This
opposition includes two new situations. Firstly, if the opposed view is accepted to be “orthodox”, a new
heterodox view rises; and secondly, for newly formed a view, there exists the danger to be transformed into an
“orthodox” view as it can become introverted.
If it is remembered that ideology is a class struggle (Kazancı, 2006, p. 10), which can be seen as the
connection between physics and economics which is established by the classical economists and the
construction of including too much mathematics in economics by neo-classicists is different from each other. In

THE DILEMMA BETWEEN THE HETERODOX-THE ORTHODOX ECONOMICS
246
neo-classics, “idealist” commitment brought mathematization “too much” with it. Shortly, ideology brought
with institutionalization that it in the background of both economic systems will be different. While in classics,
an ideology that can be reflected on the lower classes in society is dominant, in neo-classics, mathematical
economics equality on paper may not be reflected directly on the lower classes. While firstly classical
economics and then neoclassical economics could be accepted as “heterodox” when they first appeared, they
turned out to be “orthodox” structures in time.
“In other words, heterodox economics, firstly, is a rejection of a very specific form of methodological
reductionism. It is a rejection of the view that formalistic methods are everywhere and always appropriate”
(Lawson, 2006, p. 492).
The problem that heterodox economics approaches points in orthodox economics is the problem of
methodological reductionism which is claimed to be valid everywhere and at all times. The methodological
reductionism problem has a serious problem within which can be defined as “standardization”. For instance,
when a state’s economic polices are taken into consideration, orthodox economics suggest the formula should
not be stepped out of specific tools that are applied by economic policy. The economic structures of states vary
according to population, social, psychological, urban factors. So, policies applied in X state may not give
similar positive results in Y state. Additionally, X state that applies alternative policies instead of an economic
policy that will be applied according to the formulas suggested by orthodox economics, can have more positive
results. But the problem of applying only rigid policies that are required to be applied brings the problem of
standardization which results from methodological reductionism problems.
Although neo-classical economics, which is also named orthodox economics, is accepted to be a view that
formed within classical economics and carries it one step further, in fact, it is impossible to frame the concept
of “orthodox economics” with definite lines.
Defining neoclassical economics is not easy, not least because what one may call neoclassical economics has changed over the years. A broad definition would apply to the original neoclassical economics, founded in the 1870s, as well as to later work. Another difficulty is that even at one given moment of time the term is not necessarily used in the same sense by everybody. What is called here neoclassical economics is characterized by the combination of the following features: (1) the emphasis on rationality and the use of utility maximization as the criterion of rationality; (2) the emphasis on equilibrium or equilibria; and (3) the neglect of strong kinds of uncertainty and particularly of fundamental uncertainty. (Dequech, 2008, p. 280)
Three features that determine the shape of neo-classical economics are originally the reflections of
mathematization. In other words, they are built on a structure that denies production and distribution by
focusing on variables that can become quantitative. The reason of its reflection ideologically is that the aim is
to ensure that society adopts the economic situation that is wanted instead of seeing the real, existing economic
situation. It is possible to represent balance and benefit maximization through mathematics. On the other hand,
this situation can cause ignoring problems of income and distribution among classes.
As claimed by Japanese economist Morishima, mathematics is not an objective ideology. Even the use of only mathematics can be an ideological attitude. In the era of serious financial upside-down and class struggles, the use of mathematics, ending labor-value theory and using cardinal benefit-value theory that gives numerical values to everything is completely ideological. (Çakır, 2001, p. 102)
The basic point that is opposed in orthodox economics is that this view completely focuses on market and
ignores individual, society, and their benefits. So, we know that the first opposition point to orthodox

THE DILEMMA BETWEEN THE HETERODOX-THE ORTHODOX ECONOMICS
247
economics is holy triple alliance. The first dimension of criticisms starts from the point of if individuals act
completely rationally, if they behave personally and if balance is ensured completely and properly through
behaviors. Surely, these oppositions did not come from nowhere; they are formed as a result of a specific
amount of time and negativities of the general economic situation.
The story of the evolution of the term neoclassical is a story of metamorphosis. Let me briefly recount its history. The root term, Classical was coined by Karl Marx (1847) as a description of David Ricardo’s formal economics; Marx contrasted Classical with vulgar or romantic economics, by which he meant “economics close to the people.” Various writers used the “Classical” terminology and, as they did, the term eventually became a general classifier for the economics of the period running somewhere between 1776 and 1870. Thus we could talk about the evolution of thinking from the mercantilist to the Classical period. Historians of thought have raised numerous issues about the use of the term Classical. One issue is, when did the Classical period begin? Schumpeter, following Marx, starts the Classical era with Ricardo. He places Adam Smith with the mercantilist pamphleteers, taking the Classical period as 1790 to 1879. Most histories of thought include Smith as a Classical economist. Most writers put the end of the Classical period a bit earlier—in 1870—and start the neoclassical period with Carl Menger, but such beginning and ending issues, unless they involve a writer of the stature of Smith, are of minor importance. (Colander, 2000, pp. 130-131)
It is understood from here that, although it is not accepted the difference of orthodox-heterodox, views that
support one another’s views or completely contrary to each other can bring us as far as Karl Marx. But the
“classical economics” generally associated with Adam Smith’s definition gave birth to neo-classical economics,
which had been indisputable until 20-30 years ago, by getting closer to the concept of market economics.
Surely this transformation can be separated from social changes, so the social significance of
orthodox-heterodox should not be ignored.
Similar to other mainstream views, orthodox economics is associated with hegemony on institutional
structures; the meaning of institutional structure includes a wide range of issues such as educational institutions
and teaching staff. Another issue about orthodox issue that is opposed is these institutional structures which are
difficult to enter in and out. No matter how fierce the social transformations are, they may not find their
economical responses appropriately. Neo-classical economics that have completely penetrated into the
functioning of economics, education etc. is also followed by significant economists of today; this situation can
only be explained with the concept of “hegemony”.
Antonio Gramsci is one of the leading scientists of Marxist thought. […] He indicates that Marx did not emphasize the need of strategic politics in class struggle; because maintaining the capitalist relationships government is huge activity. The power of the dominant class does not only come from force; it also serves through gaining power in political and cultural area. […] Government surrounds all non-government areas. The government is a tool which helps to achieve the power of dominant group. (Portelli, 1982)
The key concept about culture and ideology of Gramcsi’s is “hegemony”. This concept is connected with culture, power, and ideology. The main curiosity of Gramsci’s is how an elite group can govern the rest of the society (numerical majority) and how the major group can accept to be governed in that way. How an elite minority can govern the majority without using force? Gramsci finds this answer in “hegemony” concept. […] Because, this minority has the government and its organs and mass communication tools which are the main institutions of the country. Thanks to these tools, the rest of the society is controlled by the minority. Gramsci mainly understood from the concept of hegemony which means controlling other parts of a society ideologically and culturally. This is why; administrator class of a society can affect non-government society. Dominant group has the basic tendency to affect entire belief system of a society, moral codes, family, schools, and unions through church. Hegemony can be explained as a society’s being governed, controlled by the thoughts of a dominant group. Thoughts of the dominant group are perceived by entire groups of society and they are normalized. The dominant group in order to protect and sustain and permanent the prosperity and occupied position in the

THE DILEMMA BETWEEN THE HETERODOX-THE ORTHODOX ECONOMICS
248
society will attribute its own philosophy, science, cultural and moral values to the society. (Gramsci, 1997)
They hide the classified and make them common character of these values and thoughts judgment of the society. They make all other judgments and all other philosophies which can be removed and make the dominant ideology unrivaled. […] According to Gramsci, the dominant group takes its power either by using strength or providing people’s consent, or using both of it. Institutions like military, policeman, judge, and prisons are necessary in order to govern through force. So, people are subjected by using physical power. However, according to Gramsci, no dominant structure can be governed by only using force. According to Gramsci, convenience is the acceptance of a dominant class’s worldview and thinking by the members of the society. Institutions such as schools, churches (religion), and media are produced and re-produced by human thought. Through these kinds of institutions, dominant group spreads its own way of thinking and view. If people face any social problem they will perceive events in the way that they were taught by dominant class. They think that this point of view is natural and they are common sense. Common sense describes the events as how everyone knows it. […] In this way, after describing social structures and social relations, people do not think that it is necessary to change them. Thus, it seems natural that some people are rich and some are poor. Because, there is no equality in nature. […] But, Gramsci emphasizes the struggle; in his opinion, “common sense” is not a stable thing, it is in a constant and change. Convenience must always be gained and re-produced. Because, people’s social materials always remind dominants about their disadvantages. And this situation causes a threat to dominant group. (Yaylagül, 2006, pp. 96-100)
So, orthodox economics that has a hegemonic significance of the function, application, education of the
economy, stating views etc. achieves and continue dominance through the tools of the system from which it
comes. For instance, in all over the world, neo-classical economics is significant in education; this situation can
also be seen in Turkey. Extent of heterodox economics, as far as is known, is not taught in university classes.
Media makes news mostly about the stock market and various markets. So, society is always under the effect of
dominant group both ideologically and culturally. This dominant situation also affects economic policies of
countries. If it is accepted that dominant group defends orthodox economics, in the applications of national
economics, applications of dominant view are preferred. Hegemonic dominance in institutional structures,
namely, this power in the organizations that are responsible for the economy in the society and in economy
media, reaches each person one by one and it causes them expect solutions from the structure which is in fact
the beginning of the same problem. This is the point that is opposed by heterodox economics as it is a
“hegemonic power”. Orthodox economics’ hegemonic part is that voice of the alternative solution suggestions
for the problems originating from structural causes are not heard enough. At the same time, it is one of the
points opposed by heterodox economics.
At this point, another feature of the concept called “mainstream” occurs. The concept of mainstream is a
thought system that generally continues for a long time, has a specific tradition and rules that are accepted, and
have become a “school” in time. One of the main reasons why heterodox economics is not generally accepted is
that it is not accepted as a “school”. Surely, it should not be forgotten that this view is also held generally in
neo-classical economics.
The terms “orthodox” and “heterodox” have been used in various ways in economics, but in the discussion above they are treated as sociological terms that define what is generally regarded as conventional or unconventional in the economics. There are two important implications of this interpretation. First, neither “orthodox” nor “heterodox” inherently refers to any particular type of approach in economics; alternatively, any kind of approach in economics can be orthodox or heterodox depending on historical conditions, and indeed in the history of economics most major approaches have been both at one time or another, and not infrequently both at the same time, though in different locations. Second, though there has often been a close correlation between individual economists’ professional success and their association with conventional approaches, this has tended to be more (though not exclusively) the case when a dominant approach exists, whereas in periods of pluralism, when what is conventional is unclear or under challenge, many individuals can be quite

THE DILEMMA BETWEEN THE HETERODOX-THE ORTHODOX ECONOMICS
249
successful professionally though their approaches are still unconventional. For example, today both behavioral and experimental economics are not conventional, though many of their main contributors are very successful professionally […]. (Davis, 2008, pp. 353-354)
Although there are different opponents, evaluating entire economic views in one group is not a correct
approach. For instance in historical process, social events affect one another, namely, the end of one
phenomena can be the beginning of another; history of economics is similar to that process, many views in
economics in fact try to make up for the deficiency of another. On the other hand, economic views of heterodox
economics have brought different solution suggestions to the same problems. In this case, “traditional” and
“non-traditional” features are other clues for us in order to determine which view is orthodox, which is
heterodox. Namely, while orthodox economics is traditional, heterodox economics is non-traditional. Besides
this, while a view is not traditional, views that contribute to it can be traditional.
Although it is not a general definition, it is possible to attribute economic view named “heterodox
economics” to Karl Marx. Possibly because of this, it is claimed that heterodox economics has a social side.
Although economics historians wanted to classify views and tried to differentiate views from one another with
sharp lines, if economists do not want to be a member of such classifications, they can be the member of a
group they want. Besides, it is also incorrect not to evaluate completely opponent views in terms of
orthodox-heterodox differentiation. Point of view of the nature of orthodox-heterodox economics that cannot be
separated from sociologic meaning, about economic process that is affected by social phenomenon should also
be discussed:
[…] For example, a core principle in orthodox neoclassical economics is that individual behavior is rational, and a common defense of the principle is that “it could not be otherwise” (thus suppressing reference to other forms of conceptualization). In contrast, a periphery principle in traditional Marxist economics is that individual behavior reflects class location. The Marxist explanation is heterodox in virtue of explicitly lying outside the core of the field, but the concept of class also bears a relation to the boundaries of economics in light of its important role in sociology […]. (Davis, 2008, p. 355)
The significance of the concept of “class” in terms of sociological dimension is also vital in economics.
Because, “class” concept includes an institutional structure, so this institutional structure contains economics. If
the economics is accepted to be a big organization—according to us, it should be so—it is impossible to
differentiate and isolate small organizations within economics. According to us, the biggest separation point of
economics as orthodox and heterodox economics stems from here. The hegemonic attitude of orthodox
economics, which is accepted to be “elite” and affects the general process of economy, schools, and
professionals hide behind a big ignorance. Namely, not including small organizations that create big
organization in time, or including them but ignoring their thoughts is the most deficient part of neo-classical
economics.
The hegemonic side of orthodox economics’ “elitist” attitude cause formation of an opposing economics
named “heterodox” economics. As hegemonic power, the dominant power that can affect both economics
literature and economy policies applied by governments can be dominant everywhere. But because of “not
introducing new views” into its ideology, it causes some problems between classes. Especially voice of classes
that does not get enough share from production and distribution of it cause emergence of other economic
ideologies. Namely, economic movements that can be defined under the title of hegemonic economics emerge
from spaces caused by hegemony. For instance, if neo-classical economics focus on mathematics too much, as

THE DILEMMA BETWEEN THE HETERODOX-THE ORTHODOX ECONOMICS
250
hegemonic economic movement sees this as a deficiency that can cause problems, it will try to fulfill this gap
with a new ideology.
Another deficiency caused by mathematization can cause ignoring especially struggle among classes; and
this situation is assumed to be significant as entrepreneurs represent “industry” as an upper class.
“[…] how and why economic activities are carried out not by isolated individuals, but by groups that
entrepreneurs get to cooperate in such larger entities as firms, industries and inter-industry groups…”
(Granovetter, 1992, p. 6).
A mathematical method that is used by orthodox economics while explaining economic phenomenon is in
fact mathematical presentation of a line of ideas. Although correctness of mathematical representation are
proven on paper, it may not help solving a problem in reality. Numerical estimations may not completely and
correctly reflect reality. Mainstream economists may get lost in analysis and present a good solution to the
problem; moreover they think that creating solutions that cannot be sometimes understood by professionals are
prestigious. Of course such solutions earn respect and prestige but for example a mathematical model that does
not present solution for economic problems can earn reputation in a limited environment.
Easiness brought by mathematics, either based on personal choices or on company preferences, cannot be
ignored; because as mathematical analysis is based on absolute accuracy, it will bring a definite and expressive
solution to economical phenomenon on paper.
Saying that modern economics follows a modeling approach does not mean that other periods did not use models. Economists have always used models. But there is a distinction in how the models are used. To see the distinction between modern economists’ use of models and earlier economists’, it is useful to distinguish between pure theory models and applied policy models. Formal modeling has always been the essence of the pure theory of economics—metaphysics, or science, depending on one’s view. For example, Franciois Quesnay, Ricardo, Cournot, and Walras all simplified their views to develop a theoretical model. Modern pure theory has evolved from the general equilibrium theory of Walras to the general equilibrium of Arrow/Debreu, but the modeling approach has not changed. These pure theory models are highly formal and mathematically deep. But such formal models are not the type of models that the large proportion of economists deals with. […] Previously, economists such as Smith or Marshall kept the theory in the back of their minds and thought about the policy problem as an art. Their models were kept in the background, and reasonableness—critical thought—was emphasized in applying the models. In modern economics that has changed. There is no art of economics in which policy problems are addressed in an informal manner. Modern applied policy models must be specified in a way that can be directly empirically tested, at least in principle. While such models are informal by mathematical standards, they are formal by artistic standards, which is why some observers call modern economics formalist. (Colander, 2000, p. 138)
As seen from above, methods of significant economists had a big influence when they were firstly used,
but had become insufficient in time as an economic structure, namely, modern economics developed. Surely,
mathematics is one of the strongest instruments that can be used in a scientific study. In fact, it is a useful
instrument, but it is intensely criticized as instrument became goal in time.
Another point that should not be ignored is that economists in that era that use mathematical modeling is
generally engineering origin. Surely, the reason why these economists gave importance to this mathematical
modeling was that after the strong bond with physics and economy, physics started to be a definite science.
Besides this, during the renewal after the break after Marshall, a significant break occurs between economics
and physics. Differences between economics mathematical models established by neo-classicists and modern
economics applications are because of this reason.
No matter which economics approach is used in the scope of heterodox economics, one of the first issues

THE DILEMMA BETWEEN THE HETERODOX-THE ORTHODOX ECONOMICS
251
that we meet is the irrepressible success of mathematics, in other words, mathematics’ “exceeding”
suppressing.
An increase of multivocality in economics surely led to the addition of many new views to the literature of
economics. Besides new views, there occurred an increase in the number of important economists. But this
increase in quantity caused new problems such as the questions of which view can be classified in which way,
if classification is necessary, if new schools are formed because of classifications.
Pioneer of institutional economics, Coase explained exceeding suppressing of economics, pioneered by
mainstream economics as follows:
Commentators routinely note that modern economics is failing as an explanatory project. […] According to the 1991 Nobel Laureate Ronald Coase, “Existing economics is a theoretical system which floats in the air and which bears little relation to what happens in the real world” (1999, p. 2). For Coase the discipline is in urgent need of substantial transformation and he suggests that there may currently be support for such a program of reorientation precisely because of the growing recognition of the inadequacies of mainstream economics: […] universalisation of formalistic methods combined with a failure to question whether such methods are appropriate to the contexts in which they are applied. The mainstream demands that formal modeling methods should be applied, almost always without making any assessment of their suitability for investigating social material. It is simply taken for granted that such techniques are appropriate for, or perhaps more accurately essential to, economics. […] All methods, including mathematical ones, are appropriately applied in some conditions but not others. These are the ontological presuppositions of those who wield these methods. When considering the prospects for, and likely consequences of, pursuing mathematical modeling, whether in economics or elsewhere, the Cambridge group recommends an evaluation of the relevance of such presuppositions in the context in which their use is being proposed. […] The sorts of formalistic methods used by economists presuppose that the domain of reality being investigated is “closed” when, in contrast, it seems to be the case that social reality is quintessentially open. A closed system is one within which regularities of the form “whenever event or state of affairs x then event or state of affairs y” obtain. These regularities can be deterministic or take a probabilistic form. They are the sort of correlations achieved, via human intervention, in well-controlled experiments. By supposing formalistic mathematical methods to be always appropriate mainstream economists assume that something at least approximating experimental conditions hold everywhere in the social realm. The difficulty for the modeling approach is that the social realm is of a nature that such conditions are rarely found to obtain. […] To produce an event regularity in a well controlled experiment the experimenter, typically, has to identify a stable mechanism and effectively isolate it. […] The (isolated) mechanism has to be intrinsically stable so that when it is triggered (conditions x) predictable effects (outcomes y) always follow. […] In fact, the results achieved can be applied outside the experimental context precisely because they relate to the underlying mechanism, not to the event regularity corresponding to its empirical identification. (Pratten, 2004, pp. 37-38)
Generally, basic problems of all the economics branches of heterodox economics are that they cannot go
out of the stereotyped views of orthodox economics, while mathematics is a necessary and useful instrument of
assumptions, it has transformed into a goal and alternative views’ acquisitions are ignored. Although some of
them were included in the mainstream, the most important name that marked economics literature made serious
criticisms about the issue and they stated that they are against excessive prescriptivism.
Namely, one of the basic contradictions is that both orthodox and heterodox economics start to be
prescriptive when they were forced to be formalized. Prescriptivism cause not being able to go beyond a
specific ideological logic. Social realities are ignored more. A process of turning from a human-centeredness
which is required by its sociologic nature, to a market-centered conceptual frame, generally to mainstream
ideology occurs.
In general terms, the most general features of “mainstream” ideology are prescriptive, which have a
distorted factuality that is assumed to be the truth etc..

THE DILEMMA BETWEEN THE HETERODOX-THE ORTHODOX ECONOMICS
252
According to Althusser’s theory, practice of society and ideology are intermingled (1) If it is remembered that ideology is not a representation of reality, it is the representation of relation through reality, it can be said that; (2) Ideology does not have a history. Ideology is a war of classes; and (3) “Ideology assumes individuals as subjects and named them as a subject. […] Ideology turns individuals into subjects through naming. […] In this way, individuals play the roles which are expected from them within the limits of being subjects. (Kazancı, 2006, p. 10)
We need to emphasize below mentioned issues in order to show what ideology represents in terms of our
topic:
(1) When neo-classic economics’ practices are applied in economic life and affect all actors in the economy,
the actors of economics think that these practices are normal and they make their life better. But, actually the
practices that are applied make some actors richer and some actors poorer;
(2) Human history is a history of war. One of the most important reasons of this war is economics. In human
history, human beings are always classified. May be it is impossible to explain this with “classification”, but people
have always faced some kind of discrimination. So, the conflicts between orthodox economics and heterodox
economics are based on the question that which one of them gives much better economical life to people;
(3) On calling economics life as “free market” we are given the all actors freedom in that system. Of course,
freedom is desirable for everybody but, one can remember that an actor that has power can design the market
however he wants. This may sound good. But, when individuals are transformed by naming method, and if they
do not play the roles expected from them, the role of “individual” that is the subject of neo-classical economics
will change. For example, the neo-classic economics expect individuals to play their roles as “individuals” and
these individuals are expected to make analysis and firms are expected to maximize their profits. If they do not
find any solutions because of the crisis, what kind of new solutions can be applied by firms? While the
ideological logic of orthodox economics can be explained as above, the ideology of its becoming mathematical is
that mathematics becomes a subject and prestige ideology is supported.
According to Katzner (2003), mathematics may have become important because of four main reasons:
This paper suggests that mathematics may have become so important in economics for four reasons: (1) to make use of existing human capital; (2) to attain scientific respectability; (3) to help assure security with respect to claims of truth; and (4) because economics was created primarily by western economists to understand western economic behavior. (p. 561)
In this article, Katzner discusses the issue through Roy Weintraub’s book How economics became a
mathematical science which he wrote in 2002. Point of view presented by Katzer really enlightens us in terms
of the use of mathematics in economics. Although relating mathematics to the science of economy has created
negative results, it also positively affected some unknown points.
Making use of human capital may be easy on paper with mathematical computing. But while there are
questions of if individuals can have equal amounts of human capital, even when they have equal amounts of
human capital, are they employed equally and under equal conditions etc., how can mathematical data on
papers be applied in reality? This is a problem.
Economics science is probably the closest to sociologic concepts. Abstraction from social context may
cause it to be respected more by science environments, but it causes being estranged from social problems.
Giving less significance to its sociological side does not decrease its prestige. Increase of becoming
mathematical brings more professionalism within which will make it harder to be understood, even by
professionals.

THE DILEMMA BETWEEN THE HETERODOX-THE ORTHODOX ECONOMICS
253
A respect could be gained by mathematical truths, but it may cause a significant disengagement between
theory and praxis. While evaluation of economical behaviors and the wish to direct market behaviors by easily
observing them was very valid at the beginning, a solution could not be found especially for the problems in the
last five or six years.
So, heterodox economics that contributes to economics literature and has some opposing points to
orthodox economics, which have so many problems within, should be analyzed more broadly. But when the
first definition we made about heterodox economics is taken into consideration, it is impossible to discuss
entire heterodox economics. This is why heterodox economics will be discussed in detail and the focus will
especially be an institutional economics that is a part of heterodox economics.
Heterodox economics would therefore be defined by its lesser prestige and influence. […] Like mainstream economics, its heterodox counterpart may or may not have shared methodological, theoretical, or political features at any particular point in time. When they exist, these shared ideas may also change over time, as some of them may be incorporated into the mainstream, while ideas that have enjoyed prestige and influence for some time may be expelled from the mainstream paradise. (Dequech, 2008, p. 295)
As can be seen, heterodox economics starts criticizing when orthodox economics, which is accepted to be
a hegemonic power, have a missing point. This situation is already in hegemony’s nature; namely, although
dominant ideology controls everywhere, there are definitely some conditions, and this causes birth of opposing
hegemonic views that will criticize the dominant ideology. For instance, orthodox economics’ mathematician is
criticized by heterodox economics. Besides this, ideology sometimes includes some opposing ideologies which
can cause—although partially—the result of adding some heterodox views to mainstream ideology.
The most significant feature that heterodox economics opposes and stands against as a hegemonic power
is pluralism. One of the heterodox economics approach that pluralism reflected the best is institutional
economics, because in economic approach that can be named “real institutional economics”, all of the
economic phenomena are named to be institutions that are in mutual interaction which caused evolutionary
point of view to economics. Apart from all movements that can be included in heterodox economics,
institutional economics deal with all of the institutions that create a society. This is why it has a close
connection with pluralism.
[…] In the interwar period, institutionalism made strong claims for itself as a school and succeeded in becoming the most visible, if not the dominant, group in American economics. The movement cohered not around a tight theoretical agenda but around a particular view of science and a conviction of the inadequacy of the unregulated market. It cannot be said that institutionalists such as Thorstein Veblen, Wesley C. Mitchell, Wahon H. Hamilton, John R. Commons, J. M. Clark, Rexford Tugwell, and M. A. Copeland all pursued exactly the same research program or utilized the same techniques of investigation. Institutionalism included Mitchell’s quantitative methods, Commons’ documentary histories and interviewing, Hamilton’s case studies of firms and industries, and Clark’s applied theorizing. Institutionalism consisted of a number of loosely related research programs, one cluster centering on business cycles and unemployment, with a reform agenda involving some notion of overall planning, and another cluster centering on the legal dimensions of markets, with a reform agenda focusing on labor law and business regulation. […] As we have said, pluralism is not to be understood as a code word for “institutionalism”. It was a genuine pluralism, to be taken in a positive sense. Pluralism meant variety, and that variety was evident in beliefs, in ideology, in methods, and in policy advice. We are used to thinking about the institutionalists as difficult to pin down because of their varied interests and practical approaches. But variety appears to be true in general, for there are no clean lines separating schools; indeed, it is not even clear that one can specify schools. (Morgan & Rutherford, 1998, pp. 2-4)
So, pluralism will enter into each field of science and enrich it both in terms of method and theory.

THE DILEMMA BETWEEN THE HETERODOX-THE ORTHODOX ECONOMICS
254
Especially as this science is economics which involves the entire material-moral phenomenon in human nature,
its ideology is criticized both in terms of theory and method.
Although the point that heterodox economics opposes in orthodox economics approach is its method, at
some points, heterodox approaches coincide with orthodox economics’ method. This means that, when all
negative criticisms take into consideration, each approach carries traces of orthodox features more or less.
When a heterodox view ignores the points it opposes in orthodox economics, and more importantly when it
moves away from its sociologic concept, it has a tendency to transform into orthodoxy. Besides this, part of the
method of institutional economics that is defined as a part of heterodox economics which separates it from
orthodox economics’ method that is close to monotype is that different institutional economists could define
different methods.
Among institutionalists, the concept of science seems to have been based on a view of natural science methods as empirical and experimental. Mitchell’s quantitative approach was quite explicitly modeled on what he thought of as the nearest approach to the methods of the natural scientist that it was possible to achieve in economics. But other institutionalists did not place the same emphasis on quantitative methods as did Mitchell; Tugwell talked of experimental economics, and Copeland talked of the natural science point of view. Although the specific techniques of investigation used by institutionalists varied, in all cases the goal was to investigate actual conditions and to create a theory that was based on realistic assumptions and that could address real world issues and problems. (Morgan & Rutherford, 1998, p. 6)
Surely, it should not be forgotten that this difference in method is determined by definite differences in
institutional economics. What we mean by difference is that institutional economics is divided into two as “Old
Institutional Economics” and “New Institutional Economics”.
[…] This “New Institutional Economics”—distinguished from the old by its reliance on arguments for the economic efficiency of observed institutions—was closely allied to the “New Economic History”, which made similar claims for historical settings. Property rights, enclosures, and all manner of political and legal institutions came to be interpreted as the efficient outcome of rational individuals pursuing their self interest (e.g., North & Thomas, 1973; Ransom & Sutch, 1982). And these new interpretations were applied even to spheres far from economists’ traditional domain, such as the family, crime, altruism, and animal behavior (e.g., Becker, 1976, 1981). […] One unifying theme of my current work is that the new economic imperialism attempts to erect an enormous super structure on a narrow and fragile base. A more solid foundation can be constructed on the basis of three classic sociological assumptions: (1) the pursuit of economic goals is normally accompanied by that of such non-economic ones and sociability, approval, status, and power; (2) economic action (like all action) is socially situated, and cannot be explained by individual motives alone; it is embedded in ongoing networks of personal relations rather than carried out by atomized actors (for an earlier programmatic statement see Granovetter (1985)); and (3) economic institutions (like all institutions) do not arise automatically in some form made inevitable by external circumstances, but are “socially constructed” (Berger & Luckmann, 1966). […] The more recent generation of economic sociologists, who constitute what I call the “New Economic Sociology”, have looked much more at core economic institutions, and are closer to such intellectual forebears as Emile Durkheim and Max Weber-who regarded economic action as a subordinate and special case of social action-than to the accommodations stance of mid-century sociologists. An important part of this focus is a sociological theory of the construction of economic institutions. Such a theory must make Dynamics central, in contrast to most neo-classical economic work on institutions which (like many branches of economics) emphasizes the comparative static of equilibrium states. Without explicit dynamic argument, we have the irony that economics, despite its devotion to methodological individualism, finds itself with no ready way to explain institutions as the outgrowth of individual action, and so falls back to accounts based on gross features of the environment. (Granovetter, 1992, pp. 4-5)
If we take the close connection between economics and sociology into consideration, this situation can be
explained through three points: (1) Sociological classifications can determine economic classification, namely,

THE DILEMMA BETWEEN THE HETERODOX-THE ORTHODOX ECONOMICS
255
economic decisions made by individuals can sometimes be determined according to social status and power in
society rather than rational choices. In other words, their expanses may not be determined solely by their
“incomes”; (2) A consumer individual may have not shown an economical behavior with personal motivation.
His/her social personal relations may affect economic behaviors; and (3) As in all institutional structures,
economic institutions are built sociologically. This means that economic structure making society is determined
by that society’s social, psychological, cultural etc. factors. If sociologic structure creates economic structure,
then this assumption accepted by generally all heterodox economics literature as a common view cannot be
ignored: Continuing orthodox economics’ entirely market-based structure only with the aim of making more
profit can lead to serious crises. This is why, instead of focusing on market, applying policies that will ease
market actors economically, which is good for both economics and society.
With all these, it is also claimed that institutional economics have a revolutionary feature. This feature can
be seen in these points: It wants to be regarded as completely apart from classical economics perspective
(phenomena); it gives a new impulse to solving the problems of economics literature out of standard economics
policies’ oppressive, boring, etc. environment.
One of the reasons of that staying power is that it provides a foundation for institutional thought-a reason for the Association for Evolutionary Economics to exist. It does so by distinguishing institutionalists from standard economists. In this paper I distinguish institutionalists (with a capital I), by which I mean the institutionalists within AFEE who maintain direct ties to old institutionalists, from quasi-and neo-institutionalists (with a small i) who spend far less time emphasizing those ties and whose work is considered part of modern mainstream economics. […]
Institutionalism represents a revolutionary way of observing economic phenomena that is not complementary to classical economics.
Standard economics is too pessimistic. Its overall policy message is that “if something must be done about economic conditions do the least possible and be cautious about that” (Hamilton, 1999, p. vii). Institutionalist economics offers a much more optimistic view of policy.
Standard economics follows a mechanistic Newtonian point of view, whereas institutionalist economics follows a “process tools” approach, which captures the evolution reality of economic change.
The difference between institutionalist economics and standard economics can be found in their concepts of change.
Institutionalist economists are more capable of coming to grips with the major economic issues. (Colander, 2003, pp. 112-113)
Shortly, moving out of the structure of orthodox economics—also called neo-classical economics—which
focuses economy only on the market, namely, limits economy generally with financial accounts, can be made by
heterodox economics. Heterodox economics, which accumulates new ideas, are more flexible in terms of
ideological structure, it is more open to both development and criticism. Hegemonic power that will be created by
heterodox economics will be much more focused on orthodox economics. In private, when institutional
economics is analyzed, which is accepted to be a part of heterodox, a very new impulse is brought to the
economics by taking both old and new theorists’ criticisms into consideration. Especially the assumption that
economics should have an evolutional structure can be seen as an ideological structure that will make a
significant contribution to the ideology of orthodox economics.

THE DILEMMA BETWEEN THE HETERODOX-THE ORTHODOX ECONOMICS
256
Conclusions
Economic periods are full of rise and falls such as contractions and expansions. But some periods cause such
huge booms that some points that are known to be true in economics have to be revised. The best historical
example of this is 1929 great depression. Besides this, 2008 crisis is another example which still has some
dimensions that could not be overcome.
Because all of these, it is possible to divide economics generally into two completely opposite poles:
orthodox economics and heterodox economics. In the literature, orthodox economics is named “neo-classical”
economics while heterodox economics includes all different kinds of schools of thought except neo-classical that
are named differently such as institutional, behavioral, Austrian School etc.. Although the names are different
from one another, heterodox economics opposes orthodox economics in terms of some specific points. Of course
when each school of thought analyzes in detail, although the points that they oppose differ from one another, the
points that heterodox economics criticizes basically are: Being market-based, becoming mathematical too much,
transformation to an ideological structure, and having the hegemonic power in this context.
In fact market-based side of orthodox economics and its aspect of becoming very mathematical can be
explained by the fact that it determines economical ideologies through its hegemonic power. Orthodox
economics rules education, economic policies of governments, media, and many other ideological instruments of
governments as the dominant power, so it transfers its ideological reason to all of the economic actors of society
through these instruments.
The relation that the first established of neo-classical economics wanted to build between physics and
economy left a connection to neo-classical economics ideologically: inflexibility in terms of recommendations,
ignoring different ideas on different topics. Being stuck in some theoretical frames ideologically with this effect
given by hegemonic power can be accepted as the biggest deficit of neo-classical economics.
Especially institutional economics is full of significant oppositions to neo-classical economics. In fact, as a
hegemonic power, one of the best ways to be applied by neo-classical economics is to incorporate new
recommendations of different economic approaches; in this way, the existing theoretical frame will be enriched
and it will be less criticized. For example, the point which neo-classical economics is criticized the most is that it
incorporated mathematics too much. While mathematization makes economic phenomenon more explainable, it
cannot produce solutions to inequalities among classes. This situation causes mathematization’s being used as an
ideological device, and it is assumed to be the hegemonic power area that heterodox economics opposes the most.
So, in most of the institutions where economics education is given, either education system cannot go
beyond the limits of neo-classical education or it can only embody heterodox economics very little. This situation
affects professionals in education institutions too. While using mathematical methods too much while explaining
any given concept can ensure prestige, it also causes these professionals not being understood.
Shortly, orthodox economics, which cannot generate new solutions to repetitive and economic problems,
has to regard solution suggestions of heterodox economics which embodies pluralism more.
References Becker, G. (1976). The economic approach to human behavior. Chicago: University of Chicago Press. Becker, G. (1981). Treatise on the family. Cambridge, M.A.: Harvard University Press. Berger, P., & Luckmann, T. (1966). The social construction of reality. New York: Double-day. Binger, B. R., & Hoffman, E. (1988). Microeconomics with calculus. London: Scott Foresman and Co..

THE DILEMMA BETWEEN THE HETERODOX-THE ORTHODOX ECONOMICS
257
Çakır, N. (2001). İktisadın Dama Taşları (Checkers economics stone). İstanbul Üniversitesi İktisat Fakültesi Mezunları Cemiyeti İktisat Dergisi (The Journal of Istanbul University Faculty of Economics Alumni) (pp. 96-111).
Coase, R. (1999). Interview with Ronald Coase. Newsletter of the International Society for New Institutional Economics, 2(1), 3-10.
Colander, D. (2000). The death of neoclassical economics. Journal of the History of Economic Thought, 22(2), 127-143. Colander, D. (2003). Are institutionalists an endangered species? Journal of Economic Issues, 37, 111-122. Colander, D., Holt, R. P. F., & Rosser, J. B. Jr. (2004). The changing face of mainstream economics. Review of Political Economy,
16(4), 485-499. Davis, J. (2006). The turn in economics: Neoclassical dominance to mainstream pluralism? Journal of Institutional Economics,
2(1), 1-20. Davis, J. B. (2008). The turn in recent economics and return of orthodoxy. Cambridge Journal of Economics, 32, 349-366. Dequech, D. (2008). Neoclassical, mainstream, orthodox, and heterodox economics. Journal of Post Keynesian Economics, 30(2),
279-302. Eğilmez, M. (2013). Ortodoks ve heterodoks ekonomi politikaları (The politics of orthodox-heterodox economics). Retrieved from
http://www.mahfiegilmez.com/2013/04/ortodoks-ve-heterodoks-ekonomi.html Emiroğlu, K. (2006). Ekonomi sözlüğü (The dictionary of economics). Ankara: Bilim ve Sanat Yayınları. Frey, B., & Benz, M. (2004). From imperialism to inspiration: A survey of economics and psychology. In D. J. Marciano, & J.
Runde (Eds.), The Elgar companion to economics and philosophy. Cheltenham: Elgar. Gramsci, A. (1971). Selections from the prison notebooks. New York: International Publishers. Granovetter, M. (1985). Economic action and social structure: The problem of embeddedness. American Journal of Sociology, 91,
481-510. Granovetter, M. (1992). Economic institutions as social constructions: A framework for analysis. Acta Sociologica, 35(3), 3-11. Hamilton, D. (1999). Evolutionary economics: A study of change in economic thought. Piscataway, N.J.: Transaction Publishers. Hodgson, G. M. (1988). Economics and institutions: A manifesto for a modern institutional economics. Cambridge: Polity Press. Katzner, D. W. (2003). Why mathematics in economics? Journal of Post Keynesian Economics, 25(4), 561- 574. Kaul, N. (2002). A critical “post” to critical realism. Cambridge Journal of Economics, 26, 709-726. Kazancı, M. (2006). Althusser: İdeoloji ve ideoloji ile ilgili son söz (Althusser: Ideology and the last word about the ideology).
İstanbul Üniversitesi İletişim Fakültesi Dergisi, 24, 1-20. Keynes, J. N. (1897). The scope and method of political economy. New York: Macmillan. Lawson, T. (2006). The nature of heterodox economics. Cambridge Journal of Economics, 30, 483-505. Mas-Collel, A., Whinston, M. D., & Green, J. R. (1995). Microeconomics theory. New York: Oxford University Press. Morgan, M. S., & Rutherford, M. (1998). American economics: The character of the transformation. History of Political Economy,
30, 1-26. North, D., & Thomas, R. (1973). The rise of the western world: A new economic history. New York: Cambridge University Press. Pirgan Matur, E. (2007). Kurumsal iktisat (Institutional economics). Ankara: İmge Kitabevi. Portelli, H. (1982). Gramsci e le bloc historique (Kenan Somer). Ankara: Ankara Savaş Yayınları. Pratten, S. (2004). Mathematical formalism in economics: Consequences and alternatives. Institute of Economic Affairs, 24,
37-42. Ransom, R. S., & Walton, G. (1982). Explorations in the new economic history: Essays in honor of Douglass C. North. New York:
Academic Press. Yaylagül, L. (2006). Kitle iletişim kuramlari egemen ve eleştirel yaklaşımlar (The theories of mass communication, dominant and
critical approaches). Ankara: Dipnot Yayınları.

Chinese Business Review, ISSN 1537-1506 April 2013, Vol. 12, No. 4, 258-265
Analysis on China’s Economic Transformation
and Its Relevance to Global Economy
Wenfu Zhou, Jianqiang Peng
Hebei Academy of Social Sciences, Shijiazhuang, China
China’s current economic transformation has its historical reasons and its urgent need of change. With over 30
years of reform and opening-up, China’s economy experienced high-speed growth for a sustained period, but China
is still confronted with many obstacles which call for immediate attention, such as shortage of resources,
deterioration of the environment, structural imbalance, and intensified social conflict. If these problems persist, an
ominous future would not be avoided unless an economic transformation was in effect. As China’s economic power
and international influence increase, its economic transformation will significantly impact not only its domestic
economy, but also the world economy. This article analyzes the transformation of China’s economy from an
international perspective, particularly focuses on the relationship between China’s transformation and the
economies of most developed countries (e.g., United States and EU) by comparing data and analyzing impacts
caused by each other. At the end, the article will provide some suggestions for further research.
Keywords: mid-income trap, sustainable growth, global economy, the relevance study, new international
cooperation, sustainable growth
Introduction: The Need for China’s Economic Transformation
China has experienced high-speed growth for a while and has become the second largest economy in the
world. In spite of this achievement, there is still a long way to go for China to join the rank of developed
countries, judging by not only the criterion of per capita GDP, but also by other criteria such as environment
and infrastructure. In the meantime, international events such as the U.S. financial crisis of 2008 and the
unsolved debt crisis in Europe also affected China’s sustainable growth; these create the necessity for economic
transformation in China.
The Characteristics of the Current Economic Development in China
In 2010, the Chinese GDP per capita surpassed 4,000 US dollars, advancing China into the top of
mid-income counties. However, the Chinese economy is likely to be “trapped” in the mid-income category if
the economy were not transformed in due time. Many researchers have focused on the transformation challenge.
Cai (2011) described the various paths that countries took after entering the mid-income stage, using
cross-national data for comparison. The research has shown that while most countries have escaped the
Wenfu Zhou, Professor, President of Hebei Academy of Social Sciences, Hebei Academy of Social Sciences. Jianqiang Peng, Professor, the Vice President of Hebei Academy of Social Sciences, Hebei Academy of Social Sciences. Correspondence concerning this article should be addressed to Jianqiang Peng, No. 67, Yuhua West Road, Shijiazhuang City,
Hebei Academy of Social Sciences. E-mail: [email protected].
D DAVID PUBLISHING

CHINA’S ECONOMIC TRANSFORMATION AND ITS RELEVANCE TO GLOBAL ECONOMY
259
“poverty trap” by moving up from the low-income countries to mid-income countries, only a few countries
escaped from the “mid-income trap” successfully. The reason was that most of the trapped countries have not
overcome challenges such as the upgrade of development model, the obstacle of technological innovation, and
the issues of institutional reforms and social inequity (Lin, Wang, Huang, & Ma, 2011). Today, China is facing
the same challenges.
Structural Imbalance in Demand and Production
The coordinated development of an economy requires the so-called “Three Carriages”, i.e., investment,
export, and consumption, to stimulate economic growth. Reliance on investment and export through heavy
industrialization has been the primary means of economic growth in China, owing to the longstanding
“overtaking-the-developer-counties” strategy and export-oriented development policies. The industrialization
has led to a 10% economic growth each year. But this mode of development also caused many structural
imbalances in the economy, aggravated by changing factors from both inside and outside. From the demand
structure point of view, the weak aggregate demand created by high-investment and low-consumption resulted
in overcapacity in production and over-dependency on foreign markets. For example, the ratio of dependency
on foreign trade in 2010 was 49% in China, compared with 22.3% and 42.8% in the United States and UK
respectively. It is higher than the ratio in India (31.2%) by 17.8%. The financial crisis and the outbreak of the
European debt crisis caused developed countries in the United States and European countries to change from
consumption on debt to consumption on saving, which diminished demand of import for labor-intensive
products exported from China, and led to the persistent decline of China’s export. For example, the contribution
of the net export to economic growth was -5.8% in China in 2011. From the structure of industry’s point of
view, the structure of industries in China is problematic. The secondary industry in China is inappropriately
high, at nearly 50% of GDP in 2009, far exceeding the rest of the world in comparison. The tertiary industry in
the Chinese economy has been just the opposite. It is relatively low when compared with other countries,
including low-income countries (see Table 1). Moreover, structural problems also exist within industries. For
example, Chinese manufacturing industry stays in the low-end of the value-chain, producing massive
labor-intensive products with low profits due to lack of innovation and research. In the service sector, certain
industries are under development such as information and producer services, insurance, media and
communication, technological research, and consulting industries.
Table 1
The 2009 International Comparison of Industry Structure
Countries Primary industry Second industry Tertiary industry
Low-income countriesa 26.9 29.1 44.1
Low-mid income countriesb 13.2 39.4 47.4
High-mid income countriesb 6.4 33.0 61.0
High-income countriesc 1.5 25.6 72.7
China 10.4 46.3 43.4
Notes. a data from 2008; b data from 2009; c data from 2007. Source: NBS “Yearbook of International Statistics 2010”.
Domestic Problems and Social Conflicts
The East Asian Economic Development Report (2006) by the World Bank indicates that when a
mid-income economy is ready to advance into high income groups, it is likely to experience a sudden outburst of
conflicts masked behind the fast-growing economic scene. Such conflicts include political disagreements,
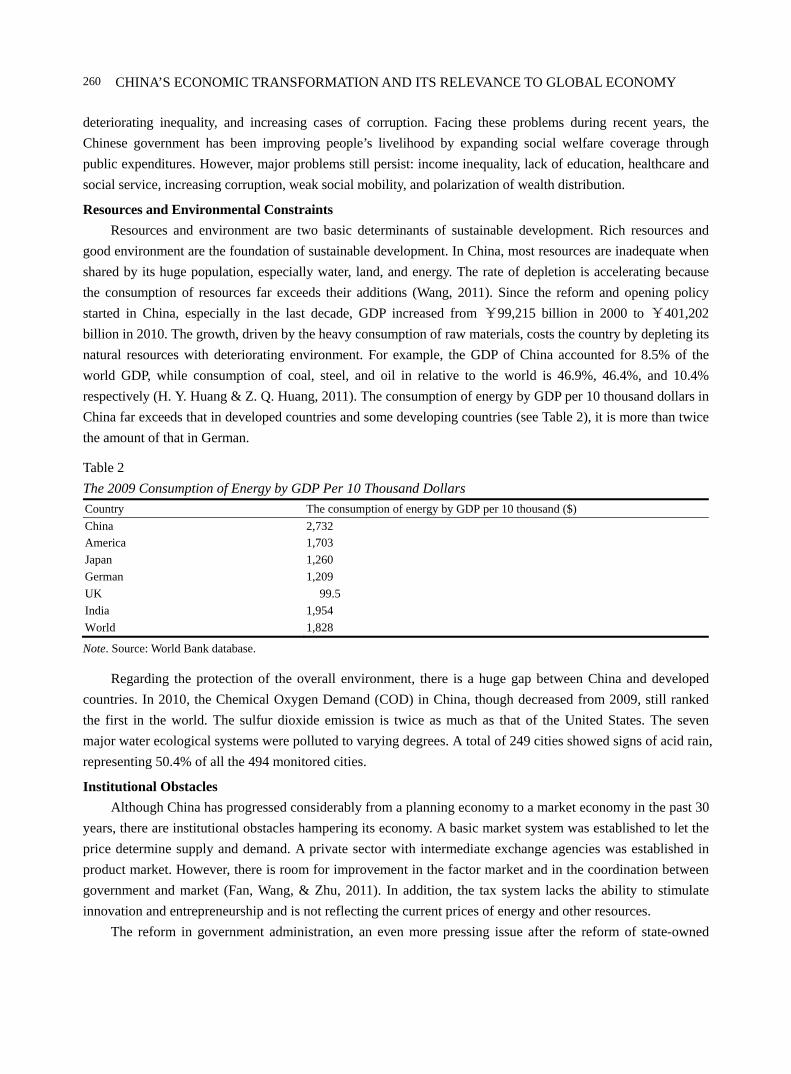
CHINA’S ECONOMIC TRANSFORMATION AND ITS RELEVANCE TO GLOBAL ECONOMY
260
deteriorating inequality, and increasing cases of corruption. Facing these problems during recent years, the
Chinese government has been improving people’s livelihood by expanding social welfare coverage through
public expenditures. However, major problems still persist: income inequality, lack of education, healthcare and
social service, increasing corruption, weak social mobility, and polarization of wealth distribution.
Resources and Environmental Constraints
Resources and environment are two basic determinants of sustainable development. Rich resources and
good environment are the foundation of sustainable development. In China, most resources are inadequate when
shared by its huge population, especially water, land, and energy. The rate of depletion is accelerating because
the consumption of resources far exceeds their additions (Wang, 2011). Since the reform and opening policy
started in China, especially in the last decade, GDP increased from ¥99,215 billion in 2000 to ¥401,202
billion in 2010. The growth, driven by the heavy consumption of raw materials, costs the country by depleting its
natural resources with deteriorating environment. For example, the GDP of China accounted for 8.5% of the
world GDP, while consumption of coal, steel, and oil in relative to the world is 46.9%, 46.4%, and 10.4%
respectively (H. Y. Huang & Z. Q. Huang, 2011). The consumption of energy by GDP per 10 thousand dollars in
China far exceeds that in developed countries and some developing countries (see Table 2), it is more than twice
the amount of that in German.
Table 2
The 2009 Consumption of Energy by GDP Per 10 Thousand Dollars
Country The consumption of energy by GDP per 10 thousand ($)
China 2,732
America 1,703
Japan 1,260
German 1,209
UK 99.5
India 1,954
World 1,828
Note. Source: World Bank database.
Regarding the protection of the overall environment, there is a huge gap between China and developed
countries. In 2010, the Chemical Oxygen Demand (COD) in China, though decreased from 2009, still ranked
the first in the world. The sulfur dioxide emission is twice as much as that of the United States. The seven
major water ecological systems were polluted to varying degrees. A total of 249 cities showed signs of acid rain,
representing 50.4% of all the 494 monitored cities.
Institutional Obstacles
Although China has progressed considerably from a planning economy to a market economy in the past 30
years, there are institutional obstacles hampering its economy. A basic market system was established to let the
price determine supply and demand. A private sector with intermediate exchange agencies was established in
product market. However, there is room for improvement in the factor market and in the coordination between
government and market (Fan, Wang, & Zhu, 2011). In addition, the tax system lacks the ability to stimulate
innovation and entrepreneurship and is not reflecting the current prices of energy and other resources.
The reform in government administration, an even more pressing issue after the reform of state-owned

CHINA’S ECONOMIC TRANSFORMATION AND ITS RELEVANCE TO GLOBAL ECONOMY
261
enterprises, is taking place gradually. Over the past 30 years, Chinese government has changed its service
attitudes, institutional functions, and administrative structures, successfully transforming itself into a modern
government. Nevertheless, problems still exist in the relationship between governments and enterprises,
characterized by intervention of market by administrative orders and lack of effective monitoring of
governments.
Changes in the Climate of International Economy
Global financial crisis and European debt crisis shattered the world economy, slowing economic recovery
and increasing the downward risk of global economic development. In many advanced economies, the
unemployment rate remains high while private demand stays low. Making matters worse, soaring international
commodity prices, greater pressure on inflation, and the volatility of global financial market added even more
uncertainties to the global economic recovery. As a consequence, China’s economic growth has slowed down
for several reasons. First, the crisis decreased the demand for Chinese products. Second, during the crisis,
developed countries realized that their over-reliance on service industries, especially the finance industry, put
their economies in jeopardy. Hence, they increased investment in research and development (R&D) and
infrastructure to compete with China in manufacturing. Finally, some developing countries such as Honduras,
Vietnam, Sri Lanka, and India, have cheaper labor and natural resources than China. They are strong
competitors of China in labor-intensive products (Lin et al., 2011).
As global economic conditions worsened, trade protectionism has risen during recent years. Many trade
disputes appeared. In the four-day period from March 19th to March 22th of 2012, United States of America
filed five trade remediation cases against China, including four anti-dumpling/anti-subsidy grievance and one
anti-dumping and anti-subsidy investigation (Retrieved from
http://www.qstheory.cn/gj/rdjjgj/201203/t20120326_147954.htm). Rather different from before, this time some
developing countries including Argentina, Mexico, Brazil, Turkey, and India also participated in the accusation
against China for unfair trade. During the first eight months since 2011, more than 40 lawsuits (14 were
recently filed) were filed. These challenges affect China’s exports considerably (Han, 2012).
Given these challenges, there seems to be one way to keep the Chinese economy growing—the
transformation of the Chinese economy. Specifically, the Chinese government has to increase the domestic
demand as a key solution to improve the economy (Zhang, 2012).
Analysis of the Relationship Between China’s Economic Transformation and World Economy
The industrial revolution has led to the formation of a global market, bringing countries closer together. An
integrated global economy emerged from the accelerating world trades, catalyzed by the recent advances in
information technology. Any large economy will have great influence on the rest of the world. China is no exception.
The Importance of Transformation for Sustainable Development
Economic transformation originally refers to the transition of an economy from a planned-economy in
which resources are allocated by highly-centralized methods to a market economy in which resources are
allocated by prices. Since the beginning of the 21st century, developing countries trapped in the mid-income
group and developed countries trapped in debt crisis. All economies started to realize the need for a new form
of economic transformation characterized by new development modes, usage of new production factors, and/or

CHINA’S ECONOMIC TRANSFORMATION AND ITS RELEVANCE TO GLOBAL ECONOMY
262
new growth paths. For developing countries, the transformation usually involves the adoption of more
sophisticated but less exploitative development mode, more market-oriented and less government-intervened
economic structure, and more technology-dependent and less natural resource-dependent growth paths. For
developed countries, the transformation usually involves a structural adjustment which emphasizes the real
economy by bringing manufacturing back to the economy.
During the process of modernization, both emerging economies and developed countries experienced the
transformation that helped the economy achieve high-speed growth. Wu (2005) portrayed the process of
economic transformation from early models to modern modes (see Table 3) and showed the importance of
transformation in economic growth. Since the 1950s, Eastern Asia including Japan and “the Four Tigers”
embarked on an export-oriented development path that worked miracles for them. From the 1950s to the 1970s,
Japan experienced an amazing growth rate of almost 10% each year, followed by the Four Tigers’ high-speed
growth from the 1960s to the 1980s (Quan & Jin, 2010). However, this “catch-up” strategy stopped working
when their economies reached a certain level. After they became developed countries themselves, they could no
longer grow by copying the experiences of developed countries (Hayami, 1998). In order to escape from the
trap inherent in export-oriented development model, Japan and the Four Tigers took measures to transform their
economies by reforming their systems of administration, finance, and currency from the 1970s to the 1980s.
After the transformation, the economic growth depends more on domestic demands and technology-intensive
industries. In Japan and South Korea, the transformation helped them advance from the mid-income country
group to the high-income country group.
Table 3
Economic Transformation of Industrialized Countries
Period Stage Character Factor Main industry
Before 1770 Stage before “takeoff” Exploitation of natural resources Natural resources Agriculture
1770-1870 Early economic growth Machines replace labor Accumulation of capital Heavy industry
1870-1970 Modern economic growth The efficiency being improved Technology progress Service-oriented manufacturing industries
After 1970 The age of information Transforming national economy with information technology
Informatization Information industry
Note. Source: Wu, 2005, p. 44.
Transformation is an important step to realize sustainable economic growth for both developed and
developing countries. Different transformation models work in different countries with different cultures,
values, traditions, and heritage. It remains to be seen which model is right for China to sustain its economic
growth.
The Influence of China’s Transformation on the World Economy
Since the policy of reform and opening-up, China’s economy has made noticeable progress, contributing
significantly to the world economy. Its international statue improved and its national power strengthened
remarkably. China is now one of the most powerful economic forces in the world. According to World Bank,
the contribution to China’s economic growth to the world increased considerably. From 2005 to 2010, China’s
contribution to the global growth ranked No. 2 after the United Sates (see Table 4).
Today, the old model of Chinese economic growth is no longer sustainable. It needs urgent reform. The
transformation of the Chinese economy with its one-fifth of the world population will bring profound impact on

CHINA’S ECONOMIC TRANSFORMATION AND ITS RELEVANCE TO GLOBAL ECONOMY
263
the world economy in several aspects. First, its aim to increase its domestic demand creates a bigger
consumption market for export from the rest of the world. Second, its aim to grow service industries will bring
opportunities to developed countries that have advantages in technology and service industry. Third, China’s
goal to transform itself into an “energy efficient and environment friendly society” will raise global
environmental awareness and advance the frontier of a green economy for all mankind.
Table 4
The Contribution to the World Economic Growth
Ranking criterion Year
2005 2006 2007 2008 2009 2010 GDP (current price)
China 22,569 27,130 34,931 45,218 49,913 59,266
United States 125,797 133,362 139,950 142,969 140,481 145,867
Japan 45,522 43,626 43,779 48,799 50,330 54,588
German 27,663 29,027 33,238 36,237 32,986 32,805
Britain 22,801 24,441 28,110 26,575 21,732 22,488
India 8,340 9,513 12,424 12,160 13,773 17,271
World 456,583 495,063 558,489 613,045 580,883 631,239
Percent of change of GDP (%)
China 11.3 12.7 14.2 9.6 9.2 10.4
United States 3.1 2.7 1.9 0.0 -3.5 3.0
Japan 1.9 2.0 2.4 -1.2 -6.3 4.0
German 0.7 3.7 3.3 1.1 -5.1 3.7
Britain 2.1 2.6 3.5 -1.1 -4.4 2.1
India 9.3 9.3 9.8 4.9 9.1 8.8
World 3.5 4.0 4.0 1.4 -2.3 4.2
Share of contribution (%)
China 15.96 17.4 22.2 50.58 34.37 23.25
United States 24.4 18.18 11.9 0.0 -36.8 16.51
Japan 5.41 4.41 4.7 -6.82 -23.73 8.24
German 1.21 5.42 4.91 4.64 -12.59 4.58
Britain 3 3.21 4.4 -3.41 -7.16 1.78
India 4.85 4.47 5.45 6.94 9.38 5.73
World 100.0 100.0 100.0 100.0 100.0 100.0
Note. Source: World Bank data.
The Impact of the World Economy on the Transformation of China
In the context of globalization, countries are closely linked with each other. The economic transformation
of China will have an influence on the world economy, and vice versa. Many structural problems emerged
during the U.S. financial crisis and the Euro-zone debt crisis. The erosion of the manufacturing base has
encroached on the economic health of many developed countries. It is desirable to restore the real economy by
reindustrialization their countries through innovation of new products in new markets. The developed countries
most likely will focus on renewable energy and reusable materials to build low-carbon economies. In these new
industries, China and other industrialized countries will compete directly, for China sees the low-carbon
economy as an important goal for sustainable economic development too. China’s future economic growth will
be constrained because developed countries have an advantage in technology and research capability.

CHINA’S ECONOMIC TRANSFORMATION AND ITS RELEVANCE TO GLOBAL ECONOMY
264
Forging New International Cooperation
In recent years, the world has seen an elevated level of protectionism in finance, trade, and investment as
evident from increasing trade frictions. There are reasons for this trend. In developed countries, many of them
have encountered considerable domestic problems within their own economies. Until now, the shadow of
unemployment still haunts the recovery of their economies. For emerging economies, declining exports and
inflation pressure require them to do some things to protect their own economies. To avoid escalation of trade
wars, it is desirable to build a new cooperation relationship that will benefit all economies involved.
Historically, behind the facade of a closely-coordinated global trade, there exists an unequal distribution of
benefits from trade. This inequality, shaped by the uneven nature of political power and the monopoly of
technological know-how, created an unequal relationship between developed countries and developing
countries. To establish a new healthy relationship among countries, the first and most important thing to do is to
give emerging countries a say that they deserve in the international community. This new relationship implies
an equal, fair, and compatible economic development of all countries. It means that countries shall look out for
each other to avoid conflicts and to achieve growth through cooperation and mutual trust.
China is in a key stage of transformation where many uncertainties exist. Thus, a peaceful and stable
international relationship is of great importance to China. On the one hand, China has to maintain consistent
foreign trade policies and make more use of the WTO dispute settlement mechanism to solve problems from
trade friction. On the other hand, China has to pay more attention to adjust the composition of its export
products and to explore emerging markets to diversify its exports.
Since the end of the Cold War, the landscape of international politics has changed considerably. The U.S.
financial crisis and the Euro-zone debt crisis have accelerated the need for reform in the international economic
system. Some developed countries have been trying to resist this change by reducing domestic unemployment
through protectionism. Two observations can be made to explain why protectionism will be counterproductive
and unwarranted. First, as China shifts its emphasis to domestic demand, its import of high-tech products from
developed countries has to increase. This will provide an excellent opportunity for the developed countries to
increase their exports to China. Second, huge amount of Chinese foreign reserves has to seek an exit in the
international market. Enterprises with high productivity in developed countries will be a good target for
Chinese investment. Chinese direct investment in these countries will result in the reduction of unemployment
in these countries. Thus, in the time of crisis and changes, it is better that every country cooperates to fight
protectionism for sustainable growth of the global economy.
Further Exploration
There are a few theoretical and practical questions yet to be resolved regarding economic transformation
and the establishment of a new international cooperation relationship. To tackle some of the major issues
requires innovative thinking and creative approaches. For instance, how to measure if an economic
transformation is successful in China? Can such measure be defined precisely or scientifically? Current
literature might shed some light on these questions. But each country has its own unique economic
circumstances that justify the use of different criteria and evaluation methods. What are the criteria and
methods that work in China? There seems to be no easy answer.
Regarding the effort to establish a new international economic order, what framework shall we use for

CHINA’S ECONOMIC TRANSFORMATION AND ITS RELEVANCE TO GLOBAL ECONOMY
265
such an effort? Is the WTO achieving its mission as originally envisioned? What are the areas that WTO failed
to deliver? Do we need an entire new international organization and structure to replace WTO? If we need to
create a new system of international order and laws, how can we ensure the enforcement of these new
international laws? All of these issues would require further research.
References Baidu Encyclopedia. (n.d.). Economic transition. Retrieved from http://baike.baidu.com/view/152796.htm Cai, H. B. (2011). China’s economic transition and social mobility. Comparative Studies, 2, 1-14. Fan, G., Wang, X. L., & Zhu, H. P. (2011). Marketization indices of China: The relative progress of regional marketization indices
in 2011. China: Economic Science Press. Han, X. S. (2012). Trade outlook mixed. China Report, January, No. 95. Hayami, Y. (1998). Theories of economic development—From poverty to affluence. Beijing: Social Science Publishing. Huang, H. Y., & Huang, Z. Q. (2011). Accelerate development paces to realize the third economic transformation. Macroeconomic
Management, 1, 234-257. Lin, G., Wang, Y. M., Huang, T. Y., & Ma, X. H. (2011). Chinese strategies to leap over the “middle-income trap”. Beijing:
Economics Publishing. Liu, M. W. (2011). Harmonious world: The core value of international relations. Fujian Forum, 6, 35-47. Liu, S. X. (2012). Trade protection against Chinese exports by US and Europe: Stereotyping and worries. Retrieved from
http://finance.ifeng.com/roll/20120103/5392808.shtml Quan, Y., & Jin, H. F. (2010). Models of development and choices of paths for Asian countries: A comparative analysis of
development paths between East Asia and Latin America. Beijing: Times Publishing. Wang, B. A. (2010). Structural imbalance of Chinese economy: Fundamental characteristics, underlying causes, and policy
recommendations. Finance, Trade, and Economics, 7, 67-90. Wang, Y. J. (2011). Status of Chinese natural environment: Some statistics. Chinese Statistics, 7, 250-256. Wu, J. L. (2005). Choice of the Chinese economic development models. Shanghai: Shanghai Yuandong Publishing. Xie, C. D. (1992). Internationalization of capitalistic economy and the harmonization of global economy. Global Economic
Research, 3, 114-130. Xinhua News. (2011). Authorized the release: “China’s foreign trade” white paper. Retrieved from
http://news.xinhuanet.com/politics/2011-12/07/c_111222865_2.htm Xu, C. G. (2011). An institutional perspective of structural problems in Chinese economy. Comparison, 5, 77-89. Yuan, Z. G., & Shao, T. (2011). Transformation of Chinese economy and rebalance of global economy. Scholarship Monthly, 1,
89-101. Zhang, Y. Y. (2012). Review and outlook for the 2011 global economy. Qiushi Magazine, 2, 19-26.

Chinese Business Review, ISSN 1537-1506 April 2013, Vol. 12, No. 4, 266-277
A Bicycle Design Model Based on Young Women’s Fashion
Combined With CAD and Statistical Science
Kaori Koizumi, Shinji Kawahara, Yuki Kizu, Kakuro Amasaka
Aoyama Gakuin University, Kanagawa, Japan
Today, more people are riding bicycles than ever before—and the numbers keep growing. This is due in part to a
greater awareness of environmental issues and growing health consciousness. Another factor driving the increasing
number of women bicyclists today is many designer bicycles now available. Still, these bicycles reflect the
subjective sensibilities of their designers, and there is no guarantee that they will always match an increasingly
diverse array of consumer values. In response to this challenge, our study sets out to build a bicycle design model
based on fashion styles popular with young women in their 20s. Fashion analysis and bicycle design analysis used
statistical science, such as cluster analysis, principal component analysis, and analytic hierarchy process (AHP).
After that, we designed a new bicycle using computer-aided design (CAD) from the analysis results. Finally, the
approach model developed in this study was confirmed to be effective by an interview with the company.
Keywords: young women’s fashion, bicycle design model, desire words
Introduction
Today, more people are riding bicycles than ever before—and the numbers keep growing. This is due in
part to a greater awareness of environmental issues and growing health consciousness. Another factor driving
the increasing number of women bicyclists today is many designer bicycles now available. Still, these bicycles
reflect the subjective sensibilities of their designers, and there is no guarantee that they will always match an
increasingly diverse array of consumer values. It goes without saying that bicycles are built in a way that
reflects the times.
As consumer values continue to diversify, it is becoming increasingly critical that bicycles express a
concept and design that appeal to customer sensibilities. In past eras, where buyers were looking primarily for
functionality, product designers could focus on the concept of “getting a product out”—meaning simply
building a product with minimum functionality and knowing it would sell. Today, when it has become
increasingly difficult for products to distinguish themselves in terms of function or performance, manufacturers
cannot sell their products unless they offer customers what they truly want.
This represents a complete shift to the idea of “customer delight”, a concept requires that product
designers grasp social trends. In order to achieve this “customer delight”, manufacturers must focus on finding
Kaori Koizumi, Graduate Student, School of Science and Engineering, Aoyama Gakuin University. Shinji Kawahara, Graduate Student, School of Science and Engineering, Aoyama Gakuin University. Yuki Kizu, Graduate Student, School of Science and Engineering, Aoyama Gakuin University. Kakuro Amasaka, Ph.D., Professor, School of Science and Engineering, Aoyama Gakuin University. Correspondence concerning this article should be addressed to Kakuro Amasaka, 5-10-1, Fuchinobe, Chuo-ku, Sagamihara-shi,
Kanagawa-ken, 252-5258, Japan. E-mail: [email protected].
D DAVID PUBLISHING

A BICYCLE DESIGN MODEL BASED ON YOUNG WOMEN’S FASHION
267
ways to identify what customers are thinking, and then figure out how to make the best use of that knowledge.
“What customers are thinking” is another way of saying “customer feedback”, and it is essential that product
developers approach the concept of “customer science” with a focus on feedback and careful consideration of
consumer values.
Objectively grasping customer preferences and values and then building them into the design process to
express them in a concrete way is a critical element of product design strategy—and also makes it possible to
predict what bicycle styles will sell 10, 20, or even more years down the line chances of achieving their goals in
real-life cases and provide confidence ratings in their predictions (Koizumi, Kawahara, & Kizu, 2011).
Background
The mission of a manufacturer is to offer products the consumers (customers) are pleased with, as the
basis for sustainable growth. Entering into a new century of product creation based on the management of
global marketing, it is necessary to create the kind of products which further enhance the life stages and
lifestyles of customers, as well as customer value. In order to develop and offer attractive, customer-oriented
products, it is vital to urgently and seriously consider “customer needs” and to establish strategic product
development methods which are ahead of the times (Amasaka, 2005).
In order to directly confront the management environment today’s companies are surrounded by and to
implement the necessary measures to respond to it, it is indispensable to establish a “scientific approach toward
customer orientation”. A reasonable business approach is needed which can be utilized for product planning
and technical development through the digitization of the hidden desires of customers, so that subjective
information (about the customers) and objective information (objectified by technology) can be mutually and
compatibly exchanged.
Generally speaking, though customers have both favorable and unfavorable evaluations about current
products in the market, they usually do not have a clear image of what types of products they want in the future.
The customers express their demands in spoken words, and therefore the product designers (planning and
designing staff) need to accurately interpret such expressions and convert them into corresponding design
drawings.
For this reason, the sales and service staff who are closest to the customers need to express the product
image that the customers have to the planners (research engineers/designers who think objectively in numerical
terms) who engage in product development, in a scientific, common language rather than rely on an implicit,
vague language (Amasaka, 2009a). In connection with the creation of future products, it is particularly
important to “offer precisely and quickly what the customers want before they realize they want it”.
In order to do this, it is vital to clearly grasp the hazy, ambiguous feelings of customers. The “product
development technological method—customer science” (Amasaka, 2002a, 2008a) shown in Figure 1 is what
gives concrete shape to such customer wants. It is intended to present a model of (an approach to) a new
business process for creating “wants” which is indispensable for manufacturing attractive products.
As depicted in Figure 1, so-called objectification of subjectivity wherein the image of customers’ words
(implicit knowledge) is expressed in a common language (lingual knowledge) and then, by incorporating
technical words (design drawings, etc.) as well as correlation techniques, it is further interpreted appropriately
(into explicit knowledge). When using the methodology of customer science for approaching various
customer-related situations, such as why the customers are satisfied or dissatisfied with a particular product,

A BICYCLE DESIGN MODEL BASED ON YOUNG WOMEN’S FASHION
268
what is the underlying feeling behind a certain expression, what kind of products then need to be offered, or in
what specific situation a recall case occurs, the situations can then be interpreted into a common language, and
further converted into the language of technology.
Then the staff of the research and development or designing departments can digitize such situations by
means of correlation techniques utilizing statistical science, simulate them in the laboratory or experiment
facility, and confirm the conditions in which such situations are most likely to occur. Finally, it is necessary to
check whether what is represented on a drawing specifically reflects what the customers actually want and
thereby confirm the accuracy of the work being performed, thus subjectifying the objectivity using correlation
techniques (Amasaka, Nagoya, & Shibata, 1999; Amasaka, 2002b, 2003, 2007a).
Figure 1. Schematic drawing of customer science.
By conducting “total marketing”, that is, an approach focusing on “quality management that gives
customers top priority” incorporating customer science, the implicit business process, consisting of
promotion/sales, product planning, designing, development designing, and production, which has been a major
concern for the management class, can be clarified further. By means of the scientific knowledge obtained from
the cycle of these business processes, “accumulation of successes” or “correction of failures” can be carried out
more accurately than ever, and therefore highly reliable quality management, “scientific quality management”
can definitely be realized (Amasaka, Watanabe, & Shimakawa, 2005).
It is observed that well-performing manufacturers both inside and outside Japan today have maintained an
attitude which prompts them to humbly repeat the process of clarifying implicit knowledge in order to grasp the
customers’ feelings to the greatest extent possible, and then feed it back to check whether what is reflected in
their product design drawings truly represents the objectified demands of customers. Such an attitude
constitutes the basis of their manufacturing activity (Amasaka, 2007b, 2007c, 2008b, 2009b).
This approach is common to Statistical Quality Control (SQC) introduced to Japan by Dr. Shewhart and
Dr. Deming and has immensely contributed to postwar Japanese manufacturing and the development of quality
management technology (Shewhart, 1986; Mary, 1988; Joiner, 1994; Gabor, 1990).
A New Bicycle Design Approach Model
We have seen that bicycle designs currently rely on the subjective sensibilities of bicycle designers. In this
study, we outline a series of five steps that take the tacit knowledge underlying bicycle design (the intuition and
Market
Language (Customers)
Image (Concept)
Drawings (Engineering)
y y
Objective Information
Subjective Information
Objectification of Subjectivity
Explicit Knowledge
Lingual Knowledge Merchandise
Explicit Knowledge

A BICYCLE DESIGN MODEL BASED ON YOUNG WOMEN’S FASHION
269
personal skills that designers have) and making it explicit with the help of preference factors and preference
studies. This process allows manufacturers to offer bicycle designs that match the sensibilities of their target
consumers (Koizumi et al., 2012a).
Preliminary Survey <STEP0>
First, examine prior research. Conduct a company market survey to better understand today’s bicycle
industry, the tastes and preferences of the target buyers (women in their 20s), and the challenges and conditions
affecting bicycles in general.
Identify Focal Areas <STEP1>
Use an eye-tracking camera to identify what parts of a bicycle women in their 20s focus their attention on.
Fashion Analysis <STEP2>
Use the results of the preliminary survey and street survey to put together a collage. Analyze the results
from preference studies and group them into five style systems by preference. Narrow down the target buyers
and identify bicycle “desire words” from the target women.
Bicycle Design Analysis <STEP3>
Determine the shape of the frame of the bicycle, color, and color of the tire from preference studies and
desire words extracted in STEP2.
Create a Design <STEP4>
Use the analysis results collected thus far to create an actual design using CAD.
Approach a Design Model <STEP5>
Propose a bicycle design approach model and verify the results.
Identify Focal Areas
Bicycles have many different parts, and it is not clear which of these impact design evaluations. To resolve
this difficulty, we used an eye-tracking camera to analyze line of sight and identify which parts women pay the
most attention to. This allowed us to identify the parts that received the most attention as those that have the
greatest impact on design evaluations. The study itself was done by having test subjects look at images of
women on bicycles and evaluate them. Starting with the heat map in Figure 2, we see that subjects paid the
most attention to the style of the bicycle and to the frame.
Figure 2. Heat map and gaze map.

A BICYCLE DESIGN MODEL BASED ON YOUNG WOMEN’S FASHION
270
The thing they looked at next was the tires. Moving on to the gaze map in Figure 2, we see that subjects
were more interested in the style, form, and tires (in that order). This indicates a relationship between these
three areas. Using these two insights, we noted the focus on style and the frame and reconfirmed the importance
of taking style into account when designing a bicycle. After learning that the aspects of the bicycle that have the
most impact are the frame, the style, and the tires, we conducted the following analysis with a focus on these
three points.
Fashion Analysis
Create a Collage
Our study grouped women in their 20s into style groups based on their image of bicycles. These groupings
were then used to analyze the design preferences of target buyers, outline what needed to be done to generate a
design concept, and actually create a bicycle design. A collage was then created based on the results of the
preference studies. In order to decide what form of media to use in creating the collage, preference study
participants were asked, “What sources do you consult when buying clothes?”—magazines. From this, we
concluded that women in their 20s use magazines to inform their purchases and construct their fashion styles.
Figure 3 groups magazines by style category.
Figure 3. The positioning map of magazines.
The items that subjects chose as best representing a particular style as shown in Figure 4 were used to
create the collage. These items are either frequently worn or carried by women, and include clothing, shoes,
watches, bags, and wallets.
Figure 4. Fashion magazines—each of the decisions.

A BICYCLE DESIGN MODEL BASED ON YOUNG WOMEN’S FASHION
271
Each fashion style was defined using the collage shown in Figure 5.
Girly: A style characterized by cute, girlish tastes;
Fashion-forward: An edgier style in line with cutting-edge fashion trends;
Adult/working woman: A more mature, classic feminine style;
High-end: A style that skillfully incorporates top fashion labels to flatter individual shape;
Street: A relaxed, casual fashion style that incorporates some girly elements.
Figure 5. Collage.
Extract Desire Words of the Bicycle
We started by performing a cluster analysis of the response data from the preference surveys to identify
respondent preferences. Women in their 20s were clustered into five different groups based on their responses
to the preference study question “What is important to you when purchasing a bicycle?” as shown in Figure 6.
Figure 6. Classification of preference by cluster analysis. Group 1: Design-focused; Group 2: Brand-focused; Group 3: Disinterested; Group 4: Trend-focused; and Group 5: Price-focused.
Next, the following determinations were made based on a positioning map that groups the magazines in
Figure 3 by fashion style (these were the magazines indicated in the analysis results and those that participants
said they read during the preference survey). Based on the above research on bicycle design, we selected the
Group 1/Girly group as the target for this study. Next, a principal component analysis study was conducted on
the same response results to create a positioning map.
When we gather around the variables with a correlation coefficient of at least 0.5 on the vertical axis,
principal component 1 in the factor loadings is positive “unique”, “urban”, “cute”, and “futuristic”, we have

A BICYCLE DESIGN MODEL BASED ON YOUNG WOMEN’S FASHION
272
found that the correlation and “orthodox” have a negative correlation. We found out that as well, “a positive
correlation”, “orthodox”, and “classic 2 main component” are “rare’’ and negative correlation.
In addition, the component of the principal component scores, it clarified that principal component 1 has a
strong positive correlation sample 8, 10, 47, 48, and 53. On the other hand, negative correlation is sample 5, 12,
18, and 36. We found out as well, principal component 2 found to be positive correlation is sample 15, 47, and
48 and negative correlation is sample 10, 24, 33, and 38. It can be said from these results, the axis of principal
component 1 is “axis representing the design of the bicycle”, the axis of principal component 2 is “axis
representing the approach to the bicycle”.
The information in Tables 1 and 2 was used to come up with bicycle “desire words” for women in the
“girly” style category: urban, cute, and futuristic/fresh. We categorized by fashion group, a scatter plot of
principal components: principal component 1 and principal component 2.
Table 1
Factor Loadings Variable name
Principal component 1 Principal component 2 Principal component 3 Principal component 4 Principal component 5
Orthodox -0.133 0.729 0.187 -0.026 0.372 Futuristic 0.808 -0.162 -0.022 -0.062 -0.232 Unusual 0.139 -0.327 0.808 -0.412 -0.023 Individual 0.569 0.339 0.325 -0.056 -0.033 Classic 0.173 0.733 -0.121 -0.477 -0.232 Noticeable 0.267 0.425 0.342 0.661 -0.402 Urban 0.676 -0.355 0.107 0.210 0.366 Cute 0.800 -0.247 -0.143 -0.043 0.041 Elegant 0.776 0.047 -0.317 -0.148 -0.183
Table 2
Principal Component Analysis
Sample Principal component 1
Principal component 2
Principal component 3
Principal component 4
Principal component 5
1 0.042 -1.323 -1.155 -1.066 -0.922 2 0.576 -0.412 -0.234 -0.578 0.310 3 0.241 -1.188 0.025 0.652 0.254 4 -0.302 -0.405 -1.137 0.909 0.300 5 -2.540 0.924 -1.694 -0.547 -0.227 6 -0.256 -0.225 -0.150 1.523 -1.018 7 -0.124 -0.588 0.423 -0.044 0.838 8 1.846 0.167 -0.551 0.546 -0.360 9 -0.960 0.344 -1.070 -0.921 0.836 … … … … … … 45 0.982 1.156 1.130 -0.192 -1.061 46 1.240 1.049 1.051 -0.550 0.158 47 1.692 1.864 0.068 0.054 -0.743 48 1.534 1.908 0.441 -0.647 0.295 49 0.942 1.048 1.482 -0.367 0.232 50 1.409 1.536 -1.398 0.645 -0.073 51 -0.424 -0.806 0.887 -0.478 0.482 52 0.134 -0.077 -2.263 0.854 -0.217 53 1.897 -0.107 0.334 1.138 -0.521 54 -0.029 0.555 -0.739 0.319 -0.494

A BICYCLE DESIGN MODEL BASED ON YOUNG WOMEN’S FASHION
273
The information in Figure 7 was used to come up with bicycle “desire words” for women in the “girly”
style category: urban, cute, and futuristic. Using the eye-tracking camera measurements recorded in STEP 1
and the fashion analysis results from STEP 2, we altered bicycle frame shape, frame angle/height, frame color,
and tire color and had women in the “girly” style category score each one using a 7-point scale. We then
subjected the results to an Analytic Hierarchy Process (AHP analysis).
Figure 7. Scatter plot.
Bicycle Design Analysis
Frame Shape
For frame shape, we conducted a preference study on five typical shapes for the small-wheel bicycles used
in this study. Bicycle frame-shaped decision is analyzed by using the AHP and preference survey. The
alternative with the highest severity grade point method seven, three elements each of the “futuristic”, “urban”,
and “cute” type bicycle frame five is the result of research, taking the maximum value of their elected. Table 3
is the degree of importance of each of the futuristic, urban, and cute. First, calculated when determining the
frame shaped or which word to emphasize how much desired in the futuristic, urban, and cute. The result is
shown in Table 3.
Figure 8. Typical frame types of the small-wheel bicycles.
As an alternative set of five different frames shaped, each alternative had evaluated by seven points in a
futuristic, urban, and cute. An example of the results for “cute” as can be seen in Table 4. After that, perform
the calculation of the degree of importance as well.

A BICYCLE DESIGN MODEL BASED ON YOUNG WOMEN’S FASHION
274
Table 3
Extraction of the Bicycle Frame Shaped (Degree of Desire Words) Desire words/Sample Cute Urban Futuristic Total 1 7 6 5 2 7 6 4
3 7 6 4
4 6 7 4
5 7 6 4
6 6 7 5
7 5 7 5
8 5 7 4
9 7 5 6
10 7 5 6
11 7 6 6
12 7 6 6
Average 6.5 6.17 4.92 17.58
Degree of importance 0.37 0.35 0.28 1.00
Table 4
Alternative of the Bicycle Frame Shaped (Cute)
Alternative/Sample Mixed shaped Diamond shaped Staggered shaped Loop shaped U-shaped Total
1 7 5 5 3 1
2 6 5 5 3 1
3 7 6 5 3 2
4 7 6 6 4 2
5 5 6 4 5 2
6 5 6 4 4 3
7 6 6 5 4 4
8 6 7 3 3 2
9 6 6 4 3 2
10 6 6 4 3 3
11 7 5 4 3 1
12 7 5 4 3 1
Average 6.25 5.75 4.42 3.42 2.00 21.83
Degree of importance 0.29 0.26 0.20 0.16 0.09 1.00
Finally, calculate the ultimate importance of alternative frame shaped and severity of the desired words.
The following is a calculation method.
An example of mixed-shaped type:
Degree of importance = Degree of importance of desire word (Cute)
Degree of importance of alternative (Cute)
+ Degree of importance of desire word (Urban)
Degree of importance of alternative (Urban)
+ Degree of importance of desire word (Futuristic)
Degree of importance of alternative (Futuristic)
Calculate diamond, staggered, loop, also U-shaped in the same way. Table 4 shows the results. Both the
“mixed shape” and “loop shape” received a maximum score of 0.28 in the analysis results. In the preference

A BICYCLE DESIGN MODEL BASED ON YOUNG WOMEN’S FASHION
275
study, subjects said that they liked the crossed portions of the mixed shape and the round lines of the loop shape.
Based on these results, we selected these two shapes as alternatives.
Frame Angle/Height
For frame angle, we designated top tubes I and II as areas where we could make changes to the parameters.
We used three standard angle/height values for each tube, yielding a total of nine options. Type I had the
highest score in the analysis results, so we used it as our alternative for frame angle and height.
Figure 9. A survey of the position/angle of the bicycle frame by a CAD image.
Color of the Frame/Tire
We selected (1) frame of 12 colors; and (2) tire of 12 colors for a total of 144 color combinations, and
created an image of each one using CAD. In doing a color analysis, we conducted a preference study on the
lighter tones that women in the “girly” style category preferred. The color types used included five basic colors
(Red, Yellow, Green, Blue, Violet) and five intermediate colors (yellow red, yellow green, blue green, blue
violet, violet red), plus white (the brightest color) and black (the darkest color) for a total of 12 colors.
Using the frame and tire color combination analyses, we came up with 144 alternatives. The analysis
indicated that the bicycles with (1) a white frame and blue tires; and (2) a white frame and red tires received the
highest score of 0.0121, so these were selected as alternatives.
A Preference Study That Frame Color/Tire Color Combination Analysis
Two bicycle types were selected as a result of the frame color/tire color combination analysis: (1) a
bicycle with a white frame and blue tires; and (2) a bicycle with a white frame and red tires. A preference study
was then done on this frame color with different front-rear tire color combinations. Type IV bicycle with a
white frame, red front tire, and the blue back tire got the highest score of 0.36, so it was selected as the
alternative for this study.
Create a Design
The desire words identified in the analysis (cute, urban, and futuristic/fresh) were found to be linked to the
selected bicycle parts, indicating that the bicycle design accurately reflected what women in the “girly” style
category said they preferred as shown in Figure 10.

A BICYCLE DESIGN MODEL BASED ON YOUNG WOMEN’S FASHION
276
Figure 10. Bicycle embodying and bicycle for verification comparison.
Verification
Using the CAD model of the bicycle, women in the “girly” style category were asked to rate how cute,
urban, and futuristic/fresh it seemed using a seven-point scoring system. The results indicated that the study
produced the appropriate design results. The bicycle for comparative verification was chosen based on the
preference studies, where it received the highest average evaluation from respondents among all 20
small-wheeled bicycles as shown in Figure 10.
The bicycles used for comparison all received a favorable evaluation score of about four, while the bicycle
created in this study received an evaluation of about five. The verification thus indicated that our bicycle design
achieved its intended goal of expressing a certain image and sensibility. In order to evaluate and verify the
research project as a whole, an interview survey was conducted at an actual design center at Fortune bike to see
what people there thought of the research results. Participants pointed out that the model in the study would
give them the ability to quantify and examine preference free from preconceptions, allowing designers and
front-line staff to better exchange information.
In addition, participants pointed out that the ability to identify focal points during the eye-tracking camera
study as a way to identify the areas of the bicycle with the most impact made it possible to change or create
designs in a logical manner. One respondent offered constructive feedback, suggesting that we verify the results
with an actual bicycle rather than a CAD model. In this way, the approach model developed in this study was
confirmed to be effective. The result is shown in Figure 11.
Figure 11. The bicycle design approach model completed.

A BICYCLE DESIGN MODEL BASED ON YOUNG WOMEN’S FASHION
277
Conclusions
This study aimed to set up a bicycle design approach model that would resolve some of the issues that
bicycle designers face, creating a bicycle design that reflected the preferences of women in their 20s with a
“girly” fashion style (Koizumi et al., 2012b). Ideas for future research include increasing the areas of the
bicycle that are studied, designing using different parameters, applying the design approach model developed
here to different age and preference groups, and designing an actual bicycle based on the model.
References Amasaka, K. (2002a). New JIT, a new management technology principle at Toyota. International Journal of Production
Economics, 80, 135-144. Amasaka, K. (2002b). Reliability of oil seal for transaxle—A science SQC approach at Toyota. Case Studies in Reliability and
Maintenance (pp. 571-588). New Jersey: John Wiley & Sons, Inc.. Amasaka, K. (2003). A “dual total task management team” involving both Toyota and NOK—A cooperative team approach for
reliability improvement of transaxle. Proceedings from the Group Technology/Cellular Manufacturing World Symposium (pp. 265-270), Columbus, Ohio.
Amasaka, K. (2005). Constructing a customer science application system “CS-CIANS”—Development of a global strategic vehicle “Lexus” utilizing new JIT. WSEAS Transactions on Business and Economics, 3(2), 135-142.
Amasaka, K. (2007a). The validity of advanced TMS, a strategic development marketing system utilizing new JIT. International Business and Economics Research Journal, 6(8), 35-42.
Amasaka, K. (2007b). The validity of “TDS-DTM”, a strategic methodology of merchandise—Development of new JIT, key to the excellence design “LEXUS”. International Business and Economics Research Journal, 6(11), 105-115.
Amasaka, K. (2007c). The validity of advanced TMS, a strategic development marketing system utilizing new JIT. International Business and Economics Research Journal, 6(8), 35-42.
Amasaka, K. (2008a). Science TQM, a new quality management principle: The quality management strategy of Toyota. The Journal of Management and Engineering Integration, 1(1), 7-22.
Amasaka, K. (2008b). Strategic QCD studies with affiliated and non-affiliated suppliers utilizing new JIT. Encyclopedia of Networked and Virtual Organizations, III, 1516-1527.
Amasaka, K. (2009b). An intellectual development production hyper-cycle model—New JIT fundamentals and applications in Toyota. International Journal of Collaborative Enterprise, 1(1), 103-127.
Amasaka, K., Nagaya, A., & Shibata, W. (1999). Studies on design SQC with the application of science SQC—Improving of business process method for automotive profile design. Japanese Journal of Sensory Evaluations, 3(1), 21-29.
Amasaka, K., Watanabe, M., & Shimakawa, K. (2005). Modeling of strategic marketing system to reflect latent customer needs and its effectiveness. The Magazine of Research & Development for Cosmetics, Toiletries & Allied Industries, 33(1), 72-77.
Gabor, A. (1990). The man who discovered quality: How Deming W. E. brought the quality revolution to America. New York: Random House, Inc..
Joiner, B. L. (1994). Forth generation management: The new business consciousness. New York: Joiner Associates, Inc.. Koizumi, K., Kawahara, S., & Kizu, Y. (2011). Research of the bicycle design approach model in consideration of the fashion by
statistical science and cad-an example about women in their 20s (Graduation thesis). Koizumi, K., Kawahara, S., & Kizu, Y. (2012a). A bicycle design model based on young women’s fashion combined with CAD
and statistical science (Graduation thesis). Koizumi, K., Kawahara, S., & Kizu, Y. (2012b). A bicycle design model based on young women’s fashion combined with CAD
and statistical science (Graduation thesis). Mary, W. (1988). The deming management method. New York: Dodd, Mead & Company, Inc.. Shewhart, W. A. (1986). Statistical method from the viewpoint of quality control. New York: Dover Publications, Inc..
Chinese Business Review, ISSN 1537-1506 April 2013, Vol. 12, No. 4, 278-286
Competitiveness of Travel Agencies in the
European Tourism Market
Iris Mihajlović
University of Dubrovnik, Dubrovnik, Croatia
The concept of competitiveness influenced by many factors is analyzed in terms of terminology distinctions. This is
the reason of numerous definitions of this term included in the first part of the paper, which varies according to the
aspect of the analysis, analyzed marketing unit, tourism product, geographical unit, region, destination, or entities
that offer an acceptable integrated product a package by specific indicators for comparison of elements of
competitiveness. The first part of the article theoretically emphasizes the distinction in defining the concept of
competitiveness from various aspects of the analyzed market subjects (different features and facilities provided), and
from those aspects of their specific business relationship in the market. Special contribution to the study of
competitiveness is contained in the second part of the paper that analyzes the existing situation of intermediation in
the European tourism market. This research is based on using the data of descriptive statistics and the secondary
research which gives insights into the business of travel agencies, using the data such as number of employees,
annual personnel costs, and the average annual cost per person employed in travel agencies in some European
countries. The changes in the environment, and the competition initiate a need for an analysis of the internal
environment, travel agencies’ tasks, and their organizational structure. Also, the results conducted research on a
sample of 500 travel agencies in 20 European countries indicate the dominance of quality service, price, and value
for money as key factors of demand for achieving the competitiveness. It indicates new trends focused on needs for
more specific—integrated tourist products that ensure the quality of service, value for money, and for the time that
tourists invest in their obtaining.
Keywords: dynamic environment, intermediaries, competition, market, service quality, price
Introduction
In the era of regional development when the country (state) as a unit is no longer a primary geographical unit
for creating and improving the competitiveness, the region has become the major driver of the economic
development which is primarily conditioned by the availability of quality resources to run certain economic
activities. A frequent focus on analysis of the competitiveness in tourism is a tourist destination, i.e., tourism
product, whereby its competitiveness has been followed through tourism revenue, the power of attracting target
market of tourist groups, the degree of satisfaction with the product/experience in the destination, the efficiency of
using the superstructure and other resources of destination, profitability, the quality of life, and the preservation of
Iris Mihajlović, Ph.D., Senior Assistant, Department of Economics and Business Economics Dubrovnik, University of
Dubrovnik. Correspondence concerning this article should be addressed to Iris Mihajlović, Ph.D., University of Dubrovnik, Department of
Economics and Business Economics Dubrovnik, Lapadska obala 7, 20000 Dubrovnik, Croatia. E-mail: [email protected].
D DAVID PUBLISHING

COMPETITIVENESS OF TRAVEL AGENCIES IN THE EUROPEAN TOURISM MARKET
279
natural environment. Based on these criteria, it is possible to establish a system of indicators of market
competitiveness on an intermediary which should integrate the specific features of the company competes,
destinations, products and in the manner of speaking—the macro-destinations or sector, but also indicators of
competitiveness which determine competitive position. In the context of monitoring competitiveness in tourism
through competitive destinations and through the specificities of tourist products, it is partly contained the answer
to the question why the analysis is not so often based on the competitiveness of tourism in a country.
Literature Review
Competitiveness is defined as the ability of long-term sustainable market participation under the market
economy conditions that ensures unobstructed assumptions of competition among producers (Porter, 1979,
pp. 137-145). Croatian Language Dictionary defines the competition as tender to achieve better performance
and competitiveness as the “successfully handling” with the competition (Anić, 2003). The Organization for
Economic Cooperation and Development (OECD) defined the competitiveness as a measure, by which the
country, under the conditions of free market, can produce goods and services that meet the test of international
markets while increasing the real income of the population in the long term (OECD, 2011).
From the above definitions, it is obvious that both in theory and practice, there are differences in defining
the competitiveness of countries and the competitiveness of enterprises. In World Competitiveness Yearbook,
competitiveness is defined as the ability of entrepreneurs to design, produce, and put into the market those
products and services whose performance qualities are more attractive set of benefits than those offered by
competitors (Garelli, 2011), and the competitiveness of the country, as the ability of generating more
proportional riches than its competitors in world markets and this presence combination of resources and
processes, whereby resources can be inherited or newly-created, until the processes transform resources into
economic outcomes (Garelli, 2011). According to different definitions of the above, the determination of
competitiveness and standards are defined differently for different objects (i.e., entrepreneurs, states, and
sectors), as well as for different levels of competitive coverage (regional, national, or international level), and
independence which performance indicators of economic business activity competitiveness are reported.
Research of Competitiveness of Intermediation in the European Tourism Market
Competitiveness of tourist market intermediation has been in the focus of interest of numerous international
organizations. Thus, the World Travel & Tourism Council (WTTC) supports the openness of the markets and also
boosts competitiveness in tourism (WTTC, 2003) following the competitiveness on the market including the
intermediation through “Tourism Competitiveness Monitor” from the year 2000 to 2007. World Economic Forum
(WEF) monitors the competitiveness on the market of tourism mediation through the publication of “The Travel
& Tourism Competitiveness Report” that in an issue for the year 2011 includes the detailed information on 70
indicators in 139 countries (Blanke & Chiesa, 2011). The World Center of Excellence for Tourism Destinations
(CED) is an international non-profit organization established by the World Tourism Organization (UNWTO) in
Montreal (Canada), with the main aim of developing competitive abilities in the destination. The analysis of
market competitiveness of tourist intermediation could be applied to subjects of tourist intermediation (e.g., travel
agencies, tour operators) related to other tourist subjects (e.g., hotels) as well as for different levels of coverage
competitiveness (regional, national, or international level) (CED, 2013). It is necessary to define which economic
performances are used to show the competitiveness of business for certain subjects and the levels that include

COMPETITIVENESS OF TRAVEL AGENCIES IN THE EUROPEAN TOURISM MARKET
280
competitiveness. Travel agencies and subjects of intermediation are also exposed to the competition and as such
entities they have been extensively studied. The results of the research on the competitiveness of travel agencies in
Hong Kong, which have been conducted by Wong and Kwan (2001, pp. 293-303), show that the increasing
competitiveness can be achieved using different strategies, such as price competitiveness, enhance cooperation
with business partners, and augment the efficiency of distribution channels.
Data and Methodology
Special contribution to the study of competitiveness is contained in the analysis of the existing situation of
intermediation in the European tourism market. This research is based on using the data of descriptive statistics
and the secondary research, using comparison method, which gives insights into the business of travel agencies
in selected European countries in 2010. Research of sources of competitiveness in the internal environment of
company is stated in the foundation based on using the data such as number of employees, annual personnel
costs, and the average annual cost per person employed in travel agencies in some European countries. The
purpose of mentioned indicators indicates the scope of competitiveness of performances in some business
segments. The changes in the environment and the competition initiate a need for an analysis of the internal
environment, travel agencies’ tasks, and their organizational structure.
Structural Changes and the Contribution on Analysis of Developmental Possibilities of the Intermediaries
in the European Tourism Market
The European Union gathers information on activities of travel agencies within Eurostat database. By the
NACE Rev. 21 classifications, the travel agency business activity belongs to section N, which indicates the
administrative and support services, and has a code N 79.11—Travel agencies (Engl. Travel agency activities).
Eurostat structural business statistics describe the structure, main characteristics, and performances of economic
activities in the European Union, elaborated in detail in several hundreds of sectors. Structural business
statistics measure the economy by observing units engaged in the economic activity, i.e., companies. Table 1
shows the basic data on the operations of travel agencies in selected European countries in 2010.
Based on the number of travel agencies, developed tourist countries characterized by a large number of
people, such as Germany and the United Kingdom and some receptive tourist countries, leaders in the world
tourism, such as France and some Mediterranean countries (i.e., Spain and Italy) stand out.
Here the travel agency means the organizational unit that provides tourist intermediation (NACE Rev. 2 of
79.11) and benefits along with a certain degree of autonomy in decision-making, especially in the allocation of
their own resources. This may be a sole legal unit that performs one or more activities at one or more locations.
Figure 1 shows the number of travel agencies in the European countries in 2010. Total revenue includes
accrued income from sales of products, goods, and services to the third parties, without Value Added Tax
(VAT) to be deducted. Following items included: (1) all duties and taxes on the goods or services invoiced by
the enterprise with the exception of the VAT calculated per unit vis-à-vis its customer and other similar
deductible taxes directly linked to turnover; and (2) all other charges (transport, packaging, etc.) passed on to
the customer, even if the costs are listed separately on the invoice. From this calculating it will be also excluded:
(1) income classified as other operating income, financial income, and supplementary income in company
accounts; and (2) operating subsidies received by public authorities or the institutions of the European Union.
1 The EU introduced the statistical classification of economic activities NACE Rev. 2. Its application started on January 1st, 2008. The classification was published in the Commission Regulation of the European EU called Regulation (EC) No. 1893/2006.

COMPETITIVENESS OF TRAVEL AGENCIES IN THE EUROPEAN TOURISM MARKET
281
According to the level of the total revenues of travel agencies, by far the most notable are the UK and Spain.
Countries in which travel agencies generate revenue in excess of one billion EUR are Austria, Germany,
Denmark, Italy, Netherlands, Norway, Portugal, and Sweden.
Table 1
Basic Data on the Operations of Travel Agencies in Selected European Countries in 2010 Country Number of travel agencies2 Total revenue (mil Euros)
Austria 904.0 3,425.3
Bulgaria 360.0 38.6
Cyprus 388.0 130.8
Germany 6,930.0 4,003.7
Denmark 164.0 1,060.4
Estonia 135.0 110.3
Spain 7,638.0 14,556.4
Finland 214.0 553.6
Croatia 1,621.0 508.6
Hungary 363.0 144.3
Italy 5,825.0 4,949.7
Letonia 342.0 276.1
Luxembourg 63.0
Latvia 370.0 161.8
Netherlands 1,388.0 2,107.7
Norway 386.0 2,549.3
Poland 1,684.0 375.0
Portugal 1,269.0 2,517.6
Romania 2,291.0 614.7
Sweden 843.0 2,225.6
Slovenia 268.0 174.1
Slovakia 160.0 60.2
United Kingdom 4,210.0 30,471.8
Note. Source: Prepared by the author according to the Eurostat, annual detailed enterprise statistics for services (NACE Rev. 2 HN and S95).
Table 2 shows the number of employees in travel agencies by countries in 2010, the number of persons
employed per agency, the annual expenses of employees in millions of Euros, and the average annual expenses
per employees in thousands of euros.
Within the context of structural business statistics, an employee3 is a person who works for an employer
2 According to the definition of the European Union, structural business statistics include all persons (including all organizations and business) registered for the activity of the statistical business register number of travel agencies covers (EU code 1110) number of legal and natural persons registered in the statistical business register that were active at least in some part of the reporting period. 3 An employee of the individual business unit receives a salary from the unit regardless of where the work is performed (even from a distant location). Worker from employment agency temporarily employed is considered to be an employee of the agency, and not of the business unit to which (he or she) is assigned. The following categories are also considered employees: (1) Paid work of the owner; (2) Students that formally contribute to the production unit in exchange for a fee and/or educational services; (3) Employees who work under the contract that is specially created to stimulate hiring of unemployed person; (4) Household workers—if there is an explicit agreement that persons receive a payment based on the work at home and if it is included in the salary. Those working part-time, seasonal workers, persons on strike or on the short-term leave are considered employees while volunteers or persons on long-term leave are not counted as employees.

COMPETITIVENESS OF TRAVEL AGENCIES IN THE EUROPEAN TOURISM MARKET
282
under a contract of employment and receives compensation in the form of salaries, wages, severances pay, or
compensations in kind. A contract is an agreement between the company (employer) and the person (employee)
that can be formal or informal, voluntarily signed by both parties, whereby the person working for a company as
compensation gains money or in-kind benefits. Based on the number of employees, the countries with the highest
total revenue and the largest number of travel agencies such as the UK, Germany, Netherlands, Spain, and Italy
stand out. The number of employees per agency is also calculated, but there is no correlation between this
indicator and other indicators. Figure 2 shows the number of employees per travel agency in European countries.
Figure 1. Number of travel agencies in European countries in 2010. Source: Prepared by the author according to the Eurostat, annual detailed enterprise statistics for services (NACE Rev. 2 HN and S95).
Figure 2. Number of employees per travel agency in European countries in 2010. Source: Prepared by the author
according to the Eurostat, annual detailed enterprise statistics for services (NACE Rev. 2 HN and S95).
Expenses per employ can be defined as the total remuneration, in cash or in kind, payable by an employer to
an employee (regular and temporary employees, as well as domestic workers) in return for the work done in the
reference period. According to the expenses per employee, the UK, Germany, Netherlands, Spain, and Italy stand
out. Figure 3 shows the average annual expenses per travel agency employee in the European countries in 2010.
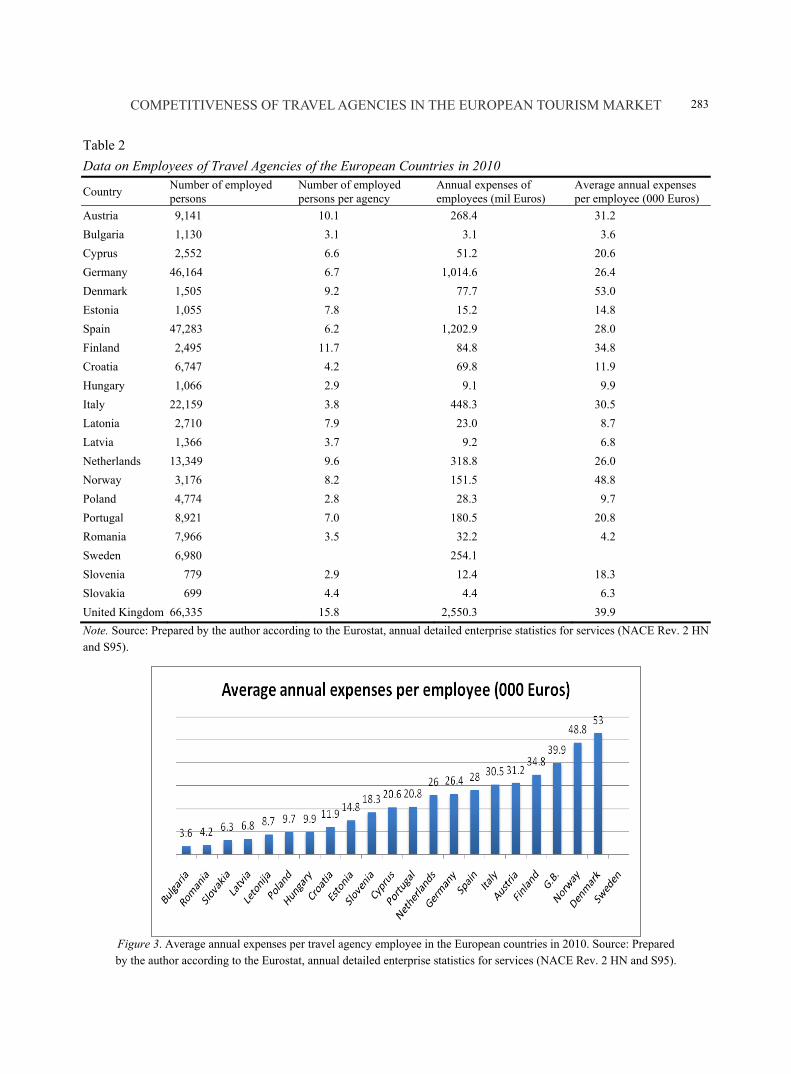
COMPETITIVENESS OF TRAVEL AGENCIES IN THE EUROPEAN TOURISM MARKET
283
Table 2
Data on Employees of Travel Agencies of the European Countries in 2010
Country Number of employed persons
Number of employed persons per agency
Annual expenses of employees (mil Euros)
Average annual expenses per employee (000 Euros)
Austria 9,141 10.1 268.4 31.2
Bulgaria 1,130 3.1 3.1 3.6
Cyprus 2,552 6.6 51.2 20.6
Germany 46,164 6.7 1,014.6 26.4
Denmark 1,505 9.2 77.7 53.0
Estonia 1,055 7.8 15.2 14.8
Spain 47,283 6.2 1,202.9 28.0
Finland 2,495 11.7 84.8 34.8
Croatia 6,747 4.2 69.8 11.9
Hungary 1,066 2.9 9.1 9.9
Italy 22,159 3.8 448.3 30.5
Latonia 2,710 7.9 23.0 8.7
Latvia 1,366 3.7 9.2 6.8
Netherlands 13,349 9.6 318.8 26.0
Norway 3,176 8.2 151.5 48.8
Poland 4,774 2.8 28.3 9.7
Portugal 8,921 7.0 180.5 20.8
Romania 7,966 3.5 32.2 4.2
Sweden 6,980 254.1
Slovenia 779 2.9 12.4 18.3
Slovakia 699 4.4 4.4 6.3
United Kingdom 66,335 15.8 2,550.3 39.9
Note. Source: Prepared by the author according to the Eurostat, annual detailed enterprise statistics for services (NACE Rev. 2 HN and S95).
Figure 3. Average annual expenses per travel agency employee in the European countries in 2010. Source: Prepared by the author according to the Eurostat, annual detailed enterprise statistics for services (NACE Rev. 2 HN and S95).

COMPETITIVENESS OF TRAVEL AGENCIES IN THE EUROPEAN TOURISM MARKET
284
Table 3
The Most Important Challenges on the Operations of Travel Agencies
The challenges travel agencies face in their business Number of response Structure (%)
Increased competition 297 53.90
Administrative and regulatory burden 233 42.30
Taxes 232 42.10
Access to finance 155 28.10
Access to international markets 88 16
Lack of skills 64 11.60
Other 55 10
Environmental challenges 42 7.60
Access to information and know-how 40 7.30
Note. Source: Response statistics for “SME panel questionnaire on tourism sector”. Retrieved from http://ec.europa.eu/enterprise/sectors/tourism.
The presented data relating to the business of travel agencies within the EU indicate that there are strong
differences in the number of travel agencies, their size in terms of number of employees and total revenue, as
well as the expenses per employee. Mentioned differences directly influence the competitiveness of travel
agencies, which come out from the ability to achieve market success of travel agencies and the competitiveness
of tourism of each country.
The Possibilities of the Travel Agencies Positioning in the Terms of Competitive Environment
In conditions determined by changes in the internal and external environment, in order to analyze
possibilities to achieve competitive ability, in the first quarter of 2009, the research was conducted on the
sample of 500 travel agencies in 20 European countries. The results of this research show that the increased
competition, i.e., a competition to achieve better results, is the most important “challenge” in business among
the travel agencies.
However, the key to achieving competitiveness lies in three factors (see Table 4). According to travel
agencies’ managers, the most important factors in demand for their services are quality of service, price, and
value for money.
Increasing the quality of service is the prerequisite to raise the level of competitiveness in the international
tourism market and it is one of the main determinants for the establishment of strategic development plans in
tourism. As some authors point out, the trend of overcoming low-cost strategy and directing it towards the
policy of high value goes in this direction as well, thus improving the quality of tourism services. On the other
hand, this strategy implies high investments, whose economic viability is questionable due to seasonality and
the average lower level of capacity utilization.
According to the “Study on the Competitiveness of the EU Tourism Industry”, it is expected that Europe
will maintain its position as a leading tourist destination in the next decade, although it could lose some of its
market share. Tourism is according to the authors of the study “highly fragmented value chain”, which consists
of large tour operators, hotel chains, and airlines, as well as small businesses that are also an integral part of the
offer, where public and private institutions are often closely associated in providing quality services at the
destination (European Commission, 2013). Trends that are placed before travel agents and subjects in tourist
destinations are globalization, demographic change, easier access to information, more sophisticated customer
requirements, sustainability, increased need for health, and wellness tourism with an increasing number of

COMPETITIVENESS OF TRAVEL AGENCIES IN THE EUROPEAN TOURISM MARKET
285
business models with minimal costs resulting in superior price competitiveness. Fight for survival in the global
tourism market is fierce, and the creation of value becomes a critical success factor of travel agencies, service
providers in the destination, as well as the destination itself.
Table 4
Key Factors in the Demand for Services of Travel Agencies
Demand factor Modality Answer Structure (%)
Service quality
Very important 381 69.1
Important 153 27.8
Less important 17 3.1
Price
Very important 358 65
Important 174 31.6
Less important 19 3.4
Value for money
Very important 328 59.5
Important 187 33.9
Less important 36 6.5
Environmental issues
Very important 60 10.9
Important 231 41.9
Less important 260 47.2
Social issues
Very important 55 10
Important 214 38.8
Less important 282 51.2
Security issues
Very important 99 18
Important 176 31.9
Less important 276 50.1
Note. Source: Response statistics for “SME panel questionnaire on tourism sector”. Retrieved from http://ec.europa.eu/enterprise/sectors/tourism.
Conclusions
Quality restructuring of the tourism supply is under pressure of travel agencies which are in today’s terms
of fierce competition forced to offer not only quality and innovative service of their products (packages) but of
other service providers (tourist subjects in the destination). They must guarantee the quality of service by
bringing tourists into a relationship with the service providers which are ready to meet their specific
requirements. This has always been a major test for the concept of mediating and organizational functions of
travel agencies who base their business, to a greater or lesser extent, on such activities. Today it initiates need
for an analysis of the internal environment, travel agencies’ tasks, and their organizational structure. Flexibility
that opens up the possibility of new products is promoted in the external environment through the creation of
conditions for the possibility of new business partnerships, and integration with the same type of businesses
that offer the same services, or partners who offer their own, often complementary services that complement
the value of the tourist product. New trends are focused on demands for quality and more specific, innovated,
and integrated tourism products. Research results suggest that specialization based on the following factors is
extremely important in the further development of tourism agencies: (1) the quality factors as a reflection of
specific preferences directed to the product; and (2) proportional value of services and prices as incentive of
satisfaction of tourists, which also represents a way of increasing their competitiveness.

COMPETITIVENESS OF TRAVEL AGENCIES IN THE EUROPEAN TOURISM MARKET
286
References Anić, V. (2003). Veliki rječnik hrvatskog jezika. Zagreb: Novi Liber. Blanke, J., & Chiesa, T. (2011). The travel and tourism competitiveness report. Retrieved from
http://www3.weforum.org/docs/wef_traveltourismcompetitiveness_report_2011.pdf Committee for Economic Development (CED). (2013). Centre mondial d’excellence des destinations, system of measures for
excellence in destinations (SMED). Retrieved from http://www.ced.travel/en/our-services/service.html European Commission. (2009). Study on the competitiveness of the EU tourism industry. Retrieved from
http://ec.europa.eu/enterprise/newsroom/cf/itemlongdetail.cfm?lang=en&item_id=3702 European Commission. (2013). Enterprise and industry. Retrieved from http://ec.europa.eu/enterprise/sectors/tourism Garelli, S. (2011). World competitiveness yearbook, Laussane, world competitevenss center. Retrieved from
http://www.imd.org/research/publications/wcy/index.cfm OECD. (2011). Competitiveness—Glossary of statistical terms. Retrieved from http://stats.oecd.org/glossary/detail.asp?id=399 Porter, M. E. (1979). How competitive forces shape strategy. Harvard Business Review, 57(2), 137-145. Wong, K. F., & Kwan, C. (2001). An analysis of the competitive strategies of hotels and travel agents in Hong Kong and
Singapore. International Journal of Contemporary Hospitality Management, 13(6), 293-303. WTTC. (2003). Tourism competitiveness monitor. Retrieved from
http://www.wttc.org/eng/tourism_news/press_releases/press_releases_2003/latest_statistics/

Chinese Business Review, ISSN 1537-1506 April 2013, Vol. 12, No. 4, 287-297
Compassion in Buddhism and Guanxi: Can There Be a
Synergy for Western Companies in China
Tashi Gelek
BSL (Business School Lausanne), Lausanne, Switzerland
Phonak Communications AG, Murten, Switzerland
Gration David
BSL (Business School Lausanne), Lausanne, Switzerland
Compassion is one of the core fundamental elements of Buddhism. The compassionate virtues are the precious
qualities essential in the practice of Buddhism. On the other hand, guanxi plays a dominant role in any successful
business venture in Chinese market. This paper develops the understanding of the two ancient bodies of knowledge
of Buddhism and Confucianism. The attempt will be made in this paper to understand the deeper meaning of
compassion in Buddhism in terms of compassionate virtues such as generosity, discipline, patience, diligence,
humility, and wisdom. In guanxi, it will delve into different aspects of guanxi in terms of its background, meaning,
significance, different types, intermediary, comparison with networking and ethics and success factors. This paper
is based on the literature review on compassion—guanxi. The compassion literature focuses on books on Buddhism
and commentaries by great Tibetan Buddhist sages. The guanxi literatures are predominately based on business
research papers related to guanxi and business culture in China. The paper provides deeper meaning of compassion
in Buddhism. The application of compassion to manage guanxi in China is the topic of this paper. This research is
about optimizing the art of guanxi through the application of compassion which will help many non-Chinese
business managers to effectively manage it. This paper is considered the first of its kind to study compassion in
Buddhism and guanxi practice in China and seeks to provide the necessary framework to conduct the further
research on applying compassion to build and manage better guanxi in China.
Keywords: guanxi, Buddhism, compassion, Chinese business culture, China business strategy, Confucius
Introduction
Since the start of the global financial crisis in 2009, the world has been searching for growth in the
emerging markets of Brazil, Russia, India, China (BRIC) nations and for ancient wisdom. Amongst BRIC
nations, China has been the fastest growing economy in the past decades and treasures an ancient civilization
spanning over thousands of years.
There are plenty of articles on the practical wisdom for management of the Chinese classical traditions
including many valuable insights into the philosophical and the practical world of Confucianism in China.
Tashi Gelek, DBA candidate at BSL; Phonak Communications AG. Gration David, Ph.D., Department of MBA and DBA, BSL. Correspondence concerning this article should be addressed to Tashi Gelek, Im Dornacher 2, 8127 Forch, Switzerland. E-mail:
D DAVID PUBLISHING

COMPASSION IN BUDDHISM AND GUANXI
288
There is strong evidence to suggest that Confucianism still has great influence on leadership practices of
modern Chinese business executives (McDonald, 2011), and according to China’s political evolution could
well be more openly recognized in future and influenced business practices even more profound; and at least
not weaken in the foreseeable future. Chinese wisdom teaches holistic understanding with the valuable virtues
of farsightedness (Vermander, 2011, p. 701). The short-term profit of centric business approach often taken by
western companies will not produce desirable business success in China since it is a guanxi-based business
society and environment where long-term relationships with business partners and associates are of immense
value. Despite the rapid economic development in China, the concept of longstanding guanxi still has an
indelible positive impact on the success of businesses in China. The application of Chinese wisdom into current
business cases requires deep and clear understanding of Confucianism (Vermander, 2011).
When Confucianism was spreading across China, Buddhism was flourishing across the Indian
subcontinent about 2,500 years ago. The practice of compassion in Buddhism is one of the core ingredients for
attaining higher spiritual perfection. The virtues of generosity, discipline, patience, diligence, humility, and
wisdom are the key qualities to be cultivated.
Through this paper, the authors would like to investigate how compassionate virtues can help to build
successful guanxi in Chinese market. Porter (1996, p. 22) mentioned that the essence of a business strategy is to
perform activities differently than the competitors. Hopefully, the Buddhist compassion will provide a
differentiating factor in building successful guanxi to customers in the Chinese market. In the end, the
objectives of this paper are to find out what is already known and what needs to be further researched on
Buddhist compassion and guanxi in China.
Purpose
The purpose of this paper is to demonstrate the use of compassion to build successful guanxi with customers
in China to help the non-Chinese western companies operating in China to manage their customer guanxi
effectively. The non-Chinese companies in the west will not be able to achieve their expected financial results in
the absence of a well-managed guanxi network with customers in the Chinese market. They should understand
about Chinese culture and carefully handle guanxi in China (Yang, 2011, p. 165). In Eastern philosophies,
compassion is considered to be a virtue which is being applied more in the modern day corporate management
systems (Opdebeeck & Habisch, 2011). But, from the literature research, there has been no research conducted on
compassionate virtues of Buddhism for building successful guanxi with customers in context to Chinese market.
Research Questions
The research questions that are intended to be answered are:
What does compassion mean in Buddhism?
Is guanxi really so different from western business practices?
How and why western businesses in the Chinese market should use compassion as a strategic tool for
building and managing guanxi with customers in China to achieve long-term business success?
What do Chinese companies do better than western in managing guanxi, and what are the lessons to be
learned and applied from the Chinese companies?
Through this paper, the authors will find out which of these questions can be answered, and which of them
to be further investigated through future research, which will contribute to the content for the next paper after

COMPASSION IN BUDDHISM AND GUANXI
289
the research is completed and conclusions are drawn.
Personal Position
Position 1
Based on the decade-long business experiences in Chinese market, the author (Tashi Gelek) has observed
that there are many non-Chinese Western MNCs still not able to establish successful guanxi with customers in
China which still making critical blunders when it comes to guanxi resulting in unsuccessful business ventures
in China.
Position 2
This research will be focused on China business in general and challenges faced by non-Chinese Western
companies when dealing with the variable factor of guanxi in China.
Position 3
The research on compassion and guanxi is intended to find possible solutions to challenges arising from
guanxi faced by non-Chinese Western companies in China.
Buddhist Belief
As a Buddhist, one should be ready to accept the four truths. The first truth, all things are impermanent;
the second truth, all emotions are pain; the third truth, all things have no inherent existence; and the final truth,
nirvana (enlightenment) is beyond concepts (Khyentse, 2007, p. 3). Also there is nothing permanent to clasp
forever. After Siddhartha (Buddha) discovered the concept of impermanence, Buddhists believe that self does
not exist independently and believing in its existence is ignorance (Khyentse, 2007, p. 46). As such, the practice
of perfect compassion is vital to the true understanding of emptiness (Padmakara Translation Group, 2006, p. 3).
The emptiness are presented in the form of non-existence. In addition, the concept of karma is the core concept
in Buddhism. Karma means accepting the consequences of all actions (Dalai Lama, 2012, p. 15). It is a law of
cause and effect, nothing bad or good karma (Khyentse, 2007, p. 76). Finally, Buddha said all of us can be free
and become an enlightened being (Padmakara Translation Group, 2006, p. 9). The state of nirvana
(enlightenment) is the ultimate goal of practicing Buddhism.
Compassion in Buddhism
In Confucianism, ren (compassion) is the essence, the source of morality, and humanity for fellow human
beings in social relationships (Ip, 2011, pp. 686-687). On many occasions, Confucius mentioned about
compassion. In Confucius Analects 12.2, Confucius stated that one should not do to others what you would not
wish to be done to yourself (Liu & Yang, 2009, p. 164).
In Buddhism, compassion has a much broader connotation. Not only limited to take cognizance of the
sufferings of others but also ask for proactive actions to expel those sufferings. Compassion is the root of
Dharma (Buddhism) (Larson, 2007, p. 34). It is one of the main teachings of Buddhism. Compassion is the
most wonderful and precious gift for people (Dalai Lama, 1998, p. 58). The core essence of compassion is to
alleviate all the sufferings of others through proactive actions.
Compassionate Virtues in Buddhism
Generosity. Generosity is the expression of an altruistic mind devoid of attachment (Padmakara
Translation Group, 2007, p. 151). The first action encouraged is the practice of generosity through the

COMPASSION IN BUDDHISM AND GUANXI
290
realization of non-existence of self and impermanence of all things and without any attachment (Khyentse,
2007, p. 112). The virtue of generosity is in giving to others, irrespective of the amount and with pure intention,
without hoping anything in return (Padmakara Translation Group, 1998, p. 234). There are four types of giving
in the classical Buddhist texts: first, the giving of materials; second, giving of freedom from fear; third, giving
spiritual counsel; and fourth, giving of love (Dalai Lama, 2012, p. 150).
Discipline. The objective of discipline is to have a peaceful, self-controlled, and an altruistic mind
(Padmakara Translation Group, 2009, p. 141). The discipline provides the necessary foundation for cultivating
positive qualities. It consists of three types of discipline: discipline to give up all harmful actions; discipline to
engage in positive actions; and discipline to benefit others (Padmakara Translation Group, 1998, p. 238;
Padmakara Translation Group, 2009, p. 140). The ultimate goal is to increase the positive actions in order to
benefit others.
Patience. The compassionate virtue of patience requires a great deal of forbearance and endurance which
are categorized into three types. Patiently to bear any harm without anger, patience to endure any hardships to
purify negative karma without sadness, and patience to face the profound meaning of Dharma that all
phenomena is empty in nature (Padmakara Translation Group, 2009, pp. 141-142).
Diligence. The compassionate virtue of diligence is the active efforts to conduct positive actions without
any expectation. The first type of diligence is to build up a strong determination to implement positive deeds
without succumbing to any kinds of negativity; the second type of diligence is to implement all the positive
activities through study, reflection, and meditation without any discouragement; and the final type of diligence
is to engage in positive actions through thoughts, words, or deeds without self-satisfaction (Padmakara
Translation Group, 2009, p. 145).
Humility. The compassionate virtue of humility is being thoroughly practiced upon a compassionate mind.
Love and compassion as the basis for practicing humility by being humble with others, dress modestly, and treat
everyone with respect (Padmakara Translation Group, 1998, p. 241). Buddhists believe in never falling prey to the
negative quality of pride which leads to arrogance and conceit (Padmakara Translation Group, 2006, p. 105).
Wisdom. The compassionate virtue of wisdom is the ultimate knowledge of realizing the situation without
a self, self-centered consciousness, and ego (Trungpa, 2010, p. 79). Wisdom has three aspects of realization:
first, wisdom acquired by studying the scriptures from a qualified teacher; second, wisdom acquired through
the reflections on the meanings of the teachings; finally, wisdom from meditation on compassion (Padmakara
Translation Group, 2009, pp. 152-154).
Conclusions on Compassion in Buddhism
In Buddhism, the practice of compassion is vital for the understanding of the teachings of Buddha. It goes
beyond the mere realization of the pain and sufferings of others and requires to engage in proactive deeds to
dispel them. Compassion is one of the key teachings in Buddhism. The compassionate virtues (generosity,
discipline, patience, diligence, humility, and wisdom) in Buddhism help to build generosity in giving to others
without any expectations through a disciplined altruistic mind of positive actions to benefit others with
complete patience to endure the sufferings of others with great diligence, humility, and wisdom.
Guanxi in China
Background of Guanxi
Confucius has deep and broad influence on the Chinese society from the ancient times till the present.

COMPASSION IN BUDDHISM AND GUANXI
291
Since the 17th National Congress of the Communist Party of China in 2007, President Hu Jintao and the
Chinese government have been promoting the Confucian concept of harmonious society (McDonald, 2011, p.
636; Thompson, 2011, p. 711). For the Chinese society, Confucianism provided moral guidelines in both
private and public lives (Wong, Shaw, & Ng, 2010, p. 1109).
Guanxi became significant in the Chinese society because of Confucianism (Yeung & Tung, 1996, p. 58).
In this system, family is the main foundation of social structure and harmonious social relations are maintained
(Hofstede & Bond, 1988, p. 8; Thompson, 2011, p. 711). Guanxi is built on trust and respect starting from
family (Zhao & Roper, 2011, p. 743). As per Confucianism, a person has a basic interest to invest in guanxi in a
relation-oriented Chinese society (Chen, 2004, p. 47).
In fact, Confucius emphasized on the importance of relationships in a society and to play by their roles and
obligations based on the five fundamental cardinal relations between emperor-subjects, father-son,
husband-wife, brother-brother, and friend-friend (Chen, 2004, pp. 47-48; Ho & Redfern, 2010, p. 208). In the
social relationship structure, strong Confucian values were obedience and deference to one’s superiors (Graham
& Lam, 2003, p. 87); and the hierarchy is defined by the codification of interpersonal ties in Confucianism (Yi
& Ellis, 2000).
During the period of the Cultural Revolution in China and the absence of a transparent legal system, the
Chinese started to engage in the widespread guanxi network to secure their daily survival through connections
(Guthrie, 1998, p. 257). Till today, the significance of guanxi in China arises due to the opaque legal system.
The foreign investors are frustrated and have to battle the lengthy negotiations, bureaucracy, and institutional
ambivalence (Yi & Ellis, 2000, p. 25). With the right guanxi, these governmental procedures become easier and
faster.
Meaning of Guanxi
The concept of guanxi is deeply-rooted in Confucianism and emphasizes the reciprocal human relationship.
In Confucian classic, the word “guanxi” is represented by lun which pertains to human relationship and lays great
importance on the wu lun (five cardinal relationships) (Ip, 2011, p. 688; X. P. Chen, & C. C. Chen, p. 307).
In simple terms, guanxi in China means interpersonal relationships or connections. But it means more than
just a connection. Guanxi is a friendship with implications of a continuous exchange of favors (Alston, 1989, p.
28; Yang, 2011, p. 164). It represents a personal level relationship based on reciprocity, a bilateral mutually
beneficial flow of personal or social transactions (Yeung & Tung, 1996, p. 55; Leung, Y. H. Wong, & S. Wong,
1996, p. 749).
Stretching over generations, guanxi also refers to long-term relationships on giving and receiving favors
(Gallo, 2008, p. 52). Exchange of favors is more utilitarian than emotional (Chen, 2004, p. 45). To summarize,
Buderi and Huang (2006, pp. 6-7) nicely defined the meaning of guanxi as a delicate art of building and
nurturing mutually beneficial relationships in China which is vital for any business success and spanning over a
long period of time based on the four principles of trust (respect and knowledge of others), favor (loyalty and
obligation), dependence (harmony and reciprocity, mutual benefit), and adaptation (patience and cultivation).
Significance of Guanxi
There are two schools of thoughts on the significance of guanxi in China. The one school believes in
diminishing influence of guanxi with the economic prosperity of China and the westernized style of the rule of
law. The other school believes in guanxi to continue to play a vital role in China despite the economic growth

COMPASSION IN BUDDHISM AND GUANXI
292
and the establishment of the rule of law.
With modernization of China, the role of guanxi is fading but remains to be an important social force
(Graham & Lam, 2003, p. 86). Guthrie (1998) in his study defended the declining role of guanxi in urban
industrial economies during the process of economic transition to modernization and emergence of the legal
system. Nonetheless, guanxi continues to play a crucial role irrespective of Chinese government and institutions
(Dunfee & Warren, 2001, p. 193).
For example, Hong Kong, South Korea, and Japan are advanced economies and Confucian-based societies
with high level of modernization and transparent legal system. In these countries, relationships or connections
continue to play an important role when doing business there (Tung & Worm, 2001, p. 524). Advanced
economy and independent legal system have not delimited the influence of guanxi in these economies. In
another instance, in terms of the legal system, as witnessed from the high-profile legal proceedings of British
businessman Neil Heywood murder case, legal experts believe how little China’s criminal justice system has
evolved (Page, 2012). A free and transparent legal system in China still has a long way to be realized.
Therefore, guanxi may well continue to play an important factor for the foreseeable future when it comes to
doing business in China (Brennan & Wilson, 2008, pp. 9-11; Chen, 2004).
In China, who you know is more important than what you know because guanxi is a valuable social
resource (Tung & Worm, 2001, pp. 518-521). It is important for MNCs to have good guanxi with different
levels of the Chinese government because it will continue to dictate all the terms and conditions in the
commercial and legal frameworks for many years to come (Garten, 1998, p. 173). As a result, non-Chinese
MNCs are advised to carefully handle guanxi in China (Yang, 2011, p. 165). Those companies with good
understanding of guanxi are generally more successful (Brennan & Wilson, 2008, p. 1). In conclusion, it can be
concluded that strong guanxi with the right persons is crucial to be nurtured overtime to achieve long-term
success in China (Yeung & Tung, 1996, p. 61; Yang, 2011, p. 167). Despite the competitive market forces,
guanxi is so pervasive and deep-rooted cultural phenomenon that it will continue to be a crucial factor in China
(Tung & Worm, 2001, p. 524).
Types of Guanxi
Guanxi can be categorized into blood-based and social-based guanxi: Blood-based guanxi includes family
members, relatives, and members of the same clan, and social-based guanxi includes those arising from social
interactions at school, the workplace, or the locality (Tsang, 1998, p. 65; Han & Altman, 2009, p. 92). X. P.
Chen and C. C. Chen (2004, p. 308) summarized guanxi into three categories: family (kinship), familiar person
(e.g., former classmates and colleagues), and strangers (with or without common demographic attributes).
Su and Littlefield (2001, p. 202) summarized different types of guanxi as follows:
Jia-ren guanxi (family members): The game rule is obligated based on filial piety and fraternal duty, and
entry strategy through marriage;
Shou-ren guanxi (relatives, friends, neighbors, colleagues, classmates): The game rule is reciprocity and
code of brotherhood, and entry strategy through commitment, altruism, giving face, empathy, and intermediary;
Sheng-ren guanxi (acquaintances or strangers): The game rule is opportunism based on personal gain and
loss, and no entry strategy.
Intermediary
In China, intermediaries help to establish guanxi with unknown parties so that social guanxi can be

COMPASSION IN BUDDHISM AND GUANXI
293
transferred from one party to another (Tsang, 1998, p. 65). The massive guanxi webs make people become
strangers to each other. In such situations, the intermediaries become effective channels to introduce each other
(Su & Littlefield, 2001, p. 207). For non-Chinese firms, they may consider using intermediaries to acquire
guanxi network in China (Yeung & Tung, 1996, pp. 61-64). In one such example, without understanding of
Chinese business culture, a joint venture company in China was successful through active engagement of an
intermediary in the form of a Chinese consultant (Brennan & Wilson, 2008, p. 10). In the Chinese business
culture, it is a common practice to make use of intermediary to communicate frankly what they are unable to
say directly with each other (Graham & Lam, 2003, p. 87).
Guanxi Versus Networking
There are three key differences between guanxi and western style networking in the west: pervasiveness,
time orientation, and personal nature of relationships (Tung & Worm, 2001, p. 522). On the other hand, Yeung
and Tung (1996, p. 55) highlighted six differences between guanxi and networking: the motives for engaging in
social relations, reciprocation in social exchanges, time orientation, pattern of differentiation, the nature of
power, and sanction practice.
Tsang (1998, p. 67) found out in China that business relationships start from personal guanxi while
personal relationship may develop from business relationships in the west. In Confucian society, guanxi places
individual in a system of interdependent relationships in which each fulfills the responsibilities of a given role
while the primary driver in the west is self-interest (Yeung & Tung, 1996, p. 55). In Guanxi, it focuses on the
reciprocation of favors and role of obligations rather than pursuit of self-interest (Yi & Ellis, 2000, p. 25). The
favors are repaid in incremental value in guanxi while they are unequal reciprocity in social transactions in the
West (Yeung & Tung, 1996, p. 55). In addition, Yang (2011, p. 164) explained that network in the west is
impersonal, without social obligations and no exchange of favors since relationships are based on firm-to-firm
basis and not personal connections.
In terms of time orientation, guanxi is more long-term oriented than networks in the west. People involved
in guanxi-invested time and efforts to keep it alive. It is maintained and reinforced through continuous,
long-term association and interactions while the objectives of social transaction in the west are based on
isolated cases with emphasis on immediate gains (Yeung & Tung, 1996, p. 55). Consequently, the persons in
guanxi are more patient for future gains than people in the networks in the west (Yang, 2011, p. 164). In a
given context and time, personal power of individual defines what is permissible in a guanxi while society
abides by institutional laws in the west (Yeung & Tung, 1996, p. 56). As such, shame to lose face is the
primary deterrent against immoral or illegal behavior in a guanxi while the west operates primarily on the basis
of guilt (Yeung & Tung, 1996, p. 57).
Guanxi Versus Ethics
The teachings of Confucius are non-religious lessons in practical ethics (Hofstede & Bond, 1988, p. 7). In
the Analects 17.23, Kongzi (Confucius) stated that morality is considered supreme for the junzi (traditionally
translated as a gentleman but applies equally to both genders today of course) rather than courage (Liu & Yang,
2009, p. 263).
Using guanxi to achieve personal goals is highlighted as a potential unethical or corrupt practices by
Western observers (Salem, 2008, p. 63). The practise of guanxi in doing business in China has been viewed
with some ambivalence by westerners and equated with corruption (Ho & Redfern, 2010, p. 207). The

COMPASSION IN BUDDHISM AND GUANXI
294
zouhoumen (walking through the back door) is a popular and essential means of getting things done in China
through personal guanxi (Chen, 2004, p. 45).
As is well known that, the history of China has prompted corruption (as explained under the section of
“background of guanxi”) since guanxi is used to get favors (Fernandez & Underwood, 2009, p. 145). In
Chinese state-owned enterprises, the negative effect of guanxi breeds favoritism and unfair systems (Zhao &
Roper, 2011, p. 746). In general, in the absence of clear laws in China including the commercial laws, it creates
abundant room for different interpretations from regions to regions and opens easier avenues for corruptions,
which deteriorates in second- and third-tier cities.
As a result, the guanxi in China is often associated with corruption and bribery (Yang, 2011, p. 165), and
westerners equate guanxi to favoritism and nepotism (Yeung & Tung, 1996, pp. 54-57). Stuck in the
bureaucratic labyrinth, guanxi can help to cut short the proceedings. This makes some western businessmen
assume that bribing to establish guanxi is the fastest way forward which may help to get the first deal but not
ganqing (affection) required for long-term guanxi (Tsang, 1998, p. 66). On the other hand, there are risks
involved in the reciprocity of taking favors in guanxi when returning favors may turn out to be inconvenient,
unethical, or even illegal (Brennan & Wilson, 2008, p. 4). Indebted to a guanxi liability, it is difficult for a
business partner to reject poor quality products which are below the required quality standard (Tsang, 1998, p.
67). However, nowadays, the good quality product is a prerequisite condition for winning deals in China.
Despite all the allegations of equating guanxi to corruption, Guanxi is much more refined and complex
phenomenon. For example, Chinese invest in guanxi and exchange favors over a period time while favors in
corruption are exchanged instantaneously; in Chinese society, guanxi is legal while corruption is not (Tung &
Worm, 2001, p. 523). It must be noted that having guanxi with customers does not necessarily mean unethical
relationships. It is essential to inform the westerners what are the right ways to enter into proper guanxi,
otherwise, difficult to differentiate between guanxi and corruption (Su & Littlefield, 2001, p. 199). It is
important to understand the detailed dynamics of guanxi in order to make sure to keep the right limits from
trespassing into unethical domain.
Furthermore, it is recommended not to engage in any unethical practice as per the standards of the code of
conduct. As such, it is important to keep the right balance between guanxi and ethical code of conduct.
Confucius also emphasized on the virtue of honesty and sincerity (Rainey, 2010, p. 30). In this aspect, it is vital
for companies to educate the employees about the limits and risks attached in the art of guanxi. In the study by
Ho and Redfern (2010) with Chinese managers in Hong Kong, it was concluded that there was the need for
managers to facilitate moral development of employees to address guanxi-related unethical practice in the
workplace.
Success Factors of Guanxi
The study by Yeung and Tung (1996, p. 59) showed that guanxi was chosen consistently as a key success
factor for doing business in China. For instance, Microsoft builds close and strong guanxi with high
government officials to solve many difficult problems (Buderi & Huang, 2006, pp. 126-129).
Fernandez and Underwood (2009, pp. 18-19) gave two pieces of advice when starting a business in China:
first to establish good guanxi with local government, and second to combine politeness, respect, humility, and
perseverance when dealing with them. You can witness the concrete positive outcome of the advice in China
when comparing the greater success of companies like Coke over Pepsi, Kodak over Fuji, Volkswagen over

COMPASSION IN BUDDHISM AND GUANXI
295
Toyota, KFC over McDonald—all due to their strong long-term guanxi based on sincerity with central and
local governments.
Conclusions of Guanxi
It can be concluded that guanxi is not an unethical act (Su & Littlefield, 2001). There are higher risks of
getting involved in unethical mismanagement in absence of proper knowledge of guanxi. Undoubtedly, guanxi
is a major success factor when comes to doing business in China. In the study of European companies operating
in China, Tung and Worm (2001, pp. 528-530) concluded that reluctance to mature guanxi and lack of
extensive use of intermediaries to establish guanxi are hindering factors for reaching greater success. Therefore,
guanxi is a must-have strategy to penetrate the Chinese market to fight against the cumbersome bureaucracy
(Yi & Ellis, 2000). The executives must manage it as another marketing variable (Leung et al., 1996).
In addition, there is a dire need to make sure that company’s gaunxi is well-managed and sustained in a
productive manner. The senior management is recommended to conduct guanxi audit with the outside
stakeholders including customers, suppliers, and government bodies (Tsang, 1998, p. 69). This can be done
through early involvement of the top management in the initial process of guanxi building and later by regular
visits to the stakeholders to investigate the status of the ongoing guanxi.
It is also advised that a company or individual may consider to make a cost-benefit analysis before
entering into any guanxi (Tsang, 1998, p. 67). One way of extracting sustainable competitive advantage from
valuable guanxi is by converting individual personal guanxi into interorganizational guanxi (Tsang, 1998, p.
69). To achieve this goal, the management of companies needs to consider to get involved in the guanxi
building process from the early stages.
There are skeptics who believe in the declining influence of guanxi in modern China as it develops legal
system and marches into a market economy. However, guanxi continues to play fundamental role in modern
and Confucian societies like Hong Kong, Singapore, and Taiwan (Chen, 2004, p. 55). From the examples of
Taiwan and Hong Kong, guanxi will continue to exert great significance when it comes to doing business in
China (Yang, 2011, p. 166). Yeung and Tung (1996, p. 64) had concluded that a well-established institutional
law system has not relegated the reliance on guanxi in more developed Confucian societies. The Confucian
values remain deeply-rooted in the social practices of Chinese organizations (Zhao & Roper, 2011). In the
foreseeable future, guanxi will continue to remain relevant in the business world of China.
Conclusions
The following conclusions can be drawn from this paper in relation to the research questions:
(1) The research question about the meaning of compassion in Buddhism is fully covered in this paper
under the section “compassion in Buddhism”. In a nutshell, compassion in Buddhism means to proactively take
actions to remove the sufferings of others through the practice of compassionate virtues (generosity, discipline,
patience, diligence, humility, and wisdom).
(2) The research question about whether guanxi is different from western business practices of networking
in the west has been researched in many studies comparing guanxi with networking. The findings can be
concluded that guanxi and networking are different in many aspects in terms of pervasiveness, time orientation,
personal nature of relationships, etc.. Furthermore, it was found that many western managers view guanxi to be
close to corruption. Many do equate guanxi with corruption or nepotism due to lack of deeper understanding of
the guanxi dynamics as explained under the section “meaning of guanxi”. It can be safely concluded that not all

COMPASSION IN BUDDHISM AND GUANXI
296
guanxi is corrupt or unethical, and there are ways to manage them in an ethical manner through education and
internal systems as explained under the section of “guanxi versus ethics”.
(3) The findings on the research question about compassion as a strategic tool for building and managing
guanxi is not covered in this paper. This will be one of the main research questions that will be further studied
in detail through further research in the Chinese market. This will be one of the main components of the authors’
future research.
(4) The findings on the research question about what do Chinese companies do better than western
counterparts in managing guanxi and lessons learnt is partly answered because Chinese companies by their
origin enjoy the benefit of established guanxi bases in China, whereas, the western companies need to establish
guanxi when entering the Chinese market. What do Chinese companies do better and what lessons are to be
learnt will be further studied through future research.
Further Research
It will be good to hear from readers, and the authors would be happy to receive and reply to suggestions,
reactions, criticisms, ideas, questions, and experience.
As the topic of Buddhist compassion to build and sustain guanxi in Chinese market is a new field of
research, the authors have come to realize that there are still some unanswered relevant questions needed to be
further research in the future:
(1) How and why companies operating in China need to use compassion as a strategic tool for building
and managing guanxi with customers in the Chinese market?
(2) The synergy of compassion and guanxi is relevant in all different regions of China?
(3) What do Chinese companies do better than western companies and lessons to be learnt and applied
when it comes to managing guanxi in China?
The next stage of research will be conducted on the above open research questions, and the findings of the
future research shall be shared in the next research article.
References Alston, J. P. (1989). Wa, Guanxi, and Inhwa: Managerial principles in Japan, China, and Korea. Business Horizons, 32(2), 26-31. Brennan, R., & Wilson, J. (2008). Understanding the importance of guanxi in UK-Chinese joint venture relationships.
Proceedings from 24th Annual Industrial Marketing and Purchasing Group (IMP) Conference (pp. 1-14). Uppsala, Sweden: Industrial Marketing and Purchasing Group.
Buderi, R., & Huang, T. G. (2006). Guanxi: Microsoft, China and Bill Gates’ plan to win the road ahead. London: Random House Business Books.
Chen, M. (2004). Asian management systems. London: Thomson Learning. Chen, X. P., & Chen, C. C. (2004). On the intricacies of the Chinese guanxi: A process model of guanxi development. Asia
Pacific Journal of Management, 21(3), 305-324. Dalai Lama. (1998). The power of compassion: A collection of lectures by his holiness the XIV Dalai Lama. New Delhi: Harper
Collins Publishers. Dalai Lama. (2012). Beyond religion: Ethics for a whole world. New Delhi: Harper Collins Publishers. Dunfee, T. W., & Warren, D. E. (2001). Is guanxi ethical? A normative analysis of doing business in China. Journal of Business
Ethics, 32(3), 191-204. Fernandez, J. A., & Underwood, L. (2009). China entrepreneur: Voices of experience from 40 international business pioneers.
Singapore: John Wiley & Sons (Asia). Gallo, F. T. (2008). Business leadership in China: How to blend western practices with Chinese wisdom. Singapore: John Wiley
& Sons (Asia). Garten, J. E. (1998). Opening the doors for business in China. Harvard Business Review, 76(3), 167-175.

COMPASSION IN BUDDHISM AND GUANXI
297
Graham, J. L., & Lam, N. M. (2003). The Chinese negotiation. Harvard Business Review, 81(10), 82-91. Guthrie, D. (1998). The declining significance of guanxi in China’s economic transition. The China Quarterly, 154, 254-282. Han, Y., & Altman, Y. (2009). Supervisor and subordinate guanxi: A grounded investigation in the People’s Republic of China.
Journal of Business Ethics, 88, 91-104. Ho, C., & Redfern, K. A. (2010). Consideration of the role of guanxi in the ethical judgement of Chinese manager. Journal of
Business Ethics, 96(2), 207-221. Hofstede, G., & Bond, M. H. (1988). The Confucius connection: From cultural roots to economic growth. Organizational
Dynamics, 16(4), 5-21. Ip, P. K. (2011). Practical wisdom of Confucian ethical leadership: A critical inquiry. Journal of Management Development,
30(7/8), 685-696. Khyentse, D. J. (2007). What makes you not a Buddhist. New Delhi: Timeless Books. Larson, Z. (2007). Chatral Rinpoche: Compassionate actions. New York: Snow Lion Publications. Leung, T. K. P., Wong, Y. H., & Wong, S. (1996). A study of Hong Kong businessmen’s perceptions of the role “guanxi” in the
People’s Republic of China. Journal of Business Ethics, 15(7), 749-758. Liu, D. C., & Yang, P. J. (2009). Confucius: The analects. Taipei: Linking Publishing Company. McDonald, P. (2011). Maoism versus Confucianism: Ideological influences on Chinese business leaders. Journal of Management
Development, 30(7/8), 632-646. Opdebeeck, H., & Habisch, A. (2011). Compassion: Chinese and western perspectives on practical wisdom in management.
Journal of Management Development, 30(7/8), 778-788. Padmakara Translation Group. (1998). The words of my perfect teacher by Patrul Rinpoche. Boston: Shambhala Publications. Padmakara Translation Group. (2006). The way of the Bodhisattva by Shantideva. Boston: Shambhala Publications. Padmakara Translation Group. (2007). The heart of compassion: The thirty-seven verses on the practice of a Bodhisattva by Dilgo
Khyentse. Boston: Shambhala Publications. Padmakara Translation Group. (2009). The heart of compassion: Instructions on Ngulchu Thongme’s thirty-seven fold practice of
Bodhisattva by Dilgo Khyentse Rinpoche. New Delhi: Shechen Publications. Page, J. (2012). China gives account of Brit’s murder. Retrieved from
http://online.wsj.com/article/SB10000872396390443537404577580873219563242.html?mod=djemalertNEWS Porter, M. E. (1996). What is strategy? Harvard Business Review, 74(6), 19-36. Rainey, L. D. (2010). Confucius & Confucianism: The essential. West Sussex: Wiley-Blackwell. Salen, R. (2008). Seeking a harmonious society: How Confucianism could enhance sustainable business practices in the 21st
century (Unpublished master’s thesis, University of Hawaii). Su, C., & Littlefield, J. E. (2001). Entering guanxi: A business ethical dilemma in mainland China? Journal of Business Ethics,
33(3), 199-210. Thompson, M. (2011). Chinese hedonic values and the Chinese classical virtues: Managing the tension. Journal of Management
Development, 30(7/8), 709-723. Trungpa, C. (2010). Meditation in action. Boston: Shambhala Publications. Tsang, E. K. (1998). Can guanxi be a source of sustained competitive advantage for doing business in China? Academy of
Management Executive, 12(2), 64-73. Tung, R. L., & Worm, V. (2001). Network capitalism: The role of human resources in penetrating the China market. International
Journal of Human Resource Management, 12(4), 517-534. Vermander, B. (2011). Chinese wisdom, management practices and the humanities. Journal of Management Development, 30(7/8),
697-708. Wong, A. L. Y., Shaw, G. H., & Ng, D. K. C. (2010). Taiwan Chinese managers’ personality: Is Confucian influence on the wane?
The International Journal of Human Resource Management, 21(7), 1108-1123. Yang, F. (2011). The importance of guanxi to multinational companies in China. Asian Social Science, 7(7), 163-168. Yeung, I. Y. M., & Tung, R. L. (1996). Achieving business success in Confucian societies: The importance of guanxi
(connections). Organizational Dynamics, 25(2), 54-65. Yi, L. M., & Ellis, P. (2000). Insider-outsider perspectives of guanxi. Business Horizons, 43(1), 25-30. Zhao, L., & Roper, J. (2011). A Confucian approach to well-being and social capital development. Journal of Management
Development, 30(7/8), 740-752.

Chinese Business Review, ISSN 1537-1506 April 2013, Vol. 12, No. 4, 298-304
The Driving Forces of CO2 Emission in China: 2002-2007*
Libo Yuan, Yinchuan Xu
Shanghai University of Financial Economics, Shanghai, China
Shanghai University of Engineering Science, Shanghai, China
This paper provides a computation on both the China’s aggregate CO2 emission volume and the emission of each
sector over the period of 2002-2007, based on the input-output analysis. Further analysis is also given on the
various determinants of the change in the emission volume, with the aid of structural decomposition analysis (SDA)
based on a residual-free method. Based on the input-output table of China in 2002 and 2007, the merge of sectors
and the adjustment of price change have been made during the study. The emissions of carbon dioxide in China
increased from 2,887.3 million ton to 5,664.6 million ton during 2002-2007. The average rate of increase is 13.3%,
faster than the average rate of gross domestic product (GDP) growth 11.6% slightly. According to the process of
SDA, the changes in emission are analyzed in terms of four different factors. Among the four factors studied in the
paper, it is found that the change of emission intensity and structure of demand are the main reason of the decrease
of emission, while production technology and scale effect increase the emission volume. The paper also finds that
although the direct emission intensity decreased during the study period, the total emission intensity increased with
the annual rate of 3.8%, which reflects the result of energy policy is not equal in different sectors.
Keywords: carbon emissions, input-output table, hybrid units, structural decomposition analysis, trading structure,
emission intensity
Introduction
A much debated issue over the last decade was the environment. For the consideration of global warming
and the challenge of environmental change, carbon cycling and carbon emission become an important issue
recently. How to stabilize the level of greenhouse gases (GHGs) led to increased research in the CO2 emission
in China.
Since the beginning of economic reform in 1979, China has experienced rapid economic growth. Her
gross domestic product (GDP) had increased by 9.9% annually over the year from 1979 to 2009. Despite the
great shock of the financial crisis of 2008, the growth rate of GDP in China is 10.7% annually over the year
2001 to 2009. On the other hand, along with the rapid economic growth of China, total energy consumption
increased from 1,518.0 Mtce in 2002 to 2,655.8 Mtce in 2007, with the annual growth rate of 11.8%. It is
estimated that in China energy-related CO2 emission increased by 59% in the period of 2000-2004. China’s
* This paper is supported by the fund of the Department of Education (10YJA790054) and SUFE (CXJJ-2011-430). Libo Yuan, Ph.D., Department of Statistics, Shanghai University of Financial Economics; Lecturer, Department of Management, Shanghai University of Engineering Science.
Yinchuan Xu, Ph.D., Department of Management, Shanghai University of Financial Economics; Lecturer, Department of Management, Shanghai University of Engineering Science.
Correspondence concerning this article should be addressed to Libo Yuan, Department of Statistics, No. 777, GuoDing Road, Shanghai, 200433, China. E-mail: [email protected].
D DAVID PUBLISHING

THE DRIVING FORCES OF CO2 EMISSION IN CHINA: 2002-2007
299
increase in CO2 emission accounted for about 56% of the increase of CO2 emission in the world. The newly
approved Five-Year Plan of China (2006-2010; 2011-2015) makes a reduction in energy intensity and energy
use in a national development objective, and decomposes the object into province level.
There are many issues studying the energy intensity of the GHGs, but seldom focus on the absolute
indicator of emission. This paper will analyze this absolute indicator, using the tools of input-output model and
structural decomposition analysis.
Literature Review
To analyze and understand historical changes in economic, environmental, employment, or other
social-economic indicators, it is useful to assess the driving forces of determinants that underlie these changes.
Two techniques for decomposing indicator changes at the sector level are structural decomposition analysis
(SDA) and index decomposition analysis (IDA). Both methods use the index theory for decomposition. The
main difference between them is the fundamental data used and the decomposed effects.
In the studies of China’s energy intensity, Huang (1993) used AMDI method to study the six industrial
sectors in 1980-1988, and Sinton and Levine (1994) used Laspeyres index to study the industrial sectors in
1980-1990, they found a similar result: The technological effect is the main factor in reducing the energy
intensity, while the structural effect had little contribution to the total change. Ma and Stern (2008) applied
LMDI method to the Chinese energy intensity between 1980 and 2003. They studied three industries and found
that the technological effect played an important role in reducing the energy intensity, and structural effect
increased the intensity. The increase of intensity after 2000 would attribute to the negative increase of
technology. Huang (2009) used LMDI to study the four waste emissions in 18 industrial sectors in 1994-2007,
she found that scale effect is the main reason of emission, technological effect is the most important force for
reducing the emission and structural change has a certain effect on increasing the emission.
Except for these IDA studies, Dietzenbacher and Los (1998) used two polar decomposition methods to
input-output model. They decomposed the emission volume into three factors: energy intensity, production
technique, and economy scale. Zhang (2003) used Laspeyres method to study the industrial sectors in China
between 1990 and 1997, they merge the industrial sectors in 29, and decompose the use of energy into three factors:
scale, production technique, and structure. They found that production technique is the most important factor.
In brief, the studies of decomposition in energy emission have three virtues: first, focusing on the
indicators in relative form; second, there are mainly four kinds of decomposing factors: energy intensity,
production technique and structure and scale; third, the use of the index varies, but almost based on Divisia
index. By contrast, this paper will focus on the volume of carbon emission, which is an indicator in absolute
form. And our decomposed factors include five effects: energy intensity, production technique, domestic
demand structure, trade structure, and economic scale, where the trade structure effect can be more persuasive
in explaining the embodied carbon emission in China. At last, we used the two-polar decomposition method in
the decomposing procedure.
This paper is organized as follows. In the next section, the Intergovernmental Panel on Climate Change
(IPCC) method to calculate the CO2 emission is described, and use the proposed decomposition approach to
decompose the change of CO2 emission over time is employed. The sector disaggregation and data used are
discussed in section three. The analysis and some main results are presented in section four. In section five,
conclusion is made in this study.

THE DRIVING FORCES OF CO2 EMISSION IN CHINA: 2002-2007
300
Methodology and Data
Calculation of CO2 Emission
Following the method presented in IPCC (1996, 2006), the total CO2 emission can be calculated based on
energy consumption, net calorific values of the energy and carbon emission factors (EFs). The calculation can
be expressed as follows:
1t t t t t
i ij ij j j j
i i j i j
C C C E NCV EF CS M (1)
where the subscript i represents the ith sector, the subscript j represents the jth fuel used, t is the time symbol in
years. tC denotes the total scale of CO2 emission (in million tons, Mt) of the economy in year t, tiC denotes
the emission (in million tons, Mt) of the ith sector in year t, tijC denotes the emission (in million tons, Mt) of
the ith sector based on the jth fuel in year t. tijE is the total energy consumption (in physical unit, million tons
or m3), NCVj is the lower-net calorific values (TJ/unit) of the jth fuel, EFj is the default carbon (kg/GJ) in the
jth fuel, tjCS is the fraction of the jth fuel that is not oxidized as raw materials in year t, M is the molecular
weight ratio of carbon dioxide to carbon (44/12).
In the version of IPCC 2006, the fraction of carbon oxidized is set to be 1. Because the fuel used as a raw
material for manufacture of products is excluded from the total energy consumption, CS is zero. The values of
NCV, EF, and CS are assumed to be constant over the time period of the study.
Structural Decomposition Analysis Based on Input-Output Model Based on the basic input-output model, the total social product X and the final demand y can be
linked with the direct consumption coefficient matrix A : 1
X I A uy
(2) where u is known as the structure effect of the final demand; y is a scalar which captures the changes in total
volume demand.
If the carbon emission intensity vector is denoted as f , and the volume of carbon emission as C , we
have: 1
C fX f I A uy fDuy
(3)
By the denotations above, the volume of emission can be expressed as: C fDuy
i ij j
i j
f d u y (4)
The second step is to decompose the change of C into four effects:
0 0 0 0t t t tC f D u y f D u y (5)
⊿ implies the change of the corresponding variable, and 0 and t imply the period of base and report. Using the MRCI decomposition method recommended by Rhee and Chung (2006):
* * * *
f d u y
ij ji i
ij ij ij ij
ij ij ij iji ij j
C C C C C
d uf yM M M M
f d u y
(6)
where:
, , 0*
*
ij t ij
ij
ij
C CM
A
*ij ji i
ij
i ij j
d uf yA
f d u y
(7)

THE DRIVING FORCES OF CO2 EMISSION IN CHINA: 2002-2007
301
In the above expression, the difference in total emissions between two periods in the intermediate sectors
is decomposed into five terms, where Cf is the difference attributable to the change in emission coefficients or
the change in the efficiency of energy use during the period, Cd is the difference due to change in production
technology as reflected on the input coefficient matrix sectors, Cu is the difference due to the structural change
in final demand sectors, Cy is the difference due to the change in the size of the economy. These four
decomposition effects can be noted as: carbon emission intensity effect, production technology effect, structural effect, and economy scale effect respectively.
Data
The data are collected from China Statistical Yearbook (CSY) and China Energy Statistical Yearbook
(CESY). In light of the price change over the period, adjustment is made to the 2007 data after compared with
the price indices from 2002 to 2007, using the method by Liu and Peng (2010). The price indices come from
the CSY 2003-2008.
When comparing the emission changes during the period, we merge the economy into 29 sectors. The
sectors and their corresponding code are presented in Table 1.
Table 1
Sectors and Codes Code Sector 1 Agriculture 2 Coal mining, washing 3 Petroleum and natural gas extraction 4 Metal ores mining 5 Non-metal ores mining 6 Manufacture of foods and tobacco 7 Manufacture of textile 8 Manufacture of textile wearing 9 Processing of timbers 10 Papermaking, printing 11 Processing of petroleum, coking 12 Chemical industry 13 Manufacture of non-metallic products 14 Smelting and rolling of metals 15 Manufacture of metal products 16 Manufacture of general machinery 17 Manufacture of transport equipment 18 Manufacture of electrical machinery 19 Manufacture of communication equipment 20 Manufacture of measuring instrument 21 Manufacture of artwork, other manufacture 22 Waste 23 Electricity and heat 24 Gas production 25 Water production 26 Construction 27 Traffic, transport and storage 28 Wholesale and retail trades 29 Others

THE DRIVING FORCES OF CO2 EMISSION IN CHINA: 2002-2007
302
Results and Analyses
The Driving Forces: From the Decomposition View
According to the energy input-output table, we compute the volume of carbon dioxide emission that is
from 2,887.3 million ton to 5,664.6 million ton during 2002-2007. The average rate of increase is 13.3%, faster
than the average rate of GDP growth 11.6% slightly.
Table 2 demonstrates the decomposition of the total volume of carbon dioxide emission. There are four
factors affected the change of emission: carbon emission intensity, production technique, structural change, and
economic scale.
Table 2
Change of the Total Emission and its Decomposition
C fCdC
uC yC
Change of emission [million ton] 2,812.0 -2,321.1 1,718.4 -8,921.2 12,335.9
Change in ratio 100.0% -82.5% 61.1% -327.3% 438.7%
Notes. Data source: CSY, CESY, and authors’ calculation. Unit: million tons; Negative values indicate decreasing CO2 emission; The symbols in the first row represent total emission change, carbon emission intensity effect, domestic demand effect, trading structural effect, and economy scale effect respectively.
Conclusions can be drawn from Table 2: Firstly, with comparison to 2002, the emission intensity and
domestic demand reduced the emission volume sharply in 2007; they are the positive factors in carbon emission
reduction. The contribution of the emission intensity is 82.5%, which reflects the improvement of efficiency of
energy use during the period, and the structure of demand contributes 327% reduction to the total change.
Secondly, the growth of the economic scale contributes 438.7% to the total change of emission, which has
the most important effect. This implies that the growth of the economy causes the pollution of the environment
and the overexploitation of natural resources. It also reflects the adjustment of industrial structure that did not
come up with the growth of the economy.
Thirdly, the change of production technique increases the carbon dioxide emission. It almost offsets the
effect of the positive factors as the first statement shows.
The Emission Intensity Analysis
When it comes to judging the effect of an energy policy, we should consider not only the reduction of a
certain sector’s emission, but also the effect on the other sectors. The total emission intensity (TEI) is
calculated to reflect this indirect relationship between sectors. Figure 1 shows the change of total emission
intensity (DTEI) and the change of direct emission intensity (DEI) during 2002-2007.
1
TEI f I A
(8)
DEI f (9)
IDI TEI DEI (10)
Using the weight of total products, we have the weighted average of emission intensity. During the year
2002-2007, the average of DEI decreased from 0.092 kg/RMB to 0.0739 kg/RMB, while the average of TEI
increased from 0.352 to 0.424, with an average annual rate of 3.8%. This implied that the indirect consumption
among different sectors cannot be neglected, especially in the establishment of an energy policy.
During 2002-2007, although the most sectors’ emission intensity decreased, some sectors’ condition did
not improve. This reflects the energy policy that did not have similar effects on the sectors.

THE DRIVING FORCES OF CO2 EMISSION IN CHINA: 2002-2007
303
Figure 1. The change of emission intensity by sectors during 2002-2007.
Conclusions
This paper tried to analyze the carbon dioxide emission in China during 2002 to 2007. The model used for
this analysis is the familiar input-output model extended to cover carbon emission. For decomposition of the
sources of change in emissions over the period, a residual-free composition method has been applied. The
method factors total change in emissions over the period into four contributing components, emission intensity,
production technique, final demand structure, and size of the economy.
Our results show that the energy uses during the study period grow rapidly compared with Ming (2009).
And trade structure changes from 2002 to 2007, with the virtue of carbon emission in trade balance (EETB)
from surplus to deficit. By SDA, we find that energy intensity and domestic demand structure are the main
reason of the reduction of carbon emission. Economic scale is the most important factor that increases the
carbon emission. Because the character of the foreign trade of China, the net export of high carbon emission
industry produces much more carbon dioxide when producing, and resulting in the carbon emission increased
sharply during the period.
Compared with Huang (1993), Sinton and Levine (1994), and Zhang (2003), our results consider the
domestic demand and the trading structure which have a significant effect on carbon emission but have
opposite direction. Besides, the production technique effect has increased the emission, which reflects the
difficulty in policy making on the control of emission.
Finally, although the DEI decreases during 2002-2007, the TEI increases with the average rate of 3.8%.
The driving force may result from some sector which increases the indirect emission during production. These
sectors are production and supply of electric power and heat, agriculture, smelting and rolling of metals, mining
and washing of coal. These sectors should give more emphasis when establishing energy policy.
References Ang, B. W. (2004). Decomposition analysis for policymaking in energy: Which is the preferred method? Energy Policy, 32,
1131-1139.
2 4 6 8 10 12 14 16 18 20 22 24 26 28
DTEI DDEI
0.4
0.2
0.0
-0.2
-0.4
-0.6
-0.8
THE DRIVING FORCES OF CO2 EMISSION IN CHINA: 2002-2007
304
Ang, B. W., & Liu, N. (2007). Negative-value problems of the logarithmic mean Divisia index decomposition approach. Energy Policy, 35, 739-742.
CESY. (2000-2008). China energy statistical yearbook. China: National Bureau of Statistics of China, National Development and Reform Commission.
CSY. (2002-2008). China statistical yearbook. China: National Bureau of Statistics of China. Dietzenbacher, E., & Los, B. (1998). Structural decomposition techniques: Sense and sensitivity. Economic System Research, 10,
307-323. Fan, Y. (2007). Changes in carbon intensity in China: Empirical findings from 1980-2003. Ecological Economics, 62, 683-691. Huang, J. (2009). The environment pollution and the structure of industries: Based on the Divisia decomposition method.
Statistics Research, 12, 68-73. Huang, J. P. (1993). Industrial energy use and structural change: A case study of the People’s Republic of China. Energy
Economics, 15, 131-136. IPCC. (2007). Greenhouse gas inventory: IPCC guidelines for national greenhouse gas inventories (pp. 11-25). Bracknell,
England: United Kingdom Meteorological Office. Liu, Q. Y., & Peng, Z. L. (2010). The sequence of input-output table and analysis of China: 1992-2005. Beijing: Chinese
Statistical Press. Ma, C., & Stern, D. I. (2008). China’s changing energy intensity trend: A decomposition analysis. Energy Economics, 30,
1037-1053. Ming, Z. (2009). Accounting for energy-related CO2 emission in China, 1991-2006. Energy Policy, 3, 7767-7773. Peters, G. P. (2010). Carbon footprints and embodied carbon at multiple scales. Current Opinion in Environmental Sustainability,
2, 245-250. Qiyun, L., & Zhilong, P. (2010). The sequence of input-output table and analysis of China: 1992-2005. Beijing: Chinese
Statistical Press. Rhee, H. C., & Chung, H. S. (2006). Change in CO2 emission and its transmissions between Korea and Japan using international
input-output analysis. Ecological Economics, 58, 788-800. Sinton, J. E., & Levine, M. D. (1994). Changing energy intensity in Chinese industry: The relative importance of structural shift
and intensity change. Energy Policy, 22, 239-255. Zhang, Z. X. (2003). Why did the energy intensity fall in China’s industry sector in the 1990s? The relative importance of
structural change and intensity change. Energy Economics, 25, 625-638.