Chinese Business Review (ISSN 1537-1506) Vol.12, No.2, 2013
79
-
Upload
independent -
Category
Documents
-
view
0 -
download
0
Transcript of Chinese Business Review (ISSN 1537-1506) Vol.12, No.2, 2013


Chinese Business Review
Volume 12, Number 2, February 2013 (Serial Number 116)
David
David Publishing Company
www.davidpublishing.com
PublishingDavid

Publication Information: Chinese Business Review is published monthly in hard copy (ISSN 1537-1506) and online by David Publishing Company located at 9460 Telstar Ave Suite 5, EL Monte, CA 91731, USA.
Aims and Scope: Chinese Business Review, a monthly professional academic journal, covers all sorts of researches on Economic Research, Management Theory and Practice, Experts Forum, Macro or Micro Analysis, Economical Studies of Theory and Practice, Finance and Finance Management, Strategic Management, and Human Resource Management, and other latest findings and achievements from experts and scholars all over the world. Editorial Board Members: Moses N. Kiggundu (Canada) Yener COŞKUN (Turkey) Helena Maria Baptista Alves (Portugal) Marcello Signorelli (Italy) Doaa Mohamed Salman (Egypt) Amitabh Deo Kodwani (Poland) Lorena Blasco-Arcas (Spain) Yutaka Kurihara (Japan) Ahmad Zafarullah Abdul Jalil (Malaysia) Salvatore Romanazzi (Italy) Saeb Farhan Al Ganideh (Jordan) Tulus Tahi Hamonangan TAMBUNAN (Indonesia)
GEORGE ASPRIDIS (Greece) Agnieszka Izabela Baruk (Poland) Goran Kutnjak (Croatia) Elenica Pjero (Albania) Cafer TOPALOĞLU (Turkey) Indah Susilowati (Indonesia) LI Kui-Wai (Hong Kong) Mohamed Nabil MZOUGHI (Tunisia) Mary RÉDEI (Hungary) Shelly SHEN (China)
Manuscripts and correspondence are invited for publication. You can submit your papers via Web Submission, or E-mail to [email protected], [email protected]. Submission guidelines and Web Submission system are available at http://www.davidpublishing.org, http://www.davidpublishing.com. Editorial Office: 9460 Telstar Ave Suite 5, EL Monte, CA 91731, USA Tel: +1-323-984-7526, 323-410-1082 Fax: +1-323-984-7374, 323-908-0457 E-mail: [email protected]
Copyright©2013 by David Publishing Company and individual contributors. All rights reserved. David Publishing Company holds the exclusive copyright of all the contents of this journal. In accordance with the international convention, no part of this journal may be reproduced or transmitted by any media or publishing organs (including various websites) without the written permission of the copyright holder. Otherwise, any conduct would be considered as the violation of the copyright. The contents of this journal are available for any citation, however, all the citations should be clearly indicated with the title of this journal, serial number and the name of the author.
Abstracted / Indexed in: Database of EBSCO, Massachusetts, USA Ulrich’s Periodicals Directory ProQuest/CSA Social Science Collection, Public Affairs Information Service (PAIS), USA Norwegian Social Science Data Services (NSD), Database for Statistics on Higher Education (DBH), Norway Index Copernicus, Poland Summon Serials Solutions
Chinese Database of CEPS, Airiti Inc. & OCLC Chinese Scientific Journals Database, VIP Corporation, Chongqing, P. R. China
Subscription Information: Print $520 Online $360 Print and Online $680 David Publishing Company 9460 Telstar Ave Suite 5, EL Monte, CA 91731, USA Tel: +1-323-984-7526, 323-410-1082 Fax: +1-323-984-7374, 323-908-0457 E-mail: [email protected]
David Publishing Company
www.davidpublishing.com
DAVID PUBLISHING
D

Chinese Business Review
Volume 12, Number 2, February 2013 (Serial Number 116)
Contents Economics
Recent Experience of the Effects of Intervention on Exchange Rates 77
Yutaka Kurihara
An Insight Into the Promise and Problems of Combining Life History and
Grounded Theory Research 84
Bronwyn Betts
Human Resources Development and Migration: New Potential
Determinants for Monetary Policy 93
Gherghinescu Oana Rodica, Ciocîrlan Irina Georgiana
Management
Customer! The Forgotten Stakeholder 104
Themistokles Lazarides, Stamatios Kontsas, Electra Pitoska
Resolving Conflicts Within Multicultural Teams in Industrial Enterprises 113
Veronika Videnová, Dagmar Cagáňová, Paul Woolliscroft, Jana Makraiová, Miloš Čambál
Application of Management Information System Planning in Concurrent Engineering
for Wooden Furniture Industry 124
Sakkarin Choodoung, Uttapol Smutkupt
Creating the Foundation of a Healthcare Research Project 131
Bobeica Ana Maria
How Many Family Businesses Are There Really and Does ICT and Innovation
Improve Their Performance? 137
Steve MacFeely, Caitriona O’Brien

Chinese Business Review, ISSN 1537-1506 February 2013, Vol. 12, No. 2, 77-83
Recent Experience of the Effects of Intervention
on Exchange Rates
Yutaka Kurihara
Aichi University, Nagoya, Japan
Recently, foreign exchange rates have been highly volatile all over the world. This article reports on an empirical
examination of the effectiveness of foreign exchange market intervention in Tokyo foreign exchange market. In
Japan, intervention in the foreign exchange market has occurred frequently and largely. In 2010, exchange rates
fluctuated greatly, and the Japanese yen appreciated greatly against other foreign currencies. The Bank of Japan
(BOJ) conducted an intervention in the foreign exchange market and bought massive USD to weaken the yen. They
are expected to prevent too much appreciation of the yen, to promote export, and expansion of the economy. Recent
foreign exchange market intervention in Tokyo has been effective in preventing the Japanese yen from appreciating
against other currencies. Also, unsterilization has had a positive effect on depreciation of the yen. Moreover, news
announcements by the Bank of Japan (BOJ) has led to depreciation of the yen. Effective announcements would
increase the effects on markets. Sterilization in intervention and market communication are both taken into account
in this article. The BOJ’s news announcements seem to convey to markets adequately and communication between
the bank and markets functions well. Moreover, the past exchange rate (i.e., the signaling effect) also is important
to the movement of exchange rates. On the other hand, portfolio channel is not found.
Keywords: exchange rate, financial policy, foreign exchange market, intervention, sterilization, Tokyo,
unsterilization
Introduction
Recently, in contract to practices in other countries, official interventions in the foreign exchange market
have been increased in Japan. In 2010, exchange rates fluctuated greatly, and the Japanese yen appreciated
greatly against other foreign currencies. The Bank of Japan (BOJ) conducted an intervention in the foreign
exchange market and bought massive USD to weaken the yen on September 15, 2010, six and a half year since
the previous intervention had been performed in Japan. The yen depreciated by about 3% on the same day. After
that, the BOJ has repeatedly conducted interventions in the foreign exchange market. The number of times is
many, and the volume also is large in Japan compared to that in other countries. Other countries, such as the
* Acknowledgement: This work was supported by JSPS KAKENHI.
Yutaka Kurihara, Professor, Department of Economics, Aichi University. Correspondence to this article should be addressed to Professor Yutaka Kurihara, Department of Economics, Aichi University,
4-60-6 Hiraike Nakamura Nagoya, 4538777, Japan. E-mail: [email protected].
DAVID PUBLISHING
D
RECENT EXPERIENCE OF THE EFFECTS OF INTERVENTION ON EXCHANGE RATES 78
United States, have not conducted interventions in the foreign exchange markets many times. There are some
possibilities that they do not emphasize intervention as the effectiveness of such measures is not highly regarded.
Along with large fluctuations of exchange rates, Japan and some other countries intervene in the foreign
exchange markets to attain stable exchange rates or to avoid too much currency appreciation. Many countries
would like to make their own currencies depreciate to promote exports and attain economic growth. An
examination of the effectiveness and influence on the markets become important. Some problems associated with
such interventions should be examined along with the impact of intervention on exchange rates. One important
aspect is to examine whether or not the interventions are sterilized, in which case the impact on exchange rates
may be diminished, according to economic theory. Also, news announcements to markets should be carefully
examined (Kim & Le, 2010). Effective announcements would increase the effects on markets. These problems
have not been discussed fully in the literature.
Historically, the BOJ started to disclose its intervention data in July 2001. Since then, some studies have
examined interventions; however, few have examined these effects for the recent period. The available data are
limited, sample period is very short, and the deterministic elements of exchange rates are various and changeable;
however, considerations of the possibilities in terms of the effects on foreign exchange rates becomes more
difficult and more important.
Klein and Rosengren (1991), Dominguez (1992), Dominguez and Frankel (1993), Neely (2000), and Reitz
and Taylor (2008) proposed that coordination of channels through intervention may be effective. Wang and
Yang (2009) performed an unconditional rolling correlation analysis for relationship intervention and reserve.
Kurihara (2011) indicated that foreign exchange market interventions influence the exchange rate level as
expected. The intervention is not only effective in changing the exchange level, but the contemporaneous effect
had a reverse sign. Park (2011) and Utsunomiya (2012) confirmed the presence of asymmetric volatility in the
foreign exchange markets. For asymmetry, Suardi and Chang (2012) showed the importance of the threshold
effect in the analysis of the effects of intervention because of the presence of asymmetry in the foreign exchange
market. Chen, Watanabe, and Yabu (2012) also showed that purchases and sales of US dollars as an intervention
cause correlation asymmetry in the United States but not in Japan and Germany. Also, the conditional correlation
is stronger when intervention is conducted frequency and the amount of intervention increase. Sinwaka and
Mkandawire (2012) used Markov-chain Monte Carlo methods and showed that a one trillion yen intervention
moved the yen/dollar exchange rate 1.8%. Ito (2004) indicated that intervention reduced the probability of the
exchange rate process staying in a regime characterized by disruptive tendencies. Kao and Wan (2012) analyzed
the effectiveness of foreign exchange market interventions by the Reserve Bank of Malawi and indicated that net
sales of US dollars by the central bank resulted in depreciation rather than appreciation. It means “leans against
the wind”.
This article examines the motivation for authorities and the effectiveness of intervention. Watanabe and
Yabu (2009) examined interventions in the foreign exchange market in Japan in an often-cited study. However,
exchange rates have fluctuated greatly and above all, interventions have been conducted often since 2010. In
2010, an intervention was conducted after six and a half years without any interventions, as mentioned above.
The purpose of this article is to examine the intervention in the Tokyo Foreign Exchange Market. Contrary
to previous studies, market communication and sterilization in intervention are both taken into account. Little
RECENT EXPERIENCE OF THE EFFECTS OF INTERVENTION ON EXCHANGE RATES 79
research has focused on or included these aspects.
This article is structured as follows: Section two presents a theoretical model; Section three shows the
empirical analysis with a focus on effectiveness of interventions. Finally, this article ends with a summary.
Theoretical Model
The exchange rate s (log) reflects the discounted value of market participants’ expectations about future
fundamentals sft + j:
1 ∑∞ | (1)
where is the discount factor and Ω is the information set available to participants. t denotes time. Foreign
exchange risk premium ρ is the return demanded by market participants in excess of the no-risk return, which is
the sum of the interest rate differentials at domestic country i relative to foreign country i* (Sarno & Taylor,
2001). Some experts believe it is natural that intervention has significant effects on market participants’
(fundamentalists’) confidence, regardless of whether the forecasting method relies on purchasing power parity
(PPP) only or on a PPP plus uncovered interest rate parity (UIP) condition. The interest rate differential can affect
the exchange rate changes by influencing the demand orders of the short-run fundamentals.
The dynamic model can be stipulated as:
Δst+1 = (i - i* + ρ) + 1 ∑∞ 1 1 | 1 1 | (2)
Which means that the change in the spot exchange rate has an expected element—the first term on the
right-hand side—and an unexpected element—the second term on the right-hand side, which is the new
information concerning fundamental elements that affect exchange rates. This equation reflects the hypothesis of
rational expectation for exchange rates.
Three channels affect exchange rates: (a) portfolio balance channel; (b) signaling channel; and (c)
communication channel.
For (a), interventions in the foreign exchange market can be understood to affect the exchange rate by
altering the foreign exchange rate risk premium ρ as noted by Reitz and Taylor (2012), for example. This
situation presents evidence of some effectiveness of official interventions that use the portfolio balance channel.
The risk-premium approach to exchange rate determination is one of the best known theories along with
purchasing power parity (PPP), monetary, and portfolio approaches.
The signaling channel (b) has recently received much attention. Interventions affect the expectations of
market participants and currency (asset) prices by signaling the information of either market participant. The
second term of the equation reflects this.
Finally, for (c), communication between policymakers and markets may affect currency prices, namely,
exchange rates. This channel implies that public announcements by financial authorities function as an element
that alters market views to cause exchange rates to move in a particular direction.
The addition of these three elements takes into account sterilization in foreign exchange markets, which
have a strong impact on the foreign exchange market.
To illustrate these functions, the following modified model is employed for empirical analysis:
Δst+1 = α0 + α1Δst + α2(i - i*) + α3INTERVENTIONt + α4POLICYt + α5ACCOUNTt (3)
The second term, Δs, on the right-hand side, checks the existence of the signaling channel exist. The third
RECENT EXPERIENCE OF THE EFFECTS OF INTERVENTION ON EXCHANGE RATES 80
term, i - i*, is the portfolio balance channel. The empirical analysis examines whether or not the premium exists.
For this analysis, the term α0 is included in the equation. The fourth term directly checks the effects of
intervention s’ on the foreign exchange market. The fifth term, POLICY, means the communication channel. The
final term, ACCOUNT, confirms the effects of sterilization/unsterilization. ACCOUNT is the change in the
current account balance at the BOJ. To check the effect of sterilization, equation (4), based on Watanabe and
Yabu (2009), is checked before equation (3) is regressed:
ΔACCOUNTt+2 = β0 + β1INTERVENTIONt (4)
Empirical Estimation
In the 1990s, Japan experienced serious economic and financial crises after the bubble economy (huge rises
in stock and land prices) burst in 1991. To overcome these severe economic situations, the BOJ conducted the
zero interest rate policy from February, 1999, to August, 2000. The BOJ decided to “flexibly provide ample funds
and encourage the uncollateralized overnight call rate (interbank interest rate) to move as low as possible”.
The zero interest rate policy seemed to contribute to economic recovery. The BOJ stopped the zero interest
rate policy. However, the economy again became troubled. The BOJ then conducted a more aggressive financial
easing policy. On March 19, 2001, the BOJ decided to increase the outstanding balance of the current accounts at
the BOJ. This is called a quantitative easing policy. This policy has been conducted in some developed countries
since then. The main operating target for financial market operations in Japan changed from the uncollateralized
overnight call rate to the outstanding balance of the current account at the BOJ.
First, equation (4) is estimated in this study. The data are daily. For reasons explained later in this paper, the
sample period is from March 19, 2001, to December 31, 2012. The estimated result is as follows:
ΔACCOUNTt+2 = 33.6017 + 0.6186INTERVENTIONt (5)
(0.8574) (0.0000)
Adj. R2: 0.0242; Prob (F-statistic): 0.0000; Durbin-Watson: 2.1242.
The figures in parentheses are p-values.
The results show that β1 is about 0.6 and significant (however, the constant term is insignificant). This result
means that about 40% of the volume of interventions is sterilized and 60% is nonsterilized. This analysis sets the
term ACCOUNT to 1 if ΔACCOUNTt+2 / INTERVENTIONt ≥ 0.5, and the term ACCOUNT to 0 if ΔACCOUNTt+2
/ INTERVENTIONt < 0.5.
POLICY is 1 if the BOJ changed financial policy and announced the change or 0 otherwise.
The data for interest rates are the money market rate (3-month). All the data are daily. The data source for
interest rates and the BOJ’s current account are from NIKKEI NEEDS. INTERVENTION data are from the Web
site of the Japan Ministry of Finance Japan and POLICY data are from the BOJ Web site.
The sample period is from 1991 to 2012 because of data availability, and the period is divided into two. The
break point is March 19, 2001, which was the starting time of the new quantitative easing policy. Since then, the
BOJ has conducted aggressive financial policy to combat deflation and recession. However, the data for the BOJ
current account was not available for the full sample period (from 1991 to 2012), so the analysis for this effect is
from March 19, 2001, to the end of 2012.
The empirical method is OLS and generalized method of moments (GMM), which is a robust estimator in

RECENT EXPERIENCE OF THE EFFECTS OF INTERVENTION ON EXCHANGE RATES 81
that, unlike maximum likelihood estimation, GMM does not require information about the exact distribution of
the disturbances. Instead of F-statistic, Hansen’s J statistics test is performed. This test checks whether or not the
model’s moment matches the data. In a GMM context, when there are more moment conditions than parameters
to be estimated, this test can be used to test the over-identifying restrictions. This method requires a decision
about which variables to use as instrumental variables. In equation (3), the lagged values of dependent and
explanatory variables are used as instrumental variables. The model is the equation (3) described in the previous
section. The results are shown in Tables 1 and 2.
Table 1
Exchange Rate Determination and Intervention
1991-March 18, 2001 March 19, 2001-2012
Method OLS GMM OLS GMM
C -0.0295 (0.2481)
-0.0235 (0.5615)
-0.0170 (0.3690)
-1.1607 (0.0812)
Δs 0.0302
(0.1358) -0.9367 (0.0000)
-0.0412 (0.0300)
0.8139 (0.0020)
i − i* -0.0086 (0.1613)
-0.0505 (0.0000)
-0.0026 (0.7259)
-0.1245 (0.2362)
INTERVENTION -2.04E-05 (0.3506)
-2.77E-05 (0.5713)
-5.17E-06 (0.4245)
0.0060 (0.0617)
POLICY -0.0137 (0.9527)
0.2842 (0.3380)
0.0444 (0.4868)
0.1787 (0.2102)
Adj.R2 0.0213 -0.9794 0.0022 -0.9556
Prob (F-statistic) 0.1653 - 0.1712 -
J-statistic - 0.0266 - 0.0052
Durbin-Watson 1.9994 0.9533 2.0020 1.8029
Note. Figures in parentheses are p-values.
Table 2
Exchange Rate Determination and Intervention Including Sterilization Effect
Method OLS GMM
C -0.0228 (0.2159)
-0.0089 (0.3298)
Δs -0.0419 (0.0202)
0.8653 (0.0000)
i − i* -0.0069 (0.3502)
-0.0045 (0.1104)
INTERVENTION 4.12E-05
(0.0000) 4.09E-05
(0.0000)
POLICY 0.0024
(0.9682) 0.0318
(0.6372)
STERILIZATION 0.1880
(0.0089) 0.1703
(0.0062) Adj.R2 0.0140 -0.8085
Prob (F-statistic) 0.0000 -
J-statistic - 0.0516
Durbin-Watson 1.9966 2.9954
Note. Figures in parentheses are p-values.
The results are almost as expected, and those derived using GMM are better than those from OLS, as
expected. GMM should be employed. The results show that interventions have recently generally been effective

RECENT EXPERIENCE OF THE EFFECTS OF INTERVENTION ON EXCHANGE RATES 82
in influencing the level of the yen-US dollar exchange rate. However, the results show that sterilization should be
taken into account as Watanabe and Yabu (2009).
The signaling channel (Δs) is confirmed to exist for both sample periods. However, the portfolio balance
channel (i − i*) does not exist. Rapid integration of financial markets and enormous increases in foreign
exchange markets seem to make this approach less effective. The findings for the communication channel
(POLICY) are not significant; however, the coefficients are positive, which indicates acceleration in the
depreciation of the Japanese yen as expected. Finally, the sterilization effect (STERILIZATION) is positive and
as expected. Unsterilization effects seem to exist strongly.
Conclusions
This article focused on interventions in the foreign exchange market in Japan. The empirical results show
that interventions have been conducted effectively. However, they depend on unsterilization to some degree. To
achieve effective and efficient interventions in foreign exchange market, it appears important to consider and
conduct sterilization or unsterilization in some cases. However, it is difficult and dangerous to judge that the
intervention policy was good. For example, in spite of the fact that the coefficient was opposite from the
expectation, there may some cases in which this approach might be able to prevent too strong
appreciation/depreciation of the yen to some degree. In such cases, interventions would be successful even if the
coefficients were not as expected.
The past exchange rate (i.e., the signaling effect) also is important to the movement of exchange rates. On
the other hand, it is interesting to note that portfolio channel was not found. However, this model hypothesized
rational expectation for exchange rates, so there is some possibility that the model does not fit well in the real
world.
The communication channel did not exist. However, exchange rate control is not the BOJ’s objective. The
Act stipulates the Bank’s principle of currency and monetary control as follows: “Currency and monetary control
by the Bank of Japan shall be aimed at achieving price stability, thereby contributing to the sound development of
the national economy”. The Ministry of Finance of Japan investigate, plans, and drafts matters concerning
foreign exchange and international monetary systems and their stability; adjustment of balance of payments;
management of the foreign exchange special account; foreign exchange rates; international organizations related
to economic cooperation or development; overseas loans and investment, and so on. However, the coefficients
were positive in the direction of depreciation of the yen. They are expected to prevent too much appreciation of
the yen, to promote export, and expansion of the economy.
In Japan, the frequency and volume of interventions have changed greatly. Compared to the past, the
number of times has decreased; on the other hand, the volume of one-time interventions has increased. Also, the
effects of interventions may have appeared later or sooner depending on the market situations. These elements
should be considered.
Recently, many countries have considered devaluation of their own currencies. The risk of such a strategy is
that it becomes incompatible if several economies pursue competitive devaluation to maintain or gain
competitiveness. However, there is not only the issue of consistency and conflict among policymakers who
attempt to pursue similar forward exchange market transactions via intervention. Sometimes coordination among
RECENT EXPERIENCE OF THE EFFECTS OF INTERVENTION ON EXCHANGE RATES 83
countries should be taken into account. This study has not considered this aspect.
Interventions have pros and cons, of course. Interventions sometimes may lose effectiveness, in which case,
financial policy, allocation or distribution of capital, and costs should be taken into account. Further study is
needed in this field.
References
Chen, Y., Watanabe, T., & Yabu, T. (2012). A new method for identifying the effects of foreign exchange intervention. Journal of Money, Credit & Banking, 44(8), 1507-1553.
Dominguez, K. (1992). Does central bank intervention increase volatility of foreign exchange rates? Cambridge: Harvard University.
Dominguez, K., & Frankel, J. (1993). Does foreign exchange intervention matter? The portfolio effect. American Economic Review, 83(5), 1356-1369.
Eria, H. (2012). The efficacy of central bank intervention on the foreign exchange market: Uganda’s experience. Journal of International Development, 24(2), 185-207.
Fratzsher, M. (2004). Official intervention in the foreign exchange market. In J. James, I. Marsh, & L. Sarno (Eds.), Handbook of exchange rates. London: Wiley.
Ito, T. (2004). Is foreign exchange intervention effective? The Japanese experience in the 1990s. In P. Mizen (Ed.), Monetary history, exchange rates and financial markets, essays in honour of Charles Goodhart (pp. 125-153). New York: Cheltenham.
Kao, C. W., & Wan, J. Y. (2012). Heterogeneous behaviours and the effectiveness of central bank intervention in the yen/dollar exchange market. Applied Financial Economics, 22(12), 967-975.
Kim, A. T., & Le, T. (2010). Secretary of bank of Japan’s yen intervention: Evidence of efficiency from intra-daily data. Journal of the Japanese and International Economies, 24(3), 369-380.
Klein, K., & Rosengren, E. (1991). Foreign exchange intervention as a signal of monetary policy. Retrieved from http://www.bos.frb.org/economic/neer/neer1991/index.htm#may/jun
Kurihara, Y. (2011). Is the Tokyo foreign exchange market efficient from two perspectives of forward bias and anomaly? Modern Economy, 2(2), 597-601.
Neely, C. J. (2000). Are changes in foreign exchange reserves well correlated with official intervention? Federal Reserve Bank of St. Louis, 82(5), 17-32.
Park, B. (2011). Asymmetric herding as a source of asymmetric return volatility. Journal of Banking &Finance, 35(10), 2657-2665. Reitz, S., & Taylor, M. P. (2008). The coordination channel of foreign exchange intervention: A nonlinear microstructural analysis.
European Economic Review, 52(1), 55-76. Reitz, S., & Taylor, M. P. (2012). FX intervention in the yen-US dollar market: A coordination channel perspective. International
Economics and Economic Policy, 9(2), 111-128. Sarno, L., & Taylor, M. P. (2001). Official intervention in the foreign exchange market: Is it effective and, if so, how does it work?
Journal of Economic Literature, 39(3), 839-868. Sinwaka, K., & Mkandawire, L. (2012). The efficacy of official intervention in the foreign exchange market in Malawi. African
Development Review, 24(2), 125-136. Suardi, S., & Chang, Y. (2012). Are changes in foreign exchange reserves a good proxy for official intervention? Journal of
International Financial Market, Institutions & Money, 22(4), 678-695. Utsunomiya, T. (2012). A new approach to the effect of intervention frequency on the foreign exchange market: Evidence from
Japan. Applied Economics, 45(26), 3742-3759. Wang, J., & Yang, Y. (2009). Asymmetric volatility in the foreign exchange markets. Journalof International Financial Markets,
Institutions & Money, 19(4), 597-615. Watanabe, T., & Yabu, T. (2009). The great intervention and massive monetary injection: The Japanese experience 2003-2004.
Working paper, Research Center for Price Dynamics, No. 12.
Chinese Business Review, ISSN 1537-1506 February 2013, Vol. 12, No. 2, 84-92
An Insight Into the Promise and Problems of Combining Life
History and Grounded Theory Research
Bronwyn Betts
Anglia Ruskin University, Cambridge, UK
This paper describes the research carried out in partial fulfilment of the degree of doctor of education. The study
was qualitative in nature with a phenomenological interpretive paradigm dominating the philosophical approach.
The research methods adopted combined life story and grounded theory. As far as the author has been able to
determine there are very few, if any studies which have applied this approach specifically to this area of research
which investigated the influence life history has on attitude to lifelong learning. Twenty five respondents were
interviewed in face-to-face informal interviews. The main aim was to elicit the respondent’s subjective
interpretation of the interaction between school, family, work, and learning within their lives. The researcher was
then able to identify when they occurred and what or who made them particularly meaningful. This paper describes
how initial decisions were made regarding the substantive area for the research. Sampling technique and method for
collecting the data is discussed and a worked example is given of how the data was analysed. It is intended that this
paper will give an insight into the challenge of combining these two much debated methods of research. The
empirical data lead to some interesting findings which educators and policy makers will find helpful in order to
strengthen the school, college, and workplace interface.
Keywords: life history, grounded theory, methodology, family, school, learning
The Raison D’être of the Research
At the inception of her doctoral studies the researcher was facilitating the reflective practice of a group of
students studying for a postgraduate degree in human resource management. An early observation was made as a
result of reading their reflective notes supported a perspective which pointed to the strong influence that
experiences in the early years had on their current (positive) attitude to learning. Therefore, the initial motivation
for the study was to seek further understanding of an otherwise little understood area, namely, the influence life
history can have on attitude to learning in later life.
The Theoretical and Methodological Framework
The study was a qualitative study with a phenomenological interpretive paradigm dominating the
philosophical approach adopted. The research methods were chosen because of their close association with this
Bronwyn Betts, Ph.D., Lord Ashcroft International Business School, Anglia Ruskin University. Correspondence concerning this article should be addressed to Bronwyn Betts, Lord Ashcroft International Business School,
Anglia Ruskin University, East Road, Cambridge, CB1 1PT, UK. E-mail: [email protected].
DAVID PUBLISHING
D
AN INSIGHT INTO THE PROMISE AND PROBLEMS OF COMBINING LIFE HISTORY 85
paradigm and were used to explore the dynamics of the relationship between life history and attitude to learning.
As suggested by Baker, West, and Stern (1992) cited in Wimping and Gass (2000), the researcher’s own
philosophy and beliefs will form the bedrock on which the choice of research method is based. Additionally it is
imperative that the chosen method or methods are congruent with the research aims. In this study the author’s
own philosophical beliefs, the experiences of her students, the phenomenon under investigation, and the research
aim all directed the methods used for data collection and analysis.
The Chosen Methods
Life History
The history method was chosen to gather data as it focuses on the ways individuals account for and theorise
about their actions in the social world over time (Musson, 2004). In other words, it is basically retrospective. It
focuses on the stories people tell about their lives so far. Goodson and Sikes (2001) suggest that it helps achieve a
better understanding of the past in order to open up possibilities for the future and this was key in the decision to
adopt the life history method for data collection. The in-depth interview was favoured as the tool for the
collection for the data as it gave access to the respondents’ accounts of how life history may have influenced their
current attitude to learning. It was also chosen as it “fitted” with the epistemological standpoint adopted for the
data analysis which was grounded theory (Glaser & Strauss, 1967).
Grounded Theory
Although grounded theory is a method that can be used with any kind of data collection Glaser and Strauss
(1967), Glaser (1978), and Charmaz (2007, p. 28) suggest that intensive qualitative interviewing fits grounded
theory methods particularly well. Both grounded theory methods and intensive interviewing are open-ended yet
directed, shaped yet emergent, and paced yet unrestricted.
Grounded theory is a general, inductive, and interpretive research method which was originated in 1967 by
Glaser and Strauss (Glaser & Strauss, 1967). Its method for analysing data was chosen, as already alluded to,
because it fitted with the philosophical base of this research, that is to say the researcher did not set out to verify a
theory, but to develop a theory which sought to explain how past experiences can influence attitude to learning.
Grounded theory emphasises theory development. It focuses on unravelling the elements of experience then, as a
result of studying these elements and their interrelationships a theory is developed which enables the researcher
to understand the nature and meaning of an experience for a particular group of people in particular settings
(Glaser & Strauss, 1967).
The Research Process
Figure 1 provides an overview of the research process. Although the steps taken are presented in linear form,
in reality these are often cyclical and interdependent processes.
All methodological decisions were perceived to meet key requirements for doctoral research, that is to say
they fitted well with the research aims and philosophical underpinning. Identifying the substantive area to
research (step 1) was relatively straightforward. Notwithstanding the interest which the student’s reflections had
generated, the researcher’s own personal experiences had also contributed to the choice of direction that the
research would take. Her own personal experiences of school were not positive and consequently it has always

AN INSIGHT INTO THE PROMISE AND PROBLEMS OF COMBINING LIFE HISTORY 86
been a great puzzlement that throughout her adult life she had been motivated to engage in learning. This is all
despite the fact that much of the literature suggests that people’s willingness to engage in learning, particularly as
adults, depends to considerable extent on whether they draw on positive experiences from this period of initial
education and early years. Thus the study began with the identification of a substantive area which was of interest
to the researcher, rather than a narrowly focussed research question (Corbin & Strauss, 1998).
Figure 1. The research process.
The Role of the Literature in Grounded Theory Research
Whilst stage 1 did not cause too many problems step 2, data collection, was more problematic. When the
literature should be consulted is a fundamental issue in grounded theory work. For Glaser and Strauss (1967),
Glaser (1978), and Strauss (1987), the defining components of grounded theory practice include conducting the
literature review after the collection and analysis of empirical data. This presented something of a dilemma, as on
the one hand, the researcher was anxious to critique earlier studies to make comparisons with her findings from
the interviews, on the other hand she did not want to import preconceived ideas and impose them on her work
(Charmaz, 2007).
Step 1—The identification of substantive area to research
Step 2—Data collection
Step 3—Data analysis
Step 4—Final literature comparison and analysis
Identification of the sample
Life history interviews
Constant comparison
On-going memoing
Ongoing Literature Review
Open-coding
Axial coding
AN INSIGHT INTO THE PROMISE AND PROBLEMS OF COMBINING LIFE HISTORY 87
In the end, the decision was influenced by two writers. Firstly, McGhee, Glenn, Marland, and Atkinson
(2007), who suggests that the literature in grounded theory research is simply another source of data which should
be theoretically sampled along with other emergent data. Theoretical sampling according to Charmaz (2007) is
about: “Seeking pertinent data to develop your emerging theory. The main purpose of theoretical sampling is to
elaborate and refine the Categories, constituting your theory” (p. 96).
The second influence was Onion (2004) who claims that the literature can be used as a form of primary as
well as secondary data. Thus, as can be seen from Figure 1, a decision was made early in the research to delay the
first real move into the literature until the process of open coding had taken place and then use it to theoretically
sample.
The Sample
Grounded theory studies are characterised by theoretical sampling and this gave the study direction.
However in order for this process to start there needs to be an initial sample for some data to be collected and
analysed. Baker et al. (1992) maintain that the researcher using the grounded theory approach initiates the
sampling process by interviewing significant individuals who have the knowledge and experience that the
researcher requires, have the ability to reflect and articulate, and have the time. Thus, the sample chosen for the
study was selected because the participants could provide relevant sources of data, they were relatively diverse in
background but all shared a positive attitude to learning. Additionally, the size of the sample was quite small
which reflected the view of Goodson and Sikes (2001) who purport that research samples for life history research
are usually quite small. This relevance was determined by the requirements for generating and delimiting the
theoretical codes (Hutchinson, 1993 as cited in Cutcliffe, 2003). Within this initial sample the researcher was
concerned with generating as many categories as possible. Once these events or happenings had been categorised,
she then sampled the literature with the aim to purposefully gather data related to these categories.
Research Participants
All respondents were either engaged in promoting learning and development within their organisation, or
full-time students having recent past work experience and intending to re-join such organisations upon
graduation. All students were interviewed in face-to-face informal interviews. The respondents were all
interviewed in places convenient to them, either their places of work or at the college where they were attending
their course.
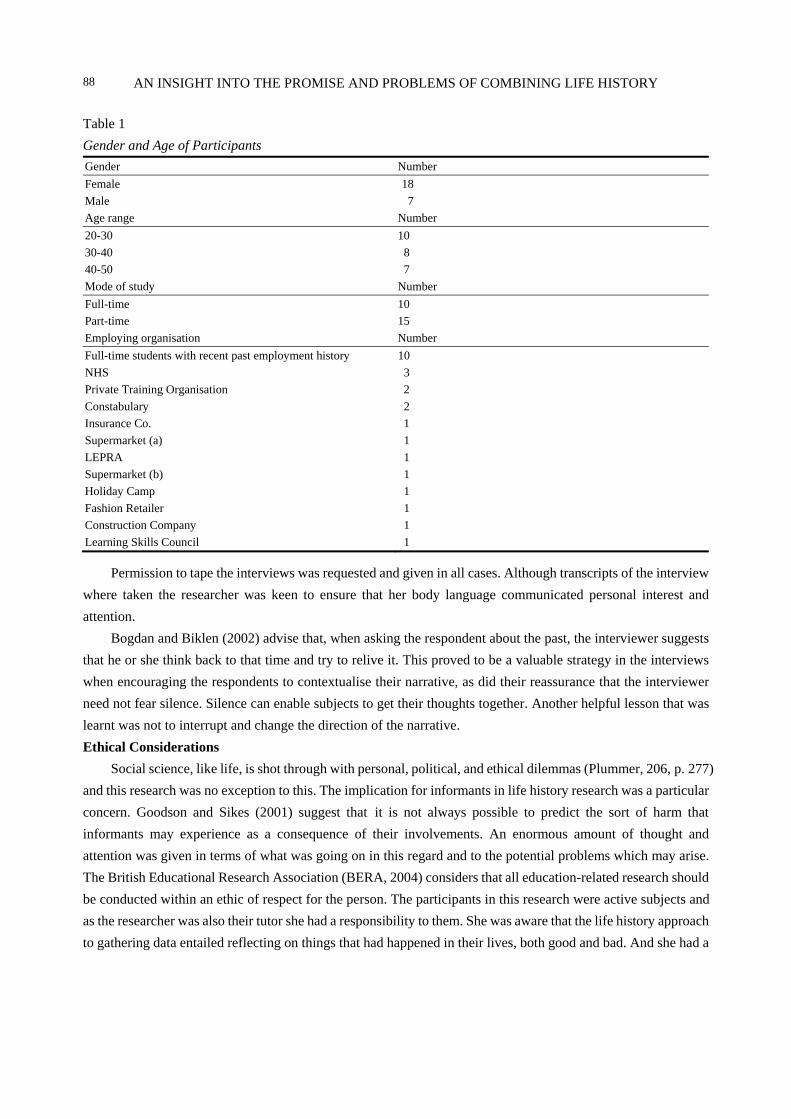
Table 1 shows the gender, age, mode of study, and the type of employing organisations of the participants.
The In-depth Interview
As can be seen from Table 1 that the respondents were quite diverse in terms of age and background. The
interviews began by the researcher asking the respondents to “offer a sequential account of their life” (Mann,
1992, p. 273), but more specifically throughout the narrative to focus on significant experiences of learning. The
main aim was to elicit the respondent’s subjective interpretation of the interaction between school, family work
and learning within their lives. She was satisfied that most of the criteria for a good interview were met. Briggs
(1986) suggests that good interviews are those in which the subjects are at ease and talk freely.
AN INSIGHT INTO THE PROMISE AND PROBLEMS OF COMBINING LIFE HISTORY 88
Table 1
Gender and Age of Participants
Gender Number
Female 18
Male 7
Age range Number
20-30 10
30-40 8
40-50 7
Mode of study Number
Full-time 10
Part-time 15
Employing organisation Number
Full-time students with recent past employment history 10
NHS 3
Private Training Organisation 2
Constabulary 2
Insurance Co. 1
Supermarket (a) 1
LEPRA 1
Supermarket (b) 1
Holiday Camp 1
Fashion Retailer 1
Construction Company 1
Learning Skills Council 1
Permission to tape the interviews was requested and given in all cases. Although transcripts of the interview
where taken the researcher was keen to ensure that her body language communicated personal interest and
attention.
Bogdan and Biklen (2002) advise that, when asking the respondent about the past, the interviewer suggests
that he or she think back to that time and try to relive it. This proved to be a valuable strategy in the interviews
when encouraging the respondents to contextualise their narrative, as did their reassurance that the interviewer
need not fear silence. Silence can enable subjects to get their thoughts together. Another helpful lesson that was
learnt was not to interrupt and change the direction of the narrative.
Ethical Considerations
Social science, like life, is shot through with personal, political, and ethical dilemmas (Plummer, 206, p. 277)
and this research was no exception to this. The implication for informants in life history research was a particular
concern. Goodson and Sikes (2001) suggest that it is not always possible to predict the sort of harm that
informants may experience as a consequence of their involvements. An enormous amount of thought and
attention was given in terms of what was going on in this regard and to the potential problems which may arise.
The British Educational Research Association (BERA, 2004) considers that all education-related research should
be conducted within an ethic of respect for the person. The participants in this research were active subjects and
as the researcher was also their tutor she had a responsibility to them. She was aware that the life history approach
to gathering data entailed reflecting on things that had happened in their lives, both good and bad. And she had a

AN INSIGHT INTO THE PROMISE AND PROBLEMS OF COMBINING LIFE HISTORY 89
responsibility to avoid any embarrassment and intimidation, or to expose confidentialities (Stake, 2000).
It was emphasised that participation was voluntary and they would not be prejudiced if they refused to
participate. They were assured of their right to withdraw their consent at any stage. The researcher was a senior
member of staff in the college where the research was conducted at the time and, as their tutor she knew them
reasonably well. This raised ethical issues about personal and professional responsibility. For in effect she was
“doing research in her own back yard” (Goodson & Sikes, 2001) with this in the forefront of her mind, she aimed
to establish mutuality, minimise communication barriers, and allay discomfort (Seiber, 1993).
Data Analysis Phase
As already alluded to detailed transcripts were made following each interview and the data examined several
times in order to develop explanations of the phenomenon being studied (Douglas, 2003, p. 46).
Memoing, or notes to self were made during and after the interviews. These were basically reflections on
feelings of the relationship with the informant; any doubts about the quality of some the data, and any remark that
related to a theory or concept which could be further explored in the literature (Strauss & Corbin, 1998). Any
issues were also noted which the researcher wanted to pursue further with the next contact or to re-interview at
some point (Miles & Huberman, 1994).
Initial Coding
The data in the transcripts and to some extent the memos was analysed phrase by phrase. This involved
taking each phrase, examining and labelling. The labels were referred to as categories, concepts, and properties.
This process of initial coding (or often referred to as open coding) requires application of what is referred to as the
“comparative method” (Pandit, 1996) that is to say broken down and questions asked. For example, “What did
this mean?”, “What is being referred to?’’, “Who was involved?”, and “When did this happen?”. The data are
then compared with data from the other interviews, grouped together and given a conceptual label. Table 2 is a
worked example. The first two respondents mentioned the influence of family in the early years, so this was
tentatively coded as “family influence”. The categories helped make sense of what the participant had said.
Whilst two participants mentioned the family influence, it was different depending on the context, characteristic,
behaviour, and impact of the family. Properties were then examined, for example, the type of behaviour in the
family, the extent of that behaviour and so on. The data from the coding were then used to theoretically sample
the relevant literature in order to elaborate and refine the categories constituting a theory.
Table 2
Initial Coding
Concept Key categories Properties
Family influence
Context Characteristics Behaviour Impact
Frequency Extent Behaviour type Duration
Axial Coding
The next stage in the process of analysis is axial coding. This process allowed the researcher to examine the
data more closely and identify relationships between the categories and properties identified in open coding. This

AN INSIGHT INTO THE PROMISE AND PROBLEMS OF COMBINING LIFE HISTORY 90
is done in order to develop core or major codes. Axial coding utilises a coding paradigm which involves the
researcher looking at the concepts, the context again and/intervening conditions involved. Consequences are then
looked at in order to bring out the central idea or core category. So for example, after family influence had been
analysed under the key categories and propertiesthe process of axial coding allowed her to think about the
material in new ways and examine the data more closely under a different coding paradigm. This enabled her to
build up a dense texture of relationships around the axes of the category being focussed upon. Hence Strauss and
Corbin’s (1998) definition of the process “axial coding”.
The emergent themes from axial coding as with the themes which emerged from the open coding procedure
were then explored in greater detail against selected literature. This led to the identification of relationships
between life experiences and attitudes to learning in later life.
Findings
The above process yielded a number of interesting findings and themes. The study presented evidence and
supports previous findings that underline the important influence family and school have on developing a
positive attitude to learning (Pugh, 1999; Pollard & Bourne, 2002; Nutbrown & Clough, 2006) and Pugh and
Duffy (2007). It adds to the vast volume of literature in this area, in so far as whilst it may be the case that adults
who are the best learners in terms of achievement come from homes value learning (Csikszentmihalyi, 1993), the
findings suggest that adults who have had bad experiences of learning within the home and school can and do still
go on to develop a positive attitude to learning in later life.
One respondent had a particularly negative experience at school and was told “she would never do anything
with her life”. She had remembered these words and they had, she claimed, made her more determined to succeed.
She went on to obtain a 2:1 degree, a post graduate diploma and aspire to a very senior position in her
organisation. Similar stories were told by many of the respondents. They were clearly driven by these negative
experiences.
Another central theme which was drawn out is that individual perceptions of learning can be a key influence.
The interviews bring out the differing perceptions and experiences of learning in schools and college as opposed
to learning in the workplace. The research supported Pollard and Bourne’s (2002) assertion that schools focus too
much on curriculum and teaching whilst paying insufficient attention to social factors. The findings from my
research support the viewpoint, which underlines the importance of making learning in schools more relevant and
individualised.
Finally the influence and importance of context and learning was a recurring theme in the study. The
respondents perceived the workplace environment as informal, supportive, and relevant in terms of meeting their
learning needs. Unlike school and to a certain extent colleges, workplaces are developing the whole person, not
just a single facet of the individual (Compton, Cox, & Santon Laanan, 2006). The conclusions suggested that this
research has shown the disjuncture between different phases of teaching (school, college, and the workplace).
Some Final Thoughts
The aim of this paper was to provide an insight into some of the issues of adopting grounded theory and life
history methodologies.

AN INSIGHT INTO THE PROMISE AND PROBLEMS OF COMBINING LIFE HISTORY 91
One of the biggest challenges of using grounded theory was adapting it to meet the researchers own needs. It
takes a degree of confidence to take the general principles and practices of grounded theory and vary them
according to individual research needs.
Grounded theory offers a set of guidelines rather than rigorous rules to be followed and as a novice
researcher the researcher could have adopted a more structured practically orientated approach. However with
grounded theory the data itself shapes the processes and product and for her it was important that she was not
totally relying on pre-conceived ideas and had the flexibility to pursue emerging themes.
Life history as a methodology presented its own challenges. The researcher should never underestimate the
importance of thoroughly familiarising themselves with this methodology and the associated ethical issues, some
of which have been discussed within this paper. The implications for the respondents and the researcher role in
particular require special consideration and attention. As reported earlier in this paper, it is not always possible to
predict the sort of harm that informants may experience as a consequence of their involvement (Goodson & Sikes,
2001).
Combining the two methodologies has not always been straightforward. However these two approaches
provided valuable experience and insight into conducting phenomenological research. It can be summed up by
Moustakas (1994):
In a phenomenological investigation the researcher has a personal interest in whatever she or he seeks to know, the researcher is intimately connected with the phenomenon, the puzzlement is autobiographical, making memory and history essential dimensions of discovery, in the present and extensions into the future. (p. 50)
References
Baker, C., West, J., & Stern, P. (1992). Method slurring: The grounded theory/phenomenology example. Journal of Advanced Nursing, 17, 1355-1360.
BERA. (2004). Guidelines for ethical research. Retrieved from http://www.bera.ac.uk Bogdan, R. C., & Biklen, S. K. (1992). Qualitative research for education: An introduction to theory and methods (2nd ed.). Boston,
M.A.: Allyn and Bacon. Briggs, C. (1986). Learning how to ask: A sociolinguistic appraisal of the role of the interview in social science research.
Cambridge, Massachusetts: Cambridge University Press. Charmaz, K. (2007). Constructing grounded theory: A practical guide through qualitative analysis. London: Sage. Compton, J. I., Cox, E., & Santon Laanan, F. (2006). Adult learners in transition: New directions for student services. Retrieved
from http://www.interscience.wiley.com/DO1.101002/ss.208 Corbin, J., & Strauss, A. (1998). Basics of qualitative research: Techniques and procedures for developing grounded theory.
London: Sage. Csikszentmihalyi, I. (1993). Family influences on the development of giftedness. In G. R. Bock, & K. Acknill (Eds.), The origins
and development of high abilit. CIBA Foundation Symposium 178, Chichester, UK. Cutliffe, R. (2003). Methodological issues in grounded theory. Journal of Advanced Nursing, 31(6), 176-194. Douglas, D. (2003). Grounded theories of management: A methodological review. Management Research News, 26(5), 44-52. Glaser, B. G. (1978). Theoretical sensitivity. Mill Valley, C.A.: Sociology Press. Glaser, B., & Strauss, A. (1967). Discovery of grounded theory. Chicago: Aldine. Goodson, I., & Sikes, P. (2001). Life history research in education settings: Learning from lives. Buckingham: Open University
Press. Mann, S. J. (1992). Telling a life story: Issues for research. Management Education and Development, 23(3), 271-280. McGhee, G., Glenn, R., Marland, J., & Atkinson, J. (2007). Grounded theory research: Literature reviewing and reflexivity. Journal
of Advanced Nursing, 60(3), 334-342. Miles, M. B., & Huberman, A. M. (1994). Qualitative data analysis (2nd ed.). London: Sage.

AN INSIGHT INTO THE PROMISE AND PROBLEMS OF COMBINING LIFE HISTORY 92
Moustakas, C. (1994). Phenomenological research methods. London: Thousand Oaks/Sage. Musson, G. (2004). Life histories. In C. Cassell, & G. Symon (Eds.), Essential guide to qualitative methods in organizational
research (pp. 34-44). London: Sage. Nutbrown, C., & Clough, P. (2006). Inclusion in the early years: Critical analysis and enabling narratives. London: Sage. Onion, P. (2004). Grounded theory applications. Reviewing Knowledge Management Literature, 1, 18. Pandit, N. R. (1996). The creation of theory: A recent application of the grounded theory method. Retrieved from
http://www.nova.edu/sss/QR/QR2-4/pandit.html Plummer, K. (2006). Documents of life: An invitation to a critical humanism. London: Sage. Pollard, A., & Bourne, J. (2002). Teaching and learning in the primary school. London: Open University. Pugh, G. (1999). Young children and their families: A community response. London: Falmer. Pugh, G., & Duffy, B. (2007). Contemporary issues in the early years. London: Sage. Seiber, J. E. (1993). The ethics and politics of sensitive research. In C. M. Renzetti, & R. M. Lee (Eds.), Researching sensitive topics
(pp. 626-633). Newbury Park, C.A.: Sage. Sikes, P., & Gale, K. (2006). Narrative approaches to education research. Retrieved April 3, 2008, from
http://www.edu.plymouth.ac.uk Stake, P. (2000). Case studies. In N. K. Denscombe, & Y. S. Lincoln (Eds.), Handbook of qualitative research (pp. 435-454),
Thousand Oaks, C.A.: Sage. Strauss, A. (1987). Qualitative analysis for social scientists. Cambridge: Cambridge University Press. Strauss, A., & Corbin, J. (1998). Basics of qualitative research: Grounded theory procedures and techniques (2nd ed.). London:
Sage.

Chinese Business Review, ISSN 1537-1506 February 2013, Vol. 12, No. 2, 93-103
Human Resources Development and Migration: New Potential
Determinants for Monetary Policy*
Gherghinescu Oana Rodica
University of Craiova, Craiova, Romania
Ciocîrlan Irina Georgiana
ACZ Consulting, Craiova, Romania
The main objective of the present paper is to determine the potential impact the qualitative and quantitative
tendencies in the labor market on the decisions which influence the design of monetary policy worldwide. The
analysis is focused on how human resources and phenomena associated with them could influence potential growth
and, further on, how they can impact monetary policy decisions at national level for European countries outside the
euro area and at ECB level for the euro zone countries. Moreover, the paper will envisage potential macroeconomic
reactions (monetary decisions herewith included) to human resources dynamics. The economic variations are
regarded through the perspective of growth potential shown by the Research & Development sector and also
through the effects of labor force migration. The analysis of statistical data aims at pointing out the different
economic perspectives in the European Union, the United States, and Japan, also considering the disparities
between EU member states. The analysis is completed by the use of the ranking method, the conclusions stating
once more the crucial importance of the human factor in drawing monetary policy decisions.
Keywords: human resources, migration, monetary policy, Research & Development sector, economic growth,
labour force, job creation
Introductory Remarks
Contemporary economics acknowledge more and more the need to correlate monetary policy design with
the changing characteristics of the real economy.
Monetary policy determination, be it within a monetary or a direct inflation targeting regime, pays special
attention to the trend growth of GDP as one of its essential determinants.
A component which is incorporated in the potential growth rate and has gained significant importance
during the last decade in macroeconomic equations is the human factor. Labour markets in Europe are confronted
* Acknowledgment: This work was supported by the strategic grant POSDRU/89/1.5/S/61968, Project ID61968 (2009), co-financed by the European Social Fund within the Sectoral Operational Programme Human Resources Development 2007-2013.
Gherghinescu Oana Rodica, Ph.D. in Economics, Department of Economics and Business Administration, University of Craiova.
Ciocîrlan Irina Georgiana, MA in Economics, Department of EU funding, ACZ Consulting. Correspondence concerning this article should be addressed to Gherghinescu Oana Rodica, Craiova, 33A Putnei Street, ap. 7,
Craiova, Romania. E-mail: [email protected].
DAVID PUBLISHING
D

HUMAN RESOURCES DEVELOPMENT AND MIGRATION 94
with prolonged shortages of skilled workers especially in the tertiary sector. Fewer and fewer qualified human
resources enter the labour markets in public works, public services, and constructions as a consequence of
inadequate education strategies in the field of vocational education and training. Another associated phenomenon
is migration of labour force from Eastern to Western and Northern Europe, thus increasing the shortage of
workers on the Eastern markets and putting inflationist pressure on the origin markets of workers via remittances.
In such a context, labor markets play an important indirect role in the design and conduct of monetary policy,
highlighting the importance of labor as an important factor in the production functions of various economies. The
present paper comprises four parts: the first one is dedicated to analyzing the rationale behind establishing a
direct link between monetary policy and economic growth; the second part analyzes the role of human capital in
the economic growth process in contemporary economies; the third part depicts and researches into four main
challenges facing economic growth from the point of view of human resources, namely, lifelong learning,
mobility, rigidities, and displacement; and the fourth part is dedicated to conclusions.
Monetary Policy and Economic Growth
Monetary policy is not an objective per se but a mechanism that is put in place in order to better serve the
achievement of macro-economic objectives. Monetary policy objectives and instruments are designed in order to
support general macroeconomic objectives, among which economic growth is essential. Empirical attempts have
been made in order to establish a quantitative relationship between monetary policy and economic growth. In
economic literature they have been categorized as either deterministic (the Taylor rule) or normative (quantitative
benchmark definitions for money supply growth rate).
The Taylor rule provides recommendations on how the Federal Reserve should set the short-term interest
rates in accordance with the economic conditions in order to achieve its short-run goal for stabilizing the
economy and its long-run goal for inflation.
Starting October 1998, the Governing Council of the European Central Bank decided to announce a
reference value for the growth rate of the broad monetary aggregate (M3) having as regressors the potential
growth, the desired inflation rate (following the ECB’s definition of price stability as an year-on-year increase in
the HICP for the euro area of below 2%) and the estimate of trends in the inverse of the velocity of circulation of
money. A reference value for monetary growth of 4.5% per annum has been successively reconfirmed by the
ECB, based on the assumptions regarding a trend for potential growth in the range of 2%-2.5% and a decline in
M3 income velocity of 0.5%-1% per annum in the euro area.
This correlation mechanism does not, however, function automatically. There are several underlying factors
for GDP growth rate, some of them radically changing during the last decades. One of the very dynamic factors is
represented by human resources and their presence in the production function of a state under the categorization
of labor.
Human Capital and Economic Growth
Human capital is without any doubt a key variable in the macro-economic equation of every state. Its
quantity and quality exert impact on the level and trend of GDP growth together with other production factors.
While quantity is affected by low birth prospects across most of the developed countries, quality of the human
HUMAN RESOURCES DEVELOPMENT AND MIGRATION 95
capital has gained importance through various initiatives such as investing more and more in education, as well as
in research and development.
Education increases the mobility of the workforce within a labor market and is therefore essential for the
functioning of a monetary union in which asymmetric economic shocks can no longer be absorbed by adapting
the exchange rate relations but have to be offset by flexible factors of production (Liebscher et al., 2006). In its
theory of optimum currency areas, Mundell (1961) has identified labor mobility as a strategic facet of an
optimum currency area. His argument was that, when this production factor moves freely within the monetary
area, adjustments to real shocks do not imply dramatic changes in the level of prices and income for member
states. If, on the contrary, mobility is low, the monetary union is not desirable. Education does not only increase
labor force mobility, but also its adaptability, productivity, and competitiveness, as key issues of Europe’s
revised Lisbon agenda. Although a time lag has been identified between the investment in education and its
results in terms of increased competitiveness and economic growth, there is clear evidence that education and
lifelong learning are an indispensable input for economic growth in the last decades.
Research and development (R&D) should become a driving force behind economic growth, job creation,
innovation of new products, and increasing quality of products.
A minimum set of six indicators can be used to assess the competitiveness potential of the EU economy in
the spirit of the Lisbon Strategy for growth and jobs (see Tables 1-6 and Figures 1-6): (1) gross domestic
expenditure on R&D; (2) tertiary graduates in science and technology per 1,000 inhabitants aged 20-29 years; (3)
the employment rate, calculated by dividing the number of persons aged 15 to 64 in employment by the total
population of the same age group; (4) labor productivity per person employed; (5) research and development
personnel, by sectors of performance; and (6) doctorate students in science and technology fields—total percent
of the population aged 20-29.
The findings are as follows:
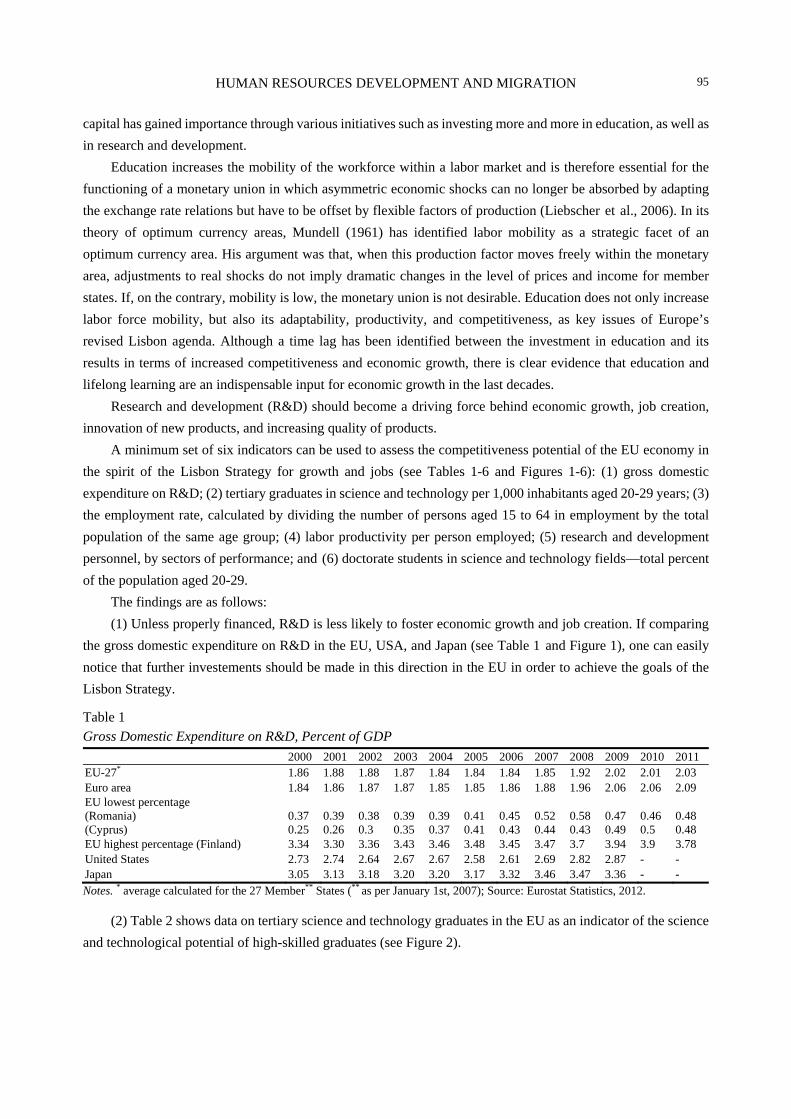
(1) Unless properly financed, R&D is less likely to foster economic growth and job creation. If comparing
the gross domestic expenditure on R&D in the EU, USA, and Japan (see Table 1 and Figure 1), one can easily
notice that further investements should be made in this direction in the EU in order to achieve the goals of the
Lisbon Strategy.
Table 1 Gross Domestic Expenditure on R&D, Percent of GDP
2000 2001 2002 2003 2004 2005 2006 2007 2008 2009 2010 2011EU-27* 1.86 1.88 1.88 1.87 1.84 1.84 1.84 1.85 1.92 2.02 2.01 2.03 Euro area 1.84 1.86 1.87 1.87 1.85 1.85 1.86 1.88 1.96 2.06 2.06 2.09 EU lowest percentage (Romania) (Cyprus)
0.37 0.25
0.39 0.26
0.38 0.3
0.39 0.35
0.39 0.37
0.41 0.41
0.45 0.43
0.52 0.44
0.58 0.43
0.47 0.49
0.46 0.5
0.48 0.48
EU highest percentage (Finland) 3.34 3.30 3.36 3.43 3.46 3.48 3.45 3.47 3.7 3.94 3.9 3.78 United States 2.73 2.74 2.64 2.67 2.67 2.58 2.61 2.69 2.82 2.87 - - Japan 3.05 3.13 3.18 3.20 3.20 3.17 3.32 3.46 3.47 3.36 - - Notes. * average calculated for the 27 Member** States (** as per January 1st, 2007); Source: Eurostat Statistics, 2012.
(2) Table 2 shows data on tertiary science and technology graduates in the EU as an indicator of the science
and technological potential of high-skilled graduates (see Figure 2).

HUMAN RESOURCES DEVELOPMENT AND MIGRATION 96
Table 2
Tertiary Graduates in Science and Technology Per 1,000 Inhabitants Aged 20-29 Years
2000 2001 2002 2003 2004 2005 2006 2007 2008 2009 2010
EU-27* 10.1 10.7 11.3 12.3 12.5 13.2 13.4 13.8 14.4 14.4 12.5
EU lowest level (Cyprus) 3.4 3.7 3.8 3.6 4.2 3.6 4.3 4.2 4.0 4.6 5.1
EU highest level (Finland) 16.0 17.2 17.4 17.4 17.9 18.1 17.9 18.8 24.3 19.0 24.2
USA 9.7 9.9 10.0 10.9 10.2 10.6 10.3 10.1 10.1 10.3 10.7
Japan 12.6 12.8 13.0 13.2 13.4 13.7 14.4 14.4 14.3 14.2 13.8
Notes. * average calculated for the 27 Member** States (** as per January 1st, 2007); Source: Eurostat Statistics, 2012.
As it can be noticed, huge disparities persist between different countries in the EU, which brings on the top
of the agenda the need to ensure homogenous priorities for higher education in the field of science and technology
accross Europe. The European Union needs to train and use on the labor market as many high-skilled graduates as
possible. This has been included among the priorities of the Bologna process and the financing priorities of the
European Social Fund.
(3) In the spirit of the Lisbon strategy for growth and jobs, there can be established a correlation between the
amounts of investments dedicated to R&D and the employment rate (see Table 3 and Figure 3).
Table 3
Employment Rate in Percent
2000 2001 2002 2003 2004 2005 2006 2007 2008 2009 2010 2011
EU-27* 66.6 66.9 66.7 67.0 67.4 68.0 69.0 69.9 70.3 69.0 68.6 68.6
EU—Changing composition 67.3 67.9 68.1 68.4 68.9 68.3 69.2 69.9 70.3 69.0 68.6 68.6
EU lowest rate (Greece) 61.9 61.5 62.5 63.6 64.0 64.6 65.7 66.0 66.5 65.8 64.0 59.9
EU highest rate (Sweden) 77.7 78.7 78.5 77.9 77.4 78.1 78.8 80.1 80.4 78.3 78.7 80.0
United States 76.9 76.1 75.0 74.5 74.5 74.8 75.3 75.3 74.5 71.3 70.5 70.4
Japan 74.0 73.8 73.1 73.2 73.4 73.9 74.5 75.3 75.3 74.7 74.7 74.9
Notes. * average calculated for the 27 Member** States (** as per January 1st, 2007); Source: Eurostat Statistics, 2012.
(4) Both the level of expenditure on R&D and the level of investments in education are to be reflected in the
productivity per person employed (see Table 4 and Figure 4).
Table 4
Labor Productivity Per Person Employed EU 27 = 100
2000 2001 2002 2003 2004 2005 2006 2007 2008 2009 2010 2011
EU-27* 100.0 100.0 100.0 100.0 100.0 100.0 100.0 100.0 100.0 100.0 100.0 100.0
EU—Changing composition 113.9 112.6 111.8 111.0 109.9 109.9 109.8 109.6 109.7 109.2 108.7 108.5
EU lowest rate (Bulgaria) 31.3 32.2 34.0 34.8 34.8 35.8 36.4 37.5 39.6 40.1 41.3 43.5EU highest rates (Luxembourg) (Belgium)
176.8 137.3
163.1 134.2
164.2137.1
168.2135.6
170.6132.6
170.3130.5
179.5129.3
180.0127.7
168.6 127.1
161.6 127.8
167.9128.3
169.8127.4
United States 142.5 140.9 140.9 142.6 143.5 144.4 140.6 139.4 138.1 140.9 142.9 143.5
Japan 100.6 99.6 100.1 100.8 100.9 100.3 97.5 97.5 95.3 92.9 96.4 95.1
Notes. * average calculated for the 27 Member** States (** as per January 1st, 2007); Source: Eurostat Statistics, 2012.
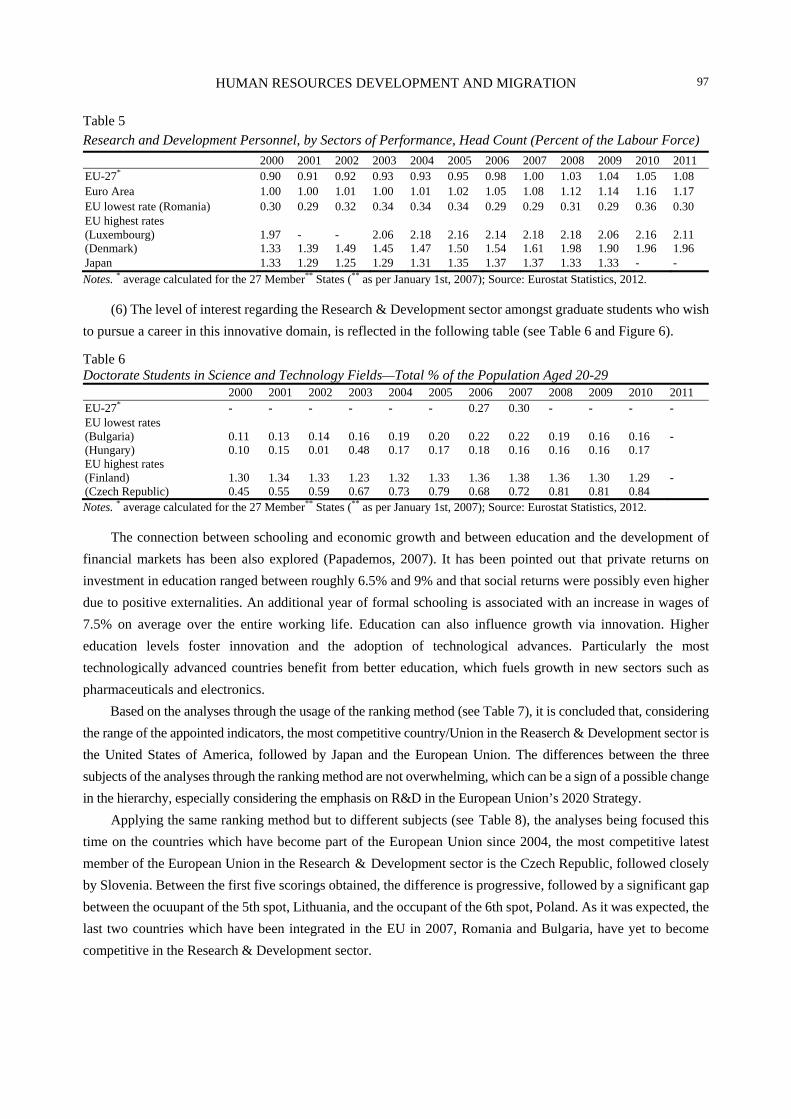
(5) The information regarding the percentage of personnel currently working in the Research &
Development sector can be viewed below (see Table 5 and Figure 5).
HUMAN RESOURCES DEVELOPMENT AND MIGRATION 97
Table 5 Research and Development Personnel, by Sectors of Performance, Head Count (Percent of the Labour Force)
2000 2001 2002 2003 2004 2005 2006 2007 2008 2009 2010 2011EU-27* 0.90 0.91 0.92 0.93 0.93 0.95 0.98 1.00 1.03 1.04 1.05 1.08 Euro Area 1.00 1.00 1.01 1.00 1.01 1.02 1.05 1.08 1.12 1.14 1.16 1.17 EU lowest rate (Romania) 0.30 0.29 0.32 0.34 0.34 0.34 0.29 0.29 0.31 0.29 0.36 0.30 EU highest rates (Luxembourg) (Denmark)
1.97 1.33
- 1.39
- 1.49
2.06 1.45
2.18 1.47
2.16 1.50
2.14 1.54
2.18 1.61
2.18 1.98
2.06 1.90
2.16 1.96
2.11 1.96
Japan 1.33 1.29 1.25 1.29 1.31 1.35 1.37 1.37 1.33 1.33 - - Notes. * average calculated for the 27 Member** States (** as per January 1st, 2007); Source: Eurostat Statistics, 2012.
(6) The level of interest regarding the Research & Development sector amongst graduate students who wish
to pursue a career in this innovative domain, is reflected in the following table (see Table 6 and Figure 6).
Table 6 Doctorate Students in Science and Technology Fields—Total % of the Population Aged 20-29 2000 2001 2002 2003 2004 2005 2006 2007 2008 2009 2010 2011 EU-27* - - - - - - 0.27 0.30 - - - - EU lowest rates (Bulgaria) (Hungary)
0.11 0.10
0.13 0.15
0.14 0.01
0.16 0.48
0.19 0.17
0.20 0.17
0.22 0.18
0.22 0.16
0.19 0.16
0.16 0.16
0.16 0.17
-
EU highest rates (Finland) (Czech Republic)
1.30 0.45
1.34 0.55
1.33 0.59
1.23 0.67
1.32 0.73
1.33 0.79
1.36 0.68
1.38 0.72
1.36 0.81
1.30 0.81
1.29 0.84
-
Notes. * average calculated for the 27 Member** States (** as per January 1st, 2007); Source: Eurostat Statistics, 2012.
The connection between schooling and economic growth and between education and the development of
financial markets has been also explored (Papademos, 2007). It has been pointed out that private returns on
investment in education ranged between roughly 6.5% and 9% and that social returns were possibly even higher
due to positive externalities. An additional year of formal schooling is associated with an increase in wages of
7.5% on average over the entire working life. Education can also influence growth via innovation. Higher
education levels foster innovation and the adoption of technological advances. Particularly the most
technologically advanced countries benefit from better education, which fuels growth in new sectors such as
pharmaceuticals and electronics.
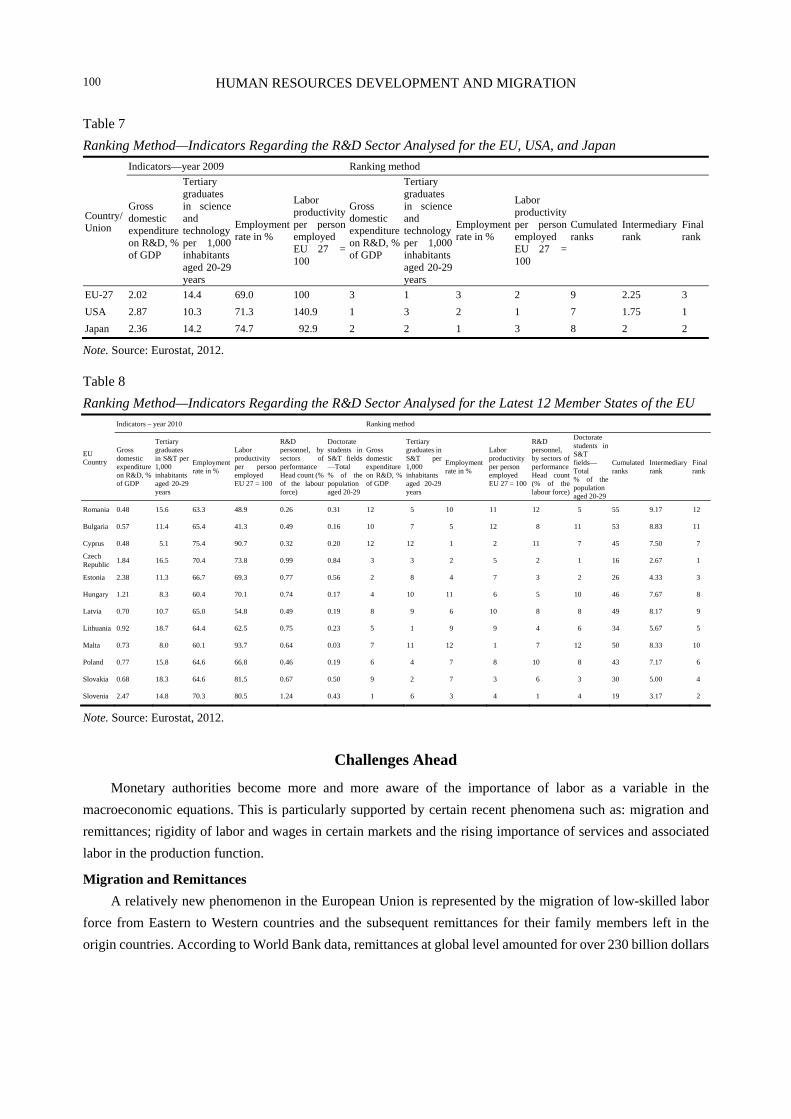
Based on the analyses through the usage of the ranking method (see Table 7), it is concluded that, considering
the range of the appointed indicators, the most competitive country/Union in the Reaserch & Development sector is
the United States of America, followed by Japan and the European Union. The differences between the three
subjects of the analyses through the ranking method are not overwhelming, which can be a sign of a possible change
in the hierarchy, especially considering the emphasis on R&D in the European Union’s 2020 Strategy.
Applying the same ranking method but to different subjects (see Table 8), the analyses being focused this
time on the countries which have become part of the European Union since 2004, the most competitive latest
member of the European Union in the Research & Development sector is the Czech Republic, followed closely
by Slovenia. Between the first five scorings obtained, the difference is progressive, followed by a significant gap
between the ocuupant of the 5th spot, Lithuania, and the occupant of the 6th spot, Poland. As it was expected, the
last two countries which have been integrated in the EU in 2007, Romania and Bulgaria, have yet to become
competitive in the Research & Development sector.

HUMAN RESOURCES DEVELOPMENT AND MIGRATION 98
Figure 1. Gross domestic expenditure on R&D, % of GDP.
Figure 2. Tertiary graduates in science and technology per 1,000 inhabitants aged 20-29 years.
Figure 3. Employment rate in %.

HUMAN RESOURCES DEVELOPMENT AND MIGRATION 99
Figure 4. Labor productivity per person employed, EU 27 = 100.
Figure 5. Research and development personnel, by sectors of performance (% of the labour force).
Figure 6. Doctorate students in science and technology fields—Total percent of the population aged 20-29.
1.6
1.4
1.2
1
0.8
0.6
0.4
0.2
0
1.6
1.4
1.2
1
0.8
0.6
0.4
0.2
0
HUMAN RESOURCES DEVELOPMENT AND MIGRATION 100
Table 7
Ranking Method—Indicators Regarding the R&D Sector Analysed for the EU, USA, and Japan
Country/ Union
Indicators—year 2009 Ranking method
Gross domestic expenditure on R&D, % of GDP
Tertiary graduates in science and technology per 1,000 inhabitants aged 20-29 years
Employment rate in %
Labor productivity per person employed EU 27 =100
Gross domestic expenditure on R&D, % of GDP
Tertiary graduates in science and technology per 1,000 inhabitantsaged 20-29 years
Employment rate in %
Labor productivity per person employed EU 27 = 100
Cumulated ranks
Intermediary rank
Final rank
EU-27 2.02 14.4 69.0 100 3 1 3 2 9 2.25 3
USA 2.87 10.3 71.3 140.9 1 3 2 1 7 1.75 1
Japan 2.36 14.2 74.7 92.9 2 2 1 3 8 2 2
Note. Source: Eurostat, 2012.
Table 8
Ranking Method—Indicators Regarding the R&D Sector Analysed for the Latest 12 Member States of the EU
EU Country
Indicators – year 2010 Ranking method
Gross domestic expenditure on R&D, % of GDP
Tertiary graduates in S&T per 1,000 inhabitants aged 20-29 years
Employment rate in %
Labor productivity per person employed EU 27 = 100
R&D personnel, by sectors of performance Head count (% of the labour force)
Doctorate students in S&T fields —Total % of the population aged 20-29
Gross domestic expenditure on R&D, % of GDP
Tertiary graduates in S&T per 1,000 inhabitantsaged 20-29 years
Employment rate in %
Labor productivity per person employed EU 27 = 100
R&D personnel, by sectors of performance Head count (% of the labour force)
Doctorate students in S&T fields— Total % of the population aged 20-29
Cumulated ranks
Intermediary rank
Final rank
Romania 0.48 15.6 63.3 48.9 0.26 0.31 12 5 10 11 12 5 55 9.17 12
Bulgaria 0.57 11.4 65.4 41.3 0.49 0.16 10 7 5 12 8 11 53 8.83 11
Cyprus 0.48 5.1 75.4 90.7 0.32 0.20 12 12 1 2 11 7 45 7.50 7
Czech Republic
1.84 16.5 70.4 73.8 0.99 0.84 3 3 2 5 2 1 16 2.67 1
Estonia 2.38 11.3 66.7 69.3 0.77 0.56 2 8 4 7 3 2 26 4.33 3
Hungary 1.21 8.3 60.4 70.1 0.74 0.17 4 10 11 6 5 10 46 7.67 8
Latvia 0.70 10.7 65.0 54.8 0.49 0.19 8 9 6 10 8 8 49 8.17 9
Lithuania 0.92 18.7 64.4 62.5 0.75 0.23 5 1 9 9 4 6 34 5.67 5
Malta 0.73 8.0 60.1 93.7 0.64 0.03 7 11 12 1 7 12 50 8.33 10
Poland 0.77 15.8 64.6 66.8 0.46 0.19 6 4 7 8 10 8 43 7.17 6
Slovakia 0.68 18.3 64.6 81.5 0.67 0.50 9 2 7 3 6 3 30 5.00 4
Slovenia 2.47 14.8 70.3 80.5 1.24 0.43 1 6 3 4 1 4 19 3.17 2
Note. Source: Eurostat, 2012.
Challenges Ahead
Monetary authorities become more and more aware of the importance of labor as a variable in the
macroeconomic equations. This is particularly supported by certain recent phenomena such as: migration and
remittances; rigidity of labor and wages in certain markets and the rising importance of services and associated
labor in the production function.
Migration and Remittances
A relatively new phenomenon in the European Union is represented by the migration of low-skilled labor
force from Eastern to Western countries and the subsequent remittances for their family members left in the
origin countries. According to World Bank data, remittances at global level amounted for over 230 billion dollars

HUMAN RESOURCES DEVELOPMENT AND MIGRATION 101
in 2004. For numerous European and Central Asia countries, remittances represent a second source of external
financing after foreign direct investments or could even be the main source of external financing as is the case of
Moldova and Albania. In low income countries, remittances represent approximately 20% of household expenses.
Moreover, in countries like Moldova, Serbia, and Montenegro, remittances account for half of total export
inflows, while in Albania and Bosnia-Herzegovina, they are almost equal to exports.
This type of phenomenon, if properly managed, can prove beneficial for both the origin and the destination
country of migrant labor. For the destination country it is a source of labor needed in the production function of
the economy, especially in sectors such as services, constructions, and agriculture as well as a dynamic factor for
the economy. For the origin country of migrant labor and, consequently, the destination country of remittances,
this is a poverty reduction factor. This inflow of foreign currency supports economic growth and helps increasing
the living standard, smoothing social tensions. Various econometric models show contradictory results as regards
the impact of remittances on economic growth. Chami, Fullenkamp, and Jahjah (2003) conclude that, because of
asymmetries and uncertainties, remittances have, at the end of the day, a negative impact on the economic growth
in their countries of destination. However, using a similar model with slight changes and additional institutional
variables, Mansoor and Quillin (2006) show that remittances stimulate economic growth. Irrespective of these
contradictions, there are issues that have general validity, namely: (1) the scope and rhythm of remittances
decrease in time as families tend to gather either in the origin or in the destination country; (2) remittances
improve the balance of payments of the country where migrant labor originates; and (3) while active, labor
migration tends to have negative social consequences such as breaks in families unity and poor performance of
children left at home by their parents as well as stagnation in the communities deprived by a large share of their
active labor force.
A very debated effect of remittances flows is the one related to the appreciation of the real exchange rate and
the connected macroeconomic effects, such as: adverse effects on the tradable sector of the economy affected by
the associated loss of international competitiveness; reductions in the labor supply of the tradable sector in favour
of the non-tradable sector, wage pressure, and price increase in the non-tradable sector; widening the current
account deficit when consumption driven by remittances is also directed towards tradable goods, thus increasing
the demand for imports; inflationary pressures when remittances flows do not leave the country and inflate
monetary aggregates; distortions in the sectoral allocation of investments, given the fact that most of the
remittances flows are directed towards the real estate market, thus artificially inflating the price of assets.
Rigidity of Labor and Wages in Certain Markets
A recent study carried out by the European Central Bank (Christoffel, Kuster, & Linzert, 2006) highlights
the role of labor markets for understanding business cycle fluctuations and the implications for monetary policy
in particular. The focus of the analyses is linked to the approach of rigid labor markets when conducting monetary
policy based on regimes such as inflation targeting. Rigid labor market regimes can influence monetary policy
transmission mechanism according to an algorithm similar to the following one: nominal wage rigidity, the speed
of mobilizing idle labor resources and the cost of mobilizing them all influence the marginal cost of labor; this
will be transposed in firms’ marginal cost as part of their price setting mechanism and finally feed aggregate
inflation. Hence, it can be stated that wage inertia level and the efficiency of labor demand-supply matching

HUMAN RESOURCES DEVELOPMENT AND MIGRATION 102
process have a strong impact on monetary policy transmission mechanism. This is the reason for which the labor
market and wage flexibility have been considered key pre-requisites for an optimum currency area. The higher
the degree of wage rigidity, the stronger inflation persistence can be. In such a context, optimal policy should
deviate from the strict regime of inflation targeting and fully acknowledge the unemployment/inflation trade-off.
Thus optimal monetary policy should envisage a mix of inflation targeting and unemployment targeting.
Changes in the Production Function
If trend growth of GDP is a key ingredient for monetary policy determination, then volatility and
determination of trend growth must be understood as well as possible. Against this background it is worrying that
recently volatility of potential growth seems to have increased and its determination seems to have shifted,
whereas it is at first sight puzzling why and in which direction. Potential growth is the trend growth of the
economy. Actual growth is regarded as the result of this structural growth and the deviation from it due to the
business cycle stance. Insight in the level of structural or potential growth of the economy is important, e.g., for
monetary policy and to assess the employment situation. This is the more the case because short term economic
developments seem to have also become more volatile, less policy driven, and more difficult to explain
(Kolodziejak & Gherghinescu, 2005).
The trend is caused by underlying factors, which are the determinants of economic growth. These factors are
endowments or production inputs on the one hand and their respective productivity on the other hand. In the
history of economic thought it can be observed that the interest moves from the first sector of the economy,
agriculture, to the second, industry, in the course of the 19th century which also marks the birth of economics as
a science. Following the traditional concept of economic growth determination a capital stock that has been built
will always result in production as long as labour costs are in accordance with the competitive position or
technological position of that capital stock. However, with the preferences of the consumers drifted to the output
of the third and fourth sector of the economy, to commercial and non-commercial services, it is doubtful whether
a capital centred approach to potential growth determination is adequate. This is sometimes solved by the
introduction of human capital in the production function. What it is noticed nowadays is that the production
function of the economy changes in response to preference drifts, sectoral changes, and consumption changes.
Immigration/inflow of labor can trigger changes in the economic preferences for services that were previously
desired, e.g., because of aging, but not possible. Nowadays the service sector plays a major role in our economy.
In response to aging preference dynamics towards services may continue and deepen. Such an approach shows
that changes in the production function of the economy (i.e., shifts from the capital intensive sector—industry to
the labor intensive sector—services) are able to support economic growth even in economies characterized by
low accumulation, relatively low savings, and a relatively low capital output ratio (the case of USA or Canada).
This is in line with the Rybczynski (1955), a core result of Heckscher-Ohlin trade theory, stating that when a
region is open to trade with other regions, changes in regional relative factor supplies can be fully accommodated
by changes in regional output without requiring changes in regional factor prices.
Conclusions
Although historically ignored as significant variable for monetary policy decisions, human resources, under
their various facets, can play a crucial part in the formulation and transmission of monetary policy and are

HUMAN RESOURCES DEVELOPMENT AND MIGRATION 103
definitely crucial for supporting economic growth.
Several conclusions have been depicted from the present paper as regards the relevance of incorporating
human resources and labor dynamics in macroeconomic analyses and, in particular, in monetary analyses.
(1) Labor is an important factor in the production function of many economies. Moreover, labor dynamics
among countries can initiate changes in the preference dynamics for certain sectors (i.e., services) that had not
been able to be satisfied before. This explains how economies with low accumulation, relatively low savings and
a relatively low capital output ratio, but open to immigration flows have been able to efficiently integrate this
labor into the services sector and gain economic growth.
(2) Although quantity of labor is affected by low birth prospects across most of the developed countries,
quality of the human capital has gained importance through various initiatives such as investing more and more in
education, as well as in research and development. It has been statistically demonstrated (even though with a time
lag) that investments in human resources support economic growth and encourage mobility and flexibility in the
labor market as prerequisites for the functioning of optimum monetary areas.
(3) Effects of the remittances flows can not be neglected while formulating monetary and exchange rate
policies in the recipient countries as they are likely to feed real exchange rate appreciation, inflation, and
distortions in certain markets.
(4) Wage inertia level and the efficiency of labor demand-supply matching process have a strong impact on
monetary policy transmission mechanism. In rigid labor markets, an optimal monetary policy based on inflation
targeting should not neglect unemployment targeting.
References
Chami, R., Fullenkamp, C., & Jahjah, S. (2003). Are immigrant remittance flows a source of capital for development? Palgrave Macmillan, 52(1), 55-81.
Christoffel, K., Kuster, K., & Linzert, T. (2006). Identifying the role of labor markets for monetary policy in an estimated DSGE model. ECB Working Paper Series, No. 635.
European Commission. (2005). New proposals for growth and jobs under the next Financial Framework 2007-13. Retrieved from http://www.europa.eu
Eurostat Statistics. (2012). Retrieved from http://www.epp.eurostat.ec.europa.eu/portal/page/portal/statistics/themes Faia, E. (2006). Optimal monetary policy rules with labor market frictions. ECB Discussion Paper No. 698. Janger, J., & Raunig, B. (2007). Human capital and economic growth—Summary of the 35th Economics Conference of the
Oesterreichische Nationalbank (pp. 106-114). Monetary Policy and the Economy No. 3. Kolodziejak, A., & Gherghinescu, O. (2005). Preference dynamics, migration and potential growth: Implications for monetary
policy. Finance-Challenges of the Future Review, No. 3. Liebscher, K., Christl, J., Peter Mooslechner, P., & Ritzberger-Grünwald, D. (2006). Financial development, integration and
stability (pp. 186-207). USA: Edward Elgar Publishing. Mansoor, A., & Quillin, B. (2006). Migration and remittances: Eastern Europe and the Former Soviet Union (Europe and
Central Asia Reports). Washington: World Bank Publications. Mundell, R. (1961). A theory of optimum currency areas. The American Economic Review, 51(4), 657-665. Papademos, L. (2007). Inflation and competitiveness divergences in the Euro area countries: Causes, consequences and policy
responses. Proceedings from The ECB and its Watchers IX, ECB Press. Rybczynski, T. M. (1955). Factor endowment and relative commodity prices. Economica, 22(88), 336-341.

Chinese Business Review, ISSN 1537-1506 February 2013, Vol. 12, No. 2, 104-112
Customer! The Forgotten Stakeholder
Themistokles Lazarides, Stamatios Kontsas, Electra Pitoska
TEI of Western Macedonia, Grevena, Greece
During last two decades a shift in marketing, corporate strategy, organizational, and market dynamics has been
recorded. A series of corporate scandals like ENRON and others has shown that corporations have a significant
impact on a number of stakeholders and particularly customers. The notion that the customers can shift from one
product or service provider to the other may not be as valid as some theories suggest. The markets are not perfect
mechanisms and customers are not rational decision makers. Although marketing has introduced the corporate
culture—the customer-centric approach, the results are not as positive as they should be. The paper shows that
marketing and corporate governance systems have many common elements and in fact they can be complementary
in practice and theory. To establish the connection-correlation between them, the author is going to review the
literature from both disciplines. As a next step, an analysis of impact of the customer as a party that has an interest
in the firm is going to take place. Finally, two examples of this impact will depict the importance of a change in
scope—goal, strategy, and practices used by both disciplines in achieving the firm’s mission and goals. The author
shows that both can be benefit from the integration of mechanisms, principles, and practices used by the marketing
and corporate governance. The paper is the first step to create a theoretical convergence framework for these
disciplines that seem completely separate. Marketing and corporate governance specialists and theorists may
design a more comprehensive and holistic approach to customer that is more customer friendly, more long term and
establishes a more successful and value creation (for both the customer and the corporation) relationship.
Keywords: corporate governance, marketing, customer
Introduction
Until now corporate governance and marketing were considered to be two different. Drucker’s (2001)
definition of marketing is:
Marketing and innovation are the two chief functions of business. You get paid for creating a customer, which is marketing. And you get paid for creating a new dimension of performance, which is innovation. Everything else is a cost center. (p. 31)
According to Drucker’s definition, auditing, accounting, human resource management, etc. are secondary
functions of the firm and the main focus should only be in marketing, research and development and production.
Themistokles Lazarides, Ph.D., Associate Professor, Applied Informatics in Administration and Economy, TEI of Western Macedonia.
Stamatios Kontsas, Ph.D., Adjunct Lecturer, Applied Informatics in Administration and Economy, TEI of Western Macedonia. Electra Pitoska, Ph.D., Associate Professor, Financial Applications, TEI of Western Macedonia. Correspondence concerning this article should be addressed to Themistokles Lazarides, Grevena, 51100, Greece. E-mail:
DAVID PUBLISHING
D

CUSTOMER! THE FORGOTTEN STAKEHOLDER 105
This approach of business has been dominant throughout the 1980s, 1990s, and the previous decade. What
came as a surprise during the last 10 years was that customers found themselves in many cases to be without
choices and loosing substantial assets, value or money by the lack of products and services.
The recent events, scandals, crises and the subsequent legal framework and business’ redesign of their
functions and priorities show a shift in the business approach towards the market, the customer, the stakeholder
and especially their role in the economy. A new consciousness is formulating. They corporations seem to
understand or they beginning to understand that the customer-centric approach is to narrow to achieve their
goals and mission. The main cause of the shift is the change in corporate mission and goals in the new approach
of the economy and market.
This does not mean that the customer-centric approach has no merit any more. It is a fact that the
customer-centric approach was short-term and narrow in scope. In the era of accelerated decline of the product
life cycle, product complexity, huge capital invested, and enormous sizes of corporations’ innovation per se
cannot create the foundations for sustainable corporate growth (i.e., the “war” between Apple and Samsung for
the table computer). Notions like stability, respect, accountability, ethos, corporate fame, and trust have become
important to the customer. Hence, corporations have begun to realize that success cannot be achieved by
looking outward (marketing), but inward as well (corporate governance).
Corporate Governance Approaches
There are many theories—approaches for corporate governance but only one is incorporating the customer
as an interesting party in the corporate agenda. The main theories that do not incorporate the customer are: (1)
Managerial hegemony theory (Mace, 1971; Vance, 1983; Lorsch & MacIver, 1989) which mainly focuses on
the dominant position of managers at the top administrative and monitoring corporate bodies; (2) Resource
dependence theory. According to this theory, boards of directors can be the facilitators of obtain resources form
the corporate environment and adapting to this environment (Pfeffer, 1972, 1973; Pfeffer & Salancik, 1978;
Pearce & Zahra, 1991; Goodstein, Gautam, & Boeker, 1994); (3) Agency theory (Barney & Hesterly, 1996;
Eisenhardt, 1988, 1989; Davis, 1991; Fama & Jensen, 1983; Jensen & Fama, 1983; Fama, 1980; Jensen &
Meckling, 1976, 1994). The agency theory argues that there are principals (owners, shareholders) and agents
(managers). Both parties are rationally committed, opportunistic, risk averse and selfish. The main problem that
the theory recognizes is the alignment of interests between principals and agents.
The only theory of corporate governance that explicitly or implicitly incorporates the customer is the
stakeholders theory. According to the stakeholder approach (Freeman, 1984; Donaldson & Preston, 1995;
Vinten, 2000, 2001) all parties that have potentially an interest or risk in the firms’ function can or must be
involved in its governing process. In the economic literature, many of the parties have been analyzed to define
the influence and their impact on the firm’s performance or on the governing process.
Despite the obvious interaction that exists between a firm and not directly engaged parts in the decision
making process and the governance of the firm, the stakeholder approach has received a lot of criticism by both
practitioners and academics. It was only until recently when the growing concern of society for matters as
environmental protection, corporate responsibility, and the rising power of consumers’ protection associations,
that triggered a fruitful discussion on the role of customers as a stakeholder in a firm.

CUSTOMER! THE FORGOTTEN STAKEHOLDER 106
Sternberg (1997), an opponent of the stakeholder theory has expressed some arguments that according to
her invalidate the stakeholder theory. The arguments can be categorized into four groups:
(1) Stakeholder theory is incompatible with business.
Stakeholder theory argues that none of the interesting parties should be favored when choosing corporate
goals. The diffusion of focus, or focus on cross many goals—stakeholders lead to reduced effectiveness.
The holistic definition of stakeholders creates a potentially very large set of stakeholders and a
correspondingly large set of interests. This number is not manageable. This led some to try to limit the number
of interested parties on three, four, or more groups. One of the problems of selecting and grouping specific
number of stakeholders is the fact that a person may be a member of more than one group (e.g., the executive
manager can be a shareholder; the shareholder may be a creditor, etc.).
From the above it appears that the stakeholder theory describes a large number of parties, large sets of
interests, and high degrees of significance interest. How the company’s management will achieve in designing
a methodology for achieving equilibrium between these many combinations? The goal appears unattainable and
therefore the theory, according to Sternberg, is incompatible with entrepreneurship per se. Faced with this
dilemma, the leadership of the administration is more likely to choose the most commonly accepted company
goal or mission and exclude groups and parties that they seem that they have no bargaining power or influence
in the company’s management.
(2) Stakeholder theory is incompatible with corporate governance.
One of the most important principles of corporate governance is accountability (the others are
responsibility, fairness, and transparency (OECD, 2004; Fremond & Capaul, 2002)). The stakeholder theory
argues that the management should be accountable to all stakeholders. Accountability diffusion reduces its
efficiency, respectively, because accountability has a specific aim: to explain the mechanism—process of
fulfilling the objectives and results of operations have been performed. The large number of targets because of
the large number of stakeholders makes accountability chaotic and therefore ineffective.
The lack of weights and measures, by which to make comparisons is another disadvantage. The lack of
comparative analysis of the accountability process reduces the efficiency and pertinence. So the dominant
parties are not accountable to anyone.
The most extreme view of Sternberg (1997) is that by reporting and balancing the executives or the
company’s management with all stakeholders violates an important corporate governance mechanism, the
confidence with which they invested shareholders when managers hired.
(3) Stakeholder theory of accountability is unjustified.
The logic of the theory is that the company’s success will come from the creation of long-term mutually
beneficial relationships with all stakeholders. These relationships are critical success factor of the strategic
objectives of the company and may directly contribute even to maximize financial performance. Sternberg and
other liberal theorists argue that this argument should not serve as a pretext for the extension of accountability
to all stakeholders.
The second question is purely moral. The stakeholder theory argues that relations with all parties should
be based mainly on strong and lasting relationships interdependent stakeholders, both at home and abroad of
the company environment. According to this theory, the only targets that should the company make are those

CUSTOMER! THE FORGOTTEN STAKEHOLDER 107
that achieve a balance between all and can be considered common. The question of Sternberg is: Why exclude
the objectives of individual parties that are not common and because the company is not accountable for them?
A third argument is a parallel with the government. Interested parties are “citizens” of a peculiar state and
have corresponding rights and especially the right of accountability. Sternberg (1997, p. 6) argues that the
parallelism does not apply because the governments have a monopoly of power and the right to use force,
which does not apply to corporations. The company is based on voluntary organizations and not pushing or
forcing anyone to do anything. There is always the option of leaving companies and no one can argue the same
for a country’s citizens.
A final argument for accountability is that companies use resources of society to achieve their goals and
therefore the company should be accountable to society for the use of these resources. This creates a “contract”
between the company and society. The “contract” is an informal non-explicit regarding the fallout of the rights
and obligations of both parties and does not include additional methods of enforcing terms.
(4) Stakeholder theory undermines ownership, representation, and wealth.
The diffusion of monitoring and supervision to all stakeholders is equivalent to the loss of ownership. The
owner—shareholder may designate the use of his property or to exercise control over the use of his property.
... the fact that property rights may be weakly enforced provides no justification for violating them. An overworked or lazy police force may make theft easier to accomplish; it does not give robbers the right to one’s goods. Despite what stakeholder theorists suggest, the fact that shareholders are sometimes unwilling or unable actively to protect their interests does not entitle other stakeholders to commandeer corporate property. (Sternberg, 1997, p. 8)
The diffusion of responsibility that agents have to everyone, rather than just to shareholders, is
undermining the relationship between agents and shareholders. The undermining of the critical partnerships can
have devastating effects on the functional and organizational balance.
The stakeholder theory has its roots in the continental—German and Japanese model of corporate
governance, where the influence of stakeholders is taken under greater consideration when designing strategies
and selecting objectives for the company. In these models the concept of business is institutional and
investment time horizon is long. These differences create an identification of capital owner with the company,
and thus, the capitalist will place greater emphasis on relations with the environment inside the company
because he realizes that over time these relationships are those that create stability within the business and
growth prospects.
Marketing
Marketing during the last four decades has made a significant impact on the business environment and
changed dramatically the way corporations are creating—selecting strategies, developing product and services,
organizing their structures and departments and mostly allocating their resources. The importance of marketing
is shown by the statement of Drucker (discussed in the Introduction section of the paper) and its inclusion to
every curriculum of business schools around the world. Although marketing is so important or because of it
scholars and practitioners do not agree on one single definition. The better definitions are focused upon
customer orientation and satisfaction of customer needs. As shown by the definitions below, marketing is
evolving and adapting to the new business environment and especially to the expectations of the customer for
CUSTOMER! THE FORGOTTEN STAKEHOLDER 108
the corporation.
“Marketing is the social process by which individuals and groups obtain what they need and want through
creating and exchanging products and value with others” (Kotler, 1994).
“Marketing is the management process that identifies, anticipates, and satisfies customer requirements
profitably” (The Chartered Institute of Marketing (CIM)).
The CIM definition (in common with Barwell’s definition of the marketing concept) looks not only at
identifying customer needs, but also satisfying them (short-term) and anticipating them in the future (long-term
retention).
“The right product, in the right place, at the right time, at the right price” (Adcock). This is a snappy and
realistic definition that uses McCarthy’s 4Ps.
“Marketing is essentially about marshalling the resources of an organization so that they meet the
changing needs of the customer on whom the organization depends” (Palmer). This is a more recent and very
realistic definition that looks at matching capabilities with needs.
During the last two decades a change in defining marketing has taken place. In 1994, a definition of
societal marketing (applicable to not-for-profit organizations such as charities or schools) appeared:
Marketing is the process whereby society, to supply its consumption needs, evolves distributive systems composed of participants, who, interacting under constraints—technical (economic) and ethical (social)—create the transactions or flows which resolve market separations and result in exchange and consumption. (Bartles, 1968, p. 32)
The societal marketing concept holds that the organization’s task is to determine the needs, wants, and
interests of target markets and to deliver the desired satisfactions more effectively and efficiently than
competitors, in a way that preserves or enhances the consumer and the society’s well-being.
Marketing scholars and practitioners now are promoting the idea that marketing is all about creating long
term successful relations with customers. Marketing is shifting its time horizon from short to long term and
from 4Ps to relationship building.
Marketing and Corporate Governance in the Post Scandals Era
For many years the basic framework for firms was that marketing can offer the customer-centric approach
as a tool to achieve the satisfaction of their customers. Firms use the marketing process or function to promote
their products and services, in order to maximize the firm’s performance and customer satisfaction. Therefore
marketing processes and strategies can and must be held accountable for the relationship among a firm and her
customers.
Market inflexibilities, imperfections or inefficiencies can lock customer to his/hers selection. Hence
customers have an interest in firm’s operation, since product discontinue, or failure to uphold its promise to
deliver the product at the appropriate and agreed time, place and condition can have an enormous effect on the
customers performance, well being, and satisfaction. Customer is the base on which the firm functions and
operates. Effective markets have a significant impact on the governing and marketing process. The pseudo
customer-centric approach used by many firms that expropriate customers can lead to low quality management,
business ethics, and corporate governance.
The basic framework of the paper is that marketing can offer the customer-centric approach as a tool to

CUSTOMER! THE FORGOTTEN STAKEHOLDER 109
achieve the stakeholder approach. Firms are using marketing process or function to promote their products and
to maximize the firm’s performance and customer satisfaction. Marketing can and must be accountable for the
relationship among the firm and the customer. As marketing is taking up a considerable amount of both assets
and financial resources (almost 25 percent of expenditures is directly attributed to marketing), is also
responsible, in part, for the financial results (sales, profits, and cash flows). Marketing expenditures have the
goal to retain and expand the customer base. An expanding, financially successful, firm must change
organizationally to address the new issues raised by the challenges of the sales size and growth rate. Managers
may overinvest in marketing strategies, or in the creation of new products (R&D), in the hope of increasing
market share, through sales, with beneficiary effects on their salary (bonus), and their reputation in the
managerial labor market. However that behavior can be damaging for the interests of shareholders as it can lead
to overinvestment and reduced profits for the firm in the short run. An expanding, financially successful, firm
must change organizationally to address the new issues raised by the challenges of the sales size and growth
rate, not only for her existing and new customers but also for the shareholders as well.
The direct connection between the financial results and marketing has lead to an organizational and
cultural change that for some firms is implicit and for some other explicit. The driving factor of marketing to
organizational change is the need to focus on customer needs. The paradox is that even though marketing has
been the driving force behind the firms’ performance and change, organizational economics has shown very
little value to the customer as a stakeholder.
A firm can, using the marketing process—practices or techniques, to attract customers. Market
inflexibilities, imperfections or inefficiencies can lock customer to his/hers selection. Hence, customers have an
interest in firm’s operation, since product discontinue, or failure to uphold its promise to deliver the product at
the appropriate and agreed time, place and condition can have an enormous effect on the customers
performance, well being, and satisfaction. Customer is the base on which the firm functions and operates.
Effective markets have a significant impact on the governing and marketing process. The pseudo
customer-centric approach used by many firms that expropriate customers can lead to low quality management,
business ethics, and corporate governance.
Marketing and corporate governance are interconnected. They have some commonalities and some
differences. The commonalities are:
(1) Mechanisms. Both corporate governance and marketing use the same fundamental mechanisms: Trust,
reputation, implicit, and explicit contracts.
(2) They are process oriented.
(3) They are interest—performance or value focused.
(4) They both have a need for an internal control mechanisms and audit protocols.
(5) Information plays a crucial role in determining the effectiveness, the policies, principles, practices, and
the structures used.
(6) There are the same options: loyalty, voice, and exit.
(7) The integration of marketing and corporate governance is driven by corporate culture.
(8) Activism (stakeholder-shareholder and customer) can play a significant role in achieving excellence
and stability.

CUSTOMER! THE FORGOTTEN STAKEHOLDER 110
The differences are:
(1) Marketing is outbound and corporate governance is mainly an inbound process.
(2) Marketing focuses on customer alone, whereas corporate governance focus is broader in scope.
Examples
The cases used in this paper have some common characteristics. The first one is that both firms were
located in USA and they both are in sectors that customers—people find that consumption is inflexible (energy
and communications). The second one is that both use long term contracts with their customers.
Enron
“Enron Corp.” manipulated the energy market practically every day during the 2000-2001 power crunch
and gouged Western customers for at least $1.1 billion, according to audiotapes and documents released
yesterday.
The records were uncovered by the same utility that last month released details of profanity-laced
conversations in which Enron traders gleefully gloat about ripping off “those poor grandmothers” in California
during the power crisis.
The latest release by the Snohomish Public Utility District provides another glimpse into how Enron
allegedly rigged the market at the same time millions of Californians were suffering blackouts and paying
sky-high electricity bills.
Snohomish wants an administrative law judge to order Enron to surrender up to $2 billion in ill-gotten
gains. California politicians want Enron to reimburse customers there at least $8.9 billion.
The latest documents show that Enron manipulated the market on 473 of 537 days from January 2000 to
June 2001, the utility said “…Enron filed for bankruptcy in 2001” (Retrieved from
http://www.baltimoresun.com/business/bal-bz.enron15jun15,0,6782458.story).
The example of Enron shows that the firm failed to incorporate in its culture the customer-centric
approach and mostly failed to create long term relationships with its customers
WorldCom (Feder, 2002)
In the case of WordCom, customers were concerned about the availability of service:
“The vast majority of WorldCom’s customers are residential users of standard long-distance and local
phone service. But the ones that hold the key to its future are large telecommunications, government, and
business customers. WorldCom is the world’s largest carrier of Internet traffic, and many of these customers
buy Internet capacity from the company’s UUNet subsidiary or obtain private data networks or other highly
profitable services from other WorldCom units.
Many large customers are likely to stick with WorldCom as long as the company maintains service levels,
if only because shopping elsewhere might force them to buy from several vendors what they receive in one deal
from WorldCom. Only AT&T can match WorldCom’s scope.
In addition, some major customers are bound by contracts running as long as three years that they cannot
easily escape”.
Customers as shown in these two examples are stakeholders that have significant interest in the normal

CUSTOMER! THE FORGOTTEN STAKEHOLDER 111
operation, function, and viability of the corporation. Corporations that failed to realize the notion of stakeholder
and the customer-centric approach didn’t succeed. Furthermore, they have created a climate of distrust and
market anxiety to customers and other market participants.
Conclusions
The paper has shown that the two disciplines—sciences have much in common and they can work
complimentarily in order to create a new approach—framework for the understanding of the corporate
environment. Both of them are considered cornerstones of business successes and their shortcoming or failure
cornerstones of business failures. The degree of importance for the two disciplines is different and varies from
sector to sector and from country to country. Nevertheless corporations that ignore them is almost certain that
will fail in the modern corporate environment.
Empirical research is needed in order to validate the theory that these two disciplines can converge and
find common ground. If the empirical research validates the connection then there is a strong connection
between organizational economics, financial analysis and marketing and the new marketing’s definition can
have more emphasis on the stakeholder approach than the previous one.
References
Barney, J. B., & Hesterly, W. S. (1996). Organizational economics: Understanding the relationship between organizations and economic analysis. In S. R. Clegg, C. Hardy, & W. R. Nord (Eds.), Handbook of organization studies. Thousand Oaks, C.A.: Sage Publications Ltd..
Bartles, R. (1968). The general theory of marketing. Journal of Marketing, 32, 29-33. Davis, G. F. (1991). Agents without principles? The spread of the poison pill through the intercorporate network. Administrative
Science Quarterly, 36(4), 583-613. Donaldson, T., & Preston, L. (1995). The stakeholder theory of the modern corporation: Concepts, evidence and implications.
Academy of Management Review, 20, 65-91. Drucker, P. (2001). The essential Drucker. N.Y.: HarperCollins Publisher. Eisenhardt, K. M. (1988). Agency-and institutional-theory explanations: The case of retail sales compensation. Academy of
Management Journal, 31(3), 488-511. Eisenhardt, K. M. (1989). Agency theory: An assessment and review. Academy of Management Review, 14(1), 57-74. Fama, E. F. (1980). Agency problems and the theory of the firm. Journal of Political Economy, 88(2), 288-307. Fama, E., & Jensen, M. (1983). Separation of ownership and control. Journal of Law and Economics, 26, 301-325. Feder, B. (2002). Worldcom’s collapse: The customers; Many think service won’t decline further. Retrieved from
http://www.nytimes.com/2002/07/22/us/worldcom-s-collapse-the-customers-many-think-service-won-t-decline-further.html?pagewanted=all&src=pm
Freeman, R. E. (1984). Strategic planning: A stakeholder approach. Marshfield, M.A.: Pitman Publishing. Fremond, O., & Capaul, M. (2002). The state of corporate governance: Experience from country assessments. World Bank Policy
Research Working Paper 2858. Goodstein, J., Gautam, K., & Boeker, W. (1994). The effects of board size and diversity on strategic change. Strategic Management
Journal, 15, 241-250. Jensen, M. C., & Fama, E. F. (1983). Agency problems and residual claims. Journal of Law and Economics, 26, 327-349. Jensen, M. C., & Meckling, W. H. (1994). The nature of man. Journal of Applied Corporate Finance, 7(2), 4-19. Jensen, M., & Meckling, W. (1976). The theory of the firm: Managerial behavior, agency costs, and ownership structure. Journal of
Financial Economics, 3, 305-360. Kotler, P. (1994). Marketing management: Analysis, planning, implementation and control (8th ed.). Englewood Cliffs, New Jersey:
Prentice Hall.

CUSTOMER! THE FORGOTTEN STAKEHOLDER 112
Lorsch, J. W., & MacIver, E. (1989). Pawns or potentates: The reality of America’s corporate boards. Boston: Harvard Business School Press.
Mace, M. L. G. (1971). Directors: Myth and reality. Boston: Division of Research Graduate School of Business Administration Harvard University.
OECD. (2004). OECD principles of corporate governance. Paris: OECD. Pearce, J. A. II., & Zahra, S. A. (1991). The relative power of CEOs and boards of directors: Associations with corporate
performance. Strategic Management Journal, 12, 135-153. Pfeffer, J. (1972). Size and composition of corporate boards of directors: The organization and its environment. Administrative
Science Quarterly, 17, 218-228. Pfeffer, J. (1973). Size, composition, and function of hospital boards of directors: A study of organization—Environment linkage.
Administrative Science Quarterly, 18, 349-364. Pfeffer, J., & Salancik, G. R. (1978). The external control of organizations: A resource dependence perspective. New York: Harper
& Row. Sternberg, E. (1997). The defects of stakeholder theory. Corporate Governance: An International Review, 5(1), 3-10. Vance, S. C. (1983). Corporate leadership: Boards, directors, and strategy. New York: McGraw-Hill. Vinten, G. (2000). The stakeholder manager. Manager Decision, 38(6), 377-383. Vinten, G. (2001). Shareholder versus Stakeholder—Is there a governance dilemma? Corporate Governance: An International
Review, 9(1), 36-47. Zahra, S. A., & Pearce, J. A. II. (1989). Boards of directors and corporate financial performa: A review and integrative model.
Journal of Management, 15, 291-334.

Chinese Business Review, ISSN 1537-1506 February 2013, Vol. 12, No. 2, 113-123
Resolving Conflicts Within Multicultural
Teams in Industrial Enterprises*
Veronika Videnová, Dagmar Cagáňová, Paul Woolliscroft, Jana Makraiová, Miloš Čambál
Slovak University of Technology in Bratislava, Trnava, Slovakia
The aim of this paper is to highlight the issue of resolving conflicts within multicultural teams in industrial
enterprises. The authors build upon the concept of multiculturalism which seeks for possible ways to enable
different cultures to coexist and the means of communication between them. The authors base the study on the
assumption that extensively developed intercultural relationships lead to mutual understanding between people and
consequently to less interpersonal conflicts. In the introduction part, the authors explain the importance of
increased attention and interest in the area of multiculturalism. Industrial enterprises nowadays are increasingly
aware of this issue as they become more open to different cultures and they are confronted with intensive
international migration and previously isolated societies become more pluralistic. As a result of these processes,
individuals are more frequently in contact with members of different cultures. “Think globally, act locally” has
become a slogan for our society. This way of thinking and acting was transferred to almost all areas of life
(economic, political, and educational) and it is applied in the context of schools, societies, and enterprises as well.
The ability to understand and accept cultural diversity is becoming essential in the ordinary working environment.
It helps to create connections between emotional perception and rational acceptance. In practice, the offer of
training seminars about intercultural differences is widespread. Enterprises supporting the knowledge improvement
of their own employees have understood that a friendly working environment leads to increased motivation,
consequently reflected in their performance. The training focused on skills development in this area can help to
reduce interpersonal misunderstandings, bring new ways of conflict resolution and harmony in the workplace and
thereby also increase productivity. The authors focus on the “outdoor method” as an actual phenomenon, which is
used in teaching the topic of tolerance towards cultural diversity. They describe the individual stages of this method
* The paper is a part of the submitted VEGA project No. 1/0787/12, The identification of sustainable performance key parameters in industrial enterprises within multicultural environment.
Veronika Videnová, Ing., Ph.D. candidate at the Institute of Industrial Engineering, Management and Quality, Faculty of Materials Science and Technology, Slovak University of Technology in Bratislava.
Dagmar Cagáňová, M.A., Ph.D., Associate Professor, Senior Lecturer at the Institute of Industrial Engineering, Management and Quality, Faculty of Materials Science and Technology, Slovak University of Technology in Bratislava.
Paul Woolliscroft, M.Sc., Ph.D. candidate at the Institute of Industrial Engineering, Management and Quality, Faculty of Materials Science and Technology, Slovak University of Technology in Bratislava.
Jana Makraiová, Ing., Ph.D. candidate at the Institute of Industrial Engineering, Management and Quality, Faculty of Materials Science and Technology, Slovak University of Technology in Bratislava.
Miloš Čambál, M.Sc., Ph.D., Associate Professor, Director of the Institute of Industrial Engineering, Management and Quality, Faculty of Materials Science and Technology, Slovak University of Technology in Bratislava.
Correspondence concerning this article should be addressed to Veronika Videnová, Na hlinách 56, 91701 Trnava, Slovakia. E-mail: [email protected].
DAVID PUBLISHING
D
RESOLVING CONFLICTS WITHIN MULTICULTURAL TEAMS 114
and introduce a modified version of Tuson’s model as an effective tool for conflict resolution in the workplace. The
tools introduced in this paper, place particular emphasis on actions to prevent conflicts in the workplace. This paper
builds upon the theory of knowledge processing and its role as a theoretical basis for knowledge development in the
area of multiculturalism. Furthermore, it teaches us to be tolerant towards others, their habits, culture, and history.
“Strangers” can be a source of experience for us and they can enrich our personal lives. Discussion of the issues
surrounding multiculturalism and also the identification of sustainable key performance parameters within
multicultural work environments can contribute to more effective conflict resolution in the workplace and promote
awareness towards the tolerant coexistence and social cohesion.
Keywords: multiculturalism, interculturality, conflict resolution, Tuson’s model, outdoor method
Introduction
If we seek to understand people, we have to try to put ourselves, as far as we can, in that particular historical and cultural background. It is not easy for a person of one country to enter into the background of another country. So there is great irritation, because one fact that seems obvious to us is not immediately accepted by the other society or does not seem obvious at all. One has to recognize that countries and people differ in their approach to life and their ways of living and thinking. If we wish to convince them, we have to use their language of the mind. (Adler, 2008, p. 69)
The submitted paper discusses the current issues of multicultural/intercultural management, through the
discussion of culture and its implications on management and resolve conflicts within multicultural team in
industrial enterprises. The topic of interculturality has become more important and relevant than it was in the
past, this is especially so since 2004 when Slovakia joined the European Union. Industrial enterprises nowadays
are increasingly aware of this issue as they become more open to different cultures and they are confronted with
intensive international migration and previously isolated societies become more pluralistic. As a result of these
processes, individuals are more frequently in contact with members of different cultures and there is
assumption that this creates a number of various conflicts. The conflicts have always been around us and
always will be in our life. After all, history is amply demonstrated. The wars between states, disputes between
businesses, quarrels between friends, divorce between husband and wife have been around forever and we have
become accustomed to these conflicts that they look almost normal in our everyday life.
Understanding of Cultural
Culture as a concept has many definitions and there is no single agreed definition of culture. It is commonly
defined as a set of habits, relationships, feelings, art and other features that characterise a society or social group.
These features regulate the behaviour and communication of culture.
Kominarec and Kominarecová (2005) state that the culture is created of shared history, experiences,
traditions and social customs. It is how we behave as individuals and in groups. Sometimes the culture is
considered to consist only of those parts that are visible. However, they lose their meaning without knowing the
other parts of culture. They are not easily accessible. Authors consider that culture consists of two equally
important parts—directly visible and invisible parts. Culture can be compared to the iceberg in Figure 1. A small
part of it is above the water surface, but much larger part is hidden underneath water surface. Authors claim that,
it is very important to know especially this part of culture. International managers need research into culture

RESOLVING CONFLICTS WITHIN MULTICULTURAL TEAMS 115
because they need to be able to predict what behaviour is typical in routine situations and how members of the
culture group will behave in such situations. They should know both parts of culture. Generally, it could be said,
that it is recommended for managers and others people to be attentive to both parts of iceberg, as what is
perceived on the surface has its roots in bottom part.
Figure 1. The cultural iceberg (Own elaboration based on Hall and Mildread, 1989).
The arrival of many foreign investors raises the important requirement—to build a corporate culture
respectful of the natural Slovak working environment, but also embrace differences, brought by foreign
investors. Coffield, Moseley, Hall, and Ecclestone (2008) state that corporate culture can be defined as a set of
attitudes and behaviour towards its employees and stakeholders. It is mostly reflected if another competitor
enters the market and in case of a merger. Mergers of companies, each coming from different cultural
backgrounds can sometimes be troublesome, not only for employees, but also often with regards to the
company’s financial position. In this context, it is highly appropriate to apply the principles of intercultural
education.
Intercultural and Multicultural Management
The globalisation of business has broadened interest in the intercultural and multicultural dimensions of
management. It is necessary to understand the meaning of these terms and differences between them. Held,
McGrew, Goldblatt, and Perraton (1999) state that globalisation is a process whereby worldwide
interconnections in virtually every sphere of activity are growing. Some of these interconnections lead to
integration/unity worldwide, others do not.
According to Landis and Wasilewska (1999), the terms cross-cultural, multicultural, and intercultural are
used seemingly as having similar or at least overlapping meanings. However, these can be separated:

RESOLVING CONFLICTS WITHIN MULTICULTURAL TEAMS 116
Multicultural research focuses on several (usually more than two) cultures living side by side and deals with
basic psychological processes;
Intercultural is the most dynamic term of these focusing on the interaction between cultures on an
interpersonal level, for example, researching how the member of one culture is adjusting and acting in another
culture.
The main difference between intercultural and multicultural management is defined below. According to
authors, this paper is necessary in order to define and know this concept and differences for understanding this
issue:
Intercultural management is the most dynamic term of these focusing on the interaction between cultures on
an interpersonal level, for example, researching how the member of one culture is adjusting and acting in another
culture;
Multicultural management research focuses on several (usually more than two) cultures living side by side
and deals with basic psychological processes.
Resolving Conflicts Within Multicultural Teams in Industrial Enterprises
More and more often, we enter into relationships with other people from diverse culture backgrounds and
environments. This can cause the emergence of various conflicts of ignorance of other people and cultures. When
people think of the word “conflict”, they often think of wars or violence. However, conflict exists at all levels of
society in all sorts of situations. It is easy to forget that we experience conflict every day of our lives. Conflict
happens when two or more people or groups have, or think they have, incompatible goals. Conflict is a fact of life.
God made each of us in his own image, but he also made us unique. Therefore some of our views and opinions
will differ from those of others. Conflict often occurs because of a lack of respect for one another’s needs and
views. However, in most cases we resolve the conflict. From a personal level to international level, good
communication is usually used to overcome differences and to reach an agreement before violence breaks out. At
a personal level, we often do not realise we are overcoming our differences. It is important to remember that
conflict can be creative. Causes of conflict start because people do not agree about an issue. Issues of
disagreement in recent large-scale conflicts include territory, language, religion, natural resources, ethnicity or
race, migration, and political power. While a conflict starts because of an issue of disagreement, there are usually
background influences that fuel the conflict. The most important influence is power. Others include culture,
identity, and rights.
If managers want to prevent conflicts it is useful to know the concept of intercultural competence. Cagáňová,
Čambál, Luptáková, and Weidlichová (2010) defined that intercultural competency is an ability to understand
and interpret cultural differences, and to utilize this understanding to work effectively and successfully with
members of other cultures.
Resolving Conflicts at Work
Every society, organization, group, and family creates a culture of conflict, a complex set of words, ideas,
values, behaviours, attitudes, customs, and rules that powerfully influence how its members think about a
respond to conflict. Cultures of conflict are shaped in and by our experiences. They set parameters for what we
believe is possible when we are in conflict and define what we can reasonably expect, both of ourselves and of

RESOLVING CONFLICTS WITHIN MULTICULTURAL TEAMS 117
others. They shape our capacity to ask questions, alter how we see our opponents and ourselves, and tell us what
is acceptable and what is not.
Every workplace and organization, school and neighborhoods, family and relationship generates spoken and
unspoken rules about what we should and should not say and do when we are in conflict. Each of these entities
produces a separate and distinct culture that exerts enormous pressure on us to respond to conflict in traditionally
expected ways.
In conflict resolution workshops, we often ask, “What is one word or phrase that expresses what you do or
feel when you are in conflict?” People’s initial responses often include words like anger, frustration, silence,
shame, fear, stress, avoidance, and repression, nearly all of which are negative. Authors then ask whether there
are any positive outcomes from conflict, and people call out words like change, intimacy, learning, growth,
opportunity, communication, resolution, forgiveness, listening, trust, and completion. The positive words
represent what we all want, what is possible, and what is at stake in our conflicts, while the negative words
represent how we feel, what we are doing to each other, and how we are trying to get it. But if you try to use
negative means to achieve positive ends, you will quickly discover that it is nearly impossible to “get there from
here” that anger does not translate into trust, any more than shame builds self-confidence. Try this yourself.
Consider a recent conflict or miscommunication you experienced. List the first words that come to mind
regarding your opponent, both negative and positive, without censoring yourself, and see what feelings and ideas
emerge from your subconscious. Then ask yourself what led you to use the negative words, how you might
implement the positive ones, and how it might be possible to resolve your conflicts by turning the negatives into
positives. For example, if you feel frightened by your opponent, consider what it might take to overcome your
fear, talk calmly about the problem, and let it go.
According to Wiley (2005), you may find that the positive words reflect a deeper understanding and that
working through your conflict could dramatically improve your relationships and communications, while the
negative ones reflect a profound frustration at your inability to do so. Yet the negative words are likely to keep
you locked in conflict and stuck in cycles of distrust, while the positive ones, to become real, require you to get to
the bottom of the reasons why you came up with the negative words in the first place and to honestly and
empathetically participate in dialogue with your opponent. Doing so automatically starts to transform the
negative words in positive ones at their source inside you. Usually often hear managers argue that conflict
resolution and effective communication take too much of their time or that it costs too much to conduct a retreat
at which employees work on improving their communication skills and resolving their disputes. But consider
how much time and money this organization wasted by not addressing its unresolved conflicts and how little time
it took to set things right. Authors rarely calculate the emotional and financial costs of living with conflict and do
not consider the time it takes to not communicate effectively or not resolve our conflicts. Authors rarely include
in bottom-line calculations the time people spend getting upset or sick over unresolved conflicts, the time
dissipated in gossiping or talking to others about them, and the time wasted by not focusing on work. Authors do
not weigh in the balance the loss of morale, motivation, customer satisfaction, and future business that result from
employee unhappiness or the amount of damage inflicted on work relationships by conflicts between friends,
colleagues, and co-workers.

RESOLVING CONFLICTS WITHIN MULTICULTURAL TEAMS 118
Outdoor Methods and Tuson’s Model as Effective Tools for Conflict Resolution in the Workplace
There are a lot of possibilities about how we can resolve conflicts, but the best way is to prevent conflicts
before they happen. The training focused on skills development in this area can help to reduce interpersonal
misunderstandings, bring new ways of conflict resolution and harmony in the workplace and thereby also
increase productivity. The authors focus on the “outdoor method” as an actual phenomenon, which is used in
teaching the topic of tolerance towards cultural diversity. They describe the individual stages of this method and
introduce a modified version of Tuson’s model as an effective tool for conflict resolution in the workplace. The
tools introduced in this paper, place particular emphasis on actions to prevent conflicts in the workplace.
The ability to understand and accept the cultural differences is increasingly important in common working
environment. It helps to create the interconnection between how the differences are emotionally perceived and
how they are rationally processed. In practice, within the training market, there are many seminars and courses
offered in the field of multiculturalism and businesses that decided to invest in raising awareness of their
employees through various learning programs have understood the importance of creating friendly working
conditions within multicultural teams that consequently leads to motivation and performance increase.
The training aimed to develop intercultural tolerance skills can reduce interpersonal misunderstandings, as
well as bring new ways of conflict resolutions on the workplace.
Outdoor Methods
Working life, very similar to a personal life, has its brighter and darker sides. After a certain time the
working team can just like a couple slip easily into the stereotype and routine, or the exhaustion of unsolved
conflicts and persistent problems can occur. Whereas the couple found themselves in this situation is advised to
go for a holiday for few days or temporarily separate to find how to cope, the employers can offer their
employees outdoor training, thus actively relax with plenty of activities and games, which can moreover initiate
positive desired changes in an organization.
Outdoor methods are recently the most used among training methods with focus on gaining intercultural
knowledge. Through creating the trustful atmosphere at outdoor activities, the working team starts to open
towards the needs of all individuals who are then able and willing to point out the conflict reasons and they are
ready to try to find the best ways out. The outdoor training programs are based on a theory of “experimental
learning” or so called “adventure learning”, which means acquisition of knowledge through you own practical
experience. The firsthand experience is the best remembered one and better used in everyday life. Therefore the
courses participants must face various tasks full of challenge and need for decision making, where original and
unconventional solutions are mostly valued. Special case studies and physical activities are taken as model
situations in this kind of learning.
Essential features of outdoor training are:
Dynamic training programs based on first-hand experience;
Model situations and real situations solving;
Active participating within small groups;
Inspirational natural surroundings.

RESOLVING CONFLICTS WITHIN MULTICULTURAL TEAMS 119
Outdoor training in most cases represents a combination of physical activities and learning seminars held
indoors. A team learning where on one side stands a group of lecturers and on the other side group of
participants is the most often used and team cooperation leads to better results, compared with individual
training. This kind of training enables to include such procedures that would be difficult to apply into a
common learning.
Advantages (strengths) of outdoor programs:
The creative approaches are developed to eliminate automated activities and routine;
Developing of fulfilled relationships rather than just formal structures;
Active behaviour rather than passive soaking of information;
Thanks to physical activities, the participants discover the joyfulness of physical exercising and
maintaining the good physical well-being. They include the analysis and feedback.
Tuson’s Model
In practice it is often seen managers or supervisors trying to manage the team of people within the
international company with the evident punctuality typical for Germans, but from the perspective of Slovak
employees they are very restrictive, leaving no space for flexibility and spontaneity. In the same moment we
can mention emotionality and expressiveness of Italians, modesty of Britons, or Japanese esteem and shyness.
Intercultural education is focused particularly on understanding and accepting of the principles of other
people’s acting. Every action promotes reaction and different reactions than expected can after some time
reflect in uncertainty or reducing of reassurance. Resolving conflict often depends on the skill of a leader. The
Tuson’s model gives low priority to efficiency (doing things right) but high priority to effectiveness (doing the
right things).
The authors of this paper characterize Tuson’s model according to three zones in Figure 2.
“Comfort zone”—it is the zone in which an individual feels safe, and is familiar with the environment,
people and the ways of working. But it is also an environment where he does not learn anything new, since he
acts based on his previous experience and knowledge and primarily he does not feel the need to change
anything.
“Learning zone”—or so called “stretch zone”—is represented by the space where an individual hits his
current limits of abilities and skills and finds out they can be developed beyond those borders. In most cases the
impulse for changing the way of acting or stepping out from worn out track comes from internal or external
environment.
“Panic zone”—usually means crossing the current limits of an individual and from the perspective of
gaining knowledge and skills there is no way further, because of the risk of regression, resulting from bad
experience and fear.
When conducting intercultural trainings we try to get the participants from the “comfort zone” to the
“learning zone” precisely by involving them into aforementioned outdoor activities. Firstly they might feel
uncertain about it, like being in the unknown environment. However with gradual learning and acquiring both
theoretical and practical knowledge and skills, their “comfort zone” expands.
From the intercultural perspective the “comfort zone” represents you own culture, whereas the “learning

RESOLVING CONFLICTS WITHIN MULTICULTURAL TEAMS 120
zone” is represented by the space for interaction with other cultures and finally the “panic zone” is a source of
misunderstandings and social conflicts. The aim of outdoor learning is to simulate specific situations that can
help to extend the “comfort zone” range by being active in their “learning zone”. It helps to understand and
respect differences, raise the motivation to cooperate and act adequately to the situation.
Figure 2. Tuson’s model (Own elaboration based on Balogová, 2005).
“KEMSAC” Strategy—Strategy of Multicultural Education
According to Kominarec and Kominarecová (2005), KEMSAC Strategy model was originally developed
in educational practice. The letters in the word KEMSAC stand for the whole processes, which are the part of
this model and they will be explained below. KEMSAC model can be stated as an important tool for
multicultural education as well. This way of educational orientation could offer preconditions for personal
development within multicultural teams, whose individual members are able to take responsibility for their
behaviors and actions, they respect each other, can contribute to smooth communication and coexistence on
local as well as global level.
“K” for Knowing—the aim is to learn how to process information, develop and manage thinking, resolve
conflicts using algorithms and heuristics and finally how to explore. These mentioned abilities are essential for
coexistence in multicultural society.
“E” for Emotion—represented in methods for emotionality development, which are aimed to learn how to
acquire a self-positive attitude, feel positive about other people, work and world. In brief, it could be conclude
this is nothing more that emotional intelligence development.
“M” for Motivation—the theory tells us about ways how to motivate employees, maintain their interest in
the topics, particularly the issue of multiculturalism, which supports learning from each other, mutual
communication, understanding and creative problem solving. Experiential learning provides the learners
personal motivation, and if we use the relational frameworks and appropriate motivators (Kolb’s cycle of
learning, Gardner’s theory of multiple intelligence types, etc.), we can achieve high motivation in individuals
which will consequently result in their success, personal development, interests and needs increase and finally
problem solving competency.
Panic zone
Learning zone
Comfort zone
Usually harmfulor threatening

RESOLVING CONFLICTS WITHIN MULTICULTURAL TEAMS 121
“S” for Socialization—the aim of the socialization is individual’s inclusion into society by the
socialization process in which the individual get familiar with the socially accepted values and dispose of
undesirable (unfavorable) attitudes instead. Compared to this, when taking a new job or upon transferring to
another job position, each employee has to undergo an adaptation process, which based upon active social
learning and results in working, social and corporate culture adaptability. The adaptation process uses methods
of which develop skills and abilities to communicate effectively, cooperate with others, help each other, but
also find their own way to the satisfaction based on good relationships on all levels (intrapersonal, interpersonal,
multicultural, etc.)
“A” for Autoregulation—means self-control, which represents pointing of internal energy the right way in
order to master emotions, wishes and achieve personal goals. In other words, it can be said it is pointing of
energy towards to the values like tolerance, respect, helpfulness, and endurance. Value education uses methods
that are based on self-reflection and self-evaluation and they help to recognize personal goals, sense of being,
ideas of personal fulfillment, and within the multicultural education equip team members with tools to observe
the attitudes and values expressions of people from different cultures.
“C” for Creativity—means discovering new unusual ways of coexistence of cultural different people and
also solving problems related to diversity in general. Methods of enhancing creativity in multicultural education
are aimed at revealing ways to improve our world.
Kolb’s Learning Cycle
According to Coffield et al. (2008), learning is the process whereby knowledge is created through the
transformation of experience. Kolb proposes that experiential learning has six main characteristics.
Authors of this paper identify and share Kolb’s opinion that learning is the process whereby knowledge is
created through the transformation of experiences. They propose to apply six main characteristics of experiential
learning to use on the multicultural education and for understanding what is multicultural education.
Authors define this characteristic of multicultural learning:
Multicultural learning is best conceived as a continuous process grounded in experience, not in terms of
outcomes;
Multicultural learning requires the resolution of conflicts between various cultures;
Multicultural learning is a holistic process of adaptation to the world and involves transactions between
the person, group, team, and the environment;
Multicultural learning is the process of creating knowledge that is the result of the transaction between
culture one country and culture of other country.
Kolb (2010) state that Kolb’s learning theory sets out four distinct learning styles, which are based on a
four-stage learning cycle. In this respect, Kolb’s model differs from others since it offers both a way to
understand individual learning styles, and also an explanation of a cycle of experiential learning that applies to
all learners. “Experiential” means relating to or resulting from experience while “experimental” means relating
to or based on experiment. Kolb uses the term “experiential” as his theory is based more on reflection of
experiences. While others use “experimental” when referencing experimental-inquiry a technique that requires
learners to test hypothesis (experiment) about content knowledge. Kolb theorized that the four combinations of

RESOLVING CONFLICTS WITHIN MULTICULTURAL TEAMS 122
perceiving and processing determine one of four learning styles of how people prefer to learn. Kolb believes
that learning styles are not fixed personality traits, but relatively stable patterns of behavior that is based on
their background and experiences. Thus, they can be thought of more as learning preferences, rather than styles.
According to authors, it is necessary to explain the importance of increased attention and interest in the
area of multicultural learning. The Kolb’s theory of understanding we can also apply and use for multicultural
learning. It is source learning of development people which work together in workplace and they are from
diverse cultures. In team, where various people work together and they have diverse culture, habits, knowledge,
etc. all members are supposed to take care of each other and get to know each other. All mentioned attributes
are helpful in building of stable and effective multicultural teams. Finally, it helps to increase motivation to
work, productivity on workplace and performance of employees. Steps of multicultural learning process are
shown in Figure 3. This figure provides a learning cycle that involves four processes that must be present for
learning to occur. Depending upon the situation or environment, the learners may enter the learning cycle at
any point and will best learn the new task if they practice all four modes.
Figure 3. Kolb’s learning styles (Kolb, 2010).
Steps in the learning process according to Kolb (2010):
Concrete experience (feeling): Learning from specific experiences and relating to people. Sensitive to
other’s feelings;
Reflective observation (watching): Observing before making a judgment by viewing the environment from
different perspectives. Looks for the meaning of things;
Abstract conceptualization (thinking): Logical analysis of ideas and acting on intellectual understanding of
a situation;
Active experimentation (doing): Ability to get things done by influencing people and events through
action. Includes risk-taking.
Authors of this paper state some examples.
Learning to coach:
Concrete experience—Having a coach guide you in coaching someone else;
Active experimentation—Using your people skills with what you have learned to achieve your own
coaching style;

RESOLVING CONFLICTS WITHIN MULTICULTURAL TEAMS 123
Reflective observation—Observing how other people coach;
Abstract conceptualization—Reading articles to find out the pros and cons of different methods.
Learning algebra:
Abstract conceptualization—Listening to explanations on what it is;
Concrete experience—Going step-by-step through an equation;
Active experimentation—Practicing;
Reflective observation—Recording your thoughts about algebraic equations in a learning log.
Conclusions
As the whole world becomes connected and globalized, we can see the interactions of different cultures in
every part of our lives, not only in professionally, but in personal relationships as well. People have various
backgrounds represented in their cultural identity, they have different expectations, ways of thinking and acting,
which sometimes can lead to misunderstandings and conflicts, therefore it is of great importance to place an
emphasis on understanding and accepting those coming from other cultures. This is the main reasons why is
necessary to know and apply multicultural education in industrial enterprises. This paper built upon the theory of
knowledge processing and its role as a theoretical basis for knowledge development in the area of multicultural
education. The authors explained the importance of increased attention and interest in the area of multicultural
education. In the paper, the authors described the strategy of “KEMSAC” and Kolbe cycle. Kolbe cycle usually
focuses on multicultural education in schools. The authors suggested this cycle to be applied for multicultural
teams in industrial enterprises. Furthermore, it teaches us to be tolerant towards others, their habits, culture and
history. “Strangers” can be a source of experience for us and they can enrich our personal lives.
This research in the area of multiculturalism, multicultural education and improve the performance of
multicultural teams will be continue, because the authors of the article carry out the research in this area during
the doctoral study.
References
Adler, N. J. (2008). International dimensions of oganizational behavior (2nd ed.). Boston, M.A.: PWS-KENT Publishing Company.
Balogová, B. (2005). Interkulturálne tréningy navodzujú atmosféru dôvery. Retrieved from http://podnikanie.etrend.sk/podnikanie-riadenie/interkulturalne-treningy-navodzuju-atmosferu-dovery.html
Cagáňová, D., Čambál, M., Luptáková, W. S., & Weidlichová, L. (2010). Intercultural management—Trend of contemporary globalized world, 21st EAEEIE. Electronics and Electrical Engineering, 6(102), 51-54.
Coffield, F., Moseley, D., Hall, E., & Ecclestone, K. (2008). Learning styles and pedagogy in post-16 learning: A systematic and critical review. Retrieved January 15, 2008, from http://www.lsda.org.uk/files/PDF/1543.pdf
Held, D., McGrew, A., Goldblatt, D., & Perraton, J. (1999). Global transformation. Stanford, C.A.: Stanford University Press. Hall, E. T., & Mildread, R. H. (1989). Understanding cultural differences: Germans, French, and Americans. Yarmouth, Maine:
Intercultural Press. Kolb, D. (2010). Experiential learning: Experience as the source of learning and development. Englewood Cliffs, New Jersey:
Prentice Hall. Kominarec, I., & Kominarecová, E. (2005). Multikulturalita a edukácia. Prešovská univerzita v Prešove, Fakulta humanitných a
prírodných vied. Landis, D., & Wasilewska, J. H. (1999). Reflections on 22 years of the international. Journal of Intercultural Relations, 23(4),
535-574. Wiley, J. (2005). Resolving conflicts at work: Eight strategies for everyone on the job. San Francisco, C.A.: Jossey-Bass.
Chinese Business Review, ISSN 1537-1506 February 2013, Vol. 12, No. 2, 124-130
Application of Management Information System Planning in
Concurrent Engineering for Wooden Furniture Industry
Sakkarin Choodoung, Uttapol Smutkupt
Chiang Mai University, Chiang Mai, Thailand
This research is a development in management information system (MIS) planning based on operation analysis and
development according to concurrent engineering approach and reestablishment of database management.
According to our case study industry, such industry currently used traditional network systems such as LAN, and
“Bus Network” Network Topology. Client/Server distributed computing has a problem with database management
in data redundancy, data inconsistency, and data independency. For Network Topology, Bus Network has problem
with multitasking since the network are able to handle only a set of data at a time so the traffic problem will occur
when multiple users request for the service. Thus, such condition is inconsistent with concurrent engineering which
must be able to access the data simultaneously. As a consequence, this study develops a network system, network
system of working system, using LAN and “Star Network” network topology. The file server processing
distributed is an application while database is stored in host computer or file server but the data will be processed in
users’ computer. When the user needs to access the data, file server will send it to the user and the user can further
analysis or manage such data in the user computer, so called “Hierarchical Database Model”. Hierarchical database
structure is easily developed like general organization command structure with different level of responsibility. In
details, the data level in the database is divided into three levels including DB1, DB2, and DB3, so development of
simultaneously systemic flow and access of various critical data is performed in parallel. Furthermore, this is
consistent with access of all three data levels including: Level 1 is overall dataflow of both inside and outside the
organization; Level 2 is dataflow of each division in the organization; and Level 3 is dataflow of subunit in each
division in the organization. After systemize flow and access of data with concurrent engineering as mentioned, it
provided optimal efficiency in the whole production system management reducing loss in the whole system of the
organization.
Keywords: management information system, concurrent engineering, wooden furniture
Introduction
Nowadays, to provide competitive capability in design and development process and production, it requires
Sakkarin Choodoung, Candidate Doctoral, Department of Industrial Engineering, Chiang Mai University. Uttapol Smutkupt, Ph.D. of Engineering, Assistant Professor, Department of Industrial Engineering, Chiang Mai University. Correspondence concerning this article should be addressed to Sakkarin Choodoung, Department of Industrial Engineering,
Chiang Mai University, 239 Huay Kaew Road, Muang District, Chiang Mai, 50200, Thailand. E-mail: [email protected].
DAVID PUBLISHING
D
APPLICATION OF MANAGEMENT INFORMATION SYSTEM PLANNING 125
correct response to market demand as well as competition in timing which differs from the past with slow
changes in product because of low competitors. Hence, the low competitive market is called oligopoly then the
market behavior depends on manufacturer policy. In the past, all production has changed gradually which always
affected by the concept of lesser change causes lesser cost restraining development. At present, however,
market’s competition is extremely high so all manufacturer have to produce high quality product with low cost as
well as develop new product in minimum amount of time to response the consumer demand. Generally, the most
effective design development in very limited amount of time can be done with collection of specialists from
various field of expertise. Concurrent engineering approach to product design and development has two major
themes: The first theme is establishing an integrated product and process organization (PPO). This is referred
herein as process taxonomy; The second theme is applying this process taxonomy (or a set of methodology) to
design and develop a total product system. This is referred to as integrated product development (IPD). As a
result, it may say that concurrent engineering will accelerate the product to the market. The amount of time used
in product development in each type of product to plan about model development, technology, and
manufacturing process rushing the product into the market as fast as possible to provided benefits from the new
product. Therefore, it is unavoidable that the design development and production in parallel require cooperation
among various divisions both directly (i.e., R&D, production, QA & QC) and indirectly (i.e., inventory,
purchasing management, sales). If application of concurrent engineering lacks of good information management,
it will cause complexity and high risk of error. Hence, information management planning using IT system can be
an effective way to adapt concurrent engineering in practice. Walter I Kennevan described a popular concept for
MIS as an organized method of providing past, present, and projection information relating to internal operations
and external intelligence. It supports the planning, control, and operational functions of an organization by
furnishing uniform in the proper timeframe to assist the decision-making process. MIS system planning with
concurrent engineering is very suitable for a product with constantly change and development in model such as
communication devices, clothing, etc., still, this is also true with furniture industry which contains incessant
change and design development. Moreover, present furniture industry has tendency with smaller lot size with
more variety. As a result, this study considers the furniture industry as case analyzing with concurrent
engineering to adapt with planning Management Information System (MIS) in wooden furniture industry.
Research Methodology
Current Data Flow System
According to the case study industry’s data flow system, it indicates that the current work system contains
problem in ambiguity of data usage, objective, and destination. Thus, it shows low efficiency concerning with
input or cost of the system. The current work system has a problem with document processing time requiring
reduction in such time period to reduce the cost. Furthermore, it also indicates that each division store their own
data (see Figure 1) and the network system consisted of LAN, “Bus Network” network topology, and
client/server distributed computing.
Access of database in the case study industry shows problem from data file system including data redundancy,
data inconsistency, and data independency. For Bus Network (see Figure 2), the problem causes by only single
available set of data at a time so the traffic problem will occur when multiple users request for the service.

APPLICATION OF MANAGEMENT INFORMATION SYSTEM PLANNING 126
Figure 1. Current IT database system.
Figure 2. Bus network.
Development of New Work System
This is adaptation of engineering data management in concurrent engineering to facilitate the cooperation
among divisions providing data unification and correlation. Therefore, it can rapidly process considerable
amount of data and effectively store such data providing rapid access as well as accelerate the communication
through computer network whether in machine to machine or human to human or human to machine
communication. The processes are as follows.
Prioritize the data flow dividing into divisions including financial and account division, human resource
division, sales and marketing division, health and safety division, and engineering division for access of
necessary and related data.
Data correlation combing each division’s databases into single database system (see Figure 3). Network of
IT work system using LAN and “Star Network” network topology (see Figure 4).
Figure 3. Data correlation.
File Server Processing distributed computing. This is an application while database is stored in host
computer or file server but the data will be processed in users’ computer. When the user needs to access the data,
file server will send it to the user and the user can further analysis or manage such data in the user computer.
Finance and Accounting `
Sales and Marketing
Engineering
HR.
The health and safety
`
`
`
`
DBMS

APPLICATION OF MANAGEMENT INFORMATION SYSTEM PLANNING 127
Figure 4. Star network
Development of Database Access
For this study, the database is hierarchical database model. Hierarchical database structure is easily
developed like general organization command structure with different level of responsibility. However, data
stored in the database must have relationship as one to one or one to many, only. The top level data called “root”
while the lower level data called “child”. Therefore, the relationship of the data level can be described as “person
child relationship”. In this database, Person data level is able to have multiple “childs” while the “child” can only
have one “person”. In other words, an upper level data can have multiple lower level data but the lower level data
can only have one upper level data.
Advantage of this model is efficiency in data searching which causes by pre-prioritizing and predefined
correlation of data reducing unnecessary data searching. However, there is limitation in characterizing and
correlation defining of all data must be performed before structure building as well as limited searching capability.
Moreover, this structure is not universal.
Figure 5. Data flow diagrams inside the organization (DFDs Level 1).
Design and Development
Design and development of new work system based on concurrent engineering is organization’s IT system
design. This process applied the study results of current work system and problem in original system for
development of new work system based on concurrent engineering using Data Flow Diagrams (DFDs). After that,
`
Host
`
`
`
`

APPLICATION OF MANAGEMENT INFORMATION SYSTEM PLANNING 128
presentation to executives and users of case study factory was performed using DFDs as a tool to define range of
work system as well as help users to better understand the new system design.
Figure 6. Level 2 data flow diagrams of sales and marketing division (DFDs Level 2).
Figure 7. Level 2 data flow diagrams of production division (DFDs Level 2).
Figure 8. Level 3 data flow diagrams of financial and account division (DFDs Level 3).
APPLICATION OF MANAGEMENT INFORMATION SYSTEM PLANNING 129
System analysis is performed through DFDs to provide broadly understanding of data flow concept from
process or methods as well as result. Furthermore, this is consistent with access of all 3 data levels including:
Level 1 is overall dataflow of both inside and outside the organization (see Figure 5); Level 2 is dataflow of each
division in the organization, in this paper, illustrating by sales and market division and engineering division to
show data correlation with design and customer demand as shown in Figures 6 and 7; and Level 3 represents with
financial and account division with dataflow as shown in Figure 8.
Conclusions
Since engineering work system is main factory production, this study analyzes deeply in engineering data
flow. Generally, engineering division will access central data especially of division’s director for customer
demand, model, customer time requirement, or even customer preferred price for proper further operation
according to such conditions. Moreover, the engineering division also coordinates with various involved
divisions such as marketing division to ensure condition of the production, purchasing management division to
purchase parts and provide the reason of such purchase which can access in DB3. From there, manager will
submit analysis, report, and suggestion into DB2. The work of main engineering division can be divided as
follows: internally manage the division according to company goal, receive work order from marketing division,
design, develop, produce prototype, assess the price relating with marketing division. For the reason, these are
done with the mean to correct the understanding with the customer preventing errors, plan, and prepare the
material relating with purchasing management division, subject bills with purchasing management division and
financial division, plan, and operate production, monitor production employees and engineer for quality and
quantity relating with human resource division and safety division, and deliver finished and qualified product to
marketing division for further distribution. For all 8 aspects, the data is flow through DB2 for inter-division
communication.
For input data in DB3, they consist of production (material inventory, product preparation, product
shaping, product assembly, coloring, containing), maintenance (cutting edge, machine, unit system), store
(equipment, consumable, secondary), quality control (in-out system quality, inter-production quality).
With aforementioned data flow and access with concurrent engineering basis, the optimal efficiency of
whole production management and reduction of loss inside of whole organization can be archived.
References
Charoenchai, N. (2002). Modern product and industrial system. Chiang Mai: Faculty of Engineering, Chiang Mai University. Choodoung, S., & Smutkupt, U. (2012). Assessment’s DFM & DFA used for wooden furniture. Proceedings from International
Ph.D. Symposium on Industrial Engineering. Chiang Mai University, Thailand. Choodoung, S., & Smutkupt, U. (2012). Factor of successful wooden furniture design process. Proceedings from World Academy of
Science Engineering and Technology (WASET 2012). Chiang Mai University, Lucerne, Switzerland Edward, B., Magrab, S. K., Gupta, F., McCluskey, P., & Sandborn, P. A. (2010). Integrated product and process design and
development. New York, N.Y.: Taylor & Francis Group, LLC. Feirec, J. L. (1963). Wood working for industry. U.S.A.: Seventy printing. Franz, F., Kollmann, P., & Wilfred, A. C. (1975). Principles of wood science and technology. New York: Springer-Verlag Berlin
Heidelberg. Kengpol, A. (2004). Concurrent engineering. North Bangkok: King Mongkut’s Institute of Technology. Mitchell, P., & Watt, H. (2010). Strategies for the new american furniture industry. North Carolina: Cooperative Extension.

APPLICATION OF MANAGEMENT INFORMATION SYSTEM PLANNING 130
Prasad, B. (1997). Concurrent engineering fundamentals integrated product development. Upper Saddle River, New Jersey: PTR Prentice Hall.
Rujikiatkamjorn, P. (2010). Design methodology. Nation Science and Technology Development Agency Ministry of Science and Technology.
Skeist, I. (1977). Handbook of adhesives. New Jersey: Skeist Laboratories, Inc.. Sriboonchitta, S. (2008). Microeconomics. Faculty of Economics, Chiang Mai University. Sumin, K., & Hyun-Joong, K. (2006). Initial tack and viscoelastic properties of MF/PVAc hybrid resins used as adhesives for
composite flooring materials. Journal of Adhesion Science and Technology, 20(7), 705-722. Wagner, W. H. (1967). Modern woodworking tool materials and process. US: The goodheart-willcox company, Inc..

Chinese Business Review, ISSN 1537-1506 February 2013, Vol. 12, No. 2, 131-136
Creating the Foundation of a Healthcare Research Project
Bobeica Ana Maria
Academy of Economic Studies, Bucharest, Romania
The research topic of this paper develops a case study approach that builds on the foundations of Yin’s “linear
model” and “the best practice” used in theoretical case studies at international research literature. It discusses the
case study method and its role and focusing on research questions like healthcare branding, research design, and
methodic. Also presents the case study research theory for a research case study. The methods used in this paper are
based on hypothesis of a generic hospital branding strategy for the Romanian Private Hospital and also may apply
to the Romanian strategy of development of public healthcare entities and partnerships between public and private
healthcare entities. An empirical test of the relationships among branding loyalty and awareness, customer
satisfaction, trust and relationship commitment suggests that Romanian hospitals can be successful in creating an
image and positive brand equity if they can manage their customer relationships well. This can be done through a
coordinated strategy of management and marketing development of healthcare entities. The results highlight the
dominance of case-study research in qualitative marketing healthcare and highlight the importance of customer
relationships in the branding practice of healthcare marketing. It also shows that marketing managers can succeed
in creating positive brand equity and image if they can manage relationships with their customers well.
Keywords: healthcare marketing, research case study, branding in healthcare, customer relationship, brand equity,
healthcare research, case study research, quality of research, quality management
Introduction
The paper emphasizes on the best practice of a case study in the international literature, based on known
research and proposes a research model in the form a case study with multiple hypotheses and a research design
for the Romanian healthcare market. The importance of the research is everlasting by the fact that there is a
direct and positive connection between brand equity and customer relationship management. The entire
hypothesis proposed in this research is correct and represent a basis for a future analysis in a healthcare
research project of Romanian healthcare industry. Yin’s research theory as presented and discussed in this
paper and also “the best practice in practice” for a successful case study should be taken into account in order to
pursue, define, and succeed in creating a bright and intelligent research case study in the years to come where
branding and the principle defined by Gil Bashe are the basis for a successful healthcare marketing research.
Bobeica Ana Maria, Ph.D. candidate, Faculty of Marketing, Academy of Economic Studies. Correspondence concerning this article should be addressed to Bobeica Ana Maria, Sf Vineri 25, bloc 105c, ap 74, sector 3,
Bucharest, Romania. E-mail: [email protected].
DAVID PUBLISHING
D

CREATING THE FOUNDATION OF A HEALTHCARE RESEARCH PROJECT 132
The Case Study Method: Definition and Typology
Defined most generally the case study is a description of a management situation. In the paper Case Study
Research—Designs and method, Yin (2003) emphasizes on three different types of case studies: exploratory,
descriptive any causal, and explanatory. Further to the classification of case studies, there are various options
available to the researcher in terms of the design or structure of the case study project. The researcher can
employ either a single or a multiple case designs depending on different design situations and further to this
dichotomy, can also choose between an embedded and a holistic case study design, reflecting unitary or
multiple units of analysis within the case or cases. Yin (2003) outcomes an additional classification of case
study designs: embedded and holistic designs. This classification relates to the level of analysis within the case
or cases. Thus Yin’s typology of case studies results in a 2 2 matrix composed of a single case embedded
design, single case holistic designs, and multiple cases embedded designs and multiple case holistic designs. If
a case study is about a single organization, such as hospital (healthcare industry) and embedded design might
yield outcomes which are the best method used in order to have some major results an impact the market.
Short History of Case Study Research
There is a chronology over years of the quality of the papers which referr to the case studies research
phenomena. All of these rerearch have been published in diffferent studies across the time but there is a
convergence of the authors on the next one: 1971-1979: During this period of time some eight case study were
published during this times. For all of these published case studies, the principal characteristic is the lack of raw
data presented to usual readers. 1980-1989: Nine cases have been published during this 1980-1989. In regards
to research quality, all of these cases actually provided less data than those published before, even though
suggested standards were beginning to emerge when you are referring to the quality of business research. So
very few researchers considered some issues of validity that we had to divert from all considerations of validity
(construct and internal) into a single category called “validity”. The authors of the study have chosen to focus
on external validity as a different issue as more authors at international level considered this, but at the end of
their articles as a future theme to study. 1990-1999: Between this period of time, 27 cases have been published
during 1990-1999. As with the previous period, the debate regarding quality in case study research was intense
in the economic and business disciplines and qualitative research began to be published largely also in
important marketing journals. Furthermore, practical (non-theory) books on qualitative methods of research and
case research were also widely available. The in depth analysis of the research cases published during this
period of time showed that 59% provided had no methodological details, 52% provided no details on secondary
sources used, some 67% did not use any triangulation, 55% of the papers provided no justification for the
method used, and 63% of the case studies presented no raw data. 2000-2006: 61 research cases were published
during this period of time. The analysis shows the view that authors are more likely to address the issues of
quality, although much more could be done in order to allow colleagues to make real based judgments about
the issues of validity, reliability, and even generalizing. In conclusion, 62% of the research justified their choice
of method, 89% case studies provided enough background case or industry details in order to make judgments
on the conditions of findings, 72% of them provided sufficient detail about their methods of study, 36% of
them have provided detail about the questions asked and engaged in any triangulation, 31% of case studies
CREATING THE FOUNDATION OF A HEALTHCARE RESEARCH PROJECT 133
provided details about the analysis procedures, and 26% of the case studies provided raw data. Given the
increase in the number of cases published during this period, the emerging issues in relation to quality were
also more complex. As well as the issues covered above in previous sections (evidence that would allow any
judgments of quality), practical quality concerns are presented in regards to data information from large
samples of multiple case studies, the use of multiple secondary data, and the relative importance of various
quality methods. As seen above there is a continuous improvement over the years in general study, concept, and
research of case studies related to the marketing industry focusing lately into the concept of “quality research”.
Also there is an important need in the near future to make an analysis on the studies already published in the
recent literature since 2006 and 2013. We hope that our findings will notice significant improvement in the case
study analysis and theory of best practice which are important in all areas involved and explained here.
Key Characteristics of Case Study
After Yin, the characteristics of case studies are the following: Phenomenon is to be examined in a natural
setting with data being collected by multiple means. Also one or few entities (person, group, or organization)
are to be examined in order to be in connection with the complexity of the unit which is to be studied
intensively. Many of the case studies analyzed are more suitable for the exploration, classification, and
hypothesis development stages of the knowledge process in research case studies where the investigator should
have a receptive attitude towards exploration of new routes. No experimental control or manipulations have to
be involved in this phase and also the investigator may not specify the set of independent and dependent
variables in advance of the research. Also the results that derived depend heavily on the integrative powers of
the investigator of the research where changes in the site selection and data collection used methodology could
take place as the investigator develops new hypotheses of work. The case study research is useful in the study
of “why” and “how” questions because it deals with operational things that are tracked over time rather than
using the frequency or incidence meanwhile the focus being on the contemporary events.
Establishing Objectives of Research for a Case Study
In the case of a “qualitative research” which is the latest “option” in the area of case study marketing
research, the objectives for a future research in the area of healthcare rebranding may include: Qualitative
research is concerned primarily with process, rather than outcomes or products. First objective: Looking on the
process of rebranding. Qualitative research is interested in meaningful results. Second objective: Focus on the
theory versus practice, the qualitative research is the primary instrument for data collection and analysis. Third
objective: Collecting relevant data and analysis qualitative research involves fieldwork. Fourth objective:
Interview with relevant people, discussion with key people involved in the process, or relevant marketing
executives in healthcare and quality leaders. Qualitative research is descriptive in that the researcher is
interested in process, meaning, and understanding gained trough words or picture. Fifth objective: Based on
relevant data collection, make assumptions. The process of qualitative research is inductive in that the
researcher builds abstractions, concepts, hypothesis, and theories from details. Sixth objective: Make
conclusions, and add personal opinions based on relevant material. The characteristics of a case study
objectives are: (1) the case study must be significant; (2) the case study must be complete; (3) the case study

CREATING THE FOUNDATION OF A HEALTHCARE RESEARCH PROJECT 134
must consider alternative perspective; (4) the case study must display sufficient evidence; and (5) the case study
must be composed in an engaging matter.
Best Practice in Practice for a Case Study
(1) Primarily theory building case studies. The authors provide a linkage between their research effort and
theory; (2) The selection of case study phenomena is based on the rationale of purposeful sampling; (3) These
case studies include different sources of data, namely, in-depth interviews, observation, and archival records; (4)
The selection of interview respondents ensures that data is collected from actors with different perspectives
with respect to investigated phenomena (e.g., employees, management, internal and external actors of a firm
etc.); (5) The authors explain the process of data analysis; more sophisticated methods to data analysis are
employed: pattern matching and constant comparison of findings with theory; (6) The coding process is often
conducted using specialized software such as Nudist, N Vivo, or Decision Support Analysis software; (7)
Findings are presented using: within and/or cross case study analysis, case history analysis, thematic analysis,
comparison between theory and data; and (8) The authors apply some triangulation techniques (data, between
method and investigator triangulation) and possibly seek respondent validation on case study findings and
reports presented. All of these results are presented in future analysis and improve our view of the best practice
in practice for a case study. This is important also for the development of the research method and the model
presented below in the actual case study of this paper.
Healthcare Branding and the 10 Most Important Principles of Branding
Characteristics of a good healthcare brand can be summed up in the “10 Principle of Branding” at outlined
in the Bashe and Hicks’s (2010) book Branding Health Services: (1) Deliver on functionality; (2) Have a right
window of safety; (3) Be right on price; (4) Speak with “one tongue”; (5) Be operationally effective versus
merely operationally efficient; (6) Be “Glocal” (see second principle above); (7) Be an “outside in” brand; (8)
Be loyal; (9) Franchise, franchise, franchise etc.; and (10) Ace out in the “affinity” department areas.
Theory and Hypothesis for the Research
Healthcare managers and marketers face unique challenges today, due in part to the role the health care in
contributing to public welfare and global crisis. Hospital marketing in Romanian latest history is particularly
challenging since there are not many private institutes, most of the system being public, and the public not
making any type of advertising in order to attract customers. As a result, Romanian hospitals depend heavily on
customer relationship management (CRM). This study identifies some key factors that influence the creation of
brand equity with the help of customer relationships: trust, customer satisfaction, relationship commitment,
brand loyalty, and brand awareness. An empirical test of the relationships among these factors suggests that
hospitals can be successful in the creation of image and positive brand equity if they can manage their customer
relationships well. Proposed hypotheses: H1: Trust influences brand loyalty positively (+); H2: Trust influences
brand awareness (+); H3: Customer satisfaction influences brand loyalty (+); H4: Customer satisfaction
influences brand awareness (+); H5: Relationship commitment influences brand loyalty (+); H6: Relationship
commitment influences brand awareness (+); H7: Brand loyalty influences brand equity (+); H8: Brand

CREATING THE FOUNDATION OF A HEALTHCARE RESEARCH PROJECT 135
awareness influences brand equity (+); H9: Brand equity influences hospital image (+); H10: Trust influences
hospital image (+); H11: Customer satisfaction influences hospital image (+); and H12: Relationship
commitment influences hospital image (+). This can be also seen in Figure 1 (see Research Model).
Figure 1. Research model: Structural path diagram of theory and hypothesis.
Research Design, Method, and Model of Research
All these Hypotheses in this study are correct. At a first view, Romanian hospitals should focus their
marketing efforts on customers that trust the healthcare entity or the doctors that practice in the hospital. They
should invest resources to create and maintain this high level of trust for their medical service with the hope
that it will lead to positive brand equity and hospital image. So hospitals should create and maintain strong
customer relationships in order to increase customers’ commitment. They must remember the importance of
creating brand awareness in order to create positive brand equity and hence cultivate hospital image. Finally,
hospital managers must learn how to connect their brand loyalty to brand equity. Government official must
implement effective communicational plans in the public sector and marketing managers in the private
healthcare institutions through advertising and customer relationship management (CRM). This study shows
that managers can succeed in creating positive brand equity and image if they can manage relationships with
their customers well. Also shows the direct connection between these two important characteristics of the
model as very important key factors between: trust, customer satisfaction, brand loyalty, and awareness.
Important Conclusions and Recommendations
Our intent in this paper was to clarify the nature of the case research method, explain why it might be
utilized in marketing research studies and offer some suggestions for future construction and improvement of
the research paper on healthcare marketing quality and rebranding. We would argue that our review has given
insight into what case researchers in this field mean by “case study” and the best practices they associate with
this methodology. The main finding here was that Yin’s literature was a strong influence, not just on the
methodological literature in industrial marketing, but on research practice as well. This can be found in the
Trust
Customer
Satisfaction
Relationship
Commitment
Brand
Awareness
Brand
Equity
Brand
Loyalty
Hospital
Image

CREATING THE FOUNDATION OF A HEALTHCARE RESEARCH PROJECT 136
pattern of citations, with Yin by far the most popular source, as well as the widespread use of some of his key
recommendations, particularly purposeful sampling, triangulation, and systematic data analysis. The managerial
implications emphasize the importance of continuing to meet core brand values yet becoming relevant to
contemporary needs. The findings underscore a company’s need to fully understand and preserve its core
values and also undertaken some major steps in order to fulfill its destiny and succeed in the future markets.
References
Bashe, G., & Hicks, N. (2000). Branding health services. Gaithersburg, M.D.: Aspen Publishers. Benbasat, I., Goldstein, D. K., & Mead, M. (1987). The case research strategy in studies of information systems. MIS Quarterly,
11(3), 369-386. Beverland, M., & Lindgreen, A. (2010). What makes a good case study? A positivist review of qualitative case research, industrial
marketing management, 1971-2006. Industrial Marketing Management, 39(1), 56-63. Diamond, P. (1992). Organizing the health insurance market. Econometrica, 60(6), 1233-1254. Dubois, A., & Gibbert, M. (2010). From complexity to transparency: Managing the interplay between theory, method and
empirical phenomena in IMM case studies. Industrial Marketing Management, 39, 129-136. Fox-Wolfgramm, S. J. (1997). Towards developing a methodology for doing: Qualitative research: The dynamic-comparative
case study method. Scandinavian Journal of Management, 13(4), 439-455. Hindle, T., Checkland, P., Mumford, M., & Worthington, D. (1995). Developing a methodology for multidisciplinary action
research: A case study. Journal of the Operational Research Society, 46(4), 453-464. Järvensivu, T., & Törnroos, J. A. (2010). Case study research with moderate constructionism: Conceptualization and practical
illustration. Industrial Marketing Management, 39, 100-108. Lee, A. S. (1989). A scientific methodology for MIS case studies. MIS Quarterly, 13(1), 33-50. Piekkari, R., Plakoyiannaki, E., & Welch, C. (2010). Good case research in industrial marketing: Insights from research practice.
Industrial Marketing Management, 39, 109-117. Size, M. (2005). Rebranding: A case study approach. Dublin: Dublin Institute of Technology. Stuart, I., McCutcheon, D., Handfield, R., McLachlin, R., & Samson, D. (2002). Effective case research in operations
management: A process perspective. Journal of Operations Management, 20, 419-433. Yin, R. K. (2003). Case study research—Designs and method. Thousand Oaks, C.A.: Sage Publications.

Chinese Business Review, ISSN 1537-1506 February 2013, Vol. 12, No. 2, 137-149
How Many Family Businesses Are There Really and Does ICT
and Innovation Improve Their Performance?
Steve MacFeely
Central Statistics Office, Cork, Ireland
University College Cork, Cork, Ireland
Caitriona O’Brien
Central Statistics Office, Cork, Ireland
Depending on the source, a reader may be left with the impression that Family Businesses (FBs) typically account
for between 75% and 95% of all enterprises operating in an economy. This study, using official structural business
statistics from Ireland, suggests that in fact family businesses may account for a considerably smaller share of the
business economy, something closer to 46%. This paper attempts to explain how such a discrepancy can arise.
Using the Annual Services Inquiry compiled by the Central Statistics Office (CSO) as the anchor dataset, micro
data are linked to the e-Commerce and ICT survey, Community Innovation Survey and VAT registrations datasets
in order to determine whether labour productivity in Family Businesses (FBs) is significantly different to that of
Non-Family Businesses (NFBs) and if Information and Communication Technologies (ICT) or innovation has an
impact. The paper also highlights the significant impact that Foreign Direct Investment (FDI) makes to the Irish
economy. This analysis is particularly relevant for a small open economy like Ireland where 31% of traded services
GVA and 15% of employment is generated by multinational enterprises.
Keywords: productivity, Foreign Direct Investment (FDI), sole trader
Introduction
Depending on the source, a reader may be left with the impression that Family Businesses (FBs) typically
account for between 75% and 95% of all enterprises operating in an economy. This study, using official structural
business statistics from Ireland, suggests that in fact family businesses may account for a considerably smaller
share of the business economy; something closer to 46%. This paper attempts to explain how such a discrepancy
can arise.
Using the Annual Services Inquiry (CSO, 2007a) compiled by the Central Statistics Office (CSO) as the
anchor dataset, micro data are linked to the e-commerce and ICT survey (CSO, 2006b), Community Innovation
Steve MacFeely, Ph.D., Assistant Director General, Central Statistics Office; Adjunct Professor, Centre for Policy Studies,
University College Cork. Caitriona O’Brien, BSc, Central Statistics Office. Correspondence concerning this article should be addressed to Steve MacFeely, Central Statistics Office, Skehard Road, Cork,
Ireland. E-mail: [email protected].
DAVID PUBLISHING
D

HOW MANY FAMILY BUSINESSES ARE THERE REALLY 138
Survey (CSO, 2008b) and VAT registrations datasets in order to determine whether labor productivity in Family
Businesses is significantly different to that of Non-family Businesses (NFBs) and if technology or innovation has
an impact.
Data Sources
A number of different official and administrative data sources are utilised in this study. These data sources
are summarised below.
The Annual Services Inquiry
The Annual Services Inquiry (ASI) is a sample survey of approximately 18,000 enterprises, compiling
structural business data such as turnover, employment, purchases, international trade etc.. The statistical unit used
for the ASI is the enterprise, where an enterprise is defined as the smallest legally independent unit. One return is
sought in respect of each enterprise covering all constituent branches or local units. The enterprise activity is
determined by the predominant activity of that enterprise and any turnover and employment etc. generated by
secondary or ancillary activity is classified to the primary activity. The surveys covers the NACE Rev.1.1
sections G, H, I, K, and O. Non-traded dominated sectors such as health, education, and defence are excluded.
VAT registrations file. Value Added Tax (VAT) was first introduced to Ireland on November 1st, 1972.
The VAT file provided by the Revenue Commissioners1
There is no universal agreement on the characteristics that define a family business (Handler, 1989). Some
to CSO contains enterprise registration data, such as
registration number, customer type (individual, company, partnership etc.), registration date, date ceased, entity
name etc..
E-commerce & ICT. The enterprise survey of e-commerce and ICT is a sample survey of approximately
8,000 enterprises and compiles general information on ICT systems and other data such as, use of Internet,
e-commerce via the internet, e-commerce via EDI, barriers to e-commerce and electronic sharing of information
using Supply Chain Management (SCM). It covers NACE Rev.1.1 sections D, F, G, H, I, J, K, and O. The scope
includes all enterprises with 10 or more persons engaged, with the exception of the construction sector where the
scope is limited to enterprises with 20 or more persons engaged. This is a challenging survey to conduct; ICT is a
quickly evolving and complex area, and consequently compiling comparable year-on-year data is not always
possible. The use of broadband is difficult to measure accurately, as the term “broadband” in itself is meaningless.
Many respondents believe they have “broadband” but cannot provide the technical specifications, which are
necessary to compile robust and meaningful statistics.
The Community Innovation Survey. The Community Innovation Survey (CIS) is a sample survey of
approximately 4,000 enterprises and compiles general information on the enterprise and data on product, process
or organisational innovation, ongoing or abandoned innovation activities, innovation expenditure, barriers to
innovation and intellectual property rights. The survey covers enterprises with 10 or more persons engaged in the
NACE Rev.1.1 sections C, D, E, I, J, and NACE divisions 51 and 72 and NACE groups 74.2 and 74.3.
Definition of Family Business
1 The Revenue Commissioners are the taxation and customs authorities in the Republic of Ireland.

HOW MANY FAMILY BUSINESSES ARE THERE REALLY 139
have used the level of equity held by a single family as the criterion (Lansberg, Perrow, & Rogolsky, 1988)
whereas other criteria have ranged from family involvement in the management structure (Kepner, 1983) to
multi-criteria definitions (Smyrnios, Romano, & Tanewski, 1997). Litz (1995) proposed a categorization of
family business which defined a “pure” family business as being family managed and family owned. Others
such as Astrachan and Shanker (1996) have proposed a broader definition of family business based on a three
scale classification: broad, middle, and narrow. The broad definition includes little direct family involvement,
an intention to keep it in the family and the effective control of strategic development. On the other end of the
spectrum the narrow definition requires that the business be multi-generational, the family directly own and
run the business and at least one member of the family has significant management responsibility.
This scaling approach was further extended by Astrachen, Klein, and Smyrnios (2002) who developed what is
known as the “F:PEC” scale as a method for measuring the influence of the family in a business. This approach
defines the potential channels of influence a family can establish in a company (e.g., power, experience, or
culture).
The Annual Services Inquiry which is the main data source for this analysis, defines family businesses as:
An enterprise where one family holds more than 50% of the voting shares
and/or
A family supplies a significant proportion of the enterprises senior management and is effectively
controlling the business
and/or
An enterprise where there is evidence of more than one generation working in the business
and/or
An enterprise that is influenced by a family or a family relationship and that perceives itself to be a family
business.
It should be noted that unlike most business statistics definitions, for example, legal form of enterprise, the
definition of a family business is a somewhat subjective one. The impact of this subjectivity is nowhere more
apparent than when examining sole traders.
Other Definitions
For the purposes of this paper, the size of enterprises will refer to the number of persons engaged, unless
stated otherwise. Although not conforming to the European Union standard (Eurostat, 2008), given the relatively
large number of smaller enterprises in Ireland, greater granularity is required for enterprises that engage less than
50 persons. Consequently enterprise size classes are defined in Table 1.
Table 1
Enterprise Size Classes Size class Persons engaged
Micro 1-9
Small 10-19
Medium 20-49
Large 50+

HOW MANY FAMILY BUSINESSES ARE THERE REALLY 140
Analysis in this paper is conducted at NACE Rev.1.12
NACE Section
(Eurostat, 2002) section level. Aggregating at this
level provides robust data and overcomes most (but not all) difficulties surrounding inadvertent disclosure of
confidential data. It of course, has the disadvantage of aggregating, highly heterogeneous business activities into
single cohorts. NACE Rev. 1.1 section aggregates are described in Table 2.
Table 2
NACE Rev. 1.1 Sections Description
G Wholesale & retail trade
H Hotels & restaurants
I Transport, storage & communications
K Real estate, renting & business activities
O Other community, social & personal services
Family Businesses—Summary Profile
In 2005, there were 38,927 FBs trading in the services sectors in Ireland, accounting for 46% of all
enterprises in those sectors. FBs employed over a quarter of a million persons and generated a total turnover of
€49.3 billion.
That only 46% of all enterprises are FBs seems low compared to statistics regularly quoted in Ireland or in
other international studies. For example, studies in Germany of the manufacturing sector in Baden-Wurttenberg
estimate that 78% of businesses were family run (Hauser, 2005). In the United States, FBs account for an even
larger proportion—86% (Keyt, 2007). Bornheim (2000) estimates that FBs account for 80% of enterprises in
Mexico and in Austria. Neubauer and Lank (1998) found that family businesses accounted for 75% of all
businesses in the United Kingdom, 70% in Portugal, 80% in Spain, 85% in Switzerland, 90% in Sweden, and
95% in Italy and the Middle-East. As already noted, there is no standardised definition for what constitutes a FB.
This lack of agreement is likely to be a contributing factor to the apparent discrepancy emerging from different
studies.
The distribution of FBs and NFBs across the enterprise size classes are more or less the same (see Figure 1).
Almost 88% of all services enterprises have less than 10 persons engaged; this holds for both FBs and NFBs. Less
than 2% of FBs had more than 50 persons engaged. Although FBs with less than 10 persons engaged accounted
for almost 41% of all services enterprises, these businesses only generated less than 9% of total Gross Value
Added (GVA). By contrast the 2% of FBs engaging 50 persons or more accounted for almost 8% of total traded
non-financial services GVA.
Overall, average FBs are smaller than NFBs but for most size classes the difference in size is negligible.
However, for enterprises with 50 or more persons engaged, there is a significant difference in scale, with large
FBs engaging an average of 150 persons compared with 215 persons for NFBs (see Figure 2).
The Sole Trader
The sole trader or individual proprietorships makes an interesting case study, perhaps providing some
2 NACE Rev.1.1—Statistical classification system of the European Union for economic activity.

HOW MANY FAMILY BUSINESSES ARE THERE REALLY 141
insights into enterprise or entrepreneurial behaviour and motivation. Of the sole traders who filed returns for the
ASI, only 44% classified themselves as a FB. This is a curious result, as a sole trader might naturally be
considered a FB, in that there is only one person managing the business and consequently a sole trader and a FB
might reasonably have been considered synonymous. Certainly if all sole traders were automatically classified as
FBs, then this would add a further 22,000 FBs to the total. This re-classification alone would result in FBs
accounting for 72% of all business and might explain partly the very high proportion of FBs quoted in various
reports.
Figure 1. Number of family and non-family businesses by size class, 2005.
Figure 2. Average number of persons engaged in family and non-family businesses by size class, 2005.
But, what if, as the results suggest, sole traders are not automatically synonymous with FBs? What are the
differences between family and non-family sole traders? Perhaps, the motivations of each are quite different,
0
10,000
20,000
30,000
40,000
1 - 9 10 - 19 20 - 49 50 +
Non - Family
Family
Enterprises
Persons Engaged
0
50
100
150
200
250
1 - 9 10 - 19 20 - 49 50 +
Family
Non - Family
Persons Engaged
Persons
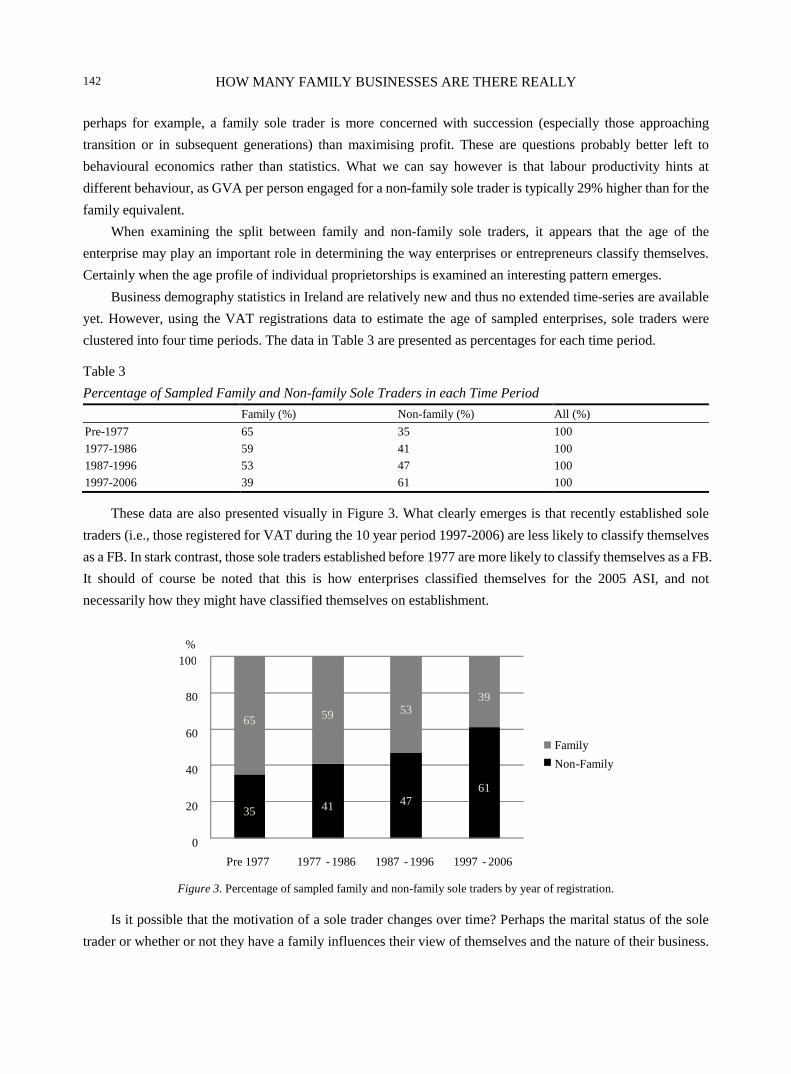
HOW MANY FAMILY BUSINESSES ARE THERE REALLY 142
perhaps for example, a family sole trader is more concerned with succession (especially those approaching
transition or in subsequent generations) than maximising profit. These are questions probably better left to
behavioural economics rather than statistics. What we can say however is that labour productivity hints at
different behaviour, as GVA per person engaged for a non-family sole trader is typically 29% higher than for the
family equivalent.
When examining the split between family and non-family sole traders, it appears that the age of the
enterprise may play an important role in determining the way enterprises or entrepreneurs classify themselves.
Certainly when the age profile of individual proprietorships is examined an interesting pattern emerges.
Business demography statistics in Ireland are relatively new and thus no extended time-series are available
yet. However, using the VAT registrations data to estimate the age of sampled enterprises, sole traders were
clustered into four time periods. The data in Table 3 are presented as percentages for each time period.
Table 3
Percentage of Sampled Family and Non-family Sole Traders in each Time Period Family (%) Non-family (%) All (%)
Pre-1977 65 35 100
1977-1986 59 41 100
1987-1996 53 47 100
1997-2006 39 61 100
These data are also presented visually in Figure 3. What clearly emerges is that recently established sole
traders (i.e., those registered for VAT during the 10 year period 1997-2006) are less likely to classify themselves
as a FB. In stark contrast, those sole traders established before 1977 are more likely to classify themselves as a FB.
It should of course be noted that this is how enterprises classified themselves for the 2005 ASI, and not
necessarily how they might have classified themselves on establishment.
Figure 3. Percentage of sampled family and non-family sole traders by year of registration.
Is it possible that the motivation of a sole trader changes over time? Perhaps the marital status of the sole
trader or whether or not they have a family influences their view of themselves and the nature of their business.
35 41 47 61
65 59 53 39
0
20
40
60
80
100
Pre 1977 1977 - 1986 1987 - 1996 1997 - 2006
%
Family
Non - Family

HOW MANY FAMILY BUSINESSES ARE THERE REALLY 143
Perhaps as a trader and the business get older, concerns over pensions and succession become more immediate
than establishing the business, market share or profit maximisation. Equally a FB that has successfully made the
transition to second or subsequent generations may become increasingly concerned with lineage. On the other
hand, many sole traders may grow and ultimately incorporate and perhaps those that do are more likely to be
NFBs, leaving more FB sole traders behind. With the data currently available it is not possible to trace the reasons
for these results. But perhaps it is not unreasonable to assume that some sole traders who established their
businesses over 20 or 30 years ago may have switched from being a NFB to a FB.
Productivity
Determining the appropriate measure of productivity for services sector activity is not always easy. In
Ireland, a measure of capital or multi-factor productivity are beyond the data currently available. Consequently an
analysis of “indicative labour productivity” is presented.
An exact measure of labour productivity cannot be calculated from the ASI. Firstly, GVA is estimated for
the full accounting year of each enterprise3
Employment in the ASI is simply a head-count of both full-time and part-time labour, rather than an exact
full-time equivalent (FTE) unit, which standardises labour units by the number of hours worked (or more
precisely the number of paid or remunerated hours worked). As working arrangements differ considerably by
sector, the impact of standardising the unit of labour utilisation will vary sector by sector. For example, one might
expect a greater range of part-time working conditions in the retailing or hospitality sectors. Equally, one might
reasonably expect the “normal” working week, in terms of hours to vary across sectors.
There are other challenges in linking hours worked to remuneration or output, as the only likely source of all
of these data is the employer or enterprise. Enterprises in sectors where there is a greater bias towards salaried
employment, rather than wages, may not record how many hours were actually worked but the hours
contractually remunerated (not necessarily the same thing). With regard to family businesses there may also be
measurement issues with regard to employment, as casual labour provided by family members may or may not be
included in the returns to CSO.
However, the ASI does provide sufficiently good data that some Indicative Labour Productivity (ILP)
measures (i.e., GVA per person engaged) can be calculated. Even using such a crude measure, the comparative
ILP between FBs and NFBs are striking.
whereas the measure of labour refers to a specific time point (for the
2005 ASI the reference week was the week ending 9 September). Consequently, the ASI does not adequately
measure seasonal peaks and falls in employment and thus may underestimate (or less likely overestimate)
employment and the number of persons engaged. The scale of this problem will likely differ by economic sector
and most probably affect sectors with greater seasonal employment variation more, such as the hospitality sector.
Secondly, the unit of labour is not clearly defined.
Overall, labour utilisation in FBs appears to be less than half as productive as labour employed by NFBs (see
Table 4). This ratio holds with minor variations in scale across most NACE sections of services activity. There
are two exceptions. The productivity differential between FBs and NFBs in the Hotel and Restaurant sectors is
3 This accounting year does not necessarily correspond with the fiscal or calendar year.

HOW MANY FAMILY BUSINESSES ARE THERE REALLY 144
less severe at about 21%. For Section I, Transport, Storage and Communications the differential was significantly
higher—64%.
Table 4
Indicative Labour Productivity Measures Classified by Business Type, 2005 NACE Rev.1.1 Section
Business type
Average GVA per person engaged-All enterprises (€ 000)
Average GVA per person engaged-Irish Owned Enterprises (€ 000)
G Family business Non-family business
37 66
36 43
H Family business Non-family business
22 28
21 27
I Family business Non-family business
48 134
46 88
K Family business Non-family business
45 98
45 69
O Family business Non-family business
23 42
23 43
All Family business Non-family business
35 80
34 56
At first glance, differentials of such magnitude scarcely seem credible. But there are some rather unique
structural conditions in the Irish economy that might contribute to these very high differentials. Ireland is a small,
open, and highly globalised economy with a relatively small enterprise population but with a high degree of
Foreign Direct Investment (FDI). For example, foreign owned enterprises account for 82% of GVA and 49% of
total employment in the manufacturing sectors (CSO, 2007d). In the non-financial, traded, services sectors,
foreign owned enterprises account for 46% of GVA and 24% of total employment (CSO, 2007a).
There are relatively few foreign owned FBs whereas quite a number of large NFBs are foreign owned. ILP
for both the manufacturing and services sectors tends to be higher for larger firms and for foreign owned
enterprises (CSO, 2007c, p. 62). Accounting practices may partly explain this trend as the financial accounts for
foreign owned enterprises can be distorted by the impact of outsourcing, transfer pricing, merchanting, licensing
or royalty arrangements.
When foreign owned enterprises are excluded from the comparison, it makes little or no difference to FB
productivity but there are significant changes to some of the NFB indicative productivity figures. The overall
differential productivity between FBs and NFBs reduces from 56% to about 39%. At NACE section level, the
differentials for sections G, I, and K reduce considerably. For Sections H and O, the removal of foreign owned
enterprises makes little difference to the results. However, even when the distortionary effect of foreign owned
enterprises are removed, the overall conclusion is the same. NFBs appear to have considerably higher ILP than
FBs. A study of the Australian Business Longitudinal Survey 1995 -1998 provided similar findings (albeit less
extreme), concluding that “Family businesses, on average, are 21 per cent less productive than non-family
businesses” (Harris et al., 2002, p. 14).
A possible contributory factor is the ratio of part-time to full-time employees used by FBs and NFBs, 35%
of FBs employees are part-time in comparison with only 25% of NFBs (CSO, 2008a). An additional
measurement issue may also arise if FBs “employ” family members as casual labour. It is not clear whether these
family members are included in the employment count collected by the ASI. Thus, the comparability of ILP may

HOW MANY FAMILY BUSINESSES ARE THERE REALLY 145
be affected, depending on how much casual labour is utilised by a FB, or whether they are recorded in official
statistics or not.
Figure 4. Difference in Average GVA per Person Engaged between Family and Non-Family businesses when foreign owned enterprises are excluded.
Influence of Information and Communication Technologies (ICT) on Productivity
The world is continually being remade by technology and innovation. Together, they have given rise to
pervasive computerisation, global communications, and the information or knowledge-based economy that
coexists with the industrial economy. Forfas (2007, p. 20) noted that “ICT is generally accepted as being one of
the drivers of productivity growth in modern economies”.
Consumers rely on the Internet for 24-hour banking, booking flights, reserving cinema tickets, and
increasingly for day-to-day grocery shopping. Capitalising on this usage of Information and Communication
Technologies (ICT) is a necessity for any enterprise wishing to thrive or survive in the modern business world.
In 2005, more than 15,200 (39%) of FBs reported they had e-mail but only 6,378 (16%) FBs had a website.
For both e-mail and website, usage by NFBs was higher but the difference was more pronounced for website take
up. It also appears that NFBs make better use of their ICT to generate sales. In 2005, NFBs generated over €17bn
(14.5% of their total turnover) from orders submitted via electronic format (i.e., either via e-mail, EDI or internet).
In comparison, FBs generated just over €4bn (8.5% of their total turnover). ICT take-up and usage varied across
the different economic sections; for Sections G and H where FBs are most active, the relative turnover generated
from via electronic sales did not differ significantly from NFBs. For other NACE sections, in particular, Sections
I and K the differences were stark. The most striking differential was in Section K where NFBs generated 21% of
their total turnover via ICT compared with only 6% for FBs (see Table 5).
Overall however, ICT take-up does appear to have a positive correlation with ILP. Across every size class,
for both FBs and NFBs, enterprises with e-mail and website and e-sales have a higher ILP (see Figure 5).
The 2005 ASI were linked to the 2005 e-Commerce & ICT survey at individual record level; a total of 831
enterprises were common to both datasets. Some basic t-tests on ICT systems and internet use/access were
conducted to determine whether ILP is greater for enterprises that have e-mail, a website, LAN, intranet and high
speed internet access than for enterprises that don’t have all of the above.
0
20
40
60
80
G H I K O All
All Enterprises
Irish Owned Enterprises
€ 000’s
NACE Section

HOW MANY FAMILY BUSINESSES ARE THERE REALLY 146
The hypotheses tested were:
H0: The average GVA per person engaged for enterprises that have e-mail, a website, LAN, intranet and
high speed internet access is the same as the average GVA per person engaged for enterprises that do not.
H1: The average GVA per person engaged for enterprises that have e-mail, a website, LAN, intranet and
high speed internet access is different to the average GVA per person engaged for enterprises that do not.
Table 5
Use of E-mail, Web Site, and E-sales, 2005
Business type
NACE REV.1.1 sectors
Number of enterprises
With E-mail
With website
With orders via e-sales
Total turnover excl. VAT (€)
Turnover from orders submitted via e-sales (€)
Family Non-Family
G 15,763 13,472
5,922 4,897
2,382 2,518
1,692 1,935
36,123,282 62,312,898
3,359,505 6,436,031
Family Non-Family
H 6,364 4,083
1,243 916
730 600
409 264
3,994,526 5,116,473
136,547 169,817
Family Non-Family
I 3,124 3,402
841 1,054
311 514
311 368
3,001,822 19,197,375
361,837 4,416,752
Family Non-Family
K 11,097 20,186
6,653 12,358
2,676 5,213
1,652 3,547
5,470,072 29,465,644
318,668 6,060,525
Family Non-Family
O 2,578 3,918
563 1,094
278 690
136 218
694,907 2,185,419
15,041 82,731
Family Non-Family
All 38,927 45,061
15,221 20,319
6,378 9,535
4,200 6,332
49,284,610 118,277,810
4,191,597 17,165,855
Note. e-sales: e-mail, EDI, or Internet.
Figure 5. GVA per person engaged for family & non-family businesses by size class with and without email & website & e-sales.
Separate tests were done for family and non-family businesses. The results proved to be significant for FBs
where the test showed a p-value of 0.0002. In other words, there is sufficient evidence to reject the null hypothesis.
The mean GVA per person engaged for FBs that have e-mail, a website, LAN, intranet and high speed internet
access is almost €50,500 compared to just under €35,600 for FBs that did not have all of the above. The results of
the test for NFBs were less significant. The t-test gave a p-value of 0.0727 and this means that there is sufficient
evidence to reject the null-hypothesis at the 10% significance level. The mean GVA per person engaged for NFBs
that have e-mail, a website, LAN, intranet and high speed internet access is just under €241,300 compared to just
over €56,100 for NFBs that did not have all of the above. Thus, we conclude that both FBs and NFBs that have
0
20
40
60
80
100
120
140
< 50 50 - 250 250+
Family - no e - sales
Family - e - sales
Non - Family - no e - sales
Non - Family - e - sales
€ 000
Persons Engaged

HOW MANY FAMILY BUSINESSES ARE THERE REALLY 147
e-mail, a website, LAN, intranet and high speed internet access have higher average GVA per person engaged
than firms that do not.
The second set of tests focussed on enterprise’s use of the internet for marketing purposes. T-tests were done
to determine whether or not ILP is greater for enterprises that use the internet for marketing their products and
providing product and price information than for those that do not.
The hypotheses tested were:
H0: The average GVA per person engaged for enterprises that use the internet for marketing the enterprise’s
products and facilitating access to product and price information is the same as the average GVA per person
engaged for enterprises that do not.
H1: The average GVA per person engaged for enterprises that use the internet for marketing the enterprise’s
products and facilitating access to product and price information is different to the average GVA per person
engaged for enterprises that do not.
Once again separate tests were done for family and non-family businesses. The results proved to be
significant for FBs where the test produced a p-value of 0.0067 and this gives us sufficient evidence to reject the
null hypothesis. The mean GVA per person engaged for FBs that use internet for marketing the enterprise’s
products and facilitating access to product and price information is just over €46,800 compared with just under
€36,300 for FBs that do not. We can therefore conclude that FBs that use internet for marketing enterprise
products and facilitating access to product and price information have higher ILP on average than those that do
not. The results were not significant for NFBs, where the t-test gave a p-value of 0.1713. Consequently, we have
insufficient evidence to conclude that there is any difference in labour productivity between NFBs that are using
internet for marketing enterprise products and facilitating access to product and price information and those that
are not doing so.
These results reinforce the findings from the ASI which indicated a link between ICT take-up and indicative
labour productivity. Some cautions should be exercised however regarding the magnitude and significance of
these relationships as no controls were made for other variables that are likely to influence productivity.
Nevertheless, the results are important as NFBs made proportionately a much greater investment in computers,
particularly hardware, than FBs did (CSO, 2007a).
Influence of Innovation on Productivity
As already noted, economies and societies are being continually reshaped by technology and innovation. To
test the impact of product and process innovation on ILP, the Community Innovation Survey (CIS) were linked to
the ASI at a unit record level. Respondents to the CIS were asked if they had engaged in any product or process
innovation during the three years 2004 to 2006. Product innovation was defined as the introduction of a new good
or service to market or a significantly improved good or service with respect to its capabilities. Process
innovation was defined as the implementation of a new or significantly improved production process, distribution
method or support activity for the enterprises goods or services. Enterprises were classed as “innovation active” if
they had engaged in either product or process innovation or both.
The benefits arising from the introduction of new processes or products usually take some years to realise,
and consequently linking to 2004-2006 CIS to the 2005 ASI is rather optimistic. Most likely, the benefits of
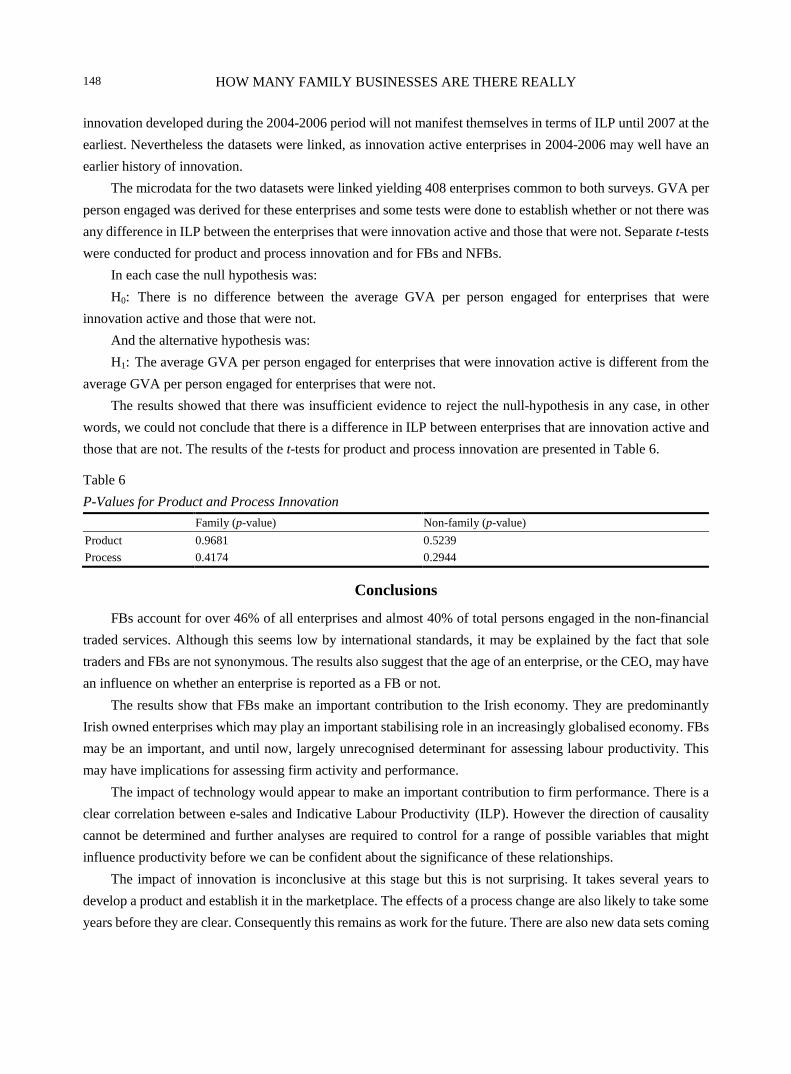
HOW MANY FAMILY BUSINESSES ARE THERE REALLY 148
innovation developed during the 2004-2006 period will not manifest themselves in terms of ILP until 2007 at the
earliest. Nevertheless the datasets were linked, as innovation active enterprises in 2004-2006 may well have an
earlier history of innovation.
The microdata for the two datasets were linked yielding 408 enterprises common to both surveys. GVA per
person engaged was derived for these enterprises and some tests were done to establish whether or not there was
any difference in ILP between the enterprises that were innovation active and those that were not. Separate t-tests
were conducted for product and process innovation and for FBs and NFBs.
In each case the null hypothesis was:
H0: There is no difference between the average GVA per person engaged for enterprises that were
innovation active and those that were not.
And the alternative hypothesis was:
H1: The average GVA per person engaged for enterprises that were innovation active is different from the
average GVA per person engaged for enterprises that were not.
The results showed that there was insufficient evidence to reject the null-hypothesis in any case, in other
words, we could not conclude that there is a difference in ILP between enterprises that are innovation active and
those that are not. The results of the t-tests for product and process innovation are presented in Table 6.
Table 6
P-Values for Product and Process Innovation Family (p-value) Non-family (p-value)
Product 0.9681 0.5239
Process 0.4174 0.2944
Conclusions
FBs account for over 46% of all enterprises and almost 40% of total persons engaged in the non-financial
traded services. Although this seems low by international standards, it may be explained by the fact that sole
traders and FBs are not synonymous. The results also suggest that the age of an enterprise, or the CEO, may have
an influence on whether an enterprise is reported as a FB or not.
The results show that FBs make an important contribution to the Irish economy. They are predominantly
Irish owned enterprises which may play an important stabilising role in an increasingly globalised economy. FBs
may be an important, and until now, largely unrecognised determinant for assessing labour productivity. This
may have implications for assessing firm activity and performance.
The impact of technology would appear to make an important contribution to firm performance. There is a
clear correlation between e-sales and Indicative Labour Productivity (ILP). However the direction of causality
cannot be determined and further analyses are required to control for a range of possible variables that might
influence productivity before we can be confident about the significance of these relationships.
The impact of innovation is inconclusive at this stage but this is not surprising. It takes several years to
develop a product and establish it in the marketplace. The effects of a process change are also likely to take some
years before they are clear. Consequently this remains as work for the future. There are also new data sets coming

HOW MANY FAMILY BUSINESSES ARE THERE REALLY 149
on stream, such as the International Sourcing. Linking the micro data from this dataset to the ASI will provide a
new and rich avenue for researchers to mine.
References Astrachan, J. H., & Shanker, M. C. (1996). Myths and realities: Family businesses’ contribution to the US economy—A
framework for assessing family business statistics. Family Business Review, 9(2), 107 -212. Astrachen, J. H., Klein, S. B., & Smyrnios, K. A. (2002). The F: PEC scale of family influence: A proposal for solving the family
business definition problem. Family Business Review, 15(1), 45-59. Bornheim, S. (2000). The organisational form of family business. Norwell, Massachusetts: Kluwer Academic Publishers.
CSO. (2003). Annual services inquiry 1999. Dublin: The Stationery Office. CSO. (2005). Information society statistics—Ireland 2005. Dublin: The Stationery Office.
CSO. (2006a). Annual services inquiry 2004. Dublin: The Stationery Office. CSO. (2006b). Information society and telecommunications, 2005. Dublin: The Stationery Office.
CSO. (2007a). Annual services inquiry 2005. Dublin: The Stationery Office. CSO. (2007b). Quarterly national household survey, 2004-2007. Dublin: The Stationery Office.
CSO. (2007c). Small business in Ireland. Dublin: The Stationery Office. CSO. (2007d). Census of industrial production. Dublin: The Stationery Office.
CSO. (2008a). Family business in Ireland—Services sectors 2005. Dublin: The Stationery Office. CSO. (2008b). Community innovation survey 2004-2006, first findings. Dublin: The Stationery Office.
CSO. (2009). Enterprise demography statistics—Forthcoming. Dublin: The Stationery Office. Eurostat. (2002). Commission Regulation (EC) No. 29/2002 of 19 December 2001 amending Council Regulation (EEC) No
3037/90 on the statistical classification of economic activities in the European Community. Official Journal of the European Union, 6, 3.
Eurostat. (2008). Regulation (EC) No. 295/2008 of the European Parliament and of the Council of 11 March, 2008 concerning structural business statistics. Official Journal of the European Union, 97, 13-59.
Forfas. (2007). Perspectives on irish productivity: A selection of essays by irish and international economists. Dublin: Forfas. Handler, W. (1989). Methodological issues and consequences in studying family business. Family Business Review, 11(3), 257-276.
Harris, M., Tang, K., & Tseng, Y. (2002). Optimal employee turnover rate: Theory and evidence. Melbourne Institute Working Paper, No. 19/02.
Hauser, M. (2005). A qualitative definition of SME. Proceedings from the SBS Expert Meeting—Towards better Structural Business and SME Statistics, OECD, Paris.
Kepner, E. (1983). The family and the firm: A co-evolutionary perspective. Organisational Dynamics, 12(1), 57-70. Keyt, A. (2007). Learning from America’s family businesses. Proceedings from the Irish Family Business Conference
2007—Building to the next generation, UCC.
Lansberg, I., Perrow, S., & Rogolsky, S. (1988). Family business as an emerging field. Family Business Review, 1(1), 1-8. Litz, R. A. (1995). The family business: Toward definitional clarity (pp. 100-104). Proceedings of the Academy of Management.
Briarcliff Manor, N.Y.: Academy of Management. Neubauer, F., & Lank, A. G. (1998). The family business: Its governance for sustainability. London: MacMillan Press.
Revenue Commissioners. (2008). VAT guide (11th ed.). Dublin: The Stationery Office. Smyrnios, K., Romano, C., & Tanewski, G. (1997). The Australian private and family business survey. Melbourne: Monash
University.