
Chinese Business Review (ISSN 1537-1506) Vol.12, No.11, 2013
70
-
Upload
independent -
Category
Documents
-
view
3 -
download
0
Transcript of Chinese Business Review (ISSN 1537-1506) Vol.12, No.11, 2013


Chinese Business Review
Volume 12, Number 11, November 2013 (Serial Number 125)
David
David Publishing Company
www.davidpublishing.com
PublishingDavid
Publication Information:
Chinese Business Review is published monthly in hard copy (ISSN 1537-1506) and online by David Publishing
Company located at 240 Nagle Avenue #15C, New York, NY 10034, USA.
Aims and Scope:
Chinese Business Review, a monthly professional academic journal, covers all sorts of researches on Economic
Research, Management Theory and Practice, Experts Forum, Macro or Micro Analysis, Economical Studies of Theory
and Practice, Finance and Finance Management, Strategic Management, and Human Resource Management, and other
latest findings and achievements from experts and scholars all over the world.
Editorial Board Members:
Kathleen G. Rust (USA)
Moses N. Kiggundu (Canada)
Helena Maria Baptista Alves (Portugal)
Marcello Signorelli (Italy)
Doaa Mohamed Salman (Egypt)
Amitabh Deo Kodwani (Poland)
Lorena Blasco-Arcas (Spain)
Yutaka Kurihara (Japan)
Shelly SHEN (China)
Salvatore Romanazzi (Italy)
Saeb Farhan Al Ganideh (Jordan)
GEORGE ASPRIDIS (Greece)
Agnieszka Izabela Baruk (Poland)
Goran Kutnjak (Croatia)
Elenica Pjero (Albania)
Kazuhiro TAKEYASU (Japan)
Mary RÉDEI (Hungary)
Bonny TU (China)
Manuscripts and correspondence are invited for publication. You can submit your papers via Web Submission, or
E-mail to [email protected], [email protected]. Submission guidelines and Web
Submission system are available at http://www.davidpublishing.org, http://www.davidpublishing.com.
Editorial Office:
240 Nagle Avenue #15C, New York, NY 10034, USA E-mail: [email protected]
Copyright©2013 by David Publishing Company and individual contributors. All rights reserved. David Publishing
Company holds the exclusive copyright of all the contents of this journal. In accordance with the international
convention, no part of this journal may be reproduced or transmitted by any media or publishing organs (including
various websites) without the written permission of the copyright holder. Otherwise, any conduct would be
considered as the violation of the copyright. The contents of this journal are available for any citation, however, all
the citations should be clearly indicated with the title of this journal, serial number and the name of the author.
Abstracted / Indexed in:
Database of EBSCO, Massachusetts, USA
Ulrich’s Periodicals Directory, USA
ProQuest/CSA Social Science Collection, Public Affairs Information Service (PAIS), USA
Cabell’s Directories, USA
Summon Serials Solutions, USA
Chinese Database of CEPS, American Federal Computer Library center (OCLC), USA
Index Copernicus, Poland
Qualis/Capes index, Brazil
Norwegian Social Science Data Services (NSD), Database for Statistics on Higher Education (DBH), Norway
Universe Digital Library S/B, ProQuest, Malaysia
Polish Scholarly Bibliography (PBN), Poland
Chinese Scientific Journals Database, VIP Corporation, Chongqing, China
Google Scholar
China National Knowledge Infrastructure (CNKI), China
Subscription Information:
Print $520 Online $360 Print and Online $680
David Publishing Company, 240 Nagle Avenue #15C, New York, NY 10034, USA
Tel: +1-323-984-7526, 323-410-1082 Fax: +1-323-984-7374, 323-908-0457
E-mail: [email protected]
Digital Cooperative Company: www.bookan.com.cn
David Publishing Company
www.davidpublishing.com
DAVID PUBLISHING
D

Chinese
Business Review
Volume 12, Number 11, November 2013 (Serial Number 125)
Contents
Economics
The New Method to Determine Ownership Stake to Exercise Control: An Empirical
Analysis on Italian Companies 725
Carmelo Intrisano, Anna Paola Micheli
Regional Developmental Problems of the Rural Settlements in Bosnia and Herzegovina 736
Rahman Nurković, Nusret Drešković
Management
Talcott Parsons’ AGIL Schema-based System Identification of Administrative Problems of
North-East Vocational Education in Thailand 747
Surachai Tumtavitikul
“A Raft in the Stormy Sea”: New Roles, New “Dresses” Operating in & for Business Networks 762
Patrizia Riva, Roberta Provasi
Competition in Marketing: Survival Yardstick for Small and Medium Enterprises (SMEs)
in Nigeria 775
Olanrewaju Samson Ibidunni, Ogundeji J. K. Ogundele


Chinese Business Review, ISSN 1537-1506
November 2013, Vol. 12, No. 11, 725-735
The New Method to Determine Ownership Stake to Exercise
Control: An Empirical Analysis on Italian Companies
Carmelo Intrisano, Anna Paola Micheli
University of Cassino and Southern Lazio, Cassino, Italy
The idea of this work arises from the analysis of the researches developed in the literature on topic of ownership
and control that are mostly based on threshold of ownership stake to determine control equal for all companies and,
in most cases, not supported by theoretical arguments and empirical evidences. In fact, the aim of this paper is to
build a new method of determining the threshold of ownership stake that allows the shareholder to exercise control.
In particular, this survey uses all Italian listed companies as reference, and the minutes of the Ordinary and
Extraordinary General Meetings of shareholders, in 2009-2012, as database. The topic can be enriched with further
and future researches aiming to adapt this new method in a cross-country investigation and so to identify the
different threshold for the countries, on the basis of the different national laws regarding the ownership stakes that
affect the control.
Keywords: ordinary and extraordinary general meetings of shareholders, control threshold, quorum, control, annual
financial statement approval, renewal of boards
Introduction
The topic about the relationship between ownership structure and control has undergone relevant
theoretical developments over time, starting from the assumption of a diffuse ownership structure (Berle &
Means, 1932; Baumol, 1959; Jensen & Meckling, 1976; Grossman & Hart, 1980) and coming to the
recognition of a relevant presence of more or less concentrated ownership structures in different countries
(Demsetz, 1983; Shleifer & Vishny, 1986; Morck, Shleifer, & Vishny, 1988).
In most investigations and, more generally, in the literature of reference, the controlling shareholder is
identified by setting a threshold of ownership that distinguishes the condition of controlling shareholder from
the condition of non-controlling shareholder. The measure of such ownership has been hypothesized by
researchers that, in most cases, come to this determination without testing and demonstrating the hypothesis.
Thus, for example, La Porta, Lopez-de-Silanes, and Shleifer (1999), in their cross-country work on
ownership structure, use two alternative measures of threshold, 10% and 20%, simply on the basis of the
following assumptions, to identify the last shareholder of the sampled companies. The 10% would represent a
relevant threshold of votes, given that many countries link the mandatory disclosure to the ownership stake,
Carmelo Intrisano, Professor of Corporate Finance, Department of Economy and Law, University of Cassino and Southern
Lazio.
Anna Paola Micheli, Ph.D., Research Fellow in Corporate Finance, Department of Economy and Law, University of Cassino
and Southern Lazio.
Correspondence concerning this article should be addressed to Carmelo Intrisano, Sant’ Angelo Road, Cassino, Italy. E-mail:
DAVID PUBLISHING
D

THE NEW METHOD TO DETERMINE OWNERSHIP STAKE TO EXERCISE CONTROL
726
which normally does not exceed 10%. This is, as you note, a justification characterized by evident signs of
weakness. In fact, it does not illustrate the relationship between mandatory disclosure and threshold: it does not
explain the reasons why the threshold of ownership that involves the mandatory disclosure is sufficient to
exercise control. Even less, this report, although inconsistent in terms of the theoretical arguments, should be
supported by specific tests. Similarly, the idea of the 20% as the ownership threshold that, according to the
researchers, is sufficient for the effective control of a company, appears unfounded on theoretical basis
regarding the ownership structure.
Even Faccio and Lang (2002) in their research on the ownership structure of Western Europe, assume that
20% of the shares with voting rights are sufficient to ensure control, justifying this decision on the basis that the
assumption is in line with previous studies.
The 20% shares, as the control threshold, is also assumed by Villalonga and Amit (2006) among the
different conditions taken to ascertain whether family firms create more value of other ownership structures.
The same measure is used by Dick and Zingales (2004) in their cross-country investigation on private
benefits, individuating the potential candidates to exercise control amongst the buyers of shareblocks, which cross
from a position where they hold less than 20% of the shares to a position in which they hold more than 20%.
Instead, Barontini and Caprio (2006), in their empirical work on the effects of family control on firm value,
set a threshold of 10% to select widely-held companies and assuming that a company is to be considered as a
widespread ownership where no shareholder owns more than 10% of the voting rights.
Table 1
Ownership Threshold in Literature
Author Size Reason Paper
La Porta et al. (1999)
10%
Many countries link the mandatory
disclosure to the ownership stake,
which normally does not exceed 10% Corporate ownership around the world
20% Sufficient measure to exercise the
effective control
Faccio and Lang (2000) 20% In line with other studies The ultimate ownership of Western European corporations
Villalonga and Amit
(2006) 20% In line with other studies
How do family ownership, management and control affect
firm value?
Dyck and Zingales (2004) 20% In line with other studies Private benefits of control: An international comparison
Barontini and Caprio
(2006) 10% In line with other studies
The effect of family control on firm value and
performance: Evidence from Continental Europe
Therefore, this work provides a theoretical contribution to the reference literature suggesting a new
method of determining the threshold of ownership, specially tested for the purpose.
Starting from these theoretical references, the paper is organized as follows. Section one describes the
methodological aspects of the empirical analysis and, in particular, observations, comments, variables, and the
descriptive statistics. Section two outlines the survey results. Section three shows the characteristic features of
the new method, specifically constructed to determine the control threshold. Section four, finally, is devoted to
conclusions.
Methodology
The empirical evidence distinguishes relevant shareholders by non-relevant shareholders depending on the
relative ownership greater or less than 2% of the share capital represented by shares with voting rights, in line
with the Italian Regulation implementing Legislative Decree 24 February 1998, No. 58, regarding the
THE NEW METHOD TO DETERMINE OWNERSHIP STAKE TO EXERCISE CONTROL
727
regulation of issuers adopted by the Commissione Nazionale per le Società e la Borsa (CONSOB) with
resolution No. 11971 of 14 May 1999.
Assuming that the interest of the owners to the general shareholders’ meeting is different depending on the
object and considering that the main manifestations and demonstrations of control during the meeting are the
resolutions adopted in the approval of the annual financial statement and in the board renewal, this research has
been focused on the analysis of the general shareholders’ meetings that have the above agendas.
This empirical evidence considers all listed companies in the Italian market, excluding the banking and
insurance sectors, since the specific regulations can affect the dynamic of control. It also excludes the
companies for which it was not possible to acquire the corporate documents or otherwise those for which the
available information is insufficient for the analysis.
Consequently all the minutes of the ordinary shareholders’ meeting of the 2009-2012 period are analyzed,
distinguishing, as mentioned, those concerning the approval of the annual financial statement from those
concerning the board renewal, since the intensity of the interest to participate at the meeting are different in the
shareholders. In fact, the general meeting for the approval of annual financial statement should arouse a greater
involvement on the part of non-controlling shareholders in view of their interest in the dividends that follow the
same approval. On the contrary, the meeting for the board renewal should motivate especially the relevant
shareholders who see this as a means to exercise control.
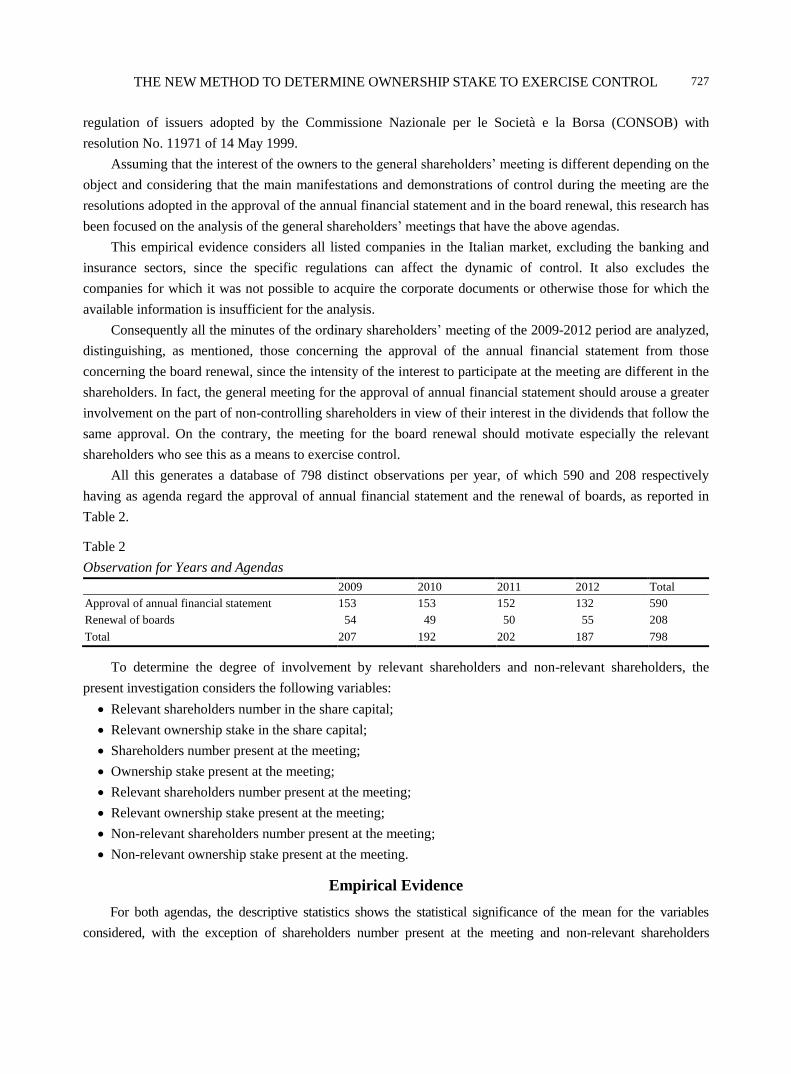
All this generates a database of 798 distinct observations per year, of which 590 and 208 respectively
having as agenda regard the approval of annual financial statement and the renewal of boards, as reported in
Table 2.
Table 2
Observation for Years and Agendas
2009 2010 2011 2012 Total
Approval of annual financial statement 153 153 152 132 590
Renewal of boards 54 49 50 55 208
Total 207 192 202 187 798
To determine the degree of involvement by relevant shareholders and non-relevant shareholders, the
present investigation considers the following variables:
Relevant shareholders number in the share capital;
Relevant ownership stake in the share capital;
Shareholders number present at the meeting;
Ownership stake present at the meeting;
Relevant shareholders number present at the meeting;
Relevant ownership stake present at the meeting;
Non-relevant shareholders number present at the meeting;
Non-relevant ownership stake present at the meeting.
Empirical Evidence
For both agendas, the descriptive statistics shows the statistical significance of the mean for the variables
considered, with the exception of shareholders number present at the meeting and non-relevant shareholders

THE NEW METHOD TO DETERMINE OWNERSHIP STAKE TO EXERCISE CONTROL
728
number present at the meeting. These variables, in fact, show in the period 2009-2012 relevant differences between
mean and median that explain the asymmetry of the relative distributions as evidenced in Tables 3 and 4.
Table 3
Descriptive Statistics: General Shareholders’ Meeting for the Approval of the Annual Financial Statement
2009 2010 2011 2012
Relevant shareholders number in the share capital Mean 4.27 4.07 4.00 4.07
Median 4.00 3.50 3.00 4.00
Dev.std 2.26 2.27 2.25 2.34
Relevant ownership stake in the share capital Mean 68.12 66.82 66.16 67.33
Median 69.27 67.52 67.56 68.62
Dev.std 12.62 12.58 14.80 13.39
Shareholders number present at the meeting Mean 27.44 38.19 85.01 78.79
Median 14.00 15.00 15.00 21.50
Dev.std 44.24 67.50 313.57 174.96
Ownership stake present at the meeting Mean 64.37 63.47 65.53 67.20
Median 64.27 64.60 68.02 69.70
Dev.std 12.27 12.80 15.45 12.67
Relevant shareholders number present at the meeting Mean 2.72 2.66 2.80 2.92
Median 2.00 2.00 2.00 2.00
Dev.std 1.89 2.13 2.15 2.12
Relevant ownership stake present at the meeting Mean 61.20 60.38 60.97 62.21
Median 61.59 62.88 63.16 62.87
Dev.std 13.25 13.66 15.68 13.98
Non-relevant shareholders number present at the meeting Mean 24.74 35.53 82.23 75.86
Median 11.00 11.00 12.50 18.50
Dev.std 44.34 67.59 313.80 175.16
Non-relevant ownership stake present at the meeting Mean 3.17 3.09 4.62 4.99
Median 1.92 1.85 2.45 2.36
Dev.std 3.75 3.50 5.43 5.75
Note. Source: our elaboration on corporate documents.
Table 4
Descriptive Statistics: General Shareholders’ Meeting for Board Renewal
2009 2010 2011 2012
Relevant shareholders number in the share capital Mean 4.67 3.98 4.02 4.18
Median 4.00 3.00 4.00 4.00
Dev.std 2.24 2.26 1.89 2.60
Relevant ownership stake in the share capital Mean 67.15 68.79 64.44 69.37
Median 67.52 69.54 67.72 70.63
Dev.std 10.60 14.03 16.57 10.82
Shareholders number present at the meeting Mean 23.28 29.96 64.48 60.95
Median 14.00 15.00 14.00 22.00
Dev.std 22.62 37.64 126.60 106.99
Ownership stake present at the meeting Mean 63.96 65.53 65.51 68.86
Median 61.92 65.25 69.12 70.20
Dev.std 10.06 14.45 16.46 10.53
Relevant shareholders number present at the meeting Mean 3.06 2.56 2.94 3.04
Median 2.50 2.00 3.00 2.00
Dev.std 2.06 1.89 1.82 2.54

THE NEW METHOD TO DETERMINE OWNERSHIP STAKE TO EXERCISE CONTROL
729
(Table 4 continued)
2009 2010 2011 2012
Relevant ownership stake present at the meeting Mean 60.24 62.46 59.70 64.37
Median 60.31 63.75 64.30 65.46
Dev.std 11.02 15.53 17.65 11.88
Non-relevant shareholders number present at the meeting Mean 20.22 27.45 61.54 57.91
Median 11.02 10.00 11.50 19.00
Dev.std 22.81 37.99 126.51 107.45
Non-relevant ownership stake present at the meeting Mean 3.71 3.06 5.81 4.49
Median 2.02 1.88 3.32 2.12
Dev.std 4.87 3.45 6.29 5.61
Note. Source: our elaboration on corporate documents.
Consequently, the analysis of this empirical work is based on the other six variables that have a lower
difference between mean and median, and it is so low that the distributions are symmetrical. For these items,
the explanatory power of the mean is further confirmed by the low dispersion of the results.
The analysis on these variables leads to similar results regarding the two agendas of ordinary shareholders’
meeting. In particular, the meeting for the approval of the annual financial statement shows a substantial
stability in the four years examined, as shown in Table 5.
Table 5
Shareholders’ Meeting for the Approval of the Annual Financial Statement (Mean)
2009 2010 2011 2012
Relevant shareholders number in the share capital 4.27 4.07 4.00 4.07
Relevant ownership stake in the share capital 68.12 66.82 66.16 67.33
Ownership stake present at the meeting 64.37 63.47 65.53 67.20
Relevant shareholders number present at the meeting 2.72 2.66 2.80 2.92
Relevant ownership stake present at the meeting 61.20 60.38 60.97 62.21
Non-relevant ownership stake present at the meeting 3.17 3.09 4.62 4.99
Note. Source: our elaboration on corporate documents.
The mean of relevant shareholders number in the share capital does not undergo large changes during the
four years, assuming values around 4, as well as the mean of relevant ownership stake in the share capital
shows values between 66.16% and 68.12%. Similarly, the mean of relevant shareholders number present at the
meeting is constant over the four years and has values around 3 equal to the mean of relevant ownership stake
present at the meeting which varies slightly in the range from 63.47 to 67.20.
From all this, it is possible to deduce the following conclusions.
At the general meeting for approval of the annual financial statement the overall ownership stake of
non-relevant ownership stake present at the meeting is very low, oscillating between 3.09% and 4.99% of the
total share capital, unlike the overall ownership stake of relevant ownership stake present at the meeting that is
very high, since which has values between the minimum of 60.38% and the maximum of 62.21%. In brief, the
minority shareholders, in their totality, represent a mean so limited that does not affect the dynamics of the
control.

THE NEW METHOD TO DETERMINE OWNERSHIP STAKE TO EXERCISE CONTROL
730
The meeting for renewal of board shows values for the means of the variables analyzed not particularly
different from those of the previous variables. The mean of the overall ownership stake of Non-relevant
ownership stake present at the meeting is very low, oscillating between 3.06% and 5.81% of the total
share capital, unlike the overall ownership stake of relevant ownership stake present at the meeting that is
very high, since it has values between the minimum of 59.70% and the maximum of 64.37%, as shown in
Table 6.
Table 6
Shareholders’ Meeting for Board Renewal (Mean)
2009 2010 2011 2012
Relevant shareholders number in the share capital 4.67 3.98 4.02 4.18
Relevant ownership stake in the share capital 67.15 68.79 64.44 69.37
Ownership stake present at the meeting 63.96 65.53 65.51 68.86
Relevant shareholders number present at the meeting 3.06 2.56 2.94 3.04
Relevant ownership stake present at the meeting 60.24 62.46 59.70 64.37
Non-relevant ownership stake present at the meeting 3.71 3.06 5.81 4.49
Note. Source: our elaboration on corporate documents.
Briefly, for both shareholders’ meeting there is a substantial absence of non-relevant shareholders, as
further confirmed from Tables 7 and 8.
In fact, at the shareholders’ meeting for annual financial statement, opposite to a mean absence of relevant
shareholders that never exceeds the 10% of the overall ownership stake of relevant shareholders in the share
capital, the mean absence of non-relevant shareholders never drops below the value of 85% of the overall
ownership stake of non-relevant shareholders in the share capital.
Table 7
Shareholders’ Meeting for the Approval of Annual Financial Statement: Ownership not Present (Mean)
2009 2010 2011 2012
Ownership stake not present at the shareholders’ meeting 35.63 36.53 34.47 32.80
Relevant ownership stake not present at the shareholders’ meeting 6.91 6.45 5.19 5.12
Non-relevant ownership stake not present at the shareholders’ meeting
28.72 30.08 29.28 27.68
Note. Source: our elaboration on corporate documents.
Table 8
Shareholders’ Meeting for the Approval of Annual Financial Statement: Ownership not Present (Ratio)
2009 2010 2011 2012
Relevant ownership stake not present at the shareholders’ meeting (ratio) 10% 10% 8% 8%
Non-relevant ownership not present at the shareholders’ meeting (ratio) 90% 91% 86% 85%
Note. Source: our elaboration on corporate documents.
Similarly, as shown in Tables 9 and 10, at the shareholders’ meeting for board renewal, opposite to a mean
absence of relevant shareholders that never exceeds the 10% of the overall ownership stake of relevant
shareholders in the share capital, the mean absence of non-relevant shareholders never drops below the value of
84% of the overall ownership stake of non-relevant shareholders in the share capital.

THE NEW METHOD TO DETERMINE OWNERSHIP STAKE TO EXERCISE CONTROL
731
Table 9
Shareholders’ Meeting for Board Renewal: Ownership not Present (Mean)
2009 2010 2011 2012
Ownership stake not present at the shareholders’ meeting 36.04 34.47 34.49 31.14
Relevant ownership stake not present at the shareholders’ meeting 6.91 6.33 4.74 5.00
Non-relevant ownership stake not present at the shareholders’ meeting
29.13 28.14 29.75 26.14
Note. Source: our elaboration on corporate documents.
Table 10
Shareholders’ Meeting for Board Renewal: Ownership not Present (Ratio)
2009 2010 2011 2012
Relevant ownership stake not present at the shareholders’ meeting (ratio) 10% 9% 7% 7%
Non-relevant ownership not present at the shareholders’ meeting (ratio)
89% 90% 84% 85%
Note. Source: our elaboration on corporate documents.
Summarizing, the presence at the general sharehoders’ meeting is almost wholly regarding the relevant
ownership and nothing for non-relevant ownership.
Non-relevant shareholders do not therefore show different interest for the two agendas, like the relevant
shareholders, and thus it is possible to disclaim the initial postulate that the non-relevant shareholders should
demonstrate a greater involvement in the shareholders’ meeting that regards the amount of dividends. They,
therefore, are absent not only in the meetings where the renewal of board can be considered as the full
manifestation of control by the relevant shareholder, but even in the meetings from which follows substantially
the performance of their investment.
On the contrary, the results of this empirical evidence confirm the initial idea that the control thresholds
within listed companies are presettable exclusively considering all the relevant ownership stakes and,
consequently, they show that the 2% settled by CONSOB is adequate to identify the relevant ownership stake.
Results and Conclusions
The conclusions of this empirical evidence are the basis of the method suggested in this work to estimate
the thresholds of ownership necessary to exercise control.
In general, the shareholder has control over the company when his/her ownership allows him/her to
preside over the decision-making process within the company, considering the civil laws on shareholder
resolutions relating to the companies that have recourse to the stock market. In particular, the decision-making
process is monitored if the ownership consents to realize the quorum established by the Civil Code.1
Constitutive quorum, as noted, set the part of the voting capital that must be present at the general
sharehoders’ meeting.
For the ordinary meeting, the only constitutive quorum concerns the first call, given the need to be present
at least half of the voting rights so that the shareholders’ meeting is regular.
For the extraordinary general shareholders’ meeting, instead, the constitutive quorum also interests the
calls after the first, for which is scheduled the same quorum of the ordinary general shareholders’ meeting.
1 In order that the results of the investigation are generalizable to most listed companies, were not considered any higher
percentage of quorum nor any calls after the second for the extraordinary general meeting, provided for by Articles 2368 and 2369
of the Civil Code.

THE NEW METHOD TO DETERMINE OWNERSHIP STAKE TO EXERCISE CONTROL
732
More precisely, a third of the share capital is required for the second call and a fifth for subsequent calls.
Deliberative quorum sets the part of capital that must vote in favor. In particular, the ordinary general
shareholders’ meeting deliberates in all the meetings with the absolute majority of the votes while the
extraordinary general shareholders’ meeting deliberates on the first call by the vote of more than half of the
capital and at subsequent calls by favorable vote of at least two thirds of the capital present at the meeting.
Consequently, shareholder concerned to control the decision-making process must carefully determine the
capital potentially present at the meeting that, according to the conclusions of this work, can be approximated
with the set of relevant ownership.
It is evident that the ownership stake equal to 50% plus one share ensures the control already in the first
call in ordinary and extraordinary general shareholders’ meeting. If the ownership is less than 50%, the control
is heavily influenced by all the other ownerships that may be present at the meeting.
So for example, if the stake is 40%, the shareholder is able to gain control in the ordinary shareholders’
meeting if the total of other ownerships is lower than 40%. In fact, the decisions could not be deliberated on the
first call, if other dissenting shareholders agree not to appear in the shareholders’ meeting, doing so undermines
the constitutive quorum, while the decisions would surely be approved on second call, since no constitutive
quorum is set, as said. On the contrary, the stake of 40% would not be enough to control the decisions in the
extraordinary general meeting.
For example, if the total of other relevant ownership is equal to 29% of the voting stake, the stake of 40%
would not reach the deliberative quorum of two thirds of the capital present at the meeting (2/3 of 69% = 46%).
Briefly, this ownership would allow to control the ordinary shareholders’ meeting but would not be sufficient to
ensure control in the extraordinary one.
It is possible to note, however, that the ownership able to meet the deliberative quorum of two-thirds of the
share capital present at the meeting, not necessarily respects the constitutive quorum of one-third of the voting
capital.
Thus, for example, if the relevant ownership stakes amount to 36% of the voting capital, the single
ownership stake of 25% is sufficient for deliberative quorum being more than 20% or two thirds of the capital
present, nevertheless, it is insufficient for the required constitutive quorum, being less than 33% equal to one
third of the voting capital.
Nor, on the other hand, the shareholder can be sure of reaching the quorum with the presence of other
relevant shareholders who together hold 11%. In fact, these, might affect the regularity of the extraordinary
general meeting not showing up at the meeting, if they intended to influence the decisions of the relevant
shareholders.
In essence, the ownership threshold that gives control, having to respect both the quorum, corresponds to
the higher value between 33.34% of the share capital and 66.67% of the relevant ownership.
Consequently, it is possible to distinguish two threshold values which correspond to two different degrees
of control:
1st threshold, which ensures control in both meetings, corresponding to the greater value between 33.34%
of the share capital and 66.67% of all the relevant ownership;
2nd threshold, which guarantees only control at ordinary general meetings, corresponding to 50% of
relevant shareholders.
Table 11 shows the control thresholds of first level relating to different values of the total relevant

THE NEW METHOD TO DETERMINE OWNERSHIP STAKE TO EXERCISE CONTROL
733
shareholdings. To this end, constitutive quorum is expressed in terms of capital through multiplication of
two-thirds by the total number of ownership available that, according to the assumption of this research,
coincides with the total of relevant sharehoders.
More specifically, it appears that as long as the total of relevant shareholders is more than 50% of the
voting capital, the ownership that meets the deliberative quorum is sufficient even for the constitutive quorum
and, conversely, if the total ownership is less than 50% of the voting capital. Therefore, the control threshold is
represented in the first case exclusively by ownership associated with the deliberative quorum and in the second
case is related to the ownership associated to constitutive quorum.
Table 11
Threshold of 1° Grade—Control in Both Shareholders’ Meeting
Relevant ownership Deliberative quorum Constitutive quorum
Threshold
90.00% 60.00% 33.34% 60.00%
80.00% 53.34% 33.34% 53.34%
70.00% 46.67% 33.34% 46.67%
60.00% 40.00% 33.34% 40.00%
50.00% 33.34% 33.34% 33.34%
40.00% 26.67% 33.34% 33.34%
30.00% 20.00% 33.34% 33.34%
20.00% 13.34% 33.34% 33.34%
10.00% 6.67% 33.34% 33.34%
Note. Source: our elaboration.
This analysis confirms the initial idea that only the relevant shareholders participate in the meetings and
also shows that the percentage set by CONSOB is adequate to identify the investments that are actually relevant
to the control. There are not major differences between the two agendas regarding the approval of the annual
financial statement and the renewal of board.
On these empirical results, the work develops and suggests a method of estimating the control threshold
that differs from the approach prevalent in the literature and based on 20% of the ownership stake needed to
exercise control. In fact, the method suggested is not based on a predefined and indistinct size for all companies
but, on the contrary, takes into account the actual relevant ownership within the various ownership structures.
This research can lead to further studies and development, through the extension of the empirical analysis
to a cross-country scenario, in which it proceeds with the analysis of the different rules and laws then with the
empirical verification of general shareholders’ meetings and to conclude, therefore, identifying control
thresholds distinct for different countries.
References
Berle, A., & Means, G. (1932). The modern corporation and private property. New York: MacMillan.
Baumol, W. (1959). Business behavior, value and growth. New York: MacMillan.
Barca, F., & Becht, M. (2010). The control of corporate Europe. Oxford: Oxford University Press.
Barclay, M. J., & Holderness, C. G. (1989). Private benefits from control of public corporations. Journal of Financial Economics,
25, 371-395.
Barclay, M. J., Holderness, C. G., & Pontiff, J. (1993). Private benefits from block ownership and discounts on closed-end fund.
Journal of Financial Economics, 3, 263-291.

THE NEW METHOD TO DETERMINE OWNERSHIP STAKE TO EXERCISE CONTROL
734
Barontini, R., & Caprio, L. (2006). The effect of family control on firm value and performance: Evidence from continental Europe.
European Financial Management, 12, 689-723.
Bebchuk, L. (1999). A rent-protection theory of corporate ownership and control. NBER Working Paper No. 7203.
Bigelli, M., & Mengoli, S. (2004). Sub-optimal acquisition decision under a relevant ity shareholder system. Journal of
Management and Governance, 8, 373-405.
Brioschi, F., Buzzacchi, L., & Colombo, M. G. (1989). Risk capital financing and the separation of ownership and control in
business groups. Journal of Banking and Finance, 13, 747-772.
Claessens, S., Djankov, S., & Lang, L. H. P. (2000). The separation of ownership and control in East Asian corporations. Journal
of Financial Economics, 58, 81-112.
DeAngelo, H., & DeAngelo, S. (1985). Managerial ownership of voting rights. Journal of Financial Economics, 14, 36-39.
Demsetz, H. (1983). Corporate control, insider trading, and rates of return. American Economic Review, 86, 313-316.
Demsetz, H., & Lehn, K. (1985). The structure of corporate ownership: Causes and consequences. Journal of Political Economy,
93, 1155-1177.
Dyck, A. (2000). Ownership structure, legal protections and corporate governance. In B. Pleskovic, & N. Stern (Eds.), 2000 Annual
World Bank Conference on Development Economics (pp. 291-330).
Dyck, A. (2001). Privatization and corporate governance: Principles, evidence and future challenges. World Bank Research
Observer, 16(1), 59-84.
Dyck, A., & Zingales, L. (2004). Private benefits of control: An international comparison. Journal of Finance, 59, 537-600.
Faccio, M., & Lang, L. H. P. (2002). The ultimate ownership of Western European corporations. Journal of Financial Economics,
65, 365-395.
Grossman, S., & Hart, O. (1980). Takeover bids, the free rider problem, and the theory of the corporation. Bell Journal of
Economics, 11, 42-69.
Grossman, S., & Hart, O. (1986). The costs and benefits of ownership: A theory of vertical and lateral integration. Bell Journal of
Economics, 11, 42-64.
Grossman, S., & Hart, O. (1988). One share one vote and the market for corporate control. Journal of Financial Economics, 20(1-2),
175-202.
Harris, M., & Raviv, A. (1988). Corporate governance: Voting rights and relevant ity rules. Journal of Financial Economics, 20,
203-235.
Holderness, C. G., & Sheehan, D. P. (1988). The role of relevant ity shareholders in publicly held corporations: An exploratory
analysis. Journal of Financial Economics, 20, 317-346.
Intrisano, C. (2012). Control-enhancing mechanisms in italian companies. China-USA Business Review, 11(3),48-78.
Intrisano, C., & Rossi, F. (2012). Do M&As generate value for shareholders’: An analysis of the Italian banking sector. Chinese
Business Review, 11(2), 206-216.
Jensen, M., & Meckling, W. (1976). Theory of the firrm: Managerial behavior, agency costs, and ownership structure. Journal of
Financial Economics, 3, 305-360.
La Porta, R., Lopez-de-Silanes, F., & Shleifer, A. (2000). Investor protection and corporate governance. Journal of Financial
Economics, 59(1-2), 3-27.
La Porta, R., Lopez-de-Silanes, F., Shleifer, A., & Vishny, R. (1997). Legal determinants of external finance. Journal of Finance,
53(1), 1131-1150.
La Porta, R., Lopez-de-Silanes, F., & Shleifer, A. (1999). Corporate ownership around the world. Journal of Finance, 54,
471-517.
Lease, R., McConnell, J., & Mikkelson, W. H. (1984). The market value of differential votino rights in closely held corporations.
Journal of Business, 57(4), 443-467.
Lease, R., McConnell, J., & Mikkelson, W. H. (1983). The market value of control in publicly-traded corporations. Journal of
Financial Economics, 11(1-4), 439-471.
Lopez-de-Silanes, F. (1997). Determinants of privatization prices. The Quarterly Journal of Economics, 4, 965-1025.
Laeven, L., & Levine, R. (2008). Complex ownership structures and corporate valuations. Review of Financial Studies, 21,
579-604.
Maury, B., & Pajuste, A. (2005). Multiple large shareholders and firm value. Journal of Banking and Finance, 29, 1813-1834.
Morck, R., Shleifer, A., & Vishny, R. (1988). Management ownership and market valuation: An empirical analysis. Journal of
Financial Economics, 20, 293-315.

THE NEW METHOD TO DETERMINE OWNERSHIP STAKE TO EXERCISE CONTROL
735
Nenova, T. (2003). The value of corporate voting rights and control: A cross-country analysis. Journal of Financial Economics,
68, 325-351.
Shleifer, A., & Vishny, R. (1986). Large shareholders and corporate control. Journal of Political Economy, 94, 461-488.
Shleifer, A., & Vishny, R. (1997). A survey of corporate governance. Journal of Finance, 52, 737-783.
Villalonga, B., & Amit, R. (2006). How do family ownership, management and control affect firm value? Journal of Financial
Economics, 80, 385-417.
Zingales, L. (1994). The value of the voting right: A study of the Milan stock exchange experience. Review of Financial Studies, 7,
125-148.
Zingales, L. (1995). What determines the value of corporate votes? Quarterly Journal of Economics, 110, 1047-1073.

Chinese Business Review, ISSN 1537-1506 November 2013, Vol. 12, No. 11, 736-746
Regional Developmental Problems of the Rural
Settlements in Bosnia and Herzegovina
Rahman Nurković, Nusret Drešković
Faculty of Science, Sarajevo, Bosnia and Herzegovina
The paper considers developmental problems of the rural settlements in Bosnia and Herzegovina, which are results
of long-term disparity in the regional development in the period 1991-2012. In this paper it is considered the recent
migration from rural to urban areas and the depopulation of the rural areas. The result of these trends reflects the
development of the new infrastructure and tertiary activities. In these investigations, statistical data processed and
geovisualised in GIS were used. The obtained data indicate extremely unequable regional arrangement of the
population in the rural areas and socio-economic development.
Keywords: Bosnia and Herzegovina, rural settlements, age structure, migration, war, depopulation, transition
countries
Methods of Work and Data Sources
Methodological approach is imperatively adjusted to the purpose of this paper, developmental problems of
the rural settlements in Bosnia and Herzegovina, which have a strong influence on local and rural development.
The research has been considered through local and rural development of the areas in Bosnia and Herzegovina.
In estimation of economic contribution of rural activities to economy, quantitative methods in the range from
stochastic to deterministic are almost exclusively used. Of stochastic methods, the most commonly used
methods are econometric methods based on the analysis of time series, cross-sectional and panel data.
Deterministic methods include models of gravitation (which can partially be stochastic models as well),
input-output (IO) analysis and social accounting matrix (SAM), satellite account of tertiary activities and
computable general equilibrium (CGE) model (Hara, 2008).
With regard to contents and inclusion into a system on social accounting, evaluation of direct contribution
of activities to local and rural development of economy in Bosnia and Herzegovina is a good basis for defining
and application of the models that enable consideration of the total contribution of rural activities. Namely, with
a direct contribution of tertiary activities perceiving the influence of tertiary activities on local and rural
development is more complete, as well as extension of the analysis through considering the links between the
sectors that directly sell the services and products of rural activities and those activities servicing these sectors
Rahman Nurković, Full Professor, Department of Geography, Faculty of Science. Nusret Drešković, Assistant Professor, Department of Geography, Faculty of Science. Correspondence concerning this article should be addressed to Nusret Drešković, Zmaja od Bosne 33/35, Sarajevo, 71.000,
Bosnia and Herzegovina. E-mail: [email protected].
DAVID PUBLISHING
D
REGIONAL DEVELOPMENTAL PROBLEMS OF THE RURAL SETTLEMENTS
737
(indirect effects of tertiary sector); and is also necessary to consider the influence of increase in income on the
economy due to consumption of tertiary activities (induced effects of tertiary activities). In the series of the
mentioned methods by which it is possible to perceive the total or partial influence of tertiary activities on
economy, the models based on input-output analysis are particularly distinguished, as well as the models of
computable general equilibrium (Zhao, Yanagida, Chakravorty, & Leung, 1997). Input-output analysis is
widely applied as the means of estimation of total effects of rural activities; however, one should bear in mind
also its limitation as the means of estimation of net effects of development activities on economy of local and
rural development in Bosnia and Herzegovina. Input-output analysis is based on the assumptions on fixed
prices and fixed coefficients and may result in overestimation of economic effects of tertiary activities on local
and rural development.
With input-output analysis only positive effect of rural activities on economic activity is perceived, with
neglecting the negative effects that may be bigger than the positive ones. The shortcomings of input-output
analysis initiated bigger and bigger use of the computable general equilibrium model as a set of equations
that describe production, consumptions, trade, and country’s activities (Dwyer, Forsyth, & Spurr, 2004;
Blake, Gillham, & Sinclair, 2006). Contributing in different ways to economic understanding of tertiary
activities, computable general equilibrium models indicate that, due to influence on prices of factors and real
appreciation of course, the influences of tertiary activities on the sectors related to tertiary activities are
smaller than they are anticipated by input-output models, and, at the same time, they also enable
consideration of negative effects of tertiary activities on other sectors competing for these factors (Blake,
2009).
Unequal regional development is a common regularity of development of rural activities, which is
particularly expressed, in specific developmental stages, in polarization of economic activities, population, and
income. On the basis of these, they have a smaller number of employed persons and, on the whole, less
developed tertiary activities. Influence of tertiary activities on local and rural development in Bosnia and
Herzegovina requires the use of particular methods. Therefore, studying the general methods and the way of
methodology of urban and rural geography in a combination with regional geographic approach will be applied.
As a basic method of gathering the sources of primary data, the interview method was used, i.e., depth
interview, at which a major instrument was a reminder for interview. About 20 economic activities in Bosnia
and Herzegovina were examined. The research was also completed by the analysis of the contents of secondary
sources, interpretation and description of the adequate data bases of the Agency for Statistics of Bosnia and
Herzegovina.
Introduction
In contemporary period of economic-geographic development around 35% of rural population live in rural
space of Bosnia and Herzegovina. Most of the rural space takes increasingly characteristics of clear lagging
behind in development, which represents a significant negativity of all demographic, sociocultural, and spatial
planned indicators. With a change of socio-economic system into market economy, rural space of Bosnia and
Herzegovina is facing new challenges. In today’s world, boundaries between cities and villages are erased by
processes of urbanization and industrialization. Many of applied technology achievements like road and rail
routes, electric power, telephone network and other increasingly bring, among other, industry, different

REGIONAL DEVELOPMENTAL PROBLEMS OF THE RURAL SETTLEMENTS
738
warehouses of goods, recreation zones and similar to rural areas.
In all this, more and more intensive development of contemporary economic activities is also particularly
expressed. At the same time, new research areas that may be added to the previous ones are being gradually
developed including, in particular, works from the field of the geography of food, which examines the
connections among production, consumption, and presentation (Goodman, 2001), farming cultures (Moris &
Evans, 2004), and the facilities in rural space and bringing together experiences of rurality (Little & Leyshon,
2003). For needs of this paper, our focus will, therefore, be shifted away from the wider context of rural
changes towards agrarian production as an element that has been deemed as a compatible function of rural
spaces of Bosnia and Herzegovina.
In this paper, among other, it has been emphasized that every rural area in Bosnia and Herzegovina
represents a particular individuality and distinctiveness. The paper itself has been divided into three parts. In the
first part, an application of a new institutional theory, in the sense of analyzing the rural space as a product of
contemporary economic development, has been discussed. In the second part, a context of development of
social and economic restructuring of rural spaces in Bosnia and Herzegovina, as a subject of analysis at the
village level, has been discussed. The third part represents a discussion over a process of improvement in
transportation in rural settlements, and the method in which the process itself has been shaped by the state and
social institutions has also been presented and analysed. Finally, conclusions were made in order to emphasize
the role of institutions in an interaction between rural spaces and rural economy, and to stimulate the changes in
rural economy of Bosnia and Herzegovina (Nurković, 2012a).
Rural Space as a Product of Contemporary Economic Development
In the rural space of Bosnia and Herzegovina, numerous and complex economic processes are ongoing,
such as the ownership processes, land use, growing agricultural cultures, then the method of exploitation of
forest areas, development of industry and tourism and other. All of this has forced its inhabitants to increasingly
adjust that space by creating better living conditions and to achieve the living standard level like that of urban
environments. In Bosnia and Herzegovina, more and more rural spaces are invested into building of
infrastructure, education, employment, rental of land and buildings, industry, tourism, and capital market.
Perspectives indicate that rural environment changes in Bosnia and Herzegovina, also that these changes are the
result of series of factors, including influence of agriculture in general, of forestry and primary production and
the influence of urbanization and accelerated construction. A consequence of this is an accelerated development
of tourism and activities that are conducted during free time, as well as care for protection of environment and
the processes originating out of the rural space (Nurković, 2010).
Modern agriculture in rural spaces is in conflict with natural environment. Traditional growth of
agricultural goods has always been dependant on nature, and constrained with land type, climate, and
topography. It has been, therefore, handed over to mercy of weather, pests and different diseases. For pioneers
of modern agriculture, however, these constraints and risks represent a loss of capital and they started to use
new technologies for control, manipulation and changing the conditions of environment. From old represented
techniques, such as irrigation and selective growth, through improvement on slopes and land, up to advanced
biotechnology and an application of agricultural chemicals, agricultural practise has developed to level that has
changed environment in order to improve productivity of agricultural production in Bosnia and Herzegovina.
REGIONAL DEVELOPMENTAL PROBLEMS OF THE RURAL SETTLEMENTS
739
Lack of investment in rural spaces of Bosnia and Herzegovina results in degradation of farms and households;
small clusters of houses or small mobile houses are in dilapidated condition, on the other hand emptying out the
cities is present with emptied shop-windows and slow destruction of infrastructure, and deserted factories
mines and mills (Lorber, 2010).
In 2012, Bosnia and Herzegovina had 5,825 settlements. Medium size settlement had 751 inhabitants, but
only when centres of municipalities or, for example, only 12, for our frames, large cities were excluded. In
centres of the municipalities, in the same period lived 1,713,108 inhabitants, and in all remaining 5,716
settlements, there were on average 459 inhabitants. That is a size of an average village of Bosnia and
Herzegovina. Rural settlements in Bosnia and Herzegovina represent a basic form of socio-economic
organization of the population dealing with agricultural production. In Bosnia and Herzegovina, they appeared
and developed next to arable land, respectively where conditions for dealing with agriculture existed. Rural
settlements of Bosnia and Herzegovina are, in general, mostly with a small number of inhabitants. They are
divided into livestock and agricultural settlements. Livestock settlements are located in mountainous section,
they have a poorly developed network of roads and are slowly urbanised. Agricultural settlements appeared by
edges of arable land, so that arable land was touched.
Unfavourable development processes in rural areas are most directly noticeable in a negative demographic
trend, depopulation, and a reduction of general population density caused by it. That regularity is confirmed
also by a higher index of depopulation of rural areas in 2012. Analysis of the mentioned data shows that
changes of age structure of population of Bosnia and Herzegovina include two fundamental components
(Horvat, 2010).
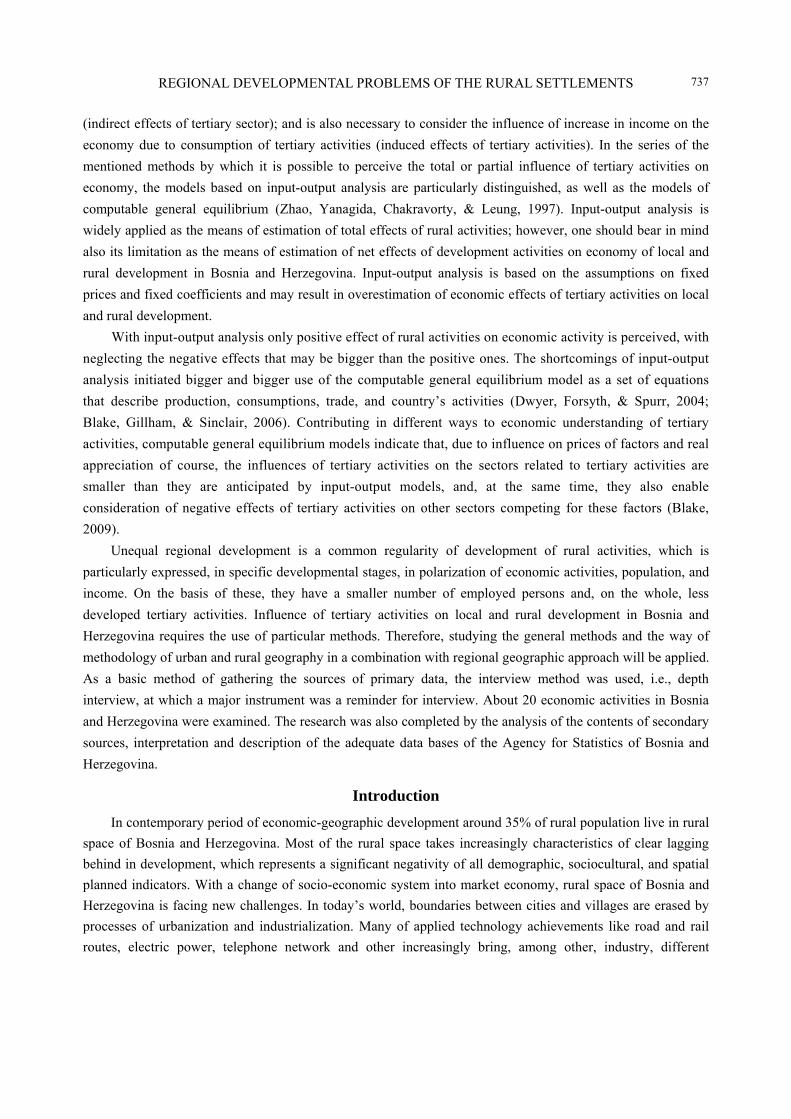
These are an accelerated reduction of young population share (0-19 years old), that makes somewhat more
than a fourth of population of Bosnia and Herzegovina in 2012 (in contrast to 1991 when it made a third), and a
significant increase in old population share (more than 60 years old), which is higher than 17%. With this,
population of Bosnia and Herzegovina is not categorized as old population (see Table 1 and Figure 1).
Table 1
Age Groups of Population of Bosnia and Herzegovina, of Urban and Other Settlements in 2012 Age group 0-19 years old 20-59 years old 60 and over Urban settlements 26.2% 54.9% 17.4%
Rural settlements 26.7% 58.3% 15.0%
Bosnia and Herzegovina 25.6% 54.1% 20.3%
Note. Source: Statistical Annual of Bosnia and Herzegovina, the State Agency for Statistics of Bosnia and Herzegovina, Sarajevo,
2012.
This also prevents establishment of an active land market, which furthermore enables the farmers to
purchase and use modern technology and knowledge, thus having benefit from market economy. In addition,
only 0.4% of land is irrigated. All of these are the reasons for low competitiveness of agricultural sector of
Bosnia and Herzegovina. Crop production accounts for 54% of cultivated land, with wheat and maize as the
most important crops. Forage crops account for 29%, vegetables 15%, and industrial crops only 2%. For this
reason, major occupations of population in rural spaces of Bosnia and Herzegovina have always been
agriculture and cattle breeding until development of industry and other non-agricultural activities, which
developed successfully after the Second World War.

REGIONAL DEVELOPMENTAL PROBLEMS OF THE RURAL SETTLEMENTS
740
Figure 1. Distribution of agricultural land in Bosnia and Herzegovina in 2012. Authors: Nurković and Drešković.
Rural areas of Bosnia and Herzegovina make over 90% of its territory. These areas have been exposed to
degradation processes since the mid-19th century, and particularly during the socialist economic system since
the mid-20th century, from the 1950s to the 1990s, with transition in the past 10 years and during the war from
1992 to1995, which lead to threshold of dying out of the rural, a village as a basic element of rural space.
Civilization and historical processes of deagrarization, deruralization, industrialization, and urbanization are
present in specific stages of development all over the world and have extremely selective and negative
influence on development of the village of Bosnia and Herzegovina. Even around 75% of rural areas of Bosnia
and Herzegovina were characterized by pronounced lagging behind in development in 2011, which designates a
clear negativity of all demographic, socio-cultural and spatio-planned indicators. Frequently isolated from the
traffic routes, with old age of population and predominant share of elderly and women’s population, these areas
are dying out fast. Only 30% of rural areas of Bosnia and Herzegovina are in stagnation—an average type of
development that is characterized by a series of favourable prerequisites for faster, easier, and more rational
managing the processes and relations (Woods, 2009).
Rural space of Bosnia and Herzegovina has lately been affected by economic impoverishment and
insufficient communal and social infrastructure. Fragmented and non-rationally plotted holdings (agricultural
land and forests), are unprofitable and do not offer an opportunity for development of commercial farming.
Even the holdings that are oriented towards quantity and have needed prerequisites are facing a big competition

REGIONAL DEVELOPMENTAL PROBLEMS OF THE RURAL SETTLEMENTS
741
in the market. Development and entry of new, non-agricultural activities into rural space, frequently is not a
planned process but a consequence of impossibility of making a living from dealing with primary sector
activities. At the same time, a social reputation of a peasant is decreasing. A whole series of factors lead to such
situation, which marked development of a village and rural space of Bosnia and Herzegovina in the past,
primarily since the mid-19th century and abolition of serfdom, until today.
Revitalization of a village in Bosnia and Herzegovina, in the sense of sustainable and overall development
is an indispensable process of preservation of rural spaces as primary production areas of food and other goods,
areas of a specific anthropogenic landscape with pronounced natural, traditional, cultural and historical
elements, oases of greenery and ecological balance, and finally as areas of tranquillity and rest from dynamical
and stressful urban milieu. Tourism in rural space is one of the factors that may have an essential role in
renewal and sustainable development of a village (Drešković & Đug, 2009). In Bosnia and Herzegovina, there
is a certain level of unofficial employment; therefore, all data on official employment should be carefully
interpreted. The share of unofficial sector in total employment in Bosnia and Herzegovina has increased from
37% to 42% in the period between 2001 and 2012. Unofficial employment is largely concentrated in agriculture
sector with more than 50%, with a big number of self-employed workers and their family members working
with them.
Figure 2. Structure of farms in Bosnia and Herzegovina according to area in hectares, 2012.
Bosnia and Herzegovina has 2,450,000 of hectares of agricultural land which are 48% of total area, of
which arable land accounts to one million hectares, orchards 36,000 hectares, vineyards 4,000, while the rest of
470,000 make meadows and pastures with 935,000 hectares. This means that agricultural land represents a
deficient resource, which should be treated very carefully, in order to achieve as much of added value as
possible (0.26 ha of arable land available per capita, respectively 0.51 ha of agricultural land). In spite of that,
more than 40% of agricultural land is still unused. It is very important to emphasize an extremely unfavourable
structure of agricultural holdings in the sense of their sizes (see Figure 2). The average size per holding is 3.1
ha, and the holdings are, on average, divided to seven to nine plots, which represents a basic element that slows
down the faster modernization of this sector.
Rural areas, in which agriculture dominates, are dominant in agriculture in the sense of land use and in
economic sense as well. These agrarian, rural areas in Bosnia and Herzegovina contain two subcategories:
Areas, in which agriculture has a strong structure of production, high productivity and in which industry of
cultivation has an important role, can be found in North Bosnia. Socio-economic sustainability is moderate or
REGIONAL DEVELOPMENTAL PROBLEMS OF THE RURAL SETTLEMENTS
742
high. An intensified agriculture puts the environment and landscape under high pressure.
Areas, in which agriculture is a traditional activity, have a weak production structure. Weak productivity is
present in Posavina, Herzegovina and in most of the places of Central and East Bosnia. Their socio-economic
sustainability is poor. Environment and landscape are under weak pressure.
Processes of restructuring the rural areas in Bosnia and Herzegovina were taking place with different
intensity and with spatially differentiated effects, in dependence of interdependent influence of more factors.
Among these, fundamental importance had three factors:
Developmental specificities caused by differences in socio-political system until the beginning of transition
(central planning in former communist countries, respectively a combined planned market economy in the area of
ex Yugoslavia);
The method of deconstruction of collectivistic systems of the complex state formations (peacefully or in
war);
Recent position of single states within the European integration processes.
Development of industrialisation in Bosnia and Herzegovina has caused the deep structural changes in the
period after the Second World War, which resulted in complex socio-economic transformation, with
corresponding consequences in structure of population, functional and physiognomic characteristics, and the
environment of rural areas. Widely initiated, urban-based industrialisation has been followed by an intensive
social restructuring of farmers and deagrarisation, and related to this, rural exodus as well. During the 1950s, in
the intercensus period from 1953 to 2012, a number of farmers declined by around 24,539,271 or 79.5%. In this
context, it is necessary to mobilize the unused resources (human and natural—40% of arable land is not used)
in order to introduce new technologies for the chosen production lines and adopt a modern business philosophy
according to which a consumer is in epicentre of business operation. The first step in this direction is to
stimulate the farmers (but also the population from other activities) to develop or to stimulate young people to
develop business activities in this sector. This will lead to development of local labour capacities (social capital)
indispensable for drawing on the structural funds of the European Union.
A better and sustainable use of human and natural resources is necessary. If this sector succeeded in using
at least a half of the unused land in Bosnia and Herzegovina it might employ 20,000-25,000 of new workers
only in rural areas (primary food production). If Bosnia and Herzegovina manages to establish a quality safety
system in accordance with the requirements of the European Union and the global market, agricultural sector
could start an export production of the products of animal origin, meat, milk, and fish, which would lead to a
significant reduction in trade deficit that is estimated to be around 100 million KM. Development and
strengthening of the other economic activities, as an integral part of rural economy, like accommodation
capacities and tourist industry, and different services of narrower scope, would definitely create new jobs in
rural areas and improve quality of life of rural communities and result in reduction of import of low-quality
food, and by this, improve the quality of nutrition of the major part of population of Bosnia and Herzegovina.
This will improve a health condition of the population, thus reducing costs of health and social protection.
Socio-economic Transformation in Rural Areas
Social and economic restructuring the rural spaces in Bosnia and Herzegovina turned a village in a much
more complex space than it used to be. Most of these developmental problems appeared in the period of
polarized country’s development and spatial differentiation of rural areas caused by it, until the beginning of

REGIONAL DEVELOPMENTAL PROBLEMS OF THE RURAL SETTLEMENTS
743
the 1990s (Jordan, 2009).
Unfavourable developmental processes were additionally intensified by the war events during the first half
of that decade, by which rural periphery was deeply destabilized. This showed the characteristics of crisis in
demographic, regional, and socio-geographic development of peripheral areas, of which a significant part was
affected by an extreme rural ruination. Urbanisation process made itself become one of the problems in rural
areas of Bosnia and Herzegovina. Comprehensive building plans applied at the end of the 20th century included
substantial changes in rural space, which potentially affected a number of people in environment. Planners and
many other experts think that land availability and a relatively scarce population density made rural areas
become attractive locations for construction of a large number of buildings, which, more or less, cause damage
to environment. Transformation that has happened at the end of the 20th century reflects in replacement of such
“rural policy” with a new “policy of rural”, in which only the meaning and management of rural space is a key
question. There is a tendency of intersecting the rural spaces by roads and railways, which mostly connect the
major regional centres in Bosnia and Herzegovina. Also, construction of accumulation lakes and dams has so
far been, and will be, a part of rural economy based on exploitation of natural rural resources (Woods, 2009).
Hydroelectric sources of Bosnia and Herzegovina appear as surface water courses, underground waters,
waters of the Adriatic Sea, and lake waters. This is a result of climate characteristics and geologic and
geographic factors. Total technologically usable power of water resources is estimated to 17.7 billion kWh.
However, degree of water power utilisation around 20% of total hydroelectric potential is considered to be very
low. This requires examining the responses to rural restructuring that was accepted by responsible people for
management of rural areas and of those living in rural areas, before the final research on experiences of changes
and on a modern village, by the people from all parts of rural population in Bosnia and Herzegovina (see
Figure 3).
Figure 3. Mini-plantation of vines near Srebrenik 2013.

REGIONAL DEVELOPMENTAL PROBLEMS OF THE RURAL SETTLEMENTS
744
Economic changes in rural areas of Bosnia and Herzegovina are demonstrated in several elements. These are:
Reduction in agricultural enterprises and a number of employed people in agriculture;
Accompanying structural changes in agriculture and in the labour market in general (key factor:
nonexistence of possibility for employment on the farms), specialization, professionalism in agriculture,
increased non-agricultural employment—or rural poverty, sustainable production, abandonment a village,
Influence of globalization: competing pressures and an additional place for expansion of market (new
services in rural environments, marketing, and local production, connection with tourism, gastronomy (Jordan,
2009).
The presented aggregate indicators conceal the real, significantly more expressed differences in intensity
of depopulation of the single parts of rural space. This is confirmed by an index of a change of number of
population in the observed period on Bosnia of Herzegovina of 63.0%. More unfavourable demographic
processes than those of the state average in rural areas are additionally corroborated by recent dynamics of
population, differences in depopulation rate from 2001 to 2012, and increase in differences in general
population density in 2012. The situation is getting more and more complex, as well as monitoring and a
significant lagging behind of the employed in development-propulsive and more income-based tertiary sector.
The presented dynamical and structural lagging behind of rural areas is directly expressed in cultural landscape
of periphery, in its spatial-functional and morphologic-physiognomic characteristics. This is also corroborated
by the selected indicators of social-geographic development, share of uncultivated agricultural land, average
size of a settlement, and share of abandoned apartments (see Table 2).
Table 2
Share of Agricultural Workers in Bosnia and Herzegovina in 2012
B & H
FAO The World Bank Farms in private ownership
Ownership of land
Labour force in agriculture per 1,000 inhabitants
Labour force in rural spaces (%)
Labour force in agriculture (%)
Agricultural households per 1,000 inhabitants
Companies and family farms with more than five ha (per 1,000 inhabitants )
85 4 18 290 110
Note. Source: The State Agency for Statistics of Bosnia and Herzegovina, Sarajevo, 2012.
Lagging behind the development of rural areas is also confirmed by evidently unfavourable
social-economic structure of population against the average of Bosnia and Herzegovina. That disadvantage is
contained in almost double share of the employed people in primary sector activities, and, at the same time, a
significantly smaller share of the employed people in tertiary sector activities. Although an orientation towards
primary sector activities is bigger, first of all, towards agriculture, which is partially predisposed also with
spatial structure of rural areas marked with dominance of agricultural land, this fact at the same time, indicates
to their lagging behind in the process of transition from traditional agrarian society into a modern industrial and
tertiary (service) society (Ruppert, Shiffer, Maier, & Reinhard, 1977).
Conclusions
Considering the recent development processes, there is a clear difference between the predominant rural
areas and explicit rural areas, where rural areas are distinguished for unfavourable characteristics with most of
the observed indicators. Unfavourable characteristics of demographic development of rural areas are expressed

REGIONAL DEVELOPMENTAL PROBLEMS OF THE RURAL SETTLEMENTS
745
in higher and higher depopulation rate between 1991 and 2012, lower population density, negative migration
balance, higher rate of natural fall, respectively total depopulation rate of old age of population. At the same
time, explicit rural areas are separated with a higher degree of economic utilization of population and a higher
share of employed people in primary sector against the average of rural areas. Due to higher existential
dependence on development, rural areas are generally characterised by smaller share of uncultivated
agricultural land against the average of Bosnia and Herzegovina. In structure of populating the rural areas
smaller settlements and a larger part of abandoned apartments for permanent living are dominant, with
Herzegovina standing out with, on average, the smallest settlements and the biggest share of abandoned
apartments among the regions.
The presented, spatially-differentiated structural and dynamical problems of rural areas of Bosnia and
Herzegovina, are the resultant of cumulative influence of different factors, from geographic position
(remoteness of the developed central settlement), through regional development, to war events during the first
half of the 1990s. At the same time, it is important to emphasize that the existing development problems are
different in each single rural area, respectively the consequence of different combination of influences of the
mentioned factors, which imposes the need for a differentiated approach to their solving. A prerequisite for
such approach is a preparation of exactly determined typology or rural areas at all levels of spatial development,
which is one of preferential tasks of geographic branch and geographers, not only in Bosnia and Herzegovina,
but also in other transition countries of Europe.
These possibilities come in forms of advanced agricultural production, a larger non-agricultural
employment, and expansion of market for the products, increased market of formal loans, increased land values,
a better approach to education and health services, and a higher standard of living. Development of transport is
mostly driven by political and economic motives. The both served to interests of the state and regional
economy rather than to interests of rural population. With all these factors in circulation, improvement of
socio-economic conditions is connected with socio-economic differentiation. This made almost impossible to
generate a simple conclusion on nature of relationship between improvement of transport and rural economy.
At present, rural population of Bosnia and Herzegovina enjoys larger economic opportunities for development,
but the life gets more complex.
References Blake, A. (2009). The dynamics of tourism’s economic impact. Tourism Economics, 3, 515-628. Blake, A. T., Gillham, J., & Sinclair, M. T. (2006). CGE tourism analysis and policy modelling. In L. Dwyer, & P. Forsyth (Eds.),
International handbook on the economics of tourism. Cheltenham: Edward Elgar. Drešković, N., & Đug, S. (2006). Establishment of protected natural areas in Canton Sarajevo and possibilities for their
ecotourism valuation. Annales, Ser. Hist. Sociol., 16, 233-246. Dwyer, L., Forsyth, P., & Spurr, R. (2004). Economic impacts of aviation stamp duties. Sustainable Tourism Cooperative
Research Centre, Gold Coast, Qld. Goodman, D. (2001). Ontology matters: The relational materiality of nature and agro-food studies. Sociologia Ruralls, 41,
182-200. Griffin, E., & Ford, L. (1980). A model of Latin American city structure. Geographical Review, 70, 397-422. Hara, T. (2008). Quantitative tourism industry analysis: Introduction to input-output, social accounting matrix modelling and
tourism satellite accounts. Amsterdam: Elsevier, Butterworth-Heinemann. Horvat, U. (2010). Health resorts and their importance for the development of less developed areas in Slovenia. Journal for
Geography, 5(1), 147-157. Jordan, P. (2009). Development of rural space in post-Communist Southeast Europe after 1989: A comparative analysis. Journal
REGIONAL DEVELOPMENTAL PROBLEMS OF THE RURAL SETTLEMENTS
746
of Geography, 4(1), 89-102. Jurčić, L. (2000). Razvitak input-output analize u Hrvatskoj. Ekonomski Pregled, 51(11-12), 1313-1333. Little, J. (2003). Riding the rural love train: Heterosexuality and the rural community. Sociologia Ruralls, 43, 401-417. Little, J., & Leyshon, M. (2003). Embodied rural geographies: Developing research agendas. Progress in Human Geography, 27,
257-272. Lorber, L. (2010). New challenges for sustainable rural development in the 21st century. Journal for Geography, 5(2), 6-13. Moris, C., & Evans, N. (2004). Agricultural turns, geographical turns: Retrospect and prospect. Journal of Rural Studies, 20,
95-111. Muller, D. (2000). Der landliche Raum Sudosteuropas in der Transformation. Agrarpopulismus in der Zwichenkriegszeit und
Reformstrategien in der 90er Jahren am Beispiel Rumaniens, Aus der Sudosteuropa-Forschung, 12, 55-61. Nurković, R. (2006). Ekonomska geografija svijeta. Tuzla: Univerzitet, Prirodno-matematički fakultet. Nurković, R. (2010). Infuence of tertiary activities on transformation of the rural settlements in Bosnia and Herzegovina. Journal
for Geography, 5(1), 67-73. Nurković, R. (2012a). Socio-economic transformation of Bosnia and Herzegovina. In J. Bański (Ed.), Local and regional
development-challenges and policy issues (pp. 151-161). Warsaw: Institute of Geography and Spatial Organization. Nurković, R. (2012b). Urbana geografija svijeta. Sarajevo: Prirodno-matematički fakultet. Ruppert, K., Shiffer, F., Maier, J., & Reinhard, P. (1977). Sozialgeographie (pp. 40-42). Braunschweig: Georg Westermann
Veriang. Statistical Yearbook of Bosnia and Herzegovina for 1961. (1961). Sarajevo: The Republic Agency for Statistics. Statistical Yearbook of Bosnia and Herzegovina for 1971. (1971). Sarajevo: The Republic Agency for Statistics. Statistical Yearbook of Bosnia and Herzegovina for 1981. (1981). Sarajevo: The Republic Agency for Statistics. Statistical Yearbook of Bosnia and Herzegovina for 1991. (1991). Sarajevo: The Republic Agency for Statistics. Statistical Yearbook of Bosnia and Herzegovina for 2001. (2001). Sarajevo: The Republic Agency for Statistics. Statistical Yearbook of Bosnia and Herzegovina for 2007. (2007). Sarajevo: The Republic Agency for Statistics. Statistical Yearbook of Bosnia and Herzegovina for 2009. (2009). Sarajevo: The Republic Agency for Statistics. Woods, M. (2009). Rural geography. London: SAGE Publications. Zhao, D., Yanagida, J., Chakravorty, V., & Leung, P. (1997). Estimamating economic impacts from turisam. Annals of Turism
Research, 1(24), 76-89.
Chinese Business Review, ISSN 1537-1506
November 2013, Vol. 12, No. 11, 747-761
Talcott Parsons’ AGIL Schema-based System Identification
of Administrative Problems of North-East Vocational
Education in Thailand*
Surachai Tumtavitikul
Thammasat University, Bangkok, Thailand
Talcott Parsons was a great well-known sociologist whose approach was based on system theory. He identified
social system into subsystems which were A (Adaptation functions), G (Goal gratification functions), I (Integration
functions), and L (Latent pattern maintenance functions). His approach was based on the concern for the stability or
maintenance of social system. The aim of this research is experimentally to identify the social system of north-east
vocational education’s macro administrative problems in Thailand by utilizing AGIL schema. The writer has
adopted the symbiosis or maintenance of socials system stance by utilizing this approach. The results of the
research were, firstly, the major macro vocational education eight problems (sentences) and 27 sub-problems
(sentences) and secondly, the 15 diagrams of above-mentioned problems and sub-problems after utilizing AGIL
concepts (In this paper, the writer illustrated seven of them). The study had been done using both secondary and
primary data. The secondary data were collected from the written documents and from the internet concerning the
vocational schools. In depth interview data were collected. Some respondents have been interviewed more than
once. The total of 69 times in depth interview were collected. The researcher had utilized Japanese Kawakita Jiro
Method of processing scattering paper clips from these primary and secondary data. In conclusion, the detail of
main findings, system of sentences of the macro problems, some derived diagrams examples (After AGIL schema
applying) and also implication from the main findings have been illustrated.
Keywords: AGIL schema, Talcott Parsons, north-east vocational education, Thailand
The Significance of Public Vocational Colleges and the Aim of This Study
Up to recently the graduates from vocational colleges (two years or four years school system after
graduating from junior high school (Grade 9)) have been the “doers” of almost every economic activities
including service sectors. The main vocational education in Thailand is implemented by government. Thus, the
question what enhance and hinder the development of public vocational colleges in Thailand is as significant as
question into the strength and weakness of Thai economical activities themselves and also the question into the
* Project Supported: Institute of Human Research, Thammasat University, Thailand.
Surachai Tumtavitikul, Associate Professor, Department of Operation Management, Thammasat Business School, Thammasat
University.
Correspondence concerning this article should be addressed to Surachai Tumtavitikul, Department of Operation Management,
Thammasat Business School, Thammasat University, 2 Prachan Rd., Pranakorn, Bangkok, 10200, Thailand. E-mail:
DAVID PUBLISHING
D

TALCOTT PARSONS’ AGIL SCHEMA-BASED SYSTEM IDENTIFICATION 748
performance of public administration itself.
The aim of this research is experimentally to identify the social system of north-east vocational
education’s macro administrative problems in Thailand by utilizing AGIL schema. The writer has adopted the
symbiosis or maintenance of social system stance by utilizing this approach.
The Motives and Aspects of the Study
The study had aimed at system identification of the administrative characteristics and problem of the
north-east vocational colleges in Thailand. The study had done using both secondary and primary data. In depth
interview data were collected from more than 20 directors, deputy directors of the north-east vocational
colleges and 10 government employees from the Ministry of Education on the administrative problems. Some
respondents have been interviewed more than once. The total of 69 time of depth interviews (short of long)
were collected from these three groups. Notingly, the interviews themselves are one of the main objectives.
The motive of the study is an experimental study of hypothesis creation process by utilizing Talcott
Parsons’ AGIL schema in system identification in order to maintain the social system.
The experimental discussion related to how to identify social systems from the perspective of relationalism
or specifically the diagram (two dimensions) presentation of the social systems from the perspective of
symbiotical macro operations including some issues related to methodological problems.
Approaches to Methods of the Study
The study on system identification of the administrative problems of the north-east vocational colleges in
Thailand had been done using both secondary and primary data. The secondary data were collected from the
written documents and from the internet concerning the vocational colleges. The primary data were from the
depth interview as mentioned before.
The study fully employed the Talcott Parsons’ AGIL schema which was elaborated in diagram by Kazuo
(1974). The reasons of this employment not other sociologists will be discussed in Appendix Figure A1.
The study fully employs the simple K.J. method invented by Kitagawa Jiro of Japan (prevalent in
operation management) in gathering, analyzing, and idea creating of the data which will be presented in the
same next section.
The overall analysis and writing of the diagrams will be implied after elaborated explaining of AGIL
schema and K.J. method in next section.
The Introduction of AGIL Schema and K.J. Method
AGIL Schema
Talcott Parsons was a great well-known sociologist whose approach was based on system theory. He
identified social system into subsystems which were A (Adaptation functions), G (Goal gratification functions),
I (Integration functions), and L (Latent pattern maintenance functions). His approach was based on the concern
for the stability of social systems.
More elaborately, Talcott Parsons concerned the maintainance of the social system by noted that it could
be done by responding to function of each A-G-I-L subsocial systems.
Adaptation function is to realize the main needs of obtaining material (or money) of the system by
material production or service production (in this case of vocational education). This is the main function of the

TALCOTT PARSONS’ AGIL SCHEMA-BASED SYSTEM IDENTIFICATION 749
social system in order for human to adapt to the environment. Conventional speaking, this is economic
function.
Goal gratification function is to create the aims and mobilize resources in order to gratify this. Example in
our case is the mobilizing personnels to create a vision or plan. Or the soft power utilization of creating unity
among personnel’s by mobilization Thai dancing event. This might be politic function.
Integration function is to implementing goal gratification by realizing it in forms of law, regulation or in
the detailed agenda or other else in order to integrate the systems.
Latent pattern maintenance function is to maintain or create, or process the latent pattern inside the systems
which is usually called “culture” or “education”. For example, the act of religion ceremony or preaching.
The main hypothesis of this study is that no role-based actions which could be eluded from these systems.
The next hypothesis of this study’s AGIL diagrams is that actions in these A-G-I-L system are not
excluded between subsystems. That means they could be redundant.
These A-G-I-L functions are main functions which could be hierarchies into subsystems as Figure 1. By
Kazuo (1974), Figure 2 is created.
Thus the real functionings are done in dotted sub-diagrams. Experimently, the main systems of each
A-G-I-L might be “agents”.
Further more discussion of AGIL schema comparing to other approach will be in Appendix Figure A1.
Figure 1. Hierarchies of the AGIL subsystems’ example in vocational colleges.

TALCOTT PARSONS’ AGIL SCHEMA-BASED SYSTEM IDENTIFICATION 750
Figure 2. Analysed diagram of Talcott Parsons’ schema being main functions of social systems. Source: Kazuo, 1974.
Notes. “sending” arrows means agent’s feeding the denoted functions (information) for the “receiving” agent. For
example, A system’s agents implement or involve in the “production” (including “servicing”) for G subsystem.
K.J. METHOD
K.J. Method was invented by Japanese anthropologist Kawakita Jiro and also conventional well-known
data compositional idea creation wisdom. It is hierarchically data processing method as denoted in Figures 3
and 4. The main principle is that the data will denote their own logics.
The Overall Analysis and Writing of Diagrams
These were implied in Figure 5.
Function concerning labor’s and
products’ market
Creating rightconsness base for the power exercising
Values offering to social groups for
performing each function
Value sharing responsibility offering
Trust demanding under values’ frame
Potent and docile labor offering
Income supplying
Creating of products’ demand.
Creating of culture related to
production
Policy decision implementing
Creating the form of benefit
Creating the responsibilites
for the leading of social
systems
System enhancing for the
administrators and politicians
Latency (pattern maintenance) The system for maintainging or
processing the “patterns” those
exist deeply in social system:
religion, company culture etc.
Integration system
The system of collaborating
various social units and creating
regulations (or laws) for “order”
of the social systems.
Righteousness creating
functions
Creating of operation responsibility
Creating of power utilizing righteousness
Defining moral duties for overall benefits
Creating of laws’ righteousness for
powers and duties
Functions of resources
allocation
Enhancing the power of resources demanding
Setting the standard of allocation
Enhancing the basement of demanding
Positioning of demanding
Power (:-politics etc.)
exercising enhancing
functions
Agents creating functions
for unity/trust/obedience of
the system
Resoures mobilizing related functions
Adaptation system The main system for adaptation
to environment in order to
survive. That is production or
service in order to be financed.
Production (servicing) managing
Efficiency enhancing
Labors divisioning
Liquid resource (monpy) supplying
allocating
Goal gratification
The system of creating social
aims and mobilizing
resources for implementing
of these social aims

TALCOTT PARSONS’ AGIL SCHEMA-BASED SYSTEM IDENTIFICATION 751
Figure 3. The example pictures of K.J. method.
Figure 4. The concept’s picture of K.J. method of processing 40 labels (40 verses).

TALCOTT PARSONS’ AGIL SCHEMA-BASED SYSTEM IDENTIFICATION 752
Figure 5. Qualitative processing of the interviews and secordary data by utilizing K.J. method and AGIL schema.
The Brief History of the Ministry of Education and Office of Vocational Education Commission
Ministry of Education
In 1932, the year of transition into Thai democracy, the national compulsory education plan was firstly
decreed. The educations were equipped with general and vocational ones which this pattern had prevailed until
recently. In 1936, 1939, 1951, and 1959, those education plans had been revised repeatedly. In 1960 the 1st
National Education Development Plan had been decreed in line of the 1st National Social and Economical Plan
from 1961 to 1966. The 2nd to 8th ones had been decreed extending from 1967 to 2001. During these periods,
the agenda in currents were the reform of Thai education which have lasted even today. This has been done by
National Education Committee which was established in 1992. Notingly, in 2003, the Ministry of Education’s
functions were streamlined into “4 Pillars”, which were: Office of the Education Council, Office of the Higher
Education Commission, Office of the Vocational Education Commission, and Office of the Basic Education
Commission of Thailand. The thing which should be noted here is recent happening to the agenda so called,
“The Second Decade of Education Reform 2009-2018” which emphasizes the “whole life learning with
quality” which depicts somewhat educational atmosphere nowadays.
Office of Vocational Education Commission
The history of vocational education lasted from 1899, which vocational schools were established for
training teachers and nurses etc.. In 1941, the Department of Vocational Education was firstly established
within Ministry of Education. In 1960 with 1st National social and Economical Plan, the vocation education
was set into secondary school and higher education (colleges) in every region of Thailand. In 1977, vocational
educations were set into general, technical, and agricultural ones. In 1992, the National Education Committee
had increased more than a hundred vocational colleges and even nearly same number in 1999. In the same year,
Level 1
Interviews and
literature review
The database is sentences in note books
containing 400-450 pages
Level 2
(Data filtering) Selecting 100 labels of key words sentences
Level 3
(Data lead to topics) Process the overall labels to be labels in
Figure 6
Level 4
(Further analysis and
synthesis)
Systemize into the next of next section
K.J. method
(Data explain
themselves)
Level 5
(Allocation of topics
to AGIL model)
Employment of the AGIL schema of Figure
2 and become samples in diagrams in the
next of next section
Level 6
(Overall synthesis) Overall conclusion and synthesization

TALCOTT PARSONS’ AGIL SCHEMA-BASED SYSTEM IDENTIFICATION 753
the laws that had enhanced education by private sectors including private work place (factory etc.) and
establishing private vocational colleges or schooling were decreed. The significant of vocational education had
been intensified in 2003 when Office of the Vocational Education Commission became one of the “4 Pillars” of
Ministry of Education as mentioned before. It seems that the rise of the north-eastern politicians in those years
have enhanced the rising role of vocational colleges into unity of existence of vocational colleges. Finally, the
laws that promote vocational colleges to include bachelor degree programs were decreed recently.
The real final note (from observation through conversations) in this section of “brief history” should be
written here that in theses 10 years like other public administration through out the country, the political rivalry
from “power and money struggling” also prevailed in vocational colleges or Ministry of Education itself. This
phenomenon seems to obstruct the strength of education reform schema, but in contrary, the rise of politicians
from region (especially north-east) has seemed to promote vocational colleges themselves either real budget or
public atmosphere.
Main Findings From the Interviews After Employment of AGIL Schema and K.J. Method
The Main Characteristics of Vocational Colleges Administration
The main characteristics are:
The pubic vocational colleges which outnumber the private ones, are centralized into the Office of
Vocational Education Commission within Ministry of Education (as mentioned before). The central
administrators will send the philosophy, policy, regulation functions outlines, agenda, central schooling
contents, approvement of personnels and other etc. to the regional colleges and also receives the feed-back and
forth (The benefits of this streamlining effects should be noted here).
Each vocational college administration is centralized to the hierarchical administration of directors and
vice-directors.
The regional government seems to have very small impact to the administration of vocational colleges
(from interviews) which seems to be not always negative phenomena (assessed by writer).
From north-east vocational colleges surveying, the infra-structures of the colleges including computerization
are modern and possess vitality. The streamlining to the central government’s good effects are sensed.
The personnel administration including the approval of directors and deputy directors is centralized to the
Ministry of Education (by examination and approval of committee).
Recently, by the central policy, the coordination between colleges and private companies or factories is
promoted and seems to be in good progress. The symbiosis between public administration of vocational
colleges and private sectors seems to be on rail (from observation). The adaptability of people (administrators),
themselves Thai people can not be neglected as one of key factors in this area of study (from observation).
Like other Thai public administration the “Muda” (the “waste” in operation management’s term) has been
sensed in the Minister of Education itself (in some sense, more than regional vocational colleges administration).
This might be related to the “people rifts” in any Thai public work place been observed by the writer.
Even the infra-structure at the regional vocational colleges seems to be good, the difference between the
endowment of the central educational public institutes (universities) and vocational colleges is griefly
incomparable (for example, the research fund for any one researcher in Bangkok well known university is
roughly three times the research fund for the whole one vocational college) and unmentioned by any party even
the regional politicians. Thankfully, this difference seems not to have any antagonism among people. Any way,

TALCOTT PARSONS’ AGIL SCHEMA-BASED SYSTEM IDENTIFICATION 754
for the time being, the symbiosis seems to go on.
Still, the vocational education seems to be possessing vitality with adaptability and flexibility to any
transition partly because of top-down bureaucratic systems’ prevalence (assessed by writer).
System of Sentences of the Macro Problems
The Diagram of System of Major Problems
This diagram is the highest level in the denotation of systems (labels) from K.J. method (see Figure 6).
Findings of Overall Sentences of Macro Problems
1. Macro economic related sentences.
1.1. Paddy field, community and vocational colleges related sentences.
1.1.1. Cities and regions discrepancy.
1.1.2. Curriculum disacknowledgement of the relation between knowledge’s and community development.
1.1.3. Insufficiency of personnels in agricultural regions due to the spill-out of graduates to other sectors.
1.1.4. Few students in agriculture colleges.
1.2. Decrease of demand toward graduates due to the insufficiency of industrial investment.
1.3. Huge discrepancy in endowment between main engineering schools and north-east vocational colleges.
2. Central public administration and central politics related sentences (Education Ministry).
2.1. Centralizing necessity of complex, redundant, and openly changing of administrators and politics
concerned systems.
2.1.1. Directing of activities of colleges from central.
2.1.2. Complex structure of the related administration units.
2.1.3. Frequent transitions of the policy’s agenda.
2.2. Power exercising of politicians and clique formation (for example, the transfer of college directors).
3. Image-morale-culture of prejudice related sentences.
3.1. Morale problems of the teachers.
3.1.1. Hard compulsory work of the teachers including admin works and self-writing works for promotion.
3.1.2. Welfare problem of assistant teachers (low salary).
3.2. Prejudice against vocational college student (image problem).
4. The problems of regional administration and transfer of autonomy to regions.
4.1. The problem of restriction of regional administration potentials except to budget potential.
4.2. The difficulty of regional administration potential toward the area of vocational colleges.
5. The problems concerning curriculums and extra-activities of the students.
5.1. Curriculum’s problems.
5.1.1. The old-fashion of the curriculums.
5.1.2. The limits of the potential teachers.
5.1.2.1. Contradiction between “common” knowledge of engineering school of teachers and “particular”
aspects of ideal vocational colleges’s curriculum.
5.2. “Students” problem of insufficient potentials.
5.2.1. Insufficient capability of math of students.
5.2.2. The inability of some students (20%) to pay college’s fee in some colleges.
6. The problems of contradiction from “common” or “particular” direction of the curriculum.

TALCOTT PARSONS’ AGIL SCHEMA-BASED SYSTEM IDENTIFICATION 755
6.1. The vast areas of vocational colleges’ possible areas of learning nowadays.
6.2. The high cost of endowment of vocational colleges in vast areas.
7. Some unachievement of the policy.
7.1. Unachievement of the agenda that students are possible to select their own study area.
7.2. Unachievement policy for allocation goal of number of students of 50-50 in ordinary education and
vocational one.
7.3. Insufficiency of entrepreneurship of the graduated students.
7.4. Insufficiency of elites from vocational college in country.
Figure 6. The result picture of macro problems from 400-450 pages of notes.
Macro
economic
related
sentences
Central public
administration
and central
politics related
sentences
(Education
Ministry)
The problems
of regional
administration
and transfer of
autonomy to
regions
Curriculum’s
problems Some
unachievement
of the policy
Macro
results Image-morale-
culture of
prejudice
related
sentences
The problems of
contradiction
from “Common”
or “Particular”
direction of the
curriculum
Result picture of macro problems from dept
interviews and related data

TALCOTT PARSONS’ AGIL SCHEMA-BASED SYSTEM IDENTIFICATION 756
Results From the Streamlining of the Macro Administrative
Problems of North-East Vocational Colleges
From the streamlining of the problems, contents below have been identified and analyzed.
The declination of agricultural sector and fuzziness of the direction of economy itself induce the
ambiguities of direction of agricultural and technical vocational colleges, which is the direction of curriculums
themselves. This problem might decrease faith in career of teachers and personnel themselves. Moreover, some
agriculture colleges (one type of vocational college) have decreasing number of enrolled students as well as
some what prejudice from surrounding societies.
Although the streamlining and centralizing of public administration of vocational colleges seem to be
needed among too complexity of the policy practices. The reshuffle of the personnel’s both central ministry and
regional colleges into cliques power structure also induces corruption and “power-related” problem.
The cultural prejudices against vocational colleges graduates impede social opportunity and capability
itself. Partly, this comes from the rampants of the street fighting among vocation colleges mostly in Bangkok at
urban congesting areas around at least these 40 years. The government from Mr. Thaksin’s side, well equipped
with marketing technology, tried to reimage vocational colleges with some degree of success. An example of
such activities is the helpings extended to the people by students in technical matters by out of charge.
Some Derived Diagrams’ Examples (System Identification) of
the Main Investigation (Figures 6-12)
The process of obtaining derived diagrams is the Hypothesis creation process itself. More specifically, the
diagrams themselves are Hypotheses.
Some Implication From the Main Findings
Nowaday, the main vocational education is done by centralized public administration. The role of regional
government in this area should be considered extensively in future together with the liberalizing in this area.
(By now, only five or six well-know vocational institutes are just emerging).
The major problems in Figure 6 and the breakdown of these just constitute the area of vocational
education which should be scrutinized further in future research.
Ordinarily, the administration of the vocational colleges is done by function prescription level (decree),
agenda prescription level, and area’s college autonomy level. These were called “Funciton-Agenda-Area”
usually by directors of the colleges. Our analysis in this research seems to be meta-functions above of these
three levels. Thus, we have to further study these derived meta-functions and deduce and induce it into
“Function-Agenda-Area” terms for utilization.
Ideally, the relationship among sub-problems or major problems will be identified by the Figure like
Figures 7-12. These should be explored further.
One of the main methodological problems is the involvement of the “Agents”. One way of soluting this
problem might be the introducing of agents connected with the “sending arrows” and “receiving agent” as
mentioned before or more explicity, the locating of “Agents” into the macro blocks of A-G-I-L (not the dotted
ones). Katai Osamu have introduced the novel method which could include “Agents” in Figure. This will be
mentioned again in Appendix Figure A1.

TALCOTT PARSONS’ AGIL SCHEMA-BASED SYSTEM IDENTIFICATION 757
Figure 7. Some likely impact to systems when information 1.1.1 enters through G system.
Figure 8. Some likely impact to systems when information 1.1.1 enters though L system.
To enhance
less trust in
own’s role
and career
L To enhance
less trust in
autonomy’s
utilization
Possibility of
new values
emerging
A G
I
Emergent
Inform 1.1.1
Problematic
Solve problem
To define
moral duties
for overall
interests
G To send policy
decision for
implementation
Information 1.1.1 “Cities and regions
discrepancy”
A
L
I
Possibility of new values
emerging

TALCOTT PARSONS’ AGIL SCHEMA-BASED SYSTEM IDENTIFICATION 758
Figure 9. Some likely impacts to systems when information 1.1.1 enters through I system. Note: The influence of information
1.1.1 entering I system might be more inert than entering other system for the time consuming of the legal process.
Figure 10. Some likely impacts to systems when information 1.1.1 enters through A system.
To be less
mutal trust in
the system
unless
improvement
Inactivisation in
both students
number and also
budgets of
agricultural
vocational
colleges
A
Possibility of
revising of
standard of
resources
allocation by
new positioning
of demanding
Inform 1.1: Insufficiency of personnels in
agricultural regions due to the spill-out of
graduates to other secors
G
I L
A
To obstruct the
righteousness in
autonomy
utilization
I
To enhance
righteousness
in up-dating
negotiation
To be less in
assisting
power
systems.
To create
new forms
of interests
To be
difficult in
mutual
values
sharing
G
L
Inform 1.1.1

TALCOTT PARSONS’ AGIL SCHEMA-BASED SYSTEM IDENTIFICATION 759
Figure 11. The clues toward “huge discrepancy in endowment between main engineering schools and north-east vocational
colleges” (Inform 1.3).
Why Employing AGIL Schema Not Other Sociological Methodologies
Firstly, by employing AGIL schema, the writer took the stance that “total social structure” be existing. It
corresponds to the aggregated phenomena. Other sociology approaches focus equally on “structure” on human
factor so-called “individualistic approach”. Utilization of AGIL schema might stem from the writer’s belief that
Thai society is unbelievably not too difficult to predict if data being provided and is vulnerable to the structures
norms or regulations. Moreover, it is not too much complex as thought from first glance.
Secondly, AGIL schema is something that takes the hypothesis of ideal condition for maintaining or
stabilizing the social system which is like “symbiosis” concept.
Thirdly, by the above approaches, the writer took the stance of “operation” more than “explanation”.
“Aspect System’s” Character of Social System Manipulation
Every manipulating, analyzing or synthesizing of social system needs “each approach” or grasping
particular aspect which varies upon each sociologist. The “correct explanation” might not exist. This might
result in “heuristic” and “operation” approach to social systems in artificial intelligence’ or system theory
approach itself.
Concerning “Opened System” Problem
Thai social system identification confronts the “opened system” controversy. For example, we often notice the
influence of schools alumni to the operation of the reshuffle of high ranked personnel’s (like related politicians).
Compromise
to Inform 1.3
(-)
Compromise
to Inform 1.3
(-)
Compromise to
Inform 1.3
(-)
Reinforce to Inform 1.3
(+)
A
Compromisation
of vocational
colleges’
administrators
High
demand
for
vocational
colleges’
students
L
The
looseness of
the
demanding
Characteristics
of the system
to chance
present status
I
Problematic
resource
allocation
G
Inform 1.3 Under hegemony of ruling regime
“Huge discrepancy in endowment between main engineering schools and north-east
vocational colleges” (Inform 1.3)
Vocational colleges society including related educational circle.

TALCOTT PARSONS’ AGIL SCHEMA-BASED SYSTEM IDENTIFICATION 760
In writer’s understanding, Luhman solves this problem and complexity problem by reducing “actions” or
“activities” into “communications”, and selects the objects of analyzing in “system” in a particular way. This
should be discussed in the future.
The Redundancy of Variables in A-G-I-L’s System
In abstract terms, the units of A-G-I-L system are “actions”. The writer’s approach to this is rather
ambiguity. By granted, the writer took it as vague “activities” done by “agents”. Some of these “activities” or
“agents” or tentative “actions” might be redundant in sub-systems of A-G-I-L system.
Another aspect is the redundancy of shadow of unofficial organization over official organization. This
counteracts the grasping of system. It also counteracts the writer’s opinion mentioned before that it is not too
difficult in predicting the behavior of Thai social systems. Further discussion is needed.
The Novel Method of Including “Agents” Into the System of “Actions” (Activities) by Osamu
KATAI ISAMU is Professor at Kyoto University. He was the student of Professor Iwai Sosuku who was
the teacher of the writer. Professor Iwai had published many theses in the area of group dynamics and also
educational approach (operational approach) to social system which could be utilized in Thai social systems.
Both teachers selected the stance of “balancing” or “symbiosis” to the analysis and synthesis of social system
via “information” (balancing itself is the natural mechanism).
In Katai Osamu papers, he introduced “Leibnizian space and time”, “occurrence net”, and “Peirce’s
existential graph” to his novel model.
At this moment, the writer has the sense that his model could be applied to psycho analysis and
communication areas in Thai society. The model itself includes “agents” and “actions” (or “activities”) at the
same time to the illustration of social system which seduces the writer to pursue in this area. At this, hopefully,
the possibility of finding the clues to “symbiosis” of the social system emerges.
Luhman (very influencial sociologist) also modeled social systems into “communication” and selected the
objects of analysis in special way. These should be pursued further together with Giddens’ writings.
Conclusions
In this writing, the writer has applied AGIL schema and Aoi Kazuo’s AGIL’s elaborated diagram to
analyse, synthesize, and identify the macro problems of north-east vocational education in Thailand from field
surveys and other secondary data. Basically, K.J. method has been employed intensively. The brief history of
the related institutions has other been introduced.
The detail of main findings, system of sentences of the macro problems, some derived diagrams examples
(After AGIL schema applying) and also implication from the main findings have been illustrated.
Lastly, from Appendix Figure A1 also, the writer should utilize Katai Osamu model method to include
“agents” also into system of “actions” (or “activites”) hopefully in the future with extensive study of Luhman
and Giddens sociology.
References
Aoi, K. (1974). Shakaigakku Koza 1, Rironshakaigakku. Todai Shuppa Kai: Publication Association of Tokyo University.
Jonathan H. T. (2003). The structure of sociological theory. Wadsworth: Thomson Learning Inc..
Osamu, K., Hiroshi, K., Takayuki, S., & Agira, N. (2010). Formalizing coexistential communication as co-creationof leibnizian
spatro-temporal fields. AI&Soc., 25, 145-153.
Osamu, K., Katsushi, M., Takayuki, S., & Hiroshi, K. (2007). System design of “Ba”—Like stages for improvisational acts via

TALCOTT PARSONS’ AGIL SCHEMA-BASED SYSTEM IDENTIFICATION 761
Leibnizian space-time and Peirce’s existential graph concepts. AI& Soc., 22, 101-112.
Tumtavitikul, S. (2011). The study of systems identification of public administration for the development of public vocational
colleges in north-east of Thailand. Institue of Human Resource, Thammasat University, Bangkok, Thailand.
Yoshifumi, T., & Tsuruyo, F. (2008). Thailand in motion: Political and administration changes 1991-2006 (Tai Seiji Gyosei No
Henkaku: 1991-2006). IDE Research Series, No. 568.
Appendix A
Figure A1. Some related methodological issues to this research (Inform 1.1.1 and Inform 1.1.3).
Inform 1.1.1
“Cities and regions
discrepancy”
(1.1.1)

Chinese Business Review, ISSN 1537-1506 November 2013, Vol. 12, No. 11, 762-774
“A Raft in the Stormy Sea”: New Roles, New “Dresses”
Operating in & for Business Networks
Patrizia Riva
University of Eastern Piedmont, Novara, Italy
Roberta Provasi
University of Milan-Bicocca, Milan, Italy
This paper aims to discuss the development and functioning conditions of business networks. After recalling the
main characteristics of post-fordistic environment and comparing it to a “stormy sea” (section one) of the paper
focuses on the idea of networks described as “rafts” useful to firms to build their own competitive advantages. In
fact, while theoretical knowledge is not so valuable because everybody can have it, practical and contextual
knowledge is specific and therefore it can be defended. The development of a contextual knowledge is feasible if
the firm chooses among all the possible alternatives. Subsequently in section two, it shows how fordistic principles
eliminate space, reduce time, and increase the speed of communication among individuals and as entering a
network has become a necessity as it allows a firm to obtain competitive advantages. The greatest benefit is the
chance to share the task of creating new knowledge among different members. In section three it is discussed if
navigation in the post-fordistic stormy sea could take advantage from the existence of a more certain regulation. It
is necessary to underline that positive law is not a post-fordistic tool. There is no satisfactory detailed law regarding
ideas, knowledge, and know-how, by now. Therefore, it is not possible to rely on a specific regulation framework to
protect knowledge found on the network. In conclusion in section four, the work discusses how single organizations
need to reach the “raft”—which is the network—through the idea of sharing learning and distinguishing elements
necessary to survive in the stormy sea post-Fordism environment. Lastly, section five would be analyzed a public
institution—Milan Chamber of Commerce—which has “changed its dress” to more effectively perform its support
role to firms.
Keywords: post-Fordism period, pre-Fordism period, business networks, shared knowledge, competitive advantage,
stormy sea, raft, Chamber of Commerce
Scientific Progress and “ Weather Changes”
The growing diffusion of information technology, personal computers, telematics and automatic machines
constitutes a technological progress, opening a transition period from Fordism to post-Fordism. While new
technologies dramatically reduce the information cost per unit, instantaneous transfers of a large amount of
complex information become possible from a place to another, even in case of relevant distances. This
Patrizia Riva, Ph.D., Aggregate Professor, Economics and Business Studies, University of Eastern Piedmont. Roberta Provasi, Ph.D., Aggregate Professor, Economics Science and Law, University of Milan-Bicocca. Correspondence concerning this article should be addressed to Patrizia Riva, University of Eastern Piedmont, Via Perrone, 18,
28100, Novara, Italy. E-mail: [email protected].
DAVID PUBLISHING
D

“A RAFT IN THE STORMY SEA”
763
phenomenon generates important consequences for organizations, because it changes the foundation of
Fordistic institutions: It can be compared only to the discovery of electrical power.
From the “Still Calm” of Fordism
The pre-fordistic manufacturing system was based on the presence of a steam power machine, hampering
and expensive, to which every other machine of the plant was linked. Therefore, each plant was conceived as a
unique large machine, formed by the power plant and a limited number of machines working synchronously. Its
functioning was based on theoretical principles, more or less directly derived from chance and technologic; it
was not easy to adapt it to different and changing resources and customer expectations. The basic knowledge
had a theoretical nature. On the contrary, everyday practice was not relevant, because machines were not able
to considerate it. Therefore, workers were completely alienated: Their personality was completely subjugated
by manufacturing machines and labor was merely considered as “manpower time”, a standardized factor
measurable in man-hours, independent from individual skills. The discovery of electrical power allows the
separation of single machines: The turbine motions are not directly transmitted to the machines, but it is
converted into electrical power that can immediately circulate through a wide network, at low costs. This means
that it is possible to operate an industrial plan virtually everywhere and not only in a specific place. The layout
of the single plant can be modified, too: Machines need not be all linked to a central power source. They
operate in a more autonomous way and once merely mechanical schemes can be adapted to specific contexts.
Technological progress thus allows adaptation to practical and specific needs: The ability in combining
different machines in new and original ways now becomes critical. Thus, the fordistic firm can partially recover
the practical knowledge and characterizing the old handicraft laboratory.
On the one hand, it standardizes micro operations (it splits basic operations), but on the other hand: it designs
macro processes by considering individual skills. Practical knowledge allows differentiation: The firm can build
its own competitive advantage. In fact, while theoretical knowledge is not so valuable because everybody can
have it, practical and contextual knowledge is specific, cannot be copied in a short time and in a cheap way, and
therefore it can be defended . The development of a contextual knowledge is feasible if the firm chooses among
all the possible alternatives: It must decompose complexity by selecting specific opportunities and not other once.
Choices are irreversible because so are investments made and product characteristics. The selected course of
action must be strictly followed according to the decision taken. This is particularly true also because the existence
of a specific know-how produces real benefits for the firm only if completely utilized. Therefore there is an
incentive to exploit relevant investments made, in other ways not recoverable, by pursuing economies of scale and
integration. A strong tendency to dimensional growth is evident at this stage. This is possible by utilizing a
hierarchical organizational structure based on centralization and coordination of the single parts of the firm
through planning. Planning and control systems ensure efficiency to the firm, so that it moves towards the
expected direction, but at the same time the firm cannot change its way according to new circumstances.
Fordism means confidence and certainty. Metaphorically speaking, it can be considered as a period in which large ships with no radar—big multidivisional companies—navigate along planned routes, on a calm sea and in favorable weather conditions. An environmental change is simply not conceived and it can hardly be effectively faced: navigation therefore means great and unavoidable risks.
To the “Stormy Sea” of Post-Fordism
The creation of art electronic power network allows to split physical operations, because the single spots

“A RAFT IN THE STORMY SEA”
764
where electricity is utilized become independent from each other. However, it is still not possible to share the
information needed to compose single operations as a system, through a network. For this reason, information
is managed in a centralized way. The transition towards a post-fordistic system starts when technology
advances allow the development of an information to split information, too. Information technology tools, such
as personal computers and Internet and Intranet communication systems, when utilized on a broad scale, allow
the codification of knowledge developed in a certain place and its use by many people located in different sites.
There are many implications of this phenomenon, because it allows to go beyond the fordistic model. New
information technology allows: (1) a virtual decomposition of complexity (of products, manufacturing
processes, working stages, and job tasks), obtained through the use of modular virtual objects representing
single components of a product/process; and (2) a new composition of single parts through virtual components,
in order to build tailored solutions using the same samples of virtual objects. Information, like electrical power
should circulate within the system: As the latter allows the creation of separate manufacturing centers, the
former today allows the creation of independent knowledge creation centers. Complexity is not a problem
anymore the firm is not obliged to choose one opportunity once and forever, asking the risk to make hardly
recoverable investments, aimed at following binding decisions with uncertain results. Frustration, derived from
the need for planning and control and from the observation that complexity cannot be reduced only to
controllable dimensions, decreases instead, the firm is pushed towards the continuous generation of new
complexity by creating very different new alternatives. This is possible because manufacturing is not the focus
of the entire process of creation any more, but it is only the final stage. On the contrary, the most important
stage is represented by the use of “pieces of information” circulating through the network, in order to try new
possible solutions. As nothing “physical” is really created and “pieces of knowledge” are available within the
network, investment in new tests is very cheap, virtually equal to zero, and it is possible to simulate different
solutions to meet the expectations of different stakeholders, of clients in particular. Firms must create value for
clients, by designing more and more tailored solutions, based on the analysis of their expectation.
Firms nowadays pursue economies of differentiation. They originate from the fact that tailored products
generate a larger amount of value to the user. What makes the new modus operandi possible and revolutionary
is the reversibility of products. Everything is possible until it remains in the “world of ideas” and is not
completely implemented. Therefore, the opportunity to generate new ideas and to create “new things” is
systematically pursued: It is not a threat anymore and it becomes a new life and new aim for the modern firm.
We can state that post-Fordism means uncertainty and pursue of the new, of the never tried, and of continuous
changes.
Metaphorically speaking, it can be viewed as a period of violent storms, in which fordistic favorable
weather conditions and still calm have disappeared. Large ships, still following pre-determined routes, have
already sunk or are facing enormous difficulties. In this context, survivors can continue their navigation only by
creating new and quicker ships.
Business Networks: “A Raft in the Stormy Sea”
The post-fordistic model dramatically chances fordistic principles: It eliminates space, reduces time, and
increases the speed of communication among individuals. The network is a virtual space where interaction
takes place and new knowledge is created. It is composed by a certain number of subjects, by reciprocal
relationships and by shared information. Its existence is not based on physical because it uses virtual

“A RAFT IN THE STORMY SEA”
765
communication and links subject physically very far from each other. A subject belongs to the network if it is
able to generate specific meanings, together with other members, and share with them the same language. The
boundaries of the network can be set in a more or less flexible way. When specific criteria to enter the network
are set, the network is “closed”.
Within this organizational model, job tasks are shared out according to knowledge criteria, and not
according to material ones. Each network junction specialized in a particular task spreads its specific
knowledge within the network, so that other members can use it. The information/communication potential of
the whole network continuously increases1.
Entering a network has become a necessity, because each firm cannot autonomously generate enough
information to ensure its survival in a continuously changing and very competitive environment, such as the
post-fordistic one. However, it is important to underline that, while entering a network allows a firm to obtain
competitive advantages, by exploiting “knowledge reserves” generated by other subject, this is enough for
survival. No certainties in post-Fordism: Everything is changing, the network included.
Metaphorically speaking, in post-fordistic stormy sea, navigation is possible only by a thin raft. Its survival among the waves is more probable than the one of ships. Riding waves on it is easier than simply swim in solitude among them.
You Need Wood to Build Your Raft
The length of the transition period between Fordism and post-Fordism depended on the speed of diffusion
of the telematic networks. Standing apart means to be condemned “to swim in solitude among the waves”,
increasing the level of risk. It seems much better to build some kind of boat-rafts—even if not so safe, because
they are less risky than just swimming. This becomes possible as:
“Wood” that is the information telematic network dimensions increases;
The potential users know that “wood” is needed to “build rafts”: The culture of telematic communication
and networks widely spread. Benefits of network way to operate have been clearly shown.
If You Wish Your Raft to Float
The greatest benefit that derives from the opportunity to build a network is the chance to share the task of
creating new knowledge among different members. It has also been underlined that in post-Fordism, subjects
are obliged, in order to survive, to enter the network, and to rely on others because they realize that nobody,
standing alone, owns enough skills to control complexity. The need to enter a network not automatically
ensures that it will correctly work as a system. Paradoxically what seems to be a strength of new technologies,
that is the possibility to reach many different subjects, could become a weakness. As already underlined, the
task of creating knowledge can be effectively shared if a new knowledge, developed in a particular part of the
network, is made available to the others, so that whoever needs it can find it in that specific net junction. From
a practical point of view, there are several obstacles to this diffusion. The diffusion can take place if:
(1) The system ensures participants the recognition of the value of knowledge brought in the network.
As a shared knowledge has no economic value, bringing new knowledge in the network means no recover
of the investments made for it. It is then necessary that the network system becomes able to recognize the real
economic value of created and shared knowledge. At this point, typical aims of the enterprise contrast with the
network logic: Firms specifically want to increase profits, differently from scientific laboratories. A firm needs
1 This statement is widely discussed in this paper, particularly in section five.

“A RAFT IN THE STORMY SEA”
766
to sell its knowledge and convert it into profits. It has a need to implement an appropriation of knowledge and
of its related, a need that does not exist in such an evident way in the scientific world. There is a specific
contradiction in the industrial economy: Facing the convenience to share information as a productive strength,
there is the convenience to limit this sharing, in order to use it exclusively. To go beyond this conflict the
strength of transferable knowledge should permeate the network, generating a far profit for its author (Rullani
& Di Bernardo, 1990).
(2) It is possible to trust on a minimum quality level of knowledge brought in the network and of the
modus operandi globally considered by network members.
The reliability of the counterparts is absolutely necessary to ensure a correct functioning of a network.
Admission of subjects not able to ensure qualitative standards comparable to other members’ causes a loss of
effectiveness and competitiveness of the network and all its components. Somebody says that these goals can
only be reached through a new transformation of a network into a hierarchy. The only way, according to these
authors is “to establish rules, enforce and support them through the menace of a compulsion” (Coleman, 1998).
This does not seem to be a necessary conclusion. There are other solutions, of different nature. However in
order to accept the existence and to understand them, you need to abandon the fordistic way of thinking and to
rely on new post-fordistic concepts. This is what we intend to do in the next part of our essay.
You Need Cooperation, but You Do not Have Time to Build Trustworth Relationship
Post-Fordism produces energy, creates opportunities never conceived before, but at the same time
generates a terrible anguish. While the risk of having invested in just one option is eliminated, other issues arise.
Firms must be able to continuously to create new ideas, because this is the only element differentiating them
from competitors. In this creative process, firms are not and must not be self-sustaining, because they do not
possess the potentially useful knowledge. Therefore, to achieve their objectives, firms must rely on others. The
dependence is risky: They are obligate to search in the network for skills necessary for their survival, as they
are not internally available. A selection of a certain number of partners, with which to establish on-going
long-period relationships, can be a way of reducing risk, as in a Japanese network model. In this particular
situation, subjects taking part in the network constitute a community sharing a set of ethical principles, to
ensure a regular and fair behavior. Japanese networks become a new way of creating “a social capital”, that is
the ability of people to work together for common goals, to associate, to share rules and values, and to
subordinate individual interests to group interests. It is formed by a not too large number of partners, which
share an environment, because they usually operate in very well-defined geographical areas.
In the post-fordistic era, firms do not benefit from this way of acting. Instead of improving the situation,
they will find themselves caged in “old fordistic schemes”: In exchange for the illusion of a stronger steadiness,
they will renounce to freedom, accepting the authority of others. A network based on this kind of informal
organization, which makes the firm feel that its loyalty belongs to a protecting work group, is very similar to
the one formed by large ships we talked about. Probably, for this group, navigation in the stormy sea, described
in the third model, will be very difficult. Within a post-fordistic network, based on the use of telematics, it is
not possible to develop long-term relationships among partners, unlike in Japanese networks, and therefore it is
not possible to create a trusty relationship either. What induces a firm to interact with another one is a
recognition of the intrinsic value of its knowledge and of its ability to create a new one. The aim of interaction
is in fact to search for knowledge to combine, to obtain a more satisfactory product design and, then, a better

“A RAFT IN THE STORMY SEA”
767
implementation. Time is extremely important. As specific abilities can be found on the network, they are
available to a large number of subjects. Therefore, probably more than one subject operating on the edge of
new knowledge is likely to achieve similar and comparable results. Thus, it is not wise to wait for an old
partner to develop new technologies, new shapes, and new ideas. If there are not, they must be searched for
somewhere else. The opportunity to rely on the telematic network and then to contact many potential
counterparts located somewhere else, makes it possible that somebody else, somewhere else, has developed
specific knowledge in that particular field. Not to take advantage of it would be completely irrational, because
it would mean to renounce to its own competitive advantage and therefore to renounce to survive “in the
post-fordistic stormy sea”.
It is interesting to underline that firms interact within the network, but that virtually they stand alone they
decide the knowledge to use, both when they design their products, and when they decide which knowledge to
use, both when they design their products and when they introduce them on the market. Therefore, in
post-Fordism every firm faces a very strong competitive pressure. The ability to generate complexity and to
find innovative solutions is the only effective defense weapon. In other words, it is possible to state that the
firm can only rely on the belief that other partners find it “interesting” and “able” and think that it is worthy
interacting with it. A decrease in the level of attention implies the exclusion from the game and the potential
failure. If on the one hand it is reasonable to abandon the subject we interacted with before, on the other hand it
is reasonable not to behave in an opportunistic way with the new partner. In fact, the impossibility to create
trustworthy relationships with few subjects does not preclude the opportunity to “temporarily” behave “in a
cooperative way”. The idea of the existence of cooperative behavior among subjects that know they have to
cooperate endlessly or indefinitely is contemplated in the game theory. According to it, only when partners
know when cooperation ends, they will be induced to behave opportunistically. As in this case partners
cooperate under not well definite conditions, they do not exactly know the future and ignore if the current one
is the last interaction, this is they may be induced to cooperate.
The Existence of a “Lighthouse Its Important, but not Enough (Limits of Fordistic Institution in a Post-Fordistic Scenery)
In this section it is discussed if navigation in the post-fordistic stormy sea could take advantage from the
existence of a more certain regulation of the reliability of knowledge in the network. To find the solution to this
question, it is above all necessary to underline that positive law is not a post-fordistic tool. Its origins are in the
pre-fordistic era, then a basic turn in history takes place: The authoritarian State model is abandoned, and
law-based State model is developed. Laws set non-modifiable boundaries, well-know in advance by every
entrepreneur. The effect of a new law introduction is not different from technological innovation. External
changes in the transformation ratios of inputs in outputs take place. Positive law, then is universal and certain:
“Every subject is equal before the law”. The last statement explains why this pre-fordistic tool maintains its
validity in the post-fordistic era. The need for control and the rules accepts and develops the already existent
tool. It is not easy to realize whether this tool can be used in the “revolutionary post-fordistic era”, when
certainties are thought to be “a not allowed luxury”, because they mean standstill, in a continuously changing
word. The existence of macro rules is undoubtedly very important in the current transition period towards
post-Fordism. It is a stimulus to enter the network for potential, but shy, subject, accustomed to fordistic
schemes. Once the network is created, though, the positive rule scheme should get less and less important

“A RAFT IN THE STORMY SEA”
768
representing the bases of a different situation. The foundations of networks functioning must in the fact be
generated within the network itself. It is not effective to wait for trustworthy relationships among network
partners to develop. However, it is necessary the partners generate their own modus operandi, a “common
language” which allows communication and action relying on the good functioning of the network and on the
profitability to belong to it. The development of different roles within the network is needed, too. In this way,
even with extreme flexibility and without the rigid mechanism of hierarchy, it will be possible to create an
effective auto-organization. In the following section a more detailed discussion of these issues will be carried
on. Now the focus will be on the potential role of positive law in the transition towards post-Fordism, trying to
understand if this role can be consistent with the current situation or if changes are needed. Therefore it is
interesting to underline that current laws are not satisfactory at all, because they actually do not give any
certainty or assurance to the operators. There is no satisfactory detailed law regarding ideas, knowledge,
abilities, and know-how, by now. Therefore it is not possible to rely on a specific regulation framework to
protect knowledge found on the network. A regulatory official intervention on this issue seems then necessary.
This intervention could be two-fold: New law concept could be created or a new interpretation of existing
concept could be set. Some kinds of knowledge are already regulated: patents, trademarks, and copyright even on
formulas and images. The problem could be solved by examining the possible application of the traditional idea of
copyright to new cases. It seems necessary to understand the scope of ownership of knowledge transferred in a
worldwide surrounding by a different physical support: the web page. It is interesting to underline that, in any case,
the juridical solution of the problem would not be relevant if faced only within national boundaries. A significant
result can be only obtained by an international harmonization process. While, as we have already said, new
technologies eliminate or at least remarkable reduce the economical relevance of “space”, the game rules,
necessary to ensure the protection of knowledge in the network, should be the same all around the world. The
juridical framework should be intended as the written expression of an ideal code of behavior, shared among all
the “net-consumers”, with no regard to their nationality. Facing the problem on a national level would be
meaningless, because the network is by definition stateless, transversal, and transnational.
This is why conditions for network functioning have to be mainly generated within it: External rules can
hardly be effective. Post-fordism is in fact the era of interaction: Several subjects (individuals, groups of
individuals, firms) communicate with each other and exchange knowledge in a new way (through telematic
networks), thus reciprocally growing and creating a world in which meanings and behavioral schemes are
shared. To make this possible and to subsequently obtain a real share of learning efforts, the subjects must be
able to rely on adequate creative abilities of their counterparts. The positive opinion cannot be based on past
experiences, because as already noticed, in a context characterized by reversible productions, knowledge
segments are supplied by different subjects almost every time. At the same time, this opinion cannot be based
on the general consideration that laws against incorrect behavior and break of contracts exist. It is necessary
that every network partner is able to ensure high quality performances. As a consequence, the problem then is
to define this last idea, which is “quality” and which means “formal definition of process characteristics and of
performances the manufacturer can ensure himself and the consumer”. Besides product features, the ability to
satisfy consumer expectation, which are process features, becomes interesting, too.
You Need to Speak the Same Language
Network has been defined as “the result of a new way of reducing complexity”. It is different from market

“A RAFT IN THE STORMY SEA”
769
and hierarchy, relies on a regulatory medium, that is the plan which concentrates information and decisions
(thanks to the firm’s appropriation power), the network utilizes a linguistic medium, consisting in specialized and
shared language for reciprocal communication among the units. It seems appropriate to try to individuate, in
general, the correct definition of “language” and the roles attributed to it, according to literature. Knowledge
circulating within the network is explicit, that is, codified. We can distinguish between formal codes and
languages. The former ones allow to translate a limited variety of inputs (situations) into a limited variety of
outputs (answers) and therefore they are a “closed elaboration system”. The latter ones, on the contrary, represent
an “open elaboration system”, formed by a set of basic meanings (words) and a combining grammar rules, which
allow to express complicated meanings (speeches). The use of formal codes in real situations allows to obtain
“information”: In fact, they represent preset “keys” to the interpretation of the real word. As a code is a simplified
representation of reality, this way of acting can be not profitable because a perfect correspondence between what
really happens and what the preset model can interpret is not ensured. At the same time, an important advantage is
obtained. “Through codification, concrete knowledge can be quietly transferred to many users, infinitely
reproduced and preserved with no difficulties”. If codification of informal knowledge through a code is not
effective because the resulting representation is too different from reality, it becomes necessary to use an open
language, instead of a closed code. “In other words, it is possible to codify knowledge in a more general way than
the specific one needed for a particular problem, by expressing it in the form of basic meanings and in a grammar
of allowed combinations”. Formal codes and languages represent “manufacturing resources” for the firm. They
are a form knowledge of more general level than solve specific and already known problems. Instead, codes and
languages can be used by whoever needs them and is allowed to by the subject that codified them. They can be
utilized in the decisional process, in many different cases and situations.
As codified knowledge is transferable, it can be included in the network. The creation of a virtual site
where all codified knowledge owned by partners can converge creates an intangible asset of unlimited potential.
Single segments of knowledge can in fact be combined in different ways by partners, according to their creative
abilities, thus originating new explicit knowledge. Composed by only a few words at the beginning, language
becomes richer, more flexible, and then useful to better interpret new situations coming next. In other words,
once it is generated, language can also be used to modify and to produce new codes, new basic meanings, and
new grammar rules. The realization of this opportunity is the most relevant existence condition of a network. Its
existence is in fact not based on trust, nor on the opportunity to create cooperative relationships, nor on the
existence of positive laws, not even on the certainty coming from relationships with “certified” counterparts. In
fact, the lack of this factor condemns the single user to follow his own way. A group of individuals, linked to
each other, not realizing that its only strength is represented by the share of individual abilities and that their
codification is expensive, does not constitute a network, but another organizational form.
Metaphorically speaking, it is compared the need for participants to share a language to the need that
different wooden components of the raft are firmly kept together by strong ropes. Without ropes, wooden
components would separate and the sailors would fall into the sea, would have to swim among the waves.
You Need to Share Tasks
The idea of sharing learning efforts can be interpreted in two different ways. Until now, it was used with a
general meaning: As the constitution of a network generates a common set of codified knowledge, at least as
big as the sum of knowledge owned by each partner, it becomes convenient for each one to manage the

“A RAFT IN THE STORMY SEA”
770
development of different knowledge segments.
Once the convenience is individuated, it is then possible to identify the potential typical roles of the firms.
In other words, an alternative value chain can be built, different from the traditional strategic management one,
not focused on material activities performed by the firm, but on learning efforts. It is possible to distinguish
some typical functions that cannot be replaced within the network, this does not mean, unlike some authors say,
“to transform network into hierarchy”, that is denying that network is an autonomous organizational model.
The lack of structure is not the element to distinguish networks from hierarchy. The main difference is the
medium utilized: authority in hierarchy and language in networks. Even a network can have a structure and
more different roles necessary for its functioning.
Literature identified four typical elements that must exist at one time in order for the network to effectively
work. In particular, we can distinguish two “primary” and two “secondary” roles. Primary roles are played by
firms directly involved in the creation of new knowledge. First of all, “global specialists” are identified: They
concentrate on the creation of new knowledge related to a single and specific segment. They design it so that it
can be used in different contexts. The second typical role is a complement of the first one: “System analysts”
study the different contexts in which knowledge can be used. They “deliver knowledge” to “final users”, by
combining available knowledge in order to satisfy clients’ expectations and by influencing “the producers of
specific knowledge”. They, in fact, drive the latter ones towards “high value added segments”, because these are
more relevant for “final users”. “Support” roles satisfy constitution and assurance expectations.
On one side it is distinguished the “meta-organizer” who constitutes the network, establishes basic
requirements to enter it and the causes to get out of it: it generically controls its functioning. The
meta-organizer manages the total investments in communication resources, shares the cost of basic innovation,
and contractually protects intangible assets from imitation and unauthorized uses, when this is necessary. On
the other side we find “connectors” who are interested in making connections among network partner easier.
This aim is achieved both in physical terms with logistics and in intangible terms ensuring the quality of new
network partners.
It is important to point out that the “meta-organizer” is not a manager of a hierarchal structure, but only a
coordinator-sponsor: He does not have direct authority on users, he does not decide single strategies or actions,
and he does not regulate interactions. Single units can autonomously choose their actions and how actively to
take part in the network. In fact, they are not subjected to the meta-organizer authority nor to any other network
partner authority (at least not just because they belong to the network). It is possible to think of the
meta-organizer as a sort of guardian of shared knowledge. Therefore, he is virtually “authorized” only to act in
protection of this asset value against any menace coming from inside or outside. In the same way, it is
interesting to underline that a connector with a warranty role is not a controller: His task is not to verify
network partners performance, but to help the meta-organizer to perform his tasks, by verifying that new
partners are respecting certain standards.
Metaphorically speaking, if the raft has to face waves, subjects must share tasks so that every operation
needed for navigation is performed.
Fordistic Organization Trying to “Change Their Dress”: Promos—Business Agency of Milan Chamber of Commerce Case Study
In this section the focus is on the efforts of a public institution—the Milan Chamber of Commerce—to

“A RAFT IN THE STORMY SEA”
771
effectively perform its support role to firms in the dynamic post-fordistic era. It would be discussion on the
nature of its contribution—certainly very innovative—trying to understand if its role is “related to a network”.
In order to strengthen its support to firms, especially small and medium-sized, in their way towards local
marketing and internationalization, in 1991, Milan Chamber of Commerce constituted a specific agency for
promotion and development of international activities, called Promos. Promos aims at promoting Milan firms
activities abroad, through advisory and assistance services, through a policy of relationships with national and
international institutions and organizations, and through information and communication instruments.
In the pursuit of its goals, Promos has set up a network of 12 foreign offices to establish a footprint on the
main international markets and to promote Milan and Lombardy. Its services aim at facilitating the promotion
of commercial, technological, and manufacturing agreements, among Milan and foreign firms. Therefore,
Promos organizes complex projects, by defining objectives, geographical areas, operational and implementation
procedures of the project.
According to these elements, the project is launched, that is its existence is communicated to Milan firms
through a multi-media instrument-fortnightly magazine “Mercatoglobale” (Global Market)—diffused through
the Internet and printed on paper, too.
Promos selects some of the firms interested in the projects, by detailed analyses which allow it to warrant
the quality of their performances, in front of potential foreign partners.
In order to spread the initiative, Promos predisposed some “desks” in some target countries. The desks
have the same role of Milan office in the launch of the project and in the selection of firms, on the basis of the
quality level of project and on the basis of the quality level of performance. When the project involves
countries where desks have not been established, Promos relies on institutional partners which perform these
tasks, on the basis of specific agreement. Usually, these partners are Italian embassies in target nations, local
chambers of commerce, local industrial associations, associations of Italian firms working abroad.
Once the network is organized, Promos does not abandon the partners, but organizes the first meetings and,
in some cases, goes along with the Italian part to the Italian part of the foreign country, following the
development of the single stages of the project. In order to better illustrate the activities performed by the
agency, it would be discussed one of its many projects towards the Mediterranean and Gulf area. It is designed
for furniture manufactures wanting to find a partner in Libya, Morocco, Syria, and Tunisia (Mediterranean and
Gulf). Promos objectives with this project are the following:
Promotion and economic cooperation for firms wanting to individuate partners in Mediterranean countries;
Creation of permanent networks for Lombardy firms already operating in those countries;
Maintenance and updating of contact networks already established in those countries;
Promotion of economic transaction and of cooperation for groups of furniture manufacturers.
The objective is generic enough to incorporate proposals coming from single firms and later developed
during interaction between counterparts, after the start of the project. It is in fact interesting to observe the
details of operational procedures:
Identification of firms and service providers potentially interested in the project. Direct meetings with each
firm, about: (1) structural firm data; (2) information or technology; and (3) statement of interests in potential
investment or commercial cooperation opportunities;
Direct survey in target countries, in order to identify projects an cooperation hypotheses through direct
meetings with potential partners;

“A RAFT IN THE STORMY SEA”
772
Check of projects and opportunities;
Technical and commercial inspections in Mediterranean countries with interested firms and direct
meetings with potential partners.
Promos is a network creator, a sponsor for partner abilities, and an interaction “facilitator”, because it
organizes technical and commercial meetings in foreign countries. However, specific projects are constituted
and proposed by potential partners.
This new Chamber of Commerce role is certainly different from the traditional one: The institution
appears to have “changed its dress (and its name)” in order to give a really useful service. In this way, at first
glance, it seems to have assumed two of the roles discussed in previous section four: the one of the
meta-organizer and the one of connector with sponsor features.
First of all, Promos can be considered as a meta-organizer, because it allows the birth of a new “object”: a
set of interrelation among subjects not linked before.
A general objective the partners must achieve is stated. In this way, the opportunity for a meeting is
created and the birth of an interaction is facilitated: A shared language—the basic element of the network—is
generated. Promos organizes personalized programs for business to business (B2B) meetings and visits to
selected local counterparts. Also, it can be considered as a connector with a sponsor role, because it ensures the
quality of activities performed by networks partners, by directly promoting analyses, through its local offices,
or relying on a “network of sponsors”. This function is not universal: Services are not destined to everybody
but only to selected Italian and foreign subjects. This is typical of every connector, being a public institution or
not. In order to identify the best available knowledge, in fact, the connector-sponsor, as previously defined it,
carries on a research work and then selects the best candidates to sponsor (that is, it “scans the available
documentation”).
Some characteristics distinguish Promos from an ordinary “network operator”. As promos is a subsidiary
of a public institution, Milan Chamber of Commerce:
It does not have the objective of creating and operating only one network. Its institutional mission is to
represent a sort of “network creation laboratory”. Only in the last year, Promos had promoted about 2,000
companies and several projects, similar to the one we just analyzed, in different industrial sectors as:
agroindustrial, automotive, transportation, energy, environment, automation, security, aerospace, and
geographical areas as in: Europe, Asia, North America, Latin America, Mediterrenean and Gulf, Sub-Saharan
Africa;
It is clear that this modus operandi does not allow to define Promos “a network operator”, that is a subject
operating in and for the network. Promos can be compared to a company’s promoter, whose role is to generate
the starting entrepreneurial idea and to begin a project other subject will later carry on;
It must pursue a specific task: the development of firms operating in Milan area. This characteristic can be
alternatively interpreted as a limit to its meta-organizational activity, or in a simply way, as a requirement for
firms wishing to participate to the network.
What it was discussed does not allow to consider Promos a perfect post-fordistic operator. The initiative
virtually constitutes a hybrid, certainly generated by a deep understanding of current changes. The hybrid is
aimed at mediating between the ancient need for “market organization” and the new need for a “network
creation and internationalization”.

“A RAFT IN THE STORMY SEA”
773
Conclusions
In the post-fordistic stormy sea, staying apart, frightened waiting for a white, safe, big ship to pass or
trying to resist to the waves continuous movement is not profitable at all. Firms must realize that it is better to
face danger and to “ride the waves”. Therefore, an easy-to-manage boat is needed: a “raft”. The raft must resist:
Its wooden components should be safely bound and the navigators have to share tasks in order to ensure the
performance of each navigation activity. Everyone should concentrate on the chosen role, so that the others can
consider his presence as a necessity. Everyone has to act, taking into account the useful advice others can give.
The dim light of the far lighthouse can help, but it can identify only a part of navigation dangers.
References AA.VV. (1995). Network: Network analysis in the social science (Reti: L’analisi di network nelle scienze sociali). Italy: Donzelli
Publisher. AA.VV. (1996). Network in marketing. Italy: Iacobucci Publisher. Bellandi, G. (1989). Quality strategic management in the relation between market-company (La gestione strategica della qualità
nei rapporti azienda-mercato). Milan: Giuffrè Publisher. Boyer, R. (1988). Looking for fordism alternatives: Years 80 (Alla ricerca di alternative al fordismo: gli anni ‘80). Stato e
Mercato, 24, 387-423. Ceccanti, G. (1992). The systematic value capacity (Il valore delle capacità). Sinergie, 29, 51-52. Coleman, J. S. (1998). Social capital in the creation of human capital. American Journal of Sociology, 94, 95-120. Cozzi, G. (1986). Information technology diffusion to market forms: First reflection aspects (Diffusione delle tecnologie
dell’informazione a forme di mercato: primi punti di riflessione). Economia e Politica Industriale, 50, 227. Di Bernardo, B. (1987). Value chain and strategic surplus: What’s new in terms of complexity industrial theory (Catena del valore
e surplus strategico: cosa c’è di nuovo sul fronte della teoria della complessità industriale). Economia e Politica Industriale, 54, 183-207.
Di Bernardo, B. (1989). Flexible capitalism network: Beyond the dichotomy hierarchy-market (La rete del capitalismo flessibile:oltre la dicotomia gerarchia-mercato). Economia e Politica Industriale, 64, 165-207.
Dubini, P., & Aldrich, H. (1989). Networks and processes of business development (Le reti e i processi di sviluppo delle imprese). Economia e Politica Industriale, 64, 363-375.
Fukuyama, F. (1995). Trust: Social virtues and the creation of prosperity. New York: Free Press. Giddens, A. (1994). The modernity consequences: Trust and risk, safety and danger (Le conseguenze della modernità: Fiducia e
rischio, sicurezza e pericolo). Bologna: Il Mulino. Giulivi, A. (1997). Computer networks and organization process in the virtual company (Le reti telematiche e organizzazione di
processo nell’impresa virtuale). Proceedings from the Conference of The Company Boundaries: Logic for the Management and Regulation. AIDEA Giovani.
Grandori, A. (1989). Efficiency and equity of inter-organizational networks: A perspective negotiating (Efficienza ed equità delle reti inter-organizzative: una prospettiva negoziale). Economia e Politica Industriale, 64, 349-350.
Grandori, A. (1989). Inter-organizational networks: Planning and negotiation (Reti inter-organizzative: progettazione e negoziazione). Economia e Management, 7, 29-31.
Kreps, D. M. (1990). Game theory and economic modeling. Oxford: Claredon Press. Lamprecht, J. L. (1996). The application of UNI EN ISO 9000 in small enterprises (L’applicazione delle norme UNI EN ISO 9000
nelle piccole aziende). Milano: Franco Angeli Publisher. Lorenzoni, G., Grandi, A., & Boari, C. (1989). The network organizations: Three basic concepts (Le organizzazioni a rete: tre
concetti di base). Economia e Politica Industriale, 64, 283-310. Nonaka, I. (1994). How an organization creates knowledge (Come un organizzazione crea conoscenza). Economia e Management,
3, 31-48. Nonaka, I., & Takeychi, H. (1995). The knowledge creating company. Oxfords: Oxford University Press. Pfefer, J., & Salancick, G. R. (1978). The external control of organizations: A resource dependence perspective. New York:
Harper & Row.
“A RAFT IN THE STORMY SEA”
774
Pindyck, R. S., & Rubinfeld, D. L. (1992). Microeconomy (Microeconomia). Italy: Zanichelli Publisher. Porter, M. E. (1996). Competitive advantage (Il vantaggio competitivo). Milan: Edizioni di Comunità. Powell, W. W., & Di Maggio, P. J. (1991). The iron cage revisited: Institutional isomorphism and collective rationality in
organizational fields. Chicago and London: The University of Chicago Press. Riva, P. (2001). Non-financial Information in (Italian) Annual Reports: Disclosure of Performance Measures: An Empirical
Survey (Informazioni non finanziarie nel sistema di bilancio: Comunicare le misure di performance: Analisi empirica) (pp. XIII-226). EGEA.
Riva, P. (2002). The importance of non-financial information in the financial statements (L’importanza delle informazioni non finanziarie nel sistema di bilancio). Maggioli Journal of IR, 4, 23-31.
Riva, P. (2009). The review of prospective data in accordance with ISAE 3400: International auditing principle application to the independent auditor attestation provided by the bankruptcy law (La revisione dei dati prospettici secondo l’ISAE 3400 L’applicazione del principio internazionale di auditing alle attestazioni del professionista previste dalla legge fallimentare). Maggioli Journal of IR, 2, 55-61.
Riva, P., & Quagli, A. (2005). Do financial websites meet the users’ information needs? A survey from the Italian context. Retrieved from http://hq.ssrn.com
Rullani, E. (1987). The enterprise as an artificial system: Learning and languages in the evolutionary approach of complexity (L’impresa come sistema artificiale: Linguaggi e apprendimento nell’approccio evolutivo della complessità). Economia e politica industriale No. 56.
Rullani, E. (1989). Network economy: The languages as production means (Economia delle reti: i linguaggi come mezzi di produzione). Economia e Politica Industriale, 64, 132.
Rullani, E. (1992). Economics of intangible resources (Economia delle risorse immateriali). Sinergie, 29, 18-19. Rullani, E., & Beccatini, G. (1993). Local system and the global market (Sistema locale e mercato globale). Economia e Politica
Industriale, 80, 25-47. Rullani, E., & Di Bernardo, B. (1984). Evolution: A new paradigm for the firm theory and technological change (Evoluzione: un
nuovo paradigma per la teoria dell’impresa e del cambiamento tecnologico). Economia e Politica Industrial, 42, 39-106. Rullani, E., & Di Bernardo, B. (1990). The management and the machines: Evolutionary theory of the enterprise (Il management
e le macchine: Teoria evolutiva dell’impresa). Bologna: Il Mulino. Rullani, E., Di Bernardo, B., & Vaccà, S. (1986). Technological change and enterprise economy (Cambiamento tecnologico ed
economia dell’impresa). Economia e Politica Industriale, 50, 79-124. Sanna Randaccio, F. (1987). Notes on the production internationalization of Italian firms (Note sull’internazionalizzazione
produttiva delle imprese italiane). Economia e Politica Industriale, 55, 219-233. Vicari, S. (1991). The living companies: Itinerary in a different conception (L’imprese vivente: Itinerario in una diversa
concezione). Milano: ETAS. Vicari, S. (1995). Towards resource based management (Verso il resource based management) (pp. 9-48). Milan: EGEA. Zucker, G. L. (1991). The role of institutionalization in cultural persistence. In W. Powell, & P. DiMaggio (Eds.), The new
institutionalism in organizational analysis (pp. 83-110). Chicago: University Chicago Press.
Chinese Business Review, ISSN 1537-1506 November 2013, Vol. 12, No. 11, 775-788
Competition in Marketing: Survival Yardstick for Small and
Medium Enterprises (SMEs) in Nigeria
Olanrewaju Samson Ibidunni
Covenant University, Ogun-state, Nigeria
Ogundeji J. K. Ogundele
Lagos State University, Lagos, Nigeria
The topic investigated competition in marketing as a survival yardstick for small and medium enterprises (SMEs) in
Nigeria. The objectives addressed by this study were: (1) identifying different types and intensity of competition
that SMEs are exposed to along the life-cycle portfolio in Nigeria; (2) quantifying the strength of SMEs vis-à-vis
some foreign enterprises in terms of market competition; and (3) proffering solutions on how best they could match
competitively these foreign enterprises. Relevant models and theories were employed in literature to evolve detailed
analysis of issues relating to the variables used in terms of competition in marketing and survival of juice-producing
SMEs. Two hypotheses were investigated through the survey of 20 prominent Ikeja based SMEs using Cluster
sampling, 5-points Likert summated rating scale was adopted, while Yard’s formula with 95% confidence level and
5% error tolerance was used. Alternative form validity of the instrument was measured at 0.63 while its reliability
was measured at Cronbach’s alpha of 0.70. Pearson’s product-moment correlation was used in testing hypothesis 1
while standard multiple regressions were used to test hypothesis 2. Findings revealed that there was strong
relationship between survival of juice-producing SMEs with forms of competition on a firm’s life-cycle; while
competition had positive effects on survival components for the enterprises. It was concluded that since competition
subsists in any firm’s life-cycle, strategies to support operations for survival must be adopted. It was recommended
that operators of SMEs have to monitor and manage competition as it affects their businesses positively and/or
negatively.
Keywords: competition, firms’ life-cycle, survival of enterprises, strategies to support operations, operators of small
and medium enterprises (SMEs), monitor and manage competition
Introduction/Background to the Study
Today’s business in any industry in Nigeria is multi-dimensional. According to Okaka (1990), Ogundele
and Opeifa (2004), Ogujiuba, Ohuche, and Adenuga (2004), Ogundele (2007), forms of small and medium
enterprises (SMEs) include retailing, wholesaling, servicing, agriculture, and extractive activities in mining
and lumbering. Competition remains a programme to participate in and manage effectively within Nigerian
Olanrewaju Samson Ibidunni, Ph.D., Department of Business Management, Covenant University. Ogundeji J. K. Ogundele, Ph.D., Department of Business Administration and Management Technology, Lagos State University. Correspondence concerning this article should be addressed to Olanrewaju Samson Ibidunni, Department of Business
Management, Covenant University, Canaanland, Ota, Ogun State, Nigeria. E-mail: [email protected]; [email protected].
DAVID PUBLISHING
D
COMPETITION IN MARKETING
776
business environment in order for SMEs to achieve stated and anticipated goals and objectives. With the
strength of multinational enterprises operating also, SMEs in Nigeria have not found it easy facing the fierce
competition, hence numerous of them die prematurely. Prior to Nigeria’s independence in 1960,
multinational enterprises, with the spread of their subsidiaries and other allies, have dominated almost all
facets of business in the country. The adoption and usage of improved technology, coupled with the financial
and managerial supports from the parent companies enable the multinational enterprises to operate almost
freely in the regions of Nigeria. On the contrary, many challenges of the SMEs emphasized in literature
hinder their competitive strength (Beck & Demirguc, 2003; Ayozie, 2006). Akingunola (1995), Heller (2002),
and Amatus (2007) proclaimed three ways by which SMEs face competition, the intra-competition, which is
competition among the domestic organizations producing similar products, the inter-competition, which is
competition between domestic firms and foreign multinational firms operating in the country, and
competition between domestic firms and quality imported brands of products. Consequent upon the
challenges enumerated above, the objectives being addressed by this study are: (1) to identify different types
and intensity of competition that SMEs are exposed to along the life-cycle portfolio in Nigeria; (2) to
quantify the strength of SMEs vis-à-vis some foreign enterprises in terms of market competition; and (3) to
proffer solutions on how best they could match competitively these foreign enterprises. Ten each of
juice-producing small and medium scale enterprises located at and around Ikeja Industrial Estate were
studied for their privileged location. The significance of this study stemmed from the fact that SMEs will be
empowered to stand and compete with other categories of organizations in the industries, hence emancipated
to bring about better and gainful employment. There will be improvement in the standard of living of
citizenry; and there will be growth and development of Nigeria’s gross domestic product (GDP). Also local
companies will be empowered technologically to exploit and extract natural deposits, hence engage capacity
building to the Nigerian people.
Literature Review and Hypotheses Development
Review of Definitional and Theoretical Issues
Calson (2000), Krauss (2004), and Kerin, Hartley, Berkowitz, and Rudelins (2006) discussed competition
as the fourth component of the environmental scan, that is, apart from social, economic, and technological
forces, in which alternative firms could provide a product to satisfy a specific market needs. The authors
enumerated four basic forms of competition at which one end of the continuum is pure competition. By pure
competition, every company in the industry has and sells similar products. In the second point on the
continuum is monopolistic competition where many sellers compete with their products on a substitutable basis.
Oligopoly was given as the third component on the continuum, and the practice is that few companies control
majority of the industry sales. The final point on the continuum was given as pure monopoly; in which only one
firm sells the product. But Hunt and Duhan (2002) wrote on a multi-market competition which refers to
competitive situations whereby same firms compete against each other in multiple markets. Both views above
were supported by Adesina (2004) in Lagos, Nigeria, reviewing competition as an important part of industry
development; and that developing country would be better off if fair competition is allowed to be introduced
into them. Ries and Trout (2004) also contributing, claimed competition in marketing to be getting brutal; that
the name of the game has become “taking business away from somebody else”. For any business organization
developing a marketing programme, four components that drive competition need to be considered. They are

COMPETITION IN MARKETING
777
entry, bargaining power of buyers and suppliers, existing rivalries, and substitution possibilities. Porter (2008)
in Figure 1 describes a concept that has become known as the “five forces model”. This concept involves a
relationship between competitors within an industry, potential competitors, suppliers, buyers, and alternative
solutions to the problem being addressed.
Figure 1. “Five forces model” of competition. Source: Porter (2008).
Literature reveals that while a small or medium scale business entrepreneur or a micro group in an
industry is struggling to push his or her product(s) within the potential 10 key areas of the model, the relational
strengths, in terms of market penetration, to a multinational enterprise is very low (Lester & Tran, 2008).
Organisation and management research uses the life-cycle concept to explain changes that take place in
organisations. Most of these changes are caused by company’s growth and management practices becoming
more complex. The most comprehensive reviews of works on the life-cycle theory were given by Quinn and
Cameron (1983), Smith, Mitchell, and Summer (1985), and Beverland (2001). It was noted that at each
developmental stage of SMEs, the rate of competition faced aggravates (Schroeder & Flynn, 2001; Mulford,
2004; Lester & Tran, 2008). Figure 2 denotes developmental stages of SMEs, according to Eggers, Leahy, and
Churchill (1994) and Shirokova (2009).
It is obvious from literature that all the authors recognized that there seems to be a life-cycle for firms
similar to the classic product life-cycle approach. While researchers seriously differed in their opinions on the
number of stages and characteristics to describe them, some authors offered generalized models which help to
describe and make comparative analysis of different approaches. For instance, Hanks, Watson, Jansen, and
Chandler (1993) offered a five-stage life-cycle model including foundation, expansion, maturity, diversification,
and decline; others may contain four stages as establishment, growth, maturity, and decline (Gupta & Chin, 1994)
or even three, that is start-up, rapid growth, and maturity. Research in this direction has been inconclusive in the
last few years. However, since the focus of this study is on survival of SMEs, three-stage life-cycle model was
adopted with the effects of competition along their life-cycle.
Potential entrants
Substitutes
Industry Competitors
Rivalry amongexisting firms
Threat of new entrants
Threat of substitute products or service
Buyers Suppliers
Bargaining power of suppliers
Bargaining power of buyers

COMPETITION IN MARKETING
778
Figure 2. Stages of small business growth characteristics. Source: Egger et al. (1994).
Effects of Competition on Firms’ Life-Cycle
Kolvereid (1992), Kolvereid and Bullvag (1996) asserted that the start-up stage of SMEs does not bother
much about competition or the intensity of competition in the industry, rather, the entrepreneur, more or less,
concentrates on satisfying consumers in the immediate environment, or adopts niche programmes to keep the
young business going. At the growth stage, the authors claimed that entrepreneurs of SMEs start to see
competition and its effects as impediments on their approaches, growths, and strategies. Mitra and Pingali
(1999) in their study wrote how entrepreneurs spend quality time, efforts, and money on gathering information
on competing brands, intensify efforts on distribution channels, vote some funds for products’ promotion, while
the level of the staff training and public relations is stepped up. Though Noel (2009) quoted experts that
majority of small businesses fold up after an average of 18 months due to failure to stand up to competition, it
is however found out that at maturity stage, operators of SMEs would have embraced a lot of facilities offered
by the governments; including facilities from the industry’s association. Hence, few of them tend to graduate to
status of “followers” in some industries. In this dimension, they imitate what market leaders or challengers
produce. At times, they adapt their brands in order to attract further patronage while still pushing the niche
business (Fullerton, Dodge, & Robbins, 1994). Fullerton, Dodge, and Robbins (1994) did not entirely agree on
stages of organizational life-cycle as described in the literature for most small businesses. They are of the
opinion that small businesses adapt and change in order to survive rather than grow. They identified
competition as the dominant factor that impedes growth in small businesses.
In Figure 3, there are five stages of business evolution and five characteristics that define each stage.

COMPETITION IN MARKETING
779
According to Egger et al. (1994), businesses with DNA that are suited to the environment and are competitive
are “rewarded” by the sheer pleasure of reaching the next stage of the evolution. Those small businesses, in
their evolutionary journey, that are not suited and not adaptable to the environment, and are not competitive in
an industry segment are “discarded”. The authors claimed that only the strong ones survive the competitive
nature of the environment.
Figure 3. The diagram above depicts the framework evolution stages and failure & exit modes. Source: Egger et al. (1994).
Supporting Theories of Competition
Hunt (1996) essentially challenged “managers” and “practitioners” to engage in the discussion of
competition based on what develops as “resource-advantage”. He canvassed that comparative advantages in
resources can lead to marketplace positions of competitive advantage, which then lead to a superior
performance. The fundamental premise of this theory is that the equilibrium-based analysis of much
mainstream economics actually eliminates both the heterogeneity and dynamism that marks real-world
industrial competition. Instead, resources of an organization should be viewed as heterogeneous and
imperfectly mobile, and intra-industry demand is substantially heterogeneous. Kovatcheva and Kozerawska
(2000) claimed that resource-advantage theory is an interdisciplinary, synthetic theory, and it is based on

COMPETITION IN MARKETING
780
several economic traditions. Contrasted with the neoclassical tradition’s view that firms are time-independent,
mathematical abstractions that combine homogeneous, and perfectly mobile resources, the resource-based view
posits that firms are entities that are (1) historically situated in space and time; (2) combine heterogeneous
imperfectly mobile resources. Also, it draws on marketing’s heterogeneous demand theory, which holds that,
because intra-industry demand is significantly heterogeneous, different market offerings are required for
different market segments in the same industry; and (3) it draws on industrial-organization economics and
differential advantage theory, which hold that marketplace positions of competitive advantage (or disadvantage)
determine superior (or inferior) financial performance. Fourth, it draws on evolutionary economics, which
views competition as a selection process, a struggle that produces innovation. Fifth, it draws on “Austrian”
economics, which stresses the importance of processes, entrepreneurship, and economic institutions. Because
information is dispersed and tacit in the process of competitive rivalry, competition results in
knowledge-discovery. Sixth, it draws on economic sociology and institutional economics, which hold that
societal institutions, such as laws, customs, taboos, traditions, and moral codes, produce order by structuring
political, economic, and social interaction. The kind of order so produced influences the process of competition
and, thereby, such outcomes as productivity and economic growth are feasible. The foundational premises of
resource-advantage theory are more descriptive of reality compared to preceding theories of competition. In
addition, the resource-advantage theory concentrates on the importance of market segments and comparative
advantage (disadvantage) in resources as well as on competitive advantage (disadvantage) in marketplace
positions. Market segments represent, according to this theory, intra-industry groups whose tastes are relatively
homogenous. Resources are defined as a firm’s tangible and intangible entities that enable it to produce
efficiently and effectively a market product, which has value to the certain market groups. Resources of firms
are significantly heterogeneous and relatively immobile and thus some firms will have a comparative advantage
and others comparative disadvantage. The firms are divided into nine types according to their market positions.
In Figure 4, cells 2, 3, and 6 are positions of competitive advantage. That advantage is achieved through a
relatively better combination of resource efficiency and produced value than that of competitors. The measure
of competitive advantage is the firm’s superior financial performance.
Figure 4. Relative resource-produced value. Source: Kovatcheva and Kozerawska (2000).
1
Indeterminate Position
4
Competitive Disadvantage
7
Competitive Disadvantage
2
Competitive Advantage
5
Parity Position
8
Competitive Disadvantage
3
Competitive Advantage
6
Competitive Advantage
9
Indeterminate Position
Lower
Parity
Higher
Lower Parity Superior
Relative Resource-Produced Value

COMPETITION IN MARKETING
781
The very competition in resource-advantage theory is defined as the disequilibrating on-going process that
consists of the constant struggle among firms for competitive advantages. The nature of competition is
influenced by five environmental factors: the societal resources, the societal institutions, actions of competitors
and suppliers, behaviours of consumers, and public policy. Companies learn in that process trying to improve
their financial performance, which is an indication of their market position, resulting from the competitive
advantage (disadvantage) they achieve.
Hunt and Morgan (1995), on the one hand, offered an interesting and provocative essay. They observed
three types of strand in recent research in marketing: The first gravitates toward competitive strategy, the
second advocates market orientation for superior firm performance, and the third explores shifting values in the
wake of emergent structural forms, such as alliances and networks. Hunt and Morgan (1995) asserted that the
“strategy debate” in marketing has been evolving toward a new theory of competition in place of the dominant
neoclassical theory of perfect competition (NTPC), which has retained its status despite many deficiencies. To
address the limitations of the dominant perspective, they proposed the comparative advantage theory of
competition (CATC). Using comparative advantage theory of competition, they explained the abundance, an
admirable quality, and innovativeness of goods and services in market-based economies. In addition, they
aimed to account for the presence of firm diversity in such economies. Accordingly, they attempted to
consolidate a theory in the exchange paradigm tradition with an eclectic approach. In particular, they drew
attention to the consensus on relating firm performance to the firm’s special competencies in deploying and
combining intangible assets. In contrast to the neoclassical theory of perfect competition, the comparative
advantage theory of competition accentuates intangible aspects, such as organizational climate, as more
specific to the firm and therefore treated them as more significant performance enhancers. The comparative
advantage theory of competition warns us that if change, uncertainty, disequilibria, and institutional
complexity are important parts of the picture, then some implications derived from the exchange paradigm
theories must be viewed carefully. The authors’ contribution was important in several respects. First, it
raises sensitivity to epistemic issues in marketing (Peter, 1995; Hodgson, 2000; Savitt, 2000). Second, it
provides an opportunity to rethink the bridge between marketing and economic theories. Third, by
challenging the dominant perspective, it opens the door for the development of fresh views on competitive
behaviour.
Hunt and Duhan (2002), on the other hand, propounded the theory of multimarket competition; suggesting
that the phenomenon of mutual forbearance may reduce the market-level intensity of competition between two
firms when the multimarket contact between them (the number of markets in which they compete) increases.
Mutual forbearance, a form of tacit collusion in which firms avoid competitive attacks against those rivals they
meet in multiple markets, is proposed to occur because multimarket competition increases the familiarity
between firms and their ability to deter each other. In this article, the authors examine how multimarket contact
increases familiarity and deterrence. Furthermore, they provide an extension of the theory of multimarket
competition by developing a conceptual model that identifies competitive and market factors that moderate the
relationship between the degree of multimarket contact and the intensity of competition. The authors also
examine the implications of multimarket competition for marketing strategy in the context of two marketing
strategy issues: product line rivalry and entry strategy. From the review of literatures above, the following two
hypotheses were formulated for testing and substantiating based on null hypothesis:

COMPETITION IN MARKETING
782
(1) Ho: Survival of juice-producing SMEs does not have a relationship with any form of competition on a
firm’s life-cycle.
(2) Ho: Competition does not have positive effects on survival components for juice-producing SMEs in
Nigeria.
Methodology
Both survey and observation methods were used with a well structured questionnaire to elicit information
from workers or staffs of SMEs producing juice-drinks. Cluster sampling was used to choose 20 prominent
Ikeja based SMEs by dividing the Lagos finite SMEs population into mutually exclusive clusters, that is, Ikeja,
Lagos Island, Lagos Mainland/Surulere, Badagry, Epe, and Ikorodu. Two research administrators holding
Ordinary National Diploma in Business Administration were engaged for two weeks to support the effort of the
researcher. They were trained on the assignment and fairly gainfully rewarded, 660 copies of the questionnaire
were administered on a 50:50 ratio basis to the two categories of the enterprise, 474 copies of the questionnaire,
representing 71.8% were returned, 276 copies, representing 83.6% were returned by staffs of small scale
enterprises while 269 copies, representing 97.5% were eventually used, seven (2.5%) copies were rejected due
to improper filling. On the other hand, 198 copies of the questionnaire representing 60% were returned by staffs
of medium scale enterprises, 192 (97%) copies could only be utilized, as six (3%) copies had to be rejected. In
all, 461 (69.85%) respondents had their views utilized for the study, 5-points Likert summated rating scale was
adopted. Also Yard’s formula with 95% confidence level and 5% error tolerance was used. Internal consistency
implied a high degree of generalization across the items within the measurement. Alternative form validity of
the instrument was measured at 0.63 while its reliability was measured at Cronbach’s alpha of 0.70. Pearson’s
product-moment correlation was used in testing the stated hypothesis 1 while standard multiple regressions
were used to test the stated hypothesis 2. Competition, as a dependent variable (Y), was operationalized to
contain pure, monopolistic, oligopoly, pure monopoly, and multimarket types of competition as components.
Survival, as an independent variable (X), was operationalized with sales revenue (Sr), profit (Pr), return on
investment (ROI), lower cost (Lc), and loyalty (Loy) as components.
Discussion of the Findings: Theoretical and Empirical
Of the 461 copies of the questionnaire used, 258 (56%) respondents were male staff, while 203 (44%)
were female staff of SMEs producing juice-drinks.
Four hundred and fifty-two (98%) respondents expressed the view that juice products of SMEs sold better
under pure competition situation than any form of competition, while 9 (2.0%) respondents were undecided.
Three hundred and five (66.2%) respondents strongly agreed, 125 (27.1%) agreed, and 28 (6.1%) were
undecided while only three (0.6%) disagreed with the view that SMEs would have done better in market places
if they could have substitute brands of juice products to market.
Four hundred and one (87.0%) respondents strongly agreed, 55 (11.9%) agreed, and 5 (1.1%) were
undecided on the views that majority of SMEs did not have what it takes to control the industry’s sales.
All, 461 (100%) respondents agreed that no small or medium enterprise has been able to dominate sales of
the industry’s products.
All, 461 (100%) respondents agreed that juice-drinks producing SMEs would have been able to sell and
dominate markets, local and foreign, but for their low productivity.

COMPETITION IN MARKETING
783
Two hundred and eighty-eight (62.5%) respondents strongly agreed, 116 (25.2%) agreed, 31 (6.7%) were
undecided, and 20 (4.3%) disagreed, while six (1.3%) strongly disagreed that same category of SMEs compete
against each other in multiple markets.
Three hundred and thirty-seven (73.1%) respondents strongly agreed, 117(25.4%) agreed, and two (0.4%)
were undecided while only five (1.1%) strongly disagreed with the view that products of SMEs compete with
some products from multinational enterprises on the start-up stage of firms’ life-cycle in Nigerian markets.
Twenty-six (4.1%) respondents strongly agreed, 19 (17.0%) agreed, 11 (2.7%) were undecided, and 233
(42.5%) disagreed while 172 (33.7%) strongly disagreed that intensive rate of competition does not affect the
productivity of SMEs at the growth stage of firms’ life-cycle.
Eight (1.7%) respondents strongly agreed, 13 (2.8%) agreed, four (0.9%) were undecided, and 192 (41.7%)
disagreed while 244 (52.9%) strongly disagreed that very insignificant number of juice-producing SMEs
outlive maturity stage of firms’ life-cycle.
Four hundred and forty-seven (98%) respondents strongly agreed expressly, while 14 (2.0%) agreed the
view that orientations and training in management and marketing practices will endow SMEs the skill to
effectively manage any form of competition in juice segments of Nigerian market.
Testing of Hypotheses
Hypothesis 1
Ho: Survival of juice-producing SMEs does not have a relationship with forms of competition on a firm’s
life-cycle.
In order to test for the relationship between survival of juice-producing SMEs and forms of competition on
firm’s life-cycle, Pearson’s product-moment correlation was used. Pure, monopolistic, oligopoly, pure
monopoly, and multimarket types of competition are components of competition, as a dependent variable (Y).
Also, Sr, Pr, ROI, Lc, and Loy are components of survival, as an independent variable (X).
From Table 1, for the 20 items represented in the questionnaire, the mean and the standard deviation for
competition were 2.2715 and 2.1968; while the mean and standard deviation for survival of SMEs were 0.4849
and 0.4719. These signified close relationship between competition and survival variables of the study.
Table 1
Descriptive Statistics
Mean Std. deviation N CIM SSMEs
2.2715 2.1968
0.48488 0.47189
461 461
Note. Source: field survey, 2010.
Tables 2 reveals a significant relationship between the dependent and independent variables, and it
corroborates the result of the descriptive statistics on Table 1; as the combined components of competition and
survival variables had correlation coefficient of (r = 0.931, n = 461, p = 0.01) each. Therefore, the correlative
relationship that existed between the dependent variable, that is competition, and the independent variable, that
is survival of SMEs indicated that the null hypothesis will not be accepted but the alternative hypothesis
accepted. The null hypothesis suggested no relationship between the dependent competition and independent
survival variables on firm’s life-cycle. It was found out that there was strong relationship between the two;

COMPETITION IN MARKETING
784
hence survival of juice-producing SMEs had relationship with forms of competition on a firm’s life-cycle.
Corroborating the findings, O’Farrell and Hichens (1988) argued that most small business models place little or
no emphasis on external factors that influence greatly the sustainability of the firm such as meeting competition
in the market place. Rather, most efforts in developing strategies against competition for the small business
focus on internal dynamics of the firm. The authors showed that changes within an organization follow a
predictable pattern characterized at development stages as follows: The sequence of events that describes how
things change over time; the hierarchical progression that is not easily reversed; and finally, the composite of a
broad range of organizational activities and structures. Firms in their empirical study had fewer management
and financial problems, but more marketing problems, as they progressed from stage to stage. Fullerton, Dodge,
and Robbins (1994) did not entirely agree on stages of organizational life-cycle as described in the literature for
most small businesses. They are of the opinion that small businesses adapt and change in order to survive rather
than grow. They identified competition as the dominant factor that impedes growth in small businesses.
Table 2
Correlations
CIM SSMEs CIM Pearson correlation
Sig. (2-tailed) N
SSMEs Pearson correlation Sig. (2-tailed) N
1 461 0.931 (**) 0.000 461
0.931 (**) 0.000 461 1 461
Notes. ** Correlation is significant at the 0.01 level (2-tailed). Source: field survey, 2010.
Testing of Hypothesis 2
Ho: Competition does not have positive effects on survival components for juice-producing SMEs in
Nigeria.
In testing this hypothesis, the multiple regressions were used to know whether competition has positive
effects on survival components for juice-producing SMEs in Nigeria.
Table 3 shows the mean and standard deviation statistics of the independent and dependent variables of
hypothesis 2.
Table 3
Descriptive Statistics
Mean Std. deviation N SSMEs Sr Pr ROI Lc Loy
2.1968 1.9747 2.4335 2.5696 2.2278 2.1519
0.47189 0.57956 0.74648 0.92934 0.66409 0.79403
461 461 461 461 461 461
Note. Source: field survey, 2010.
The correlation Table 4 reveals that there were statistically significant relationships between the dependent
variable and the independent variable. With a coefficient of 0.765, the strongest relationship was between sales
revenue and survival of SMEs, while the lowest correlation was that of loyalty and survival of SMEs with
coefficient of 0.419.

COMPETITION IN MARKETING
785
Table 4
Correlations
Variables SSMEs Sr Pr ROI Lc Loy
Pearson correlation SSMEs Sr Pr ROI Lc Loy Sig. {1-tailed} SSMEs Sr Pr ROI Lc Loy NSSMEs Sr Pr ROI Lc Loy
1.000 0.765 0.754 0.646 0.477 0.419 .
0.000 0.000 0.000 0.000 0.000
461 461 461 461 461 461
0.765 1.000 0.392 0.215 0.240 0.144 0.000 .
0.000 0.029 0.017 0.102
461 461 461 461 461 461
0.754 0.392 1.000 0.420 0.199 0.198 0.000 0.000 .
0.000 0.039 0.040
461 461 461 461 461 461
0.646 0.215 0.420 1.000 0.374 0.342 0.000 0.029 0.000 .
0.000 0.001
461 461 461 461 461 461
0.477 0.240 0.199 0.374 1.000 0.171 0.000 0.017 0.039 0.000 .
0.066 461 461 461 461 461 461
0.419 0.144 0.198 0.342 0.171 1.000 0.000 0.102 0.040 0.001 0.066 .
461 461 461 461 461 461
Note. Source: field survey, 2010.
Table 5 shows a model summary of how much of variance in the dependent variable (competition) was
expressed by the independent variables (survival of SMEs). The adjusted R Square value, when transformed
indicated a 98.2% level of variance in survival of juice-producing SMEs, while the standard error was less than
1%. The interpretation of this model is that competition has positive effects on survival components for
juice-producing SMEs in Nigeria.
Table 5
Model Summary
Model R R Square Adjusted R Square Std. error of the estimate
1 0.991 (a) 0.982 0.980 0.06610
Notes. (a) Predictors: (constant), Sr, Pr, ROI, Lc, Loy. Source: field survey, 2010.
Table 6 shows a significance of 0.000 which implied a high or perfect significance. Hence, the alternative
hypothesis shall be accepted and the null hypothesis will be rejected.
Table 6
Anova
Model Sum of squares df Mean square F Sig. 1 Regression Residual Total
17.050 1.82
18.870
5 455 460
3.410 0.004 780.402 0.000 (a)
Notes. (a) Predictors: (constant), Sr, Pr, ROI, Lc, Loy. Source: field survey, 2010.
Table 7 shows which of the variables included in the model contributed to the determination of the
dependent variable. In this case, beta values in the coefficient table were used for evaluation since the study
was interested in comparing the role of each independent variable. It should be noted that the B values in the
table are the coefficients of the independent variables. As a result, the equation of the model will be as follow:

COMPETITION IN MARKETING
786
y = 0.15 + 0.405(Sr) + 0.244(Pr) + 0.136(ROI) + 0.110(Lc) + 0.091(Loy) where each letter stands as specified
earlier. It should however be noted that 0.015 represented a constant as calculated statistically. The highest beta
coefficient is 0.497 which represented sales revenue. This meant that sales revenue was a very strong
contributor to survival of SMEs, 0.153 which represents loyalty has the least contribution to competition, a
dependent variable. This however, does not mean that there was no significant and direct relationship as it does
not reflect a negative figure with the “-” sign. All the independent variables used in the research work were
found to be significant even as the Sig. column shows 0.000 all through. Sales revenue emerged as having the
strongest contribution to competition, followed by profit with the beta coefficient of 0.386 and then ROI with
the Beta coefficient of 0.267, less cost component with Beta coefficient of 0.115, and loyalty component with
Beta coefficient of 0.153.
Table 7
Coefficients
Model Unstandardized coefficients Standardized coefficients t Sig.
B Std. error Beta B Std. error 1 (constant) Sr Pr ROI Lcp Loy
0.015 0.405 0.244 0.136 0.110 0.091
0.038 0.014 0.012 0.010 0.012 0.010
0.497 0.386 0.267 0.155 0.153
0.396 28.303 20.750 13.928 8.919 9.004
0.693 0.000 0.000 0.000 0.000 0.000
Note. Source: field survey, 2010.
Also looking at the Sig. coefficient column, all the independent variables had significant level with a
coefficient of 0.000 indicating that all the variables were equally important with respect to competition. Thus,
since all the independent variables have a statistical significance (effects) with respect to competition, we
rejected the null hypothesis which says that competition does not have positive effects on survival components
for juice-producing SMEs in Nigeria, and accepted the alternative view that competition has positive effects on
survival components for SMEs in Nigeria. The regression analysis however gave an equation for the model in
order to predict the gravity of competition which was outside the scope of this study. Andretsch, Clarysse, and
Duchene (2000) expressed, at a Conference of Ministers responsible for SMEs, the ability of SMEs to create,
access, and commercialize new knowledge on global markets to be fundamental to their sustained
competitiveness. The survival moves identified some principle strategies SMEs have pursued on their own,
which included: the innovation strategy, in which SMEs try to appropriate returns from their knowledge base
(which may or may not involve own investments in research and development). The information technology
strategy makes innovative uses of information technology, in order to reduce enterprises’ costs and increase
productivity. The niche strategy is chosen by the enterprises to become sophisticated global players in a arrow
product line. The network strategy, in which SMEs work co-operates with other firms, be they SMEs or large
enterprises, in order to improve their ability to access and absorb innovations. The cluster strategy, in which
SMEs locate in close proximity with competitors in order to take advantage of knowledge spill-over’s, especially
in the early stages of the industrial life-cycle. However, Andretsch, Clarysse, and Duchene (2000) emphasized
that both scale economies and research and development have become more important instruments for
competitiveness in the global economy. Since SMEs seem to be at a disadvantage for both these factors, many
experts predicted their demise in terms of competitiveness as globalization increases. While many SMEs have

COMPETITION IN MARKETING
787
indeed succumbed to a deterioration of competitiveness, others have found ways to actually enhance their
positions in global markets. The actual record of the competitiveness of SMEs in the Organization of Economic
Co-operation and Development (OECD) countries has been heterogeneous and complex due to their sheer
numbers, which span a broad range of economic activities in a disparate set of industries across different
countries.
Concluding Remarks and Implications of the Study
From this research, we can conclude that:
(1) From the findings, it was evident that competition subsists in any industry; not only in Nigeria, also
globally and it bites hard in terms of loss of revenue, profits, and ROI on any business organization that does
not have the strategies to support its operations;
(2) Every business organization goes through life-cycle. SMEs in Nigeria have to monitor and manage the
rate at which competition affects their businesses positively and/or negatively;
(3) Operators of SMEs in Nigeria need to be trained to understand different forms of competition available
so as to be able to determine the required strategies adoptable for survival of particular business enterprise;
(4) So far, majority of SMEs in Nigeria have businesses operating within pure and multimarket forms of
competition. Nigerian governments should assist the operators, through their agents, to technologically tap
agricultural and mineral resources which would give Nigerian entrepreneurs opportunity and privilege to
produce goods that can operate on monopolistic, oligopoly, and pure monopoly forms of competition. By this,
the dominant structure of the multinational enterprises in Nigerian industries will subside or reduce;
(5) Since competition is pre-requisite to survival of SMEs, Nigerian entrepreneurs should hold it as a
“factor” among other factors of consideration during planning and operational stages of business;
(6) Consequently, there will be reduction in high mortality rate of SMEs in Nigeria, instead SMEs will
grow and outlive the founding entrepreneurs.
References Adesina, K. (2004). Competition is key in the market. Marketing Edge, 1(2), 24. Akingunola, R. O. (1995). Financial of small and medium scale enterprises through equity sources. In A. T. Ojo (Ed.),
Management of small and medium scale enterprises in Nigeria (pp. 87-94). Pumark Nigeria, Lagos. Amatus, A. (2007). This man invented a formula for wealth creation. Daily Sun (p. 16). Audretsch, D., Clarysse, B., & Duchêne, V. (2000). Enhancing competitiveness of small and medium enterprises through
innovation. Proceedings from the Conference of Ministers Responsible for Small and Medium Enterprises. Industry Ministers, Bologna, Italy.
Ayozie, O. D. (2006). The role of small scale industry in national development in Nigeria. Retrieved from http://www.scribd.com/doc/23665278/
Beck, T., & Demirguc, K. (2003). Small and medium enterprises, growth and poverty. World Bank Public Policy For Private Sector, Note No. 268.
Beverland, M. (2001). Organizational life cycles in small New Zealand wineries. Journal of Small Business Management, 12(3), 5.
Calson, D. (2000). The old economy in the new economy. Business Week (p. 42H). Eggers, J. H., Leahy, K. T., & Churchill, N. C. (1994). Stages of small business growth revisited: Insights into growth path and
leadership/management skills in low- and high-growth companies. Journal of Humanities, Psychology and Social Science, 5(4), 110-119.
Fullerton, S., Dodge, H., & Robbins, J. (1994). Stage of the organizational life-cycle and competition as mediators of problem perception for small businesses. Strategic Management Journal, 15, 121-134.

COMPETITION IN MARKETING
788
Gupta, Y. P., & Chin, D. W. (1994). Organizational life-cycle: A review and proposed directions. The Mid-Atlantic Journal of Business, 4(3), 71-83.
Hanks, S., Watson, C., Jansen, E., & Chandler, G. (1993). Tightening the life-cycle construct: A taxonomic study of growth stage configurations in high-technology organizations. Entrepreneurship Theory and Practice, 18(2), 5-19.
Heller, R. (2002). Assessing your entrepreneurship profile: Do you have what it takes? Business The Ultimate Resource TM, Bloomsbury Reference Book (pp. 818-819), London.
Hodgson, G. M. (2000). The marketing of wisdom: Resource-advantage theory. Journal of Macromarketing, 20(1), 16-27. Hunt, S. D. (1996). The resource-advantage theory of competition: Dynamics, path dependencies, and evolutionary dimensions.
Retrieved from http://www.jstor.org/stable/1251905 Hunt, S. D., & Duhan, D. F. (2002). Competition in the third millenium: Efficiency or effectiveness? Journal of Business Research
55(2), 97-102. Hunt, S. D., & Morgan, R. M. (1995). The comparative advantage theory of competition. Journal of Marketing, 14(3), 1-12. Kerin, R. A., Hartley, S. W., Berkowitz, E. N., & Rudelins, W. (2006). Marketing (8th ed.). New York: McGraw-Hill. Kolvereid, L. (1992). Growth aspirations among Norwegian entrepreneurs. Journal of Business Venturing, 7(3), 209-222. Kolvereid, L., & Bullvag, E. (1996). Growth intentions and actual growth: The impact of entrepreneurial choice. Journal of
Enterprising Culture, 4(1), 1-17. Kovatcheva, E., & Kozerawska, A. (2000). Marketing of wisdom: Resource-advantage theory. Retrieved from
http://www.pafis.shh.fi/~elikov02/Case_1/RAtheory.html Krauss, M. (2004). Young net entrepreneurs leverage web anew. Marketing News (p. 4). Lester, D. L., & Tran, T. T. (2008). Organizational life-cycle and performance among small and medium enterprises: Generic
strategies for high and low performers. International Journal of Commerce and Management, 1, 4-7. Mitra, R., & Pingali, V. (1999). Analysis of growth stages in small firms: A case study of automobile ancillaries in India. Journal of
Small Business Management, 37(3), 43-61. Mulford, B. (2004). Let all the competition eat their hearts out. Retrieved from
http://www.sbynews.blogspot.com/2009/11/brooke-mulford-update_13.html Noel, J. (2009). Small and medium enterprises’ life-cycle: Steps to failure or success?. Retrieved from
www.moyak.com/papers/small-medium-enterprises.pdf O’Farrell, P. N., & Hitchen, D. M. (1988). Alternative theories of small firms’ growth: A critical review. Environmental and
Planning, 20(2), 1365-1383. Ogujiuba, K. K., Ohuche, F. K., & Adenuga, A. O. (2004). Credit availability to small and medium scale enterprises in Nigeria:
Importance of new capital base for banks. Background and Issues Bullion: Central Bank of Nigeria, 28(4), 57-68. Ogundele, O. J. K. (2007). Introduction to entrepreneurship development, corporate governance and small business management.
Lagos: Molofin Nominees. Ogundele, O. J. K., & Opeifa, A. Z. (2004). The influence of external political environment on the processes of entrepreneurship.
The Nigerian Academic Forum: A Multidisciplinary Journal, 7(5), 7. Okaka, P. O. (1990). Entrepreneurship development programme in Kenya. Directorate of Technical Training and Applied
Technology (pp. 8-10). Peters, T. (1995). New products, new markets, new competition, new thinking. The Economist, 4, 27-32. Porter, M. E. (2008). The five competitive forces that shape strategy. Harvard Business Review, 16, 86-87. Quinn, R., & Cameron, K. (1983). Organizational life cycles and shifting criteria of effectiveness: Some preliminary evidence.
Management Science, 29(1), 33-51. Ries, A., & Trout, J. (2004). Marketing warfare. Retrieved from
http://blogcritics.org/books/article/al-ries-jack-trout-marketing-warfare/#ixzz2MSh5FsCn Savitt, R. (2000). A philosophical essay about a general theory of competition: Resources, competencies, productivity, economic
growth. Journal of Macromarketing, 20(1), 73-76. Schroeder, R. G., & Flynn, B. B. (2001). High performance manufacturing: Global perspectives. Retrieved from
http://books.google.com.ng/books?id=XWrt4dN7U5IC&pg=PA278&l Shirokova, G. (2009). Organizational life-cycle: The characteristics of developmental stages in Russian companies. Journal for
East European Management Studies, 14(1). 65-85. Smith, K., Mitchell, T., & Summer, C. (1985). Top level management priorities in different stages of the organizational life cycle.
Academy of Management Journal, 28(4), 799-820.