
China-USA Business Review (ISSN 1537-1514) Vol.14, No.4, 2015
Upload
independentCategory
view
1download
0

Chinese Business Review
Volume 12, Number 1, January 2013 (Serial Number 115)
David
David Publishing Company
www.davidpublishing.com
PublishingDavid

Publication Information: Chinese Business Review is published monthly in hard copy (ISSN 1537-1506) and online by David Publishing Company located at 9460 Telstar Ave Suite 5, EL Monte, CA 91731, USA.
Aims and Scope: Chinese Business Review, a monthly professional academic journal, covers all sorts of researches on Economic Research, Management Theory and Practice, Experts Forum, Macro or Micro Analysis, Economical Studies of Theory and Practice, Finance and Finance Management, Strategic Management, and Human Resource Management, and other latest findings and achievements from experts and scholars all over the world. Editorial Board Members: Moses N. Kiggundu (Canada) Yener COŞKUN (Turkey) Helena Maria Baptista Alves (Portugal) Marcello Signorelli (Italy) Doaa Mohamed Salman (Egypt) Amitabh Deo Kodwani (Poland) Lorena Blasco-Arcas (Spain) Yutaka Kurihara (Japan) Ahmad Zafarullah Abdul Jalil (Malaysia) Salvatore Romanazzi (Italy) Saeb Farhan Al Ganideh (Jordan) Tulus Tahi Hamonangan TAMBUNAN (Indonesia)
GEORGE ASPRIDIS (Greece) Agnieszka Izabela Baruk (Poland) Goran Kutnjak (Croatia) Elenica Pjero (Albania) Cafer TOPALOĞLU (Turkey) Indah Susilowati (Indonesia) LI Kui-Wai (Hong Kong) Mohamed Nabil MZOUGHI (Tunisia) Mary RÉDEI (Hungary) Shelly SHEN (China)
Manuscripts and correspondence are invited for publication. You can submit your papers via Web Submission, or E-mail to [email protected], [email protected]. Submission guidelines and Web Submission system are available at http://www.davidpublishing.org, http://www.davidpublishing.com. Editorial Office: 9460 Telstar Ave Suite 5, EL Monte, CA 91731, USA Tel: +1-323-984-7526, 323-410-1082 Fax: +1-323-984-7374, 323-908-0457 E-mail: [email protected]
Copyright©2013 by David Publishing Company and individual contributors. All rights reserved. David Publishing Company holds the exclusive copyright of all the contents of this journal. In accordance with the international convention, no part of this journal may be reproduced or transmitted by any media or publishing organs (including various websites) without the written permission of the copyright holder. Otherwise, any conduct would be considered as the violation of the copyright. The contents of this journal are available for any citation, however, all the citations should be clearly indicated with the title of this journal, serial number and the name of the author.
Abstracted / Indexed in: Database of EBSCO, Massachusetts, USA Ulrich’s Periodicals Directory ProQuest/CSA Social Science Collection, Public Affairs Information Service (PAIS), USA Norwegian Social Science Data Services (NSD), Database for Statistics on Higher Education (DBH), Norway Index Copernicus, Poland Summon Serials Solutions
Chinese Database of CEPS, Airiti Inc. & OCLC Chinese Scientific Journals Database, VIP Corporation, Chongqing, P. R. China
Subscription Information: Print $520 Online $360 Print and Online $680 David Publishing Company 9460 Telstar Ave Suite 5, EL Monte, CA 91731, USA Tel: +1-323-984-7526, 323-410-1082 Fax: +1-323-984-7374, 323-908-0457 E-mail: [email protected]
David Publishing Company
www.davidpublishing.com
DAVID PUBLISHING
D

Chinese Business Review
Volume 12, Number 1, January 2013 (Serial Number 115)
Contents Economics
Typology and Dynamics of Financial-Industrial Groups Operating in the Czech Republic and Slovakia 1
Danes BRZICA
Migration in the Middle Asia and Its Effects on the Labor Market 14 Füsun ÇELEBİ, Atakan DURMAZ
Acceleration Factors in the Improvement of Public Welfare Sangiran 24 Mugi Raharjo, I Gusti Putu Diva Awatara, Harmadi, Wahyu Agung Setyo New Keynesian Model and Inflation Prediction 34 Yutaka Kurihara
Chinese Patent—A Tentative Explanation of Various Strategies of Patenting 41 Dou Henri, Dou Jean-Marie Jr
Management
Entrepreneurship and Growth in Emerging Mini-dragon Economies: A South-East Asia Perspective 48
Alex Maritz, Viet Le, Simon Masli, Anton de Waal, Bert Verhoeven, Shieh, Chich Jen
Analysis of Managing Creativity for Entrepreneurs 62 Ati Cahayani
Application of Recent Technologies in the Concept of Modern Business 70 Danica Tadic


Chinese Business Review, ISSN 1537-1506 January 2013, Vol. 12, No. 1, 1-13
Typology and Dynamics of Financial-Industrial Groups
Operating in the Czech Republic and Slovakia*
Danes BRZICA
Slovak Academy of Sciences, Bratislava, Slovak Republic
The contribution of this paper is threefold. Firstly, it develops a typology of corporate group development in terms
of the pattern of corporate group formation in the Czech Republic and Slovakia. It identifies briefly three important
types of corporate groups—industrial groups (type I groups), pyramid-like (type II) groups, and financial (type III
or FIGs) groups. Using original typology for corporate groups, the paper examines development trajectory of some
of the biggest FIGs and shows what effects their existence have in the two economies. Finally, some lessons
resulting from this corporate group-related type of ownership concentration for other pre-transitive countries are
mentioned.
Keywords: financial-industrial groups, The Czech Republic, Slovakia, restructuring, corporate governance
Introduction
Transformation towards market economy has been completed across Central and Eastern European
countries (CEECs). Since its start in early 1990s, this process has represented numerous reform processes, radical
shifts in institutional settings and many other aspects affecting business actors as well as citizens. Despite the
specter of changes, the most visible aspect of reforms was privatization process. It is not our aim here to review
all main features of the process but rather to look at how specific institutional setting, regulation, and policy steps
affected the emergence and development of financial-industrial groups (type III groups or FIGs) in the Czech
Republic (CR) and Slovak Republic (SR). To demonstrate magnitude of FIGs power, one good example is PPF
group from the Czech Republic majority-owned by Kellner. Mr. Kellner’s position was among the top 100 richest
men of the world as of 2010. Other groups, although smaller, are also important players on the domestic and
(Central) European markets.
The contribution of our paper is threefold. Firstly, it develops a typology of corporate group development in
terms of the pattern of corporate group formation in the Czech Republic and Slovakia. Briefly, it identifies three
important types of corporate groups in these countries: these being industrial groups, pyramid-like groups, and
financial groups. Our research tries to show how group-related process of ownership concentration has developed
* Acknowledgment: This paper was published with the support of grant VEGA number 2/0080/12. The author would like to thank for the comments on an earlier versions of this article to participants at conferences in Stockholm, Sydney and Seoul. The author also wants to thank for useful comments to M. Rafferty from The University of Sydney Business School.
Danes BRZICA, Ing., Ph.D., Institute of Economic Research, Slovak Academy of Sciences. Correspondence concerning this article should be addressed to Danes BRZICA, Institute of Economic Research, Slovak
Academy of Sciences, Sancova 56, 811 05 Bratislava, Slovak Republic. E-mail: [email protected].
DAVID PUBLISHING
D

TYPOLOGY AND DYNAMICS OF FINANCIAL-INDUSTRIAL GROUPS 2
since the beginning of transition. In the early transition process, industrial groups emerged as significant ways of
overcoming the weaknesses in financial markets and property rights confronting industrial firms, themselves
facing significant restructuring pressures. Later groups (pyramid-like) emerged out of the process of collecting
funds from the public, especially in Slovakia, on the promise of very high returns from stock trading and
investment. However, these groups were quite unstable and unprofitable forms of investment and losses to small
lenders/investors were common. Indeed, as with pyramid type schemes elsewhere, many pyramid-like groups
were characterized by flagrant theft and corruption, and their activities quickly came to be considered to be risky
or illegal. Not surprisingly then, their history was to paraphrase Hobbes, nasty brutish and short. This paper aims
also to analyze emergence and developmental trajectories of FIGs in the two countries, and finally to formulate
some general policy lessons from transformation process related to FISGs. The structure of the paper corresponds
to the above three areas.
Theoretical Issues Related to Groups and Basic Typology
The theory of firm has a well-established literature covering several aspects of firm structure and
performance. Some of the traditional works on firm structure and performance include Demsetz (1983), March
and Simon (1958), and many others. However, some new areas of research have been introduced recently to the
traditional areas. Among these are, e.g., issues of ownership concentration and corporate governance. Tirole
(1991) represents one important work that explores the newer areas in the context of developments in CEECs.
The standard textbook account of the firm tells us that increased size often brings greater efficiency, but that as a
firm grows beyond a certain size it may in fact become absolutely less efficient. This size/performance paradigm
has been a centerpiece of research on the firm for decades. One reason provided by the literature on optimal
size/performance is that as a corporate group grows it eventually becomes more difficult to organize and manage.
Thus, some diseconomies may begin to arise because of the firm exceeding optimal size. Problems with the firm
size often relate to difficulties in coordination and control of group activities.
Most existing research on the development of the corporate sector in the Czech Republic and Slovakia has to
date focused on the mechanisms and effects of voucher privatization. Some have taken this analysis further and
attempted to estimate also the impact of investment funds on the process. Notable here is the work of Ellerman
(1998), Mertlik (1997), and more broadly Simoneti, Estrin, and Boehm (1999), and Olsson (1999). In general,
these studies tell a rather gloomy story about the impact of these methods of privatization and financial structure
on market and corporate development. The privatization process helped to introduce companies and markets in a
formal sense, but as such could not provide mechanisms to ensure that they operated in ways that anywhere near
approached those of developed market economies. Privatization by vouchers generated an initially dispersed
ownership structure, but was rapidly overwhelmed by developments that have led to highly concentrated
ownership forms (e.g., Olsson and Brzica, 2001). In earlier research by the author, it was established if it was
possible to identify the emergence of several different types of corporate group structures.
Research into ownership concentration has typically been made in terms of industry concentration ratios,
average corporate size or other such indicators. These indicators provide a very good standardized snapshot of
industry or firm structure and offer the possibility of using inter-industry or cross-country comparisons of various
types. However, it is difficult to use such data for tracing the dynamics of industrial concentration in a country
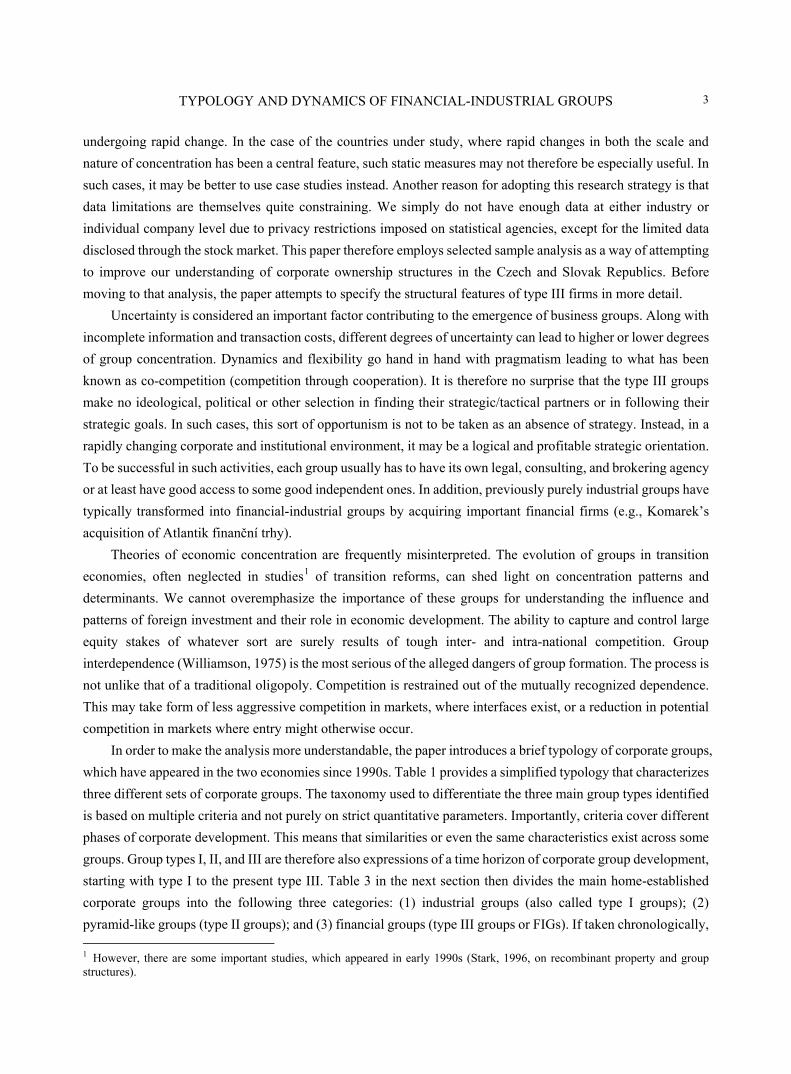
TYPOLOGY AND DYNAMICS OF FINANCIAL-INDUSTRIAL GROUPS 3
undergoing rapid change. In the case of the countries under study, where rapid changes in both the scale and
nature of concentration has been a central feature, such static measures may not therefore be especially useful. In
such cases, it may be better to use case studies instead. Another reason for adopting this research strategy is that
data limitations are themselves quite constraining. We simply do not have enough data at either industry or
individual company level due to privacy restrictions imposed on statistical agencies, except for the limited data
disclosed through the stock market. This paper therefore employs selected sample analysis as a way of attempting
to improve our understanding of corporate ownership structures in the Czech and Slovak Republics. Before
moving to that analysis, the paper attempts to specify the structural features of type III firms in more detail.
Uncertainty is considered an important factor contributing to the emergence of business groups. Along with
incomplete information and transaction costs, different degrees of uncertainty can lead to higher or lower degrees
of group concentration. Dynamics and flexibility go hand in hand with pragmatism leading to what has been
known as co-competition (competition through cooperation). It is therefore no surprise that the type III groups
make no ideological, political or other selection in finding their strategic/tactical partners or in following their
strategic goals. In such cases, this sort of opportunism is not to be taken as an absence of strategy. Instead, in a
rapidly changing corporate and institutional environment, it may be a logical and profitable strategic orientation.
To be successful in such activities, each group usually has to have its own legal, consulting, and brokering agency
or at least have good access to some good independent ones. In addition, previously purely industrial groups have
typically transformed into financial-industrial groups by acquiring important financial firms (e.g., Komarek’s
acquisition of Atlantik finanční trhy).
Theories of economic concentration are frequently misinterpreted. The evolution of groups in transition
economies, often neglected in studies1 of transition reforms, can shed light on concentration patterns and
determinants. We cannot overemphasize the importance of these groups for understanding the influence and
patterns of foreign investment and their role in economic development. The ability to capture and control large
equity stakes of whatever sort are surely results of tough inter- and intra-national competition. Group
interdependence (Williamson, 1975) is the most serious of the alleged dangers of group formation. The process is
not unlike that of a traditional oligopoly. Competition is restrained out of the mutually recognized dependence.
This may take form of less aggressive competition in markets, where interfaces exist, or a reduction in potential
competition in markets where entry might otherwise occur.
In order to make the analysis more understandable, the paper introduces a brief typology of corporate groups,
which have appeared in the two economies since 1990s. Table 1 provides a simplified typology that characterizes
three different sets of corporate groups. The taxonomy used to differentiate the three main group types identified
is based on multiple criteria and not purely on strict quantitative parameters. Importantly, criteria cover different
phases of corporate development. This means that similarities or even the same characteristics exist across some
groups. Group types I, II, and III are therefore also expressions of a time horizon of corporate group development,
starting with type I to the present type III. Table 3 in the next section then divides the main home-established
corporate groups into the following three categories: (1) industrial groups (also called type I groups); (2)
pyramid-like groups (type II groups); and (3) financial groups (type III groups or FIGs). If taken chronologically, 1 However, there are some important studies, which appeared in early 1990s (Stark, 1996, on recombinant property and group structures).
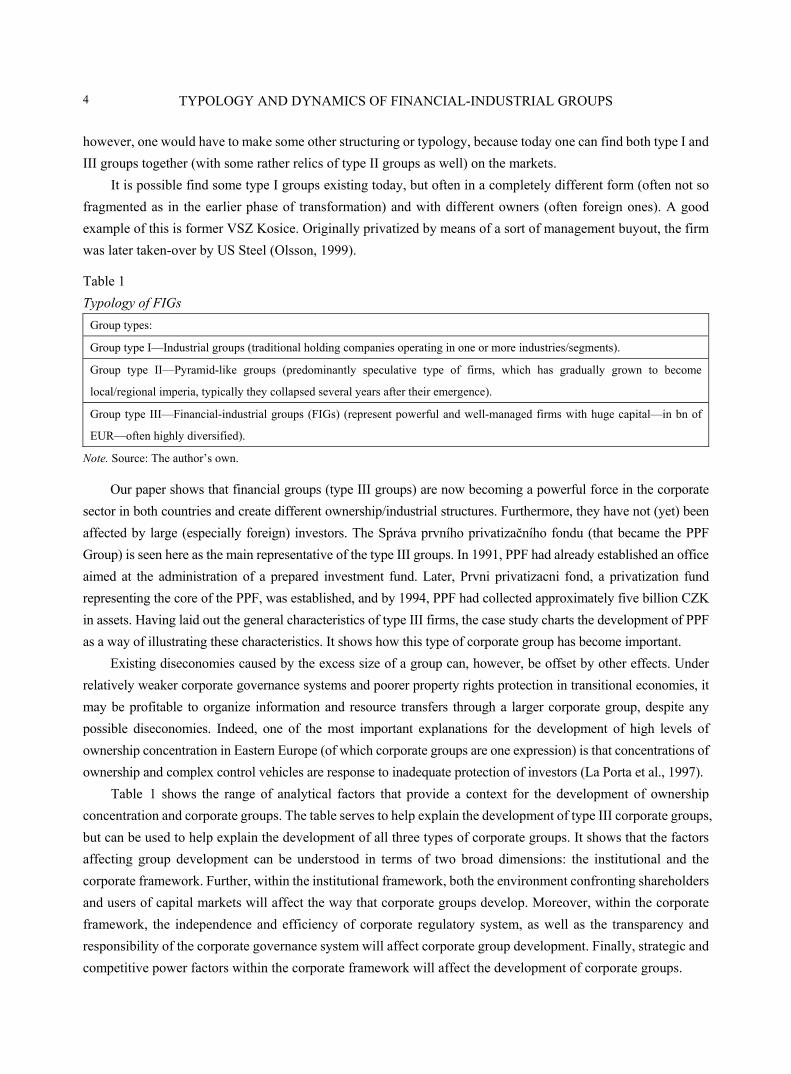
TYPOLOGY AND DYNAMICS OF FINANCIAL-INDUSTRIAL GROUPS 4
however, one would have to make some other structuring or typology, because today one can find both type I and
III groups together (with some rather relics of type II groups as well) on the markets.
It is possible find some type I groups existing today, but often in a completely different form (often not so
fragmented as in the earlier phase of transformation) and with different owners (often foreign ones). A good
example of this is former VSZ Kosice. Originally privatized by means of a sort of management buyout, the firm
was later taken-over by US Steel (Olsson, 1999).
Table 1
Typology of FIGs
Group types:
Group type I—Industrial groups (traditional holding companies operating in one or more industries/segments).
Group type II—Pyramid-like groups (predominantly speculative type of firms, which has gradually grown to become
local/regional imperia, typically they collapsed several years after their emergence).
Group type III—Financial-industrial groups (FIGs) (represent powerful and well-managed firms with huge capital—in bn of
EUR—often highly diversified).
Note. Source: The author’s own.
Our paper shows that financial groups (type III groups) are now becoming a powerful force in the corporate
sector in both countries and create different ownership/industrial structures. Furthermore, they have not (yet) been
affected by large (especially foreign) investors. The Správa prvního privatizačního fondu (that became the PPF
Group) is seen here as the main representative of the type III groups. In 1991, PPF had already established an office
aimed at the administration of a prepared investment fund. Later, Prvni privatizacni fond, a privatization fund
representing the core of the PPF, was established, and by 1994, PPF had collected approximately five billion CZK
in assets. Having laid out the general characteristics of type III firms, the case study charts the development of PPF
as a way of illustrating these characteristics. It shows how this type of corporate group has become important.
Existing diseconomies caused by the excess size of a group can, however, be offset by other effects. Under
relatively weaker corporate governance systems and poorer property rights protection in transitional economies, it
may be profitable to organize information and resource transfers through a larger corporate group, despite any
possible diseconomies. Indeed, one of the most important explanations for the development of high levels of
ownership concentration in Eastern Europe (of which corporate groups are one expression) is that concentrations of
ownership and complex control vehicles are response to inadequate protection of investors (La Porta et al., 1997).
Table 1 shows the range of analytical factors that provide a context for the development of ownership
concentration and corporate groups. The table serves to help explain the development of type III corporate groups,
but can be used to help explain the development of all three types of corporate groups. It shows that the factors
affecting group development can be understood in terms of two broad dimensions: the institutional and the
corporate framework. Further, within the institutional framework, both the environment confronting shareholders
and users of capital markets will affect the way that corporate groups develop. Moreover, within the corporate
framework, the independence and efficiency of corporate regulatory system, as well as the transparency and
responsibility of the corporate governance system will affect corporate group development. Finally, strategic and
competitive power factors within the corporate framework will affect the development of corporate groups.

TYPOLOGY AND DYNAMICS OF FINANCIAL-INDUSTRIAL GROUPS 5
In explaining the development of type III groups, this paper suggests that strategic factors (scope of
activities covered—SCOAC-C and high profit activity share on total activities HIAC-C) and competitive power
(POW-C) issues, together with ownership related issues (OW-I and INV-I) have been particularly important. C
and I, respectively, in abbreviations means corporate or institutional framework element. Given their importance
for the analysis of the ownership structure within type III groups and corporate governance issues, the paper also
mentions rate of equality among shareholders (SHE-C). The paper suggests that for further growth of the type III
groups, a more balanced dealing with different stakeholders (and especially particular shareholder groups) will
now become more critical. After all, it is widely accepted that it has been this factor, which has been a source of
many problems in corporate development in most transition economies. This structural weakness and the absence
of properly specified legal protections have substantially marked the development of capital markets in the Czech
Republic and Slovakia. These weaknesses have had, however, an uneven impact. It provided advantages for the
some groups of shareholders, especially to large (majority-insider) shareholders.
Table 2 provides some specification of the analytical context applied to the two basic corporate governance
models—Anglo-Saxon and continental. The structure of corporate governance has certainly exerted a substantial
influence over the process of ownership concentration and the emergence of all three types of groups.
Irrespective of the specific type of privatization employed, certain forms of legal arrangements along with a
traditional aversion to meet ethical standards vis-à-vis the state and business partners, there would not have been
probably such processes of ownership concentration, which we have seen since 1990s. On the other hand, the
historical fact is that everywhere around the globe a concentration of property in reform period had been
aggressive and massive in both scale and scope.
Table 2
Specification of the Analytical Context: Two Basic Models
Model OW-I ownership
INV-I investment
STDEV-I stock market development
TAK-I rate of takeover activity
BO-C Board INC-C Incentives
DIS-C Disclosure
SHE-C shareholder protection
A Dispersed institutional investors
High High Majority of non-executive members
Widely-set stimuli
High High
B Concentrated families, banks, public sector
low (especiallyfor the new issues)
Limited Bodies composed from insiders
Stimuli related to main shareholders
Limited
Weak protection of minority shareholders
Notes. Model A = Anglo-Saxon model; Model B = continental model; Source: The author’s own.
Table 4 does not cover all industrial groups existing in the Czech and Slovak republics. Several other large
actors operate in coal mining (Kolacek group, Czech Coal), agriculture and food processing (Agropol Group),
petrol, travel, and tourism (Unimex group) and real estate. Other groups are established or controlled by foreign
companies, e.g., Siemens group in Slovakia or ABB in the Czech Republic.
Emergence and Developmental Strategies of FIGs
Given the fact that voucher privatization was designed and for the first time used on a wide-scale basis in the
Czech Republic, it was natural that this model had been used also in some other countries, which had copied this
model with some modifications later on (e.g., in Bulgaria or Russia). Several authors have written on the topic of

TYPOLOGY AND DYNAMICS OF FINANCIAL-INDUSTRIAL GROUPS 6
voucher privatization specifically (Claessens, Djankov, & Pohl, 1996) or on privatization in the Czech Republic
in general (Coffee, 1996). Studies of ownership concentration in Western Europe and CEECs (Olsson & Brzica,
2001; Olsson & Alasheyeva, 2000) confirm that for various reason the concentration of listed companies was
quite high in late 1990s.
Development of corporate groups is the result of ongoing ownership concentration in the Czech and Slovak
economies and can be characterized by several periods. Several types of financial and industrial groups have
appeared since 1990s, but now it is evident that only some of them have survived and even smaller part of them have
become FIGs. In this chapter, five subchapters cover main aspects of FIGs’ emergence and developmental strategies
Type III Groups: Concentration, Conflict, and Cooperation
The type III groups compete intensively within the Czech and Slovak republics. For them, the transfer of
remaining state stakes in companies or bad debts claims has been a central way they have been able to expand at
such a rapid pace. Table 3 provides a more detailed picture of the corporate groups in the two countries selected.
Table 3
Typology With Some Representatives for Each Type Group (Examples)
Group Types:
Type I—Industrial groups
Chemapol group (Czech Republic)
Skoda Plzen group (Czech Republic)
VSZ Kosice group (Slovakia)
HTC holding (Slovakia)
IPB Group (financial group with stakes in industrial firms) (Czech Republic)
Skoda Plzen Group (Czech Republic)
Majsky group (Slovakia)
Agrofert Holding (Czech Republic)
Type II—Pyramid-like groups
BMG Invest CR (Czech Republic)
BMG Invest (Slovakia)
Horizont Slovakia (Slovakia)
Drukos (Slovakia)
AGW (Slovakia)
Type III—Financial-industrial super groups (FISGs)
PPF Group (Czech Republic)
K&K Capital Group (Komarek Group) (Czech Republic)
J&T (Czech Republic & Slovakia)
Penta Group (Slovakia)
Istrokapital (Slovakia)
CPI (Czech Republic)
Note. For the cases of Chemapol group, VSZ group, and Skoda Plzen group see Brzica (2001). Source: The author’s own.
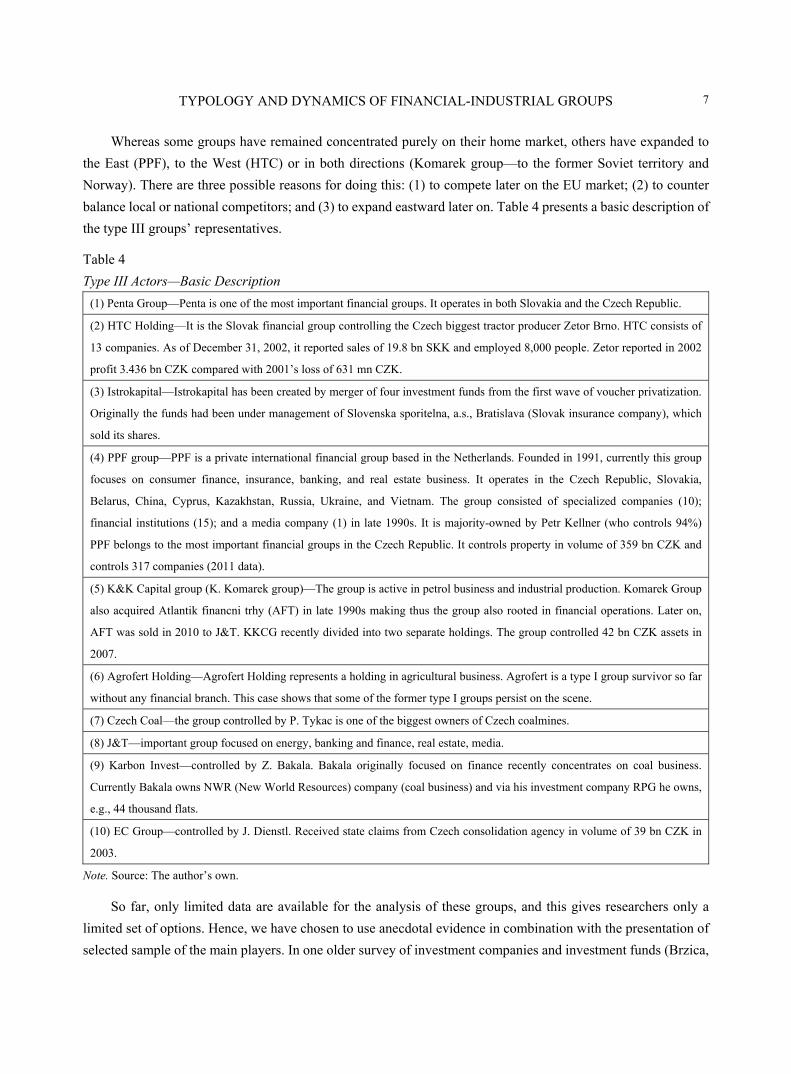
TYPOLOGY AND DYNAMICS OF FINANCIAL-INDUSTRIAL GROUPS 7
Whereas some groups have remained concentrated purely on their home market, others have expanded to
the East (PPF), to the West (HTC) or in both directions (Komarek group—to the former Soviet territory and
Norway). There are three possible reasons for doing this: (1) to compete later on the EU market; (2) to counter
balance local or national competitors; and (3) to expand eastward later on. Table 4 presents a basic description of
the type III groups’ representatives.
Table 4
Type III Actors—Basic Description
(1) Penta Group—Penta is one of the most important financial groups. It operates in both Slovakia and the Czech Republic.
(2) HTC Holding—It is the Slovak financial group controlling the Czech biggest tractor producer Zetor Brno. HTC consists of
13 companies. As of December 31, 2002, it reported sales of 19.8 bn SKK and employed 8,000 people. Zetor reported in 2002
profit 3.436 bn CZK compared with 2001’s loss of 631 mn CZK.
(3) Istrokapital—Istrokapital has been created by merger of four investment funds from the first wave of voucher privatization.
Originally the funds had been under management of Slovenska sporitelna, a.s., Bratislava (Slovak insurance company), which
sold its shares.
(4) PPF group—PPF is a private international financial group based in the Netherlands. Founded in 1991, currently this group
focuses on consumer finance, insurance, banking, and real estate business. It operates in the Czech Republic, Slovakia,
Belarus, China, Cyprus, Kazakhstan, Russia, Ukraine, and Vietnam. The group consisted of specialized companies (10);
financial institutions (15); and a media company (1) in late 1990s. It is majority-owned by Petr Kellner (who controls 94%)
PPF belongs to the most important financial groups in the Czech Republic. It controls property in volume of 359 bn CZK and
controls 317 companies (2011 data).
(5) K&K Capital group (K. Komarek group)—The group is active in petrol business and industrial production. Komarek Group
also acquired Atlantik financni trhy (AFT) in late 1990s making thus the group also rooted in financial operations. Later on,
AFT was sold in 2010 to J&T. KKCG recently divided into two separate holdings. The group controlled 42 bn CZK assets in
2007.
(6) Agrofert Holding—Agrofert Holding represents a holding in agricultural business. Agrofert is a type I group survivor so far
without any financial branch. This case shows that some of the former type I groups persist on the scene.
(7) Czech Coal—the group controlled by P. Tykac is one of the biggest owners of Czech coalmines.
(8) J&T—important group focused on energy, banking and finance, real estate, media.
(9) Karbon Invest—controlled by Z. Bakala. Bakala originally focused on finance recently concentrates on coal business.
Currently Bakala owns NWR (New World Resources) company (coal business) and via his investment company RPG he owns,
e.g., 44 thousand flats.
(10) EC Group—controlled by J. Dienstl. Received state claims from Czech consolidation agency in volume of 39 bn CZK in
2003.
Note. Source: The author’s own.
So far, only limited data are available for the analysis of these groups, and this gives researchers only a
limited set of options. Hence, we have chosen to use anecdotal evidence in combination with the presentation of
selected sample of the main players. In one older survey of investment companies and investment funds (Brzica,

TYPOLOGY AND DYNAMICS OF FINANCIAL-INDUSTRIAL GROUPS 8
1996), several of the biggest fund managers expressed then their willingness to become active administrators of
firms in their portfolio. Legal barriers, however, have changed their possibilities for a while but some of their
dreams have continued throughout the whole 1990s.
What has been typical for all main FIGs since their emergence in 1990s is their bi-polar nature of their
business. As most of FIGs are large groups within their home countries they, as a result, both compete and
cooperate among themselves. The reason is simple, in public tenders many of them are interested to participate
and hence they compete there or, alternatively, they form consortia in which they cooperate (see Table 5 for
illustration).
Table 5
Competition Over Stakes—Some Examples
Firm Industry Value Bidders/competitors
Unipetrol2 petrol 15 bn CZK B, other firms*
Severoceske doly coalmining millions of CZK J, P, other firms*
TV NOVA TV broadcasting billions of CZK PP
State claims various industries billions of CZK PP**, J**, P, EC, other firms*
Fischer group travel agencies millions of CZK P, K, J
Cesky Telecom3 telecommunications 50 bn CZK PP
Sazka lottery billions of CZK J, P, CPI, other firms
Notes. PP = PPF; B = Babis group (Agrofert); P = Penta group; J = J&T group; I = Istrocapital; K = Komarek group; EC = EC group; * There are also some other competitors but they do not represent the groups studied here; **Penta is together with J&T Finance one of the biggest Slovak type III groups, which business focus is especially on trades with bad debts. Source: The author’s own.
Ownership and Control Dynamics of Type III Groups
What makes the difference between the three categories of groups mentioned earlier important for the
changing corporate landscape (and therefore for researchers) are differences in the dynamics and strategic focus
as well as the composition of their activities between the different types of group structures. Whereas the type I
and II groups could be characterized as having quite stable strategic focus, especially on acquiring stakes in
industrial companies (in the case of the type I groups) or collecting money from investors (in the case of the type
II groups), the type III groups are more dynamic in pursuing their strategic goals. Demsetz and Lehn (1985)
postulate that owner control should be more valuable in firms where rapid, uncertain changes in the operating
environment make it difficult to evaluate the effort of management. This is indeed the characteristic feature of the
present business environment in certain segments of the Czech and Slovak industries where further important
privatizations are to be expected.
Having the PPF group in the sample of type III groups, it is easy to show that the dynamics inherent to the
2 Participation in the privatization of Unipetrol announced then the Hungarian petrol and gas company MOL; the Polish PKN Orlen (in consortium with Agrofert); the Russian company Yukos and TNK-BP; ConocoPhilips and Agip. Both Agip and ConocoPhillips had already stakes in Unipetrol and planned to increase their stakes in the company. 3 The consortium Tel Source, representing KPN (The Netherlands) and Swisscom (Switzerland), had decided to sell 27 percent of Cesky Telekom shares. The PPF group, as financial investor, searched for new investment opportunities. Cesky Telekom had been evaluated from this perspective but given the circumstances the purchase of its shares was not considered attractive enough for the PPF.

TYPOLOGY AND DYNAMICS OF FINANCIAL-INDUSTRIAL GROUPS 9
group has helped it to survive and avoid the destiny of other type I groups.4 Internal efficiency of the type III
groups is probably higher than that for the type I and definitely higher than for the type II, because responsiveness
to change is integral to their strategic and structural orientation. Initial ownership dynamics of the type III groups
could have been hampered due to several factors. Among them especially important are: (1) an increasing
competition from abroad in particular segments nowadays controlled by the groups; (2) a global pressure to
concentrate on core technologies; and (3) problems with management and control of complex business structures
in a less developed institutional environment.
Compared with type I and II groups, which had focused on mainly industrial capital and real estate (type I)
or money capital (type II), the type III groups are open to every opportunity to make profit. For this reason, they
have created efficient structures to identify profitable opportunities, provide legal advice on all operations to
avoid possible misconducts and potential suits, and to mobilize financial resources within the group to take
advantage of the identified opportunities. They also organize restructuring, managing/maintaining, consulting or
selling newly acquired assets. This is being made on such a wide-scale level that it can be considered as a
completely new phenomenon despite some exceptions that existed within types I and II groups.
With the concentration process having intensified across many sectors of the Czech and Slovak economies,
large parts of the economy are now controlled either by private groups/companies (or remain in state ownership).
The “winner takes all” principle of current privatization and corporate takeover activity is forcing all the main
players to be active in fights for receiving controlling stakes in different important companies be they in
telecommunications (Telecom), petrol (Unipetrol), banking (Postovni banka) and others. Table 5 provides some
examples of which groups have been competing over which stakes. From the privatization of Unipetrol, the
Czech Republic expected to receive revenues up to 15 bn CZK. As seen from the announced planned sales, a bid
for these stakes required/s substantial capital available. Several groups from our sample confirmed that they have
enough capital sources to be ready to use for such purposes.
We have observed so far that the Czech and Slovak corporate sector concentration for publicly listed
companies is substantial. The group-related process of ownership concentration is permanent throughout the
transition period in both countries as the groups analyzed collect still higher stakes in some important companies
as shown by the cases of PPF or Penta group. In addition, there are several indicators suggesting that this process
will continue. The forms and modes of concentration used by FIGs have been changing over time. It is evident
that some practices and strategies: (1) do not work efficiently; (2) are no longer available (e.g., cheap bank
credits); or (3) are no longer possible (due to higher competition on the market, new legislation etc.). The groups
as intermediaries can, in some cases, “maintain” originally highly concentrated ownership structure of some
former state companies unchanged, because, through bids, they have access to bulk of shares in these companies.
The Cesky Telecom case is one such example of this phenomenon. The dynamics of different types of groups
have widened substantially in terms of durability (persistence), complexity and scope or profitability. Nowadays
they also more efficiently use an opportunity to be incorporated abroad.5
As regards ownership structure, in many cases FIGs are either family-owned (KKCG, EC group),
4 Sometime the IPB case is mentioned in this regard because of some similarities between IPB and PPF structures. 5 Being dynamic and powerful also means that a group should pay substantial amount of taxes. Therefore, the mother company of the whole group, Penta Holding Ltd., is for the tax purposes registered in Cyprus.

TYPOLOGY AND DYNAMICS OF FINANCIAL-INDUSTRIAL GROUPS 10
individually owned (PPF), or owned by small number of individual majority owners (Penta group, J&T).
Restructuring Dynamics of Type III Groups
The emergence of type III groups, together with a new state policy of selling claims of Czech consolidation
agency (a state agency responsible for dealing with claims of state), have generated higher dynamics to the whole
process of restructuring. Not successful initial bank and type I group-lead restructuring have been gradually
substituted by more successful type III groups-lead restructuring. Whereas both the Czech and Slovak banks had
not been successful in solving the situation with their bad debts and claims, the type III groups had been very
dynamic and successful here. Usual time-period of solving such a case was less than one year,6 any operation
lasting more than one year was considered as a failure and such claims were written-off.
Despite the literature on the relation between corporate concentration and restructuring is not well
developed in transition economies, the results from developed countries have shown substantial interrelatedness
between the two aspects. Hence, one has a good reason to believe that making the industrial structure more
concentrated can lead in turn to further restructuring. Restructuring activities are considered here in a wider sense.
They include not only corporate/industrial restructuring processes but also innovations generated by the type III
groups leading to changes in institutional environment and organization setting on the national level. So far, there
have been several such changes made also by the type I and II groups. In the case of type III groups, one change
affected completely corporate sector. It was the initiative of the two companies cooperating on the Czech and
Slovak markets (J&T Global, a member of J&T group and MEI—Middle Europe Investment from the
Netherlands) to trade IPOs of shares related to business in real estates in the Czech Republic and Slovakia. The
two firms have created Middle Europe Real Estate (MERE), a close-end fund with assets value of 100 mn EUR,
where J&T Global and MEI have become joint fund administrators.
In general, restructuring of an economy in transition requires a committed government providing consistent
and widely supported economic policy as well as some business actors capable to initiate needed changes.
Strategic investors from the voucher privatization—some strategically oriented investment companies and
investment funds7; industrial groups of the type I and some individually owned “family imperia”8—could not
have obtained enough power to contribute to substantial concentration of ownership in medium-term horizon.
Many of them have either been transferred into portfolio players, have collapsed or been marginalized by (often
foreign) competitors. In the latter two groups (collapsed and marginalized firms) one can find Chemapol group or
Skoda Plzen, both type I Czech groups. One type I group from Slovakia, VSZ Kosice, has followed still another
development path. Being not a fund but an industrial firm, it has not collapsed or been marginalized but has
returned to its core business with its previously strong capacity. However, it is no surprise also here that Penta had
been interested in control over this company.
Unlike the groups from previous periods, nowadays the biggest groups have quite different operating
possibilities. Whereas at the beginning of transformation the type I and II groups had to deal with both the state
6 Usual schedule for the operation was that in one month these groups or specialized agencies contacted debtors, in less than three months made an agreement or find buyers and then received payments. 7 Since 1996 several investment companies have transformed themselves into holding companies to avoid anti-strategic fund regulation. 8 Charouz group, once a single man-owned company, had in mid 1990s about 1,000 firms in its portfolio.

TYPOLOGY AND DYNAMICS OF FINANCIAL-INDUSTRIAL GROUPS 11
and broad public, now the main partner for the groups in some activities is the state only and in other deals other
powerful groups. Such a situation was possible to see in the case of acquiring claims from the Czech
consolidation agency in volume of billions of CZK or in privatization of important state stakes in strategic
companies, like, e.g., in Czech Telecom or Czech post. In times of voucher privatization there had been disputes
with the government but most activities concentrated on attracting enough individual voucher investors to invest
in particular funds (or to have sufficient number of investors to deposit money in the case of the type II groups).
Although their investment opportunities are limited, their knowledge of how to use existing institutional
environment (especially laws and tender procedures) are deep. Hence, the type III groups are unusually
successful in public tenders organized by the state and usually it is the groups, which appear on short-lists for
such tenders. In some cases, they initiate legal suits to satisfy their claims or to protect their rights. Nevertheless,
FIGs are also successful in usual business. PPF Group, the biggest investment group in Central and Eastern
Europe, received (in 2010) a permission of the Chinese regulator in banking CBRC to found a non-banking
company for providing consumer credits in one Chinese city. This approval gives PPF group the right to
establish—in line with the law on consumer credits adopted in China in 2009—the first company for consumer
credit operations, which will be fully owned by foreign investor. In total in four Chinese cities is to be allowed to
establish firms for consumer credits and these cities/firms should be a pilot for development of this financial
industry in the whole China. Among the recent activities of FIGs belong huge investments into real estates, but
this activity has been reduced since the beginning of the global financial crisis.
Currently, most of the groups mentioned in this paper dynamically develop its activities despite the ongoing
crisis. The largest Italian insurance company Generali has agreed to acquire 49% shares of Generali PPF Holding
(GPH), a joint venture with Kellner’s PPF. Generali, among other things, dominate the Ceska pojistovna (Czech
Insurance Company), which is part of the GPH. For the PPF’s share in GPH Italians pay 2.5 bn euros (about 63.8
bn CZK) (CTK, 2013).
Some Policy Lessons From Transformation Process Related to FIGs
Recent development of FIGs shows that such groups can serve a positive role in post-transformation
economies. It thus confirms the hypothesis that in a transitive economy market uncertainty and instability
motivate firms and other business actors to behave in such a way as to stabilize internally market conditions by
formation of diversified conglomerates. Our analysis indicates that FIGs are very often focused on high profit
margin activities based on deals both with private firms/FIGs and state organizations/institutions. Their economic
power and ability to find and invest in attractive projects make them less vulnerable to crisis—as was shown, e.g.,
by PPF. From a policy perspective is highly discussed the issue of (relative) closeness of these groups. If not
directly person-owned or family-owned then often such groups have a small number of high-stake owners.
An analysis of the groups is important for transitional economies for two reasons: (1) it provides an
explanation of the concentration processes within the economies; and (2) it helps to understand why some
particular modes of privatization and concentration take place and what kind of industrial structure can be
expected to arise in the next future.
To summarize some key elements relevant for other countries one can mention the following ones:
Regulators must stimulate competition and avoid “imperfections” in legislation, which can lead to erosion of

TYPOLOGY AND DYNAMICS OF FINANCIAL-INDUSTRIAL GROUPS 12
competition. Nevertheless, as identified by north, due to active participation of business interest groups in
legislation process (directly or indirectly through lobby groups/persons) such task is very difficult and sometimes
impossible;
Timing and sequencing of steps in reform process can have certain impact on FISGs emergence. However,
initial conditions matter probably more due to the inherent industrial structure of a country than do reforms
specificities;
As the Czech and Slovak cases demonstrate, despite several mistakes of policymakers at the beginning and
during the transition process the resulting post-reform situation is in both countries quite good. Both countries’
competitiveness remains well above those of many other post-reform countries and even global financial crisis
has had a comparatively modest impact on economic development;
Together with foreign direct investments, FIGs has become since their emergence an important vehicle for
exporting investment activities—one most visible example is the one of PPF, which has become the only fully
foreign-owned company receiving a license to provide consumer credit services to population in China. It is
important to note that for PPF this kind of business represent one of the core businesses, which is highly
profitable.
Conclusions
The partial results, which have been presented so far indicate that: (1) group-related process of ownership
concentration is permanent throughout the transition period in both countries; (2) forms and modes of
concentration used by groups have changed over time; and (3) such intermediaries can, in some cases, “maintain”
originally highly concentrated ownership structures of some former state companies unchanged. The dynamics of
different types of groups have widened substantially in terms of durability (persistence), complexity and scope or
profitability. Legal and ethical positions of their operation are also very important from an economic policy
standpoint but for our purposes have been left aside here and therefore were not discussed.
We have shown that the dynamics and structure of different types of groups are important features
explaining, at least partly, why some groups have become more powerful over time while other have either been
rendered unstable or collapsed entirely.
References
Brzica, D. (1996). The role of investment companies and investment fund managers in exercising ownership rights. Russian and East European Finance and Trade, 32(4), 47-66.
Claessens, S., Djankov, S., & Pohl, G. (1996). Ownership and corporate governance: Evidence from the Czech Republic. Retrieved November 8-9, 1996, from http://www-wds.worldbank.org/external/default/WDSContentServer/IW3P/IB/2000/02/24/000009265_3971110141228/additional/117517322_20041117180553.pdf
Coffee, J. C. (1996). Institutional investors in transitional economies: Lessons from the Czech experience. In R. Frydman, Ch. W. Gray, & A. Rapaczynski (Eds.), Corporate governance in central Europe and Russia (pp. 111-186). Budapest: CEU Press.
CTK. (2013). Generali ovládne českou pojišťovnu, odkoupí podíl Kellnerovy PPF. Retrieved from http://www.financninoviny.cz/zpravy/generali-ovladne-ceskou-pojistovnu-odkoupi-podil-kellnerovy-ppf/886027
Demsetz, H. (1983). The structure of ownership and the theory of the firm. Journal of Law and Economics, 26(2), 375-390. Demsetz, H., & Lehn, K. (1985). The structure of corporate ownership: Causes and consequences. Journal of Political Economy, 93,
1155-1177.

TYPOLOGY AND DYNAMICS OF FINANCIAL-INDUSTRIAL GROUPS 13
Ellerman, D. (1998). Voucher privatization with investment funds. The William Davidson Institute Working Paper, No. 167, University of Michigan Business School.
La Porta, R., Lopez de Silanes, F., Shleifer, A., & Vishny, R. W. (1997). Legal determinants of external finance. Journal of Finance, 52, 1131-1150.
March, J. G., & Simon, H. A. (1958). Organizations. New York: Willey. Mertlik, P. (1997). Czech privatization: From public ownership to public ownership in five years? Eastern European Economics, 35,
64-83. Olsson, M. (1999). Ownership reform and corporate governance: The Slovak Privatisation Process in 1990-1996 (Acta Universitatis
Upsaliensis, Uppsala Studies in Economic History No. 49). Olsson, M., & Alasheyeva, J. (2000). Market transparency, ownership concentration and harmonization of law in some east
European countries: A critical note. Paper presented at the conference of Economic Aspects of European Integration. Sweden: Mölle.
Olsson, M., & Brzica, D. (2001). Corporate governance in transitional economies: The case of the Czech Republic. Paper presented at the ACE workshop on Corporate Governance and the Accession Countries, Portoroz, Slovenia.
Pistor, K., & Spicer, A. (1997). Investment funds in mass privatization and beyond: Evidence from the Czech Republic and Russia. Retrieved from http://www.cid.harvard.edu/hiid/565.pdf.
Simoneti, M., Estrin, S., & Boehm, A. (1999). The governance of privatization funds: Experiences of the Czech Republic, Poland and Slovenia. London: Edward Elgar.
Stark, D. (1996). Recombinant property in East European capitalism. American Journal of Sociology, 101(4), 993-1027. Tirole, J. (1991). Privatization in Eastern Europe: Incentives and the economics of transition (draft). Cambridge/Mass:
Massachusetts Institute of Technology. Williamson, O. E. (1975). Markets and hierarchies: Analysis and antitrust implications. New York: Free Press.

Chinese Business Review, ISSN 1537-1506 January 2013, Vol. 12, No. 1, 14-23
Migration in the Middle Asia and Its
Effects on the Labor Market
Füsun ÇELEBİ, Atakan DURMAZ
Bayburt University, Bayburt, Turkey
Many Middle Asia countries declaring their independence after the splitting of the Soviet Union, cannot meet the
economical and social needs of their citizens by falling much behind of the era in terms of industry despite the
natural wealth they have. In addition to all these, the problems in the ruling class and the chaos environment have
resulted in the migration of many people to alternative living spaces. These migrations have affected labor market
both positively and negatively besides the social life. The labor demand increased by the entrance of the immigrants
into the market has affected the employee wages and also this situation has affected the life standards of the citizens.
In this study, the migration that took place in the countries established after the splitting of the Soviet Union,
forming one of the two poles of the world before the cold war, and the effects of this migration on the labor market
have been analyzed considering previous studies on the subject. The studies carried out on this subject have yielded
various results according to the area in which it is carried out, the time interval it includes, and the period’s structure.
For this reason, the points of views on the subject are compared by making a long literature review.
Keywords: migration, labor market, Middle Asia
Introduction
Human being has been obliged to emigrate due to various reasons for centuries. While some have emigrated
as a result of the brutality of sovereigns, others have done so because of such reasons hunger, famine, and
economic factors.
The migrations caused by economic reasons take place generally in a way in which people groups who want
to live in better conditions and earn more lead to more developed countries leaving where they live. These
migrations affect both positively and negatively not only the countries left but also those arrived. The fact that the
unqualified emigrant labor affects the labor market of the country they arrive in as a result of the excess supply
they cause could be considered as the most important one among the negative effects. However, the probable
deduction effect of the immigrant labor power on costs is one of the most important positive effects which should
never be underestimated.
The immigrants affect, in various ways, not only the countries in which they arrive but also in which they
Füsun ÇELEBİ, Associate Professor, Ph.D., Department of Economics, Bayburt University. Atakan DURMAZ, Research Assistant, Department of Economics, Bayburt University. Correspondence concerning this article should be addressed to Füsun Çelebi, Bayburt University, Bayburt, Turkey. E-mail:
DAVID PUBLISHING
D

MIGRATION IN THE MIDDLE ASIA AND ITS EFFECTS ON THE LABOR MARKET 15
were born. The main effect of those is the decrease in unemployment caused by the migration of the unqualified
labor power. Apart from this, the exchange income sent by the emigrants to their homelands is considered as a
very important foreign resource for many countries.
In this study, the effect of migration on the labor market of the countries having been established in Central
Asia especially after the Soviet Union separated is aimed to be analyzed. Firstly, the concept of international
migration and the effects of international migration on labor market will be investigated into and then, the effect
of migration on Central Asia countries is aimed to be discussed.
International Migrations
The increase having been experienced in both national and international migration currencies since the
second half of the 20th century has caused academic studies to be focused on this area. Different reasons cause
individuals to emigrate individually or within groups. In this context, it is possible to explain migration briefly as
the moving of people individually or collectively as a result of economic, social, and political reasons (Şahin,
2001). Thinking more comprehensively, migration is the temporary or stable settlement of people in other places
after leaving the places where they live for the aim of working or providing themselves with better life conditions
(Öngör, 1980).
Migration takes place voluntarily or compulsorily. However, considering the historical events, one can see
that the mass migrations have taken place generally because of compulsory reasons. The Migration of Tribes
which dates back to 4th century when the Huns trying to escape from the sovereignty of China moved towards the
west and settled in the north of Black Sea causing the German tribes who had been living in that region to leave
the region and invade the Europe Continent for years laying the foundations of today’s Eurpoe states, is the first
known mass migration movement (Kinik, 2010). While the mass migrations taking place in different places leads
up to the foundation of new cities and states, the intercontinental migrating has had an oversea dimension since
the American Continent was discovered (Aksoy, 2012). Since the 16th century, many people living in Europe
have migrated collectively to America continent and have settled there. Behind this migration are the economic
reasons. The opportunity of agriculture in the large fields within the new continent and the fact that the overseas
trade developed much have lead people to settle in this continent collectively. Apart from these, nearly 15 million
people have been moved from Africa to America to work as a slave, in the 19th century, millions of people
migrated to America and Europe from China and India for working as contract labors, as a result of the two World
Wars broke out in 20th century, many people have been obliged to leave their homelands (Giddens, 2010).
Europe countries having been tried to be re-established after the Second World War, which have started to
host emigrants from underdeveloped and developing countries to meet the demanded labor power. As this
migration movement depending on economic factors has taken place in parallel with the people’s wishes, it is
possible to be regarded as being based on voluntariness.
General idea about the factors affecting international migration depends on the migration of people from
underdeveloped countries to more developed ones for earn more and to live in better conditions (İçduygu, 2009).
However, this idea has been changing gradually. A kind of migration from developed countries to
underdeveloped ones has been taken place since the developed countries began to spread their economic actions
towards various parts of the world. These are (de Tapia, 2003):
MIGRATION IN THE MIDDLE ASIA AND ITS EFFECTS ON THE LABOR MARKET 16
Permanent settlers;
Permanent contract labors;
Permanent professional workers;
Secret or illegal workers;
Asylum seekers;
Refugees.
According to United Nations, those leaving their homelands and moving to other countries need to stay there
more than one year to mention about international migration (Gençler, 2004). Economic factors, though being an
important factor leading people to move and live in other countries distinct from their homelands, are not the sole
factor. There are several factors apart from economic ones. These could be counted as below:
Migration originating from Economical factors: Migration movements taking place due to people’s wish to
have better jobs, more income, and, accordingly, a better life;
Migration originating from Climatic factors: Migration movements caused by climatic conditions and
natural events. Events such as drought, famine, and natural disasters are leading factors for people’s migration;
Migration originating from Political factors: Migrations caused by the events such as wars, terror, political
pressure which threatens human life. This kind of migration could be caused by problems and instabilities among
different parts of a country while it could be among countries;
Migration originating from educational factors: Migration movements that take place temporarily for
educational purposes. While backward migration could take place as the educational process finishes, permanent
settlement is also possible even after educational process finishes;
Brain drain: Migration of well-educated, qualified, expert individuals of an underdeveloped country to
developed countries for the aim of having better living conditions, a better status, and better income level;
Retired migration: Retired migration, including motivations different from the other migration types, refers
to the migration of people from generally wealthy North America and North Europe to South America and South
Europe costs to spend rest of their life after retirement (Balkiri, Karaman, & Kırkulak, 2008).
Various theories directed at the reasons of international migration have been developed within migration
srudies (Lee, 1996; Wallerstein, 1974). However, the studies carried out accept that the contemporary migration
cannot be connected with only one theory and cannot be measured through one viewpoint (Massey et al., 1993).
Globalization makes it compulsory to evaluate the migration relationship among countries with different
dimensions.
The Effect of International Migration on Labor Market
According to a study carried out by United Nations: more than 175 million people, 3% of the world
population, live in places different from their homelands (Borjas, 2006). Many developed countries, especially
the USA, Canada, and Australia, host these emigrants. The amount of emigrant population hosted by developed
countries has reached high levels, 11% of France’s population, 9% of Germany’s population, 11% of
Switzerland’s population, and 7% of United Kingdom’s population is comprised of foreign originated people.
These crowded emigrant groups have great impacts on both social and economical structure of the countries in
which they live. Important conflicts caused by cultural differences and economic factors can be observed

MIGRATION IN THE MIDDLE ASIA AND ITS EFFECTS ON THE LABOR MARKET 17
between the natives and emigrants especially during crisis periods.
The effect that emigrants have on the labor power of the host countries has been an important subject on
which many academics have studied. However, contrary to the general opinion, it has been revealed as a result of
the studies carried out in the USA and many European countries that migration has no or very little effect affect
on the native workers employment or their salaries (Dustmann, Fabbri, & Preston, 2005). However, considering
the studies analyzing the effects of migration in detail, the effect of migration on labor market varies according to
the qualified worker portion in total emigrant group and the labor market’s structure.
The fact that migration towards OECD countries is more than the rest of the world and also there has been a
gradual increase during the recent years is stated in the study carried out by Docquier, Özden, and Peri (2001). It
was revealed in 2009 that 10% of the OECD countries’ population is foreign originated people. However,
contrary to what is believed in this study, it has been revealed that the many migration movements among OECD
countries have been from one OECD country to another and the portion of high-school graduate in the emigrant
group is higher than those in the migrated country. Accordingly, it can be said that the migration towards the
OECD country is mainly brain drain. It has been revealed that as those migrating to OECD countries are
generally qualified workers, although migration movement towards this region affects employment and salaries
of the unqualified workers in that country negatively, it has no negative effect on the qualified works.
The Structure of Migration in Central Asia and the Effect of Labor Migration on Employment Market
Central Asia countries’ population has been in a new structuring process since the Soviet Union separated
and new 15 states established. While, initially, migration intention was high because of political and ethnical
conflicts, economic reasons came forward later. Especially after the Soviet Union, as the structure of migration is
analyzed within five different periods, the reasons why the region’s people headed towards come up. In the first
step (1991-1992), population movements were the same as in the last years of 1980s, and were shaped according
to discriminations and ethnical based conflicts. In the second step of migration period (1993-1995), political and
ethnical factors continued their dominance, while about 57% of originally Kazakh migrants live in emergent
countries, the rest live in Mongolia (Korobkov, 2007). In the third step (1996-1999), as political factors lost their
significance, social and economic factors accelerated the region’s people’s movements. In this period, while the
number of emigrants arriving in Russia, Ukraine, Belarus, and Moldova decreased, there was an increase in both
permanent and temporary labor migration in Azerbaijan and Central Asia. Also, the growing bureaucratic
structuring, the effects of international laws and the negative attitudes towards emigrants slow down the
migration tendency. In the fourth step (2000-2005), there were attempts to construct legal infrastructure of
emigrant policy, while in the fifth step, after 2005, there was a process in which temporary emigrants were made
permanent, and employees were punished in case of employing illegal emigrants (Korobkov, 2007).
In Figure 1, the increase portion of migration towards Russia between 1992 and 2010 is shown. After the
country separated, while the highest amount of migration was in 1994, the number of people migrating decreased
in the following years and reached its lowest number in 2003. The number of migration in 2003 increased less
than those in 1990s, and as of the year of 2010, being in a decrease proccess, reached a number of below 200
thousand.

MIGRATION IN THE MIDDLE ASIA AND ITS EFFECTS ON THE LABOR MARKET 18
Figure 1. The increase in the migration amount of Russia between 1992 and 2010 (Thousand).
Table 1
Country Based Distribution of Those Migrated Between 1997 and 2010
1997 2000 2005 2006 2007 2008 2009 2010
Azerbaijan 29,878 14,906 4,600 8,900 20,968 23,331 22,874 14,500
Armenia 19,123 15,951 7,581 12,949 30,751 35,216 35,753 19,890
Belarus 17,575 10,274 6,797 5,619 6,030 5,865 5,517 4,894
Kazakhstan 235,903 124,903 51,945 38,606 40,258 39,964 38,830 27,862
Kirghizistan 13,752 15,536 15,592 15,669 24,731 24,014 23,265 20,901
Moldova 13,750 11,652 6,569 8,649 14,090 15,519 16,433 11,814
Tadzhikistan 23,053 11,043 4,717 6,523 17,309 20,717 27,028 18,188
Turkmenistan 16,501 6,738 4,104 4,089 4,846 3,962 3,336 2,283
Uzbekistan 39,620 40,810 30,436 37,126 52,802 43,518 42,539 24,100
Ukraine 138,231 74,748 30,760 32,721 51,492 49,064 45,920 27,508
Total 547,386 326,561 163,101 170,851 263,277 261,170 261,495 171,940
Considering the migration data about countries between 1992 and 2010, it is observed that there are 547,386
emigrants in 1997, and also while Kazakhstan comprises 43% and Ukraine comprises 25% of this amount, the
rest is comprised of Uzbekistan, Azerbaijan, and Tadzhikistan. It is possible to conclude the fact that as Kazakh
language became dominant in Kazakhstan, Kazakhs had a voice in policy and economy, and there was a weak
economy in that region, there has been an increase in the number of emigrants (Dornis, 1997). Migration from
Kazakhstan to Russia decreased after 1997, and the number was 27,862 in 2010. The reason for this decrease was
0
200
400
600
800
1000
1200
Increase of migration (thousand)

MIGRATION IN THE MIDDLE ASIA AND ITS EFFECTS ON THE LABOR MARKET 19
the improvement in Kazakhstan’s economy despite the recession in Russia’s economy (Salt, 2005). In the same
way, the number of emigrants from Ukraine to his close neighbor has decreased until 2007, and although it
increased again in 2007, it started to decrease again after 2007. The emigrants leaving Ukraine prefer not only
Russia, but also East Europe, Germany, and Israel with the intention of settling, depending on the economy in
Russia (Rybakovsky & Ryazantsev, 2005). Such factors as militarial ethnical conflicts, downwardness of Russia
population and Russian language in Kirghizistan have affected the migration process, and although it increased in
the years between 1997 and 2007, Russia was at the fourth place among the emigrant countries in 2010. As
people migrating from Kirghizistan are high qualified people, their migration causes a decrease in the country’s
economically active population and qualified workers working in the industrial, transportation, construction
sectors (Ergeshayev, 2006). While, general the number of people migrating from Uzbekistan to Russia is
fluctuating, it was 24,100 in 2010. As a result of the economic growth in Kazakhstan and Russia, the number of
people migrating from Tajikistan and Uzbekistan increased in 2007, and then it decreased due to the economic
crisis (Abdullaev, 2008).
The Structure of Labor Migration in Central Asia and Its Affect on Labor Market
The fact that life standards decreased and unemployment increased with the shift into market mechanism in
Central Asia led people to search for alternative income resources in various countries. Accordingly, this fact
accelerated labor migration (Korobkov & Zaionnchkovskaia, 2004). After Soviet Union separated, people from
Azerbaijan, Georgia, Kirghizistan, Armenia, Moldova, Uzbekistan, Tajikistan, and Ukraine started working in
Russia without getting visa. A large amount of the workers is comprised of males, and also most of them works at
construction, services, trade, and agriculture sectors (Retrieved from
http://www.ios-regensburg.de/fileadmin/doc/ios_db/Remittances_CIS12_2004-2008.pdf).
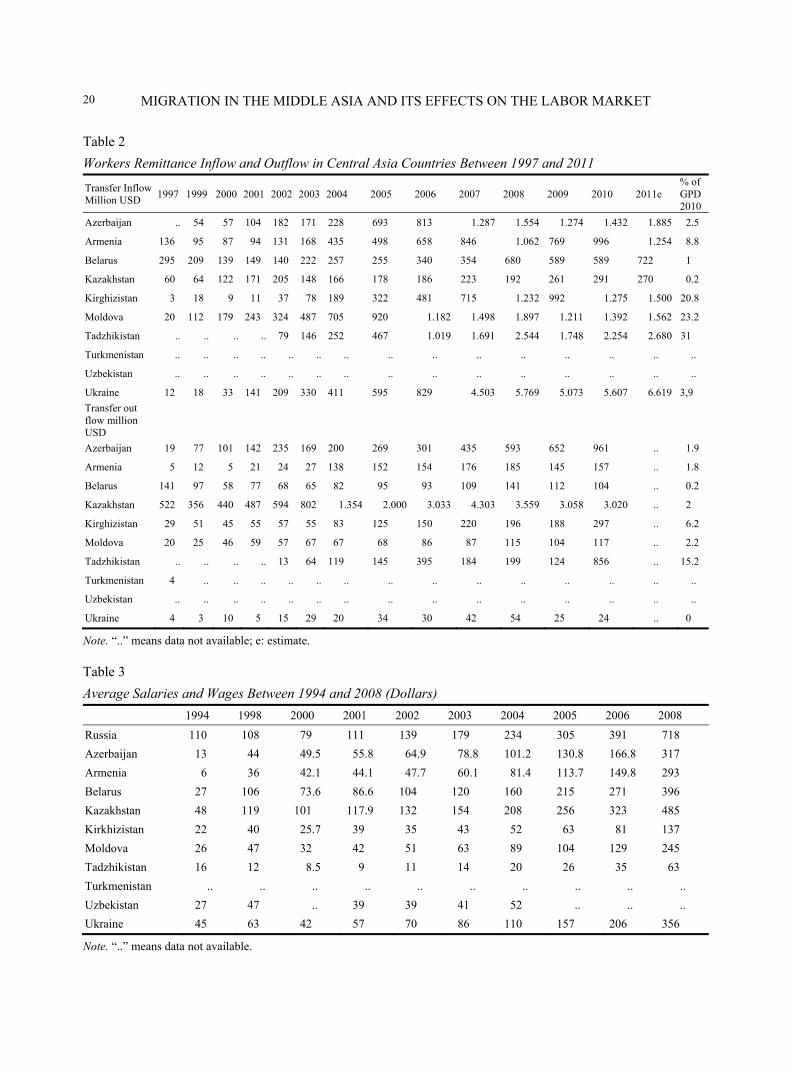
As it can be seen from Table 2, the share of remittance income in Gross Domestic Product (GDP) is
Tajikistan with an amount of 31% followed by Moldova and Kirghizistan respectively. It is possible to conclude
the fact that migration tendency has increased in Tajikistan as educational processes are left half finished because
of the civil war, large amount of the population work at agricultural sectors whose average salary is low, and their
qualifications are inadequate (Marat, 2009). Migration tendency in Moldova varies in three ways. In the first step,
it was generally for economical and commercial purposes because of the high poverty level depending on the
effects of economic crisis in Russia in the second step after 1997. In the same way, the period after 2007 refers to
a period in which the share of Moldavian exists in foreign labor market, and the remittance income increases
except for 2009 (Retrieved from
http://siteresources.worldbank.org/INTECA/Resources/WBMoldovaReport.pdf). The fact that remittance
income in Kirghizistan increases except for 2009, the crises in Kazakhstan and Russia led both countries impose
a quota on those to be employed refer to a decrease in remittance in 2009 (Retrieved from
http://www.warwick.ac.uk/fac/soc/pais/researc/nsc/projects/templer/publications/cg_central_asia_migrants_and
_the_economic_crisis_in_pdf.pdf). While, the portion of outflow of foreign currency by workers in Gross
Domestic Product is most in Tajikistan with an amount of 15.2%, Kirghizistan’s share is 6.2%. It is determinable
that the outflow of foreign currency is shaped according to those transferring from Kirghizistan to Tajikistan and
Uzbekistan, and from there to Russia and Kazakhstan (Collins, 2006).
MIGRATION IN THE MIDDLE ASIA AND ITS EFFECTS ON THE LABOR MARKET 20
Table 2
Workers Remittance Inflow and Outflow in Central Asia Countries Between 1997 and 2011
Transfer Inflow Million USD
1997 1999 2000 2001 2002 2003 2004 2005 2006 2007 2008 2009 2010 2011e % of GPD 2010
Azerbaijan .. 54 57 104 182 171 228 693 813 1.287 1.554 1.274 1.432 1.885 2.5
Armenia 136 95 87 94 131 168 435 498 658 846 1.062 769 996 1.254 8.8
Belarus 295 209 139 149 140 222 257 255 340 354 680 589 589 722 1
Kazakhstan 60 64 122 171 205 148 166 178 186 223 192 261 291 270 0.2
Kirghizistan 3 18 9 11 37 78 189 322 481 715 1.232 992 1.275 1.500 20.8
Moldova 20 112 179 243 324 487 705 920 1.182 1.498 1.897 1.211 1.392 1.562 23.2
Tadzhikistan .. .. .. .. 79 146 252 467 1.019 1.691 2.544 1.748 2.254 2.680 31
Turkmenistan .. .. .. .. .. .. .. .. .. .. .. .. .. .. ..
Uzbekistan .. .. .. .. .. .. .. .. .. .. .. .. .. .. ..
Ukraine 12 18 33 141 209 330 411 595 829 4.503 5.769 5.073 5.607 6.619 3,9
Transfer out flow million USD
Azerbaijan 19 77 101 142 235 169 200 269 301 435 593 652 961 .. 1.9
Armenia 5 12 5 21 24 27 138 152 154 176 185 145 157 .. 1.8
Belarus 141 97 58 77 68 65 82 95 93 109 141 112 104 .. 0.2
Kazakhstan 522 356 440 487 594 802 1.354 2.000 3.033 4.303 3.559 3.058 3.020 .. 2
Kirghizistan 29 51 45 55 57 55 83 125 150 220 196 188 297 .. 6.2
Moldova 20 25 46 59 57 67 67 68 86 87 115 104 117 .. 2.2
Tadzhikistan .. .. .. .. 13 64 119 145 395 184 199 124 856 .. 15.2
Turkmenistan 4 .. .. .. .. .. .. .. .. .. .. .. .. .. ..
Uzbekistan .. .. .. .. .. .. .. .. .. .. .. .. .. .. ..
Ukraine 4 3 10 5 15 29 20 34 30 42 54 25 24 .. 0
Note. “..” means data not available; e: estimate.
Table 3
Average Salaries and Wages Between 1994 and 2008 (Dollars)
1994 1998 2000 2001 2002 2003 2004 2005 2006 2008
Russia 110 108 79 111 139 179 234 305 391 718
Azerbaijan 13 44 49.5 55.8 64.9 78.8 101.2 130.8 166.8 317
Armenia 6 36 42.1 44.1 47.7 60.1 81.4 113.7 149.8 293
Belarus 27 106 73.6 86.6 104 120 160 215 271 396
Kazakhstan 48 119 101 117.9 132 154 208 256 323 485
Kirkhizistan 22 40 25.7 39 35 43 52 63 81 137
Moldova 26 47 32 42 51 63 89 104 129 245
Tadzhikistan 16 12 8.5 9 11 14 20 26 35 63
Turkmenistan .. .. .. .. .. .. .. .. .. ..
Uzbekistan 27 47 .. 39 39 41 52 .. .. ..
Ukraine 45 63 42 57 70 86 110 157 206 356
Note. “..” means data not available.

MIGRATION IN THE MIDDLE ASIA AND ITS EFFECTS ON THE LABOR MARKET 21
According to Table 3, average salary in Russia increases generally except for that in 1998, crisis period, and
reached 718 dollars in 2008. In the same way, average salary in Kazakhstan too, is higher than many other
countries, and increases except for 2000. Apart from Kazakhstan, the countries with high salaries are Ukraine,
Belarus, and Azerbaijan followed by Armenia and Moldova. The countries with lowest salaries are Kirghizistan
and Tajikistan. The fact that remittance income is highly results in the migration of people to countries with
higher salaries to have better life standards. In January, 2012, while the average salaries are supposed to be 795
and 630 dollars in Russia and Kazakhstan respectively, it is supposed to be about 110 dollars Tajikistan
(Retrieved from http://news.am/eng/news/101025.html). It is known that Russia’s economy will grow and
remittance income will increase by means of the increase in oil prices and economic recovery. Also, according to
the forecasts, remittance out flow from Europe and Central Asia will rise from 6.5% to 10.4% from 2011 to 2012.
Conclusions
After the separation of Russia, the second biggest migration-receiving country, while ethnic origin based
migration tendency of those Russian originated and Russian speaking increased, the structure of migration
changed depending on the economic disruption. The civil wars in Tajikistan, Kirghizistan, and
Azerbaijan-Armenia regions prevented people from finishing their education and getting qualified training. In
this period, at the same time, with the shift into market economy, the fact that new arrangements were made and
they could not find positions suitable for their qualifications led people to search for new ways of income.
Accordingly, the process of migrating to close neighbours started and then continued towards Europe Countries,
Israel, and America. It can be said that the citizens of the region migrate to other places with higher average
salaries to get better life standards and live in better conditions, and especially those in Kirghizistan, Tajikistan,
and Uzbekistan headed for Kazakhstan and Russia. Also, the fact that the exchange income comprises a large
amount of gross Domestic Product of Tajikistan, Kirghizistan, and Moldova underlines again the importance of
emigrant income. As Russia made it easier to get visa for the places where it was dominant, labor migration
increased significantly and it became an important country in terms of outflow of foreign currency. Labor
migration, playing an important role on such sectors as construction, services and trade, is expected to increase
even if it would not be at the same lever with that in 1990s. It could be said that Russia’s and Kazakhstan’s
continuing economic growth depending on the increases in oil prices will be important for Tajikistan,
Kirghizistan and Uzbekistan from where they allow immigrants, and also the number of people migrating will
increase. Accordingly, as a result of the economic crises, countries will set measures to present employment
market which will let to a decrease in workers’ incomes.
It can be said that, in the new period, while Russia will keep its importance, a new kind of structuring will
come out in which qualified labor power will, instead of working in poor countries, shift towards developed
countries lacking labor. Apart from this, the moderate changes in the economic structure make economic and
social factors be more dominant in the migration period based on ethnic and political reasons after Soviet Union
separated.
References
Abazov, R. (2009). Current trends in migration in the common wealth of independent states, human development research paper. Retrieved from http://hdr.undp.org/en/re ports/global/ hdr 2009/ papers/HDRP_2009_36.pdf

MIGRATION IN THE MIDDLE ASIA AND ITS EFFECTS ON THE LABOR MARKET 22
Abdullaev, E. V. (2008). Labour migration as phenomenon of developing societies, labour migration in Uzbekıstan: Social, legal and gender aspects. Tashkent.
Aksoy, Z. (2012). Uluslar arası göç ve Kültürlerarası İletişim. Uluslararası Sosyal Araştırmalar Dergisi, 5(20), 292-303. Balkiri, C., Karaman, Z. T., & Kırkulak, B. (2008). Yabancı Emekli Göçünün Sosyal ve Ekonomik Etkileri: Antalya ve Çevresi
Üzerine Ampirik Bir Çalışma. Uluslararası Emekli Göçünün Sosyal ve Ekonomik Etkileri: Antalya Örneği (pp. 8-38). Antalya: Der. Canan Balkırı.
Beloborodov, I. (2011). Demographic situation in Russia in 1992-2010. Retrieved July 01, 2012, from http://www.demographia.ru/eng/articles/index.html?idR=71&idArt=1928
Borjas, G. (2006). The impact of migration on the labor market. http://www.jvi.org/fileadmin/jvi_files/Warsaw_Conference/Papers_and_Presentations/Borjas_paper.pdf
Collins, K. (2006). The logic of clan politics in central Asia. Cambridge: Cambridge University Press. Daniyar, K. (2008). Kyrgyzstan’s average wage rates second to last. Retrieved August 01, 2012, from
http://eng.24.kg/cis/2008/07/31/5732.html de Tapia, S. (2003). New patters of irregular migration to Europe. Retrieved from
http://www.coe.int/t/dg3/migration/documentation/Migration%20management/53000_New_patterns_of_irregular_migration_in_Europe_en.pdf
Docquier, F., Özden, Ç., & Peri, G. (2011). The labor market effect of migration and emigration in OECD countries. IZA Discussion Paper No. 6258.
Dornis, C. (1997). Migration in the Russian Federation since the mid-1980s: Refugees, immigrants and emigrants (pp. 77-117). USA: Raıner Münz ve Myron Weiner.
Dustmann, C., Fabbri, F., & Preston, I. (2005). The impact of migration on the british labour market. The Economic Journal, 115, F324-F341.
Ergeshayev, U. (2006). Trends and migration processes in Kyrgyzstan, migration perspectives Eastern Europe and central Asia. Austria: Roger Rodriguez Rues. Retrieved from http://src.auca.kg/pdf/Migration_Perspectives_Eastern_Europe_and_Central_Asia.pdf#pge=51
Federal State Statics Service. (2011). Population, international migration. Retrieved July 02, 2012, from http://www.gks.ru/bgd/regl/b11_12/IssWWW.exe/stg/d01/05-08.htm
Gençler, A. (2004). Avrupa Birliği’nin Göç Politikası. Sosyal Siyaset Konferansları Dergisi, 49, 173-197. Retrieved from http://iudergi.com/index.php/sosyalsiyaset/ article/viewFile/461/416
Giddens, A. (2010). Göçmenlerin Emek Piyasası Üzerindeki Etkisi, Sosyoloji Başlangıç Okumaları (pp. 522-527). Ed. Anthony Giddens, Ankara: Say Yayınları.
İçduygu, A. (2009). International migration and human development in Turkey. UNDP Human Developments Research Paper 2009/52. Retrieved from http://hdr.undp.org/en/reports/global/hdr2009/papers/HDRP_2009_52.pdf
International Crisis Group. (2010). Central Asia: Migrants and the economic crisis, Asia Report, 2010. Retrieved from http://www.warwick.ac.uk/fac/soc/pais/research/nsc/projects/templer/publications/cg_central_asia_migrants_and_the_economic_crisis_in_pdf.pdf
Kinik, K. (2010). Göç, Sürgün ve İltica. Retrieved from http://www.amnesty.org.tr/ai/node/1538 Korobkov, A. V. (2007). Migration trends in central Eurasia: Politics versus economics. Communist and Post-Communist Studies
40(2), 169-189. Korobkov, A. V., & Zaionchkovskaia, Z. A. (2004). The changes in the migration patterns in the post-Soviet states: The first
decade. Communist and Post-Communist Studies, 37(4), 481-508. Lee, E. S. (1966). A theory of migration. Demography, 3, 47-57. Marat, E. (2009). Labour migration in central Asia implications of the global economic crisis. Washington: Central Asia:
Caucasus Institute Silk Road Studies Program. Retrieved from http://www.silkroadstudies.org/new/docs/silkroadpapers/0905migration.pdf
Massey, D. S., Arango, J., Hugo, G., Kouaouci, A., Pellegrino, A., & Taylor, E. J. (1993). Theories of international migration: Review and appraisal. Population and Development Review, 19(3), 54-77.
Mohapatra, S., Ratha, D. & Silwal, A. (2010). Outlook for remittance flows 2011-2012. Retrieved from http://INTPROSPECTS/Resources/3349341110315015165/MigrationAndDevelopmentBrief13.pdf
Öngör, S. (1980). Coğrafya terimleri sözlüğü. Ankara: Türk Dil Kurumu Yayınları. Retrieved from http://tdkterim.gov.tr

MIGRATION IN THE MIDDLE ASIA AND ITS EFFECTS ON THE LABOR MARKET 23
Rybakovsky, L., & Ryazantsev, S. (2005). United Nations expert group meeting on international migration and development. Retrieved from http://www.un.org/esa/population/meetings/ittmigdev2005/P11_Rybak ovsky&Ryazantsev.pdf
Şahin, C. (2001). Yurt Dışı Göçün Bireyin Psikolojik Sağlığı Üzerindeki Etkisi İlişkin Kuramsal Bir İnceleme. G.Ü.Gazi Eğitim Fakültesi Dergisi, 21(2), 57-67.
Salt, J. (2005). Current trends in international migration in Europe. Strasbourg: Council of Europe Publishing. The CIS Inter-state Statistics Committee. (2012). Average wage in Armenia and CIS countries data. Retrieved June 30, 2012, from
http://news.am/eng/news/101025.html Wallerstein, I. (1974). The modern world system: Capitalist agriculture and the origins of the European world economy in the
sixteenth century. New York: Academic Press. World Bank. (2010). Strengthening the link between migration and development. Retrieved from
http://siteresources.worldbank.org/INTECA/Resources/WBMoldovaReport.pdf World Bank. (2012). Annual remmitances data. Retrieved June 30, 2012, from
http://econ.worldbank.org/WBSITE/EXTERNAL/EXTDEC/EXTDECPROSPECTS/0

Chinese Business Review, ISSN 1537-1506 January 2013, Vol. 12, No. 1, 24-33
Acceleration Factors in the Improvement
of Public Welfare Sangiran
Mugi Raharjo, I Gusti Putu Diva Awatara, Harmadi, Wahyu Agung Setyo
Sebelas Maret University, Surakarta, Indonesia
Efforts to preserve the cultural heritage are manifestation to represent the work of the ancestors of the past so that
people can now take advantage of in accordance with destining. There are at least four major aspects of a cultural
heritage can be appreciated to the public, as art, as an economic resource (for tourism and improve the welfare of the
people in the region), as a source of information as knowledge and social fulfillment. This study aims to determine: (1)
acceleration factors in the improvement of social welfare Sangiran; and (2) modernization of infrastructure and the
role of maximum revenue acceleration in accelerating improvements in public welfare in the Sangiran with the
integrated approach of the factors increasing human development, community empowerment, provision of credit
banking and employment opportunities. This research is a survey of the Sangiran area using data collection methods
of documentation, interviews, and questionnaires. The population in this study is people in the Sangiran region,
Central Java. This study uses cluster sampling with sampling. Cluster sampling is a probability sampling extracted by
certain groups with similar characteristics. In this study, samples were grouped according to the residence of
respondents. The sample used in this study was 500 respondents. The analysis technique used is structural equation
modeling (SEM). The results of this study show that: (1) the factors of human development, community
empowerment, access to bank credit and employment opportunities to accelerate the improvement of social welfare in
the Sangiran area; and (2) the acceleration of the increase in welfare Sangiran region can be achieved by an integrated
approach of the factors increasing human development, community empowerment, bank lending and increase
employment opportunities through increased infrastructure modernization and maximum income.
Keywords: human development, community empowerment, bank credit, employment opportunities, infrastructure,
income, welfare
Introduction
Sangiran region have a lot of very interesting mysteries to uncover. The information contained in silence
behind the hills at Sangiran is very important to the world of science. This is because the Sangiran sites were
found the remains of past life which are very interesting to observe and learn. As the world’s cultural heritage,
Sangiran not only provides an overview of the physical evolution of humans alone but also able to provides a
Mugi Raharjo, Ph.D., Drs. M.Si, Senior Lecturer, Faculty of Economic, Sebelas Maret University. I Gusti Putu Diva Awatara, SP. M.Si, Ph.D. Candidate of Environmental Science, Sebelas Maret University. Harmadi, Drs. MM., Vice Dean, Faculty of Economic, Sebelas Maret University. Wahyu Agung Setyo, Drs. M.Si, Lecturer, Faculty of Economic, Sebelas Maret University. Correspondence concerning this article should be addressed to Mugi Raharjo, Faculty of Economic, Sebelas Maret University,
Surakarta, Ir. Sutami 36 A Surakarta, 57126, Indonesia. E-mail: [email protected].
DAVID PUBLISHING
D

ACCELERATION FACTORS IN THE IMPROVEMENT OF PUBLIC WELFARE SANGIRAN 25
clear picture of the evolution of culture, animals, and the environment as mandated by the vision and mission of
preservation and development of the sustainability of Sangiran. Sangiran site as a center for the study of early
human is able to provide maximum benefit at all the global, regional, national, and local levels.
Efforts to preserve the cultural heritage are actually one form to represent the work of the ancestors of the
past so that people can now take advantage of in accordance with destining. There are at least four major aspects
of a cultural heritage can be appreciated to the public, as objects of art, as an economic resource (for tourism and
improve the welfare of the people in the region, for example), as a source of information science, and the social
fulfillment (Hampton, 2005).
Sangiran is a potential area to be developed as a traditional cultural community-based tourism. This is
caused by the background Sangiran still thick with the atmosphere of a traditional, though modernization has
touched the lives of area residents. For the Sangiran, accepting modernization does not mean necessarily leave
the local wisdom. The passion to create the harmony of human life with nature and the environment still
characterize each individual action and communal activities. Tourism trends taking place in the last decade shows
that those travelers tend tourist interested in natural shades. Tourism objects that sell exotic landscape and feel of
a traditional society sell. Both local and foreign tourists in recent times experienced a change in consumption
patterns. The travelers are no longer focused simply want to enjoy the beautiful natural scenery of the area, but
also want to know even more intimate interaction into a pattern of public culture. With such a trend of tourism,
community life, creative arts and culture, and heritage encapsulated in packages more attractive for tourists. The
purpose of this study was to determine: (1) acceleration factors in the improvement of social welfare Sangiran; (2)
modernization of the infrastructure and the role of maximum revenue acceleration in accelerating improvements
in public welfare in the Sangiran with the integrated approach of the factors increasing human development,
community development, administration bank credit, and increase employment opportunities.
Literature Review
Human Development
Human needs consists of three sides, namely: (1) basic life needs, it includes the needs of food, clothing,
shelter and health; (2) social needs, covering education, recreation, transportation, internal and external
interactions; and (3) developmental needs, including savings, special education and access to information
(Soemardjan, 1997). The general sense is an attempt to promote the development of society and its citizens. The
progress made by a society in economics. Based on the understanding, it can be given the understanding of
human development as the progress made by the human society to meet the needs of the economy. However, this
definition can be expanded, given the needs of the people that are not only economic, but also social, the human
development can be given meaning as condition and the progress of human life is measured by its ability to meet
the needs of life and social services (Budiman, 2004).
Community Empowerment
Ife (1995) states that empowerment is a process of helping disadvantaged groups and more individualized to
compete effectively with other interests, by helping them to learn and use in lobbying, using the media, engaging
in political action, understanding how to work the system and so on. The above definition defines the concept of
empowerment as an effort to provide autonomy, authority, and trust to every individual in an organization, and

ACCELERATION FACTORS IN THE IMPROVEMENT OF PUBLIC WELFARE SANGIRAN 26
encourage them to be creative in order to complete the task as possible. Foy (1994) states empowerment is often
interpreted as an effort to provide power in order to hear their aspirations in order to contribute to the planning
and decisions that affect their communities.
Budiman (2004) states the general sense is an attempt to promote the development of society and its citizens.
The progress made by a society in economics. Based on the understanding, it can be given the understanding of
human development as the progress made by the human society to meet the needs of the economy. However, this
definition can be expanded, given the needs of the people that are not only economic, but also social, the human
development can be given meaning as condition and the progress of human life is measured by its ability to meet
the needs of life and social services.
Community empowerment is a concept that summarizes the economic development of social values. This
concept reflects the new development paradigm, namely that is “people centered, participatory, empowering, and
sustainable” (Chambers, 1995). This concept is broader than merely satisfy basic needs (basic needs) or provide a
mechanism to prevent further impoverishment (safety net), whose thinking recently been developed as an effort
to find an alternative to the concepts of growth in the past. This concept evolved from the efforts of many experts
and practitioners to find out what the others by Friedman (1992) referred to as alternative development, which
requires inclusive democracy, appropriate economic growth, gender equality, and intergenerational equal.
Banking Credit
Credit is the delay in the payment of the loans given current achievements in the form of goods, money or
services profits or interest obtained from the lender to maintain business continuity and expand its business
(Tohar, 2000). Samuelson and Nordhaus (2004) reason for credit request is a request that needs a medium of
exchange transactions received by the general public to buy goods and pay bills, and in addition to that asset or as
a store of value. Request credit be affected by interest rate (cost of holding money) where the higher cost (interest
rate) and the demand for credit (money) decreased.
Money demand for credit purposes is determined by the interest rate. The higher the interest rate is, the
lower the community’s desire for credit is. The reason is if the interest rate rise means the cost of holding money
(opportunity costs) vanishingly small, whereas the lower the interest rate, the greater the public’s willingness to
borrow loans (Tambunan, 2001).
Employment Opportunities
Tambunan’s (2001) definition of employment has included jobs that are already occupied and vacant
(vacancy), while Djuhari (1998) states implies employment jobs and jobs created to be filled through an
economic activity (production) so employment includes jobs are already filled and all the jobs that have not been
filled and are commonly known as job requirements.
Makmun (2004) states that the measure of economic progress include national income, employment rate,
the price level, and the foreign payments position. Nationally suggests that the economic collapse of industries in
urban areas resulted in the rural economic growth and rising unemployment as a result of increased migrants
return to the village. Easements government capital for the development of the SME sector will be able to
overcome the leveling off (reduction of capacity) and increase profits. Development of agribusiness and
agro-industries in rural areas will also be able to increase productivity, income, and employment opportunities so
ACCELERATION FACTORS IN THE IMPROVEMENT OF PUBLIC WELFARE SANGIRAN 27
that populations will increase aggregate supply.
Infrastructure
World Bank (2007) defines infrastructure as the physical assets needed to support economic activity both in
production and final consumption includes public utilities (energy, telecommunications, water supply, sanitation,
and gas), public work (roads, dams, canals, irrigation channels, and drainage) and the transport sector (road, rail,
transit ports, airports and so on).
The linkage between infrastructure and economic growth cannot be separated from the function as with
infrastructure enabler of economic activity. Infrastructure has the tools to drive various sectors of the economy as
it is considered as social overhead capital (Permana, 2009). As a region, Sangiran course requires physical
infrastructure as a facility that will support all activities carried out in the region. In general, the infrastructure
include: infrastructure related to transportation of goods and people, such as roads and other logistics facilities,
infrastructure as a provider and supplier of energy such as electricity and other energy generating stations,
sewage treatment and storage infrastructure such as water treatment and others as well telecommunications
infrastructure such as telephone and communication (Djajadiningrat & Melia, 2004).
Revenue
Baridwan (2004) revenues are inflows of other assets or an increase in a business entity or settlement of its
debts (a combination of both) during a period from the delivery or manufacture of goods, delivery of services or
other activities that constitute the main activity of the enterprise. Dycman (2002) says that revenues are inflows or
other enhancements of assets or settlement of liabilities an entity or a combination of the two during the period of
delivery or production of goods, provision of services or other activities that are major or central operations
ongoing entity. Syafri (2002) defines gross income as an increase in assets and a decrease in the gross liability
assessed by accounting principles derived from profit-seeking activities.
Revenue should be presented fairly, not to be anticipated too big or too small. Measurement revenues by
Indonesian Institute of Accountants (2004) explained that the revenue should be measured by the fair value of the
consideration received or to be received, the Indonesian Institute of Accountants further stated that the amount of
revenue arising from a transaction is usually determined by agreement between the company and the buyer or
user assets. The amount is measured by the fair value of the consideration received or receivable the company
reduced the number of trade discounts and volume rebates earned by the company.
Welfare
Sen (2002) says that welfare economics is a rational process towards the public release of the barriers to
progress. Social welfare can be measured from measures such as the level of life (levels of living), fulfillment of
basic needs (basic needs fulfillment), quality of life (quality of life), and human development, while Nicholson
(1992) argues that the principle of the social welfare state welfare social maximum is reached when no one was
harmed. Swasono (2004) propose performance criteria for social welfare with restrictions that include output
growth, efficiency, stability, security, inequality, and the freedom that should be associated with a social
preference, while Etzioni (1999) says that the privacy of individuals related by social norms, and thus the position
of the individual is as social beings who must find in economics primarily in economic development aimed
towards the welfare of society.

ACCELERATION FACTORS IN THE IMPROVEMENT OF PUBLIC WELFARE SANGIRAN 28
Research Methods
This research is the correlation by using primary data through a survey with interview techniques (direct
interview) to the respondents with the help of a structured questionnaire (questionnaire) contains about human
development, community development, banking credit, employment, infrastructure, income, and welfare.
The population in this study is people in the Sangiran region, Sragen, Central Java. This study uses cluster
sampling with sampling. Cluster sampling is a probability sampling extracted by certain groups with similar
characteristics. In this study, samples were grouped according to the residence of respondents. Sampling method
was used for this study will take a sample based on specific goals quickly. The sample used in this study was 500
respondents.
Operational definitions of the variables used in this study are:
(1) Human development is the progress made by the human society in meeting the needs of the economy,
measured by the human development index (HDI) covering aspects of health and longevity read of the life
expectancy, educational aspect views of the old school and buying power.
(2) Community empowerment is a process of development potential and ability that grows the capacity to
solve the problems facing society. Community empowerment is measured by the success of awareness and
community organizing.
(3) Bank credit is the provision of a number of funds offered by banking institutions to the public for
business. Bank lending is measured by the ease of access and procedure.
(4) Job opportunity is that jobs and vacancies are created to be filled through an economic activity
(production). Employment opportunities are not easily measured or employment opportunities.
(5) Infrastructure is a public facility and infrastructure in support of economic activities in the area of
Sangiran. Infrastructure measured by eligibility transportation infrastructure, irrigation, housing, and buildings
and public utilities.
(6) Income is income households (head of the family, father, mother, and children who are already working)
regular monthly as salaries, wages, and benefits. Income measured in dollars.
(7) The welfare of society is a rational process towards the public release of the barriers to progress. Social
welfare is measured by the fulfillment of basic needs (basic needs fulfillment) and livelihood (levels of living).
The analysis technique used is structural equation modeling which is a technique that combines elements of
multiple regression and factor analysis. This technique will also examine the relationship between different
variables or constructs simultaneously, so it will be beneficial when the dependent variable to the independent
variable in the next relationship. To test this hypothesis in this study we used Maximum Likelihood Estimation
(ML) with the program Amos Version 5 through Maximum Likelihood Estimation will get the value of critical
ratio (CR) which is identical to the t test in Multiple Linear Regression, where the value of CR accepted if it has a
value equal to or greater than two (Ferdiand, 2000).
Data Analysis
Goodness of Fit Test
X2 value in this study amounted to 276.571 with a probability of 0.063 is a good indication. GFI value of
0.954 means that are qualified to be expected and RMSEA value of 0.017 is a good indication. While the

ACCELERATION FACTORS IN THE IMPROVEMENT OF PUBLIC WELFARE SANGIRAN 29
incremental fit index AGFI value obtained measures of 0.943 means it meets the expected requirements and CFI
values of 0.956 and 0.950 for mean TLI has been qualified to be expected. In addition to the parsimony fit index
measures the value obtained CMIN/df of 1.143 is a good indication because it has a smaller value than two. These
results indicate that the model is built gives Goodness of Fit Index value that meets the requirements of the
model.
Hypothesis Test
The estimation of structural models in this study can be seen in Table 1:
Table 1
The Result of Structural Equation Model Estimation
Regression Weights C.R. p Criteria
I ← PM 3.375 0.000*** 0.01
I ← DM 2.168 0.030** 0.01
I ← KP 3.025 0.002*** 0.01
I ← KK 7.830 0.000*** 0.01
P← PM 2.009 0.045** 0.05
P← DM 2.206 0.027** 0.05
P← KP 2.386 0.017** 0.05
P← KK 4.360 0.000*** 0.01
KM ← I 2.076 0.038** 0.05
KM ← P 3.124 0.002*** 0.01
KM ← PM 4.251 0.000*** 0.01
KM ← DM 3.151 0.002*** 0.01
KM ← KP 3.213 0.002*** 0.01
KM ← KK 3.321 0.000*** 0.01
Notes. PM = Human Development; DM = Empowerment; KP = Bank loans; KK = Employment opportunities; I = Infrastructure; P = Revenue; KM = welfare society; ** = Significant at the 5% error; *** = Significant at 1% error. Source: Data analysis, 2012.
Results
(1) In order to accelerate the improvement of social welfare in the Sangiran area, efforts should be taken:
Increasing human development in the region’s Krikilan, Ngebung, Bukuran, and Dayu through efforts to
provide educational scholarship programs for school children and training activities such as training of
conservation and tourism development in the village of Krikilan, Ngebung, Bukuran, and Dayu and training need
assessment (TNA) for local and community development efforts in the field of handicrafts/souvenirs;
Increasing the empowerment of communities through efforts to provide a variety of community programs
such as community development efforts in the areas of accommodation, home stay and restaurants in clusters
Krikilan, production process technology training in the field of batik, souvenirs and crafts at the cluster Bukuran,
management training business management, developed a tourism awareness groups (Pokdarwis) in each village.
Development of tourism awareness groups can observe aspects in an integrated area development Sangiran
Krikilan e.g., for cluster development directed to the appreciation of the history of human civilization. For those
communities that exist in the cluster should at least understand Krikilan, Krikilan cluster region as an
appreciation of history of human civilization so expect existing community empowerment can be adjusted with
the ability or potential businesses in the cluster region Krikilan that can be adapted to the cluster development

ACCELERATION FACTORS IN THE IMPROVEMENT OF PUBLIC WELFARE SANGIRAN 30
concept Krikilan. Likewise, for the communities in the cluster can be empowered in accordance Ngebung,
Ngebung cluster development as an appreciation of the history of the discovery of fossils of Sangiran site. For
the cluster can be empowered in accordance Bukuran, Bukuran cluster development as information accumulated
appreciation fossils Sangiran site (history of java man) and cluster Dayu appreciation Sangiran excavation of
fossil sites and cutting-edge research;
Increasing the bank loan by the government to provide capital access to both banking institutions Banks and
Bank Syariah to the public by a group of credit without collateral given to the people who have started businesses
and credit application procedure is not complicated;
Increasing employment opportunities by involving the active participation of the community in the
development of the area in each cluster through involvement in developing the unique nature, fossils, handmade
souvenirs, and tourist attraction as well as the existing research on cluster Krikilan could be involved in the
construction and development study center, convention center and recreational water clusters Krikilan. For
cluster Ngebung community can be involved in the management of the indoor museum, while the cluster
Bukuran community can be involved in managing the souvenir shop. Other than that involved in the
development of restaurants and restaurant, amphitheater construction multimedia, entertainment stage
construction, installation of signs tours, jungle tours development, construction, and fishing floating resto in
Dam Bapang and land acquisition in the area of Sangiran.
(2) Accelerating the improvement of social welfare in the Sangiran can be achieved through the
modernization of infrastructure and revenue maximized. Infrastructure modernization efforts in the area of
Sangiran can be done through:
Repair or improved drainage and pavement construction for example, in a village location Jetis Karangpung,
construction of major roads such as relatively long bridge worth in District Kalijambe and Plupuh;
Construction of drainage and sidewalks driveways Sangiran Museum;
Installation of street lighting in the village or mercury Jetis Karangpung;
Construction of road paving in locations where fossil discoveries cluster Krikilan, Ngebung, Bukuran, and
Dayu;
Development checkpoint on cluster Ngebung, Bukuran, and Dayu;
Improvement path toward Pungsari Sangiran, road improvements Kragilan towards Ngebung, Sangiran
towards Bapang roadwork, road improvements and repairs Sangiran towards Dayu From leading Pungsari;
Maintenance of secondary channels in Jetis Karangpung, Wonorejo, Kaliwuni, Bapang, Sambirejo, and
Citran;
Improvement neighborhoods such as drainage improvements, street paving, and the provision of more and
improved bins or carts;
Improvement ponds Ngebung.
(3) Efforts to increase the maximum income can be done through:
Accelerate the number of permanent stalls Sangiran region;
Accelerate the construction of facilities catering service provider (restaurant) in the Sangiran area with
facilities that have a standard of comfort and hygiene;
Accelerate the construction of the gallery souvenirs at Sangiran area;
ACCELERATION FACTORS IN THE IMPROVEMENT OF PUBLIC WELFARE SANGIRAN 31
Accelerating the provision of working tools owned by the artisan souvenirs at Sangiran area;
Accelerate the provision of working capital held by the craftsmen to develop the business;
Accelerating the provision of quality craft products produced by the public so that the need for training to
improve the skills of craftsmen.
Conclusions
Human development, community development, banking credit, and employment opportunities have
positive effects on social welfare. These results indicate that increasing human development, community
empowerment, bank credits, and employment opportunities can accelerate the improvement of social welfare in
the Sangiran area.
Accelerating the improvement of social welfare in the Sangiran can be achieved with the integrated
approach of the factors increasing human development, community development, bank lending, and increase
employment opportunities through increased infrastructure modernization and maximum income.
Some recommendations can be associated with this study are as follows:
(1) Increasing human development can be done through education scholarships for children and training
activities such as training of conservation and tourism development in the village of Krikilan, Ngebung, Bukuran,
and Dayu and training needs assessment (TNA) for local and community development efforts in the field of
handicrafts/souvenirs.
(2) Increasing the empowerment of the community through efforts to provide a variety of community
programs such as community development efforts in the areas of accommodation, home stay, and restaurants in
clusters Krikilan, production process technology training in the field of batik, souvenirs and crafts at the cluster
Bukuran, management training business management, developed a tourism awareness groups (Pokdarwis) in
each village.
(3) Increasing the bank loan by the government to provide capital access to both banking institutions Banks
and Bank Syariah to the public by a group of credit without collateral given to the people who have started
businesses and credit application procedure is not complicated.
(4) Increasing employment opportunities by involving the active participation of the community in the
development of the area in each cluster through involvement in developing the unique nature, fossils, handmade
souvenirs, and tourist attraction as well as the existing research.
(5) Efforts to modernize infrastructure in the Sangiran area can be done through:
Preparation of the special facilities for disabled people in the cluster Krikilan;
Repair or improved drainage and pavement construction, for example, in a village location Jetis karangpung,
construction of major roads such as relatively long bridge worth in District Kalijambe and Plupuh;
Construction of drainage and sidewalks driveways Sangiran Museum;
Construction of road paving in locations where fossil discoveries cluster Krikilan, Ngebung, Bukuran, and
Dayu;
Development checkpoint on cluster Ngebung, Bukuran, and Dayu;
Improvement neighborhoods such as drainage improvements, street paving and the provision of more and
improved garbage bins or carts and repair ponds Ngebung.

ACCELERATION FACTORS IN THE IMPROVEMENT OF PUBLIC WELFARE SANGIRAN 32
(6) Efforts to increase the maximum income can be done through:
Accelerate the number of permanent stalls Sangiran region;
Accelerate the construction of facilities catering service provider (restaurant) in the Sangiran area with
facilities that have a standard of comfort and hygiene;
Accelerate the construction of the gallery souvenirs at Sangiran area;
Accelerate the provision of working tools owned by the artisan souvenirs at Sangiran area;
Accelerate the provision of working capital held by the craftsmen to develop the business;
Accelerate the provision of quality craft products produced by the public so that the need for training to
improve the skills of craftsmen;
Provide outreach to the community to plant plants that fit the soil conditions in the area without damaging
the Sangiran site such as fruit crops like citrus Tawangmangu once famous. options productive agricultural
cultivation will be more supportive of Sangiran as a tourist area and address critical land;
Entertainment in the form of traditional art such as art Tayub to be further developed, for serving tourists on
any given day. This has been initiated and implemented and the results have increased the flow of tourists to the
region Sangiran.
(7) Making packages in collaboration with travel agents will also be able to represent the presence of the
Sangiran. For packages that need to be planned field trips to locations outcrop soils containing findings and
describing stratigraphic outcrop of land ranging from the oldest to the youngest layer. This package must be
supported by a reliable guide to explain the history of geology Sangiran well. Target eventually expected to show
Mueum Sangiran useful educational cultural treat for visitors to the museum community. Gradually each
community will be formed a positive attitude towards the preservation of the national culture.
(8) Required ongoing coordination and collaboration with all stakeholders of the central government,
provincial governments, district/municipal, private, universities/academics, NGOs, and the whole community in
the development of the Sangiran.
References
Baridwan, Z. (2004). Intermediate accounting. Yogyakarta: BPFE. Budiman, A. (2004). Third world development theory. Jakarta: Gramedia. Chambers, R. (1995). Rural development: From rear. Jakarta: LP3ES. Djajadiningrat, S. T., & Melia, F. (2004). Environmental industrial zone (Eco industrial park). Bandung: Engineering Science. Djuhari, M. (1998). Shadow of classical economics. Jakarta: Directorate General of Higher Education. Dycman, D. D. (2002). Intermediate accounting. Jakarta: Erlangga. Etzioni, A. (1999). Comparative analysis of complex organizations. USA: The Free Press of Glencoe, Inc.. Ferdiand, A. (2000). Structural equation modeling in management research, Semarang: BP. UNDIP. Foy, N. (1994). Empowering people at work. London: Grower Publishing Company. Friedman, J. (1992). Empowerment the polities of alternative development. USA: Blackwell Publishers, Cambridge. Hair, J. F., Anderson, R. E., & Tatham, R. L. (1998). Multivariate data analysis. New Jersey, N.J.: Prentice Hall. Hampton, M. P. (2005). Heritage, local communities and economic development. Annuals of Tourism Research, 32(3), 735-759. IAI. (2004). Financial accounting standards. Jakarta: Four Salemba. Ife, J. W. (1995). Community development: Creating community alternatives-vision, analysis and practice. Melbourne: Longman. Kieso, D. E., Weygandt, J. J., & Terry, D. W. (2002). Intermediate accounting. Jakarta: Erlangga Publishing. Makmun. (2004). Effect of availability of employment and the formation of the value added investment in the manufacturing sector:
A case study in Batam. Study of Economy and Finance, 8(1), 19-31.

ACCELERATION FACTORS IN THE IMPROVEMENT OF PUBLIC WELFARE SANGIRAN 33
Nicholson, W. (1992). Microeconomics theory. New York: The Dryden. Permana, C. D. (2009). The role and impact analysis of infrastructure investment on Indonesian economy. Bogor: IPB Press. Samuelson, P. A., & Nordhaus, W. D. (2004). Macroeconomic sciences. Jakarta: PT. Global Media Education. Sen, A. (2002). Development as freedom. Oxford: Oxford University Press. Soemardjan, S. (1997). Poverty: A view of sociology. Jakarta: ISI Publisher. Swasono, S. E. (2004). Economic system and economic democracy. Jakarta: UI Press. Syafri, S. H. (2002). Critical analysis of financial statements. Jakarta: PT. King Grafindo Perkasa. Tambunan, T. (2001). Indonesia’s economic transformation: Theory and empirical discovery. Jakarta: Indonesia Ghalia. Tohar, M. (2000). Capital and credit cooperatives. Yogyakarta: Kanisius. World Bank. (2007). Indonesia public expenditure chapter 5 infrastructure. Retrieved November 22, 2009 from
http://siteresources.worldbank.org/INTINDONESIA/Resources/2262711168333550999/PERFBAB5-Infrastruktur.pdf

Chinese Business Review, ISSN 1537-1506 January 2013, Vol. 12, No. 1, 34-40
New Keynesian Model and Inflation Prediction*
Yutaka Kurihara
Aichi University, Nagoya, Japan
Recently, much dispute has occurred about the validity of the New Keynesian model from both theoretical and
empirical views. However, a few studies have analyzed this model from the empirical perspective. Few other
studies have analyzed this model directly or nearly directly. This article empirically examines the New Keynesian
model focusing on inflation forecast. Generalized method of moments (GMM) is used to examine whether the
typical Keynesian model with Taylor rule is empirically appropriate for the US, UK, Euro area, and Japan. The
results showed: (1) the New Keynesian model fits well in most cases and explains the real economy well. Taylor
rule also fits well for most cases; (2) Rational expectations for inflation rates may not be useful based on this model.
When AR (1) (time series analysis) model is used to capture inflation expectations instead of one-time ahead real
values, the model fits well. With measured expectations, the relative weight of the forward-looking terms increase
on the cost of lagged inflation and output terms, even up to the point at which the lagged inflation terms are no
longer needed to rescue the new Keynesian model; and (3) Forward-looking variables play more important roles
than backward-looking ones in economic activity. Results with expectations with forward-looking terms perform
better in general. This New Keynesian model may reduce the importance of lagged output in some cases.
Keywords: expectation, forward-looking, inflation, New Keynesian, output, Taylor rule
Introduction
Recently, much dispute has been occurring about the validity of the New Keynesian model not only from the
theoretical perspective but from empirically one. However, a few studies have analyzed this model from the
empirical perspective (Gnos & Rochon, 2007). Hall, Hondroiannis, and Tavlas (2009) employed a hybrid open
economy model to demonstrate that the United States, United Kingdom, and Canada enjoy less inertia in price
setting than the G7, and showed that models that add lagged inflation and supply shock variables are spurious and
miss-specified. Chortareas, Magonis, and Panagiotidis (2012) showed that a pure New Keynesian Phillips curve
model accurately captured inflation dynamics at high inflation quantities. Fabio (2012) showed that the
conventional estimates co-found two distinct effects on output: “surprise” shocks and “news” on policy shocks.
Laurence (2012) employed a revised New Keynesian Phillips curve allowing for entry of firms and increasing
competitive pressures with the number of firms. Few other studies, however, have analyzed this model directly or
nearly directly.
* This work is supported by KAKENHI, Japan.
Yutaka Kurihara, Professor, Department of Economics, Aichi University. Correspondence concerning this article should be addressed to Yutaka Kurihara, Aichi University, 4-60-6 Hiraike Nakamura
Nagoya 4538777, Japan. E-mail: [email protected].
DAVID PUBLISHING
D
NEW KEYNESIAN MODEL AND INFLATION PREDICTION 35
Macroeconomists have understood that inflation expectations are an important determinant of inflation. The
rational expectation hypothesis states that economic agents’ predictions of the future value of relevant variables
(e.g., inflation) are not systematically wrong in that all errors are random. This rational expectations assumption
is used in many macroeconomic models. Wallusch (2012) showed that average price change probability by the
Calvo pricing mechanism was bigger than suggested by the Keynesian Phillips curve literature.
For the inflation expectation, many methods have been employed for empirical analyses. Its importance has
recently been the topic of much discussion. For example, Sweidan (2011) proved that the effect of a central bank’s
inability is larger relative to inflation expectations than the influence of targeted inflation rates. Not only
macroeconomic models but also time series analyses are used for inflation forecasting. Recently, Kortelainen,
Paloviita, and Viren (2011) used survey-measured expectations for a consensus forecasting. Zhang, Osborne, and
Kim (2010) compared the Generalized Method of Moments (GMM) approach and the Survey of Professional
Forecasters’ data and showed that the output gap performs very poorly and that the survey data results made more
sense. Also, the results suggested that lagged inflation is more important to the point at which the coefficient of the
expected inflation is hardly significant. Scheufele (2010) found that a model that uses survey expectations
outperforms most other competing models. Frédo (2012) also found that survey forecasts improve estimations of the
Keynesian Phillips curve. Jean-Baptiste (2012) confirmed that, compared with other estimation methods, survey
forecasts improved estimates of the New Keynesian Phillips curve and forecasting performance of inflation.
Luca and Giulio (2011) adopted the New Keynesian Phillips curve in the Euro area and showed that the
forward-looking component of inflation expectations is much larger than the backward-looking component.
Antonio, Saten, and Bhaskara (2012) showed that backward-looking and forward-looking models are rejected
empirically. Emil and Helge (2012) showed that money-based New Keynesian Dynamic Stochastic General
Equilibrium (DSGE) models and Vector Autoregressions (VARs) incorporating money perform better than
their cashless counterparts. Born, Juessen, and Müller (2013) showed that government spending multipliers are
larger under fixed exchange rate regimes and that the New Keynesian model provides a satisfactory explanation
of the evidence.
Recent macroeconomic models are generally forward-looking, reflecting an increasing focus on what is
coming. There are some possibilities that the hypothesis implies explosions in real variables that are relevant to
economic conditions. This article considers the forward-looking model. Because the New Keynesian model
contains this variable, it is impossible to avoid this issue to analyze macro economy.
However, this poses additional difficult problems, namely, how to evaluate the data consistency of these
models. Since the 1980s, an obvious solution has been the GMM estimator, which basically utilizes the
orthogonality conditions of the rational expectations hypothesis. The difference-GMM estimator employs
suitable lagged values of the first differences of all endogenous variables as their instruments. GMM is a robust
estimator in that, unlike maximum likelihood estimation, GMM does not require information about the exact
distribution of the disturbances.
On the other hand, GMM estimates have not been completely satisfactory. Limiting their research to the
New Keynesian Model, Bjornland and Leitemo (2011) examined this model by using the Bayesian and
Kalman-Filter methods. The purely forward-looking models have been so unsatisfactory that they have been
replaced by a hybrid specification in which lagged inflation or output terms have been introduced in a more or

NEW KEYNESIAN MODEL AND INFLATION PREDICTION 36
less ad hoc way. Also, Lanne and Luoto (2013) estimated the New Keynesian model with quarterly U.S. data
avoiding the GMM, and both expected future inflation and lagged inflation were found important in
determining the inflation rate. Moreover, inflation persistence turned out to be intrinsic.
Although the New Keynesian models provide a theory of endogenous money with exogenous interest rates,
these models provide no description of a central bank reaction function (Claude & Philippe, 2007). This paper
examines whether or not the fit of the New Keynesian Model with an assumption of a forward-looking Taylor
rule, is good. Lubik and Marzo (2007) showed that when the monetary authority targets output and smoothes
interest rates, determinacy is obtained from a wide range of policy parameters. Ramon and Jesus (2008) showed
that a generalized version that includes habit formation and a forward-looking Taylor rule can mimic the weak
comovement of medium and long-term forecast horizons. Paradiso and Kumar (2013) showed that traditional
backward looking and forward looking models are overwhelmingly rejected, however, its evidence supported
the extended backward looking model using quadratic trend as output being relevant for monetary policy
analysis. However, there has been little empirical study on this issue. Empirical analyses of the New Keynesian
model that include these points have not been performed. Finally, Pontiggia (2012) showed that when the
traditional New Keynesian model is extended to allow for rule-of-thumb behavior by price setters, the
optimality of zero long-run inflation stops, and the monetary authority conducts a positive inflation target.
This article is structured as follows. Section two shows the theoretical model for the empirical analyses.
Section three demonstrates the methods of empirical analyses and data employed here. Section four shows the
results and the additional analysis is performed. Finally this paper ends with a brief summary.
Theoretical Model
The model employed here is the following New Keynesian model, which consists of the following three
equations:
IS curve:
1 1 1 1 2 1 1(1 ) ( )t t t t tgap a gap a gap a it E p (1)
Phillips curve:
1 1 1 1 2 2(1 )t t t t t tp b p b E p b gap (2)
Taylor rule:
0 1 2 3t t t ti c c p c gap (3)
where the gap is the output gap (deviation of (log) output y from the equilibrium output (y* level)), i is the
nominal interest rate, Δp is the rate of inflation; ε1 is a demand shock, ε2 is a supply shock, and ε3 is a monetary
policy shock. E denotes the mathematical expectations operator.
The Taylor rule may also be estimated in a form such that actual inflation Δp is replaced by the expected
inflation EtΔpt+1. This article employs both cases.
Empirical Method and Data
The estimation methods are GMM and LS (least squared). The GMM estimator proposed by Arellano and
Bond (1991) provides consistent estimates for such models. The difference-GMM estimator uses suitable lagged
values of the first differences of all endogenous variables as their instruments. It is assumed that current inflation,
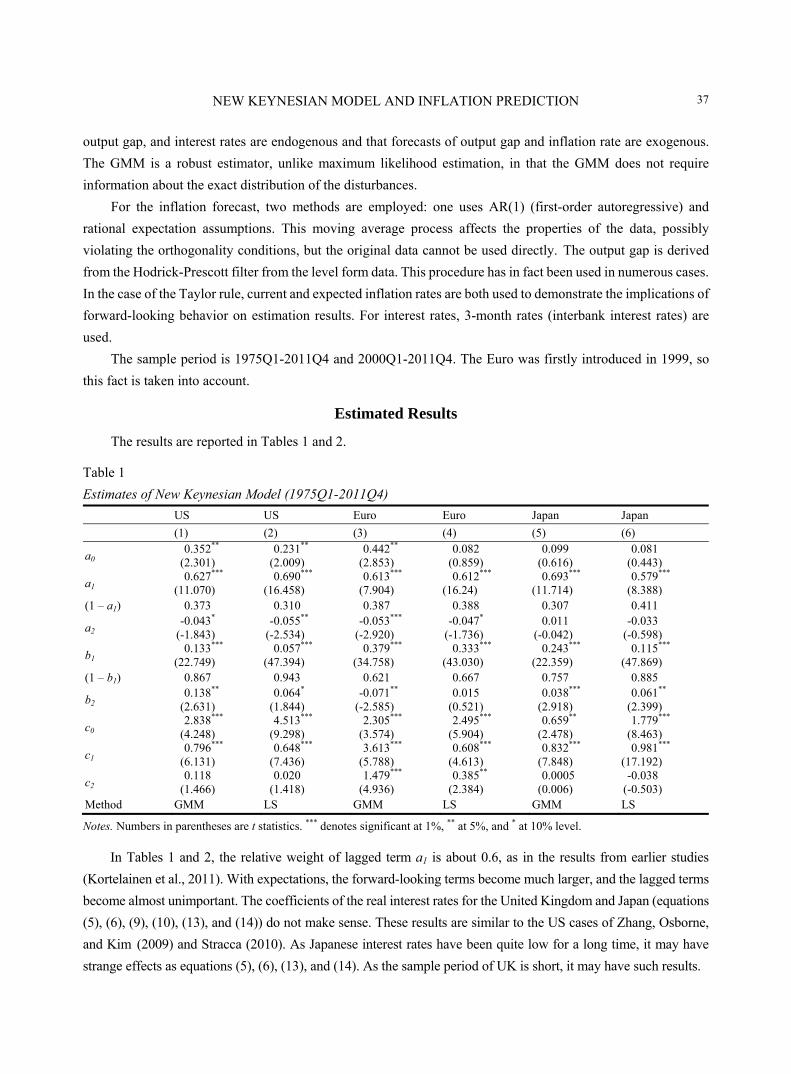
NEW KEYNESIAN MODEL AND INFLATION PREDICTION 37
output gap, and interest rates are endogenous and that forecasts of output gap and inflation rate are exogenous.
The GMM is a robust estimator, unlike maximum likelihood estimation, in that the GMM does not require
information about the exact distribution of the disturbances.
For the inflation forecast, two methods are employed: one uses AR(1) (first-order autoregressive) and
rational expectation assumptions. This moving average process affects the properties of the data, possibly
violating the orthogonality conditions, but the original data cannot be used directly. The output gap is derived
from the Hodrick-Prescott filter from the level form data. This procedure has in fact been used in numerous cases.
In the case of the Taylor rule, current and expected inflation rates are both used to demonstrate the implications of
forward-looking behavior on estimation results. For interest rates, 3-month rates (interbank interest rates) are
used.
The sample period is 1975Q1-2011Q4 and 2000Q1-2011Q4. The Euro was firstly introduced in 1999, so
this fact is taken into account.
Estimated Results
The results are reported in Tables 1 and 2.
Table 1
Estimates of New Keynesian Model (1975Q1-2011Q4)
US US Euro Euro Japan Japan
(1) (2) (3) (4) (5) (6)
a0 0.352**
(2.301) 0.231**
(2.009) 0.442**
(2.853) 0.082
(0.859) 0.099
(0.616) 0.081
(0.443)
a1 0.627***
(11.070) 0.690***
(16.458) 0.613***
(7.904) 0.612***
(16.24) 0.693***
(11.714) 0.579***
(8.388) (1 – a1) 0.373 0.310 0.387 0.388 0.307 0.411
a2 -0.043*
(-1.843) -0.055**
(-2.534) -0.053***
(-2.920) -0.047*
(-1.736) 0.011
(-0.042) -0.033
(-0.598)
b1 0.133***
(22.749) 0.057***
(47.394) 0.379***
(34.758) 0.333***
(43.030) 0.243***
(22.359) 0.115***
(47.869) (1 – b1) 0.867 0.943 0.621 0.667 0.757 0.885
b2 0.138**
(2.631) 0.064*
(1.844) -0.071**
(-2.585) 0.015
(0.521) 0.038***
(2.918) 0.061**
(2.399)
c0 2.838***
(4.248) 4.513***
(9.298) 2.305***
(3.574) 2.495***
(5.904) 0.659**
(2.478) 1.779***
(8.463)
c1 0.796***
(6.131) 0.648***
(7.436) 3.613***
(5.788) 0.608***
(4.613) 0.832***
(7.848) 0.981***
(17.192)
c2 0.118
(1.466) 0.020
(1.418) 1.479***
(4.936) 0.385**
(2.384) 0.0005
(0.006) -0.038
(-0.503) Method GMM LS GMM LS GMM LS
Notes. Numbers in parentheses are t statistics. *** denotes significant at 1%, ** at 5%, and * at 10% level.
In Tables 1 and 2, the relative weight of lagged term a1 is about 0.6, as in the results from earlier studies
(Kortelainen et al., 2011). With expectations, the forward-looking terms become much larger, and the lagged terms
become almost unimportant. The coefficients of the real interest rates for the United Kingdom and Japan (equations
(5), (6), (9), (10), (13), and (14)) do not make sense. These results are similar to the US cases of Zhang, Osborne,
and Kim (2009) and Stracca (2010). As Japanese interest rates have been quite low for a long time, it may have
strange effects as equations (5), (6), (13), and (14). As the sample period of UK is short, it may have such results.

NEW KEYNESIAN MODEL AND INFLATION PREDICTION 38
Table 2
Estimates of New Keynesian Model (2000Q1-2011Q4)
US US UK UK Euro Euro Japan Japan
(7) (8) (9) (10) (11) (12) (13) (14)
a0 0.128***
(4.128) 0.695
(1.264) 0.195*
(1.840) 0.054
(0.405) 0.537**
(2.590) 0.058
(0.359) 2.518*
(1.871) -0.504
(-0.458)
a1 0.572
(1.309) 0.625***
(12.980) 0.595***
(14.363) 0.691***
(10.448) 0.738***
(9.397) 0.778***
(10.600) 0.655***
(10.850) 0.661***
(7.517) (1 – a1) 0.428 0.375 0.405 0.309 0.262 0.222 0.345 0.339
a2 -0.361**
(-2.225) -0.156**
(-1.980) -0.089
(-0.892) -0.038
(-0.055) -0.328**
(-1.985) -0.179
(-0.012) 2.524
(1.174) 0.878
(0.557)
b1 0.869***
(17.325) 0.775***
(36.374) 0.814***
(18.378) 0.999***
(25.170) 0.986***
(15.607) 0.909***
(17.482) 0.501***
(5.136) 0.806***
(9.020) (1 – b1) 0.131 0.225 0.186 0.001 0.014 0.091 0.499 0.194
b2 -0.035
(-0.475) 0.236**
(2.466) 0.097**
(3.176) 0.010
(0.333) -0.131
(-1.434) 0.109*
(1.820) -0.125*
(-1.893) -0.013
(-0.193)
c0 5.744***
(6.853) 1.425***
(3.357) 3.622**
(2.736) 4.528***
(7.212) 2.927***
(5.457) 0.836*
(1.807) 0.050
(1.520) 7.672***
(7.024)
c1 0.376*
(1.858) 1.068***
(6.836) 0.145
(0.724) -0.850**
(-2.880) 0.167
(0.643) 0.968***
(4.434) 0.017
(0.270) 0.119***
(9.284)
c2 0.482**
(2.339) -0.158
(-1.281) -1.145***
(-4.137) 0.450**
(2.868) 0.508***
(4.030) 0.033
(0.348) -0.001
(-0.815) 0.023
(0.302) Method GMM LS GMM LS GMM LS GMM LS
Notes. Numbers in parentheses are t statistics. *** denotes significant at 1%, ** at 5%, and * at 10% level.
Zhang et al. (2009) showed that prices are more rigid in Europe and that the interest rate sensitivity of the IS
curve in Europe (recent period as in Table 2) is more pronounced, which may indicate that the interest rate
channel is more important. The results here show such situations as equations (3), (4), (11), and (12).
For the Taylor rule, the fit is pretty good for most cases except for the United Kingdom (equations (9) and
(10)). Monetary authorities react to inflation but only weakly react to the output gap as Cem (2012).
The important results are forward-looking terms. Instead of AR(1), data derived from using assumptions of
rational expectations are analyzed. The results are as show in Table 3.
Table 3
Estimates of New Keynesian Model in the Case of Rational Expectations (2000Q1-2011Q4)
US US UK UK Euro Euro Japan Japan
(1) (2) (3) (4) (5) (6) (7) (8)
c1 -0.311
(-0.560) -0.190
(-0.377) 0.373
(1.325) -0.814**
(-2.558) 0.324
(0.448) 0.771
(1.023) 0.034
(0.154) 0.099
(1.204)
Notes. Numbers in parentheses are t statistics. ** denotes significant at 5%.
Almost all of the variables except equation (4) are not significant compared with the cases of AR(1). The
variables do not show effective explanation variables.
Conclusions
Estimation results make sense for the Euro area and for the United States. Results with expectations with
forward-looking terms perform better.
Results with AR(1) inflation expectations instead of rational expectations perform better, but the most

NEW KEYNESIAN MODEL AND INFLATION PREDICTION 39
important observation deals with the role of forward-looking terms in the model. With measured expectations,
the relative weight of the forward-looking terms increase on the cost of lagged inflation and output terms, even up
to the point at which the lagged inflation terms are no longer needed to rescue the new Keynesian model with
additional elements.
Further research is needed. Mazumder (2011) casted doubt on the empirical viability of the New Keynesian
Phillips curve model. The empirical evidence on this is far from conclusive. For example, the marginal cost
DSGE model estimation would be interesting. Also, it would be interesting to compare other models. It would be
necessary to divide the time period (Liu & Jansen, 2011; Oliver & Yuriy, 2011). For the cases of the EU area,
some time is needed to analyze this situation in greater depth.
References
Antonio, P., Saten, K., & Bhaskara, R. B. (2012). A new Keynesian IS curve for Australia: Is it forward looking or backward looking? MPRA, 9, 1-22.
Arellano, M., & Bond, S. (1991). Some tests of specification for panel data: Monte Carlo evidence and an application to employment equations. Review of Economic Studies, 58(2), 277-297.
Bjornland, H., & Leitemo, K. (2011). Estimating the natural rates in a simple new Keynesian framework. Empirical Economics, 40(3), 755-777.
Born, B., Juessen, F., & Müller, G. J. (2013). Exchange rate regimes and fiscal multipliers. Journal of Economic Dynamics & Control, 37(2), 446-465.
Cem, C. (2012). The interaction between monetary and fiscal policies in Turkey: An estimated new Keynesian DSGE model. Economic Modelling, 29(4), 1258-1267.
Chortareas, G., Magonis, G., & Panagiotidis, T. (2012). The asymmetry of the new Keynesian Phillips curve in the Euro-area. Economics Letters, 114(2), 161-164.
Claude, G., & Philippe, R. (2007). The new consensus and post-Keynesian interest rate policy. Review of Political Economy, 19(3), 369-386.
Emil, S., & Helge, B. (2012). The information content of money in forecasting Euro area inflation. Applied Economics, 44(1), 4055-4057.
Fabio, M. (2012). Has has globalization transformed U.S. macroeconomic dynamics? Macroeconomic Dynamics, 16(2), 204-229. Frédo, J. B. (2012). Forecasting with the new Keynesian Phillips curve: Evidence from survey data. Economics Letters, 117(3),
811-813. Gnos, C., & Rochon, L. (2007). Monetary policy and financial stability: A post-Keynesian agenda. UK: Edward Elgar. Hall, S., Hondroiannis, D., & Tavlas, S. (2009). Bretton-Woods systems, old and new, and the rotation of exchange-rates regimes.
Discussion Paper in Economics 09/15. Jean-Baptiste, F. (2012). Forecasting with the new Keynesian Phillips curve: Evidence from survey data. Economics Letters,
117(3), 811-813. Kortelainen, M., Paloviita, M., & Viren, M. (2011). Observed inflation forecasts and the new Keynesian macro model. Economics
Letters, 112(1), 88-90. Lanne, M., & Luoto, J. (2013). Autoregression-based estimation of the new Keynesian Phillips curve. Journal of Economic
Dynamics & Control, 37(3), 561-570. Laurence, B. (2012). Product market regulation, trend inflation and inflation dynamics in the new Keynesian Phillips curve.
Economic Modelling, 29(5), 2058. Liu, D., & Jansen, D. (2011). Does a factor Phillips Curve help? An evaluation of the predictive power for U.S. inflation. Empirical
Economics, 40(3), 807-826. Lubik, T., & Marzo, A. (2007). An inventory of simple monetary policy rules in a new Keynesian macroeconomic models.
International Review of Economics and Finance, 16(1), 25-46. Luca, F., & Giulio, P. (2011). Simulation based tests of forward-looking models under UAR learning dynamics. Journal of Applied
Econometrics, 26(5), 762-775.

NEW KEYNESIAN MODEL AND INFLATION PREDICTION 40
Mazumder, S. (2011). The empirical validity of the new Keynesian Phillips curve using survey forecasts of inflation. Economic Modelling, 28(6), 2439-2452.
Oliver, C., & Yuriy, G. (2011). Monetary policy, trend inflation, and the great moderation: An alternative interpretation. The American Economic Review, 101(1), 341-370.
Paradiso, A., & Kumar, S. (2013). A new Keynesian IS curve for Australia: Is it forward looking or backward looking? Applied Economics, 45(26), 3691-3700.
Pontiggia, D. (2012). Optimal long-run inflation and the new Keynesian model. Journal of Macroeconomics, 34(4), 1077-1094. Ramon, M. D., & Jesus, V. (2008). The new Keynesian monetary model: Does it show the comovement between GDP and inflation
in the U.S. Journal of Economic Dynamics and Control, 32(5), 1466-1480. Scheufele, R. (2010). Are qualitative inflation expectations useful to predict inflation? Journal of Business Cycle Measurement and
Analyses, 1(1), 29-53. Stracca, L. (2010). Is the new Keynesian IS curve structural? (pp. 1-45). ECB Working Paper Series No. 1236. Sweidan, O. (2010). Central bank losses: Causes and consequences. Asian-Pacific Economic Literature, 25(1), 29-42. Wallusch, J. (2012). How frequently do consumer prices change in transition countries. Applied Economics Letters, 19(10),
921-923. Zhang, C., Osborne, D., & Kim, D. (2009). Observed inflation and the new Keynesian Phillips curve. Oxford Bulletin of Economics
and Statistics, 71(3), 375-398.

Chinese Business Review, ISSN 1537-1506 January 2013, Vol. 12, No. 1, 41-47
Chinese Patent—A Tentative Explanation
of Various Strategies of Patenting
Dou Henri Atelis, Strategic Intelligence Workroom, France Business School (FBS), Tours, France
Dou Jean-Marie Jr Chamber of Commerce and Industry CCIMP, Marseille, France
The recent increase in patent granted in China prompts for an analysis of the various strategies which are certainly
developed by Chinese applicants in that field. An analysis (APA Automatic Patent Analysis) has been done in
several fields which have different impacts on the Chinese economy. We chose four different subjects: solar panels;
photovoltaic panels; fireworks; and honeysuckle. These areas go from deep international concern to only Chinese
interest. We analyzed in the different ratios between Chinese priority patents, Chinese patents extended to other
countries, Patent extended from other countries to China and Chinese utility models. The results show clearly that
various directions are followed depending on the economic importance of the field and also the pressure of the
competition inside and outside China. In this context the strategic dependence (number of patents extended to
China by other countries) was examined for each of the fields. We also show that in the domain where the man
power is important such as fireworks the number of utility models is important. This suggests that utility models are
used to spread in that field minor innovations. In the fields such as honeysuckle many applicants are the same that
the inventors and the involvement of universities larger than in other fields. These two fields more or less centered
on Chinese domestic aspects only a few patents (not for Honeysuckle) are extended to other countries. The impact
of foreign patents in these two fields is quasi nil. In other domains such as photovoltaic panel the triadic patents
(extension to US JP EP) are examined its show that if some Chinese patents are extended to other countries there
are also an important numbers of foreign patents extended to China. This also suggests that in these most critical
subjects, China develops a sort of technological protection barrier from domestic patents. This underlines a strategy
on attack and defense in that field.
Keywords: automatic patent analysis, fireworks, honeysuckle, solar panel, China, strategic dependence
Material and Method
The increasing number of patents granted in China prompts us to make an analysis of the patents granted in various subjects to see if there is a possible way out of this analysis to underline a Chinese management policy in
Dou Henri, University Professor, Atelis, Strategic Intelligence Workroom, France Business School (FBS). Dou Jean-Marie Jr, Ph.D., Project Manager, Chamber of Commerce and Industry CCIMP. Correspondence concerning this article should be addressed to Dou Henri, Atelis, France Business School, 1 rue Léo Delibes,
37205, Tours Cedex France. E-mail: [email protected].
DAVID PUBLISHING
D

A TENTATIVE EXPLANATION OF VARIOUS STRATEGIES OF PATENTING 42
Intellectual Property Management (IPM). The trend in patents granted in the world and in China is presented in Table 1.
Table 1 Number of patents filled in the world (Tribune, 2010) Application year Office 2008 2009 2010 Share of total (%): 2010 Growth (%): 2009-2010 Total 1,915,000 1,846,000 1,979,000 100.0 7.2 United States of America 456,321 456,106 490,226 24.8 24.3 China 289,838 314,604 391,177 19.8 7.5 Japan 391,002 348,596 344,598 17.4 -1.1 Republic of Korea 170,632 163,523 170,101 8.6 4.0 European Patent Office 146,150 134,580 150,961 7.6 12.2 Germany 62,417 59,583 59,245 3.0 -0.6 Russian Federation 41,849 38,564 42,500 2.1 10.2 Canada 42,089 37,477 35,449 1.8 -5.4 India* 36,812 34,287 - 1.9 -6.9 Australia 26,346 23,681 24,887 1.3 5.1 Brazil 22,917 21,944 22,686 1.1 3.4 United Kingdom 23,379 22,465 21,929 1.1 -2.4 France 16,419 15,693 16,580 0.8 5.7 Mexico 16,581 14,281 14,576 0.7 2.1 China, HongKong SAR 13,662 11,857 11,702 0.6 -1.3 Others 125,586 148,759 182,383 9.2 22.6 Notes. Application numbers are a sum of direct filings and PCT national phase entries received by offices. * Share of total applications is based on 2009 total and growth is based on 2008-2009 figures; “-” not available.
To perform the various analysis we used the Matheo-Patent software (Matheo Software, 2013) facilities to query the patent database (World Patent Database from the EPO (European Patent Office), OPS VI). This database gives an access to all patents including Chinese patents. The Matheo-Patent resident software allows to query the database and to update the results if necessary. From the local database thus created various bibliometric analysis can be performed (Dou et al., 2005). Mostly they will answer to the questions: who is doing what, with whom, when, how? We took four subjects: the solar panels; the photovoltaic panels; the fireworks; and the honeysuckle. These four subjects give rise to four local databases which were analyzed to show: the number of patents with a Chinese priority versus the global number of patents and versus to foreign patents. The same was done for the extended Chinese patents (there is a delay of 12 months which allows you to extend a patent to another country). We also analyze the number of utility models versus the global number of Chinese patents. The utility models are what is called petty patents, that is to say a system which give a lighter protection that the genuine patents (protection span 10 years in China instead of 20, lower cost, and easy examination) (WIPO 2012). A patent with a Chinese priority means that the first patent granted to protect this invention as been granted in China (PR = CN). The patent numbers dealing with China concern all Chinese priority patents plus patents from other countries extended to China (PN = CN).
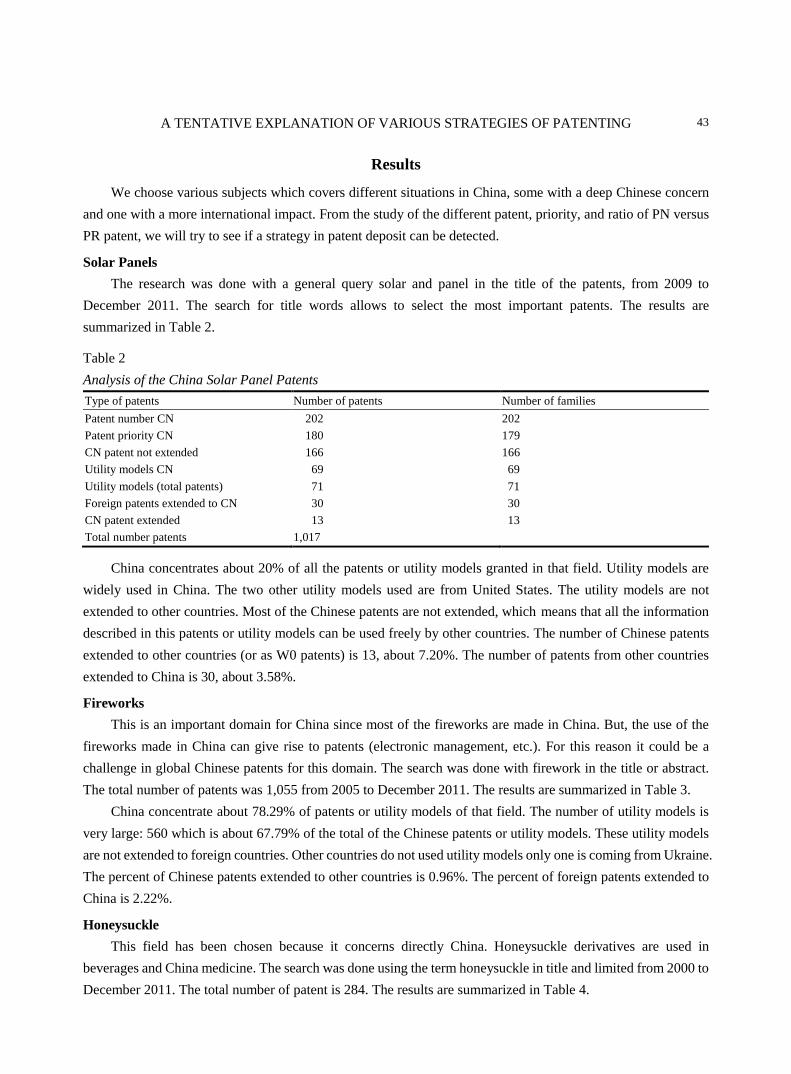
A TENTATIVE EXPLANATION OF VARIOUS STRATEGIES OF PATENTING 43
Results
We choose various subjects which covers different situations in China, some with a deep Chinese concern and one with a more international impact. From the study of the different patent, priority, and ratio of PN versus PR patent, we will try to see if a strategy in patent deposit can be detected.
Solar Panels The research was done with a general query solar and panel in the title of the patents, from 2009 to
December 2011. The search for title words allows to select the most important patents. The results are summarized in Table 2.
Table 2 Analysis of the China Solar Panel Patents Type of patents Number of patents Number of families Patent number CN 202 202 Patent priority CN 180 179 CN patent not extended 166 166 Utility models CN 69 69 Utility models (total patents) 71 71 Foreign patents extended to CN 30 30 CN patent extended 13 13 Total number patents 1,017
China concentrates about 20% of all the patents or utility models granted in that field. Utility models are widely used in China. The two other utility models used are from United States. The utility models are not extended to other countries. Most of the Chinese patents are not extended, which means that all the information described in this patents or utility models can be used freely by other countries. The number of Chinese patents extended to other countries (or as W0 patents) is 13, about 7.20%. The number of patents from other countries extended to China is 30, about 3.58%.
Fireworks This is an important domain for China since most of the fireworks are made in China. But, the use of the
fireworks made in China can give rise to patents (electronic management, etc.). For this reason it could be a challenge in global Chinese patents for this domain. The search was done with firework in the title or abstract. The total number of patents was 1,055 from 2005 to December 2011. The results are summarized in Table 3.
China concentrate about 78.29% of patents or utility models of that field. The number of utility models is very large: 560 which is about 67.79% of the total of the Chinese patents or utility models. These utility models are not extended to foreign countries. Other countries do not used utility models only one is coming from Ukraine. The percent of Chinese patents extended to other countries is 0.96%. The percent of foreign patents extended to China is 2.22%.
Honeysuckle This field has been chosen because it concerns directly China. Honeysuckle derivatives are used in
beverages and China medicine. The search was done using the term honeysuckle in title and limited from 2000 to December 2011. The total number of patent is 284. The results are summarized in Table 4.

A TENTATIVE EXPLANATION OF VARIOUS STRATEGIES OF PATENTING 44
Table 3 Analysis of the Chinese Fireworks Patents Type of patents Number of patents Number of families Patent number CN 831 821 Patent priority CN 826 826 CN patent not extended 818 818 Utility models CN 560 560 Utility models (total patents) 561 561 Foreign patents extended CN 5 5 CN patent extended 8 8 Total number patents 1,055
Table 4 Analysis of the Chinese Honeysuckle Patents Type of patents Number of patents Number of families Patent number CN 217 217 Patent priority CN 217 217 CN patent not extended 217 217 Utility models CN 10 10 Utility models (total patents) 10 10 Foreign patents extended CN 0 0 CN patent extended 0 0 Total number patents 284 284
Chinese patents represent about 76.40% of the field. The utility models represent 4.60% of the total of the Chinese patents and utility models. There are no Chinese patents extended to foreign countries neither foreign patent extended to China.
Solar Photovoltaic Panels This subjects was choose to show the difference in strategy when a subject is directly link to the Chinese
economy and export. The search was done by using the International Patent Classification (IPC) (IPC, 2013). We used the IPC:
H01L 31/042 were H01L = Semiconductor Devices; Electric Solid State Devices and 31/042 including a panel or array of photoelectric cells, e.g., solar cells.
The search was limited to the year 2012 for the purpose of the example. The total patents retrieves is 907. The results are summarized in Table 5.
The patents with Chinese priority represent about 4.11% of the total patents. There is no utility model. The foreign patents extended to China increases about 7.70% of the amount of foreign patents. The ratio of extended Chinese patents being 7.05%.
The number of patents extended by other countries to China indicates a certain degree of dependence of China versus these patents: this is the concept of strategic dependence which is not the subject of this paper, but which has been detailed recently (Dou et al., 2011).
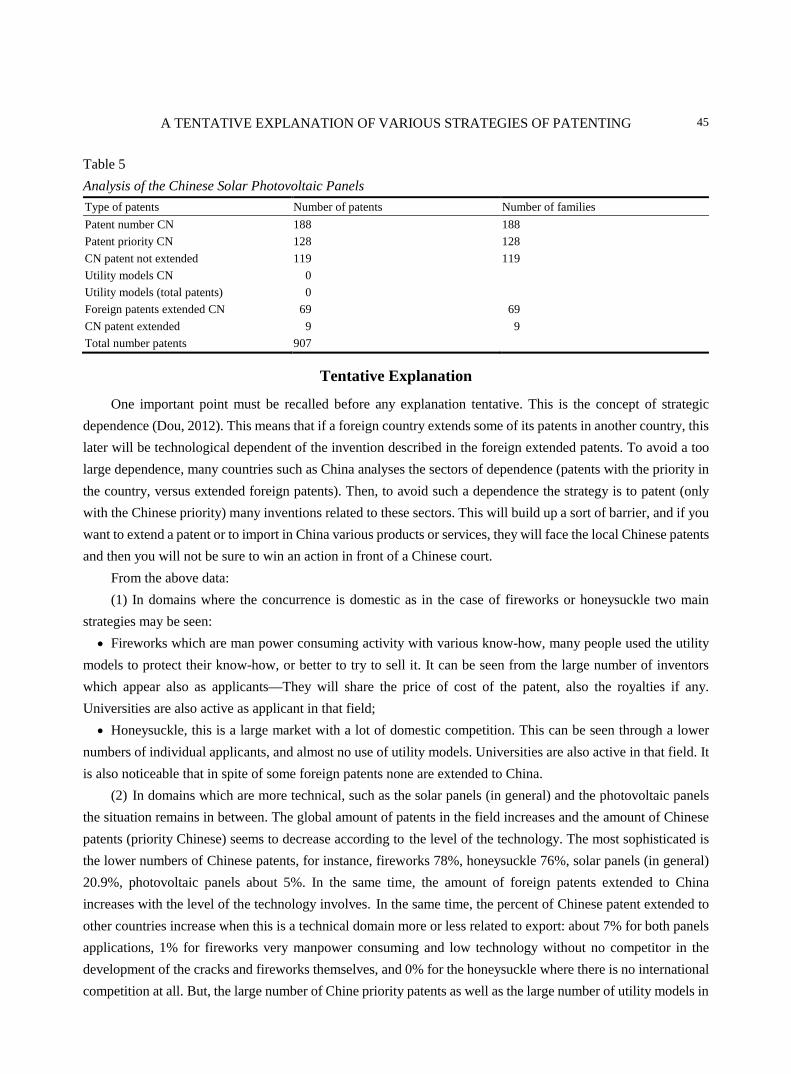
A TENTATIVE EXPLANATION OF VARIOUS STRATEGIES OF PATENTING 45
Table 5 Analysis of the Chinese Solar Photovoltaic Panels Type of patents Number of patents Number of families Patent number CN 188 188 Patent priority CN 128 128 CN patent not extended 119 119 Utility models CN 0 Utility models (total patents) 0 Foreign patents extended CN 69 69 CN patent extended 9 9 Total number patents 907
Tentative Explanation
One important point must be recalled before any explanation tentative. This is the concept of strategic dependence (Dou, 2012). This means that if a foreign country extends some of its patents in another country, this later will be technological dependent of the invention described in the foreign extended patents. To avoid a too large dependence, many countries such as China analyses the sectors of dependence (patents with the priority in the country, versus extended foreign patents). Then, to avoid such a dependence the strategy is to patent (only with the Chinese priority) many inventions related to these sectors. This will build up a sort of barrier, and if you want to extend a patent or to import in China various products or services, they will face the local Chinese patents and then you will not be sure to win an action in front of a Chinese court.
From the above data: (1) In domains where the concurrence is domestic as in the case of fireworks or honeysuckle two main
strategies may be seen: • Fireworks which are man power consuming activity with various know-how, many people used the utility
models to protect their know-how, or better to try to sell it. It can be seen from the large number of inventors which appear also as applicants—They will share the price of cost of the patent, also the royalties if any. Universities are also active as applicant in that field;
• Honeysuckle, this is a large market with a lot of domestic competition. This can be seen through a lower numbers of individual applicants, and almost no use of utility models. Universities are also active in that field. It is also noticeable that in spite of some foreign patents none are extended to China.
(2) In domains which are more technical, such as the solar panels (in general) and the photovoltaic panels the situation remains in between. The global amount of patents in the field increases and the amount of Chinese patents (priority Chinese) seems to decrease according to the level of the technology. The most sophisticated is the lower numbers of Chinese patents, for instance, fireworks 78%, honeysuckle 76%, solar panels (in general) 20.9%, photovoltaic panels about 5%. In the same time, the amount of foreign patents extended to China increases with the level of the technology involves. In the same time, the percent of Chinese patent extended to other countries increase when this is a technical domain more or less related to export: about 7% for both panels applications, 1% for fireworks very manpower consuming and low technology without no competitor in the development of the cracks and fireworks themselves, and 0% for the honeysuckle where there is no international competition at all. But, the large number of Chine priority patents as well as the large number of utility models in
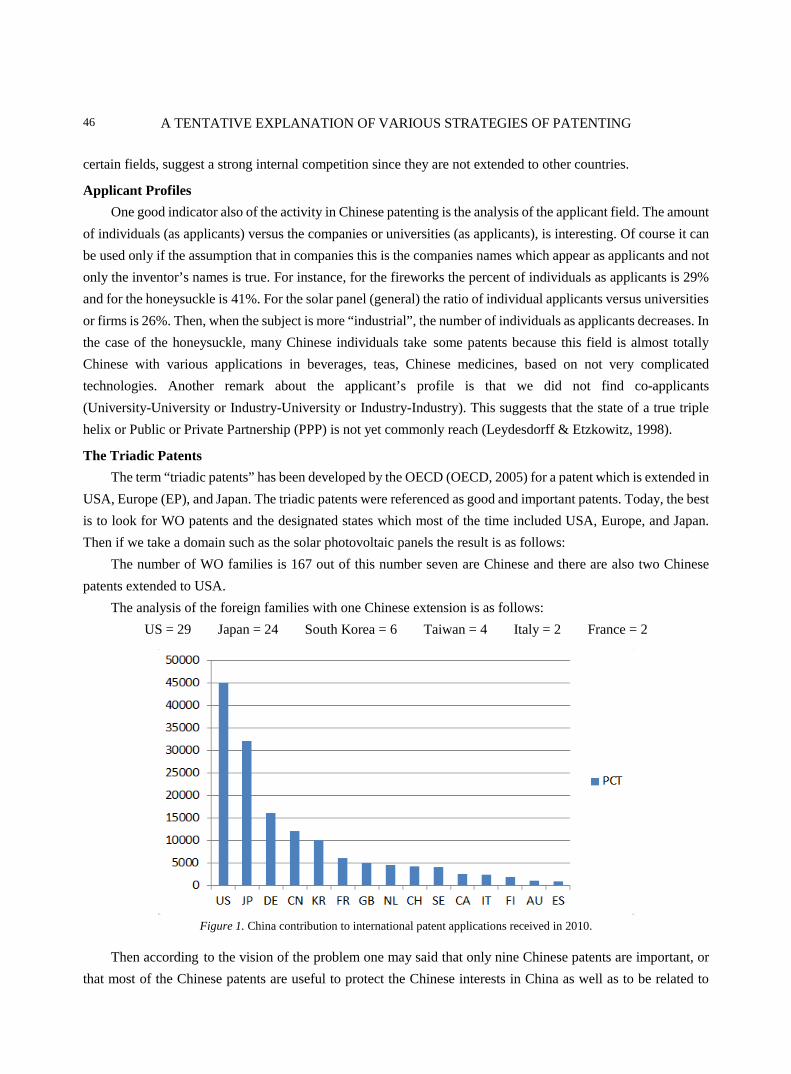
A TENTATIVE EXPLANATION OF VARIOUS STRATEGIES OF PATENTING 46
certain fields, suggest a strong internal competition since they are not extended to other countries.
Applicant Profiles One good indicator also of the activity in Chinese patenting is the analysis of the applicant field. The amount
of individuals (as applicants) versus the companies or universities (as applicants), is interesting. Of course it can be used only if the assumption that in companies this is the companies names which appear as applicants and not only the inventor’s names is true. For instance, for the fireworks the percent of individuals as applicants is 29% and for the honeysuckle is 41%. For the solar panel (general) the ratio of individual applicants versus universities or firms is 26%. Then, when the subject is more “industrial”, the number of individuals as applicants decreases. In the case of the honeysuckle, many Chinese individuals take some patents because this field is almost totally Chinese with various applications in beverages, teas, Chinese medicines, based on not very complicated technologies. Another remark about the applicant’s profile is that we did not find co-applicants (University-University or Industry-University or Industry-Industry). This suggests that the state of a true triple helix or Public or Private Partnership (PPP) is not yet commonly reach (Leydesdorff & Etzkowitz, 1998).
The Triadic Patents The term “triadic patents” has been developed by the OECD (OECD, 2005) for a patent which is extended in
USA, Europe (EP), and Japan. The triadic patents were referenced as good and important patents. Today, the best is to look for WO patents and the designated states which most of the time included USA, Europe, and Japan. Then if we take a domain such as the solar photovoltaic panels the result is as follows:
The number of WO families is 167 out of this number seven are Chinese and there are also two Chinese patents extended to USA.
The analysis of the foreign families with one Chinese extension is as follows: US = 29 Japan = 24 South Korea = 6 Taiwan = 4 Italy = 2 France = 2
Figure 1. China contribution to international patent applications received in 2010.
Then according to the vision of the problem one may said that only nine Chinese patents are important, or that most of the Chinese patents are useful to protect the Chinese interests in China as well as to be related to

A TENTATIVE EXPLANATION OF VARIOUS STRATEGIES OF PATENTING 47
domestic Chinese competition. Figure 1 indicates the amount of Patent Cooperative Treaty (PCT) from various countries in 2010. China becomes the fourth contributor (PEN, 2012).
Conclusions
It is clear that China will become the most important country in the field of intellectual property. But if we look to the strategy of the management of the intellectual property three aspects must be deducted from this study:
The Chinese Patents Extended Chinese patents extended to the world are mainly WO patents, some of them (but rarely extended only to US)
are not very large compared with the total number of patents with a Chinese priority but not extended.
The Chinese Patents Which Are not Extended They are the patent with only a Chinese priority (Priority China), these patents are reflecting of two strategies: One is to avoid the strategic dependence. This is the defense of the geographical territory of China. The
second one reflects the domestic competition and the use of patents as a vector of possible gains.
The Utility Models The utility models are not really patents. In this case they are related to a domestic competition, but more
certainly the idea to get some money out of them. For other countries outside China, the researchers and firms can use these not extended Chinese patents as a
good source of information and ideas which can be readily used. Nevertheless, the great effort made by China in the domain of the intellectual property is the evidence that China is leaving the copying mode or incremental innovation, to move to a true inventive mode (XIE et al., 2012), and then as people say go from “made in China” to the “made by China”. It is clear that the work on the strategic dependence must be completed by other analysis dealing with strategic area of development, for example, the biofuel, the biodiesel, and the nanotubes. This work is underway and the first result confirm globally the conclusion of the above research.
References Dou, H. (2012). Intelligence organisationnelle et des institutions. Veille Magazine, 131, 21-23. Dou, H., Dou, J. M. Jr., & Getachew, M. A. (2011). Automatic patent analysis—Technological strategic dependence. Beijing:
ICTCI. Dou, H., Leveillé, V., Manullang, S. D., & Dou, J. M. Jr. (2005). Patent analysis for competitive technical intelligence and
innovative thinking. Data Science Journal (DSJ), 4, 209-236. IPC. (2013). Cooperative patent classification, espacenet. Retrieved from
http://worldwide.espacenet.com/eclasrch?classification=ecla&locale=en_EP&ECLA=C09D5 Leydesdorff, L., & Etzkowitz, H. (1998). The triple helix as a model for innovation studies. Science é Public Policy, 25(3), 195-203. Matheo Software. (2013). Matheo patent Xe disponible. Retrieved from http://www.matheo-software.com OECD. (2005). Main science and technology indicators. Paris, France: OECD Publishing. PEN. (2012). Pan European networks science & technology. Retrieved from
http://www.paneuropeannetworks.com/sector/science-and-technology12.html Tribune (La). (2010). Comment la Chine va devenir la championne du monde des brevets. Retrieved from
http://www.latribune.fr/actualites/economie/international/20101012trib000559284/comment-la-chine-va-devenir-la-championne-du-monde-des-brevets-.html
WIPO. (2012). SME resources. Retrieved from http://www.wipo.int/sme/en/ XIE, X. Z., WANG, Q., & Chen, A. Q. (2012). Analysis of competition in Chinese automobile industry based on an opinion and
sentiment mining system. Journal of Intelligence Studies in Business JISIB, 2(1), 41-50.

Chinese Business Review, ISSN 1537-1506 January 2013, Vol. 12, No. 1, 48-61
Entrepreneurship and Growth in Emerging Mini-dragon
Economies: A South-East Asia Perspective*
Alex Maritz, Viet Le, Simon Masli, Anton de Waal, Bert Verhoeven Swinburne University of Technology, Melbourne, Australia
Shieh, Chich Jen Chang Jung University, Tainan, Taiwan
Emerging economies throughout the world are at a renaissance to economic growth, prosperity, and overall wellbeing of individual nations (GEM, 2010). This study develops an exploratory paradigm on such emerging economies in a South East Asia context, an extension of a previous study on the Asian Tiger economies of South Korea, Hong Kong, Taiwan, and Singapore (Maritz, 2011). We chose a distinct subset of emerging South East Asian economies based on a smorgasbord of factors, including the role of small to medium enterprises, entrepreneurship activity indicators, growth rates, and nascent entrepreneurship rates amongst others. In addition, we included factors typically drawn from the internationalization process perspective (Tiwari & Matascu, 2011). Such indicators include risk and uncertainty, knowledge, networks, culture, and personal background. After an
Entrepreneurship and growth are driving forces in the development of emerging economic systems. In this
exploratory study we discuss emerging economies within a South-East Asia context. In particular, we expand on a
previous study on the East Asian Tiger economies, and introduce the mini-dragon economies of Indonesia,
Malaysia, Thailand, and Philippines. We explore the role of various economic indicators and indices,
entrepreneurship and SMEs as drivers of growth in these emerging economies. Growth factors unique to the region
are also identified, and institutional and government interventions are recommended. Furthermore, we elaborate on
the interdependence of the entire region on each of the mini-dragon economies. Since we have highlighted only a
few of the emerging economies in the region, opportunities exist to expand the base for further study.
Keywords: entrepreneurship, growth, SMEs, mini-dragon economies
Introduction
* Acknowledgment: The authors are obligated to express thanks to Denny Thomas, Research Assistant, Ph.D. candidate and the committee of the 2012 ICOI Conference, Surabaya, Indonesia.
Alex Maritz, Ph.D., Faculty of Business and Enterprise, Swinburne University of Technology. Viet Le, Ph.D., Faculty of Business and Enterprise, Swinburne University of Technology. Simon Masli, Ph.D., Faculty of Business and Enterprise, Swinburne University of Technology. Anton de Waal, Ph.D., Faculty of Business and Enterprise, Swinburne University of Technology. Bert Verhoeven, Lecturer, Faculty of Business and Enterprise, Swinburne University of Technology. Shieh, Chich Jen, Ph.D., Department of International Business, Chang Jung University. Correspondence concerning this article should be addressed to Alex Maritz, Swinburne University of Technology, Melbourne,
Australia. E-mail: [email protected].
DAVID PUBLISHING
D

ENTREPRENEURSHIP AND GROWTH IN EMERGING MINI-DRAGON ECONOMIES 49
initial screening process, the economies of Indonesia, Malaysia, Thailand, and Philippines were nominated. Whilst paradoxically similar, yet contrasting in many ways, these emerging economies were nominated as it was deemed appropriate to benchmark these economies from an entrepreneurship and geographical proportionality perspective.
Since the financial crisis in 1997, several countries in Asia have bounced back economically, whether with the bitter pills of International Monetary Fund (IMF) as the medicine, or without IMF assistance. Economists are still reaching the consensus yet whether the intervention from IMF is the panacea to the economic problems in Asia in late 20th century. Currently, those Asian countries worst affected by the 1997 financial crisis (e.g., Indonesia, South Korea, Thailand, and Malaysia) and other Asian countries, such as China, Hong Kong, Singapore, and Taiwan, have been growing admirably amid the shadow of global financial crisis in 2008-2009.
Some causes of the Asian economies resilience are due to the fact that after the structural adjustment in late year 2000, their economies had been enjoying strong export growth, robust domestic consumption and investment, sound and credible fiscal and monetary policies (Das, 2012), and low private-sector debt (The Economist, 2012), which partially explained how these factors are the determinants of the link between economic growth and Foreign Direct Investment (FDI) (Anwara & Nguyen, 2010). Furthermore, Shahbaz and Rehman (2010) showed that FDI as determinant of economic growth. Also, Jayachandran and Seilan (2010) identified that FDI and exports are among the factors affecting economic growth. In their intensive study, covering 23 Asian countries and employing data from 1986 to 2008, Tiwari and Mutascu (2011) concluded that FDI and exports enhance the growth of Asian countries. However, recent studies (for example, Hessels & van Stel, 2011; Augustin-Jean, 2010) confirmed that entrepreneurship in general has positive impact on economic growth. Lawrence Summers, former Director of the US’ National Economic Council, said that entrepreneurship “drives economic growth by fostering competition and dynamism in a world economy whose shape is rapidly changing” (redcliff.com, 2011). Therefore, in this paper we will look at the entrepreneurship and growth in Asian Tiger economies (i.e., Hong Kong, Taiwan, Singapore, and South Korea), and South East Asia countries, especially on the countries grouped as Mini-Dragon economies (i.e., Indonesia, Malaysia, and Thailand) and Philippines for the comparison purpose.
We commence this explorative study with an overview of the Tiger economies, and then delineate the indicators from each of our mini-dragon economies.
Asian Tiger Economies
Tiger economies such as Hong Kong, Taiwan, Singapore, and South Korea are also called Asia’s Newly Industrializing Economies (NIE) (Yu, 1998; Regnier, 1993). From 1980s to mid-1997, these NIEs enjoyed almost double-digit growth, led by the export industries, such as electronics, computer parts, textile, and others. Several theories have been proposed to explain this “miracle”, and one of the popular ones is that all these four economies share the same heritage, Confucianism, which emphasizes hard work, frugality, and education. However, according to Chen (2010), these Asian countries significantly have adoptive entrepreneurship, especially in Hong Kong and Taiwan where entrepreneurs play an important role (Chen, 2010). The prosperity of these two countries is also related to market power rather than government intervened policies (Chen, 2010). Nonetheless, the government has been actively involved in promoting entrepreneurship activity. For example,

ENTREPRENEURSHIP AND GROWTH IN EMERGING MINI-DRAGON ECONOMIES 50
while Hong Kong is famous for its free market policy and non-government intervention in business, there are government interventions to support entrepreneurship and SMEs, which are backbone of the economy (Augustin-Jean, 2010; Man & Lau, 2005). Hong Kong has been regarded as one of the most dynamic entrepreneurial economies in the world with a business environment favouring entrepreneurship (Yu, 2000; Man & Lau, 2005), which is shifting towards a knowledge economy (Man & Lau, 2005). Likewise, the Taiwanese’s economy is almost entirely supported by small and medium enterprises (SMEs) (Chen, 2010). Its entrepreneurs are independent owner managers compared with other Asian Tiger economies (Chen, 2010). According to Global Entrepreneurship Monitor (GEM) Report, the Total Early-stage Entrepreneurial Activity (TEA) in Hong Kong (10%) and Taiwan (7.9%) was relatively high. Also, the Nascent Entrepreneurship Rate (NER) in both countries was quite impressive, i.e., 5.7% (Hong Kong) and 3.6% (Taiwan).
While Taiwanese enterprises have superior adoptive entrepreneurship and flexible supply networks (Chen, 2010; Yu, 2000), which helps them to react quickly to the changing markets, the entrepreneurs from Hong Kong have a short-term view on production, flexibility, and rapid-reactions to market changes (Yu, 1998). In Hong Kong’s context, entrepreneurship is related to its competitiveness (Augustin-Jean, 2010), which is same as in Taiwan. The high entrepreneurial attitude also has its contextual factors such as influence of Chinese cultural values (Man & Lau, 2005), and they are hard workers and achieve social status through business success.
Until late 20th century, South Korea’s political economy positively discriminated against SMEs (Sohn & Kenney, 2007). According to Moskovitch and Kim (2008), the Korean economy traditionally dominated by Cheabols or big businesses where as Taiwan on SMEs. Due to heavy government intervention with favouritism towards the Cheaboles, Korean economy experienced spectacular growth, and was part of Asian Miracle economies (Sohn & Kenney, 2007; Kwon & Kang, 2011). Consequently, true to the spirit of traditional Confucianism which disdained the merchant class or business people, the entrepreneurship was not supported. Furthermore, some other hindering factors of entrepreneurship include unavailability of technical labour and early stage venture capital (Sohn & Kenney, 2007). The most valued entrepreneurship frameworks in Korea were general national policy, dynamic internal market, and physical infrastructure (GEM, 2010). However, the Asian financial crisis in 1997 has triggered the positive changes to entrepreneurial activities coupled with intentional government policies (Moskovitch & Kim, 2008). And currently, spurred by young start-ups, the Korea is moved toward innovation driven economy (GEM, 2010). While not as high as Taiwan or Hong Kong, the Korea’s TEA and NER are improving (7.8% for TEA and 2.9% for NER).
Another Asian Tiger economy is Singapore, a city-state with 80% Chinese population (Dahles, 2008), it currently has a pro-business stand by government (Choo, 2005). Rapid economic growth based on manufactured exports has made Singapore a newly-industrializing economy like Hong Kong, Taiwan, and South Korea (Low, 2005). However, presence of already established multinational and local firms and the cultural norm, which does not support risk taking, creativity, and innovativeness, are cited as barriers in developing entrepreneurship culture (Choo, 2005; Low, 2005; Pereira, 2007). Singapore has a well-educated and skilled labour force with a preference for paid employment (Low, 2005). Even educational system focusing on sciences and mathematics is blamed for low creative and critical thinking necessary for entrepreneurship (Choo, 2005; Low, 2005). There are calls for more strategic moves by government to support entrepreneurship culture including educational reforms (Choo, 2005; Low, 2005). And, in the past 10 years, the government has been trying to accelerate the growth of

ENTREPRENEURSHIP AND GROWTH IN EMERGING MINI-DRAGON ECONOMIES 51
entrepreneurship. For example, the Singaporean government (via Economic Development Board) has established Startup Enterprise Development Scheme (SEEDS) in 2001 (now it is called SPRING Seeds) to assist the young and innovative firms across diverse industries. However, for Singapore, cultural, social norms, education and training and government policy are mentioned as affecting the entrepreneurial culture (Low, 2005). Among four Asian Tigers, Singapore has the lowest TEA (6.6%), and its NER is comparable to Taiwan (3.8%).
Table 1 Asian Tiger Economy Country Comparison-General Indicators Hong Kong Taiwan South Korea Singapore Source GDP Per capita (2010 in US$) 45,900 35,700 30,000 62,100 CIA Factbook Growth rate (2010) % 7.0 10.8* 6.2 14.5 World Bank Population (in million) (2011) 7.1 23 48.7 4.7 CIA Factbook Corruption ranking
12
32
43
5
Transparency International
People living in poverty % (2010) NA 1.16 15# NA CIA Factbook Literacy rate % 93.5 96.1 97.9 92.5 CIA Factbook Total early-stage entrepreneurial activity@ 10% (2007) 7.9% (2011) 7.8% (2011) 6.6% (2011) GEM Nascent entrepreneurship rate@ 5.7% (2007) 3.6 (2011) 2.9 (2011) 3.8 (2011) GEM Inflation % (2010) 2.3 1* 2.9 2.8 World Bank Unemployment % (2009) 5.2 5.2* 3.6 5.9 World Bank GDP (millions of US$) (2010) 224,457 821,800* 1,014,483 208,765 World Bank
Note. # 2006 data; @ Latest available data; *CIA fact book data.
Entrepreneurship in Mini-dragons and Philippines
In this section, we will look at entrepreneurship and growth in Mini-dragons (Indonesia, Malaysia, and Thailand) and Philippines for the comparison purpose.
Entrepreneurship in Indonesia Indonesia is the fourth largest country in the world in terms of population and the world’s third largest
democracy, the world’s largest archipelagic state, and home to the world’s largest Muslim population (Bhasin & Venkataramany, 2010). It is facing numerous challenges, including alleviating poverty, controlling overpopulation, improving education, fighting terrorism, consolidating democracy after decades of authoritarian rule, stemming endemic corruption, coping with natural disasters, environmental damage, and implementing economic and social reform (Bhasin & Venkataramany, 2010).
The role of Small and Medium Enterprises (SMEs) in Indonesia’s economy is very significant as their contribution to the Indonesian Gross Domestic Product accounted for 53.6% in 2007 (Kusumawardhani, McCarthy, & Perera, 2009). They also account for nearly 99.9% of total business and employ 96.18% of the total Indonesian workforce (Sari, Alam, & Beaumont, 2008; Kusumawardhani, McCarthy, & Perera, 2009).
In terms of entrepreneur development, Indonesia was too dependent on external factors that included lack of funding, high interest rates, high taxation, and burdensome government requirements in seeking support (Bhasin & Venkataramany, 2010). Globalisation and trade liberalisation issues pose serious challenges to Indonesian SMEs. They have to prepare themselves for severe competition, not only from domestic but also from international companies (Kusumawardhani, McCarthy, & Perera, 2009). Tambunan (2011) notes that the

ENTREPRENEURSHIP AND GROWTH IN EMERGING MINI-DRAGON ECONOMIES 52
majority of SMEs, especially small enterprises, are scattered widely throughout rural areas, and likely to play an important role in developing the talents of villagers, particularly women, as entrepreneurs. Many of these Indonesian SMEs are self-employment enterprises without wage-paid workers with low productivity largely producing basic, low value-added goods for local markets (Tambunan, 2011). Thus current situation in Indonesia demands development of SMEs that are capable of competing in the global marketplace (Bhasin & Venkataramany, 2010).
Indonesian SMEs face constraints such as lack of capital, business information, technology, and skilled workers; difficulties in procuring raw materials; marketing and distribution challenges; and government policies and regulations (Tambunan, 2011). Only a small proportion of Indonesian SMEs receive credit from banks or other financial institutions reflects the underdeveloped financial markets and institutions in the country (Tambunan, 2011).
A study conducted by Cole (Bhasin & Venkataramany, 2010) found that in addition to the lack of knowledge and structural support as constraining factors for entrepreneurs, the influence of the government to hinder entrepreneurship was far greater. The study also identified that a lack of understanding, confidence, and education acted as barriers to the entrepreneurial potential of the Indonesian community. According to Bhasin and Venkataramany (2010), in developing entrepreneurship, Indonesia faces challenges such as lack of professional institutions for educating and training entrepreneurs, lack of experienced entrepreneurs who could teach, train, and educate common people to become entrepreneurs, lack of good programs for entrepreneurship development and social and cultural impediments to entrepreneurial development such as preference of people to work in government after completing their tertiary education.
Training in entrepreneurship has become an important part of development government supported programs for the development of SMEs in Indonesia (Tambunan, 2007). Entrepreneurship development is also a current important issue related to economic development in Indonesia (Tambunan, 2007).
However, Indonesian culture has been traditionally averse to entrepreneurial activity (Bhasin & Venkataramany, 2010). Also, Becoming an entrepreneur in Indonesia is still dominantly a man culture (Tambunan, 2007). The average level of education of male is higher than that of female, and the illiteracy rate for women is still higher than men, especially in rural areas (Tambunan, 2007). In Islamic countries like Indonesia, that makes female behavior or attitude less open than male to “doing modern business” culture. Especially in rural society, women are more restricted than in urban areas to do activities outside of the home (Tambunan, 2007).
Entrepreneurial development should consider policies such as promoting risk-taking by changing the mindset through education, creating an environment that accepts failure and allows free expression, very strong financial incentives, and tax breaks that increase entrepreneurial risk-taking (Bhasin & Venkataramany, 2010).
Entrepreneurship in Malaysia Malaysia comprises 13 states and all states were segmented into three regional growth corridors the northern
corridor of economic region (NCER), the Iskandar development region (IDR), and the eastern corridor of economic region (ECER) (Awang et al., 2010). Malaysia has a vibrant entrepreneurial base with a huge potential to become a global player (Ariff & Abubakar, 2003).
Malaysia is a multi-racial country where the dominant races are Malays, Chinese, and Indians (Osman et al.,

ENTREPRENEURSHIP AND GROWTH IN EMERGING MINI-DRAGON ECONOMIES 53
2011). Local ethnic groups dominance in entrepreneurship and immigration is a more recent phenomena in developing countries such as Malaysia (Osman et al., 2011). Current context of Malaysian entrepreneurship has to consider the historical practice of segregating economic activity by racial lines (Ariff & Abubakar, 2003). Even the attitude towards enterprise creation has been previously divided along racial lines due to the identification of race within economic activity (Ariff & Abubakar, 2003). The policies supporting existing and potential Bumiputera entrepreneurs helped in increasing the number of businesses being established in Malaysia (Ariff & Abubakar, 2003).
Abdullah and Muhammad (2008) categorize the entrepreneurial development of Malaysia into four phases, where the fourth phase is from the introduction of New Development Policy and the implementation of sixth, seventh, and Eighth Malaysian plans. However the latest one is the Vision Development Policy (Awang et al., 2010).
Malaysian government tries to promote ethical practices in order to create a moral and ethical society (Ahmad & Seet, 2010). The support given to entrepreneurship development by the Malaysian government is evident from the scale and variety of mechanisms and policies exist for entrepreneurs including the ministry of entrepreneur development (Ariff & Abubakar, 2003; Ahmad, Baharun, & Rahman, 2004). Ahmad, Baharun, and Rahman (2004) state that entrepreneurship plays an important role in the Malaysia and has strong support from the government for entrepreneurs including funding, physical infrastructure, and business advisory services. The government also intends to transform its economy to knowledge and information driven economy and has clear plans to promote high-tech, information, and knowledge intensive ventures (Ariff & Abubakar, 2003).
The GEM (2010) data show that finance, physical infrastructure, and internal market dynamics as three valued most positive entrepreneurship framework conditions, whereas regulations, primary and secondary education and open internal market as three most negative conditions in Malaysia.
Education institutions in Malaysia, particularly higher education institutions, are entrusted with a new additional task, which is to contribute to the development of entrepreneurial talent among young graduates (Ahmad, Baharun, & Rahman, 2004). Many universities and high learning institutions in Malaysia have introduced courses related to entrepreneurship or majors in entrepreneurship (Ahmad, Baharun, & Rahman, 2004).
Women entrepreneurs play an important role in the increasing small and medium enterprises and hence to the Malaysian economy (Ahmad & Seet, 2010). The attitude towards women in the workforce has improved and their higher education attainment also increased (Ariff & Abubakar, 2003). In Malaysia, ethics and social responsibility issues are important entrepreneurial behaviours (Ahmad & Seet, 2010). The attitude of Bumiputerans who did not have a tradition of entrepreneurship changed due to the government policies into embracing an entrepreneurial culture (Ariff & Abubakar, 2003).
In Malaysia, entrepreneurs have access to sources of capital including banking system, development finance institutes, venture capital funds, and other special funds (Ariff & Abubakar, 2003). However, According to the GEM (2010) report, Malaysia has high fear of failure in the efficiency driven group in pursuing entrepreneurship. It also shows the highest media attention around entrepreneurship, yet the lowest perception on entrepreneurship as a career (GEM, 2010).
In a multi country study about culture and entrepreneurial orientation, Lee, Lim, and Pathak (2011) found that Malaysian context prefer to be more innovative, autonomous, competitive, and risk taking. However, in

ENTREPRENEURSHIP AND GROWTH IN EMERGING MINI-DRAGON ECONOMIES 54
developing countries such as Malaysia, entrepreneurial enterprises have tended to be looked at from a development, or poverty alleviation perspective, rather than as entrepreneurial activities and potentially growing businesses (Salleh & Sidek, 2011).
Entrepreneurship in Thailand Thailand has one of the highest levels of entrepreneurship in the world measured by early stage
entrepreneurship rate at 20 percent by Global Entrepreneurship Monitor (OECD 2011; Sukasame, Sebora, & Mohedano-Suanes, 2008). Thailand has had an impressive economic advancement over the last few decades, except the Asian financial crisis period (Sukasame, Sebora, & Mohedano-Suanes, 2008). A series of economic reforms have been launched to assist the economic recovery (N. Suntornpithug & P. Suntornpithug, 2008). Even after two economic crises, sound macroeconomic policies, growing export opportunities, competitive markets, and entrepreneurial dynamism have delivered economic growth and resilience to the country (OECD, 2011).
The intensity entrepreneurial activity of Thailand has direct correlation with the economic growth (Somjai, 2003) and is largely in line with international norms (OECD, 2011). The intense entrepreneurial activity transformed Thailand from an agricultural and rural economy into an industrial and service based economy (Somjai, 2003; N. Suntornpithug & P. Suntornpithug, 2008). The entrepreneurial spirit of the commercial class made up mainly of Thais of Chinese origin has helped expand entrepreneurial activity and speed up the economic development process in Thailand (Somjai, 2003).
Entrepreneurs are conditioned by the structure of the society in which they operate and therefore the culture of a society has an important bearing on entrepreneurial development (Cole, 2007). From a cultural perspective, the entrepreneurial thinking in Thailand has its roots in the hard-working values of Confucianism and Buddhist values contributing to the tolerance towards failures (Somjai, 2003; N. Suntornpithug & P. Suntornpithug, 2008). The context views failures as learning process in the entrepreneurship journey (Somjai, 2003). Thai society have a positive perception about entrepreneurship as a career choice (OECD, 2011).
The entrepreneurship landscape has its weaknesses such as lack of finance for SMEs and entrepreneurship, underdeveloped infrastructure, institutional failures, and underdeveloped infrastructure (OECD, 2011). Paulson and Townsend (2004) also found that financial constraints play an important role in shaping entrepreneurship patterns in Thailand. There are regional differences in entrepreneurial activities restricted by financial constraints (Paulson & Townsend, 2004; OECD, 2011). The entrepreneurial ventures gather much of the startup funds from savings and from family or friends (Paulson & Townsend, 2004; Somjai, 2003). Lack of technological readiness is another major impediment to the creation of new productive firms and SME’s innovation and growth.
A high proportion of entrepreneurship are undertaken for necessity, such as lack of alternative income opportunity which are sometimes characterized by low productivity, lack growth potential and offer poor income and employment conditions (OECD, 2011). However the average annual income of business owners in rural and semi-urban Thailand is double that of nonbusiness owners (Paulson & Townsend, 2004).
In Thailand, formal education is strongly associated with entrepreneurial talent (Paulson & Townsend, 2004). The likelihood of becoming an entrepreneur increases dramatically with wealth in Thailand (Paulson & Townsend, 2004). The Thai society started accepting role of women as a major workforce, a trend contributed by rapid economic growth, extensive urbanization, and rising educational backgrounds (Somjai, 2003). Currently,

ENTREPRENEURSHIP AND GROWTH IN EMERGING MINI-DRAGON ECONOMIES 55
Thailand has high proportions of female entrepreneurs and business owners, who make up just fewer than 50% of start-ups and operating SMEs (OECD, 2011).
The Thai government has been supporting private enterprises including the setup of the Board of Investments (BOI), in order to facilitate new business venture, but bureaucratic red tape has been cited as a barrier (Somjai, 2003). The Thai government support for entrepreneurship promotion also include tax incentives, business advisory services and setting up of Market for Alternative investment (MAI) and Industrial Estate Authority (Somjai, 2003). The government also created a favourable policy and environment for business incubation in order to facilitate those unemployed to start their own businesses and generate income (Sukasame, Sebora, & Mohedano-Suanes, 2008). However, the Thai national policy on entrepreneurship focus only on establishing new ventures and not on its subsequent growth, thereby, missing a link to macro-economic growth (Sukasame, Sebora, & Mohedano-Suanes, 2008).
Increased government expenditure and better export performance were reflected in satisfactory GDP performances and lower unemployment rate (N. Suntornpithug & P. Suntornpithug, 2008). Thailand continues to have a strong underlying growth potential into the future (Sukasame, Sebora, & Mohedano-Suanes, 2008). According to Somjai (2003), the entrepreneurship policies in Thailand should consider easier capital access, education in the field of entrepreneurship, English, IT, and international exposure of Thai entrepreneurs. According to OECD (2011) report, policy makers should consider improving the framework for the formulation and implementation of SME and entrepreneurship policy, building more innovative, growth-oriented, and international SMEs, and developing policies that enable productive entrepreneurship for regional and social development.
Entrepreneurship in Philippines Philippines economic history to date is characterized by a cycle of repressive and liberal economic policies
(Batalla, 2010). In Philippines, entrepreneurial development programs rest on the assumption that “entrepreneur is someone who forms and manages a business” is evident from the government programs that attempt to develop small-scale industries (Batalla, 2010). Even though entrepreneurship in the Philippines has no strong socio-demographic barrier (GEM, 2007), Philippines lack entrepreneurs who apply innovation, superior judgment, and organizational talent in order to gain distinct, sustainable competitive advantages (Batalla, 2010).
Foreign travel, management education, mass media, and information technology have increasingly become accessible to more Filipinos and these factors resulted in a mass exposure to modern production and management techniques, trends and lifestyles, and other pertinent information for enterprise development (Batalla, 2010).
During the second half of the 20th century, the Philippine government established several government institutions promoting entrepreneurship in trading and expanding cottage industries to convert them into small and medium sized enterprises (Baughn et al., 2006). However, the inability of government to provide a more conducive setting for private sector governance and development has led SMEs virtually to themselves (Batalla, 2010). However Filipino SMEs make up more than 99% of all businesses in the country, provide more than two-thirds of the country’s employment, and is responsible for almost one-third of the country’s income (Ruane, 2007).
Filipino culture has high power distance, high masculinity, and low uncertainty avoidance and from this perspective, the Filipino culture seems to be favourably disposed towards entrepreneurship, except on the

ENTREPRENEURSHIP AND GROWTH IN EMERGING MINI-DRAGON ECONOMIES 56
dimension of individualism (Johnson, Munoz, & Alon, 2007) that may adversely impact entrepreneurial tendencies. As the relationship between socio-cultural values and entrepreneurial environment has been discussed in literature (Begley & Tan, 2001), the value of sharing among Filipinos can curtail business propensity and efficiencies, and the moral pressure of obligatory sharing has hindered entrepreneurial Filipinos from engaging in commerce (Johnson, Munoz, & Alon, 2007).
In the entrepreneurial environment, financing is cited as the most limiting factor. The small number of formal financial intermediaries and their restrictive policies limited support to long-term private sector financing in Philippines (Batalla, 2010). Since capital constraints are often the critical limitation for starting one’s own business, equity financing of enterprises depended primarily on social and family networks (Baughn et al., 2006; Batalla, 2010).
The economic environment of the Philippines is exacerbated by several factors such as drastic currency devaluation, a huge annual government budget deficit, socio-political risks due to law and order concerns, allegations of bribery, level of unemployment and the prevalence of labour migration (Johnson, Munoz, & Alon, 2007). In addition to that SMEs suffered from several problems including lack of credit, lack of business linkages, relatively high cost of doing business, and lack of requisite skills for global competitiveness (Batalla, 2010).
The transformation of the Philippines into a service economy and the stagnation of its manufacturing sector limit the expansion potentials for employment and GDP. This provides the setting for the massive exodus of Philippine labour in the closing decades of the 20th century (Batalla, 2010). Philippines is the largest labour exporter in Asia, having sent over 7.4 million people, or 22% of its entire labour force of 30 million, to over 120 countries (Johnson, Munoz, & Alon, 2007).
New investment and business expansion in the Philippines has been constrained by considerations of financing, government regulation, and security. These problems reveal weaknesses of institutions of both market and state and their effects on private sector development (Batalla, 2010). Majority of business are born out of necessity and most Filipinos have a positive attitude towards entrepreneurship (GEM, 2007). However, fear of failure appears to be a significant impediment to start an enterprise (GEM, 2007).
Batalla (2010) identified that historically conditioned attitudinal and psychological factors, perpetuated by public policy, affected the quality of entrepreneurship in the Philippines. Having a strong tradition of powerful social institutions (Johnson, Munoz, & Alon, 2007), Filipino entrepreneurs do not place high value on entrepreneurial qualities of being independent and being creative showing strong influence of the Catholic and American heritage (Uy, 2011).
GEM (2007) identified that need to improve formal and informal education and training towards entrepreneurship and the improvement of technological infrastructure, research and development. GEM (2007) also state that the policies should address improved financing options, improved export orientation, enhanced business growth, and emphasized role of local governments.
Table 2 represents a snapshot of the mini-dragon comparison indicators, including entrepreneurship activity indicators.
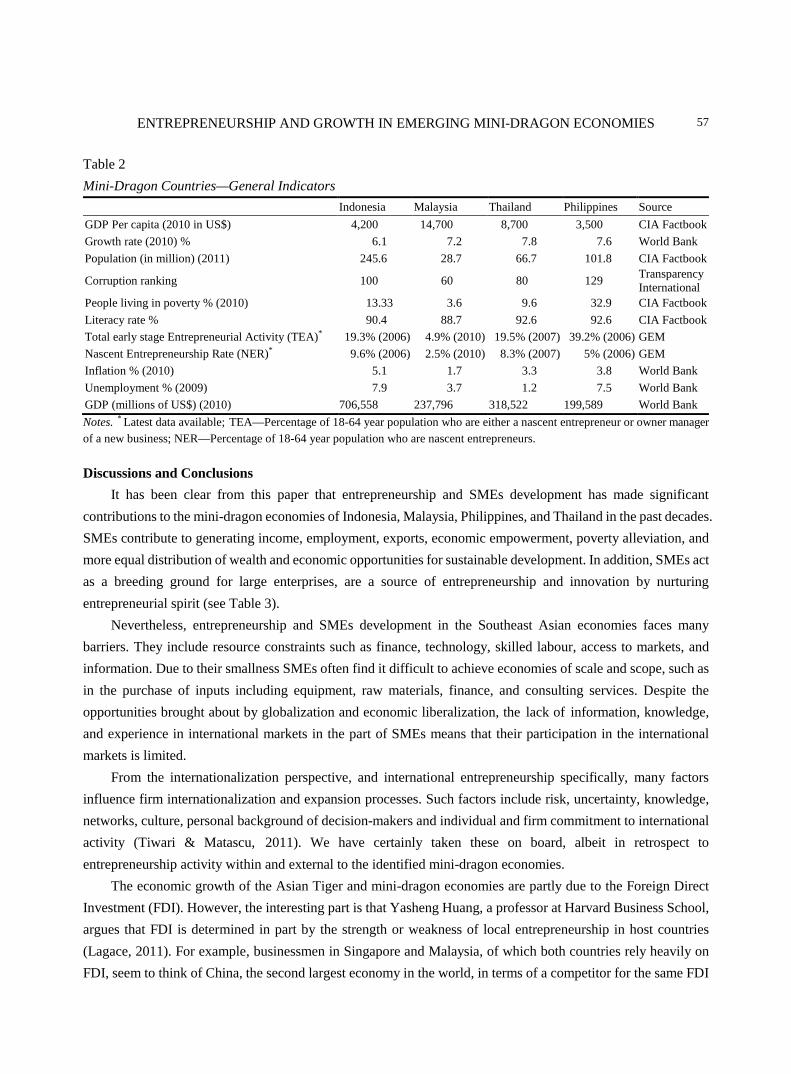
ENTREPRENEURSHIP AND GROWTH IN EMERGING MINI-DRAGON ECONOMIES 57
Table 2 Mini-Dragon Countries—General Indicators Indonesia Malaysia Thailand Philippines Source GDP Per capita (2010 in US$) 4,200 14,700 8,700 3,500 CIA Factbook Growth rate (2010) % 6.1 7.2 7.8 7.6 World Bank Population (in million) (2011) 245.6 28.7 66.7 101.8 CIA Factbook
Corruption ranking 100 60 80 129 Transparency International
People living in poverty % (2010) 13.33 3.6 9.6 32.9 CIA Factbook Literacy rate % 90.4 88.7 92.6 92.6 CIA Factbook Total early stage Entrepreneurial Activity (TEA)* 19.3% (2006) 4.9% (2010) 19.5% (2007) 39.2% (2006) GEM Nascent Entrepreneurship Rate (NER)* 9.6% (2006) 2.5% (2010) 8.3% (2007) 5% (2006) GEM Inflation % (2010) 5.1 1.7 3.3 3.8 World Bank Unemployment % (2009) 7.9 3.7 1.2 7.5 World Bank GDP (millions of US$) (2010) 706,558 237,796 318,522 199,589 World Bank Notes. * Latest data available; TEA—Percentage of 18-64 year population who are either a nascent entrepreneur or owner manager of a new business; NER—Percentage of 18-64 year population who are nascent entrepreneurs.
Discussions and Conclusions It has been clear from this paper that entrepreneurship and SMEs development has made significant
contributions to the mini-dragon economies of Indonesia, Malaysia, Philippines, and Thailand in the past decades. SMEs contribute to generating income, employment, exports, economic empowerment, poverty alleviation, and more equal distribution of wealth and economic opportunities for sustainable development. In addition, SMEs act as a breeding ground for large enterprises, are a source of entrepreneurship and innovation by nurturing entrepreneurial spirit (see Table 3).
Nevertheless, entrepreneurship and SMEs development in the Southeast Asian economies faces many barriers. They include resource constraints such as finance, technology, skilled labour, access to markets, and information. Due to their smallness SMEs often find it difficult to achieve economies of scale and scope, such as in the purchase of inputs including equipment, raw materials, finance, and consulting services. Despite the opportunities brought about by globalization and economic liberalization, the lack of information, knowledge, and experience in international markets in the part of SMEs means that their participation in the international markets is limited.
From the internationalization perspective, and international entrepreneurship specifically, many factors influence firm internationalization and expansion processes. Such factors include risk, uncertainty, knowledge, networks, culture, personal background of decision-makers and individual and firm commitment to international activity (Tiwari & Matascu, 2011). We have certainly taken these on board, albeit in retrospect to entrepreneurship activity within and external to the identified mini-dragon economies.
The economic growth of the Asian Tiger and mini-dragon economies are partly due to the Foreign Direct Investment (FDI). However, the interesting part is that Yasheng Huang, a professor at Harvard Business School, argues that FDI is determined in part by the strength or weakness of local entrepreneurship in host countries (Lagace, 2011). For example, businessmen in Singapore and Malaysia, of which both countries rely heavily on FDI, seem to think of China, the second largest economy in the world, in terms of a competitor for the same FDI

ENTREPRENEURSHIP AND GROWTH IN EMERGING MINI-DRAGON ECONOMIES 58
they try to attract. On the other hand, Taiwanese and Hong Kong entrepreneurs view a rising China as representing an investment and business opportunity. Consequently, the entrepreneurs from these two countries benefit the most from China’s growth. Thus, the countries that ignore to support the local entrepreneurs may face increasing difficulties in the future. In the case of Singapore, for example, the high paid compensation packages in the public sector have driven most talented people in Singapore to work for the government. The private sector, which is far less lucrative, attracts lesser talents. In the long run, this will be detrimental to the development of a vibrant private sector in Singapore, argued by Huang (Lagace, 2011).
Table 3 A Summary Profile of SMEs in East and South-East Asia Key features Regional differences and policy issues
Numbers of Enterprises
1. There are about 20 to 30 million SMEs in East Asia. 2. They account for 98% of all enterprises. 3. Micro-enterprises account for about 73% of all private sector enterprises. 4. On average, there are about 85 people for every SME.
1. Most of the SMEs are in China (8 million) and Japan (5 million) and Korea (2.6 million) which together have 70% of the SMEs in East Asia. 2. In developed economies there are only about 20 people per SME, but the ratio is above 100 in the developing economies, especially in China, Vietnam, Philippines, and Indonesia.
Employment
5. SMEs employ about 60% of the private sector workforce, and 30% of the total workforce. 6. Over 95% of enterprises employ less than 100 people, and over 80% employ less than five people. 7. SMEs contribute about 70% of net employment growth. 8. SMEs provide about 80% of employment in the services sector, and about 15% in the manufacturing sector. 9. Women make up about 30% of employers/self employed in APEC—mainly in micro-enterprises.
3. In developing economies (below about $15,000 US$ per head income) SMEs employ about 75% of people, above $15,000 the level is closer to 50%. Japan is a major exception-Japan’s SMEs employ around 80% of the workforce. 4. More developed economies seem to have more medium sized SMEs and they play a greater role. Developing economies seem more likely to have a “missing middle”. 5. In developed economies most of this growth probably comes from fast growth firms, in developing economies a higher proportion probably comes from net start ups.
Output measures (sales, value added)
10. SMEs contribute about 50% of sales, value added or output.
6. The contribution varies from lows of 15% (Singapore) to about 60% for most other economies.
Exports
11. SMEs generate about 30% of direct exports (US$930 billion in 2000), much less than the SME contribution to employment (about 60% to 70%) or output (about 50%). 12. SMEs contribute indirectly to trade through supply chain relationships with other firms. SME contribution to total trade could rise to 50%.
7. SME exports figures are difficult to verify, but they range from about 5% or less (Indonesia) to around 40% (Korea) of total exports. 8. Tariff cuts have increased total APEC member trade, but the SME contribution to direct exports has remained static or declined. Reductions in tariffs have not benefited SMEs, more emphasis needs to be put on tackling non tariff barriers if SMEs are to benefit from trade expansion.
Entrepreneurial engine, international potential, and the new economy
13. SMEs already contribute the bulk of growth, and SMEs could make a much bigger contribution to the Asian regional economy if efforts were made to address impediments to SME internationalization. This could add as much as $1.18 trillion in trade over a five year period. 14. SMEs moving towards services and away from agriculture and manufacturing.
9. The developing economies need to create about 50 to 70 million more SMEs if they are to achieve “benchmark” levels of SME activity. 10. To achieve maximum gain from trade it is essential to improve governance, building capacity, reducing transaction costs, promoting further liberalization, addressing non-tariff barriers, increasing internet access and facilitating trade and investment to improve the capacity of SMEs to export. 11. Capacity building includes: access to finance; improved professional skills (IT, management, accounting and entrepreneurship); improved business infrastructure; removal of trade barriers that particularly adversely affect SMEs.
Note. Source: Adapted from Harvie (2007).
ENTREPRENEURSHIP AND GROWTH IN EMERGING MINI-DRAGON ECONOMIES 59
Because of the impediments to entrepreneurship and SMEs development in the mini-dragon economies discussed in this paper and summarized above, governments of these economies have implemented a range of policies to support their development. However, they should focus on the key areas such as creating an enabling business environment conducive to entrepreneurship development such as providing tax breaks and incentives for new firms, easier access to finance and credit guarantee schemes for SMEs, and simplified regulations to make it easier to start-up a business. Capacity building and business advisory services in management, marketing, supply chain development, cluster development, production networks could be provided to entrepreneurs, especially women entrepreneurs. SMEs themselves should take initiatives to improve their productivity and efficiency to become more competitive in both domestic and global markets. SMEs can make use of ICT and e-commerce to increase their access to information and reach overseas markets.
Limitations of this paper are explicitly linked to the identified mini-dragon economies, and an opportunity exists to expand this study across all South East Asian economies.
References
Abdullah, S., & Muhammad, A. (2008). The development of entrepreneurship in Malaysia: State‐led initiatives. Asian Journal of Technology Innovation, 16(1), 101-116.
Ahmad, F., Baharun, R., & Rahman, S. H. A. (2004). Interest in entrepreneurship: An exploratory study on engineering and technical students in entrepreneurship education and choosing entrepreneurship as a career. Project Report, Faculty of Management and Human Resource Development, Skudai, Johor.
Ahmad, N. H., & Seet, P. S. (2010). Gender variations in ethical and socially responsible considerations among SME entrepreneurs in Malaysia. International Journal of Business & Society, 11(1), 77-88.
Anwara, S., & Nguyen, L. (2010). Foreign direct investment and economic growth in Vietnam. Asia Pacific Business Review, 16, 183-202.
Ariff, M., & Abubakar, S. Y. (2003). Strengthening entrepreneurship in Malaysia. Kuala Lumpur: Institute of Economics Research. Augustin-Jean, L. (2010). Entrepreneurship as a contributor to growth in Asia: The case of Hong Kong. Canadian Journal of
Development Studies, 31(3-4), 317-340. Awang, A., Ahmad, Z., Asghar, A. R. S., & Subari, K. A. (2010). Entrepreneurial orientation among Bumiputera Small and
Medium Agro-Based Enterprises (BSMAEs) in West Malaysia: Policy implication in Malaysia. International Journal of Business & Management, 5(5), 130-143.
Batalla, E. V. (2010). Entrepreneurship and Philippine development. Canadian Journal of Development Studies, 31(3-4), 341-365. Baughn, C. C., Cao, J. S. R., Le, L. T. M., Lim, V. A., & Neupert, K. E. (2006). Normative, social and cognitive predictors of
entrepreneurial interest in China, Vietnam and the Philippines. Journal of Developmental Entrepreneurship, 11(1), 57. Begley, T. M., & Tan, W. L. (2001). The socio-cultural environment for entrepreneurship: A comparison between East Asian and
Anglo-Saxon countries. Journal of International Business Studies, 32(3), 537-553. Bhasin, B. B., & Venkataramany, S. (2010). Globalization of entrepreneurship: Policy considerations for SME development in
Indonesia. International Business & Economics Research Journal (IBER), 9(4), 92-118. Bruton, G. D., Ahlstrom, D., & Obloj, K. (2008). Entrepreneurship in emerging economies: Where are we today and where should
the research go in the future. Entrepreneurship Theory and Practice, 32(1), 1-14. Chen, S. (2010). Dimensions of Taiwanese entrepreneurship. Global Business Review, 11(3), 333-345. Choo, S. (2005). Developing an entrepreneurial culture in Singapore: Dream or reality. Asian Affairs, 36(3), 361-373. Cole, S. (2007). Entrepreneurship and empowerment: Considering the barriers—A case study from Indonesia. Tourism Review,
55(4), 461-473 Dahles, H. (2008). Entrepreneurship and the legacies of a developmental state: Singapore enterprises venturing across national
borders. Journal of Developmental Entrepreneurship, 13(4), 485-508. Das, D. K. (2012). How did the Asian economy cope with the global financial crisis and recession? A revaluation and review. Asia
Pacific Business Review, 18(1), 7-25.

ENTREPRENEURSHIP AND GROWTH IN EMERGING MINI-DRAGON ECONOMIES 60
Global Entrepreneurship Monitor (GEM). (2007). Philippine report 2006-2007. Retrieved from http://www.gemconsortium.org/document.aspx?id=673
Global Entrepreneurship Monitor (GEM). (2010). Global report 2010. Retrieved from http://www.gemconsortium.org/download/1326348227500/GEM%20GLOBAL%20REPORT%202010rev.pdf
Harvie, C. (2007). SME development strategy in Vietnam. Proceedings from The 4th SMEs in a Global Economy Conference: Responding to Global Challenges and Opportunities, Shah Alam Selangor, Malaysia.
Hessels, J., & van Stel, A. (2011). Entrepreneurship, export orientation, and economic growth. Small Business Economics, 37, 255-268.
Jayachandran, G., & Seilan, A. (2010). A causal relationship between trade, foreign direct investment and economic growth for India. International Research Journal of Finance and Economics, 42, 74-88.
Johnson, J. P., Munoz, J. M., & Alon, I. (2007). Filipino ethnic entrepreneurship: An integrated review and propositions. International Entrepreneurship and Management Journal, 3(1), 69-85.
Kusumawardhani, A., McCarthy, G., & Perera, N. (2009). Framework of entrepreneurial orientation and networking: A study of SMEs performance in a developing country. Proceedings of the Australian and New Zealand Academy of Management Conference (pp. 1-16).
Kwon, J. K., & Kang, J. M. (2011). The East Asian model of economic development. Asian-Pacific Economic Literature, 25(2), 116-130.
Lagace, M. (2011). Entrepreneurship in Asia and foreign direct investment. Retrieved April 24, 2012, from http://hbswk.hbs.edu/item/2948.html
Lee, S. M., Lim, S., & Pathak, R. D. (2011). Culture and entrepreneurial orientation: A multi-country study. International Entrepreneurship and Management Journal, 7(1), 1-15.
Low, L. (2005). Entrepreneurship development in Ireland and Singapore. Journal of the Asia Pacific Economy, 10(1), 116-138. Man, T. W. Y., & Lau, T. (2005). The context of entrepreneurship in Hong Kong: An investigation through the patterns of
entrepreneurial competencies in contrasting industrial environments. Journal of Small Business and Enterprise Development, 12(4), 464-481.
Maritz, P. A. (2011). Keynote address: Global entrepreneurship and the East Asian tiger economy. Retrieved from http://www.enterprisemkt.org
Moskovitch, I., & Kim, D. J. (2008). Building an entrepreneurial economy: The case of Korea 1998-2005. Global Economic Review, 37(1), 63-73.
OECD. (2011). Thailand: Key issues and policies, OECD studies on SMEs and entrepreneurship. Berlin: OECD Publishing. Osman, M. H. M., Asrah, M. R. B., Rashid, M. A., & Rajput, A. (2011). Ethnic entrepreneurship and interplay of cultural factors in
developing countries: A compendium of literature. Interdisciplinary Journal of Contemporary Research in Business, 3(3), 472-480.
Paulson, A. L., & Townsend, R. (2004). Entrepreneurship and financial constraints in Thailand. Journal of Corporate Finance, 10(2), 229.
Pereira, A. A. (2007). Attitudes towards entrepreneurship in Singapore: The role of the state in cultural transition. Asian Journal of Social Science, 35(3), 321-339.
Redcliff.com. (2011). Entrepreneurs to play major role in Asian renaissance. Retrieved April 24, 2012, from http://business.rediff.com/report/2010/apr/28/entrepreneurs-to-play-major-role-in-asian-renaissance.htm
Regnier, P. (1993). The dynamics of small and medium-sized enterprises in Korea and other Asian NIEs. Small Business Economics, 5(1), 23-36.
Ruane, M. C. M. (2007). Small-scale business enterprises in the Philippines: Survey and empirical analysis. International Journal of Entrepreneurship, 11, 119-131.
Salleh, M. M., & MohdSidek, N. Z. (2011). Rural entrepreneurship: A challenges and opportunities of Rural Micro Enterprise (RME) in Malaysia. Interdisciplinary Journal of Contemporary Research in Business, 2(11), 573-583.
Sari, D., Alam, Q., & Beaumont, N. (2008). Internationalisation of small medium sized enterprises in Indonesia: Entrepreneur human and social capital. Working Papers in Business, Management and Finance.
Shahbaz, M., & Rehman, M. M. (2010). Foreign capital inflows-growth nexus and role of domestic financial sector: An ARDL cointegration approach for Pakistan. Journal of Economic Research, 35, 207-231.
Somjai, P. (2003). Entrepreneurship in Thailand. Proceedings from Global Forum of Entrepreneurship in Asia, 4th US-Japan Dialogue.

ENTREPRENEURSHIP AND GROWTH IN EMERGING MINI-DRAGON ECONOMIES 61
Sohn, D. W., & Kenney, M. (2007). Universities, clusters, and innovation systems: The case of Seoul, Korea. World Development, 35(6), 991-1004.
Sukasame, N., Sebora, T. C., & Mohedano-Suanes, A. (2008). E-commerce entrepreneurship as a national priority: The case of Thailand. Service Industries Journal, 28(7/8), 989-1001.
Suntornpithug, N., & Suntornpithug, P. (2008). Don’t give them the fish, show them how to fish: Framework of market-driven entrepreneurship in Thailand. Journal of Small Business and Entrepreneurship, 21(2), 181-194.
Tambunan, T. (2007). Entrepreneurship development: SMEs in Indonesia. Journal of Developmental Entrepreneurship, 12(1), 95. Tambunan, T. T. H. (2011). Development of small and medium enterprises in a developing country: The Indonesian case. Journal of
Enterprising Communities: People and Places in the Global Economy, 5(1), 68-82. The Economist. (2012). An astonishing rebound. Retrieved April 23, 2010, from http://www.economist.com/node/14214001 Tiwari, A. K., & Mutascu, M. (2011). Economic growth and FDI in Asia: A panel-data approach. Economic Analysis & Policy, 41,
173-187. Uy, A. O. O. (2011). What motivates entrepreneurs? A study of the value systems of Filipino Entrepreneur. International Journal of
Entrepreneurship, 15, 73-97. Yu, T. F. L. (1998). Hong Kong’s industrial success: An entrepreneurial perspective. Asia Pacific Business Review, 4(4), 22-35. Yu, T. F. L. (2000). Hong Kong’s entrepreneurship: Behaviours and determinants. Entrepreneurship & Regional Development,
12(3), 179-194.
Chinese Business Review, ISSN 1537-1506 January 2013, Vol. 12, No. 1, 62-69
Analysis of Managing Creativity for Entrepreneurs
Ati Cahayani Atma Jaya Catholic University, Jakarta, Indonesia
In Indonesia, open unemployment until August 2011 was 7,700,086. Although this number has decreased
compared with the number of unemployed in February 2011, which is 8,117,631, but the decline is not very
significant. Unemployment occurs because labor forces are not absorbed into employment. One way to reduce
unemployment is to open their own employment or become entrepreneurs. In fact, the government of Indonesia has
made some efforts to the growth of new entrepreneurs, for example, by providing funding for student
entrepreneurship program to a number of universities in Indonesia. However, efforts by the government are useless
if there is no intention in the individual itself, and there are five factors driving intention in entrepreneurship, which
invest, creativity, market opportunity, autonomy, status. Meanwhile, some researchers have conducted research
about factor which driving the entrepreneurial intention. The result of that research shows that the most
encouraging factor is the creativity. However, creativity must be managed properly in order to give optimal results.
This article wants to analyze the management of creativity among entrepreneurs in order to give optimal results.
The research was conducted among young entrepreneurs, which are still a college student or had graduated from
college. The total informants for this research are five informants from three private universities/colleges. This
research used interview to collect data. This study attempted to process qualitative data obtained from interviews
with young entrepreneurs. The result of this research is all of the respondents use some techniques to maintain and
enhance creativity, such as “allow you to creative”, “think out of the box”, and “be persistent”. From the findings of
this study, it also can be seen that the young entrepreneurs are able to overcome the barriers to creativity, “believing
that I am not creative”.
Keywords: managing and enhancing creativity, entrepreneurs, barriers to creativity
Introduction
In Indonesia, open unemployment until August 2011 was 7,700,086 (Biro Pusat Statistik, 2012). Although this number has decreased compared with the number of open unemployment in February 2011, which is 8,117,631, the decline is not very significant. That data can be seen in Table 1.
Meanwhile, from Table 1 we can also see that on August 2011, there are 492,343 open unemployment from bachelor degree (Biro Pusat Statistik, 2012). The number of this open unemployment is greater than the number of open unemployment from diploma on August 2011 amounted to 244,687 people (Biro Pusat Statistik, 2012).
Ati Cahayani, Doctor of Education Management, Department of Business Administration, Faculty of Business Administration
and Communication Sciences, Atma Jaya Catholic University. Correspondence concerning this article should be addressed to Ati Cahayani, Jl. Jenderal Sudirman Kav 51, Jakarta Selatan,
Jakarta, 12930, Indonesia. E-mail: [email protected]; [email protected].
DAVID PUBLISHING
D

ANALYSIS OF MANAGING CREATIVITY FOR ENTREPRENEURS 63
That condition indicates that graduators from diploma are more easily absorbed in the workforce rather than people with bachelor degree.
Table 1 Open Unemployment of Bachelor Degree and Diploma (Year of 2004-2011) Year Diploma Bachelor degree 2004 237.251 348.107 2005 (Feb.) 322.836 385.418 2005 (Nov.) 308.522 395.538 2006 (Feb.) 297.185 375.601 2006 (August) 278.074 395.554 2007 (Feb.) 330.316 409.890 2007 (August) 397.191 566.588 2008 (Feb.) 519.867 626.202 2008 (August) 362.683 598.318 2009 (Feb.) 486.399 626.621 2009 (August) 441.100 701.651 2010 (Feb.) 538.186 820.020 2010 (August) 443.222 710.128 2011 (Feb.) 434.457 612.717 2011 (August) 244.687 492.343 Note. Source: Survey of National Labor Force 2004-2011. Retrieved from http://www.bps.go.id/tab_sub/view.php?kat=1&tabel=1&daftar=1&id_subyek=06¬ab=4.
One way to reduce unemployment is by have business or turn into entrepreneurs. In fact, Ministry of Education and Culture of Indonesia since 2009 has launched the Student Entrepreneurial Program (PMW). The program is intended to provide sufficient knowledge, skills, and entrepreneurial spirit based on science and technology to students in order to become strong and successful entrepreneur in the face of global competition (Ministry of Education and Culture of Indonesia, 2012).
However, efforts by the government are useless if there is no intention in the individual itself to run the business. Because, entrepreneurial intention is a significant initiative factor in the entrepreneurial process (Lo & Wang, 2007, pp. 21-43). According to Volery, Does, and Mazzarol (1997), there are five factors driving the entrepreneurial intention, which invest, creativity, market opportunity, autonomy, status. Meanwhile, Surya and Cahayani (2012) have conducted research about factor which driving the intention in entrepreneurship. The result of that research shows that the most encouraging factor is the creativity, whose MOS score is 4.28 of 5. Creativity here shows that an entrepreneur can express their creative ideas, without any limitations of the other party. Thus, the results of these studies suggest that the majority of respondents opted to become entrepreneurs because they can reveal their creativity.
But, creativity also can become barrier to start-up business. According to Robertson et al. (2003), eliminating of barriers to start-up is a key to stimulating people to start new business. Robertson et al. (2003) said one of the barriers to start-up business is lack of idea. Lack of idea has root on lack of creativity. They are some students who said that they think they cannot be good entrepreneur because they do not think that they have creativity. They said, they want to be entrepreneur but do not know how to be a creative person. And, some of them still think that creativity is a gift or divine feature. So, if they think that they have that gift, they can think or

ANALYSIS OF MANAGING CREATIVITY FOR ENTREPRENEURS 64
do something creatively. In addition, the entrepreneurs are required to have the creativity, especially since the business world is
changing very fast. Without creativity, the business cannot keep up with the times. The entrepreneur must strive so that they always have the creativity. So, creativity must be managed properly in order to give optimal results. This article wants to analyze the way to managing creativity among entrepreneurs in order to give optimal results.
This article is expected to provide new information on how to maintain and enhance creativity made by entrepreneurs, especially young entrepreneurs.
Conceptualization
Creativity is the highly ambiguous concept and gives a lot of meanings (Berglund & Wennberg, 2006). Nicholas and Stokes (2005) said, creativity is the generation of new idea. The official definition usually contains at least these two characteristics: newness and appropriateness (Henry, 2001). From the definition, it can be seen that creativity is useless if it cannot be applied or used.
In the business context, creativity often translated into idea development, new product innovations, and adapting or improving existing innovations (Berglund & Wennberg, 2006). From the definition above, we can say that creativity is the root of business. It can be said that “no creativity, no business”. In Indonesia, McDonalds is the first fast food restaurant that gives delivery service with one phone number (14045). This service is particularly useful for consumers because consumers do not need to remember a phone number long and is different for each branch. That service came about due to creative thinking.
But, most people think that they do not have enough creativity to start new business. Scarborough (2011) said there are 10 barriers to creativity: Searching for the one “right”; Focusing on “being logical”; Blindly following the rules; Constantly being practical; Viewing plays as frivolous; Becoming overly specialized; Avoiding ambiguity; Fearing looking foolish; Fearing mistakes and failure; Believing that “I’m not creative”.
To overcome those barriers, Scarborough (2011) also explains some ways to managing and enhancing individual creativity: Allow yourself to be creative; Give your mind fresh input every day; Observe the product and services of other companies, especially those in completely different market; Recognize the creative power of mistake; Notice what is missing; Keep a journal handy to record your thoughts and ideas;
ANALYSIS OF MANAGING CREATIVITY FOR ENTREPRENEURS 65
Listen to other people; Listen to customer; Talk to a child; Do something ordinary in an usual way; Keep a toy box in your office; Do not throw away seemingly “bad” ideas; Read book on stimulating creativity or take a class on creativity; Take some time off; Be persistent.
Methodology
This study used purposive sampling because the researcher only chooses respondents who are college student or alumni from some college or university who run business, at least starting one year before this research was held. Researchers selected five respondents with different businesses, which in farming of betta fish or fighting fish, cupcake and chocolate praline, product recycling, gas reseller, and traditional food.
This research attempted to process qualitative data obtained from interviews with young entrepreneurs. Researcher particularly wants to get in-depth data on how young entrepreneurs get creative, what things those lead them to creativity, and how they strive to be always creative.
Data
(1) Respondent P is alumni from Catholic University of Atma Jaya Jakarta. He is farming of betta fish or fighting fish. He started his business since five years ago, but sometimes the business stopped because he was busy with his studies. But, he did his business seriously in 2010. The idea to start business in this sector came from himself who saw a pretty good market opportunity. Although his business seems monotonous and does not require high creativity, but P still think creativity is important, and he have been done some creative efforts in his business. P has tried to think out of the box because if the rainy season comes, the room temperature becomes unstable so many fish seeds dead. P tried to maintain the room temperature, by using a light above the seedling containers made of Styrofoam, and it works. P claim that he must tried over and over to fit the room temperature with the need of the fish seeds. P argues that, creativity needs to be managed by always thinking positive and thinking out of the box, and dare to try things that others often regarded as something abnormal.
(2) Respondent L is alumni from Catholic University of Atma Jaya. She has been running chocolate praline and cupcakes business since 2010. She said, at first, that she tried to make and sell chocolate praline for fundraiser in her university. After she found that she can make money from that business, she made decision to run business in this sector. Respondent L think that one of her strength as an entrepreneur is have a lot of idea. And, the idea needed in chocolate cupcake and praline business, especially in terms of variation of cupcake decoration and chocolate praline content and form. Respondent L said, she must always try to have idea to make her product still favored by customer and to fulfill consumer need. She is getting new ideas for those things from magazines, the Internet, the survey results to the competitor. She also needs creativity for packaging and delivering her product, primarily to maintain the quality of the cake and chocolate up into the hands of customers. According to L, the creativity of
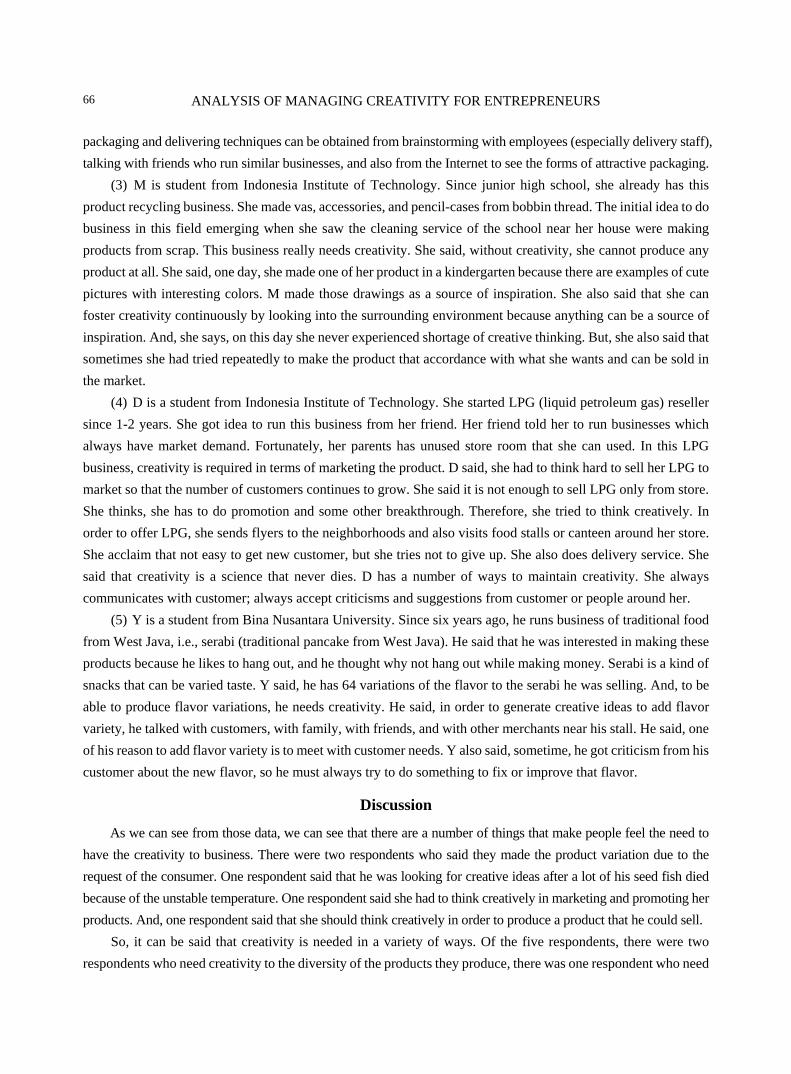
ANALYSIS OF MANAGING CREATIVITY FOR ENTREPRENEURS 66
packaging and delivering techniques can be obtained from brainstorming with employees (especially delivery staff), talking with friends who run similar businesses, and also from the Internet to see the forms of attractive packaging.
(3) M is student from Indonesia Institute of Technology. Since junior high school, she already has this product recycling business. She made vas, accessories, and pencil-cases from bobbin thread. The initial idea to do business in this field emerging when she saw the cleaning service of the school near her house were making products from scrap. This business really needs creativity. She said, without creativity, she cannot produce any product at all. She said, one day, she made one of her product in a kindergarten because there are examples of cute pictures with interesting colors. M made those drawings as a source of inspiration. She also said that she can foster creativity continuously by looking into the surrounding environment because anything can be a source of inspiration. And, she says, on this day she never experienced shortage of creative thinking. But, she also said that sometimes she had tried repeatedly to make the product that accordance with what she wants and can be sold in the market.
(4) D is a student from Indonesia Institute of Technology. She started LPG (liquid petroleum gas) reseller since 1-2 years. She got idea to run this business from her friend. Her friend told her to run businesses which always have market demand. Fortunately, her parents has unused store room that she can used. In this LPG business, creativity is required in terms of marketing the product. D said, she had to think hard to sell her LPG to market so that the number of customers continues to grow. She said it is not enough to sell LPG only from store. She thinks, she has to do promotion and some other breakthrough. Therefore, she tried to think creatively. In order to offer LPG, she sends flyers to the neighborhoods and also visits food stalls or canteen around her store. She acclaim that not easy to get new customer, but she tries not to give up. She also does delivery service. She said that creativity is a science that never dies. D has a number of ways to maintain creativity. She always communicates with customer; always accept criticisms and suggestions from customer or people around her.
(5) Y is a student from Bina Nusantara University. Since six years ago, he runs business of traditional food from West Java, i.e., serabi (traditional pancake from West Java). He said that he was interested in making these products because he likes to hang out, and he thought why not hang out while making money. Serabi is a kind of snacks that can be varied taste. Y said, he has 64 variations of the flavor to the serabi he was selling. And, to be able to produce flavor variations, he needs creativity. He said, in order to generate creative ideas to add flavor variety, he talked with customers, with family, with friends, and with other merchants near his stall. He said, one of his reason to add flavor variety is to meet with customer needs. Y also said, sometime, he got criticism from his customer about the new flavor, so he must always try to do something to fix or improve that flavor.
Discussion
As we can see from those data, we can see that there are a number of things that make people feel the need to have the creativity to business. There were two respondents who said they made the product variation due to the request of the consumer. One respondent said that he was looking for creative ideas after a lot of his seed fish died because of the unstable temperature. One respondent said she had to think creatively in marketing and promoting her products. And, one respondent said that she should think creatively in order to produce a product that he could sell.
So, it can be said that creativity is needed in a variety of ways. Of the five respondents, there were two respondents who need creativity to the diversity of the products they produce, there was one respondent who need

ANALYSIS OF MANAGING CREATIVITY FOR ENTREPRENEURS 67
creativity for products he makes and also for packaging and delivering products, and one respondent who need creativity to the production techniques of the business that he run. So, even if the business does look monotonous and its products can not be varied (such as LPG business reseller), but creativity is still needed for other aspects of business, such as in the field of product marketing. To help readers understand the explanation described above, the following is displayed in Table 2 contains a summary of those explanation.
Table 2 Aspect Business that Need Creativity Respondent Aspect business that need creativity P Technique to maintain room temperature
L Variety of content for praline and variety of product decoration for cupcakes. Packaging and delivering technique
M and Y Variety of product D Technique to selling and promoting the LPG
All of those respondents always trying to manage the creativity required in business by doing some ways that can lead to creative business ideas. For ease of the reader, the following display tables to describe efforts to manage creativity to help readers understand the explanation described above, the following is displayed in Table 3 contains a summary of those explanation.
Table 3 Activity to Managing and Enhancing Creativity
Respondent Activity to managing and enhancing creativity Activity to managing and enhancing creativity according Scarborough
P
Always thinking positive Thinking out of the box Dare to try things that others often regarded as something abnormal Must tried over and over to fit the room temperature with the need of the fish seeds
give your mind fresh input every day allow yourself to be creative be persistent
L
Reading magazines Browsing the Internet Survey results to the competitor Brainstorming with employees (especially delivery staff) Talking with friends who run similar businesses Always try to have idea to make her product still favored by customer and to fulfill consumer need
give your mind fresh input every day listen to other people listen to customer observe the product and services of other companies, especially those in completely different market be persistent
M
Talking with somebody Looking into the surrounding environment Tried repeatedly to make the product that accordance with what she wants and can be sold in the market
listen to other people give your mind fresh input every day be persistent
D
Communicates with customer Always accept criticisms and suggestions from customer or people around her tries not to give up
listen to other people listen to customer be persistent
Y talked with customers talk with family, friends, and with other merchants near his stallmust always try to do something to fix or improve that flavor
listen to other people listen to customer be persistent
From Table 3 it can be seen that majority of them use technique “listen to other people” and “listen to customer”. However, this can only be done by people who are willing to humbly listen to others and to their customers. They did not think himself as the most intelligent person and not feel as the most know everything.

ANALYSIS OF MANAGING CREATIVITY FOR ENTREPRENEURS 68
People who are willing to listen to others and listen to customers (especially criticism from customers) will get a lot of knowledge, and it can open up your mind about the best idea.
Meanwhile, some respondents use technique “give your mind fresh input everyday”. This can be done by a walk to look around, read a magazine, or by browsing the internet. Creative ideas can arise in a calm state of mind and by read or see something new.
But, only one respondent who use technique, “allow yourself to creative”. This respondent always tries to think “out of the box” and dare to try things that others often regarded as something abnormal. This is the most difficult thing to do because most of people think that she/he is not creative. Researchers have been met with a lot of students who can not think creatively so that after graduation they would prefer to be employees rather than entrepreneurs.
There is one interesting thing of the findings in the field. That is, all respondents using the technique “be persistent”. This is important because without determination and persistence, people will not continually try to find something new, innovative, and creative. When an entrepreneur straight up so having one failure in trying something new, he/she will not be able to sustain its business or his/her business can not grow.
Resume
From the explanation above, it can be concluded that young entrepreneurs have the ways to maintain and enhance their creativity. The respondent seeks creative thinking not only for the product but also creativity in marketing and production techniques. This is exciting because they have realized that creativity is required in all aspects of the business. So it can be said that they realized that creativity is the most important thing to their business sustainability.
However, from the above data, it can be seen that they only use a small number of techniques to maintain and enhance the creativity of the many techniques proposed by Scarborough (2011). They may need to expand the ways to still be able to think creatively, so that creative ideas could always emerge. But from some of the technique that they use, the most important technique is “be persistent”. Without determination and persistence, we can do or produce something new, unique, or innovative.
From the findings of this study, it can be seen that the young entrepreneurs are able to overcome the barriers to creativity, “believing that I am not creative”. They realize and believe that creative ideas can be obtained during an attempt to do that. Their business is expected to survive, and even more advanced with the creativity.
References
Berglund, H., & Wennberg, K. (2006). Creativity among entrepreneurship students: Comparing engineering and business education. International Journal of Continuing Engineering Education and Lifelong Learning, 16(5), 366-379.
Biro Pusat Statistik (Centre Bureau of Statistic). (2012). Pengangguran terbuka menurut pendidikan tertinggi yang ditamatkan 2004, 2005, 2006, 2007, 2008, 2009, 2010, dan 2011. Retrieved August 6, 2012, from http://www.bps.go.id/tab_sub/view.php?kat=1&tabel=1&daftar=1&id_subyek=06¬ab=4
Henry, J. (2001). Creativity and perception in management. London: Sage Publications. Kementrian Pendidikan dan Kebudayaan (Ministry of Education and Culture of Indonesia). (2012). Program mahasiswa wirausaha.
Retrieved October 8, 2012, from http://www.dikti.go.id/?page_id=447&lang=id Lo, C. M., & Wang, J. R. (2007). The entrepreneurial intention under environmental uncertainty. Journal of Accounting, Finance &
Management Strategy, 3(1), 21-43.

ANALYSIS OF MANAGING CREATIVITY FOR ENTREPRENEURS 69
Nicholas, C. W., & Stokes, D. (2005). Managing creativity and innovation: The challenge for cultural entrepreneurs. Journal of Small Business and Enterprise Development, 12(3), 366-378.
Robertson, M., Collins, A., Medeira, N., & Slater, J. (2003). Barriers to start-up and their effect on aspirant entrepreneurs. Education & Training, 45(6), 308-316.
Scarborough, N. M. (2011). Essentials of entrepreneurship and small business management (6th ed.). Upper Saddle River, NJ: Pearson.
Surya, A., & Cahayani, A. (2012). Analysis of entrepreneurial intentionality of student in faculty of business administration and communication sciences, Atma Jaya, Catholic University. In N. Sarinastiti et al. (Eds.), Entrepreneurship in Global Competition. Jakarta: Atma Jaya University Publisher-Jakarta.
Volery, T., Does, N., & Mazzarol, T. (1997). Triggers and barriers affecting entrepreneurial intention: The case of western Australia nascent entrepreneurs. Proceedings from 42nd ICSB World Conference, San Francisco.
Chinese Business Review, ISSN 1537-1506 January 2013, Vol. 12, No. 1, 70-76
Application of Recent Technologies in the
Concept of Modern Business
Danica Tadic Ministry of Finance and Economy, Belgrade, Serbia
In the era of over communications and hyper concurrency, people are overloaded with the offer of information,
ideas, products, and services. Information is easy and unbelievable prompt available all over the world. Customers,
concurrency, and innovators have immediate access to each other changes in technology, especially those in
informatics and technology of communication are transforming the era of informatics to the era of knowledge. The
aim of this paper is to make an overview of the most up-to-date novelties in technology, especially those that were
enabled by ICT, as well as to direct to some of the potential of the future evolution in business process that is open
to the innovations.
Keywords: ICT, economy of knowledge, internet economy, virtual company
In principle, appropriate usage of technology maintains two elements of improvement: efficacy and effectiveness. As for the efficacy, technology promotes improvements widening and evaluation of information at all level of organization and further lower the risk of error considerably. With regard to the effectiveness,
Introduction
The tempo of changes and evolution of technology has considerably accelerated in last decades. Kotler and Kevin (2006) has defined the technology as the most important power in determining the human destiny. For example, just few years ago only small number of people had access to the mobile telephone, most of the population used fixed phone lines for communication. Today’s digital phones are everywhere: almost everybody has the direct access to the local, national, and global connections. And that happened in one blink. Unambiguously, that tansformation was positive for the society, factories, and individuals. Nowadays and meanwhile even intermediate enterprises have well organized system of informations accessible to the strong applications capable to elaborate, analyse, and interprete data with no quantitative restrictions. The influence of ICT could be clustered in at least three different categories: economic, business, and social. Those three are intertwined, in the sense that what happens in one is the cause and consequence of what is going to happen in the other. Nevertheless, it is useful to evaluate them all separately. Business management contributed to the application of ICT in any organization enabling the access to the resources that are contributing to the improvement of efficacy.
Danica Tadic, Ph.D. candidate, Directorate of Measures and Precious Metals, Ministry of Finance and Economy. Correspondence concerning this article should be addressed to Danica Tadic, Mike Alasa 14, 11000 Belgrade, Serbia. E-mail:
DAVID PUBLISHING
D

APPLICATION OF RECENT TECHNOLOGIES IN THE CONCEPT OF MODERN BUSINESS 71
technology enables application of company resources in many ways, growth of efficacy of the tasks or processes, which are undertaken. Strategic technology turned out to be important part of business strategy and potentially competitive advantage or deficiency at the global trade.
Crisis as the Opportunity
The challenge is now more important because many counties are thinking about new models of growth and development after global economy crisis. This is the field where technology and especially ICT could play key role, even if there are no solutions to guarantee the success (World Economic Forum, 2010). One of the most sensible and casting strategic responsibilities of the management team is their capability to precisely predict the future. In any environment, access to the information in correct form and in time, for the executive management team enables development of effective and active vision of the future. All corporative leaders, no matter to the section of their businesses, enterprises they are responsible for or the size of the trade to support, must sooner or later make decisions in at three fields: to define the applications most appropriate for the improvement of the distinctiveness of the process; to select the equipment, infrastructure, and tools that are going to optimize; and to enable contribution of ICT for the business and model that are the best for the management of the technology available for the different characteristics of organization.
Key change in global economy concerns the change of the fundamental competitiveness’ advantage of enterprises and functions of the management. Lowered costs of information’s course, growth of the trade, liberalization of the trade of products and labor, deregulation of finances courses have put at the second level traditional sources of competitive differentiations and pointed at the new cores as the base in creating the values. That fundamental core concerns the development and usage of invisible property, where the knowledge, competency, and intellectual property rights are of the most importance. One of the key tasks of contemporary managers is to provide, develop allocate resources of the organization. Technology is the resource of the most importance for numerous organizations. To manage the resources to attain, maintain, and develop competitive advantage comprises integration of technology with the strategy of the enterprise.
The second key task of the manager is development and usage of the capacity of the innovation in the enterprise. Activities that are enrolling in the process of innovation in the company are complex and risky, unpredictable, expensive, and very often with the uncertain results concerning the trade success. Competitive advantage has relative dimension—that is the result of comparison of the activity of the company to the activity of the concurrency, as well as the absolute dimension, which is the result of the existence of the trade of the company product.
Analysis of the Old Industrial and New Economy Having in mind that in the era of digital economy (economy of knowledge) knowledge represents the power,
ICTs that are creating fast and easily, exchanges and application of knowledge, faster and much more then ever, represents the method of using that power the best way.
Data on trade, companies, and labor in old industrial economy and new economy of knowledge are presented in Table 1. If we look to the trade of old economy (column 2, cell 2) we can see that they are slow, linear, and predictable and magnitude based. On the other side, the acceptance of knowledge as the primary source of value in column 3, cell 3, brings new economy to the top of those that are managing the knowledge

APPLICATION OF RECENT TECHNOLOGIES IN THE CONCEPT OF MODERN BUSINESS 72
effectively, discovering, and combining the knowledge in new products and services faster than the concurrency. Internet changed fundamental nature of business and concurrency. New modalities of building, delivery of the products and services appeared and concurrency enabled that people became the most precious resource that were not properly exploited in companies. The comparison of companies in column 2, cell 5 shows that the old economy was based at the capital and automation. We can see that in the new economy, as presented in column 3 cell 6, all employees are the treasury of knowledge and central part of the company concurrency advantage, top management can not support on his own the competitiveness of the company. Only possession of skill of the management is not enough for the success in managing in nowadays business world. Companies should understand the difference between management and leading, and they should know how to integrate the two roles as to achieve the success in organization.
Table 1 Old Industrial and New Economy of Knowledge Emission Old industrial economy New economy of knowledge Trades Development of economy (1) Growing, quite predictable (2) Not stable and chaotic (3) Changes in trade Slow and linear Fast and unpredictable Key economies Large industry companies Companies based at knowledge Scope of competition Local Global Competition Quantity: large eats small Velocity: fast eats slow Company The tempo of business (4) Slow down (5) Faster, expectation of customers (6) Point at to the Stability Managing the changes Success Profit Trade capitalization (trade’s price of the whole company) Key starts up for grow Capital People, knowledge and skills Key sources of innovations Research System innovation, knowledge management
Key technology Automation and mechanization Information and communications technologies, IT business, production and computer aided design
Modest resources Finances’ capital Human Capital Processes of innovation Periodical, linear Continual, system’s innovation
Business model Traditional: command and control New business model: redirected to people and knowledge, coherency
Labor Top management (7) Vertical (8) Self-management (9) Request for the education Skill or level Continual learning Management of the employees relationships
Confrontation
Cooperation, team work
Employee seen as Expenditure Investment
In the new era of fast changes and knowledge-based companies, management business became more difficult task. Technology and innovations have key role in increasing the productivity, development of new products, services and in creating absolute and comparable advantages. Internet technologies could play that role in supporting innovations’ changes in design of the courses of business, as well as the requests of business and organigram in company. If we compare cells 8 and 9 at the level of the labor, there is a change in the approach of the company to their employees, greater attention is to the knowledge and capabilities. People become very important. System’s opinion, capability to accept holistic point of view, including many different types or relations among multiple elements in complicated system, means overcoming largest obstacles in building business processes and success of the company in obtaining the results higher than the sum of the parts of the

APPLICATION OF RECENT TECHNOLOGIES IN THE CONCEPT OF MODERN BUSINESS 73
whole system. If you intend to become a new manager, you should understand that your art of working with people is the most important to build up. Your capability to influence the other and to motivate them to acquire corporative objectives is the most important talent of the manager.
Based on the previous analysis we can conclude that the new economy is characterized by the knowledge as the main component of the product and service, and that this is dramatically more ranked and became dominant component for the customer. Tempo of changes is so fast that the new companies are dominating and they completely marked the new era of the business that is based at knowledge, changes, and globalization (see Table 2).
Table 2 Three Powers of the New Economy Order
Knowledge Intellectual value or capital as the strategic factor; set of comprehensions that are used by people in decision making or undertaking actions important for the company
Changes Continual, fast, and complex; make uncertainty and lower prediction
Globalization Technology, production, trade, finances, communication, and information are resulting in opening the economy, global dependence, and business
Knowledge—faster transactions at the global trade, reconstruct the course of investments, goods, and services, changes in everyday’s social and professional life of the people, growth of the quantity of the available information in private and public sector, as well as the consequences and usage of ICT are spreading faster. New ICT is the milestone of the development of the economy (society) of the knowledge and capability of the access to the ICT and their usage has the key role in the personal and social advancement. Instead of capital, information and knowledge became the base unit of individual and social growth.
Changes—tempo of progress in technology is faster and ICT became more present in behavior of the people in social nets, business praxis and in governmental activity. Dramatic changes in competition, technologies, labor, and values are provoking companies to search the new modalities in enlarging the production and concurrency. Possibility to access large information in only a few minutes, long distance communication at a lower cost, improvement of quality and practicality, transforms the way people communicate in companies.
Globalization—global internet economy enables faster growth in developing countries, faster expansion of their consumer’s class and development of the wireless technology. Factors that are influencing especially to the spreading of Internet are: accessibility of PC and density of the existing fixed telephones. All over the world, technology can help to the people and to the individuals to realize ideas in reality and to overcome stagnation in development. Determined leaders are discovering coming business potentials and are strengthening employees through the inspiration and development of the net of possibilities. Inspired leaders create the culture in the frame of their organization. They create common vision and inspire people to attain more.
Motivated people are of the key importance to the development and execution of strategies, at all levels, supporting all big improvements.
Knowledge as the Source of the Business Value In economy, where only certainty/uncertainty is the only certain source of the secret competitiveness’
knowledge is the advantage. When trades changes, technology reproduce, competitors multiplies, and products becomes obsoletes almost over night, successful companies are the ones that are making new knowledge, spread the knowledge in the whole organization and model the knowledge in new technologies and products (OECD, 1996). Those activities define “knowledge-creation” companies whose only occupation is continual innovation.

APPLICATION OF RECENT TECHNOLOGIES IN THE CONCEPT OF MODERN BUSINESS 74
Many companies can create solely permanent competitive advantages if they turn into knowledge based companies or organizations where education/learning is of the most importance. They are using two kinds of knowledge. One is explicit knowledge, such as data, documents, and things written or memorized in PCs. The other kind is the concealed knowledge of the labor. This knowledge represents very often the most important information in organization. Long-term employee in company knows many things on production of the goods or offers of the services, as well as about the sale and how to work with the equipment. This silent knowledge is not documented or coded anywhere that knowledge had the evolution in the years of experience. In addition, large part of this silent knowledge employees do not share with the people in position that should screen them formally, as they are not enough motivated to do that, or simply “nobody asked them about it”.
Successful knowledge management creates techniques, technologies, and system to encourage employees to share their knowledge. Knowledge management is becoming one of the main strategic applications of the IT. This information encompasses processes, procedures, patents, reference papers, formulae, best praxis, prognosis, and repair. Internet, Intranets, Web sites, Groupware are designed to support fast reverse information in the knowledge of the employees, to initiate changes in behavior of employees and to improve business performance. This integration helps the companies to become more innovative and faster provider of high quality products and services as well as very strong competitor on the trade.
Internet Economy
That is economy based at the digital technology, including digital net of communication (Internet, Intranets, as well as value added private nets—VANS), PCs, software and other technologies of informatics. Digital connections and infrastructure of communication enabled global platform in which people and organization are in the position to work together, communicate, cooperate, and search the information. Development of the Internet economy in the near future will have as result the numerous new applications, services, and devices at disposal. All those will improve the quality of the people, growth of the productivity in the organization and provision of the foundations for the completely new business models, that could not exist without mobile Internet (World Economic Forum, 2010). New consumer’s electronics, including smart phones, notebooks, tablet PCs, mobile media, video players, and book readers, facilitates widening the activities of users in the world, far away of their desks. Velocity in delivery of mobile and good quality wireless nets is improving all the time and will have a big jump with new generation of 4G net. 3G net are designed for voice and 4G net to launch data. Those innovations will be applied and in use of services that are location based, in order to improve the quality of the search, the communication tools, social nets, games, applications, and intended advertizing. Most likely, the highest influence to the economy will come over companies and other organizations that are adopting mobile wideband applications. Man workers, especially those in sectors such as transport, trade, health care, and some small sales, work far from the PCs that are connected to the internet. For dozen millions of workers that ate in their business mobile (such as taxi drivers, pilots, postman, traders, clerks, serviceman, building workers, worker in agriculture, ranchers, fisherman etc.), mobile internet enables them to connect to the powerful technology that were accessible only to the offices employees and the result of that is that all those will be put in the position to work with better efficacy.
Modern business models are in fact web based systems, whose applications or services are available from the

APPLICATION OF RECENT TECHNOLOGIES IN THE CONCEPT OF MODERN BUSINESS 75
server and as such are accessible from any place over Internet service (like World Wide Web) that is available in Web.
Virtual Companies Information technology enables the companies to become partners with the providers, distributers, and
producers. Cooperation over Web portal that is chain based system provision, significantly improve their capabilities in usage of innovative business possibilities.
In dynamic global business environment, the forming of virtual company could be one of the most important strategic usages of information technology. Virtual company (virtual corporation or virtual organization) is organization that is using information technology to connect people, organizations, means, and ideas (Martinez, Foultier, Park, & Favrel, 2001). In virtual companies, virtual working groups are formed as well as the unions with the business partners that are connected over Internet, Intranet, and Extranet. It is notorious that those companies are organized internally in the process of clusters and cross-functional teams, connected in Intranet. They develop unions in external net of links that create inter enterprise information systems to the providers, customers, co-operant, and concurrency.
So, virtual companies create flexible and adaptive virtual working groups and unions that are of the key importance in exploiting the velocity in exchange business capabilities. Why people form virtual companies? That is the best way to conduct key business strategy and unions that offers promises for success in nowaday’s business turbulence? For example, company can not have time or resources to develop necessary production, infrastructure of distribution, personal functions, and information technologies to make new trade capabilities to the full extent. Information technology can enable the company to develop relationships with their clients in virtual communities that are helping the company to become leading innovator. Nowadays, of course, internet, intranet, and extranet as well as many other internet technologies are vital components in creation of those successful solutions.
New Dimensions in Business Area
New values are the set of expressions to rate corporative performances in economy: speed at the trade, cycle period in development of new products, number of electronic connections to the providers, customers, and partners. In this new world the focus is put at the way the nature of values is changing, including the new price of the goods, information, and emotions. Implication of the new shapes of exchange is the transfer of the power from the producers to the customers. There are many present values: economic, informative, and emotive. Companies should think about the offer, including linkage of goods and services and to use the knowledge in order to provide added value to their customers, and not only the “sale of the service”. User focused companies are using internet, intranet, extranet, e-commerce, and web locations to offer goods, services, and information always and in any moment, offering individual customer or user friendly service anywhere. The power of the punch of the technology, rise of economy, trade evolution, shift in customers’ taste, social changes, and events in politics could widen or shorten business space. Potentials for innovators in technology or strategy are high, modern time produces great interruptions in continuity, create new industry, destroy old and accelerate growth in economy. Business space, technology, processes and models in business are becoming more complicated offering new possibilities for those that are entering new environment to create higher values. The power of customers has increased, the lack of goods and services is replaced with the abundance. The key reason for that is

APPLICATION OF RECENT TECHNOLOGIES IN THE CONCEPT OF MODERN BUSINESS 76
the fast development of the technology that enabled the growth of the production and productivity at lower cost. That enabled the entrance and spreading of industry of all kinds. At the same time, customers became more sophisticated and informed. Many products became virtual goods and fast changes in technology dramatically shortened the life cycle of products. The trade of capital evolved significantly. New investors are more informed, more innovative and active, and that is why they became the carriers of the changes demanding superior performance and corporative transparency. Concurrency is now more based at the capabilities than at the means. Simultaneously, knowledge labor became more mobile at the trade and old style of loyalty of employees has died. Due to the growing demography changes dual careers couples, family values, and free time.
From the customer point of view this process save money, increase pleasure, and give quicker results, from the manager perspective, the most important advantage of business is to safe expenses and time.
Conclusions
Based on the research that were conducted in this paper, it is possible to conclude that improvement of speed and quality of the wideband approach from the Web 2.0 technology and application, economy, and social dynamics will change dramatically all over the world, along with the large implications concerning productivity and new potentials for individuals. That concerns: creation of Internet economy, building of digital highways, guaranteed technologies, ICT influence to the lowering of poverty, ICT contribution to fulfill the decades’ challenge, localization 2.0, and ICT effective social strategy. At the scene of nowadays, is so called game of null profit that is based on competition in which everybody has his own corridor to go up and improve. On the other side, new concurrency of brains storming is absolutely based on the principle: win or loose. In trade competition not everybody is using completely the same strategies, but it is quite evident that all players have the very same starting point.
Based on the dominant weapon that the concurrency is going to apply in 21st century will be education and skills of the employees, as well as the intelligence of the management. Digital economy, contrary to the industrial economy from the past, does not rely on natural resources, but on smart ambitious individuals.
References Ahuja, M. K., & Charley, K. M. (1998). Network structure in virtual organizations. Journal of Computer-Mediated Communication, 3(4),
1-34. Bjelić, P. (2011). Internet as the media and platform of contemporary business. Belgrade: Faculty of Economy. Cisco & Global Business Network. (2010). The evolving internet: Driving forces, uncertainties and four scenarios to
2025.Retrieved from http://www.monitor.com/Portals/0/MonitorContent/imported IMF (International Monetary Fund). (2010). World economic outlook. Retrieved from http://www.imf.org/external/pubs/ft/ ITU (International Telecommunication Union). (2010). ICT indicators. Retrieved from http://www.itu.int/publ/ Kotler, Ph., & Kevin, L. K. (2006). Marketing management. Belgrade: Data Status. Martinez, M. T., Fouletier, K. H., Park, K. H., & Favrel, J. (2001). Virtual enterprise—Organization, evolution and control.
International Journal of Production Economics, 74, 225-238. OECD. (1996). The knowledge-based economy. Paris: STI Outlook. Palmer, W. J., & Speier, C. (1997). A typology of virtual organizations: An empirical study. Proceedings from ACIS. Indianapolis, IN. Qiang, C. Z. W., Rosotto, C., & Kimura, K. (2009). Economic impacts of broadband. Information and communications for
development 2009 (p. 45). Washington, D.C.: World Bank. World Bank. (1998/1999). Knowledge for development. New York: World Bank and Oxford University Press. World Economic Forum. (2008-2009). The global informationtechnology report: Mobility in a Networked World. Geneva: World
Economic Forum. World Economic Forum. (2010-2011). The global information technology report (pp. 33-34). WEF GITR 2010.

Copyright © 2022 FDOKUMEN