China-USA Business Review (ISSN 1537-1514) Vol.14, No.3, 2015
60
-
Upload
independent -
Category
Documents
-
view
0 -
download
0
Transcript of China-USA Business Review (ISSN 1537-1514) Vol.14, No.3, 2015


China-USA
Business Review
Volume 14, Number 3, March 2015 (Serial Number 141)
David
David Publishing Company
www.davidpublisher.com
PublishingDavid

Publication Information:
China-USA Business Review (ISSN 1537-1514) is published monthly in hard copy and online by David Publishing
Company located at 1840 Industrial Drive, Suite 160, Libertyville, IL 60048, USA.
Aims and Scope:
China-USA Business Review, a monthly professional academic journal, covers all sorts of researches on Economic
Research, Management Theory and Practice, Experts Forum, Macro or Micro Analysis, Economical Studies of Theory
and Practice, Finance and Finance Management, Strategic Management, and Human Resource Management, and other
latest findings and achievements from experts and scholars all over the world.
Editorial Board Members:
Kathleen G. Rust (USA)
Moses N. Kiggundu (Canada)
Helena Maria Baptista Alves (Portugal)
Marcello Signorelli (Italy)
Doaa Mohamed Salman (Egypt)
Amitabh Deo Kodwani (Poland)
Lorena Blasco-Arcas (Spain)
Yutaka Kurihara (Japan)
Shelly SHEN (China)
Salvatore Romanazzi (Italy)
Saeb Farhan Al Ganideh (Jordan)
GEORGE ASPRIDIS (Greece)
Agnieszka Izabela Baruk (Poland)
Goran Kutnjak (Croatia)
Elenica Pjero (Albania) Kazuhiro TAKEYASU (Japan)
Mary RÉDEI (Hungary)
Bonny TU (China)
Manuscripts and correspondence are invited for publication. You can submit your papers via Web Submission, or
E-mail to [email protected], [email protected]. Submission guidelines and Web
Submission system are available at http://www.davidpublisher.com.
Editorial Office:
1840 Industrial Drive, Suite 160, Libertyville, IL 60048, USA E-mail: [email protected]
Copyright©2015 by David Publishing Company and individual contributors. All rights reserved. David Publishing
Company holds the exclusive copyright of all the contents of this journal. In accordance with the international
convention, no part of this journal may be reproduced or transmitted by any media or publishing organs (including
various websites) without the written permission of the copyright holder. Otherwise, any conduct would be
considered as the violation of the copyright. The contents of this journal are available for any citation, however, all
the citations should be clearly indicated with the title of this journal, serial number and the name of the author.
Abstracted / Indexed in:
Database of EBSCO, Massachusetts, USA
Ulrich’s Periodicals Directory, USA
ProQuest/CSA Social Science Collection, PAIS, USA
Cabell's Directory of Publishing Opportunities, USA
Summon Serials Solutions, USA
ProQuest
Google Scholar
Chinese Database of CEPS, OCLC
ProQuest Asian Business and Reference
Index Copernicus, Poland
Qualis/Capes index, Brazil
NSD/DBH, Norway
Universe Digital Library S/B, ProQuest, Malaysia
Chinese Scientific Journals Database, China
GetCITED, Canada
CiteFactor, USA
Polish Scholarly Bibliography (PBN), Poland
SCRIBD (Digital Library), USA
PubMed, USA
Open Academic Journals Index (OAJI), Russian
Electronic Journals Library (EZB), Germany
Journals Impact Factor (JIF) (0.5)
NewJour, USA
InnoSpace, USA
Publicon Science Index, USA
Scholarsteer, USA
Turkish Education Index, Turkey
Universal Impact factor, USA
BASE, Germany
WorldCat, USA
Subscription Information:
Print $640 Online $480 Print and Online $800
David Publishing Company, 1840 Industrial Drive, Suite 160, Libertyville, IL 60048, USA
Tel: +1-323-984-7526, 323-410-1082 Fax: +1-323-984-7374, 323-908-0457
E-mail: [email protected] Digital Cooperative Company: www.bookan.com.cn
David Publishing Company
www.davidpublisher.com
DAVID PUBLISHING
D
China-USA Business Review
Volume 14, Number 3, March 2015 (Serial Number 141)
Contents
Economics
Concept of Transaction Costs and Its Influence on the Development of Offshore Outsourcing 117
Elżbieta Marcinkowska
The Level of the Financial Inclusion in the African Countries and in the World Group Regions 129
Kokou Adalessossi
Management
Policy, Legal, and Institutional Frameworks for PPP Implementation in Development Process:
Stakeholders’ Perspective 143
Teshome Tafesse
Knowledge Management Strategies in Public Sector—Case Study 159
Salwa Alhamoudi

China-USA Business Review, March 2015, Vol. 14, No. 3, 117-128
doi: 10.17265/1537-1514/2015.03.001
Concept of Transaction Costs and Its Influence on the
Development of Offshore Outsourcing
Elżbieta Marcinkowska
AGH University of Science and Technology, Krakow, Poland
The theory of transaction costs is one of the major and most important trends of new institutional economics. It is
concerned with selecting the most effective method of regulating transactions. The analysis of transaction costs
requires a new look at the concept of hierarchy and market in a company. Whether companies pursue actions inside
a company or whether they transfer them to a specialised supplier is determined by a comparison of both solutions,
including comparison of their transaction costs. Companies implement solutions which are characterised by lower
transaction costs. The article presents the concept of transaction costs and its impact on the development of
outsourcing, in particular, one of its varieties, offshore outsourcing.
Keywords: outsourcing, offshore outsourcing, transaction costs, effectiveness, Poland
Introduction
The transaction costs reflect expenditures incurred in order to reduce uncertainty, namely costs of
searching, gathering, and processing information, as well as costs related to selecting a supplier, drawing up a
contract, and coordinating the course of its implementation. These costs accompany every transaction
concluded in the modern economy. Until recently, transaction costs of actions implemented in internal
structures of a company were lower than those related to implementation of activities by the market. This
situation has completely changed in the last two decades. New conditions of operations of companies related to
the process of globalisation and rapid technological development lead to modern business models being shaped.
Outsourcing is such a phenomenon in the contemporary management of a company. For many years, this
concept has been establishing its position in theory and practice of management. Outsourcing still evolves by
offering new solutions in terms of operations of an organisation. As far as the transfer of tasks outside the
company is concerned, they are transferred to outsourcing companies operating on the domestic market
(outsourcing) and those available abroad (offshoring). Why do companies transfer certain areas of their
previous activity outside so willingly? This is a result of changes in transaction costs. The suppliers of
outsourcing services perform these actions cheaper than companies on their own.
The purpose of this article is an attempt to outline the influence of transaction costs on the development of
offshore outsourcing. The article presents the method of determining the effectiveness of offshore outsourcing
and the problem of measuring transaction costs. At the end of the article, the development of offshore
Elżbieta Marcinkowska, Ph.D., assistant professor of management, Department of Economics, Finance and Environmental
Management, Faculty of Management, AGH University of Science and Technology, Krakow, Poland.
Correspondence concerning this article should be addressed to Elżbieta Marcinkowska, AGH Faculty of Management,
Gramatyka 10, 30-067 Krakow, Poland. E-mail: [email protected].
DAVID PUBLISHING
D

INFLUENCE ON THE DEVELOPMENT OF OFFSHORE OUTSOURCING
118
outsourcing in Poland, which became an important place for offshore investments, is presented.
Offshore Outsourcing—Definitional Approach
The concept of outsourcing consists in sectioning selected functions (tasks) beyond a company and
transferring them for implementation to specialised outsourcing companies. The definition of outsourcing is
broad and ambiguous in world literature. The author presenting the idea of outsourcing highlights its various
aspects. Lei and Hitt (1995) defined outsourcing as transferring production to external suppliers. Perry (1997)
emphasised the role of employment in the concept of outsourcing. Tasks which used to be performed by the
employees of a company are transferred to be performed by the employees of an external company. Sharpe
(1997) stressed the definition of outsourcing that functions which are not basic competences of a company are
subject to sectioning. Gilley and Rasheed (2000) defined outsourcing as something that was originally
delivered internally or could have been delivered internally, but the decision to order it on the outside has been
made. A broader definition of outsourcing was provided by Lysons and Gillinham (2003), who specified this
concept as the strategic use of resources to perform activities traditionally handled by internal staff and their
resources. This is a managerial strategy consisting in separating certain support functions from the
organisational structure and entrusting specialised external organisations with implementing them. This is
providing a third party with permanent managerial liability for performing a service specified in the contract.
Offshoring is a concept in company management which has become more and more significant in recent
years. Business entities decide to transfer production activities abroad in order to achieve specific corporate
goals. Subject literature often fails to distinguish between offshoring and outsourcing and uses the two concepts
interchangeably. This is an incorrect approach. Outsourcing is a practice of separating by companies’ certain
activities from their own organizational structure and transferring them to outside entities, to other business
partners based in the same country. Offshoring leads to a separation of selected services and transferring them
for implementation to companies based in a different country.
Offshoring is defined as a process as a result of that services are executed on the territory of another
country. This process may be provided by the company internally (captive offshoring) or by a foreign business
partner (offshore outsourcing). This leads to the differentiation of two basic types of offshoring:
Captive offshoring is a process as a result of which the company forms a branch abroad or an equity
related company. This allows the company to retain complete control over the transferred production or service
processes;
Offshore outsourcing is a process consisting of transferring selected production or service activities to an
external company, non-equity related, conducting business activities in another country.
Another classification of offshoring is based on the criterion of location of the offshoring company. The
following forms of offshoring should be then distinguished: offshore, nearshoring, and farshoring. Nearshoring
is defined as cooperation among entities in markets which are geographically and culturally close. Offshore is
the cooperation among entities in markets which are remote in geographical terms, but close in cultural and
economic ones. Farshoring is a market which is geographically, culturally, and economically remote.
As it has been already mentioned, offshoring is a concept in business management successfully
implemented all around the world. Companies adopting offshoring seek mainly the following benefits:
the possibility opportunity to focus on primary activities;
improvement in the quality of provided services, resulting from the work of highly-qualified employees;
INFLUENCE ON THE DEVELOPMENT OF OFFSHORE OUTSOURCING
119
improvement in competitiveness or gaining a competitive advantage;
introduction of innovative solutions;
greater customer satisfaction (Marcinkowska, 2013).
The development of offshoring commenced successfully many years ago, when international companies
transferred their production services abroad. Various industry branches, in particular, the clothing industry (e.g.,
Puma and Nike) and the automotive industry (e.g., Porsche and Daimler—Chrysler), transferred their
production to the Far East as well as to Central and Eastern Europe. The next widely used offshoring service
was the IT service. The share of service offshoring has been growing for several years. Typical business
functions became of a dominant significance in offshoring services. Offshoring companies began to create
service centers on a global scale in order to efficiently and effectively handle their customers. Offshoring
entities operating in the international market include:
shared service centers (SSC);
business process outsourcing (BPO);
information technology outsourcing (ITO);
research & development (R&D);
call centers (CC).
Such a wide service offer on the international level requires offshoring entities to employ workers with
varied competencies and qualifications. Some offshoring services are typical of a repeated nature and do not
require specialized knowledge. However, highly-specialized services based on knowledge (knowledge process
offshoring—KPO) are becoming more and more significant in offshoring activities. The implementation of
these services requires employees to have high qualifications, experience, and knowledge.
Theoretical Perspective of Transaction Costs
The problem of transaction costs in business management was introduced by a Nobel Prize winner, Coase
(1937), in his article The Nature of Firm. Coase (1937) raised a question about the purposefulness of the
existence of companies. He began his discussion on this topic with a definition of market system. The market
system is the coordination of business activity through a system of prices. The fact that market coordination
requires sustaining costs is of fundamental significance. Coase (1937) distinguished the costs of the operation
of the market mechanism and the costs of organizing transactions inside the company. Each transaction
concluded in economy is accompanied by transaction costs. The author was of the opinion that as long as the
costs of organizing transactions within companies were lower than the costs of purchasing this service on the
market or contracting it to another company, companies would increase their size, expanding their
organizational structure. Coase (1937) stated that companies were established in order to decrease the costs of
transactions, and thus he assumed that the internal implementation of actions was cheaper than their
implementation by the market, which was confirmed by the economic practice of that time. For a few decades,
the companies expanded their structure, creating new departments, units, and etc.. They implemented their
functions on their own, using their own material, capital, and human potential.
Even at the beginning of the 1990s, another Nobel Prize winner, dealing with transaction costs,
Williamson believed that the implementation of actions within the company was more profitable than
contracting them outside. This resulted from the fact that transaction costs of actions implemented outside were
still higher than the savings which companies achieved by delegating them to suppliers. Subsequent decades

INFLUENCE ON THE DEVELOPMENT OF OFFSHORE OUTSOURCING
120
brought changes in transaction costs and the implementation of actions outside became more effective from the
implementation in one’s own organizational structure.
What are transaction costs? To answer this question, this paper has to introduce the notion of transaction.
Transaction is the basic unit of economic analysis. Transaction takes place when goods or services go through
technically specified limits. One sphere of activity ends and another one begins (Williamson, 1985).
Transaction does not only imply market exchange, but also includes other acts of exchange within the
organization.
The notion of contract is associated with the transaction. This is a transaction with a clearly outlined
structure, not always a formal one. Furubotn and Richter (1997, p. 53) defined a contract as a “bilateral
transaction, in which both parties agree as to their certain obligations. Apart from the parties’ agreement
concerning their relations (planning relations), the existence of legal sanctions (enforceable by law) is regarded
as a characteristic feature of the contract”. Each contract involves costs related to its handling, regardless of
whether or not it is internalized within the organization or proceeds as a market transaction. The method in
which the contract is managed is selected on the basis of the criterion of minimizing transaction costs and this
is the basic assumption of the economics of transaction costs. Therefore, it can assume that transaction costs are
the costs of the operation of the socio-economic system; they reflect the expenditures incurred as a result of all
possible types of concluded transactions.
It can express transaction costs as a function of three components: specific nature of assets, frequency, and
uncertainty (Williamson, 1998).
The specific nature of assets results, essentially from their high value, rareness, and the lack of substitutes
and idiosyncrasy. Specific assets are those which may not be easily transferred for other applications and also
cannot be easily replaced, e.g., the specific nature of tangible assets, the specific nature of human assets, the
specific nature of location, and the specific nature of the intended use of assets. If the transaction is
characterized by specific assets, the effect is the growth in the complexity of contracts concluded between
market entities and, as a result, growth in transaction costs. The second significant factor affecting the amount
of transaction costs is uncertainty, presented in two dimensions as the uncertainty of the external environment
and behavioral uncertainty. When companies conclude transactions, they are not able to take into account all
factors which may affect their course. The occurrence of new facts leads to the renegotiation of contracts and
this, in turn, leads to the growth in transaction costs. The last factor determining the level of transaction costs is
frequency, which is less frequently displayed in the literature on the subject. According to Williamson (1985,
1998), if transactions are characterized by high frequency, companies are more willing to use vertical
integration.
According to the theory of transaction costs, the basic management function is to limit costs related to the
coordination of the implementation of a given transaction, namely the selection of such a structure of managing
transactions inside the company, so that the costs of coordination are as low as possible. Transaction costs are
saved by connecting transactions of various attributes with management structures in a diverse manner.
Theoretically, this paper may distinguish two extreme methods of regulating transactions: market regulation
and administrative (hierarchical) regulation. Between the two extremes which are the market and the hierarchy,
there is a spectrum of methods for conducting transactions. The effectiveness of particular forms of regulations
depends on the previously characterized transaction attributes, namely on the specific nature of assets, the
frequency of transactions and the uncertainty.

INFLUENCE ON THE DEVELOPMENT OF OFFSHORE OUTSOURCING
121
Combining management structures with transaction attributes serves the purposes of effectiveness.
Transaction costs are saved by connecting transactions of various attributes with management structures in a
diverse manner. It is assumed that the amount of transaction costs determines the adopted solution. If these
costs are at a low level, companies decide to transfer their activities to the market, many transactions are
concluded, based on the market mechanism. When transaction costs are high, companies avoid or limit the
number of transactions on the market and execute actions in their own organizational structures. As mentioned
earlier, there are situations when transaction costs are high, regardless of whether the transactions are
conducted on the market or internally in a company. Then, companies choose to function in the so-called
hybrid forms. These are intermediate solutions between the market and the internal hierarchy (for instance the
network).
Measurement of Transaction Costs
As it has already been mentioned, a weakness of transaction cost theory is the problem with measurement
of these costs. It is difficult to determine the exact level of transaction costs. Calculations of these costs are to a
large extent based on assumptions, since a part of these costs are costs that will occur in the future (estimates).
However, this is not a premise to disregard measurement of transaction costs. If the basic reason for using
offshoring is to reduce costs of business operations, failure to measure transaction costs may result in a failure
of offshoring. Underestimation of transaction costs with assessment of offshoring effectiveness affects the
increase in risk. The risk of offshoring increases due to shortcomings in preparation of the separation process
(at every stage of preparation of the course of the process, transaction costs should be calculated). An example
of increase in the risk of offshoring is, e.g., increase in the price of services provided by foreign suppliers. At
the stage of preparation of the contract, a company should secure itself against possible unfavourable situation.
Another important element of accurate measurement of transaction costs results from the fact that most
often, these measurable transaction costs are definitely higher in the case of offshoring than in the case of
implementation inside the organizational structure of the company. An important factor will be the amount of
total transaction costs. The total value of transaction costs should affect the decision on offshoring. What is
equally important, practice proves that total transaction costs are dominated by those with variable cost nature.
If these are variable costs, then people, as managers, can affect their amount and respond to changes in variable
costs relatively quickly.
Companies that perform measurement of transaction costs do it within the information system of the
company, both in financial accounting system and in the managerial accounting system. The main tool used for
that purpose is, obviously, the cost account. Managers must have information on whether the transaction costs
are higher within the market or within the organization. A particular role, when estimating transaction costs,
can be played by the tools of management accounting, such as activity-based costing and balanced scorecard.
Caring about achieving the objectives of contracting, management structures are adjusted to transaction
conditions. These structures vary between one another in the capacity for an effective reaction to interferences.
Effectiveness of Offshore Outsourcing
Effectiveness is not a clear notion. Literature often mentions terms with similar meaning, like efficacy,
productivity, profitability, or economy. An important publication, containing a comprehensive analysis of the
notion of effectiveness is the work by Holstein-Beck (1987) entitled Sketches About Work. The author presents
INFLUENCE ON THE DEVELOPMENT OF OFFSHORE OUTSOURCING
122
efficiency as the main element shaping today’s understanding of “effectiveness”. The main value of
effectiveness is efficacy, gainfulness, and economy (Kotarbiński, 1955; Kieżun, 1977). Such perspective on
effectiveness is a result of impact of the Polish praxeological school in the theory of organisation on works by
many authors. Efficacy is an action which leads to the effect intended as a goal. A measure of efficiency is thus
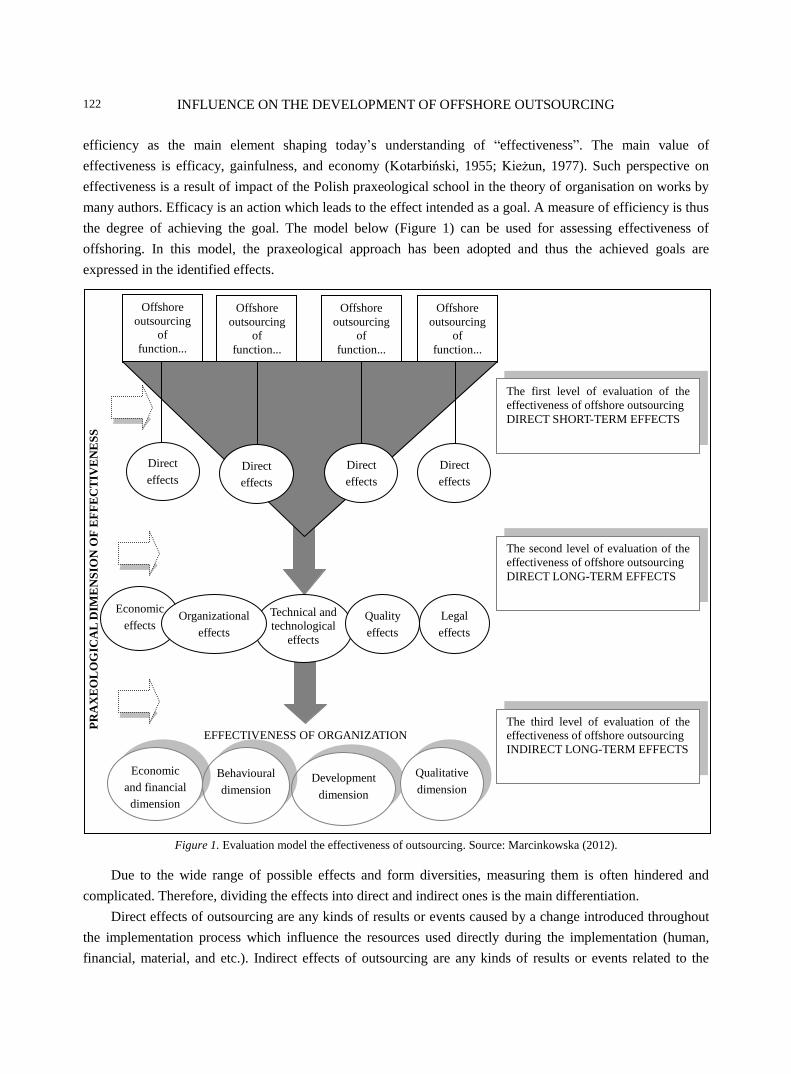
the degree of achieving the goal. The model below (Figure 1) can be used for assessing effectiveness of
offshoring. In this model, the praxeological approach has been adopted and thus the achieved goals are
expressed in the identified effects.
Figure 1. Evaluation model the effectiveness of outsourcing. Source: Marcinkowska (2012).
Due to the wide range of possible effects and form diversities, measuring them is often hindered and
complicated. Therefore, dividing the effects into direct and indirect ones is the main differentiation.
Direct effects of outsourcing are any kinds of results or events caused by a change introduced throughout
the implementation process which influence the resources used directly during the implementation (human,
financial, material, and etc.). Indirect effects of outsourcing are any kinds of results or events related to the
Development
dimension
Offshore
outsourcing
of
function...
Offshore
outsourcing
of
function...
Offshore
outsourcing
of
function...
Offshore
outsourcing
of
function...
The third level of evaluation of the
effectiveness of offshore outsourcing
INDIRECT LONG-TERM EFFECTS
The first level of evaluation of the
effectiveness of offshore outsourcing
DIRECT SHORT-TERM EFFECTS
The second level of evaluation of the
effectiveness of offshore outsourcing
DIRECT LONG-TERM EFFECTS
Qualitative
dimension
Behavioural
dimension
Economic
and financial
dimension
Direct
effects
Direct
effects
Direct
effects
Economic
effects
EFFECTIVENESS OF ORGANIZATION
Technical and
technological
effects
Legal
effects
Quality
effects
PR
AX
EO
LO
GIC
AL
DIM
EN
SIO
N O
F E
FF
EC
TIV
EN
ES
S
Direct
effects
Organizational
effects

INFLUENCE ON THE DEVELOPMENT OF OFFSHORE OUTSOURCING
123
implementation of outsourcing which are identified in different areas of activity of an organisation. Based on
the assumed occurrence criteria of effects, a three-stage evaluation leading to a complete analysis of the
effectiveness of outsourcing may be performed.
In Table 1 below, proposes measures assess the effectiveness of offshore outsourcing.
Table 1
Effectiveness of Offshore Outsourcing
Efficiency of
offshore
outsourcing
Effectiveness of offshore processes (services)
Direct short-term effects Direct long-term effects
Dimension Measures of assessment Dimension Measures of assessment
economic
organizational
technical and
technological
qualitative
legal
other
cost reduction
number of reduced
workplaces
number of
complaints
economic
organizational
technical and
technological
qualitative
legal
other
investment outlays
level
work effectiveness,
know-how of
employees,
number of conflicts
time of their
solution
Effectiveness of organization
Operational effectiveness Strategic effectiveness
Effects: cost reduction, growth in work efficiency,
shortening production and service cycles, increase in
profit, simplification of the organizational structure,
and etc.
Effects: new products, new markets, new
technologies, introduced innovations, focus on basic
activity, and etc.
Source: Prepared by the author.
Effects of separation and transfer for implementation under offshoring are identified in two planes: the
effectiveness of offshore operations and the organizational effectiveness of offshoring. The main differentiation
is the division into direct effects (short-term and long-term). Direct effects are any kinds of results or events
caused by the change introduced into the implementation of the functions (action/service). Indirect effects are
identified results of offshoring having impact on the whole organization. In the proposed model for assessment
of effectiveness, several dimensions of effectiveness have been adopted, such as economic, organizational,
technical and technological, qualitative, and legal dimension. Each dimension can be attributed to measures
reflecting degree of achievement of goals for which offshoring has been used. These dimensions of
effectiveness might not only be used in the assessment of the separated function itself and direct effects that it
yields, but also can be used to assess the effect of offshoring on effectiveness of the whole company. These
effects are indirect and they can be additionally divided into operational and strategic effects.
Transaction Costs and Development of Offshore Outsourcing in Poland
The theoretical assumptions of the concept of transaction costs are applied in economic practice. An
example of the application of the theory of transaction costs in economic life is outsourcing. This concept
involves a transfer of certain activities (functions) outside the company’s structure and realizing them by
specialized external companies. In the last two decades, companies all around the world and in Poland more
and more often use outsourcing. In the first phase of outsourcing popularity, companies decided to transfer
additional functions, often referred to as peripheral, in the company. These were functions which were not
complex, which did not require the involvement of specific resources for their implementation. However, with
time, apart from additional functions, companies widened the scope of separations covering also functions

INFLUENCE ON THE DEVELOPMENT OF OFFSHORE OUTSOURCING
124
critical for the company. Companies transferred such areas of activity as production, tests, development, and
customer service to external suppliers.
The impact of changes in transaction costs may be noticed in a certain variety of outsourcing referred to as
offshore outsourcing. This is a form of outsourcing, in which tasks are transferred abroad.
The market of offshoring services has been growing for many years. Figure 2 presents the value of
offshoring transactions concluded all over the world in the years from 2004 to 2009.
Figure 2. Global market for offshore outsourcing of services from 2004 to 2009 (USD billion). Source: Prepared by
the author; United Nations Conference on Trade and Development (2009).
A sudden growth in separations of activity and their transfer to other countries results from the change in
transaction costs. The main drivers of that change are development of information technologies and
globalization.
As a result of the development of new information technologies, especially the internet, the costs of
communication decreased, as well as the costs related to searching for information and suppliers. But these are
not the only benefits resulting from the application of new technologies in the field of IT. Companies use
modern technologies to collect and send data all around the world. They do it cheaply and safely.
Globalization has also affected the decrease in transaction costs to a significant degree. Conducting
transactions “with the whole world” emphasized numerous differences in the area of shaping prices, costs, and
conditions in which production is implemented. Globalization has also showed cultural differences in
organizations. Companies very quickly responded to these differences and moved transactions, where the
conditions for their implementation were more attractive.
As it has already been mentioned, companies transfer selected actions to offshoring suppliers for
implementation. Actions related to IT and BPO, but only these, are most often separated. They transfer
production, tests, development, and other functions considered basic to suppliers.
Even at the beginning of the 1980s, such companies as Adidas or Puma used to employ thousands of
workers in Germany who manufactured sports shoes. Today, these companies do not have a single factory.
They contracted the whole production of shoes and clothes to partners in the Far East and Southeast Europe.
Nike submitted key elements of production to offshore outsourcing, focusing on unique activity, such as
research and development and post-production actions (distribution, sales, and marketing). Argyle Diamonds,
one of the largest manufacturers of diamonds in the world, went even further. It outsourced all mining and
35
51 65
76
93 96
0
20
40
60
80
100
120
2004 2005 2006 2007 2008 2009

INFLUENCE ON THE DEVELOPMENT OF OFFSHORE OUTSOURCING
125
distribution operations, conducting on its own only actions related to the separation and sorting of diamonds.
Similarly, the company Apple Computers submitted 70% of its production and other essential elements, e.g.
designing and part of marketing activities to outsourcing in order to focus on the production of unique parts,
such as Apple DOS (disk operating systems) and systems supporting macro software which are unique for
Apple products, and therefore key (Quinn & Hilmmer, 1994).
Production activities in the automotive industry are also no longer basic competences for the
manufacturers of vehicles. Production is an action of a low specific nature. Supplier specialized only in
production appeared on the market. The company Porsche decided to completely subject the production of the
model US Boxer to outsource to the company Velmet from Finland. Porsche focuses on engineering, marketing,
and controlling suppliers. Daimler Chrysler, a vehicle manufacturer, transferred the management of his supplier
portfolio to Andersen Consulting in the form of outsourcing.
Offshore outsourcing has also become strong in the electronic and telecommunication industry. A new
situation has emerged in the electronic industry and this situation is slowly being transferred onto the whole
industry. Large renowned companies with strong brands transfer production to companies with a network of
production sites all around the world. It turns out that these companies have higher skills in manufacturing than
their clients. Even though they are unknown to the general public, these companies form a new industry which
is referred to as contract manufacturing industry. Large contract manufacturers (Solectron and Celestica)
implement orders from the largest competitors. The assembly belts of Flextronics (100 sites in 30 countries,
including Poland) handle mobile phones from the companies Sony Ericsson, Nokia, and Alcatel (Polish Press
Agency, 2002).
The dominant reason why companies resign from the domestic market and move the implementation of
tasks to the global market is the possibility to reduce costs. This cost reduction results mainly from the access
to cheap workforce. When China, India, Brazil, and Mexico entered the global market, they gave the
opportunity to employ more than one billion low-qualified employees.
Searching for savings in costs on the global market, the potential of developing countries has also been
noticed. These potential results from having qualified employees whose employment costs are still lower
than in highly-developed countries. Such an attractive labor market with educated employees is, above all,
Poland and the remaining countries of Central-Eastern Europe. For many years, the employees support a
Western European companies doing for them services in the field of finance, accounting, tax, customer service,
and etc..
The attractiveness of offshore outsourcing services location is confirmed by report results. The report
entitled Offshoring Opportunities Amid Economic Turbulence presented a list of the most attractive offshore
outsourcing locations in the world. Table 2 presents leaders of provided offshoring services. The order in which
the countries have been presented results from the investment attractiveness index level which is shaped by
such parameters as low costs including taxes, infrastructure, quality and availability of employees, and business
environment.
Transferring various actions abroad, where the costs of their implementation are definitely lower, affects
the economic performance and the competitiveness of companies. The low costs of wages, low taxes, and
political-economic stability determine the fact that India, China, and Malaysia have been leaders of the ranking
for several years. Poland is also gaining a stronger and stronger position on the map of attractive locations.
Within two years, Poland moved up in the ranking from the 38th place to the 24th place.

INFLUENCE ON THE DEVELOPMENT OF OFFSHORE OUTSOURCING
126
Table 2
Global Services Location Index 2009 and 2011
Rank 2011 Country Rank 2009/change in ranking
1 India 1 (0)
2 China 2 (0)
3 Malaysia 3 (0)
4 Egypt 6 (+2)
5 Indonesia 5 (0)
6 Mexico 11 (+5)
7 Thailand 4 (-3)
8 Vietnam 10 (+2)
9 Philippines 7 (-2)
10 Chile 8 (-2)
11 Estonia 18 (+5)
12 Brazil 12 (0)
13 Latvia 22 (+14)
14 Lithuania 21 (+7)
24 Poland 38 (+15)
Source: Prepared by the author; A. T. Kearney Global Services Location Index (2009, 2011).
Poland is the Central and Eastern European leader in the sector of modern business services. This country
has more than 470 business services centers with foreign capital which employ more than 128 thousand
employees. Additionally, the employment in this sector is systematically growing every year by 20%. Poland’s
attractiveness on the map of offshoring investment projects results mainly from a very well qualified and cheap
workforce. Offshoring centers located here offer both BPO and KPO services. Employees need to have
specialized knowledge and education, very often technical, in order to provide this type of services, especially
those based on knowledge.
Strong centers of advanced business services in Poland include large cities, such as Krakow, Warsaw,
Poznan, Wroclaw, and Lodz. These cities are not selected as business service centers by accident. These are
cities in which thousands of young people learn in universities. Those who are well educated and who know
foreign languages will easily find employment in business service centers. An educated personnel is the basic
factor for which foreign investors open their centers in Poland. Poland’s policy of supporting the sector of
modern services is also of significance. Investors may obtain tax allowances when investing in Special
Economic Zones. After meeting specific conditions (Polish Information and Foreign Investment Agency), they
may obtain direct budget subsidies for their investment projects. R&D activity enjoys a special interest and
support from governmental authorities in the form of subsidies (Marcinkowska, 2013).
Polish attractiveness stems from the growing importance soft factors when companies select a country.
Over 40% of companies include soft factors when selecting a country (Figure 3).
Cost reduction remains the overarching objective of offshoring. But location criteria goes beyond
benchmarking of hard facts and is influenced by soft factors, such as following competitors, promotion by
target countries, and internal lobbying by a foreign affiliate (Figure 4).
The business services sector is one of the priority sectors of the economic policy in Poland. The polish
investment incentive policy gives special preferences for this sector. Key investment incentives for the business
services sector are:

INFLUENCE ON THE DEVELOPMENT OF OFFSHORE OUTSOURCING
127
tax reliefs on Special Economic Zone (CIT tax exemption);
direct budget subsidies for new investment/employment;
support for R&D activities.
Figure 3. Approach for country selection—Soft factors. Source: Prepared by the author; United Nations Conference on
Trade and Development (2004).
Figure 4. Soft factors. Source: Prepared by the author; United Nations Conference on Trade and Development (2004).
Conclusions
The changes that have occurred in transaction costs in the past two decades have influenced the
development of offshore outsourcing. Enterprises are looking for the best fit business models for your needs.
Companies decide to transfer the implementation of previous tasks outside the company’s structure.
Outsourcing is a method that reduces transaction cost. Domestic outsourcing and offshore outsourcing are
booming. Moving business processes abroad proves to be an effective solution for multinational companies.
41%
59%
Influence of soft factors
Influence of hard factors:
costs, skills, time zone, and etc.
0% 10% 20% 30% 40% 50% 60%
Experience with target country
Promotion by target country officials
Internal lobbying by a foraign affiliate
Offer of a business partner
Political situation
Following competitor's best practice

INFLUENCE ON THE DEVELOPMENT OF OFFSHORE OUTSOURCING
128
That’s why today Poland becomes obvious location for business processes for companies from Europe and the
USA. Company managements make initial decisions on the separation of certain actions on the basis of the
conducted cost benefit analysis, which is possible to obtain as a result of introduced changes. The first hint for
the separation is a surplus of benefits over costs obtained as a result of the analysis. This means that the costs of
implementation outside are lower than the costs of implementation within a company. However, this result
should not decide the separation. The generated benefits should also cover the transaction costs. It should be
born in mind that there is a real problem with the quantification of transaction costs. They may take the form of
financial costs and benefits, as well as qualitative costs and benefits. Therefore, the effectiveness of outsourcing
is of a praxeological dimension. This specific nature of transaction costs and the difficulty to measure them
affect the fact that many companies probably do not take them into account in the process of offshore
outsourcing analysis.
References
A. T. Kearney Global Services Location Index. (2009). The shifting geography of offshoring. Retrieved from
http://www.atkearney.com/documents/10192/fda82529-b60a-4fae-8d92-22cfd69b95b3
A. T. Kearney Global Services Location Index. (2011). Offshoring opportunities amid economic turbulence. Retrieved from
http://www.atkearney.com/documents/10192/f062cfd8-ee98-4312-ae4f-0439afc10880
Coase, R. (1937). The nature of the firm. Economica, 4, 386-405.
Furubotn, E. G., & Richter, R. (1997). Institutions and economic theory: The contribution of the new institutional economics. Ann
Arbor: The University of Michigan Press.
Gilley, M. K., & Rasheed, A. (2000). Making more by doing less: An analysis of outsourcing. Journal of Management, 26,
763-790.
Holstein-Beck, M. (1987). Szkice o pracy (Sketches about work). Warszawa: Książka i Wiedza.
Kieżun, W. (1977). Podstawy organizacji i zarzadzania (Principles of organization and management). Warszawa: Książka i
Wiedza.
Kotarbiński, T. (1955). Traktat o dobrej robocie (Treatise on good job). Łódź: Ossolineum.
Lei, D., & Hitt, M. (1995). Strategic restructuring and outsourcing: The effect of mergers and acquisitions and LBOs on building
firm skills and capabilities. Journal of Management, 21, 835-859.
Lysons, M., & Gillinham, M. (2003). Purchasing and supply chain management. Essex: Financial Times/Prentice Hall.
Marcinkowska, E. (2012). Outsourcing w zarządzaniu szpitalem publicznym (Outsourcing in management of public hospital).
Warszawa: ABC a Wolters Kluwer business.
Marcinkowska, E. (2013). Offshoring for business services in Poland. Proceedings from virtual multidisciplinary conference,
Quaesti, Zilina.
Perry, C. (1997). Outsourcing and union power. Journal of Labour Research, 18, 521-534.
Polish Press Agency. (2002). Przekazywanie produkcji wykonawcom kontraktowym (Transfer of production to contractors
contract). Management in the World, 3, 42-46.
Quinn, J. B., & Hilmmer, F. (1994). Strategic outsourcing. Sloan Management Review, 35, 43-55.
Sharpe, M. (1997). Outsourcing, organizational competitiveness, and work. Journal of Labour Research, 18, 535-549.
United Nations Conference on Trade and Development. (2004). Service offshoring takes off in Europa—In search of improved
competitiveness. Retrieved from http://unctad.org/sections/press/docs/SurveyOffshoring_en.pdf
United Nations Conference on Trade and Development. (2009). Information economy report. Trends and outlook in turbulent
times. Retrieved from http://unctad.org/en/Docs/ier2009_en.pdf
Williamson, O. E. (1985). The economic institutions of capitalism. New York: Simon and Schuster.
Williamson, O. E. (1998). Ekonomiczne instytucje kapitalizmu (The economic institutions of capitalism). Warsaw: PWN.

China-USA Business Review, March 2015, Vol. 14, No. 3, 129-142
doi: 10.17265/1537-1514/2015.03.002
The Level of the Financial Inclusion in the African Countries
and in the World Group Regions
Kokou Adalessossi
Akdeniz University, Antalya, Turkey
One key component of inclusive development is financial inclusion, an area in which Africa has been lagging
behind unlike other continents. At most, one adult out of four in Africa has access to an account in a formal
financial institution. The objective of this study is to find out the level of the financial inclusion among 41 African
countries on one hand and the level of the financial inclusion among the world six group regions on the other hand. To
find out which country or which group region has a higher level or a lower level in the financial inclusion, according
to some indicators, such as account at a formal financial institution, access to formal accounts, use of formal accounts,
mobile payments, savings, credits patterns, and insurance decision as underlined in the literature review that the latter
constituted the principal indicators for inclusive financing, an appropriate and reliable statistical method has been
used, such as cluster analysis. The data set was the secondary data taken from the World Bank website; the first data
published by the World Bank in 2012 on the global financial inclusion concerning 148 countries in the world. The
empirical results from this study reveal that most of African countries with lower levels are low-income countries and
those with higher levels remain largely of middle-income countries. Among the world group regions, only
Sub-Saharan African region has the low level in five of the seven indicators used in this research, when compared
with the other group regions. This study will awaken most African countries including the Sub-Saharan African
region to develop strategies to enhance their level in the future in order to reduce poverty and to strengthen their
financial system which leads to economic growth.
Keywords: African countries, financial inclusion, World Bank, indicators, cluster analysis
Introduction
Africa is now the world’s second fastest growing region after Asia, with annual GDP growth rates in
excess of 5% over the last decade (Thouraya & Faye, 2013). Despite this growth, the Arab Spring events
showed that good economic growth in the continent has not translated into shared prosperity and better
livelihoods for the majority. Growth has to be inclusive to be socially and politically sustainable. One key
component of inclusive development is financial inclusion, an area in which Africa has been lagging behind
other continents. Less than one adult out of four in Africa has access to an account at a formal financial
institution. Broadening access to financial services will mobilize greater household savings, marshal capital for
investment, expand the class of entrepreneurs, and enable more people to invest in themselves and their families.
Kokou Adalessossi, Ph.D. student researcher in finance, Faculty of Economics and Business Administration Sciences, Business
Administration Department, Akdeniz University, Antalya, Turkey.
Correspondence concerning this article should be addressed to Kokou Adalessossi, Akdeniz University, Dumlupinar Bulvari,
07058 Kampus, Antalya, Turkey. Tel: +905078510893. E-mail: [email protected].
DAVID PUBLISHING
D

FINANCIAL INCLUSION IN THE AFRICAN COUNTRIES
130
In recent decades, access to financial services has been dramatically improved in African countries
(Thouraya & Faye, 2013). More financial services, especially credit, are now provided to individuals and
enterprises. New technologies, such as mobile money, have also helped broaden access to financial services,
including savings and payment products. Yet, until recently, in Africa and elsewhere, little was known about
the reach of the financial sector—the extent of financial inclusion and the degree to which disadvantaged
groups, such as the poor, women, and youth, are excluded from formal financial systems. Financial services are
increasingly being seen as important to poverty reduction and achievement of the millennium development
goals. By borrowing, saving, or buying insurance, the poor can plan for their future beyond the short term.
They can build up assets and invest in education and health. Financial services can help them cope in times of
need and hardship. Beyond this, access to financial services can promote social inclusion and build
self-confidence and empowerment, in particular among women.
Access to financial services plays a critical part in development by facilitating economic growth and
reducing income inequality. Inclusive financial systems allow poor people to smooth their consumption and
insure themselves against economic vulnerabilities, from illness and accidents to theft and unemployment.
Financial access enables poor people to save and borrow—allowing them to build their assets, to invest in
education and entrepreneurial ventures, and thus to improve their livelihoods. While significant progress has
been made in expanding access to financial services by the poor, there is still more to be done. It is estimated
that more than 2.7 billion people in developing countries (World Bank, 2008), particularly Africa
countries—the majority of adults—are still excluded from the financial services market.
Inclusive financing is especially likely to benefit disadvantaged groups, such as women, youth, and rural
communities. For all these reasons, financial inclusion has gained prominence in recent years as a policy
objective to improve the lives of the poor. Financial inclusion or inclusive financing is the delivery of financial
services at affordable costs to sections of disadvantaged and low-income segments of society, in contrast to
financial exclusion where those services are not available or affordable. Adults of an estimated 2.5 billion
working-age globally have no access to the types of formal financial services delivered by regulated financial
institutions (World Bank, 2012), for example, in Sub-Saharan Africa, only 24% of adults have a bank account
even though African formal financial sector has grown in recent years. It is argued that as banking services are in
the nature of public good, the availability of banking and payment services to the entire population without
discrimination is the prime objective of financial inclusion public policy.
The aim of this study is to find out their level in the inclusive financing in one side among 41 African
countries and measure the level of the financial inclusion among the world six group regions in the second side.
This is to show that, according to some indicators, which country and group region has a high level in financing
inclusion. After touching by finger which the literature review has said about in the second section, this paper will
move on the data and methodology of the research in the third section. The empirical results analysis and
discussions are in the fourth section before concluding at the end.
Literature Review
Conceptual Framework of Financial Inclusion
Committee on financial inclusion defines financial inclusion as delivery of financial services at an
affordable cost to vast sections of disadvantaged and low-income groups (Government of India, 2008).
Unrestrained access to public goods and services is the essential condition of an open and efficient society. This

FINANCIAL INCLUSION IN THE AFRICAN COUNTRIES
131
view is reiterated in the definition “the process of ensuring access to timely and adequate credit and financial
services to vulnerable groups at an affordable cost” (Kamath, 2007, pp. 1334-1335). As banking services are in
the nature of public good, it is essential that availability of banking and payment services to the entire
population without discrimination should be the prime objective of the public policy. The international
definitions of financial inclusion have been viewed in much wider perspective (Leeladhar, 2005). The
definitions of financial inclusion emphasize several dimensions (Sharma, 2008), e.g., accessibility, suitability,
availability, and usage of the financial system. These dimensions together build an inclusive financial system.
Another issue that needs to be taken care of is whether to measure access or usage. Because in transaction
banking and insurance, it can be found that people do not use it, even if they have access to it. Access
dimension implies mere access to services, while usage dimension is a broader term requiring examination of
aspects like access, suitability, availability, and actual usage.
World Bank
World Bank also distinguishes between those who are formally served (have access to financial services
from a bank and/or other formal providers) and those who are financially served (include people who use
informal providers). In contrast to the other work described above, the term “financially excluded” is only used
to describe those who have no access at all (World Bank, 2005). This study considers only the formal sector
which includes all legally endorsed financial services. The definitions of financial inclusion vary across the
geographic regions decided by the concomitant economic development. This study focuses on financial
inclusion with respect to the poorest of the poor and emphasizing a wider connotation of the term “financial
services” than defining it in a narrow perspective of owning a savings account with a bank. The definition of
several aspects of the term propounded by several authors, committees, and commissions is reviewed here to
arrive at an acceptable working definition.
Definitions of financial inclusion in literature tend to vary on dimensions, such as breadth, focus, and
degree of exclusion (Reserve Bank of India, 2009). The breadth dimension is the broadest of all definitions
which defines financial inclusion, as a consequence of social inclusion which prevents the poor and the
disadvantaged from gaining access to the mainstream financial system. Some of the definitions of financial
inclusion reiterating this view are as follows. Financial inclusion infers accessibility and usage of financial
services from formal service providers. United Nations (2006) defined financially inclusion as the financial
sector that provides access to credit for all bankable people and firms, to insurance for all insurable people and
firms, and to savings and payments services for everyone. Inclusive finance does not require that everyone who
is eligible uses each of the services, but he should be able to choose to use them if desired. The degree
dimension is the narrowest of all and defines financial exclusion as exclusion from usage of particular sources
of credit and other financial services, including insurance, bill payment services, and accessible and appropriate
deposit accounts. World Bank (2005) described exclusion as a phenomenon with access to key areas, such as
transaction banking, savings, credit, and insurance.
For the purpose of the study, this definition has been accepted as the bench mark. Though all services
including credit, savings, and insurance offered by the banks and other financial institutions are taken as the
benchmark, more weight age is given to credit segment. Financial inclusion may be interpreted as the ability of
every individual to access basic financial services which include savings, loans, and insurance in a manner that
is reasonably convenient and flexible in terms of access and design; and reliable in the sense that savings will

FINANCIAL INCLUSION IN THE AFRICAN COUNTRIES
132
be safe and that insurance claim will be paid with certainty (Mor & Ananth, 2007). Indeed, having a current
account/savings account on its own cannot be regarded as an accurate indicator of financial inclusion (Chatrath
& Vallabh, 2006).
Financial inclusion is characterized primarily as either general access to loans or access to savings
accounts (Arunachalam, 2008). Very few risk management and vulnerability reducing products are available to
small holder producers. Financial inclusion cannot only be restricted merely to opening savings accounts and/or
providing credit for consumption/consumer spending, but should also encompass delivering financial products
tailor-made to cope with the fluctuating earning pattern of the poor. Rogaly (1999) defined financial exclusion
in the perspective of exclusion from particular sources of credit and other financial services (including
insurance, bill payment services, and accessible and appropriate deposit accounts).
The review of literature suggests that most of the definitions are context specific, originating from country
specific problems related to financial exclusion with regard to the respective of socio-economic dimensions
which assumes importance in the public policy perspective. On the basis of the above review, the following
working definition has been accepted with regard to financial inclusion throughout the study
Financial inclusion may be interpreted through poor households’ access to basic financial services from
formal and semiformal service providers which include savings, loans, insurance, and other financial services
in a manner that is reasonably convenient and flexible in terms of access and design. In this perspective, the
study attempts to measure financial inclusion as a composite one that takes into consideration access to
transaction banking, savings, credit, and insurance:
Transaction banking: It refers to access to bank’s financial services other than savings, credit, and
insurance;
Savings: Lesser savings leads to lesser capital formation implying lesser development. Not having a
savings account can lead to financial exclusion;
Credit: It is the most valid indicator for assessing the status of financial inclusion. Though other indicators
are measured, credit access and indebtedness of a family determine the level of well being achieved. Credit
measured as a sole measure of financial inclusion can also be useful, because it may provide status of the
stakeholder considering aspects like source, cost of borrowing, adequacy, proximity, and etc.;
Insurance: Insurance provides coverage to the accidents/emergencies arising in a society affecting human
lives, assets, or livelihoods. Recent developments have increased popularity and access to insurance. Also
government has enacted insurance policies for the benefit of sea faring fishers. Insurance inclusion is measured
as sub element in the financial inclusion designating appropriate weights.
Data and Research Methods
Data
The data set of this study was taken from the global index database covering 148 economies that includes
41 African countries (Demirgüç-Kunt & Klapper, 2012). This data was published in 2012 by the World Bank
on its website titled The Global Financial Inclusion using indicators, such as formal bank accounts, payments
behavior, savings patterns, credit patterns, and insurance decisions. This data provides country-level indicators
of financial inclusion summarized for all adults and disaggregated by key demographic characteristics—gender,
age, education, income, and rural or urban residence.
This research chose 41 African countries, according to the World Bank’s available data for countries and

FINANCIAL INCLUSION IN THE AFRICAN COUNTRIES
133
the six regions: East Asia and Pacific (grouping nine countries), Europe and Central Asia (grouping 24
countries), Latin America and the Caribbean (grouping 19 countries), Middle East and North Africa (grouping
12 countries), South Asia (grouping six countries), and Sub-Saharan Africa (grouping 36 country).
Research Methods
To perform this study, the appropriate and reliable statistical method used is the method of two-step
clusters analysis. It enables identifying groups of individual or objects that are similar to each other, but
different from individuals in other group. This method will help to classify the countries into two groups and
will show which of them belongs to first group and the second group.
The limit of this study is that all the African countries (54) did not take part in this study. Indeed, it will
be very good that all the African countries took part with a view to gauging the level of all countries in
inclusive financing. But due to the World Bank group classification, only 41 African countries data were
accounted for.
Method of Cluster
Classification and clustering have become an increasingly popular method of multivariate analysis over
the past two decades and they have become a vast amount of published material. Since there is no journal
devoted exclusively to cluster analysis as a general topic and it has been used in many (Scoltock, 1982) fields
of study, the novice user is faced with the daunting prospect of searching through a multitude of journals for
appropriate references. It has already been suggested that cluster analysis techniques have been applied to data
from numerous and diverse fields of study. In his review, Anderberg (1973) attributed the diversity to a mixture
of professional jealousy, relative isolation among the fields and genuine differences of viewpoint. Porter (1998),
who is the most frequently cited advocate and analyst of cluster policy, defined clusters as geographic
concentrations of interconnected companies and institutions in a particular field, linked by commonalities and
complementarities.
Cluster analysis classifies a set of observations into two or more mutually exclusive unknown groups
based on combinations of interval variables. The purpose of cluster analysis is to discover a system of
organizing observations, usually people and objects into groups where members of the groups share properties
in common. It is cognitively easier for people to predict behavior or properties of people or objects based on
group membership, all of whom share similar properties. It is generally cognitively difficult to deal with
individuals and predict behavior or properties based on observations of other behaviors or properties. Cluster
analysis classifies unknown groups, while discriminant function analysis classifies known groups. The procedure
for doing a discriminant function analysis is well established. There are few options, other than type of output,
that need to be specified, when doing a discriminant function analysis. Cluster analysis, while, allows many
choices about the nature of the algorithm for combining groups. Each choice may result in a different grouping
structure. There are three types of clusters: two-step cluster analysis, hierarchical cluster, and non-hierarchical
clusters (k-means cluster). In this research, two-step cluster analysis is used to classify the countries in two
groups using SPSS 13.
Definition of Variables
Variables used for this research are all continuous ones (independents variables). These variables are
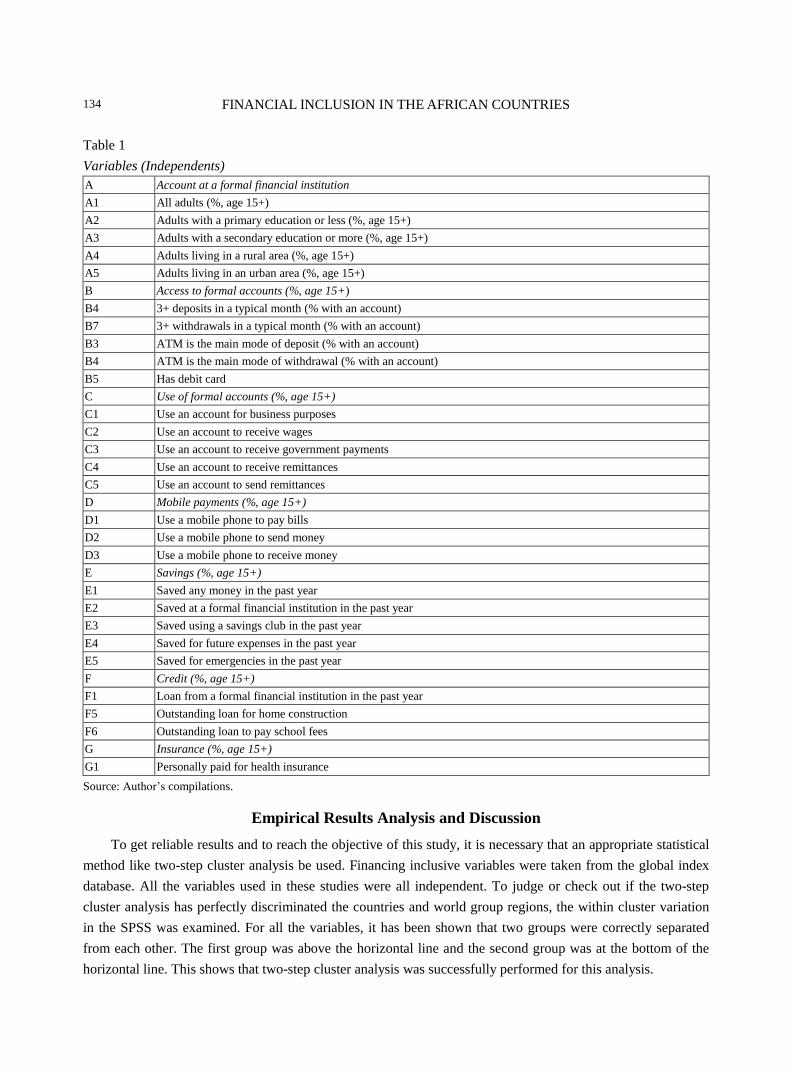
recapitulated in the Table 1.
FINANCIAL INCLUSION IN THE AFRICAN COUNTRIES
134
Table 1
Variables (Independents)
A Account at a formal financial institution
A1 All adults (%, age 15+)
A2 Adults with a primary education or less (%, age 15+)
A3 Adults with a secondary education or more (%, age 15+)
A4 Adults living in a rural area (%, age 15+)
A5 Adults living in an urban area (%, age 15+)
B Access to formal accounts (%, age 15+)
B4 3+ deposits in a typical month (% with an account)
B7 3+ withdrawals in a typical month (% with an account)
B3 ATM is the main mode of deposit (% with an account)
B4 ATM is the main mode of withdrawal (% with an account)
B5 Has debit card
C Use of formal accounts (%, age 15+)
C1 Use an account for business purposes
C2 Use an account to receive wages
C3 Use an account to receive government payments
C4 Use an account to receive remittances
C5 Use an account to send remittances
D Mobile payments (%, age 15+)
D1 Use a mobile phone to pay bills
D2 Use a mobile phone to send money
D3 Use a mobile phone to receive money
E Savings (%, age 15+)
E1 Saved any money in the past year
E2 Saved at a formal financial institution in the past year
E3 Saved using a savings club in the past year
E4 Saved for future expenses in the past year
E5 Saved for emergencies in the past year
F Credit (%, age 15+)
F1 Loan from a formal financial institution in the past year
F5 Outstanding loan for home construction
F6 Outstanding loan to pay school fees
G Insurance (%, age 15+)
G1 Personally paid for health insurance
Source: Author’s compilations.
Empirical Results Analysis and Discussion
To get reliable results and to reach the objective of this study, it is necessary that an appropriate statistical
method like two-step cluster analysis be used. Financing inclusive variables were taken from the global index
database. All the variables used in these studies were all independent. To judge or check out if the two-step
cluster analysis has perfectly discriminated the countries and world group regions, the within cluster variation
in the SPSS was examined. For all the variables, it has been shown that two groups were correctly separated
from each other. The first group was above the horizontal line and the second group was at the bottom of the
horizontal line. This shows that two-step cluster analysis was successfully performed for this analysis.

FINANCIAL INCLUSION IN THE AFRICAN COUNTRIES
135
Table 2
Cluster Distribution/Account at Formal Financial Institution
No. % of combined % of total
Cluster 1 19 40.4% 40.4%
2 28 59.6% 59.6%
Combined 47 100.0% 100.0%
Total 47 100.0%
Source: SPSS 13.
In Table 2, the cluster distribution, when based on account at formal financial institution, shows that out of
the 47 countries and world group regions, 19 were classified in the first group (high level), whereas 28 of them
are classified in the second group (low level). It means that eight countries and world group regions have the
high level in account at formal financial institution.
Table 3
Cluster Profiles Centroids/Account at Formal Financial Institution
All adults
(%, age 15+)
Adults with a
primary education or
less (%, age 15+)
Adults with a
secondary education
or more (%, age 15+)
Adults living in a
rural area
(%, age 15+)
Adults living in an
urban area
(%, age 15+)
Mean
Std.
Deviation Mean
Std.
Deviation Mean
Std.
Deviation Mean
Std.
Deviation Mean
Std.
Deviation
Cluster 1 39.642 12.41 27.12 15.838 49.81 17.0199 32.926 16.759 49.042 17.966
2 12.289 6.432 7.343 4.253 24.014 9.866 9.9107 6.2424 20.792 10.157
Combined 23.346 16.391 15.34 14.317 34.442 18.2821 19.21 16.221 32.212 19.576
Source: SPSS 13.
Observing the cluster profiles in Table 3, when based on account at formal financial institution, it is shown
that countries and world group regions of the first group (high level) have accounted for higher value in mean
and standard deviation than those in the second group.
Table 4
Cluster Distribution/Access to Formal Account
No. % of Combined % of Total
Cluster
1 22 46.8% 46.8%
2 25 53.2% 53.2%
Combined 47 100.0% 100.0%
Total 47 100.0%
Source: SPSS 13.
The results in Table 4 show that, when based on access to formal account, out of the 47 countries and
world group regions, 19 (46.8%) were classified in the first group (high level), whereas 28 of them are
classified in the second group (low level). It means that eight countries and world group region have a high
level in account at formal financial institution.
The results from Table 5 show that the first group (high level) of countries and world group regions
compared to the second when based on access to formal account has the high value in mean and standard
deviation.

FINANCIAL INCLUSION IN THE AFRICAN COUNTRIES
136
Table 5
Cluster Profiles Centroids/Access to Formal Account
3+ deposits in a
typical month (%
with an account)
3+ withdrawals in a
typical month (%
with an account)
ATM is the main
mode of deposit (%
with an account)
ATM is the main
mode of withdrawal
(% with an account)
Has debit card
Mean Std.
Deviation Mean
Std.
Deviation Mean
Std.
Deviation Mean
Std.
Deviation Mean
Std.
Deviation
Cluster
1 24.027 13.069 32.12 12.075 11.495 7.6781 57.423 20.1214 22.232 12.818
2 17.216 8.993 13.24 6.8037 4.816 3.8212 15.172 14.1967 4.664 3.8448
Combined 20.404 11.488 22.08 13.4692 7.943 6.7736 34.949 27.2784 12.887 12.6978
Source: SPSS 13.
Table 6
Cluster Distribution Use a Formal Account
No. % of Combined % of Total
Cluster
1 11 23.4% 23.4%
2 36 76.6% 76.6%
Combined 47 100.0% 100.0%
Total 47 100.0%
Source: SPSS 13.
The results in Table 6 show that, when based on access to formal account, out of the 47 countries and
world group regions, 11 (23.4%) were classified in the first group (high level), whereas 28 of them were
classified in the second group (low level). It means that 11 countries and world group regions have the highest
level in a formal account.
Table 7
Cluster Profiles Centroids/Use a Formal Account
Use an account for
business purposes
Use an account to
receive wages
Use an account to
receive government
payments
Use an account to
receive remittances
Use an account to
send remittances
Mean Std.
Deviation Mean
Std.
Deviation Mean
Std.
Deviation Mean
Std.
Deviation Mean
Std.
Deviation
Cluster 1 8 2.9462 17.48 5.1563 8.464 4.3202 14.809 4.3885 10.582 3.1644
2 3.514 1.843 6.786 4.569 4.494 4.1919 3.308 2.5987 2.608 1.9608
Combined 4.564 2.8561 9.289 7.718 5.423 4.7944 6 5.7924 4.474 4.0923
Source: SPSS 13.
In Table 7, it is shown that the first group has the higher value than the second group when based on a
formal account.
Table 8
Cluster Distribution in Mobile Payments
No. % of Combined % of Total
Cluster 1 8 17.0% 17.0%
2 39 83.0% 83.0%
Combined 47 100.0% 100.0%
Total 47 100.0%
Source: SPSS 13.

FINANCIAL INCLUSION IN THE AFRICAN COUNTRIES
137
The cluster distribution in Table 8 shows that out of the 47 countries and world group regions, eight were
classified in the first group, whereas 39 of them were classified in the second group. It means that eight
countries and world group regions have a high level in mobile payment (use a mobile phone to pay bills, send
money, and receive money).
Table 9
Cluster Profiles Centroids in Mobile Payments
Use a mobile phone to pay bills
Use a mobile phone to send
money
Use a mobile phone to receive
money
Mean Std. Deviation Mean Std. Deviation Mean Std. Deviation
Cluster 1 9.588 8.1341 29.588 15.4335 38.263 14.6938
2 1.736 1.7285 3.303 3.9233 5.000 5.2778
Combined 3.072 4.6296 7.777 12.1929 10.662 14.6810
Source: SPSS 13.
Table 9 shows that, trough mobile payments, the first group (high level) has the higher value in mean and
standard deviation than the second group.
Table 10
Cluster Distribution Savings
No. % of Combined % of Total
Cluster
1 18 38.3% 38.3%
2 29 61.7% 61.7%
Combined 47 100.0% 100,0%
Total 47 100.0%
Source: SPSS 13.
The cluster distribution shown in Table 10 indicates that out of the 47 countries and world group regions,
18 (38.3%) were classified in the first group, whereas 29 (61.7%) of them were classified in the second group.
It shows that 18 countries and world group regions have the high level in savings patterns.
Table 11
Cluster Profile Centroids in Savings
Saved at a formal financial institution in the
past year Saved for emergencies in the past year
Mean Std. Deviation Mean Std. Deviation
Cluster
1 18.094 5.5837 30.150 8.7424
2 5.779 3.4822 15.886 4.4545
Combined 10.496 7.4513 21.349 9.4576
Source: SPSS 13.
Table 11 shows that the countries and world group regions belonging to the first group have accounted to
higher value in mean and standard deviation, when based on savings patterns than those belonging to the
second group. Also, the examination of the “within cluster variation” in the SPSS shows that the two groups
were correctly separated from each other. The first group was above the horizontal line and the second group
was at the bottom of the horizontal line. This indicates that the two-step cluster analysis has successfully
discriminated the countries and world regions in two groups.
FINANCIAL INCLUSION IN THE AFRICAN COUNTRIES
138
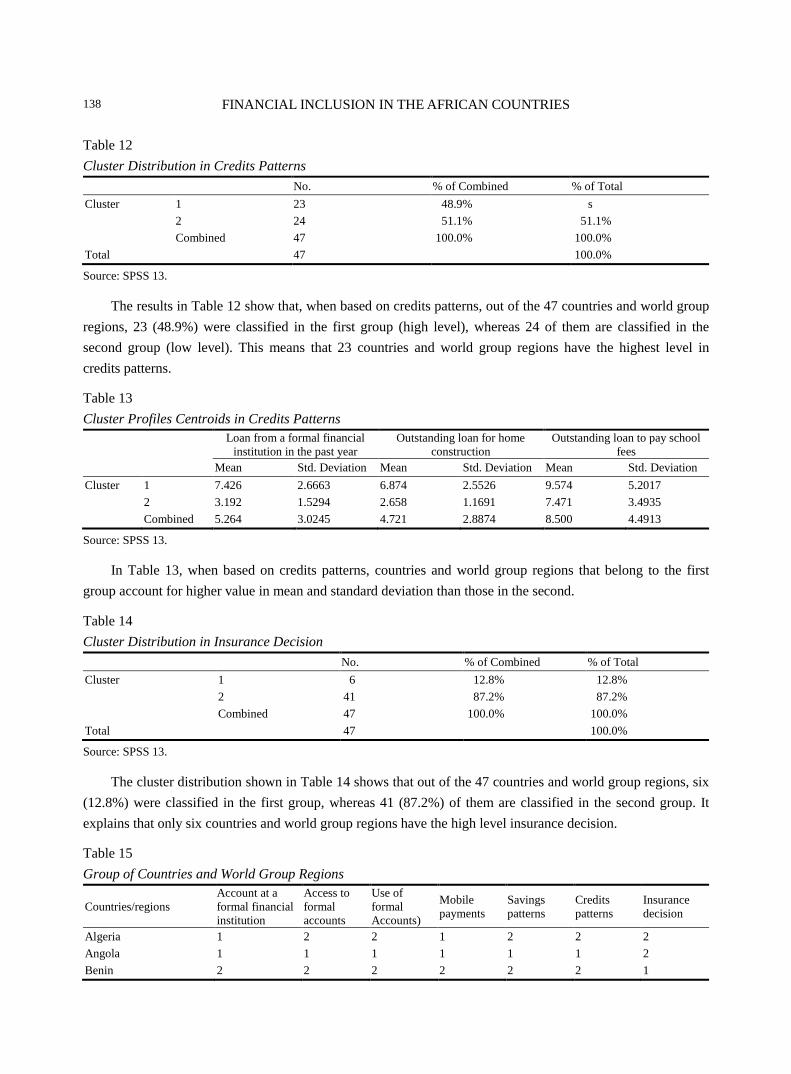
Table 12
Cluster Distribution in Credits Patterns
No. % of Combined % of Total
Cluster 1 23 48.9% s
2 24 51.1% 51.1%
Combined 47 100.0% 100.0%
Total 47 100.0%
Source: SPSS 13.
The results in Table 12 show that, when based on credits patterns, out of the 47 countries and world group
regions, 23 (48.9%) were classified in the first group (high level), whereas 24 of them are classified in the
second group (low level). This means that 23 countries and world group regions have the highest level in
credits patterns.
Table 13
Cluster Profiles Centroids in Credits Patterns
Loan from a formal financial
institution in the past year
Outstanding loan for home
construction
Outstanding loan to pay school
fees
Mean Std. Deviation Mean Std. Deviation Mean Std. Deviation
Cluster 1 7.426 2.6663 6.874 2.5526 9.574 5.2017
2 3.192 1.5294 2.658 1.1691 7.471 3.4935
Combined 5.264 3.0245 4.721 2.8874 8.500 4.4913
Source: SPSS 13.
In Table 13, when based on credits patterns, countries and world group regions that belong to the first
group account for higher value in mean and standard deviation than those in the second.
Table 14
Cluster Distribution in Insurance Decision
No. % of Combined % of Total
Cluster 1 6 12.8% 12.8%
2 41 87.2% 87.2%
Combined 47 100.0% 100.0%
Total 47 100.0%
Source: SPSS 13.
The cluster distribution shown in Table 14 shows that out of the 47 countries and world group regions, six
(12.8%) were classified in the first group, whereas 41 (87.2%) of them are classified in the second group. It
explains that only six countries and world group regions have the high level insurance decision.
Table 15
Group of Countries and World Group Regions
Countries/regions
Account at a
formal financial
institution
Access to
formal
accounts
Use of
formal
Accounts)
Mobile
payments
Savings
patterns
Credits
patterns
Insurance
decision
Algeria 1 2 2 1 2 2 2
Angola 1 1 1 1 1 1 2
Benin 2 2 2 2 2 2 1

FINANCIAL INCLUSION IN THE AFRICAN COUNTRIES
139
Table 15 continued
Countries/regions
Account at a
formal financial
institution
Access to
formal
accounts
Use of
formal
Accounts)
Mobile
payments
Savings
patterns
Credits
patterns
Insurance
decision
Botswana 1 1 1 2 1 2 2
Burkina 2 2 2 2 2 2 2
Burundi 2 2 2 2 2 2 2
Cameroun 2 2 2 2 1 1 2
CentAfriRep 2 2 2 2 2 2 2
Chad 2 1 2 2 2 1 2
Comoros 2 2 2 2 2 1 2
CngoRepD 2 2 2 2 2 2 2
CongoRep 2 2 2 1 2 2 2
Djibouti 2 1 2 2 2 1 2
Egypt 2 2 2 2 2 1 2
Gabon 2 2 2 1 2 2 2
Ghana 1 2 1 2 1 1 2
Guinea 2 2 2 2 2 2 2
Kenyan 1 1 1 1 1 1 1
Lesotho 2 1 2 2 2 2 2
Madagascar 2 2 2 2 2 2 1
Malawi 2 2 2 2 2 1 2
Mali 2 2 2 2 2 2 2
Mauritania 2 2 2 2 2 1 2
Mauritius 1 1 2 2 1 1 1
Moroco 1 1 1 2 2 2 1
Mozambique 1 1 1 2 1 1 1
Niger 2 2 2 2 2 2 2
Nigeria 1 1 1 2 1 2 2
Rwanda 1 2 2 2 1 1 2
Senegal 2 2 2 2 2 2 2
Siera Leone 2 2 2 2 1 2 2
Somali 1 1 1 1 2 2 2
South Africa 1 1 1 2 1 1 1
Sudan 2 1 2 1 2 1 2
Swaziland 1 1 1 2 1 1 2
Tanzania 2 1 2 2 1 1 1
Togo 2 2 2 2 2 2 2
Tunisie 1 1 2 2 2 2 2
Uganda 2 2 2 1 1 1 2
Zambia 2 1 2 2 1 2 1
Zimbabwe 1 1 1 2 1 2 1
EAsia&Pacific 1 1 2 2 1 1 1
Eurpe&CntralAsia 1 1 2 2 2 1 1
LtinAmca&Caraibbean 1 1 2 2 2 1 1
Middle East North Africa 2 2 2 2 2 1 1
South Asia 1 2 2 2 2 1 1
SubSaharan Africa 2 1 2 2 1 2 2
Source: Author’s compilation.

FINANCIAL INCLUSION IN THE AFRICAN COUNTRIES
140
The results shown in Table 15 are in the following.
According to the indicator account at formal financial institution, 15 African countries (Algeria, Angola,
Botswana, Ghana, Kenyan, Mauritius, Morocco, Mozambique, Nigeria, Rwanda, Zimbabwe, South Africa,
Swaziland, Tunisia, and Somali) were located in the group of high level, whereas the remaining 26 African
countries were in the group of low level.
Based on the six world group regions, four world group regions, such as East Asia and Pacific, Europe and
Central Asia, Latin America and the Caribbean, and South Asia, have a high level and two of them (Middle East
and North Africa and Sub-Saharan Africa) were in the group of the low level.
Concerning the indicator—access to formal account, 18 countries (Angola, Botswana, Chad, Djibouti,
Kenyan, Lesotho, Zimbabwe, Nigeria, Somali, South Africa, Sudan, Swaziland, Tanzania, Tunisia, Zambia,
Mauritius, Morocco, and Mozambique) have the high level, whereas 23 counts have the low level in having
access to formal account.
Concerning the indicators—use of formal account (use an account for business purposes, use an account to
receive wages, use an account to receive government payments, use an account to receive remittances, and use an
account to send remittances), 11 countries (Angola, Botswana, Ghana, Kenyan, Morocco, Mozambique, Nigeria,
Somali, South Africa, Swaziland, and Zimbabwe) have a high level in this indicator, whereas 30 countries have
low level in this in this indicator, according to the cluster analysis. Concerning the world group regions, all the six
groups have the low level in the “use of formal account”.
Based on the “use mobile payments” indicator (use a mobile phone to pay bills, use a mobile phone to send
money, and use a mobile phone to receive money), only eight countries (Algeria, Angola, CongoRep, Gabon,
Kenyan, Somali, Sudan, and Uganda) have a high level in it, while 33 Africans countries and the six world group
regions have taken place in the low level group.
Based on the “savings and credits patterns”, it is found that 16 countries respectively (Angola, Botswana,
Cameroun, Ghana, Kenyan, Mozambique, Mauritius, Nigeria, Rwanda, Sierra Leone, South Africa ,Zambia,
Tanzania, Uganda, Zimbabwe, and Swaziland) have had a high level in the savings patterns (saved for
emergencies in the past year and saved at a formal financial institution in the past year) and 19 countries ( Angola,
Botswana, Cameroun, Chad, Comoros, Djibouti, Egypt, Ghana, Kenyan, Malawi, Mauritania, Mauritius,
Mozambique, Rwanda, South Africa, Sudan, Uganda, Tanzania, and Swaziland) have had a high level in credits
(loan from a formal financial institution in the past year, outstanding loan to pay school fees, and outstanding loan
for home construction), while 25 countries have had a low level in savings patterns and 22 countries did not have
a high level in credits patterns.
Moreover, out of the six world group regions, only two regions (Sub-Saharan Africa and East Asia and
Pacific) and five regions (Latin America and the Caribbean, East Asia and Pacific, Europe and Central Asia,
South Asia, and Middle East and North Africa) have a high level respectively in “savings and credits patterns”,
while four group regions (Europe and Central Asia, Latin America and the Caribbean, Middle East and North
Africa, and South Asia) and only one region group (Sub-Saharan Africa) respectively have a low level in
“savings and in credits patterns”.
Concerning the indicator—insurance decision, six countries (Benin, Morocco, Swaziland, South Africa,
Mauritius, and Mozambique) well classified in this indicator, have a high level in “insurance decision”
(personally paid for health insurance), the remaining 35 countries have a low level in the latter.

FINANCIAL INCLUSION IN THE AFRICAN COUNTRIES
141
According to the world group regions, five group regions (East Asia and Pacific, Europe and Central Asia,
Latin America and the Caribbean, Middle East and North Africa, and South Asia) have a high level in “personally
paid for health insurance”, while one group (Sub-Saharan Africa) have a low level in it.
Conclusions
The aim of this study which is to find out the level in financial inclusion among 41 African countries on one
hand and the level in financial inclusion among the six world group regions on the other hand using cluster
analysis has led to successful results. The analysis of the results of this study with the use of the two-step cluster
analysis, when based on seven variables/indicators (account at a formal financial institution, access to formal
accounts, use of formal accounts, mobile payments, savings patterns, credits patterns, and insurance decision),
revealed that most African countries with low levels are low-income countries and those with high levels remain
largely of middle-income countries. Moreover, Sub-Saharan Africa is the only region that was classified in the
second group for five indicators and was the only one classified in the first group for two indicators (access to
formal accounts and credits patterns)
This research is the first concerning the comparison of level among African countries and among the
world group regions in financial inclusion using two-step cluster analysis. This research permits to gauge
African countries and six world group regions level in financial inclusion. Furthermore, this will enable to wake
up the African countries that have a low level in the financial inclusion in some indicators, to develop strategies
to enhance their level in the future, reduce poverty, and also enhance the economic growth.
Shortly, this research on global financing inclusion based on developing countries (particularly African
countries and the world group regions) enables to categorize the difference among these countries on one hand
and the difference among the world group regions on the other hand. This research can contribute largely to the
literature review.
References
Anderberg, M. R. (1973). Cluster analysis for applications. London: Academic Press.
Arunachalam, R. S. (2008). Scoping paper on financial inclusion, considerations and recommendations for UNDP. Retrieved
from www.in.undp.org/content/dam/india/docs/scoping_paper_on_financial_inclusion.pdf
Chatrath, S., & Vallabh, G. (2006). Role of banks in agricultural and rural development. Retrieved from
http://www.ruralfinance.org/fileadmin/templates/rflc/documents/102901122-1130.pdf
Demirgüç-Kunt, A., & Klapper, L. (2012). Measuring financial inclusion: The global index database (World Bank Policy
Research Working Paper 6025, World Bank, Washington, D.C.).
Government of India. (2008). Report of the committee on financial inclusion. Retrieved from
http//www.sksindia.com/downloads/Report_Committee_Financial_Inclusion.pdf
Kamath, R. (2007). Financial inclusion vis-à-vis social banking. Economic and Political Weekly, 42(15), 1334-1335.
Leeladhar, V. (2005). Taking banking services to common man: Financial inclusion (Commemorative lecture at the Fedbank
Hormis Memorial Foundation at Ernakulam on December 2).
Mor, N., & Ananth, B. (2007). Inclusive financial systems: Some design principles and a case study. Economic and Political
Weekly, 42(13), 1121-1126.
Porter, M. (1998). Competitive advantage. Creating and sustaining superior performance. New York: Free Press.
Reserve Bank of India. (2005). Report of the internal group to examine issues relating to rural credit and microfinance. Retrieved
from http://rbidocs.rbi.org.in/rdocs/PublicationReport/Pdfs/65111.pdf
Rogaly, B. (1999). Poverty and social exclusion in Britain: Where finance fits. In B. Rogaly, T. Fisher, & E. Mayo (Eds.), Poverty,
Social exclusion and microfinance in Britain. Oxford: Oxfam GB.
Scoltock, J. (1982). A survey of the literature of cluster analysis. The Computer Journal, 25(1), 130-134.
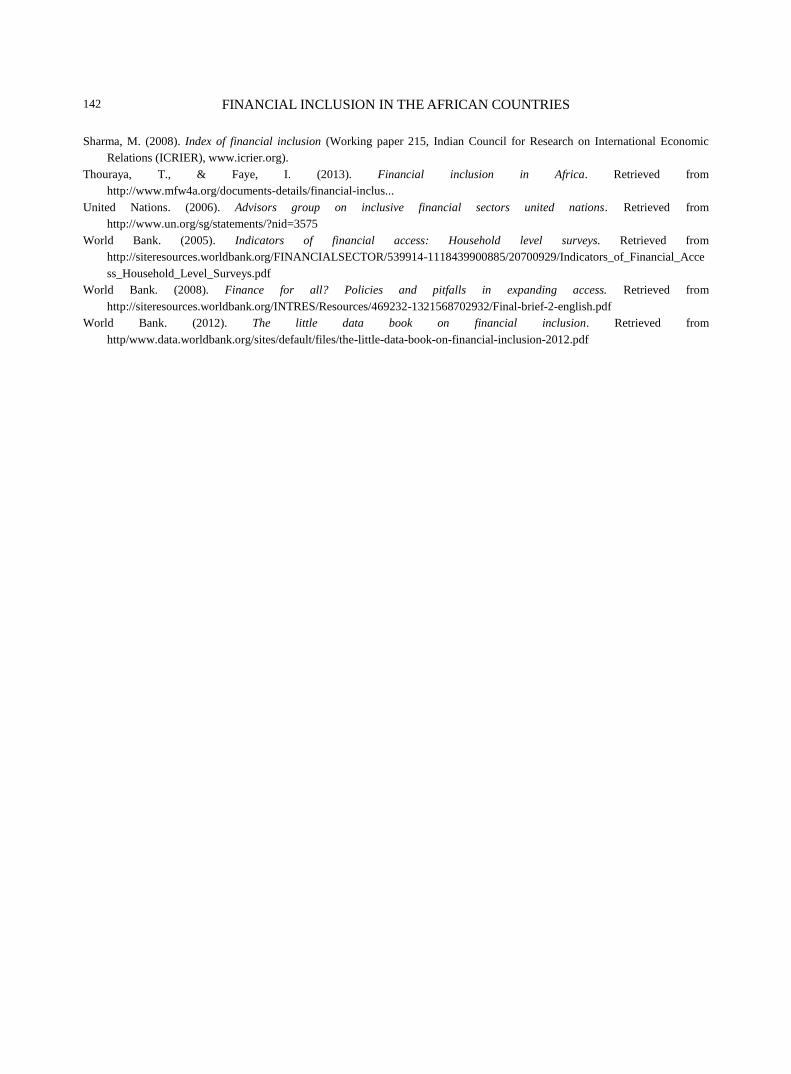
FINANCIAL INCLUSION IN THE AFRICAN COUNTRIES
142
Sharma, M. (2008). Index of financial inclusion (Working paper 215, Indian Council for Research on International Economic
Relations (ICRIER), www.icrier.org).
Thouraya, T., & Faye, I. (2013). Financial inclusion in Africa. Retrieved from
http://www.mfw4a.org/documents-details/financial-inclus...
United Nations. (2006). Advisors group on inclusive financial sectors united nations. Retrieved from
http://www.un.org/sg/statements/?nid=3575
World Bank. (2005). Indicators of financial access: Household level surveys. Retrieved from
http://siteresources.worldbank.org/FINANCIALSECTOR/539914-1118439900885/20700929/Indicators_of_Financial_Acce
ss_Household_Level_Surveys.pdf
World Bank. (2008). Finance for all? Policies and pitfalls in expanding access. Retrieved from
http://siteresources.worldbank.org/INTRES/Resources/469232-1321568702932/Final-brief-2-english.pdf
World Bank. (2012). The little data book on financial inclusion. Retrieved from
http/www.data.worldbank.org/sites/default/files/the-little-data-book-on-financial-inclusion-2012.pdf

China-USA Business Review, March 2015, Vol. 14, No. 3, 143-158 doi: 10.17265/1537-1514/2015.03.003
Policy, Legal, and Institutional Frameworks for PPP
Implementation in Development Process:
Stakeholders’ Perspective
Teshome Tafesse Beyene
Ethiopian Civil Service University (ECSU), Addis Ababa, Ethiopia
This study assessed the policy, legal, and institutional frameworks for public private partnership (PPP)
implementation in development process based on the perspectives of stakeholders in Ethiopia. An exploratory
sequential mixed method was employed. One hundred and twenty-one stakeholders were selected from public,
private, existing PPPs, and development partners, Think Thank and civil society organizations (CSOs) were
participated. The findings revealed that prevalence of specific legal framework for PPP, prevalence of PPP
dedicated public agency, and government guarantee are the most important factors to be put in place to implement
PPP in the development process of the country. An inclusion of PPP as part of the development policy, devising a
specific legal framework and establishing an independent public agency for PPP is the suggestion forwarded by the
stakeholders. The study recommends to incorporate PPP in the existing development policy as one of the
development strategies, to devise PPP strategy of the country and specific legal framework of PPP, and to establish
a federal PPP agency with the full mandate of undertaking PPP related issues under the Prime Minister’s office.
Keywords: public, private, civil society, legal framework, institutional framework, public private partnership (PPP)
Introduction
Government is a traditional provider of public services and an operator of public service delivery
institutions and development projects using resources from public sources, i.e., taxes and levy. However, the
ever-increasing disparity between the capacity of the public sector to generate resources and the public demand
for new facilities has forced governments to look for new funding methods and sources. Public private
partnership (PPP) as a new funding method is an increasingly popular phenomenon and a global trend (Hodge,
2005).
PPP is a long-term contractual arrangement between a public-sector agency and a private-sector
entrepreneur, whereby resources and risks are shared for the purpose of developing a public facility. For the
public sector, the principal aim of a PPP is to achieve value for money (Akintoye, Beck, & Hardcastle, 2003).
In relation to this, Alinaitwe and Robert (2013) elaborated that the public sector can secure value for money in
the public service delivery, while ensuring that the PPP partnering private-sector entities meet their contractual
obligations properly and efficiently. As a consequence, many countries are now contemplating PPP as an
Teshome Tafesse Beyene, Ph.D., assistant professor, Ethiopian Civil Service University (ECSU), Addis Ababa, Ethiopia. Correspondence concerning this article should be addressed to Teshome Tafesse, P.O. Box: 22811, Code 1000, Addis Ababa,
Ethiopia. E-mail: [email protected].
DAVID PUBLISHING
D

DEVELOPMENT PROCESS: STAKEHOLDERS’ PERSPECTIVE
144
arrangement between public and private sectors to finance, design, build, operate, and maintain public
infrastructure, community facilities, and related development projects.
Though the potential advantage of PPPs in public service delivery and development process is well
understood by most public policy makers and professionals around the globe, the extent in countries around the
world in general and developing countries in particular is quite slow (Teshome, 2014a). Perhaps being unaware
of some of the factors may preclude the enablers of the system from creating conducive environment for PPP
implementation. Particularly developing countries which are striving hard to alleviate poverty and bring about
development should effectively mobilize their resources and use their capacities for the success of their
development goals. In light of this, Ethiopia, as a developing country striving hard to develop, should work
hard to mobilize its available capacities from all sectors to keep forward its development targets. PPP is one of
the best potential mechanisms to mobilize resources (be it of public, private, or civil society) in the form of
collective action towards development and efficient public service delivery (Teshome, 2014a).
Hence, in line with this argument, it is imperative to study what specific factors affect adoption of PPP in
any country planning to adopt PPP for its development. Assessing conditions required for PPP adoption with its
legal and institutional environment are so important to start the new PPP arrangement. In view of this, this
study takes up the task of assessing factors attracting implementation of PPP in development process of
Ethiopia. Moreover, the prevalent condition for PPP including legal and institutional framework was studied.
The study was mainly based on the stakeholders’ perspectives. The researcher tried to associate and compare
the summary perspective of stakeholders with the related best practices and empirical study findings done in
PPP area somewhere around the globe. The study subjects were requested to share their hands on experience
and knowledge regarding what conditions or factors are needed, so as PPP could operate, involve, and expand
in Ethiopian development process. To keep the validity and reliability of the study, the researcher opted to use
study tools employed by other scholars in PPP studies done somewhere else.
Studies by Li, Akintoye, Edwards, and Hardcastle (2005) and Cheung, Chan, and Kajewski (2009) tried to
investigate the attractive factors for adopting PPP in their respective study area. The study of Li et al. (2005)
revealed that the top three attractive factors were “transferring of risk to private sector”, “solving the problem
of public sector budget constraints”, and “non-recourse or limited recourse public funding”. The same study
examined the differences between the public and private sectors respondents’ perceptions on the importance of
the attractive factors and reported that there are no significant differences in perception except for a few factors
that are not among the top three attractive factors (Ismail, 2013).
A similar study done by Cheung et al. (2009) reported that the top three attractive factors for PPP in Hong
Kong include “providing an integrated solution for public services”, “facilitating creative and innovative
approaches”, and “solving the problem of public sector budget restraint”. The top three attractive PPP factors
for Australian respondents were “providing an integrated solution for public services”, “facilitating creative and
innovative approaches”, and “saving time in delivering the project”. The findings of the above studies reveal
that factors perceived by respondents from different countries are not the same. This implies that factors attracting
adoption of PPP may differ on the basis of the specific objective condition of the study area or country.
Therefore, the unique characteristics of PPP in each country influence the PPP attractiveness in the
country (Ismail, 2013). Because of this, the case in Ethiopia can be expected to be different, not only because of
the unique characteristics of the prevalent PPPs, but also because of the undeveloped conditions for PPP
(Teshome, 2014b).

DEVELOPMENT PROCESS: STAKEHOLDERS’ PERSPECTIVE
145
PPP in Ethiopian Policy and Legislative Documents
The review of Federal Democratic Republic of Ethiopia’s (FDRE) policy and national development
documents reveals that partnership is one of the sought strategies of development. There are many legal and
policy documents mentioning the significance of partnership between the public and private sector in the
Ethiopian development process. The development policy document for rural development issued in 1994
acknowledged the significance of creating an integration or partnership between farmers and potential private
investors in agricultural sector, particularly in securing and expanding markets for agricultural products. It was
clearly stated in the policy document as: “… all sorts of efforts shall be done to find private companies with
high level of experience in agricultural development and attract them to come and work with farmers in
partnership …”(Ministry of Information [MOI], 1994a, p. 211).
It further elaborates that this partnership can be in the form of “a contractual agreement between farmers
and the private investing companies”, as it is widely known as “out growers’ agreement” (MOI, 1994a, p. 211).
Knowing the critical importance of creating such partnership for the success of the agricultural and rural
development, the policy document prescribes that “the government should work hard to put in place all
preconditions or enable environment to establish and expand the out grower system of partnership” between
farmers and the private investors (MOI, 1994a, p. 215).
Ethiopia’s industrial development strategy of 1994 elaborates the importance of the public and private
partnership for the success of the policy. It particularly states that “the government shall work with private
investors in a more collaborated manner and partnership so as the envisaged policy objective could be attained”
(MOI, 1994b, p. 64). It is also boldly stated in the Plan for Accelerated and Sustained Development to End
Poverty (PASDEP) document that, as the private and civil society sectors have grown, diversified, and
expanded their program activities and areas of public engagement, they have been gaining an increased support
and recognition from the public side (Ministry of Finance and Economic Development [MOFED], 2006). The
government itself has gradually opened avenues for private and civil society sectors involvement in many areas.
A PASDEP, the government’s development plan for the year from 2005 to 2010, recognized the strong role that
non-governmental organizations (NGOs) have been playing and will continue to play in the effort to overcome
poverty and meet the Millennium Development Goals (MDGs). This is more strengthened by Dessalegn,
Akalewold, and Yoseph (2010), who asserted that the Ethiopian government will find it difficult to meet the
MDGs, especially in the nutrition, health, education, and water sectors, without the active intervention of the
voluntary sector (civil society).
The Growth and Transformation Plan (GTP) document explains that efforts shall be done to enable the
private sector to be the engine of growth and the primary source of investment. It also makes clear that
domestic and international participants will be encouraged and an “active partnership between the public and
private sectors will be promoted” (MOFED, 2010, p. 144). As it is stated in GTP documents, the planned
activity to promote growth and development embraces a number of critical factors for Ethiopia, among which
the “private and public partnership is one of these factors” (MOFED, 2010, p. 224).
The document clearly describes to “provide better access to services (water, power, irrigation, roads, and
telecommunication) through more efficient utilization of existing infrastructure and building new capacity and
to promote PPPs in infrastructure development for industrial development and speeding up implementation of
industrial zones” (MOFED, 2010, p. 157).

DEVELOPMENT PROCESS: STAKEHOLDERS’ PERSPECTIVE
146
Moreover, the country strategy paper for the years from 2011 to 2015 states that the private sector is
expected to play a major role in GTP implementation. However, clearer strategies for crowding in private
investment need to be articulated, particularly in the context of the current weaknesses in the financial sector
and the business environment (African Development Bank, 2011).
Hence, one can easily understand from this that the Ethiopian government is well aware of the benefit of
involving the private sector and civil society in the form of partnership in the process of development of the
country. However, issues like the importance of dedicated PPP policy, legal, and institutional framework, what
favorable sectors or areas of investment for partnership are there, and what is the potential of PPP in the context
of Ethiopian development process, remain unclear.
Hence, this study assesses factors attracting the implementation of PPP in Ethiopia’s development process,
appropriate policy, legal, and institutional frameworks for PPP implementation in Ethiopia on the basis of the
stakeholders’ perspectives. The methodology and theoretical framework employed in this study are briefly
presented below.
Methodology and Theoretical Framework
An exploratory sequential mixed method research design was employed (Hesse-Bibe, 2010). The
stakeholders’ perspectives about the factors attracting implementation of PPP were solicited by using a
questionnaire survey. The researcher used some fitting factors stated in the questionnaire template designed by
Cheung et al. (2009). The researcher believes that using the available list of factors was advisable compared to
developing a new list of factors from scratch. As it is described by Ismail (2013), these are recognized by the
sector and global scientific community as several articles using the same list of attractive factors have been
published in reputable refereed scientific journals. To this end, list of factors used to measure stakeholders’
perspective in this study is depicted in Table 1 below. To identify appropriate policy, legal, and institutional
framework of PPP, qualitative approach was used. The qualitative data were collected using document review,
interview, and open-ended questionnaire survey.
Table 1
List of Factors Attracting Adoption of PPP in Public Service Delivery and Development Factors Supporting literature
1 Government support in providing guarantee Cheung et al. (2009)
2 Government support in providing loan Cheung et al. (2009)
3 Tax exemption or reduction Cheung et al. (2009)
4 Prevalence of PPP dedicated public agency Qiao, Wang, Tiong, and Chan (2001); Yescombe (2007)
5 Prevalence of PPP specific legal framework Tiong (1996)
6 Government’s willingness to share risks Qiao et al. (2001)
PPP As Part of Development Policy
PPP is emerging as a new development arrangement. In this regard, the dominant argument asserts that
PPP maximizes benefits for development through collaboration and enhances efficiency (Bringkerhoff, 2001).
Thus, PPP can be conceived as a very important method of promoting development and a tool for development
(Binza, 2009).
Urio (2010) explained the importance of integrating of PPP into the development policy of developing
countries. He further elaborated that the major goal of integrating PPP in the development strategy is to build a

DEVELOPMENT PROCESS: STAKEHOLDERS’ PERSPECTIVE
147
society that improves the attainment of the four values, namely: efficiency, equity, sustainability, and security.
That is to mean, “an economy developing with a level of efficiency compatible with a sustainable pace, human
activities (both private and public) organized and coordinated in a way that preserves the environment and more
particularly scarce and non-renewable natural resources, organized in a way that realizes a balanced society
with a reasonable, acceptable, and improving level of equity and security” (Urio, 2010, p. 52). There are some
conditions expected to be fulfilled, so that PPP could be taken as a part of development strategy of a given
country.
Accordingly, these conditions can be defined in three interrelated levels: strategic, contextual, and
operational, each of them comprising a set of conditions or factors susceptible to having an impact on PPP
(Urio, 2010). But in reality, these three levels are not perfectly separated (not entirely mutually exclusive).
However, the author describes that the importance of dividing the three factors into manageable components is
in view of making the analysis simple and clear, whereas, they are in fact imbedded into a single reality. Figure
1 summarizes the divided components of factors affecting the adoption and implementation of PPP.
Figure 1. Three levels of conditions for PPP adoption as part of the development strategy. Source: Urio (2010).
As it can grasp from the Figure 1, the strategic level conditions comprise two major components: the
polity and public administration. The polity comprises the political will of the leadership, Think Thank, and
NGOs. These are listed under polity, because of their expected access to the political decision-making process.
Transparency and accountability are important factors under public administration.
The contextual level incorporates the conditions within which the strategy is implemented. The following
contextual elements are considered: the state of the development policy, availability and provision of
infrastructures (electric city, transport, and communication facilities), the awareness of partners (private, public,
and civil society) about PPP, impact or support of international development partners, and favorability in terms
of geographical location and natural resource.
Implementation
STRATEGIC LEVEL
Polity (political system) ‐ Political will of leadership ‐ Think Thank ‐ NGOs Public Administration ‐ Transparency ‐ Accountability
CONTEXTUAL LEVEL
The state of domestic Infrastructure
‐ Electric power ‐ Transportation facilities ‐ Communication facilities Partners Awareness ‐ Private investors ‐ Public officials ‐ Civil society financiers
OPERATIONAL LEVEL
Legal and institutional framework
‐ Private property (protection) ‐ Public procurement ‐ Contract law of PPP ‐ Dedicated PPP agency Partners Competencies ‐ Local investors ‐ International investors
Support of international development partners Type of development policy (favors PPP) Impact of geographical situation

DEVELOPMENT PROCESS: STAKEHOLDERS’ PERSPECTIVE
148
The operational level includes the legal and Institutional framework, i.e., the rules governing the economy,
private property, public procurement, contract law (and more specifically rules governing PPP), as well as the
prevalence of PPP dedicated institution. Then, the competencies of partners to engage themselves in PPP
contracts in terms of asset possession, financial capacity, legitimacy to secure loan, skills, and knowledge are
factors considered in this level.
Findings and Discussion
Sample and Data Collection Procedures
An empirical cross sectional survey was conducted from January 2014 to March 2014 to analyze the major
factors attracting PPP implementation in public service delivery and development projects in Ethiopia.
In this study, the target survey respondents included individuals from the public, private, and civil society
sectors, and also development partner institutions, Think Thank, and available PPP institutions. The survey
respondents were requested to rate their degree of agreement against each of the identified factors attracting the
private sector partners to engage in PPP, according to a five-point Likert scale (1 = least important, 2 = less
important, 3 = important, 4 = more important, and 5 = most important).
Target respondents were selected using snowball sampling technique based on their direct hands-on
involvement in PPP related issues and their willingness to participate in the survey. List of public, private, civil
society, development partners, Think Thank, and PPP institutions, was created by considering potential, direct,
or indirect involvement in issues related to PPP implementation in Ethiopian context. Then, a kind of quota
sample was assigned to each institution to select individual practitioners or professionals to participate in the
survey.
Response Rate and Demographic Background of Respondents
A total of 127 survey questionnaires were distributed to target respondents who are working in different
public, private, civil societies, development partner, Think Thank, and PPP institutions. A total of 121
completed questionnaires were returned representing a high response rate of 95%.
As it is shown in Table 2 below, among the 121 respondents, 41 (32%) engaged in the private sector, 39
(31%) in public sector, 12 (9%) in the civil society sector, and 13 (10%) in PPP. The remaining 10 (8%) and six
(5%) were from the development partners and Think Thank institutions, respectively. The majority of the
respondents were from the private and public sectors representing 80 (63%) of the whole sample stratum.
Table 2 Response Rate of the Questionnaire
Sector
Distributed Returned Response. Rate %
Sex Sex
Female Male Total Female Male Total
Civil society 3 9 12 3 9 12 9.4
Development partners 2 8 10 2 8 10 7.8
PPP 4 9 13 4 9 13 10.2
Private sector 12 31 43 12 29 41 32.3
Public sector 11 32 43 11 28 39 30.7
Think Thank 1 5 6 1 5 6 4.7
Total 33 94 127 33 88 121 95.3
Source: Survey output.

DEVELOPMENT PROCESS: STAKEHOLDERS’ PERSPECTIVE
149
As it is depicted in Table 3, the survey respondents comprised well-educated, experienced, and matured
practitioners from five sectors with direct or indirect influence on PPP implementation, for instance, 63 (52%)
and 35 (30%) of them are MA and BA degree holders, respectively. This constituted about 98 (82%) of the
total sample. The remaining four (3%) and 19 (16%) are Ph.D. and diploma holders, respectively. With regard
to their age, 108 (89%) are between 31-50 years of age, making the sample stratum dominated by matured
people. As shown in Table 4, 68 (56%) and 53 (44%) of the respondents possessed more than 11 years and five
years of work experience, respectively.
Table 3
Survey Respondents by Level of Education and Age Category
Sector Level of education Age in years
BA DIP MA PhD Total Category Female Male Total
Civil society 4 1 7 1 12 18-30 3 5 8
Dev. partners 3 0 6 1 10 31-40 18 30 48
PPP 2 4 7 0 13 41-50 11 49 60
Private sector 13 7 21 0 41 50 1 4 5
Public sector 11 7 18 0 39 Total 33 88 121
Think Thank 0 0 4 2 6
Total 35 19 63 4 121
Table 4
Factors Attracting PPP Implementation in Public Service Delivery and Development Projects
Variables Obs Mean Std. Dev. R Min Max
Existence of specific PPP law 121 4.818182 0.447214 1 3 5
Existence of PPP dedicated public agency 121 4.636364 0.483046 2 4 5
Government guarantee 121 4.404959 0.996481 3 2 5
Tax exemption or reduction 121 4.371901 0.720327 4 2 5
Government provision of loan 121 4.22314 0.73584 5 2 5
Government willingness to share risk 121 4.190083 0.767182 6 3 5
Source: Survey output.
Factors for Implementation of PPP in Development Stakeholders Perspective
Table 4 illustrates the mean scores and the rank of the relative importance for each of the six factors based
on the rating of all survey respondents. The result shows that the six factors were well perceived by all
respondents to be either “more important” or “most important”, because the mean scores for the factors range
from 4.2 to 4.8.
Moreover, the mean score rank result of all respondents indicates that three factors found to be most
important in their ascending order of importance. These are “existence of specific PPP law” (MS = 4.8),
“existence of PPP dedicated public agency” (MS = 4.6), and “government guarantee” (MS = 4.4).
The prevalence of specific legal framework for PPP is perceived by respondents as the basic and most
important factor to implement PPP in public service delivery and development projects. Furthermore, the Stata
software summary statistics shows that 84% of respondents expressed their perception by rating as “strongly
agree”, i.e., most important. When the rating of respondents from different sectors separately is seen, 85% of
the private sector respondent and 77% of public sector respondents rated as “strongly agree”. Interestingly
enough, 100% of the respondents from the existing PPP rated the relative importance of PPP specific legal

DEVELOPMENT PROCESS: STAKEHOLDERS’ PERSPECTIVE
150
framework as “strongly agree”. Moreover, 83% of civil society respondents rated the prevalence of legal
framework as most important factor for PPP implementation as “strongly agree”. This finding clearly indicates
that PPP stakeholders in Ethiopia strongly believe that the federal government of Ethiopia has to devise a
specific legal framework for PPP as a prerequisite, so that potential private and civil society partners would
freely involve or engage in public service delivery and development oriented projects with government under
PPP arrangement.
The second most important factor for PPP implementation in Ethiopian, as perceived by most respondents
was “the existence of PPP dedicated public agency”. This factor seems vital in a sense that a mere existence of
PPP specific legal framework, may not serve the purpose, without owning institution to implement the
provision stipulated in it. Put differently, the legal framework with its supporting rules and regulations needs to
be owned by public agency with a full mandate to run and execute, according to norms and provisions
stipulated in it. Unless an institutional arrangement is put in place, the mere existence of rules and regulations
may not serve the purpose.
This finding supports the recommendation of Jamali (2004) suggesting that while PPP can bring added
value to the partners, a sound legal and regulatory framework and complete transparency are essential elements.
Also important is the presence of strong structure at the level of central administration to steer and guide policy
implementation.
Differences in the Perceptions of the Public and Private Sectors’ Respondents on the Importance of
Attractive Factors
Based on the mean score rankings, the results of the public and private sector respondents on the perceived
importance of each factor are almost similar except for differences in three factors. Table 5 shows that all
factors were perceived to be more important by the private sector respondents than those by the public sector
respondents. In this sense, in Ethiopia, PPP seems the main choice of the private sector to be involved in
development projects in collaboration with government and in order to enhance its role in the process of overall
development of the country.
Table 5
Summary of the Independent T-test Results for Attractive Factors
Attractive factors Mean T-test
Private Public Diff. t Sign.
Government support in providing guarantee 4.414634 4.384615 0.300188 0.1349 0.8930
Government support in providing loan 4.317073 4.051282 2.657911 1.5345 0.1290*
Tax exemption or reduction 4.512195 4.358974 1.532208 0.9203 0.3603*
Prevalence of PPP dedicated public agency 4.487805 4.487179 0.006254 0.0053 0.9958
Prevalence of PPP specific legal framework 4.682927 4.512821 1.701063 1.0055 0.3178*
Government’s willingness to share risks 4.609756 4.512821 0.969356 0.6424 0.5225
Note. * significant at 0.05.
On the bases of the results illustrated in Table 5, it is prudent to conclude that there is a significant
difference in the perception of the public and private respondents in three factors, namely: government support
in providing loan, tax exemption or reduction, and prevalence of PPP specific legal framework. The data in
Table 5 shows a statistically significant difference at 5% significance level.

DEVELOPMENT PROCESS: STAKEHOLDERS’ PERSPECTIVE
151
The private sector respondents perceived the attractive factor: The prevalence of PPP specific legal
framework is significantly more important compared to the public sector respondents. This may be because the
private sector considers it critical to gain confidence in PPP implementation process, such as negotiation,
contract, and execution. Similarly, for the other two factors: tax exemption or reduction and government
support in providing loan, the private sector respondents perceived them as significantly more important
compared to public sector respondents. The private sector respondents believed that the issue of tax exemption
and provision of loan services was among the most important factors motivating or attracting private partners’
engagement in PPP.
The findings of Cheung et al. (2009) also indicate the prevalence of significant difference between the
perceptions of respondents in Hong Kong and Australia. Their comparative study did not consider public and
private sectors separately but overall respondents on the basis of their homelands. Similar, results are reported
by Ismail (2013) on the presence of significant differences between the perceptions of private and public sector
respondents in Malaysia. The latter study further reported that public sector respondents perceived the factors
as more important than the private sector respondents (Ismail, 2013). In contrast, the findings of this study
imply that the private sector respondents in Ethiopia perceived the factors as more important than the public
sector respondents. The private sector respondents in Ethiopia perceived the attracting factors of PPP similar to
that of the UK respondents (Li et al., 2005).
Policy, Legal, and Institutional Frameworks for PPP Implementation
Conditions for PPP adoption. An assessment of conditions for PPP adoption and implementation in
Ethiopia has been carried out using study variables recommended by Urio (2010). These are classified into
three levels: strategic, contextual, and operational levels of conditions. Each of these comprises a set of factors
having an impact on prevalence of PPP. Respondents were asked to indicate their opinion about the prevalence
of conditions by choosing “yes”, “no”, or “do not know” options for each factor listed under the three major
levels of conditions. Moreover, respondents were given the chance to express their point of view freely in the
space provided in the questionnaire. In addition, relevant documents were assessed and interview data was used
to support the findings, as it deemed necessary for some particular factors.
In summary from the strategic level conditions, the prevalence of political will among the polity was
confirmed by both survey respondents and key interviewees. From the contextual level conditions, the
country’s geographic location is believed to be suitable for PPP expansion and development. The infrastructural
development and expansion trend in the country, particularly the ongoing hydroelectric dam construction,
railways, and road construction for transportation and telecom expansion for communication facilities can
together be conducive contextual conditions for PPP expansion in Ethiopia.
The prevalence of constitutional protection for the right to possess private property is notable operational
level condition prevalent in Ethiopia. The asset and financial capacity of local private sector investors as
perceived by respondents also shows the confidence in the availability of capable investors among potential
PPP partners in Ethiopia.
Legal framework of PPP. In order to assess the existing legal framework specific to PPP application in
Ethiopia, the researcher conducted document review, open-ended questionnaire survey, and interviews.
Specific documents reviewed for this question were: Public Enterprises Proclamation (No. 25/1992),
Privatization of Public Enterprises Amendment Proclamation (182/1999), Investment Proclamation (No

DEVELOPMENT PROCESS: STAKEHOLDERS’ PERSPECTIVE
152
280/2002), Public Enterprises Supervising Agency Establishment Proclamation (No.412/2004), Procurement
and Property Administration Proclamation (No. 649/2009), Investment Proclamation (No. 769/2012), and a
journal article, Revisiting Company Law With the Advent of Ethiopian Commodity Exchange.
The relevant document review conducted in view of detecting the presence of specific legal framework for
PPP reveals that the country lacks special legal instruments for PPP. The law of the land that governs business
companies and associations, i.e., Commercial Code of Ethiopia of 1960 used the term “partnership” in its
definition of business organization. According to the Commercial Code (article 210(1)), business organization
is any association arising out of a partnership agreement. Though the use of the word “partnership” in the
definition of business organization is likely to include PPP in the category of business organizations, the very
definition of partnership agreement in the same code does not mention who the partners may be nor if one of
the partners could be the government or public. The Commercial Code simply defines partnership agreement as
a contract whereby two or more persons, who intend to join together, cooperate, and undertake to bring together
contributions for the purpose of carrying out activities of an economic nature… Apart from defining business
organization and partnership agreement in association with it, the code does not mention about PPP as one form
of business organization.
According to article 2(1) of Public Enterprises Proclamation (No. 25/1992), public enterprises are
companies established by law, where business organizations are registered companies that are established by a
memorandum of association. Here, ambiguity is seen in the legal system—how PPP as a business entity could
be established. In line with this point, article 2(3) of Privatization and Public Enterprises Supervising Agency
Establishment Proclamation (No.412/2004) defines a share company as a company partially owned by the state
and this definition replaces the total ownership provision stated in Proclamation (No. 146/1998) and
Proclamation (No. 277/2002) and introduces the possibility of joint ventures with the government.
Here, some kinds of PPP arrangement envisaged in the process of privatization can be seen. Later on, this
point is clearly elaborated in the Ethiopian Federal Government Procurement and Property Administration
Proclamation (No. 649/2009). The term PPP is defined perhaps for the first time in the legal documents of
Ethiopia as: Public private partnership means investment through private sector participation by a contractual
arrangement between a public body and a private sector enterprise, as the concessionaire, in which the
concessionaire undertakes to perform, any construction project, or service; or lease concession assumes
substantial financial, technical, and operational risks in connection with the performance of a public function or
use of government property; and receives consideration for performing a public function or utilizing
government property, by way of fees from any public funds, user levies collected by the concessionaire from
users or customers for a service provided by it, or a combination of such consideration (Federal Democratic
Republic of Ethiopia [FDRE], 2009).
Even though, the term PPP is clearly defined in the law text, how it could be implemented in the public
procurement process is not mentioned. The law empowers the minster of MOFED to issue rules and directives
of PPP formation and implementation. Accordingly, this is stipulated as that the minister may issue directive
prescribing the rules governing the formation of PPP and the modes of implementation of such partnership
(FDRE, 2009).
Furthermore, the Investment Proclamation (No 769/2012) confers the power of decision to approve any
proposal submitted by any private investor intending to engage with government in article 6(9) of the
proclamation. It is described as: The privatization and public enterprises supervising agency shall receive

DEVELOPMENT PROCESS: STAKEHOLDERS’ PERSPECTIVE
153
investment proposals submitted by any private investor intending to invest jointly with the government; it shall
submit same to the ministry of industry for decision and upon approval, designate a public enterprise to invest
as partner in the joint investment (FDRE, 2012).
This clearly implies that the level of development achieved in the country is demanding new form of
business structure one of which government is supposed to participate as a partner. However, there is a strong
interest for PPP adoption, the existing system of rules and regulation seems inadequate to attract, mobilize, and
implement PPP arrangement in the development of the country. The Commercial Code of the country is not
modified or updated to accommodate such developments. One of the very evidence for this point is that, the
initiation of founding Exchange Commodity Exchange (ECX) with its unique characteristics has brought a
challenge in the legal system.
The respondents were asked to indicate their opinion about the prevalence of PPP dedicated policy in
Ethiopia. The majority of respondents 59 (49%) reported that they do not know whether the existing
development policy is suitable for PPP implementation or not. The qualitative data synthesized from interviews
indicate that the existing policy is highly suitable for private sector development, but not for PPP involvement
in development. The fact that PPP is not incorporated in the development policy as a component, in the form of
development strategy, shows that the existing development policy is not suitable as desired. On one hand, 87
(72%) respondents reported that PPP is not incorporated in the development policy as development strategy.
This response is supported by data obtained from the interviews and document review.
On the other hand, 91 (75%) of the respondents believe that there is no specific law or regulation of PPP
that could attract investors to engage in PPP projects. This finding is in harmony with the data obtained from
interviews and also the document review done in light of the purpose of this study.
Institutional framework of PPP. In order to assess the existing institutional framework of PPP in
Ethiopia, document review, open-ended questionnaire survey and interview were conducted. Specific
documents reviewed for this question were: Privatization of Public Enterprises Amendment Proclamation
(182/1999), Investment Proclamation (No 280/2002), Public Enterprise Supervising Authority Establishment
proclamation (No 412/2004), Ethiopian Federal Government Procurement and Property Administration
Proclamation (No. 649/2009), and Investment Proclamation (No. 769/2012). The review of legal texts detects
conflicting provisions regarding government bodies in charge of PPP related issues. Article 34 of Procurement
and Property Administration Proclamation (No. 649/2009) confers the power to the minster of MOFED to
issue rules and directives of PPP formation and implementation. Whereas Investment Proclamation (No
769/2012) of article 6 (9) confers the power of decision to approve any proposal submitted by any private
investor intending to engage with government to Ministry of Industry. Therefore, review of the relevant
documents shows that there is no PPP dedicated public agency or enterprise with a mandate to regulate, manage,
and oversee the implementation of PPP in Ethiopia.
Interviewees from the private and civil society sectors mentioned that the country lacks an independent
and empowered public agency to run PPP issues in Ethiopia. This gap further exacerbated mistrust among the
potential partners from the private and civil society sectors and the government. Had the agency been available
in the public administration system, it would have pursued developmental promotional activities to bring about
potential partners from all sectors into development agenda, which would have in turn built strong confidence
and trust among all partners.

DEVELOPMENT PROCESS: STAKEHOLDERS’ PERSPECTIVE
154
Whereas interviewees from the public sector argue that there is an enough institutional arrangement to
accommodate potential partnership projects. Therefore, they say, having a special agency for PPP may not be
feasible. They insist that the attention of the public sector should be on building the capacity of private
investors in financial, technical, and ethical terms, so that they can have adequate capacity to work in mega
development projects in collaboration with the government in PPP arrangement. They believe that the current
capacity of the private sector by and large is not enough to work with the government in big development
projects. The interviewee from the private sector admitting the infancy of the private sector argued that the
private sector capacity is now growing to the level of contributing to the ongoing development of the country
comparatively more than the public sector itself. In the recent past, the private and public sectors were both
incapable due to the past socialist oriented command economy. Hence, devising mechanisms such as specific
regulations and institutional frameworks for PPP may help to build the capacity of both sectors.
Suggested Policy, Legal, and Institutional Framework
Type of policy suggested. According to data displayed in Table 6, 95 (79%) respondents suggested a type
of policy that accommodates PPP as part of the development strategy. This suggestion is supported by most of
the interviews from all sectors. This would also provide a legitimate opportunity for all sectors to shoulder and
execute societal and developmental responsibilities with full confidence. Urio (2010) suggested this type of
policy as the best option to utilize the potential of the private sector particularly for developing countries.
Table 6 Summary of Stakeholders’ Suggestion on Type of Policy, Legal, and Institutional Framework of PPP for Ethiopia
Variables Freq % Interview data Document Data
Type of policy
Accommodates PPP as part of development strategy
95 78.51 Most of interviewees support this option is useful for Ethiopia
Urio (2010) recommended this options for developing countries
Allows PPP as it deems necessary but not as development strategy
17 14.05 ----
Never allow PPP arrangement in public projects 3 9 -------
Type of legal framework
With specific laws, regulations and procedures for PPP
102 84.30 Most of interviewees seconded this option for Ethiopian legal context
Getahun (2010) suggested updating the commercial code of Ethiopia
Without specific laws and regulation for PPP 19 15.70 - -
Type institutional framework
Public agency with full mandate for PPP 95 78.51 Some interviewees from all sectors support this option
Yescombe (2007)
PPP units or directorates in concerned public offices
18 14.88 Some interviewees from public and CSOs support this option
Cheung et al. (2009)
Type of legal framework of PPP suggested. According to summary data presented in Table 6, 102 (84%)
stakeholders suggested the type of legal framework with specific laws, regulation, and procedures of PPP.
These suggestions are also supported by most of interviewees. In the same manner, all partners from other
sectors will have an opportunity to engage in PPP with confidence, good will, and sense of public
accountability, knowing that the rules and regulations are functional to protect the interest of the general public
as well as the participants in the partnership system.

DEVELOPMENT PROCESS: STAKEHOLDERS’ PERSPECTIVE
155
Type of institutional framework of PPP suggested. According to the data presented in Table 6, 95(79%)
respondents recommended that the Ethiopian government should establish an institutional framework for PPP
that is led by a public agency with full mandate at federal level. This suggestion is also supported by
interviewees from all sectors. The reasons mentioned by interviewees and some survey respondents through the
open-ended questions are: Having a responsible and accountable public agency with full mandate to plan,
promote, execute, and report issues related to PPP implementation would help to integrate capacities of all
relevant sectors towards the development goals of the nation. Since the capacity of the private sector is ever
increasing, the government as the most important actor and enabler of the development has to create an
effective institutional mechanism to plan, prioritize, optimize, and use the growing potential of the sector in
view of accelerating the general development direction of the country. Some interviewees, who also agree with
notion of having a special and dedicated institution at the center, suggest another model. According to them, a
special office (division, directorate, or department) could be established in the Office of the Prime Minster
(Council of Ministers) to be headed by a professional appointee with the rank of minister to manage and
oversee PPP related issues throughout the country. They say that the designated or appointed minster of PPP
should be accountable to the Prime Minster.
In this regard, all public institutions presumably will have their own structures (PPP units or directorates)
in their respective organizational structure. Heads of the PPP units or directorates may have dual accountability,
to the head of the public institution and as well as to the minster of PPP in the Council of Ministers. Another
option suggested by interviewees was a National Public Agency with full mandate to oversee issues related to
PPP. The leadership will include representatives from the public, private, and civil society sectors. The
directors’ board chairperson of this special agency could be appointed by the government, because of the
traditional role of the government to lead development and provide public services for its constituencies. The
CEO or General Director of the special agency may be hired by open vacancy announcement from the labor
market.
Conclusions
The study examined factors attracting adoption of PPP in public service delivery and development projects
in Ethiopia. The study evaluated the difference in the perception of the two main players in PPP, the public and
the private sectors. Hence, the three main attractive factors for implementing PPP in Ethiopia are prevalence of
PPP specific legal framework, prevalence of PPP dedicated public agency, and government support in
providing guarantee. In terms of the differences in perception between the public and private sector groups, the
independent t-test results indicated that there are significant differences in three attractive factors. Regarding
the perceptive difference between the respondents in the two sectors, the study concludes that the private sector
in Ethiopia is ready to get involved in PPP arrangements, provided that these attractive factors are put in place
by the government. It is also valid to conclude from these findings that the Ethiopian government may consider
offering these three important attractive factors to motivate and engage the private sector in development
oriented PPP projects. Potentially, other attractive factors, such as tax exemption, risk sharing, and loan
provision may also be considered by the government to expedite engagement in PPP projects.
Respondents suggested that Ethiopia should have a policy in which PPP is considered one of the development
strategies as suggested by Urio (2010). Regarding the type of legal framework, respondents suggested
invariably that the country should have a PPP dedicated legal framework with specific laws, regulation, and

DEVELOPMENT PROCESS: STAKEHOLDERS’ PERSPECTIVE
156
procedures for PPP implementation in the development process. Stakeholders also suggested the establishment
of PPP dedicated public agency with full mandate to manage and oversee issues related to PPP.
Generally, the collective suggestions imply that having a policy in which PPP is taken as a development
strategy with its enabling legal environment would encourage potential sectors to collaborate with the
government on mega development projects. With the establishment of a special government agency and the
concomitant laws, regulations, and procedures, PPP projects could be properly executed thereby enhancing the
development potential of the country.
Recommendation
The following steps or actions are recommended to be taken by the Ethiopian government and to harness
the potential advantages of PPP to accelerate the ongoing development process, these are:
(1) incorporate PPP in the existing development policy as one of the development strategies for
development. As a result of this, PPP should be considered as one of the pillars of the forthcoming GTP2;
(2) establish an ad hoc taskforce of experts for PPP with a special task to review the existing sectoral
policies, rules, and regulations and then prepare a draft national PPP strategy;
(3) approve and announce the PPP strategy of the country. Among other points, the strategy shall explain
the objectives of adopting PPP in the process of development, the expected roles of partners, the central role of
the government in safeguarding or protecting the interest of the citizenry in the process of PPP operation. The
basic intentions of the government in introducing PPP in the system etc.;
(4) prepare PPP specific legal framework as per the PPP strategy and conduct stakeholders’ consultation
on the draft legal framework. Among other points, the law should include what areas of investment are going to
be open for PPP, what sort of enabling environment and incentives are devised for PPP, what modalities of PPP
are preferred, applicable laws and regulation, its institutional arrangement, expected requirements for partners
to initiate PPP project proposals (unsolicited projects) or to participate in open bid of PPP projects (solicited)
etc.;
(5) enact the PPP specific legal framework;
(6) prepare PPP standard, procurement procedures, and model contracts;
(7) establish a federal PPP agency under the office of the Prime Minster either of the following options:
Option 1: The current institution—Privatization and Public Enterprises Supervising Agency may be
reorganized with dual mandate, keeping the current mandate and promotion, expansion, and supervising PPP
projects. The new nomenclature shall focus mainly on PPP. The reorganized institution shall be empowered and
made accountable to the Prime Minister’s office. Head of the agency shall have a rank of a minister with proper
academic and professional background related to the given mandate. There should be at least two deputy heads
with a rank of state ministers. The PPP wing would be lead by one of the deputy heads and the privatization
wing by another one.
Option 2: Ethiopian Investment Agency and Ethiopian Privatization and Public Enterprises Supervising
Agency may be amalgamated and reinvigorated. The new institution with a rank of ministry will have three
wings—investment promotion and expansion, privatization and public enterprise supervision, and PPP
promotion, implementation and expansion—to be led by deputies with state minister rank.
Option 3: A PPP Unit could be established under MOFED to be run by a head with state minster rank that
is accountable to the minister of MOFED. This unit should have a special working lateral connection with

DEVELOPMENT PROCESS: STAKEHOLDERS’ PERSPECTIVE
157
Ethiopian Investment Agency and Privatization and Public Enterprises Supervising Agency.
Though further study is recommended, this work provides some insight and important information for the
government and the private sector concerning practical conditions for the implementation of PPP, particularly
in Ethiopia. This may have provided some indications to be considered by other governments of developing
countries in their endeavor to involve their respective third sector partners in development and public service
delivery activities.
References African Development Bank. (2011). Federal democratic Ethiopia country strategy. Retrieved from
www.afdb.org/fileadmin/.../Ethiopia-2011-2015%20CSP%20ENG1.pdf Akintoye, A., Beck, M., & Hardcastle, C. (2003). Public private partnerships: Managing risks and opportunities. Oxford:
Blackwell Science. Alinaitwe, H., & Robert, A. (2013). Success factors for the implementation of public private partnerships in the construction
industry in Uganda. Journal of Construction in Developing Countries,18(2), 1-14. Binza, M. S. (2009). A public-private partnership model for the improvement of local economic development in South African
metropolitan government (Ph.D. Nelson Mandela Metropolitan University). Bringkerhoff, J. M. (2001). Partnerships are the wave of the future. American Society for Public Administration. PA Times, 24(2),
5-5. Cheung, E., Chan, A. P. C., & Kajewski, S. L. (2009). Reasons for implementing public private partnership projects: Perspectives
from Hong Kong, Australian, and British practitioners. Journal of Property Investment and Finance, 27(1), 81-95. Dessalegn, R., Akalewold, B., & Yoseph, E. (2010). CSOs/NGOs in Ethiopia partners in development and good governance (A
Report Prepared for the Ad Hoc CSO/NGO Task Force, Addis Ababa). Federal Democratic Republic of Ethiopia. (2009). Procurement and property administration proclamation. Addis Ababa:
Berhanena Selam Printing Press. Federal Democratic Republic of Ethiopia. (2009). Procurement and property administration proclamation. Retrieved from
http://www.pppds.gov.et/PPPDSA/images/proclamation649.pdf Federal Democratic Republic of Ethiopia. (2012). Investment proclamation. Retrieved from
http://www.investethiopia.gov.et/images/pdf/Investment_Proclamation_No769-2012_of_Ethiopia.pdf Getahun, S. (2010). Revisiting company law with the advent of Ethiopian commodity exchange (ECX): An overview. Mizan Law
Review, 4(1), 102-141. Hesse-Bibe, S. N. (2010). Mixed methods research: Merging theory with practice. New York: The Guilford Press. Hodge, G. (2005). Public private partnerships and legitimacy. UNSW Law Journal, 29(3), 318-327. Ismail, S. (2013). Factors attracting the use of public private partnership in Malaysia. Journal of Construction in Developing
Countries, 18(1), 95-108. Jamali, D. (2004). Success and failure mechanisms of public private partnerships (PPPs) in developing countries: Insights from
the Lebanese context. The International Journal of Public Sector Management, 17(5), 414-430. Li, B., Akintoye, A., Edwards, P. J., & Hardcastle, C. (2005). Perceptions of positive and negative factors influencing the
attractiveness of PPP/PFI procurement for construction projects in the UK: Findings from a questionnaire survey. Engineering, Construction and Architectural Management, 12(2), 125-148.
Ministry of Finance and Economic Development. (2006). Ethiopia: Building on progress a plan for accelerated and sustained development to end poverty (PASDEP). Retrieved from http://www.afdb.org/fileadmin/uploads/afdb/Documents/Policy-Documents/Plan_for_Accelerated_and_Sustained_%28PASDEP%29_final_July_2007_Volume_I_3.pdf
Ministry of Finance and Economic Development. (2010). Growth and transformation plan. Retrieved from http://www.ethiopians.com/Ethiopia_GTP_2015.pdf
Ministry of Information. (1994a). FDRE’s policies, strategies and tactics on rural development. Retrieved from www.ethiopia.gov.et/policies-and-strategies1
Ministry of Information. (1994b). FDRE’s industrial development strategy. Retrieved from www.ethiopia.gov.et/policies-and-strategies1

DEVELOPMENT PROCESS: STAKEHOLDERS’ PERSPECTIVE
158
Qiao, L., Wang, S. Q., Tiong, R. L. K., & Chan, T. S. (2001). Framework for critical success factors of BOT projects in China. Journal of Project Finance, 7(1), 53-61.
Teshome, T. (2014a). Factors for implementing public-private partnership (PPP) in the development process: Stakeholders’ perspective from Ethiopia. International Journal of Science and Research, 3(3), 792-799.
Teshome, T. (2014b). Public private partnership in development: Lessons in devising legal and institutional framework from South Korea. International Journal of Public Policy and Administration, 3(4), 876-896.
Tiong, R. L. K. (1996). CSFs in competitive tendering and negotiation model of BOT projects. Journal of Construction Engineering and Management, 122(3), 205-211.
Urio, P. (2010). Public-private partnerships success and failure factors for in-transition countries. Lanham: University Press of America.
Yescombe, E. R. (2007). Public private partnerships—Principles of policy and finance. London: Elsevier.

China-USA Business Review, March 2015, Vol. 14, No. 3, 159-170 doi: 10.17265/1537-1514/2015.03.004
Knowledge Management Strategies in Public
Sector—Case Study
Salwa Alhamoudi
Institute of Public Administration, Riyadh, Saudi Arabia
Knowledge management (KM) as an emerging discipline is becoming increasingly important to organizations
seeking to improve their efficiency and competitive abilities. This research aims to investigate knowledge management
strategies (KMS) from different fields of knowledge and to identify what are critical factors for effective KMS in
public sector and the challenges it faces for the future. This research is possibly the first attempt to investigate
empirically the compatibility in one of the most important Saudi public organizations of KMS. To investigate KMS,
the research focuses on KM as practiced in the Institute of Public Administration (IPA). The research focuses on
factors that may critically influence the development of KMS in public sector in Saudi Arabia. The main question
research is: What are the success factors for effective KMS at IPA? The research design was employed with
quantitative data collection methods. Questionnaires were distributed to 238 employees in all IPA organizations.
The resulting data is analyzed at descriptive and explanatory levels. The research identified 13 critical factors that
must be carefully considered to ensure KMS success. The study divided these critical factors into four groups from
different perspectives point views to KMS, namely: KM resources, KM technology, KM learning and innovation,
and KM beneficiaries. By integrating the insights from organizational knowledge, information systems,
customer-based knowledge, and organizational learning literatures, this study has demonstrated the need to
implement complementary strategies.
Keywords: knowledge management (KM), knowledge strategy, information technology, organizational learning,
knowledge management beneficiaries
Introduction
Knowledge has been recognized as the basis of competition and the key for business success (Nonaka &
Takeuchi, 1995). The globalization of business, new legislation, increasingly demanding consumers, and the
shift from production-based to a knowledge-based economy are creating a revolution that is forcing
organizations to utilize and leverage their knowledge to be able to compete (Civi, 2000; Chong & Choi, 2005).
Knowledge management (KM) has been the subject of many discussions over the past decade. KM initiatives,
projects, and systems are just beginning to appear in organisations. There is little research and field data to
guide the successful development and implementation of such systems or to guide the expectations of the
potential benefits of such systems (Civi, 2000; Cormican & O’Sullivan, 2003). While organizations recognize
Salwa Alhamoudi, Ph.D., assistant professor, Institute of Public Administration, Riyadh, Saudi Arabia. Correspondence concerning this article should be addressed to Salwa Alhamoudi, IPA, Riyadh, 11141, Saudi Arabia. E-mail:
DAVID PUBLISHING
D
KNOWLEDGE MANAGEMENT STRATEGIES IN PUBLIC SECTOR
160
that KM is essential for improving performance, many have difficulties in developing strategies for
implementation. At present, organizations are challenged to be more creative and innovative to constantly
improve performance, to form new partnerships and alliances, and to undertake new ventures outside traditional
organizational boundaries (Liu & Tsai, 2007). KM that is poorly planned and implemented could lead to poor
organization knowledge, which in turn can produce poor management decisions, strategies, and policies
(Stewart et al., 2000).
Some scholars argued that shifting the focus of organisational KM efforts from technology to people and
processes is important for effectively and beneficially managing knowledge (Davenport & Prusak, 2000; Wiig,
2002). Others asserted that knowledge is a strategic imperative and, therefore, firms must develop strategies for
managing knowledge (Zack, 1999). In this research, KM is considered to be one of the fundamental sources of
competitive advantage within the context of knowledge management strategy (KMS). Against this background
of an emerging literature in strategic management and continual striving to find a workable means of strategic
implementation for KM, managers in a wide variety of industries are rethinking their performance
measurement systems (Evans, 2005).
Simultaneously, KMS enables the organization to recognize its most immediate and future knowledge
priorities, goals, and objectives, and its critical knowledge domains, so as to work toward building strategic
knowledge systems and embedding work systems within them (Alavi, Kayworth, & Leidner, 2006). In addition,
KMS will help organizations become more competitive by using new knowledge to reduce costs, increase
speed, and meet customer needs (Civi, 2000). Consequently, KMS allows organizations to increase profits,
identify new markets, improve efficiency, improve market share, and be more effective. Nevertheless, little
attention is paid to different supporting elements, such as organizational culture, strategy, management
commitment, information and knowledge systems, continuous improvement, and organizational learning which
may be considered to be critical for the successful implementation of KMS. For these reasons, this research
attempts to fill this gap by investigating the feasibility of adopting a KMS and identifying the critical factors of
success in Institute of Public Administration (IPA) as a case study.
One of the potentially most important contributions of this study is the exposure of data relating
different approaches from different fields in KMS to an area that has not previously been explored and
documented in detail by researchers. Not only did this study provide an empirical assessment of the
essential elements in KM projects, but also assessed the critical success factors (CSFs) of importance for
implementation of KM distilled from a comprehensive review of the concepts and practice of KM. This
study is possibly the first attempt to investigate empirically the compatibility in one of the most important
Saudi public organizations of key ideas of KM and strategic management. This study aims to investigate
KMS and to identify what are critical factors for effective KMS in public sector and the challenges it faces
for the future. To achieve the aims set out above, the study’s main question is: What are the success factors
for effective KMS at IPA? To meet the research’s aims, the study contains five sections. The first section
highlights the background literature research. The second section considers relevant literature from several
fields of knowledge strategies perspectives. The third section presents the research methodology employed
in the study, and the fourth section provides a comprehensive discussion on the analysis of the results and
findings of the quantitative data. The last section deals with the conclusions based on the findings of the
research.

KNOWLEDGE MANAGEMENT STRATEGIES IN PUBLIC SECTOR
161
Background Literature
In a context where competitive advantages are related to knowledge, it can be affirmed that it is important
to make an effort to delineate a comprehensive approach, which conceptualises a renewal and dynamic
articulation between practices of managing people strategies and KM initiatives (Meireles, Cardoso, &
Marques, 2008). There is an important distinction between KM and KMS: KM is a set of practices and
processes, whereas KMS is the orientation/philosophy or the common thread that guides various activities of
KM. The content of KM can change depending on a particular firm’s needs and business context but the
common underlying theme, which is the KMS, remains the same. Knowledge strategy is, however, different
from KMS, as explained by Zack (2002, p. 271): “Knowledge strategy is oriented towards understanding what
knowledge is strategic and why knowledge management strategy guides and defines the processes and
infrastructure (organisation and technological) for managing knowledge”. The notion of knowledge strategy
relates to how a firm approaches its knowledge needs, whereas KMS relates to how it approaches KM as an
activity, for example, Earl (2001) recommended that firms analyse and manage knowledge gaps with the help
of three broad KMS: technocratic, economic, and behavioural. These three strategies are further subdivided into
seven different strategies: technocratic (systems, cartographic, and engineering), economic (commercial), and
behavioural (organisational, spatial, and strategic). These strategies differ in their focus, aim, and critical
success factors (Earl, 2001). In this study, the holistic approach is applied to the definition of KM and points to
the same fundamental idea that KM refers to the critical issues of organisational adaptation, survival, and
competence in the face of discontinuous environmental change. Essentially, it embodies organisational
processes that seek a synergistic combination of data and the information-processing capacity of information
technologies, and the creative and innovative capacity of human beings (Nonaka & Von Krogh, 2009). Nonaka
and Von Krogh (2009) pointed out that KM is the strategic application of collective company knowledge and
know-how to build profits and market share. Knowledge assets, both ideas or concepts and know-how, are
created through the computerised collection, storage, sharing, and linking of the corporate knowledge pool.
Advanced technologies make it possible to tap into the corporate mind. Hicks, Dattero, and Galup (2006) stated
that KM is a systemised and integrated managerial strategy, which combines IT with the organisational process.
KM is a managerial activity, which develops transfers, transmits stores, and applies knowledge, as well as
providing the members of the organisation with real information to be able to react and make the right decisions,
in order to attain the organisation’s goals.
This view of KMS enables the organisation to identify its critical knowledge domains, its most immediate
and future knowledge priorities, goals, and objectives, and to work toward building critical knowledge systems
and embedding work systems within them. It advocates a multidisciplinary approach to understanding and
researching the field of KM. In the next section, the KMS will be presented in details.
Knowledge Management Strategies
The research in organizational learning pointed to the importance of learning processes that create
knowledge. Armed with high power computing and communication tools, the information technology
discipline viewed KM as a technical activity providing IT which stores information. Moreover, knowledge is
dynamic in nature and can be accessed through collaboration and communication with experts who have that
knowledge (Cormican & O’Sullivan, 2003). KMS widely accepts that within the literature on KM, there are two

KNOWLEDGE MANAGEMENT STRATEGIES IN PUBLIC SECTOR
162
fundamental approaches: personalisation and codification (Hicks et al., 2006). These two approaches were
originally identified and described as being fundamental by Hansen, Nohria, and Tierney (1999). Personalisation
takes the viewpoint that the organisation’s knowledge resides mainly in the heads of its people, and the main
purpose of KM systems is to help people locate it and communicate it to each other. Codification takes the
viewpoint that the most relevant knowledge for the organisation can be codified and stored in computer format,
so that it may be widely shared. The following is KMS in details.
KM Resource Strategy
The KMS and approach should be documented and presented to senior management to ensure buy-in and
alignment to organisational goals (Lam & Chua, 2005). Ferdinand (1999) identified the resources of organisation
as stocks of available assets that are owned or controlled by a firm, i.e., know-how, financial and physical
resources, and human capital. Organisations have the following motives for managing knowledge: capturing
lessons learned, avoiding repeating mistakes, and capturing expertise before it leaves (Davenport, De Long, &
Beers, 1998). In this research, the knowledge resource strategy is considered to emphasise the personal
knowledge possessed by the firm and the organisational knowledge possessed by the firm (Gehani, 2002). These
two kinds of knowledge were supported by KM human resource and KM capturing resource schools. This
strategy will include top management support, the organisation structure, resources captured, and human
resources knowledge.
KM Technology Strategy (Internal Process)
Although it is a common mistake to consider that many KM solutions are only limited to certain information
systems, knowledge technology is considered to be one of the central drivers of KM (Davenport & Prusak, 2000).
Vera and Crossan (2003) suggested that KM is mainly concerned with providing managers with information
technology solutions and prescriptions about how to proactively manage knowledge in organisations. The
literature on KM mainly emphasises IT and underscores the need to proactively manage knowledge but offers
very little guidance about how to do it, except for prescribing tools, such as groupware, document management
systems, email, and internet (Mehrizi, Tehrani, & Kazemi, 2008). Not surprisingly, most organisations view KM
as equivalent to providing the technology infrastructure (Yahya, 2009). Goldman (2010) stated that it is very
important to underline the idea that KM does not manage, create, or integrate knowledge or an organisation’s
results directly. It only has impact on knowledge processes. This kind of process accomplishes its goals through
actors involved in the operating process (Goldman, 2010).
In this research, the KM technology strategy will include the processes for KM transfer, information and
communication technology for KM, and organisational culture knowledge transfer.
KM Learning and Innovation Strategy
It is difficult to manage knowledge with the help of information technology, because knowledge is not only
explicit, but is also tacit (Polanyi, 1996). Further, knowledge is not only a resource, but a process of knowing
(Goldman, 2010). The literature on organisational learning has emphasised that learning is the process that
creates knowledge (Vera & Crossan, 2003). The belief that learning is a means to create and manage knowledge
is central to a KM learning strategy, which is defined in this research as an emphasis on the learning and
innovation which evolve from the experiences and best practices of others and sharing and transferring
knowledge quickly and efficiently throughout the organisation. Regarding innovation, it is important to note that
nowadays it is not enough for organisations to improve continually. Something must make them different. This is

KNOWLEDGE MANAGEMENT STRATEGIES IN PUBLIC SECTOR
163
what makes radical innovation more than an option; it is a necessity (Goldman, 2010). Thus in this study, the
researcher uses the term “learning and innovation knowledge” to indicate the concept of organisational
knowledge, learning climate, and self-development opportunity
KM Beneficiaries Strategy (External Knowledge):
Every organisation exists in an environment that conditions the way the organisation conducts its business
(Haggie & Kingston, 2003). Through access to organisational knowledge, employees make sense of their
environment and give it meaning. They find new and better ways to perform, work together, break down barriers,
share a vision, fill gaps in knowledge, increase productivity, satisfy customers, and ultimately compete (Civi,
2000). Having identified the organisation’s competitive knowledge position, Zack (2002) pointed out the fact
that organisations which are more innovative have more knowledge, because they explore external knowledge
resources. Binney (2001) stated that KM is derived from external data sources, typically focussing on
customer-related information. Thus in this study, the researcher uses the term “beneficiary knowledge” to
indicate the concept of external knowledge which emphasis the customer focused knowledge which includes
three factors: creating advantages for the customers and suppliers, performance evaluation and continuous
improvement, and the external environment and benchmarking.
Research Methodology
This study used the multiple cases approach, because one case study cannot give sufficient evidence to be
able make robust generalisations. Multiple cases provide a general understanding and detailed description of each
case and then present the themes within each case followed by thematic analysis across cases (Yin, 2009). This
research was on four IPA institutions and each case was treated as a separate case but with scope for
comprehensive analysis. A case study strategy based on quantitative technique was used in this research. The
questionnaire allowed the “what” questions in this research to be answered. Most questionnaire questions were
closed-ended and used a five-point Likert scale, so they were easy to complete and analyse. The sample size
decision for the population size (1,000) was made up of 278 candidates from IPA’s organisations.
Data Analysis and Dissection of Results
In this section, the research was carried on to investigate the KMS in IPA in order to answer the main
question of the research: What are the success factors for effective KMS at IPA? KMS was studied from four
perspectives within IPA and the following sub-questions formulated:
(1) What are the success factors for knowledge resources strategy?
(2) What are the success factors for KM information technology strategy?
(3) What are the success factors for KM learning and innovation strategy?
(4) What are the success factors for KM beneficiary strategy?
KM Resources Strategy
In this section, the study attempts to answer the question of the research: What are the success factors for
knowledge resources strategy? The results of t-tests in Table 1 can be sorted in descending order, according to the
main factors of the KM resource dimension inside IPA.
The results in Table 1 above are found to be very significantly different from the mid-point 3.0 (P < 0.05).
The overall mean of KM resource strategy was 3.6556. This suggests that the current systems of top

KNOWLEDGE MANAGEMENT STRATEGIES IN PUBLIC SECTOR
164
management, organisational structure, and storing and retrieving knowledge are available success factors for
the application of KMS in IPA. In contrast, human resource KM is a less successful factor in the application of
knowledge management strategies in IPA. The study findings from the literature review questionnaires confirm
that the factor of top management support is an important success factor in KM implementation strategies. This
result is consistent with previous study findings found in the literature review (Davenport et al., 1998; Egbu, 2004;
Wong & Aspinwall, 2005; Chong, 2006). The results in this study suggest that the factor of top management
support and the success of KM project implementation are positively linked.
Table 1
One-sample T-test of Statistical Significance of KM Resources in IPA
One-sample t-test Mean Knowledge Management Resources
Sig. (1-tailed) t-statistic Standard deviation
0.000* 13.277 0.6874 3.9916 1-1 Top management support
0.009* 2.395 0.9284 3.5441 1-2 Organisational structure
0.000* 13.062 0.7484 4.0336 1-3 Storing and retrieving knowledge
0.000* 12.82 0.9084 3.3550 1-4 Human resources that supported knowledge resources
0.000* 6.029 0.6542 3.6556 Total
Note. * Significant at level 0.05.
In relation to organisational structure, the study findings in this research confirm that having an enabling
structure is an important factor in KMS. This result is consistent with previous study findings (Chong, 2006;
Oliver & Kandadi, 2006). The results from the survey show that the employees agreed that this factor was a
strong available factor in implementing KM projects. Based on these findings, in IPA the organisational structure
is a hierarchy; in hierarchical organisational structures, the employees chiefly communicate with their immediate
superiors and with their immediate subordinates. Structuring organisations in this way limits information flow
and hinders sharing and transfer of knowledge through all the different levels of the organisation.
Relating to storing and retrieving knowledge, the majority of the study findings in this research confirm that
storing and retrieving knowledge is a strong available success factor. This result is consistent with study findings
in a few previous studies (Davenport & Prusak, 2000; Civi, 2000; Nonaka, Toyama, & Konno, 2000; Madhoushi
& Sadati, 2010). This factor was ranked number one in terms of level of availability for knowledge resource
organisational strategy. This result reveals that documents stored in repositories are very important for IPA and
that it is thought that knowledge should be stored somewhere where it can be easily retrieved. Capturing
knowledge and lessons learned helps the organisation avoid repeating mistakes and helps it capture expertise
before it leaves (Davenport et al., 1998).
Finally, the study findings in this research confirm that the KM human resource factor is a success factor in
KM project implementation. This result is in agreement with findings in previous studies (Chong, 2006; Yahya,
2009). In contrast, the survey suggested that human resources that support knowledge organisational resources in
IPA came in as a less available factor in the application of KM inside IPA. Based on these findings, it can be
argued that the results indicate that risk-taking is not encouraged, so that new possibilities seem unlikely to
emerge. Empowering employees is required to encourage the creation and application of knowledge within an
organisation. Empowerment is a driver of knowledge creation. Empowering people gives them a sense of power
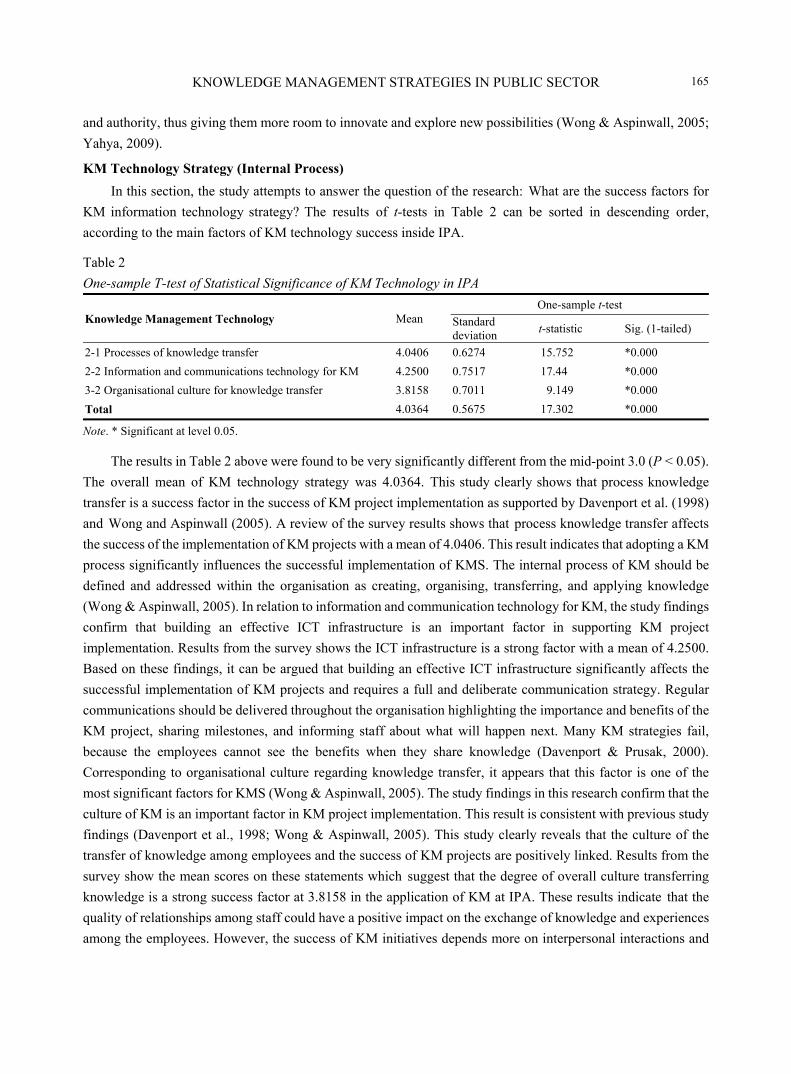
KNOWLEDGE MANAGEMENT STRATEGIES IN PUBLIC SECTOR
165
and authority, thus giving them more room to innovate and explore new possibilities (Wong & Aspinwall, 2005;
Yahya, 2009).
KM Technology Strategy (Internal Process)
In this section, the study attempts to answer the question of the research: What are the success factors for
KM information technology strategy? The results of t-tests in Table 2 can be sorted in descending order,
according to the main factors of KM technology success inside IPA.
Table 2
One-sample T-test of Statistical Significance of KM Technology in IPA
One-sample t-test Mean Knowledge Management Technology
Sig. (1-tailed) t-statistic Standard deviation
0.000* 15.752 0.6274 4.0406 2-1 Processes of knowledge transfer
0.000* 17.44 0.7517 4.2500 2-2 Information and communications technology for KM
0.000* 9.149 0.7011 3.8158 3-2 Organisational culture for knowledge transfer
0.000* 17.302 0.5675 4.0364 Total
Note. * Significant at level 0.05.
The results in Table 2 above were found to be very significantly different from the mid-point 3.0 (P < 0.05).
The overall mean of KM technology strategy was 4.0364. This study clearly shows that process knowledge
transfer is a success factor in the success of KM project implementation as supported by Davenport et al. (1998)
and Wong and Aspinwall (2005). A review of the survey results shows that process knowledge transfer affects
the success of the implementation of KM projects with a mean of 4.0406. This result indicates that adopting a KM
process significantly influences the successful implementation of KMS. The internal process of KM should be
defined and addressed within the organisation as creating, organising, transferring, and applying knowledge
(Wong & Aspinwall, 2005). In relation to information and communication technology for KM, the study findings
confirm that building an effective ICT infrastructure is an important factor in supporting KM project
implementation. Results from the survey shows the ICT infrastructure is a strong factor with a mean of 4.2500.
Based on these findings, it can be argued that building an effective ICT infrastructure significantly affects the
successful implementation of KM projects and requires a full and deliberate communication strategy. Regular
communications should be delivered throughout the organisation highlighting the importance and benefits of the
KM project, sharing milestones, and informing staff about what will happen next. Many KM strategies fail,
because the employees cannot see the benefits when they share knowledge (Davenport & Prusak, 2000).
Corresponding to organisational culture regarding knowledge transfer, it appears that this factor is one of the
most significant factors for KMS (Wong & Aspinwall, 2005). The study findings in this research confirm that the
culture of KM is an important factor in KM project implementation. This result is consistent with previous study
findings (Davenport et al., 1998; Wong & Aspinwall, 2005). This study clearly reveals that the culture of the
transfer of knowledge among employees and the success of KM projects are positively linked. Results from the
survey show the mean scores on these statements which suggest that the degree of overall culture transferring
knowledge is a strong success factor at 3.8158 in the application of KM at IPA. These results indicate that the
quality of relationships among staff could have a positive impact on the exchange of knowledge and experiences
among the employees. However, the success of KM initiatives depends more on interpersonal interactions and

KNOWLEDGE MANAGEMENT STRATEGIES IN PUBLIC SECTOR
166
social relationships than on the technology itself (Chong & Choi, 2005). In effect, a culture of trust and
confidence among employees is required to encourage the application and development of knowledge within an
organisation. Without a high degree of mutual trust, people will be sceptical about the intentions and behaviours
of others and thus they will likely withhold their knowledge (Chong & Choi, 2005).
KM Learning and Innovation Strategy
In this section, the study attempts to answer the question of the research: What are the success factors for
KM learning and innovation strategy? The results of t-tests in Table 3 can be sorted in descending order,
according to the main factors of KM learning and innovation in IPA.
Table 3
One-sample T-test of Statistical Significance of KM Learning and Innovation in IPA
One-sample t-test Mean Knowledge Management Learning and Innovation
Sig. (1-tailed) t-statistic Standard deviation
0.001* 3.210 0.7533 3.5567 3-1 Organisational learning
0.000* 15.500 0.8825 3.4867 3-2 Learning climate for KM
0.000* 14.450 0.8903 3.4342 3-3 Self-development opportunities
0.020* 2.063 0.7392 3.4988 Total
Note. * Significant at level 0.05.
The results in Table 3 above are found to be very significantly different from the mid-point 3.0 (P < 0.05).
The overall mean of KM learning and innovation in IPA was 3.4988. The study findings in this research confirm
that employee learning and innovation is an important factor in KM project implementation. This result is
consistent with findings in previous studies (Wong & Aspinwall, 2005; Chong, 2006). The results from the
survey show the overall mean of organisational learning 3.556 as an available success factor in the application of
KM inside IPA. This result indicates that individuals seem to work together and exchange ideas in a way that will
enable them to quickly and easily obtain the information that they need to understand fully. Basically, the skills
and competences of knowledge workers need to be continuously developed in order for them to produce valuable
contributions to an organisation (Wong & Aspinwall, 2005). If not, as with other tangible assets, their value will
depreciate. Hence, organisations have to provide appropriate professional development and learning activities for
their employees through training and education. In relation to climate learning KM, as supported by the work of
Chong (2006), this study clearly reveals that organisational climate is a success factor in the success of KM
projects. The learning climate in IPA does not seem to be a healthy learning climate with a culture of forgiveness.
Anxiety may reduce the level of learning and innovation in IPA because of concern about making mistakes.
Hence, making mistakes should be viewed as a process of investing in individuals, because it can be a key source
for the creation of a learning organisation (Yang & Wan, 2004). Relating to self-development, it appears that
individuals in IPA find it difficult to take the main responsibility and that the managers do not provide appropriate
guidance or opportunities for self-development. An overall mean score of 3.4342 shows this is a less available
success factor in the application of KM and offers strong evidence that learning opportunities at IPA do not
enable staff to share knowledge across the organisation or to share ideas and experiences.
Based on the findings, it can be argued that KM learning and innovation is an important condition for
knowledge transfer to occur among individuals and across a group. This is because knowledge transfer requires

KNOWLEDGE MANAGEMENT STRATEGIES IN PUBLIC SECTOR
167
individuals to come together to interact, exchange ideas, and share knowledge with one to another. Consequently,
this will lead to the success of KM projects. The results reflect a clear picture of the learning opportunities in IPA
which does not suggest a healthy learning climate, not least because the culture of forgiveness and of learning
from mistakes is not widely prevalent. Overall, it should be noted that facilities and resources for
self-development in IPA are not accessible to everyone.
KM Beneficiaries Strategy (External Knowledge)
In this section, the study attempt to answer the question of the research: What are the success factors for KM
beneficiary’s strategy? The results of t-test in Tables 4 can be sorted in descending order, according to the main
factors of KM beneficiaries in IPA.
Table 4
One-sample T-test of Statistical Significance of KM Beneficiaries in IPA
One-sample t-test Mean Knowledge Management Beneficiaries
Sig. (1-tailed) t-statistic Standard deviation
0.000* 5.452 0.6842 3.6418 4-1 Creating advantage for the customers and suppliers
0.000* 9.417 0.7145 3.8361 4-2 Performance evaluation and continues development
0.000* 7.213 0.8430 3.7941 4-3 External environment and benchmarking
0.000* 8.410 0.6446 3.7514 Total
Note. * Significant at level 0.05.
The results in Table 4 above are found to be very significantly different from the mid-point 3.0 (P < 0.05).
The overall mean of the KM beneficiaries dimension was 3.7514. This study clearly reveals that creating
advantage for customers and suppliers is a success factor for the success of KM project implementation as is
supported by the work of Pelau, Vladoi, Fuefezan, Binca, and Ghinea (2010). The results from this study suggest
that factors relating to KM customers and suppliers are positively linked with success of KM projects. The overall
mean of creating advantages for customers and suppliers was 3.6418. This result indicates that focusing on
customers and suppliers has become an important consideration and an available success factor in the application
of KM inside IPA. Customer-focused knowledge provides knowledge about customer demands in order to justify
the internal processes to meet the customer needs; however, it should be taken into consideration that customer
needs will undoubtedly change over time. Based on these findings, it can be argued that a complete understanding
of existing customers enables IPA to meet current market challenges which represents a new potential market and
source of competitive advantage, as well as being a means of retaining existing customers, and improving
customer satisfaction.
In relation to performance evaluation and continuous improvement, the study confirms that performance
evaluation and continuous improvement is an important factor in KM project implementation. This result is in
agreement with findings from previous studies (Feher, 2004). Results from the survey suggested a mean of 3.836.
Based on these findings, it can be argued that evaluating performance and outcomes is an important factor in KM
project implementation. Further, evaluating them enables organisations to track the progress of KM and to
determine its benefits and effectiveness (Yahya, 2009)
In relation to external environment and benchmarking, the results of the study revealed that the factor of
benchmarking best practices is one of the important success factors in KM project implementation. This result is
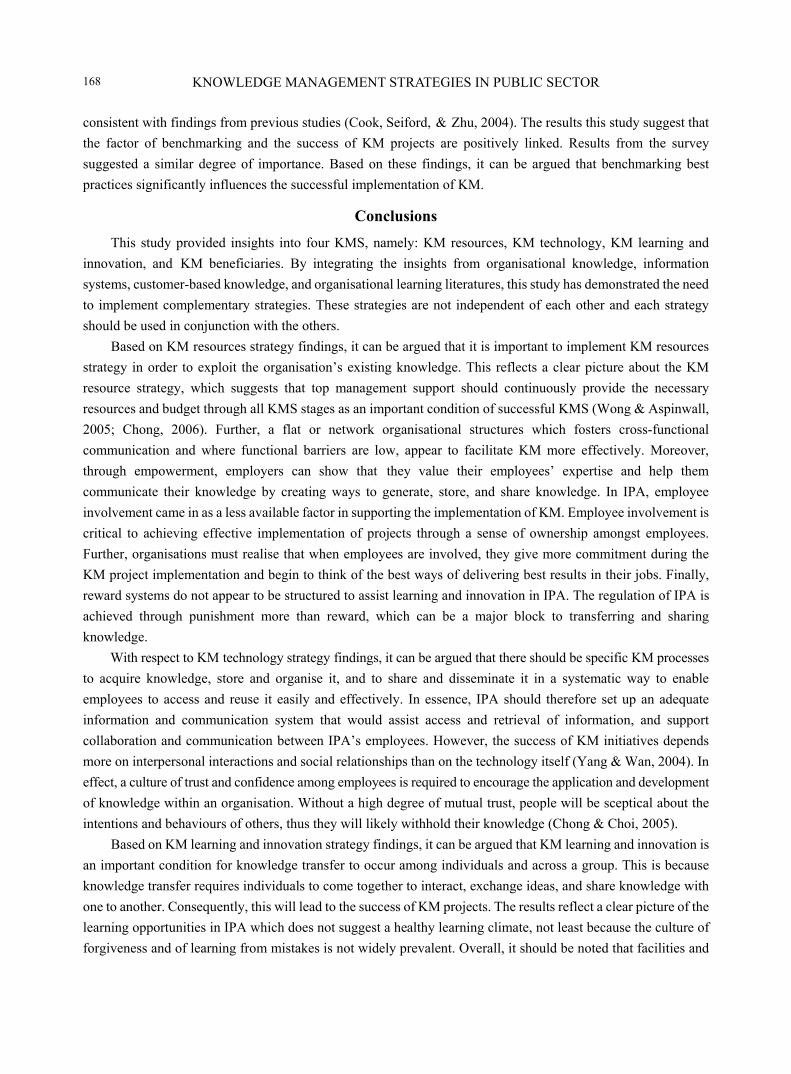
KNOWLEDGE MANAGEMENT STRATEGIES IN PUBLIC SECTOR
168
consistent with findings from previous studies (Cook, Seiford, & Zhu, 2004). The results this study suggest that
the factor of benchmarking and the success of KM projects are positively linked. Results from the survey
suggested a similar degree of importance. Based on these findings, it can be argued that benchmarking best
practices significantly influences the successful implementation of KM.
Conclusions
This study provided insights into four KMS, namely: KM resources, KM technology, KM learning and
innovation, and KM beneficiaries. By integrating the insights from organisational knowledge, information
systems, customer-based knowledge, and organisational learning literatures, this study has demonstrated the need
to implement complementary strategies. These strategies are not independent of each other and each strategy
should be used in conjunction with the others.
Based on KM resources strategy findings, it can be argued that it is important to implement KM resources
strategy in order to exploit the organisation’s existing knowledge. This reflects a clear picture about the KM
resource strategy, which suggests that top management support should continuously provide the necessary
resources and budget through all KMS stages as an important condition of successful KMS (Wong & Aspinwall,
2005; Chong, 2006). Further, a flat or network organisational structures which fosters cross-functional
communication and where functional barriers are low, appear to facilitate KM more effectively. Moreover,
through empowerment, employers can show that they value their employees’ expertise and help them
communicate their knowledge by creating ways to generate, store, and share knowledge. In IPA, employee
involvement came in as a less available factor in supporting the implementation of KM. Employee involvement is
critical to achieving effective implementation of projects through a sense of ownership amongst employees.
Further, organisations must realise that when employees are involved, they give more commitment during the
KM project implementation and begin to think of the best ways of delivering best results in their jobs. Finally,
reward systems do not appear to be structured to assist learning and innovation in IPA. The regulation of IPA is
achieved through punishment more than reward, which can be a major block to transferring and sharing
knowledge.
With respect to KM technology strategy findings, it can be argued that there should be specific KM processes
to acquire knowledge, store and organise it, and to share and disseminate it in a systematic way to enable
employees to access and reuse it easily and effectively. In essence, IPA should therefore set up an adequate
information and communication system that would assist access and retrieval of information, and support
collaboration and communication between IPA’s employees. However, the success of KM initiatives depends
more on interpersonal interactions and social relationships than on the technology itself (Yang & Wan, 2004). In
effect, a culture of trust and confidence among employees is required to encourage the application and development
of knowledge within an organisation. Without a high degree of mutual trust, people will be sceptical about the
intentions and behaviours of others, thus they will likely withhold their knowledge (Chong & Choi, 2005).
Based on KM learning and innovation strategy findings, it can be argued that KM learning and innovation is
an important condition for knowledge transfer to occur among individuals and across a group. This is because
knowledge transfer requires individuals to come together to interact, exchange ideas, and share knowledge with
one to another. Consequently, this will lead to the success of KM projects. The results reflect a clear picture of the
learning opportunities in IPA which does not suggest a healthy learning climate, not least because the culture of
forgiveness and of learning from mistakes is not widely prevalent. Overall, it should be noted that facilities and

KNOWLEDGE MANAGEMENT STRATEGIES IN PUBLIC SECTOR
169
resources for self-development in IPA are not accessible to everyone.
In relation to external environment and benchmarking, the results of the study revealed that the factor of
benchmarking best practices is one of the important success factors in KM project implementation. This result is
consistent with findings from previous studies (Cook et al., 2004). Results from the survey suggested a similar
degree of importance. Based on these findings, it can be argued that benchmarking best practices significantly
influences the successful implementation of KM.
This study has presented a holistic review of KM strategies implementation through a comprehensive
scrutiny of the relevant literature, an exploratory survey of IPA’s employees for the case studies. It has provided
a detailed discussion of critical factors of KM strategies implementation. The study identified 13 critical factors
that must be considered carefully to secure strategic KM success.
References Alavi, M., Kayworth, T., & Leidner, D. (2006). An empirical examination of the influence of organisational culture on knowledge
management practices. Journal of Management Information Systems, 22(3), 191-191. Binney, D. (2001). The knowledge management spectrum-understanding the KM landscape. Journal of Knowledge Management,
5(1), 33-42. Chong, S. (2006). KM critical success factors: A comparison of perceived importance versus implementation in Malaysian ICT
companies. The Learning Organisation, 13(3), 230-256. Chong, S. C., & Choi, Y. S. (2005). Critical factors in the successful implementation of knowledge management. Retrieved from
http://www.tlainc.com/articl90.htm Civi, E. (2000). Knowledge management as a competitive asset: A review. Marketing Intelligence & Planning, 18(4), 166-174. Cook, W., Seiford, L., & Zhu, J. (2004). Models for performance benchmarking: Measuring the effect of e-business activities on
banking performance. Omega, 32, 313-322. Cormican, K., & O’Sullivan, D. (2003). A scorecard for supporting enterprise knowledge management. Journal of Information
and Knowledge Management, 2(3), 191-202. Davenport, T. H., & Prusak, L. (2000). Working knowledge: How organizations manage what they know. Boston: Harvard
Business School Press. Davenport, T., De Long, D., & Beers, M. (1998). Successful knowledge management projects. Sloan Management Review, 39(2),
43-57. Earl, M. (2001). Knowledge management strategies: Toward a taxonomy. Journal of Management Information Systems, 18(1),
215-215. Egbu, C. (2004). Managing knowledge and intellectual capital for improved organisation innovations in the construction industry:
An examination of critical success factors. Engineering, Construction and Architectural Management, 11(5), 301-315. Evans, N. (2005). Assessing the balanced scorecard as a management tool for hotels. International Journal of contemporary
Hospitality management, 17(5), 376-390. Feher, P. (2004). Combining knowledge and change management at consultancies. Electronic Journal of Knowledge Management,
2(1), 19-32. Ferdinand, A. T. (1999). Strategic pathways toward sustainable competitive advantage (DBA thesis, Southern Cross
University). Gehani, R. R. (2002). Chester Barnard’s “executive” and the knowledge-based firm. Management Decision, 40(10), 980-991. Goldman, F. (2010). A structured model of relationship dynamics between organisational knowledge management and
organisational learning. Proceedings from the 2nd European Conference on Intellectual Capital, Lisbon, Portugal. Haggie, K., & Kingston, J. (2003). Choosing your knowledge management strategy. Retrieved from
http://www.tlainc.com/jkmpv4.tm Hansen, M., Nohria, N., & Tierney, T. (1999). What’s your strategy for managing knowledge? Harvard Business Review, 77(2),
106-116. Hicks, R. Dattero, R., & Galup, S. (2006). The five-tier knowledge management hierarchy. Journal of Knowledge Management,
10(1), 19-31.

KNOWLEDGE MANAGEMENT STRATEGIES IN PUBLIC SECTOR
170
Lam, W., & Chua, A. (2005). The mismanagement of knowledge management. Alsip Proceedings, 57(5), 424-433. Liu, P. L., & Tsai, C. H. (2007). The study of R&D management on new product development performance in Taiwan’s HI-tech
industries. Retrieved from http://www.scientificjournals.org/journals2007/articles/1053.htm Madhoushi, M., & Sadati, A. (2010). Knowledge management, antecedent of organisational innovation and competitiveness.
Proceeding from the 2nd European Conference on Intellectual Capital, ECIC, Italy. Mehrizi, M., Tehrani, H., & Kazemi, M. (2008). Towards and integrated framework of knowledge management between project
and organisation level. Proceedings from the 9th European Conference of Knowledge Management, Southampton Solent University, UK.
Meireles, A., Cardoso, L., & Marques, J. (2008). Organisation commitment, knowledge management and social economy: An empirical study. Proceedings from the 9th European Conference of Knowledge Management, Southampton Solent University, UK.
Nonaka, I., & Takeuchi, H. (1995). The knowledge-creating company. New York: Oxford University Press. Nonaka, I., & Von Krogh, G. (2009). Tacit knowledge and knowledge conversion: Controversy and advancement in
organisational knowledge creation theory organisation science. Organization Science, 20(3), 635-652. Nonaka, I., Toyama, R., & Konno, N. (2000). SECI, Ba, and leadership: A unified model of dynamic knowledge creation. Long
Range Planning, 33(1), 5-34. Oliver, S., & Kandadi, K. (2006). How to develop knowledge culture in organisations? A multiple case study of large distributed
organisations. Journal of knowledge Management, 10(4), 6-24. Pelau, C., Vladoi, A., Fuefezan, M., Binca, V., & Ghinea, V. (2010). The influence of knowledge dynamics on consumer
behaviour. Proceeding from the 2nd European Conference on Intellectual Capital, ECIC, Italy. Polanyi, M. (1996). The tacit dimension. New York: Doubleday. Stewart, K., Baskerville, R., Storey, V., Senn, J., Raven, A., & Long, C. (2000). Confronting the assumptions underlying the
management of knowledge: An agenda for understanding and investigating knowledge management. ACM SIGMIS Database, 31(4), 41-53.
Vera, D., & Crossan, M. (2003). Organisational learning and knowledge management: Toward an integrative framework. In M. Easterby-Smith, & M. Lyles (Eds.), Handbook of organisational learning and knowledge management. Oxford: Blackwell Publishing.
Wiig, K. (2002). Knowledge management in public administration. Journal of Knowledge Management, 6(3), 224-239. Wong, K., & Aspinwall, E. (2005). An empirical study of the important factors for knowledge-management adoption in the SME
sector. Journal of Knowledge Management, 9(3), 64-82. Yahya, K. (2009). Power-influence in decision making, competence, and organizational culture in public organizations. Journal of
Public Administration Research and Theory, 19(2), 385- 408. Yang, J. T., & Wan, C. S. (2004). Advancing organisational effectiveness and knowledge management implementation. Tourism
Management, 25(5), 593-601. Yin, R. K. (2009). Case study research design and methods (4th ed.). London: SAGE Publications Ltd.. Zack, M. (1999). Developing a knowledge strategy. California Management Review, 41(3), 125-145. Zack, M. (2002). Epilogue: Developing a knowledge strategy. In N. Bontis, & C. W. Choo (Eds.), The strategic management of
intellectual capital and organisational knowledge (pp. 268-276). Oxford: Oxford University Press.