Trial by fire - Utrecht University Repository
142
Trial by fire Postfire development of a tropical dipterocarp forest Mark G.L. van Nieuwstadt
-
Upload
khangminh22 -
Category
Documents
-
view
3 -
download
0
Transcript of Trial by fire - Utrecht University Repository
Trial by fire
Postfire development of a tropical dipterocarp forest
Mark G.L. van Nieuwstadt
2
Cover legend: Sungai Wain forest in different stages before and after burning. From leftto right: Unburned forest (9-98), surface fire inside the forest (3-98), burned forest 6months after fire with a high density of standing dead trees (9-98), burned forest withyoung Macaranga seedlings (12-98), burned forest two years after fire with a dense sec-ondary regrowth dominated by ferns (6-00).
M.G.L. van NieuwstadtTrail by fire - Postfire development of a tropical dipterocarp forestISBN: 90 – 393 – 3002–6Keywords: Drought, East Kalimantan, forest fire, Indonesia, large-scale disturbances,lowland dipterocarp forest, plant persistence, succession.
© 2002 Mark G.L. van Nieuwstadt
All rights reserved. No part of this publication, apart from bibliographic data and briefquotations in critical reviews, may be reproduced, re-recorded or published in any formincluding photocopy, microfilm, electronic or electromagnetic record, without writtenpermission.
Printed by: PrintPartners Ipskam B.V., EnschedeCover: Emy FranckLayout and photos: Mark van Nieuwstadt

3
Trial by fire
Postfire development of a tropical dipterocarp forest
De vuurproef
Ontwikkeling van een tropisch dipterocarp bos na brand
(Met een samenvatting in het Nederlands)
Percobaan oleh kebakaran
Pembangunan paska-kebakaran hutan dipterocarp tropis
(Dengan ringkasan dalam Bahasa Indonesia)
Proefschrift
Ter verkrijging van de graad van doctor aan de Universiteit Utrecht
op gezag van de rector magnificus,Prof. Dr. W.H. Gispen,
ingevolge het besluit van het College voor promotiesin het openbaar te verdedigen
op maandag 13 Mei 2002des middags om 16.15 uur
door
Mark Geerten Lambertus van Nieuwstadt
Geboren op 29 juni 1970 te Breda

4
Promotores: Prof. Dr. M.J.A. WergerProf. J.A. SayerVerbonden aan de Faculteit Biologievan de Universiteit Utrecht
The studies reported in this thesis were carried out in a collaboration of the Center forInternational Forestry Research (CIFOR) in Bogor, Indonesia, the International Minis-try of Forestry (MOF)-Tropenbos-Kalimantan research institute in Samboja, Indonesia,and the Department of Plant Ecology, Utrecht University, the Netherlands. Financialsupport was provided through grant 84-408 by the Netherlands Foundation for the Ad-vancement of Tropical Research (WOTRO), and by CIFOR.

5
Ik trok een streep:tot hier,
nooit ga ik verder dan tot hier.
Toen ik verder gingtrok ik een nieuwe streep
en nog een streep.
De zon scheen en overal zag ik mensen,haastig en ernstig,
en iedereen trok een streep,iedereen ging verder.
I drew a line:up to here,never will I go further than up to here.
When I went further,I drew a new line,and yet another line.
The sun was shining and I saw people everywhere,hasty and sincere,and everyone drew a line,everyone went further.
Toon TellegenOver liefde en over niets anders.1997, page 12 Querido
6
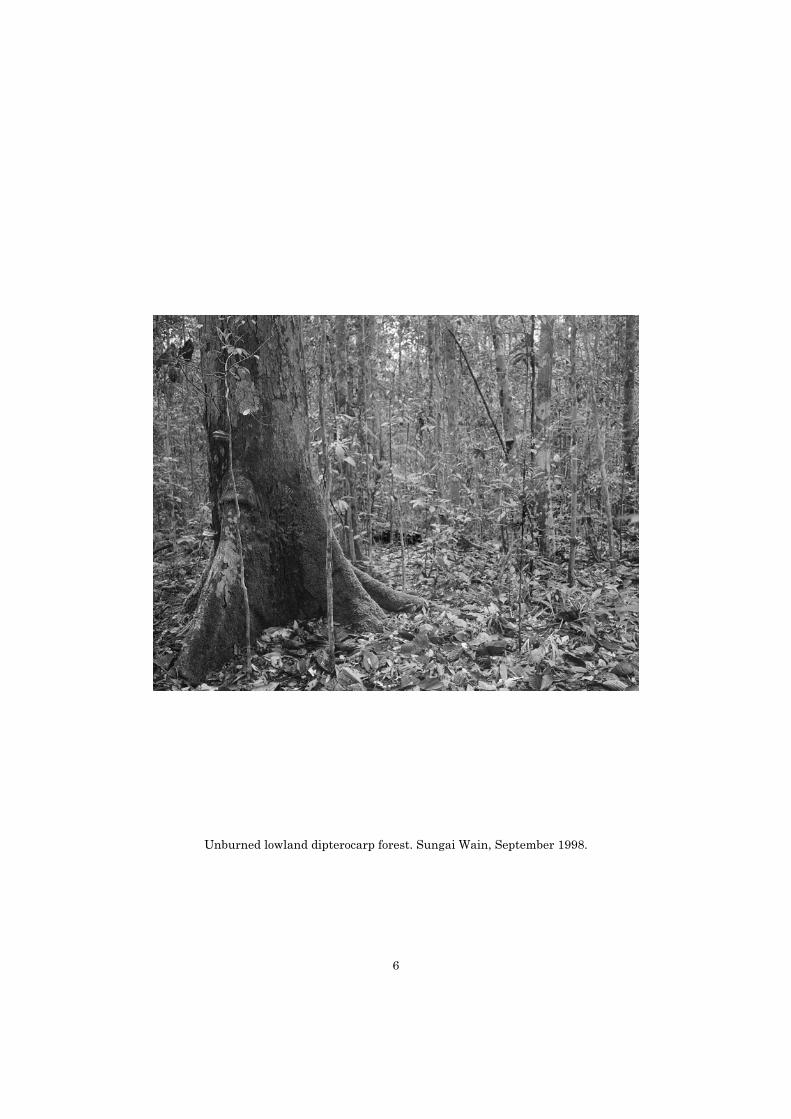
Unburned lowland dipterocarp forest. Sungai Wain, September 1998.
Contents
Chapter Page
1 General introduction 9
2 Separating the effects of severe drought and subsequent fire 27on tree mortality in a lowland dipterocarp rain forest in EastKalimantan, Indonesia
3 Post-fire dynamics of plant functional groups in a lowland dip- 45terocarp rain forest
4 Resprouting capacity of tropical saplings after artificial stem 67breakage, and the storage of non-structural carbohydrates
5 Vertical gradient in viable seed density and germination after 83fire in the seed bank of lowland dipterocarp rain forest
6 The ecological consequences of logging in the burned forests of 95East Kalimantan, Indonesia
7 Synthesis: Assessing the consequences of drought and fire in a 99lowland dipterocarp rain forest
Executive summary 115
Nederlandse samenvatting 117
Ringkasan dalam Bahasa Indonesia 124
References 127
Acknowledgements 141
Curriculum vitae 143
8
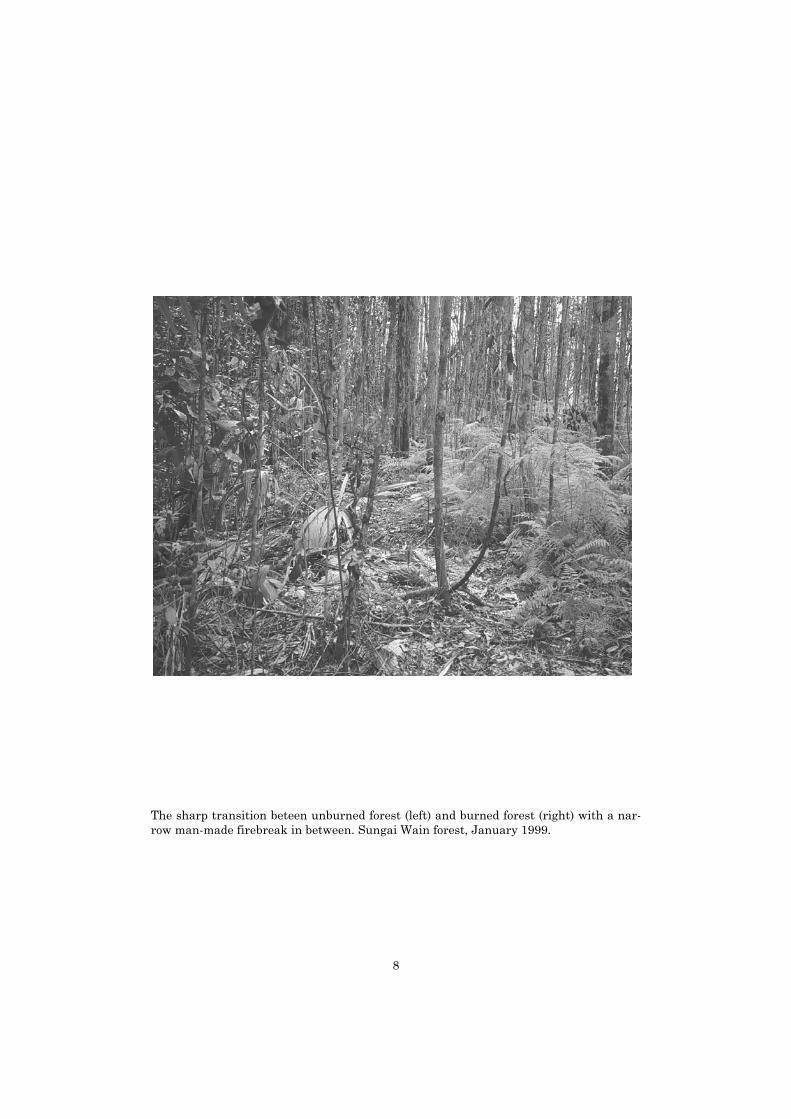
The sharp transition beteen unburned forest (left) and burned forest (right) with a nar-row man-made firebreak in between. Sungai Wain forest, January 1999.
1General introduction
Introduction
For a long time, ecologists used toconceive the tropical rain forest as undis-turbed gardens of Eden (MacMahon 1981,Whitmore 1984, Richards 1996). Detailedaccounts of the effects of hurricanes, vol-canic eruptions and, more recently, large-scale forest fires have altered this percep-tion (Tanner et al. 1991, Bellingham et al.1994, Whitmore & Burslem 1998, Co-chrane et al. 1999). It is now clear thatsevere disturbances occurring at low fre-quencies are a natural component ofmany tropical rain forests. The challengethat ecologists face is to incorporate theeffects of such disturbances into the theo-retical framework that describes and ex-plains patterns of species composition andspecies co-existence in the tropical rainforest.
In recent years, probably the moststriking example of a large-scale distur-bance in tropical rain forest was the oc-currence of extensive fires which, in amatter of months, devastated an area of2.6 million hectares of forest in the Indo-nesian province of East Kalimantan in1997-1998 (Hoffmann et al. 1999, Siegertet al. 2001). This region experiences in-frequent dry episodes related to the elNiño-Southern Oscillation (ENSO)(Ropelewski & Halpert 1996, Walsh 1996a, Walsh and Newbery 1999). A single firedoes not necessarily destroy the tropicalrain forest vegetation completely(Leighton & Wirawan 1986, Woods 1989,Holdsworth & Uhl 1997, Cochrane &Schulze 1999). The damaged area may
still have potential value in terms of na-ture conservation properties and timberproduction. These values depend on theability of a forest to recover after fire, andthe speed at which recovery occurs. Theprocesses of recovery need to be under-stood before we can decide whether it isuseful to put effort into the preservationof burned forests.
Many components of the forest are af-fected by fire and deserve a detailedanalysis. Not only does fire cause hightree mortality (Woods 1989, Leighton &Wirawan 1989), but also animal popula-tions are affected, either directly throughfire injury, or indirectly through changesin food availability or habitat structure(Azuma 1988, Doi 1988, Suzuki 1988,Yajima 1988, Makihara et al. 2001).Where animals interact with the vegeta-tion in their role as herbivores, seed dis-persers or pollinators, they may influencethe course of vegetation development.Depending on the fire intensity, the den-sity and composition of the mycorrhizalcommunity may be reduced by the heatproduced by a fire, or may change as theresult of altered soil characteristics. How-ever, from studies in South Asia and Aus-tralia it appears that the mycorrhizalcommunity is damaged only superficiallyor otherwise recovers quickly after fire(Bellgard et al. 1994, Rashid et al. 1997).Fire may change certain soil characteris-tics such as pH and availability of nutri-ents to the vegetation, and may cause atemporal increase in erosion rate (Busch-
10
bacher et al. 1988, Shimokawa 1988, Hol-scher et al. 1997, Douglas 1999, Ketter-ings & Bigham 2000, Ketterings et al.2000, Kennard & Gholz 2001). As a resultof the high plant mortality caused by fire,light penetration to the understorey in-creases, as does the temperature, whereasthe relative humidity decreases (Toma1999, Toma et al. 2001 a).
Light limitation is frequently identi-fied as one of the most important factorsdetermining plant establishment, growthand survival (Bazzaz 1996, Hubbell1998). While not denying the possibleinfluence of other factors on post-firevegetation development, the aim of thisstudy is to improve our understanding ofthe processes of establishment, growthand persistence that determine vegeta-tion dynamics after drought and fire, in-cluding light availability as the variablethat is likely to excert the most widelyinfluence on the post-fire development ofthe vegetation. During a two-year field-work that followed directly upon the1998-fire and the preceding drought, Istudied these processes by comparing anunburned core of forest with its burnedperiphery.
Theoretical framework
Few attempts have been made toplace post-fire vegetation dynamics inBorneo within a broader theoretical con-text. Because of the occurrence of fire-disturbance in an ecosystem which is tra-ditionally studied in a non-fire theoreticalcontext, insight may be gained from ana-lysing the vegetation dynamics within anon-fire (“general”) ecological framework,as well as from a fire-ecological point ofview. Due to the specific characteristics offire-prone ecosystems and fire as a dis-turbance agent, fire research has devel-oped some distinct approaches from thegeneral ecological literature (Bond & Wil-gen 1996).
General non-fire ecologyPatterns of predictable vegetation
changes are the subject of succession the-ory, which has continued to receive muchattention throughout the development of
both general ecology and fire-ecology. Inits original concept in general ecology,succession (primary succession) was pre-sented as a predictable sequence of vege-tation types which started on an initiallybare substrate and which ultimately de-veloped towards a climax vegetation(Clements 1904, 1916). It was determinedby speed of colonisation and subsequentcompetition, where species modified thesite after their establishment (“reaction”,sensu Clements 1904, 1916), changing therelative abilities of species to germinateand survive. The variety of vegetationdynamics referred to as succession gradu-ally expanded. A distinction was madebetween primary succession and secon-dary succession (the first referring tovegetation development on a newlyformed or exposed substrate (Glenn-Lewin & van der Maarel 1992)). Princi-ples of succession theory are now used todescribe vegetation dynamics over a widerange of spatial scales and intensities ofdisturbance, varying from colonisation ofa sterile volcanic island (Whittaker et al.1989) to the growth of saplings after treefall has formed a canopy gap (review byVeblen 1992).
The emphasis of succession theorygradually moved from a holistic view ofthe ecosystem (Clements 1916) to a pro-cess based approach which focuses on life-history characteristics, colonisation andinteractions between species (Connell &Slatyer 1977, Horn 1981, Pickett et al.1987, Tilman 1988, Glenn-Lewin et al.1992). An important part of modern lit-erature on non-fire succession theory isformed by studies in old-fields, in whichdifferences in colonisation rate, competi-tive ability, shade tolerance and longevityform the main factors driving the succes-sional sequence (Connell & Slatyer 1977,Huston & Smith 1987, review from a neo-tropical perspective by Finegan 1996).Following disturbance, species with dif-ferent competitive abilities dominate asite in a time sequence of replacements(Figure 1.1 a) (Horn 1981, Tilman 1982).In line with this emphasis, the role of adisturbance is primarily determined interms of its’ ability to “change resources,substrate availability, or the physical

11
environment” (White & Pickett 1985).While acknowledging that these changesresult from a temporarily increased turn-over of biomass or an increased mortality,studies which follow this approach rarelyinvestigate disturbance-induced patternsof species-specific mortality, but focus onthe post-disturbance colonisation andutilisation of the disposed resources in-stead (sensu Tilman 1988, Bazzaz 1996).Maybe due to the historical emphasis onsuccession in old fields, vegetative persis-tence of plants from before the distur-bance by whole-plant survival or re-sprouting is rarely explicitly incorporatedinto the theory.
Succession appears in the ecologicaltheory of old growth forests in the form oftreefall gap dynamics (Bazzaz & Pickett1980, Brokaw 1985, Veblen 1992). Distur-bances in a old growth forest are formedby small canopy gaps caused by the fall ofone or a few trees. A gap disturbanceusually causes little mortality but for thetree which causes the gap formation. Itcharacterised in terms of increased re-source availability (especially light) (Bro-kaw 1985). An essential difference withthe foregoing description of succession inold fields is, that the vegetation in a small
gap is formed in large part by shade tol-erant individuals which were present be-fore the disturbance (Uhl et al. 1988 c,Hubbell 1998) and thus, post-disturbancecolonisation does play only a limited role.The competitive dominance of the treesgrowing in the gap is largely determinedby their pre-disturbance size distribution,with the tallest trees at the time of gapformation capturing the highest amountof light (Zagt & Werger 1998, Brown et al.1999). However, the main forces of selec-tion may occur in the absence of distur-bance, and are formed by the length ofthe time period during which light avail-ability is limited (Zagt & Werger 1998,Brown et al. 1999) and the frequency ofdamage occurring during that period(Canham et al. 1996, Foster 1996, Harmset al. 1997). It has been argued that thestrategy of shade tolerant tree speciesshould be to maximise persistence underresource-limited conditions and to accu-mulate reserves to withstand unpredict-able damage, rather than to optimise theacquisition of light and other resources(Iwasa and Kubo 1997, Iwasa 2000).
To facilitate the analysis of processessuch as succession in species-rich assem-blages, functional groups have been de-fined, which share certain important life-history characteristics. In tropical forests,this functional grouping is often based onlight requirements in the seedling phase,and on longevity (Denslow 1980, Hubbell& Foster 1986). Two groups of trees, in-cluding light-demanding tree species andshade tolerant tree species are commonlydefined (Whitmore 1984, Swaine &Whitmore 1988) and in the successionalsequence, a third group of light-demanding non-woody species can be rec-ognised (Table 1.1). Successional devel-opment of a secondary tropical forest isabstracted as the sequence of these func-tional groups (Finegan 1996). In agree-ment with the competitive successionmodel, the successional sequence is pre-dicted as the result of differences ingrowth rate, longevity, competitive abili-ties and colonisation rates of the fourgroups over a temporal gradient in lightavailability. Following a disturbance, thegroup of light-demanding non-woody spe
Figure 1.1. Graphic representation of twomodels of succession, from Bond & van Wilgen(1996). The first model (a) represents tradi-tional non-fire succession in an old field,where a competitive hierarchy of speciespopulations replaces one another. The secondmodel (b) visualises succession in a fire-pronesystem, where all populations establish im-mediately after the disturbance, and the vege-tation changes are merely an effect ofdifferences in species longevity.
Time
a. Relay floristicsA B C D E
b. Fire successionA AB BC CD DE E
Fire
E

12
cies dominates the vegetation for a shortperiod of time. At the same time, short-lived and long-lived light-demanding treespecies establish from the seed bank andform a closed canopy in a few years time.After one to three decades, the long-livedspecies overgrow the short-lived trees andstart to dominate the canopy. The thirdand most species-rich group of shade tol-erant trees slowly increases in densitythrough colonisation from the seed rain(Gómez-Pompa & Vázquez-Yanes 1981,Finegan 1996). Their competitive superi-ority enables them to gradually replacethe light-demanding species.
Fire-ecology In the literature on fire ecology, dis-
turbances are most often viewed andanalysed in terms of population dynam-ics. Fire research broadly focuses on twoaspects: Interval-dependent effects andevent-dependent effects (Bond & Wilgen1996). Interval-dependent effects refer tothe influence of the length of the intervalbetween fires. Event-dependent effectsconsider the characteristics of a particu-lar fire, which may exert a critical influ-ence on population dynamics, dependingon fire intensity, time of year, etceteras.
Following a paper by Hanes (1971) inCalifornian chaparral, it was increasingly
acknowledged that in fire-prone ecosys-tems, a fire disturbance does not neces-sarily start a sequence of successionalstages driven by colonisation and compe-tition (Bond & van Wilgen 1996). Instead,Hanes found that all species that were todominate the later vegetation were al-ready present shortly after the fire, eitheras resprouts or through establishmentfrom the seed bank. He called this self-replacement “autosuccession”. It is char-acteristic for vegetations that are adaptedto a certain severe disturbance regime.Many species in the community requirepost-fire conditions for their establish-ment, and the community may even de-velop into a “senile” and unproductivephase in the absence of fire (Hanes 1971).The successional pattern that follows af-ter fire is the result of differences in spe-cies longevity (Figure 1.1 b). All speciesare present directly after the disturbanceand as time passes, only the longer-livedspecies remain established in the above-ground vegetation.
Depending on the characteristics of afire regime, fire can also cause profoundchanges in the composition of fire-proneecosystems. For example, in many tropi-cal parts of the world, fire is thought to beresponsible for the maintenance of sava-nahs where otherwise forest would grow(Gillison 1983, Werger 1983). A high fire
Table 1.1. Characterization of the life-history attributes of the main functionalgroups in this study.
Functional groupApproximately ordered from early to late successional
Life-history attribute Non-woody species Light-demanding
treesShade-tolerant
treesLight requirement for germination and survival
high high low
Seed size usually very small small to very small largeSeed dispersal distance long short to moderate shortSurvival in seed bank yes yes noAbility to resprout after fire disturbance
often high unknown unknown
Time to reach reproductive maturity
± 1 year > 5 years usually > 25 years
Life span Highly variable > 10-15 years > 50-100 yearsCharacteristic species in Borneo
Terrestrial ferns, Imperata
cylindrica, Mikania scandens
Macaranga spp., Mallotus spp.,
Dillenia cf. borneensis,
Vernonia arborea
Most tree species in the undisturbed
forest
13
frequency prevents the growth to matur-ity of trees that persist as resproutingseedlings throughout the grass vegetation(Bond & van Wilgen 1996). The observa-tion that changes in the disturbance re-gime could lead to changes in thevegetation led to the approach of pre-dicting vegetation development by defin-
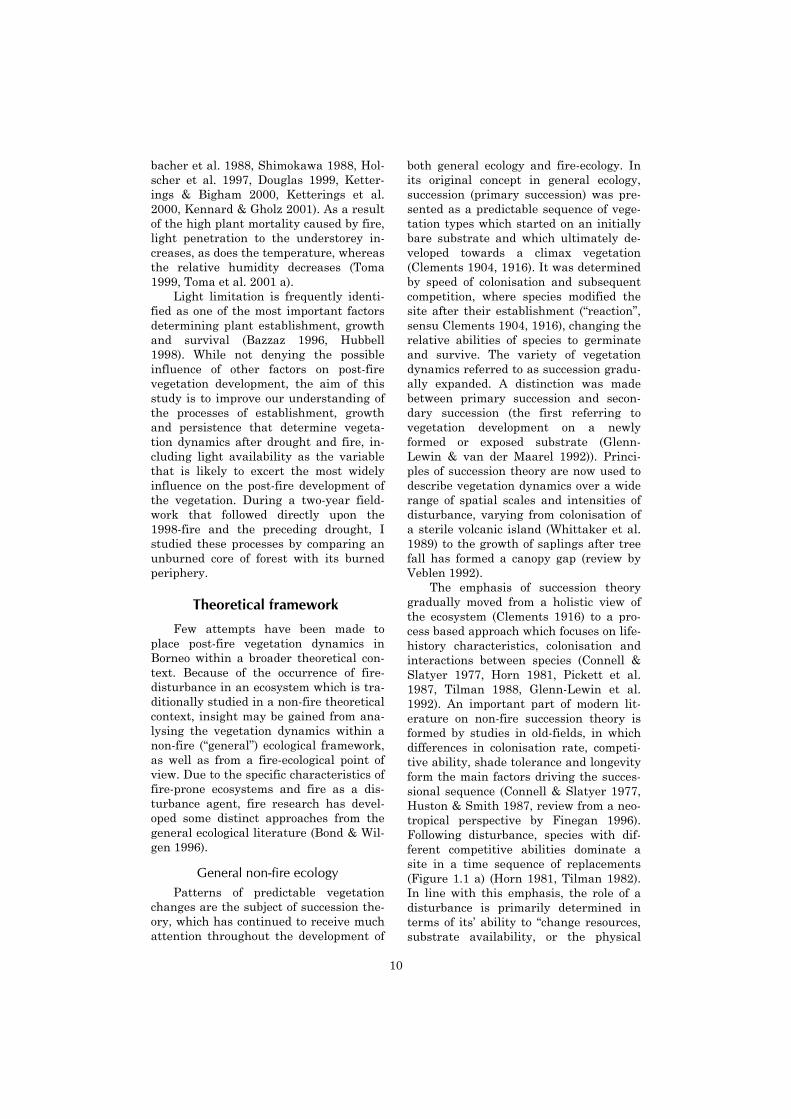
ing sets of “plant vital attributes” (Table1.2) (Noble & Slatyer 1980, Bond & vanWilgen 1996).
Plant vital attributes are key charac-teristics of species, which define the “re-generation niche” (Grubb, 1977) of speciesand, characteristic for the fire-orientedapproach, also the “persistence niche”
Table 1.2. Classification of plant vital attributes after Noble & Slatyer (1980), with theequivalent plant functional group or equivalent plant characteristics in a tropical rain forest.(1) Uhl & Jordan 1984, Stocker 1981, Uhl et al. 1981, Kauffman 1991, Kammesheidt 1998,1999. (2) Vines 1968, Uhl & Kauffman 1990, Pinard & Huffman 1997.
Plant vital attribute DescriptionEquivalent functional group in tropical forest
Establishment requirementsT Tolerant species Able to establish at any time, tolerating
competition with adults.Shade-tolerant tree species.
I Intolerant species Able to establish only immediately after the disturbance.
Light-demanding tree species, many non-woody species.
R Requiring species Unable to establish directly after the disturbance, but have the ability to establish once mature individuals are present.
Certain shade-tolerant tree species?
Mode of persistenceD Dispersed species Long-distance seed dispersal. Associated with wind-dispersal,
i.e. light-demanding trees, lianas, many non-woody
S Soil-stored species Seeds with long viability in the soil. Associated with light-demanding trees, lianas, many non-woody species.
G Germinating species As above, but the seed pool is exhausted after the fire. Individuals must reach maturity before the next fire in order for the population to survive.
Unknown; probably rare or absent.
C Canopy-stored species Seeds surviving the disturbance in the crown.
Unknown; probably rare or absent.
V Vegetative species Large part of both juvenile and mature individuals survives the disturbance by resprouting.
Association with functional groups unknown; basal sprouting reported in several slash & burn studies (1).
U Unaffected species Part of the individuals survives the disturbance unaffected.
Association with functional groups unknown; Importance ofbark thickness reported from neotropical studies (2).
W Mature stage unaffected
As in V, but sprouting individuals remain in mature life stage.
As in V
Y Juvenile stage unaffected
As in V, but sprouting individuals are in juvenile (i.e. non reproducing) life stage.
As in V
Time to reach certain life history stagem Time to reproductive maturity Related with shade-tolerance
and adult stature.
l Life span of individuals Related with shade-tolerance and adult stature.
e Unknown; probably rare or absent.
Time for all propagules to be lost from the community in the absence of disturbance

14
(Bond & van Wilgen 1996, Bond &Midgley 2001) and the timing of criticallife-history events. The vital attributesdefining the regeneration niche, whichdetermine the ability of a plant to becomeestablished at different stages after fire,show considerable overlap with functionalgroupings commonly used in tropical non-fire research (Table 1.2). The other twoclassifications, mode of persistence andtiming of life-history events, have beenonly partially considered in tropical non-fire research. The importance of the seedbank is widely acknowledged (i.e. reviewby Garwood 1989), as is the role of whole-plant persistence of seedlings after asmall-scale, low-intensity disturbancesuch as gap formation (Uhl et al. 1988 c,Zagt 1997, Brown et al. 1999, Brokaw &Busing 2000). In studies on larger andmore severe disturbances, whole-plantsurvival and resprouting are often givenlittle consideration (cf. Finegan 1996),even though some tropical studies showthat it can play a significant role afterlogging (Rijks, Malta & Zagt 1998, Negre-ros-Castillo & Hall 2000), hurricanes(Bellingham et al. 1994, Bellingham &Tanner 1995), forest fire (Kauffman1991), and slashing and burning (Riswan& Kartawinata 1989, Kammesheidt 1998,1999, Uhl & Jordan 1984). The timing oflife-history events does feature in manyforest succession models (review in Urban& Shugart 1992, Clark 1996, Pacala et al.1996, Loehle 2000), but few tropical fieldstudies focus on species characteristicssuch as age to reproductive maturity andlife span (but see Thomas 1996, Davies &Ashton 1999).
The vital attribute view assumes thatsuccessional patterns can be predictedwithout considering competitive interac-tions between individuals. Instead, per-sistence characteristics determine thecommunity composition shortly after fire,and successional changes in species com-position are the result of differences inspecific life-history attributes such asgrowth rate and longevity. Thus, individ-ual species behave in the same way re-gardless of the species composition thatoccurs in their surroundings (Bond & vanWilgen 1996).
HypothesesBased on the traditional successional
approach and the vital attribute ap-proach, we can make two different sets ofpredictions (Table 1.3). The two main dif-ferences are that (1) the vital attributeapproach includes species’ abilities tosurvive the drought and fire disturbance,whereas such abilities are not explicitlyconsidered in the non-fire approach, and(2) the non-fire approach predicts thatcompetitive interactions play an impor-tant role in structuring the temporal pat-terns after the disturbance, whereas thevital-attribute approach predicts that,with time passing, light-demanding spe-cies will be eliminated not because oftheir competitive inferiority (i.e. becausethey are outshaded by shade tolerant spe-cies), but simply because of their limitedlife-span. Likewise, the species composi-tion of the pool of shade tolerant trees isnot determined by differences in colonisa-tion rate and competitive dominance, butby the persistence ability of species di
Table 1.3. Hypotheses based on general succession theory and fire succession theory.Functional groups are: Light-demanding (LD) and shade-tolerant (ST).
Community pattern Non-fire Fire1. Vegetation composition directly after fire
Dominated by LD species; Other functional groups virtually absent
All functional groups that are to form the later community are present
2. Density of LD vs. ST species in time
ST species increase because they outcompete LD species
ST increase because of slow growth rate and high longevity. LD species decline because of limited longevity.
3. Species composition of ST species
Determined by colonisation rate and competitive ability
Determined by fire survival rate,growth rate and longevity

15
rectly after the disturbance, and the spe-cies’ longevity. The emphasis of this studyis on the first and third hypothesis in ta-ble 1.3.
Vegetation dynamics after droughtand fire
Complex disturbance regimesSeveral research studies in Borneo
describe the effects of fire on the lowlanddipterocarp rain forest, focussing post-firevegetation development. However, thesestudies do not provide a satisfying over-view of the successional development af-ter fire disturbance, because thedisturbance “treatments” were highlyvariable, and were rarely restricted to asingle fire in an “undisturbed” forest (ex-ceptions are studies on tree mortality byLeighton & Wirawan 1986, Woods 1989).In most studies the “treatment” consistedof more complex disturbances whichwould not occur in the absence of humaninterference. These complex disturbanceregimes included logging and burning(Woods 1989, Nykvist 1996), slashing andburning (Riswan & Kartawinata 1988,1989) or even more complex sequences ofdisturbance (Kobayashi et al. 1999,Matius et al. 2001, Mori 2001, Toma et al.1999, 2001 b). A similar emphasis oncomplex disturbance regimes exists intropical studies from other continents. Anextensive body of Neotropical literaturedescribes forest development after a sin-gle experimental slash and burn treat-ment (Uhl et al. 1981, Uhl & Jordan 1984,Steiniger 2000), after slashing and burn-ing followed by several years of cultiva-tion (Uhl et al. 1982, Uhl 1987, Uhl et al.1988, Kammesheidt 1998, Kammesheidt1999, Peña-Claros 2001), or after a com-plex regime of fires and other distur-bances (Ewel et al. 1981, Cochrane &Schulze 1999, Pinard et al. 1999). Only afew Neotropical studies describe the ef-fects of fire in unlogged forest (Kauffman1991, Kammesheidt 1999) or the effects offire in selectively logged forest (Hold-sworth & Uhl 1997, Cochrane & Schulze1999, Pinard et al. 1999).
Our understanding of the impact offire disturbance may be coloured by theemphasis on experiments with a very se-vere disturbance treatment. The moreseverely or frequently disturbed a forestsite is, the higher the local mortality andthus the lower the importance of plantpersistence. Second, in a small researchplot with the undisturbed forest close-by,the input of seeds from shade tolerantspecies will be relatively high. If fewshade tolerant species survive on the site,and if seed input is sufficiently high toensure a high seedling density, non-firetheories of colonisation and competitionmay be adequate to describe the succes-sional patterns after slash and burntreatments. However, the importance ofspecies persistence and the timing of life-history characteristics may become ofsignificant importance in the vegetationdevelopment after a single, large-scalefire.
The role of droughtIn a tropical forest, fire is necessarily
preceded by a prolonged drought whichcauses desiccation of the litter layer. Suchan exceptional drought may in itself be anagent of tree mortality. In two studies inperhumid forests, which on average donot experience a monthly rainfall below100 mm, two-month periods with a totalof 50-80 mm precipitation caused a sig-nificant increase in tree mortality (Naka-gawa et al. 2000, Williamson 2000). Adrought in East Kalimantan, which wassimilar in intensity to the drought that isthe subject of this study, caused approxi-mately 25% mortality among canopy trees(Leighton & Wirawan 1986). No studieshave analysed species-specific mortalityor successional patterns after extremedrought in tropical perhumid forest. Fol-lowing a dry period of unusual length inthe seasonally dry forest of Barro Colo-rado Island, canopy trees had a higherchance of mortality than smaller indi-viduals (Condit et al. 1995). Patterns ofspecies-specific mortality were not easilyexplained.
16
Vegetation dynamics after disturbanceby fire
Descriptions of vegetation develop-ment after fire are only available forlowland dipterocarp forests which experi-enced a combination of fire and other dis-turbances. These studies provide the bestavailable approximation of what can beexpected after a single fire in a forest thathas not been disturbed otherwise. To-gether, the studies performed in Borneosuggest that in the first 30-35 years ofsuccession, the vegetation developsthrough three stages. These stages ap-pear to be predictable and are similar tothe successional stages in other tropicalrain forests (Finegan 1996).
In the first stage, lasting one to fiveyears after the disturbance, the vegeta-tion is dominated by light-demandingnon-woody species. The early vegetationdynamics (up to 1.5 yr.) were studied indetail near Samarinda, where a 0.5 haplot of primary lowland dipterocarp forestwas experimentally slashed and burned(S & B) (Riswan & Kartawinata 1989).After half a year, the cover of non-woodyspecies (notably the grass Paspalumconjugatum) reached a maximum cover ofnearly 50%. In the following six monthsthe herb cover decreased rapidly, whilethe cover of tree seedlings increased. Theduration of the first phase remains un-specified in a study in Sabah, where fernsdominated the early post-fire vegetationin a burned selectively logged forest(Nykvist 1996). However, it may havelasted longer than in the study by Riswanand Kartawinata since five years afterthe fire, ferns were still highly abundant.
In the second stage, light-demandingtree species form the dominant compo-nent of the vegetation. In the study ofRiswan and Kartawinata, this phasestarted around one year, when the vege-tation became dominated by tree seed-lings. After 1.5 year the density of treeseedlings was 405 per 100 m2, of which30% were primary forest species. Riswanand Kartawinata were the only research-ers to distinguish between woody re-growth originating from resprouts or fromseeds. The number of shade tolerant tree
species on 100 m2 originating fromsprouts was 25, compared to 23 speciesfrom seedlings. However, the percentagecover of tree sprouts was only 7%, com-pared to nearly 70% cover by tree seed-lings (shade tolerant and light-demandingspecies combined).
In the study by Nykvist, light compe-tition between ferns and the developingtree vegetation may have been the reasonfor the reduction of the former. Eightyears after the fire, Macaranga spp.formed the dominant component, com-prising 45% of the total biomass. Non-woody species added 7%, and shade toler-ant tree species 9 to 25% to the total bio-mass.
Several longer-term studies from theBukit Soeharto Education Forest (BSEF)provide insight in the tree populationdynamics during the second successionalphase. The BSEF was selectively loggedup to 1976, burned with varying intensityin 1983, was partly logged with differentintensities in 1997 and burned again withvarying intensity in 1997-1998 (Kobaya-shi et al. 1999, Matius et al. 2001, Mori2001, Toma et al. 1999, 2001 b). Toma etal. (2001 b) presented data on the devel-opment of a lightly damaged part of theBSEF forest after selective logging andfire in 1982-1983. Their observations ontree cover (>10 cm dbh) started 5 yearsafter the fires, by which time Mallotuspenangensis had established a stablepopulation of approximately 20 stems ha-
1. In the 10-year period that followed, thetotal density of trees gradually increasedfrom approximately 300 to 340 stems ha-1.Most of this increase was caused by in-growth into the size class >10 cm dbh ofMacaranga hypoleuca. Populations ofshade tolerant species remained stable atapproximately 250 stems ha-1. Macarangagigantea established very abundantly inthe more highly disturbed plots (Toma etal. 2001 b, Matius et al. 2001).
Disruption of the closed canopy oflight-demanding species interludes thetransition to the third stage, in whichshade tolerant trees become the mostabundant component of the vegetation. InBSEF, the disruption of the uniform can-opy of light-demanding species appears to
17
be determined by the occurrence ofdrought. When approximately 15 yearsold, populations of Macaranga spp. weredecimated as the result of a prolongeddrought in 1997 (Toma et al. 2001 b). Inthe absence of drought, the canopy oflight-demanding species probably persistslonger.
Riswan and Kartawinata (1988) in-vestigated the result of succession in anabandoned pepper plantation, which waslocated in a primary forest in East Ka-limantan. Thirty to 35 years after aban-donment, the vegetation was in the thirdphase of successional development. With70% of the stem density (>10 cm dbh),shade tolerant trees dominated the stand.In the plot of 0.8 ha they found 121 spe-cies, 85 of which were considered to beshade tolerant species. However, none ofthe large trees (>50 cm dbh) in the plotwere shade tolerant species. The speciescomposition deviated considerably fromthe primary forest. Especially the nearabsence of Dipterocarpaceae in the plotwas conspicuous. Due to the intensiveland use, shade tolerant trees must have
been rare or absent in the plot at the on-set of vegetation recovery. Riswan andKartawinata inferred that the slow in-growth of shade tolerant trees was causedby a limited influx of seed from the sur-rounding forest, and a slow growth rate ofthe shade tolerant species.
Due to the variable disturbance re-gimes and a lack of information on thepersistence mode, the growth, and sur-vival of individuals, these studies are in-sufficient to test the hypothesesgenerated from non-fire and fire succes-sional theory in table 1.3. However, thestudies suggest that considerations fromboth approaches have potential explana-tory power. For example, competition forlight may have played a role in the reduc-tion of non-woody species in the studies ofRiswan and Kartawinata (1988) andNykvist (1996), whereas not competitionfor light but drought-tolerance seems tohave determined the ending of the phasedominated by light-demanding trees inthe study of Toma et al. (2001 b).
Ultimately, the performance and fateof shade tolerant populations determines
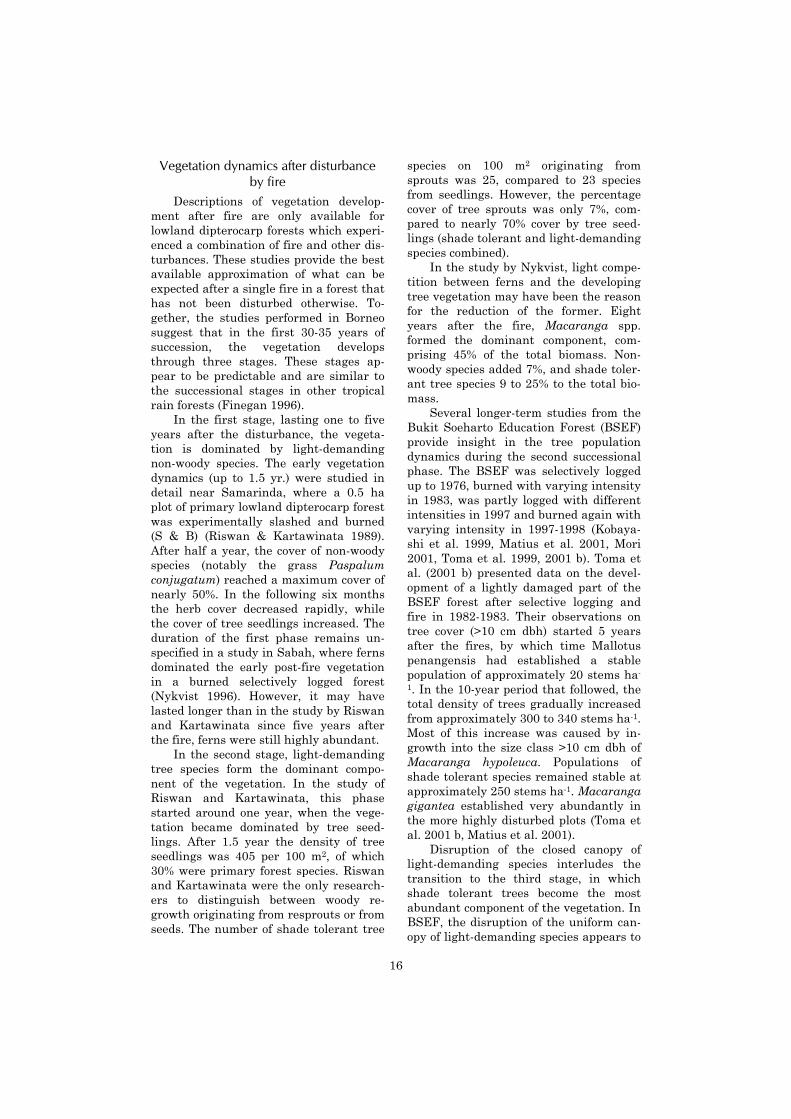
Figure 1.2. Map showing the location of Sungai Wain forest on the island of Borneo. Theenlargement shows the Sungai Wain forest indicating the unburned area (dark grey), andthe areas which burned once in (1998) (light grey) or twice (1983 and 1998) (white). The loca-tion of each pair of permanent sample plots (psp) is shown. The circular inset shows an ex-ample of the lay out of one pair of psp over the fire edge. Psp 5 is situated in unburned forestand psp 6 in once burned forest.
18
the recovery of the forest. The diversity ofsprouts in the study of Riswan and Kar-tawinata (1989) and the fact that a sub-stantial density of trees survives the fire(Woods 1989, Leighton & Wirawan 1984,Toma et al. 2001 b) suggest that not onlypost-fire colonisation by seed dispersal,but also different modes of persistencecontribute significantly to the post-firesuccession. However, far too little isknown of the origin of shade toleranttrees in the recovering forest to under-stand the relative importance of theseprocesses.
Site description
The main research site is a watercatchment reserve of circa 100 km2, calledSungai Wain protection forest near toBalikpapan, East Kalimantan (1º16’ Sand 116º54’ E) at 15 km from the Strait ofMakasar (Figure 1.2). Three-quarters ofthe reserve are covered with lowland dip-terocarp rain forest. Settlers have culti-vated the eastern quarter of the reserve.The reserve borders low-intensity agricul-tural land (so-called Alang-alang shrublands) in the South and the East, a mo-saic of logged forest and plantations inthe North, and a mosaic of logged forest,agricultural fields and mangrove forest inthe West. The topography of the reserveconsists of gentle to sometimes steep hills,and is intersected by several small rivers.There exists a gentle North-South gradi-ent in altitude, as the result of which thearea varies in altitude from 40 to 140m.a.s.l.
The soil mainly consists of alisols(FAO/Unesco/ISRIC 1988, Bremen et al.1990, MacKinnon et al. 1996). These arestrongly weathered, very deep, infertilesoils, which contain a high fraction ofloam and clay.
Additional data were collected in theprotected Wanariset Wartonokadri re-search forest (10 km Northeast of theSungai Wain forest). This is a forestfragment of 50 ha surrounded on threesides by degraded forest and agriculturalfields, and on the fourth side it is sepa-rated from another forest patch by a nar-
row road. The altitude, soil type andclimate are similar to the Sungai Wainforest.
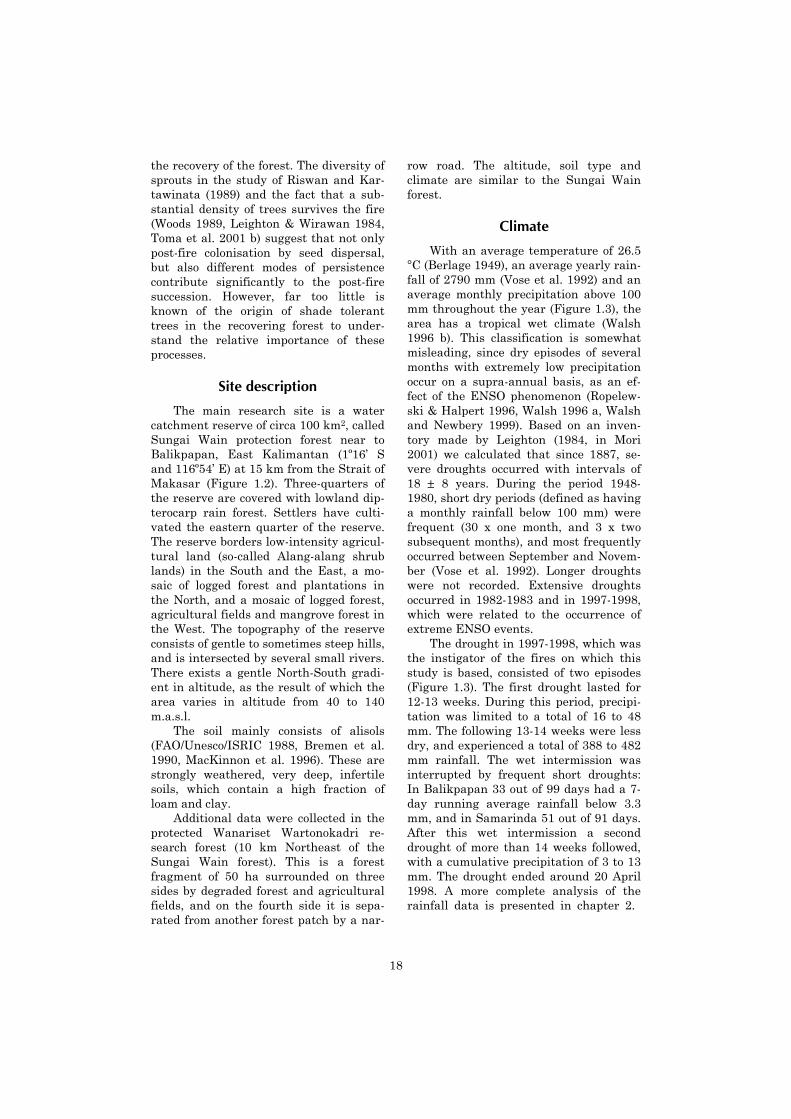
Climate
With an average temperature of 26.5°C (Berlage 1949), an average yearly rain-fall of 2790 mm (Vose et al. 1992) and anaverage monthly precipitation above 100mm throughout the year (Figure 1.3), thearea has a tropical wet climate (Walsh1996 b). This classification is somewhatmisleading, since dry episodes of severalmonths with extremely low precipitationoccur on a supra-annual basis, as an ef-fect of the ENSO phenomenon (Ropelew-ski & Halpert 1996, Walsh 1996 a, Walshand Newbery 1999). Based on an inven-tory made by Leighton (1984, in Mori2001) we calculated that since 1887, se-vere droughts occurred with intervals of18 ± 8 years. During the period 1948-1980, short dry periods (defined as havinga monthly rainfall below 100 mm) werefrequent (30 x one month, and 3 x twosubsequent months), and most frequentlyoccurred between September and Novem-ber (Vose et al. 1992). Longer droughtswere not recorded. Extensive droughtsoccurred in 1982-1983 and in 1997-1998,which were related to the occurrence ofextreme ENSO events.
The drought in 1997-1998, which wasthe instigator of the fires on which thisstudy is based, consisted of two episodes(Figure 1.3). The first drought lasted for12-13 weeks. During this period, precipi-tation was limited to a total of 16 to 48mm. The following 13-14 weeks were lessdry, and experienced a total of 388 to 482mm rainfall. The wet intermission wasinterrupted by frequent short droughts:In Balikpapan 33 out of 99 days had a 7-day running average rainfall below 3.3mm, and in Samarinda 51 out of 91 days.After this wet intermission a seconddrought of more than 14 weeks followed,with a cumulative precipitation of 3 to 13mm. The drought ended around 20 April1998. A more complete analysis of therainfall data is presented in chapter 2.
19
Fire characteristics and historicalfire regime
There are records of two fires in theSungai Wain research forest. One oc-curred in the eastern part of the forest inthe dry episode of 1982-1983, burningone-third of the reserve (Figure 1.2). Thesecond fire occurred during the last partof the exceptional drought in March –April 1998, burning two-thirds of the re-serve. A core area of one third of the totalarea (3 x 8 km) was saved from the fire.The ecological impact of a fire regime de-pends on many variables, of which fireintensity, fire return interval, extent (orpatchiness) and size of the burned area(Whelan 1995) are of particular interesthere.
Fire intensity (energy output per me-ter of fire front, in kW m-1) (Alexander1982, Whelan 1995) depends on theavailable fuel load, fuel moisture, windspeed and other variables (Uhl et al.1988, Whelan 1995). Fires are character-ised as crown fires and surface fires. Dueto the humid conditions and low windspeed inside a tropical rain forest, fires
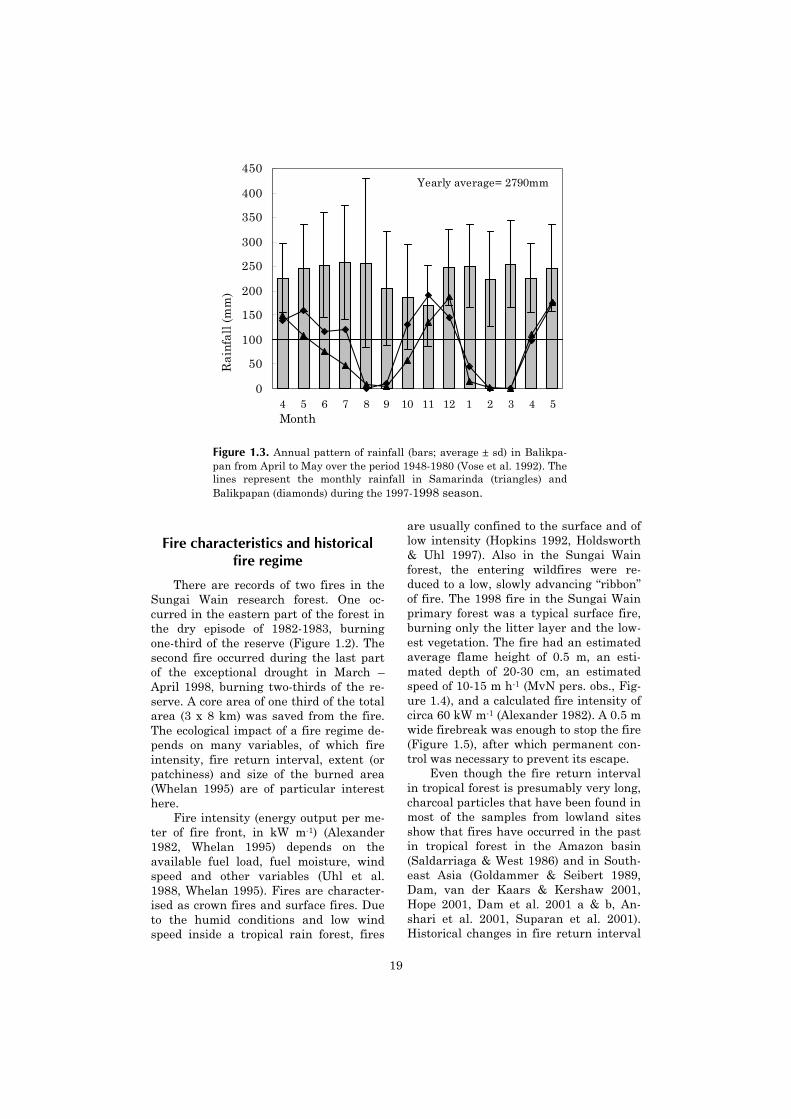
are usually confined to the surface and oflow intensity (Hopkins 1992, Holdsworth& Uhl 1997). Also in the Sungai Wainforest, the entering wildfires were re-duced to a low, slowly advancing “ribbon”of fire. The 1998 fire in the Sungai Wainprimary forest was a typical surface fire,burning only the litter layer and the low-est vegetation. The fire had an estimatedaverage flame height of 0.5 m, an esti-mated depth of 20-30 cm, an estimatedspeed of 10-15 m h-1 (MvN pers. obs., Fig-ure 1.4), and a calculated fire intensity ofcirca 60 kW m-1 (Alexander 1982). A 0.5 mwide firebreak was enough to stop the fire(Figure 1.5), after which permanent con-trol was necessary to prevent its escape.
Even though the fire return intervalin tropical forest is presumably very long,charcoal particles that have been found inmost of the samples from lowland sitesshow that fires have occurred in the pastin tropical forest in the Amazon basin(Saldarriaga & West 1986) and in South-east Asia (Goldammer & Seibert 1989,Dam, van der Kaars & Kershaw 2001,Hope 2001, Dam et al. 2001 a & b, An-shari et al. 2001, Suparan et al. 2001).Historical changes in fire return interval
Figure 1.3. Annual pattern of rainfall (bars; average ± sd) in Balikpa-pan from April to May over the period 1948-1980 (Vose et al. 1992). Thelines represent the monthly rainfall in Samarinda (triangles) andBalikpapan (diamonds) during the 1997-1998 season.
Yearly average= 2790mm
0
50
100
150
200
250
300
350
400
450
4 5 6 7 8 9 10 11 12 1 2 3 4 5Month
Rai
nfal
l (m
m)

20
may have been caused by a temporarilydrier and more seasonal climate. Suchconditions prevailed in a period that be-gan during the Last Glacial Maximumand lasted until the beginning of theHolocene (Dam, van der Kaars & Ker-shaw 2001, Hope 2001, Dam et al. 2001 a& b, Anshari et al. 2001, Suparan et al.2001). However, colonising humans mayalso have changed the fire frequency.Whether the fires were “natural” or havean anthropogenic origin cannot be estab-lished, since the sample sequences do notdate from before the first human occupa-tion (Dam, van der Kaars & Kershaw2001).
During the last decades, fires haveoccurred at an unprecedented frequencyin the tropical rain forests of SoutheastAsia (Leighton & Wirawan 1984, Len-nertz and Panzer 1984, Hoffmann et al.1999) and Latin America (Cochrane &Schulze 1999, Cochrane et al. 1999). Therecent catastrophic fires in Borneo wererelated to extremely dry periods. Much ofthe burned forests had previously beenselectively logged (Hoffmann et al. 1999,Siegert et al. 2001), but following extremedroughts in 1982-1983 and 1997-1998,
also unlogged forests in Borneo caughtfire (Leighton & Wirawan 1984, Woods1989, Hoffmann et al. 1999). The in-creased fire frequency is caused by a com-bination of extensive droughts, selectivelogging and forest fragmentation, andparticularly by the intensifying use of firefor land clearing by plantation companiesand farmers (Hoffmann et al. 1999).
The size of the burned area andpatchiness are important ecological pa-rameters, because they influence scaledependent processes, such as the traveldistance of seeds colonising from un-burned forest. Covering nearly the entireSoutheastern quarter of the province ofEast Kalimantan (Lennertz & Panzer1984, Hoffmann et al. 1999, Siegert et al.2001), the scale of the fires of 1982-1983and 1997-1998 was larger than any proc-ess of biological recovery. Nothing isknown about the size of natural fires inEast Kalimantan in the past. Given thelow spreading rate of a tropical forest fire,the size of the burned forest area willprobably have depended mainly on thetime lapse between fire ignition and theonset of the rainy season.
Figure 1.4. A typical surface fire insidedipterocarp rain forest, Wanariset researchforest, March 1998.
Figure 1.5. A man-made firebreak, Wanarisetresearch forest, March 1998.

21
Post-facto experimental design
The occurrence of a severe distur-bance such as a forest fire is usuallyhighly unpredictable, which makes thestudy of such a disturbance difficult. Inmany cases, there may exist little alter-native for a post-facto experimental re-search. Three main constraints to post-facto studies can be recognised (Wiens &Parker 1995, Turner et al. 1997). First,experimental plots with different treat-ments cannot be randomly located be-cause the “treatment” has already beenapplied. Second, a comparison can only bemade in space, since by definition com-prehensive data from before the distur-bance are not available. Thus, anunknown portion of variation betweenplots in the different treatments is intro-duced, even if it were possible to locatethe plots entirely randomly. Third, pseu-doreplication is difficult to avoid, becausethe disturbance event itself is the onlytrue level of replication (Eberhardt &Thomas 1991, Turner et al. 1997).
In the present study, we aimed atminimising the limitations inherent tothese constraints. The particulars of thefield situation allowed us to locate re-search plots with different treatmentsrelatively randomly spread in the land-scape: During the drought, the unburnedpart and burned part of the forest hadequal potential to burn. The unburnedforest remained unburned because ofman-made fire breaks, which did not cor-respond to any topographical feature inthe areas where the research plots wereplaced. Thus, there is no a priory reasonto expect differences in the original vege-tation of the unburned and the burnedplots. To increase insight in the effect ofspatial variation in the disturbance re-gime, we planned sets of replicate re-search plots over three different sites thatwere several kilometres apart. To mini-mise variation in plot characteristics be-tween the two treatments, we designedthe post-facto experiment in pairs of oneunburned and one burned plot, whichbordered each other with the firebreak asthe only separation. Locating the plots in
pairs minimized pre-fire differences inlandscape variation between plots.
The post-facto study of a naturally oc-curring severe disturbance also presentssome advantages over the experimentalapplication of disturbance treatments.The area of disturbance in case of a natu-ral event is larger than what is usuallyfeasible to apply experimentally. In thenatural situation, the risk of introducingunacknowledged scale-dependent proc-esses in the study is minimised. Also, itmay be nearly impossible to mimic thenatural disturbance regime accurately.For example, in the present study the firedisturbance was closely linked to a pre-ceding long drought. This drought pre-sented a severe disturbance in its ownright, and therefore needed to be analysedin unison with the fire.
By nature, a post-facto experimentaldesign concerns a comparison of treat-ments in space, not in time. Also here,there are advantages as well as disadvan-tages. Differences in plot characteristics(such as topography, species composition,and vegetation structure) may interferewith a straightforward analysis of thedata. On the other hand, processes thathave an explicit temporal component maybe studied more accurately in a parallelanalysis of a disturbed and an undis-turbed plot, than by studying pre- andpost disturbance at the same location(Wiens & Parker 1995).
Plot description
In the Sungai Wain forest 18 perma-nent sample plots (psp) of 60 x 300 m (1.8ha) each were laid out in unburned forestand in forest that burned once in 1998(Figure 1.2). The set-up of the psp wasdesigned around man-made firebreaks of0.5 m wide, which were made during thefires. Because the fire-breaks did not cor-respond to any topographical feature inthe places were the psp were positioned,this allowed for a random samplingscheme with paired plots of unburned andburned forest at a short distance fromeach other. The psp were laid out in ninepairs, each pair of psp adjacent to eachother over the firebreak between burned
22
and unburned forest. Thus, each pair ofpsp forms one contiguous transect of 60 x600 m half in burned and half in un-burned forest. The psp are nested in threegroups and spread over a total area ofcirca 20 km2. The distance between twopairs of psp is always more than 500 m.
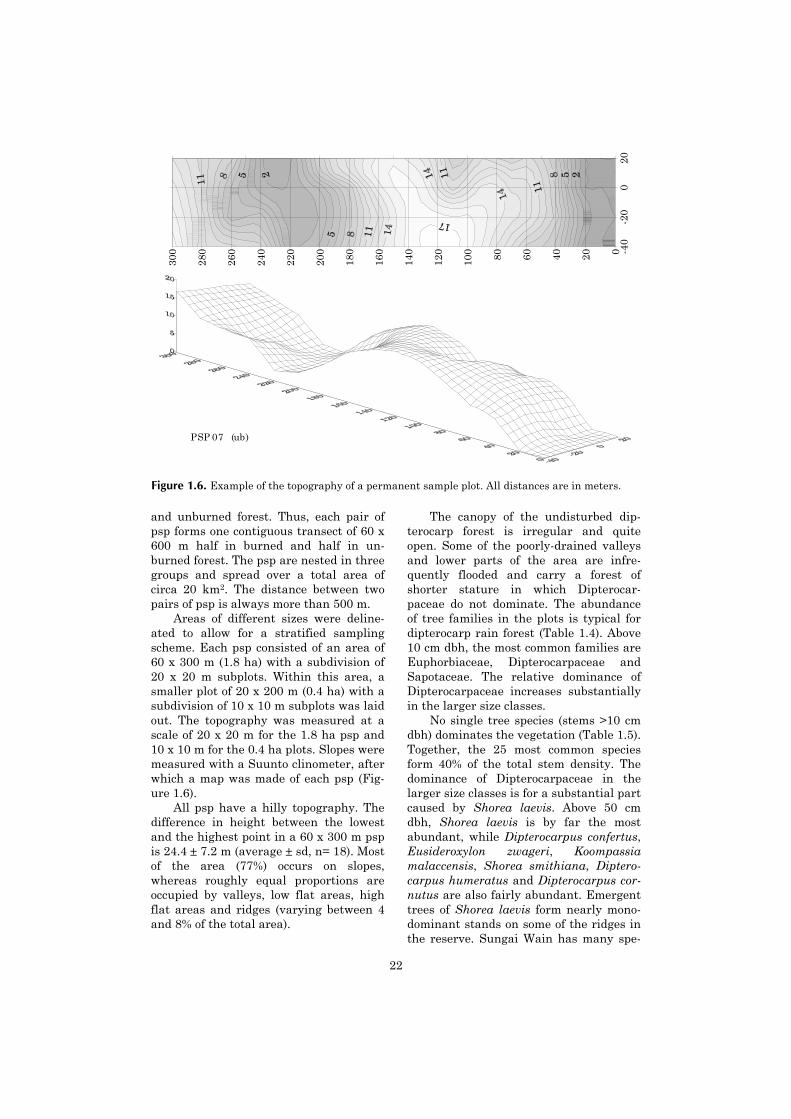
Areas of different sizes were deline-ated to allow for a stratified samplingscheme. Each psp consisted of an area of60 x 300 m (1.8 ha) with a subdivision of20 x 20 m subplots. Within this area, asmaller plot of 20 x 200 m (0.4 ha) with asubdivision of 10 x 10 m subplots was laidout. The topography was measured at ascale of 20 x 20 m for the 1.8 ha psp and10 x 10 m for the 0.4 ha plots. Slopes weremeasured with a Suunto clinometer, afterwhich a map was made of each psp (Fig-ure 1.6).
All psp have a hilly topography. Thedifference in height between the lowestand the highest point in a 60 x 300 m pspis 24.4 ± 7.2 m (average ± sd, n= 18). Mostof the area (77%) occurs on slopes,whereas roughly equal proportions areoccupied by valleys, low flat areas, highflat areas and ridges (varying between 4and 8% of the total area).
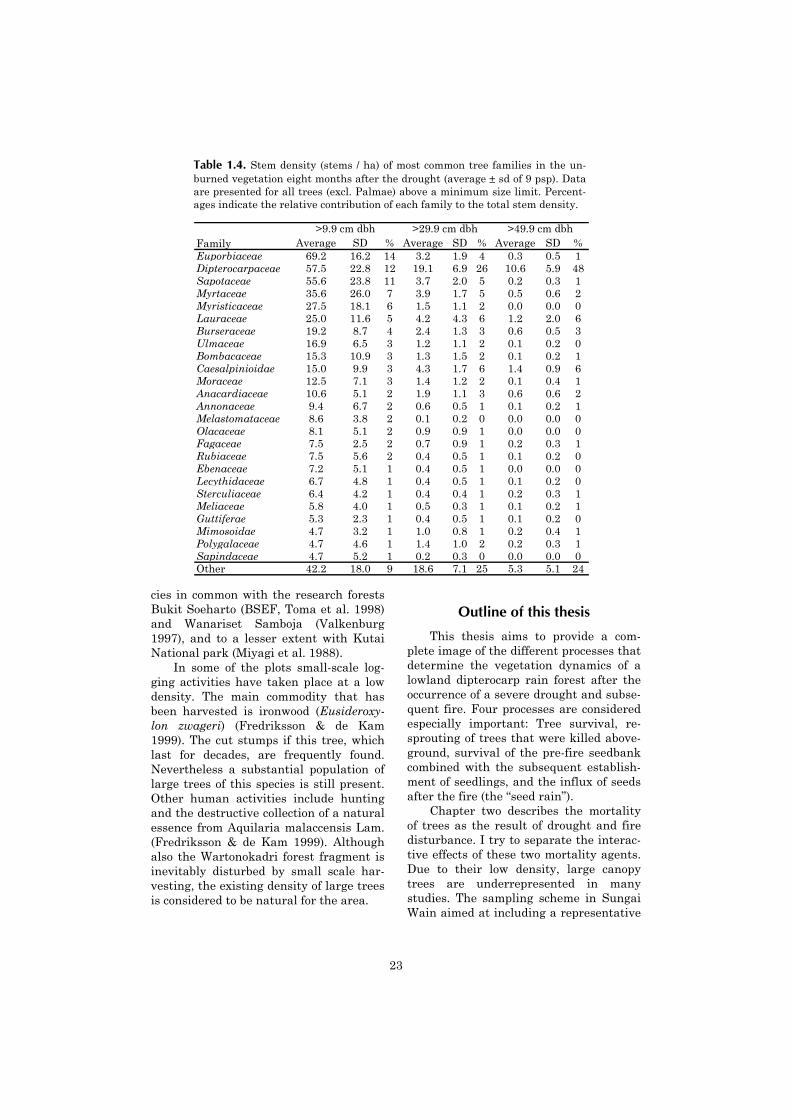
The canopy of the undisturbed dip-terocarp forest is irregular and quiteopen. Some of the poorly-drained valleysand lower parts of the area are infre-quently flooded and carry a forest ofshorter stature in which Dipterocar-paceae do not dominate. The abundanceof tree families in the plots is typical fordipterocarp rain forest (Table 1.4). Above10 cm dbh, the most common families areEuphorbiaceae, Dipterocarpaceae andSapotaceae. The relative dominance ofDipterocarpaceae increases substantiallyin the larger size classes.
No single tree species (stems >10 cmdbh) dominates the vegetation (Table 1.5).Together, the 25 most common speciesform 40% of the total stem density. Thedominance of Dipterocarpaceae in thelarger size classes is for a substantial partcaused by Shorea laevis. Above 50 cmdbh, Shorea laevis is by far the mostabundant, while Dipterocarpus confertus,Eusideroxylon zwageri, Koompassiamalaccensis, Shorea smithiana, Diptero-carpus humeratus and Dipterocarpus cor-nutus are also fairly abundant. Emergenttrees of Shorea laevis form nearly mono-dominant stands on some of the ridges inthe reserve. Sungai Wain has many spe-
PSP 07 (ub)
-40
-20
020
020406080100
120
140
160
180
200
220
240
260
280
300
Figure 1.6. Example of the topography of a permanent sample plot. All distances are in meters.
23
cies in common with the research forestsBukit Soeharto (BSEF, Toma et al. 1998)and Wanariset Samboja (Valkenburg1997), and to a lesser extent with KutaiNational park (Miyagi et al. 1988).
In some of the plots small-scale log-ging activities have taken place at a lowdensity. The main commodity that hasbeen harvested is ironwood (Eusideroxy-lon zwageri) (Fredriksson & de Kam1999). The cut stumps if this tree, whichlast for decades, are frequently found.Nevertheless a substantial population oflarge trees of this species is still present.Other human activities include huntingand the destructive collection of a naturalessence from Aquilaria malaccensis Lam.(Fredriksson & de Kam 1999). Althoughalso the Wartonokadri forest fragment isinevitably disturbed by small scale har-vesting, the existing density of large treesis considered to be natural for the area.
Outline of this thesis
This thesis aims to provide a com-plete image of the different processes thatdetermine the vegetation dynamics of alowland dipterocarp rain forest after theoccurrence of a severe drought and subse-quent fire. Four processes are consideredespecially important: Tree survival, re-sprouting of trees that were killed above-ground, survival of the pre-fire seedbankcombined with the subsequent establish-ment of seedlings, and the influx of seedsafter the fire (the “seed rain”).
Chapter two describes the mortalityof trees as the result of drought and firedisturbance. I try to separate the interac-tive effects of these two mortality agents.Due to their low density, large canopytrees are underrepresented in manystudies. The sampling scheme in SungaiWain aimed at including a representative
Table 1.4. Stem density (stems / ha) of most common tree families in the un-burned vegetation eight months after the drought (average ± sd of 9 psp). Dataare presented for all trees (excl. Palmae) above a minimum size limit. Percent-ages indicate the relative contribution of each family to the total stem density.
Family Average SD % Average SD % Average SD %Euporbiaceae 69.2 16.2 14 3.2 1.9 4 0.3 0.5 1Dipterocarpaceae 57.5 22.8 12 19.1 6.9 26 10.6 5.9 48Sapotaceae 55.6 23.8 11 3.7 2.0 5 0.2 0.3 1Myrtaceae 35.6 26.0 7 3.9 1.7 5 0.5 0.6 2Myristicaceae 27.5 18.1 6 1.5 1.1 2 0.0 0.0 0Lauraceae 25.0 11.6 5 4.2 4.3 6 1.2 2.0 6Burseraceae 19.2 8.7 4 2.4 1.3 3 0.6 0.5 3Ulmaceae 16.9 6.5 3 1.2 1.1 2 0.1 0.2 0Bombacaceae 15.3 10.9 3 1.3 1.5 2 0.1 0.2 1Caesalpinioidae 15.0 9.9 3 4.3 1.7 6 1.4 0.9 6Moraceae 12.5 7.1 3 1.4 1.2 2 0.1 0.4 1Anacardiaceae 10.6 5.1 2 1.9 1.1 3 0.6 0.6 2Annonaceae 9.4 6.7 2 0.6 0.5 1 0.1 0.2 1Melastomataceae 8.6 3.8 2 0.1 0.2 0 0.0 0.0 0Olacaceae 8.1 5.1 2 0.9 0.9 1 0.0 0.0 0Fagaceae 7.5 2.5 2 0.7 0.9 1 0.2 0.3 1Rubiaceae 7.5 5.6 2 0.4 0.5 1 0.1 0.2 0Ebenaceae 7.2 5.1 1 0.4 0.5 1 0.0 0.0 0Lecythidaceae 6.7 4.8 1 0.4 0.5 1 0.1 0.2 0Sterculiaceae 6.4 4.2 1 0.4 0.4 1 0.2 0.3 1Meliaceae 5.8 4.0 1 0.5 0.3 1 0.1 0.2 1Guttiferae 5.3 2.3 1 0.4 0.5 1 0.1 0.2 0Mimosoidae 4.7 3.2 1 1.0 0.8 1 0.2 0.4 1Polygalaceae 4.7 4.6 1 1.4 1.0 2 0.2 0.3 1Sapindaceae 4.7 5.2 1 0.2 0.3 0 0.0 0.0 0Other 42.2 18.0 9 18.6 7.1 25 5.3 5.1 24
>9.9 cm dbh >29.9 cm dbh >49.9 cm dbh
24
sample of trees above 30 cm diameter atbreast height.
The level of mortality does not onlyset the density of the remaining seedsources, it also determines the abioticenvironment after the fire. Chapter threestarts by analysing the light availabilityafter the fire. Subsequently it aims atproviding an overview of the dynamics ofdifferent post-fire functional groups, andto estimate the relative importance ofdifferent vegetation processes that are atwork.
Chapter four continues with a moredetailed investigation of tree sproutingcapacity, which appears to be an impor-tant component of the post-fire demo-
graphics of shade tolerant species. Thechapter describes the sprouting capacityof saplings after experimental clipping inthe unburned forest. It aims at under-standing why differences in sproutingcapacity between shade tolerant tree spe-cies occur. An explanation is sought in thespecies-specific availability of non-structural carbohydrates.
Chapter five investigates the verticalcomposition of the soil seed bank, and theeffects of fire on the density of seeds. Bystudying seed germination under experi-mental conditions, we try to understandthe germination sensitivity of seeds todifferent environmental factors.
Table 1.5. Stem density (trees/ha) of most common species in the unburned vegetation, eightmonths after the drought (average ± sd of 9 psp). Data are presented for all trees above aminimal size limit. Percentages indicate the relative contribution of each species to the totalstem density. * For Borassodendron (Palmae), no dbh was measured. All individuals were<29.9 cm dbh. ** These species were included in the table because they are relatively commonin the size class >49.9 cm dbh.
Species Aver. SD % Aver. SD % Aver. SD %Madhuca kingiana (Brace) H.J.Lam 27.2 35.6 6 1.2 0.9 2Gironniera nervosa Planch 14.7 6.2 3 1.2 1.1 2 0.1 0.2 0Macaranga lowii King ex Hook.f. 12.2 6.5 3Borassodendron cf. borneensis* 11.1 13.0 2Shorea laevis Ridl. 10.3 7.6 2 7.7 4.6 13 5.2 3.6 29Eugenia tawahense 10.3 13.2 2 0.7 0.9 1Payena lucida (G.Don) DC. 10.0 9.0 2 1.1 1.5 2Koompassia malaccensis Maing. Ex Benth. 9.2 9.3 2 2.3 1.5 4 0.7 0.8 4Durio acutifolius (Mast.) Kosterm. 8.9 8.0 2 0.1 0.2 0Eusideroxylon zwageri Teijsm. & Binn. 7.2 9.4 2 2.7 3.9 4 1.0 2.0 5Drypetes kikir Airy Shaw 6.9 7.7 1 0.9 0.9 1 0.1 0.2 0Shorea ovalis (Korth.) Blume 6.4 5.6 1 1.1 0.8 2 0.3 0.4 2Dipterocarpus confertus Sloot. 5.8 5.7 1 2.3 1.7 4 1.1 0.9 6Vatica umbonata (Hook.f.) Burck 5.3 4.4 1 0.2 0.4 0Gymnacranthera farquhariana (Hook.f. & Thomson) Warb.
4.7 8.5 1 0.2 0.4 0
Shorea parvifolia Dyer 4.7 3.4 1 0.9 0.9 1 0.2 0.3 1Dipterocarpus tempehes Slooten 4.7 10.0 1 0.2 0.4 0 0.1 0.2 1Dacryodes rostrata (Blume) H.J.Lam 4.4 5.1 1Chaetocarpus castanocarpus (Roxb.) Thwaites 4.2 6.1 1 1.2 1.0 2 0.2 0.3 1Dipterocarpus cornutus Dyer 3.9 5.3 1 0.9 1.2 1 0.5 0.7 3Ochanostachys amentacea Mast. 3.6 2.2 1 0.5 0.5 1Diospyros borneensis Hiern 3.6 3.6 1Aporosa dioica (Roxb.) Mull.Arg. 3.6 5.9 1Barringtonia macrostachya Jack 3.6 4.7 1 0.3 0.4 1Madhuca pierrei Van der Assem 3.6 5.3 1 0.4 0.9 1 0.1 0.2 0Gonystylus affinis Radlk 3.3 5.9 1 0.1 0.2 0Shorea smithiana Sym ** 2.2 1.5 0 1.0 0.6 2 0.7 0.7 4Dipterocarpus humeratus Slooten ** 0.6 1.1 0 0.8 2.4 1 0.7 2.0 4Other 278.3 49.7 59 32.0 53 7.3 40
> 9.9 cm dbh > 29.9 cm dbh >49.9 cm dbh

25
Shortly after the fires, the Indonesiangovernment issued a regulation, allowingconcessionaires to harvest dead standingtrees in their burned concession forests.Chapter six warns for the potentiallyharmful consequences of this practice,arguing that this so-called salvage fellingis detrimental if the aim is to maintain asustainable forestry concession or indeedany forest cover at all.
In chapter seven I present a synthesisof the preceding chapters, and return tothe question what is the value of non-fireand fire succession theories for under-standing post-fire vegetation dynamics ina dipterocarp rain forest.
Acknowledgements
I thank M.J.A. Werger and D. Sheilfor their critical review of an earlier ver-sion of this chapter.
26
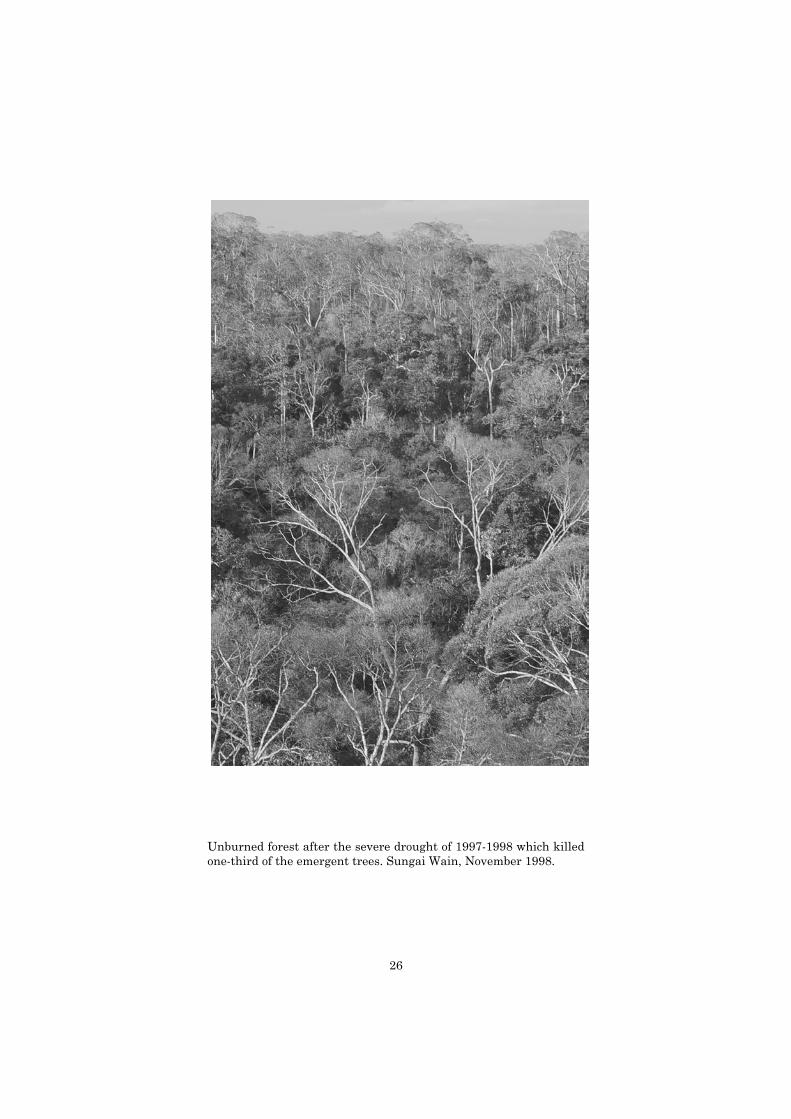
Unburned forest after the severe drought of 1997-1998 which killedone-third of the emergent trees. Sungai Wain, November 1998.
2Separating the effects of severe drought
and subsequent fire on tree survivalin a lowland dipterocarp rain forest
in East Kalimantan, Indonesia
With Douglas Sheil
Abstract Over the last decades, extreme droughts and fires damaged extensive areas of forest in Indo-
nesia. Notwithstanding the environmental impact of such large-scale disturbances, their effect ontree mortality has not been investigated in much detail in Southeast Asia. Especially data on theperformance of very large trees are generally lacking. This study provides data on the patterns oftree mortality in a lowland rainforest in East Kalimantan after the drought of 1997-1998, which isone of the most extreme droughts that has so far been recorded in tropical ecological literature.Second, it gives a detailed account of the effects of the fire that followed at the end of this drought.
Eighteen permanent sample plots (psp) were established after the drought and fire in ninepairs of one unburned and one burned psp. This layout enabled us to separate the effects of droughtand fire, which are entangled in the burned forest. The 1.8 ha size of each psp made accurate esti-mates of mortality among large trees possible. The psp were monitored twice, 8 months and 21months after the disturbances.
Tree mortality was high in the first eight months after the drought (19.1 ± 4.4% dead trees >10cm dbh). We observed a high level of retarded mortality, resulting in 28.6 ± 4.2% dead trees after21 months. Tree mortality after the drought was positively related to dbh. The burned forestshowed an even much higher mortality (60.6 ± 10.4% dead trees after eight months, and 74.4 ±8.7% after 21 months). By subtracting mortality after drought from mortality after drought x fire ineach pair of adjacent psp, we estimated that the fire was responsible for roughly 2/3 of the mortal-ity in the burned psp. Fire mortality was negatively related to dbh: Drought x fire resulted innearly complete mortality for individuals <10 cm dbh, whereas fire did not cause a significant in-crease in tree mortality >70 cm dbh. For the community as a whole the relation between dbh andfire mortality could be explained in terms of average bark thickness per dbh class.
For trees >30 cm dbh, mortality after drought and drought x fire ranged widely between spe-cies. Trees with a high wood density had a higher drought survival. For the trees in this size class,species-specific bark thickness did not explain the observed patterns in mortality after fire.
We related the intensity of occasional droughts in different everwet tropical forest sites (meas-ured as the cumulative water deficit) with the percentage of drought-induced mortality, and foundthat below a cwd of 100-200 the increase in mortality is low, whereas it rapidly increases when thecwd becomes larger. We argue that the soil water reserve acts as a buffer which delays the actualonset of water stress for trees after a rainfall deficit has started to develop.
We conclude that the combined effect of drought and fire causes great damage to the forestvegetation, partly because the two disturbances act on different strata of the vegetation. The highlevel of retarded mortality that we observed underscores the necessity of long-term observations inorder to understand the effects of such severe disturbances.

28
Keywords: Drought, fire, large-scale disturbance, lowland dipterocarp rain forest,Southeast Asia, tree mortality.
Introduction
Extreme droughts and the repeatedoccurrence of fires have formed an in-creasing threat to the lowland rain forestsof Indonesia over the past decades. Onthe island of Borneo, dry spells (definedas periods in which the monthly rainfallremains below 100 mm) of three to fourmonths have occurred over the past 50 to100 years in most locations (Walsh 1996b, Walsh & Newbery 1999). They are tosome extent related to the El Niño-Southern Oscillation (ENSO) phenome-non. During the two extreme ENSOevents in 1982–1983 and 1997–1998,these long droughts were accompanied bysubsequent widespread forest fires. In theprovince of East Kalimantan, 2.6 millionha of forests burned during the drought of1997-1998 (Hoffmann et al. 1999, Siegertet al. 2001). Despite these massive im-pacts few studies have documented theimpact of drought and fire on the forestvegetation.
Increased tree mortality in tropicalrain forest caused by an exceptionaldrought has been observed on severaloccasions (Leighton & Wirawan 1986,Condit et al. 1995, Nakagawa et al. 2000,Williamson et al. 2000). However, theseverity of these “extreme” droughts ishighly variable. With three dry months,followed by three wet (but less than aver-age) months and a second dry period ofanother three months, this study reportsthe effects of the most severe drought intropical rain forest modern ecological lit-erature.
Fire can enter a tropical rain forestonly after a dry period during which thesoil litter layer dries out and becomesflammable (Uhl et al. 1988). Inside a for-est with a closed canopy, a burn charac-teristically takes the form of a ‘surfacefire’, which is largely confined to this drylitter layer. The low available fuel load,relatively high fuel humidity and lowwind speed inside the forest limit the fire
intensity and the speed at which itspreads (Uhl et al. 1988). Virtually allwoody plants that are killed remainstanding after the fire (Leighton & Wi-rawan 1986, Woods 1988). High levels oftree mortality have nonetheless been re-ported in primary forests after such fireevents (Leighton & Wirawan 1986, Woods1988, Kinnaird & O’Brien 1998).
Since forest fires are confined to longperiods of drought, fire induced tree mor-tality cannot easily be separated frommortality resulting from the precedingdrought. The separate effects of droughtand fire on tree survival cannot readily bestudied on the same location, because themortality caused by the drought is not yetquantifiable by the time the subsequentfire burns the area. The comparison of aburned forest with a nearby unburnedforest is therefore the best available solu-tion. Separating the effect of fire from theeffect of drought on tree mortality bymaking such a comparison between bor-dering areas is the main objective of thispaper.
In the current study we investigatedthe impact of an extreme drought on thevegetation. We monitored the changes inthe overall stand structure of the forest.We analysed the influence of tree size andtree species, on mortality. We expected tofind a negative correlation between treesize and mortality rate because largertrees with a deeper root system havemore prolonged access to soil water(Wright 1992). Second, we expected thatheavy-wooded species would have a lowermortality rate, because wood density iscorrelated with prevention of xylem im-plosion during drought stress, especiallyfor wood densities >0.7 g cm-3 (Hacke etal. 2001). We compared the effect of thedrought on tree mortality with otheravailable studies in everwet tropical for-est, in order to explore the relationship
29
between the severity of a drought and theresulting increase in tree mortality.
We investigated how fire-induced treemortality in a primary forest is influencedby tree size and species. Mortality hasbeen correlated with bark insulationproperties, and especially bark thickness(Gill & Ashton 1968, Vines 1968, Uhl &Kauffman 1990, Pinard & Huffman1997). We expected to find a positive cor-relation between tree size and barkthickness, as well as substantial species-specific differences in bark thickness. Asa consequence, we hypothesised tree mor-tality after fire to be highest amongstsmall trees and amongst thin-barked spe-cies.
Because retarded mortality has beenobserved after large-scale disturbances(Burslem, Whitmore & Brown 2000, alsosee Pedersen 1998), we monitored thepatterns of mortality over a period ofnearly two years following the distur-bance. Due to the large proportion of deadtrees that remained upright after thedrought and the fire we expected an in-crease in tree fall during this period. Thepatterns of tree fall in relation to dbhwere studied in both unburned andburned forest.
Study sites
The main research site is a watercatchment reserve of circa 100 km2, calledSungai Wain protection forest near toBalikpapan, East Kalimantan (1º16’ Sand 116º54’ E) at 15 km from the Strait ofMakasar (Figure 1.2). The largest part ofthis area was originally covered withlowland dipterocarp rain forest. A moredetailed description of the vegetation isgiven in chapter 1. Some of the poorlydrained valleys and lower parts of thearea carry a shorter stature, infrequentlyflooded forest. The topography of the re-serve consists of gentle to sometimessteep hills, and is intersected by severalsmall rivers. The area varies in altitudefrom 40 to 140 m.a.s.l. Alisols, which arestrongly weathered, very deep, infertilesoils with a high fraction of loam and clayform the major soil type (FAO/Unesco/ISRIC 1988, van Bremen et al.1990, MacKinnon et al. 1996).
Additional data on tree mortalitywere collected in the protected WanarisetWartonokadri research forest (10 kmNortheast of the Sungai Wain forest).This is a forest fragment of 50 ha sur-rounded on three sides by degraded forestand agricultural fields, and on the fourth
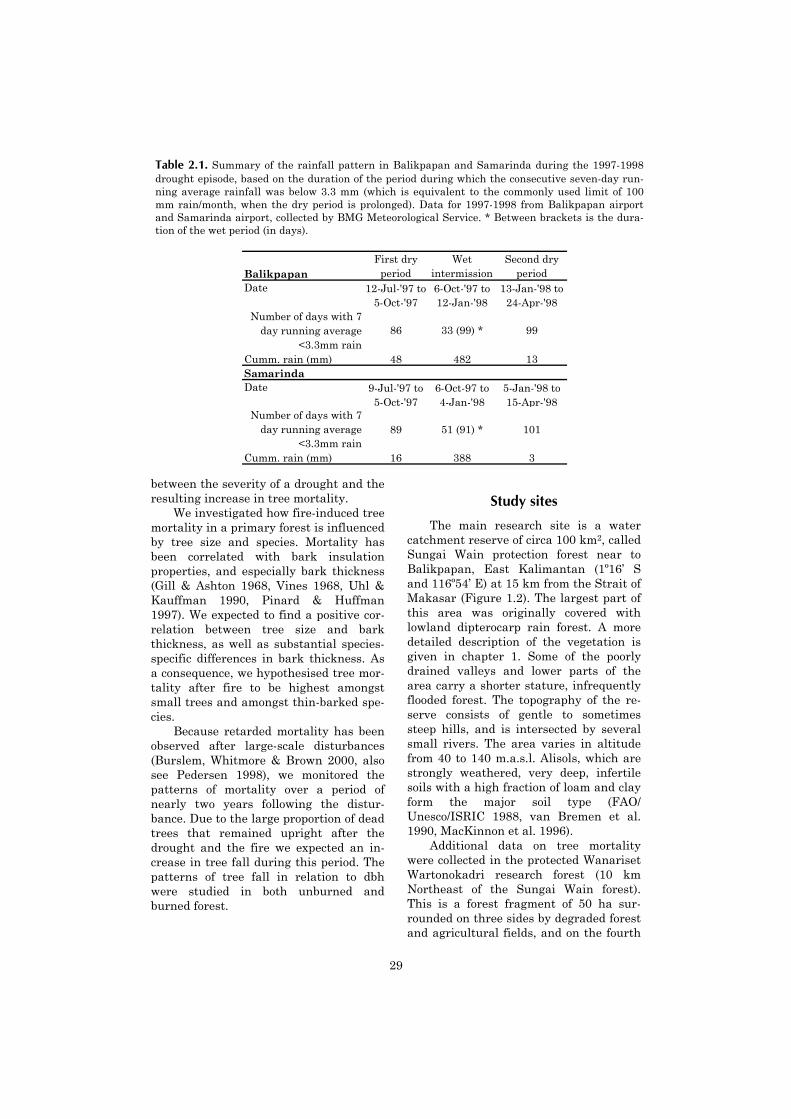
Table 2.1. Summary of the rainfall pattern in Balikpapan and Samarinda during the 1997-1998drought episode, based on the duration of the period during which the consecutive seven-day run-ning average rainfall was below 3.3 mm (which is equivalent to the commonly used limit of 100mm rain/month, when the dry period is prolonged). Data for 1997-1998 from Balikpapan airportand Samarinda airport, collected by BMG Meteorological Service. * Between brackets is the dura-tion of the wet period (in days).
BalikpapanFirst dry
periodWet
intermission Second dry
periodDate 12-Jul-'97 to
5-Oct-'976-Oct-'97 to 12-Jan-'98
13-Jan-'98 to 24-Apr-'98
Number of days with 7day running average
<3.3mm rain86 33 (99) * 99
Cumm. rain (mm) 48 482 13SamarindaDate 9-Jul-'97 to
5-Oct-'976-Oct-97 to 4-Jan-'98
5-Jan-'98 to 15-Apr-'98
Number of days with 7day running average
<3.3mm rain89 51 (91) * 101
Cumm. rain (mm) 16 388 3

30
side is separated from another forestpatch by a narrow road. The altitude, soiltypes, topography and rainfall are similarto the Sungai Wain forest. Although alsothis fragment is inevitably disturbed bysmall scale harvesting, the existing den-sity of large trees is considered to benatural for the area.
Climate and fire regime
The average yearly rainfall is 2790mm (Figure 1.3) (Vose et al. 1992). Onaverage, the area does not experience lessthan 100 mm monthly rainfall. Duringthe period 1948-1980, short dry periods(defined as having a monthly rainfall be-low 100 mm) were frequent (30 x onemonth, and 3 x two months), and mostfrequently occurred between Septemberand November. Longer droughts were notrecorded. After 1980, the pattern changeddramatically. Extensive droughts oc-curred in 1982-1983 and in 1997-1998,which were related to the occurrence ofextreme ENSO events.
For a detailed characterisation of thedrought in 1997-1998, we calculated theperiod during which the seven-day run-ning average rainfall remained below 3.3mm. This is equivalent to the commonlyused limit of 100 mm rain per monthwhen the dry period is prolonged. Thedrought consisted of two periods, whichwere similar in Balikpapan and Sama-rinda (Figure 1.3, Table 2.1). The firstdrought lasted for 12-13 weeks. Duringthis period, precipitation was limited to atotal of 16 to 48 mm. The following 13-14weeks were wetter, and experienced atotal of 388 to 482 mm rainfall. The wetintermission was interrupted by frequentshort droughts: In Balikpapan 33 out of99 days had a 7-day running averagerainfall below 3.3 mm, and in Samarinda51 out of 91 days. After this wet intermis-sion a second drought of more than 14weeks followed, with a cumulative pre-cipitation of 3 to 13 mm. The droughtended around 20 April 1998.
To enable a comparison with otherstudies, for which only the relativelycrude monthly rainfall patterns are avail-able, we also analysed the monthly rain-
fall data. To estimate the intensity of thedrought, the cumulative water deficit(cwd) was calculated. We developed thecwd as a refined version of the cumulativerainfall deficit (the sum of the amounts bywhich the rainfall of each month in a drymonth sequence fell below 100 mm)(Walsh & Newbery 1999). In the cwd in-dex, the rainfall deficit is gradually coun-terbalanced by any surplus precipitationabove 100 mm per month, instead of re-turning to zero instantaneously, once thethreshold of 100 mm monthly precipita-tion is reached.
The 1998 fire in the Sungai Wainprimary forest was a typical surface fire,with an estimated average flame height of0.5 m, an estimated depth of 20-30 cm, anestimated speed of 10-15 m/h (MvN pers.obs.), and a calculated fire intensity ofcirca 60 kW/m (Alexander 1982). A 0.5 mwide firebreak was enough to stop thefire, after which permanent control wasnecessary to prevent its escape. One thirdof the total area in the reserve burnedduring the 1982-1983 dry episode andburned again in 1997-1998 (Figure 1.2).Another third burned for the first time inMarch – April 1998, during the last partof the dry period. A core area of one thirdof the total area (3.5 x 8 km) was savedfrom the fire. The research was performedin the unburned area and the area thatburned once.
Material and methods
In the Sungai Wain forest (SW for-est), 18 permanent sample plots (psp) of60 x 300 m (1.8 ha) each were laid out inunburned forest and in forest that burnedonce in 1998 (Figure 1.2). The psp werelaid out in nine pairs, each pair of pspadjacent to each other over a man-madefirebreak between burned and unburnedforest. Thus, each pair of psp forms onecontiguous transect of 60 x 600 m half inburned and half in unburned forest. Thepsp are spread over a total area of circa20 km2. In those areas where the psp arelocated, the firebreak does not correspondto any topographical feature.
Two surveys were done in the twoyears following the drought and fire. The

31
average date of measurement of the firstsurvey was December 1998 (eight monthsafter the drought and fire). During thissurvey, all dead and living stems largerthan 28 cm dbh (diameter measured at1.3 m height) were labelled and assessed.In each psp a subplot of 20 x 200 m wasestablished, in which all trees between 8cm and 28 cm dbh were assessed and la-belled (Table 2.2). The lower limits of 8cm dbh and 28 cm dbh were chosen inorder to avoid the omission of trees with adbh close to respectively 10 cm and 30 cm.In the analyses of the responses of trees,the lower limits of 10 cm and 30 cm dbhare used. Palmae above 8 cm dbh werelabelled, but not included in the analysisunless specifically mentioned.
For trees which had protruberancesat 1.30 m (buttresses or other irregulari-ties), the diameter (Dx) was measured at30 cm above the protruberances (Sheil1995). The diameter was measured with ameasurement tape up to a height of 2.5m. Above this height, a ruler attached toa pole was rested against the stem andread from 10 m distance, following themethod described in Alder and Synnott(1992).
If the diameters (Dx) collected above1.30 m height were used as an uncor-rected proxy for dbh, stem tapering wouldintroduce a systematic underestimate ofstem size in the dataset. To avoid such asystematic error, we estimated the rela-tion between dbh and Dx to correct forstem tapering. For a set of 43 trees be-tween 25 and 82 cm dbh with a straightstem, the diameter at 130 cm (dbh) wasmeasured with a measuring tape, and thediameter (Dx) was estimated with themethod described above (Alder & Synnott1992) at 1.30 m, 2.50 m and 4.00 mheight. We then calculated the ratio be-
tween dbh and Dx. We predicted that boththe dbh of the tree and the height ofmeasurement would influence the ratio(Dx /dbh). A multiple linear regressionrevealed that for a fixed height of meas-uring, the ratio (Dx /dbh) was independ-ent of dbh (multiple regression anova, n=43, F= 1.13, sign = 0.35). Therefore dbhwas not introduced as an independentvariable in the equation. Curve estima-tion showed that the relationship betweenthe ratio (Dx /dbh) and height of meas-urement was best predicted by a powerfunction with the form (Dx /dbh)= 1.1816 *h –0.1168 (R2= 0.40, df= 123, F= 80.6, p<0.001). This function was subsequentlyused to estimate the dbh of stems whichhad been measured above 1.30 m high.We estimated that, if the correction wasnot applied, an underestimation of 9%and 16% in basal area would have beenmade for trees that were measured re-spectively at 2.0 m height and 4.0 mheight.
In 16 unburned and 51 burned sub-plots of 100 m2 each, which were evenlyspread over the psp, all (dead and living)seedlings and saplings (stem length >50cm and dbh <8 cm) were assessed andlabelled (Table 2.2). Of these plants, thediameter was measured at 25 cm aboveground level with a calliper, this istermed the diameter at ankle height(dah).
The position of each tree in the pspwas determined, and the topography ofeach psp was mapped with a clinometer(Suunto) in steps of 10 m in the 20 x 200m subplots and 20 m in the 60 x 300 mplots. Individuals with a leafless crownwere considered dead in the sense thatthey had been killed aboveground. Thisincluded individuals that were re-sprouting from the roots or from the base
Number of individualsDbh (cm) Dbh (cm)
Treatment Psp < 8 Psp 8 > x > 28 > 28Drought 1, 7, 9, 11, 13,
15, 171284 1, 3, 5, 7, 9,
11, 13, 15, 172654 1560
Drought x fire 2, 4, 6, 8, 10, 12, 14, 16, 18
3589 2, 4, 6, 8, 10, 12, 14, 16, 18
2214 1497
Table 2.2. Psp in Sungai Wain and numbers of individuals per dbh category.

32
of the stem. The resprouting of stems thatare killed above ground is discussed inchapter 3.
Local experts trained at the herbar-ium of the nearby Wanariset Sambodjaresearch station identified living trees, aswell as dead trees larger than 28 cm dbhbelonging to 10 common species (Table2.3). Dead trees below 28 cm were notidentified because the result was expectedto be taxonomically difficult and unreli-able. Because of this, species-specific mor-tality is analysed only for trees above 30cm dbh. Specific wood densities of thesespecies were obtained from the literature(Burgess 1966, Suzuki 1999). Nomencla-ture follows Sidiyasa et al. 1999.
The average date of measurement ofthe second survey was January 2000 (21months after the drought and fire). Inthis survey, we re-assessed whether treeswere living or dead. We did not assessdbh during this survey. We also observedresprouting of trees and tree fall. Tree fallincluded both uprooting and stem break-age, of which the latter was defined as astem which lacked primary branches (asnapped stem cannot easily be discernedfrom a stem that has lost all its primarybranches).
In the Wanariset Wartonokadri for-est, measurements were taken in fiveparallel transects of 10 x 200 m spaced atdistances of 100 m (Slik et al. 2001). 599trees above 10 cm dbh were labelled andidentified in September 1997, during theearly phase of the drought. Tree mortalitywas re-measured four months after theend of the drought (August 1998) and
again 22 months after the drought (Feb-ruary 2000). To ensure that the Wartono-kadri forest and the Sungai Wain forestcarried a similar vegetation type prior tothe disturbances, which would justify thecombined use of some of the data from thetwo sites, we tested for differences in theoverall stand structure between the twosites.
The first survey in Wartonokadriprovided us with an estimate of the aver-age percentage of dead trees per transectbefore the onset of the drought. Theseresults were used to estimate the numberof living stems prior to the drought in theSungai Wain Forest, where plots wereestablished only after the disturbance.We estimated the density of living stemsbefore the drought in Sungai Wain, bysubtracting the percentage of dead treesas observed in the earliest survey in theWanariset forest from the total stem den-sity (i.e. the sum of living and deadstems) in the Sungai Wain forest after thedrought.
Fire occurs only in unison with an ex-tended drought, and as a result the treemortality that is recorded after fire is acombination of drought-induced mortalityand truly fire-induced mortality. Our aimis not only to measure tree mortality asthe result of the combined effect ofdrought and fire, but also to partition theeffects of these two factors. By subtract-ing the former from the latter we proposethat we can quantify the additional mor-tality due to the influence of fire on thedrought impacted forest stand. Percent-ages mortality were measured per psp.
Table 2.3. Tree species of which living and dead individuals above 28 cm dbhwere identified in the unburned and burned plots.
Species Family AbbreviationArtocarpus anisophyllus Miq. Moraceae Arto anisDipterocarpus confertus Sloot. Dipterocarpaceae Dipt confDipterocarpus cornutus Dyer Dipterocarpaceae Dipt cornDrypetes kikir Airy Shaw Euphorbiaceae Dryp kikiEusideroxylon zwageri Teijsm. & Binn. Lauraceae Eusi zwagGironniera nervosa Planch. Ulmaceae Giro nervKoompassia malaccensis Maing. Ex Benth. Caesalpinioidae Koom malaMadhuca kingiana (Brace) H.J.Lam Sapotaceae Madh kingShorea laevis Ridl. Dipterocarpaceae Shor laevShorea ovalis (Korth.) Blume Dipterocarpaceae Shor oval
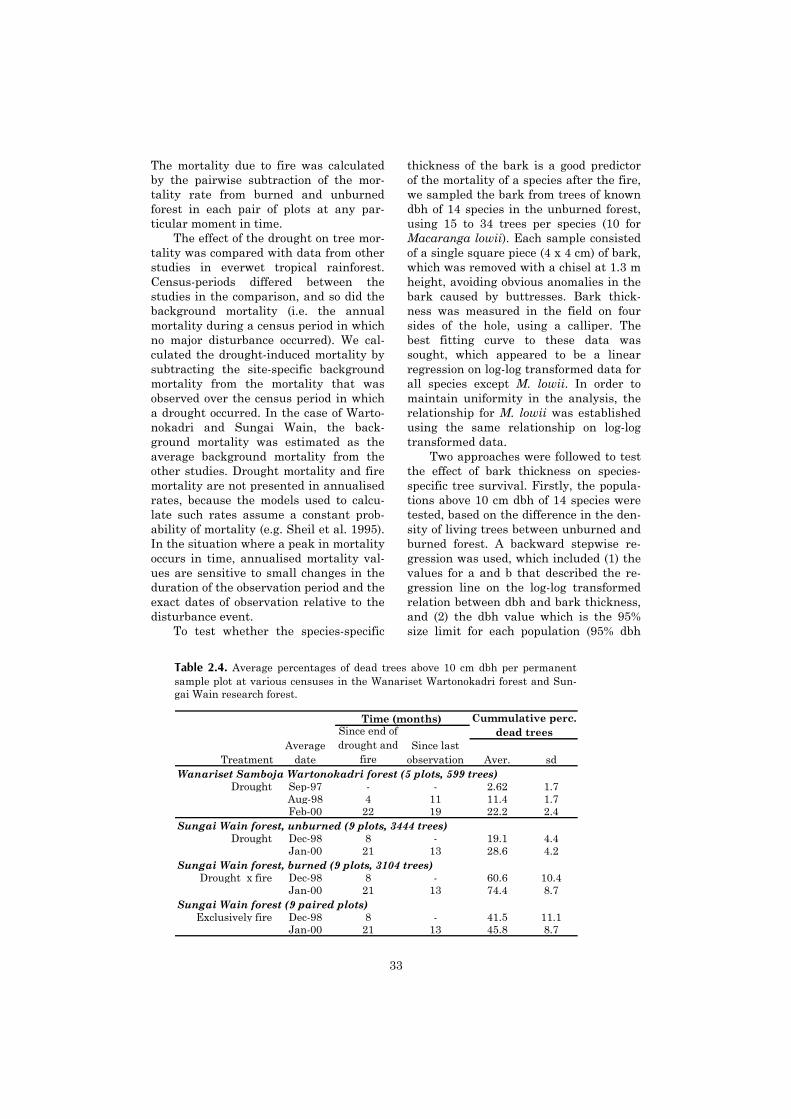
33
The mortality due to fire was calculatedby the pairwise subtraction of the mor-tality rate from burned and unburnedforest in each pair of plots at any par-ticular moment in time.
The effect of the drought on tree mor-tality was compared with data from otherstudies in everwet tropical rainforest.Census-periods differed between thestudies in the comparison, and so did thebackground mortality (i.e. the annualmortality during a census period in whichno major disturbance occurred). We cal-culated the drought-induced mortality bysubtracting the site-specific backgroundmortality from the mortality that wasobserved over the census period in whicha drought occurred. In the case of Warto-nokadri and Sungai Wain, the back-ground mortality was estimated as theaverage background mortality from theother studies. Drought mortality and firemortality are not presented in annualisedrates, because the models used to calcu-late such rates assume a constant prob-ability of mortality (e.g. Sheil et al. 1995).In the situation where a peak in mortalityoccurs in time, annualised mortality val-ues are sensitive to small changes in theduration of the observation period and theexact dates of observation relative to thedisturbance event.
To test whether the species-specific
thickness of the bark is a good predictorof the mortality of a species after the fire,we sampled the bark from trees of knowndbh of 14 species in the unburned forest,using 15 to 34 trees per species (10 forMacaranga lowii). Each sample consistedof a single square piece (4 x 4 cm) of bark,which was removed with a chisel at 1.3 mheight, avoiding obvious anomalies in thebark caused by buttresses. Bark thick-ness was measured in the field on foursides of the hole, using a calliper. Thebest fitting curve to these data wassought, which appeared to be a linearregression on log-log transformed data forall species except M. lowii. In order tomaintain uniformity in the analysis, therelationship for M. lowii was establishedusing the same relationship on log-logtransformed data.
Two approaches were followed to testthe effect of bark thickness on species-specific tree survival. Firstly, the popula-tions above 10 cm dbh of 14 species weretested, based on the difference in the den-sity of living trees between unburned andburned forest. A backward stepwise re-gression was used, which included (1) thevalues for a and b that described the re-gression line on the log-log transformedrelation between dbh and bark thickness,and (2) the dbh value which is the 95%size limit for each population (95% dbh
TreatmentAverage
dateSince last
observation Aver. sdWanariset Samboja Wartonokadri forest (5 plots, 599 trees)
Drought Sep-97 - - 2.62 1.7Aug-98 4 11 11.4 1.7Feb-00 22 19 22.2 2.4
Sungai Wain forest, unburned (9 plots, 3444 trees)Drought Dec-98 8 - 19.1 4.4
Jan-00 21 13 28.6 4.2Sungai Wain forest, burned (9 plots, 3104 trees)
Drought x fire Dec-98 8 - 60.6 10.4Jan-00 21 13 74.4 8.7
Sungai Wain forest (9 paired plots)Exclusively fire Dec-98 8 - 41.5 11.1
Jan-00 21 13 45.8 8.7
Since end of drought and
fire
Time (months) Cummulative perc.dead trees
Table 2.4. Average percentages of dead trees above 10 cm dbh per permanentsample plot at various censuses in the Wanariset Wartonokadri forest and Sun-gai Wain research forest.

34
limit). Ninety-five percent of the trees(>10 cm dbh) in a population had a dbhsmaller than this value.
The second test, performed on ninepopulations above 30 cm dbh (of specieswhich could be identified even when theywere dead), was different in the respectthat it was based on the numbers of livingand dead trees in the burned forest.
Results
Stand structure and mortality at thecommunity level
At the first census in the Wartono-kadri forest, taken during the beginningof the drought, the average stem densityof all trees per plot (living and dead, >10cm dbh) was 627 ± 105 trees ha-1 (mean ±sd, n= 5), of which 610 ± 100 trees ha-1
were alive (Figure 2.1 a), which can betranslated into an average of 2.6% ± 1.7dead standing trees per plot (Table 2.4).The basal area of all trees (living anddead, >10 cm dbh) was 32.4 ± 7.0 m2 ha-1
(mean ± sd, n=5) and the basal area of all
living trees was 31.5 ± 6.4 m2 ha-1 (Figure2.1 b). The overall stand structure inWartonokadri was not significantly dif-ferent from Sungai Wain (t-test compari-son between plots in Wartonokadri forest(n= 5) and Sungai Wain forest (n= 18);Tree density of all trees: F= 0.37, p= 0.86,df= 21, and basal area of all trees: F=2.37, p= 0.85, df= 21), which justified theuse of the value of 2.6% as the percentageof standing dead trees present prior to thedrought in the plots in Sungai Wain. Fourmonths after the drought the percentagedead trees had increased to 11.4% ± 1.7 inthe unburned Wartonokadri plots, whichcorresponds to a total mortality of 8.8%over this 11 month period (Table 2.4).There was a high level of retarded mor-tality: The percentage dead stems nearlydoubled between August 1998 and Febru-ary 2000, resulting in 22.2% ± 2.4 deadtrees (19.6% mortality) 22 months afterthe drought.
At the first inventory of the unburnedpsp in Sungai Wain, eight months afterthe extreme drought, the stem density ofall dead and living trees (>10 cm dbh)
Figure 2.1. Stem density and basal area of the permanent sample plots (I) at the onset of thedrought, (II) eight months after the end of the drought and fire and (III) 21 months after the end ofthe drought and fire. (a) Stem density per psp (stems ha-1) of all living trees in Wanariset forest(WA) and Sungai Wain forest (SW). (b) Basal area per plot (m2 ha-1) of all living trees in Wanarisetforest and Sungai Wain forest. All bars represent averages ± sd across psp. The data fromWanariset are based on 5 psp of 0.2 ha each. The data from Sungai Wain are based on 9 psp of 0.4ha for trees <30 cm dbh and 9 psp of 1.8 ha for trees >30 cm dbh. The stem density and basal areaof living trees in Sungai Wain at the onset of the drought are estimates, based on the observationthat of all standing trees (both living and dead) at the first census after the drought, an estimated2.6 % was standing dead at the onset of the drought. Two burned psp were excluded from the cal-culation of the average basal area, because the presence of a few very large trees made them out-liers in this respect.
WA SW (UB) SW (B)
0
10
20
30
40
I I II III I II III
Bas
al a
rea
(m2 h
a-1)
WA SW (UB) SW (B)
0
100
200
300
400
500
600
700
800
I I II III I II III
Ste
m d
ensi
ty (s
tem
s ha
-1) A B
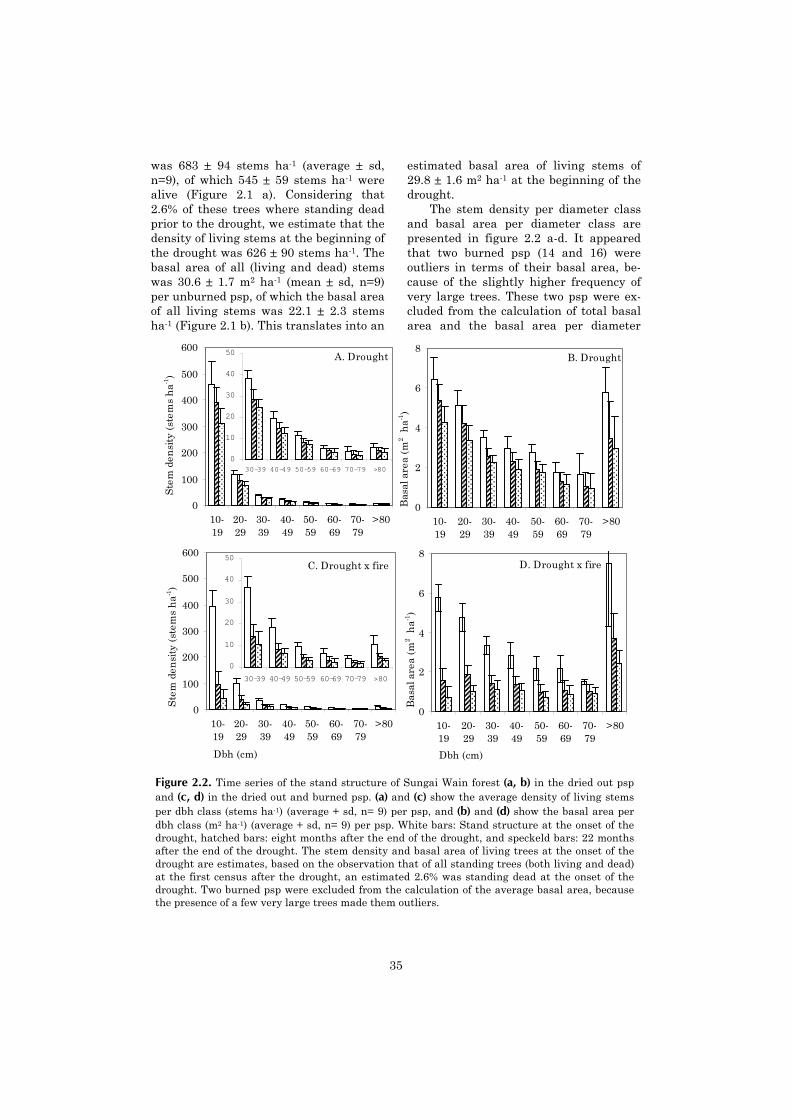
35
was 683 ± 94 stems ha-1 (average ± sd,n=9), of which 545 ± 59 stems ha-1 werealive (Figure 2.1 a). Considering that2.6% of these trees where standing deadprior to the drought, we estimate that thedensity of living stems at the beginning ofthe drought was 626 ± 90 stems ha-1. Thebasal area of all (living and dead) stemswas 30.6 ± 1.7 m2 ha-1 (mean ± sd, n=9)per unburned psp, of which the basal areaof all living stems was 22.1 ± 2.3 stemsha-1 (Figure 2.1 b). This translates into an
estimated basal area of living stems of29.8 ± 1.6 m2 ha-1 at the beginning of thedrought.
The stem density per diameter classand basal area per diameter class arepresented in figure 2.2 a-d. It appearedthat two burned psp (14 and 16) wereoutliers in terms of their basal area, be-cause of the slightly higher frequency ofvery large trees. These two psp were ex-cluded from the calculation of total basalarea and the basal area per diameter
Figure 2.2. Time series of the stand structure of Sungai Wain forest (a, b) in the dried out pspand (c, d) in the dried out and burned psp. (a) and (c) show the average density of living stemsper dbh class (stems ha-1) (average + sd, n= 9) per psp, and (b) and (d) show the basal area perdbh class (m2 ha-1) (average + sd, n= 9) per psp. White bars: Stand structure at the onset of thedrought, hatched bars: eight months after the end of the drought, and speckeld bars: 22 monthsafter the end of the drought. The stem density and basal area of living trees at the onset of thedrought are estimates, based on the observation that of all standing trees (both living and dead)at the first census after the drought, an estimated 2.6% was standing dead at the onset of thedrought. Two burned psp were excluded from the calculation of the average basal area, becausethe presence of a few very large trees made them outliers.
���������
������������
���������
���������
����
������
������
������������������
������
������
���������
������
������
������
������
������������
D. Drought x fire
0
2
4
6
8
10-19
20-29
30-39
40-49
50-59
60-69
70-79
>80
Dbh (cm)
Bas
al a
rea
(m2 h
a-1)
����������������
���������������������
���������������
������������
������������
���������
���������
������������
���������������������
������������������
������������
����������������
������������
���������
���������
��������������������
B. Drought
0
2
4
6
8
10-19
20-29
30-39
40-49
50-59
60-69
70-79
>80
Bas
al a
rea
(m2 h
a-1)
���������������������
������ ��� ��� ��� ��� ���� ���
������������������
������ ��� ��� ��� ��� ��� ���
0
100
200
300
400
500
600
10-19
20-29
30-39
40-49
50-59
60-69
70-79
>80
Ste
m d
ensi
ty (
stem
s h
a-1)
������������
���������
�������� ��� ��� ���
������������
������
������ ���� ��� ���
A. Drought
0
10
20
30
40
50
30-39 40-49 50-59 60-69 70-79 >80
���������
������ ��� ��� ��� ��� �� ���
������
������ ���� ��� ��� ��� ���� ���
0
100
200
300
400
500
600
10-19
20-29
30-39
40-49
50-59
60-69
70-79
>80
Dbh (cm)
Ste
m d
ensi
ty (
stem
s h
a-1)
���������
��������
�������� ��� ����
������
���������
������ ��� ���� ��� ���
C. Drought x fire
0
10
20
30
40
50
30-39 40-49 50-59 60-69 70-79 >80
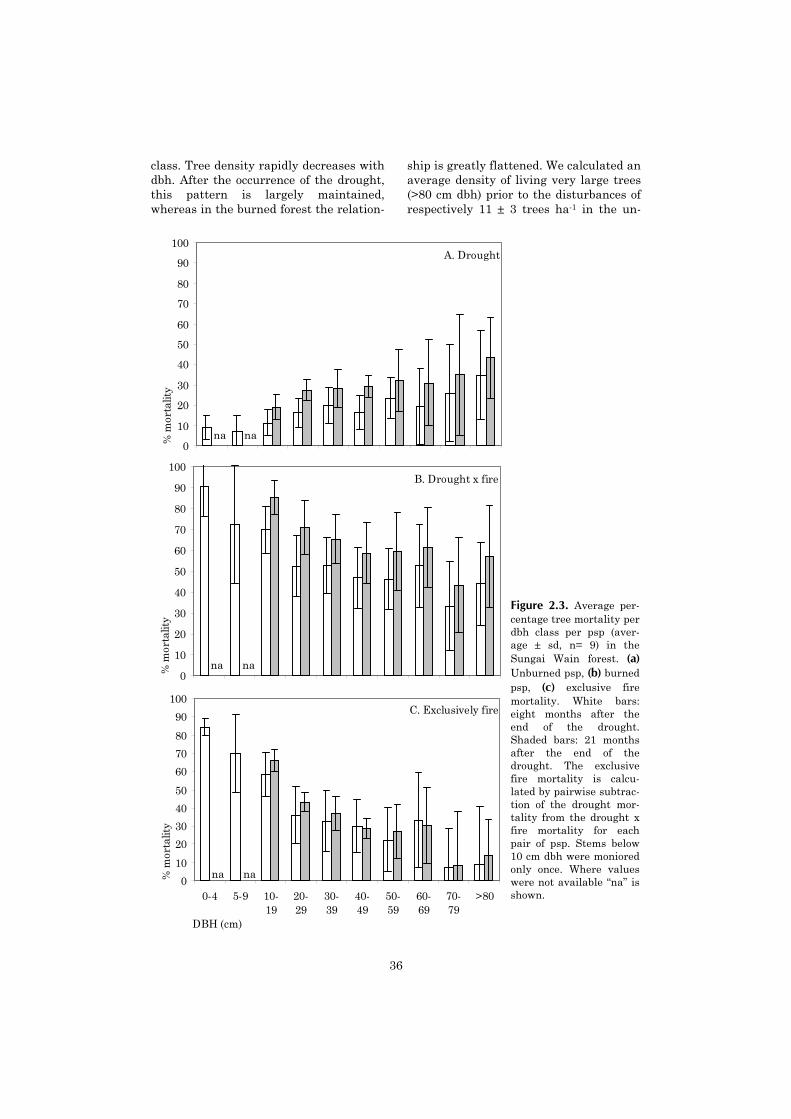
36
class. Tree density rapidly decreases withdbh. After the occurrence of the drought,this pattern is largely maintained,whereas in the burned forest the relation-
ship is greatly flattened. We calculated anaverage density of living very large trees(>80 cm dbh) prior to the disturbances ofrespectively 11 ± 3 trees ha-1 in the un-
A. Drought
0
10
20
30
40
50
60
70
80
90
100
% m
orta
lity
na na
B. Drought x fire
0
10
20
30
40
50
60
70
80
90
100
% m
orta
lity
nana
C. Exclusively fire
0
10
20
30
40
50
60
70
80
90
100
0-4 5-9 10-19
20-29
30-39
40-49
50-59
60-69
70-79
>80
DBH (cm)
% m
orta
lity
nana
Figure 2.3. Average per-centage tree mortality perdbh class per psp (aver-age ± sd, n= 9) in theSungai Wain forest. (a)Unburned psp, (b) burnedpsp, (c) exclusive firemortality. White bars:eight months after theend of the drought.Shaded bars: 21 monthsafter the end of thedrought. The exclusivefire mortality is calcu-lated by pairwise subtrac-tion of the drought mor-tality from the drought xfire mortality for eachpair of psp. Stems below10 cm dbh were monioredonly once. Where valueswere not available “na” isshown.
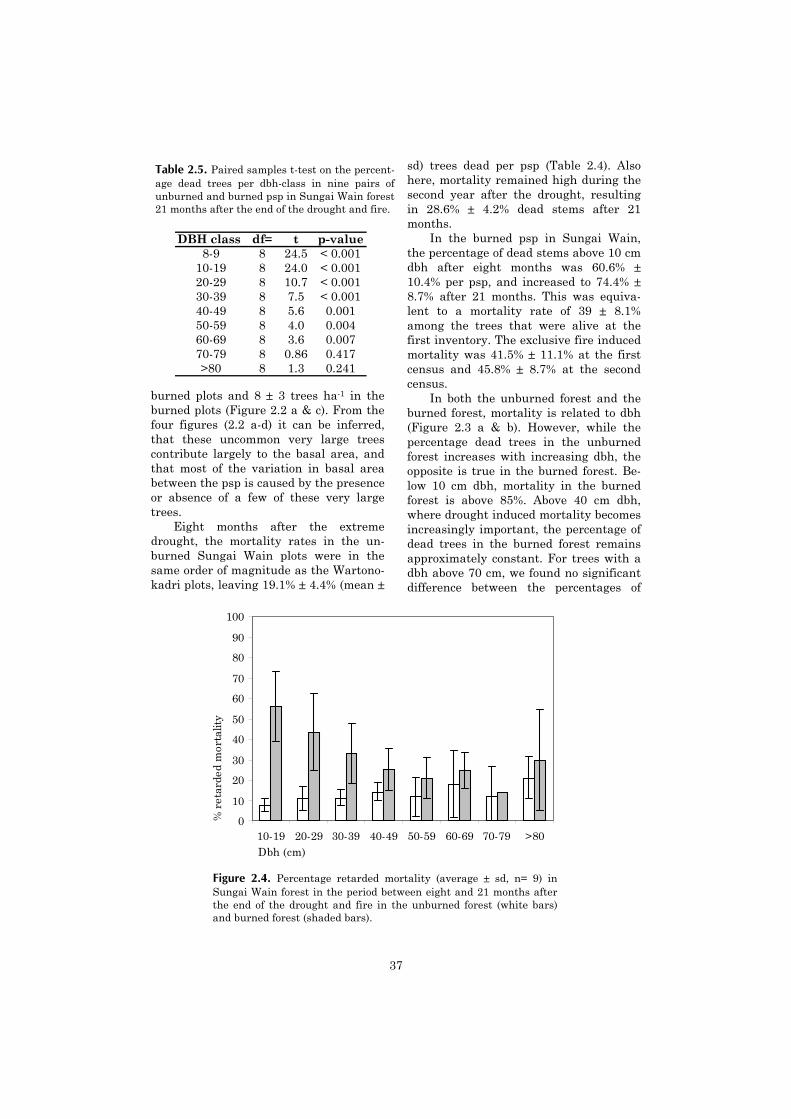
37
burned plots and 8 ± 3 trees ha-1 in theburned plots (Figure 2.2 a & c). From thefour figures (2.2 a-d) it can be inferred,that these uncommon very large treescontribute largely to the basal area, andthat most of the variation in basal areabetween the psp is caused by the presenceor absence of a few of these very largetrees.
Eight months after the extremedrought, the mortality rates in the un-burned Sungai Wain plots were in thesame order of magnitude as the Wartono-kadri plots, leaving 19.1% ± 4.4% (mean ±
sd) trees dead per psp (Table 2.4). Alsohere, mortality remained high during thesecond year after the drought, resultingin 28.6% ± 4.2% dead stems after 21months.
In the burned psp in Sungai Wain,the percentage of dead stems above 10 cmdbh after eight months was 60.6% ±10.4% per psp, and increased to 74.4% ±8.7% after 21 months. This was equiva-lent to a mortality rate of 39 ± 8.1%among the trees that were alive at thefirst inventory. The exclusive fire inducedmortality was 41.5% ± 11.1% at the firstcensus and 45.8% ± 8.7% at the secondcensus.
In both the unburned forest and theburned forest, mortality is related to dbh(Figure 2.3 a & b). However, while thepercentage dead trees in the unburnedforest increases with increasing dbh, theopposite is true in the burned forest. Be-low 10 cm dbh, mortality in the burnedforest is above 85%. Above 40 cm dbh,where drought induced mortality becomesincreasingly important, the percentage ofdead trees in the burned forest remainsapproximately constant. For trees with adbh above 70 cm, we found no significantdifference between the percentages of
Table 2.5. Paired samples t-test on the percent-age dead trees per dbh-class in nine pairs ofunburned and burned psp in Sungai Wain forest21 months after the end of the drought and fire.
DBH class df= t p-value8-9 8 24.5 < 0.001
10-19 8 24.0 < 0.00120-29 8 10.7 < 0.00130-39 8 7.5 < 0.00140-49 8 5.6 0.00150-59 8 4.0 0.00460-69 8 3.6 0.00770-79 8 0.86 0.417>80 8 1.3 0.241
Figure 2.4. Percentage retarded mortality (average ± sd, n= 9) inSungai Wain forest in the period between eight and 21 months afterthe end of the drought and fire in the unburned forest (white bars)and burned forest (shaded bars).
0
10
20
30
40
50
60
70
80
90
100
10-19 20-29 30-39 40-49 50-59 60-69 70-79 >80Dbh (cm)
% r
etar
ded
mor
talit
y

38
dead trees in the unburned and burnedplots after 21 months (Table 2.5).
The retarded mortality showed asimilar pattern in relation to dbh class asthe mortality during the first observationperiod. In the unburned forest, retardedmortality between 8 and 21 months wasfairly constant over all dbh classes,whereas in the burned forest the retardedmortality was negatively related to dbh(Figure 2.4). The frequency of tree fallwas high in the burned forest: 28% of thestanding dead trees and 7.5% of the livingtrees fell during the second year after thefire (Figure 2.5 a & b). Living trees hadnearly twice as much chance to fall in theburned forest as compared to the un-burned forest (4.0%), a difference which
was mainly due to the high rate of smalltrees falling in the burned forest (Figure2.5 a). Tree fall of living and dead treesdecreased with increasing dbh in both theunburned and the burned forest.
Species-specific mortalityTwenty-one months after the
drought, the percentage of dead treesabove 30 cm dbh ranged from 5% to 30%,while Koompassia malaccensis was anoutlier with a mortality rate of 69% (Ta-ble 2.6). We assume that the high mor-tality of Koompassia was caused byanother factor than the drought. Species-specific drought mortality of trees >30 cmdbh was negatively correlated to wooddensity (Figure 2.6, Pearson corr.= -0.84,p= 0.005, n=9). Especially Eusideroxylonzwageri appeared to be highly droughtresistant.
In the burned forest, the percentagedead trees per species varied from 11% to91%. For half the species, the exclusivefire mortality among trees above 30 cmdbh roughly equalled the drought mor-tality. In some species (Dipterocarpusconfertus, Shorea ovalis) the trees above30 cm dbh were unaffected altogether bythe fire, while for most species the exclu-sive fire mortality was around 25%, withan extreme 75% mortality for Artocarpusanisophyllus. It should be noted that, ob-viously, the measured impact of the firewould have been manifold higher, had itbeen possible to include species-specificmortality amongst smaller size classes inthe census. The percentage of dead Pal-mae above 10 cm dbh (mainly Borasso-dendron sp. and Oncosperma sp.) was 3%± 4% after the drought and 10% ± 11%after the fire (not shown in table).
Fire mortality and bark thickness Curve estimation revealed that for all
species combined, the relation betweendbh and bark thickness was best de-scribed by a linear regression on log-logtransformed data (Figure 2.7 a). The per-centage mortality per dbh class that wascaused exclusively by fire (i.e. correctedfor drought mortality) is linearly relatedto the average bark thickness of trees in
Figure 2.5. Percentage tree fall (average ± sd,n= 9) in Sungai Wain forest in the period be-tween eight and 21 months after the end of thedrought and fire of (a) trees living at the start ofthe census period and (b) trees that were deadat the start of the census period. White bars:Unburned forest. Shaded bars: Burned forest.
A
0
10
20
30
40
50
60%
tre
e fa
ll
B
0
10
20
30
40
50
60
10-19 20-29 30-39 40-49 50-59 >60
Dbh (cm)
% t
ree
fall

39
that class (Figure 2.7 b). The same linearregression based on log-log transformedvalues provided the best predictive rela-tionship for the 14 individual species(Figure 2.8).
To test the influence of bark thick-ness on species-specific tree survival,populations above 30 cm dbh of nine spe-cies (which could be identified even whenthey were dead) were tested based on thenumbers of living and dead trees in theburned forest.
A backward stepwise regression re-vealed that for trees above 10 cm dbh,differences in population density in theunburned and the burned forest could notbe explained by either the values a or bfrom the log-log transformed relation be-tween dbh and bark, nor by the 95% dbhlimit (n= 14, for all fitted models F< 2.52,p> 0.13).
Likewise, a backward stepwise re-gression on the percentage fire mortalityof nine species above 30 cm dbh showedthat neither the 95% dbh limit, nor thevalues a and b, explained a significantpart of the variation of the species-specificfire mortality (n= 9, for all fitted modelsF< 0.52, p> 0.57). In other words, in nei-ther case was bark thickness a good pre-dictor of species-specific fire sensitivity.
Discussion
Drought mortalityThe current paper gives an account of
tree mortality as a result of large-scaledisturbance caused by an extremedrought and fire in the tropical lowlandrainforest of East Kalimantan. Notwith-standing the severity of the droughtevent, similar droughts have been naturalto tropical rain forest ecosystems in SouthEast Asia and Latin America (Walsh &
SpeciesWood density
(g cm-3) Drought sdDrought
x fire sd Fire sdArto anis 0.718 20 27 92 17 67 24Dipt conf 0.803 15 18 8 10 -14 19Dipt corn 0.843 14 13 29 6 15 18Dryp kiki 0.999 13 14 31 30 27 18Eusi zwag 1.066 5 6 39 5 30 10Giro nerv 0.603 30 23 59 39 29 39Koom mala 0.934 64 24 92 12 29 24Madh king 0.79 17 19 59 38 42 38Shor laev 0.933 23 18 44 14 29 21Shor oval 0.537 28 22 20 27 -5 33
Percentage dead trees
Figure 2.6. Species-specific mortality of trees>28 cm dbh versus specific wood density.Koompassia malaccensis was an outlier andhas been excluded from the figure (for furtherexplanation see text).
Table 2.6. Species-specific mortality after drought and fire of trees above 30 cmdbh in Sungai Wain forest 21 months after the end of the fire and drought. Thepercentage dead trees after “drought” and “drought + fire” are given as the aver-age percentage dead trees per psp (n= 6). To calculate the mortality exclusivelycaused by fire, the mortality after drought per psp is subtracted pairwise fromthe mortality after “fire + drought” for each pair of adjacent psp.
0
5
10
15
20
25
30
35
0.5 0.7 0.9 1.1Wood density (g cm-3)
% d
roug
ht m
orta
lity

40
Newbery 1999). This study shows to whatextend an extreme drought may affectforest structure and species composition.Mortality soared to 20-26% amongst trees>10 cm dbh two years after the drought,and species-specific mortality amongsttrees >30 cm dbh varied ten-fold. Thus,differences in species-specific mortalitymay cause significant changes in localspecies composition.
In several researches it has been ob-served that in mixed tropical rain forest,mortality rate is not related to dbh fortrees above a certain minimum size limit(Gentry & Terborgh 1990, Lieberman &Lieberman 1987, Manokaran & Kochu-men 1987), or shows a slightly decreasewith dbh (Rankin-de-Merona et al. 1990,Clark & Clark 1996). The marked size-dependent increase in mortality that wasfound in our study strongly deviates fromthis general pattern. A similar, if lesspronounced, pattern of dbh-dependentmortality was found after unusualdrought in the Neotropics (Hubbell &Foster 1990). It was expected that largetrees would be least affected by droughtdue to their deep root system (Condit etal. 1995). However, the large trees in thepresent study appeared most vulnerableto drought, as was found in various other
studies (Leighton & Wirawan 1986, Hub-bell & Foster 1995, Condit et al. 1995).
Xylem cavitation is the most frequentcause of death (Walsh & Newbery 1999).It seems that during a drought largertrees build up a water deficit more rap-idly than smaller trees do. Probably, asmaller tree, which is more likely to growin the shade, has a lower water evapora-tion rate per unit leaf area and thus de-pletes the available water in its root zonemore slowly. The hypothesis that smallindividuals have an insufficient access towater supplies during drought may onlyapply to seedlings and saplings (Caven-der-Bares & Bazzaz 2000), which wereobserved in some neotropical forests tosuffer from high mortality during exces-sive drought (Hartshorn 1990), althoughthis was not observed in the presentstudy, nor in some other neotropical sites(Hubbell & Foster 1990, Condit et al.1995). Differences in soil characteristicssuch as depth and drainage are probablyresponsible for this.
Species mortality after drought wasnegatively related with wood density. In atropical dry forest, hardwood species grewon the driest sites, and could withstand astrongly negative xylem pressure (Bor-chert 1994). Hacke et al. (2001) arguedthat high wood density is primarily the
Figure 2.7. The relationship between dbh, bark thickness and exclusive fire mor-tality. (a) The relationship between log dbh and log bark thickness for 16 speciescombined. Regression line: y = 0.669 x - 1.21 (R2 = 0.788). (b) Average bark thick-ness (± sd) per 10 cm dbh class (of 16 species combined, as in figure 8a and thepercentage mortality per dbh class (mean ± sd) caused exclusively by fire. Re-gression line: y = -56.3 x + 82.1 (R2 = 0.892).
B
0
20
40
60
80
100
0 0.5 1 1.5 2Bark thickness (cm)
% e
xclu
sive
fir
e m
ort.
A
-1.4-1.2-1.0-0.8-0.6-0.4-0.20.00.20.40.6
0.0 0.5 1.0 1.5 2.0 2.510 log (DBH)
10 lo
g (B
ark
thic
knes
s)
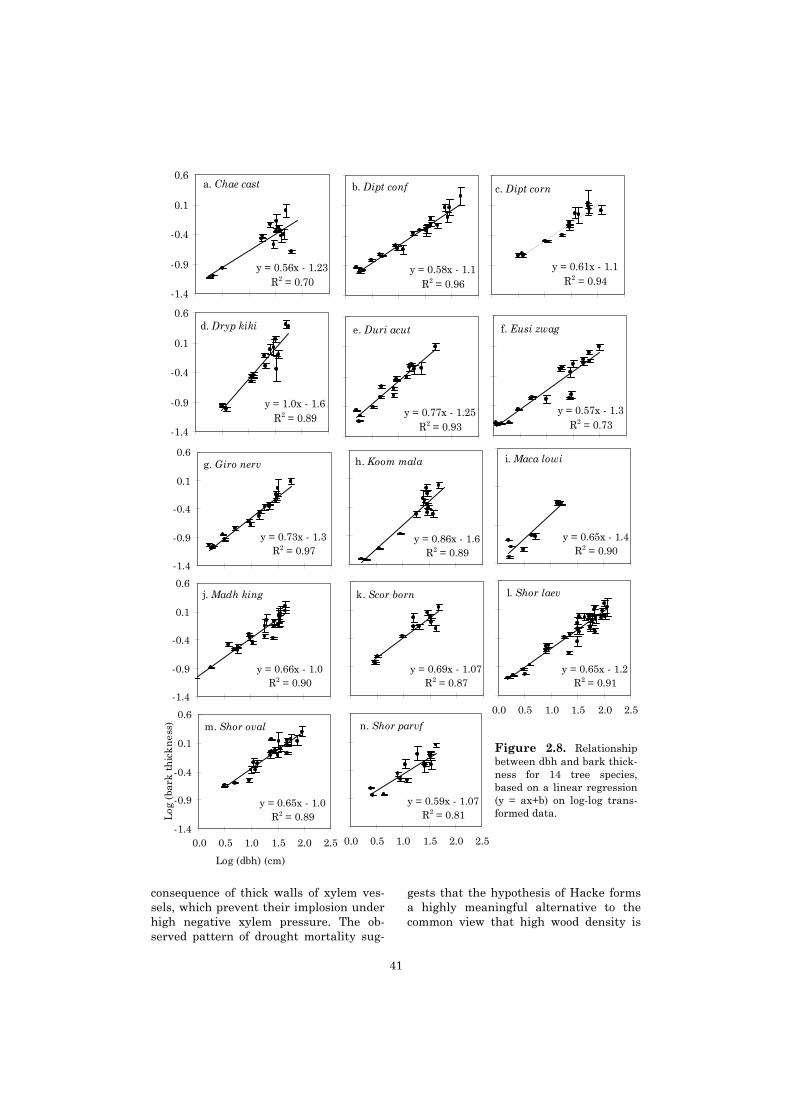
41
consequence of thick walls of xylem ves-sels, which prevent their implosion underhigh negative xylem pressure. The ob-served pattern of drought mortality sug-
gests that the hypothesis of Hacke formsa highly meaningful alternative to thecommon view that high wood density is
n. Shor parvf
y = 0.59x - 1.07R2 = 0.81
0.0 0.5 1.0 1.5 2.0 2.5
m. Shor oval
y = 0.65x - 1.0R2 = 0.89
-1.4
-0.9
-0.4
0.1
0.6
0.0 0.5 1.0 1.5 2.0 2.5
Log (dbh) (cm)
Log
(ba
rk t
hic
kn
ess)
h. Koom mala
y = 0.86x - 1.6R2 = 0.89
g. Giro nerv
y = 0.73x - 1.3R2 = 0.97
-1.4
-0.9
-0.4
0.1
0.6
j. Madh king
y = 0.66x - 1.0R2 = 0.90
-1.4
-0.9
-0.4
0.1
0.6l. Shor laev
y = 0.65x - 1.2R2 = 0.91
0.0 0.5 1.0 1.5 2.0 2.5
i. Maca lowi
y = 0.65x - 1.4R2 = 0.90
k. Scor born
y = 0.69x - 1.07R2 = 0.87
c. Dipt corn
y = 0.61x - 1.1R2 = 0.94
b. Dipt conf
y = 0.58x - 1.1R2 = 0.96
f. Eusi zwag
y = 0.57x - 1.3R2 = 0.73
d. Dryp kiki
y = 1.0x - 1.6R2 = 0.89
-1.4
-0.9
-0.4
0.1
0.6
a. Chae cast
y = 0.56x - 1.23R2 = 0.70
-1.4
-0.9
-0.4
0.1
0.6
e. Duri acut
y = 0.77x - 1.25R2 = 0.93
Figure 2.8. Relationshipbetween dbh and bark thick-ness for 14 tree species,based on a linear regression(y = ax+b) on log-log trans-formed data.
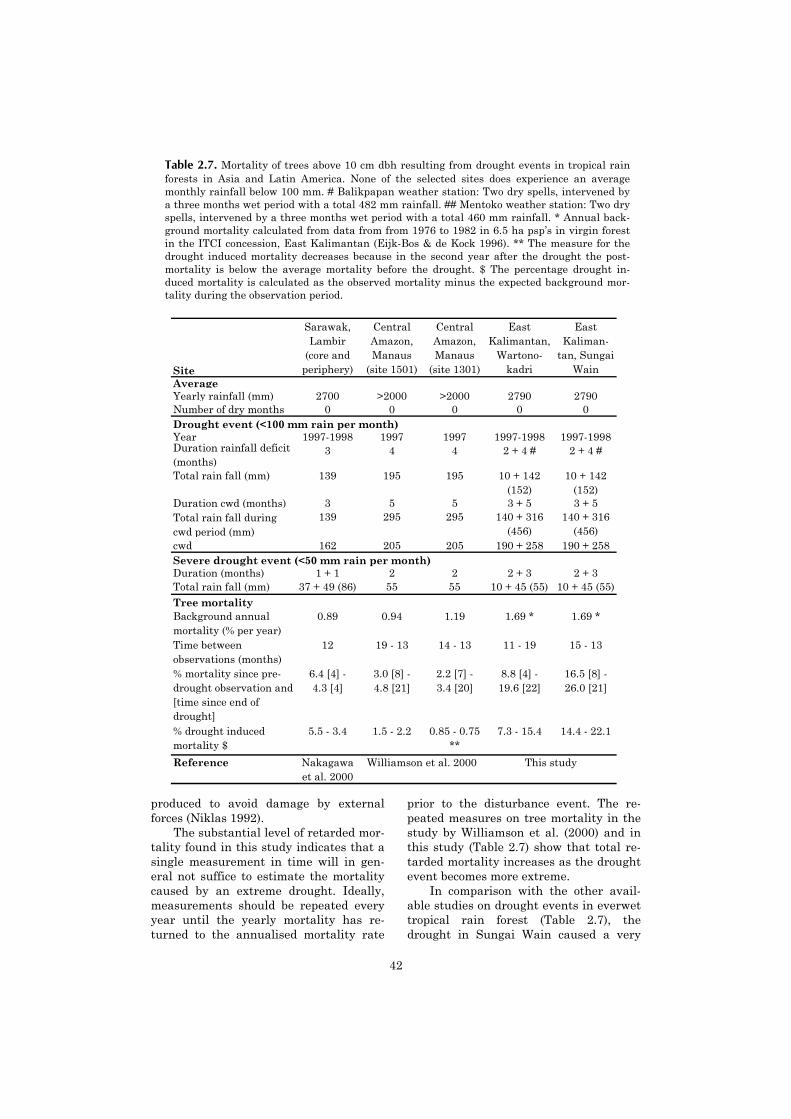
42
produced to avoid damage by externalforces (Niklas 1992).
The substantial level of retarded mor-tality found in this study indicates that asingle measurement in time will in gen-eral not suffice to estimate the mortalitycaused by an extreme drought. Ideally,measurements should be repeated everyyear until the yearly mortality has re-turned to the annualised mortality rate
prior to the disturbance event. The re-peated measures on tree mortality in thestudy by Williamson et al. (2000) and inthis study (Table 2.7) show that total re-tarded mortality increases as the droughtevent becomes more extreme.
In comparison with the other avail-able studies on drought events in everwettropical rain forest (Table 2.7), thedrought in Sungai Wain caused a very
Table 2.7. Mortality of trees above 10 cm dbh resulting from drought events in tropical rainforests in Asia and Latin America. None of the selected sites does experience an averagemonthly rainfall below 100 mm. # Balikpapan weather station: Two dry spells, intervened bya three months wet period with a total 482 mm rainfall. ## Mentoko weather station: Two dryspells, intervened by a three months wet period with a total 460 mm rainfall. * Annual back-ground mortality calculated from data from from 1976 to 1982 in 6.5 ha psp’s in virgin forestin the ITCI concession, East Kalimantan (Eijk-Bos & de Kock 1996). ** The measure for thedrought induced mortality decreases because in the second year after the drought the post-mortality is below the average mortality before the drought. $ The percentage drought in-duced mortality is calculated as the observed mortality minus the expected background mor-tality during the observation period.
Site
Sarawak, Lambir
(core and periphery)
Central Amazon, Manaus
(site 1501)
Central Amazon, Manaus
(site 1301)
East Kalimantan,
Wartono-kadri
East Kaliman-
tan, Sungai Wain
AverageYearly rainfall (mm) 2700 >2000 >2000 2790 2790Number of dry months 0 0 0 0 0Drought event (<100 mm rain per month)Year 1997-1998 1997 1997 1997-1998 1997-1998Duration rainfall deficit (months)
3 4 4 2 + 4 # 2 + 4 #
Total rain fall (mm) 139 195 195 10 + 142 (152)
10 + 142 (152)
Duration cwd (months) 3 5 5 3 + 5 3 + 5Total rain fall during cwd period (mm)
139 295 295 140 + 316 (456)
140 + 316 (456)
cwd 162 205 205 190 + 258 190 + 258 Severe drought event (<50 mm rain per month)Duration (months) 1 + 1 2 2 2 + 3 2 + 3Total rain fall (mm) 37 + 49 (86) 55 55 10 + 45 (55) 10 + 45 (55)Tree mortalityBackground annual mortality (% per year)
0.89 0.94 1.19 1.69 * 1.69 *
Time between observations (months)
12 19 - 13 14 - 13 11 - 19 15 - 13
% mortality since pre-drought observation and [time since end of drought]
6.4 [4] - 4.3 [4]
3.0 [8] - 4.8 [21]
2.2 [7] - 3.4 [20]
8.8 [4] - 19.6 [22]
16.5 [8] - 26.0 [21]
% drought induced mortality $
5.5 - 3.4 1.5 - 2.2 0.85 - 0.75 **
7.3 - 15.4 14.4 - 22.1
Reference Nakagawa et al. 2000
Williamson et al. 2000 This study
43
high mortality. Whereas the cumulativewater deficit in Sungai Wain was two tothree times larger than in the otherstudies, the resulting tree mortality wason average six times higher. The relation-ship between the percentage drought in-duced mortality after 20-22 months andthe cwd (Table 2.7) is described ade-quately by an exponential relationship(y= 0.023e0.016x (R2= 0.92)) as well as by alinear relationship (y= 0.048x - 4.32 (R2=0.80)). It is currently not possible to de-fine the exact relationship between cwdand tree mortality. However, both modelspredict a negligible effect of drought aslong as the cwd remains below 100 (linearmodel) to 200 (exponential model). Abovethat value the mortality rapidly increaseswith cwd. This pattern probably resultsfrom the fact that trees experience a de-lay in their actual water shortage afterthe onset of a rainfall deficit, resultingfrom the water reserve that is buffered inthe soil (Poorter & Hayashida-Oliver2000, van Dam 2001).
Fire mortality and its interaction withdrought
The current paper presents the firststudy in a Southeast Asian rain forestcomprising of a comparison betweenburned and unburned forest completewith replicates and a large set of trees>10 cm dbh as well as >30 cm dbh. Fortrees larger than 10 cm dbh the mortalityin Sungai Wain was 74% 21 months afterthe fire, compared with 57% mortality 22months after fire in Sabah (Woods 1988),36% after four months in Kutai NationalPark, East Kalimantan (Leighton & Wi-rawan 1986) and 25% after six months insouth-west Sumatra (Kinnaird & O’Brien1998). Partly these differences result frommethodology: the actual mortality in thestudy of Woods (1988) may have beenhigher, because trees that had fallen bythe time of observation were not takeninto consideration. The other two surveyswere done shortly after the fire, andtherefore have missed retarded mortality.Still, part of the variation is likely to beexplained by differences in the intensityof the droughts preceding the fires. The
comparison of unburned and burned plotsin our study elucidated the additive effectof drought and fire on tree mortality. Outof the total mortality among trees >10 cmdbh 21 months after the fire, almost 40%was caused by the drought.
Like in the unburned forest, a sub-stantial level of retarded mortality wasobserved in the burned forest. The re-tarded mortality in the burned forest wastwo-fold higher than in the unburned for-est, and was caused by a much highermortality rate amongst trees of 10-40 cmdbh. Tree fall among trees in these sizeclasses that were still alive at the firstcensus was much higher in the burnedforest. This can partly be explained by thehigh density of falling dead trees in theburned forest (even if the frequency ofdead trees falling was not increased),which took living trees with them in theirfall. Because the open canopy in theburned forest forms little obstacle forgusts of wind, wind throw of living treeswas higher as well.
Tree specific fire mortality rate Several studies have aimed at pre-
dicting the species-specific and dbh-specific chance of mortality of tropicalrain forest trees after fire by assessingbark insulation properties and experi-mentally heating the bark of living trees(Gill & Ashton 1968, Vines 1968, Uhl &Kauffman 1990, Pinard & Huffman1997). In these studies bark insulationturned out to be mainly determined bybark thickness. Few studies looked at theactual species-specific mortality of tropi-cal rain forest trees after fire to validatethe predictions made by the above men-tioned experiments.
We found that, over the entire rangeof dbh classes, mortality caused by firewas negatively related to dbh and to barkthickness. Above 70 cm dbh, we did notobserve a significant effect of fire on treemortality. Leighton & Wirawan (1986)found the same pattern of dbh-relatedmortality. However, bark thickness didnot explain the species-specific survivalrates of trees >30 cm dbh. This may bedue to the rather small differences inbark thickness between species of that

44
size, but it may also indicate that otherfactors than merely bark thickness have alarge influence on tree mortality, such asan increased risk of fire mortality for sizeclasses and species which frequently havea damaged stem base (Yeaton 1988). Atany rate, the results suggest that in orderto predict the fire sensitivity of a species,it is more effective to assess the dbhstructure of the population than the spe-cies-specific bark characteristics. Attain-ing a large dbh appears one effectivemeans to increase the chance of fire sur-vival.
Conclusion
Our study shows that fire as well asdrought may cause high levels of treemortality. The effect of both disturbancesis for a large part on different strata ofthe vegetation: Drought causes high mor-tality among trees in the canopy, whereasfire destroys most of the understorey andmidstorey. Since fires only occur in uni-son with extended drought, their effect isdisastrous to the forest vegetation. Themost vulnerable tree species seem to bethose which are confined to the understo-rey and midstorey. Species that grow to alarge stature are likely to survive as apopulation, although interspecific differ-ences in sensitivity are considerable, andnot well understood.
Because of the high levels of retardedmortality, the full extend of the damageresulting from drought and fire can only
be determined if a forest is monitored fora considerable period of time after thedisturbance. It seems likely that even ourinventory 21 months after the event didnot record the entire mortality caused bythe disturbance events.
Acknowledgements
This research was performed at theInternational-Ministry of Forestry(MOF)-Tropenbos-Kalimantan researchstation, East Kalimantan. We are grate-ful for the support we received from themany staff members working there, espe-cially M. de Kam and A. Susilo. K. Sidi-yasa, Ambriansyah, Z. Arifin andAdriansyah from the Wanariset Herbar-ium were responsible for the tree identifi-cations, and the staff from the Wanarisetforest economy and monitoring unit es-tablished the permanent sample plots inSungai Wain. Furthermore the fieldworkbenefited greatly from the dedication of J.Helleman, N. Syah, F. Udin, and S. LaysaPutra. J.W.F. Slik kindly provided datafrom the Wartonokadri plots. We aregrateful to J.A. Sayer, M. van Noordwijk,D.W. Dijkman, and G.M. Fredriksson fortheir support and fruitful discussions.M.J.A. Werger and F.J. Sterck madevaluable comments on earlier versions ofthis manuscript. The research was sup-ported by the Netherlands Foundation forthe Advancement of Tropical Research(WOTRO) with grant 84-408 to M.v.N.
3Post-fire dynamics of
plant functional groups in alowland dipterocarp rain forest
With Kade Sidiyasa and Heinjo During
AbstractFollowing widespread fires, we studied the vegetation dynamics of a lowland dipterocarp rain
forest in East Kalimantan, Indonesia. We used a post-facto experimental set-up of nine burnedplots and nine unburned plots, the latter being protected by man-made firebreaks.
Three main functional groups of plants were distinguished a priori, and a fourth group a pos-teriori, on the basis of life-history attributes. These functional groups were shade tolerant tree spe-cies, light-demanding tree species, non-woody plants (including grasses, herbs, vines and ferns) andlitter-gap demanding species. The virtual absence of non-woody species and light-demanding treespecies in the unburned forest made a comparison for these functional groups between the twotreatments redundant.
Unburned patches formed only 4% to 7% of the area that was not protected by a firebreak andwere unevenly distributed over the nine burned plots. Apart from these patches, the burned areawas fairly homogeneously affected. The canopy openness in the unburned forest was 5% and dif-fered sharply from the 24% canopy openness in the burned forest. Canopy openness was signifi-cantly related to the percentage dead trees in the burned forest.
In the burned forest the species diversity of surviving stems (>10 cm dbh) per 0.4 ha was only30% of the pre-disturbance diversity. The number of species per number of stems was nearly iden-tical between the unburned forest and the burned forest. The relative abundance of families re-mained largely unchanged.
Contrary to our expectation, the percentage tree mortality explained little of the variation inthe post-fire vegetation, apart from the percentage cover of Pteridium caudatum. Fern cover wasnegatively related to sapling density, while there was no such relation with sprout density. Thepatterns of individual species did often divert considerably from the patterns of these broad func-tional groups.
Establishment from the seed bank and post-fire seed dispersal determined the demography oflight-demanding non-woody species and light-demanding tree species. These species formed anabundant element of the post-fire vegetation, even though mature trees of the same species wererare in the unburned forest.
Together with survival of trees >10 cm dbh, resprouting played an important role in the post-fire dynamics of the functional group of shade tolerant tree species, whereas seed rain appeared tobe much less important than expected. The average density of sprouts was 22 per 100 m2. The ma-jority of the sprouts originated from (just) below ground parts of the stem (64%). Small parentstems contributed enormously to the density of sprouts, mainly because of their high pre-fire den-sity, relative to larger stems. A single shrub species (Fordia splendidissima (Blume ex Miq.) Buij-sen) with an estimated 100% sprouting frequency dominated the sprout community. Nevertheless,the sprout diversity (species per number of stems) was comparable to the diversity of stems >10 cmdbh in the unburned forest.
Species-specific sprouting frequency of shade tolerant tree species was negatively related towood density, and so was the average stem length growth of sprouts in the second year. Sproutsurvival in the second year was 83% or higher and was not related to wood density. These patternsare discussed in terms of life-history trade-offs. They are important for predicting the succesional

46
development of the post-fire vegetation. The capacity of stems to resprout allows for a relativelyrapid recovery of the functional group of shade tolerant species. However, we predict that repeateddisturbances will diminish this recovery potential by rapidly reducing the densities of resprouts.
Keywords: East Kalimantan, ferns, forest fire, forest succession, functional groups, In-donesia, large-scale disturbance, light availability, lowland dipterocarp forest, pioneertrees, plant-functional attributes, resprouting, secondary succession, seed bank, shadetolerant trees, tree mortality, vegetation recovery
Introduction
Over the past decades, extensivewildfires have become a recurring phe-nomenon in the evergreen dipterocarpforests of Borneo and Sumatra (Leighton& Wirawan 1986, Woods 1989, Nykvist1996, Hoffmann et al. 1999, Siegert et al.2001). The most devastating episodes offorest fires, during which large tracks offorest were severely damaged, occurredduring periods of extreme drought thatwere related to supra-annual El Niño-Southern Oscillation (ENSO) events.Knowledge about the post-fire develop-ment of the tropical rain forest is veryscattered. The major vegetation transi-tions following fire in Kalimantan havebeen studied (Riswan & Kartawinata1988, 1989, Nykvist 1996, Kobayashi etal. 1999, Matius et al. 2001, Mori 2001,Toma et al. 1999, 2001 b) and for othertropical sites, successional transitionsfollowing large-scale disturbance havebeen summarised in comprehensiveschemes (Hopkins 1981, Whitmore 1984,Whittaker et al. 1989, Richards 1996,Cochrane & Schulze 1999). However,these approaches provide only a sketchyunderstanding of the processes that de-termine the successional development.
Functional groups of plants can be de-fined on the basis of life-history attributes(Noble & Slatyer 1980, Bond & van Wil-gen 1996). In fire-prone ecosystems, life-history attributes are an important tool inpredicting post-fire vegetation dynamics.In the tropical rain forest, fire is an ex-tremely infrequent disturbance (Sanfordet al. 1985, Goldammer & Seibert 1989)and it is unlikely that plant species in atropical rain forest developed adaptationsto fire disturbance. Nevertheless, it canbe useful to divide tropical rain forestplant species into broad groups, which
share common life-history attributes thatdetermine their population dynamics andthat may influence the vegetation devel-opment after fire. A study in which thesefunctional groups are studied in unisonwill enhance our understanding of theirrelative importance in structuring thepost-fire forest vegetation. We used an apriory deductive classification (Gitay etal. 1999) that was based on light re-quirements in the seedling phase and onplant growth form. We defined threefunctional groups of plants: shade toler-ant woody species, light-demandingwoody species and light-demanding non-woody species (Whitmore 1984, Swaine &Whitmore 1988, Finegan 1996). The re-search focuses on four main processesthat are closely linked with certain life-history attributes, e.g. tree survival, re-sprouting, germination from the pre-fireseed bank and seed arrival through thepost-fire seed rain.
Different light requirements form themost important discriminating factor inthe characterisation of the different func-tional groups, since these are expected toexcert a large influence on populationdevelopment following fire. We expectthat spatial variation in the vegetationmatrix creates a spatially variable lightclimate at ground level, which likely de-termines the local development of thevegetation.
Our objectives are (1) to determinethe changes in the abiotic environment,and more specifically the light availabil-ity, caused by fire, (2) to assess the rela-tive importance of different regenerativeprocesses in each functional group for thedevelopment of the vegetation structureand species composition of the post-firevegetation, and (3) to characterise the

47
spatial heterogeneity of the vegetationafter the fire. This research serves as aframework for the following chapters inthis thesis, which probe into the details ofthe different processes of post-fire vegeta-tion dynamics.
Non-woody speciesAll herbs, grasses and ferns were
lumped into a single functional group,which was determined by maximumheight of the species (<3 m) and the ab-sence of woody stem tissue. For our pur-pose it was not necesarry to define thefunctional group more narrowly, but itshould be noted that we only includedspecies that share a larger set of charac-teristics. Because the selected specieswere absent in the unburned forest andestablished widely after the fire, theymust share characteristics of long-ditanceseed dispersal, high survival in the seedbank and a high light requirement forestablishment and growth. The group ofnon-woody species included three terres-trial ferns (Pteridophytae), Imperata cyl-indrica [L.] Beauv. (Gramineae) and thevine species Mikania scandens Willd.(Compositae). We hypothesise that thelocal population densities of these speciesdepend on variation in canopy openness.The presence of these species is impor-tant, because they can form dense stands.Such stands have been observed to inhibitthe establishment, survival and growth oftree seedlings and resprouts in differentforest types, including forests in Europe(den Ouden 2000) and Australia (Adam1992), and tropical rain forest in South-east Asia (Whitmore 1984, Richards1996).
Light-demanding tree speciesThe functional group of light-
demanding tree species is defined asthose tree species which need relativelyhigh light availability for successful seed-ling growth and establishment (Swaine &Whitmore 1988). Research in the Neo-tropics (review by Garwood 1989) and inSoutheast Asia (Saulei & Swaine 1988,Metcalfe & Grubb 1995) has shown thatpopulations of typical light-demanding
tree species are maintained in the undis-turbed forest through the presence oflong-lived seeds in the soil seed bank. Inthe soil, these seeds await the formationof a canopy gap, in which the increasedlight availability triggers them to germi-nate (review by Pons 2000). The gap-likeenvironmental circumstances after firemay provide the appropriate circum-stances for the germination and estab-lishment of these species. We expect lightavailability to be the main determinantfor the density of light-demanding treeseedlings and saplings in the burned for-est.
Shade tolerant tree speciesWe defined the functional group of
shade tolerant tree species as all tree spe-cies that are able to survive in the deepshade of the forest canopy (Swaine &Whitmore 1988). Accordingly, the speciesin this functional group were present asboth juveniles and adults in the unburnedforest. Population dynamics of shade tol-erant tree species are influenced bywhole-plant survival, resprouting, andpost-fire seed dispersal. Here, we focus onstem survival and resprouting. Post-fireseed dispersal was not explicitly meas-ured in the current study, because veryfew tree species fruited in the first twoyears after the fire in the unburned aswell as the burned forest (G. Fredriksson,unpubl. data). Obviously the local densityand diversity of surviving stems is one ofthe main factors determining the post-firedevelopment of the vegetation. The pat-terns of community-wide mortality havebeen described in chapter 2. In the cur-rent chapter, we analyse the conse-quences of this mortality for the localspecies diversity.
Resprouting of stems remains a rela-tively understudied aspect of rain forestecology, although its importance has beenrecognised repeatedly (Clark & Clark1991, Kauffman 1991, Bellingham et al.1994, Guariguata 1998, Bellingham 2000,Bond & Midgley 2001). Species-specificsprouting capacity includes the sproutingfrequency (the percentage of stems thatproduces sprouts), as well as the survivalrate and growth rate of resprouting

48
plants. In studies on resprouting afternatural disturbances such as hurricanes(Putz & Brokaw 1989, Bellingham et al.1994), and in experimental studies wheresaplings were severely damaged(Guariguata 1998, Chapter 4), species-specific and size-dependent variation insprouting capacity has been observed.Such variation may be influenced by theamount of stored energy and nutrients inthe plant (Bell et al. 1996, Chapin et al.1990, Canham et al. 1999, Chapter 4), orby morphological constraints such as thedensity of dormant buds (Jobidon 1997).
Especially after fire, the capability ofplants to sprout from well-insulated partsat or below ground-level may influencethe size-dependent pattern of resprouting.If resprouting is limited to above groundstem parts, sprouting frequency is ex-pected to be related to stem dbh and spe-cific bark thickness, because with theincreasing level of heat insulation pro-vided by thick bark, tissue that has thecapacity to resprout will have a higherchance of survival. If sprouting occursfrom below ground parts, with the soilacting as an insulator, the frequency ofsprouting may be independent of barkthickness.
We aim at explaining species-specificdifferences in sprouting capacity througha comparison with sapling ecology. Inter-specific differences in the performance ofsaplings have been characterised as a life-history trade-off between growth rate inhigh light environments and survival ratein understorey shade (Hubbell 1995,1998). Since high maximum growth ratesof species are associated with low wooddensity (Suzuki 1999, ter Steege &Hammond 2001), one may expect that (1)at sites with high light availability thereis a negative correlation between wooddensity and growth rate, and (2) whenlight availability is low, there is a positivecorrelation between wood density andsurvival rate. Given the high light avail-ability in the burned forest, we predictthat the rgr of sprouts will be negativelyrelated to wood density, whereas sproutsurvival will be independent of wood den-sity.
Interactions between functional groupsThe different functional groups in the
post-fire vegetation may inhibit the es-tablishment, growth and survival of othergroups. In this respect, Pteridium cauda-tum is known to inhibit establishmentand survival of other species in many for-est types worldwide (Fletcher & Kirkwood1979, den Ouden 2000), and Imperatacylindrica is a notoriously persistent spe-cies in many parts of Southeast Asia.Light may become quickly limited close tothe ground in places where a dense un-dergrowth develops. In such cases, fast-growing species are expected to reducethe growth and survival of slower-growing species. We predict that thepresence of each functional group is nega-tively correlated with the density of otherfunctional groups. Since ferns and light-demanding tree species obtained roughlyequal height during the first year afterthe fires (MvN pers. obs.), it is not possi-ble to make a general prediction which ofthese two functional groups would reducethe performance of the other group. Dueto their much slower growth rate, we pre-dict that the sprouts of shade toleranttrees are negatively affected by the pres-ence of the other two functional groups.
Material & methods
Site descriptionThe study was conducted from 1998
to 2000 in the Sungai Wain protectionforest (1º16’ S and 116º54’ E; altitude 40to 140 m.a.s.l.) near Balikpapan in EastKalimantan, Indonesia. The local climateis tropical perhumid with an averageyearly rainfall of 2790 mm. The averagetemperature at mid-day is 30ºC (Toma etal. 2001 a). More detailed accounts of thedrought episodes that occur in the regionand of the local soil characteristics aregiven in chapter 1 and 2.
In 1997-1998 an exceptional droughtoccurred, during which a large part of the100 km2 Sungai Wain reserve burned.Only an area of approximately 3.5 x 8 kmin the core of the reserve was preventedfrom burning by a network of man-made

49
firebreaks of 0.5 m wide. This core areasupports a primary lowland dipterocarpforest. A 70 km2 area of burned forestsurrounds the core on three sides. As aresult of the fires this surrounding forestwas heavily damaged. After the fire, thestanding dead and living trees formed aspatially variable matrix (Chapter 2).Eight months and 21 months after thefire, the density of surviving trees (>10cm dbh) was respectively 218 ± 80 ha-1
and 128 ± 65 ha-1 (average ± sd, n= 9).This is approximately one third and onefifth of the total stem density (dead +living stems) of 594 ± 76 ha-1 that wasfound in the adjacent unburned plots. Thedecrease in living basal area was similar,with a decrease of 56% and 70% relativeto the original 33.1 ± 6.1 m2 ha-1. Nearlyall dead individuals from seedlings toemergent trees remained upright afterthe fire. Therefore the area supportednearly the original density of stems.
Plot designPermanent sample plots (psp) were
set up at both sides of the man-made fire-breaks. Because the fire-breaks did notcorrespond to any topographical featurein the places were the psp were posi-tioned, this allowed for a random sam-pling scheme with paired plots ofunburned and burned forest. The set-upof the study consisted of 18 permanentsample plots (psp) which were distributedin nine pairs of one unburned and oneburned psp over an area of circa 20 km2.A man-made firebreak separated the twoadjacent psp in each pair of plots.
Within the psp, areas of differentsizes were delineated to allow for a strati-fied sampling scheme. Each psp consistedof an area of 60 x 300 m (1.8 ha) with asubdivision of 20 x 20 m. Within the psp,a smaller plot of 20 x 200 m (0.4 ha) witha subdivision of 10 x 10 m was located.The topography was measured at a scaleof 20 x 20 m for the 1.8 ha psp and 10 x10 m for the 0.4 ha plots. Slopes weremeasured with a Suunto clinometer, afterwhich a map was made of each psp.Chapter 1 provides more details on plottopography.
Light availabilityWe estimated the light climate in the
unburned and burned forest in January1999, 10 months after the fire. In the cen-tre of six 10 x 10 m subplots per psp,hemispherical photographs were taken at1 m above ground level (n= 54 in un-burned forest and n= 54 in burned forest).On the basis of these photographs, canopyopenness was estimated using Winphot5.0 (ter Steege 1996). With a general fac-torial anova we tested the hypothesisthat, in the burned forest, canopy open-ness increased with the percentage ofdead basal area and decreased with totalbasal area (living + dead) in 54 burnedsubplots of 100 m2.
Sampling schemeTo measure the dynamics of the vege-
tation, observations were made in theburned forest at two times after the fire,in December 1998, eight months after thefire, and in January 2000, 21 months af-ter the fire. Each observation consisted ofa stratified scheme of measurements ondifferent components of the vegetation.For the field inventory, dead, living andresprouting trees were divided in threesize classes: >30 cm dbh; >10 cm dbh; and>50 cm high and <10 cm dbh. Other com-ponents of the vegetation that were stud-ied included tree saplings and non-woodyspecies. Ferns and light-demanding sap-lings were studied only in the burned for-est, since they were virtually absent fromthe unburned forest. Resprouting stemswere also studied in the burned forest,and for six common species the densitiesof small stems were also studied in theunburned forest. Nomenclature followsSidiyasa et al. (1999) and Slik (2001).
The term “dead” was used for trees ofwhich the above ground parts had died.Dead trees did not possess green leaves inthe crown or along the stem (both indica-tions that the cambium had survived in atleast some section of the stem). However,the root system of such trees may havebeen alive: Trees that resprouted fromtheir basal parts, either below ground orjust above-ground, but which did other-wise not possess green leaves, were con-
50
sidered dead. Such cases were recorded ina separate category.
Stem survival above 10 cm dbhAt the first observation period, all
dead and living trees >28 cm dbh in each1.8 ha psp were labelled, mapped andtheir diameter at 1.30 m above groundlevel (diameter at breast height, dbh)measured using a measuring tape to thenearest millimetre. In the 0.4 ha plots, alldead and living trees >8 cm dbh werelabelled, their position recorded and theirdbh measured. The lower limits of 28 cmand 8 cm dbh were chosen in order toavoid the exclusion of individuals with adbh close to the lower limits of respec-tively 30 cm and 10 cm dbh. Where ap-propriate, individuals between 28-30 cmdbh and between 8-10 cm dbh were laterexcluded from the analyses. Living indi-viduals were taxonomically identified.Numbers of resprouts were recorded, andthe length and diameter at 25 cm abovethe point of attachment of the tallestsprout were measured when the point ofattachment was below 2 m on the parentstem. In the second inventory, all treesabove 8 cm dbh were re-inventoried. Werecorded whether they were living or deadand when present, the diameter andlength of the tallest sprout was measured.
For trees which had protruberancesat 1.30 m (buttresses or other irregulari-ties), the diameter (Dx) was measured at30 cm above the protruberances (Sheil1995). Using a subset of regular stems,we measured the degree of stem tapering.The resulting curve estimation allowed usto calculate the dbh for trees of which thediameter had been measured above 1.30m (Chapter 2).
Stems below 10 cm dbh, post-fire sap-lings and non-woody species
In six burned psp (2, 4, 6, 8, 10, 12)we selected 10 subplots of 10 x 10 m (totaln= 60 subplots) spread over the entirelength of the psp. In these subplots, allliving and dead small trees (defined asstems over 50 cm high but <10 cm dbh)were labelled and mapped. Living treeswere identified taxonomically. Stem di-ameter was measured either at 1.30 m(dbh) or, for individuals <1.30 m high, at30 cm above ground level (diameter atankle height, abbreviated as dah). Weobserved a linear relationship betweendbh and dah, based on measurements ofboth characteristics on a large number ofindividuals (Dah = 0.527 + 1.021 * dbh,n= 286, R2= 0.90, p< 0.001). Whereneeded, this relationship was used to al-locate individuals to their appropriatesize category.
In this chapter, the terms “seedling”and “sapling” refer to individuals thatwere present in the post-fire vegetationeither as the result of whole-plant sur-vival, or when they established from seedafter the fire. Plants were identified asresprouts when they consisted of one ormore post-fire shoots which originatedfrom a parent stem which had been killedby the fire.
Parent stems of respouts were usu-ally still standing upright, even for thesmallest individuals. The diameter of theparent stem was measured at dah forindividuals <1.30 m high, and at dbh forindividuals >1.30 m high. To distinguishbetween sprouts originating from belowground and seedlings, sprouting pointswere excavated. Based on the location of
Table 3.1. Different points of origin of resprouts.
Abbrev. Location Descriptionas > 2m along stem above 2 m sprout originating along the stem, from a point at least 2 m above the
soil surfaceas < 2m along stem below 2 m sprout originating along the stem, from a point >0.3 m and <2 m
above the soil surfacebag base above ground at the base, sprout originating from above the soil surfacebbg base below ground at the base, sprout originating from below the soil surfacerag roots above ground from the roots, sprout originating from above the soil surfacerbg roots below ground from the roots, sprout originating from below the soil surface

51
origin, resprouts were classified into fiveclasses (Table 3.1). All resprouts werelabelled, and identified taxonomically. Wemeasured the length of the tallest sproutand its diameter at 30 cm above the pointof origin. In the second inventory the sizeand survival of the resprouts was as-sessed. In this inventory, we also recordedthe Dawkins light class for each sprout atits highest stem point (Dawkins & Field1978). Because taking herbarium samplesfrom resprouts would have affected theirgrowth, resprouts were taxonomicallyidentified in the field, which explains thesometimes restricted level of identifica-tion.
In each of these six burned psp, weselected three subplots of 10 x 10 m (n=18) in which we measured the density ofall dead stems >50 cm high. This allowedan estimate of the sprout frequency forthe community as a whole (e.g. independ-ent of species). To allow for a species-specific estimate of the sprout frequency,the density of individuals >50 cm high ofsix common species (Table 3.11) was es-timated in 60 unburned subplots of 10 x10 m evenly spread over three psp. Here,the ratio of the density of resprouts in theburned forest and the number of indi-viduals in the unburned forest gives anestimate of the species-specific sproutingratio. Wood densities of these specieswere obtained from the literature (Bur-gess 1966, Soerianegara & Lemmens1993, Suzuki 1999).
The density of saplings (>1.30 mhigh) establishing from the post-fire seedbank was measured in the second inven-tory. We limited our observations to a fewcharacteristic taxa (Table 3.7). In thesame area a full inventory of seedlingdensity and seedling diversity was madeby other researchers (Priadjati 1999,Eichhorn unpubl. data). The dbh of allsaplings >1.30 m high of Macaranga gi-gantea, Dillenia cf. borneensis and Verno-nia arborea were measured.
In the first inventory, ferns and othernon-woody species were scarce, and notrecorded. In the second inventory, thepercentage ground cover of the three mostcommon fern species, Imperata cylindricaand Mikania scandens was estimated.
Percentage ground cover was defined asthe percentage of the total area whichwas covered by a specific species whenprojecting its canopy on the ground. Weestimated the number of square meterscovered by a species surveying each 10 x10 m subplot from an elevated position.
Data analysisA correspondence analysis (ca) was
used to explore variation in vegetationcomposition between the subplots, and toexplore the correlation between vegeta-tion composition and environmental vari-ables. Independent variables wereincluded as factors (Site with two classes,Topography with 5 classes and slope with3 classes) or as co-variables (the otherindependent variables). The two classesfor “Site” were the two locations (“East”and “West”) where three pairs of plotswere located (Figure 1.2). Topographicclasses are identified in table 3.5. Thethree slope classes were flat to gentle(slope <10°), moderate (slope 10-20°) andsteep (slope >20°).
With multivariate anovas, we testedthe effect of various environmental fac-tors and components of the vegetation onthe density of several taxa. Initially, mul-tivariate anovas were performed in whichall two-way interactions between inde-pendent variables were included. Wherethese interactions were not significant,they were excluded from the final analy-sis. The densities of other elements of thevegetation were only included as inde-pendent variables when these elementswere expected to influence the establish-ment of the dependent taxa. Data on stemdensities were square-root transformed,data based on percentages were arcsintransformed, and the total ba per subplotwas log transformed (Sokal & Rohlf1981).
Results
Unburned patches The area that was not protected by
the firebreak had burned for the largestpart. Unburned patches were rare andwere unevenly distributed over the

52
burned forest. They added up to 7.5 ±12.7% (average ± sd, n= 9) of the area inthe 0.4 ha plots, and to 4.4 ± 8.5% in the1.8 ha plots. Unburned patches occurredin 4 out of the 9 permanent sample plotsof 1.8 ha. The unburned area in one of thesample plots made up for half the totalarea that naturally escaped the fire.
Unburned patches and partly un-burned patches were significantly associ-ated with certain topographical units inthe landscape, mainly occurring in val-leys, low slopes and low flat areas (Chi2
test on 10 x 10 m subplots: Chi2-value=59.2, p< 0.001, n= 356; Chi2 test on 20 x20 m subplots: Chi2-value= 26.9, p= 0.008,n= 297). However, even these areas had ahigh chance to burn (Table 3.2).
Canopy openness and its relation withlocal damage to the vegetation
Canopy openness increased sharplyafter the fire. In the unburned forest,canopy openness was 5.3 ± 2.9% (average± sd, n= 54) and in the burned forest itwas 24.1 ± 7.1%. Canopy openness in theburned forest was significantly related
with the percentage dead trees per 100m2 plot (Table 3.3). The linear regressionbetween canopy openness and percentagedead trees (not transformed) was y= 2.4 x+ 19.7 (df= 22, R2= 0.41, p< 0.001). Totalba and percentage dead ba did not addsignificantly to the explained variance. Inthe following analyses, the percentagedead trees has been used as a proxy forlight availability.
Diversity of surviving shade toleranttrees
At 0.4 ha plot level, the number ofspecies in the unburned forest (>10 cmdbh, excluding Palmae) decreased from70.1 ± 5.3 (average ± sd, n= 9) in the firstcensus to 62.8 ± 7.8 in the second census.In contrast, the number of species in theburned forest at the second census wasonly 20.8 ± 10.6 per 0.4 ha. The species-area curve for the area (Figure 3.1 a)shows that up to an area of at least 3.6ha, the species number in both the un-burned and the burned forest continuedto rise. Even on a logarithmic area scale,the slope of the curve continued to in-crease with area. Over all the scales ofmeasurement the species number in theburned forest was at least a factor twolower than in the unburned forest. In con-trast, the number of species per numberof stems was nearly identical between theunburned forest and the burned forest(Figure 3.1 b). The difference in speciesnumber per area must therefore becaused by the drastically reduced stemdensity in the burned forest.
Table 3.2. Distribution of topographical units and their fire history in the burned psp.* The “unburned” category includes plots that naturally escaped the fire completely orpartly.
Source df F Sig.Corrected Model 3 8.99 0.001% dead trees 1 14.66 0.001% dead ba 1 2.74 0.114Total ba 1 0.21 0.652Error 20
Table 3.3. Relation between canopy opennessand stand characteristics per 100 m2 subplot,analysed in a multiple regression anova. N=24. Percentage dead trees and percentagedead ba were arcsin transformed, and total bawas log transformed.
Topographical unit
Valley Low flat Mid slope High flat Ridge Total10 x 10 m subplots
Burned 14 17 20 170 75 25 12 333Unburned* 2 10 0 5 1 1 0 19Total 16 27 20 175 76 26 12 352
20 x 20 m subplotsBurned 9 13 27 120 60 25 13 267Unburned* 3 5 5 11 3 3 0 30Total 12 18 32 131 63 28 13 297
Fire history
Lower slope
Upper slope
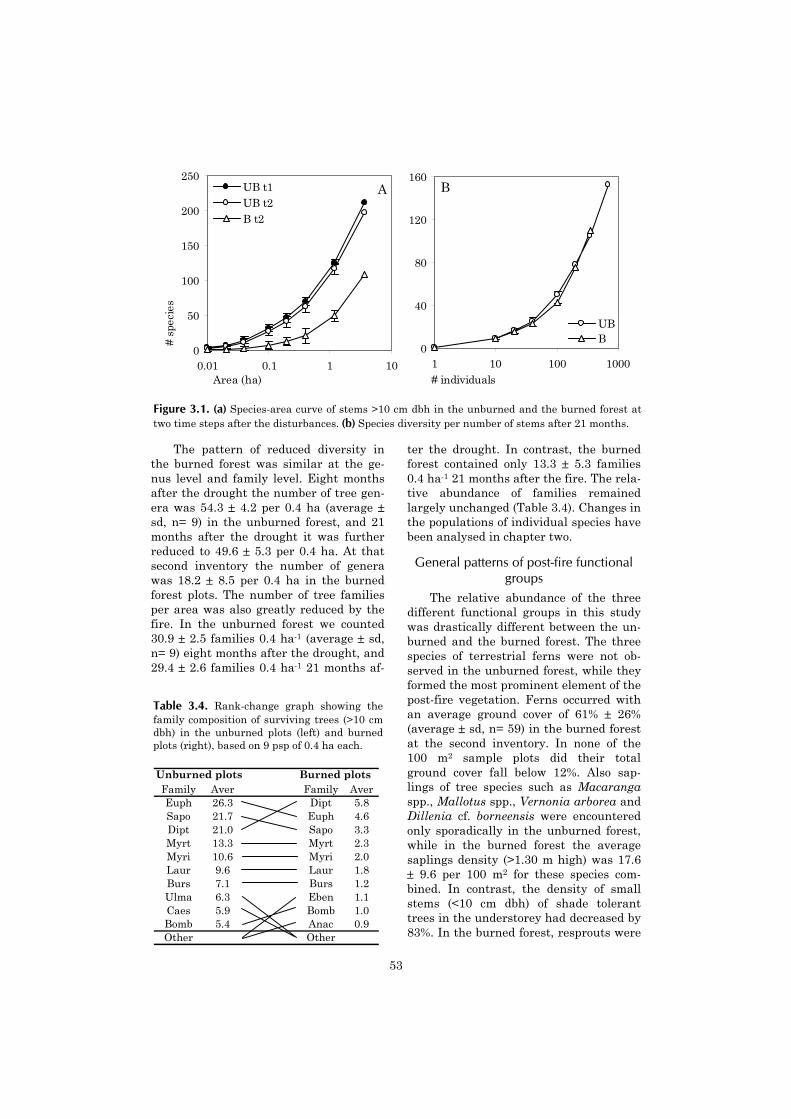
tnaesmrswfpf3n2
A
0
50
100
150
200
250
0.01 0.1 1 10Area (ha)
# sp
ecie
s
UB t1UB t2B t2
B
0
40
80
120
160
1 10 100 1000# individuals
UBB
Tfdp
Ft
igure 3.1. (a) Species-area curve of stems >10 cm dbh in the unburned and the burned forest atwo time steps after the disturbances. (b) Species diversity per number of stems after 21 months.53
The pattern of reduced diversity inhe burned forest was similar at the ge-us level and family level. Eight monthsfter the drought the number of tree gen-ra was 54.3 ± 4.2 per 0.4 ha (average ±d, n= 9) in the unburned forest, and 21onths after the drought it was further
educed to 49.6 ± 5.3 per 0.4 ha. At thatecond inventory the number of generaas 18.2 ± 8.5 per 0.4 ha in the burned
orest plots. The number of tree familieser area was also greatly reduced by theire. In the unburned forest we counted0.9 ± 2.5 families 0.4 ha-1 (average ± sd,= 9) eight months after the drought, and9.4 ± 2.6 families 0.4 ha-1 21 months af-
ter the drought. In contrast, the burnedforest contained only 13.3 ± 5.3 families0.4 ha-1 21 months after the fire. The rela-tive abundance of families remainedlargely unchanged (Table 3.4). Changes inthe populations of individual species havebeen analysed in chapter two.
General patterns of post-fire functionalgroups
The relative abundance of the threedifferent functional groups in this studywas drastically different between the un-burned and the burned forest. The threespecies of terrestrial ferns were not ob-served in the unburned forest, while theyformed the most prominent element of thepost-fire vegetation. Ferns occurred withan average ground cover of 61% ± 26%(average ± sd, n= 59) in the burned forestat the second inventory. In none of the100 m2 sample plots did their totalground cover fall below 12%. Also sap-lings of tree species such as Macarangaspp., Mallotus spp., Vernonia arborea andDillenia cf. borneensis were encounteredonly sporadically in the unburned forest,while in the burned forest the averagesaplings density (>1.30 m high) was 17.6± 9.6 per 100 m2 for these species com-bined. In contrast, the density of smallstems (<10 cm dbh) of shade toleranttrees in the understorey had decreased by83%. In the burned forest, resprouts were
Unburned plots Burned plotsFamily Aver Family AverEuph 26.3 Dipt 5.8Sapo 21.7 Euph 4.6Dipt 21.0 Sapo 3.3Myrt 13.3 Myrt 2.3Myri 10.6 Myri 2.0Laur 9.6 Laur 1.8Burs 7.1 Burs 1.2Ulma 6.3 Eben 1.1Caes 5.9 Bomb 1.0Bomb 5.4 Anac 0.9Other Other
able 3.4. Rank-change graph showing theamily composition of surviving trees (>10 cmbh) in the unburned plots (left) and burnedlots (right), based on 9 psp of 0.4 ha each.

54
present at a density of 22 ± 9.6 per 100m2, compared with a density of stems <10cm dbh before the fire of 129 ± 38 per 100m2. The fact that the main post-fire func-tional groups, ferns and light-demandingsaplings, were all but absent from theunburned forest makes an in-depth com-parison between the unburned andburned vegetation redundant. The fol-lowing analyses principally concern vege-tation patterns in the burned forest.
A correspondence analysis was em-ployed as an exploratory analysis of thevegetation composition in the burned for-
est (Figure 3.2). The first axis wasstrongest related to the percentageground cover of Pteridium caudatum. Thestem density of Dillenia cf. borneensiswas most strongly related with the secondaxis. Especially on the first axis, saplingstended to be far removed from Pteridiumcaudatum. The environmental variablescorrelating best with the first axis weresite and canopy openness (Table 3.5). Thesecond axis was marginally correlatedwith canopy openness and the percentagedead trees. Topographic units tended tobe ordered in a sequence along the first
Figure 3.2. Representation of 15 taxa 21 months after fire based on a correspondence analysis on59 burned subplots of 100 m2 in Sungai Wain forest. The sum of all eigenvalues is 0.53. Axis 1 hasan eigenvalue of 0.18 and explains 34 % of all variance. Axis 2 has an eigenvalue of 0.11 and ex-plains 20.5 % of all variance. Environmental variables are depicted as centroids (topographic class,site) or as biplot scores (other variables). The position of canopy openness was calculated in spss inorder to account for missing values, and its absolute position cannot be readily compared with theother environmental variables.Legenda: Species data points represent: Brac= Pteridium caudatum, Fine fern= Microlepia spelun-cae, Simp fern= Blechnum orientale, All fern= three fern species combined, All seedl= sum of allrecorded seedlings, Dill= Dillenia sp., Ficu= Ficus spp., Impcyl= Imperata cylindrica, Maca= allMacaranga spp., Macgig= Macaranga gigantea, Malpan= Mallotus paniculatus, Miksca= Mikaniascandens, Rubi= Rubiaceae, Sprout= sum of all resprouts, Verarb= Vernonia arborea. Environ-mental variable datapoints represent: Can open= canopy openness, % dead ba= percentage deadbasal area, % dead trees= percentage dead trees, lg tot ba= logarithm of total basal area (living +dead), Site= location of the plot (see text), 1-5 are topographical units (see table 5). Correlationsbetween axes and environmental variables are given in table 5.
ImpcylSprout
MalpanSimp fern
Verarb
All fernFine fern
MacaMacgig
MikscaAll seedl
Ficu
BracDill
Rubi
lg tot ba
% dead trees% dead ba
Site
3
2 5
4
1
Can open
Axis 2
Axis 1
2
-2 2
-2

55
axis, but unit 5 (ridges and high flat ar-eas) did not fit this pattern. Based on thecorrespondence analysis, we decided toinclude Pteridium caudatum, where ap-propriate, as an independent variable inthe multivariate analyses below.
The multivariate analyses were em-ployed to test for (1) the influence of thelevel of fire-damage to the vegetation, (2)possible inhibiting effects between func-tional groups, and (3) effects of locationand topography on the density of threepost-fire functional groups. The tests pro-vided significant levels of explanation forthe density of ferns and sprouts, and anearly significant level of explanation forthe density of all saplings (Table 3.6). Asexpected, we found a negative relationbetween fern cover and the density ofsaplings (Figure 3.3). There was no suchrelation with sprout density. Contrary toexpectation, the percentage dead trees
was not related to the density of any ofthe three groups. Total fern cover wasbest explained by the density of saplingsand partly by slope class. Sapling densitywas partly explained by slope class andfern cover. The density of pre-fire stemswith a dbh <10 cm largely explained thedensity of sprouts. The patterns of indi-vidual species did often divert considera-bly from the patterns of these broadfunctional groups.
Non-woody species Three fern species where highly
abundant (Figure 3.4). Especially Blech-num orientale L. was extremely commonin the burned forest. Spatial variation inthe density of these three species de-pended on different factors (Table 3.6).Pteridium caudatum (L.) Maxon. wasassociated with high percentages of deadtrees, especially in the west-site (Figure
Environmental factor n Axis 1 Axis 2Site 59 0.51 ** 0.08Canopy Openness 24 0.42 * 0.36 (*)% dead trees 59 0.223 (*) 0.24 (*)% dead BA 59 .30 * 0.21log BA 59 -0.08 -0.131. low flat / valley 9 -0.24 (*) -0.202. Low slope 8 -0.07 0.133. Mid slope 23 0.03 -0.104. High slope 11 0.21 0.015. High flat / ridge 8 0.04 0.20
Table 3.5. Pearson’s coefficients of cor-relation of environmental variables withthe 1st and 2nd axis of the correspondenceanalysis. Significant correlations areflagged: (*): p< 0.10, *: p< 0.05, **: p <0.01.
0
20
40
60
80
100
0 40 80 120% Fern cover
All
seed
lings
(#
100
m-2
)
FlatGentleSteep
Figure 3.3. Percentage ground cover of fernsversus the density of seedlings in the burnedforest. Different symbols indicate slopeclasses. n= 59.
0
10
20
30
40
50
60
25 50 75 100
% dead trees
% P
teri
dium
Site 1Site 2
85%
Figure 3.5. Percentage ground cover ofPteridium caudatum versus the percentagedead trees in the burned forest. n= 59.

56
3.5). The density of Microlepia speluncae(L.) Moore differed significantly betweenthe two sites and was related to topogra-phy, being highest on low slopes and midslopes. The density of Blechnum orientaledecreased with increasing slope.
Ferns first established in locationswhere smouldering logs had been con-sumed by fire, leaving a bed of ash. Thelong period of heat production (often inthe order of several days) in these loca-tions must have sterilised the soil. Thefact that these sites were the first to beoccupied by ferns implies that fern sporesarrived after the fire from outside theburned area. Even though 6 months afterthe fire the plants were still small, theyformed a dense cover in these sites. Fromthis we infer that spores must have ar-rived in high densities, since there is noreason to believe that the sterilised siteswould have received a higher than aver-age influx of spores. Reaching a maxi-mum height of 1.5 to 2 m, the fern coverhad overgrown many of the seedlings andresprouts approximately one year afterthe fire.
Other non-woody species were muchless abundant than ferns, which is thereason we did not include them in the
anova analyses. Imperata cylindrica waspresent in 61% of the 100 m2 subplots,but the ground cover was never dense norclosed, with an average of 1.7 ± 2.9% per100 m2 plot (average ± sd, n= 59). Thevine species Mikania scandens was pres-ent in 72% of the subplots and formed alocally dense layer of vegetation with anaverage ground cover of 4.6 ± 7.3% and amaximum cover of 39%.
Light-demanding tree saplings The community of tree saplings that
established after the fire was predomi-nantly formed by a few light-demandingspecies (Table 3.7). Based on a compari-son with a complete inventory of seed-lings in the burned Sungai Wain forest(Priadjati 1999) we estimate that the con-tribution of other species to the total den-sity of saplings >1.30 m high was around10%.
Sapling densities of Vernonia arbo-rea, Macaranga gigantea and were con-siderable, given the density of adult treesin the plots which was low (respectively<0.5 and 0.8 trees ha-1). The density ofDillenia cf. borneensis was 3.9 trees ha-1
(>10 cm dbh).
0
20
40
60
80
100
120
Blechnumorientale
Microlepiaspeluncae
Pteridiumcaudatum
Total
% g
roun
d co
ver
-
-
-
-
-
-
-
-
Figure 3.4. Percentage ground cover of the three most commonfern species in the burned forest, 21 months after the fire.Given are the average ± sd. The short bold markings indicatemaximum and minimum values. Values are based on 59 plots of100 m2 each. Because in some cases different species overshadeeach other, the total coverage can be above 100%.
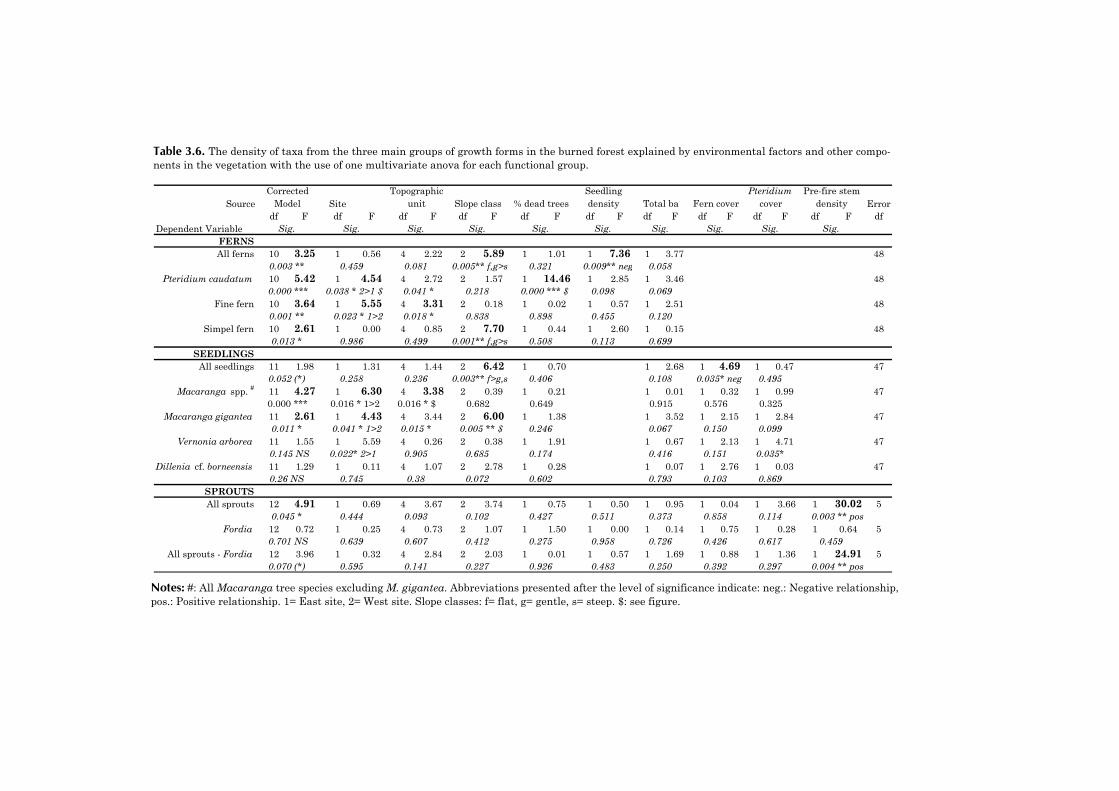
Notes: #: All Macaranga tree species excluding M. gigantea. Abbreviations presented after the level of significance indicate: neg.: Negative relationship, pos.: Positive relationship. 1= East site, 2= West site. Slope classes: f= flat, g= gentle, s= steep. $: see figure.
Source Site Errordf F df F df F df F df F df F df F df F df F df F df
Dependent VariableFERNSAll ferns 10 3.25 1 0.56 4 2.22 2 5.89 1 1.01 1 7.36 1 3.77 48
Pteridium caudatum 10 5.42 1 4.54 4 2.72 2 1.57 1 14.46 1 2.85 1 3.46 48
Fine fern 10 3.64 1 5.55 4 3.31 2 0.18 1 0.02 1 0.57 1 2.51 48
Simpel fern 10 2.61 1 0.00 4 0.85 2 7.70 1 0.44 1 2.60 1 0.15 48
SEEDLINGSAll seedlings 11 1.98 1 1.31 4 1.44 2 6.42 1 0.70 1 2.68 1 4.69 1 0.47 47
Macaranga spp. # 11 4.27 1 6.30 4 3.38 2 0.39 1 0.21 1 0.01 1 0.32 1 0.99 47
Macaranga gigantea 11 2.61 1 4.43 4 3.44 2 6.00 1 1.38 1 3.52 1 2.15 1 2.84 47
Vernonia arborea 11 1.55 1 5.59 4 0.26 2 0.38 1 1.91 1 0.67 1 2.13 1 4.71 47
Dillenia cf. borneensis 11 1.29 1 0.11 4 1.07 2 2.78 1 0.28 1 0.07 1 2.76 1 0.03 47
SPROUTSAll sprouts 12 4.91 1 0.69 4 3.67 2 3.74 1 0.75 1 0.50 1 0.95 1 0.04 1 3.66 1 30.02 5
Fordia 12 0.72 1 0.25 4 0.73 2 1.07 1 1.50 1 0.00 1 0.14 1 0.75 1 0.28 1 0.64 5
All sprouts - Fordia 12 3.96 1 0.32 4 2.84 2 2.03 1 0.01 1 0.57 1 1.69 1 0.88 1 1.36 1 24.91 5
0.649 0.915 0.576 0.3250.000 *** 0.016 * 1>2 0.016 * $ 0.682
0.003 ** 0.459 0.081 0.321
0.986 0.001** f,g>s
0.058
0.069
0.120
0.6990.113
0.898 0.455
0.098
0.444
0.639
0.595
0.093
0.607
0.141 0.227
0.427
0.275
0.926
0.246
0.617
0.297
0.511
0.958
0.483
0.373
0.726
0.250
Sig.Sig.Sig.
0.035*
0.150 0.099
Sig.Sig.Sig. Sig.Sig.Sig.Sig.
Fern coverPteridium
coverCorrected
ModelTopographic
unit Slope class % dead treesPre-fire stem
density
0.005** f,g>s 0.009** neg
0.000 *** 0.038 * 2>1 $ 0.041 * 0.000 *** $0.218
Seedling density Total ba
0.041 * 1>2 0.015 * 0.005 ** $
0.001 ** 0.023 * 1>2 0.018 * 0.838
0.011 *
0.013 *
0.052 (*)
0.5080.499
0.004 ** pos
0.003 ** pos
0.035* neg 0.495
0.174 0.416 0.151
0.067
0.070 (*)
0.701 NS
0.045 *
0.459
0.392
0.426
0.858 0.1140.102
0.412
0.258 0.236 0.003** f>g,s 0.1080.406
0.145 NS 0.022* 2>1 0.905 0.685
0.26 NS 0.745 0.38 0.072 0.602 0.793 0.103 0.869
Table 3.6. The density of taxa from the three main groups of growth forms in the burned forest explained by environmental factors and other compo-nents in the vegetation with the use of one multivariate anova for each functional group.
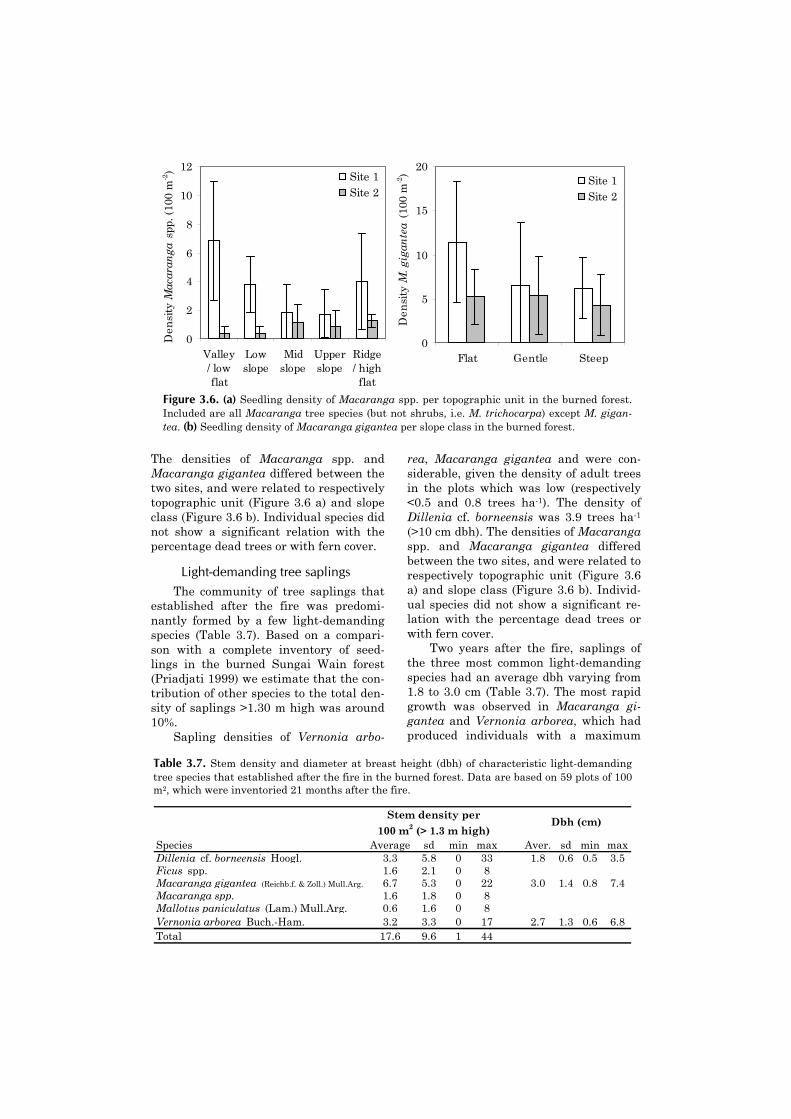
The densities of Macaranga spp. andMacaranga gigantea differed between thetwo sites, and were related to respectivelytopographic unit (Figure 3.6 a) and slopeclass (Figure 3.6 b). Individual species didnot show a significant relation with thepercentage dead trees or with fern cover.
Light-demanding tree saplings The community of tree saplings that
established after the fire was predomi-nantly formed by a few light-demandingspecies (Table 3.7). Based on a compari-son with a complete inventory of seed-lings in the burned Sungai Wain forest(Priadjati 1999) we estimate that the con-tribution of other species to the total den-sity of saplings >1.30 m high was around10%.
Sapling densities of Vernonia arbo-
rea, Macaranga gigantea and were con-siderable, given the density of adult treesin the plots which was low (respectively<0.5 and 0.8 trees ha-1). The density ofDillenia cf. borneensis was 3.9 trees ha-1
(>10 cm dbh). The densities of Macarangaspp. and Macaranga gigantea differedbetween the two sites, and were related torespectively topographic unit (Figure 3.6a) and slope class (Figure 3.6 b). Individ-ual species did not show a significant re-lation with the percentage dead trees orwith fern cover.
Two years after the fire, saplings ofthe three most common light-demandingspecies had an average dbh varying from1.8 to 3.0 cm (Table 3.7). The most rapidgrowth was observed in Macaranga gi-gantea and Vernonia arborea, which hadproduced individuals with a maximum
Species Average sd min max Aver. sd min maxDillenia cf. borneensis Hoogl. 3.3 5.8 0 33 1.8 0.6 0.5 3.5Ficus spp. 1.6 2.1 0 8Macaranga gigantea (Reichb.f. & Zoll.) Mull.Arg. 6.7 5.3 0 22 3.0 1.4 0.8 7.4Macaranga spp. 1.6 1.8 0 8Mallotus paniculatus (Lam.) Mull.Arg. 0.6 1.6 0 8Vernonia arborea Buch.-Ham. 3.2 3.3 0 17 2.7 1.3 0.6 6.8Total 17.6 9.6 1 44
Stem density per 100 m2 (> 1.3 m high)
Dbh (cm)
Table 3.7. Stem density and diameter at breast height (dbh) of characteristic light-demandingtree species that established after the fire in the burned forest. Data are based on 59 plots of 100m2, which were inventoried 21 months after the fire.
0
2
4
6
8
10
12
Valley/ lowflat
Lowslope
Midslope
Upperslope
Ridge/ highflat
Den
sity
Mac
aran
ga s
pp. (
100
m-2) Site 1
Site 2
0
5
10
15
20
Flat Gentle Steep
Den
sity
M. g
igan
tea
(100
m-2)
Site 1Site 2
Figure 3.6. (a) Seedling density of Macaranga spp. per topographic unit in the burned forest.Included are all Macaranga tree species (but not shrubs, i.e. M. trichocarpa) except M. gigan-tea. (b) Seedling density of Macaranga gigantea per slope class in the burned forest.
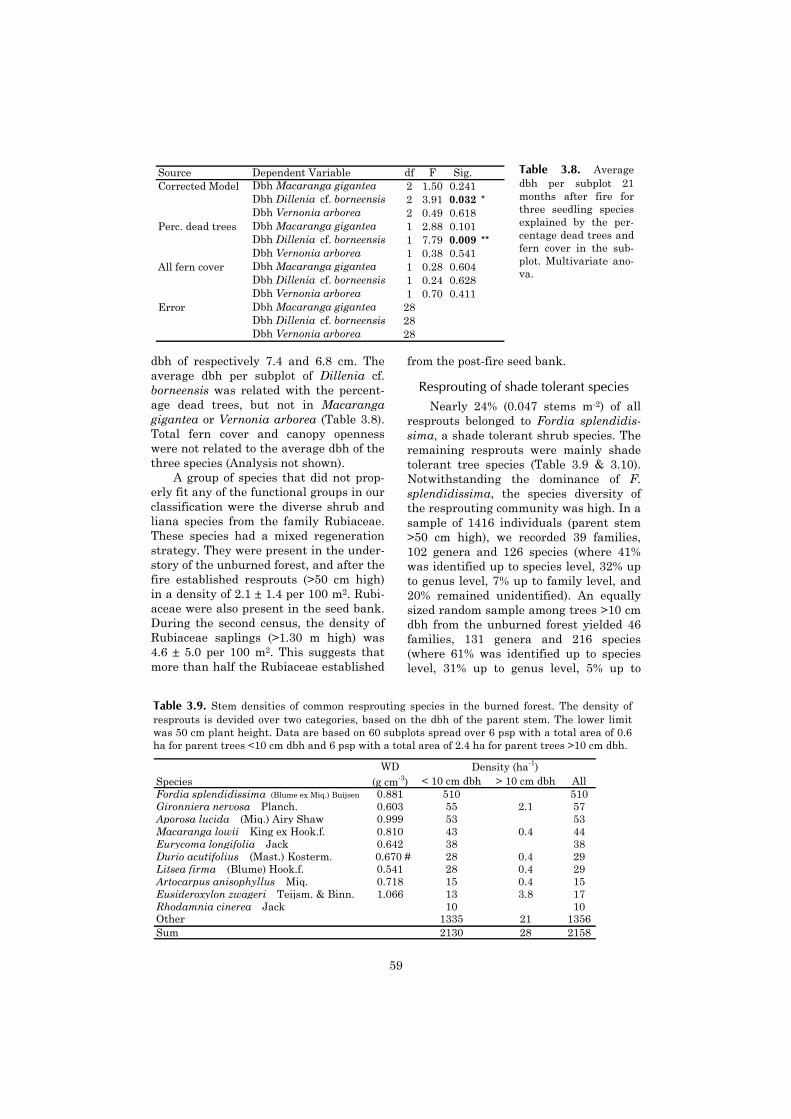
59
dbh of respectively 7.4 and 6.8 cm. Theaverage dbh per subplot of Dillenia cf.borneensis was related with the percent-age dead trees, but not in Macarangagigantea or Vernonia arborea (Table 3.8).Total fern cover and canopy opennesswere not related to the average dbh of thethree species (Analysis not shown).
A group of species that did not prop-erly fit any of the functional groups in ourclassification were the diverse shrub andliana species from the family Rubiaceae.These species had a mixed regenerationstrategy. They were present in the under-story of the unburned forest, and after thefire established resprouts (>50 cm high)in a density of 2.1 ± 1.4 per 100 m2. Rubi-aceae were also present in the seed bank.During the second census, the density ofRubiaceae saplings (>1.30 m high) was4.6 ± 5.0 per 100 m2. This suggests thatmore than half the Rubiaceae established
from the post-fire seed bank.
Resprouting of shade tolerant speciesNearly 24% (0.047 stems m-2) of all
resprouts belonged to Fordia splendidis-sima, a shade tolerant shrub species. Theremaining resprouts were mainly shadetolerant tree species (Table 3.9 & 3.10).Notwithstanding the dominance of F.splendidissima, the species diversity ofthe resprouting community was high. In asample of 1416 individuals (parent stem>50 cm high), we recorded 39 families,102 genera and 126 species (where 41%was identified up to species level, 32% upto genus level, 7% up to family level, and20% remained unidentified). An equallysized random sample among trees >10 cmdbh from the unburned forest yielded 46families, 131 genera and 216 species(where 61% was identified up to specieslevel, 31% up to genus level, 5% up to
Source Dependent Variable df F Sig.Corrected Model Dbh Macaranga gigantea 2 1.50 0.241
Dbh Dillenia cf. borneensis 2 3.91 0.032 *Dbh Vernonia arborea 2 0.49 0.618
Perc. dead trees Dbh Macaranga gigantea 1 2.88 0.101Dbh Dillenia cf. borneensis 1 7.79 0.009 **Dbh Vernonia arborea 1 0.38 0.541
All fern cover Dbh Macaranga gigantea 1 0.28 0.604Dbh Dillenia cf. borneensis 1 0.24 0.628Dbh Vernonia arborea 1 0.70 0.411
Error Dbh Macaranga gigantea 28Dbh Dillenia cf. borneensis 28Dbh Vernonia arborea 28
Table 3.8. Averagedbh per subplot 21months after fire forthree seedling speciesexplained by the per-centage dead trees andfern cover in the sub-plot. Multivariate ano-va.
Table 3.9. Stem densities of common resprouting species in the burned forest. The density ofresprouts is devided over two categories, based on the dbh of the parent stem. The lower limitwas 50 cm plant height. Data are based on 60 subplots spread over 6 psp with a total area of 0.6ha for parent trees <10 cm dbh and 6 psp with a total area of 2.4 ha for parent trees >10 cm dbh.
WDSpecies (g cm-3) < 10 cm dbh > 10 cm dbh AllFordia splendidissima (Blume ex Miq.) Buijsen 0.881 510 510Gironniera nervosa Planch. 0.603 55 2.1 57Aporosa lucida (Miq.) Airy Shaw 0.999 53 53Macaranga lowii King ex Hook.f. 0.810 43 0.4 44Eurycoma longifolia Jack 0.642 38 38Durio acutifolius (Mast.) Kosterm. 0.670 # 28 0.4 29Litsea firma (Blume) Hook.f. 0.541 28 0.4 29Artocarpus anisophyllus Miq. 0.718 15 0.4 15Eusideroxylon zwageri Teijsm. & Binn. 1.066 13 3.8 17Rhodamnia cinerea Jack 10 10Other 1335 21 1356Sum 2130 28 2158
Density (ha-1)

60
family level, and 3% remained unidenti-fied).
Most of the sprouts on parent stems<10 cm dbh originated from the base ofthe stem (93%). The majority originatedfrom (just) below ground parts (64%),whereas fewer originated from above-ground parts or from both above-groundand below ground parts (30%). The re-maining 7% of the resprouting individuals
resprouted along the stem. Root sproutswere very rare. Small stems contributeenormously to the post-fire sprout density(Figure 3.7). Partly, this is caused by aten-fold decrease in sprouting frequencybetween parent stems which range in sizefrom 0-1.9 cm dah to >50 cm dbh (Figure3.8). However, the pattern is mainly theresult of an exponential decrease of stemdensity with size, which is found in most
Table 3.10. Stem densities of common resprouting genera in the burned forest.
Table 3.11. Wood density, stem density (>50 cm high) and the estimated percentage sproutingstems of six shade tolerant species in unburned forest and the density of resprouts in adjacentburned forest.
Note: * The value for the wood density of D. acutifolius is the genus average (0.670 ± 0.056 g cm-3
(average ± sd, n= 9)).
Genus Family < 10 cm dbh > 10 cm dbh AllFordia Palilionaceae 510 510Syzygium Myrtaceae 105 0.4 105Xanthophyllum Polygalaceae 70 70Aporosa Euphorbiaceae 65 0.4 65Litsea Lauraceae 57 1.3 58Urophyllum Rubiaceae 55 55Gironniera Ulmaceae 52 2.1 54Salacia Celastraceae 53 53Macaranga Euphorbiaceae 45 0.4 45Barringtonia Lecythidiaceae 40 0.4 40Eurycoma Simaroubaceae 38 38Artocarpus Moraceae 37 0.8 38Durio Bombacaceae 37 0.8 38Popowia Annonaceae 35 35Pternandra Melastomataceae 27 27Archidendron Mimosoidae 22 22Nephelium Sapindaceae 20 20Cotylelobium Dipterocarpaceae 18 0.4 19Eusideroxylon Lauraceae 13 3.8 17Lithocarpus Fagaceae 13 0.8 14Baccaurea Euphorbiaceae 13 0.4 14Dacryodes Burseraceae 13 0.4 14Polyalthia Annonaceae 13 0.4 14Ixora Rubiaceae 12 12Tetracera Dilleniaceae 12 12Other 752 15.4 767Sum 2127 28 2155
Density (ha-1)
Wood density (g cm-3)
Species Average Average sd Average sdDipterocarpus confertus Sloot. 0.803 2.0 2.9 0.05 0.22 2.5Durio acutifolius (Mast.) Kosterm. 0.670 * 3.6 2.5 0.40 0.71 11Fordia splendidissima (Blume ex Miq.) Buijsen 0.881 5.5 4.8 5.6 4.0 102Gironera nervosa Planch. 0.603 4.4 5.1 0.68 1.07 15Macaranga lowii King ex Hook.f. 0.810 10.2 11.0 0.55 0.81 5.4Shorea laevis Ridl. 0.933 6.3 7.9 0.03 0.16 0.4
Stem density per 100 m2 in
unburned forest
Sprout density per 100 m2 in burned forest Estimated %
sprouting
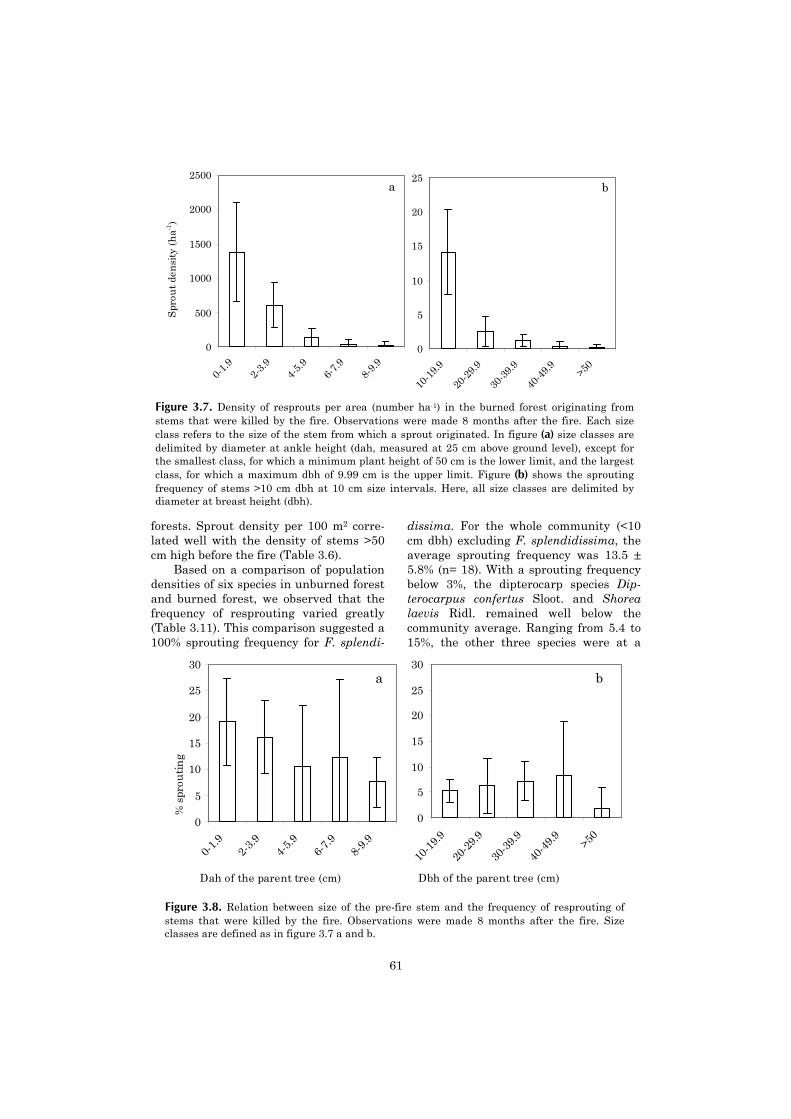
folac
dafr(T1
0
500
1000
1500
2000
2500
0-1.9
2-3.9
4-5.9
6-7.9
8-9.9
Spr
out
dens
ity
(ha-1
)
0
5
10
15
20
25
10-1
9.9
20-2
9.9
30-3
9.9
40-4
9.9 >50
a b
Fscdtcfd
Dah of the parent tree (cm) Dbh of the parent tree (cm)igure 3.7. Density of resprouts per area (number ha-1) in the burned forest originating fromtems that were killed by the fire. Observations were made 8 months after the fire. Each sizelass refers to the size of the stem from which a sprout originated. In figure (a) size classes areelimited by diameter at ankle height (dah, measured at 25 cm above ground level), except forhe smallest class, for which a minimum plant height of 50 cm is the lower limit, and the largestlass, for which a maximum dbh of 9.99 cm is the upper limit. Figure (b) shows the sproutingrequency of stems >10 cm dbh at 10 cm size intervals. Here, all size classes are delimited byiameter at breast height (dbh).
61
rests. Sprout density per 100 m2 corre-ted well with the density of stems >50
m high before the fire (Table 3.6). Based on a comparison of population
ensities of six species in unburned forestnd burned forest, we observed that theequency of resprouting varied greatlyable 3.11). This comparison suggested a
00% sprouting frequency for F. splendi-
dissima. For the whole community (<10cm dbh) excluding F. splendidissima, theaverage sprouting frequency was 13.5 ±5.8% (n= 18). With a sprouting frequencybelow 3%, the dipterocarp species Dip-terocarpus confertus Sloot. and Shorealaevis Ridl. remained well below thecommunity average. Ranging from 5.4 to15%, the other three species were at a
Figure 3.8. Relation between size of the pre-fire stem and the frequency of resprouting ofstems that were killed by the fire. Observations were made 8 months after the fire. Sizeclasses are defined as in figure 3.7 a and b.
0
5
10
15
20
25
30
10-1
9.9
20-2
9.9
30-3
9.9
40-4
9.9 >50
Dbh of the parent tree (cm)
0
5
10
15
20
25
30
0-1.9
2-3.9
4-5.9
6-7.9
8-9.9
Dah of the parent tree (cm)
% s
prou
ting
a b

62
sprouting level close to the communityaverage. The five tree species in this com-parison (i.e. excl. Fordia splendidissima)showed a strong negative relationshipbetween sprouting frequency and wooddensity (y= -38.9 x + 37.1, R2= 0.89).
Sprouts grew fast in the first 21months after the fire. The average sproutlength eight months after the fire was25.1 ± 19.2 cm (3.1 ± 2.4 cm month-1).Sprouts grew another 80.3 ± 71.3 cm (6.2± 5.5 cm month-1) in the 13 months thatfollowed. As predicted, length growth ofsprouts was negatively related to specificwood density (Figure 3.9 a). Sprout sur-vival was fairly high between the cen-suses 8 and 21 months after the fire: 83%of the sprouts survived, whereas the fateof another 11% remained unclear. Sproutsurvival was not significantly correlatedto wood density (Figure 3.9 b).
Discussion
Spatial patterns in damage and lightavailability
In the current study, unburnedpatches were scarce, and so were verylightly burned patches that were observedin the field to have a largely intact can-opy, and a vegetation development muchmore similar to unburned forest. Un-
burned patches and lightly burnedpatches were associated with low flat ar-eas and low slopes and valleys. In a yearwith an average precipitation, many lowflat areas are saturated with water. Lowslopes and valleys experience a lower ir-radiation, lower wind speeds and a rela-tively high water influx. For thesereasons they may have been slightly wet-ter than their surroundings at the timethe fire arrived.
The percentage tree mortality ex-plained little of the variation in the post-fire vegetation apart from the percentagecover of Pteridium caudatum. We assumethat the spatial variation in fire-intensitywas low, leaving a fairly homogeneouslydisturbed vegetation. This contrastssharply with the effects of fire in temper-ate forests, where fire characteristicallycreates a landscape mosaic of distur-bances (Turner et al. 1994).
Different processes determine thepost-fire demographical dynamics of thethree functional groups in this study.Non-woody species were probably presentin the vegetation through establishmentfrom the seed bank and post-fire seedrain. Light-demanding tree species estab-lished from the seed bank, although seedsof some species (notably Vernonia arbo-rea) may have been wind-dispersed afterthe fire. Populations of shade tolerant
Figure 3.9. Wood density as an indicator for (a) length growth of sprouts and (b) sprout survivalover the period from 8 months until 21 months after fire. One-tailed Pearson correlations reveal asignificant correlation between wood density and sprout length growth (Pears. corr. -0.51, p= 0.05,n= 12) and no significant correlation between wood density and survival (Pears. corr. 0.090, p=0.40, n=10).
50
60
70
80
90
100
0.4 0.6 0.8 1 1.2
Wood density (g cm-3)
% s
urv
ival
1.4
1.6
1.8
2.0
2.2
0.4 0.6 0.8 1 1.2
Wood density (g cm-3)
Log
(L
engt
h g
row
th)
(cm
yea
r-1)
a b

63
tree species were maintained throughsurvival of stems and resprouting frombasal parts, whereas post-fire seed dis-persal was not observed.
Shade tolerant speciesFor shade tolerant species, post-
disturbance seed dispersal is often im-plicitly expected to an important factor inpopulation development after a distur-bance. Instead, the present study showsthat in the first two years after fire, mostof the stem density and species diversityactually resulted from resprouting stems.The local diversity of surviving adulttrees was severely reduced up to a scale ofat least several hectares. Since seed dis-persal of large-seeded species is usuallystrongly skewed (Howe & Smallwood1982), the local seed rain will be species-poor in the years to come. It is thereforemost likely that the seed rain will containfewer species than the already estab-lished local vegetation of resprouts.Moreover, shade tolerant trees wererarely observed to fruit in the two yearsafter fire, which followed upon a mast-season a few months prior to the fires(Kiyono & Hastaniah 2001, G.Fredriksson, pers. com.). Thus, the seedrain appears to be much less importantthan expected. In this situation it be-comes very important to understand spe-cies-specific differences in sproutingcapacity.
On a per area basis, most of the re-sprouts originated from small stems. Thisis partly explained by the size-dependentten-fold decrease in sprouting frequency.However, of much larger influence wasthe composition of the stem populationbefore the fire, which showed a more than7000-fold decrease in stem density overthe same size range (Figure 3.7). Theabove ground living tissue of small indi-viduals was at higher risk of mortality,because a thin bark is a less effective pro-tection against fire heat (Gill & Ashton1968, Vines 1968, Uhl & Kauffman 1990,Pinard & Huffman 1997). Thus, the rela-tionship between tree size and sproutingfrequency depended on the capability ofseedlings and saplings to sprout frombelow ground parts.
Even though small individuals payedthe largest contribution to the post-firedensity of sprouts, the actual frequency ofsprouting after fire was much lower thanthe sprouting frequency that has beenobserved for tropical trees after breakageof the main stem (respectively 14% afterfire versus 65-100% after stem breakage,Guarigata 1998, Chapter 4). To under-stand potential limitations to sproutingability after fire, we performed a prelimi-nary experiment in which saplings wereclipped at ground level, respectively at 10cm above ground level (six species, n= 30per treatment). Plants clipped at groundlevel had a sprouting percentage rangingfrom 0 to 41% (average 19%) relative tothe sprouting frequency of plants clippedat 10 cm above ground level. This lowability of plants to sprout from belowground level explains the relatively lowsprouting frequency of small individualsafter fire. An intrinsically lower capacityof the root tissue to produce sproutingbuds, or the stimulation of bud develop-ment by light availability could cause thislow sprouting frequency.
We expected that wood density mightbe a useful proxy to predict specific sproutgrowth. Species with a high wood densityhad a lower relative growth rate, whilesprout survival rate was not significantlyrelated to wood density. Due to the spe-cies-specific differences in sprouting ca-pacity, heavy-wooded species will beunderrepresented in the post-fire re-sprout community. The species-specificsprouting capacity of saplings is analysedin more detail in chapter 4.
Light-demanding tree speciesMacaranga gigantea, Dillenia cf.
borneensis and Vernonia arborea werevery rare as adult trees in the unburnedpsp, and yet they were common as sap-lings in the burned forest. Macarangagigantea and Dillenia cf. borneensis, andto a lesser extent Vernonia arborea, pro-duce quite large seeds which are probablynot dispersed very far. Instead of beinggood dispersers in space, we presume thatthese species “disperse in time”, i.e. theysurvive for considerable periods of time in

64
the soil seed bank (review by Garwood1989).
We found no significant relation be-tween the percentage dead trees and sap-ling density. The relation between canopyopenness or percentage dead trees andrelative growth rate was only significantfor Dillenia cf. borneensis. This suggeststhat within the range of light availabilitycreated by the fire (95% of the plots had acanopy openness above 15%), seed germi-nation and sapling growth were rarelylimited by light.
The post-fire demographic dynamicsof the shrubs and lianas from the familyRubiaceae are the result of a mixed re-generation strategy. Rubiaceae estab-lished in roughly equal amounts asresprouts and as seedlings from the post-fire seed bank. This behaviour fits wellwith earlier descriptions of the regenera-tion niche of Rubiaceae. Species of thisfamily often produce very small seeds,whereas at the same time they persist inthe forest undergrowth (Metcalfe &Grubb 1995, Metcalfe et al. 1998, Met-calfe & Turner 1998).
Non-woody speciesThe three most common fern species
in the burned forest were not observed inthe nearby unburned forest before or afterthe fire. Spores of these species musthave originated from outside the reserve.However, the cultivated land surroundingthe research forest burned in the monthspreceding the fires in Sungai Wain(Hoffmann et al. 1999) and was thus un-likely to have produced large quantities offern spores. It is more likely that sporesoriginated from unburned areas which layat great distance from the research site.Spore input may have been especiallyhigh during the first rains following thefires, because a relatively high density ofspores remained dispensed in the airduring the preceding drought (Fletcher &Kirkwood 1979).
Total fern density was negatively re-lated to the density of saplings (Figure3.3). This suggests a certain level of com-petition between the two functionalgroups. Ferns and seedlings established
at approximately the same time, and bothwere capable of quickly forming a locallydense ground cover (MvN pers. obs.). De-pending on the time of establishment andthe initial population density, we regardboth functional groups to have the poten-tial to inhibit the establishment or growthof the other functional group.
Conclusion
The post-fire vegetation consists ofseveral functional groups of plants, whichshow very different patterns of estab-lishment and growth. Establishment fromthe pre-fire seed bank and from post-fireseed rain appear to be the most importantprocesses determining the demographicdynamics of non-woody species and light-demanding tree species. The populationdensity and local diversity of shade toler-ant species, however, is mainly deter-mined by the occurrence of resprouts.
The capacity of stems to resprout in-creases the resistance of the communityto a fire disturbance. This allows for arelatively rapid recovery, because speciesdo not have to recolonise the disturbedareas. If the resprouting plants are giventhe opportunity, a forest dominated byshade tolerant tree species may re-establish in a few decades. However, thethreat of a forest fire does not come inde-pendently from the threat of other distur-bances. In fact, repeated disturbances arevery likely to occur, because (1) for atleast a decade, the flammability of thepost-fire vegetation is increased, and (2)an abundance of human sources of igni-tion is available during periods ofdrought. Also, burned forests in Indonesiahave been disturbed in a government-backed move to exploit the forest for sal-vage wood (Chapter 6). Thus, a sequenceof repeated disturbances is likely to followthe first fire (Cochrane & Schulze 1999,Cochrane et al. 1999, Siegert et al. 2001).Such repeated disturbances lead to arapid degradation of the forest. Our re-search suggests that, with repeated dis-turbance, the time for recovery greatlyincreases because the density of resproutswill rapidly decrease.
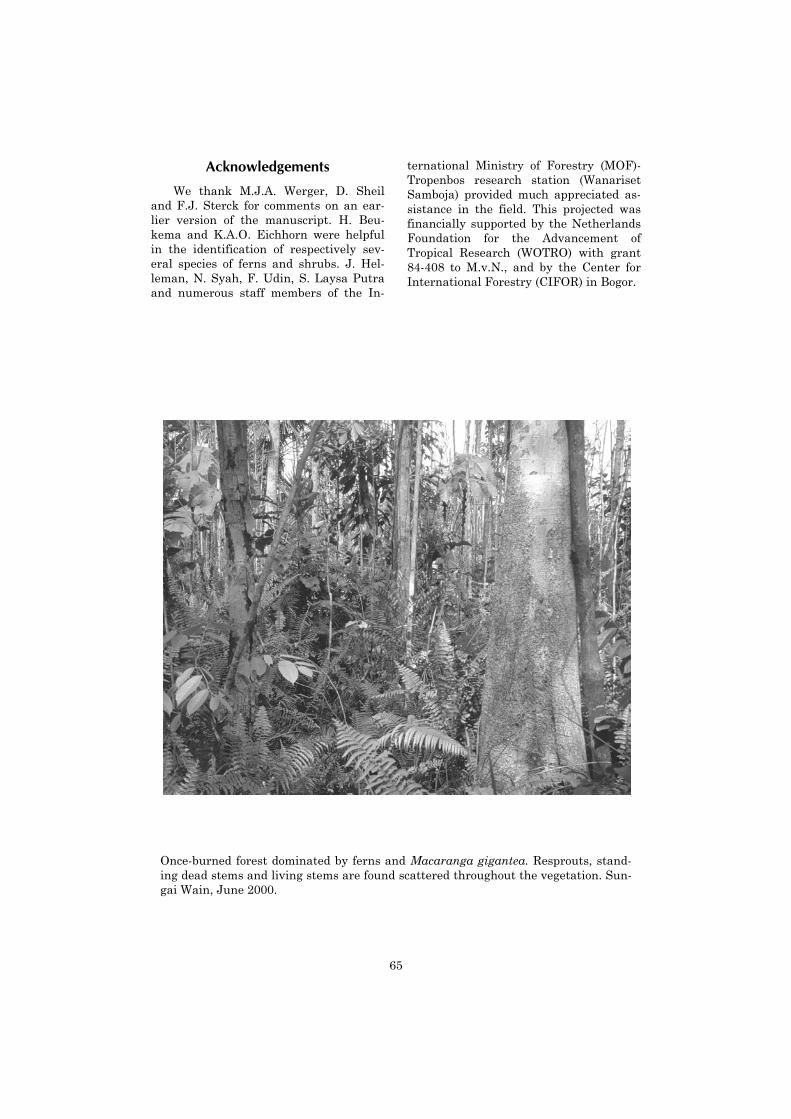
65
Acknowledgements
We thank M.J.A. Werger, D. Sheiland F.J. Sterck for comments on an ear-lier version of the manuscript. H. Beu-kema and K.A.O. Eichhorn were helpfulin the identification of respectively sev-eral species of ferns and shrubs. J. Hel-leman, N. Syah, F. Udin, S. Laysa Putraand numerous staff members of the In-
ternational Ministry of Forestry (MOF)-Tropenbos research station (WanarisetSamboja) provided much appreciated as-sistance in the field. This projected wasfinancially supported by the NetherlandsFoundation for the Advancement ofTropical Research (WOTRO) with grant84-408 to M.v.N., and by the Center forInternational Forestry (CIFOR) in Bogor.
Once-burned forest dominated by ferns and Macaranga gigantea. Resprouts, stand-ing dead stems and living stems are found scattered throughout the vegetation. Sun-gai Wain, June 2000.
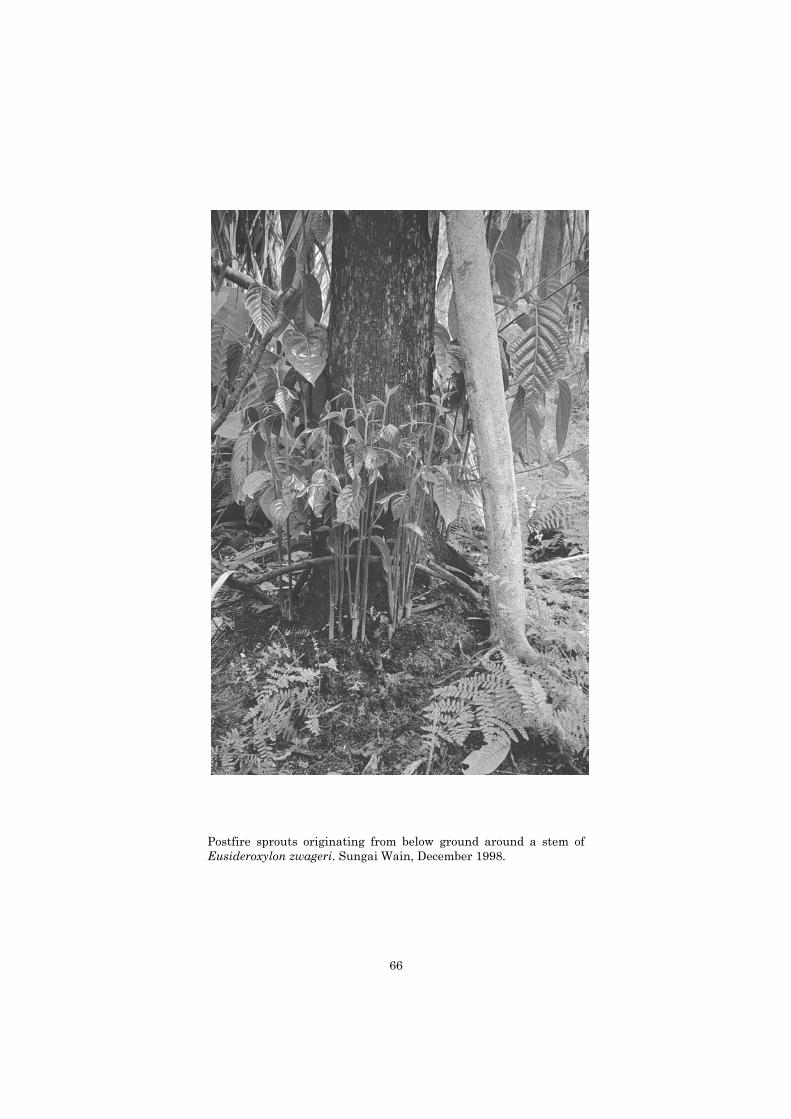
66
Postfire sprouts originating from below ground around a stem ofEusideroxylon zwageri. Sungai Wain, December 1998.
4Resprouting capacity of tropical saplings
after artificial stem breakage, and thestorage of non-structural carbohydrates
AbstractResprouting of saplings after physical disturbance is a common phenomenon in the tropical
rainforest, and plays an important role in the maintenance of populations in a disturbed environ-ment. Little is known of resprouting behaviour after severe damage, and about the importance ofstored total non-structural carbohydrates (tnc) in this respect. We studied the resprouting behav-iour of saplings of six shade tolerant tree species in a lowland dipterocarp forest in Indonesia afterartificial breakage of the main stem, inflicting the loss of all green leaves. We limited the study tothe first six months after stem breakage, during which time the plants were predicted to developthrough two stages, based on the origin of the invested carbohydrates. We predicted that the spe-cies-specific amount of carbohydrate reserves would correlate with the percentage of individualsthat sprouted, as well as the total dry mass produced. We predicted that with increasing lightavailability, the concentration of tnc would be higher, and as a result the sprouting capacity wouldbe higher. Sprout growth was expected to be correlated with specific wood density during the sec-ond stage of development, when sprouts have developed photosyntetically active tissue. Apicaldominance was disrupted by the treatment. We observed how apical dominance was restored, andhow this affected the architecture of the sprouts.
Tnc concentrations differed significantly between species. Tnc tended to be related to the per-centage of individuals that sprouted and the total dry mass produced after six months. The concen-trations of tnc thus seem to play a vital role in determining the sprouting capacity of a plant. Tncconcentrations were not related to light availability, nor were sprouting frequency or dry massproduction. This suggests that even under low light conditions, plants give a high priority to theinvestment of carbohydrates into storage, relative to investing them in growth.
We observed two distinct phases in the development of resprouts. In the first phase sproutheight growth was fast, and entirely dependent on tnc, because photosynthesising leaves were ab-sent. In the second phase, sprout height growth was much slower for most species, and greenleaves provided at least part of the photosynthates. Sprout growth in the second developmentalstage (i.e. in the 5th and 6th month after clipping) tended to be negatively correlated with specificwood density.
Sprout height growth and the development of a dominant shoot varied considerably betweenspecies. Some species had a highly dominant shoot after six months, whereas in others all shootswere of almost equal length. We suggest that this variation reflects a trade-off between rapid lat-eral extension of the crown, which maximises light interception under shady conditions, and in-vestment in height growth, which improves the relative height position in the vegetation, andconsequently prolongs the duration of light capture following gap formation in the canopy.
Keywords: Apical dominance, East Kalimantan, Indonesia, lowland dipterocarp forest,physical damage, shade-tolerance, wood density.

68
Introduction
In tropical rain forest, the seedlingsand saplings of shade tolerant tree spe-cies remain in the understorey for a longperiod of time. Many individuals experi-ence severe damage during their life dueto local disturbances by branch fall andtree fall or due to large-scale disturbancessuch as fire (Clark & Clark 1991, Pacio-rek et al. 2000, Chapter 3). Given thehigh incidence of stem breakage, the spe-cies-specific ability to resprout is likely toexert a major influence on the perform-ance of individuals and the dynamics ofpopulations (Bond & Midgley 2001). Highpersistence of individuals will limit thelocal changes in species composition aftera disturbance has occurred, and is likelyto sustain local species diversity after alarge-scale disturbance that affects alarge proportion of the individuals. Thephenomenon of sprouting must be under-stood if we want to comprehend the dy-namics of forests after disturbances suchas logging (Kammesheidt 1999), hurri-canes (Bellingham et al. 1994) or fire(Kauffman 1991, Kammesheidt 1998).
Sprouting responses of plants arevariable, depending on the severity of thedisturbance and the plant parts that arelost (Bond & Midgley 2001). In the cur-rent study we focus on resprouting insaplings after one of the most severe pos-sible disturbances, breakage of the mainstem below the crown, which causes theloss of all branches and all green leaves.
This treatment mimics decapitation ofsaplings by falling debris, or browsing bylarge herbivores. In the following text, itwill be referred to as stem breakage. Sev-eral studies have investigated thesprouting behaviour of tropical trees overthe course of a few years after such dam-age (Putz & Brokaw 1989, Bellingham etal. 1994, Guariguata 1998), but the recov-ery process shortly after breakage hasscarcely been studied. We investigatedthe process of resprouting during thisfirst period after breakage at both thepopulation level as well as the individualplant level, focussing on the factors thatdetermine sprout development, and fo-cussing on how sprout growth patterns, interms of sprout axis production, leaf pro-duction, length growth rate and the de-velopment of sprout dominance differbetween species.
When sprouting occurs after stembreakage, sprout development goesthrough two phases. In the first phase,dormant buds are activated and sproutsemerge from the bark. Mature leaves areabsent in this first phase, so the forma-tion of new sprouts is dependent on storedtotal non-structural carbohydrates (tnc)(Chapin et al. 1990). In the transition tothe second phase, the newly formedsprouts develop mature leaves, and startproducing carbohydrates. Sprout growthgradually becomes independent of thestored tnc (Schier & Zasada 1973). We
Table 4.1. Description of the species in the study. n* is the number of individuals in the clippingexperiment. The 95% dbh limit represents the dbh below which 95% of the individuals of a popula-tion are found, followed by the number of trees in the observed population. The growth form of theadult tree is categorised in 3 classes (Em= emergent, Up= Upper canopy, Mid= Mid-story). Wooddensities were taken from the literature. The last three columns show the specific individual leafmass of the saplings before clipping (slm sapl) (average, sd and number of observations).
GrowthSpecies Family n* n FormDipterocarpus confertus Sloot. Dipterocarpaceae 108 95 55 Em 0.80Durio acutifolius (Mast.) Kosterm. Bombacaceae 93 25 41 Mid 0.67Gironniera nervosa Planch. Ulmaceae 96 30 83 Up 0.60Macaranga lowii King ex Hook.f. Euphorbiaceae 103 15 52 Mid 0.81Madhuca kingiana (Brace) H.J.Lam Sapotaceae 97 30 137 Up 0.79Shorea laevis Ridl. Dipterocarpaceae 102 105 149 Em 0.93
95% dbh limit (cm)
Wood density(g cm-3)

69
investigated how the phase of tnc-dependence and the photosynthesisingphase are reflected in the patterns ofheight growth rate (hgr) of sprouts.
The principal objective of this re-search was to study the importance ofenergy reserves that are stored in thestem and roots on sprouting capacity ofshade tolerant trees. A correlation be-tween storage of carbohydrates and in-creased sprouting frequency has beendocumented in Australian heath lands(Pate et al. 1990, Bell et al. 1996) andSouth African fynbos (Bell & Ojeda 1999).We expect a similar correlation for tropi-cal tree saplings, and hypothesise thatsprout biomass production rate after stembreakage is correlated to the amount ofstored tnc in roots and stem. If the rate ofbiomass production in resprouting sap-lings is limited by the amount of storedtnc, the relationship between these twofactors will be strongest shortly aftersprouts have started to photosynthesise.We expect that, when a species has ahigher concentration of stored tnc in stemand roots, (a) a higher percentage of itspopulation will produces sprouts and (b)its individuals will have a higher sproutdry mass production rate. Furthermorewe predict that (c) within species, indi-viduals which were growing under higherlight conditions before breaking have ahigher concentration of tnc. (d) If this istrue, these individuals are expected tohave a higher sprouting chance and ahigher sprout dry mass production rate.This higher sprout production is reflectedin an increase in the initial number ofleaves and sprouts produced, and ahigher total sprout length by the timesprouts have developed photosynthesisingleaves.
In chapter 3 of this thesis, sprouting
capacity of a number of shade toleranttree species, including the species thatfeature in this clipping experiment, wasmeasured. In that research, a negativecorrelation was observed for 12 species ofshade tolerant trees between sproutgrowth and wood density, whereas sproutsurvival was not significantly correlatedto wood density. A similar associationbetween wood density and maximumgrowth rate was found for tropical treesin Borneo and in Guyana (Suzuki 1999,H. ter Steege pers. com.). Our hypothesisis that in the second stage of develop-ment, when sprouts are no longer relyingon stored energy supplies, sprout growthoccurs under the same constraints asseedling growth, and is therefore be nega-tively related to wood density. In thisstudy wood densities were taken from theliterature (Burgess 1966, Suzuki 1999).
Sprouting occurs because dormantbuds are activated after apical dominancehas been removed (Wilson 2000). Duringthe resprouting process, apical controlwill be restored by one sprout, which be-comes dominant over the others. We ex-pect that apical dominance of one sproutwill develop, which will form the mainstem in the future. The development ofthe dominant sprouts is investigated overthe first and second developmental phase.
Study area Sungai Wain Forest (1º16’ S and
116º54’ E) is a forest reserve of roughly100 km2 in East Kalimantan, located 20km North of Balikpapan and 15 km Westof the Strait of Makasar. The forest iscurrently the subject of a study on theeffects of forest fire, since a large part ofthe reserve burned in 1998. The forestfires did not destroy a core area of 30 km2.Two-thirds of this core area are coveredwith lowland dipterocarp rain forest, witha canopy height of an estimated 45 m.The canopy is irregular and quite open,which is probably due to the frequentdroughts that the region has experienced.The other one-third of the unburned areamaintains an infrequently flooded forestwith a lower and more closed canopy inwhich Dipterocarpaceae do not dominate.
(g) SD n2.6 1.2 15
0.33 0.15 150.53 0.38 150.34 0.15 151.5 1.1 15
0.23 0.13 15
Slm sapl
Table 4.1. (Continued)
70
The topography of the reserve consists ofgentle to sometimes steep hills, and isintersected by several small rivers. Thearea varies in altitude from 40 to 140m.a.s.l. Alisols form the major soil type(MacKinnon et al. 1996). For a more de-tailed description, see chapter 1.
Material and methods
The experiment was performed infour primary forest plots of 60 x 300 meach, which were spread over an area of10 km2. The plots were laid out as part ofa larger research design on the effects ofdrought and fire on forest dynamics(Chapter 2). Plot topography was meas-ured in 20 x 20 m subplots with a cli-nometer (Suunto).
Six tree species that are common inthe understorey as saplings were selected(Table 4.1). Species will be referred to bytheir generic names. All six species (in-cluding Macaranga lowii) are shade tol-erant, i.e. they commonly occur in theforest understorey as seedlings and sap-lings. Four of these species can be foundin the upper canopy or as emerging trees,whereas the other two species are foundin the mid-storey. Leaf size varies by afactor 11 between species. Per species,approximately 115 saplings with a diame-ter at breast height (dbh, measured at130 cm) between 1.50 and 2.50 cm werelabelled. Individuals with obvious stemdeformations, including multiple stemsand stems with signs of previous severedamage, were excluded. Individuals thatwere damaged by falling debris duringthe experiment were excluded as well.The co-ordinates of each individual wererecorded, and the site topography for eachindividual was classified into threeclasses (1= ridge, 2= slope, 3= valley).
For each sapling the light availabilitywas estimated by using the Dawkins’
crown index, which scores the source andrelative amount of crown lighting (Table4.2) (Dawkins & Field 1978, Clark &Clark 1992). For the analysis, class 1 andclass 2-L were combined because theywere sometimes difficult to distinguish.Because of low observation numbers insome classes, some other Dawkins scoreswere combined to form a total of threecategories (Table 4.2).
Individuals (n= 93 to 108) were clip-ped at 1.30 m height in September 1999.At the time of clipping, stem length andnumber of leaves of each individual weremeasured. Analysis showed high correla-tions between dbh, stem length and num-ber of leaves for all six species (n= 91-108,all 2-tailed Pearson correlations >0.38and p< 0.001). Therefore only dbh wasincluded in analyses as an indication ofpre-clipping plant size. After the clippingtreatment, sprouting behaviour was sur-veyed monthly over a period of sixmonths. The monthly survey includedboth measurements of characteristics atthe population level, as well as the indi-vidual plant level (Table 4.3). For claritywe refer to the stems of individualsprouts as axes were necessary, to distin-guish them from the remnants of thesaplings’ main stems that remained afterthe clipping treatment.
Per species, six individuals in lowlight (light category 1) and six individualsin high light (light category 3) were ran-domly selected and excluded from theclipping treatment. In these individualsthe concentration of total non structuralcarbohydrates (tnc, in mg/g) in the mainstem and main root was measured. Asample was taken consisting of the saw-dust of six transverse cuttings of the stemat 20, 40, 60, 80 and 100 cm above theground. The root sample consisted of fourtransverse cuttings at three equal dis-tances between the soil surface and the
CategoryDawkins score Description
1. Low 1 No direct lateral or overhead light2-L Some direct lateral light, no overhead light
2. Middle 2-M Between 2-L and 2-H3. High 2-H Much direct lateral light, no overhead light
3, 4, 5 Increasing amounts of direct overhead light
Table 4.2. Light catego-ries based on Dawkins’crown illumination index(Dawkins & Field 1978),refined by Clark and Clark(1992).
71
point at which the root diameter was 5mm. Side roots were removed at the pointof <5 mm diameter. Samples were driedat 70 °C for 48 hours. The concentrationof tnc was measured by taking ± 25 mgoven dried plant mass. Samples wereground, extracted and hydrolysed with3% HCl for at least 3h at 125 °C. Totalglucose content was determined by thereduction of copper, using a modifiedFehling method (Sawyer & Dixon 1968).A photo-spectrometer (Skalar auto-analyser) was used for the colorimetricdetermination of glucose.
At the level of the population, we re-corded the sprouting frequency (the per-centage of individual stems that sprouts)and stem mortality (Table 4.3). At thelevel of individual plants, we character-ised the sprouting process by monitoringthe number of sprouts (length >0.5 cm),the sprout axis length and the height ofimplantation of each individual sprout.From the fourth survey onwards, thenumber of immature and mature leaveswas also recorded. Immature leaves weredefined as leaves that had not yet un-folded (Durio, Shorea) or expanded (Dip-terocarpus, Gironniera) and that were
Table 4.3. Plant traits recorded after stem breakage. Traits are either recorded monthly overthe course of six months, or are measured once, six months after the time of stem breakage.
Level TraitAbrevia-tion Unit Description
PopulationSprouting frequency % The percentage of individual stems that
produces sproutsStem mortality % The percentage of individual stems that
dies after having produced sproutsIndividual plant
Time to sprout emergence month Time lapse between breakage of the main stem and the emergence of the first
Number of sprouts n Number of sprouts per stem
Sprout axis turn-over % Mortality among individual sprout axes per stem
Number of immature leaves n Number of immature leaves per stem
Number of mature leaves n Number of mature leaves per stem
Average sprout axis length cm Average length of all sprout axes on a
Largest sprout axis length cm Length of the sprout that was longest six months after clipping
Height of implantation cm Distance between breakage point and point of implantation of each sprout
Average height growth rate hgr aver cm month-1
Length growth per sprout axis per month
Maximum height growth rate hgr max cm month-1
Length growth per month of the sprout axis which was largest at t= 6
Variation in sprout length cv % Coefficient of variation, indicating the variation in length between the sprout axes on a stem
Axis mass per length aml g cm-1 Dry mass per unit length of the sprout
Specific leaf mass slm g Average dry mass of a mature leaf on a resprouting stem
Specific immature leaf mass slm imm g Average dry mass of an immature leaf on a resprouting stem
Total leaf mass tlm g Total dry leaf mass of a resprouting stem
Total axis mass tam g Total dry mass of all sprout axes per individual stem
Total sprout mass tsm g Total dry mass of all sprouts on a stem (tlm + tam)
Leaf axis mass ratio lamr g g-1 Total leaf dry mass divided by the total sprout dry mass
72
densely pubescent (Dipterocarpus, Giron-niera) or coloured brownish-red (Mad-huca) or distinctly light green (Durio,Macaranga, Shorea). Mature leaves weredefined as leaves that had unfoldedand/or expanded and which were green,and which were therefore supposed to becapable of photosynthesis. Individualsprouts were monitored through time.From the data on sprout length, theheight growth rate (hgr) per month wascalculated for each individual sprout axis.The longest sprout axis after six monthswas identified on each stem, and itsgrowth was more closely analysed. Thevariation in sprout length was expressedas the coefficient of variation (cv), cor-rected for small sample sizes (Sokal &Rohlf 1981).
Prior to our study, no data wereavailable on the time-lapse between stembreakage and the emergence of the firstsprouts and the development of the firstmature leaves. During the course of theexperiment, the start and the end of thetnc-dependent phase and the followingphotosynthesising phase were estimated,based on the time of first sprout emer-gence, the development of mature leaves,and a pronounced change in hgr of thesprouts.
Sprout development was character-ised in terms of dry mass of leaves andsprout axes, six months after the clippingtreatment, which was shortly after allspecies had developed green leaves (Table4.3). Sprouts of five to eight randomlyselected individuals were harvested for
measurement of the dry mass per unitlength of the sprouts (sprout axis massper length, aml, g/cm), specific leaf drymass of immature leaves (slm imm, perindividual leaf, in g) and specific leaf drymass of mature leaves (slm, per individ-ual leaf, in g). Dry masses were deter-mined on a Satorius 210 BP balance.
These measured values of individualsprout dry mass were used to estimatethe total dry mass of the stems of re-sprouts (total axis dry mass, tam, in g),total leaf dry mass (tlm, in g) and the sumof these two (total sprout dry mass, tsm,in g) of the sprout axes on the other indi-viduals. This was achieved by multiplyingthe above mentioned average dry masseswith respectively the total sprout length,number of immature leaves, and numberof mature leaves six months after clip-ping. The leaf axis mass ratio (lamr, ing/g) was calculated by dividing the totalleaf dry mass by the total axis dry mass.
SPSS 7.0 was used for the statisticalanalysis of the data. Species-specific dif-ferences in the concentration of tnc wereanalysed with a general multivariateanalysis with the independent variablesspecies, storage organ (main stem or mainroot), dbh and Dawkins light index (lowlight: category 1 in table 4.2, and highlight: category 2 & 3 in table 4.2). Sincedbh was not correlated with the tnc con-centration, the same analysis was per-formed without this variable to include apost-hoc comparison test between species.Because the interaction between storageorgan and light class was significant, we
Table 4.4. Three-way anova testing the effect of species, light class and stor-age organ (root or stem) on the concentrations of tnc. The average number ofsamples per species is 26 (range from 22 to 30).
SourceType III Sum
of Squares dfMean
Square F Sig.Corrected Model 180518 23 7849 6.97 0.000Intercept 5129786 1 5129786 4558 0.000Species 106539 5 21308 18.9 0.000Storage organ 20097 1 20097 17.9 0.000Light class 2713 1 2713 2.41 0.123Species * storage organ 25981 5 5196 4.62 0.001Species * light class 6959 5 1392 1.24 0.296Storage organ * light class 4086 1 4086 3.63 0.059Storage organ * species * light class
2486 5 497 0.44 0.819

73
analysed whether the tnc concentrationsin root and stem of each species were sig-nificantly different with a paired t-test.
Differences in temporal patterns offirst sprout emergence from each stemwere tested with Kaplan-Meier survivalanalysis (n= 100 for each species, post-hoccomparisons between species made withTarone-Ware statistics). The relationshipbetween sprout mortality and topographyand light climate was analysed withKaplan-Meier analysis. Light categoriesand topographical units were comparedusing a log rank statistical comparison.The correlation between the species-specific average concentrations of tnc inroot and stem versus the percentage ofsprouting individuals was tested with a 2-tailed Spearman rank correlation.
Species-specific differences in produc-tion of number of sprouts and leaves, andsprout dry mass six months after clippingand the effect of light availability thereupon were analysed with a two-wayanova. Differences between species weretested with post-hoc Dunnett T3 tests(equal variances not assumed).
To assess the development of sproutdominance, height growth of the largestsprout versus average height growth was
analysed using a paired samples t-test.The analysis was not performed as a re-peated measurement analysis because ofmissing values in the first and last timesteps. To correct for the multiple use ofmeasurements (i.e. sprout length wasused to calculate hgr during two consecu-tive time steps) a Bonferroni correctionwas applied. An interspecific comparisonof variation in sprout length, expressed asthe coefficient of variation (cv), was madewith a one-way anova.
Results
Pre-damage non structural carbohydrates
All six species had average tnc con-centrations above 145 mg/g in both theirroots and stem (Figure 4.1). Contrary toour prediction, the tnc concentration inthe root and stem was not significantlyrelated to the light environment (Table4.4). Dipterocarpus, Durio and Madhucahad relatively high concentrations of tncin both root and stem, with significantlyhigher tnc concentrations in the root thanin the stem. The pattern of tnc storage inthese three species was significantly dif-
Figure 4.1. Concentrations of tnc in the stem (white bars) and the mainroot (hatched bars) of saplings (± sd). Letters below the bars show thesignificant differences between species, based on a Bonferroni post-hoctest (p< 0.05). The stars above the bars indicate differences between theroot and the stem (* = p<0.05, ** = p<0.01, ns = not significant).
0
50
100
150
200
250
300
Dipt Duri Giro Maca Madh Shor
Tnc
(mg/
g)
sd
a a b b a b
** * * ns * ns

74
ferent from Gironniera, Macaranga, andShorea. Gironniera tended to have lowertnc concentrations in both stem and root.The relatively low tnc concentrations inboth the stem and the root of Macarangaand Shorea did not differ significantlyfrom each other.
Survival and mortalityIn all six species more than 50% of
the individuals had sprouted within threemonths after clipping (Figure 4.2 a-f).Emergence of the first sprout throughtime was fastest in Durio, Gironniera andMacaranga (p> 0.05), intermediate in
Madhuca and Dipterocarpus (p< 0.01for comparisons with the other fourspecies, and p= 0.077 for the compari-son between the two species), andslowest in Shorea (p< 0.01 for all com-parisons). The number of sproutingDipterocarpus was still increasing af-ter six months, and was expected toreach 100% after 9-10 months if thesame trend continued. In Macarangaand Shorea, respectively 7% and 20%of the individuals never producedsprouts. None of the species showed asignificant relation between light cli-mate or topography and the emergenceof sprouts through time.
Unexpectedly, we observed consid-erable levels of mortality among sap-lings that had produced sprouts inMacaranga, Shorea and Madhuca,which started in the second to fourthmonth after clipping (Figure 4.2 g-l).Resprouting individuals of Shorea diedearlier when they grew under a higherlight intensity (Kaplan-Meier analysis,n= 82, number of events = 29. Com-parisons between Dawkins classes 1-2,1-3, 2-3 yield respectively: p= 0.000, p=0.000, p= 0.908). In Macaranga mor-tality was related to topography, beinghigher on the ridges and lower onslopes and in valleys (Kaplan-Meieranalysis, n= 98, number of events = 23.Comparisons between topographicalunits 1-2, 1-3, 2-3 yield respectively:p= 0.019, p= 0.018, p= 0.694). Themortality of resprouting Madhucasaplings was independent of topogra-phy and light environment. We ob-served a fungus infection underneaththe bark of a high proportion of thedead saplings of this species.
The mortality of individual sproutaxes over six months was highest inShorea (51%) and Macaranga (46%),intermediate in Durio (32%), Diptero-Figure 4.2. (a-f). First sprout emergence through
time and (g-l) sapling survival (defined by the deathof all sprouts on a stem) through time.
j. Macaranga0
20
40
60
80
100
k. Madhuca0
20
40
60
80
100
l. Shorea0
20
40
60
80
100
0 2 4 6Time (months)
% s
urvi
ving
g. Dipterocarpus0
20
40
60
80
100
h. Durio0
20
40
60
80
100
i. Gironniera0
20
40
60
80
100
Sprout emergence Stem survival
a. DipterocarpusR2 = 0.98
0
20
40
60
80
100
d. MacarangaR2 = 0.84
0
20
40
60
80
100
e. MadhucaR2 = 0.95
0
20
40
60
80
100
f. Shorea
R2 = 0.99
0 2 4 6Time (months)
0
20
40
60
80
100
% s
tem
s sp
rout
ing
b. DurioR2 = 0.87
0
20
40
60
80
100
c. Gironniera
R2 = 0.870
20
40
60
80
100
75
carpus (28%) and Gironniera (34%), andlowest in Madhuca (17%). Sprout axismortality per stem was often stronglyaggregated in time, which suggested anexternal cause of mortality. In Maca-ranga, Madhuca and Shorea, 100% sproutaxis mortality within one month was re-corded in respectively 38%, 71% and 54%of the individuals that had produced morethan one sprout and that had died by theend of the experiment. Such immediatedeath was associated with signs of a fun-gus infection in Madhuca, and accountedfor half of the 17% sprout mortality re-corded in this species.
The two species with the lowest tnc inboth root and stem, Macaranga and Sho-rea, had the lowest percentages ofsprouting individuals after six months(Figure 4.3 a & b), the highest levels ofindividual sprout axis mortality and the
highest levels of stem mortality duringthe experiment. However, the number ofspecies was too low to reveal a significantrelationship between the percentage ofindividuals sprouting and the concentra-tion of tnc in the root (2-tailed Spearmanrank correlation, n= 6, corr. coef.= 0.50,ns) or in the stem (n= 6, corr. coef.= 0.21,ns).
Two phases of sprout developmentThe two phases in the production of
sprouts that were expected because of theabsence of photosynthesising leaves inthe first phase of sprout developmentwere suggested by the peaked-curved pat-tern of the hgr in most species. In all spe-cies the production of sprout axes washighest in the second and third month(Figure 4.4). Hereafter, sprout productiondecreased, and dropped below the
Figure 4.3. Relation between the average concentration of tnc in themain root and main stem, and (a, b) the percentage of individuals thathad resprouted after six months and (c, d) total sprout dry mass produc-tion (Tsm) after six months. Label numbers refer to species. 1= Diptero-carpus, 2= Durio, 3= Gironierra, 4= Macaranga, 5= Madhuca, 6= Shorea.
B.52314
6
0
20
40
60
80
100
100 150 200 250 300
% s
prou
ting
indi
v.
A.
6
4 1
53 2
0
20
40
60
80
100
100 150 200 250 300
% s
prou
ting
indi
v.
C.
0
2
4
6
8
10
12
100 150 200 250 300
Tnc root (mg/g)
Tsm
(g)
D.
0
2
4
6
8
10
12
100 150 200 250 300
Tnc stem (mg/g)
Tsm
(g)
76
monthly sprout mortality in Durio, Gi-ronniera, Macaranga and Shorea. Aroundthe same time as we observed a peak insprout emergence, a pronounced peak inhgr was found for most species (Figure4.5). In the third and fourth month atransitory period between the first to thesecond phase followed, during which thehgr decreased, after which the hgr ap-peared to stabilise at a relatively low ratefrom the fifth month onwards. The pat-tern was pronounced for Durio, Maca-ranga and Madhuca and Shorea, whereasit was less obvious for the average hgr ofDipterocarpus and Gironniera.
Sprout growth, tnc, and wood density The characterisation of sprouting be-
haviour revealed significant differencesbetween species for all variables in theanalysis (Table 4.5, 4.6). Light class had avery limited effect, and was strongestrelated to the number of leaves per sproutaxis. Reviewed at a species-specific level,
the relation between light class and num-ber of leaves per sprout axis showed asmall increase in some species, which wasnegligible in comparison with the varia-tion within one light class.
Total sprout mass varied by a factor7, and the specific leaf mass by approxi-mately a factor ten between species. Thelarge leaf size produced by Dipterocarpuswas associated with the production of alow number of leaves and low number ofsprout axes. Specific leaf mass wasstrongly correlated with axis mass perlength (One-tailed Pearson correlation=0.98, p< 0.001, n=6). Considering thelarge variation in specific leaf mass, dif-ferences in leaf axis mass ratio were re-markably small. Only Dipterocarpusdiffered significantly from the other spe-cies in this respect.
The concentration of tnc in the roottended to be related to the total sproutmass production (Figure 4.3 c, F= 13.9, p=0.02, n= 6), but this was not the case for
Figure 4.4. Sprout dynamics per stem during six months after clipping. Open squares: Averagenumber of sprouts emerging per stem per month. Closed triangles: Average sprout mortality perstem per month. Note the different scales on the y-axis.
a. Dipterocarpus
0
1
2
3
4b. Durio
0
1
2
3
4
5
6
7
8c. Gironierra
0
1
2
3
4
5
6
7
8
d. Macaranga
0
1
2
3
4
1 2 3 4 5 6Time (months)
Spr
outs
ste
m-1 m
onth
-1
e. Madhuca
0
1
2
3
4
1 2 3 4 5 6
f. Shorea
0
1
2
3
4
1 2 3 4 5 6
77
tnc concentration in the stem (Figure 4.3d, F= 3.7 p= 0.13, n= 6). Growth of thetallest sprout in the fifth and sixth monthafter breakage showed a tendency to becorrelated with wood density (Figure 4.6).
Apical dominanceIn all species the largest sprout after
six months had a hgr which was signifi-cantly higher than average during atleast one observation month after clipping(Figure 4.5). In three species, the hgr ofthe largest sprout was significantlyhigher than average both during theleafless first phase, as well as during thesecond phase. In Macaranga, Madhucaand Shorea, the hgr of the largest sproutwas significantly higher only during thefirst one to fourth months of establish-ment, a difference which became insig-nificant by the time green leaves haddeveloped on the sprout axes.
Variation in hgr between the individ-ual sprouts on a single individual resultedin size differences between sprouts aftersix months. As a result the coefficient ofvariation (cv) in sprout length after sixmonths differed considerably betweenspecies (Figure 4.7). The cv gives a stan-dardised indication for the dominance ofthe tallest sprout. Such a dominantsprout developed in Dipterocarpus, Durioand Gironniera, whereas the variation insprout length between the sprouts oneach individual sapling remained low andeven decreased over time in Macaranga,Madhuca and Shorea. In the case ofMadhuca, we observed that the sprouts ofeach individual had a remarkably con-stant length after six months. The initialvariation in sprout length in this specieswas due to variation in the time of emer-gence of the different sprouts on the samestem, which resulted in differences instage of development at any particulartime step.
c. Gironierra
ns
d. Macaranga
0
2
4
6
8
10
1 2 3 4 5 6Time (months)
Gro
wth
rat
e (c
m/m
onth
) f. Shorea
1 2 3 4 5 6
a. Dipterocarpus
ns
0
2
4
6
8
10
GR aver
GR max
e. Madhuca
1 2 3 4 5 6
b. Durio
Hgr aver
Hgr m ax
ns ** * *** **ns *** *** *** *** *** *** *** *** *** ***
ns *** ns ns ns ns ns *** ns ns ns ** *** * ns ns
Figure 4.5. Average height growth rate (hgraver) per individual sprout through time (closedsquares), and the hgrmax, of the sprout which was largest six months after clipping (open triangles).In the top three species, the hgrmax is persistently higher than the hgraver, whereas in the lowerthree species the hgrmax is higher only during the first phase of development.
78
Discussion
Total non-structural carbohydrates andlight
Ranging from 15 to 24% of the totaldry weight, concentrations of tnc wereconsidered high, considering that thestudied plants were growing in the forestunderstorey. Comparable concentrationshave been found for seedlings growing intemperate forests (Canham et al. 1999).Theoretical modelling studies (Iwasa &Kubo 1997, Iwasa 2000) have predictedthat, if they grow under unfavourable
conditions and have a high chance of ex-periencing damage, the optimal strategyfor plants is to make relatively large car-bon investments to ensure their persis-tence, at the cost of investing in growth.Apparently, the saplings in our study actaccording to this model, storing consider-able amounts of energy in order to ensuretheir survival under adverse circum-stances.
Table 4.5. Two-way anova describing the effects of species and light class on sprouting behav-iour six months after clipping. Sprouting behaviour is characterised in terms of number ofleaves, number of sprouts, number of leaves per sprout, total sprout mass (Tsm), total leaf mass(Tlm), total sprout axis mass (Tam) the ratio between leaf mass and axis mass (Lamr). Results ofthe post-hoc analysis of species-specific differences are presented in table 4.6.
Source Dependent Variable Type III Sum of Squares
df Mean Square
F Sig.
Species Number of leaves 4893.3 5 978.7 13.2 0.000 ***Number of sprouts 488.1 5 97.6 13.8 0.000 ***Leaves per sprout 31.7 5 6.3 2.5 0.029 *Tsm 2666.8 5 533.4 54.5 0.000 ***Tlm 1661.0 5 332.2 53.0 0.000 ***Tam 149.3 5 29.9 51.9 0.000 ***Lamr 475.3 5 95.1 20.3 0.000 ***
Light class Number of leaves 512.2 2 256.1 3.4 0.033 *Number of sprouts 8.8 2 4.4 0.6 0.539Leaves per sprout 31.9 2 16.0 6.3 0.002 **Tsm 23.9 2 11.9 1.2 0.296Tlm 8.5 2 4.3 0.7 0.507Tam 4.5 2 2.3 3.9 0.020 *Lamr 15.1 2 7.5 1.6 0.202Number of leaves 713.6 10 71.4 1.0 0.478Number of sprouts 87.7 10 8.8 1.2 0.263Leaves per sprout 51.1 10 5.1 2.0 0.029 *Tsm 137.5 10 13.7 1.4 0.175Tlm 83.9 10 8.4 1.3 0.207Tam 10.0 10 1.0 1.7 0.071Lamr 81.2 10 8.1 1.7 0.071
Total Number of leaves 115468.0 430Number of sprouts 14067.3 430Leaves per sprout 4777.1 430Tsm 15723.4 430Tlm 9670.6 430Tam 857.1 430Lamr 8686.6 430
Species * light class

79
Contrary to our prediction, therewere no significant differences in tnc con-centrations between individuals growingunder different light conditions. Canhamet al. (1999) found a small effect of lightavailability on tnc concentrations in atemperate forest, which suggested that
either seedlings were limited in theirability to respond to differences in lightavailability, or alternatively storage of tnchas a high priority, and is achieved evenunder limited light conditions. The lack ofcorrelation between tnc concentrationsand light conditions also suggests that
Diptero-carpus
Durio Gironniera
Maca-ranga
Madhuca
Shorea
(a) Measured dry massn (stems sampled) 6 7 6 8 6 5
Slm imm (g) 0.72 0.075 0.031 0.021 0.049 0.007
SD 0.83 0.057 0.020 0.021
Slm (g) 1.29 0.24 0.11 0.11 0.42 0.10SD 0.90 0.08 0.09 0.03 0.24 0.07
Aml (g/cm) 0.059 0.013 0.014 0.0077 0.034 0.0065SD 0.026 0.005 0.007 0.0025 0.011 0.0026
(b) Measured sprout characteristicsn 93 91 96 74 88 52
Number of leaves 4.9 14 17 14 13 9.3SD 4.2 8.5 9.9 10 8.7 8.0Sign. a cd d cd bc b
Number of sprouts 2.1 5.1 6.2 5.1 4.2 3.8SD 1.1 2.7 3.2 3.2 2.6 2.9Sign. a bcd d cd bc b
Leaves per sprout 2.5 3.3 3.0 2.9 3.2 3.5SD 1.3 2.3 1.4 1.5 1.3 4.4Sign. a ab ab ab ab b
(c) Calculated dry massn 93 91 96 74 88 52
Tam (g) 1.1 1.0 0.52 0.41 2.0 0.29SD 1.0 0.4 0.28 0.27 1.4 0.20Sign. b b c c a d
Total leaf mass Tlm (g) 5.9 3.0 1.7 1.3 5.1 0.74SD 4.5 1.7 1.0 1.0 3.2 0.59Sign. a b c d a e
Total sprout dry mass Tsm (g) 7.1 3.9 2.3 1.7 7.0 1.0SD 5.4 2.0 1.2 1.2 4.4 0.7Sign. a b c d a e
Leaf axis mass ratio Lamr (g/g) 0.84 0.73 0.76 0.74 0.72 0.66SD 0.06 0.10 0.07 0.10 0.09 0.19Sign. a b b b b b
Specific leaf mass (immature leaves)
Specific leaf mass (mature leaves)
Sprout axis mass per length
Total dry mass of sprout axes
Table 4.6. Sprout characteristics six months after clipping. All values are for newly producedspouts only. Presented are: (a) Dry masses measured on a random subsets of five to eight indi-viduals per species (n). (b) Sprout characteristics measured in the field of all individuals (n) ofthe six species in the experiment. (c) Calculated sprout characteristics of all individuals (n) of thesix species in the experiment. Significant differences between pairs of species, based on a post-hoc Dunnet T3 test, are indicated in the table with letters.
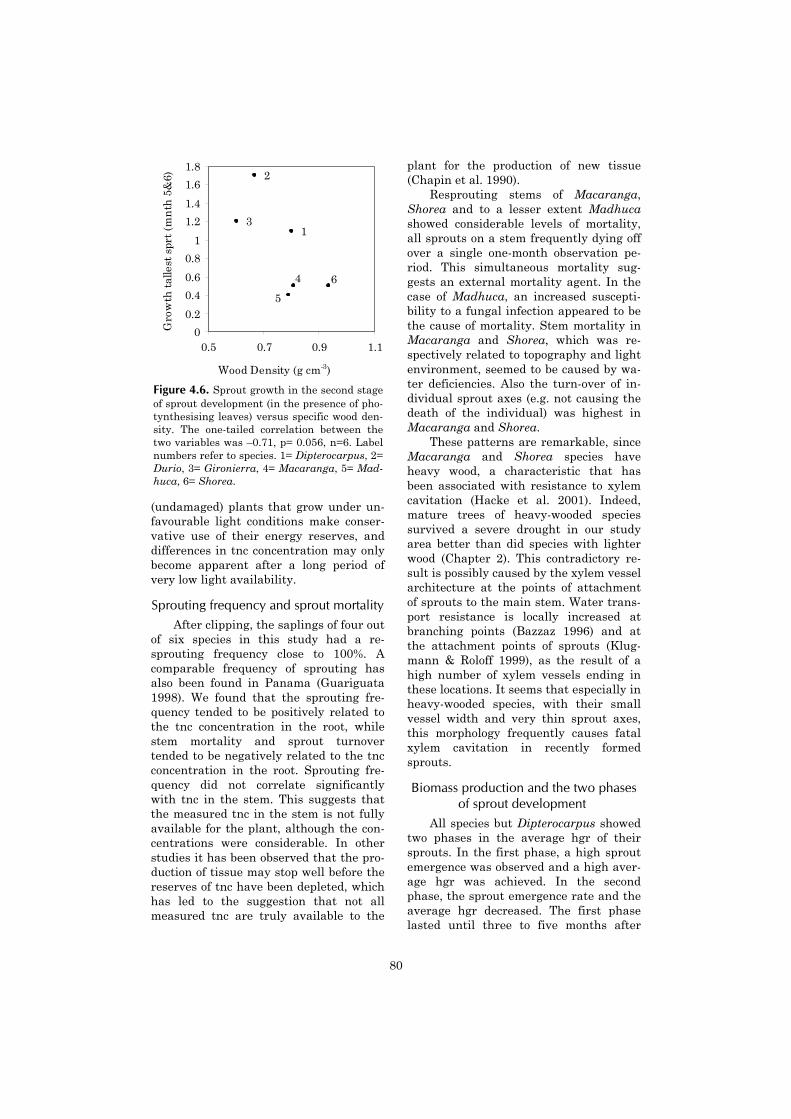
80
(undamaged) plants that grow under un-favourable light conditions make conser-vative use of their energy reserves, anddifferences in tnc concentration may onlybecome apparent after a long period ofvery low light availability.
Sprouting frequency and sprout mortalityAfter clipping, the saplings of four out
of six species in this study had a re-sprouting frequency close to 100%. Acomparable frequency of sprouting hasalso been found in Panama (Guariguata1998). We found that the sprouting fre-quency tended to be positively related tothe tnc concentration in the root, whilestem mortality and sprout turnovertended to be negatively related to the tncconcentration in the root. Sprouting fre-quency did not correlate significantlywith tnc in the stem. This suggests thatthe measured tnc in the stem is not fullyavailable for the plant, although the con-centrations were considerable. In otherstudies it has been observed that the pro-duction of tissue may stop well before thereserves of tnc have been depleted, whichhas led to the suggestion that not allmeasured tnc are truly available to the
plant for the production of new tissue(Chapin et al. 1990).
Resprouting stems of Macaranga,Shorea and to a lesser extent Madhucashowed considerable levels of mortality,all sprouts on a stem frequently dying offover a single one-month observation pe-riod. This simultaneous mortality sug-gests an external mortality agent. In thecase of Madhuca, an increased suscepti-bility to a fungal infection appeared to bethe cause of mortality. Stem mortality inMacaranga and Shorea, which was re-spectively related to topography and lightenvironment, seemed to be caused by wa-ter deficiencies. Also the turn-over of in-dividual sprout axes (e.g. not causing thedeath of the individual) was highest inMacaranga and Shorea.
These patterns are remarkable, sinceMacaranga and Shorea species haveheavy wood, a characteristic that hasbeen associated with resistance to xylemcavitation (Hacke et al. 2001). Indeed,mature trees of heavy-wooded speciessurvived a severe drought in our studyarea better than did species with lighterwood (Chapter 2). This contradictory re-sult is possibly caused by the xylem vesselarchitecture at the points of attachmentof sprouts to the main stem. Water trans-port resistance is locally increased atbranching points (Bazzaz 1996) and atthe attachment points of sprouts (Klug-mann & Roloff 1999), as the result of ahigh number of xylem vessels ending inthese locations. It seems that especially inheavy-wooded species, with their smallvessel width and very thin sprout axes,this morphology frequently causes fatalxylem cavitation in recently formedsprouts.
Biomass production and the two phasesof sprout development
All species but Dipterocarpus showedtwo phases in the average hgr of theirsprouts. In the first phase, a high sproutemergence was observed and a high aver-age hgr was achieved. In the secondphase, the sprout emergence rate and theaverage hgr decreased. The first phaselasted until three to five months after
64
5
3
2
1
0
0.2
0.4
0.6
0.8
1
1.2
1.4
1.6
1.8
0.5 0.7 0.9 1.1
Wood Density (g cm-3)
Gro
wth
tal
lest
spr
t (m
nth
5&
6)
Figure 4.6. Sprout growth in the second stageof sprout development (in the presence of pho-tynthesising leaves) versus specific wood den-sity. The one-tailed correlation between thetwo variables was –0.71, p= 0.056, n=6. Labelnumbers refer to species. 1= Dipterocarpus, 2=Durio, 3= Gironierra, 4= Macaranga, 5= Mad-huca, 6= Shorea.

81
stem breakage. Because green leaveswere absent, sprout growth must havebeen entirely dependent on the stored tncduring the sprout initiation phase. Thetotal dry mass produced by resprouting atthe end of the experiment was positivelyrelated to the concentrations of tnc in theroot. By this time, most of the biomasswas produced using stored tnc. Theseobservations suggest that the storage oftnc is indeed of vital importance for thesuccessful resprouting of these saplings.Since many seedlings and saplings sur-vive severe damage during their livesbefore reaching the canopy (Clark &Clark 1991, MvN pers. obs.) the high con-centrations of tnc and the subsequenthigh persistence of individuals may be acommon phenomenon in many forests.
The light environment prior to clip-ping did not explain intra-specific differ-ences in sprouting frequency or sproutcapacity six months after clipping. Be-cause green leaves were absent during alarge part of the experiment, and the hgrwas low during the period that greenleaves were present, the measured sproutproduction appears to be mainly based onstored tnc. Since the concentrations of tnc
were not related to the light environment,differences in sprouting capacity were notto be expected between saplings growingin different light environments. In a defo-liation experiment with temperate seed-lings, Canham et al. (1999) found asimilar limited effect of light level onseedling growth rate, pattern of biomassallocation, tnc concentration, and sur-vival. They concluded that this suggests arelative independence of seedling per-formance on external resource availabil-ity, whereas seedling survival seems to bestrongly affected by disturbance factorsthat cause defoliation or loss of root orshoot tissue.
Green leaves had started to developat the beginning of the second phase,which suggests that at this point, thesprouts were becoming more and moreautonomous in their energy supply. Inthis phase, length growth of sproutstended to be negatively correlated to spe-cific wood density. Similar constraints ongrowth, such as a higher carbon invest-ment per volume of wood tissue in heavy-wooded trees, may explain the similarityin the patterns of sprout growth andgrowth of undamaged seedlings.
0
20
40
60
80
100
120
140
Dipt Duri Giro Maca Madh Shor
CV
spr
out
len
gth
at t=
6 ±
sd
bc ab a d d c
Figure 4.7. Coefficient of variance for the length of sproutsper stem, six months after clipping. Values are corrected forsmall sample size (Sokal & Rohlf 1981). Letters above thebars show the significant differences between species, basedon a Bonferroni post-hoc test (p< 0.05).
82
Sprout dominance and crownarchitecture
One of the most striking inter-specificdifferences in sprout formation was thefast growth of a dominant sprout in Dip-terocarpus and even more so in Durio andGironniera. In these species, the domi-nant sprout had a higher than averagehgr during the first as well as the secondphase of development. This growth pat-tern contrasted with the sprout growth inthe other three species, were the tallestsprout did initially have a significantlyhigher than average hgr, but did notmaintain this during the second phase.The interspecific differences in the pat-tern of hgr resulted in sprouting behav-iour that ranged from the formation of asingle dominant sprout, to the productionof a larger number of sprouts which werealmost equal in size.
For the growth of undamaged sap-lings, a trade-off has been suggested be-tween investment in lateral extension ofthe crown and investment in heightgrowth (King 1990, Kohyama & Hotta1990, Ackerly & Donoghue 1998). Lateralcrown extension will maximise light in-terception under shady conditions. In-vestment in height growth increases thespeed at which better-lit sites higher upin the canopy are reached (King 1990,Kohyama & Hotta 1990).
The observed variation in sprout for-mation after stem breakage may be theresult of a similar trade-off. We observedthat the production of many similar-sizedsprouts coincided with more horizontallygrowing branches and a conspicuous widelateral distribution of the leaf area inMadhuca, which corroborates the exis-tence of a trade-off between height growthand lateral crown extension. We hypothe-sise that the alternative strategy, whichcomprises of quickly producing a domi-nant sprout which shows rapid heightgrowth, improves the chances for a dam-aged plant to consolidate a dominant po-sition in the relative size order with itsneighbours. This is likely to increase thefuture growth of the individual as well asits survival chance if a vertical light gra-
dient exists, since the size of a saplingrelative to its neighbours has been shownto be one of the main determining factorsfor the outcome of competition (Zagt 1997,Brown et al. 1999).
Sprouting strategy and persistence ofindividuals
The high levels of sprouting capacityfound in this paper show that the persis-tence of individuals after a disturbance,including large-scale disturbances such asfire, is likely to play a pivotal role in de-termining the future forest structure andspecies composition. At current, knowl-edge of species-specific sprouting behav-iour of tropical trees, and the factors thatdetermine it, are virtually non-existent(Bond & Midgley 2001). We have shownthat sprouting capacity is influenced bythe amount of stored tnc, particularly inthe root, and wood density. Marked dif-ferences in sprouting behaviour provideevidence for the existence of variation inrecovery strategy. There are few impedi-ments to validate the importance of varia-tion in sprouting behaviour as a life-history characteristic on a large set ofspecies, because it is relatively easy tomake detailed assessments of sproutingbehaviour in a standardised way.
Acknowledgements
I am grateful to M.J.A. Werger, J.A.Sayer, D. Sheil, D.W. Dijkman, T. deKam, K. Sidiyasa, H.J. During, M. vanNoordwijk, P. Frost, F. Sterck, J.W.F.Slik and G.M. Fredriksson for logisticsupport and fruitful discussions. The fieldwork benefited from the dedicated assis-tance of J.A. Helleman, N. Syah, F. Udinand S. Laysa Putra. Carbohydrate analy-ses were done by J. van Rheenen. Thisresearch was performed at the Interna-tional Ministry of Forestry (MOF)-Tropenbos-Kalimantan research stationin East Kalimantan. Financial supportwas provided by the Netherlands Founda-tion for the Advancement of Tropical Re-search (WOTRO) with grant 84-408 andby the Center for International ForestryResearch (CIFOR) in Bogor, Indonesia.
5
Vertical gradient in viable seed densityand germination after fire
in the seed bank ofa lowland dipterocarp rain forest
AbstractThe vertical distribution of seeds in the top 4.5 cm of soil in a primary lowland dipterocarp for-
est in East Kalimantan and in an adjacent burned part of the forest were compared. In the primaryforest the seed density was 292 - 397 seeds 0.1 m-2, which is higher than recorded values from mostother studies on tropical rain forest. Seed density showed a rapid decline with depth. In the burnedforest the viable seed density in the litter layer and the upper 1.5 cm of the soil was respectively86% and 71% lower than in the primary forest, but lower layers were not significantly different.The vertical stratification pattern and changes therein were comparable for the two dominantfamilies, Rubiaceae and Melastomataceae.
Sensitivity of dormant seeds to different combinations of light and temperature was tested ex-perimentally. Light was shown to be a pre-requisite for the germination of very small-seeded spe-cies, whereas small-seeded Macaranga was able to germinate in complete darkness as long as therewere daily fluctuations in temperature. In complete darkness, Macaranga seedlings etiolated andpostponed the unfolding and colouring of the cotyledons. In contrast, very small-seeded species didnot etiolate and always produced two green cotyledons immediately after germination. The combi-nation of germination in the dark and stem elongation suggests that Macaranga is capable of suc-cessful seedling establishment from a greater depth in the soil.
Keywords: East Kalimantan, forest fire, germination trigger, seed bank, seedling estab-lishment, tropical rain forest.

Introduction
A persistent soil seed bank, which in-cludes herbs, shrubs, lianas and trees, iscommonly found in tropical forests (Chin1973, Cheke et al. 1979, Saulei & Swaine1988, Garwood 1989, Dalling et al. 1994,1997 a, Swaine et al. 1997). The densityof viable seeds in the soil of an undis-turbed forest decreases with increasingdepth (Hopkins & Graham 1983, Younget al. 1987). This pattern results from aslow infiltration rate of seeds in the soil(Bekker et al. 1998), in combination witha low mortality rate for dormant seeds,which is commonly sigmoid or logarithmicover time (Roberts 1972, Dalling et al.1997 a).
The germination rate of seeds at acertain depth in the seedbank and thesubsequent chance of above ground es-tablishment of seedlings are determinedby different environmental factors(Vleeshouwers 1997). Germination isusually triggered by an external abiotictrigger, such as light (both the amountand the spectral composition (Pons 1992,2000)) and daily fluctuations in tempera-ture (Vázquez-Yanes & Orozco-Segovia1982, Probert 1992, 2000, Vázquez-Yanes& Orozco-Segovia 1993). As light pene-trates only a few millimetres into the soil(Wooley & Stoller 1978), only those light-sensitive seeds which are close to the soilsurface are likely to respond to an above-ground change in the light regime (Molof-sky & Augspurger 1992). Temperature-sensitive seeds may germinate at agreater depth, since temperature fluctua-tions are considerable up to a depth ofapproximately 10-15 centimetre when thesoil surface is exposed to a full day of di-rect sun light (Rosenberg 1974).
The chance of successful establish-ment of a seed from a certain depth isdetermined by its size, which sets themaximum size of the seedling that can beproduced (Grime & Jeffrey 1965). Theinitial size does not only affect the com-petitive ability of the seedling, but alsothe maximum burial depth from whichemergence to the soil surface is possible(Haskins & Gorz 1975 in Vleeshouwers
1997, Bond & Wilgen 1996). The seed sizeof species with dormant seeds varies by atleast an order of 3 in the Southeast Asianrain forest (Metcalfe & Grubb 1995). MostRubiaceae and Melastomataceae have aseed weight <1 mg or even <0.1 mg. Ficusseeds commonly weigh 0.1-0.4 mg,whereas Macaranga species typicallyhave a seed weight of 10-30 mg (Metcalfe& Grubb 1995).
It would be clearly advantageous to aseed to be sensitive to a germination trig-ger that penetrates the soil up to themaximum depth from which it is able tosuccessfully establish a seedling. Thus,we expect that species with larger seedsare sensitive to triggers that penetratedeeper into the ground. More specifically,we predict the seeds of very small-seededtaxa (Rubiaceae, Melastomataceae, Ficus)to be triggered by light, whereas Maca-ranga seeds are also sensitive to dailyfluctuations in temperature. In the pres-ent study, we tested how different combi-nations of light availability and dailyfluctuations in temperature influence thegermination of seeds from the soil seedbank.
The dependence for germination onan external trigger allows species withdormant seeds to commonly establish innatural forest gaps (Hopkins & Graham1984, Raich & Gong 1990). The samemechanism ensures that the seedbankcontributes significantly to the estab-lishing vegetation after fire (Young et al.1987, Riswan & Kartawinata 1989,Woods 1989, Nykvist 1996, Kammesheidt1999). Due to the fire the above groundvegetation is disturbed which greatly in-creases the light availability and dailyfluctuations in temperature at the soilsurface, thus providing ample triggers forseed germination. However, seeds in theupper part of the seed bank are likely tobe damaged (Ewel et al. 1981, Swaine etal. 1997) by the fire (Campbell et al.1995). These two opposing variables de-termine the post-fire density of germina-tion (Martin & Cushwa 1966, Whelan1995). We investigated the vertical gradi-

85
ent of the seedbank in an undisturbedforest, and compared this with the verti-cal distribution of seeds in adjacent partsof the forest that were burned. This waywe can make an estimate of how the fireaffects the availability of seeds that havethe potential to successfully establish aseedling after the fire.
Material and methods
Site descriptionThe samples for this study were col-
lected in the Sungai Wain forest reserveclose to Balikpapan, East Kalimantan inIndonesia (1º16’ S and 116º54’ E). Thisreserve is covered mainly by lowland dip-terocarp rain forest. It receives an aver-age annual rainfall of 2790 mm. In Marchand April 1998, during an extremely longdry episode, a forest fire burned two-thirds of the reserve. A core area of theforest was saved from the fire by means ofan extensive network of firebreaks. Moredetails on the site description are given inchapter 2.
Inside the forest the fire was of lowintensity, spreading over the ground at arate of 10-15 m/h and with a flame heightof 0.5 m. The fire was largely confined tothe litter layer, which mostly did not burncompletely. Although high rates of treemortality occurred, nearly all dead stems,including small seedlings and saplings,were left standing (chapter 2).
Two experiments were conducted inthis forest. The first experiment aimed atmeasuring the change in the vertical gra-dient of seed density in the seed bank asthe result of fire. The second experimentfocussed on differences in sensitivity ofdormant seeds to light availability anddaily fluctuations in temperature, whichpenetrate to different depths in the soil.
Seed density experimentFor the measurement of the viable
seed density, soil samples were collectedfrom six sites over an area of 9 km2. Sam-pling took place from 5 to 10 October1998. Samples were collected pair-wise,one sampling station being situated inburned forest and one in unburned forest.Sampling stations were at a distance of
15 to 30 m from the firebreak. At eachsampling station, five sub-samples with asurface area of 10 x 20 cm each weretaken in an area of 3 x 5 m. Each sub-sample was stratified into four horizontallayers, including the litter layer and threelayers of mineral soil of 1.5 cm deptheach. Per soil depth layer, these stratifiedsub-samples, were later homogenised toform a single sample. Thus we sampledup to 4.5 cm deep into the mineral soil.The volume of soil collected per samplingstation was 0.90 l (excluding the litterlayer). The layers were collected by usingknife-edged metal plates, which deline-ated the vertical borders of the sub-sample, after which a single plate wasdriven into the soil horizontally to collectthe layers separately. After collecting alayer, the depth to the soil surface wasmeasured at the four corners of the sam-ple pit, to ensure a correct stratification.These measurements showed that accu-rate stratification was achieved: From thesoil surface downwards, the depth of thethree soil layers was respectively 1.6 ± 0.2cm (average ± sd, n= 60), 3.1 ± 0.2 cm and4.6 ± 0.2 cm.
Samples were stored in plastic bagsin the dark and transported to the nurs-ery within three days. Each sample wasconcentrated by rinsing with water andsieving through a mesh of 0.5 mm. Be-cause very small seeds might be lost bythis procedure, we combined the residuesof the three layers of mineral soil fromone sub-sample (excluding the litterlayer) into one sample, which was washedthrough a sieve of 0.1 mm mesh wide.This control test was performed on thesub-samples of four sample points. All theresidues were randomly placed in trayson a substrate of white sand in a layerwith a maximum depth of 0.5 mm to en-sure favourable germination conditions atall depths in the samples (Dalling et al.1994). To control for viable seeds in thesubstrate and for wind dispersed seedsthat might arrive during the experiment,an additional twenty trays which con-tained only white sand were placed ran-domly over the greenhouse area. The fewsamples that had remained relativelyvoluminous after rinsing and sieving were
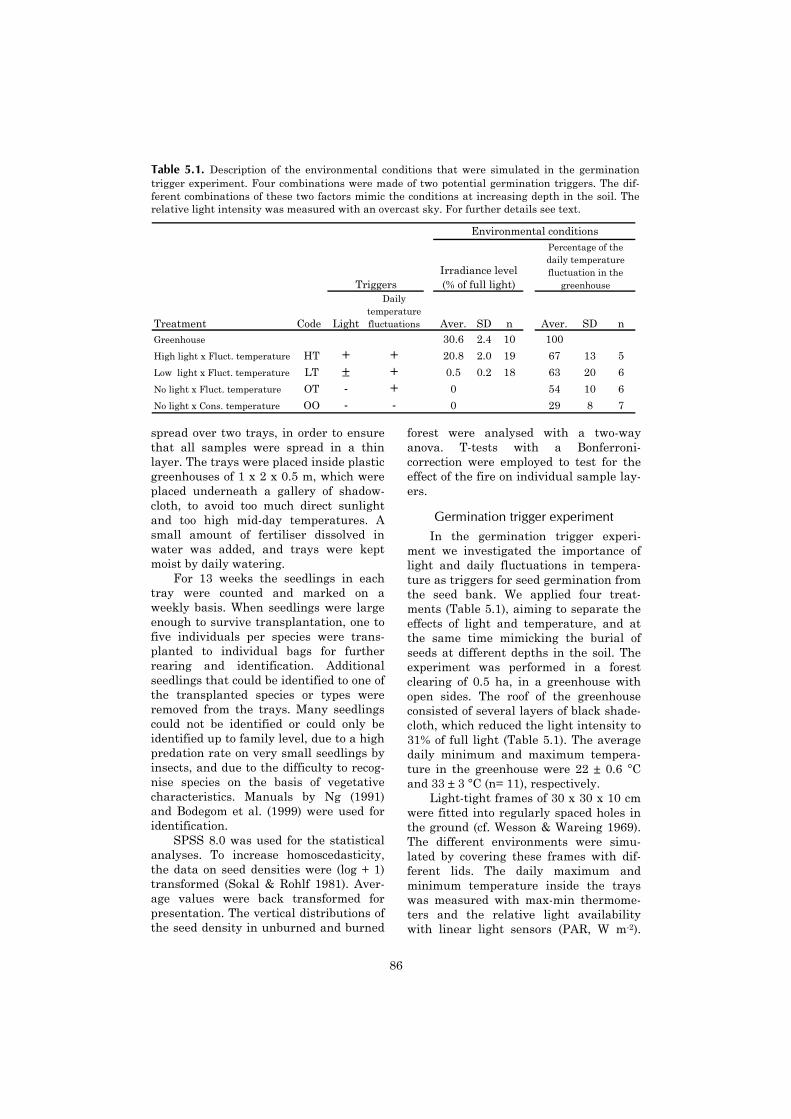
86
spread over two trays, in order to ensurethat all samples were spread in a thinlayer. The trays were placed inside plasticgreenhouses of 1 x 2 x 0.5 m, which wereplaced underneath a gallery of shadow-cloth, to avoid too much direct sunlightand too high mid-day temperatures. Asmall amount of fertiliser dissolved inwater was added, and trays were keptmoist by daily watering.
For 13 weeks the seedlings in eachtray were counted and marked on aweekly basis. When seedlings were largeenough to survive transplantation, one tofive individuals per species were trans-planted to individual bags for furtherrearing and identification. Additionalseedlings that could be identified to one ofthe transplanted species or types wereremoved from the trays. Many seedlingscould not be identified or could only beidentified up to family level, due to a highpredation rate on very small seedlings byinsects, and due to the difficulty to recog-nise species on the basis of vegetativecharacteristics. Manuals by Ng (1991)and Bodegom et al. (1999) were used foridentification.
SPSS 8.0 was used for the statisticalanalyses. To increase homoscedasticity,the data on seed densities were (log + 1)transformed (Sokal & Rohlf 1981). Aver-age values were back transformed forpresentation. The vertical distributions ofthe seed density in unburned and burned
forest were analysed with a two-wayanova. T-tests with a Bonferroni-correction were employed to test for theeffect of the fire on individual sample lay-ers.
Germination trigger experimentIn the germination trigger experi-
ment we investigated the importance oflight and daily fluctuations in tempera-ture as triggers for seed germination fromthe seed bank. We applied four treat-ments (Table 5.1), aiming to separate theeffects of light and temperature, and atthe same time mimicking the burial ofseeds at different depths in the soil. Theexperiment was performed in a forestclearing of 0.5 ha, in a greenhouse withopen sides. The roof of the greenhouseconsisted of several layers of black shade-cloth, which reduced the light intensity to31% of full light (Table 5.1). The averagedaily minimum and maximum tempera-ture in the greenhouse were 22 ± 0.6 °Cand 33 ± 3 °C (n= 11), respectively.
Light-tight frames of 30 x 30 x 10 cmwere fitted into regularly spaced holes inthe ground (cf. Wesson & Wareing 1969).The different environments were simu-lated by covering these frames with dif-ferent lids. The daily maximum andminimum temperature inside the trayswas measured with max-min thermome-ters and the relative light availabilitywith linear light sensors (PAR, W m-2).
Table 5.1. Description of the environmental conditions that were simulated in the germinationtrigger experiment. Four combinations were made of two potential germination triggers. The dif-ferent combinations of these two factors mimic the conditions at increasing depth in the soil. Therelative light intensity was measured with an overcast sky. For further details see text.
Treatment Code Light
Daily temperature fluctuations Aver. SD n Aver. SD n
Greenhouse 30.6 2.4 10 100High light x Fluct. temperature HT + + 20.8 2.0 19 67 13 5Low light x Fluct. temperature LT ± + 0.5 0.2 18 63 20 6No light x Fluct. temperature OT - + 0 54 10 6No light x Cons. temperature OO - - 0 29 8 7
Triggers
Environmental conditions
Irradiance level (% of full light)
Percentage of the daily temperature fluctuation in the
greenhouse
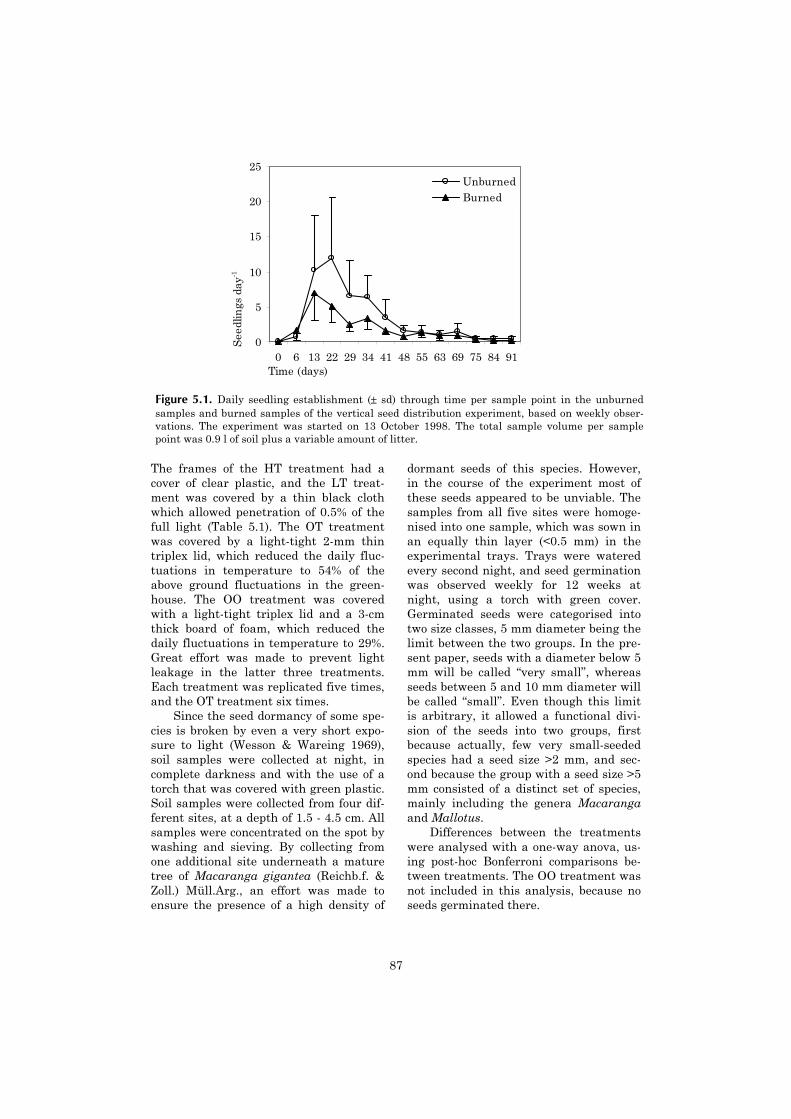
87
The frames of the HT treatment had acover of clear plastic, and the LT treat-ment was covered by a thin black clothwhich allowed penetration of 0.5% of thefull light (Table 5.1). The OT treatmentwas covered by a light-tight 2-mm thintriplex lid, which reduced the daily fluc-tuations in temperature to 54% of theabove ground fluctuations in the green-house. The OO treatment was coveredwith a light-tight triplex lid and a 3-cmthick board of foam, which reduced thedaily fluctuations in temperature to 29%.Great effort was made to prevent lightleakage in the latter three treatments.Each treatment was replicated five times,and the OT treatment six times.
Since the seed dormancy of some spe-cies is broken by even a very short expo-sure to light (Wesson & Wareing 1969),soil samples were collected at night, incomplete darkness and with the use of atorch that was covered with green plastic.Soil samples were collected from four dif-ferent sites, at a depth of 1.5 - 4.5 cm. Allsamples were concentrated on the spot bywashing and sieving. By collecting fromone additional site underneath a maturetree of Macaranga gigantea (Reichb.f. &Zoll.) Müll.Arg., an effort was made toensure the presence of a high density of
dormant seeds of this species. However,in the course of the experiment most ofthese seeds appeared to be unviable. Thesamples from all five sites were homoge-nised into one sample, which was sown inan equally thin layer (<0.5 mm) in theexperimental trays. Trays were wateredevery second night, and seed germinationwas observed weekly for 12 weeks atnight, using a torch with green cover.Germinated seeds were categorised intotwo size classes, 5 mm diameter being thelimit between the two groups. In the pre-sent paper, seeds with a diameter below 5mm will be called “very small”, whereasseeds between 5 and 10 mm diameter willbe called “small”. Even though this limitis arbitrary, it allowed a functional divi-sion of the seeds into two groups, firstbecause actually, few very small-seededspecies had a seed size >2 mm, and sec-ond because the group with a seed size >5mm consisted of a distinct set of species,mainly including the genera Macarangaand Mallotus.
Differences between the treatmentswere analysed with a one-way anova, us-ing post-hoc Bonferroni comparisons be-tween treatments. The OO treatment wasnot included in this analysis, because noseeds germinated there.
Figure 5.1. Daily seedling establishment (± sd) through time per sample point in the unburnedsamples and burned samples of the vertical seed distribution experiment, based on weekly obser-vations. The experiment was started on 13 October 1998. The total sample volume per samplepoint was 0.9 l of soil plus a variable amount of litter.
0
5
10
15
20
25
0 6 13 22 29 34 41 48 55 63 69 75 84 91Time (days)
See
dlin
gs d
ay-1
UnburnedBurned
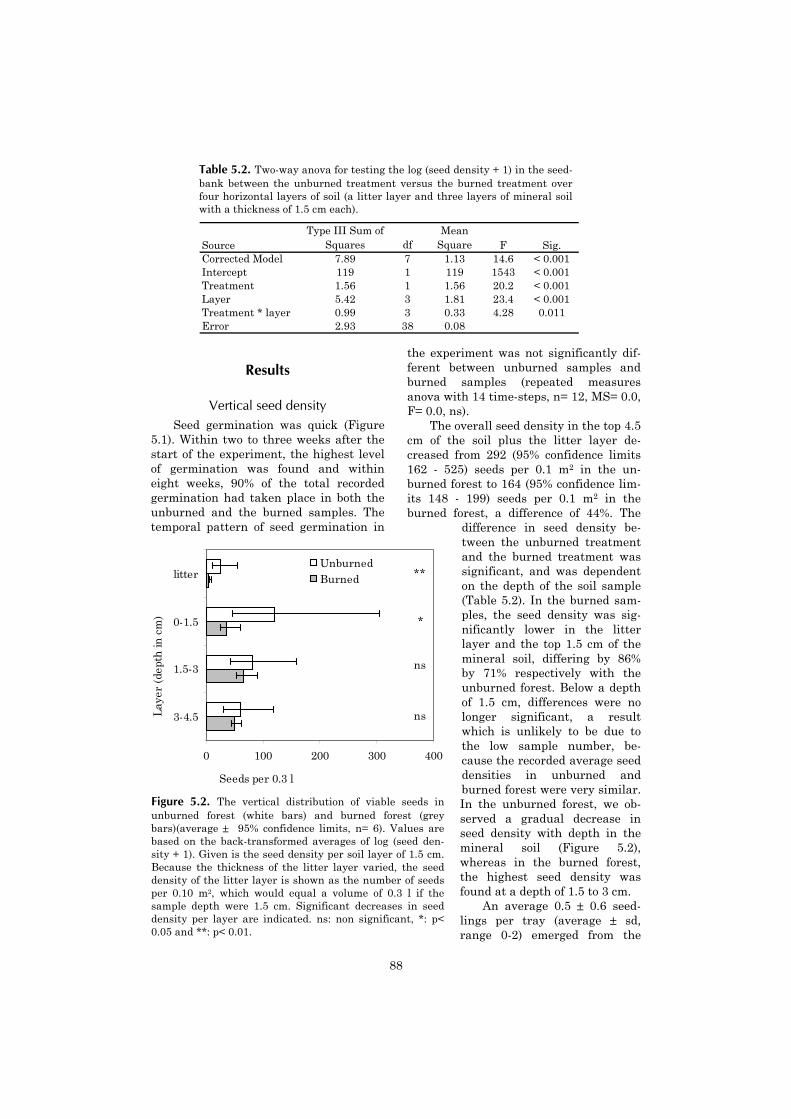
Results
Vertical seed densitySeed germination was quick (Figure
5.1). Within two to three weeks after thestart of the experiment, the highest levelof germination was found and withineight weeks, 90% of the total recordedgermination had taken place in both theunburned and the burned samples. Thetemporal pattern of seed germination in
the experiment was not significantly dif-ferent between unburned samples andburned samples (repeated measuresanova with 14 time-steps, n= 12, MS= 0.0,F= 0.0, ns).
The overall seed density in the top 4.5cm of the soil plus the litter layer de-creased from 292 (95% confidence limits162 - 525) seeds per 0.1 m2 in the un-burned forest to 164 (95% confidence lim-its 148 - 199) seeds per 0.1 m2 in theburned forest, a difference of 44%. The
difference in seed density be-tween the unburned treatmentand the burned treatment wassignificant, and was dependenton the depth of the soil sample(Table 5.2). In the burned sam-ples, the seed density was sig-nificantly lower in the litterlayer and the top 1.5 cm of themineral soil, differing by 86%by 71% respectively with theunburned forest. Below a depthof 1.5 cm, differences were nolonger significant, a resultwhich is unlikely to be due tothe low sample number, be-cause the recorded average seeddensities in unburned andburned forest were very similar.In the unburned forest, we ob-served a gradual decrease inseed density with depth in themineral soil (Figure 5.2),whereas in the burned forest,the highest seed density wasfound at a depth of 1.5 to 3 cm.
An average 0.5 ± 0.6 seed-lings per tray (average ± sd,
Table 5.2. Two-way anova for testing the log (seed density + 1) in the seed-bank between the unburned treatment versus the burned treatment overfour horizontal layers of soil (a litter layer and three layers of mineral soilwith a thickness of 1.5 cm each).
FubbsBdpsd0
ns
ns
*
**
0 100 200 300 400
litter
0-1.5
1.5-3
3-4.5Lay
er (
dept
h in
cm
)
Seeds per 0.3 l
UnburnedBurned
SourceType III Sum of
Squares dfMean
Square F Sig.Corrected Model 7.89 7 1.13 14.6 < 0.001Intercept 119 1 119 1543 < 0.001Treatment 1.56 1 1.56 20.2 < 0.001Layer 5.42 3 1.81 23.4 < 0.001Treatment * layer 0.99 3 0.33 4.28 0.011Error 2.93 38 0.08
igure 5.2. The vertical distribution of viable seeds innburned forest (white bars) and burned forest (greyars)(average ± 95% confidence limits, n= 6). Values areased on the back-transformed averages of log (seed den-ity + 1). Given is the seed density per soil layer of 1.5 cm.ecause the thickness of the litter layer varied, the seedensity of the litter layer is shown as the number of seedser 0.10 m2, which would equal a volume of 0.3 l if theample depth were 1.5 cm. Significant decreases in seedensity per layer are indicated. ns: non significant, *: p<.05 and **: p< 0.01.
88
range 0-2) emerged from the
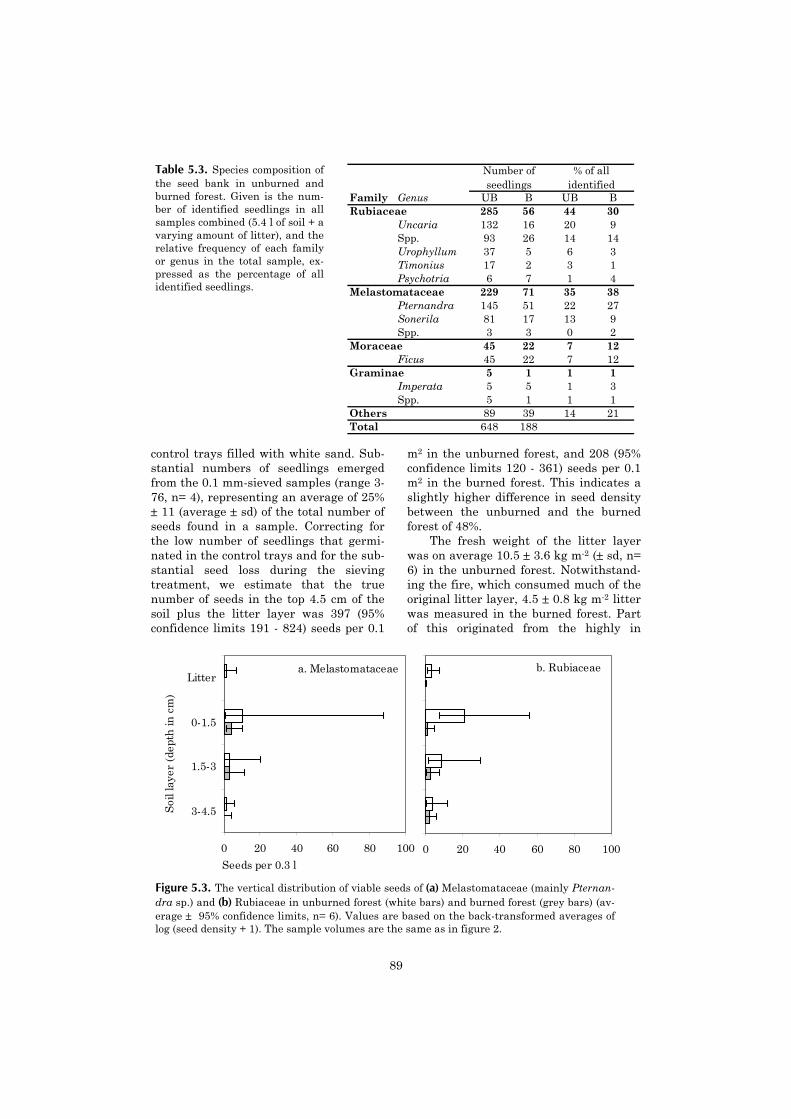
89
control trays filled with white sand. Sub-stantial numbers of seedlings emergedfrom the 0.1 mm-sieved samples (range 3-76, n= 4), representing an average of 25%± 11 (average ± sd) of the total number ofseeds found in a sample. Correcting forthe low number of seedlings that germi-nated in the control trays and for the sub-stantial seed loss during the sievingtreatment, we estimate that the truenumber of seeds in the top 4.5 cm of thesoil plus the litter layer was 397 (95%confidence limits 191 - 824) seeds per 0.1
m2 in the unburned forest, and 208 (95%confidence limits 120 - 361) seeds per 0.1m2 in the burned forest. This indicates aslightly higher difference in seed densitybetween the unburned and the burnedforest of 48%.
The fresh weight of the litter layerwas on average 10.5 ± 3.6 kg m-2 (± sd, n=6) in the unburned forest. Notwithstand-ing the fire, which consumed much of theoriginal litter layer, 4.5 ± 0.8 kg m-2 litterwas measured in the burned forest. Partof this originated from the highly in
Family Genus UB B UB BRubiaceae 285 56 44 30
Uncaria 132 16 20 9Spp. 93 26 14 14Urophyllum 37 5 6 3Timonius 17 2 3 1Psychotria 6 7 1 4
Melastomataceae 229 71 35 38Pternandra 145 51 22 27Sonerila 81 17 13 9Spp. 3 3 0 2
Moraceae 45 22 7 12Ficus 45 22 7 12
Graminae 5 1 1 1Imperata 5 5 1 3Spp. 5 1 1 1
Others 89 39 14 21Total 648 188
Number of seedlings
% of all identified
Table 5.3. Species composition ofthe seed bank in unburned andburned forest. Given is the num-ber of identified seedlings in allsamples combined (5.4 l of soil + avarying amount of litter), and therelative frequency of each familyor genus in the total sample, ex-pressed as the percentage of allidentified seedlings.
b. Rubiaceae
0 20 40 60 80 100
a. Melastomataceae
0 20 40 60 80 100
Litter
0-1.5
1.5-3
3-4.5Soi
l lay
er (
dept
h in
cm
)
Seeds per 0.3 l
Figure 5.3. The vertical distribution of viable seeds of (a) Melastomataceae (mainly Pternan-dra sp.) and (b) Rubiaceae in unburned forest (white bars) and burned forest (grey bars) (av-erage ± 95% confidence limits, n= 6). Values are based on the back-transformed averages oflog (seed density + 1). The sample volumes are the same as in figure 2.
creased leaf fall after the fire. In allburned plots but one we recorded viableseeds in the litter layer, although the lit-ter layer formed the main source of com-bustible material.
Three families made up more than85% of the identified individuals (Table5.3). Nearly all the taxa that we foundproduce very small seeds (i.e. <5 mm di-ameter). Several species of small treeswere found in the samples, including Fi-cus grossularioides Burm.f., Ficus aurataMiq. and Vernonia arborea Buch.-Ham.The only common species that reachesabove 15 m was Pternandra sp. Only veryfew seedlings of Macaranga spp. werefound in the samples, although they werecommon in the burned forest. Melastoma-taceae and Rubiaceae were present insufficiently high densities to allow for acomparison of their vertical seed densitydistribution (Figure 5.3). The vertical
seed distribution of these two familieswas nearly identical both in the absenceand presence of fire (Table 5.4). We foundonly a marginally significant interactionterm between family and the fire treat-ment, which suggests that Rubiaceaemight be slightly more sensitive to fire.
The spatial variation in seed densitywas high (i.e. see the 95% confidence lim-its in figure 5.2). We observed that thisspatial variation in seed density was notjust the result of the aggregation of seedsof a single species, but instead resultedfrom a correlation in the density of seedsfrom different taxa (Figure 5.4). This cor-relation was pronounced in both the un-burned and the burned forest.
Germination triggersWe found significant differences in
seed germination under different envi-ronmental conditions (one-way anova, df=
Table 5.4. Three-way anova for testing the log (seed density + 1) in the seed-bank of two families (Melastomataceae vs. Rubiaceae) between two treatments(unburned forest vs. burned forest) over four horizontal layers of soil, includinga litter layer and three layers of mineral soil with a thickness of 1.5 cm each.
Source
Type III Sum of Squares df
Mean Square F Sig.
Corrected Model 10.3 15 0.68 3.74 < 0.001Intercept 28.1 1 28.1 154 < 0.001Family 0.59 1 0.59 3.23 0.076Treatment 3.11 1 3.11 17.0 < 0.001Layer 4.60 3 1.53 8.39 < 0.001Family * treatment 0.75 1 0.75 4.11 0.046Family * layer 0.26 3 0.09 0.47 0.702Treatment * layer 1.12 3 0.37 2.03 0.116Family * treatment * layer 0.19 3 0.06 0.35 0.788Error 13.9 76 0.18
Table 5.5. Number of seeds germinated from soil samples from the primary forest, which weresown under different combinations of environmental conditions (See table 1). The number of repli-cates (n), the total number of seeds emerged (± sd), the number of seeds smaller than 5 mm diame-ter, and the number of seeds larger than 5 mm diameter are given.
Treatment n Average SD Sign* Average SD Average SDHT 5 88 19 a 87 19 1.2 0.8LT 4** 40 9 b 40 9 0.5 0.6OT 6 0.5 0.5 c 0.2 0.4 0.3 0.5OO 5 0.0 0.0 0.0
Seeds < 5 mm Seeds > 5 mmTotal
*0s
Pairwise differences between treatments were tested with a post-hoc Bonferroni test (all p<.013). Because in the OO treatment no seeds germinated, this treatment was excluded from the
90
tatistical analysis. ** One replicate in the LT treatment was lost due to disturbance.
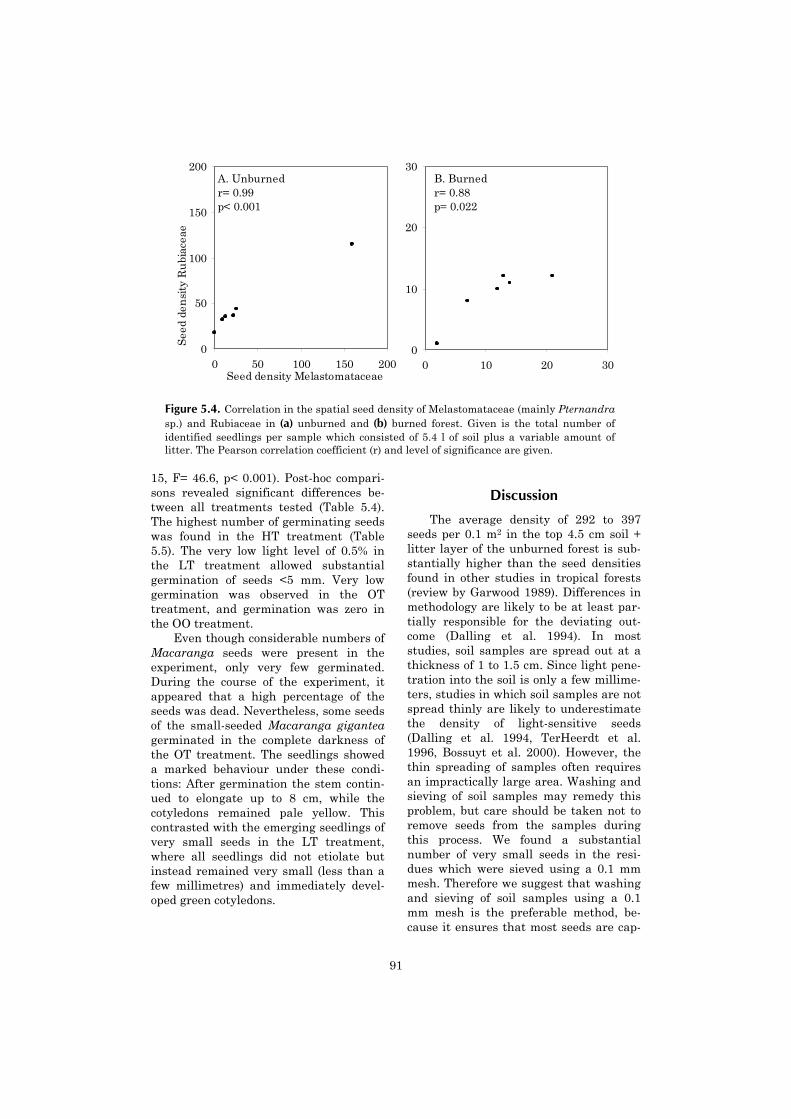
91
15, F= 46.6, p< 0.001). Post-hoc compari-sons revealed significant differences be-tween all treatments tested (Table 5.4).The highest number of germinating seedswas found in the HT treatment (Table5.5). The very low light level of 0.5% inthe LT treatment allowed substantialgermination of seeds <5 mm. Very lowgermination was observed in the OTtreatment, and germination was zero inthe OO treatment.
Even though considerable numbers ofMacaranga seeds were present in theexperiment, only very few germinated.During the course of the experiment, itappeared that a high percentage of theseeds was dead. Nevertheless, some seedsof the small-seeded Macaranga giganteagerminated in the complete darkness ofthe OT treatment. The seedlings showeda marked behaviour under these condi-tions: After germination the stem contin-ued to elongate up to 8 cm, while thecotyledons remained pale yellow. Thiscontrasted with the emerging seedlings ofvery small seeds in the LT treatment,where all seedlings did not etiolate butinstead remained very small (less than afew millimetres) and immediately devel-oped green cotyledons.
Discussion
The average density of 292 to 397seeds per 0.1 m2 in the top 4.5 cm soil +litter layer of the unburned forest is sub-stantially higher than the seed densitiesfound in other studies in tropical forests(review by Garwood 1989). Differences inmethodology are likely to be at least par-tially responsible for the deviating out-come (Dalling et al. 1994). In moststudies, soil samples are spread out at athickness of 1 to 1.5 cm. Since light pene-tration into the soil is only a few millime-ters, studies in which soil samples are notspread thinly are likely to underestimatethe density of light-sensitive seeds(Dalling et al. 1994, TerHeerdt et al.1996, Bossuyt et al. 2000). However, thethin spreading of samples often requiresan impractically large area. Washing andsieving of soil samples may remedy thisproblem, but care should be taken not toremove seeds from the samples duringthis process. We found a substantialnumber of very small seeds in the resi-dues which were sieved using a 0.1 mmmesh. Therefore we suggest that washingand sieving of soil samples using a 0.1mm mesh is the preferable method, be-cause it ensures that most seeds are cap-
B. Burnedr= 0.88p= 0.022
0
10
20
30
0 10 20 30
A. Unburnedr= 0.99p< 0.001
0
50
100
150
200
0 50 100 150 200Seed density Melastomataceae
See
d de
nsi
ty R
ubi
acea
e
Figure 5.4. Correlation in the spatial seed density of Melastomataceae (mainly Pternandrasp.) and Rubiaceae in (a) unburned and (b) burned forest. Given is the total number ofidentified seedlings per sample which consisted of 5.4 l of soil plus a variable amount oflitter. The Pearson correlation coefficient (r) and level of significance are given.
92
tured whereas at the same time it allowsthe thin spreading of samples over anarea of manageable size.
The species composition of the soilseed bank is an indicator for the regrowthpotential after a fire. Only 28% of allseedlings could be identified up to sometaxonomic level, partly because manyvery small seedlings (1-2 mm high at thetime of emergence) died before identifica-tion was possible. Therefore, the relativeabundance of different taxa should beinterpreted cautiously. Rubiaceae andMelastomataceae both representedroughly one third of the identified seed-lings. Shrubs, small trees and lianas arethe common growth forms in these fami-lies.
The various seedlings germinatingfrom the soil samples have been classifiedas light-demanding pioneer species (Ficusaurata, Ixora spp., Macaranga spp. Me-lastoma sp., Trema spp., Timonius sp.),while the samples also contained a num-ber of very small-seeded shade toleratingspecies (Ficus grossularioides Burm.f.,Lasianthus spp., Pternandra sp., Uro-phyllum spp.), which are dependent on apatch of bare soil for their establishment(Metcalfe & Grubb 1995, Metcalfe et al.1998). Pternandra sp. was the mostabundant species in the seed bank,probably as a result of the relatively highstem density of 3.1 trees ha-1 (>10 cmdbh) in the unburned forest.
We observed a large spatial variationin seed density (see 95% confidence limitsin figure 5.2), which, remarkably, in largepart is the result of a correlation in seeddensity of the two dominant families(Figure 5.4). The majority of the recordedRubiaceae can be categorised as short-lived light-demanding species, whereasPternandra, the species that accounts formost of the seeds recorded within theMelasomataceae, is a longer-lived under-storey tree. Therefore, the local history ofabove-ground disturbance seems an un-likely explanation for the correlative pat-tern. Instead, there seems to operate aspecies-independent factor that influencesthe local seed density. Possible factors areeither interactions with generalist seedconsumers such as ants, which may cause
spatially clumped patterns of seed disper-sal (review by Louda 1989) and post-dispersal seed predation (Louda 1989,Crawley 1992), or site-specific abiotic fac-tors such as soil texture (Hopkins & Gra-ham 1983) and soil humidity (Garwood1989), which influence the movement ofseeds or the local survival rate (Roberts &Abdalla 1968, Roberts 1972).
Comparison of the vertically strati-fied soil samples from the unburned for-est and the burned forest shows that thefire damage was restricted to the upper-most layers: Only the litter layer and top1.5 cm of the seed bank were significantlyaffected. Changes in seed density werealso largely confined to the top 1.5 cm ofmineral soil in a Ghanaian forest afterbeing experimentally burned (Swaine etal. 1997). The pattern is in agreementwith the short fire residence time and thelow fire intensity inside the forest (MvNpers. obs.), and with the observation thatpeak temperature generally declinesrapidly with depth (references in Whelan1995, Swaine et al. 1997, Campbell et al.1995).
Notwithstanding the superficiality ofthe damage, the fire may have profoundconsequences for the establishment po-tential of seedlings from the seed bank.Burial depth influences the chance of seedgermination and seedling establishmentand thus the chance that a seed contrib-utes to the establishing vegetation afterthe fire. The trigger experiment that weperformed, showed that all of the verysmall-sized seeds need light for theirgermination, even though that can be aslow as 0.5% light. Such light levels maybe available at 1 tot 2 mm depth in a baresoil (Wooley & Stoller 1978). In agree-ment, a rapid decrease in germinationrate of seeds deeper than 5 mm in the soilwas found in a neotropical study (Dallinget al. 1994) in which approximately 90%of the seeds had a weight <1 mg.
A study in a neotropical rainforest inCosta Rica suggested much higher pro-portions of germination, with 85% of theseeds in the top 4 cm of the soil germi-nating and establishing a seedling after apatch of land was slashed and burned(Young et al. 1987). However, the seed

93
density prior to the disturbance may havebeen underestimated, due to the above-mentioned methodological problems. Ten-tatively we conclude that, unless distur-bances occur at the soil surface thatexpose deeper soil layers, only the mostsuperficially buried seeds of the strictlylight-sensitive species will be triggered togerminate, and a substantial proportionof the seed bank probably remains unaf-fected by either the fire disturbance orthe subsequent change in the above-ground light environment.
The seed store of the small-seededMacaranga species may be affected quitedifferently by the disturbance. Someseeds of Macaranga germinated in com-plete darkness, probably as a response todaily fluctuations in temperature. Aftergermination they showed a marked elon-gation of the stem (etiolation) up to atleast 8 cm. Even though the number ofgerminating seeds was too low to providestatistical proof, these observations sug-gest that Macaranga seedlings are able toestablish from deeper in the soil.
The consequence of the higher germi-nation rate from deeper soil layers may bethat, after a fire disturbance and the sub-sequent germination flush, a smaller partof the seed stores of small-seeded specieslike Macaranga remains than of verysmall-seeded species. Because a repeateddisturbance may kill the re-establishing
individuals before a new seed-set hasbeen achieved, Macaranga populationsare expected to decline more rapidly thanthe populations of very small-seeded spe-cies after logging activities in a burnedforest (Nieuwstadt et al. 2001) or after arecurring fire.
Acknowledgements
This research was performed at theWanariset International Ministry of For-estry (MOF) - Tropenbos research station,East Kalimantan. I am indebted to manyof the staff members working there, espe-cially M. de Kam, A. Susilo and K. Sidi-yasa for logistic support, and the researchgroup of R. Effendi for maintenance of thegreenhouse experiment. The researchwould have been impossible without arewarding co-operation with G.M.Fredriksson and the dedicated assistanceof J. Helleman, S. Laysa Putra, N. Syah,F. Udin and C.S.A. Vissers. Seedlingswere identified by K.A.O. Eichhorn, P.B.Pelser and J.W.F. Slik. M.J.A. Wergerand H.J. During provided helpful com-ments on the manuscript. The researchwas supported by the Netherlands Foun-dation for the Advancement of TropicalResearch (WOTRO) with grant 84-804 toM.v.N.

94
Repeatedly burned hill side, with a vegetation consisting of herbs,vines, shrubs, and a few scattered surviving trees. Wanariset re-search area, February 2000.

Note to Chapter 6
“ The ecological consequences of logging inthe burned forests of East Kalimantan,
Indonesia”(With Douglas Sheil and Kuswata Kartawinata)
Publ In: Conservation Biology 15(4): 1183-1186
“If this article is to be used in any way, you must seek permission from the publisher".
6The ecological consequences of logging in
the burned forests of East Kalimantan,Indonesia
With Douglas Sheil and Kuswata Kartawinata
In: Conservation Biology 15(4): 1183-1186
Keywords: repeated disturbance, resprouting, salvage logging, seed bank, South-EastAsia, tree mortality, tropical dipterocarp forest.
Introduction
In 1997-1998 over 50,000 km2 of EastKalimantan burned, and some 26,000km2 of natural forest concessions wereaffected. This is nearly one-quarter (24%)of the area of all natural forest conces-sions in the province (Hoffmann et al.1999, Siegert et al. 2001). The biomass ofthe trees living at the time of the burnwas little reduced by the fire whichtended to be restricted to the litter andunderstory, and although many treesdied, most stems remained standing afterfire. These dead stems in the burned for-est represent a significant timber re-source. A government regulation wasissued (Directorate of Forest Utilization1999) indicating that in concessionswhere fires had occurred, ”salvage felling”(harvesting of the remnant commercialdead timber by conventional methods)should precede any continuation of regu-lar harvesting operations in unburnedforest areas. The reason for this regula-tion was that the dead stems could stillprovide valuable timber if removed before
serious deterioration (Ulbricht et al.1999). It was apparently assumed thatsuch salvage activities would have littleadditional effect on the already degradedforest. There are good reasons, however,to be concerned about the ecological ef-fects of salvage felling after fire.
Forest areas can recover after fire,but remain in a very sensitive state inwhich additional disturbances, such assalvage felling, will cause significantlyincreased levels of forest deteriorationand loss. The results from our 2-yearstudy on post-fire vegetation dynamics inthe unlogged dipterocarp rainforest ofSungai Wain near to Balikpapan (1º16’ Sand 116º54’ E; altitude 40 to 140 m.a.s.l.;average yearly rainfall 2790 mm (Vose etal. 1992), East Kalimantan, compel us towarn against the implications of salvagefelling. We intend to publish a more de-tailed account of our study but the ur-gency of the situation makes it importantthat we disseminate our main conclusionsas soon as possible.
96
Vegetation processes after singleand repeated disturbance
The recovery capacity of forest vege-tation after fire and other disturbancesinvolves four main processes: tree sur-vival, the resprouting of damaged trees,germination of seeds in the seed bank,and the seed rain. To study the relativecontribution of these processes to vegeta-tion development, we established perma-nent sample plots of 1.8 ha each inunburned forest and in forest that burnedaccidentally in March 1998 after severalmonths of drought. Nine pairs of burnedand unburned plots were established ad-jacent to each other over a human-madeedge (a successful fire break that usuallydoes not correspond to any topographicalfeature) between burned and unburnedforest. The plots were spread over a totalarea of circa 20 km2. Each pair of plotsformed one contiguous transect of 60 x600 m half in burned and half in un-burned forest. In these plots, more than3000 (both dead and living) stems largerthan 28 cm dbh (diameter measured at1.3 m height) were measured and labeled.In subplots of 0.4 ha, an additional 4700trees between 8 cm and 28 cm dbh weremeasured and labeled. A total of 2190(dead and living) seedlings and saplings(<8 cm dbh) and 445 living resprouts onstems smaller than 8 cm dbh were meas-ured and labeled in 10 m2 burned sub-plots. Living trees and sprouts and deadtrees larger than 28 cm dbh belonging to10 common species were identified bylocal experts.
Directly after the low intensityground fire most of the trees remainedstanding, although a high proportion ofthe stems appeared to be dead. One yearafter burning < 1% of trees smaller than 8cm dbh survived, but larger sizes gener-ally fared better. Survival of trees largerthan 30 cm dbh was circa 45%, with arange from 20 to 95% among species.Comparable levels of survival for treeslarger than 10 cm dbh 1 month after firehave been found in a recently logged for-est in Sabah (Woods 1988), whereas sur-vival 6 months after fire was circa 25%higher in an unlogged forest in Kutai Na-
tional Park, East Kalimantan (Leighton& Wirawan 1986) and in Sumatra (Kin-naird & O’Brien 1998). The survivingtrees in the Sungai Wain forest appearedsensitive to wind. Of the 35% of the livingstems that died in the second year, one-fifth had fallen. The remaining trees pro-vided a sparse matrix, with a considera-bly impoverished species composition.
After the fire, some trees that werekilled above ground sprouted from basalparts. This is a common phenomenon af-ter slash and burn practices (Stocker1981; Riswan & Kartawinata 1991 a & b;Kammesheidt 1998) and has been ob-served after fire in other tropical forests(Leighton & Wirawan 1986; Riswan &Yusuf 1986; Pinard et al. 1999). With aproportion of circa 17%, sprouting fre-quency was highest for above-ground-killed seedlings and saplings smaller than8 cm dbh. This was enough to providedensities of 0.2 to 0.4 sprouting trees perm2. Trees larger than 10 cm dbh thatwere killed above ground had a sproutingfrequency below 10% and added little tothe density of sprouting individuals.
In an experiment in the unburnedforest we assessed the sprouting vigor ofyoung trees of six primary forest species(Dipterocarpus confertus Sloot, Durio acu-tifolius [Mast.] Kosterm., Gironniera ner-vosa Planch., Macaranga lowii King exHook.f., Madhuca kingiana [Brace]H.J.Lam, Shorea laevis Ridl.), after clip-ping the main stem. Two hundred indi-viduals from each species were checkedmonthly over 6 months for the number ofsprouts produced, sprout length, andnumber of leaves. Sprouting occurredfast, with more than 90% of the individu-als sprouted after 3 months in four of thesix species. Several species were affectednegatively by repeated disturbance.Plants that were clipped for a second time2 months after the initial clipping showeda reduction in sprouting frequency rang-ing from 0 to 40% when the top of theremaining stem was removed to a 64 to100% reduction when clipped at groundlevel. Thus, where the heavy machineryused for salvage felling damages re-sprouts, their survival is reduced.
97
Sprouts of primary tree species com-peted with ferns and secondary seedlingsof pioneer trees and shrubs in the youngvegetation and were often overgrown bythese within 1 year. Most of the sproutsnevertheless survived for the first 2years. After 2 years, 25% of the sproutshad outgrown the layers of ferns andshrubs. Therefore, they appeared to playan important role in the persistence ofmany primary forest species.
Stratified soil samples, taken in sixreplicates from unburned and burnedareas in the Sungai Wain forest wereplaced in the nursery under high lightconditions, which triggered abundantgermination of seeds. The experimentrevealed that the fire killed 85% of theseeds lying dormant in the litter layerand more than 60% of the seeds in theupper 1.5 cm of the soil. No reduced seeddensity was found in deeper soil layers. Inthe burned forest, the gap-like environ-mental circumstances induced the fre-quent germination of seeds from the seedbank (Vázquez-Yanes & Orozco-Segovia1993). Notwithstanding the high seedmortality in the upper soil layers, a densecarpet of pioneer seedlings had estab-lished 4 months after the fire in thoseplaces where high densities of pioneertrees had been present prior to the burn-ing. Because of the high mortality and thehigh germination incidence soon after thefire, the density of viable seeds remainingin the soil is greatly reduced (Hopkins &Graham 1984; Young & Brown 1987;Saulei & Swaine 1988). Under these cir-cumstances the local seed bank has littlepotential for further regrowth. These ar-eas, if further damaged, risk invasion bywind-dispersed species, including Imper-ata cylindrica [L.] Beauv. (Alang-alang,grass), Pteridium caudatum [L.] Maxon(Bracken fern), and Dinochloa sp. (Bam-boo). It has previously been shown in EastKalimantan that complete conversion of aprimary forest to Imperata grassland cantake place rapidly after clearfelling andrepeated burning (Kartawinata 1993).For the local seed production of woodyspecies to become substantial takes 1 yearor more for rapidly maturing shrubbyspecies (e.g., Homalanthus populneus
[Geiseler] Pax, Macaranga trichocarpa[Reichb.f. & Zoll.] Müll.Arg., some Ficusspp.) and at least 4 years for the largersecondary tree species (e.g., Dillenia sp.,Mallotus paniculatus [Lam.] Müll.Arg.)(Saulei & Swaine 1988).
Seed production by trees that surviveeither as individuals in the burned areaor in pockets of unburned forest will ulti-mately be the main source of regenerationof many primary forest tree species. Ini-tially the density and diversity of the seedrain will be impoverished due to the lowavailability of seed sources. Because theseed dispersal distance of many tree spe-cies is limited (Howe & Smallwood 1982;Whitmore 1984), the proximity and com-position of relic unburned patches is an-ticipated to have a large effect on thepersistence of fire-sensitive species in theburned forest.
Many species in the Sungai Wain for-est fruited in 1997 during the long pre-fire drought and did not seed again dur-ing the first 2 years after the fire. As wedescribed above, the burned forest wasdensely covered by ferns, pioneer seed-lings, sprouts, and grasses by that time.Seedling establishment from the post-fireseed rain under these circumstances re-mains to be assessed, but it is evidentthat it will take a long time before seed-lings of primary species will have estab-lished from the seed rain in numberscomparable to the post-fire density of re-sprouts. For that reason the presence andperformance of resprouts is a more impor-tant factor in the initial restoration of theforest than is the density of tree seedsources.
Conclusions and recommendations
Fire does not in itself cause completeloss of forest cover. The survival andsprouting capacity of primary forest treesand the seedling establishment of pioneertrees and shrubs suppress the establish-ment of nonforest species. However, post-fire vegetation is certainly less resiliantthan might be assumed by anyone wit-nessing the vigorous post-fire regrowth.The post-fire undergrowth cannot with-stand repeated disturbance: previously

98
sprouted individuals show reducedsprouting potential and survival afterbeing damaged a second time, the seed-bank is largely reduced after the initialpost-fire burst of germination, and thedensity of vital seed trees is low. The openareas created in the understory by theconventional heavy logging machineryused for salvage felling encourage therapid develoment of nonforest vegetation,and seriously reduce the potential forrecovery.
The genuine regenerative potential ofburned tropical rain forest and the poten-tial consequences of further disturbancecaused by salvage felling need recogni-tion. Our evidence implies that the main-tenance of a productive permanent forestestate is likely to be served best byavoiding logging activities in burned ar-eas. Further studies should be made inareas already harvested to further clarifythe effects of salvage felling, but untilsuch information is available caution isthe only environmentally defensible op-tion.
We have presented only ecologicalconcerns so far, but there are other rea-sons to review current practices of sal-vage harvesting. In Indonesia concessionholders cannot normally recut harvested
forest areas without waiting the statutoryperiod (a 20-year cutting cycle is thenorm). However, if fire occurs in a conces-sion, this restriction is lifted and furthercutting is allowed. Such incentives mustbe avoided.
Acknowledgements
This research was performed at theInternational Ministry of Forestry (MOF)-TROPENBOS-Kalimantan research sta-tion, East Kalimantan. We thank themany staff members working there fortheir support, especially M. de Kam, K.Sidiyasa, Ambriansyah, Z. Arifin, andA.K. Pakala. The field work benefitedgreatly from the dedication of N. Syah, F.Udin, and S. Laysa Putra. We are grate-full to J.A. Sayer, M.J.A. Werger, M. vanNoordwijk, D.W. Dijkman, G.M. Fredriks-son, J.W.F. Slik and A. Hoffmann fortheir support and fruitfull discussions.M.J.A. Werger, H. ter Steege, A. Hinrichsand 3 anonymous reviewers made valu-able comments on earlier versions of themanuscript. The research was supportedby the Netherlands Foundation for theAdvancement of Tropical Research (WO-TRO) with grant 84-408 to M.v.N.

7Synthesis: Assessing the consequences ofdrought and fire in a lowland dipterocarp
rain forest
“They wanted to be imperfect in order to always have something to strive towards, which is beauty.They wanted also to know wonder and to live miracles. Death is too perfect.”
Ben Okri, The Famished Road1991
Introduction
This report describes vegetation dy-namics in the first two years afterdrought and fire in a tropical lowlanddipterocarp rain forest. The study fol-lowed upon large-scale fires which, duringan exceptionally dry episode in 1997-1998, devastated extensive areas of forestin East Kalimantan, Indonesia (Hoff-mann et al. 1999, Siegert et al. 2001).Fires are considered to be rare in thetropical rain forest, and are restricted toperiods of exceptional drought. Never-theless, occasional fires must have oc-curred for a long time in many of theIndonesian forests, because traces of his-torical fires have been reported through-out the entire length of many paly-nological sample cores (Dam et al. 2001 a& b, Hope 2001, Anshari et al. 2001, Su-paran et al. 2001). Recently, the fre-quency and extent of fire disturbances inthe dipterocarp rain forest has increaseddramatically as the result of a synergismbetween logging activities, forest frag-mentation, and the common use of fire forland clearing by concessionaires andfarmers. In Kalimantan and Sumatrathere are large areas of recently burned
forest, and remaining forests are underthe threat of burning when new dry epi-sodes occur.
Notwithstanding the astonishing sizeof the areas that are affected or threat-ened, very few studies have been cariedout in Southeast Asia to assess the im-pact of fire on forest vegetation. Knowl-edge about the fate of a forest afterburning is indispensable for sound forestmanagement, both from a conservation aswell as from an economic point of view.The fires also constitute an intriguingcase for ecological science. Recently, theimportance of large-scale disturbances intropical rain forests has been acknowl-edged (Tanner et al. 1991, Bellingham etal. 1994, Whitmore & Burslem 1998, Co-chrane et al. 1999). Understanding howthe structure and composition of tropicalrain forests is maintained in the wake ofsuch disturbances constitutes a majorscientific challenge (Sheil 1999).
Fire causes a multitude of biotic andabiotic changes in the structure and func-tioning of a tropical rain forest, and in-cludes both direct and indirect effects.The most visible effect of fire is high tree
100
mortality (Leighton & Wirawan 1986,Woods 1989). Densities of animal popula-tions change as the direct result of fireinjury, and because of changes in avail-ability of food sources and habitat suit-ability (Azuma 1988, Doi 1988, Suzuki1988, Yajima 1988, Makihara et al. 2001).Changes in population density of herbi-vores, seed dispersers and pollinatorsmay affect the growth and reproductivesuccess of plants. Changes in the densityand species composition of mycorrhizaafter fire have been scarcely studied inIndonesia. Based on studies in Australia(Bellgard et al. 1994) and South Asia(Rashid et al. 1997), mycorrhiza popula-tions may be able to recover rapidly afterfire. Fire also causes changes in soilphysical characteristics and nutrients(Holscher et al. 1997, Buschbacher et al.1988, Ketterings & Bigham 2000,Ketterings et al. 2000, Kennard & Gholz2001) and causes a temporarily increasederosion rate (Douglas 1999, Shimokawa1988). Changes in the microclimate in-clude an increase in light availability andtemperature in the understorey, and adecrease in relative humidity (Toma1999, Toma et al. 2001 a). Several ofthese phenomenae remain understudiedand not very well understood. While ac-knowledging the variety of changes andpossible interactive processes that mayoccur in all components of the ecosystem,the emphasis of this study is on succes-sional changes of plants, with a focus onpopulation demography and processes ofplant establishment and persistence.
The objectives of this thesis are to as-sess the damage caused by fire and thesubsequent recovery potential in a dip-terocarp rain forest. After a short sum-mary of the theoretical approaches tosuccession considered in this thesis and adescription of the experimental set-up, Ievaluate, respectively, the early estab-lishment of different functional groups inthe post-fire vegetation, the vegetationdynamics of functional groups, and thedevelopment of the group of shade toler-ant tree species at species-level. Thechapter continues with an analysis ofseveral theoretical issues and an analysisof consequences for forest management.
Theoretical approaches
The vegetation changes that occur af-ter fire disturbance can be described interms of succession, which I define as asequential change in species compositionthrough time following a disturbance thatopens up a relatively large space (sensuConnell & Slatyer 1977, Huston & Smith1987, Chapter 1). Traditionally, severalstages have been identified in patterns ofsuccession. The first phase of successionis characterised by abundant establish-ment of individuals in the open spacemade available by the disturbance. Afterthat follows a phase in which little openspace is left and the vegetation developsthrough a process of plant growth andthinning (Connell & Slatyer 1977).
Succession may be best understoodthrough study of the underlying processesand mechanisms (Connell & Slatyer 1977,Huston & Smith 1987, Pickett et al.1987). A list of processes that potentiallyinfluence succession has been compiled byPickett et al. (1987). The vegetationalprocesses that are the main subject of thisthesis include aboveground survival,sprouting and seed bank dynamics, whileseedling performance and post-disturbance seed rain are also considered.
Theoretical approaches to successiontaken by researchers studying fire-pronecommunities (hereafter referred to as firetheory of succession) and communitiesthat are rarely affected by fire (non-firetheory of succession) exhibit some crucialdifferences (Bond & van Wilgen 1996).Central to much of non-fire theory of suc-cession, which originates from studies onold fields after abandonment, are proc-esses of species-specific rate of colonisa-tion and competitive exclusion (Connell &Slatyer 1977, Tilman 1982, 1988, Huston& Smith 1987), even if many authors con-sider a complex set of factors to be of im-portance (Egler 1954, Connell & Slatyer1977, Pickett et al. 1987).
In the study of old growth forests,small-scale gap dynamics resulting fromtreefall form the focus of successionaldevelopment in the absence of large-scaledisturbances (Bazzaz & Picket 1980, Bro-

101
kaw 1985, Veblen 1992). An importantdifference with old-field succession andwith succession after large-scale distur-bances such as fire is, that post-disturbance colonization plays a limitedrole. Gap creation is such a low-intensitydisturbance that it causes virtually nomortality of saplings (Uhl et al. 1988 c).The relative size distribution of individu-als before the disturbance is an importantdeterminant for the competitive rankingof individuals after the disturbance (Zagt& Werger 1998).
A form of succession in the tropicswhich is more similar to the old fieldstudies from temperate areas is secon-dary forest development, which has beenstudied after fire disturbance in combina-tion with other disturbances in the Neo-tropics (Uhl et al. 1981, 1988, Uhl &Jordan 1984, Uhl 1987, Finegan 1996,Kammesheidt 1998, 1999, Steiniger 2000,Peña-Claros 2001) and the Palaeotropics(Symington 1933, Riswan & Kartawinata1988, 1989, Nykvist 1996, Toma et al.2001 b). To analyse complex processessuch as succession in these species-richtropical forests, plant species which sharelife-history characteristics have beencategorised into functional groups(Swaine & Whitmore 1988). The func-tional groups in the current study wererecognised on the basis a combination oflight requirement in the establishmentphase, growth form and longevity(Denslow 1980, Whitmore 1984, Hubbell& Foster 1986, Swaine & Whitmore1988). Our a priori categorisation in-cluded light-demanding non-woody spe-cies, light-demanding trees and shadetolerant trees.
Successional theory originating fromresearch in fire-prone systems centresaround the vital attributes approach (No-ble & Slatyer 1980), in which competitionplays a minor role (Bond & van Wilgen1996). The vital attributes approach aimsat determining the role of a plant in avegetation replacement sequence. Thepopulation dynamics of a species are pre-dicted by assessing three categories ofplant characteristics, which include es-tablishment requirements, mode of per-sistence and timing of critical life-history
attributes (Noble & Slatyer 1980, Chapter1).
In this synthesis chapter, I will re-turn to two aspects of post-fire vegetationdynamics which were introduced in chap-ter 1, and to which the two bodies of suc-cession theory attribute differentialimportance. Using the two different theo-retical approaches, I aim to answer twomain questions:
(1) Which vegetation processes de-termine the early functional group com-position of the vegetation?
(2) Which vegetation processes de-termine the population recovery and spe-cies composition of the group of shadetolerant tree species?
First, the two theories make differentpredictions about the composition of func-tional groups shortly after the distur-bance. Non-fire theory assumes that theearly vegetation composition after a se-vere disturbance depends on survival ofpropagules in the soil seed bank and onpost-disturbance colonisation by propa-gules. Notably small-seeded, well-dispersed, light-demanding tree speciespossess these characteristics (Garwood1989, Gómez-Pompa & Vázquez-Yanes1981, Metcalfe & Grubb 1995, Dalling etal. 1998), and as a result they will be thefirst to establish and dominate the site,whereas large-seeded, slow-growing spe-cies with limited seed dispersal capacitywill be absent from the early post-disturbance vegetation. In fire-theory, amore diverse array of persistence modesis explicitly considered to be of impor-tance after a severe disturbance (Noble &Slatyer 1980). Besides the propagule-based modes of persistence that are em-phasised in non-fire theory, also vegeta-tive persistence is specified in theframework of vital attributes. It includesspecies which survive unaffected as juve-niles or as mature individuals, and spe-cies which resprout from surviving tissue.Vegetative persistence limits changes inspecies composition in the wake of a dis-turbance, and in a tropical rain forestwould ensure the maintenance of popula-tions of slow-dispersing shade tolerantspecies that were present before the dis-turbance.

essecomof stheociesnisaFireaspethe minperslong
199prisplotWai116limathisloggthe werEacburnwermadpsp penturesysttopo(Ebe199
102
The second question concerns proc-s that determine the post-fire speciesposition within the functional grouphade tolerant tree species. In non-firery, composition of shade tolerant spe- is predicted to be determined by colo-tion rate and competitive vigour.-oriented theory assumes that thesects may be of importance, but thatspecies composition is also deter-
ed by a more diverse array of vitalistence attributes, growth rate andevity.
Experimental set-up
Following upon the fires of 1997 –8, we set up a post-hoc experiment com-ed of replicated permanent samples (psp) in the partly burned Sungain protection forest (1º16’ S andº54’ E) near to Balikpapan, East Ka-ntan (Chapter 1). Before the fires,
reserve was largely covered by un-ed lowland dipterocarp rain forest. Incore of the reserve, nine pairs of pspe spread over an area of circa 20 km2.h pair of psp consisted of one un-ed plot and one burned plot, which
e separated from each other by a man-e firebreak. In the areas where thewere located, the firebreak was inde-
dent of any specific topographical fea-, which minimised the risk that aematic difference would exist in thegraphy of unburned and burned plotsrhardt & Thomas 1991, Turner et al.
7). Each psp had a size of 60 x 300 m,
in which all trees >28 cm dbh were as-sessed. In a subplot of 20 x 200 m withineach psp, all trees >8 cm dbh were as-sessed. In each of six burned psp, tensubplots of 10 x 10 m were selected forthe assessment of trees <8 cm dbh andnon-woody plants. The plots were inven-toried 8 and 21 months after the droughtand fire to evaluate patterns of tree mor-tality (Chapter 2) and to study the devel-opment of the vegetation after firethrough tree survival, seedling estab-lishment and sprouting (Chapter 3).
Since 8 and 21 months after the fire,light-demanding non-woody species andlight-demanding trees were virtually ab-sent from the unburned forest, while theywere abundant in the burned forest, adetailed comparison of these functionalgroups between the two treatments wouldhave been redundant. Evaluation of thelight-demanding functional groups there-fore focussed on the burned forest,whereas the performance of shade toler-ant trees was investigated in both un-burned and burned forest.
Two additional experiments were car-ried out to elucidate the workings of par-ticular processes after disturbance.Species-specific sprouting capacity wasstudied experimentally by removing thecrown from saplings of six species ofshade tolerant trees (Chapter 4). The ef-fect of fire on the seed bank was studiedby comparing seed germination in verti-cally stratified soil samples that weretaken from unburned forest and burnedforest (Chapter 5).
Table 7.1. Main life stages of a population as proposed by Noble and Slatyer (1980).
Population life stage Description Modes of persistenceJuvenile stage Majority of the individuals are
immature.Vegetatively
Mature stage Many (or all) of the individuals are reproductively mature *.
Sexually or vegetatively
Propagule stage Only propagules remain. There no longerpersists a significant number of juvenilesor adults at the site.
Sexually
Locally extinct No juveniles, adults or propagules are available at the site.
Long-distance dispersal of propagules
* Note that for this defenition to apply to a tropical rain forest it should be interpretedliberally.

103
Successional patterns after droughtand fire
Early presence of light-demanding func-tional groups: Seed bank and propagule
dispersalA few months after the fire, we ob-
served that the early composition of thevegetation was determined by a variety ofprocesses. The plants that established inthe open spaces were categorised in fourfunctional groups. Light-demanding non-woody species, light-demanding trees andshade tolerant trees were recognised apriori. The principal mode of persistencevaried between these groups (Table 7.1).A fourth group of shade tolerant shrubswas defined a posteriori (Chapter 3). Thisgroup, notably formed by many species ofRubiaceae, exhibited a dual persistencestrategy: The very small seeds were pres-ent in high densities in the post-fire seedbank (Chapter 5), whereas establishedindividuals were observed to survive inthe shade of the unburned forest, andwere capable of sprouting from basal stemparts in the burned forest (Chapter 3).Because these species have been found torequire openings in the litter layer forsuccessful establishment while the seed-lings are shade tolerant (Metcalfe andGrubb1995, Metcalfe & Turner 1998,Metcalfe et al. 1998), this functionalgroup will be referred to as litter-gap de-manding species.
Light-demanding non-woody plantsdominated the early post-fire under-growth, due to an abundantly establish-ing fern cover, dominated by three species(Blechnum orientale L., Pteridium cauda-tum (L.) Maxon. and Microlepia speluncae(L.) Moore). Ferns established first inlocations where smouldering logs hadbeen consumed by fire. The soil in thesesites must have been sterilised by theprolonged heat produced by the fire. Fromthis it was inferred that ferns arrivedthrough post-fire dispersal of propagules.Reaching a maximum height of 1.5 to 2m, the fern cover had overgrown many ofthe seedlings and sprouts approximatelyone year after the fire. Other light-
demanding non-woody species, includingthe grass Imperata cylindrica and thevine Mikania scandens, were much lessabundant than ferns.
With a combined density of 17.6 ± 9.6seedlings (>1.30 m high) per 100 m2,light-demanding trees (Macaranga spp.,Mallotus spp., Dillenia cf. borneensis)formed a prominent element in the post-fire vegetation, notwithstanding the verylow densities of mature trees in the un-burned forest (Chapter 3). Survivingseeds in the soil seed bank formed themain source of establishment after thefire (Chapter 5). The light-demandingfunctional groups were able to establishfrom the seed bank because the mortalitycaused by the fire was only superficial(Chapter 5). Seed density was reduced inthe top 1.5 cm of the mineral soil,whereas the insulation properties of thesoil assured that at greater depths, fewseeds were killed.
Small seeds of light-demanding treespecies such as Macaranga spp. do poten-tially have large enough energy resourcesto establish from deeper in the soil,whereas very small-seeded light-demanding shrub species such as Melas-tomataceae and Ficus spp. are only capa-ble of successful establishment when theyare at the soil surface. In line with thesedifferential establishment capacities froma certain depth, seeds of the two groups ofspecies appeared to be sensitive to differ-ent sets of germination triggers (Chapter5). Our experiments showed that verysmall-seeded species required at leastsome light to trigger their germination.Macaranga may be sensitive to daily fluc-tuations in temperature, which penetrateupto a few centimeters deep into the soil.This allows Macaranga to detect gap-likeconditions in the above-ground vegetationwhile remaining in complete darkness.Etiolation of the stem allows Macarangaseedlings to successfully establish fromsuch a depth.
Due to the pre-requisite of very small-seeded species to be at the soil surface inorder to germinate, the part of the seedbank that has the potential for post-fireseedling establishment will be more seri-ously affected for these species than is the
104
case for the seed bank of Macaranga spe-cies.
Early presence of the functional group ofshade tolerant trees: Above-ground sur-
vival and sproutingShade tolerant trees persisted in the
vegetation through above-ground sur-vival, mainly of individuals >10 cm dbh(Chapter 2), as well as through re-sprouting from basal stem parts, mainlyfrom individuals <10 cm dbh (Chapter 3).
In our study on tree mortality we in-vestigated both mortality caused bydrought and mortality caused by droughtx fire (Chapter 2). Subtraction of the mor-tality rates caused by these two treat-ments provided us with an estimate ofexclusive fire mortality, which could notbe observed directly in the field. Bothdrought and drought x fire caused highlevels of mortality among stems >10 cmdbh eight months after disturbance, andhigh levels of retarded mortality wereobserved in the second year after the dis-turbance. After 21 months, drought anddrought x fire had caused 28% and 74%mortality, respectively. Exclusive firemortality accounted for roughly 2/3 of themortality in the burned psp.
The relative contribution of droughtand fire-disturbance to the total mortalitymay be event-specific, and depends on theduration of the drought and the timingand intensity of the fire. To assess theeffect of drought duration on tree mortal-ity, we analysed mortality data from sev-eral studies in perhumid tropical forest(defined as forest which, on average, didnot experience a monthly rainfall <100mm) (Chapter 2). Drought severity wasdefined as the cumulative water deficit(cwd). From this comparison we inferredthe relation between the intensity of adrought, and drought-induced levels ofmortality. Tree mortality increased onlyslowly below a cwd of 100 - 200, whereasit rapidly increased when the cwd becamelarger than 200, so that a relatively smallprolongation of a drought causes a largeincrease in mortality.
Twenty-one months after the fire, thestem density of surviving trees (>10 cm
dbh) was 128 ± 65 ha-1 (average ± sd, n=9) in the burned forest. This is approxi-mately one fifth of the total stem density(dead + living stems) of 594 ± 76 ha-1 thatwas measured in the adjacent unburnedplots. The basal area of living stems was9.9 ± 1.9 m2 ha-1 after 21 months, whichwas a decrease of 70% relative to theoriginal 33.1 ± 6.1 m2 ha-1.
After the fire, shade tolerant sproutsoriginating from small parent stems (<10cm dbh) were present in a density of 22 ±9.6 stems per 100 m2, which is 17% of thedensity of stems <10 cm dbh in the un-burned forest (Chapter 3). The high den-sity of resprouts was mainly due to thesprouting ability of the abundant smallpre-fire stems (“parent stems”). The localdensity of resprouts was related to thelocal density of parent stems. Much of thesprouting occurred from basal stem parts,below-ground or just above-ground, indi-cating that small stems retained sprout-ing capacity because the soil protectedtissue with sprouting capacity from thefire-heat.
Factors structuring functional groupsuccession after initial occupation
Following upon the first successionalphase of plant establishment in unoccu-pied spaces, the vegetation rapidly in-creased in density. After one year, theunderstorey formed a nearly closedground cover. The rate of establishmentof all functional groups diminished. Veryfew shade tolerant species fruited in thetwo years following the drought and fire.Colonisation through seed dispersal didnot occur and, contrary to the commonexpectation, seeds were not an importantsource of regeneration for shade toleranttree species.
We found no significant relation be-tween the percentage dead trees (used asa proxy for the local light availability) andseedling density. The relation betweencanopy openness or percentage dead treesand growth rate was significant for Dille-nia cf. borneensis, but not for the othertwo light-demanding tree species that weinvestigated. These observations suggestthat seed germination and seedling
105
growth of light-demanding tree specieswere rarely limited by shading from theremaining tree cover in the burned forest.
Twenty-one months after the fire, to-tal fern cover was negatively related tothe density of light-demanding tree seed-lings. This suggests a certain degree ofcompetition between the two functionalgroups. Ferns and seedlings establishedapproximately at the same time, and bothwere capable of quickly forming a locallydense carpet which cast deep shade onthe ground. Such high local densitieswere much more common for ferns thanfor light-demanding tree seedlings to oc-cur. Large local variation in the composi-tion of the vegetation may result fromsubtle differences between functionalgroups in timing of establishment and ininitial densities, which prevent the estab-lishment of other light-demanding indi-viduals.
Pteridium, one of the dominant fernspecies, is known world-wide for its abil-ity to dominate a vegetation after severedisturbance, keeping the vegetation in astage of “arrested development” (denOuden 2000). Pteridium is capable of in-hibiting tree seedling establishmentthrough the deep shade it casts on theground, by smothering plants under col-lapsing dead fronds, and through theformation of a thick litter layer whichinhibits the establishment of seedlingsfrom small seeds (Finegan 1984, Molofsky& Augspurger 1992, Tolhurst & Turvey1992, Humprey & Swaine 1997, denOuden 2000). Although ferns had beenvery abundant two and five years after aforest fire in Sabah, they had virtuallydisappeared after eight years (Nykvist1996), apparently as the result of dimin-ished light availability due to shading byemerging trees. Little is known of theautecology of the other two common fernspecies. Close to our research site, in aforest that burned 15 years ago, we didnot observe ferns although the localabundance of mature trees of Macarangagigantea and Macaranga trichocarpa in-dicated high light conditions after thefire. It is not clear whether ferns wereoutcompeted there, or they never estab-
lished after the fire occurred. Since inSungai Wain some of the seedlings andsprouts were growing above the fern layertwo years after the fire, we expect thatferns will not persist, but eventually willbe outshaded by other plants.
The density of sprouting individualswas not related to the density of light-demanding functional groups. Instead,the density of pre-fire stems with a dbh<10 cm largely explained the density ofsprouts. Sprouts generally had a lowergrowth rate than light-demanding treeseedlings and ferns, and were usuallyoutshaded by these one year after thedisturbance. Sprout survival was between83% and 94% over the census period from8 months to 21 months after the fire.
Patterns within the functional group ofshade tolerant tree species
Ultimately, forest recovery is deter-mined by the speed with which shadetolerant trees regain dominance of thevegetation, and the species composition inwhich they do so. Since vegetative plantsurvival after disturbance is substantial,persistence abilities form an importantcomponent of shade tolerant species’abilities to maintain a population. Here, Ievaluate patterns of species diversity(Chapter 3), species-specific survival(Chapter 2) and sprouting capacity(Chapter 3, 4) within the functional groupof shade tolerant trees and analyse howthese modes of persistence contribute tothe shade tolerant vegetation.
Only data on post-disturbance pat-terns of species diversity were collected.These allow assessment of the effect ofdelayed drought mortality on species di-versity, and for the comparison of droughtversus drought x fire disturbance. As aresult of the drought, the number of spe-cies (>10 cm dbh) in the unburned forestdecreased from 70.1 ± 5.3 per 0.4 ha plot(average ± sd, n= 9) in the first census to62.8 ± 7.8 in the second census. The num-ber of species in the burned forest at thesecond census was only 20.8 ± 10.6 per 0.4ha. Over a range of spatial scales from0.01 ha to 3.6 ha, the species number inthe burned forest was at least a factor of

106
two lower than in the unburned forest. Incontrast, the number of species per num-ber of stems was nearly identical betweenthe unburned forest and the burned for-est. The difference in species number perarea must therefore be caused by thedrastically reduced stem density in theburned forest.
The specific survival rate of shadetolerant trees depends on a species’ sensi-tivity to both drought and the subsequentfire. For the community as a whole,drought mortality was positively corre-lated to dbh, while the opposite was truefor fire mortality. Fire accounted for two-thirds of the overall mortality, but above70 cm dbh, mortality in the burned pspwas not significantly higher than mortal-ity in the unburned psp. To assess thespecific whole-plant persistence capacityof smaller trees, we should focus on fireresistance, whereas for larger individuals,sensitivity to drought forms the principalconstraint.
Species-specific drought mortalitycould only be assessed for trees >30 cmdbh. For these trees drought mortalitywas negatively related to specific wooddensity (Figure 2.6). Such a pattern wasexpected because wood density is linkedto wood traits that prevent xylem cavita-tion under drought stress (Hacke et al.2001). Our observation contrasts with thecommonly assumed association of highwood density in environments subject tovery little disturbance (ter Steege &Hammond 2001). We do not dispute thatvery low rates of disturbance may resultin forests with an average high wood den-sity. However, our data suggest that un-der certain conditions a regime of severedroughts might favour the dominance ofheavy wooded species. It is possible thatthe high local dominance of Eusideroxylonzwageri in Kalimantan and Sumatra(Whitten et al. 1987, MacKinnon et al.1996) is the result of such specific climaticcircumstances (Leighton & Wirawan1986), since this dominance occurs in ar-eas which suffer from occasional droughtssimilar to the drought that we investi-gated, to which Eusideroxylon appearedto be highly resistant (Figure 2.9). Thispattern calls for a cautious use of vegeta-
tion characteristics as a way to infer thedisturbance history of a site. It suggeststhat the assumption in the intermediatedisturbance theory (Connell 1979, Huston1979) and the dynamic equilibrium hy-pothesis (Huston 1994), that disturbancesfacilitate the maintenance of diversity byselecting against species with a K-strategy (sensu Pianka 1970), is not nec-essarily correct.
For the community as a whole, aver-age bark thickness per dbh class was afair predictor for fire-induced mortality.Thus, the proportional loss of individualsfrom a population by exclusive fire dis-turbance depends on the size-distributionof stems and on the species-specific pat-tern of bark increment with size (Chapter2). Several species of Dipterocarpaceaecombine a population structure charac-terised by an abundance of large indi-viduals (Table 1.3 & 1.4) with a rapidincrease in bark thickness with size (Fig-ure 2.11). This combination of character-istics may explain why the relativedominance of this family in the burnedforest is higher than in the unburned for-est (Table 3.4).
Local diversity of shade tolerant treesshortly after the fire was mainly deter-mined by sprouting of small stems: 18% ofthe pre-fire stems did so. Sprouts formedsuch an important component of the post-fire vegetation because their density (ex-cluding Fordia splendidissima, a domi-nant shade tolerant shrub) was 13 timeshigher than the density of survivingstems, and their species diversity pernumber of stems was similar to that ofpre-fire stems >10 cm dbh. Moreover,their early establishment after the firemay have given these resprouts an ad-vantage over shade tolerant seedlingsthat may establish when dispersed seedsstart to arrive, because it allows them toovergrow the potentially inhibitive fern-cover in an earlier stage of development.
Species showed different levels ofsprouting capacity, which was expressedin terms of sprouting frequency (the per-centage of individuals producing sproutsafter being damaged), and the growth andsurvival of sprouts. Species-specificsprouting frequency after fire correlated
107
well with the sprouting frequency of thosesame species in a clipping experiment inthe unburned forest (Chapter 4).
The clipping experiment provided in-sight in the question, which factors de-termine specific sprouting capacity. Onepre-requisite for the maintenance ofsprouting ability is the availability of suf-ficient energy reserves (Chapin et al.1990, Pate et al. 1990, Bell et al. 1996).The six species in the clipping experimentproved to contain such reserves in theform of high concentrations of stored totalnon-structural carbohydrates (tnc) in thestem and root, forming 15-23% of the to-tal dry weight. The species in our studyappear to make large investments to se-cure their persistence. Carbohydrate re-serves were high even when individualswere growing under a low light intensity.On theoretical grounds, such a persis-tence-oriented strategy is to be expectedwhen individuals have to survive for longperiods in an environment where re-sources are limited, while the risk ofdamage is high (Iwasa & Kubo 1997,Iwasa 2000). The ability of seedlings andsaplings to resprout after a singular oc-currence of fire probably is a side effect ofthe adaptive capability of juveniles tosprout after stem breakage. However, itappears that sprouting after fire is im-peded by other factors than tnc availabil-ity as well, since the sprouting frequencyafter fire was approximately five timeslower than the sprouting frequency afterclipping.
After establishment in the burnedforest, sprouts grew fast in the first 21months after the fire. The average sproutlength eight months after the fire was25.1 ± 19.2 cm (3.1 ± 2.4 cm month-1).Sprouts grew another 80.3 ± 71.3 cm (6.2± 5.5 cm month-1) in the 13 months thatfollowed. Length growth of sprouts wasnegatively related to specific wood density(Figure 3.9). The same pattern was ob-served in the clipping experiment whenwood density was related to lengthgrowth of the tallest sprout in the fifthand sixth month after clipping, whengrowth had stabilised and depended onphotosynthesis of the newly formed leaves(Figure 4.6).
Sprout survival was fairly high be-tween the censuses 8 and 21 months afterthe fire: 83% of the sprouts survived,whereas the fate of another 11% re-mained unclear. Sprout survival in theclipping experiment appeared to be influ-enced by water constraints in two species.Macaranga lowii (a shade tolerant spe-cies) had a higher mortality on ridgesthan on slopes and in valleys, and Shorealaevis had the highest mortality underhigh light conditions. It is remarkablethat the two species with the highestwood density would show the highestdrought-related mortality, since wooddensity is related to the ability of a tree towithstand water stress (Chapter 2, Hackeet al. 2001). Water transport resistancehas been found to be highest in the jointsof branches (Bazzaz 1996), in the joints ofsprouts (Klugmann & Roloff 1999), and inthin distal branches in general (Yang &Tyree 1993). I believe that such locallyhigh resistance was the culprit for theobserved mortality in these two specieswhich formed very thin sprout axes(Chapter 4). In the burned forest, sproutsurvival was not significantly correlatedto wood density. Sample sizes may havebeen too low to detect such patterns, orpossibly the individuals that sufferedfrom the constraint of high water resis-tance in sprout joints had died before thefirst inventory.
Competitive interactions betweenshade tolerant individuals will probablynot occur until they have reached a heightof several meters. The density of shadetolerant tree sprouts in the burned forestis less than one fifth of the pre-fire den-sity of stems <10 cm dbh. At a small scale(i.e. 0.1 – 10 m) sprouts were evenly dis-tributed (MvN pers. obs.). We infer thatlocal shade tolerant species compositionwill be mainly determined by initialfloristics (Egler 1954), i.e. the communitycomposition of the surviving sprouts, andvery little by competitive interactions.Heavy-wooded species will probably beunderrepresented in the post-fire re-sprouting community, due to the species-specific differences in initial persistenceability through sprouting and subsequentsprout survival and growth rate.
The predictive power of non-fireand fire-based theoretical
approaches
The research in Sungai Wain showsthat a variety of persistence modes con-tribute to the population build-up of spe-cies after fire disturbance. Several ofthese modes of persistence have beenlargely ignored in non-fire successionaltheory after severe disturbance, whichhas a traditional focus on long-distanceseed dispersal and survival of propagulesin the soil. This focus on propagule-basedprocesses is adequate when the distur-bance regime is severe enough to killmost of the later-successional individualson the site. Therefore, the traditional the-ory provides a good description of old fieldsuccession in the temperate regions fromwhich the theory originates (Clements1916, Glenn-Lewin & van der Maarel1992). Disturbance treatments in tropicalforest succession experiments have oftenbeen small in scale and of severe intensityto an extent which would not occur in theabsence of human interference (e.g. Uhlet al. 1982, 1988, Uhl 1987, Uhl & Jordan1984, Riswan & Kartawinata 1989,Kammesheidt 1998, 1999, Peña-Claros2001). This bias unintentionally promotedthe relative importance of propagule dis-persal and propagule survival in the seedbank above vegetative modes of persis-tence, causing a reasonable fit of the datato traditional succession theory.
Both non-fire ecologists and fireecologists recognise a great diversity ofsuccessional patterns and processes(Connell & Slatyer 1977, Pickett et al1987, Bond & van Wilgen 1996). How-ever, the idea of a predictable sequence ofplant species replacement, the relay flo-ristic model of succession, is still centralto much of traditional ecological thinking(Bond & van Wilgen 1996). Connell andSlatyer made an attempt to distinguishthe different mechanistic processes driv-ing succession, proposing that successionoccurred along one of three alternativepathways, which were named the facilita-
tion model, the tolerance model and theinhibition model. It has been argued thatthese alternative models are not mutuallyexclusive and cannot be discriminatedfrom one another by experiments (Pickettet al. 1987). Nevertheless the frameworkremains an important reference point forsuccessional studies.
The tolerance model, in which “themodifications wrought on the environ-ment by the earlier colonists neither in-crease nor reduce the rates of recruitmentand growth to maturity of later colonists”(Connell & Slatyer 1977, p. 1122), mightappear to fit the characteristics of theearly post-fire vegetation patterns in ourstudy. However, the emphasis is funda-mentally different between the tolerancemodel and the processes that appear todetermine the functional group composi-tion after fire. The discriminating empha-sises of the models of Connell and Slatyeris on interactions between individuals,and aims at assessing whether estab-lishment of later arriving species is eitherenhanced, reduced or unaffected by ear-lier established species. In contrast, ourresults show that, in order to understandearly vegetation composition, it is not theinteractions between species that are ofcentral importance, but the abilities ofspecies to persist in the seed bank, to re-generate vegetatively from surviving tis-sue or even to avoid any significant loss ofbiomass. This perspective asks for theexplicit incorporation of species’ sensitiv-ity to the disturbance treatment.
In traditional succession theory, theinfluence of the “initial floristics” on suc-cession (Egler 1954) has been acknowl-edged for a long time. In tropical gap-dynamical studies, the importance of thepre-gap composition of the vegetation hasbeen identified as a determinant of gap-phase succession (for example Zagt &Werger 1996, Wright 2002). Althoughdifferent terminology is used, the essenceof these studies is similar to the “initialfloristics” approach of Egler. Neverthe-less, species persistence capabilities (per-sistence here referring to the ability of apopulation to survive a particular distur-bance) remain essentially unspecified intheoretical non-fire succession models
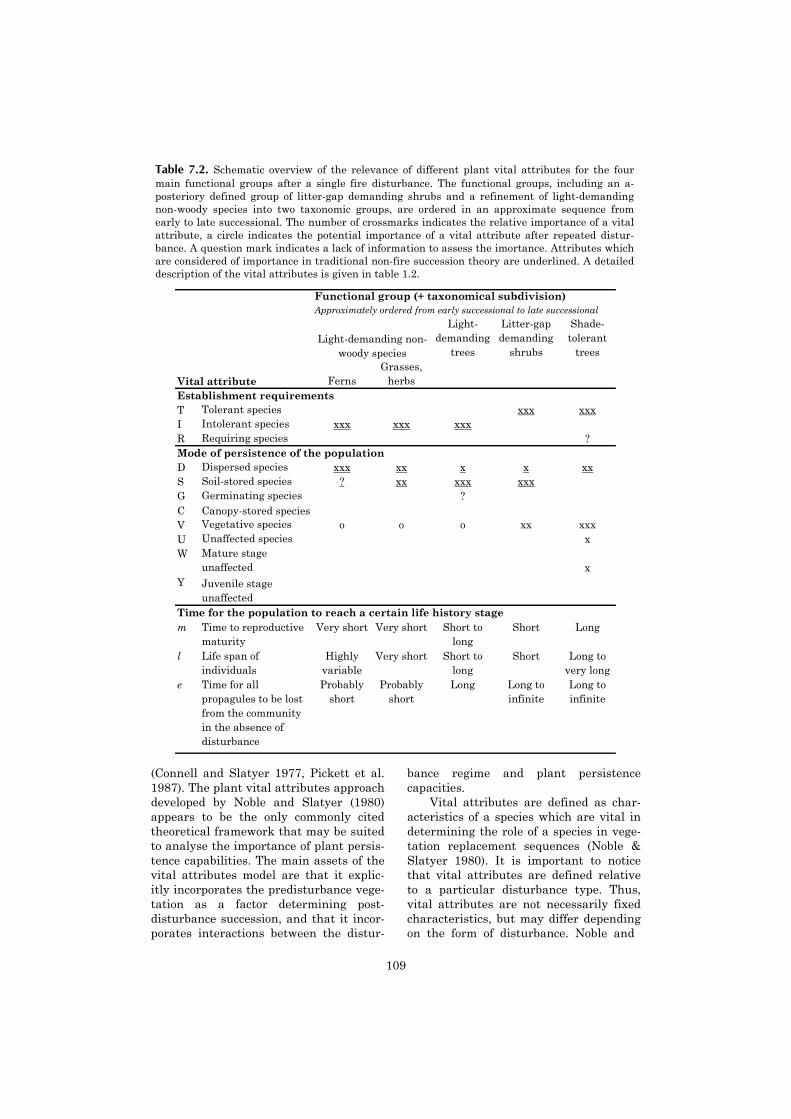
109
(Connell and Slatyer 1977, Pickett et al.1987). The plant vital attributes approachdeveloped by Noble and Slatyer (1980)appears to be the only commonly citedtheoretical framework that may be suitedto analyse the importance of plant persis-tence capabilities. The main assets of thevital attributes model are that it explic-itly incorporates the predisturbance vege-tation as a factor determining post-disturbance succession, and that it incor-porates interactions between the distur-
bance regime and plant persistencecapacities.
Vital attributes are defined as char-acteristics of a species which are vital indetermining the role of a species in vege-tation replacement sequences (Noble &Slatyer 1980). It is important to noticethat vital attributes are defined relativeto a particular disturbance type. Thus,vital attributes are not necessarily fixedcharacteristics, but may differ dependingon the form of disturbance. Noble and
Table 7.2. Schematic overview of the relevance of different plant vital attributes for the fourmain functional groups after a single fire disturbance. The functional groups, including an a-posteriory defined group of litter-gap demanding shrubs and a refinement of light-demandingnon-woody species into two taxonomic groups, are ordered in an approximate sequence fromearly to late successional. The number of crossmarks indicates the relative importance of a vitalattribute, a circle indicates the potential importance of a vital attribute after repeated distur-bance. A question mark indicates a lack of information to assess the imortance. Attributes whichare considered of importance in traditional non-fire succession theory are underlined. A detaileddescription of the vital attributes is given in table 1.2.
Functional group (+ taxonomical subdivision)Approximately ordered from early successional to late successional
Light-demanding
trees
Litter-gap demanding
shrubs
Shade-tolerant
trees
Vital attribute FernsGrasses,
herbsEstablishment requirementsT Tolerant species xxx xxxI Intolerant species xxx xxx xxxR Requiring species ?Mode of persistence of the populationD Dispersed species xxx xx x x xxS Soil-stored species ? xx xxx xxxG Germinating species ?C Canopy-stored speciesV Vegetative species o o o xx xxxU Unaffected species xW Mature stage
unaffected xY Juvenile stage
unaffectedTime for the population to reach a certain life history stagem Time to reproductive
maturityVery short Very short Short to
longShort Long
l Life span of individuals
Highly variable
Very short Short to long
Short Long to very long
e Time for all propagules to be lost from the community in the absence of disturbance
Probably short
Probably short
Long Long to infinite
Long to infinite
Light-demanding non-woody species

Figure 7.1 a.
Surface fire
- High stem density- Log decrease in stem density with dbh- High spp diversity
- Low stem density- Persistant in seed bank
- Aver. stem density- Persistant in seed bank
- Absent in vegetation- Persistant in seed bank
ST trees LD trees
LGD shrubs Non-woody spp.
Mature self-replacing forest
ST trees LD trees
LGD shrubs Non-woody spp.
Young matrix forest
- Low stem density- Low spp-area diversity- Small stems resprout
- High stem density in understorey- Reduced seed bank
- High stem density in understorey- Reduced seed bank
- High density in understorey- Seed bank quickly restored
ST trees LD trees
LGD shrubs Non-woody spp.
Mature matrix forest
- Sprouts account for increasing stem density and spp diversity - Influx from seed rain
- Stem density high but decreasing- Seed bank restored when trees mature
- Stem density high - High seed bank density
- Low stem density in dark understorey- High seed bank density
Surface or crown fire
Surface fire
Crown fire
ST trees LD trees
LGD shrubs Non-woody spp.
Non-forest vegetation
- Absent - Absent
- Dominant in the vegetation and in the seed bank
- Unknown, probably rare
ST trees LD trees
LGD shrubs Non-woody spp.
Mature secondary forest
- Slowly increasing in understorey
- High stem density forming closed canopy- Low establishment in shade
- Low density or absent in dark understorey
- Slowly increasing in understorey
ST trees LD trees
LGD shrubs Non-woody spp.
Young secondary forest
- Nearly absent as adults and resprouts
- Very high stem density in understorey (if sufficient t ime for recovery seed bank)
- Very high stem density in understorey- Seed bank quickly restored
- Low stem density in understorey- Seed bank depleted?
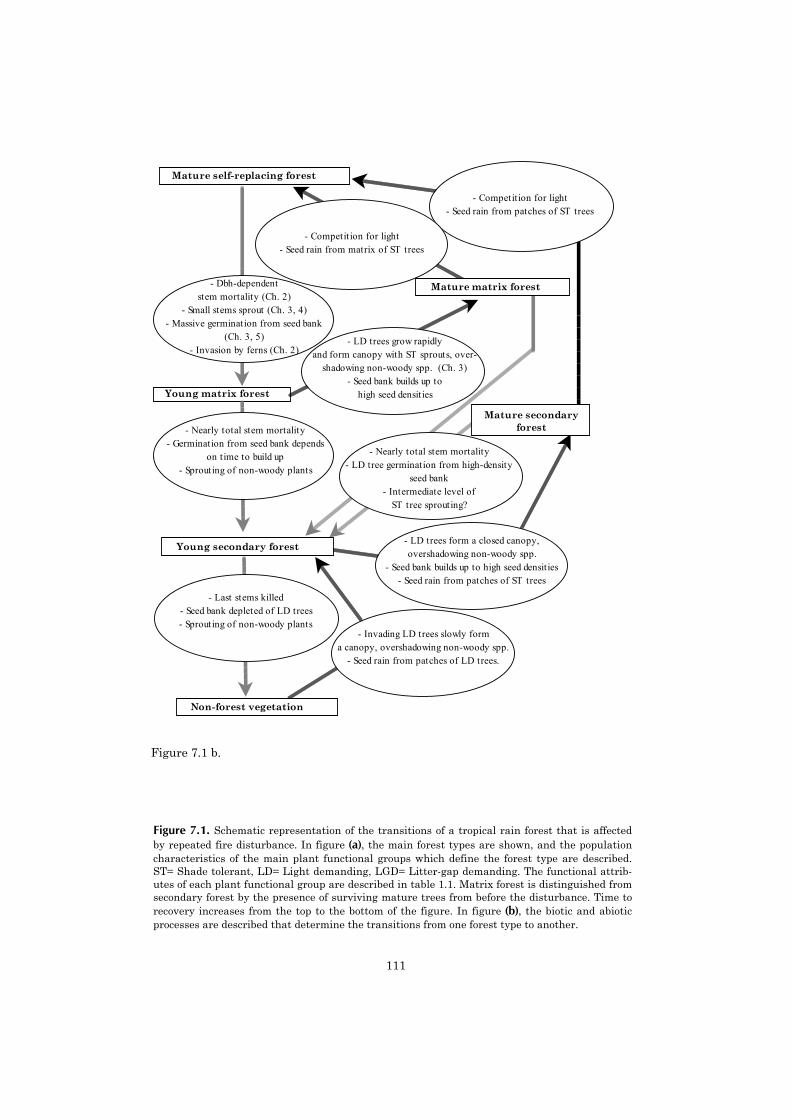
111
Figure 7.1 b.
Figure 7.1. Schematic representation of the transitions of a tropical rain forest that is affectedby repeated fire disturbance. In figure (a), the main forest types are shown, and the populationcharacteristics of the main plant functional groups which define the forest type are described.ST= Shade tolerant, LD= Light demanding, LGD= Litter-gap demanding. The functional attrib-utes of each plant functional group are described in table 1.1. Matrix forest is distinguished fromsecondary forest by the presence of surviving mature trees from before the disturbance. Time torecovery increases from the top to the bottom of the figure. In figure (b), the biotic and abioticprocesses are described that determine the transitions from one forest type to another.
Young matrix forest
Mature self-replacing forest
Non-forest vegetation
- Dbh-dependent stem mortality (Ch. 2)
- Small stems sprout (Ch. 3, 4)- Massive germination from seed bank
(Ch. 3, 5) - Invasion by ferns (Ch. 2)
- Competit ion for light- Seed rain from patches of ST trees
- Competit ion for light- Seed rain from matrix of ST trees
- LD trees grow rapidlyand form canopy with ST sprouts, over-
shadowing non-woody spp. (Ch. 3)- Seed bank builds up to
high seed densities
- Nearly total stem mortality- Germination from seed bank depends
on time to build up- Sprouting of non-woody plants
- Last stems killed - Seed bank depleted of LD trees - Sprouting of non-woody plants
- LD trees form a closed canopy, overshadowing non-woody spp.
- Seed bank builds up to high seed densities - Seed rain from patches of ST trees
- Invading LD trees slowly form a canopy, overshadowing non-woody spp.
- Seed rain from patches of LD trees.
Mature secondary forest
Young secondary forest
Mature matrix forest
- Nearly total stem mortality- LD tree germination from high-density
seed bank - Intermediate level of
ST tree sprouting?
Slatyer consider three groups of vital at-tributes (Table 7.1). Here, I focus mainlyon the group of persistence attributes, forwhich the approach provides a compre-hensive framework.
Persistence modes are based on eitherpropagule-based mechanisms (where apropagule is defined as “a structure pro-duced by an organism, either sexually orasexually, which becomes detached fromthe parent and gives rise to another indi-vidual (Noble & Slatyer 1980, p. 21)), orvegetative mechanisms, which are asex-ual. Vital persistence attributes are cate-gorised according to their occurrence infour major life stages (Table 7.1). Theselife stages apply to the state of a popula-tion at a certain moment in time and notto particular individuals. The resultingframework renders 20 theoretical modesof persistence, eight of which are likely tooccur in nature, according to Noble andSlatyer (Table 7.2).
Table 7.2 shows, which persistencemodes and other vital attributes play arole in the population dynamics of thedifferent functional groups that we stud-ied. Using vital attributes, one can sum-marise the vegetation development as theresult of population dynamics driven bydifferent mechanisms of persistence, es-tablishment and life stage characteristics.The successional pathway that occursafter fire in the dipterocarp rain forest ofEast Kalimantan is visualised in figure7.1 a. Also indicated in the same figureare pathways as they may be expectedafter repeated fire disturbance. Figure 7.1b shows the various mechanisms thatappear to structure the dynamics of thefour main functional groups studied inthis thesis. Given a lack of information onmany aspects of the performance of thefunctional groups, it is not yet possible toprovide the full detail that is given by thevegetation replacement models in thetradition of Noble and Slatyers’ paper.
Figure 7.1 emphasises the importanceof tree survival and sprouting of smallstems as a factor contributing to the re-covery of shade tolerant trees in the vege-tation. The figure also indicates how,following repeated disturbances, recoveryof shade tolerant tree populations will
depend ever more on long-distance seeddispersal. Infrequent seed production(Janzen 1974, Curran & Leighton 2000,Wich & van Schaik 2000) and often shortdispersal distances (Hubbell 1979, 1980,Howe & Smallwood 1982, Dalling et al.1998) make that the recovery process ofshade tolerant populations will be muchlonger when they depend on seed disper-sal.
Egler (1954) presented the concept ofinitial floristics in old field succession.White (1979) observed that “much of thepersistent controversy surrounding suc-cession stems from the very differentstarting points or pioneer states followingvaried kinds and degrees of disturbance,from which the seral sequence begins”.Many papers subsequently published onthe subject of succession make referenceto these authors (e.g. Connell & Slatyer1977, West et al. 1981, Huston & Smith1987, Pickett et al. 1987, Glenn-Lewin etal. 1992). Given this long-time recognitionof initial floristics as a factor determiningsuccessional development, it is remark-able that the persistence characteristicsdefined in the vital attributes approachwere never firmly integrated into generalsuccession theory. It appears that succes-sion theory would gain in compre-hensiveness from an integration of thestrong aspects of non-fire and fire ap-proaches.
Possibly, the impediment to integra-tion lies in the fact that most vital attrib-utes in the vital attributes classificationare determined only qualitatively. Nobleand Slatyer did so deliberately in order tokeep the approach simple. Thus, the maininnovating aspects of the vital attributesapproach, i.e. the explicit inclusion andmodes of persistence and their interactionwith the type of disturbance both remainunquantified in the theory. In non-firetheory it is common practice to definemany plant characteristics quantitatively.This difference may be the reason thatthe vital attributes approach is cited inmost papers on succession theory, but itsideas are never truly integrated in theconceptual framework.
The disadvantage of a quantitativeapproach is that the model system be

113
comes increasingly complex. Only com-puter supported simulation models maybe able to handle such complexity. Recentsuccession simulation models alreadyincluded a greater variety of life-historytraits to explain vegetation dynamics andspecies diversity (Pacala et al. 1996,Clark 1996, Loehle 2000). As Pacala et al.(1996) showed, it is possible with thesemodels to disentangle the effect of differ-ent life-history traits on the dynamics ofpopulations. Individual-based successionmodels may allow the testing of howimaginary species would perform if theydiffered only in persistence characteris-tics.
Drought and fire persistence aslife-history traits
Life history and physiological traitsdetermine the performance of individuals,and structure the dynamics of a popula-tion. Plant traits occur in a limited num-ber of combinations, as the result ofcharacter convergence (Cody 1973). Theimplication of this limited variation isthat successional patterns are con-strained to a restricted number of pat-terns (Grime 1979, Huston & Smith1987). Insight in how plant traits corre-late and which trade-offs determine theoccurring combinations of traits helps tounderstand patterns of succession and isa subject which returns in many theoreti-cal approaches (Grime 1979, Noble &Slatyer 1980, Tilman 1982, 1988, Huston& Smith 1987, Swaine & Whitmore 1988,Hubbell 1998). Understanding the corre-lations and trade-offs between persistencetraits and other life-history characteris-tics is needed to assesss the dynamics ofpopulations in the successional develop-ment of a vegetation.
Correlative patterns between themechanisms of persistence of shade toler-ant trees and other traits have beenscarcely studied. The research in SungaiWain indicates that several such correla-tions exist, e.g. we found correlations be-tween drought survival and wood density,fire survival and bark thickness, concen-tration of total non-structural carbohy-drate reserves (tnc) and sprouting
frequency, wood density and sprout sur-vival, and wood density and sproutgrowth.
Wood density is a variable which re-turns in several of these correlative rela-tions. Even though wood density may be aderived characteristic in these analyses,lacking a simple mechanistic relationshipwith the other plant traits in the correla-tion, it provides a suitable way of charac-terising tree types because it correlateswith a multitude of plant traits. Theseinclude growth characteristics (structuralinvestments per unit volume, watertransport capacity, xylem cavitation re-sistance, photosynthetic assimilationrate, growth rate, shade-tolerance, as-ymptotic height (Borchert 1994, Thomas1996, Lucas et al. 1997, Hubbell 1998,Tyree et al. 1998, Suzuki 1999, Hacke etal. 2001)), and reproductive characteris-tics (seed size, seed dispersal mode (terSteege & Hammond 2001)).
Inclusion of persistence abilities willincrease the complexity of succession the-ory. However, the observed correlationsbetween persistence abilities and otherplant traits suggest that the number ofpossible life-history combinations is lim-ited. Thus, the number of successionalpatterns (sensu Huston & Smith 1987)will not increase proportionally.
Nature conservation, forestmanagement and the threat of
repeated disturbances
Analysis of the successional pathwaysof dipterocarp rain forest after fire mayhelp to determine the potential capabilityof the forest to recover, to assess its sensi-tivity to additional disturbances and toasses the need for specific managementmeasures. As was observed in severalother studies (Stocker 1981, Kammes-heidt 1998, 1999), tropical rain forestsposses a higher level of resilience to firedisturbance than was forseen. Sincemany shade tolerant tree species are ableto persist through whole-plant survival orresprouting from basal stem parts,recolonisation from unburned forest areasis not always required.
114
Notwithstanding the moderately op-timistic results that come out of thisstudy, persistence of the forest cover ishighly threatened. It should be noted thatthis study was done in an old growth for-est, whereas a large part of the fires in1997-1998 occurred in selectively loggedforest, which both had a higher risk ofburning and probably experienced ahigher fire intensity. Depending on log-ging intensity and the period of recoverybetween logging and burning, loggingfollowed by fire probably results in agreater reduction in tree density, lowerdensities of resprouting stems, and agreater reduction of the soil seed bank.
Following a first disturbance such asselective logging or fire, the synergy be-tween increased flammability of the forestand continuing threats posed by humanactivities is likely to result in a sequenceof fire disturbances (Cochrane & Schulze1999, Cochrane et al. 1999, Cochrane2001). Following a first fire, the vegeta-tion will remain much more flammableover a period of several decades. The can-opy is opened, allowing for the rapid dry-ing-up of fuel (Uhl et al. 1988,Holdsworth and Uhl 1997). Trees whichwere killed by the first fire provide amplecoarse woody fuel (debris), while invadingferns and Imperata cylindrica form ahighly flammable understorey.
The persistence mechanisms of shadetolerant trees and light-demanding trees
are not sufficient to ensure that forestcover is maintained in the wake of re-peated fires. Following recurrent distur-bances the vegetation rapidly deterio-rates, and the pathway to recoverychanges fundamentally (Figure 7.1). In-stead of recovering locally throughsprouting, shade tolerant tree populationswill depend on the slow process of long-distance seed dispersal for their recovery.This takes a much longer time, and thespecies composition will be much moreseverely altered than in a resproutingforest. In chapter 6 we warned for asimilar scenario if burned forests are fur-ther disturbed by logging (vanNieuwstadt et al. 2001).
Even though from a conservationists’point of view the burned forests of EastKalimantan form a poor substitute forunburned forest, their sustained diver-sity, surviving populations of timber spe-cies and evident recovery potential makethem worth maintaining. An active pro-tection program which minimises anysubsequent disturbances is necessary totake advantage of their potential for re-covery.
Acknowledgements
I am grateful to M.J.A. Werger, J.A.Sayer and D. Sheil for their comments onan earlier version of the manuscript.
Nederlandse samenvatting
Achtergrond
Tropische bosbranden als nieuwfenomeen
Wereldwijd worden tropische bossenin hoog tempo door de mens vernietigd.Tot voor kort vormden houtkap en ont-ginning voor landbouw de voornaamsteredenen voor ontbossing. Gedurende deafgelopen decennia is daar een nieuwebedreiging bijgekomen in de vorm vanongecontroleerde branden. In tegenstel-ling tot wat men lange tijd veronder-stelde, blijken tropische regenwoudenbrandbaar te zijn gedurende ongewoonlange droog-tes, die ontstaan in zogehetenel Niño jaren. Met name selectief gekaptebossen zijn voor brand vatbaar, maar ookongeschonde bossen blijken vlam te kun-nen vatten. De ecologische en economi-sche schade hiervan is grootschalig: Al-leen al in de Indonesische provincie Oost-Kalimantan verbrandde zo’n 2.6 miljoehectare bos gedurende een aanhoudendedroogte in 1997-1998.
Ondanks de enorme schaal waaroptropische bosbranden plaatsvinden, is erweinig onderzoek verricht naar de conse-quenties voor de ontwikkeling van hetbos. Verbrande gebieden kunnen nogsteeds een potentiële waarde voor hout-produktie en natuurbescherming hebben.Deze waarde hangt af van de mo-gelijkheid van een verbrand bos om zichte herstellen, en de snelheid waarmee ditgebeurt. Evenmin zijn er pogingen onder-nomen om de vegetatieontwikkeling nabrand in een breder theoretisch kader teplaatsen. Men heeft lange tijd aange-nomen dat de hoge soortendiversiteit inhet tropisch regenwoud in stand blijft alsgevolg van een langdurig stabiele om-geving, waar slechts locale verstoringenin voorkomen. Uit palynologisch onder-
zoek is gebleken dat veel tropische bossenook in het verleden sporadisch brandden.Het is een wetenschappelijke uitdagingom het voorkomen van grootschalige ver-storingen, zoals bosbranden, te integrerenin het theoretisch raamwerk dat de so-ortensamenstelling en de hoge soortendi-versiteit in de tropen verklaart. Eencomplicerende factor hierbij is het feit datook de ongewone droogte zelf, dienoodzakelijkerwijs aan een brand vooraf-gaat, effect op de vegetatie heeft.
Verschillende benaderingen insuccessietheorie
Successietheorie vormt het weten-schappelijk raamwerk waarbinnen deontwikkeling van een vegetatie na ver-storing wordt beschreven. Successie kanmen definiëren als een voorspelbareopeenvolging van vegetatietypes die zichna een verstoring ontwikkelen. Succes-sietheorie is inmiddels zo’n 100 jaar ouden was aanvankelijk gericht op hetbeschrijven van vegetatieontwikkeling opverlaten landbouwgronden. In die situatiespelen verschillen tussen soorten in kolo-nisatiesnelheid, concurrentiekracht enlevensduur een belangrijke rol in hetverklaren en voorspellen van de opeen-volging van vegetatietypes. Omdat hetbeginstadium van de successiereeks uiteen nagenoeg complete afwezigheid vanvegetatie bestaat, spelen de overlevings-kansen van planten gedurende de ver-storing (het in cultuur brengen van degrond) nauwelijks een rol.
In de loop van de tijd werd vanuit hettheoretisch raamwerk van successie deontwikkeling van vegetaties in steedsmeer verschillende situaties geanaly-seerd. In bossen wordt successie be-studeerd na kleinschalige verstoringen in

118
het kronendak, meestal als gevolg vaneen omvallende boom. Een dergelijke ver-storing veroorzaakt in het algemeenweinig schade aan de vegetatie en wordtmeestal gekwantificeerd in termen van detoegenomen beschikbaarheid van bronnendie limiterend zijn voor de groei (metname licht). Successionele veranderingenworden voorspeld aan de hand van deconcurrentie-rangorde tussen individuenin de opening in de vegetatie.
In het onderzoek dat zich richt opsuccessie na brand in brandgevoeligevegetaties heeft zich een andere theore-tische benadering ontwikkeld. Deze be-nadering ontstond toen men zichrealiseerde dat in mediterrane struik-vegetaties alle soorten, die gedurendeverschillende stadia van de suc-cessiereeks domineren, al direct na eenbrand aanwezig zijn door middel van lo-kaal aanwezige zaden of door het uitlopenvan overlevende wortels. Successie is hierniet het gevolg van verschillen in koloni-satiesnelheid of concurrentie, maar sim-pelweg het gevolg van verschillen inlevensduur.
In een poging om de dynamiek vansoorten in een brandbare vegetatie inte-graal te beschrijven werd het raamwerkvan “vitale plant attributen” (VPA)ontwikkeld. In deze aanpak wordt nietalleen de “regeneratie-niche” van soortengedefiniëerd (de omstandigheden waar-onder een soort zich succesvol kan vesti-gen), maar ook de “persistentie-niche” (deomstandigheden waaronder een gevestigdindividu kan overleven) en de tijd die eensoort nodig heeft om een aantal karak-teristieke fasen te doorlopen (o.a. de tijdom volwassen te worden en de maximaleoverlevingsduur van gevestigde indi-viduen). In tegenstelling tot de tradi-tionele successietheorie, spelen ver-schillen in concurrentiekracht tussensoorten in VPA theorie nauwelijks eenrol.
Successie in de tropenEen grote verscheidenheid aan plan-
tensoorten in een vegetatie bemoeilijkthet vinden van algemene patronen. Omanalyse en interpretatie van processenzoals successie in een tropisch regenwoud
te vergemakkelijken heeft men het begripfunctionele plantengroepen geïntro-duceerd. Een functionele groep is eengroep van soorten die een aantal karak-teristieke kenmerken delen. In mijn on-derzoek heb ik vantevoren drie func-tionele groepen onderscheiden, zijndelichtbehoevende niet-houtige soorten,lichtbehoevende boomsoorten, enschaduwtolerante boomsoorten, terwijl aposteriori een vierde groep werd gede-finiëerd, zijnde soorten, die zich alleenkunnen vestigen op plekken waar eenopening ontstaat in de strooisellaag.
In de bestaande theorie wordt de suc-cessiereeks in een tropisch bos na eenzware verstoring tot een opeenvolging vande eerste drie functionele groepen geab-straheerd. Aanvankelijk bestaat de vege-tatie uit lichtbehoevende soorten, die zichna een verstoring snel kunnen vestigenomdat ze een goede zaadverspreidinghebben en als zaad in de bodem over-leven. De niet-houtige soorten dominerengedurende een korte beginperiode, waar-na lichtbehoevende bomen boven hen uit-groeien. Geleidelijk aan wordt de vegeta-tie steeds meer door schaduwtolerantesoorten gedomineerd, die later arriverenomdat ze een minder efficiënte zaadver-spreiding hebben, maar die in de schaduwvan een gevestigde vegetatie kunnenoverleven.
Diverse onderzoeken in Borneo en inandere delen van de tropen beschrijven deeffecten van brand op de ontwikkelingvan de vegetatie. Deze onderzoeken gevenechter geen goed totaalbeeld van de suc-cessionele ontwikkeling van een bos nabrand, omdat de verstoringsregimes ergvarieerden en deze vaak complex en in-tens waren (bv. kleinschalige kaalslaggevolgd door brand en landbouwgebruik).Mogelijkerwijs is het bestaande inzicht invegetatieontwikkeling na brand gekleurddoor deze nadruk op intensieve en klein-schalige verstoringen, die nooit zoudenoptreden in de afwezigheid van mensen.Door dergelijke verstoringen is de kans oplokale overleving van planten namelijkklein, terwijl het gewoonlijk nabijgelegenonverstoorde bos een bron van zadenvormt. De lokale overleving van plantenkan een veel belangrijkere rol spelen

119
wanneer de vegetatie door een enkele,grootschalige brand wordt verstoord.
Onderzoeksopzet
Het onderzoek werd in het bos SungaiWain uitgevoerd, een beschermd water-wingebied van zo’n 100 km2 aan de oost-kust van Oost-Kalimantan ten noordenvan de stad Balikpapan. Dit gebied isgrotendeels begroeid met laagland dip-terocarp bos, een term die verwijst naarde meest kenmerkende familie van boom-soorten. Het gebied heeft een tropisch natklimaat met een gemiddelde jaarlijkseregenval van 2790 mm en een gemiddeldemaandelijkse regenval die gedurende hethele jaar boven de 100 mm ligt. Dezekarakterisering is echter enigszins mis-leidend, omdat met een zekere regelmaatextreme droogtes van een of enkelemaanden voorkomen, die ten dele samen-hangen met het el Niño fenomeen.
De droogte die voorafging aan debranden die het onderwerp van dezestudie zijn, bestond uit twee extreemdroge episodes van ieder 12-14 weken, inde tweede helft van 1997 en de eerstehelft van 1998. De 14 weken tussen dezetwee droge episodes waren natter, hoeweler nog altijd minder neerslag viel dangemiddeld. De meeste bosbranden vondengedurende de tweede droge episodeplaats. De branden in het bos waren vaneen lage intensiteit, met vlammen vanzo’n 0.5 meter hoog die zich als een langlint over de bosbodem verplaatsten meteen snelheid van 10-15 meter per uur.Hoewel de sterfte van bomen hoog was,zorgde de lage vuurintensiteit ervoor datzelfs de dunste stammetjes ook na debrand nog overeind stonden.
Het onderzoek richtte zich op eenvergelijking van het centrale, onver-brande bos met het daaromheen gelegeneenmaal verbrande bos. Deze waren vanelkaar gescheiden door een smalle brand-gang die tijdens de branden werd aange-legd. De onderzoeksopzet bestond uit 18permanente proefvlakken van ieder 60 x300 m (1.8 ha), die over een gebied vanzo’n 20 km2 waren verspreid. De proef-vlakken werden paarsgewijs uitgezet, hetene proefvlak in onverbrand en het an-
dere in verbrand bos. In totaal omvattende inventarisaties in deze proefvlakkenruwweg 3000 bomen van meer dan 28 cmdbh, 5000 bomen tussen 8 en 28 cm dbh,en 5000 individuen van minder dan 8 cmdbh.
Resultaten en discussie
Sterfte van bomen na droogte en brandZowel droogte als brand bleken een
hoge sterfte van bomen tot gevolg te heb-ben (Hoofdstuk 2). De sterfte namgedurende het tweede jaar na verstoringsubstantiëel toe. De waargenomen sterfteonder bomen (> 10 cm dbh) van 29%, 21maanden na de droogte, is de hoogste dieooit in de wetenschappelijke literatuurover de tropen werd geregistreerd. Dik-kere bomen hadden een grotere kans omals gevolg van de droogte te sterven.Soortspecifieke sterfte na droogte vanbomen boven 30 cm dbh werd door ver-schillen in houtdichtheid verklaard. Zoalsuit morfologisch onderzoek werd voor-speld, waren soorten met zwaar hout hetminst gevoelig voor de droogte. Dit is op-merkelijk, omdat het voorkomen vanzwaarhoutige soorten met hun langzamegroei vaak met de langdurige afwezigheidvan grote verstoringen geassociëerdwordt.
Eenentwintig maanden na de brandwas de sterfte 74%. Door sterfte uit-sluitend als gevolg van droogte af te trek-ken van sterfte na droogte en brand, werdgeschat dat in het verbrande bos 2/3 vande sterfte door brand werd veroorzaakt.Bovengrondse sterfte van bomen nadroogte en brand was bijna 100% voorindividuen dunner dan 10 cm dbh. Mettoenemende dikte hadden bomen eensteeds kleinere kans om als gevolg van debrand te sterven. Boven de 70 cm dbhwerd er geen significante toename in ster-fte als gevolg van de brand waargenomen.De correlatie tussen boomgrootte en ster-ftekans wordt veroorzaakt door een be-tere isolatie van het levende weefselnaarmate bomen dikker zijn, als gevolgvan een toenemende bastdikte. Bastdikteverklaart echter niet de soortspecifieke
120
verschillen in sterfte van bomen boven de30 cm dbh als gevolg van de brand.
De combinatie van droogte en brandveroorzaakten vooral zo’n grote sterfte,omdat de twee verstoringen deels aan-grijpen op verschillende grootteklassen.Het hoge niveau van “vertraagde” sterftena zowel droogte als na droogte plusbrand laat zien dat langlopende observa-ties noodzakelijk zijn om de consequentiesvan deze verstoringen voor de vegetatie tekunnen meten.
Vegetatiedynamiek van functioneleplantengroepen na brand
In hoofdstuk 3 werden patronen vanfunctionele plantengroepen in de vegeta-tie onderzocht. Tevens werd ruimtelijkevariatie in het brandregime gemeten,alswel het effect van de brand op de licht-beschikbaarheid en het verband tussen delokale sterfte van bomen en de licht-beschikbaarheid.
Onverbrande stukjes bos vormdenslechts 4 tot 7% van het niet door debrandgang beschermde bos en waren on-gelijkmatig verdeeld over de proefvlak-ken. Met name valeitjes hadden eenlagere kans om te verbranden. De open-heid van het kronendak in het verbrandebos was gemiddeld 24%, vele malen meerdan de 5% in het onverbrande bos. Deopenheid van het kronendak was aan hetlokale percentage dode bomen gerela-teerd. Ondanks de flinke variatie in licht-beschikbaarheid in het verbrande bos,was de vegetatie die zich na de brandontwikkelde hiermee nauwelijks gerela-teerd, wellicht omdat kort na de brand delichtbeschikbaarheid vrijwel nergens inhet verbrande bos limiterend was.
De dichtheid aan varens was gemid-deld 61% in het verbrande bos. Op veelplekken vormden varens een aaneen-gesloten vegetatie van 1 tot 2 meter hoog.Lichtbehoevende jonge boompjes (> 1.30m hoog) hadden een aanzienlijke dicht-heid, variërend van 0.6 tot 6.7 stammenper 100 m2, ondanks het feit dat volwas-sen individuen vóór de brand schaarswaren. De dichtheid aan varens wasnegatief gecorreleerd met dichtheid aanlichtbehoevende jonge boompjes en was
niet gecorreleerd met de dichtheid aanuitlopende schaduwtolerante stammetjes.
De soortendiversiteit van boven-gronds overlevende bomen (> 10 cm dbh,op een oppervlak van 0.4 ha) in het ver-brande bos was slechts 30% van de on-verbrande vegetatie. De soortendiversiteitper aantal stammen in onverbrand enverbrand bos was echter nagenoeg gelijk.De dichtheid aan schaduwtolerantesoorten (in alle grote klasses) werd vooraldoor een hoge dichtheid aan her-spruitende stammetjes dunner dan 10 cmdbh bepaald. Deze bleken een belangrijkefactor in het herstel van het bos te vor-men, en een relatief snel herstel van depopulaties van schaduwtolerante soortenmogelijk te maken. De soortendiversiteitper aantal herspruitende stammen wasvergelijkbaar met de soortendiversiteitper aantal stammen (> 10 cm dbh) in hetonverbrande bos. Van een beperkt aantalschaduwtolerante soorten werd het ver-band tussen soortspecifieke hout-dichtheid, spruitfrequentie, groeisnelheiden overleving in het tweede jaar na debrand onderzocht. Dergelijke verbandenkunnen helpen om veranderingen in desoortensamenstelling van de functionelegroep van schaduwtolerante soorten tevoorspellen.
Uitlopen van jonge boompjes na hetafknippen van de stam: een experiment
In hoofdstuk 4 beschrijf ik een ex-periment, waarin de capaciteit van jongeboompjes om uit te lopen (“spruiten”) nazware beschadiging bepaald wordt. Omzware beschadiging te simuleren werdenjonge boompjes (1.5-2.5 cm dbh) van zesschaduwtolerante soorten op 1.30 meterhoogte afgeknipt, zodat er geen groenebladeren achterbleven. Gedurende zesmaanden werd maandelijks het aantalspruiten en de lengte van iedere spruitgemeten. Doel van het onderzoek was omte onderzoeken hoe groot soortspecifiekeverschillen in de capaciteit om te spruitenzijn, en hoe deze verschillen samenhan-gen met energiereserves (“totale niet-structurele carbohydraten”, tnc) die door

121
deze soorten in de stam en de wortel wor-den opgeslagen.
De concentratie aan tnc varieerde van15 tot 25% van het drooggewicht en ver-schilde significant tussen de zes soorten.De twee soorten met de laagste tnc con-centratie in de wortel hadden een lagerpercentage spruitende stammen en eenhoger percentage stammen waarvan allespruiten stierven, dan de soorten methogere tnc concentraties. Ook was er eentendens zichtbaar dat soorten met lageretnc concentraties na zes maanden eenlager drooggewicht aan spruiten haddengevormd. De hoeveelheid energiereservesblijken dus een belangrijke factor te zijndie de capaciteit van soorten om nabeschadiging opnieuw uit te lopenbepaalt.
Zodra spruiten fotosynthetiserendebladeren hadden gevormd, nam hungroeisnelheid af. In deze fase vertoondende spruiten van zwaarhoutige soorten eentendens om langzamer te groeien. Ditpatroon komt overeen met de verwachtin-gen voor het verband tussen hout-dichtheid en groeisnelheid van onbe-schadigde jonge boompjes. Dergelijke pa-tronen helpen te voorspellen hoe ver-schillende populaties zich na zwareverstoring zullen ontwikkelen.
Effecten van brand op de zaadvoorraadin de bodem
Door een vergelijking te maken tus-sen bodemmonsters uit zowel het onver-brande als het verbrande bos, onderzochtik in hoofdstuk 5 de effecten van brand opde zaadvoorraad in de bosbodem. Om tekunnen analyseren tot welke diepte debrand effect heeft op de overleving vanzaden werden bodemmonsters in vier la-gen gestoken. Het bovenste monsterbestond uit de strooisellaag, en de overigedrie monsters uit laagjes minerale bodemvan 0-1.5 cm, 1.5-3.0 cm en 3.0-4.5 cmdiep. De zaaddichtheid in deze monsterswerd bepaald door in een kwekerijgedurende 13 weken de kiemplantjes dieopkwamen in de dun uitgespreiddebodemmonsters te tellen en te identifi-ceren.
De zaaddichtheid in het onverbrandebos nam snel met de diepte af. De schadeaan de zaadvoorraad als gevolg van debrand beperkte zich tot de strooisellaagen de bovenste 1.5 cm van de bodem.
In een tweede experiment onderzochtik, door welke factoren zaden in de bodemtot kiemen worden aangezet. Dit experi-ment toonde aan dat licht een voorwaardevoor de kieming van heel erg kleinzadigesoorten (<5 mm doorsnede) was, terwijlde kleinzadige Macaranga (>5 mmdoorsnede) ook in de duisternis kiemde,mits de dagelijkse temperatuur fluc-tueerde. In de duisternis strekten Maca-ranga zaailingen zich tot een lengte vanzo’n 8 cm, terwijl de kiembladen zichgesloten hielden. Heel kleinzadige soortenvertoonden dit gedrag niet. De combinatievan kieming in het donker en het strek-ken van de zaailing suggereert dat Maca-ranga zich met succes vanaf een groterediepte in de bodem kan vestigen. Alsgevolg hiervan is de zaadvoorraad alsgeheel minder gevoelig voor brandschade.
Schade veroorzaakt door het kappen vandode bomen in een verbrand bosNa de branden van 1997-1998 werd
door de Indonesische overheid een richt-lijn uitgevaardigd, waarin stond datkapmaatschappijen prioriteit moestengeven aan het kappen van dode bomenmet economische waarde in verbrand bos,boven de gewone kapactiviteiten in on-verbrand bos. Kennelijk werd veronder-steld dat het kappen van dode bomengeen negatieve invloed had op de rege-neratie van de verbrande bossen, die im-mers toch al zwaar beschadigd waren.Ons onderzoek in Sungai Wain suggereertechter, dat het kappen van deze bomeneen groot risico voor het herstel van hetbos met zich meebrengt.
Een enkele brand veroorzaakt niethet volledig verdwijnen van de oor-spronkelijke vegetatie. Lichtbehoevendeboomsoorten komen kort na de brand opuit de zaadbank, die hierdoor tijdelijk indichtheid vermindert. Schaduwtoleranteboomsoorten, die karakteristiek zijn vooreen onverstoord bos, behouden een rede
122
lijke dichtheid omdat ze voor hun rege-neratie met name afhankelijk zijn van hetopnieuw uitlopen van stammen die bo-vengronds door de brand zijn gedood.
Na deze eerste verstoring is de vege-tatie kwetsbaar voor verdere verstoring-en: Herspruitende planten hebben eenlagere spruitkans wanneer ze een tweedekeer worden beschadigd, de dichtheid vanzaden in de zaadbank is als gevolg van demassale kieming kort na de brand sterkafgenomen, en de dichtheid aan bomendie als zaadbron dienst kunnen doen islaag. Wanneer in een dergelijke situatiede zich herstellende vegetatie wordtbeschadigd door de zware machines diebij de kap gebruikt worden, ontwikkeltzich gemakkelijk een niet-bos vegetatieen wordt het potentiëel tot herstel vanhet bos sterk verminderd. Onze resul-taten wijzen erop dat kapactiviteiten inverbrand bos moeten worden vermedenwanneer men op de lange termijn hetbehoud van een bosvegetatie of de hout-produktie van een concessie veilig wilstellen.
Conclusie
Uiteindelijk wordt het herstel van hetbos bepaald door de snelheid waarmeeschaduwtolerante soorten hun dominantepositie in de vegetatie heroveren, en desoortensamenstelling waarin zij dit doen.De overleving van schaduwtolerante indi-viduen, hetzij in ongeschonden toestanddanwel door uitlopers na bovengrondsesterfte, is aanzienlijk. Daarom spelendeze “persistentie-processen” een belang-rijke rol in de populatiedynamiek vanschaduwtolerante soorten. Dergelijke per-sistentie-processen zijn in belangrijkemate veronachtzaamd in de traditioneleniet-vuur gerelateerde successietheorie,waarin de nadruk op zaadverspreiding enoverleving van zaden in de zaadbank ligt.Een dergelijke nadruk is voldoende wan-neer het verstoringsregime dermate in-tens is, dat de meeste laat-successioneleindividuen op de site worden gedood. Omdie reden vormt de traditionele theorieeen goede basis voor de beschrijving vansuccessie op verlaten landbouwgronden.In de tropen zijn veel successie-
experimenten gebaseerd op intensieve enkleinschalige verstoringen, die alleenkunnen ontstaan als gevolg van menselijkingrijpen. Onbedoeld begunstigde dezeaanpak het relatief belang van kolonisatiedoor zaad verspreiding en overleving vanzaden in de bodem boven vegetatieve wij-zen van persistentie.
Zowel niet-vuur ecologen als vuurecologen onderkennen het bestaan vaneen grote diversiteit aan patronen enprocessen in de successionele ontwik-keling van een vegetatie. Desalnietteminvervult het idee dat soorten elkaar in devegetatie in een voorspelbare sequentievan soorten opvolgen, gedreven door ver-schillen in kolonisatie snelheid en concur-rentie, nog altijd een centrale rol in deniet-vuur gerelateerde theorie. Deze na-druk is fundamenteel verschillend van deaanpak die door vuurecologen wordtgevolgd, waarin een successiereeks wordtbeschreven aan de hand van een aantalgecorreleerde plantkarakteristieken diein een VPA raamwerk worden onderge-bracht. In deze aanpak speelt de wijzevan persistentie gedurende een verstoringeen belangrijke rol.
Gezien de belangrijke rol die in onsonderzoek door verschillende persistentie-processen wordt gespeeld, ligt het voor dehand om de principes van zowel de tradi-tionele niet-vuur theorie als de VPA be-nadering op de vegetatie-ontwikkeling nabrand toe te passen. Een dergelijke inte-gratie van deze twee benaderingswijzenheeft tot dusver niet plaatsgevonden. Hetobstakel om beide theoriën te integrerenzit hem wellicht in het feit dat de VPA-theorie in grote mate kwalitatief is, omdeze aanpak eenvoudig te houden. In deniet-vuur gerelateerde theorie is hetdaarentegen gebruikelijk om diverseplantkarakteristieken te kwantificeren.Het nadeel van een kwantitatieve aanpakvan de VPA-theorie is dat het model bi-jzonder complex kan worden. Een der-gelijke complexiteit kan enkel met behulpvan computersimulaties worden bestu-deerd.
Door diverse fysiologische en morfolo-gische limiteringen komen planteigen-schappen in een beperkt aantalcombinaties voor. Dit principe speelt een
123
belangrijke rol in diverse theoretischebenaderingen van ecologische problemen.Voor een integratie van de beide be-naderingswijzen van successie zal hetnodig zijn om de verbanden tussen persi-stentie en andere karakteristieken vansoorten te begrijpen. Uit dit proefschriftkomen verschillende verbanden naarvoren, waarbij de houtdichtheid vansoorten een nuttig soortenkenmerk blijktte zijn om dergelijke verbanden te onder-zoeken.
De integratie van persistentiekarak-teristieken zal de complexiteit van suc-cessietheorie verhogen, maar de geobser-veerde verbanden tussen persistentie enandere plantkarakteristieken suggererendat het aantal mogelijke combinatiesbeperkt is. Daarom zal het aantal succes-sionele patronen niet proportioneel incomplexiteit toenemen.
Natuurbescherming, bosbeheer en hetrisico van herhaalde verstoringenAnalyse van de successionele ontwik-
kelingspatronen van een dipterocarp bosna brand helpen om de potentie van hetbos om te herstellen te bepalen, de gevoe-ligheid voor bijkomende verstoringen teanalyseren, en de noodzaak voor speci-fieke beheersmaatregelen vast te stellen.
Omdat schaduwtolerante soorten naeen enkele brand een redelijke mate vanlokale persistentie hebben, hoeft een ver-brand bos niet opnieuw door deze soortente worden gekoloniseerd. Hierdoor is eenrelatief snel herstel van het bos mogelijk.
Ondanks deze gematigd positieve conclu-sie, blijft het voortbestaan van een ver-brand bos uitermate onzeker. Dit komtomdat een verbrand bos snel verder zaldegenereren wanneer een bijkomendeverstoring optreedt. Daar komt bij dat debrandbaarheid van een eenmalig ver-brand bos gedurende enkele decenniasterk verhoogd is. Dit komt omdat ermeer brandstof in de vorm van dode bio-massa aanwezig is en omdat het bossneller uitdroogt als gevolg van de openstruktuur van het kronendak. Bovendienzorgen landbouwactiviteiten voor een fre-quente bron van nieuwe brandhaarden.Studies in Latijns-Amerika hebben latenzien dat een veel voorkomend vervolg opeen eerste brand is, dat er een reeks vanbranden optreedt. De persistentiemecha-nismes van schaduwtolerante soorten zijnniet voldoende om in een dergelijke situ-atie hun lokale overleving te bewerkstel-ligen. Dat heeft een snelle degradatie vande vegetatie tot gevolg.
Vanuit een natuurbeschermingsoog-punt vormen de verbrande bossen vanOost-Kalimantan een magere vervangingvan onverbrand bos. Desalnietteminmaken hun soortendiversiteit, over-levende populaties van commerciëleboomsoorten en onmiskenbare herstelpo-tentiëel het waard om ze te behouden.Een actief beleid dat erop gericht is omherhaalde verstoringen te voorkomen, isnodig om dit herstelpotentiëel maximaalte benutten.

Percobaan oleh KebakaranPembangunan paska-kebakaran hutan dipterocarp tropis
Ringkasan
Selama dekade terakhir, kebakaranhutan yang tidak terkendali meningkat-kan ancaman terhadap hutan tropis,seringkali menyebabkan kerusakanekologi dan ekonomi dalam skala besar.Hutan-hutan yang terbakar kemungki-nan masih memiliki nilai potensial untukproduksi kayu dan konservasi alam, ter-gantung dari kemampuan hutan-hutantersebut untuk pulih. Mengintegrasikanterjadinya gangguan-gangguan skalabesar seperti kebakaran ke dalam ke-rangka-kerja teoritis merupakan tantang-an ilmiah yang menjelaskan keragamanspesies dan komposisi spesies di hutanpenghujan tropis.
Teori-teori suksesi membentuk ke-rangka-kerja yang menjelaskan perkem-bangan vegetasi setelah gangguan. Kon-sep sentral dalam teori teori yangberkaitan dengan non-kebakaran (non-fire theories) adalah bahwa spesies salingmenggantikan dalam urutan yang dapatdiduga, terdorong oleh perbedaan lajukolonisasi, persaingan dan umur panjang.Penekanan ini secara mendasar berbedadari pendekatan suksesi pada vegetasimudah terbakar, dimana suksesi dijelas-kan berdasarkan karakteristik tum-buhan, yang terbungkus dalam atributvital tumbuhan. Dalam pendekatan ini,persistensi semasa gangguan memainkanperan penting, seperti juga waktu peris-tiwa sejarah kehidupan tumbuhan ter-tentu.
Dalam penelitian yang ada mengenaisuksesi di hutan-hutan tropis, kompleksi-tas dan intensitas rejim gangguan padaumumnya tinggi. Kemungkinan ini mem-pengaruhi persepsi yang ada mengenaiperkembangan vegetasi setelah keba-karan, karena setelah gangguan skalakecil yang parah, daya tahan hidup lokaltumbuhan menjadi rendah, sementarabiasanya hutan yang tak terganggu didekat hutan terbakar tersebut menyedia-kan sumber benih yang berlimpah. Per-
sistensi lokal tumbuhan dapat me-mainkan peran yang lebih penting saatvegetasi terganggu oleh kebakaran tung-gal skala besar.
Penelitian ini dilaksanakan di SungaiWain, yang berupa hutan dipterocarpdaerah rendah, juga merupakan daerahsuaka tangkapan air seluas 100 km2
dekat pantai Kalimantan Timur. Wilayahini beriklim tropis lembab, kekeringanekstrim berbasis supra-annual, yangsampai derajat tertentu terkait denganfenomena El Niño. Mengikuti kebakaran-kebakaran sebelumnya yang merupakansubyek thesis ini, wilayah tersebut men-galami dua kali kekeringan ekstrimmasing-masing selama 12 sampai 14minggu antara tahun 1997-1998. Riset iniberfokus pada perbandingan bagian sen-tral hutan Sungai Wain yang kering na-mun tidak terkakar, dengan hutansekelilingnya yang satu kali mengalamikebakaran dengan intensitas rendah.Rancangan percobaan posteriori terdiridari 9 permanen plot yang tidak terbakardan 9 yang terbakar, masing-masingberukuran 60 x 300 m, membentang ber-pasangan di areal seluas 20 km2. Plot-plotpada tiap pasangan terpisah satu samalain oleh penghambat kebakaran buatanyang kecil.
Kekeringan dan kebakaran menye-babkan 29% dan 74% mortalitas pohonsecara berurutan. Dalam hutan yang ter-bakar, 2/3 dari mortalitas disebabkanoleh kebakaran. Sebagian besar dari mor-talitas yang tercatat terjadi di tahunkedua setelah gangguan. Setelah keke-ringan, mortalitas pohon spesies-spesifikberukuran > 30 dbh berkorelasi negatifdengan kepadatan pepohonan kayu. Halini luar biasa, karena terjadinya spesiespepohonan berkayu-berat biasanya ber-kaitan dengan tidak adanya gangguanyang parah. Dengan dbh yang meningkat,pohon memiliki peluang yang lebih ren-dah dari kematian karena kebakaran,

125
karena kulit kayu yang lebih kerasmenyediakan insulasi yang lebih baik.
Pada hutan yang tidak dilindungipenghambat kebakaran, hanya 4 sampai7% yang selamat dari kebakaran. Terbu-kanya kanopi pada hutan terbakar rata-rata 24%, sementara pada hutan tak ter-bakar 5%. Kepadatan tumbuhan pakis dihutan yang terbakar tinggi, dan secaranegatif berkorelasi dengan kepadatanpohon muda atau anak pohon yang me-merlukan sinar matahari, tetapi tidakdengan kepadatan batang-batang yangbertunas kembali dari spesies yang toler-an terhadap keteduhan (toleran-teduh).Keragaman spesies pohon per wilayahyang bertahan dari kebakaran di atastanah hanya 30% dari keragaman padahutan tidak terbakar. Namun demikian,keragaman spesies per jumlah batangsecara praktis sama pada hutan tidakterbakar dan hutan terbakar. Persistensilokal dari spesies toleran-teduh terutamaditentukan oleh tingginya kepadatanbatang yang bertunas kembali berukuran<10 cm dbh. Keragaman spesies perjumlah batang yang bertunas kembali dihutan yang terbakar serupa dengan ke-ragaman per jumlah batang (>10 cm dbh)di hutan yang tidak terbakar.
Kapasitas tumbuh-tinggi dari pepo-honan muda spesies-spesifik setelahgangguan parah diketahui dari percobaandengan kliping individu pada ketinggian1,30 m. Konsentrasi karbohidrat non-struktural total (tnc) berbeda secaranyata antara spesies, dan merupakanfaktor penting dalam penentuan kapasi-tas tumbuh-tinggi. Pada tahap keduadari perkembangan tumbuh tinggi, saatdedaunan pelaku fotosintesis sudah ter-bentuk, laju tumbuh-tinggi pepohonanmuda dari spesies-spesies kayu-beratcenderung lebih rendah. Pola ini mem-bantu memperkirakan pertumbuhanpopulasi spesies setelah gangguan.
Untuk menilai dampak kebakaranterhadap ketersediaan benih, kami mem-bandingkan hutan yang terbakar dantidak terbakar dengan mengumpulkansampel tanah yang secara vertikal di-stratifikasi dalam empat lapisan tanahmineral masing-masing setebal 1,5 cm.Sinar matahari tampaknya merupakan
prasyarat untuk berkecambah bagi spe-sies-spesies berbiji sangat kecil (diameter<5 mm). Sebaliknya, Macaranga berbijikecil (diameter >5 mm) berkecambahdalam kegelapan, dengan suhu harianyang berfluktuasi. Kemampuan berke-cambah sebagai respon terhadap fluk-tuasi suhu, serta kemampuan etiolasisetelah berkecambah, menunjukkan bah-wa biji Macaranga menunjukkan ke-mampuan untuk berhasil tumbuh darikedalaman tanah yang lebih dalam.Dengan demikian, cadangan biji Maca-ranga di dalam tanah kurang peka ter-hadap kerusakan akibat kebakarandaripada spesies-spesies berbiji sangatkecil.
Baik ahli ekologi non-kebakaranmaupun ahli ekologi kebakaran megenalisejumlah besar keragaman pola dan pro-ses yang berperan selama suksesi. Na-mun demikian, persistensi selamagangguan hanya memperoleh perhatianyang sedikit sekali dalam teori non-kebakaran sebagai faktor yang menentu-kan komposisi vegetasi paska-gangguan;padahal berperan penting dalam studi-studi suksesi setelah kebakaran. Asimi-lasi dari karakteristik persistensi ke da-lam pendekatan tradisional akan mening-katkan aplikabilitas umum teori suksesi.Integrasi seperti ini akan menghasilkanpendekatan yang lebih kompleks, yangkemungkinan hanya dapat dianalisis olehmodel-model simulasi komputer. Akantetapi, korelasi yang diamati antara per-sistensi dan karakteristik tumbuhan lainmenyatakan bahwa kompleksitas dalampola suksesi tidak akan meningkat secaraproporsional.
Persistensi lokal yang diamati darispesies toleran-teduh setelah kebakarantunggal memiliki implikasi penting untukmanajemen hutan-hutan yang terbakar.Sebagai hasil dari persistensi lokal, re-kolonisasi spesies toleran-teduh tidakdiperlukan, sehingga memungkinkan pe-mulihan hutan yang cepat. Tidak sepertikesimpulan yang cukup positif ini, pe-meliharaan tutupan hutan dalam jangkapanjang sangat tidak pasti setelah keba-karan terjadi. Mekanisme persistensitidak cukup untuk memastikan daya ta-han hidup lokal spesies toleran-teduh
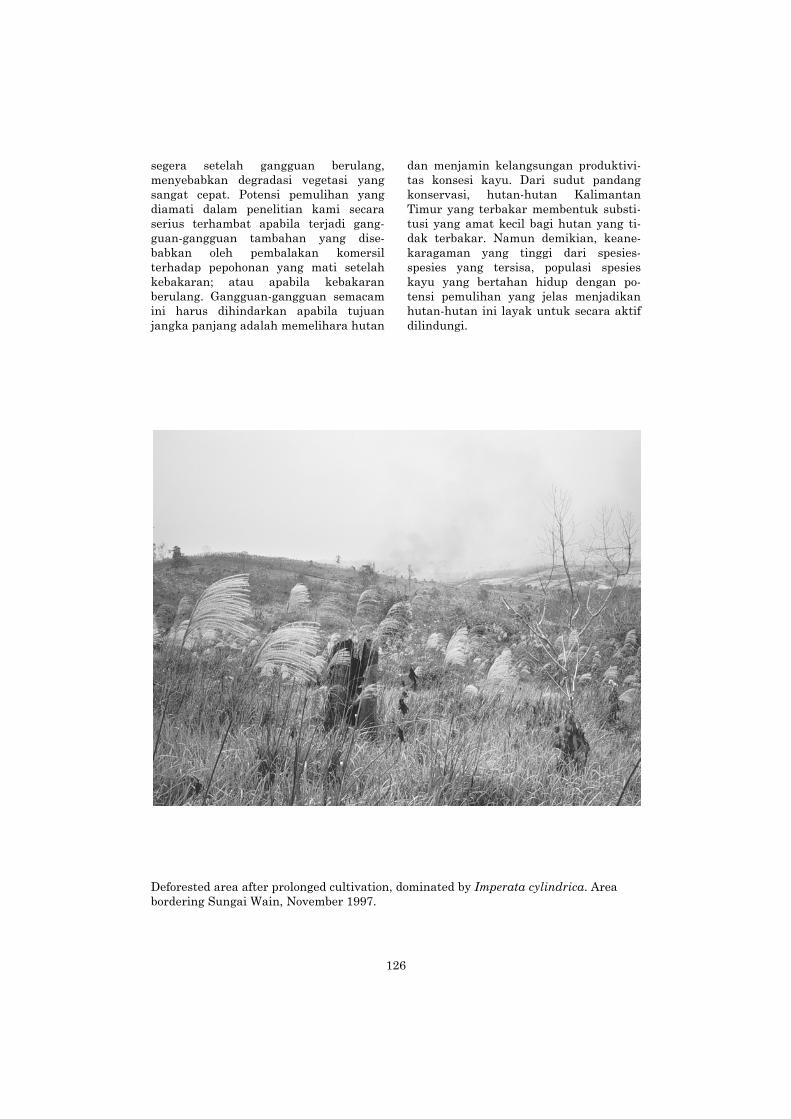
126
segera setelah gangguan berulang,menyebabkan degradasi vegetasi yangsangat cepat. Potensi pemulihan yangdiamati dalam penelitian kami secaraserius terhambat apabila terjadi gang-guan-gangguan tambahan yang dise-babkan oleh pembalakan komersilterhadap pepohonan yang mati setelahkebakaran; atau apabila kebakaranberulang. Gangguan-gangguan semacamini harus dihindarkan apabila tujuanjangka panjang adalah memelihara hutan
dan menjamin kelangsungan produktivi-tas konsesi kayu. Dari sudut pandangkonservasi, hutan-hutan KalimantanTimur yang terbakar membentuk substi-tusi yang amat kecil bagi hutan yang ti-dak terbakar. Namun demikian, keane-karagaman yang tinggi dari spesies-spesies yang tersisa, populasi spesieskayu yang bertahan hidup dengan po-tensi pemulihan yang jelas menjadikanhutan-hutan ini layak untuk secara aktifdilindungi.
Deforested area after prolonged cultivation, dominated by Imperata cylindrica. Areabordering Sungai Wain, November 1997.
References
Ackerly, D.D. and M.J. Donoghue (1998) Leaf size, sapling allometry, and Corner’s rules: Phylog-eny and correlated evolution in Maples (Acer). Am. Nat. 152(6): 767-791.
Adam, P. (1992) Australian rainforests. Oxford biogeography series no. 6. Pp. 308. Oxford Univer-sity Press, New Yrok, USA.
Alder, D. and T.J. Synnott (1992) Permanent sample plot techniques for mixed tropical forest.Tropical forestry paper 25. Oxford Forestry Institute, University of Oxford, UK.
Alexander, M.E. (1982) Calculating and interpreting forest fire intensities. Can. J. Bot. 60: 349-357.
Alvarez-Buylla, E.R. and M. Martinez-Ramos (1990) Seed bank versus seed rain in the regenera-tion of a tropical pioneer tree. Oecologia 84: 314-325.
Anshari, G., A.P. Kershaw and S. van der Kaars (2001) A Late Pleistocene and Holocene pollen andcharcoal record from peat swamp forest, Lake Sentarum Wildlife Reserve, West Kalimantan, In-donesia. Palaeo 171(3-4): 213-228.
Azuma, S. (1988) Distribution and abundance of primates after the forest fire in the lowland forestof East Kalimantan 1983-1986. Pp. 94-116. In: Tagawa, H. and N. Wirawan (eds.) A research onthe process of earlier recovery of tropical rain forest after a large scale fire in Kalimantan Timur,Indonesia, Occasional paper no. 14, Research Center for the South Pacific, Japan.
Bazzaz, F.A. (1996) Plants in changing environments. Linking physiological, population and com-munity ecology. Pp. 320. Cambridge University Press, Cambridge, UK.
Bazzaz, F.A. and S.T.A. Pickett (1980) Physiological ecology of tropical succession: A comparativereview. Ann. Rev. Ecol. Syst. 11: 287-310.
Bekker, R.M. et al. (1998) Seed size, shape and vertical distribution in the soil: indicators of lon-gevity. Funct. Ecol. 12: 834-842.
Bell, T.L. and F. Ojeda (1999) Underground starch storage in Erica species of the Cape floristicregion – differences between seeders and resprouters. New Phytol. 144: 143-152.
Bell, T.L., J.S. Pate and K.W. Dixon (1996) Relationships between fire response, morphology, rootanatomy and starch distribution in South-west Australian Epacridaceae. Ann. Bot. 77: 357-364.
Bellgard, S.E., R.J. Whelan and R.M. Muston (1994) The impact of wildfire on vesicular-arbuscularmycorrhizal fungi and their potential to influence the reestablishment of postfire plant-communities. Mycorrhiza 4(4): 139-146.
Bellingham, P.J., E.J.V. Tanner and J.R. Healy (1994) Sprouting of trees in Jamaican montaneforests, after a hurricane. J. Ecol. 82: 747-758.
Berlage, H.P. (1949) Regenval in Indonesie. Koninklijk Magnetisch en Meteorologisch Observato-rium te Batavia. Verhandelingen no. 37.
Bodegom, S., P.B. Pelser and P.J.A. Keler (1999) Seedlings of secondary forest tree species of EastKalimantan, Indonesia. Tropenbos-Kalimantan series 1. Tropenbos Foundation, Wageningen, TheNetherlands.
Bond, W.J. and J.J. Midgley (2001) Ecology of sprouting in woody plants: the persistence niche.TREE 16(1): 45-51.
Bond, W.J. and B.W. van Wilgen (1996) Fire and plants. Pp. 263. Chapman and Hall, London, UK.
Borchert, R. (1994) Soil and stem water storage determine phenology and distribution of tropicaldry forest trees. Ecology 75(5): 1437-1449.
Bossuyt, B., M. Heyn and M. Hermy (2000) Concentrating samples estimates a larger seed bankdensity of a forest soil. Funct. Ecol. 14(6): 766.
Bremen, H. van, M. Iriansyah and W. Andriesse (1990) Detailed soil survey and physical landevaluation in a tropical rain forest, Indonesia. Pp.188. Tropenbos technical series 6. Stichting Tro-penbos, Wageningen, The Netherlands.
128
Brokaw, N.V.L. (1985) Treefalls, regrowth, and community structure in tropical forests. Pp. 53-69.In: Pickett, S.T.A. and P.S. White (eds.) The ecology of natural disturbance and patch dynamics.Academic Press, Orlando, US.
Burgess, P.F. (1966) Timber trees of Sabah. Sabah forest record no. 6. Forest department, Sabah,Malaysia.
Burslem, D.F.R.P, T.C. Whitmore and G.C. Brown (2000) Short-term effects of cyclone impact andlong-term recovery of tropical rain forest on Kolombangara, Solomon Islands. J. Ecol. 88: 1063-1078.
Buschbacher, R., C. Uhl and E.A.S. Serrao (1988) Abandoned pastures in Eastern Amazonia. II.Nutrient stocks in the soil and vegetation. J. Ecol. 76: 682-699.
Campbell, G.S., J.D. Jungbauer, K.L. Bristow and R.D. Hungerford (1995) Soil temperature andwater content beneath a surface fire. Soil Science 159(6): 363-374.
Canham, C.D., R.K. Kobe, E.F. Latty, and R.L. Chazdon (1999) Interspecific and intraspecificvariation in tree seedling survival: effects of allocation to roots vs. carbohydrate reserves. Oecolo-gia 121: 1-11.
Cavender-Bares, J. and F.A. Bazzaz (2000) Changes in drought response stragegies with ontogenyin Quercus rubra: Implications for scaling from seedlings to mature trees. Oecologia 124(1): 8-18.
Chapin III, F.S., E.D. Schulze and H.A. Mooney (1990) The ecology and economics of storage inplants. Annu. Rev. Ecol. Syst. 21: 423-447.
Cheke, A.S., W. Nanakorn and C. Yankoses (1979) Dormancy and dispersal of seeds of secondaryforest species under the canopy of a primary tropical rain forest in Northern Thailand. Biotropica11(2): 88-95.
Chin, L.T. (1973) Occurrence of seeds in virgin forest topsoil with particular reference to secondaryspecies in Sabah. Malay. For. 36(3).
Christensen, N.L. (1985) Shrubland fire regimes and their evolutionary consequences. Pp. 86-100.In: Pickett, S.T.A. and P.S. White (eds.) The ecology of natural disturbance and patch dynamics.Academic Press, Orlando, Florida, USA.
Clark, D.A. and D.B. Clark (1992) Life history diversity of canopy and emergent trees in a neo-tropical rain forest. Ecol. Monogr. 62(3): 315-344.
Clark, D.B. and D.A. Clark (1991) The impact of physical damage on canopy tree regeneration intropical rain forest. J. Ecol. 79: 447-457.
Clark, D.B. and D.A. Clark (1996) Abundance, growth and mortality of very large trees in neotropi-cal lowland rain forest. For. Ecol. Manage. 80: 1-3.
Clark, J.S. (1996) Testing disturbance theory with long-term data: alternative life-history solutionsto the distribution of events. Am. Nat. 148(6): 976-996.
Clements, F.E. (1904) The development and structure of vegetation. Botanical Survey of Nebraska7. Studies in the vegetation of the state, Lincoln, Nebraska, USA.
Clements, F.E. (1916) Plant succession. Carnegie Institute Washington Publication 242, Washing-ton, D.C., USA.
Cochrane, M.A. (2001) Synergetic interactions between habitat fragmentation and fire in evergreentropical forests. Cons. Biol. 15(6): 1515-1521.
Cochrane, M.A. and M.D. Schulze (1998) Forest fires in the brazilian Amazon. Cons. Biol. 12(5):948-950.
Cochrane, M.A. and M.D. Schulze (1999) Fire as a recurrent event in tropical forests of the EasternAmazon: Effects on forest structure, biomass, and species composition. Biotropica 31(1): 2-16.
Cochrane, M.A. et al. (1999) Positive feedbacks in the fire dynamic of closed canopy tropical forests.Science 284: 1832-1835.
Cody, M.L. (1973) Character Convergence. Ann. Rev. Ecol. Syst. 4: 189-211.
Condit, R., S.P. Hubbell and R.B. Foster (1995) Mortality rates of 205 neotropical tree and shrubspecies and the impact of a severe drought. Ecol. Monogr. 65(4): 419-439.
Connell, J.H. (1978) Diversity in tropical rain forests and coral reefs. Science 199: 1302-1310.
129
Connell, J.H. and R.O. Slatyer (1977) Mechanisms of succession in natural communities and theirrole in community stability and organization. Am. Nat. 111: 1119-1144.
Corner, E.J.H. (1949) The durian theory or the origin of the modern tree. Ann. Bot. 13: 317.
Crawley, M.J. (1992) Seed predators and plant population dynamics. Pp. 157-192. In: Fenner, M.(ed.) Seeds. The ecology of regeneration in plant communities. C.A.B. International, Willington,UK.
Curran, L.M. and M. Leighton (2000) Vertebrate responses to spatiotemporal variation in seedproduction of mast-fruiting Dipterocarpaceae. Ecol. Monogr. 70(1): 101-128.
Dalling J.W. and J.S. Denslow (1998) Soil seed bank composition along a forest chronosequence inseasonally moist tropical forest, Panama. J. Veg. Sci. 9(5): 669-678.
Dalling J.W., M.D. Swaine and N.C. Garwood (1994) Effect of soil depth on seedling emergence intropical soil seed bank investigations. Funct. Ecol. 9: 119-122.
Dalling, J.W., M.D. Swaine and N.C. Garwood (1997 a) Soil seed bank community dynamics inseasonally moist lowland tropical forest, Panama. J. Trop. Ecol. 13: 659-680.
Dalling, J.W., M.D. Swaine and N.C. Garwood and K.E. Harms and R. Aizprua (1997 b) Seed dam-age tolerance and seedling resprouting ability of Prioria copaifera in Panama. J. Trop. Ecol. 13:481-490.
Dalling, J.W., S.P. Hubbell and K. Silvera (1998) Seed dispersal, seedling establishment and gappartitioning among tropical pioneer trees. J. Ecol. 86(4): 674-689.
Dam, R.A.C., J. Fluin, P. Suparan and S. van der Kaars (2001 a) Palaeoenvironmental develop-ments in the Lake Tondano area (N. Sulawesi, Indonesia) since 33,000 yr B.P. Palaeo 171(3-4):147-183.
Dam, R.A.C., S. van der Kaars and A.P. Kershaw (2001 b) Quaternary environmental change in theIndonesian region. Palaeo 171(3-4): 91-95.
Davies S.J. and P.S. Ashton (1999) Phenology and fecundity in 11 sympatric pioneer species ofMacaranga (Euphorbiaceae) in Borneo. Am. J. Bot. 86(12): 1786-1795.
Dawkins, H.C. and D.R. Field (1978) A long-term surveillance system for British woodland vegeta-tion. Occasional papers no. 1, Oxford University, Oxford.
den Ouden, J. (2000) The role of bracken (Pteridium aquilinum) in forest dynamics. Ph.D. thesis,Wageningen University, Wageningen, The Netherlands. Pp. 218.
Denslow, J.S. (1980) Gap partitioning among tropical rain forest trees. Biotropica 12: 47-55.
Directorate of Forest Utilization (1999) Penyempurnaan surat edaran direktur jenderal pengusa-haan hutan produksi nomor 259/IV-BPH/1999 tentang tebang penyelamatan di areal HPH bekaskebakaran. Departemen Kehutanan dan Perkebunan, Direktorat Jenderal Pengusahaan HutanProduksi Republik Indonesia. Jakarta, Indonesia.
Doi, T. (1988) Present status of the large mammals in the Kutai national park, after a large scalefire in East Kalimantan, Indonesia. Pp. 82-93. In: Tagawa, H. and N. Wirawan (eds.) A researchon the process of earlier recovery of tropical rain forest after a large scale fire in KalimantanTimur, Indonesia, Occasional paper no. 14, Research Center for the South Pacific, Japan.
Douglas, I. (1999) Hydrological investigations of forest disturbance and land cover impacts inSouth-East Asia: a review. Phil. Trans. R. Soc. Lond. B 354(1391): 1725-1738.
Eberhardt, L.L. and J.M. Thomas (1991) Designing environmental field studies. Ecol. Monogr.61(1): 53-73.
Egler, F.E. (1954) Vegetation science concepts, I. Initial floristic composition - a factor in old-fieldvegetation development. Vegetatio 4: 412-417.
Everham, E.M. and N.V.L. Brokaw (1996) Forest damage and recovery from catastrophic wind.Bot. Rev. 62: 113-185.
Ewel, J., C. Berish, B. Brown, N. Price and J. Raich (1981) Slash and burn impacts on a Costa Ri-can wet forest site. Ecology 62: 816-829.
FAO/Unesco/ISRIC (1988) Revised legend of the FAO/Unseco soil map of the world. FAO, Rome,Italy.

130
Fenner, M. (1985) Seed ecology. Chapman and Hall, London, UK.
Finegan, B. (1984) Forest succession. Nature 312: 109-114.
Finegan, B. (1996) Pattern and process in neotropical secondary rain forest: the first 100 years ofsuccession. TREE 11(3): 119-124.
Fletcher, W.W. and R.C. Kirkwood (1979) The bracken fern (Pteridium aquilinum L. (Kuhn); itsbiology and control. Pp. 591-635. In: Dyer, A.F. (ed.) The experimental biology of ferns. Academicpress, London, UK.
Foster, S.A. (1986) On the adaptive value of large seeds for tropical moist forest trees: review andsynthesis. Bot. Rev. 52: 260-299.
Fredriksson, G.M. and M. de Kam (1999) Strategic plan for the conservation of the Sungai Wainprotection forest, East Kalimantan. Pp.38. The International MOFEC – Tropenbos Kalimantanproject, Wanariset Samboja. Balikpapan, Indonesia.
Garwood, N.C. (1989) Tropical soil seed banks: a review. Pp. 149-209. In: Leck, M.A., V.T. Parkerand R.L. Simpson (eds.) Ecology of soil seed banks. Academic Press. San Diego, California, USA.
Gentry, A.H. and and J. Terborgh (1990) Composition and dynamics of the Cocha Cashu "mature"floodplain forest. Pp. 542-572. In: Gentry, A.H. (ed.) Four neotropical rainforests. Yale UniversityPress, New Haven, CT, USA.
Gill, A.M. and D.H. Ashton (1968) The role of bark type in relative tolerance to fire of three centralvictorian eucalypts. Aust. J. Bot. 16: 491-498.
Gillison, A.N. (1983) Tropical savannas of Australia and the Southwest Pacific. Pp. 183-243. In:Bourlière, F. (ed.) Tropical savannas- Ecosystems of the world. Vol. 13. Elsevier. Amsterdam,Netherlands.
Gitay, H. I.R. Noble and J.H. Connell (1999) Deriving functional types for rain-forest trees. J. Veg.Sci. 10: 641-650.
Glenn-Lewin, D.C. and E. van der Maarel (1992) Patterns and processes of vegetation dynamics.Pp. 11-59. In: Glenn-Lewin, D.C., R.K. Peet and T.T. Veblen (eds.) Plant succession. Theory andprediction. Pp.352. Chapman and Hall, London, UK.
Glenn-Lewin, D.C., R.K. Peet and T.T. Veblen (eds.) (1992) Plant succession. Theory and prediction.Pp.352. Chapman and Hall, London, UK
Goldammer, J.G. and B. Seibert (1989) Natural rain forest fires in eastern Borneo during the Pleis-tocene and Holocene. Naturwissenschaften 76(11): 518-520.
Gómez-Pompa, A. and C. Vásquez-Yanes (1981) Successional studies of a rain forest in Mexico. Pp.246-266. In: West, D.C., H.H. Shugart and D.B. Botkin (eds.) Forest succession: Concepts and ap-plication. Springer-Verlag, New York, USA.
Grime, J.P. (1979) Plant strategies and vegetation processes. Pp. 222. John Wiley & Sons, Chiches-ter, UK.
Grime, J.P. and D.W. Jeffrey (1965) Seedling establishment in vertical gradients of sunlight. J.Ecol. 53: 621-642.
Grubb, P.J. (1977) The maintenance of species-richness in plant communities: The importance ofthe regeneration niche. Biol. Rev. 52: 107-145.
Guariguata, M.R. (1998) Response of forest tree saplings to experimental mechanical damage inlowland Panama. For. Ecol. Manage. 102: 103-111.
Hacke, U.G., J.S. Sperry, W.T. Pockman, S.D. Davis and K.A. McCulloh (2001) Trends in wooddensity and structure are linked to prevention of xylem implosion by negative pressure. Oecologia126: 457-461.
Hanes, T.L. (1971) Succession after fire in the chaparral of Southern California. Ecol. Monogr. 35:213-235.
Hartshorn, G.S. (1990) An overview of neotropical forest dynamics. Pp. 585-599. In: Gentry, A.H.(ed.) Four neotropical rainforests. Yale University Press, New Haven, CT, USA.
Haskins, F.A. and H.J. Gorz (1975) Influence of plant size, planting depth, and companion crop onemergence and vigor of seedlings in sweetclover. Agronomy J. 67: 652-654.
131
Hoffmann, A.A., A. Hinrichs, and F. Siegert (1999) Fire damage in East Kalimantan in 1997/98related to land use and vegetation classes: satellite radar inventory results and proposal for fur-ther actions. Integrated Forest Fire Management Project and Sustainable Forest ManagementProject. Report 1. Samarinda, Indonesia.
Holdsworth, A.R. and C. Uhl (1997) Fire in amazonian selectively logged rain forest and the poten-tial for fire reduction. Ecol. Appl. 7(2): 713-725.
Hope, G. (2001) Environmental change in the Late Pleistocene and later Holocene at Wanda site,Soroako, South Sulawesi, Indonesia. Palaeo 171(3-4): 129-145.
Hopkins, B. (1992) Ecological processes at the forest-savanna boundary. Pp. 21-33. In: Furley, P.A.,J. Proctor & J.A. Ratter (eds.) Nature and dynamics of forest-savanna boundaries. Chapman &Hall, London, UK.
Hopkins, M.S. (1981) Disturbance and change in rainforests and the resulting problems of func-tional classification. Pp. 42-52. In: Gillison, A.N. and D.J. Anderson (eds.) Vegetation classifica-tion in Australia. CSIRO/ANU press, Canberra, Australia.
Hopkins, M.S. and A.W. Graham (1983) The species composition of soil seed banks beneath lowlandtropical rainforests in North Queensland, Australia. Biotropica 15(2): 90-99.
Hopkins, M.S. and A.W. Graham (1984) The role of soil seed banks in regeneration in canopy gapsin Australian tropical lowland rainforest – Preliminary field experiments. Malay. For. 47(2): 146-158.
Horn, H.H. (1976) Succession. Pp. 187-204. In: May, R.M. (ed.) Theoretical ecology: Principles andapplications. Blackwell, Oxford.
Howe, H.F., and J. Smallwood (1982) Ecology of seed dispersal. Ann. Rev. Ecol. Syst. 13: 201-228.
Hubbell, S.P. (1979) Tree dispersion, abundance, and diversity in a tropical dry forest. Science 203:1299-1309.
Hubbell, S.P. (1980) Seed predation and the coexistence of tree species in tropical forests. Oikos 35:214-229.
Hubbell, S.P. (1998) The maintenance of diversity in a neotropical tree community: conceptualissues, current evidence, and challenges ahead. Pp. 17-44. In: Dallmeier, F. & J.A. Comiskey(eds.) Forest biodiversity, research, monitoring and modelling. Conceptual background and oldworld case studies. UNESCO Man and the biosphere series. Volume 20. Parthenon publishinggroup inc., USA.
Hubbell, S.P. and R.B. Foster (1986 a) Biology, chance, and history and the structure of tropicalrain forest tree communities. Pp. 314-329. In: Diamond, J. and T.J. Case (eds.) Community ecol-ogy. Harper and Row, New York, USA.
Hubbell, S.P. and R.B. Foster (1986 b) Canopy gaps and the dynamics of a Neotropical forest. Pp.77-96. In: Crawley, M.J. (ed.) Plant Biology. Blackwell Scientific Publications, London, UK.
Hubbell, S.P. and R.B. Foster (1990) Structure, dynamics, and equilibrium status of old-growthforest on Barro Colorado Island. Pp. 522-541. In: Gentry, A.H. (ed.) Four neotropical rainforests.Yale University Press, New Haven, CT, USA.
Hubbell, S.P. et al. (1990) Presence and absence of density-dependence in a neotropical tree com-munity. Phil. Trans. Roy. Soc. Lond. B330: 269-281.
Humprey, J. and M.D. Swaine (1997) Factors affecting the natural regeneration of Quercus in Scot-tish oakwoods. I. Competiton from Pteridium aquilinum. J. Appl. Ecol. 34: 577-584.
Huston, M. (1979) A general hypothesis of species diversity. Am. Nat. 113: 81-101.
Huston, M.A. (1994) Biological diversity. The coexistence of species on changing landscapes. Pp.681. Cambridge University Press, Cambridge, New York, USA.
Huston, M. and T. Smith (1987) Plant succession: Life history and competition. Am. Nat. 130(2):168-198.
Iwasa, Y. (2000) Dynamic optimization of plant growth. Evol. Ecol. Res. 2: 437-455.
Iwasa, Y. and T. Kubo (1997) Optimal size of storage for recovery after unpredictable disturbances.Evol. Ecol. 11: 41-65.

132
Janzen, D.H. (1974) Tropical blackwater rivers, animals, and mast-fruiting by the Dipterocar-paceae. Biotropica 6: 69-103.
Jobidon, R. (1997) Stump height effects on sprouting of Mountain Maple, Paper Birch and PinCherry - 10 year results. Forestry Chronicle 73(5): 590-595.
Jongeman, R.H.G., C.J.F. ter Braak and O.F.R. van Tongeren (1995) Data analysis in communityand landscape ecology. (2nd edition). Pp. 299. Cambridge University Press, Cambridge, UK.
Kammesheidt, L. (1998) The role of tree sprouts in the restoration of stand structure and speciesdiversity in tropical moist forest after slash-and-burn agriculture in Eastern Paraguay. PlantEcol. 139(2): 155-165.
Kammesheidt, L. (1999) Forest recovery by root suckers and above-ground sprouts after slash-and-burn agriculture, fire and logging in Paraguay and Venezuela. J. Trop. Ecol. 15: 143-157.
Kartawinata, K. (1993) A wider view of the fire hazard. Pp. 261-266. In: Brookfield, H. and Y.Byron (eds.) South-east Asia's environmental future: The search for sustainability. United NationsUniversity Press, Tokyo, Japan.
Kauffman, J.B. (1991) Survival by sprouting following fire in tropical forests of the eastern Ama-zon. Biotropica 23(3): 219-224.
Kennard, D.K. and H.L. Gholz (2001) Effects of high- and low-intensity fires on soil properties andplant growth in a Bolivian dry forest. Plant Soil 234(1): 119-129.
Ketterings, Q.M. and J.M. Bigham (2000) Soil color as an indicator of slash-and-burn fire severityand soil fertility in Sumatra, Indonesia. Soil Sci. Soc. Am. 64(5): 1826-1833.
Ketterings, Q.M., J.M. Bigham and V. Laperche (2000) Changes in soil mineralogy and texturecaused by slash-and-burn fires in Sumatra, Indonesia. Soil Sci. Soc. Am. 64(3): 1108-1117.
King, D.A. (1990) Allometry of saplings and understorey trees of a panamanian forest. Funct. Ecol.4: 27-32.
Kinnaird, M.F. and T.G. O’Brien (1998) Ecological effects of wildfire on lowland rainforest in Su-matra. Cons. Biol. 12(5): 954-956.
Klugmann, K. and A. Roloff (1999) Twig abscission (cladoptosis) and its ecophysiological signifi-cance for decline symptoms in Quercus robur L. Forstwissenschaftliches Centralblatt 118(4): 271-286.
Kobayashi, S., M. Sutisna, A. Delmy and T. Toma (1999) Initial phase of secondary succession atthe burnt logged-over forest in Bukit Soeharto, East Kalimantan, Indonesia - Which vegetationtypes are facilitation or competition process? Pp. 324-335. In: Suhartoyo, H. and T. Toma (eds.)Pusrehut special publication 8. Proceedings of the 3rd international symposium on Asia tropicalforest management. Tropical Forest Research Center Mulawarman University & JICA, Sama-rinda, Indonesia.
Kohyama, T. and M. Hotta (1990) Significance of allometry in tropical saplings. Funct. Ecol. 4: 515-521.
Leighton, M. (1984) The El Niño-Southern Oscillation event in Southeast Asia: Effects of droughtand fire in tropical forest in eastern Borneo. WWF report.
Leighton, M. and N. Wirawan (1986) Catastrophic drought and fire in Borneo tropical rain forestassociated with the 1982-1983 El Niño Southern Oscillation event. Pp. 75-102. In: G.T. Prance(ed.) Tropical rain forest and the world atmosphere, AAAS Selected Symposium 101. WashingtonDC: Amer. Assoc. for the Advancem. of Sc., USA.
Lennertz, R. and K.F. Panzer (1984) Preliminary assessment of the drought and forest fire damagein Kalimantan Timur. Report by DFS German Forest Inventory Service for Gesellschaft furTechnische Zusammenarbeit (GTZ). Pp. 45 + annexes. Germany.
Lieberman, D. and M. Lieberman (1987) Forest tree growth and dynamics at La Selva, Costa Rica(1969-1982). J. Trop. Ecol. 3: 347-358.
Loehle, C. (2000) Strategy space and the disturbance spectrum: a life history model for tree speciescoexistence. Am. Nat. 156(1): 14-33.

133
Louda, S. (1989) Predation in the dynamics of seed regeneration. Pp. 25-52. In: Leck, M.A., V.T.Parker and R.L. Simpson (eds.) Ecology of soil seed banks. Academic press. San Diego, California,USA.
Lucas, P.W., H.T.W. Tan and P.Y. Cheng (1997) The toughness of secondary cell wall and woodytissue. Phil. Trans. Roy. Soc. Lond. Series B. 352(1351): 341-352.
MacKinnon, K., G. Hatta, H. Halim and A. Mangalik (1996) The ecology of Kalimantan. The ecologyof Indonesia series. Vol. 3. Pp. 802. Periplus editions, Singapore.
MacMahon, J.A. (1981) Successional processes: Comparisons among biomes with special referenceto probable roles of and influences on animals. Pp. 275-304. In: West, D.C., H.H. Shugart andD.B. Botkin (eds.) Forest succession. Concepts and application. Pp. 517. Springer-Verlag, NY,USA.
Makihara, H., H. Kinuura, K. Yahiro and C. Soeyamto (2001) The effects of droughts and fires onColepteran insects in lowland dipterocarp forests in Bukit Soeharto, East Kalimantan. Pp. 153-166. In: Guhardja, E. et al. (eds.) Rainforest ecosystems of East Kalimantan. El Niño, drought, fireand human impacts. Springer, Tokyo, Japan.
Malanson, G.P. (1984) Intensity as a third factor of disturbance regime and its effect on speciesdiversity. Oikos (43): 411-413.
Manokaran, N. and K.M. Kochummen (1987) Recruitment, growth and mortality of tree species ina lowland dipterocarp forest in Peninsular Malaysia. J. Trop. Ecol. 3: 315-330.
Martin, R.E. and C.T. Cushwa (1966) Effects of heat and moisture on leguminous seed. Proceedingsof the tall timbers fire ecology conference 5: 159-175.
Matius, P., T. Toma and M. Sutisna (2001) Tree species composition of a burned lowland diptero-carp forest in Bukit Soeharto, East Kalimantan. Pp. 99-104. In: Guhardja, E. et al. (eds.) Rainfor-est ecosystems of East Kalimantan. El Niño, drought, fire and human impacts. Springer, Tokyo,Japan.
Metcalfe, D.J. and P.J. Grubb (1995) Seed weights and light requirements for regeneration inSouth-east Asian rain forest. Can. J. Bot. 73: 817-826.
Metcalfe D.J., P.J. Grubb and I.M. Turner (1998) The ecology of very small-seeded shade-toleranttrees and shrubs in lowland rain forest in Singapore. Plant Ecol. 134(2): 131-149.
Metcalfe, D.J. and I.M. Turner (1998) Soil seed bank from lowland rain forest in Singapore: Can-opy-gap and litter-gap demanders. J. Trop. Ecol. 14: 103-108.
Miller, T.E. (1982) Community diversity and interactions between the size and frequency of distur-bance. Am. Nat. 120: 533-536.
Miyagi, Y., H. Tagawa, E. Suzuki, N. Wirawan and N. Oka (1988) Phytosociological study of thevegetation of Kutai national park, East Kalimantan, Indonesia. Pp. 51-62. In: Tagawa, H. and N.Wirawan (eds.) A research on the process of earlier recovery of tropical rain forest after a largescale fire in Kalimantan Timur, Indonesia. Occasional papers no. 14. Pp. 136. Kagoshima Univ.Research Center for the South Pacific, Japan.
Molofsky, J. and C.K. Augspurger (1992) The effect of litter on early seedling establishment in atropical forest. Ecology 73: 68-77.
Moreno, J.M. and W.C. Oechel (1989) A simple method for estimating fire intensity after a burn inCalifornia chaparral. Acta Oecol. 10(1): 57-68.
Mori, T. (2001) Effects of droughts and forest fires on dipterocarp forest in East Kalimantan. Pp.29-48. In: Guhardja, E. et al. (eds.) Rainforest ecosystems of East Kalimantan. El Niño, drought,fire and human impacts. Springer, Tokyo, Japan.
Nakagawa, M. et al. (2000) Impact of severe drought associated with the 1997-1998 El Niño in atropical forest in Sarawak. J. Trop. Ecol. 16: 355-367.
Negreros-Castillo, P. and R.B. Hall (2000) Sprouting capability of 17 tropical tree species afteroverstory removal in Quintana Roo, Mexico. For. Ecol. Manage. 126: 399-403.
Ng, F.S.P. (1991) Manual of forest fruits, seeds and seedlings (2 vol.). Vol 1: Pp. 1-400. Vol. 2: Pp.401-997. Malayan forest records 34. Forest Research Institute Malaysia. Kepong, Malaysia.
Niklas, K.J. (1992) Plant biomechanics. Universiy of Chicago Press, Chicago, USA.

134
Noble, I.R. and R.O. Slatyer (1980) The use of vital attributes to predict successional changes inplant communities subject to recurrent disturbances. Vegetatio 43: 5-21.
Nykvist, N. (1996) Regrowth of secondary vegetation after the "Borneo fire" of 1982-1983. J. Trop.Ecol. 12: 307-312.
Pacala, S.W., C.D. Canham, J. Saponara, J.A. Silander, R.K. Kobe and E. Ribbens (1996) Forestmodels defined by field measurements: Estimation, error analysis and dynamics. Ecol. Monogr.66(1): 1-43.
Paciorek, C.J., R. Condit, S.P. Hubbell and R.B. Foster (2000) The demographics of resprouting intree and shrub species of a moist tropical forest. J. Ecol. 88(5): 765-777.
Pate, J.S., R.H. Froend, B.J. Bowen, A. Hansen and J. Kuo (1990) Seedling growth and storagecharacteristics of seeder and resprouter species of Mediterranean-type ecosystems of S.W. Aus-tralia. Ann. Bot. 65: 585-601.
Pedersen, B.S. (1998) The role of stress in the mortality of midwestern oaks as indicated by growthprior to death. Ecology 79(1): 79-93.
Peña-Claros, M. (2001) Secondary forest succession. Processes affecting the regeneration of Boliv-ian tree species. Pp. 170. Ph.D. Thesis. Promab scientific series 3. Riberalta, Bolivia.
Pianka, E.R. (1970) On r- and K-selection. Am. Nat. 104: 592-597.
Pickett, S.T.A., S.L. Collins and J.J. Armesto (1987) Models, mechanisms and pathways of succes-sion. Bot. Rev. 53: 335-371.
Pinard, M.A. and J. Huffman (1997) Fire resistance and bark properties of trees in a seasonally dryforest in eastern Bolivia. J. Trop. Ecol. 13: 727-740.
Pinard, M.A. and F.E. Putz and J.C. Licona (1999) Tree mortality and vine proliferation following awildfire in a subhumid tropical forest in eastern Bolivia. For. Ecol. Manage. 116: 247-252.
Pons, T. (1992) Seed responses to light. Pp. 259-284. In: Fenner, M. (ed.) Seeds. The ecology of re-generation in plant communities. C.A.B. International, Willington, UK.
Pons, T.L. (2000) Seed responses to light. Pp. 237-260. In: Fenner, M. (ed.) Seeds. The ecology ofregeneration in plant communities. Second edition. CABI Publishing, Wallingford, UK.
Priadjati, A. (1999) The impacts of forest fires on seedlings and saplings structure in Sungai Wainprotection forest, East Kalimantan, Indonesia. Pp. 310-319. In: Suhartoyo, H. and T. Toma (eds.)Impacts of fire and human activities on forest ecosystems in the tropics. Proceedings of the 3rd in-ternational symposium on Asia tropical forest management. Pusrehut special publication 8. Tropi-cal Forest Research Center Mulawarman University & JICA, Samarinda, Indonesia.
Probert, R.J. (1992) The role of temperature in germination ecophysiology. Pp. 285-325. In: Fenner,M. (ed.) Seeds. The ecology of regeneration in plant communities. C.A.B. International, Willington,UK.
Probert, R.J. (2000) The role of temperature in the regulation of seed dormancy and germination.Pp. 261-292. In: Fenner, M. (ed.) Seeds. The ecology of regeneration in plant communities. Secondedition. CABI Publishing, Wallingford, UK.
Putz, F.E. and N.V.L. Brokaw (1989) Sprouting of broken trees on Barro Colorado Island, Panama.Ecology 70(2): 508-512.
Raich J.W. and W.K. Gong (1990) Effects of canopy openings on tree seed germination in a Malay-sian dipterocarp forest. J. Trop. Ecol. 6: 203-217.
Rankin-de-Merona, J.M., R.W. Hutchins and T.E. Lovejoy (1990) Tree mortality and recruitmentover a five-year period in undisturbed upland rain forest of the Central Amazon. Pp. 573-584. In:Gentry, A.H. (ed.) Four neotropical rainforests. Yale University Press, New Haven, CT. USA.
Richards, P.W. (1996) The tropical rain forest. Second edition. Pp. 575. University Press, Cam-bridge, UK.
Rijks M.H., E.J. Malta and R.J. Zagt (1998) Regeneration through sprout formation in Chlorocar-dium rodiei (Lauraceae) in Guyana. J. Trop. Ecol. 14(4): 463-475.
Riswan, S. and K. Kartawinata (1988) A lowland dipterocarp forest 35 years after pepper planta-tion in East Kalimantan, Indonesia. Pp. 1-40. In: Soemodihardjo, S. (ed.) Some ecological aspects

135
of tropical forest of East Kalimantan: A collection of research reports. MAB Indonesia Contributionno. 48, Jakarta: Man and the Biosphere Programme.
Riswan, S. and K. Kartawinata (1989) Regeneration after disturbance in a lowland mixed diptero-carp forest in East Kalimantan, Indonesia. Ekologi Indonesia 1: 9-28.
Riswan, S. and K. Kartawinata (1991 a) Regeneration after disturbance in a lowland mixed dip-terocarp forest in East Kalimantan, Indonesia. Pp. 295-301. In: Gomez-Pompa, A., T.C. Whitmore& M. Hadley (eds.) Rain forest regeneration and management. Man and the biosphere series.
Riswan, S. and K. Kartawinata (1991 b) Species strategy in early stage of secondary successionassociated with soil properties status in a lowland mixed dipterocarp forest and kerangas forest inEast Kalimantan. Tropics 1: 13-34.
Riswan, S. and R. Yusuf (1986) Effects of forest fires on trees in the lowland dipterocarp forest ofEast Kalimantan, Indonesia. Pp. 155-163. In: Proc. of the Symp. on Forest Regeneration in South-east Asia, Bogor, Indonesia, 9-11 May 1984. BIOTROP spec. publ. no. 25. Bogor, Indonesia.
Riswan, S. et al. (1985) The estimation of temporal processes in tropical rain forest: a study of pri-mary mixed dipterocarp forest in Indonesia. J. Trop. Ecol. 1: 171-182.
Roberts, E.H. (1972) Storage environment and the control of viability. In: Roberts, E.H. (ed.) Viabil-ity of seeds. pp. 15-57. Chapmann and Hall, London, UK.
Roberts, E.H. and F.H. Abdalla (1968) The influence of temperature, moisture, and oxygen on pe-riod of seed viability in Barley, Broad beans, and Peas. Ann. Bot. 32: 97-117.
Ropelewski, C.F. and M.S. Halpert (1996) Quantifying Southern Oscillation - precipitation rela-tionships. J. Climate 9: 1043-1059.
Rose, S.A. (2000) Seeds, seedlings and gaps - size matters. A study in the tropical rain forest of Guy-ana. Pp. 175. Ph.D. thesis, Tropenbos Guyana Programme, Georgetown, Guyana.
Rosenberg, N.J. (1974) Microclimate: The biological environment. Pp. 315. J. Wiley and sons, NewYork, USA.
Runkle, J.R. (1985) Disturbance regimes in temperate forests. Pp. 17-34. In: Pickett, S.T.A. andP.S. White (eds.) The ecology of natural disturbance and patch dynamics. Academic Press, Or-lando, Florida, USA.
Saldarriaga, J.G. and D.C. West (1986) Holocene fires in the northern Amazon basin. Quat. Res. 26:358-366.
Saulei, S.M. and M.D. Swaine (1988) Rain forest seed dynamics during succession at Gogol, PapuaNew Guinea. J. Ecol. 76: 1133-1152.
Sawyer, R. and E.J. Dixon (1968) The automatic determination of original gravity of beer. Part I.Introduction and determination of reducing sugar after hydrolysis. Analyst 93: 669-679.
Schier, G.A. and J.C. Zasada (1973) Role of carbohydrate reserves in the development of root suck-ers in Populus tremuloides. Can. J. For. Res. 3: 243-250.
Sheil, D. (1995) A critique of permanent plot methods and analysis with examples from Budongoforest, Uganda. For. Ecol. Manage. 77: 11-34.
Sheil, D. (1999) Tropical forest diversity, environmental change and species augmentation: Afterthe intermediate disturbance hypothesis. J. Veg. Sci. 10: 851-860.
Sheil, D., D.F.R.P. Burslem and D. Alder (1995) The interpretation and misinterpretation of mor-tality rate measures. J. Ecol. 83: 331-333.
Shimokawa, E. (1988) Effect of fire of a tropical rain forest on soil erosion. Pp. 2-11. In: Tagawa, H.and N. Wirawan (eds.) A research on the process of earlier recovery of tropical rain forest after alarge scale fire in Kalimantan Timur, Indonesia, Occasional paper no. 14, Research Center for theSouth Pacific, Japan.
Sidiyasa, K. Arbainsyah and P.J.A. Kessler (1999) List of collections stored at the Wanariset herbar-ium, East Kalimantan, Indonesia. The International MOFEC-Tropenbos Kalimantan project,Samboja, Indonesia. Pp. 252.
Siegert, F., G. Ruecker, A. Hinrichs and A.A. Hoffmann (2001) Increased damage from fires inlogged forests during droughts caused by el Niño. Nature 414: 437-440.

136
Slik, J.W.F., P.J.A. Kessler and P.C. van Welzen (2001) Macaranga and Mallotus species (Euphor-biaceae) as indicators for disturbance in the mixed lowland dipterocarp forest of East Kalimantan(Indonesia). Pp. 21-36. In: J.W.F. Slik. Macaranga and Mallotus (Euphorbiaceae) as indicators fordisturbance in the lowland dipterocarp forests of East Kalimantan, Indonesia. Ph.D. thesis. Tro-penbos-Kalimantan series 4. Balikpapan, Indonesia.
Sokal, R.R. and F.J. Rohlf (1981) Biometry. 2nd edition. Pp.859. Freeman and Company, New York,USA.
Sousa, W.P. (1985) Disturbance and patch dynamics on rocky intertidal shores. Pp. 101-124. In:Pickett, S.T.A. and P.S. White (eds.) The ecology of natural disturbance and patch dynamics. Aca-demic Press, Orlando, Florida, USA.
Steiniger, M.K. (2000) Secondary forest structure and biomass following short and extended land-use in central and southern Amazonia. J. Trop. Ecol. 16(5): 689-708.
Stocker, G.C. (1981) Regeneration of a North Queensland rain forest following felling and burning.Biotropica 13(2): 86-92.
Suparan, P., R.A.C. Dam, S. van der Kaars and T.E. Wong (2001) Late Quaternary tropical lowlandenvironments on Halmahera, Indonesia. Palaeo 171(3-4): 229-258.
Suzuki, E. (1988) The socio-ecological study of Orangutans and the forest conditions after the bigforest fires and drought, 1983, in Kutai national park, Indonesia. Pp. 117-136. In: Tagawa, H. andN. Wirawan (eds.) A research on the process of earlier recovery of tropical rain forest after a largescale fire in Kalimantan Timur, Indonesia, Occasional paper no. 14, Research Center for theSouth Pacific, Japan.
Suzuki, E. (1999) Diversity in specific gravity and water content of wood among Bornean tropicalrainforest trees. Ecol. Res. 14(3): 211-224.
Swaine, M.D., V.K. Agyeman, B. Kyereh et al. (1997) Ecology of forest trees in Ghana. OverseasDevelopment Agency. Forestry series 7. UK.
Swaine, M.D. and T.C. Whitmore (1988) On the defenition of ecological species groups in tropicalrain forests. Vegetatio 75: 81-86.
Symington, C.F. (1933) The study of secondary growth on rain forest sites in Malaya. Malay. For. 2:107-117.
Tanner, E.J.V., V. Kapos and J.R.H. Healey (1991) Hurricane effects on forest ecosystems in theCaribbean. Biotropica 23: 513-521.
ter Steege, H. (1996) Winphot 5.0: A programme to analyze vegetation indices, light and lightquality from hemisperical photographs. Tropenbos Guyana report 95-2. Tropenbos Guyana Pro-gramme, Georgetown, Guyana.
ter Steege, H. and D.S. Hammond (2001) Character convergence, diversity, and disturbance intropical rain forest in Guyana. Ecology 82(11): 3197-3212.
TerHeerdt G.N.J., G.L. Verweij, R.M. Bekker and J.P. Bakker (1996) An improved method for seed-bank analysis: Seedling emergence after removing the soil by sieving. Funct. Ecol. 10(1): 144-151.
Thomas, S.C. (1996) Relative size at onset of maturity in rain forest trees: A comparative analysisof 37 Malaysian species. Oikos 76(1): 145-154.
Tilman, D. (1982) Resource competition and community structure. Princeton University Press,Princeton, N.J., USA.
Tilman, D. (1988) Plant strategies and the dynamics and structure of plant communities. Pp. 360.Princeton University Press, Princeton, N.J., USA.
Tolhurst, K.G. and N.D. Turvey (1992) Effects of bracken (Pteridium esculentum (Forst. f. Cock-ayne)) on eucalypt regeneration in west-central Victoria. For. Ecol. Manage. 54: 45-67.
Toma, T. (1999) Effects of selective logging and forest fire on microclimate of lowland dipterocarpforest in Bukit Soeharto, East Kalimantan. Proc. 3rd Intern. Symp. Asean Trop. For. Manage.
Toma, T., et al. (1998) Floristic composition and stand dynamics in logged-over and burnt lowlanddipterocarp forests in Bukit Soeharto, East Kalimantan. Pusrehut special publication. Sama-rinda, Indonesia.
137
Toma, T., P. Matius and M. Sutisna (1999) Fire and human impacts on aboveground biomass oflowland dipterocarp forests in East Kalimantan. Pp. 297-305. In: Suhartoyo, H. and T. Toma(eds.) Pusrehut special publication 8. Proceedings of the 3rd international symposium on Asia
Toma, T., Marjenah and Hastaniah (2001 a) Climate in Bukit Soeharto, East Kalimantan. Pp. 13-25. In: Guhardja, E. et al. (eds.) Rainforest ecosystems of East Kalimantan. El Niño, drought, fireand human impacts. Springer, Tokyo, Japan.
tropical forest management. Tropical Forest Research Center Mulawarman University & JICA,Samarinda, Indonesia.
Toma, T., P. Matius, Hastaniah, et al. (2001 b) Dynamics of burned lowland Dipterocarp foreststands in Bukit Soeharto, East Kalimantan. Pp. 107-120. In: Guhardja, E. et al. (eds.) Rainforestecosystems of East Kalimantan. El Niño, drought, fire and human impacts. Springer, Tokyo, Ja-pan.
Turner M.G., W.H. Romme, R.H. Gardner and W.W. Hargrove (1997) Effects of fire size and pat-tern on early succession in Yellowstone national park. Ecol. Monogr. 67(4): 411-433.
Tyree M.T., S. Patiño and P. Becker (1998) Vulnerability to drought-induced embolism of Borneanheath and dipterocarp forest trees. Tree Physiol. 18: 583-588.
Uhl, C. (1987) Factors controlling succession following slash-and-burn agriculture in Amazonia. J.Ecol. 75: 377-407.
Uhl, C., R. Buschbacher and E.A.S. Serrao (1988 b) Abandoned pastures in Eastern Amazon. I.Patterns of plant succession. J. Ecol. 76: 663-668.
Uhl, C., H. Clark, K. Clark and P. Maquirino (1982) Successional patterns associated with slash-and-burn agriculture in the Upper Rio Negro region of the Amazon basin. Biotropica 14(4): 249-254.
Uhl, C., K. Clark, H. Clark and P. Murphy (1981) Early plant succession after cutting and burningin the upper Rio Negro region of the Amazon basin. J. Ecol. 69: 631-649.
Uhl, C., K. Clark, N. Dezzeo and P. Maquirino (1988 c) Vegetation Dynamics in Amazonian TreefallGaps. Ecology 69(3): 751-763.
Uhl, C. and C.F. Jordan (1984) Succession and nutrient dynamics following forest cutting andburning in Amazonia. Ecology 65(5): 1476-1490.
Uhl, C. and J.B. Kauffman (1990) Deforestation, fire susceptibility, and potential tree responses tofire in the eastern Amazon. Ecology 71(2): 437-449.
Uhl, C., J.B. Kauffman and D.L. Cummings (1988 a) Fire in the Venezuelan Amazon 2: Environ-mental conditions necessary for forest fires in the evergreen rainforest of Venezuela. Oikos 53:176-184.
Ulbricht, R., A. Hinrichs, and Y. Ruslim (1999) Technical guideline for salvage felling in rehabilita-tion areas after forest fires. Sustainable Forest Management Project. Report 1. Samarinda, Indo-nesia.
Urban, D.L. and H.H. Shugart (1992) Individual-based models of forest succession. Pp. 249-292. In:Glenn-Lewin, D.C., R.K. Peet and T.T. Veblen (eds.) Plant succession. Theory and prediction.Pp.352. Chapman and Hall, London, UK.
van Dam, O. (2001) Forest filled with gaps. Effects of gap size on water and nutrient cycling intropical rain forest. A study in Guyana. Ph.D. thesis. Tropenbos-Guyana series 10. Georgetown,Guyana. Pp. 208.
van Eijk-Bos, C., and R.B. de Kock (1996) Tree species composition and increment of dipterocarpforest in permanent plots in East Kalimantan. Wanariset technical report 1996-1. InternationalMOF Tropenbos-Kalimantan project. Balikpapan, Indonesia.
van Nieuwstadt, M.G.L., D. Sheil and K. Kartawinata (2001) The ecological consequences of log-ging in the burned forests of East Kalimantan, Indonesia. Cons. Biol. 15(4): 1183-1186.
van Valkenburg, J.L.C.H. (1997) Non-timber forest products of East Kalimantan - Potentials forsustainable forest use. Tropenbos series 16. Backhuijs Publ. Leiden, Netherlands.

138
Vázquez-Yanes, C. and A. Orozco-Segovia (1982) Seed germination of a tropical rain forest treeHeliocarpus donell-smithii in response to diurnal fluctuations of temperature. Physiol. Plant. 56:295-298.
Vázquez-Yanes, C. and A. Orozco-Segovia (1993) Patterns of seed longevity and germination in thetropical rainforest. Annu. Rev. Ecol. Syst. 24: 69-87.
Veblen, T.T. (1992) Regeneration dynamics. Pp. 152-187. In: Glenn-Lewin, D.C., R.K. Peet and T.T.Veblen (eds.) Plant succession. Theory and prediction. Pp.352. Chapman and Hall, London, UK.
Vines, R.G. (1968) Heat transfer through bark, and the resistance of trees to fire. Aust. J. Bot. 16:499-514.
Vleeshouwers, L.M. (1997) Modelling the effects of temperature, soil penetration resistance, burialdepth and seed weight on pre-emergence growth of weeds. Ann. Bot. 79: 553-563.
Vose, R.S., R.L. Schmoyer, P.M. Steurer, T.C. Peterson, R. Heim, T.R. Karl, and J.K. Eischeid(1992) The global historical climatology network: Long-term monthly temperature, precipitation,sea level pressure, and station pressure data. Carbon Dioxide Information Analysis Center. OakRidge, TN. Available from ftp://cdiac.esd.ornl.gov/pub/ndp041/ (accessed 8 November 2000).
Walsh, R.P.D. (1996 a) Climate. Pp. 159-236. In: Richards, P.W. The Tropical Rain Forest (2ndedition). Cambridge University Press, Cambridge, UK.
Walsh, R.P.D. (1996 b) Drought frequency changes in Sabah and adjacent parts of northern Borneosince the late nineteenth century and possible implications for tropical rain forest dynamics. J.Trop. Ecol. 12: 385-407.
Walsh, R.P.D. and D.M. Newbery (1999) The ecoclimatology of Danum, Sabah, in the context of theworld's rainforest regions, with particular reference to dry periods and their impact. Phil. Trans.R. Soc. Lond. B 354: 1869-1883.
Werger, M.J.A. (1983) Tropical grasslands, savannas, woodlands: natural and manmade. Pp. 107-137. In: Holzner, W., M.J.A. Werger and I. Ikisima (eds.) Man's impact on vegetation. Geobotany5. Dr. W. Junk Publ., The Hague, Netherlands.
Wesson, G. and P.F. Wareing (1969) The role of light in the germination of naturally occuringpopulations of buried weed seeds. J. Exp. Bot. 20(63): 402-413.
West, D.C., H.H. Shugart and D.B. Botkin (1981) Forest succession: concepts and application. Pp.517. Springer-Verlag, New York, USA.
Whelan, R.J. (1995) The ecology of fire. Pp. 346. Cambridge University Press, Cambridge, USA.
White, P.S. (1979) Pattern, process, and natural disturbance in vegetation. Bot. Rev. 45: 229-299.
White, P.S. and S.T.A. Pickett (1985) Natural disturbance and patch dynamics: An introduction.Pp. 3-13. In: Pickett, S.T.A. and P.S. White (eds.) The ecology of natural disturbance and patchdynamics. Academic Press, Orlando, US.
Whitmore, T.C. (1984) Tropical rain forests of the Far East. Pp. 352. Claredon Press, Oxford, UK.
Whitmore, T.C. and D.F.R.P. Burslem (1998) Major disturbances in tropical rainforests. Pp. 549-566. In: Newbery, D.M., H.H.T. Prins and N. Brown (eds.) Dynamics of tropical communities. 37thsymposium of the British Ecological Society. Blackwell Science, Oxford, UK.
Whittaker, R.J., M.B. Bush and K. Richards (1989) Plant Recolonization and Vegetation Successionon the Krakatau Islands, Indonesia. Ecol. Monogr. 59(2): 59-123.
Whitten, A.J., S.J. Damanik, S.J. Anwar and H. Nazaruddin (1987) The ecology of Sumatra. Gad-jah Mada University Press, Yogyakarta, Indonesia.
Wich, S.A. and C.P. van Schaik (2000) The impact of el Niño on mast fruiting in Sumatra and else-where in Malesia. J. Trop. Ecol. 16(4): 563-578.
Wiens, J.A. and K.R. Parker (1995) Analyzing the effects of accidental environmental impacts:Approaches and assumptions. Ecol. Appl. 5(4): 1069-1083.
Williamson, G.B. et al. (2000) Amazonian tree mortality during the 1997 el Niño drought. Cons.Biol. 14(5): 1538-1542.
Wilson, B.F. (2000) Apical control of branch growth and angle in woody plants. Am. J. Bot. 87(5):601.
139
Woods, P. (1989) Effects of logging drought and fire on structure and composition of tropical forestsin Sabah Malaysia. Biotropica 21(4): 290-298.
Wooley, J.T. and E.W. Stoller (1978) Light penetration and light-induced seed germination in soil.Plant Physiol. 61: 579-600.
Wright, S.J. (1992) Seasonal drought, soil fertility and the species diversity of tropical forest plantcommunities. TREE 7: 260-263.
Wright, S.J. (2002) Plant diversity in tropical forests: a review of mechanisms of species coexis-tence. Oecologia 130: 1-14.
Yajima, T. (1988) Change in the terrestrial invertebrate community structure in relatin to largefires at the Kutai national park, East Kalimantan (Borneo), Indonesia. Pp. 63-81. In: Tagawa, H.and N. Wirawan (eds.) A research on the process of earlier recovery of tropical rain forest after alarge scale fire in Kalimantan Timur, Indonesia, Occasional paper no. 14, Research Center for theSouth Pacific, Japan.
Yang, S.D. and M.T. Tyree (1993) Hydraulic resistance in Acer-Saccharum shoots and its influenceon leaf water potential and transpiration. Tree Physiol. 12(3): 231-242.
Yeaton, R.I. (1988) Porcupines, fires and the dynamics of the tree layer of the Burkea africana sa-vanna. J. Ecol. 76: 1017-1029.
Young, K.R., J.J. Ewel and B.J. Brown (1987) Seed dynamics during forest succession in CostaRica. Vegetatio 71: 157-173.
Zagt, R.J. (1997) Tree demography in the tropical rain forest of Guyana. PhD thesis. Tropenbos-Guyana series 3. Georgetown, Guyana.
Zagt, R.J. and M.J.A. Werger (1998) Community structure and the demography of primary speciesin tropical rainforest. Pp. 193-220. In: Newbery, D.M., H.H.T. Prins and N. Brown (eds.) Dynam-ics of tropical communities. 37th symposium of the British Ecological Society. Blackwell Science,Oxford, UK.
Zedler, P.H. (1981) Vegetation change in chaparral and desert communities in San Diego County,California. Pp. 406-430. In: West, D.C., H.H. Shugart and D.B. Botkin (eds.) Forest Succession.Springer-Verlag, New York, USA.
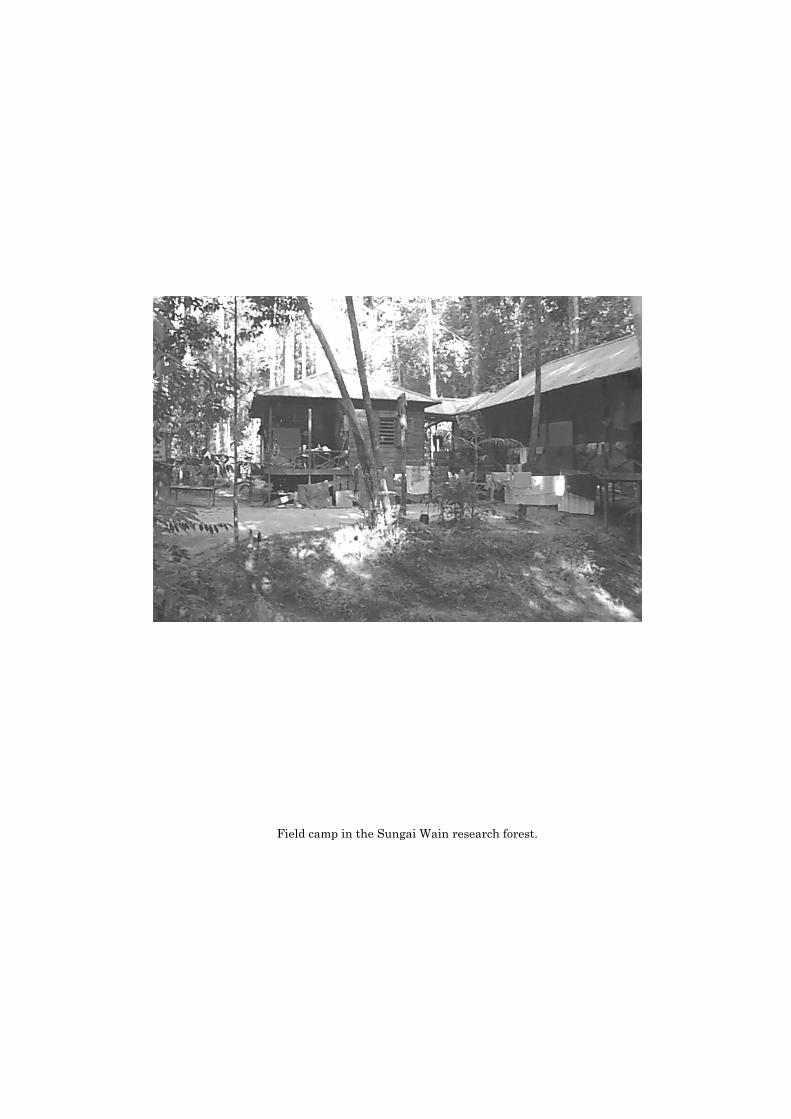
Field camp in the Sungai Wain research forest.
Acknowledgements
Originally focussing on the effects of forest fragmentation, I did not wish for a catas-trophe to engulf my research plots in East Kalimantan. Nevertheless, that event and mypresence at that place and time put me in a unique position, allowing me to study theeffects of a rare large-scale event from the very moment that it occurred.
However, it would have been virtually impossible to find a suitable study site if notfor Gabriella Fredriksson, who fought the fires and protected the Sungai Wain forestreserve. Building upon her dedication and determination, she and people from SungaiWain village managed to save the core of this forest. They cleaned the forest floor fromlitter by using palm leaves as broomsticks, thus creating a kilometres-long firebreak,which they patrolled for weeks on end. My debt therefore goes to Gabriella, who moreo-ver proved to be a pleasant companion with whom to share a research camp. My hopeand faith are that she will succeed in making an important contribution to the conserva-tion of some of the threatened pieces of nature on this earth.
If an unexpected fire and a fire break of unlikely narrowness enabled me to startthis research, the consistent involvement of many people was indispensable to bring theproject to a successful ending. I am greatly indebted to my promotor Marinus Werger forhis counsel throughout the whole endeavour, and for the freedom that I was given todevelop the project according to my own views. My other promotor, Jeff Sayer, im-pressed me by the promptness at which he spotted my face and arranged a meeting assoon as I dropped in at CIFOR, notwithstanding the myriad of directorial duties on hisagenda. I will always remember how, on one of his visits to Sungai Wain, a tremendousrainstorm surprised us in the middle of the forest. This, however, was of no concern toJeff, who declined the umbrella offered to him, informing us that he was testing a newpair of trousers which supposedly would dry up very quickly.
Probably the most indispensable contributions to the project were made by my two“day-to-day supervisors”, Wim Dijkman in the Netherlands and Douglas Sheil in Indo-nesia. Wim solved many logistic issues and provided a listening ear whenever disap-pointments threatened to accumulate beyond what I could cope with. Discussions withDoug were crucial in structuring the research, and several of his ideas were to occupykey positions in the design and execution of my experiments.
At different stages, also Heinjo During, Meine van Noordwijk, Herman Wijnne andRoderick Zagt provided very valuable technical advice. Tim Boyle, Andy Gillison, AnjaHoffmann, Paul Keßler, John Poulsen, Feike Schieving, Frank Sterck, Hans ter Steege,Wim Tolkamp and Rene Verburg acted as excellent sounding boards in diverse discus-sions.
Working in Indonesia was often logistically challenging. I have been very fortunatethat the CIFOR support staff were willing to deal with many bureaucratic issues and toassist in countless other ways. Above all I would like to express my gratitude to InnaBangun, Rosita Go, Norman MacDonald, Ismed Mahmud, Ramsey Omar, MurniatiSono, Kustiani Suharsono, Indah Susilanasari and Meilinda Wan for their helpfulnessand efficiency.
Also innumerable staff members at the International Ministry of Forestry(MOFEC)-Tropenbos Kalimantan Research Station (aku Wanariset Samboja) providedmuch appreciated assistance and scientific co-operation. I would especially like to thankAgustin, Arsad Anom, Riskan Efendi, Bas van Helvoort, Tinus de Kam, Mulyana Omon,Aldrianto Priadjati and Adi Susilo for their logistic involvement.
Setting up a network of 18 permanent sample plots was an endeavour too large for asingle person. Two research units from the Wanariset Samboja, namely the forest man-agement unit and the herbarium, were heavily involved. I thank the staff of the forestmanagement unit, particularly Marten Buntu, Antonius Kari Pakala, Yance Pitoy, and
142
Herry Prajitno for planting some 1900 reference poles in the forest, and for makingtopographic maps of the permanent plots. Having little knowledge of the local florawhen I arrived, the taxonomic expertise of the herbarium staff proved invaluable. Ithank Kade Sidiyasa, Ambriansyah, Arbainsyah, Zainal Arifin and Yan for the identifi-cation of several thousand trees. I thank Rien Beukema, Karl Eichhorn, Ferry Slik,Saskia Bodegom and Pieter Pelser for deploying their specialised expertise in the identi-fication of rogue specimens. Staff from the greenhouse nursery unit, in particular Ham-dansyah, meticulously maintained my seed germination experiments at the researchstation while I was in the forest. Panjul, Manis, Scizo, an aged Bearded Pig and ananonymous python are thanked for the unanticipated (and sometimes scary) encountersin the forest, which provided me with a wealth of stories to entertain my children in thefuture.
Special thanks go to my field assistants Nurdin Syah and Fathar Udin, who accom-panied me most of my time in the forest, lightening the atmosphere with a continuousflow of cheerful stories and jokes. They did most of the practical handiwork that formsthe foundations of this thesis, and they were always prepared to commit themselves toyet another labour-intensive experiment. Much appreciated field assistance was alsoprovided by Jake Paul, who unfortunately had to leave before he could see his hardwork go up in smoke, and Janneke Helleman and Claudia Vissers, who saw their re-search plans turned upside-down by the burnings before they had even got into the field.Syahrudin Laysa Putra helped me out when I was a pair of hands short in the finalmonths of my fieldwork.
Being required for my studies to stay on three different islands, I met hospitablepeople everywhere. In Bogor, Tina, Siti Nadiroh, and the other staff members made onealways feel at home in the CIFOR guesthouse. Gus Hellier and Nell Wilson let me sharetheir house with them, and taught me to appreciate the potion that is called “gin ‘n’tonic”. Jeff and Mireille, Meine and Kurniatun, Doug and Miriam, Rien and Fred, andCarmen made me feel at home in the expat community of Bogor. Ratna and co. providedhousing during my stay in Sumatra, and in East Kalimantan, I found the front door ofthe house of Tinus de Kam always open for more or less expected visits.
Back in the Netherlands, a long period of data analysis and writing laid ahead ofme. Fortunately, I encountered a lively group of enthusiastic Ph.D. colleagues, post-docs, and permanent staff who had created a pleasant working atmosphere. Thank youlong-time roommates Zeng Bo and Marielos Peña Claros, and corridormates Niels An-ten, Eric Arets, Roel Brienen, Wim Dijkman, Marjet Elemans, Gerrit Heil, ShirrinkaGoubitz, Tessa Pronk, Jacaranda van Rheenen, Simone Rose, Feike Schieving, MerelSoons, Marja van Staalduinen, Hans ter Steege, Frank Sterck, Bert van Ulft, Rene Ver-burg, Marinus Werger, Jo Willems and Roderick Zagt for the small talk during coffeebreaks and the discussions over lunch. I reserve a special word of gratitude for PieterZuidema, who actually wrote the initial research proposal that allowed me to do re-search in Indonesia. Among others, Leonard Bik, Bertus Ebbenhorst, and Hans deNooijer provided logistic support in the Netherlands.
Tot slot wil ik mijn familie en vrienden bedanken: Mijn vader en moeder voor deliefde die ze me hebben bijgebracht voor het buitenleven en de natuur, waarin ver-moedelijk de basis is terug te vinden voor mijn voorkeur te verdwalen op onhandig ge-plande expedities in het oerwoud. Mijn vader, moeder en Anneke voor hun liefde alsoppas-opa en oma’s. Michiel, Suzanne, Joris, Mira en Jeroen voor de emails, brieven enpakjes die hun weg vonden naar mijn hutje in het bos. En Judith, die altijd met enge-lengeduld wachtte tot ik weer terugkwam naar Nederland, die vasthoudend iederenieuwe onderzoeksplek bezocht die ik had uitgekozen, en die de moed er in wist tehouden bij de verschillende kleine en grotere rampen die in de loop der tijd passeerden.Zonder haar ondersteuning zou ik er lang geleden de brui aan hebben gegeven. Bovenalprijs ik mij gelukkig omdat Judith, Simone en sinds kort Hajo een welkomscommiteevormen waar ik na iedere werkdag weer naar uitkijk!

Curriculum vitae
Mark van Nieuwstadt was born in Breda, the Netherlands on the 29th of June, 1970.He received his secondary education at the Onze Lieve Vrouwe Lyceum in Breda. Afterobtaining his high school degree in 1988, he studied Biology at Utrecht University, spe-cialising in plant ecology and animal ecology. He investigated long-term vegetation dy-namics of calcareous grasslands in Southern Limburg, and did research on the foragingbehaviour of tropical bees in Costa Rica (Central America). Both studies resulted inpublications in international scientific journals. He graduated cum laude in 1993.
After graduating, Mark took up a post as associate expert in the Proyecto Regionalde Apicultura y Meliponicultura (PRAM) at the Universidad Nacional (UNA) in CostaRica. He assisted in the development of research programs on pollination and the for-aging behaviour of bees. Responsibilities included the supervision of M.Sc. studentsfrom throughout the region, and the development of a methodology for palynologicalanalysis of honey and pollen samples. Based on these activities several papers werepublished.
In August 1996 he accepted a Ph.D. position at Utrecht University in a cooperationprogram with the Center for International Forestry Research (CIFOR) in Indonesia. Theresearch was done at the Wanariset Samboja research station in East Kalimantan,which is managed by Tropenbos International and the Indonesian Ministry of Forestry(MOF). During the first 1.5 years, his research focussed on the effects of forest fragmen-tation on populations dynamics of shade tolerant trees. The continuation of this re-search was impeded by extensive fires in March 1998, which burned the largest part ofthe forest in the research area. Adjusting his research to the new circumstances, hestudied vegetation dynamics after forest fire in the four years that followed.
Publications
Biesmeijer, J.C., M.G.L. van Nieuwstadt, S. Lukács and M.J. Sommeijer (1998) The role of internaland external information in foraging decisions of Melipona workers (Hymenoptera: Meliponinae).Behav. Ecol. Sociobiol. 42: 107-116.
van Nieuwstadt, M.G.L. and J.F. Ramirez (1994) Uso de colmenas para la polinización de cultivos:plaguicidas y el uso de un contrato. In: van Veen, J.W., H.G. Arce & A. Ortiz (eds.) Apicultura: es-trategias para el manejo adecuado de las colmenas, Memorias del tercer congreso nacional deapicultura, Costa Rica (In Spanish).
van Nieuwstadt, M.G.L. and C.E. Ruano Iraheta (1997) Relation between size and foraging rangein stingless bees (Apidae, Meliponinae). Apidologie 27: 219-228.
van Nieuwstadt, M.G.L., L.A. Sanchez C., J.C. Biesmeijer, H.G. Arce A. & M.J. Sommeijer (1997)Foraging behaviour of stingless bees: are their diets really so diverse? In: Mardan, M. et al. (eds.)Tropical bees and the environment. Proceedings of the Conference on tropical bees and the envi-ronment, Malaysia 1995. Beenet Asia, Universiti Pertanian Malaysia, Southbound.
van Nieuwstadt, M.G.L., D. Sheil and K. Kartawinata (2001) The ecological consequences of log-ging in the burned forests of East Kalimantan, Indonesia. Cons. Biol. 15(4): 1183-1186.
Willems, J.H. and M.G.L. van Nieuwstadt (1996) Long-term after effects of fertilization on above-ground phytomass and species diversity in calcareous grassland. Journal of Vegetation Science 7:177-184.