THE KENYAN DAIRY VALUE CHAIN - Utrecht University Student ...
109
THE KENYAN DAIRY VALUE CHAIN Promoting inclusive and climate smart dairy production Master thesis by D.M. (Vera) Vernooij
-
Upload
khangminh22 -
Category
Documents
-
view
0 -
download
0
Transcript of THE KENYAN DAIRY VALUE CHAIN - Utrecht University Student ...
THE KENYAN DAIRY VALUE CHAIN Promoting inclusive and climate smart dairy production
Master thesis by D.M. (Vera) Vernooij


5
Master thesis
By: D.M. (Vera) Vernooij
Email: [email protected]
As part of the program Sustainable Development
Track: International Development
Utrecht University, Faculty of Geosciences
Supervisor: Dr. A.C.M. (Guus) van Westen
Email: [email protected]
Second reader: Dr. B. J. (Bram) van Helvoirt
Email: [email protected]
Handed in on October 27, 2016
Internship at:
Center for International Forestry Research
Eastern and Southern Africa Hub
UN Avenue, Gigiri, Nairobi, Kenya
Supervisor: Dr. G.C. (George) Schoneveld
Email: [email protected]
This research was funded by the Climate Change Agriculture and Food Security (CCAFS)
program of the CGIAR, under the project “Mitigation in livestock and LED pathways”.
Cover photo: woman feeding cow. Photo credits: East African Dairy Development Project. Obtained on March 29,
2016 from: https://www.flickr.com/photos/51193564@N05/4909685415/

6
7
Summary This thesis answers to the following research question: How to promote an increase in cow milk
production in an environmentally sustainable - and inclusive way for smallholder dairy producers in Nandi – and
Bomet counties, Kenya? This is done through a mixed method research design mostly consisting of
stakeholder interviews and a producer survey. Promoting an increase in cow milk production in
an environmentally sustainable way requires first of all an understanding of barriers to the uptake
of improved practices. The main technical barriers are related to knowledge on feeding,
reproduction cycles of the cow, and breeding. Socio-cultural barriers are related to the value
people attach to cows and food - over feed crops. Promoting an increase in cow milk production
in an inclusive, pro-poor, way, either means to promote a push from informal to formal; and to
improve the unreliable character of the informal sector. In order to promote a push from
informal to formal, the main benefit of participating in informal markets need to be created in the
formal sector as well, which are a combination of the payment structure, which is often daily or
weekly and in cash, and accessibility as milk is picked from the farm or from collection points
along the road very close by. Therefore alternative payment schemes need to be developed and
the accessibility and visibility of the formal sector needs to be improved. Further, the
requirements to enter the formal market, which are quality standards and hygiene procedures
regarding handling of the milk, form barriers to entry. Ways to incentivize smallholder producers
to comply to the desired quality and hygiene practices are provisioning and explaining of (how to
use the) correct materials. Crucial is the attention that needs to be paid to territorial
embeddedness of chain activities. This study revealed differences on a local level with regards to
the presence of certain actors in particular places, which has different impacts on the value chain
dynamics.

8
Preface When I was 11 years old I did a small school assignment about milk. I joined the milkman and
visited the processing factory to find out what happens to the milk of my parents cows. My mom
reminded me of that during the process of writing my thesis, as surprised as me that years later I
end up doing something slightly similar. A few weeks ago, 13 years later, I joined my dad and
brother for the second time to the same (but modernized) milk factory, again curious to what
happens to the milk of my parents - and someday hopefully my brothers cows.
The path I was enabled to take between the first and second time I visited the milk
factory has not been an evident one. With a fascination for everything that was far away and
different from my own surroundings, later leading me obtain a bachelor’s degree in cultural
anthropology and development sociology, I did not show much interest in agriculture or the
cows at home.
A growing interest in environmental studies fueled by a concern about limits to resources
led me to issues of land management and agriculture. In the Sustainable Development –
International Development master program at Utrecht University, I found my main fascination
for people combined with tools for further exploring these - to me - new fields. I soon learned,
realized, and experienced that the most vulnerable are the first to suffer from the consequences
of climate change, and I decided I wanted to learn more about what I could do and how I could
assist to limit the damage.
In my motivation letter as part of the application to the internship at CIFOR that enabled
me to conduct this research, I said that being able to conduct my thesis research to the given
topic embodies all that I had hoped to learn and be able to do when I started studying back in
2010, and in particular when I started this master’s program in 2014. A continuing passion for the
topic and (honestly) joy till the last days of writing this report shows that I am satisfied and that I
could hardly have tried harder. I am grateful for all that has contributed to and enabled me to
write this today, and I thank my family, friends, colleagues, supervisors for having played a part in
this.
Particular gratitude goes to all participants of this research as without them this report would be
non-existent, kongoi mising, asante sana. Your cooperation, hospitality, openess: I have enjoyed
every bit of it. I have learned more from you then I could ever return, and I can not wait to taste
fresh mursik again.
In specific I want to sincerely thank the lovely Doris Chepkemboi and Nathan Kiplagat
Maiyo, research assistants and friends. You both amazed me with the daily updates on the
experiences from the field, showing bright minds and a passion for the topic. It is admirable how
you managed to reach the targets by very hard and decent work; I know it was not always easy
and I appreciate your consistent professional attitudes. Both of your perceverance is an
inspiration to me and I enjoyed working with you so much. Kongoi mising.
A special thanks also to my friend Shadrack Kirong, student at the University of Nairobi
and staff member of the agricultural department of Nandi county. At the end of the first day I
met him he had already arranged transportation and two possible research assistants. Kongoi
missing, I hope I can return the many favors some day.
In general, I can not thank county staff in particular of the agricultural departments in
Nandi – and Bomet and the transportation deparment of Nandi county enough. The latter literaly

9
enabled conducting the surveys. Without their permission, approval and support of the plans this
would not have been possible.
Then, if it wasn’t for my supervisors I am prety sure I would have had the ‘help-I’m-lost’-
feeling more often than I had now. Dr. Guus van Westen of Utrecht University, bedankt for both
positive – and critical notes and feedback, and for trusting in me by awaiting the results. It was a
pleasure being supervised by you.
Dr. George Schoneveld of the Center for International Forestry Research, during the data
analysis I sometimes wondered what I got myself into with statistical tests, but when you had
explained and showed it to me back in Nairobi, it seemed so doable so I continued trying. That
to me characterizes your supervision: if I was on the verge of not knowing where to start or
continue you reminded me of the bigger picture, that it is feasible, and gave me advise on how to
continue. Thank you for this opportunity and your trust. You pushed me to healthy limits, I have
enjoyed it and learned a lot, dankjewel.
Additional thanks also to all staff and scientists at the Center for International Forestry
Research, Nairobi, Kenya. I am lucky to have had such an amazing opportunity and to get to
know you. Your assistance has helped me a lot. The fieldwork budget through CIFOR enabled
the data gathering; it is not common for a master student researcher to have access to funds or a
budget, and I realise the huge advantage this gave me, as well as responsibility, and I am grateful
for that.
I would also like to thank scientists at the International Livestock Research Center in
Nairobi, Kenya, for providing literature that forms the basis of this study, opportunities for me to
get useful input, and friendly meetings. It was truly a pleasure.
Last but not least, I thank my friend from the master program and collegue at CIFOR
Peter Jopke. It was good having a friend around. I enjoyed the talks and discussions we had and
they contributed to decisions I made in the process of this research, danke schön.
October 25, 2016
Vera Vernooij
Utrecht, the Netherlands
Picture with Nathan and Doris by Stanley Chirchir at the Annual field day
and exhibion at Kaimosi Agricultural Training Center in the beautiful
highlands of Nandi county on July 20, 2016.

10
Acronyms
AI Artificial insemination
AR4D Agricultural Research for Development
ASAP Adaptation for Smallholder Agriculture Program
CIFOR Center for International Forestry Research
CSA Climate Smart Agriculture
EADD East Africa Dairy Development Program
FAO Food and Agriculture Organization of the United Nations
GCF Green Climate Fund
GHG Green House Gasses
GPN Global Production Networks
GoK Government of the Republic of Kenya
HCA Hierarchical Cluster Analysis
IFAD International Fund for Agriculture Development
ILRI International Livestock Research Institute
KES Kenyan Shillings
LEDS Low Emission Development Strategies
NAMA Nationally Appropriate Mitigation Actions
New KCC New Kenya Co-operative Creameries
PRA Probit Regression Analysis
SDP Smallholder Dairy Project
SI Sustainable Intensification
UNFCCC United Nations Framework Convention on Climate Change
VCA Value Chain Analysis
VC Value Chain

11
Table of contents
SUMMARY 7
PREFACE 8
ACRONYMS 10
TABLE OF CONTENTS 11
LIST OF FIGURES 13
LIST OF TABLES 14
INTRODUCTION 16
LEDS AND NAMA 19
THEORY 21
GLOBAL PRODUCTION NETWORKS AND RELATED APPROACHES 21 DEFINITIONS OF MAIN CONCEPTS 22 VALUE CHAIN GOVERNANCE 26 TYPES OF UPGRADING 28 SUSTAINABLE INTENSIFICATION AND CLIMATE SMART AGRICULTURE 29
METHODOLOGY 30
METHODS 30 EPISTEMOLOGY AND ONTOLOGY 30 DATA COLLECTION 31 OPERATIONALIZATION 34 DATA ANALYSIS 34 RELIABILITY AND VALIDITY 35 LIMITATIONS 35
CHAPTER 1: THE DAIRY VALUE CHAIN 36
DAIRY PRODUCERS 36 HOUSEHOLD CHARACTERISTICS 36 MILK PRODUCTION 37 FARMING PRACTICES 39 COOLING PLANTS 40 PROCESSORS 42 INPUTS 44 OUTPUT MARKETS 46
CHAPTER 2: TYPOLOGY OF SMALLHOLDER DAIRY FARMERS 48
HIERARCHICAL CLUSTER ANALYSIS 48 SELECTION OF VARIABLES 48 CLUSTERS 50
CHAPTER 3: MARKET ORIENTATION AND PARTICIPATION OF SMALLHOLDER DAIRY PRODUCERS 56
MARKET ORIENTATION 56

12
FACTORS THAT INFLUENCE MARKET ORIENTATION 58
CHAPTER 4: GOVERNANCE IN THE CHAIN 63
HORIZONTAL COORDINATION 63 VERTICAL COORDINATION 63 PRICES 66 TYPES OF GOVERANCE 67 TERRITORIAL EMBEDDEDNESS 69
CHAPTER 5: BARRIERS TO THE ADOPTION OF CLIMATE SMART AGRICULTURAL PRACTICES 73
CHAPTER 6: PROMOTING MORE INCLUSIVE STRATEGIES FOR DAIRY CHAIN DEVELOPMENT 75
CONCLUSIONS 78
DISCUSSION 81
BIBLIOGRAPHY 83
APPENDIX 85
OVERVIEW OF COLLECTED DATA 2016 85 NAIROBI 85 NANDI 85 BOMET 85 DAIRY PRODUCER SURVEY QUESTIONS 87 AGROVETSTORE SURVEY QUESTIONS 92 OUTPUTS HIERARCHICAL CLUSTER ANALYSIS SPSS 93 CASE PROCESSING SUMMARY AND PARAMETER ESTIMATES PROBIT SELL FORMAL 103 CASE PROCESSING SUMMARY AND PARAMETER ESTIMATES PROBIT SELL INFORMAL 107

13
List of figures Figure 1 Agro-ecological zones in Kenya (National Environment Management Authority, 2010: 112).
......................................................................................................................................................... 17 Figure 2 Nandi (N) - and Bomet (B) county, Kenya, East Africa (adjusted from d-maps, 2016). ......... 18
Figure 3 Four links in a simple industrial value chain (Kaplinsky and Morris, 2001: 4)........................ 22
Figure 4 A value chain map of the Kenya dairy value chain in 2002 (Ngigi et al. 2010, in Haggblade et
al., 2012: 9). ...................................................................................................................................... 23 Figure 5 A framework for GPN analysis (Henderson et al., 2002: 448). ............................................. 25
Figure 6 Examples of legislative, judicial and executive value chain governance (Kaplinsky, 2000:
125). ................................................................................................................................................. 27 Figure 7 Four categories of upgrading (Humphrey and Schmitz, 2001 in Kaplinsky et al., 2002: 5). ... 28
Figure 8 Nandi - (left) and Bomet county (right) and sample locations of the smallholder dairy
producers in orange dots, following the numbers as presented in table 4. .......................................... 33 Figure 9 Locations of New KCC in Kenya, not on the map is a location in Mombassa. Indicated with
colors are the three locations in Nandi – and Bomet county (adjusted from
www.newkcc.co.ke/branches-2 on October 5, 2016).......................................................................... 43 Figure 10 Location of the only chilling – and processing plant of Brookside Dairy LTD (adjusted from
Google Maps). .................................................................................................................................. 44 Figure 11 Geographical differences between who sells to middlemen (left), farmers organizations
(middle), and individual costumers (right) in Nandi county. ................................................................ 69 Figure 12 Geographical differences between favorite marketing channel, middlemen (left, light-yellow
dots), farmers organizations (middle), individual costumers (right), in Nandi county. .......................... 70 Figure 13 Geographical differences between who sells to middlemen (left), farmers organizations
(middle), and individual costumers (right) in Bomet county. ............................................................... 71 Figure 14 Geographical differences between favorite marketing channel, middlemen (left, light-yellow
dots), farmers organizations (middle), individual costumers (right), in Bomet county. ......................... 71

14
List of tables Table 1 General characteristics and crop suitability of the agro-ecological zones (Jaetzold et al., 2009
in National Environment Management Authority, 2010: 111). ............................................................. 17 Table 2 Key determinants of global value chain governance, obtained from Gereffi et al. (2005: 87). 27
Table 3 Reasons for sampling the wards. ......................................................................................... 32
Table 4 Overview of collected dairy producer surveys. ...................................................................... 33
Table 5 Overview of collected agrovetstore surveys. ......................................................................... 33
Table 6 Main source of income for smallholder dairy producers in Nandi - and Bomet county. ........... 36
Table 7 Household income categories for smallholder dairy producers in Nandi - and Bomet county. 36 Table 8 Composition of cattle herd in Nandi- and Bomet county. ....................................................... 37
Table 9 Dairy cattle and milk production county data from Nandi and Bomet. .................................... 37
Table 10 First, second, and third ideas of smallholder dairy produers in Nandi – and Bomet county on
how to increase milk production. ....................................................................................................... 38 Table 11 Main limitation according to smallholder dairy producers to increase milk production. ......... 38
Table 12 Who detects if a cow is in heat. .......................................................................................... 39
Table 13 What is done when a cow is in heat. ................................................................................... 39
Table 14 Cattle feeding in the dry - and rainy season. ....................................................................... 39 Table 15 Method of grazing in the dry - and rainy season.................................................................. 39
Table 16 Where the cattle grazes in dry - and rainy season. ............................................................. 40
Table 17 Overview of management, locations and capacity of coolers in Nandi county. ..................... 41
Table 18 Overview of management, locations and capacity of coolers in Bomet county. .................... 41
Table 19 Number of functional coolers and total capacity (L) of Nandi – and Bomet county. .............. 42
Table 20 Avarage distance to cooling plant per ward for sampled dairy producers............................. 42
Table 21 Most popular products bought by dairy producers according to agrovetstore employees
(N=10). ............................................................................................................................................. 45 Table 22 Household consumption and selling of milk. ....................................................................... 46
Table 23 Gender: milk marketing and managing of money. ............................................................... 47
Table 24 Percentages on what on average is done with morning and evening milk. .......................... 47
Table 25 Types of variables used for the HCA. ................................................................................. 50
Table 26 Case Processing Summary of HCA. ................................................................................... 50
Table 27 Results of test of Homogeneity of Variances. ...................................................................... 51
Table 28 Descriptives from One-Way Anova. .................................................................................... 51
Table 29 ANOVA output table. .......................................................................................................... 52 Table 30 Multiple Comparisons table One-Way Anova. ..................................................................... 53
Table 31 Overview of the smallholder dairy producer groups as produced by a HCA in terms of
favorable scores on the selected variables. It is assumed that the lower the total score the better. ..... 55 Table 32 Descriptive statistics One-Way ANOVA formal and informal selling of milk. ........................ 56
Table 33 ANOVA output table formal and informal milk selling. ......................................................... 57
Table 34 Test of homogeneity of variances formal and informal milk selling. ..................................... 57
Table 35 Pseudo R-Square probit sell formal. ................................................................................... 58

15
Table 36 Parameter estimates probit sell formal. ............................................................................... 59
Table 37 Pseudo R-Square probit sell informal. ................................................................................ 60
Table 38 Parameter estimates probit sell informal. ............................................................................ 60
Table 39 Off-take arrangements smallholders with their milk buyers.................................................. 64
Table 40 Term and way in which smallholders are paid by their milk buyers. ..................................... 64
Table 41 New KCC producer prices as of March 1, 2016, on April 28, 2016 for Eldoret and Sotik
clusters (including Kapsabet). ........................................................................................................... 66 Table 42 Milk prices farmers’ organizations, processors and middlemen. .......................................... 66
Table 43 Geographical dispersion of perceived main problem to increase milk production according to
smallholders in Nandi - and Bomet county. ........................................................................................ 72

16
Introduction ‘Humanity is called to take note of the need for changes in lifestyle and changes in methods of
production and consumption to combat this warming, or at least the human causes that produce and accentuate it.’ - Pope Francis, 2015 (in Kirchgaessner and Hooper, 2015).
Due to climatic circumstances and environmentally damaging farming practices, in combination
with an increasing population reaching its peak in 2050, soils are degrading. This leaves us with a
daunting task in terms of food security: how to feed our planet? In addition, food consumption
patterns are changing due to increasing welfare, which leads to people’s desire to consume more
food in general, and more animal products (Campbell et al., 2014). Providing food security
requires agricultural lands. In order to not further degrade soils while meeting food demands,
agricultural intensification needs to be happening in an environmentally friendly manner.
Therefore, there is a need for sustainable intensification (SI), and ‘Climate Smart Agriculture [CSA]
provides the foundations for incentivizing and enabling intensification’ (ibid.: 39).
CSA offers ways to sustainably intensify agricultural production while at the same time
reducing Green House Gas (GHG) emissions per unit of output. A wider adoption of CSA
practices is therefore needed to meet the challenges of current food insecurity and in order to
sustain and protect our environment and its ecosystem services. Considering the adoption of
CSA practices, considerable gains are to be made in the developing world, where agriculture is
dominated by smallholder producers, playing an important role in many rural livelihoods, and
where food security is a pressing issue.
Of all agricultural sectors, the livestock sector is considered to be one of the leading
contributors to an increase in environmental degradation. Livestock production globally accounts
for 70% of the total agricultural land use and therefore has immense land -, water - and carbon
footprints (Bosire et al., 2016). This is largely accounted for by the dairy sector. In addition, the
average annual growth rate for consumption of milk and dairy products is 2.1% for developing
countries, with the highest average for Sub-Saharan Africa with 2.5% according to the Food and
Agriculture Organization of the United Nations (FAO, 2013: 31), estimated for the period from
2005/2007 to 2030. The highest average annual growth rates in the production of milk and dairy
products for the same time span are also to be found in developing countries (2.1%), in particular
in Sub-Saharan Africa (2.4%).
In eastern Africa, over 85% of the dairy cattle population resides in Kenya (Thorpe et al.,
2000). Smallholders, owning one to three dairy cows, account for about 80% of the milk
production in Kenya (Makoni et al., 2013: 101). Livestock is therefore an important livelihood
asset for many Kenyan rural residents; focusing intensification strategies on smallholder dairy
producers offers development potential. A recent scenario analysis shows that milk production
could be expanded by 51% in Kenya using the currently available cropland and that milk
production could be increased by up to 80% by increasing productivity and using additional
cropland for livestock production (Bosire et al., 2016). The potential of the Kenyan dairy sector
to increase production to meet consumer demands of the growing population and enhance
livelihood benefits, combined with the environmentally damaging aspects of dairy systems, has
not gone unnoticed.
In the context of recent Low Emission Development Strategies (LEDS), the Center for
International Forestry Research (CIFOR) and the International Livestock Research Institute
17
(ILRI) are currently working on a project called ‘Greening Livestock: Incentive-based interventions for
reducing the impact of livestock in East Africa’. Also, currently the Government of the Republic of
Kenya (GoK) is developing a strategy for Nationally Appropriate Mitigation Action (NAMA) for
the dairy sector (more on the LEDS and NAMA below). This indicates a need for strategies to
decrease the output of GHG’s in the Kenyan dairy sector while enhancing livelihood benefits;
this study aims to meet this need by analyzing the dairy value chain in Kenya.
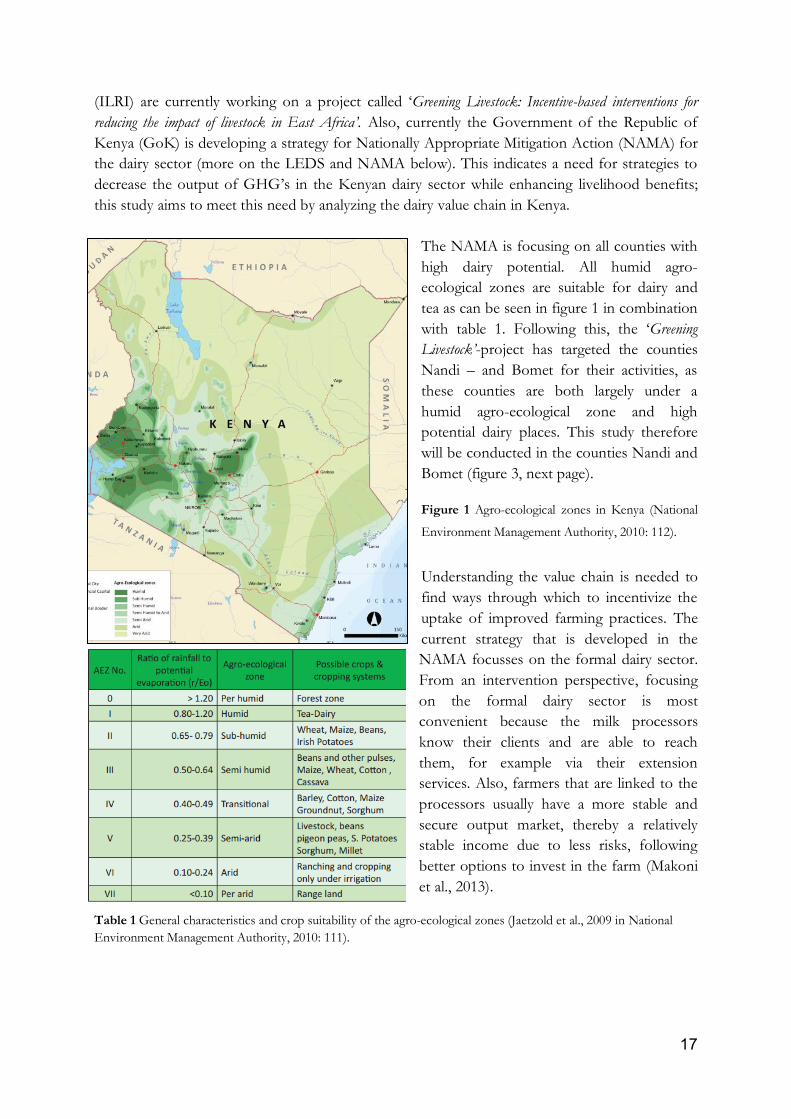
The NAMA is focusing on all counties with
high dairy potential. All humid agro-
ecological zones are suitable for dairy and
tea as can be seen in figure 1 in combination
with table 1. Following this, the ‘Greening
Livestock’-project has targeted the counties
Nandi – and Bomet for their activities, as
these counties are both largely under a
humid agro-ecological zone and high
potential dairy places. This study therefore
will be conducted in the counties Nandi and
Bomet (figure 3, next page).
Figure 1 Agro-ecological zones in Kenya (National
Environment Management Authority, 2010: 112).
Understanding the value chain is needed to
find ways through which to incentivize the
uptake of improved farming practices. The
current strategy that is developed in the
NAMA focusses on the formal dairy sector.
From an intervention perspective, focusing
on the formal dairy sector is most
convenient because the milk processors
know their clients and are able to reach
them, for example via their extension
services. Also, farmers that are linked to the
processors usually have a more stable and
secure output market, thereby a relatively
stable income due to less risks, following
better options to invest in the farm (Makoni
et al., 2013).
Table 1 General characteristics and crop suitability of the agro-ecological zones (Jaetzold et al., 2009 in National
Environment Management Authority, 2010: 111).

18
It is however estimated that about
60% to 70% of all marketed cow
milk in Kenya is sold via informal
market channels in raw form, and
that the formal cow milk market is
estimated to ‘only’ take up 32% of
marketed milk. The informal
marketing channels have
advantages as well, in particular for
the ones that produce least, and
sell small quantities of milk. This is
because the informal market is
relatively easy accessible, because
direct payments of cash (instead of
weekly or monthly by cooperatives
and processors), and because of
the acceptance of lower quality
milk (Makoni et al., 2013). A value
chain analysis (VCA) is therefore proposed in order to get an understanding of the different
formal and informal marketing channels, and how the benefits are distributed along the chain. A
VCA offers important insights into issues about participation in product markets, and to the
possibilities to create more equal integration and distribution of benefits in product chains
(Kaplinsky and Morris, 2001: 1-2).
As current initiatives focus on the formal dairy sector for the uptake of improved
practices, it is important to find out what barriers to integration in the formal sector there are.
Previous studies have tried to find out about these barriers (Wanjala and Njehia, 2014; Burke et
al., 2015; Mutura, Mwangi et al. 2016, Mutura, Nyairo et al. 2016, Moturi et al., 2015). However,
according to Mutura, Nyairo et al. (2016: 4) ‘The socio-economic factors that determine vertical and
horizontal integration among smallholder dairy farmers have not been exhaustively analyzed’. This is a gap in
the literature that this study will contribute to.
It should however not be assumed that the formal market is better than the informal
market. The advantages and disadvantages of both the formal – and informal market are more or
less known, but more is to be learned as to why smallholders sell their milk the way they do, and
what their position is in the value chain in relation to other actors. The focus of this study is
therefore on the position of smallholders in the chain. As there are different types of
smallholders, a typology will be created.
Given the societal – and scientific background, the research objective of this study is to
identify how smallholder dairy producers can enhance productivity and environmental
sustainability in a manner that enhances livelihood benefits.
The following main research question and sub questions are formulated:
Figure 2 Nandi (N) - and Bomet (B) county, Kenya, East Africa (adjusted from d-maps, 2016).

19
How to promote an increase in cow milk production in an environmentally sustainable -
and inclusive way for smallholder dairy producers in Nandi – and Bomet counties?
i. How is the dairy value chain structured in Nandi – and Bomet county?
ii. What smallholder dairy producer groups can be created?
iii. How is each of the smallholder dairy producer groups articulated to the milk
market?
iv. What factors shape participation in (in)formal markets?
v. How are the relationships between different actors in the chain?
vi. What barriers to the uptake of climate smart agricultural practices do smallholders
face?
vii. What is the potential for upgrading in the chain?
The scientific relevance of this study will be that it will provide an understanding of the dairy
value chain in western Kenya, in particular about what types of smallholder dairy producers there
are, where they sell their milk and why, what their relation is with the actors in the different
output channels, how they are connected to inputs, what the barriers to entering the formal
sector are, and if it is desired for smallholders that are not part of the formal sector, to become
part of the formal sector. It thereby provides answers to the current literature gap as identified
earlier.
The societal relevance of this research is that it contributes to the second component of
the ‘Greening Livestock’ project (further elaborated upon in the Background below), which aims at
sustainably intensifying dairy production via CSA practices, thereby enhancing smallholder’s
income, economic development, and realizing relatively less emissions of GHG per unit of
output. The study further contributes by examining how the current NAMA strategy with its
focus on the formal sector can be more inclusive, i.e. how can as much smallholder dairy
producers as possible contribute from investments in the dairy sector, including the smallholders
that are not part of the formal sector. Following this, the main societal relevance of this study is
to contribute to finding ways for smallholder dairy producers in Kenya to enhance productivity in
a climate-smart way while also enhancing livelihood benefits.
Following the introduction, a Theory section will introduce the main theoretical framework as
well as the main concepts underlying this study. The Methodology section will follow, presenting
the methods used, epistemological – and ontological considerations, the type of data collected,
how the data is collected and analyzed and the main limitations of the study. The sub questions
guide the structure of the results Chapters 1, 2, 3, 4, 5 and 6 followed by Conclusions and a
Discussion where the research questions will be answered and reflected upon.
LEDS and NAMA The societal relevance of this study follows the current developments with regards to the LEDS
and NAMA. In the context of the LEDS, CIFOR and ILRI are working on the ‘Greening Livestock’
project. The project is funded by the International Fund for Agricultural Development (IFAD),
and is prepared for the Agricultural Research for Development (AR4D) program. The objectives
of the project align with the IFAD Adaptation for Smallholder Agriculture Program (ASAP) and
20
are ‘to provide smallholders with options to improve productivity while contributing to a reduction in the climate
footprint of livestock production in East Africa’. The project specific goal is to ‘support public and private
sector CSA interventions that promote productive livestock systems that reduce the livestock sector’s emissions and
improve alignment with national LEDS’ and the main project objective is ‘to identify, test and promote
promising CSA strategies (technical and institutional) with an appropriate framework for Monitoring, Reporting,
and Verification (MRV) in Kenya and Tanzania.’
The project is structured into three components: (1) Baseline and identification of
promising Climate Smart Agriculture (CSA) interventions; (2) Social and institutional analysis to
identify appropriate interventions to promote the uptake of Climate Smart Agriculture (CSA);
and (3) Experimentation and MRV testing (CIFOR and ILRI 2015). This study contributes
directly to the second component of the program. More specifically, the aim of the second
component of the project is to identify incentive based interventions that are appropriate to
different types of livestock production systems and will be effective in promoting the uptake and
up scaling of best CSA practices, as identified under the first component of the project. This
follows the identification of financial, social, market, and technical barriers to the adoption of
promising CSA practices and land use and forest initiatives. Politically and economically viable
CSA intervention options will be identified, that are appropriate to different types of livestock
production systems (CIFOR and ILRI, 2015).
Also, currently the GoK is developing a NAMA for the dairy sector. NAMA are
strategies designed to reduce GHGEs in economic sectors with large carbon footprints. One of
the three NAMA sectors in Kenya is dairy. The development of the NAMA is lead by the
Germany based consultancy UNIQUE forestry and land use and also involves partners such as
the FAO, the Kenyan Dairy Board, ILRI, CIFOR, Kenyan milk processors, and banks. Currently
the GoK is in the process of applying for money from the Green Climate Fund (GCF), a
financial mechanism under the United Nations Framework Convention on Climate Change
(UNFCCC), established by 194 governments to ‘limit or reduce greenhouse gas emissions in developing
countries, and to help adapt vulnerable societies to the unavoidable impacts of climate change’
(https://www.greenclimate.fund/home). The GoK requests this money for the implementation
of the NAMA. If money from the GCF will become available for the dairy sector, more
knowledge on dairy value chains and practices in the counties that are part of the implementation
(among which are Nandi – and Bomet counties) is likely to result in more optimal social-,
economic- and environmental returns of investments.
As became clear from the attended NAMA stakeholder workshops in March and on
August 9, 2016 in Nairobi, the capital of Kenya, the current strategy focusses on the formal dairy
sector and is characterized by private-led development. As most smallholder dairy producers are
not part of the formal dairy sector, the challenge is to create a strategy that is inclusive, i.e. a pro-
poor strategy. The assumption is that people that are connected to the formal sector are better
off than smallholders who are not. The challenge then lies in making sure more smallholders are
part of the formal sector, or, as the informal sector has its advantages over the formal sector, to
adapt the strategy to also have a focus on informal sector development. This study aims to
inform that strategy.

21
Theory In this section a short background of the main theories is explained, why the theories are
appropriate, how they are used, and the main concepts are defined. Differences in how
governance along value chains is exercised matters for the upgrading prospects of producers in
developing countries (Humphrey and Schmitz, 2000). The framework of Henderson et al. (2002)
on Global Production Networks (GPN) will be used to explore issues of governance between
actors, in particular by looking at territorial – and network embeddedness of smallholder
producers in the dairy value chain. Then, types of upgrading are introduced. In the context of the
NAMA as introduced in the introduction, particular interest is in process – and chain upgrading
(Kaplinsky et al., 2002).
Global Production Networks and related approaches Henderson et al. (2002: 438) outlined an analytic framework called the GPN ‘…in order to
understand the dynamics of development in a given place. This then according to them requires to
‘comprehend how places are being transformed by flows of capital, labour, knowledge, power etc. and how, at the
same time, places are transforming those flows as they locate in place-specific domains’. This analytic framework
of the GPN is the main theoretical basis of this study.
Before further explaining the GPN framework, a short introduction to the related approaches of
the GPN is desired. First of all there is the Value Chain Analysis (VCA). As the VCA is at the
basis of the GPN and as its main concepts are also used in GPN, first the VCA analysis is
introduced, followed by points of critique and the differences with the GPN.
VCA derives from traditional sectorial analysis. VCA overcomes the weaknesses of this
traditional analysis which tends to be static (Kaplinsky and Morris 2001). VCA also emerged to
offer a counterweight to market assessments of large agribusiness firms for internal strategic
plans by providing an analysis on behalf of the rural poor, which are often the least powerful
members of the global value chain. VCA’s emergence was further led by the desire to find a tool
that was able to show where and how participants could maximize value, introduce efficiencies,
and reduce costs, in order for it to be used as a tool for competitiveness (Haggblade et al., 2012).
The main value chain dynamics occur because of shifts in market demand such as urban market
growth, increasing export markets, on-farm consumption requirements, and policies, and/or
because of shifts in technology or other factors affecting supply such as new technologies, large
firm investments, grades and standards, and labor market changes (ibid.). Regarding agricultural
value chains, VCA ‘provides a framework for understanding the structural connective tissue linking small
farmers with input suppliers, processors, traders and final consumers’ (ibid.: 2).
More specifically, according to Kaplinsky and Morris (2001: 4)‘The value chain describes the
full range of activities which are required to bring a product or service from conception, through the different phases
of production (involving a combination of physical transformation and the input of various producer services),
delivery to final consumer, and final disposal after use.’ A distinction can be made between the simple
value chain and the extended value chain. The simple industrial value chain typically consists of
four links, namely design, production, marketing, and consumption and recycling (figure 3); also
called the productive functions of the chain. The extended value chain portrays a more complex
scheme. If you take for example the furniture industry, the extended value chain involves the
provisioning of seed inputs and water for the forestry sector, and the sawmill sector to cut the

22
logs: the extended value chain therefore includes different sectors. In agricultural value chains, the
productive functions typically are input supply to farming, trading, processing, marketing, and
consumption.
Figure 3 Four links in a simple industrial value chain (Kaplinsky and Morris, 2001: 4).
Definitions of main concepts The main value chain concepts that will be used throughout this study are productive functions,
supply channel, vertical – and horizontal coordination, competitiveness, inclusiveness, upgrading
(described under competitiveness) and value chain governance. The concepts of value chain
governance and upgrading will further be elaborated upon in two different sections below. The
concepts and their definitions were adapted from Haggblade et al. (2012: 4-11). To exemplify the
concepts, there is referred to the value chain map (figure 4) from Haggblade et al. (ibid.) in the
Background section.
Productive functions of the value chain The productive functions of the Kenya dairy value chain are in figure 4 (value chain map) below
presented on the vertical as. They are fodder production, dairy farming, milking, collection, milk
processing, distribution, retailing, and marketing (Haggblade et al., 2012: 5, 9).
Supply channels Supply channels are the ‘network of competing vertical supply channels that link input suppliers, farmers,
processors, distributors and final consumers’ (Haggblade et al., 2012: 4). In the case of the Kenya dairy
value chain in 2002 (figure 4) there are six supply channels, indicated below on the horizontal as.
The urban and peri-urban markets (top right figure 4) are served through channels 2, 3, 4, 5 and 6
while the rural consumers are served through the supply channels 1 and 2.
Vertical coordination ‘Vertical coordination describes how different types of enterprises interact with their input suppliers (one or more
functional level below them in the value chain map) and with the firms that purchase their output (one or more

23
functional levels above them in the value chain map) (Haggblade et al., 2012: 7). There are three major
options for managing these interactions, namely through vertical integration, spot markets, or
contract production. Vertical integration ‘occurs when an individual enterprise conducts a sequence of value
chain functions in-house’ (ibid.: 6), which can for example be seen in channel 1 of the Kenya dairy
value chain map (figure 4). Spot markets are public financial markets with immediate delivery,
and they usually mediate agribusiness transactions. Contract production ‘typically requires agreed-upon
grades, standards, quantity stipulations and delivery conditions’ (ibid.: 8).
Horizontal coordination Horizontal coordination is the coordination between the competing actors in the horizontal rows
along the productive factors. The main reasons for horizontal coordination are the possibility of
competitive advantages, and technology exchange. Competitive advantages are for instance an
increase in bargaining power, reduction of transactions costs, and to acquire the minimums
necessary to meet the requirements of large-scale intermediaries. Examples of horizontal
coordination are the establishment of farmers’ associations and marketing cooperatives
(Haggblade et al., 2012: 10).
Figure 4 A value chain map of the Kenya dairy value chain in 2002 (Ngigi et al. 2010, in Haggblade et al., 2012: 9).
Value chain governance Value chain governance ‘reflects the distribution of power and information among various actors’ (Haggblade
et al., 2012: 9). This is shaped by the nature of interactions in the vertical coordination of the
chain. This then influences the distribution of benefits, thereby reflecting the distribution of
24
power and control (ibid: 7). Gereffi et al. (2005) and others offer a more nuanced introduction to
value chain governance, which will be elaborated upon in the next section.
Competitiveness VCA to make VC’s more competitive was initially popularized by Porter (1985, in Haggblade et
al. 2012: 10). Competitiveness in a chain can be upgraded in three ways, namely through process
upgrading, product upgrading, or functional upgrading. Process upgrading ‘involves improving the
efficiency of internal processes.’ Product upgrading ‘involves the introduction of new, improved or more profitable
goods and services.’ Functional upgrading ‘involves increasing profitability by changing the mix of activities
undertaken.’ (ibid.).
Inclusiveness Increasing the opportunities for the poor, instead of improving competitiveness, is a current
focus for people working on value chains. Inclusiveness in value chains therefore means pro-
poor value chain development (Haggblade et al., 2012: 10-11). This concept is used in the main
research aim and question as presented in the Introduction.
According to Henderson et al. (2002: 439) the concept of VCA is however limited in the sense
that ‘it is bounded by the firm or interfirm network and pays no attention to issues of corporate power, the
institutional contexts of – and influences upon – firm-based activities, or to the territorial arrangements in which
the chains are embedded.’ According to them it has therefore little relevance for the study of
economic development.
Other value chain approaches are filière and Global Commodity Chain (GCC) (Kaplinsky
and Morris, 2001: 7, 8). Filière can be described as: ‘a system of agents producing and distributing goods
and services for the satisfaction of a final demand.’ The main objective of the filière-approach is slightly
different from the VCA and is ‘to map commodity flows and to identify the agents and activities within the
filière.’ It therefore compared to the VCA allows for a more detailed analysis of dynamics of
economic integration, and of an identification of the relations between actors in the chain
(Henderon et al., 2002: 439).
The Global Commodity Chain ‘consists of sets of interorganizational networks clustered around one
commodity or product, linking households, enterprises, and states to one another withing the world-economy. These
networks are situationally specific, socially constructed, and locally integrated, underscoring the social embeddedness
of economic organization’ (Gereffi et al., 1994: 2). The development of the GCC framework was an
attempt to operationalize some of the world-systems categories for empirical study of cross-
border, firm-based transaction and their relation to development. It thereby broke with the static
spatial categories of the core, semi periphery and periphery.
The main reasons for Henderon et al. (2002: 444, 445) to develop the GPN framework
using slightly different terminology, were first of all that the use of ‘production’ instead of
‘commodity’ in the GCC places the analytic emphasis on the social processes involved in
producing goods. They step away from the ‘chain’ metaphor mostly because this metaphor gives
the impression of essentially linear processes. This makes it difficult to incorporate attention to
the issues of the reproduction of labor power for example. Therefore, they choose to speak about
‘networks’ as this is more inclusive, more empirically adequate and thus more analytically fertile
than talking about ‘chains’. Relating to this different terminology, compared to the Gobal
Commodity Chain (GCC) and Global Value Chain (GVC) conceptualizations, the GPN is similar

25
in the core but there are two major differences. First, GCC’s and GVC’s are essentially linear
structures and the GPN aims to go beyond that. Second, GCC’s and GVC’s focus narrowly on
governance aspects of chains; the GPN framework allows to describe all sets of actors and
relationship that are of relevance (Coe et al., 2008). For more background on the GCC, GVC and
GPN see textbox 1.
Textbox 1 Footnote elaborating on GCC, GVC and GPN from Coe et al. (2008: 272).
A framework for GPN analysis is presented in figure 5. The three elements on which the
framework is raised are value, power and embeddedness. This study will use the concept of
territorial embeddedness to describe the relationship between actors in the dairy value chain in
Kenya, in particular the relations at the ‘beginning’ of the chain: between smallholders and other
direct actors. The reason to use the GPN instead of the related approaches as described above is
because it allows describing relations between actors on all levels and more in-depth, as clearly
explained above under the second difference of GPN from GCC and GVC conceptualizations.
Therefore, as this study focusses on the smallholder dairy producers, it is useful and allows for a
more in-depth analysis of relations between actors at the ‘beginning’ of the chain.
Figure 5 A framework for GPN analysis (Henderson et al., 2002: 448).
Embeddedness in the GPN framework describes the relations between actors; the effects of
social and spatial processes of ‘embedding’. Territorial embeddedness describes how a GPN

26
absorbs (and is constraint by) economic activities and social dynamics that already exist in those
places. Because territorial embeddedness describes how GPNs are shaped by the economic,
social and political arrangements of the places they inhabit, this is central to an analysis of the
prospects for development at the local level. This is another reason why this framework suits the
purposes of this study. Network embeddedness describes connections between network
members regardless of their country of origin or local anchoring in particular places (Henderson
et al., 2002: 446, 452, 453), and is less contributing to the aims of this study.
Next to the three categories there are four conceptual dimensions through which value is
created, power exercised or institutional embeddedness is given concrete effect in terms of
particular initiatives and policies, namely firms, sectors, networks and institutions. A correct
configuration and coordination of these dimensions should lead to development. It is within the
various networks that particular issues of governance arise (Henderson et al., 2002: 454).
Value Chain Governance To describe the relationship between actors in the dairy value chain using the territorial
embeddedness concept of the GPN framework, the five types of governance of Gereffi et al.
(2005) are used. Using these concepts contributes to the research gap about the socio-economic
factors that determine vertical – and horizontal integration among smallholder dairy farmers.
Value chain governance, its concept shortly introduced earlier, is shaped by the nature of
interactions in the vertical coordination of the chain. This then influences the distribution of
benefits, thereby reflecting the distribution of power and control (Haggblade et al., 2012: 7).
Governance in value chains matters because it is important in relation to market access, insights
in fast tracks to the acquisition of production capabilities, distribution of gains, leverage points
for policy initiatives, and funnel for technical assistance (Humphrey and Schmitz, 2001: 20-21).
How governance along value chains is exercised also matters for the upgrading prospects of
producers in developing countries (ibid.): analyzing the chain governance thereby conforms to
the aim of this study as it will help in finding out about the power relations and distributions of
benefits along the chain. This will offer insights into what barriers smallholders that market via
informal channels face in entering the formal sector, for example.
Building on the concept of value chain governance, Gereffi (1994, in Kaplinsky, 2000)
made a distinction between two types of of value chains, namely buyer-driven - and producer-
driven chains. Buyer-driven chains are chains ‘where the critical governing role is played by a buyer’. They
are characterized by labor-intensive industries such as footwear, and thereby relevant to
developing countries. Producer-driven chains describe a situation where key producers play the
role of coordinating the various links between supply and demand.
Based on Gereffi (1994, in Kaplinsky, 2000) three forms of governance can be
distinguished: legislative, judicial, executive governance. They can both be exercised by parties
internal and external to the chain. See figure 6 for the three forms of governance and examples.

27
Figure 6 Examples of legislative, judicial and executive value chain governance (Kaplinsky, 2000: 125).
These three forms of governance are important to understand, however there is a more recent
and detailed framework for governance in chains that will be used, again from Gereffi et al.
(2005). These types of governance are market -, modular -, relational -, captive -, and hierarchical
governance. The determinants of governance structure are information complexity, information
codification, and supplier capability. Information complexity is about ‘The complexity of
information and knowledge transfer required to sustain a particular transaction, particularly with
respect to product and process specifications’. Information Codification is ‘the extent to which
this information and knowledge can be codified, and, therefore, transmitted efficiently and
without transaction-specific investment between the parties to the transaction’. Supplier
capability is ‘the capabilities of actual and potential suppliers in relation to the requirements of the
transaction’ (Gereffi et al., 2005: 85). Other contributing factors to governance are (1) business
enabling environment and institutions, and (2) power, either exercised by actors inside the chain
such as the suppliers or firms, or outside the chain such as by (local) governments (ibid.).
If the determinants of governance structures are given the values high or low, eight
possible combinations are to be made, of which five are actually found (see table 2):
Table 2 Key determinants of global value chain governance, obtained from Gereffi et al. (2005: 87).
These combinations lead to the five governance types:

28
Market: characterized by low complexity of transactions, high ability to codify transaction
and capabilities in the supply-base, buyers respond to specifications and prices, and little
explicit coordination is needed;
Modular: characterized by high complexity of transactions, ability to codify transactions,
and capabilities in the supply-base. This arises when linkages are not just based on price
anymore as in market exchanges, but involves more complex products thus higher
complexity in transaction; still low explicit coordination needed and low costs of
switching to new partners;
Relational: characterized by high complexity of transactions, low ability to codify
transactions, and high capabilities in the supply-base. This arises when product
specifications cannot be codified and transactions are complex. In combination with high
capabilities in the supply-base, knowledge must be exchanged between buyers and sellers,
hence high levels of explicit coordination, which makes costs of switching to new
partners high;
Captive: characterized by high complexity in transactions and ability to codify
transactions, but low capabilities in the supply-base, a situation with high control on the
part of the lead firm is created with high switching costs for suppliers;
Hierarchical: characterized by complex transactions where information cannot be codified
and suppliers are not capable, firms are forced to manufacture and develop products
themselves (Gereffi et al., 2005: 86).
In chapter 4 it will examine what type of governance characterizes the relations between actors in
the informal and formal dairy value chain in western Kenya.
Types of upgrading For the last sub question types of upgrading for the different types of smallholder dairy
producers are explored using four types of upgrading as described by Kaplinsky et al. (2002).
These types of upgrading are (1) process upgrading; (2) product upgrading; (3) functional
upgrading and (4) chain upgrading. See figure 7 for a description of the different types of
upgrading. In the context of the NAMA as described in the introduction, this study focusses on
the potential of process – and channel upgrading.
Figure 7 Four categories of upgrading (Humphrey and Schmitz, 2001 in Kaplinsky et al., 2002: 5).

29
Sustainable Intensification and Climate Smart Agriculture While Climate Smart Agriculture (CSA) and Sustainable Intensification (SI) do not directly form
the basis of this thesis, they are so to say the beginning and end-point of the reasons for
conducting this study, and therefore it is necessary to shortly introduce the concepts here:
SI and CSA are two complementary approaches. SI puts ‘emphasis on improving risk
management, information flows, and local institutions to support adaptive capacity’, whereas ‘CSA provides the
foundations for incentivizing and enabling intensification’ (Campbell et al. 2014: 39). Some see SI as too
narrowly focused on production, but SI rather means rethinking of the whole food systems to
reduce environmental impacts, enhance animal welfare, enhance human nutrition, and support
rural economies and sustainable development. CSA has three objectives, namely (1) to increase
agricultural productivity to support increased incomes, food security and development, (2) to
increase adaptive capacity at multiple levels, and (3) to decrease GHGE and to increase carbon
sinks. Identifying potential tradeoffs and synergies between these objectives is an essential
element of CSA (ibid.). These concepts are at the core of this research: SI in the dairy sector is
desired through CSA practices. As is the core of the second research question: ‘Identifying
appropriate ways to incentivize the uptake of climate smart alternatives is a key priority’ (ibid.: 42).

30
Methodology This section described which methods are used, the data types and sources, how data was
collected and analyzed, how concepts were measured, the epistemological and ontological
position of the researcher, and the reliability and validity of the research.
Methods This research follows a mixed-methods design in which quantitative – and qualitative methods
are combined. The main advantages of such a design are its ability to overcome weaknesses of
either a quantitative – or qualitative research design. Such weaknesses are for example related to
having data from one type of perspective and thereby having higher chances of gaps in the data.
Following a variation of both quantitative – and qualitative methods therefore leads to greater
validity.
The main reason for choosing a mixed-methods design is that only a qualitative – or a
quantitative design was not able to provide all the information that was required to answer the
research questions. Namely, as well a description of the structure of the chain, its actors and
relations between actors, and the creation of a typology of smallholder dairy producers is needed
to meet the aim of the study as presented in the introduction. The approach to the mixed
methods approach, following Hammersley (1996, in Bryman, 2008: 607) is complementarity:
‘…the two research strategies are employed in order that different aspects of an investigation can be dovetailed’ .
Triangulation is also done, namely both qualitative research and quantitative research both made
sure to corroborate quantitative – and qualitative research findings: this enhances the validity.
Following Morgan’s (1998, in Bryman, 2008: 607) approaches to mixed methods research, this
research follows an approach where first qualitative data was gathered before quantitative data
(the sequence decisions), however qualitative data was also gathered during quantitative data
gathering. Because of the complementarity approach, qualitative or quantitative methods were
both not the principal data-gathering tool, but equally important.
Epistemology and ontology It is sometimes argued that research methods are rooted in epistemological and ontological
commitments: to do participant observation can follow an interpretivist epistemological
commitment, rather than a positivist one (Bryman, 2008: 604). It is therefore important to reflect
on the researchers epistemological and ontological positions. Epistemology is about what is
regarded as acceptable knowledge in a discipline. This study follows an interpretivist
epistemological position, believing that there are differences between people and the objects of
the natural sciences, and that they therefore cannot be measured using natural science methods.
This leaves room for social scientists to ‘grasp the subjective meaning of social action’, following Weber’s
notion of Verstehen (Bryman, 2008: 15, 16).
Ontology answers the central point of orientation about ‘whether social entities can and should
be considered objective entities that have reality external to social actors, or whether they can and should be
considered social constructions built up from the perceptions and actions of social actors’. The researcher her
ontological position follows a constructionist commitment: ‘social phenomena and their meanings are
continually being accomplished by social actors’. Social actors are therefore considered ‘social constructions
built up from the perceptions and actions of social actors’ (Bryman, 2008: 18, 19). The methods chosen in
this social – and geographical study are supported by these positions.

31
Data collection Primary – and secondary data gathering, key stakeholder interviews, and surveys were the main
methods used. For instance, NAMA multi-stakeholder workshops in Nairobi were visited in
order to get a better picture of the process of creating a NAMA and to see what approaches and
strategies are currently considered in order to decrease emissions from the dairy sector.
Secondary data about dairy cattle and milk production per ward is obtained from the county
governments of Nandi – and Bomet county. The two main data sources were however
smallholder dairy producers sampled in Nandi – and Bomet county, and employees of dairy
farmers cooperative societies. A short survey among agrovetstores also provided useful data on
inputs.
The data was collected as follows: After attending a NAMA multi-stakeholder workshop
in Nairobi, data collection was started in Nandi county. First, exploratory interviews were done
with staff of the agricultural- and environmental departments of the county government in order
to be able to sample the wards in which the smallholder dairy producer survey was to be
conducted. Secondary data was gathered as well, transportation was arranged, and two research
assistants were selected and trained. Considering the time frame four wards were selected.
Considering the chain approach, based on stakeholder consultation and secondary data on milk
production, two wards were selected that were relatively far away from markets, one in a higher
milk producing area and one in a lower producing area, and two wards were selected that were
relatively close to markets, again one in a higher producing area and one in a lower producing
area. Were possible, wards close to forests were chosen as considering the host organization of
the internship (CIFOR) it would be interesting to see if people let their cattle graze in forests. See
table 3 for the characteristics of each ward. The dairy producer survey was largely inspired by an
already conducted EADD survey. The main adjustments were additional questions about
marketing of the milk, and skipping a lot of questions to remain with the core questions
regarding household characteristics and farming practices etc. The survey was coded into an
XLSForm, uploaded in Ona (https://ona.io/home/), and collected through the ODK Collect
app on tablets provided by CIFOR. The survey was tested in the beginning, and adjusted and
improved in the process.
The same sample approach was executed in Bomet county, after having attended a KDB
stakeholder workshop to get an idea of the issues in the dairy sector in Bomet county. Next to
the county government, in Bomet, WorldVision was also asked which wards best to sample. The
same research assistants conducted the smallholder survey in Bomet. The sample in Nandi
county did not have any people that directly sold their milk to formal milk processors, that is why
in Bomet county the ward Chemagel was chosen in order to hopefully be able to get conclusions
about the differences between farmers who directly sell to the milk processors and the others.
After the work in Bomet was finished, a one-week return visit to Nandi was done to fill in the
gaps and conduct more surveys. Kapsabet ward was added due to the presence of a dairy
processor. In each ward, in order to be able to say something about it statistically, the aim was to
conduct 30 surveys. This more or less worked out, however in the end the ward Kapsabet had a
higher priority due to the presence of a milk processor, so Kobujoi and Kibwareng wards did not
reach 30 surveys each. However, as they are close to each other and the total amount of surveys
in both wards is 29, they can somewhat be regarded as one ward (see figure 8).

32
Table 3 Reasons for sampling the wards.
For the actual sampling of households, there were options to use member registers of farmers’
cooperative societies, but that would mean there would only be people included that deliver milk
to the farmers’ cooperative societies, which was not desired. Due to a lack of specific household
data on county level and time constraints, the households were simply sampled by getting out of
the car at some point in the ward and walk around. The terrain was often difficult to tackle by
car, and a higher priority was set to getting 30 surveys per ward then to having a sample that is
collected dispersed throughout the ward. Therefore the surveys are collected as shown on figure
8. I personally joined for about 55 surveys in Nandi county, thereafter the research assistants
were able to conduct the surveys without me as they were trained and could save time by not
having to translate on the spot for me. Quality control was done by going through the submitted
surveys of the research assistants every day and discuss unclarities or interesting things the day
after, as well as general updates on how the days went at the same day. This was the most optimal
way to guarantee quality as the respondents they talked to were still fresh in their minds, and they
could share their general experiences immediately after returning to the main town. See table 4
for how many times each ward was visited to conduct the producer surveys. In the meantime, in
both Nandi – and Bomet county, I arranged and conducted interviews with dairy specific
farmers’ cooperative societies and milk processors, preferably at least in the wards that were also
sampled for the dairy producer surveys. In Nandi county two dairy cooperative societies were
visited and the processors New KCC, in total six interviews were done. Smaller I resided a total
of six weeks in Kapsabet and a total of five weeks in Bomet: the towns where the county
governments are located. There was an operating budget of 2000 USD available through CIFOR
which enabled staying at the site locations and paying for research assistants and transportation.
County and sampled wards Ward Chosen because of following: Nandi 1: Kipkarren High producting, remote, no tarmac roads
2: Kaptel High producing, less remote than Kipkarren, tarmac roads, close to forest
3: Kapsabet Presence of formal dairy processor, tarmac roads, close to forest
4: Kobujoi Low producing, less remote than Kibwareng, no tarmac roads, close to forest
5: Kibwareng Low producing, no tarmac roads, remote Bomet 1: Kimulot High producing, remote, no tarmac roads, close
to forest 2: Chesoen High producing, less remote than Kimulot,
tarmac roads 3: Chemagel Precense of formal dairy processor, tarmac
roads 4: Kong’assis Low producing, remote, no tarmac roads, close
to forest

33
Figure 8 Nandi - (left) and Bomet county (right) and sample locations of the smallholder dairy producers in orange
dots, following the numbers as presented in table 4.
Table 4 Overview of collected dairy producer surveys.
County Ward Nr. of times visited to conduct surveys
Number of dairy producer surveys collected (N=240)
Nandi 1: Kipkarren 3 32 2: Kaptel 3 30 3: Kapsabet 2 30 4: Kobujoi 2 13 5: Kibwareng 2 16
Total: 121 Bomet 1: Kimulot 3 30
2: Chesoen 3 29 3: Chemagel 2 30 4: Kong’assis 2 30
Total: 119
Towards the end of the fieldwork period additional agrovetstore surveys were conducted in both
counties in order to get a better idea of the inputs available, where these inputs come from, their
prices, and how they are transported from producer to agrovetstore and from agrovetstore to
farmer. It was executed the same as the other survey: on tablets or phone with the ODK Collect
app. See table 5 for info on where the agrovetstore surveys were conducted, and appendix 1 for
an overview of the collected data and people interviewed.
Table 5 Overview of collected agrovetstore surveys.
County Name of ward Name of center Nr. of surveys (N=10) Nandi Kaptel Kaptel 1
Kapsabet Kapsabet 1 Kapsabet Kapsabet 1
Bomet Kongasis Olbutyo 1 Silibwet Silibwet 1 Bomet East Bomet 1 Chemagel Kaplong 2 Chemagel Sotik 2

34
Operationalization Most of the information is collected through the producer survey and interviews with the dairy
coop societies. Below are some examples given of questions asked to measure the concepts; this
further becomes clear in the results chapters. See appendixes 2 and 3 for all the survey questions
asked.
In order to say something about the value chain structure with a focus on the ‘beginning’
of the chain, vertical coordination and horizontal coordination are explored. Horizontal
coordination is explored in the smallholder producer survey by asking questions such as ‘Are you
part of a farmers’ organization’, and ‘What services are offered through your organization’ to
make sure they are part of a dairy organization, namely if they answer with ‘milk collection’,
and/or ‘milk selling’. To the dairy farmers organizations is asked about whether they work
together with other dairy farmers organizations to get an idea of horizontal coordination on their
level.
Vertical coordination is measures by asking the farmers to which actors they sell the milk,
how transportation is and price negotiation is arranged, and what type of contract they have with
the buyers of their milk, for example. To the dairy coop societies more or less the same questions
are asked about their relation with the farmers as well as with the milk processors. The same
accounts for the formal milk processors. An example of a question asked to New KCC, the
formal milk processors, is what percentage or their milk they receive/buy from groups, and what
percentage they get from individuals.
In order to say something about governance in the chain, the concept of embeddedness is
used, and measured using the five types of governance of Gereffi (2005). The information on
vertical coordination is used, and this is backed up by more direct qualitative data from interviews
with the dairy coop societies about how their relations are with the farmers and the formal
processors, and how contracts are put together between dairy coop societies and formal
processors, for instance. More specific questions in the dairy producer survey were asked later on
in the process about the relationship between the farmer and the middleman: questions were
asked such as ‘does the middleman sometimes not show up when you expect him/her’, and ‘does
the middleman sometimes pays less or later than you expect him/her to do’?
In order to answer the main research question the concept of inclusiveness is also
considered, in particular with respect to the development of the NAMA, based on two
stakeholder meetings in Nairobi. As their strategy is to focus on the private – and formal sector
to develop the dairy sector, to measure the possible effect of that, it is analyzed how many
smallholder producers are directly connected to the formal milk market. This is discovered by
asking questions about what percentages of morning – and evening milk is sold to whom/where,
and also by questions about which extensions services actors are present, and from who
smallholders have receive extension services in the last year, for instance.
Data analysis Notes from the workshops and interviews with staff members of the county government or
farmers’ cooperative societies were typed out, were read repeatedly, and kept closely during
writing of the report. Questions from the dairy producer survey were mostly analyzed using
Microsoft Excel, after coding averages were calculated, just like percentages, and standard
deviations: the descriptive statistics. A few variables were analyzed in IBM SPSS Statistics version

35
24 to perform a Hierarchical Cluster Analysis (HCA) and Probit Regression Analysis (PRA).
Justification of the variables used for the analysis in SPSS can be found in the results chapters.
Reliability and validity ‘Reliability is concerned with the question of whether the results of a study are repeatable ’ (Bryman, 2008: 31).
Reliability in this study is accounted for by partly using statistical tests that can be repeated and
will give the same outcomes. These outcomes will however have a chance of being different with
the use of different variables and a larger or smaller sample, this is its limitation. With regards to
the more qualitative parts, to the farmers organizations more or less the same questions have
been asked, and as most of these questions were straightforward, such as ‘how many members
does this farmers organization have’, these results are repeatable. Reliability challenges are mostly
present with regards to the dynamics in the chain, as the results presented about this in this study
are the result of attended meetings and interviews that are highly unlikely to take place in the
same way as I have experienced them.
‘Validity is concerned with the integrity of the conclusions that are generated from a piece of research’
(Bryman, 2008: 32), so is measured what is said to be measured? For the statistical parts, this
mostly means that no generalizing conclusions can be done or outcomes can be reframed, as they
are then not correct anymore and do not describe what exactly is measured. If the correct use of
wording is used, such as ‘when having a higher value of X the probability of being part of the
group that sells to X are statistically significantly higher’, then you describe what is measured and
not beyond that. For the more qualitative part, again the validity is harder to guarantee. Any
challenges with regards to reliability and validity in this study are limited by choosing a mixed
methods framework.
Limitations The main limitation to this research is the sampling method, as all respondents that participated
are close to some sort of road. Even though some areas were really remote, they were somehow
reachable with a car or motorbike and thereby ‘close’ to a road. There is therefore no clear
understanding of practices and marketing behavior of people that live further away from some
sort of a road.
Second, there was an active search for people that directly deliver their milk to the
processors. This was desired to be able to compare these respondents with other respondents. It
was very difficult to find them and the ones that are part of the sample have been actively
searched for, indicating that the general descriptive statistics of the whole sample of smallholders
may be slightly different as without active searching for these respondents, the chances are very
low that there would have been people in the sample that directly sell milk to the processors
(even around the New KCC collection and processing plants).
Third, the use of research assistants always has its advantages and limitations. In terms of
language and a general understanding of socio-cultural contexts it was absolutely indispensable to
work with them. However, it also always remains a limitation because I could not directly
understand most smallholders myself. Even if I could have picked up on some things in
Kiswahili, a national language in Kenya, with the presence of the local research assistants this
automatically moved to Kalenjin, the local tribe language of which I did not speak a word.

36
Chapter 1: The dairy value chain This chapter aims at presenting the main characteristics of the actors and main structures of the
dairy value chain in answering the first sub question: How is the dairy value chain structured in Nandi –
and Bomet county? Smallholder dairy producers, processors, and farmers’ organizations will be
described, as well as the main input channels for smallholder dairy producers and the options for
marketing. This chapter can therefore be regarded as a biography of the counties with regards to
the dairy sector. In the end some differences between Nandi – and Bomet county will be
discussed but since the value chain structure is more or less the same, in the rest of the chapter
no distinction will be made.
Dairy producers The largest group of actors in terms of numbers, and the focus of this research, is the group of
dairy producers. Most dairy producers are smallholders. A survey was conducted among 240
smallholder dairy producers in Nandi – and Bomet county. Results with regards to the topics in
the survey, namely household characteristics, cattle and milk production, and production
practices, will be presented in this section in order to get a clear picture of the smallholder
producers in these counties. In particular, general statistics are presented for the variables that are
used in to conduct analyses in the chapters that follow. Secondary data regarding livestock and
cow milk production is also presented.
Household characteristics In the survey 195 male and 45 female headed household heads participated. Of the respondents
125 were male and 115 female. The average dependency ratio is 38.56% per household. The main
sources of income for the households were the cash crop tea or the livestock product milk (see
tables 6).
Table 6 Main source of income for smallholder dairy producers in Nandi - and Bomet county.
Main source of income
Total (N=240) Percentage (%) of total Specification
Cash crops 85 35,4 Tea (N=85) Livestock products 80 33,3 Cow milk (N=80) Subsistence crops 32 13,3 Maize (N=20) Formal employment 24 10 Casual employment 5 2,1 Small business 13 5,4 Remittances 1 0,4
Table 7 shows that 30.4% has a total household income of more than 30.000 KES/month, which
is about 270 euro’s. 48.8%, about half of the sample, has an income of 20.000 KES/month or
less, that is about 180 euro’s.
Table 7 Household income categories for smallholder dairy producers in Nandi - and Bomet county.
Income category in KES/month
Nr. of households (N=240) Percentage (%) of total
Cumulative Percentage (%)
Less than 2.500 2 0,8 0,8 2.500 – 5.000 10 4,2 5 5.000 – 10.000 46 19,2 24,2 10.000 – 20.000 59 24,6 48,8
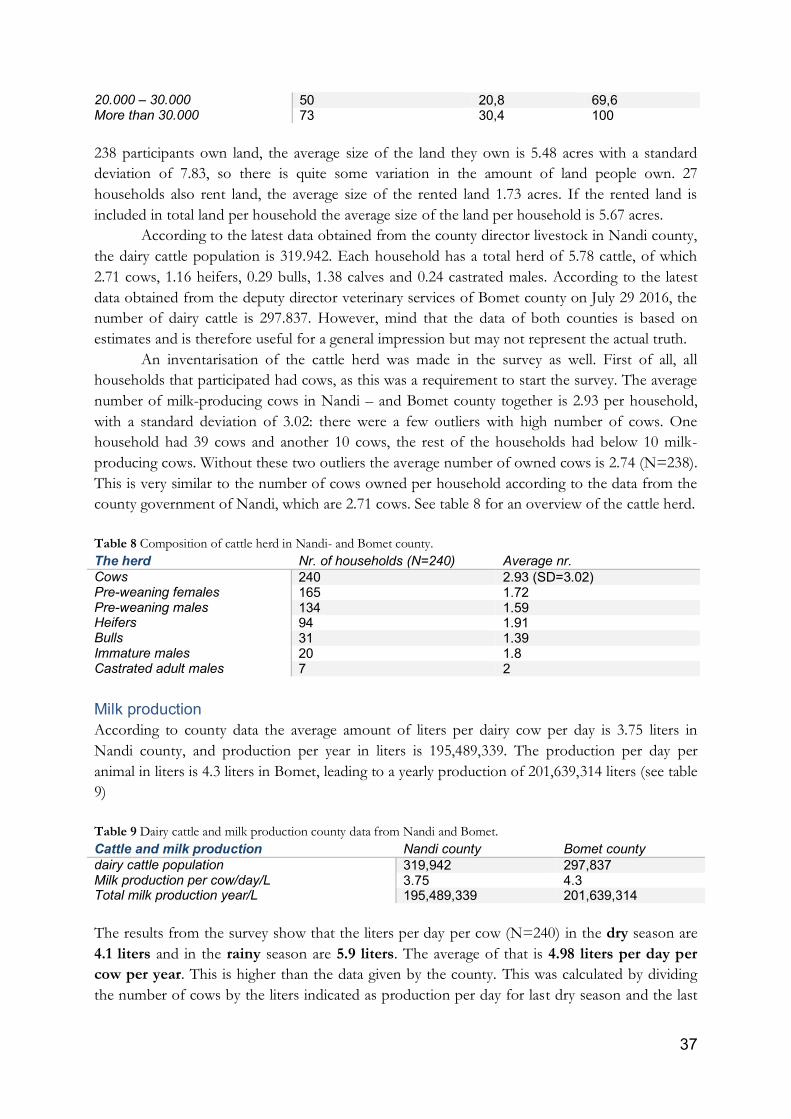
37
20.000 – 30.000 50 20,8 69,6 More than 30.000 73 30,4 100
238 participants own land, the average size of the land they own is 5.48 acres with a standard
deviation of 7.83, so there is quite some variation in the amount of land people own. 27
households also rent land, the average size of the rented land 1.73 acres. If the rented land is
included in total land per household the average size of the land per household is 5.67 acres.
According to the latest data obtained from the county director livestock in Nandi county,
the dairy cattle population is 319.942. Each household has a total herd of 5.78 cattle, of which
2.71 cows, 1.16 heifers, 0.29 bulls, 1.38 calves and 0.24 castrated males. According to the latest
data obtained from the deputy director veterinary services of Bomet county on July 29 2016, the
number of dairy cattle is 297.837. However, mind that the data of both counties is based on
estimates and is therefore useful for a general impression but may not represent the actual truth.
An inventarisation of the cattle herd was made in the survey as well. First of all, all
households that participated had cows, as this was a requirement to start the survey. The average
number of milk-producing cows in Nandi – and Bomet county together is 2.93 per household,
with a standard deviation of 3.02: there were a few outliers with high number of cows. One
household had 39 cows and another 10 cows, the rest of the households had below 10 milk-
producing cows. Without these two outliers the average number of owned cows is 2.74 (N=238).
This is very similar to the number of cows owned per household according to the data from the
county government of Nandi, which are 2.71 cows. See table 8 for an overview of the cattle herd.
Table 8 Composition of cattle herd in Nandi- and Bomet county.
The herd Nr. of households (N=240) Average nr. Cows 240 2.93 (SD=3.02) Pre-weaning females 165 1.72 Pre-weaning males 134 1.59 Heifers 94 1.91 Bulls 31 1.39 Immature males 20 1.8 Castrated adult males 7 2
Milk production According to county data the average amount of liters per dairy cow per day is 3.75 liters in
Nandi county, and production per year in liters is 195,489,339. The production per day per
animal in liters is 4.3 liters in Bomet, leading to a yearly production of 201,639,314 liters (see table
9)
Table 9 Dairy cattle and milk production county data from Nandi and Bomet.
Cattle and milk production Nandi county Bomet county dairy cattle population 319,942 297,837 Milk production per cow/day/L 3.75 4.3 Total milk production year/L 195,489,339 201,639,314
The results from the survey show that the liters per day per cow (N=240) in the dry season are
4.1 liters and in the rainy season are 5.9 liters. The average of that is 4.98 liters per day per
cow per year. This is higher than the data given by the county. This was calculated by dividing
the number of cows by the liters indicated as production per day for last dry season and the last

38
rainy season. Mind however that sometimes people currently had for instance one cow more or
less in the last rain or dry season so again, these are estimates.
With regards to milk production, 238 (N=240) participants wanted to increase their milk
production. They were all asked how they wanted to increase their milk production. See table 10
for the results. This is useful data because it shows how the participants themselves think they
can increase their production.
Table 10 First, second, and third ideas of smallholder dairy produers in Nandi – and Bomet county on how to
increase milk production.
First, second, third method to increase production (N=238) First Second Third Produce more feed 117 53 28 Buy more feed 39 72 30 Better feeding practices 38 48 55 Improve grade 25 31 46 Increase the nr. of cows 14 21 41 Spent more on controlling animal disease 3 8 16 Depends on extentionist advice 2 0 2 I don’t know 0 3 14 Other 0 2 6
Conclusions that can be drawn from table 10 are first of all that most smallholders know they can
increase their cow’s milk production by giving them more feed or by better feeding practices, and
that of all people who wanted to increase their cow milk production, everyone had ideas on how
to do this. If they have ideas on how to increase their production but they are not doing that,
what limitations are they experiencing in order to increase cow milk production? See table 11 for
results on that.
Table 11 Main limitation according to smallholder dairy producers to increase milk production.
First and second limitation to increase production (N=238) First Second Lack of credit to buy (quality) feed 59 40 Lack of enough land to produce my own feed 59 30 My animals suffer from diseases 35 18 There is not enough good grazing land available 18 21 The price for milk is too low 14 29 Lack water 11 14 Lack of (credit to buy) labour 10 10 Lack of credit to buy animals 8 20 Good vet care is too expensive 7 13 I don’t know how to increase my production 5 16 Other 5 14 There is not enough feed to buy available in my area 4 4 There is no buyer for the milk 2 1 Good vet care is not available in my area 1 4
Conclusions that can be drawn from table 11 in particular if we look at the first three of the first
– and second limitation to increase milk production, is that they are related to a lack of credit or a
lack of land to buy and produce cattle feed. Thereafter, animal diseases are a perceived problem,
following a perceived low cow milk price which prevents people from being able to invest.

39
Farming practices With regard to farming practices, questions have been asked about feeding and grazing, fodder
legumes, feed conservation and manure management. It is beyond the scope of this study to
examine in detail the farming practices, so a selection of the main practices that influence cow
milk production, based on FAO (2013b), Harvey et al. (2014), Wambugu et al. (2014), and an
expert from CIFOR (see appendix 4), are chosen to ask in the survey and to present here. It is
important to have a general idea of the farming practices as eventually, in order to produce
environmentally sustainable, these practices are the ones that need to be adapted and/or
improved.
Table 12 shows that the household head mostly detects if a cow is in heat, and table 13
shows that 63.7% get a bull from close by to inseminate the cow; a higher percentage of people
that use AI is desired.
Table 12 Who detects if a cow is in heat. Detects if a cow is in heat Total (N=240) Percentage % of total Head 173 72.1 Spouse 29 12.1 Son 24 10 Other 14 5.8 Table 13 What is done when a cow is in heat.
When a cow is in heat Total Percentage % of total Get a bull from close by 153 63.7 Get a vet to do AI 86 35.8 Do AI myself 1 There are no large differences between how the cattle grazes between the dry and the rainy
season (table 14), between how the cows graze (table 15), and where (table 16). Most farmers
have their cattle graze and give them some additional stallfeeding. They mostly graze freely or
fenced, or rotational, on their privately owned lands.
Table 14 Cattle feeding in the dry - and rainy season. Cattle feeding Total
(dry) (N=240)
Total (rain) (N=240)
Percentage % of total (dry)
Percentage % of total (rain)
Only grazing 64 74 26.7 30.8 Mainly grazing and some stall feeding
121 125 50.4 50.4
50% grazing and 50% stall feeding
13 21 5.4 8.8
Mainly stall feeding and some grazing
40 19 16.7 7.9
Only stall feeding – zero grazing
2 1 .8 .4
Table 15 Method of grazing in the dry - and rainy season.
Cattle grazing Total (dry) (N=228)
Total (rain) (N=235)
Percentage % of total (dry)
Percentage % of total (rain)
Free/fenced grazing
125 125 54.8 53.2
Rotational grazing
69 72 30.3 30.6
Tethered grazing
30 34 13.2 14.5

40
Other 4 4 1.8 1.7 Table 16 Where the cattle grazes in dry - and rainy season.
Location cattle grazing Total (dry) (N=234)
Total (rain) (N=234)
Percentage % of total (dry)
Percentage % of total (rain)
On common land 5 5 2.1 2.1 Own privately owned land
185 190 79.1 81.2
Someones else’s privately owned land
12 12 5.1 5.1
Along the roads 13 12 5.6 5.1 Mostly in forests 19 15 8.1 6.4
As the question about grazing in general did not give insights into whether people have their
cattle grazing in the forest or not, later on this was specifically asked. Of 188 respondents 23 said
to sometimes have their cattle graze in the forest, 165 indicated not to. In Kapsabet ward it was
mentioned 12 times, in Kaptel ward once, in Kimulot five time (Mau forest), in Kong’assis four.
Eight respondents indicated mostly to have their cattle graze in forests in the rainy season, while
15 respondents said they have their cattle grazing in forests equally in both seasons. This does not
correspond with results from the survey in general where a slightly higher percentage of people
who have their cattle graze in the forest is to be seen in the dry season.
With regards to the number of hours cattle grazes, the average of 209 respondents is 6.8
hours in the dry season and 6.7 hours in the rainy season for 208 respondents, so there is
practically no difference. 34 respondents indicate to sometimes pay others for having cattle
grazing in certain places, 199 do not (N=233).
Questions on additional food sources are only asked to people who indicated to feed their
cattle next to grazing. 134 respondents (N=179, which 74.9%, say their main additional food
source is Napier grass, followed by dry maize strover. The main type of feed bought (N=129) is
dairy meal (74.4%) followed by Boma Rhodes (9.3%). This shows, as is also confirmed in other
questions in the survey, that most people grown their own cattle feed, in particular Napier grass.
Only five respondents (N=240) indicated to grow fodder legumes, namely calliandra and
desmodium.
44.6% (N=240) practice feed conservation, in particular by stacking it in a separate store
(57.5%) or traditional stacking under shade (21.2%). 70.8% (N=240) collect manure from cows
and apply it to apply it to food and cash crops (93.9%) and cattle feed crops (66.1%). Chapter 5
will elaborate more on the barriers to the uptake of improved practices.
Cooling plants There are many small and larger farmers’ organization that, sometimes solely, are involved in cow
milk collection. Many of these groups have obtained coolers to chill the milk, or milk coolers
were provided through (projects of) the county government and external partners. Except for
some privately owned coolers, most coolers are therefore owned and managed by (a selection of)
farmers through a management committee. Table 17 and 18 give an overview of coolers, their
capacities and locations in Nandi- and Bomet county. This data was given by both county
governments, but field visits and triangulation with other researchers often indicated slight
differences in capacity. Therefore is should be kept in mind that there can be mistakes in both
tables, except for the ones that were visited by myself (indicated with *).
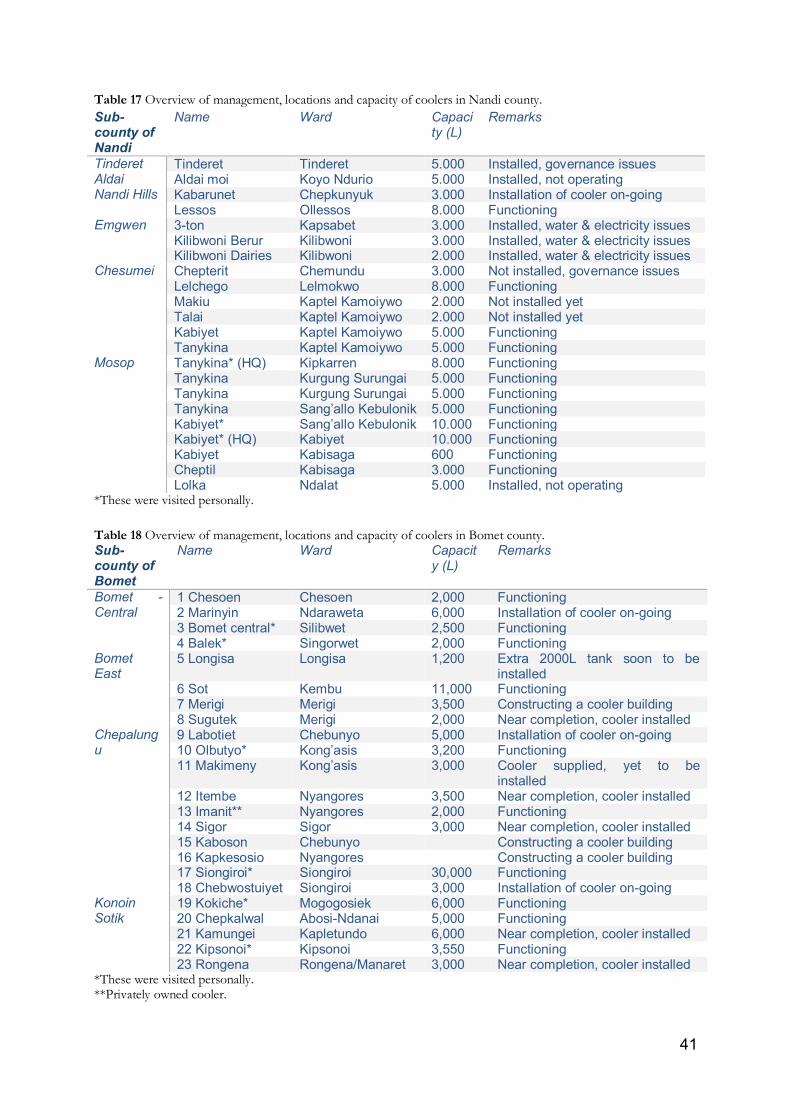
41
Table 17 Overview of management, locations and capacity of coolers in Nandi county.
Sub-county of Nandi
Name Ward Capacity (L)
Remarks
Tinderet Tinderet Tinderet 5.000 Installed, governance issues Aldai Aldai moi Koyo Ndurio 5.000 Installed, not operating Nandi Hills Kabarunet Chepkunyuk 3.000 Installation of cooler on-going
Lessos Ollessos 8.000 Functioning Emgwen 3-ton Kapsabet 3.000 Installed, water & electricity issues
Kilibwoni Berur Kilibwoni 3.000 Installed, water & electricity issues Kilibwoni Dairies Kilibwoni 2.000 Installed, water & electricity issues
Chesumei Chepterit Chemundu 3.000 Not installed, governance issues Lelchego Lelmokwo 8.000 Functioning Makiu Kaptel Kamoiywo 2.000 Not installed yet Talai Kaptel Kamoiywo 2.000 Not installed yet Kabiyet Kaptel Kamoiywo 5.000 Functioning Tanykina Kaptel Kamoiywo 5.000 Functioning
Mosop Tanykina* (HQ) Kipkarren 8.000 Functioning Tanykina Kurgung Surungai 5.000 Functioning Tanykina Kurgung Surungai 5.000 Functioning Tanykina Sang’allo Kebulonik 5.000 Functioning Kabiyet* Sang’allo Kebulonik 10.000 Functioning Kabiyet* (HQ) Kabiyet 10.000 Functioning Kabiyet Kabisaga 600 Functioning Cheptil Kabisaga 3.000 Functioning Lolka Ndalat 5.000 Installed, not operating
*These were visited personally.
Table 18 Overview of management, locations and capacity of coolers in Bomet county.
*These were visited personally. **Privately owned cooler.
Sub-county of Bomet
Name Ward Capacity (L)
Remarks
Bomet -Central
1 Chesoen Chesoen 2,000 Functioning 2 Marinyin Ndaraweta 6,000 Installation of cooler on-going 3 Bomet central* Silibwet 2,500 Functioning 4 Balek* Singorwet 2,000 Functioning
Bomet East
5 Longisa Longisa 1,200 Extra 2000L tank soon to be installed
6 Sot Kembu 11,000 Functioning 7 Merigi Merigi 3,500 Constructing a cooler building 8 Sugutek Merigi 2,000 Near completion, cooler installed
Chepalungu
9 Labotiet Chebunyo 5,000 Installation of cooler on-going 10 Olbutyo* Kong’asis 3,200 Functioning 11 Makimeny Kong’asis 3,000 Cooler supplied, yet to be
installed 12 Itembe Nyangores 3,500 Near completion, cooler installed 13 Imanit** Nyangores 2,000 Functioning 14 Sigor Sigor 3,000 Near completion, cooler installed 15 Kaboson Chebunyo Constructing a cooler building 16 Kapkesosio Nyangores Constructing a cooler building 17 Siongiroi* Siongiroi 30,000 Functioning 18 Chebwostuiyet Siongiroi 3,000 Installation of cooler on-going
Konoin 19 Kokiche* Mogogosiek 6,000 Functioning Sotik 20 Chepkalwal Abosi-Ndanai 5,000 Functioning
21 Kamungei Kapletundo 6,000 Near completion, cooler installed 22 Kipsonoi* Kipsonoi 3,550 Functioning 23 Rongena Rongena/Manaret 3,000 Near completion, cooler installed

42
Also incorporating the coolers of New KCC in the counties (see next section), there are currently
more or less 15 functioning coolers in Nandi county with a capacity of 277.600L. In Bomet
county there are 12 functioning coolers with a capacity of 369.250L (see table 19).
Table 19 Number of functional coolers and total capacity (L) of Nandi – and Bomet county.
Coolers and capacities Nandi county Bomet county Number of functional coolers 15 12 Total capacity/L 277,600 369,250
The average distance to the nearest cooling plant differs strongly per ward (see table 20), which is
part of the reason why these wards were sampled.
Table 20 Avarage distance to cooling plant per ward for sampled dairy producers.
County Ward Average distance to cooling plant (in km) Nandi Kipkarren (N=32) 1.83
Kaptel (N=30) 0.90 Kapsabet (N=30) 9.70 Kobujoi (N=13) 5.85 Kibwareng (N=16) 17.75
Bomet Kimulot (N=30 17.37 Chesoen (N=29) 6.72 Chemagel (N=30) 2.32 Kong’assis (N=30) 0.54
There is a difference between a farmers’ cooperative and a ‘limited’: ltd. A cooperative is a public
entity, so it can take a while before certain decisions are made as this requires approval of at least
part of the members. That is why most cooperative societies have a limited (ltd.) which is private.
The cooperative then buys the milk from the ltd. as they are able to make quick decisions about
what to do with it (interview Kiptalam, July 4, 2016). For the consistency in this report it did not
seem relevant to distinct between cooperatives and ltd. Therefore here is referred to farmers’
organizations. Farmers’ organizations that are a relatively well established and large, and that offer
extension services such as training, are also called ‘hubs’.
Farmers’ organizations, often with the help from the county governments or other dairy
programs such as EADD, purchase coolers to chill the milk. If farmers deliver milk they can have
shares in this. It depends per farmers’ organization whether they automatically start deducting to
pay for a share through a check-off system for the milk that you deliver, what the price is for a
share, and up to which maximum you can have a share. As soon as you have one share you can
start participating in decision making processes, and you get dividend at the end of the year if
profit is made (interviews Kitur and Paul, June 14 and July 14 2016).
There are differences between members and active members. The active members are
members that deliver daily, the other members do not deliver daily (interview Kiplimo, July 20,
2016).
Processors The main formal dairy processors in Nandi and Bomet county are New KCC and Brookside
Dairy LTD (hereafter referred to as Brookside). As can be seen in figure 9, New KCC has two
locations in Nandi county and one in Bomet county. The location in Kapsabet (Nandi county) is
a milk cooling plant, just like the location in Lessos (Nandi county bordering Uasin Gishu

43
county). As there are no other processors in the county either, there is no milk processing facility
in Nandi county. The New KCC location in Eldoret (above-right to the Kapsabet location) is
however relatively close by, and it is a sales depot and processing factory. The location in Sotik
(Bomet county bordering Kericho county) is a processing factory, and is thereby the only
location in Bomet county where milk is processed.
Figure 9 Locations of New KCC in Kenya, not on the map is a location in Mombassa. Indicated with colors are the three locations in Nandi – and Bomet county (adjusted from www.newkcc.co.ke/branches-2 on October 5, 2016).
The capacity of the cooling plant in Sotik is 300,000L, and in Kapsabet and Lessos is both
100,000L. The cooling plants of New KCC also have smaller coolers and satellite coolers that are
not indicated on this map. Two other relatively close cooling plants to Sotik, one in Molo and
one in Kigoris (both not in Bomet county), have a capacity of 80,000L and 20,000L. Then there
are eight satellite coolers in the area, of which the exact locations are un-known, but likely not
located in Bomet county as they were not mentioned by anyone else except New KCC
themselves. In Nandi county New KCC also has a 5000L cooling plant in Kaptel. A 5000L
cooling plant in Tinderet is almost functioning but currently lacks electricity.
The plant in Kapsabet currently receives 18,000L/day, of which about 5,000L from 250-
280 individual farmers; the rest is from groups. There are about 10 groups delivering at the
Kapsabet plant, of which the smallest deliver 500L/day and the largest 15,000L/day (interview
Kibet, New KCC Kapsabet). The plant in Sotik receives 120,000L/day, of which 70,000L is
processed in Sotik and the rest in Nairobi and Eldoret. In total 16,000 farmers bring milk, about
70% of them are from Bomet county. There are about 40 groups delivers with on average 300
members bus some have 5000 or more. The rest are individual deliverers, about 4000. They often
transport the milk at night (interview Kiptalam, July 4, 2016). New KCC has two routes,
Siongiroi – Makimeny – Sotik and Nderaweta – Balek – Olbutyo – Sotik. (interview Paul, July 4,
2016).

44
When delivering milk to the New KCC quality tests are done to decide whether the milk
is accepted. In particular, a lactometer test measures the density of the milk to make sure no
water is added, and an acidity test is done to test for sour milk (interview Kibet, April 28, 2016).
Brookside only has one chilling – and processing plant in Ruiru, close to Nairobi (figure 10).
Figure 10 Location of the only chilling – and processing plant of Brookside Dairy LTD (adjusted from Google Maps).
When Brookside picks the milk from the farmers’ organizations with which they have a contract,
they often bring it to Ruiru on the same day. There are also other smaller processors present such
as Daima, but the focus will remain on New KCC and Brookside as they are most present in the
counties Nandi – and Bomet.
Inputs The inputs that will be described in this section are described from a smallholder dairy producer
perspective. As well products such as dairy feed or drugs for cattle diseases, and extension
services such as trainings are described. The different marketing options for smallholder dairy
producers, namely formal (hubs and processors) and informal (individual costumers, middlemen)
will be elaborated upon too.
The two main channels for farmers to obtain products such as dairy feed and dairy cattle
disease drugs are agrovetstores and farmers organizations. Agrovetstores sell a variety of products
for farmers in general, so not specifically products for dairy. In almost all villages an agrovetstore
can be found, however the smaller the village, often the smaller the agrovetstore and amount of
products offered. A small agrovetstore survey about the main products purchased by dairy
farmers, its prices and suppliers was done in Nandi – and Bomet county. This survey was
conducted at the end of the fieldwork after having all the impressions from the smallholder dairy
producer surveys. In Nandi county three agrovetstore surveys were conducted of which one was

45
not finished, and in Bomet county seven agrovetstore surveys were conducted. The data for the
two counties is analyzed together as from fieldwork experiences there seems to be no significant
differences between the counties.
According to the participants there are two agrovetstores in Kaptel, nine in Kapsabet, two
in Olbutyo, four in Silibwet, five in Bomet, three in Kaplong, and nine or ten in Sotik, to give an
idea of how many agrovetstores there are, even in small centers such as Olbutyo.
Options with popular dairy products were given to see if they were available in the stores.
All of them sold dairy meal and dairy/salt/mineral licks, nine sold drugs against ticks, four sold
Boma Rhodes seeds, and one sold hay. Thereafter it was indicated whether they sold fodder
legume seeds. Two sold both Desmodium and Lucerne seeds, respectively for 5500 and 3400
KES/kg (Desmodium) and for 2800 and 2400 KES/kg.
Table 21 shows what according to the participants the three most popular products were
for dairy farmers. Dairy meal is mentioned seven times and a good second place is for mineral
licks.
Table 21 Most popular products bought by dairy producers according to agrovetstore employees (N=10).
Most popular product Second most popular product Third most popular product 1 Dairy meal (N=6) Drugs against ticks (N=5) Dairy/salt/mineral licks (N=6) 2 Drugs against ticks (N=3) Dairy/salt/mineral licks (N=3) Dairy meal (N=1) 3 Dairy/salt/mineral licks (N=1) Dairy meal (N=2) Drugs against ticks (N=1)
The main companies that supply their agrovetstores with these dairy products are Unga feeds ltd.,
Norbrook, Ultravetis, Farmcare, and Coopers. 15 different companies were named as suppliers
for mineral licks, 10 for dairy meal, and 7 for drugs against ticks, suggesting a greater variety in
the available suppliers of mineral licks than for drugs against ticks. Unga feeds ltd. was mentioned
as supplying all three products. Most dairy meal is produced around Nakuru, and most mineral
licks and drugs seem to be from Nairobi. These suppliers do not have contracts with all the
agrovets, but usually only with the larger ones in the bigger towns. These larger agrovets then
serve as a supplier to the other smaller agrovetstores: when these small agrovetstores need
products they order them at the agrovetstore that is contracted with a supplier.
In Bomet there is one large scale feed producer, and the county stimulates the growth of
Boma Rhodes, a fodder grass, by distributing seeds for a small price (interview Kiprotich, June
13, 2016). In Nandi there are not feed processors. For feed there are millers in Eldoret and
Kisumu. Feed is also not mixed in Nandi county (interview Jepchumba, May 3, 2016). Prices for
feeds, drugs and other inputs are regarded as quite high, which according to the actors leads to
the desire to produce own feeds: ‘I haven’t seen any feed manufacturers here. The prices for feeds, drugs and
other inputs are high, that is why we need to produce feeds ourselves’ Brookside representative (at KDB
stakeholder meeting, June 9, 2016). There is Rift Valley Hay Growers associations based in
Nakuru that started producing feeds on a large scale since last year, targeting among others the
counties Nandi and Bomet (interview Kiptalam, July 4, 2016). Farmers’ organization Siongiroi
started requesting from its members to also produce Boma Rhodes by proving small scale
farmers around the area with all the inputs they needed. They were then selling the feed to the
organization. This is how last year they had 3700 bales of Boma Rhodes hay (interview Kitur,
June 14, 2016).
In terms of extension services, current programs in the counties are the IFAD funded
Smallholder Dairy Commercialization Program (SDCP); SNV’s Kenya market led dairy

46
programme (based in Eldoret); Kenya Agricultural Value Chain Enterprise (KAVC), also based in
Eldoret; East African Dairy Development (EADD) program, of which the first phase was
implemented from 2007 till 2013. A second phase is underway. EADD is a consortium with
among others ILRI, IFAD, and ICRAF. Other partners are TechnoServe, USAID and
WorldVision (interview Kipngetich, April 26, 2016). Most of these programs have a ‘hub’-
approach: they stimulate and support the establishment and growth of dairy farmers’
organizations (interview Jepchumba, May 3, 2016).
The county governments support dairy development through services such as subsidized
AI, subsidized seeds for fodder grass, subsidized vaccinations, and through trainings by extension
service county staff that is freely accessible (interview Ken, July 12, 2016). Most farmers’
organizations also offer services, of which a first service is often the availability of inputs through
an agrovetstore connected to the organization. The larger organizations offer trainings on a
regular basis for instance on feed conservation. There are also private extension services, most
notably the private vets that operate in the counties. In Bomet there are around 200: ‘they are
allowed to operate because they are licenced, but we regulate them, and they are not allowed to do vaccinations
because that is something that only counties are allowed to do according to legislation’ (interview Ken, July 12,
2016). There are some issues with the private vets as they sometimes on purpose overdose or
underdose animals to get more money from farmers. They should also report monthly to the
county to give a disease picture, but they don’t. ‘Like with corruption, we can’t live without them and we
can’t live with them’ (ibid.), the latter because the counties are not with enough staff the offer vet
services to all that require this.
Output markets According to the county director marketing (at KDB stakeholder meeting in Bomet town, June 9, 2016), last year of the 201 million liters of milk that was produced, 47% was marketed. Of that 47% about 10-15% is marketed formally, and the rest informally. This corresponds with national data.
From the participants to the survey, 99.6% of the households use the milk for household
consumption, except one respondent who sells all the milk (so N=239, one missing value). Three
households only used the milk for household consumption and did not sell the milk, so 98.7% of
the households (N=239) sells the milk. Of that 98.7%, 120 households (50.8%) sell to the formal
market, which is either directly to the processors (7.6%) but mostly to farmers’ organizations
(43.2%). In total 147 households (N=236) sell to the informal market, which is 62.3%. They
mostly sell to individual costumers (43.6%), or to informal traders or so called hawkers, hereafter
referred to as middlemen (28%). 205 households, which is 86.9%, sell only to either the formal –
or the informal market. 31 households (13.1%) sell to both formal – and informal markets. See
table 22 for an overview.
Table 22 Household consumption and selling of milk.
Use of milk Total Percentage % of total Household consumption 238 (N=239) 99.6 Sold to formal market Processors 18 (N=236) 7.6
Farmers’ organizations 102 (N=236) 43.2 Sold to informal market Individual costumers 103 (N=236) 43.6
Middlemen 66 (N=236) 28.0

47
For decisions with regards to where and how the sell the milk, there are differences to be seen for
the morning – and evening milk (table 23).
Table 23 Gender: milk marketing and managing of money.
Decides where to sell the milk Manages the money Morning milk (N=238) Head 158 (66.4%) 152 (63.9%) Spouse 69 (29%) 75 (31.5%) Other 11 (4.6%) 11 (4.6%) Evening milk (N=153) Head 59 (38.6%) 54 (35.3%) Spouse 86 (56.2%) 91 (59.5%) Other 8 (5.2%) 8 (5.2%)
Table 23 reveals household dynamics, namely that for morning milk the household head mostly
decides where to sell the milk. They are also managing the money of the morning milk, although
for a small % this is then done by the spouse. For the evening milk, it is clear that the spouse
dominates decisions on where to sell the milk and mostly manages the money.
There are differences as to how the milk is used in terms of consumption and the actors
to which it is sold between the evening and the morning milk (table 24).
Table 24 Percentages on what on average is done with morning and evening milk.
Morning milk Evening milk % spend on household consumption 6.9 68.2 % sold to individual costumers 50.0 42.6 % sold to processors 90.9 28.2 % sold to middlemen 91.0 13.9 % sold to farmers’ organization 93.2 24.8
The clear tendency we see is that morning milk is sold and that evening milk is consumed. The
percentage that is sold to individual costumers is more or less the same for morning and evening
milk, which is different from the other channels. This indicates the need of individual costumers
for milk both in the morning and evening, and the accessibility of this channel. Middlemen also
mostly seem to be active in the morning, as of course it is more difficult to transport the money
to profitable places and find buyers in the evening compared to in the morning. For the
processors and farmers’ organization the percentages varied from 0% to almost all with regards
to evening milk, so this seems to depend on the household and whether there is the option to
bring your evening milk to the processor or the chilling plant. This already reveals some
interesting patterns in terms of smallholders’ articulation to the milk market. However, this study
aims at understanding more in detail marketing behavior. In order to do so it is now explored
what type of groups of smallholders can be created; to then find out whether there are
differences in how the groups are articulated to the milk market and what factors influence this.

48
Chapter 2: Typology of smallholder dairy farmers Dairy smallholder producers are many in Kenya. As they are a diverse group it cannot be
assumed they are homogeneous in characteristics. This chapter therefore aims at further
exploring the main actor of interest of this study, namely the smallholder dairy producers by
finding out what smallholder dairy producer groups can be created, thereby answering the second
sub question. This is desired for a better understanding of marketing behavior of different types
of smallholders. Knowing how different types of smallholders are articulated to the formal and
informal milk market is crucial in developing strategies to increase the uptake of improved CSA
practices and in better understanding whether it is desired to upgrade smallholders, why (not),
and if so, how best to do this. To form the groups a Hierarchical Cluster Analysis (HCA) in IBM
SPSS Statistics version 24 is conducted of which the results are presented here.
Hierarchical cluster analysis The goal of the HCA is to create and identify different groups. This can be done without
knowing in advance who belongs in which group, or the number of groups (clusters) you have.
This method is very useful for instance when wanting to identify people with similar purchasing
patterns so that marketing strategies can be adopted to this (Nurusis, 2012). As this analysis
clusters people based on certain variables, it is very helpful in creating a typology of the
smallholder dairy farmers. This knowledge is needed to find out more about marketing behavior,
namely, in the next chapter it will be explored how each of the smallholder producer groups is
articulated to the milk market.
For cluster analysis, first the variables on which you desire the cluster to be similar/different need
to be chosen. For HCA in specific, after selecting the variables, a statistic that quantifies how far
apart or similar the two cases are needs to be chosen. Following, a method for forming the
groups has to be decided upon. Then it will be determined how many clusters are desired; this
can be done by looking at how similar clusters are when additional clusters are created, or when
existing ones are collapsed (Nurusis, 2012).
The default of the HVA in SPSS is set to agglomerative, which means that the analysis
starts with seeing each case as a cluster of itself. The other option is a divisive analysis, which
starts with everybody in one cluster. For this analysis the default is used: agglomerative clustering.
The cluster method is set to the between-group linkage, so that SPSS will compute the
smallest average distance between the cases. The measure for forming the groups that is used is
the Squared Euclidean Distance. Considering the different units of measurements of the
variables, this is a reliable method as it is the sum of the squared differences over all the variables.
However, this measure is dependent on the units of measurements of the variables, when
variables are measured on different scales, the variables with large variables contribute more to
the distance measure than variables with small values (Nurusis, 2012: 365). Therefore, the
variables as presented below are standardized to z-scores so that they all contribute equally.
Selection of variables The aim is to get groups that are formed based on factors that are expected to influence how
households decide where the milk is sold, which will be explored in the next chapter. Therefore,
first of all variables about household characteristics are selected. As farming practices to a large

49
extend influence the amount of milk a cow gives, thus the surplus that can be sold, there are two
variables about grazing added as well. Based on the experiences from the field there are
differences per ward with regards to the presence of marketing actors: geographical factors seem
to be influential and determining with regards to smallholders marketing behavior. Therefore the
geographical variable ‘distance to cooling plant’ is created and incorporated. The expectation is
that based on the selected variables there are different groups found with different characteristics.
The variables that describe household characteristics that are selected for the HCA are:
Dependency ratio
Gender of household head
Income category
Owned land size (in acres)
Number of cows
The first four variables are selected because, based on the fieldwork impressions and general
impressions from literature, they seem important with regards to the general functioning of the
household. The number of cows is selected because this makes the typology more specific with
regards to the topic of dairy. As feeding practices are very important with regards to the milk
production of the cow, the following variables about production practices are included:
Only grazing (or also additional feeding in dry season) - yes/no
Only grazing (or also additional feeding in rainy season) - yes/no
A geographical variable is added. Even though there is data on proximity to markets, this data
does not say that much as in almost all villages there is a market someday, even though often very
small. Instead of using this data on markets/proximity to the village, the following geographical
variable is used, which is also more in line with the topic of the research:
Distance to nearest cooling plant (in km).
The dependency ratio is calculated as follows based on information from the survey about how
many people in the household are below 15 years old, above 65 years old, and total household
members present: (Number of dependents (< 15; > 65) / Population (15-65)) * 100%. It is an
interval variable.
The gender of household head has been coded as 1: male, 2: female, and is thereby a
binary variable.
The income categories used in the survey, based on an earlier EADD survey, are: Less
than 2.500 KES, 2.500 – 5.000 KES, 5.000 – 10.000 KES, 10.000 – 20.000 KES, 20.000 – 30.000
KES, and more than 30.000 KES. From low to high incomes the options have been coded 1 to
6.
The options for grazing practices in the survey were categorized as follows: only grazing,
mainly grazing and some stall feeding, 50% grazing and 50% stall feeding, mainly stall feeding
and some grazing, and only stall feeding - zero grazing. For the HCA the option ‘only grazing’
has been coded as 1 and the other options as 0, so they are dummy variables.
The distance to the cooling plant is not something that has literally been asked to all the
participants of the survey. In the beginning this was asked, but later the question was skipped and
the following were asked: how far is the closest milk collection point that you use, and does this
collection point have a chilling plant. Only people who use a collection point answered these
questions. Knowing the locations of the participants, the locations of chilling plants in Nandi –

50
and Bomet county and having some data about it, it was roughly estimated how far the chilling
plants were for all the households using the GPS coordinates in Ona server and Google maps.
See table 25 for an overview of the types of variables used.
Table 25 Types of variables used for the HCA.
Variables Types of variable In SPSS Dependency ratio Interval Scale Gender of household head Categorical Nominal Income category Ordinal Ordinal Owned land size (in acres) Interval Scale Number of cows Interval Scale Only grazing (dry season) Categorical (Dummy) Nominal Only grazing (rainy season) Categorical (Dummy) Nominal Distance to nearest cooling plant (in km) Interval Scale
Regarding the selected variables, the statistics for the whole data set are presented in Chapter 1.
Clusters For forming the groups (or clusters as they are called in SPSS), there is no right or wrong with
regards to how many clusters you will get as this can be decided upon according to one’s own
desire (Norusis, 2016: 364). What you do however want to get from a HCA is clusters with more
or less the same amount of cases: a cluster of 4 cases is not desirable and does not say much. As
the sample size is 240, the aim of the HCA is to get three or four cluster, each cluster having at
least 20 cases. Therefore the analysis is executed as indicated above, with the variables as
presented above. How many clusters is desired can be done by looking at how similar clusters are
when additional clusters are created or when existing ones are collapsed, as explained earlier. As
outliers have to be dropped in statistics, it is desirable to get the outliers in one small cluster that
can then be dropped. Therefore, there was asked for six clusters, after which outliers were
dropped. This process continued three times, each time dropping cases, after which there seemed
to be at least three groups of a size of >20. The cluster analysis was thereafter processed for four
clusters, and the following groups were presented: cluster 1 (N=142), cluster 2 (N=18), cluster
3 (N=30), cluster 4 (N=39) with a total of N=219. Additional tries were done to find better
groups, in particular to see if cluster two could get bigger, but this was not the case so therefore
this is the best outcome. Even though cluster 2 has N<20, it is kept as this is a small sample and
could still show interesting results. As there are now four groups created while including as
much cases as possible, these are the groups that will be used for further analysis and will be
referred to as G(roup)1, G2, G3 and G4. See table 26 for the cluster summary. See appendix 5
for the SPSS outputs (agglomeration schedule and cluster membership).
Table 26 Case Processing Summary of HCA.
Case Processing Summarya Cases
Valid Missing Total N Percent N Percent N Percent
219 100,0% 0 0,0% 219 100,0% a. Squared Euclidean Distance used
A One-Way ANOVA is done to see whether there are significant differences between the
clusters. First the homogeneity of variances is tested to see which post hoc test to use. The

51
variance is the average of the squared distances from the mean. Under ‘option’ under the One-
Way ANOVA ‘homogeneity of variance test’ is ticked, see table 27 for the result.
Table 27 Results of test of Homogeneity of Variances.
Test of Homogeneity of Variances
Levene Statistic df1 df2 Sig.
dependency ratio 1,163 3 215 ,325 gender household head 16,343*** 3 215 ,000 income category 5,870*** 3 215 ,001 nr. of cows 8,257*** 3 215 ,000 distance to cooler (km) 8,958*** 3 215 ,000 owned land size (acres) 2,502* 3 215 ,060 only grazing (dry season) 91,506*** 3 215 ,000 only grazing (rainy season)
3,742** 3 215 ,012
* Significant at the 0.1 level. ** Significant at the 0.05 level. *** Significant at the 0.01 level. The significant variables in table 27 are all variables except dependency ratio. This shows that for that variable equal variances cannot be assumed, so in the One-Way ANOVA for the post hoc test the Games-Howell is used. For the other variables post hoc test Tukey is used. See table 28 for the descriptive statistics. Table 28 Descriptives from One-Way Anova.
Descriptives
N Mean Std.
Deviation Std. Error
95% Confidence Interval for Mean
Minimum Maximum Lower Bound
Upper Bound
gender household head
1 142 1.13 .342 .029 1.08 1.19 1 2 2 18 1.11 .323 .076 .95 1.27 1 2 3 20 2.00 .000 .000 2.00 2.00 2 2 4 39 1.00 .000 .000 1.00 1.00 1 1 Total 219 1.19 ,391 ,026 1,14 1,24 1 2
income category 1 142 4,30 1,276 ,107 4,08 4,51 1 6 2 18 5,72 ,575 ,135 5,44 6,01 4 6 3 20 3,85 1,137 ,254 3,32 4,38 2 6 4 39 4,62 1,091 ,175 4,26 4,97 2 6 Total 219 4,43 1,259 ,085 4,26 4,60 1 6
nr. of cows 1 142 2,04 1,017 ,085 1,87 2,21 1 6 2 18 5,00 1,414 ,333 4,30 5,70 3 8 3 20 2,35 1,182 ,264 1,80 2,90 1 5 4 39 2,79 1,641 ,263 2,26 3,33 1 7 Total 219 2,45 1,443 ,098 2,26 2,64 1 8
distance to cooler (km)
1 142 6,471 6,6319 ,5565 5,371 7,571 ,1 23,0 2 18 1,900 1,7912 ,4222 1,009 2,791 ,2 8,0 3 20 5,675 6,1074 1,3657 2,817 8,533 ,3 22,0 4 39 7,841 6,9538 1,1135 5,587 10,095 ,2 23,0 Total 219 6,267 6,5157 ,4403 5,399 7,134 ,1 23,0
owned land size (acres)
1 142 2,873 2,2546 ,1892 2,499 3,247 ,0 14,0 2 18 10,417 3,1166 ,7346 8,867 11,967 6,0 18,0 3 20 3,190 2,6220 ,5863 1,963 4,417 ,5 9,0 4 39 3,626 2,7353 ,4380 2,739 4,512 ,5 10,0 Total 219 3,656 3,1847 ,2152 3,232 4,080 ,0 18,0
only grazing (dry season)
1 142 ,01 ,084 ,007 -,01 ,02 0 1 2 18 ,00 ,000 ,000 ,00 ,00 0 0 3 20 ,75 ,444 ,099 ,54 ,96 0 1 4 39 1,00 ,000 ,000 1,00 1,00 1 1 Total 219 ,25 ,435 ,029 ,19 ,31 0 1
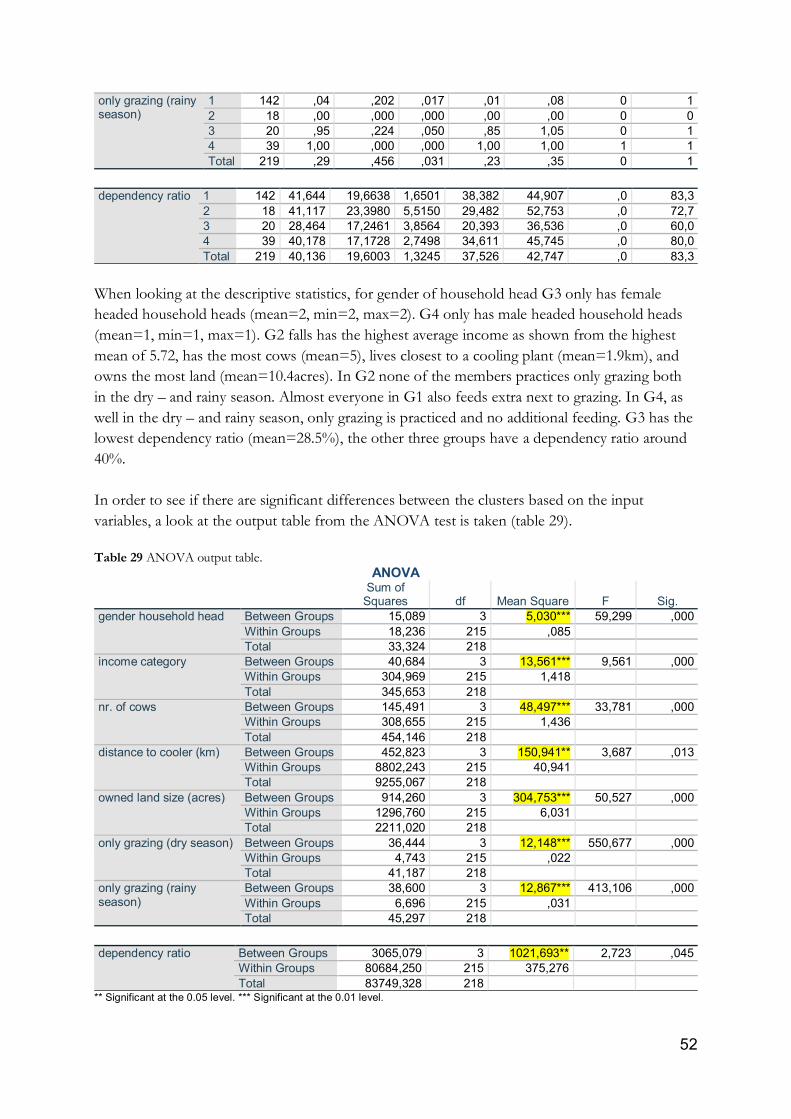
52
only grazing (rainy season)
1 142 ,04 ,202 ,017 ,01 ,08 0 1 2 18 ,00 ,000 ,000 ,00 ,00 0 0 3 20 ,95 ,224 ,050 ,85 1,05 0 1 4 39 1,00 ,000 ,000 1,00 1,00 1 1 Total 219 ,29 ,456 ,031 ,23 ,35 0 1
dependency ratio 1 142 41,644 19,6638 1,6501 38,382 44,907 ,0 83,3
2 18 41,117 23,3980 5,5150 29,482 52,753 ,0 72,7 3 20 28,464 17,2461 3,8564 20,393 36,536 ,0 60,0 4 39 40,178 17,1728 2,7498 34,611 45,745 ,0 80,0 Total 219 40,136 19,6003 1,3245 37,526 42,747 ,0 83,3
When looking at the descriptive statistics, for gender of household head G3 only has female
headed household heads (mean=2, min=2, max=2). G4 only has male headed household heads
(mean=1, min=1, max=1). G2 falls has the highest average income as shown from the highest
mean of 5.72, has the most cows (mean=5), lives closest to a cooling plant (mean=1.9km), and
owns the most land (mean=10.4acres). In G2 none of the members practices only grazing both
in the dry – and rainy season. Almost everyone in G1 also feeds extra next to grazing. In G4, as
well in the dry – and rainy season, only grazing is practiced and no additional feeding. G3 has the
lowest dependency ratio (mean=28.5%), the other three groups have a dependency ratio around
40%.
In order to see if there are significant differences between the clusters based on the input
variables, a look at the output table from the ANOVA test is taken (table 29).
Table 29 ANOVA output table.
ANOVA
Sum of
Squares df Mean Square F Sig. gender household head Between Groups 15,089 3 5,030*** 59,299 ,000
Within Groups 18,236 215 ,085 Total 33,324 218
income category Between Groups 40,684 3 13,561*** 9,561 ,000 Within Groups 304,969 215 1,418 Total 345,653 218
nr. of cows Between Groups 145,491 3 48,497*** 33,781 ,000 Within Groups 308,655 215 1,436 Total 454,146 218
distance to cooler (km) Between Groups 452,823 3 150,941** 3,687 ,013 Within Groups 8802,243 215 40,941 Total 9255,067 218
owned land size (acres) Between Groups 914,260 3 304,753*** 50,527 ,000 Within Groups 1296,760 215 6,031 Total 2211,020 218
only grazing (dry season) Between Groups 36,444 3 12,148*** 550,677 ,000 Within Groups 4,743 215 ,022 Total 41,187 218
only grazing (rainy season)
Between Groups 38,600 3 12,867*** 413,106 ,000 Within Groups 6,696 215 ,031 Total 45,297 218
dependency ratio Between Groups 3065,079 3 1021,693** 2,723 ,045
Within Groups 80684,250 215 375,276 Total 83749,328 218
** Significant at the 0.05 level. *** Significant at the 0.01 level.
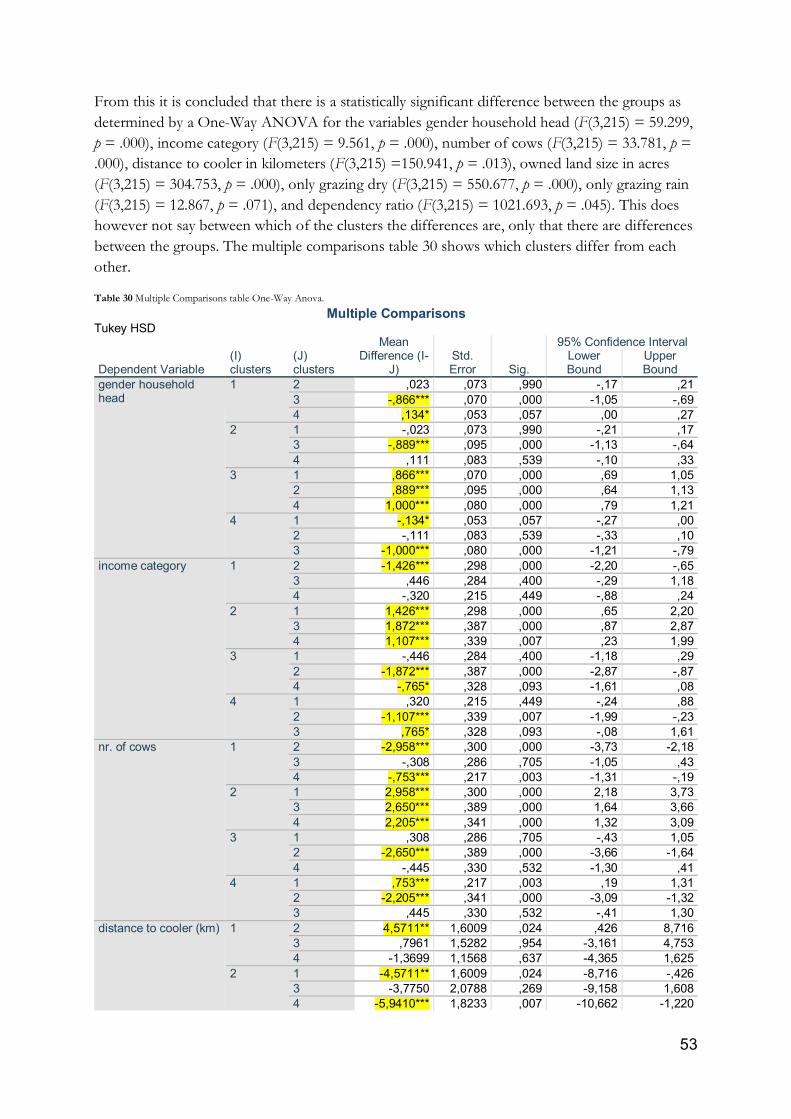
53
From this it is concluded that there is a statistically significant difference between the groups as
determined by a One-Way ANOVA for the variables gender household head (F(3,215) = 59.299,
p = .000), income category (F(3,215) = 9.561, p = .000), number of cows (F(3,215) = 33.781, p =
.000), distance to cooler in kilometers (F(3,215) =150.941, p = .013), owned land size in acres
(F(3,215) = 304.753, p = .000), only grazing dry (F(3,215) = 550.677, p = .000), only grazing rain
(F(3,215) = 12.867, p = .071), and dependency ratio (F(3,215) = 1021.693, p = .045). This does
however not say between which of the clusters the differences are, only that there are differences
between the groups. The multiple comparisons table 30 shows which clusters differ from each
other.
Table 30 Multiple Comparisons table One-Way Anova.
Multiple Comparisons Tukey HSD
Dependent Variable (I) clusters
(J) clusters
Mean Difference (I-
J) Std. Error Sig.
95% Confidence Interval Lower Bound
Upper Bound
gender household head
1 2 ,023 ,073 ,990 -,17 ,21 3 -,866*** ,070 ,000 -1,05 -,69 4 ,134* ,053 ,057 ,00 ,27
2 1 -,023 ,073 ,990 -,21 ,17 3 -,889*** ,095 ,000 -1,13 -,64 4 ,111 ,083 ,539 -,10 ,33
3 1 ,866*** ,070 ,000 ,69 1,05 2 ,889*** ,095 ,000 ,64 1,13 4 1,000*** ,080 ,000 ,79 1,21
4 1 -,134* ,053 ,057 -,27 ,00 2 -,111 ,083 ,539 -,33 ,10 3 -1,000*** ,080 ,000 -1,21 -,79
income category 1 2 -1,426*** ,298 ,000 -2,20 -,65 3 ,446 ,284 ,400 -,29 1,18 4 -,320 ,215 ,449 -,88 ,24
2 1 1,426*** ,298 ,000 ,65 2,20 3 1,872*** ,387 ,000 ,87 2,87 4 1,107*** ,339 ,007 ,23 1,99
3 1 -,446 ,284 ,400 -1,18 ,29 2 -1,872*** ,387 ,000 -2,87 -,87 4 -,765* ,328 ,093 -1,61 ,08
4 1 ,320 ,215 ,449 -,24 ,88 2 -1,107*** ,339 ,007 -1,99 -,23 3 ,765* ,328 ,093 -,08 1,61
nr. of cows 1 2 -2,958*** ,300 ,000 -3,73 -2,18 3 -,308 ,286 ,705 -1,05 ,43 4 -,753*** ,217 ,003 -1,31 -,19
2 1 2,958*** ,300 ,000 2,18 3,73 3 2,650*** ,389 ,000 1,64 3,66 4 2,205*** ,341 ,000 1,32 3,09
3 1 ,308 ,286 ,705 -,43 1,05 2 -2,650*** ,389 ,000 -3,66 -1,64 4 -,445 ,330 ,532 -1,30 ,41
4 1 ,753*** ,217 ,003 ,19 1,31 2 -2,205*** ,341 ,000 -3,09 -1,32 3 ,445 ,330 ,532 -,41 1,30
distance to cooler (km) 1 2 4,5711** 1,6009 ,024 ,426 8,716 3 ,7961 1,5282 ,954 -3,161 4,753 4 -1,3699 1,1568 ,637 -4,365 1,625
2 1 -4,5711** 1,6009 ,024 -8,716 -,426 3 -3,7750 2,0788 ,269 -9,158 1,608 4 -5,9410*** 1,8233 ,007 -10,662 -1,220

54
3 1 -,7961 1,5282 ,954 -4,753 3,161 2 3,7750 2,0788 ,269 -1,608 9,158 4 -2,1660 1,7598 ,608 -6,722 2,390
4 1 1,3699 1,1568 ,637 -1,625 4,365 2 5,9410*** 1,8233 ,007 1,220 10,662 3 2,1660 1,7598 ,608 -2,390 6,722
owned land size (acres)
1 2 -7,5441*** ,6145 ,000 -9,135 -5,953 3 -,3175 ,5866 ,949 -1,836 1,201 4 -,7531 ,4440 ,328 -1,903 ,396
2 1 7,5441*** ,6145 ,000 5,953 9,135 3 7,2267*** ,7979 ,000 5,161 9,293 4 6,7910*** ,6998 ,000 4,979 8,603
3 1 ,3175 ,5866 ,949 -1,201 1,836 2 -7,2267*** ,7979 ,000 -9,293 -5,161 4 -,4356 ,6754 ,917 -2,185 1,313
4 1 ,7531 ,4440 ,328 -,396 1,903 2 -6,7910*** ,6998 ,000 -8,603 -4,979 3 ,4356 ,6754 ,917 -1,313 2,185
only grazing (dry season)
1 2 ,007 ,037 ,998 -,09 ,10 3 -,743*** ,035 ,000 -,83 -,65 4 -,993*** ,027 ,000 -1,06 -,92
2 1 -,007 ,037 ,998 -,10 ,09 3 -,750*** ,048 ,000 -,87 -,63 4 -1,000*** ,042 ,000 -1,11 -,89
3 1 ,743*** ,035 ,000 ,65 ,83 2 ,750*** ,048 ,000 ,63 ,87 4 -,250*** ,041 ,000 -,36 -,14
4 1 ,993*** ,027 ,000 ,92 1,06 2 1,000*** ,042 ,000 ,89 1,11 3 ,250*** ,041 ,000 ,14 ,36
only grazing (rainy season)
1 2 ,042 ,044 ,774 -,07 ,16 3 -,908*** ,042 ,000 -1,02 -,80 4 -,958*** ,032 ,000 -1,04 -,88
2 1 -,042 ,044 ,774 -,16 ,07 3 -,950*** ,057 ,000 -1,10 -,80 4 -1,000*** ,050 ,000 -1,13 -,87
3 1 ,908*** ,042 ,000 ,80 1,02 2 ,950*** ,057 ,000 ,80 1,10 4 -,050 ,049 ,732 -,18 ,08
4 1 ,958*** ,032 ,000 ,88 1,04 2 1,000*** ,050 ,000 ,87 1,13 3 ,050 ,049 ,732 -,08 ,18
Games-Howell dependency ratio 1 2 ,5273 5,7565 1,000 -15,574 16,628
3 13,1802** 4,1946 ,020 1,687 24,673 4 1,4664 3,2070 ,968 -6,980 9,913
2 1 -,5273 5,7565 1,000 -16,628 15,574 3 12,6528 6,7295 ,257 -5,610 30,916 4 ,9391 6,1625 ,999 -15,976 17,854
3 1 -13,1802** 4,1946 ,020 -24,673 -1,687 2 -12,6528 6,7295 ,257 -30,916 5,610 4 -11,7138* 4,7364 ,080 -24,434 1,006
4 1 -1,4664 3,2070 ,968 -9,913 6,980 2 -,9391 6,1625 ,999 -17,854 15,976 3 11,7138* 4,7364 ,080 -1,006 24,434
* Significant at the 0.1 level. ** Significant at the 0.05 level. *** Significant at the 0.01 level.
A Tukey post hoc test (table 30) reveals that there are statistically significantly more female
headed household heads in G3 compared to G1 (p = .000), G2 (p = .000) and G4 (p = .000).
There is a weak statistically significant difference between G1 and G4, where G4 for has more

55
male headed household heads (p = .057). This is evident from the descriptive statistics table as
well. There is also a statistically significant difference in income category between the G2 and G1
(p = .000), G3 (p = .000) and G4 (p = .007), where G2 falls in the highest income category, and
between G3 and G4 (p = 0.093), where G4 has a higher income than G3. G2 also shows to have
statistically significant more cows than G1 (p = .000), G3 (p = .000) and G4 (p = .000). G4 also
statistically significant has more cows than G1 (p = .003). The households in G2 further live
statistically significantly closer to a cooler than the households in G1 (p = .024) and G4 (p =
.007). On top of that, G2 shows to own statistically significant more land than G1 (p = .000), G3
(p = .000) and G4 (p = .000). With regards to grazing practices in the dry season, G4 statistically
significantly practices more only grazing than G1 (p = .000), G2 (p = .000) and G3 (p = .000). G3
also practices statistically significant more only grazing in the dry season than G1 (p = .000) and
G2 (p = .000). For the rainy season, both G3 and G4 practice statistically significant more only
grazing than G1 (p = .000) and G2 (p = .000).
A Games-Howell post hoc test (bottom of table 30) reveals that G3 has a statistically
significant lower dependency ratio than G1 (p = .020) and G4 (p = .080).
To conclude, in table 31 all groups are assigned scores from one to four, one being most
favorable. For household heads, the groups with the most male household heads is regarded as
one since the absence of a male household head in these regions indicates that a women has to
provide for the household herself, which is often more difficult. The closer to a cooler, the
better, since this indicates access to the formal sector. Scoring high on only-grazing is regarded as
not favorable since cows need additional feeding for more milk production. A lower dependency
ratio is favorable over a higher one as this indicates the percentage of ‘dependent’ people in the
household: i.e. people below 15 and above 65 are assumed to be not able to provide for
themselves. From this we can see that G2 scores the best, followed by G4, G3, and G1, although
there is not a lot of difference between the last three groups in terms of scoring favorable on the
combination of selected variables for the HCA.
Table 31 Overview of the smallholder dairy producer groups as produced by a HCA in terms of favorable scores on the selected variables. It is assumed that the lower the total score the better.
HCA variables G1 G2 G3 G4 Male household head 3 2 4 1 Income category 3 1 4 2 Nr. of cows 4 1 3 2 Distance to cooler (km) 3 1 2 4 Owned land size (km) 4 1 3 2 Only grazing dry season 2 1 3 4 Only grazing rainy season 2 1 3 4 Dependency ratio 4 3 1 2
Total 25 11 23 21

56
Chapter 3: Market orientation and participation of smallholder dairy producers In order to better understand the functioning of the value chain, and in particular the milk market
from a producer perspective, this chapter answers the sub questions: How is each of the smallholder
dairy producer groups articulated to the milk market? and What factors shape participation in (in)formal
markets? To answer the first sub question, again a One-Way ANOVA is done in SPSS, which
enables to describe the groups in terms of market behavior, whether or not there is a difference
between the groups, and what this means. To answer the second sub question, a Probit
Regression Analysis (PRA) in SPSS is conducted analyzing which of the variables selected to
form the groups influence selling milk to the formal - and informal market.
Market orientation In order to find out whether or not there are statistically significant differences between how the
groups are articulated to the milk market, a one-way ANOVA is done using the following
variables:
Sell formal (dummy, 1=yes, 0=no)
Sell informal (dummy, 1=yes, 0=no)
The factor variable is the Average Linkage (Between Groups) created in the HCA in Chapter 3.
This results in table 32 with descriptive statistics.
Table 32 Descriptive statistics One-Way ANOVA formal and informal selling of milk.
Descriptives
N Mean Std.
Deviation Std. Error
95% Confidence Interval for Mean
Minimum Maximum Lower Bound
Upper Bound
sell formal
1 142 ,49 ,502 ,042 ,40 ,57 0 1 2 18 ,89 ,323 ,076 ,73 1,05 0 1 3 18 ,33 ,485 ,114 ,09 ,57 0 1 4 38 ,45 ,504 ,082 ,28 ,61 0 1 Total 216 ,50 ,501 ,034 ,43 ,57 0 1
sell informal
1 142 ,64 ,481 ,040 ,56 ,72 0 1 2 18 ,33 ,485 ,114 ,09 ,57 0 1 3 18 ,72 ,461 ,109 ,49 ,95 0 1 4 38 ,68 ,471 ,076 ,53 ,84 0 1 Total 216 ,63 ,484 ,033 ,56 ,69 0 1
From these descriptives we can see that G2 (mean = .89) sells to the formal market most,
followed by G1, G4, and G3. G3 (mean = .72) sells most to the informal market, followed by
G4, G1, and G2.
In order to see whether there are statistically significant differences between the groups, a look is
taken at the ANOVA output table (33, next page).
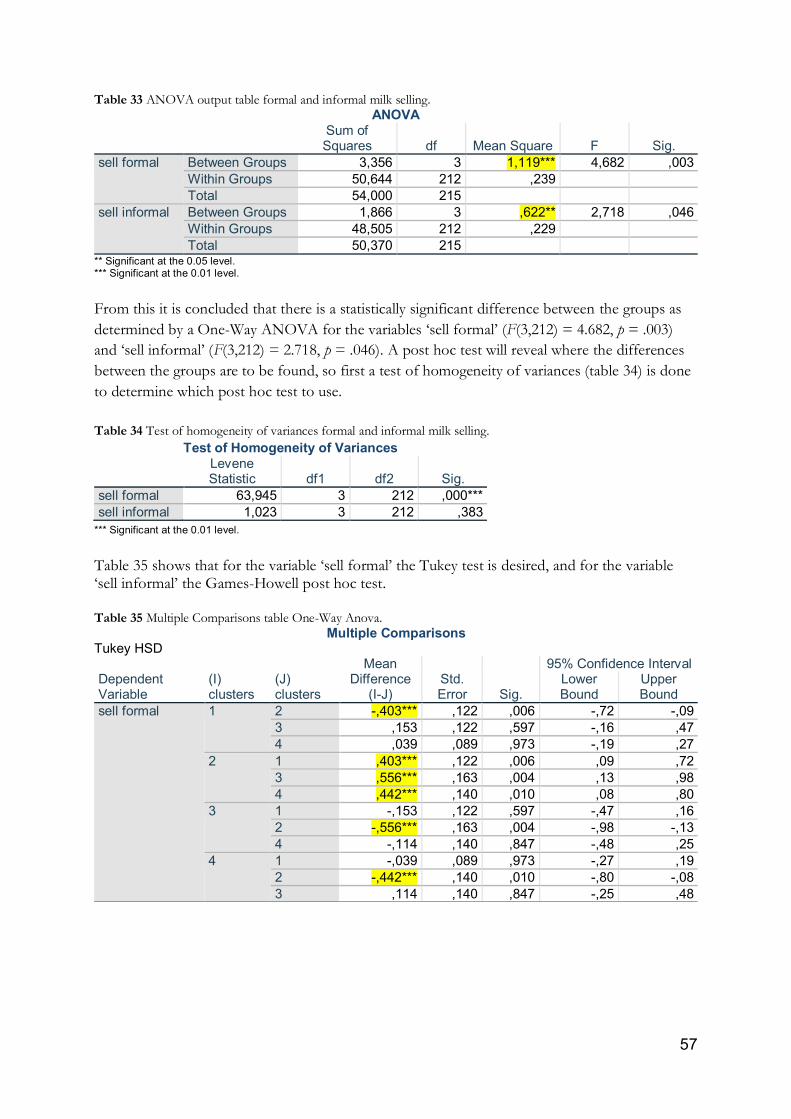
57
Table 33 ANOVA output table formal and informal milk selling.
ANOVA
Sum of Squares df Mean Square F Sig.
sell formal Between Groups 3,356 3 1,119*** 4,682 ,003 Within Groups 50,644 212 ,239 Total 54,000 215
sell informal Between Groups 1,866 3 ,622** 2,718 ,046 Within Groups 48,505 212 ,229 Total 50,370 215
** Significant at the 0.05 level. *** Significant at the 0.01 level.
From this it is concluded that there is a statistically significant difference between the groups as
determined by a One-Way ANOVA for the variables ‘sell formal’ (F(3,212) = 4.682, p = .003)
and ‘sell informal’ (F(3,212) = 2.718, p = .046). A post hoc test will reveal where the differences
between the groups are to be found, so first a test of homogeneity of variances (table 34) is done
to determine which post hoc test to use.
Table 34 Test of homogeneity of variances formal and informal milk selling.
*** Significant at the 0.01 level.
Table 35 shows that for the variable ‘sell formal’ the Tukey test is desired, and for the variable ‘sell informal’ the Games-Howell post hoc test.
Table 35 Multiple Comparisons table One-Way Anova.
Multiple Comparisons Tukey HSD
Dependent Variable
(I) clusters
(J) clusters
Mean Difference
(I-J) Std. Error Sig.
95% Confidence Interval Lower Bound
Upper Bound
sell formal 1 2 -,403*** ,122 ,006 -,72 -,09 3 ,153 ,122 ,597 -,16 ,47 4 ,039 ,089 ,973 -,19 ,27
2 1 ,403*** ,122 ,006 ,09 ,72 3 ,556*** ,163 ,004 ,13 ,98 4 ,442*** ,140 ,010 ,08 ,80
3 1 -,153 ,122 ,597 -,47 ,16 2 -,556*** ,163 ,004 -,98 -,13 4 -,114 ,140 ,847 -,48 ,25
4 1 -,039 ,089 ,973 -,27 ,19 2 -,442*** ,140 ,010 -,80 -,08 3 ,114 ,140 ,847 -,25 ,48
Test of Homogeneity of Variances
Levene Statistic df1 df2 Sig.
sell formal 63,945 3 212 ,000*** sell informal 1,023 3 212 ,383

58
Games-Howell sell informal 1 2 ,308* ,121 ,082 -,03 ,64
3 -,081 ,116 ,895 -,40 ,24 4 -,043 ,086 ,958 -,27 ,19
2 1 -,308* ,121 ,082 -,64 ,03 3 -,389* ,158 ,084 -,81 ,04 4 -,351* ,138 ,070 -,72 ,02
3 1 ,081 ,116 ,895 -,24 ,40 2 ,389* ,158 ,084 -,04 ,81 4 ,038 ,133 ,992 -,32 ,40
4 1 ,043 ,086 ,958 -,19 ,27 2 ,351* ,138 ,070 -,02 ,72 3 -,038 ,133 ,992 -,40 ,32
* Significant at the 0.1 level. ** Significant at the 0.05 level. *** Significant at the 0.01 level. A Tukey post hoc test (table 35) reveals that G2 statistically significantly sells more milk to the
formal market than G1 (p = .006), G3 (p = .004) and G4 (p = .010). A Games-Howell post hoc
test reveals that there is a weaker statistically significant difference between the same groups,
where G2 sells less milk to the informal market than G1 (p = .082), G3 (p = .084) and G4 (p =
.070).
Factors that influence market orientation Now that there are statistically significant differences between the smallholder dairy producer
groups and how they are articulated to the milk market, this section finds out what factors exactly
decrease or increase the probability of being part of the group that sells to the formal - or to the
informal market. A PRA in SPSS will provide insights. In a PRA the dependent variable can only
take two values, in this case selling to the formal market or not selling to the formal market. The
purpose of the PRA is to estimate the probability that a case is part of either the group that sells
milk to the formal market, or to the group that does not sell to the formal market, and is thereby
a binary classification type model (IDRE, 2016). This will be tested with the variables dependency
ratio, female household head, number of cows, distance to cooler, owned land, only grazing in
the dry season, and only grazing in the rainy season. These are the variables that were earlier
selected for the HCA, excluding the variable ‘income category’ as the variables used in a PRA can
only be dummy or scaler variables. The variable female household head is used instead of gender
of household head. The PRA is conducted using the ordinal regression model, setting the link
function to probit.
Table 36 Pseudo R-Square probit sell formal.
Pseudo R-Square Cox and Snell .784 Nagelkerke 1.000 McFadden 1.000 Link function: Probit.

59
Table 37 Parameter estimates probit sell formal.
Parameter Estimates
Estimate Std. Error Wald df Sig.
95% Confidence Interval
Lower Bound Upper Bound
Threshold [sell_formal = 0] .997 6.144 .026 1 .871 -11.046 13.039 [sell_formal = 1] 5.323 6.113 .758 1 .384 -6.658 17.304 [dependency_ratio=45.5] 9.634* 5.831 2.730 1 .099 -1.795 21.064 [nr_of_cows=1] -4.366*** 1.589 7.549 1 .006 -7.481 -1.252 [nr_of_cows=2] -3.718** 1.575 5.571 1 .018 -6.805 -.631 [nr_of_cows=3] -3.374** 1.608 4.405 1 .036 -6.525 -.223 [nr_of_cows=4] -2.604 1.605 2.631 1 .105 -5.751 .543 [nr_of_cows=5] -3.663** 1.753 4.364 1 .037 -7.099 -.226 [nr_of_cows=6] -3.149* 1.828 2.968 1 .085 -6.733 .434 [nr_of_cows=7] -1.841 1.843 .999 1 .318 -5.453 1.770 [nr_of_cows=8] .304 6.000 .003 1 .960 -11.456 12.064 [nr_of_cows=9] 0a . . 0 . . . [nr_of_cows=10] 0a . . 0 . . . [distance_cooler=.1] 5.168* 2.876 3.229 1 .072 -.469 10.804 [distance_cooler=.2] 4.171** 1.930 4.672 1 .031 .389 7.953 [distance_cooler=.3] -1.216 2.654 .210 1 .647 -6.418 3.986 [distance_cooler=.5] 2.832 1.758 2.596 1 .107 -.613 6.276 [distance_cooler=.6] 4.917** 2.151 5.223 1 .022 .700 9.133 [distance_cooler=.7] 3.667** 1.842 3.964 1 .046 .057 7.277 [distance_cooler=.8] .465 5.385 .007 1 .931 -10.090 11.020 [distance_cooler=1.0] 3.740** 1.758 4.523 1 .033 .293 7.186 [distance_cooler=1.5] 4.016** 1.826 4.839 1 .028 .438 7.595 [distance_cooler=2.0] 4.280** 1.850 5.352 1 .021 .654 7.907 [distance_cooler=2.5] 3.922** 1.759 4.969 1 .026 .474 7.370 [distance_cooler=3.0] 5.289*** 1.864 8.048 1 .005 1.635 8.943 [distance_cooler=5.0] 1.178 1.827 .416 1 .519 -2.402 4.758 [distance_cooler=6.0] -.557 2.238 .062 1 .803 -4.944 3.829 [distance_cooler=6.5] 4.530* 2.344 3.734 1 .053 -.065 9.124 [distance_cooler=7.0] 2.416 1.820 1.763 1 .184 -1.150 5.983 [distance_cooler=8.0] 3.023 2.375 1.621 1 .203 -1.631 7.677 [distance_cooler=9.0] 2.527 1.770 2.038 1 .153 -.942 5.996 [distance_cooler=11.0] 1.265 1.804 .492 1 .483 -2.271 4.801 [distance_cooler=12.0] -.154 2.736 .003 1 .955 -5.516 5.208 [distance_cooler=14.0] 1.809 2.233 .657 1 .418 -2.567 6.185 [distance_cooler=15.0] -1.446 3.117 .215 1 .643 -7.555 4.663 [distance_cooler=16.0] -.336 5.889 .003 1 .955 -11.879 11.207 [distance_cooler=17.0] -.126 2.752 .002 1 .963 -5.520 5.267 [distance_cooler=18.0] -.011 3.309 .000 1 .997 -6.497 6.474 [distance_cooler=20.0] -3.174 4.164 .581 1 .446 -11.336 4.987 [distance_cooler=21.0] .315 4.064 .006 1 .938 -7.651 8.281 [distance_cooler=22.0] -1.745 6.664 .069 1 .793 -14.806 11.317 [distance_cooler=23.0] 0a . . 0 . . .
Link function: Probit. a. This parameter is set to zero because it is redundant.

60
* Significant at the 0.1 level. ** Significant at the 0.05 level. *** Significant at the 0.01 level.
Table 37 shows the parameter estimates for the probit with the dependent variable ‘sell formal’;
only the variables with significant values are presented. For dependency ratio only the one (weak)
significant value is presented. For the full table and the case processing summary see appendix 6.
The following interesting conclusions can be made: with an R-square of 1 (Nagelkerke, table 36)
which shows that the model fits the data well, there is a significant probability that an increase in
cows leads to an increased probability of being part to the group that sells milk to the formal
sector. This makes sense if we assume that having more cows results in higher amounts of milk
per day, hence surplus to sell. Also, there is a significant probability that living within up to
around five kilometers from a cooling plant increases being part of the groups that sells milk to
the formal sector. This makes sense in terms of access to the formal market.
It is now clear that the number of cows and distance to the cooling plant statistically significant
influence the probability of selling to the formal market. There are also people who sell to both
the formal – and informal market(s), i.e. people who sell formally can also at the same time sell
informally, which means that different factors can influence selling to the informal market then
the factors that have a probability of influencing selling to the formal sector. Therefore, the same
procedure is repeated with the dependent variable being ‘sell informal’, to get a better idea of
what factors influence the probability of selling to the informal market.
Table 38 Pseudo R-Square probit sell informal.
Pseudo R-Square Cox and Snell .771 Nagelkerke 1.000 McFadden 1.000 Link function: Probit.
Table 39 Parameter estimates probit sell informal.
Parameter Estimates
Estimate Std. Error Wald df Sig.
95% Confidence Interval
Lower Bound
Upper Bound
Threshold [sell_informal = 0] -5.421 6.549 .685 1 .408 -18.258 7.416 [sell_informal = 1] -.473 6.488 .005 1 .942 -13.189 12.244 [dependency_ratio=70.0] -10.981* 6.360 2.981 1 .084 -23.447 1.484 [female_hh=0] -.901* .482 3.500 1 .061 -1.845 .043 [female_hh=1] 0a . . 0 . . . [male_hh=0] -.183 .202 .815 1 .367 -.579 .214 [male_hh=1] 0a . . 0 . . . [distance_cooler=.1] -4.761 5.259 .820 1 .365 -15.068 5.546 [distance_cooler=.2] -3.198*** 1.205 7.046 1 .008 -5.559 -.837 [distance_cooler=.3] -.352 1.273 .077 1 .782 -2.847 2.142 [distance_cooler=.5] -3.513*** 1.117 9.900 1 .002 -5.702 -1.325 [distance_cooler=.6] -.710 1.439 .243 1 .622 -3.531 2.111 [distance_cooler=.7] -3.986*** 1.283 9.647 1 .002 -6.501 -1.471 [distance_cooler=.8] -.580 3.300 .031 1 .860 -7.048 5.888

61
[distance_cooler=1.0] -1.150 1.013 1.290 1 .256 -3.135 .835 [distance_cooler=1.5] -7.366*** 2.050 12.905 1 .000 -11.384 -3.347 [distance_cooler=2.0] -4.416*** 1.279 11.926 1 .001 -6.923 -1.910 [distance_cooler=2.5] -3.346*** 1.071 9.766 1 .002 -5.444 -1.247 [distance_cooler=3.0] -3.666*** 1.194 9.419 1 .002 -6.007 -1.325 [distance_cooler=5.0] .122 1.230 .010 1 .921 -2.290 2.533 [distance_cooler=6.0] -.012 1.119 .000 1 .991 -2.206 2.181 [distance_cooler=6.5] .525 2.098 .063 1 .802 -3.587 4.637 [distance_cooler=7.0] -1.138 1.158 .965 1 .326 -3.408 1.132 [distance_cooler=8.0] -.003 1.976 .000 1 .999 -3.876 3.870 [distance_cooler=9.0] -1.288 1.084 1.414 1 .234 -3.412 .835 [distance_cooler=11.0] -.869 1.102 .621 1 .431 -3.029 1.292 [distance_cooler=12.0] -.045 1.247 .001 1 .971 -2.488 2.398 [distance_cooler=14.0] .118 1.577 .006 1 .940 -2.974 3.209 [distance_cooler=15.0] -.147 1.262 .014 1 .907 -2.621 2.327 [distance_cooler=16.0] 2.050 6.181 .110 1 .740 -10.065 14.166 [distance_cooler=17.0] .534 1.414 .143 1 .706 -2.237 3.304 [distance_cooler=18.0] .677 1.740 .151 1 .697 -2.734 4.088 [distance_cooler=20.0] .294 1.911 .024 1 .878 -3.451 4.039 [distance_cooler=21.0] .731 2.036 .129 1 .719 -3.258 4.721 [distance_cooler=22.0] -1.798 4.035 .199 1 .656 -9.706 6.110 [distance_cooler=23.0] 0a . . 0 . . .
Link function: Probit. a. This parameter is set to zero because it is redundant.
* Significant at the 0.1 level. ** Significant at the 0.05 level. *** Significant at the 0.01 level.
Table 39 shows the parameter estimates for the analysis with the dependent variable ‘sell
informal’; only the variables with significant values are presented. For dependency ratio only the
one (weak) significant value is presented. For the full table and the case processing summary see
appendix 7. The following interesting conclusions can be made: with an R-square of 1
(Nagelkerke, table 38), there is a strong significant probability of not selling to the informal
market (as the estimate values are negative) when living within up to three kilometers from a
cooling plant. This corresponds with the results from the PRA with the dependent variable ‘sell
formal’, and makes sense as people living close to chilling plants have relatively easier access to
the formal market than people living further away. Another interesting finding, however with
weak significance, is that the probability of being part of the group that sells the milk informally
decreases when the household head is not female. However, there is no significant probability of
being part of the groups that sells informally when the household head is female, male, or not
male, so this should not be taken very strongly.
To conclude, the factors that influence the probability of being part of the group that sells to the
formal market are the number of cows and the distance to cooling plants. The factor that
influence the probability of not being part of the group that sells the milk to the informal market
is distance to cooling plant, and possibly that the household head is not female. This indicates
that geographical characteristics and access to formal – and informal markets influences the
choice of marketing channel most, next to the number of cows; e.g. the amount of daily
produced milk. As the variable of distance to cooler is a scaler variable, it can be said that the

62
further away from a cooler, the less likely it is to be selling milk to a cooler, e.g. to the formal
market, or other formal marketing channels. The causality explanation however remains difficult
as this is not to be explained with these statistical tests. Therefore the following chapters will
contextualize these results more qualitatively.

63
Chapter 4: Governance in the chain This chapter aims to qualitatively explore the relations between the different types of smallholder
dairy producers, their off-take marketing channel actors, and between the actors in the formal –
and informal off-take markets. Based on the concept of embeddedness in the GPN framework,
here the different relations between the main actors in the chain will be described answering the
sub question: How are the relationships between different actors in the chain? The focus will be on
territorial embeddedness, as this is essential to know for local development. Following the GPN
framework, the embeddedness together with other categories leads to the presence of certain
networks in which issues of governance arise (Henderson et al., 2002: 448). Governance is
shaped by the nature of interactions in the vertical coordination of the chain (Haggblade et al.,
2012). Therefore, first, horizontal – and vertical coordination of the actors is described, and
linked to the types of governance from Gereffi et al. (2005). This chapter therefore does not
describe public sector governance (governments) but private sector governance. Finally,
differences per ward with regards to the presence of marketing channels is presented to
exemplify the importance of understanding territorial embeddedness for development.
Horizontal coordination Before describing relations between different actors, first horizontal coordination is described.
Horizontal coordination is the coordination between the competing actors in the horizontal rows
along the productive factors, thereby describes relations between these competing actors.
Horizontal coordination among smallholder dairy farmers in the chain is measured by looking at
whether or not they are part of a farmers’ organization. Of the sample 114 farmers are part of a
farmers organization, this was however not necessarily dairy specific. In 79 cases the farmers’
organization offered the services milk collection, milk selling or both: these are the dairy
organizations. Thus 32.9% of dairy smallholders is horizontally integrated in the dairy value
chain. The main reason for smallholder to form alliances in the form of farmers’ organizations is
better competitive advantages such as an increase in bargaining power with the processors.
There are also talks about more horizontal integration on the level of the farmers’
organizations in Nandi county, where the three main dairies are talking about adding value by
opening their own processing plant (interview Jane, Tanykina dairies, May 20, 2016). The main
reason for this is an even better competitive advantage over the processors.
On the level of the processors, there is a Kenya dairy processors association with close to
about 30 processors among which Brookside, Daima, Premier, Mr. Kenya, Githunguri. New
KCC is the chair of that association (interview Kiptalam, New KCC, July 4, 2016).
Vertical coordination The county government of Bomet also aims to establish a processing plant in the county, owned
by farmers in cooperative societies under an overarching multipurpose cooperative society. They
have found an Israeli company who wants to invest in the processing plant, and are currently
opening up a number of small coolers (included in table 18), together with partners such as
WorldVision and New KCC (interviews Kiprotich, county government Bomet, June 13, 2016;
interview Linet, WorldVision, June 13, 2016; interview Kiptalam, New KCC, July 4, 2016). This
development is a desire of more vertical integration in the chain by conducting more value chain
functions ‘in-house’. They are in particular planning to add value through producing mursik (in

64
Kalenjin), also called mala (in Kiswahili) or fermented milk. Currently there is no organized
market for mursik, it is only sold in hotels and is mostly deliverd through individual suppliers.
There are therefore opportunities to organize this better (interview Linet, WorldVision, June 13,
2016).
Vertical coordination of smallholders in the chain is measured by asking whether people
add value through making mursik at home, or any other value adding activities. 67.9% indicated to
sometimes make mursik (N=240), 16.1% indicated to sometimes sell the mursik (of the ones that
make mursik, N=155, 8 missing). As indicated above there are currently also no hubs that add
value in Nandi – and Bomet county.
Vertical coordination also describes how the different actors interact with their input
suppliers. This is measured by asking what type of contracts (if any) smallholders have with the
off-take actors.
Table 40 Off-take arrangements smallholders with their milk buyers.
Off-take arrangements smallholders
Indiv. Costumers (N=103)
Middlemen (N=66)
Farmers organization (N=102)
Processors (N=18)
Written 35.9% 42.4% 97.1% 100% Verbal 64.1% 57.6% / / None / / 2.9% / Table 41 Term and way in which smallholders are paid by their milk buyers.
Compensated how Indiv. Costumers (N=103)
Middlemen (N=66)
Farmers organization (N=102)
Processors (N=18)
Direct cash in hand 36.9% 33.3% / / Weekly cash in hand 25.2% 28.8% / / Monthly cash in hand 34.0% 31.8% 53.9% / Weekly through bank/sacco / / / / Monthly through bank/sacco / / 44.1% 100% Other 3.9% 6.1% / /
From tables 40 and 41 it is concluded that the relation between smallholders and individual
costumers is largely based on verbal contracts, and that smallholders are only paid in cash, mostly
direct, but also weekly or monthly. It is further concluded that the relations between farmers and
middlemen is also mostly based on verbal contracts, and that there is more or less equal variation
in how they are paid as well, but always in cash. An unexpectedly high percentage also works with
written contracts, and from the producer visits it became clear this is an attempt of the
smallholders to have slightly more control and power over their relation with the middlemen,
even though these contracts are not legally binding. The small percentage in the ‘other’ category
in table 41 which is only to be seen for the informal channels, indicates the flexibility of these
channels in terms of payments. Some indicated to be paid every ten days by the middlemen, or
every two weeks. Individual customers are mostly hotels and restaurants, but in one case it was a
school where the farmer’s children were going. By delivering milk to the school she got a
reduction in school fees.
The flexibility of the informal channels, in particular of the middlemen, is confirmed in
interviews. Kitur (interview, June 14, 2016) says that the informal market is ‘very fluctuating and
dynamic’ as middlemen ‘try to get the best price everyday’. As well processors as farmers organization
can only reject the milk based on quality tests, so ‘some [middlemen] may be delivering to a hotel in Kisii

65
that is closed on Sundays so then they bring the milk to us [New KCC Sotik ] (interview Kiptalam, July 4,
2016). In Nandi the middlemen are said to take the milk to ‘the west, to Kisumu, Kakamega, but also to
Eldoret’ (interview Kiplimo, July 20, 2016). In Bomet, Kisumu is also mentioned (interviews
Kipketer, June 14, 2016; Kiptalam, July 4, 2016), as well as Narok and Kericho. There is diversity
in how much milk per day the middlemen can collect and sell, and this depends also per area.
Around Bomet town according to Kipketer (interview, June 14, 2016) they can sell 500 to
1000L/day, according to Beth (interview, June 16, 2014) in the north of Bomet county about five
middlemen collect and sell around 200-300L/day, so this depends on the location. Almost all
middlemen at least have a motorbike with which they pick up and sell, however, according to
WorldVision in the south of Bomet county they also have collection centers (interview Linet,
June 13, 2016), as is confirmed by Kipketer (interview, June 14, 2016) who says middlemen
collect the milk on motorbikes, then bring it to a collection center and from there a pick-up
drives up to Narok to sell the milk. In Nandi county Kiplimo (interview, July 20, 2016) also says
the middlemen have trucks, indicating that this milk travels quite some distances on a day.
With regards to how the middlemen pay, as suits a dynamic market, this is diverse.
According to Kipketer (interview, June 14, 2016) the middlemen pay their suppliers in advance,
this can be from up to two months but even up to a year: ‘Yes, really, they have the money, that is how
they bind people to them’. But some pay afterwards, for instance at the end of the week ‘The middlemen
dictate the price, sometimes they pay at the end of the week, then they say they couldn’t find a good market and had
to sell for a lower price, so you have to share the loss. We doubt whether that is ever true’ (interview Linet, June
13, 2016).
As it is likely that issues of payment arise in informal markets like this, and as there is
unclarity about the exact functioning of the middlemen, additional questions were asked in the
producer survey later on with the following results: 42% (N=188) indicated not to know how
many middlemen were active in their area, the rest mentioned numbers varying from 1 to 15.
43.6% (N=188) also did not know where middlemen sell their milk, the rest indicated they sell
either to farmers organizations (21.8%), to residents in town centers (14.9%), to tea estates
(13.3%), to hotels (in town centers) (11.7%), and about 1% to processors or other individual
costumers (staff of a university in the area). At tea estates the tea pickers usually live close to the
plantations, it is to them that the middlemen or small-scale producers directly sell their milk.
About how many months people had been selling milk to the same middleman, answers varied
from three months up to three years. Most middlemen pick the milk from the farms between 7-
9am. 26.8% (N=41) indicated that the middleman sometimes does not show up when he or she
expects him, and that this happened mostly once a week, but to others less than once a month.
12.2% (N=41) indicated that the middleman sometimes pays later or less than agreed upon, this
then happened about once – or less than once a month. 43.9% (N=41) indicated that the
middleman sometimes pays money in advance, with an average of a little under one month in
advance. 31.7% (N=41) indicated to sometimes feel powerless against the middlemen. Payments
between producers and individuals costumers and middlemen are a result of negotiations and
differ per agreement. For smallholder dairy producers to have individual costumers is a way to
work around the middlemen.
From tables 40 and 41 is it further concluded that almost everyone that delivers to a
farmers organization has a written contract and gets paid per month, either in cash or through a
bank/sacco. A sacco is a savings and credit cooperative society. For the processors the same
accounts, but they don’t pay their suppliers in cash. For the processors, monthly targets are set
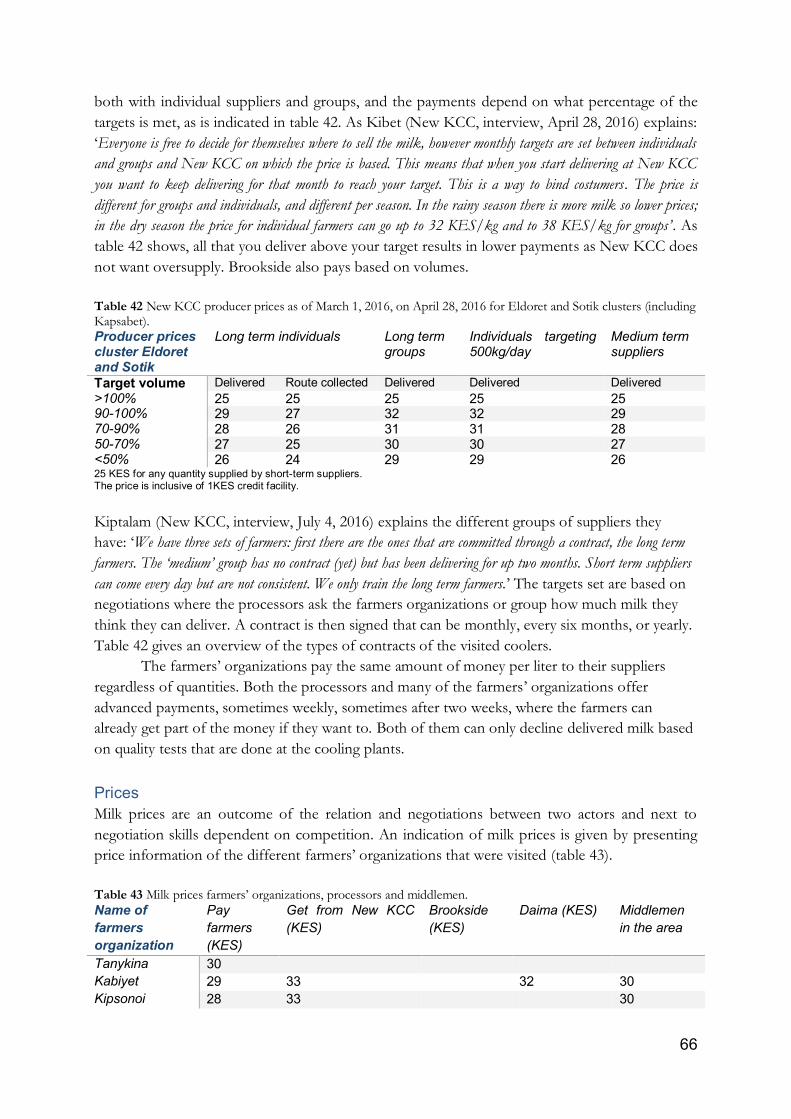
66
both with individual suppliers and groups, and the payments depend on what percentage of the
targets is met, as is indicated in table 42. As Kibet (New KCC, interview, April 28, 2016) explains:
‘Everyone is free to decide for themselves where to sell the milk, however monthly targets are set between individuals
and groups and New KCC on which the price is based. This means that when you start delivering at New KCC
you want to keep delivering for that month to reach your target. This is a way to bind costumers. The price is
different for groups and individuals, and different per season. In the rainy season there is more milk so lower prices;
in the dry season the price for individual farmers can go up to 32 KES/kg and to 38 KES/kg for groups’. As
table 42 shows, all that you deliver above your target results in lower payments as New KCC does
not want oversupply. Brookside also pays based on volumes.
Table 42 New KCC producer prices as of March 1, 2016, on April 28, 2016 for Eldoret and Sotik clusters (including Kapsabet).
Producer prices cluster Eldoret and Sotik
Long term individuals Long term groups
Individuals targeting 500kg/day
Medium term suppliers
Target volume Delivered Route collected Delivered Delivered Delivered >100% 25 25 25 25 25 90-100% 29 27 32 32 29 70-90% 28 26 31 31 28 50-70% 27 25 30 30 27 <50% 26 24 29 29 26 25 KES for any quantity supplied by short-term suppliers. The price is inclusive of 1KES credit facility.
Kiptalam (New KCC, interview, July 4, 2016) explains the different groups of suppliers they
have: ‘We have three sets of farmers: first there are the ones that are committed through a contract, the long term
farmers. The ‘medium’ group has no contract (yet) but has been delivering for up two months. Short term suppliers
can come every day but are not consistent. We only train the long term farmers.’ The targets set are based on
negotiations where the processors ask the farmers organizations or group how much milk they
think they can deliver. A contract is then signed that can be monthly, every six months, or yearly.
Table 42 gives an overview of the types of contracts of the visited coolers.
The farmers’ organizations pay the same amount of money per liter to their suppliers
regardless of quantities. Both the processors and many of the farmers’ organizations offer
advanced payments, sometimes weekly, sometimes after two weeks, where the farmers can
already get part of the money if they want to. Both of them can only decline delivered milk based
on quality tests that are done at the cooling plants.
Prices Milk prices are an outcome of the relation and negotiations between two actors and next to
negotiation skills dependent on competition. An indication of milk prices is given by presenting
price information of the different farmers’ organizations that were visited (table 43).
Table 43 Milk prices farmers’ organizations, processors and middlemen.
Name of farmers organization
Pay farmers (KES)
Get from New KCC (KES)
Brookside (KES)
Daima (KES) Middlemen in the area
Tanykina 30 Kabiyet 29 33 32 30 Kipsonoi 28 33 30

67
Siongiroi 36 34 Olbutyo 28 33 Kokiche* 27 28 35 Bomet central 27 28 Balek* 28 30 30 * also get 1.45KES/kg (Kokiche) and 1.40KES/kg (Balek) for chilling milk that Brookside brings to these coolers.
All contracts with New KCC in this case are monthly, and with Brookside yearly. Kabiyet and
Siongiroi have contracts with two processors. The price paid to farmers by the farmers’
organizations is the price without deduction of transportation costs. These costs depend per
organization; some ask 4KES/L, some 1KES/L, for some organization the costs are split
between the organization and the supplier. Middlemen try to keep the price as low as possible but
slightly higher than what the present organization pay the farmers.
According to information form the survey, the average price (KES) people get per liter of
milk from individual costumers is 40, from middlemen is 32.4, from processors 29.5 and from
farmers’ organizations is 30.3. Both the informal marketing channels therefore pay better than
the formal ones.
Types of goverance The determinants of governance structure are information complexity, information codification,
and supplier capability. Before looking into these aspects there are however also two contributing
factors to governance of which one is power. The main power executed is by the processors.
This is therefore power from inside the chain which creates a power asymmetry. This is
experienced mostly through setting up the contracts between processors and farmers
organizations and competition on the ground. At the KDB stakeholder meeting in Bomet town
on June 9, 2016, the issue of the contract was brought up by members of the management
committees of various farmers organizations, saying that they feel that they have no say over
what is stated in the contract. This was recognized by the county director livestock: ‘there seems to
be no room for change in terms of the contracts, they are one-sided. We should be involved in signing the contracts’,
suggesting a role for the county government in being involved in the negotiations between the
processors and the farmers organizations. The issues seems to be that the processors want to
have the contract signed quickly, and that especially new management committees are not keen
enough on issues that can be of negative impact for them. With regards to the process of these
contracts, Kipketer (interview, June 14, 2016) said: ‘they make the contract, they send us and then we
sign’. Kitur (interview, June 14, 2016) of a successful farmers’ organization says: ‘We now have
experience with the processors but these new ones [cooler committees] get the same contracts that the processors gave
us ten years ago with many issues in it’.
Power by the processors is further executed by competing on the ground with farmers
organizations. This means that processors, and in particular Brookside, also collects milk directly
from farmers. They do this for instance in a northern part in Bomet county around the farmers
organization Kokiche: ‘Production dropped because of competition from brokers and Brookside. We get 28
KES/l from Brookside and we pay our farmers 27 KES/l, they directly give farmers 28 KES/l. They collect
directly from farmers through bodaboda’s [motorbikes], they currently hire three that bring the milk to this chilling
plant. They collect from about 200 farmers. We have a minimal profit from the milk so right now we survive on
chilling milk for Brookside, and the agrovet services. They [Brookside] pay 1.45/kg milk for chilling here. We
have a minimal profit from the milk.’ (Beth, interview, June 16, 2016). It is not quite clear what their

68
advantage is of competing on the ground, as they seem to cut their own fingers by negatively
influencing how much milk goes to the farmers organizations that they buy the milk from, while
at the same time having to pay for having those same farmers organizations chill the milk that
they directly picked from the farmers, as well as motorbike drivers that they contract to pick the
milk. A Brookside representative at the KDB stakeholder meeting in Bomet town (June 9, 2016)
said ‘we always encourage farmers to bulk milk under [farmers’ cooperative] societies’. However, after they
had left, the representative of KDB said: ‘The elephant in the room are the processors that seem to have
benefits from keeping us fragmented.’ About why they would do that, someone responded ‘Processors find
it easier to manipulate and dictate farmers than [farmers’ cooperative] societies’. This remains a delicate topic.
There have also been issues like this in Nandi county. According to Langat (interview, July 20,
2016): ‘Brookside has left, they used to collect from farmers in our catchment area, but we negotiated with them. In
2014 we deliverd milk to them, we said ‘we will not continue to deliver if you pick [milk] from our farmers’. So
they left’. New KCC said to directly pick from farmers in Bomet county with one lori (3000L
capacity) and three pickups (1200L capacity each), but they want to phase this out of their
activities (interview Kiptalam, July 4, 2016). It is unclear if Brookside is planning to continue this
and why. According to Kimaiyo (interview, June 16, 2016): ‘In two weeks they [Brookside] will start to
collect form farmers in an area where we also get some milk from about 20km from here. Brookside can collect
there because they have cars.’
As the main dynamics between actors in the chain have now been explored, as well as the
main power dynamics, the types of governance of Gereffi et al. (2005) are now used to classify
the type of governance for the chain based on the three determinants as described in the theory
section. A distinction is made between smallholders that are linked to the informal sector and the
ones that are linked to the formal sector. As with regards to the informal sector, the complexity
of information is low as there are no requirements to be able to enter the informal market in
terms of quality or quantity. The ability to codify information is high as there are hardly any
transaction-specific investments between the parties in the transaction. The capabilities of the
suppliers in relation to the requirements of the transaction is also high, as, to illustrate,
middlemen literally ask for the milk from the cow, and people are able to milk the cow. Therefore
the informal sector is characterized by a markets type of governance.
For the formal sector this is a slightly different. The initial requirements to enter the
formal market are quality of the milk and hygiene in handling and transportation of the milk (of
course these are related). The ability to codify transactions high, but supplier capability is often
low in terms of being able to comply to the quality and hygiene requirements. Combined with a
power asymmetry dominated by the processors therefore the formal milk sector is mostly
characterized by a captive governance type. However, the captive governance type indicates high
costs for producers to switch, and that is something that is not necessarily seen as what also
became clear from the interviews is that farmers organizations switch to whom they sell the milk
on a regular basis. Two weeks after the interview with Kipruto (June 14, 2016) they had changed
from delivering milk to New KCC to delivering to Brookside. Just before the interview with Paul
(July 14, 2016) they had switched from Brookside to selling to New KCC because ‘the price kept
changing, and they wanted us to deliver 1000kg/day and we can’t do that now’.
There is however also a combination of the determinants that does not lead to a type of
governance per se. According to Gereffi et al. (2005: 87), if the complexity of the transaction is
low and the ability to codify is high, but the supplier capability is low, this would lead to exclusion
of the value chain, and therefore it does not generate a type of governance per se. This

69
combination is not represented in table 2 in the theory section. Based on the gathered data, with
regards to governance in the chain, it is very likely that a group of smallholders is also excluded
from the chain. Namely, some farmers may find themselves with low supplier capability in the
sense that they do not possess the capabilities to meet the requirements set by other actors in the
chain. For the case of cow milk these requirements to enter the formal market are quality
standards set by the hubs and formal processors that part of the smallholders cannot comply to.
Quantity requirements are according to the law not allowed: this means that all farmers or
middlemen can deliver any amount of milk to the hubs or formal processors. This milk can only
be denied based on quality reasons. However, as this chapter showed, the pricing structure of
formal processors is based on quantity: the more you deliver the higher your price. If the
informal channels offer the same price but easier access, or a higher price, the step for
smallholder producers to sell to the formal market is larger than selling to the informal market. In
that sense the presence of the informal market decreases the group of people that is completely
excluded of the chain.
Territorial embeddedness Why certain chain actors are present or not, and with which dominance, differs per region and
can be explained using the concept of territorial embeddedness. This influences the governance
in that locality. Here it is illustrated that there are differences between wards and counties with
regards to the presence and role of chain actors. This is done by comparing the different wards.
In the survey it was asked where people sell their milk to as presented earlier. With the
GPS coordinates collected in the Ona server it can easily be seen what answers were given where.
When looking at that there are differences per ward for the answer that people gave. Starting with
Nandi county, selling to processors is dominant in Kapsabet, however there was active search for
people who sold directly to the formal processors to be able to compare them with informally
connected households, so that should not be taken to serious. When looking at who answered to
sell to middlemen, there is a very clear dominance in southern Nandi (Kobujoi and Kibwareng
wards), while for farmers organizations there is very clear dominance in northern Nandi (Kaptel
and Kipkarren) (see table 4 in combination with figure 8 for a reminder of the names of the
wards).
Figure 11 Geographical differences between who sells to middlemen (left), farmers organizations (middle), and individual costumers (right) in Nandi county.

70
The red dots in figure 11 are the respondents. Around the center of the county, Kapsabet, there
seems to be a bit more people selling to individual costumers, but the difference is not as clear as
for middlemen and farmers organizations. The differences per region are simply to be explained
by the the fact that the northern part of Nandi county is largely covert by farmers organizations,
whereas in the south these are further away. This is also reflected back in the question about the
favorite marketing channel according to the participants (figure 12).
Figure 12 Geographical differences between favorite marketing channel, middlemen (left, light-yellow dots), farmers organizations (middle), individual costumers (right), in Nandi county.
It is clear from figure 12 that most respondents in Nandi north regard farmers organizations as
the favorite marketing channel, whereas in Nandi south middlemen as favorite market channel
are mentioned most. There is also a farmers organization in the area, but it is further away than
for most people in Nandi north and not as strong. The left – and middle image of figure 12
clearly shows this distinction between a group of people who prefers the middlemen, and a group
who prefers the farmers organizations. Closter to the main town Kapsabet are people who have
individual costumers as favorite marketing channel, most likely related to the presence of most
hotels in Kapsabet town. The same can be seen for Bomet county (figure 13), but with different
dynamics.

71
Figure 13 Geographical differences between who sells to middlemen (left), farmers organizations (middle), and individual costumers (right) in Bomet county.
The two main things to be concluded from figure 13 is that in Bomet north individual customers
are by far sold to the most. Closte towards town centers we see more people selling to
middlemen. No one in Chemagel ward sells to middlemen despite it being close to the centers
Sotik and Kaplong, this is because of the presence of New KCC in Sotik. Also in terms of
favorite marketing channels there are the same dynamics to be seen (figure 14).
Figure 14 Geographical differences between favorite marketing channel, middlemen (left, light-yellow dots), farmers organizations (middle), individual costumers (right), in Bomet county.
The strong preference and dominance of individual customers in the north of Bomet is directly
related to the presence of numerous tea estates in the area to which most smallholders directly
sell their milk. This in combination with no tarmac roads and difficult reachability also keeps the
middlemen a bit away. Middlemen are in particular a favorite marketing in the wards closest to
the main center Bomet town. Farmers organizations have a slightly higher preference in the south
of Bomet compared to the middle of Bomet (Chesoen ward), because south of Bomet town there
are hardly any tarmac roads, making the area less accessible and other marketing options more
difficult to reach.

72
These clear geographical differences between where people sell their milk and between
what they regard as the favorite channel to sell milk, thereby also the precense of certain actors in
the area, are all influenced by a combination of factors that are used to describe the territorial
embeddedness of chains. In the North of Nandi, which is relatively well accesible in terms of
tarmac roads, the farmers organizations established are doing good business. The largest and
most succesful dairy coopreation in Bomet is to be found in the south which is more difficult to
access, but that is according to some partly created its success: ‘They [Siongiroi] are successful because
they are very distant, there is not a lot of competition’(interview Kipketer, June 14, 2016.
That there are differences with regards to the presence of certain marketing actors also
influences differences in milk prices. For a large part, what middlemen do is to use this
information business-wise to find out where they can buy the milk at an average price, to sell in a
locality with less milk market structures, resulting in much higher sales prices and therefore
profits: ‘Some come all the way from Kisii, in some areas they can buy milk for about 20 KES/L, they go to a
neighbouring county (Nyamiri) and sell for 40KES/L. Or even if they bring milk from Chebunyo to Lelaitich
[neighbouring wards in Bomet county] they already make a profit’ (interview Linet, June 13, 2016).
That these differences per locality have an impact on development, and are thereby
essential to know, is further shown by a distinction per ward of the main perceived limitations to
increase milk production (table 44, the ward numbers representing the different counties are
following table 4)
Table 44 Geographical dispersion of perceived main problem to increase milk production according to smallholders
in Nandi - and Bomet county.
Geographical dispersion of perceived main limitation (X indicates mentioning in ward)
Nandi county Bomet county
Ward numbers according to table 4 1 2 3 4 5 1 2 3 4 Lack of credit to buy (quality) feed X X X X X X X X X Lack of enough land to produce my own feed X X X X X X X X X My animals suffer from diseases X X X X X X X X X There is not enough good grazing land available X X X X X X X X The price for milk is too low X X X X X X X Lack water X X X X X Lack of (credit to buy) labour X X X X X Lack of credit to buy animals X X X X X X Good vet care is too expensive X X X X X I don’t know how to increase my production X X X X X There is not enough feed to buy available in my area X X X There is no buyer for the milk X Good vet care is not available in my area X
As table 44 shows, in all wards the three main limitations are mentioned, but some more ‘ward-
specific’ issues also come up, such as a lack of water in parts of Nandi and Bomet, no available
feeds to buy in parts of Bomet, and no buyer for the milk as a perceived limitation. All the above
indicates different dynamics and reasons for marketing actors to be or to be not present in areas.
In order to successfully stimulate development in a place it is therefore essential to, next to the
other categories and dimensions of the GPN framework, understand territorial embeddedness on
a very local scale; county level would not be enough as within counties there are also differences.

73
Chapter 5: Barriers to the adoption of Climate Smart Agricultural practices This chapter answer sub question 6: What barriers to the uptake of climate smart agricultural practices do
smallholders face? Increasing cow milk production means increasing the efficiency of the cow,
thereby reducing also reducing the outputs of GHG emission per cow. In order to answer the
main research question there needs to be a basic understanding of the barriers to the adoption is
CSA practices. In Chapter 1 shortly the practices that are regarded as CSA practices are
mentioned and it was shown that not many people practice them. Here it will be presented why
not. The two main socio-cultural aspects that can negatively influence successful adoption are
also described.
Fodder legumes such as desmodium, calliandra or lucerne contain a lot of nutrients and
therefore enhance milk production. Close to 0% of the respondents grows fodder legumes (beans
not included), and according to 64.2% (N=215) the main reason for that is a lack of technical
information and knowledge on the benefits. The unavailability of planting material is the second
largest reason for people not to grow fodder legumes, which is confirmed in the agrovetstore
survey as presented earlier.
Being able to conserve feed enables people to feed their cattle also in dry periods when
there is not a lot or forage available for instance along the roads. The main reason for people not
to conserve feeds is also a lack of technical information and knowledge about the benefits of
conserving feed (45.1%, N=133), followed by a lack of enough feeds to conserve in the first
place (41.4%). Options were given on how the respondents would suggest to promote feed
conservation, 50.6% (N=239) would suggest a training on the advantages on feed conservation,
followed by provisioning of the materials to conserve feed (22.6%), a training on how to increase
feed production (13.8%) and the ability to get a loan to invest in materials for feed conservation
(13.0%).
Manure that is left on pastures is another source of emission. Collecting manure and
using it in home gardens can improve soil quality and stimulate growth of food -, cash -, and feed
crops as a natural fertilizer. 30% indicated not to collect manure from cows. The main reason for
that were other priorities, combined with the reason that the cows were not kept in one place. It
would therefore require an investment in either time to collect the manure or capital to invest in a
structure to keep the cows in one place, which people were not willing or able to do. For the
ones that did collect manure, but did not apply it food-, cash- and/or feed crops, was also mainly
because of other priorities and thereby no willingness to invest extra time to do that.
Most people interviewed mentioned the problem of feeding as a challenge for farmers to
increase production. Other additional things mentioned were for instance the reproductive cycle
of the cow, which is not optimal: ‘The cow gives 8L in the first three months [after calving] and then 3L the
rest of the year, the reproductive cycle of the cow is not effective’ (KDB representative at KDB stakeholder
meeting Bomet town, June 9, 2016). The deputy director veterinary services, Dr. Ken, confirms
this (interview, July 12, 2012): ‘The challenges dairy farmers face are related to poor heat detection, a poor
timing of AI, reproductive diseases, feeding, and breed selection.’ He explains the AM-PM rule: if you see a
cow is in heat in the morning, you need to have it inseminated in the afternoon, and the other
way around. This usually happens to late. Further, when people use a bull the chances of
reproductive diseases become higher.

74
Socio-cultural barriers to adoption can also play a role. Both counties are dominated by the
Kalenjin tribe. As quotes from Michela Wrong (2010) in her book show, the Kalenjins have a
tradition of cattle rearing: ‘…and on the western fringes of this natural cleft Nandi-speaking tribes – later to
be rebaptised the Kalenjin – tended crops and livestock. (Wrong, 2010: 46-47)’, ‘‘People of the milk’ indicates
the livestock-rearing Kalenjin or Masaai. (ibid.: 43-44)’, and ‘…in contrast, the cold, remote Kalenjin care more
about their cows than about their homes (ibid.: 43).
The importance of cows for the Kalenjin also proved to be a barrier for the establishment
of a community farm in southern Bomet. Kiptalam (New KCC, interview July 4, 2016) explains:
‘We tried to establish a community farm where cows of different households would all be confined in one place. The
idea was that farmers then would produce cow feeds at home where they usually have their cattle grazing. It didn’t
work because other services of the cow next to milk turned out to be too important. Without cows next to you
homestead you look poor.’ The idea behind establishing a community farm was that less people would
handle the milk, thereby increasing hygiene, while also tackling the problem of lack of feeds.
These cultural considerations don’t always have to be a barrier. Another group in Bomet is
currently trying to establish a community farm: if you find the innovators that are willing to have
a few cows less next to the homestead it can work.
Another barrier related to feeding of cattle is related to growing versus buying of food:
‘Farmers prioritize food crops over feed crops. It is considered more dignified to have your own food crops like
maize, sweet potato, beans, sorghum, instead of buying food at the market.’ (interview Linet, June 13, 2016).
These barriers have to be understood, addressed, and taken into account in the development of
strategies to increase the adoption of CSA practices.
Overcoming limitations and challenges to increase production and improve farming practices,
almost always requires an investment either in time or money. The willingness to invest can for
instance be influenced by other priorities, such as tea cultivation. The willingness to invest was
measured by asking how important dairy is on a scale from 1 to 10, and how many extra hours a
day, and money (KES) per month they would be willing to invest if it was guaranteed that their
production would increase with 50%.
The respondents indicated dairy to be of an importance of 7,8 (N=231) on a scale from 1
to 10, 10 being very important, and they were willing and able to work an extra 2,8 hours per
day on dairy activities if it was guaranteed that their milk production would go up with 50%.
How much extra money people were willing to invest per month if it was guaranteed that there
production would go up with 50% depends on their total monthly income. As this was asked in
categories, the categories were assigned one value in order to be able to calculate what percentage
of their monthly household income people were willing to invest extra. The category ‘less than
2.500’ is regarded as 1000, ‘2.500-5.000’ as 3.750, ‘5.000-10.000’ as 7.400, ‘10.000-20.000’ as
15.000, and ’20.000-30.000’ as 25.000. The monthly incomes of the group ‘more than 30.000’ can
vary widely, just like the amount they want to invest per month. Therefore this category is not
included in this calculation, hence the missing values. The result is that people are willing to
invest 18,8% (N=156) of their monthly income in dairy if it is guaranteed that their milk
production will go up with 50%.
A very brief overview of issues to be regarded as barriers to the adoption of CSA practices is
presented here, but a more in-depth understanding of the complexities, considerations and risks
playing a role in different types of crop-livestock systems in these particular locations is needed.

75
Chapter 6: Promoting more inclusive strategies for dairy chain development Incorporating the knowledge of the previous chapters, what are the challenges and opportunities
for upgrading of different types of smallholders? This chapter answers the last sub question: What
is the potential for upgrading in the chain? The aim is to provide handles for the stakeholders involved
in the development of the NAMA to either more explicitly describe how to integrate
smallholders into the chain that are currently not operating in formal networks, or to include
strategies that directly target the informal milk market as well. Considering the last, suggestions
from the field on how to deal with the informal market is also be presented.
With regards to competition, all actors on horizontal levels compete with each other and
consider each other the main competitors: New KCC sees Brookside as the main competitor,
large farmers’ organizations see each other as competitors, or large farmers organizations see the
establishment of a number of smaller coolers in the area as competitors. All of them, however,
also regard the middlemen as competitors; they have a shared interest in getting rid of
middlemen. As a representative of the KDB said on a KDB stakeholder meeting in Bomet town
(June 9, 2016) said: ‘We [all stakeholders together] have established that when we move from informal to
formal, we develop.’ The main suggestions on how to realize such a situation are presented here and
linked to types of upgrading from Kaplinski et al. (2002).
In order to find out, first of all a closer look is taken at why people prefer certain
marketing channels. 40.9% of the smallholder producers indicated that the main reason for
choosing their favorite marketing channel is because they prefer the payment structure, followed
by the best price (24.0%), access to it (20.9%), and reliability (10.6%). This is interesting because
it shows that apparently people do not only decide on their favorite channel based on price, but
that mostly the payment structure is plays an important role. This can be about the direct
payments of the middlemen, or the monthly payments by the farmers organizations, of which
people indicated that they like that there money is kept for a bit until they receive it. This is
related to what was concluded about a dairy value chain analysis by WorldVision in the south of
Bomet: ‘there is a gap in savings behaviour, people don’t save money’ (interview Linet, June 13, 2016).
Also New KCC has noticed this desire on the one hand of people to not be able to reach
all money at once, but at the same time the need for daily cash for daily purchases for the
household. They conducted a focus group discussion with their members came to the
understanding that ideally people receive 30% of their daily deliveries: ‘We want to roll a daily
payment scheme…we are looking at working with transferring part of the milk money directly to mpesa money’
(interview Kiptalam, July 4, 2016). Mpesa is a popular phone-based money transfer service.
Important in moving people from the informal to the formal market is therefore to create the
advantages that people get from the informal market also formally. This main advantage is related
to payment structure. There should be high sensitivity for household gender dynamics in
establishing alternative payment schemes such as the one suggested by New KCC, and gender
equity needs to be actively promoted.
As requirements to enter the formal market are about quality and hygiene, in order to
move more people from informal to formal they need to incentivized to comply to quality
standards and hygiene practices. Developments with regards to that are first of all the
development of plastic containers that are suitable for people to carry milk in. A lot of people
prefer the plastic containers over aluminium cans because they are cheaper. However, because of

76
a rough inside and a small opening the containers cannot be cleaned properly, which is the main
reason for some farmers organizations to stimulate the use of aluminium cans: with the smooth
surface and big opening it is easy clean. Therefore currently plastic containers ar being developed
with EADD and New KCC with a bigger opening and a smooth surface inside. Distributing
these can increase people’s chances of entering the formal market (interview Kiptalam, July 4,
2016).
Also relating to quality, currently there is a pilot study in a part of Narok county where
people get 1KES/L extra if they deliver the milk in the right materials, and they lose 1KES/L if
they do not. This is a way to incentivize people to deliver the milk in the right materials following
hygiene procedures. There is also a similar pilot where the temperature of milk is tested. At
delivery the temperature of the milk is measured, and at a certain temperature farmers get
1KES/L extra. This is aimed at stimulating people to take the milk to the coolers as soon as
possible after milking, and thereby again to incentivize better handling of the milk to enhance
quality. Finally, SNV and TechnoServe are trying to develop a quality based payment scheme. As
options for testing for quality is limited outside Nairobi, they are finding out other parameters to
test quality immediately in the field. In order to stimulate people to enter the formal market,
working with such a quality scheme of course requires decent trainings on the how, why, and
what of the scheme.
Next to adjusted payment schemes and incentivized hygiene and quality promotion, the
third main way to move people from informal to formal is related to extension services. On more
than one occasion and during more than one interview it was mentioned that current extension
services are not aligned. Providing a few of the same key messages through different extension
service providers will confuse farmers less and build trust. Also, the frequency with which
farmers currently receive extensions services is low and not frequent.
All-day access to the formal market also plays a role. As became clear earlier, in particular
evening milk is often sold informally. Reasons for that can be attributed to household dynamics
and are related to payment schedules and the need for direct cash. However, this is also related to
the fact that farmers’ organizations, in particular new ones, often only collect morning milk up to
a certain time, and then close. Despite high consumption percentages for evening milk, offering
the opportunity to also deliver evening milk to the coolers increases the access to the formal
market. Of course this also requires more operational costs, better arrangements with the
processor, and more detailed logistic schemes, that often only become within reach when a
certain economy of scale of the farmers organizations is reached.
Also, new links in the chain could be stimulated, in particular the link between individual
costumers and farmers organizations. Most milk and mala in hotels and restaurants is either raw
coming directly from the informal market, or packaged and obtained from one of the processors
in the country. It would be interesting to explore option for individual costumers to get milk
from the farmers’ organizations. Incentives for individual customers to do this are the often
lower price. The main incentive for farmers to start delivering to a chilling plant instead of an
individual costumer is the access to services that become available, in particular at a well-
established organization.
Finally, the main dairy programs active in the counties have the so called ‘hub-approach’
where they establish, support and stimulate the growth of farmers’ organizations. Strengthening
the competitiveness of dairy organizations, stimulating them to grow and supporting the
establishment of extension services through the organizations seems to be an effective way to
77
work against the middlemen. The effect of having a dairy farmers organization in the area is that
all members get the same price: ‘with a marketing hub all members get the same price, they all know that
price, and that gives them a step ahead against the hawkers’ (interview Linet, June 13, 2016).
This requires however more than the placement of a chilling plant. The example of Balek
cooler shows how a government initiated cooler has been struggling in the first year of its
existence: ‘In April 2015 at our establishment we sold half of the milk locally and half of it went to Kokiche
Dairies. The same accounts for May. On June 1 2015 we had over 500L so then we started chilling the milk.
Brookside gave provided us with one of their staff to guarantee quality. After two months, after July, Brookside cut
the milk price with 2 KES/L, then in August they cut the price with 2KES/L again. From October 2015 to
March this year we brought the milk to Bomet Central. In April and May we brought the milk to Kapkwen
(Imanet Dairies) because of a better price. Then they gave us notice that they will also cut the price with 3KES/l.
Now, 700kg of milk this month is the target we have with New KCC, if we reach that we get a 3 month
contract.’ This shows how important stable markets are.
Another issue related to working through the hubs are related to management and farmer
loyalty. The KDB representative at the KDB stakeholder meeting in Bomet town (June 9, 2016)
therefore suggests that first of all the members of a cooperation are well informed on the
selection procedures of the management committee, and that the county is involved to make sure
the election of the management committee happens in a fair way. Issues related to farmer loyalty
are linked to the fluctuating prices of processors in combination with late payments and farmers
organizations that do not have the means to overcome this. According to the processors, in order
to have less price fluctuations there needs to be consistency in milk delivery. To overcome this,
seasonality of the milk production needs to be tackled by the producers, which requires the
increased uptake of CSA practices as discussed before.
Main issues with regards to the informal sellers are unreliability and powerlessness against
the middlemen as they cannot be procured. As the county director Livestock said on the KDB
meeting in Bomet town (June 9, 2016) about milk that is sold informally: ‘maybe it is Blue Band
[butter], mixed with what? We don’t know’. Therefore main suggestions to improve the informal
market are related to pushing more legislation that enhances the reliability of the middlemen and
empowers their customers. This could be legislations with regards to mandatory licenses to
transport and sell milk, better enforcement of the already present hygiene prescriptions for selling
milk, or prohibiting hawking. As there is the shared objective among the formal actors to get rid
of hawking, it is even suggested that the processors can push legislation like this as they have the
power to do so. The role for middlemen to facilitate transport between the farmers’ organizations
and hotels, restaurants and other individual costumers can be explored as well.
Linking the above and information from earlier chapters to types of upgrading from
Kaplinski et al. (2002), there are options for smallholders for process upgrading mainly with
regards to handling of the milk and hygiene. As this distinct the formal market from the informal
one and is its main advantage, framing it as a public health issues (which is the current dominant
discourse) and at the same time incentivizing improvements in handling the milk offers
possibilities to upgrade smallholders. For farmers organizations there are options for functional
upgrading by establishing own processing plants or new farmers organizations that focus for
instance on the production of mala as there is currently no organized market for this popular
product, except at the processor level. Farmers’ organizations could also upgrade by actively
targeting the market of individual customers such as hotels, restaurants, and universities.

78
Conclusions This thesis aimed to find an answer to the following main research question: How to promote an
increase in cow milk production in an environmentally sustainable - and inclusive way for smallholder dairy
producers in Nandi – and Bomet counties, Kenya? This is done through a mixed method research design
conducting stakeholder interviews most notably with management of dairy farmers’
organizations, through a producer survey, an agrovetstore survey and secondary data gathering.
The structure, dynamics, governance and power of the dairy value chain have been analyzed
using the GPN framework and related concepts. A typology of smallholder producers is created
by conducting a HCA in SPSS Statistics, in which four groups were formed. This enabled to find
out through a Probit Regression Analysis that the number of cows and the proximity to cooling
plants have an influence on being part of the group that sells milk to the formal sector, and the
further away from the cooling plant, the more likely it is to sell milk to the informal sector. The
final shorter chapters on barriers to the adoption of CSA practices and on how to push more
milk into the formal sector aimed at linking the data to the broader main research question,
which will be answered here.
Environmentally sustainable cow milk production is production where the body of the
cow is efficiently producing milk, thereby decreasing emissions per cow for instance from enteric
fermentation: the main source of GHG emissions in the East-African dairy sector. This can be
achieved by a combination of CSA practices. Based on an inventarization of grazing –, feeding –
and other production practices, in combination with low production levels, it is confirmed that
current production is not environmentally sustainable.
In order to overcome this, the barriers to adoption need to be identified and understood.
The main limitations to increase milk production, are related to feeding. Other reasons for low
production and thereby high emission output are related to an ineffective reproductive cycle of
the cows, poor heat detection, a poor timing of AI, reproductive diseases, and breed selection.
Socio-cultural issues related to the status of having cows in the homestead and growing food
crops instead of buying food at the market can also form barriers to the uptake of CSA practices.
Therefore, promoting an increase in cow milk production in an environmentally
sustainable way requires first of all better understanding and addressing these issues. As these
issues differ per locality, they need to be well understood and addressed at the local level for
optimal development perspective. Following a lack of technical knowledge on the practices and
benefits of CSA, extension services should be aligned and consistency of trainings that farmers
receive on topics such as feed conservation, heat detection, AI timing, and breed selection should
be ensured. Following a lack of capital or labor to implement CSA practices, the willingness and
ability to invest needs to be understood at the household level, and a more in-depth
understanding of the complexities, considerations and risks playing a role in different types of
crop-livestock systems in these particular locations is needed. Gender household dynamics need
to be unpacked to better understand their impact on decisions on farming practices.
There is a correlation between emission intensity and milk yield; therefore adopting CSA
practices also has the potential to positively influence livelihood factors such as income. A main
incentive for wanting to increase production and a necessity for realizing increased production is
the presence of stable off-take markets for milk. Next to this, the importance of analyzing dairy
value chain dynamics is that it has to be found out how through the chain, the uptake of CSA
practices can be achieved and increased.

79
Increasing production in an inclusive way means to increase production for all, e.g. to not
leave out groups that produce but are not part of, or struggling to be part of the chain, therefore
to stimulate pro-poor development. Considering both the formal – and informal market, there
are two ways to realize this: 1) promoting a push from informal to formal; 2) improve the
unreliable character of the informal sector. This study showed to understand the dynamics that
shape participation in informal – and formal markets on the level of producers, and the dynamics
among formal sector actors.
In order to promote a push from informal to formal, the main benefit of participating in
informal markets need to be created in the formal sector as well. The main benefits of the
informal sector are a combination of the payment structure, which is often daily or weekly and in
cash, and accessibility as milk is picked from the farm or from collection points along the road
very close by. The formal sector often pays monthly with advance payments every two weeks and
usually through banks/sacco, although some small farmers’ organizations also partly pay in cash.
People often prefer money being saved till the end of the month, but are also in need of daily
cash. Therefore alternative payments schemes need to be developed by actors in the chain in
collaboration with smallholders that are not part of the formal sector (yet). There should be high
sensitivity for household gender dynamics in establishing alternative payment schemes such as
daily payments through mpesa, and gender equity needs to be actively promoted in order not to
lose the benefits that in particular women have with regards to links to the informal sector.
This is related to accessibility of the formal market. The areas that are covered by farmers’
organizations indicate a weaker position of middlemen as farmers in the area have a higher
chance of being aware of the milk price, thus having a better negotiation position than without
knowing the price. Therefore, as a way of promoting inclusive dairy chain development,
establishments of new dairy organizations and strengthening of current ones is promoted as with
their precence they increase the access to the formal market. As the example of Balek cooler in
Chapter 6 showed, more important than the presence of a chilling plant itself is a strong and well-
functioning organization.
Further, the requirements to enter the formal market, which are quality standards and
hygiene procedures regarding handling of the milk, form barriers to entry. These barriers need to
be lowered or the desired and required practices need to be incentivized for people to move to
the formal sector. As these requirements are set from a valid public health framing of the issue it
is not desired that these barriers are lowered. Ways to incentivize smallholder producers to
comply to the desired quality and hygiene practices are provisioning and explaining of (how to use
the) correct materials
Crucial in all the above is the attention that needs to be paid to territorial embeddedness
of chain activities. This study revealed differences on a local level with regards to the presence of
certain actors in particular places. For instance, the north of Bomet where tea cultivation is
dominant in combination with poor accessibility shows that there are little alternatives for
smallholders than the tea estates to sell the milk to. The north of Nandi which is largely covered
by farmers’ organizations showed both a well-functioning of those organizations and
contentment with the organizations by its members. The south of Nandi which is less covered by
farmers’ organizations showed a divide between middlemen and farmers organizations as favorite
marketing channels.
As the farmers organizations and processors share the objective to get rid of the
middlemen there is potential for these plans. A link in the chain that can be explored is between

80
farmers’ organizations and individual costumers. Potential for chain upgrading is in establishing
an organized market for fermented milk. In order to regulate the informal market, legislation is
largely suggested. The processors have the power to push such legislation. The power that
processors execute within the chain is troublesome and captive. Strengthening farmers
organizations, so promoting better horizontal coordination, will increase competitiveness and
decrease the power asymmetry.

81
Discussion Limitations of the study are related to reliability and validity of the results, as shortly described in
the Methodology. The statistical tests in IMB SPSS Statistics are reliable as the procedure is
transparent and can be repeated. The use of different variables and a larger or smaller sample is
possible to show different outcomes, and therein lay the limitations to these analyses. With
regards to validity, the issues of measuring what one claims to measure, this is a bit more
complex. As is seen in the results of the PRA, sometimes things are measured but they do not
mean anything such as: the probability of being part of the group that sells the milk informally
decreases when the household head is not female. Using a mixed methodological framework with
both qualitative and quantitative methods however overcomes these limitations as the outcomes
of the more quantitative methods used and analyses can be and are explained and confirmed as a
result of the interviews. The other way around, the statistical tests confirm impressions and
knowledge from the fieldwork, increasing its correctness. As the diversity but consistency of
results show, despite these reliability and validity issues regarding the methods, the results still
make sense and most importantly, can be explained.
With regards to theoretical implications of this study, as indicated in the introduction, the
socio-economic reasons for horizontal – and vertical coordination in the Kenyan dairy sector
have not been exhaustively examined. By analyzing the dairy value chain dynamics, and therefore
reasons for horizontal – and vertical coordination, as well as dynamics in the chain that influence
this, this study contributed to the literature. There are however no theoretical implications
following this study as the theory is not tested but concepts are used. The concepts used proved
well for making sense of the situation and answering the main research question and sub
questions.
Following the report and the conclusions, there are suggestions for further research, of
which most notably into barriers to the uptake of improved practices, and second, to the political
economy of the sector in Kenya. Regarding the first, as was shown, this study attempted to
answer how to promote environmentally sustainable production, but did not reach beyond
brought suggestions as firstly the chain dynamics need to fully understood, as well as complex
household dynamics.
Regarding the political economy of the Kenyan dairy sector, this study has hinted towards
but largely left aside the politics at play in the Kenyan dairy sector. In particular, this is related to
the power of the processors, the main processors being owned by influential people. Issues of
ethnicity, power, hidden objectives have not been discussed first of all because it was beyond of
the scope of this particular research, which is related to the second reason, namely that trying to
understand these issues requires much more time, observations, interviews, literature research on
the history of the Kenyan dairy sector, etcetera, than was currently possible. As these issues are
very likely to have an influence on the feasibility of strategies either to increase the uptake of
improved farming practices, as well as promoting more inclusive chain development, it is very
important that these issues are understood and that ways are described on how to address these
issues, and what the implications are for both the increased uptake of CSA practices and more
inclusive chain development.
However, in answering the main research question there has gone beyond the possibilities
that an increase in the uptake of CSA practices can also have negative influences. The uptake of
CSA practices will always require investments, either in capital or labor or both. Assuming these

82
investments will be the trade-offs with investments in other activities, this can create a situation
that is not favorable and does not enhance livelihood benefits as is expected. Herein lies the core
of the link between the two aspects of the research question: an increase in milk production
needs stable markets in order to enhance livelihood benefits. If a farmer indeed replaces his or
her food crops by feed crops, having a higher production, but then the price of milk drops, he or
she can be worse off than before. ‘What is development?’ is therefore a delicate issue.
The same accounts for promoting a push from informal to formal. Formal is not
necessarily better, informal is also not necessarily better; this is dependent on a complex
combination of factors. With regards to the necessity of stable markets for the increased uptake
of improved CSA practices for dairy development, the ‘stability’ of the informal market is maybe
that it always seems to be there, and always seems to be dynamic and fluctuating. The advantages
of this kind of ‘stability’ should not be underestimated.
The advice that follows from this is directed at the whole sector in Kenya but in particular
to the stakeholders involved in the development of the NAMA for the Kenyan dairy sector. The
stakeholders involved are promising mix of types, ranging from the main administrative bodies
and actors such as the Kenyan Dairy Board, to banks, dairy cooperatives, FAO, research
institutes etcetera. It is a ‘once in a life time’ situation in which a considerate amount of money
can become available, tackling at the same time emissions as well as inefficient production and
livelihood benefits. The potential is there, but judging from current knowledge on the
development and strategies that are being planned so far, there is far too little attention to the
informal sector. Considering the percentages of milk that are ending up in the formal market and
the percentages that are sold informally, one can barely speak of having developed a strategy for
NAMA for dairy without more explicitly including strategies aimed either at improvements of the
informal sector, or strategies on how to move the informal sector to the formal sector. Paying
attention to the local factors that shape the chain is an advice for all.
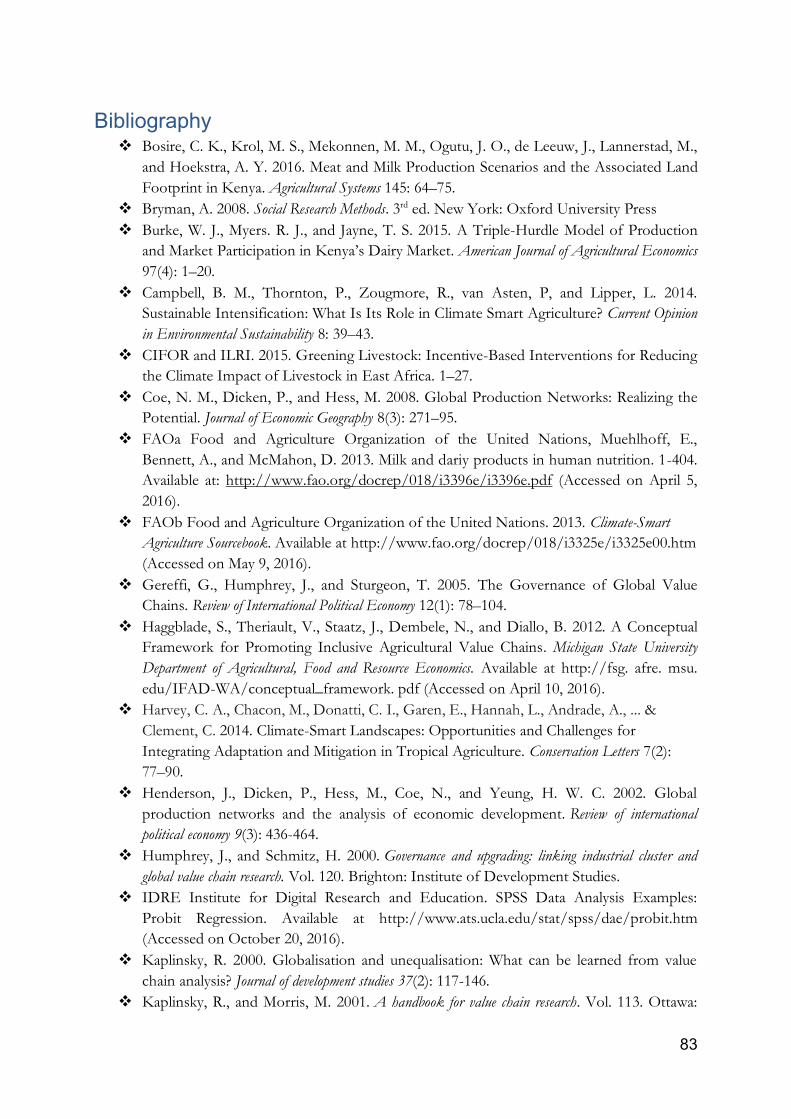
83
Bibliography Bosire, C. K., Krol, M. S., Mekonnen, M. M., Ogutu, J. O., de Leeuw, J., Lannerstad, M.,
and Hoekstra, A. Y. 2016. Meat and Milk Production Scenarios and the Associated Land
Footprint in Kenya. Agricultural Systems 145: 64–75.
Bryman, A. 2008. Social Research Methods. 3rd ed. New York: Oxford University Press
Burke, W. J., Myers. R. J., and Jayne, T. S. 2015. A Triple-Hurdle Model of Production
and Market Participation in Kenya’s Dairy Market. American Journal of Agricultural Economics
97(4): 1–20.
Campbell, B. M., Thornton, P., Zougmore, R., van Asten, P, and Lipper, L. 2014.
Sustainable Intensification: What Is Its Role in Climate Smart Agriculture? Current Opinion
in Environmental Sustainability 8: 39–43.
CIFOR and ILRI. 2015. Greening Livestock: Incentive-Based Interventions for Reducing
the Climate Impact of Livestock in East Africa. 1–27.
Coe, N. M., Dicken, P., and Hess, M. 2008. Global Production Networks: Realizing the
Potential. Journal of Economic Geography 8(3): 271–95.
FAOa Food and Agriculture Organization of the United Nations, Muehlhoff, E.,
Bennett, A., and McMahon, D. 2013. Milk and dariy products in human nutrition. 1-404.
Available at: http://www.fao.org/docrep/018/i3396e/i3396e.pdf (Accessed on April 5,
2016).
FAOb Food and Agriculture Organization of the United Nations. 2013. Climate-Smart
Agriculture Sourcebook. Available at http://www.fao.org/docrep/018/i3325e/i3325e00.htm
(Accessed on May 9, 2016).
Gereffi, G., Humphrey, J., and Sturgeon, T. 2005. The Governance of Global Value
Chains. Review of International Political Economy 12(1): 78–104.
Haggblade, S., Theriault, V., Staatz, J., Dembele, N., and Diallo, B. 2012. A Conceptual
Framework for Promoting Inclusive Agricultural Value Chains. Michigan State University
Department of Agricultural, Food and Resource Economics. Available at http://fsg. afre. msu.
edu/IFAD-WA/conceptual_framework. pdf (Accessed on April 10, 2016).
Harvey, C. A., Chacon, M., Donatti, C. I., Garen, E., Hannah, L., Andrade, A., ... &
Clement, C. 2014. Climate-Smart Landscapes: Opportunities and Challenges for
Integrating Adaptation and Mitigation in Tropical Agriculture. Conservation Letters 7(2):
77–90.
Henderson, J., Dicken, P., Hess, M., Coe, N., and Yeung, H. W. C. 2002. Global
production networks and the analysis of economic development. Review of international
political economy 9(3): 436-464.
Humphrey, J., and Schmitz, H. 2000. Governance and upgrading: linking industrial cluster and
global value chain research. Vol. 120. Brighton: Institute of Development Studies.
IDRE Institute for Digital Research and Education. SPSS Data Analysis Examples:
Probit Regression. Available at http://www.ats.ucla.edu/stat/spss/dae/probit.htm
(Accessed on October 20, 2016).
Kaplinsky, R. 2000. Globalisation and unequalisation: What can be learned from value
chain analysis? Journal of development studies 37(2): 117-146.
Kaplinsky, R., and Morris, M. 2001. A handbook for value chain research. Vol. 113. Ottawa:

84
IDRC.
Kaplinsky, R., Morris, M., and Readman, J. 2002. The globalization of product markets
and immiserizing growth: lessons from the South African furniture industry. World
Development 30(7): 1159-1177.
Kirchgaessner, S. and Hooper, J. (2015) Pope Francis warns of destruction of Earth´s
ecosystem in leaked encyclical´, The Guardian, June 16. Available at:
https://www.theguardian.com/world/2015/jun/15/pope-francis-destruction-ecosystem-
leaked-encyclical (Accessed October 23, 2016).
Makoni, N., Mwai, R., Redda, R., van der Zijpp, A., van der Lee, J. 2013. White Gold:
Opportunities for Dairy Sector Development Collaboration in East Africa. Centre for
Development Innovation, Wageningen UR (University and Research centre). CDI report: 1-203.
Moturi, W. O., Obare, G. A., and Kahi, A. K. 2015. Milk Marketing Channel Choices for
Enhanced Competitiveness in The Kenya Dairy Supply Chain: A Multinomial Logit
Approach. In 2015 Conference, August 9-14, 2015, Milan, Italy (No. 212477). International
Association of Agricultural Economists. 1–21.
Mutura, J. K., Mwangi, M., Nyairo, N. M., and Wambugu, S. K. 2016. Analysis of
Integration among Smallholder Dairy Farmers in Lower Central Kenya. The International
Journal of Business & Management 4(2): 57–64.
Mutura, J. K., Nyairo, N. M., Mwangi, M., and Stephen, K. 2016. Analysis of
Determinants of Vertical and Horizontal Integration among Smallholder Dairy Farmers
in Lower Central Kenya. International Journal of Agricultural and Food Research 5(1): 1–13.
National Environment Management Authority, Gachimbi, L. N. 2010. Kenya State of the
Environment and Outlook, Chapter 6: Land, Agriculture and Livestock. 108-123.
Available at: file:///C:/Windows/Temp/Kenya_SOE.pdf (Accessed on October 9,
2016).
Norusis, M. J. 2012. IBM SPSS Statistics 19 Statistical Procedures Companion, Chapter 16:
Cluster Analysis. Pearson. Available at: http://www.norusis.com/pdf/SPC_v13.pdf
(Accessed September 27, 2016).
Thorpe, W., Muriuki, H. G., Omore, A., Owango, M. O., and Staal, S. 2000. Dairy
Development in Kenya: The Past, the Present and the Future. Paper prepared for the
Annual Symposium of the Animal Production Society in Kenya, March 22-23, 2000,
KARI headquarters, Nairobi. 1-10. Available at:
https://cgspace.cgiar.org/bitstream/handle/10568/1723/Thorpe%20et%20al-2000-
Dairy%20dev%20past%20present%20future-APSK.pdf?sequence=1 (Accessed on April
2, 2016).
Wambugu, C., S. Franzel, and J. Rioux. 2014. Options for Climate-Smart Agriculture at
Kaptumo Site in Kenya. World Agroforestry Centre, Nairobi. Working paper no. 185: 1-89.
Available at http://www.fao.org/3/a-bl226e.pdf (Accessed on May 9, 2016).
Wanjala, S. P. O. and B. K. Njehia. 2014. Value Chain Predictors of Milk Production on
Smallholder Dairy Farms in Western Kenya: A Multiple Regression Analysis. International
Journal of Current Research 6(4): 6380–6388.
Wrong, M. 2012. It’s our turn to eat: the story of a Kenyan whistle-blower. Harper
Perennial.

85
Appendix 1 Overview of collected data 2016 Nairobi Attended a National Appriate Mitigations Actions (NAMA) multi-stakeholder workhop in
Nairobi on 23-03-2016 (the beginning of my stay) and at 09-08-2016 (at the end of my stay).
Nandi Interviews1:
1: Kipngetich (M) – Program coordinator Small-scale Dairy Commercialization Program (SDCP),
April 26.
2: Kibet (M) – employee at New KCC cooling plant Kapsabet town, April 28.
3: Jepchumba (F) – County director livestock, May 3.
4: Jeffrey (M) (KCC plant manager) and Anneline (extension services coordinator) – New KCC
cooling plant Kapsabet town, May 12.
5: Jane (F) – Accountant at Tanykina Dairies, May 20.
6: Kiplimo (M) – Manager of Kabiyet Dairies, and Langat (M) – manager at satellite cooler
Sang’allo of Kabiyet dairies, July 20.
Surveys Nandi county:
Name of wards in Nandi county Number of surveys Kapsabet 30 Kaptel 30 Kipkarren 32 Kibwareng 16 Kobujoi 13 Total: 121 And three additional agrovetstore surveys, also a zero-grazing unit was visited in Kapsabet town.
Bomet Interviews:
1: Kiprotich (M) – (assistant) county director livestock, June 13.
2: Linet (F) – WorldVision Chebunyo, June 13.
3: Kipketer (M) (and more) – Manager Kipsonoi cooling plant, June 14.
4: Dr. Kitur (M) – replacing manager at Siongiroi dairies, June 14.
5: Kipruto (M) – quality officer at Olbutyo dairies, June 14.
6: Beth (F) – quality control officer at Kokiche dairies, June 16.
7: Cheruiyot (M) (Brookside representative in charge of quality) and Kimaiyo (M) (part of the co-
op society) - Bomet Central dairies, June 16.
8: Kiptalam (M) – in charge of field services at New KCC cooling plant Sotik, July 4.
9: Dr. Ken (M) – Deputy director veterinary services, July 12.
10: Paul (M) – Balek cooler, July 14.
1 All names of people interviewed in Nandi – and Bomet county have been modified for privacy reasons.
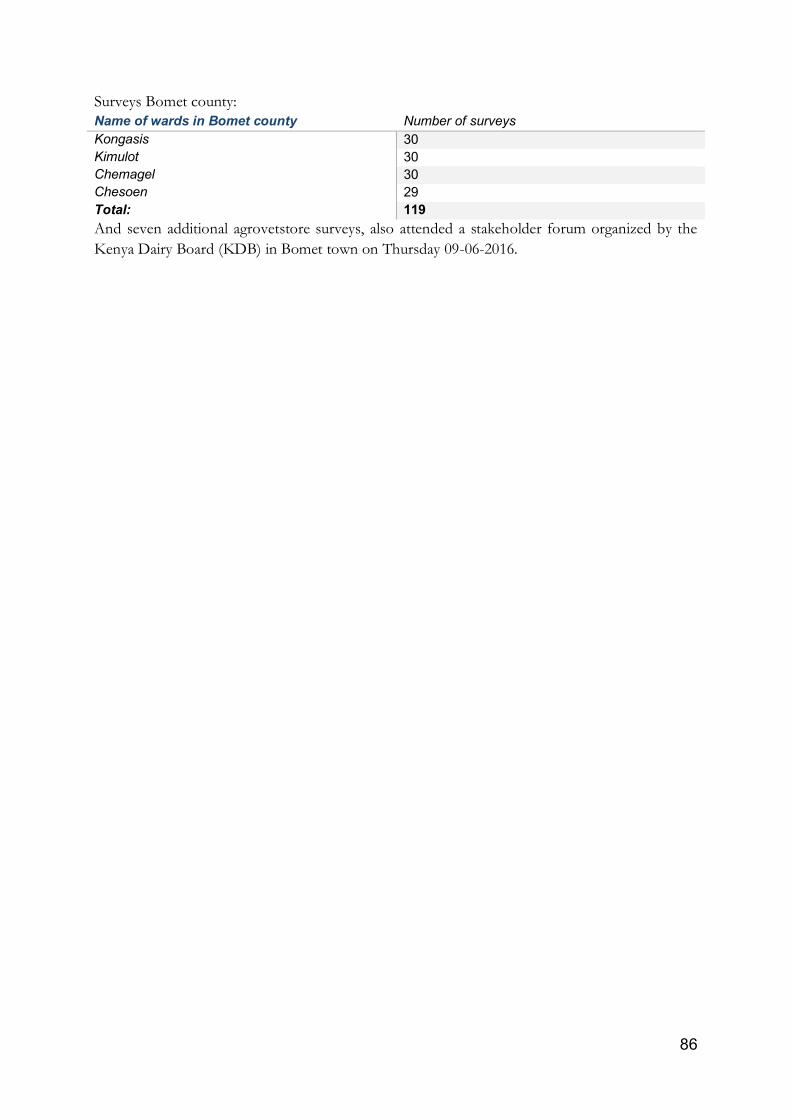
86
Surveys Bomet county:
Name of wards in Bomet county Number of surveys Kongasis 30 Kimulot 30 Chemagel 30 Chesoen 29 Total: 119 And seven additional agrovetstore surveys, also attended a stakeholder forum organized by the
Kenya Dairy Board (KDB) in Bomet town on Thursday 09-06-2016.

87
2 Dairy producer survey questions See below the questions of the dairy producer survey. The survey took over one hour in the
beginning but about 40 minutes towards the end. Not all questions were asked to anyone, this
was depending on answers to previous questions. In the overview below, ‘specify other’s were
taken out. The categories are general, cattle and milk production, selling milk, organization and
service provisioning, and management practices.
General
Does this household have dairy cattle?
Enumerator’s Name
Date of Interview
In which county are you?
In which ward in Nandi county are you?
In which ward in Bomet county are you?
Are you in charge of dairy (or farm) activities?
Farm owner's name
Is the farm owner the same person as the respondent?
Respondent's Name
Respondent's position in the household
How many household members, including household head and respondent, live permanently on
the compound?
How many household members are younger than 15 years?
How many household members are older than 65 years?
Gender of household head
Year of birth of household head
What is the highest education level completed by household head?
Household head can read and write in an official language
Is the respondent the same person as the household head?
Gender of respondent
Year of birth of respondent
Years of dairy cattle farming experience
Main source of income of this household
Specify product
Rank the second most important livelihood activity
Specify product
Do you currently own land?
Size of owned land in acres
Do you currently rent land?
Size of rented land in acres
Cattle and milk production
Why did you start producing dairy products?
Select all the animal types you currently own and how many
Select breed of each
Specify total (for all cattle - morning and evening) liters of milk per day in the dry season
Specify total (for all cattle - morning and evening) liters of milk per day in the rainy season

88
Do you plan to increase the amount of cow milk you produce?
How do you plan to increase your production? First method:
How do you plan to increase your production? Second method:
How do you plan to increase your production? Third method:
Main limitation to increase cow milk production
What solution do you propose for this limitation and who should be responsible for that?
Second limitation to increase cow milk production
What solution do you propose for this limitation and who should be responsible for that?
On a scale from 1 to 10, how much do you value your cattle for paying dowry, gifts, other
ceremonial purposes or your social status?
Selling milk
Did you sell your milk in the last year?
In what year did your household first start selling milk?
What is the main reason that you have not sold your milk in the last year?
Do you wish to sell your milk?
Why do you not want to sell your milk?
Since there is a wish to sell milk, what is the main reason for not selling milk?
Does your household sometimes give away milk for free (for example to relatives, church,
neighbors)?
Indicate for the last year all options for how your milk was used (and sold):
To which formal trader in specific does your household directly deliver your milk?
To which formal traders does your farmers’ organization deliver milk?
Is there a difference in how much milk your household consumes between the rainy and dry
season?
On avarage, how many liters of milk does your household consume daily in the dry season?
On avarage, how many liters of milk does your household consume daily in the rainy season?
How many liters of milk does your total household consume daily?
Is there a difference in how you sell your milk between the rainy and dry season?
In general, what % of your MORNING milk is spent on household consumption?
In general, what % of your MORNING milk is sold to individual costumers? (incl. hotels)
In general, what % of your MORNING milk is sold to formal private milk traders (e.g. KCC)?
In general, what % of your MORNING milk is sold to hawkers?
In general, what % of your MORNING milk is sold to (a) farmer's organization(s)?
In general, what % of your MORNING milk is given away for free/spilled/not sold/not
consumed?
In general, what % of your EVENING milk is spent on household consumption?
In general, what % of your EVENING milk is sold to individual costumers? (incl. hotels)
In general, what % of your EVENING milk is sold to formal private milk traders (e.g. KCC)?
In general, what % of your EVENING milk is sold to hawkers?
In general, what % of your EVENING milk is sold to (a) farmer's organization(s)?
In general, what % of your EVENING milk is given away for free/spilled/not sold/not
consumed?
(The above questions were answered separately for dry – and rainy season if indicated that there is a difference in
how milk is sold between dry- and rainy season.
What type of off-take arrangement do you have with individual costumers?

89
What type of off-take arrangement do you have with the formal private milk trader(s)
What type of off-take arrangement do you have with the hawkers?
What type of off-take arrangement do you have with the farmer's organization?
How in general are you compensated by the individual costumers?
What is the current price you get for your milk PER LITER from your main individual
costumer?
How in general are you compensated by the formal private milk trader(s)?
What is the current price you get for your milk PER LITER from the private milk trader?
How in general are you compensated by the hawkers/informal traders?
What is the current price you get for your milk PER LITER from the hawker(s)?
How many hawkers are currently active in your area?
Where do the hawkers in your area sell the milk?
For how many months have you been selling your milk to the same hawker?
At what time does the hawker usually collect your milk?
Does the hawker sometimes NOT show up when you expect him/her?
How often does the hawker not show up when you expect him/her?
Does the hawker sometimes pay too late, or less than agreed upon?
How often does the hawker usually pay too late, or less than agreed upon?
Does the hawker sometimes pay money in advance?
For how many MONTHS in advance does he pay?
Do you sometimes feel powerless against the hawkers?
How in general are you compensated by the farmer's organization?
What is the current price you get for your milk PER LITER from the farmer's organization?
How in general is transportation of the milk arranged with your individual costumers?
How in general is transportation of the milk arranged with the formal private milk trader(s)?
How in general is transportation of the milk arranged with the hawkers?
How in general is transportation of the milk arranged with the farmer's organization?
Who pays for the transport with your individual costumers?
Specify transportation payment with individual costumers:
Who pays for the transport with the formal private milk trader(s)?
Specify transportation payment with formal private milk trader(s):
Who pays for the transport with the hawkers?
Specify transportation payment with hawkers:
Who pays for the transport with the farmer's organization?
Specify transportation payment with farmer's organization:
How far is the closest milk collection point (that you use)?
Who manages that closest collection point?
Does this collection point have a chilling plant?
How far (km) is the closest market?
Do you or a household member sometimes go to this market to sell your milk?
In general, where do you prefer to sell your milk?
Why this marketing channel? Provide MAIN reason:
In the last year, did you sell your MORNING milk?
Who on avarage decides where and how to sell the MORNING milk?
Who on avarage manages the money from the MORNING milk?

90
In the last year, did you sell your EVENING milk?
Who on avarage decides where and how to sell the EVENING milk?
Who on avarage manages the money from the EVENING milk?
Does your household make mala/mursik?
Does your household sometimes sell mursik?
Organization and service provisioning
Are you part of a farmer's organization?
What kind of farmer's organization are you a part of?
What services does your organization provide?
Have you been part of a farmer's organization in the past?
What is the main reason that you are not part of a farmer's organization?
Has anyone in the household ever obtained long term credit (loans) for your dairy activities?
What was the purpose of getting the loan?
From what organization(s) did you get the loan?
What extension services are present in your area?
Specify what other extension services are in your area:
Which extenstion services have visited you in the last 12 months?
Which services did you use through the extension agents that visited you in the last 12 months?
How much money (KES) did you spent last year on all the services that visited you in the last 12
months?
Management practices
Who detects if a cow is in heat?
What do you do when a cow is in heat?
How do you feed your cattle in the DRY season?
Specify what percentage you practice GRAZING in the DRY season:
Specify what percentage you practice STALL FEEDGING in the DRY season:
How do you feed your cattle in the RAINY season?
Specify what percentage you practige GRAZING in the RAINY season:
Specify what percentage you practice STALL FEEDING in the RAINY season:
How does your cattle usually graze in the DRY season?
Where does your cattle mostly graze in the DRY season?
How does your cattle usually graze in the RAINY season?
Where does your cattle mostly graze in the RAINY season?
How many hours per day does your cattle graze in the DRY season?
How many hours per day does your cattle graze in the RAINY season?
Do you have to pay to someone to have your cattle grazing somewhere?
Who do you pay for grazing?
How much do you pay per MONTH for grazing?
Does your cattle sometimes graze in a forest?
Is forest grazing usually in the dry- or rainy season or equally in both?
Throughout the year, do you experience a shortage of feeds for your cattle?
When is this shortage of feeds most severe?
What are the two main stall feeding food sources? Select the first:
On average throughout the year, do you mostly grow this yourself or buy it?
What is the second main stall feeding feed?

91
On average throughout the year, do you mostly grow this yourself or buy it?
How many different types of feed for your cow do you BUY?
What type of dairy feed do you buy MOST?
How many kilometers from here do you purchase your most bought dairy feed?
Where/how do you get your most bought dairy feed?
On what terms do you purchase your main dairy feed bought?
What is the price per kilo?
How is transport of your main dairy feed bought arranged?
Select the second type of dairy feed most bought:
How many kilometers from here do you purchase your second most bought dairy feed?
Where/how do you get your second most bought dairy feed?
On what terms do you purchase your second main dairy feed bought?
What is the price per kilo?
How is transport of your second main dairy feed bought arranged?
Do you presently grow fodder legumes?
What are you currently growing?
Why are you not growing fodder legumes, provide the main reason:
Do you practice feed conservation on your farm?
Indicate the type(s) of feed conservation method(s) you use(d)
Select main reason for not conserving feed:
If feed conservation on your farm was promoted, what would you prefer?
Do you collect manure (from any livestock)?
Why do you not collect manure?
Why do you not collect manure from cows?
Do you apply manure (from any livestock) to food and cash crops?
Why do you not apply manure to food and cash crops?
Do you apply manure (from any livestock) to cattle feed crops?
Why do you not apply manure to dairy cattle feed crops?
In the last year, have you employed laborers on your farm?
In which months in the past year did you employ laborers on your farm?
On a scale from 1 to 10, how important is dairy for you?
If it was guaranteed that your dairy production would go up with 50%, how many hours on top
of your current working hours, would you be willing to invest daily?
Guaranteed increase of production with 50% requires investments, on top of your current
investments, how much money would you be willing to invest extra, per month?
In which category do you estimate your total monthly household income?
Collect the GPS coordinates of this household

92
3 Agrovetstore survey questions See below the questions of the agrovetstore survey. Not all questions were asked to anyone, this
was depending on answers to previous questions. In the overview below, ‘specify other’s were
taken out.
Enumerator’s Name
Date of Interview
Respondent's name
Name of agrovet store
Name of the county
Name of ward
Name of center
How many places for dairy inputs are there in total in this center?
Since what year is this store here?
Which of the following are available in this store?
Which of the following seeds are available in this store?
What is the price per kg/Desmodium seeds?
What is the price per kg/Calliandra seeds?
What is the price per kg/Luceana seeds?
What is the price per kg/Sesbania seeds?
What is the price per kg/Lucerne seeds?
What is the price per kg/Vetches seeds?
What is the price per kg/Grevillae seeds?
What are the three main things purchased by dairy farmers? Select the FIRST:
From what actor did you get/buy this product?
What kind of contract do you have with the main seller of this product?
Where is it produced?
What do you pay per kg?
For what price do you sell a kg?
From how many different sellers do you sell this product?
What is/are the name(s) of the companies that you sell this product from?
(The questions above were repeated also for the second and third main things purchased by dairy farmers).
How in general is transportation arranged of the products that you sell here?
Do this agrovet also (sometimes) deliver your products directly to farmers?
Do you sometimes experience a shortage of certain products?
If yes, for which products?
In which months are these shortages most severe?
Why are the shortages most severe in these months?

93
4 List of best dairy practices Improved feeding
- Growing fodder trees: a) Calliandra, b) Leucaena, c) Sesbania, d) Others: ......
- Growing herbaceous legumes: a) alfalfa, b) others....
- Growing grass: a) Napier grass, b) Elephant grass, c) Brachiaria, d) others....
- Feeding dairy concentrates: commercial, made on-farm
- Practice low cost fodder conservation technologies: Baling, Silage, others....
- Collecting high quality grass off-farm (practice called cut-and-carry)
- Chop crop residues to improve intake
Calves rearing
- Weaning age:....
- Feeding after weaning: X litres until X age
- Supplementary feeds: a) none, b) xxxxx Grazing
- Off-farm free ranging (hours per day rainy season, hours per day dry season)
- On-farm rotational grazing
- Zero-grazing Health
- Vaccines against most common cattle diseases such as rumen archaea, foot-and-mouth disease etc.;
- Treatments for helminthic diseases (internal parasites)
- Treatment for ticks (external parasites)
- Treatment for mastitis
- Have livestock insurance (usually for drought, as far as Mariana knows)
Herd management
- Detect heat in time and have a vet do artificial insemination;
- Insemination (artificial done by farmer, done by vet, use a bull from the village)
- For calves, after 12 months prepare them to get pregnant within 6 months;
- Livestock genetic improvement through (breeding), creating for example heat-tolerant (mostly ranching)– and drought tolerant breeds; for milk cross local zebu with Friesian, brown Swiss, or other European milk breeds.
- Conservation of livestock genetic diversity; Manure management
- Collect manure
- Compost manure
- Apply manure to food and cash crops
- Apply manure to feed crops More general
- Restore degraded or fragile rangelands through soil and water conservation practices such as land contouring with grass/trees; terracing

94
- Use silvopastoral systems such as trees in pastures and live fences, e.g. practice integration within the farming system;
- Target the location of intensive livestock production within the landscape to reduce water contamination;
- Practice rain water harvesting (drinking water for cows?);
- Sustainable intensification of livestock production to reduce pressure on fragile areas and expansion into new (forest) areas.
Based on literature as mentioned in the text. Further based on a meeting with Prof. Mariana Rufino, on April 19, 2016, Nairobi.

95
5 Outputs Hierarchical Cluster Analysis SPSS Agglomeration Schedule
Stage Cluster Combined
Coefficients Stage Cluster First Appears
Next Stage Cluster 1 Cluster 2 Cluster 1 Cluster 2 1 41 75 ,063 0 0 73 2 131 212 ,087 0 0 6 3 51 172 ,094 0 0 27 4 132 158 ,099 0 0 28 5 40 43 ,105 0 0 17 6 85 131 ,106 0 2 61 7 18 133 ,110 0 0 34 8 39 73 ,114 0 0 28 9 156 198 ,117 0 0 60 10 203 214 ,122 0 0 42 11 201 205 ,133 0 0 76 12 77 154 ,135 0 0 75 13 50 174 ,143 0 0 100 14 92 97 ,144 0 0 92 15 118 125 ,148 0 0 26 16 46 170 ,178 0 0 31 17 40 190 ,206 5 0 29 18 126 134 ,211 0 0 62 19 193 194 ,214 0 0 89 20 49 146 ,237 0 0 67 21 23 24 ,239 0 0 46 22 82 213 ,244 0 0 64 23 2 114 ,245 0 0 56 24 63 162 ,275 0 0 59 25 117 159 ,285 0 0 137 26 118 155 ,299 15 0 36 27 48 51 ,307 0 3 69 28 39 132 ,331 8 4 35 29 40 112 ,340 17 0 49 30 120 206 ,365 0 0 65 31 46 145 ,407 16 0 37 32 33 94 ,453 0 0 135 33 52 150 ,481 0 0 69 34 18 135 ,488 7 0 59 35 39 58 ,490 28 0 61 36 108 118 ,533 0 26 82 37 21 46 ,546 0 31 43 38 3 115 ,563 0 0 141 39 110 122 ,579 0 0 80 40 38 184 ,581 0 0 117 41 59 86 ,640 0 0 75 42 11 203 ,647 0 10 65 43 21 168 ,648 37 0 128 44 78 204 ,649 0 0 169 45 57 200 ,657 0 0 72 46 23 111 ,659 21 0 112 47 60 160 ,673 0 0 97 48 124 143 ,693 0 0 103 49 40 130 ,707 29 0 77 50 167 183 ,716 0 0 95 51 36 101 ,717 0 0 181 52 20 161 ,729 0 0 82 53 81 84 ,730 0 0 85 54 180 182 ,740 0 0 109 55 8 98 ,741 0 0 142 56 2 119 ,753 23 0 116 57 141 197 ,760 0 0 111

96
58 12 195 ,761 0 0 119 59 18 63 ,773 34 24 74 60 156 219 ,816 9 0 106 61 39 85 ,833 35 6 85 62 126 147 ,833 18 0 156 63 54 215 ,848 0 0 121 64 45 82 ,854 0 22 129 65 11 120 ,864 42 30 115 66 128 153 ,879 0 0 140 67 49 169 ,884 20 0 100 68 72 151 ,923 0 0 123 69 48 52 ,927 27 33 131 70 53 62 ,941 0 0 127 71 210 217 ,949 0 0 88 72 57 107 ,958 45 0 133 73 41 113 ,970 1 0 93 74 18 74 1,010 59 0 96 75 59 77 1,012 41 12 110 76 201 218 1,038 11 0 114 77 40 191 1,053 49 0 129 78 56 70 1,056 0 0 93 79 5 79 1,061 0 0 186 80 110 136 1,086 39 0 122 81 69 209 1,092 0 0 141 82 20 108 1,125 52 36 112 83 34 35 1,140 0 0 130 84 140 166 1,149 0 0 116 85 39 81 1,158 61 53 120 86 47 139 1,161 0 0 95 87 176 181 1,162 0 0 174 88 185 210 1,164 0 71 136 89 193 196 1,218 19 0 91 90 105 175 1,229 0 0 109 91 193 199 1,241 89 0 145 92 92 95 1,256 14 0 130 93 41 56 1,298 73 78 139 94 67 123 1,310 0 0 201 95 47 167 1,329 86 50 166 96 18 164 1,357 74 0 115 97 60 61 1,370 47 0 158 98 15 16 1,371 0 0 171 99 189 202 1,391 0 0 189 100 49 50 1,392 67 13 134 101 68 121 1,412 0 0 122 102 26 32 1,417 0 0 118 103 42 124 1,420 0 48 106 104 27 29 1,429 0 0 118 105 4 89 1,440 0 0 142 106 42 156 1,483 103 60 160 107 187 216 1,503 0 0 189 108 55 66 1,514 0 0 146 109 105 180 1,517 90 54 126 110 59 76 1,569 75 0 120 111 127 141 1,585 0 57 125 112 20 23 1,590 82 46 131 113 71 208 1,609 0 0 123 114 165 201 1,694 0 76 147 115 11 18 1,700 65 96 127 116 2 140 1,719 56 84 168 117 38 109 1,768 40 0 145 118 26 27 1,842 102 104 175

97
119 12 148 1,881 58 0 151 120 39 59 1,892 85 110 137 121 54 171 1,936 63 0 157 122 68 110 1,972 101 80 146 123 71 72 1,980 113 68 159 124 106 177 1,997 0 0 202 125 13 127 2,012 0 111 160 126 104 105 2,046 0 109 143 127 11 53 2,112 115 70 138 128 21 30 2,125 43 0 134 129 40 45 2,146 77 64 139 130 34 92 2,199 83 92 135 131 20 48 2,221 112 69 155 132 17 44 2,241 0 0 180 133 57 80 2,378 72 0 154 134 21 49 2,410 128 100 162 135 33 34 2,427 32 130 175 136 185 192 2,568 88 0 159 137 39 117 2,584 120 25 138 138 11 39 2,671 127 137 162 139 40 41 2,695 129 93 155 140 128 129 2,711 66 0 152 141 3 69 2,763 38 81 173 142 4 8 2,778 105 55 170 143 104 179 2,810 126 0 172 144 116 173 2,828 0 0 168 145 38 193 2,864 117 91 167 146 55 68 2,899 108 122 151 147 165 211 3,079 114 0 173 148 19 149 3,085 0 0 153 149 88 91 3,225 0 0 172 150 10 163 3,228 0 0 177 151 12 55 3,333 119 146 197 152 128 137 3,365 140 0 179 153 19 64 3,371 148 0 195 154 57 188 3,442 133 0 176 155 20 40 3,491 131 139 167 156 126 144 3,492 62 0 187 157 54 103 3,560 121 0 176 158 60 186 3,603 97 0 171 159 71 185 3,634 123 136 182 160 13 42 3,688 125 106 169 161 1 152 3,693 0 0 179 162 11 21 3,886 138 134 185 163 14 65 3,913 0 0 195 164 83 142 3,982 0 0 184 165 7 178 4,144 0 0 194 166 6 47 4,252 0 95 200 167 20 38 4,321 155 145 185 168 2 116 4,456 116 144 197 169 13 78 4,487 160 44 193 170 4 28 4,488 142 0 207 171 15 60 4,616 98 158 187 172 88 104 4,719 149 143 181 173 3 165 4,790 141 147 180 174 102 176 5,006 0 87 182 175 26 33 5,049 118 135 192 176 54 57 5,133 157 154 190 177 10 22 5,195 150 0 186 178 96 138 5,255 0 0 210 179 1 128 5,333 161 152 198

98
180 3 17 5,449 173 132 188 181 36 88 5,722 51 172 191 182 71 102 5,859 159 174 202 183 87 90 5,872 0 0 192 184 83 100 5,942 164 0 199 185 11 20 6,167 162 167 196 186 5 10 6,929 79 177 204 187 15 126 7,150 171 156 196 188 3 37 7,174 180 0 209 189 187 189 7,241 107 99 201 190 9 54 7,257 0 176 204 191 31 36 7,266 0 181 193 192 26 87 7,379 175 183 200 193 13 31 7,667 169 191 208 194 7 99 8,385 165 0 205 195 14 19 8,653 163 153 203 196 11 15 8,743 185 187 198 197 2 12 9,029 168 151 210 198 1 11 9,351 179 196 206 199 83 207 9,534 184 0 211 200 6 26 9,793 166 192 206 201 67 187 9,967 94 189 209 202 71 106 10,038 182 124 205 203 14 25 10,313 195 0 212 204 5 9 10,542 186 190 211 205 7 71 11,388 194 202 208 206 1 6 11,431 198 200 212 207 4 157 11,764 170 0 214 208 7 13 12,375 205 193 216 209 3 67 12,483 188 201 218 210 2 96 12,614 197 178 213 211 5 83 13,338 204 199 215 212 1 14 13,443 206 203 213 213 1 2 14,724 212 210 214 214 1 4 15,671 213 207 217 215 5 93 15,980 211 0 216 216 5 7 17,250 215 208 217 217 1 5 20,646 214 216 218 218 1 3 23,195 217 209 0
Cluster Membership Case 4 Clusters 1:Case 1 1 2:Case 2 1 3:Case 3 2 4:Case 4 1 5:Case 5 3 6:Case 6 1 7:Case 7 4 8:Case 8 1 9:Case 9 3 10:Case 10 3 11:Case 11 1 12:Case 12 1 13:Case 13 4 14:Case 14 1 15:Case 15 1 16:Case 16 1 17:Case 17 2 18:Case 18 1

99
19:Case 19 1 20:Case 20 1 21:Case 21 1 22:Case 22 3 23:Case 23 1 24:Case 24 1 25:Case 25 1 26:Case 26 1 27:Case 27 1 28:Case 28 1 29:Case 29 1 30:Case 30 1 31:Case 31 4 32:Case 32 1 33:Case 33 1 34:Case 34 1 35:Case 35 1 36:Case 36 4 37:Case 37 2 38:Case 38 1 39:Case 39 1 40:Case 40 1 41:Case 41 1 42:Case 42 4 43:Case 43 1 44:Case 44 2 45:Case 45 1 46:Case 46 1 47:Case 47 1 48:Case 48 1 49:Case 49 1 50:Case 50 1 51:Case 51 1 52:Case 52 1 53:Case 53 1 54:Case 54 3 55:Case 55 1 56:Case 56 1 57:Case 57 3 58:Case 58 1 59:Case 59 1 60:Case 60 1 61:Case 61 1 62:Case 62 1 63:Case 63 1 64:Case 64 1 65:Case 65 1 66:Case 66 1 67:Case 67 2 68:Case 68 1 69:Case 69 2 70:Case 70 1 71:Case 71 4 72:Case 72 4 73:Case 73 1 74:Case 74 1 75:Case 75 1 76:Case 76 1 77:Case 77 1 78:Case 78 4 79:Case 79 3

100
80:Case 80 3 81:Case 81 1 82:Case 82 1 83:Case 83 3 84:Case 84 1 85:Case 85 1 86:Case 86 1 87:Case 87 1 88:Case 88 4 89:Case 89 1 90:Case 90 1 91:Case 91 4 92:Case 92 1 93:Case 93 3 94:Case 94 1 95:Case 95 1 96:Case 96 1 97:Case 97 1 98:Case 98 1 99:Case 99 4 100:Case 100 3 101:Case 101 4 102:Case 102 4 103:Case 103 3 104:Case 104 4 105:Case 105 4 106:Case 106 4 107:Case 107 3 108:Case 108 1 109:Case 109 1 110:Case 110 1 111:Case 111 1 112:Case 112 1 113:Case 113 1 114:Case 114 1 115:Case 115 2 116:Case 116 1 117:Case 117 1 118:Case 118 1 119:Case 119 1 120:Case 120 1 121:Case 121 1 122:Case 122 1 123:Case 123 2 124:Case 124 4 125:Case 125 1 126:Case 126 1 127:Case 127 4 128:Case 128 1 129:Case 129 1 130:Case 130 1 131:Case 131 1 132:Case 132 1 133:Case 133 1 134:Case 134 1 135:Case 135 1 136:Case 136 1 137:Case 137 1 138:Case 138 1 139:Case 139 1 140:Case 140 1

101
141:Case 141 4 142:Case 142 3 143:Case 143 4 144:Case 144 1 145:Case 145 1 146:Case 146 1 147:Case 147 1 148:Case 148 1 149:Case 149 1 150:Case 150 1 151:Case 151 4 152:Case 152 1 153:Case 153 1 154:Case 154 1 155:Case 155 1 156:Case 156 4 157:Case 157 1 158:Case 158 1 159:Case 159 1 160:Case 160 1 161:Case 161 1 162:Case 162 1 163:Case 163 3 164:Case 164 1 165:Case 165 2 166:Case 166 1 167:Case 167 1 168:Case 168 1 169:Case 169 1 170:Case 170 1 171:Case 171 3 172:Case 172 1 173:Case 173 1 174:Case 174 1 175:Case 175 4 176:Case 176 4 177:Case 177 4 178:Case 178 4 179:Case 179 4 180:Case 180 4 181:Case 181 4 182:Case 182 4 183:Case 183 1 184:Case 184 1 185:Case 185 4 186:Case 186 1 187:Case 187 2 188:Case 188 3 189:Case 189 2 190:Case 190 1 191:Case 191 1 192:Case 192 4 193:Case 193 1 194:Case 194 1 195:Case 195 1 196:Case 196 1 197:Case 197 4 198:Case 198 4 199:Case 199 1 200:Case 200 3 201:Case 201 2

102
202:Case 202 2 203:Case 203 1 204:Case 204 4 205:Case 205 2 206:Case 206 1 207:Case 207 3 208:Case 208 4 209:Case 209 2 210:Case 210 4 211:Case 211 2 212:Case 212 1 213:Case 213 1 214:Case 214 1 215:Case 215 3 216:Case 216 2 217:Case 217 4 218:Case 218 2 219:Case 219 4

103
6 Case processing summary and parameter estimates probit sell formal Case Processing Summary
N Marginal
Percentage sell formal no 114 48,3%
yes 118 50,0% 99 4 1,7%
dependency ratio ,0 26 11,0% 12,5 3 1,3% 14,3 4 1,7% 16,7 7 3,0% 20,0 12 5,1% 25,0 5 2,1% 28,6 10 4,2% 30,0 1 0,4% 33,3 30 12,7% 37,5 6 2,5% 40,0 20 8,5% 42,9 13 5,5% 44,4 3 1,3% 45,5 1 0,4% 50,0 42 17,8% 57,1 5 2,1% 58,3 1 0,4% 60,0 22 9,3% 66,7 14 5,9% 70,0 1 0,4% 71,4 3 1,3% 72,7 1 0,4% 75,0 4 1,7% 80,0 1 0,4% 83,3 1 0,4%
male household head no 45 19,1% yes 191 80,9%
female household head no 191 80,9% yes 45 19,1%
nr. of cows 1 64 27,1% 2 78 33,1% 3 36 15,3% 4 22 9,3% 5 16 6,8% 6 6 2,5% 7 6 2,5% 8 2 0,8% 9 5 2,1% 10 1 0,4%
distance cooler (km) ,1 1 0,4% ,2 6 2,5% ,3 6 2,5% ,5 16 6,8% ,6 6 2,5% ,7 7 3,0% ,8 3 1,3% 1,0 21 8,9% 1,5 12 5,1%

104
2,0 13 5,5% 2,5 22 9,3% 3,0 13 5,5% 5,0 9 3,8% 6,0 13 5,5% 6,5 2 0,8% 7,0 7 3,0% 8,0 4 1,7% 9,0 10 4,2% 11,0 18 7,6% 12,0 7 3,0% 14,0 6 2,5% 15,0 8 3,4% 16,0 1 0,4% 17,0 6 2,5% 18,0 3 1,3% 20,0 2 0,8% 21,0 2 0,8% 22,0 1 0,4% 23,0 11 4,7%
owned land size (acres) ,0 2 0,8% ,2 1 0,4% ,4 1 0,4% ,5 8 3,4% ,6 3 1,3% ,7 3 1,3% ,8 4 1,7% ,9 1 0,4% 1,0 17 7,2% 1,1 1 0,4% 1,2 4 1,7% 1,3 1 0,4% 1,5 18 7,6% 1,8 2 0,8% 2,0 40 16,9% 2,5 4 1,7% 3,0 32 13,6% 3,5 1 0,4% 3,9 1 0,4% 4,0 17 7,2% 5,0 12 5,1% 6,0 14 5,9% 6,5 2 0,8% 7,0 7 3,0% 8,0 4 1,7% 9,0 4 1,7% 9,5 2 0,8% 10,0 7 3,0% 11,0 1 0,4% 12,0 6 2,5% 14,0 1 0,4% 15,0 1 0,4% 17,0 1 0,4% 18,0 2 0,8% 20,0 6 2,5%

105
23,0 1 0,4% 25,0 2 0,8% 27,0 1 0,4% 30,0 1 0,4%
only grazing dry 0 174 73,7% 1 62 26,3%
only grazing rain 0 164 69,5% 1 72 30,5%
Valid 236 100,0% Missing 4 Total 240
Parameter Estimates
Estimate Std. Error Wald df Sig.
95% Confidence Interval
Lower Bound
Upper Bound
Threshold [sell_formal = 0] 1,438 6,126 ,055 1 ,814 -10,569 13,444 [sell_formal = 1] 5,764 6,098 ,894 1 ,345 -6,187 17,715
Location [dependency_ratio=,0] 3,686 5,120 ,518 1 ,472 -6,349 13,722 [dependency_ratio=12,5] 3,164 5,258 ,362 1 ,547 -7,142 13,470 [dependency_ratio=14,3] 3,256 5,271 ,382 1 ,537 -7,075 13,586 [dependency_ratio=16,7] 3,908 5,213 ,562 1 ,453 -6,309 14,126 [dependency_ratio=20,0] 2,821 5,142 ,301 1 ,583 -7,256 12,899 [dependency_ratio=25,0] 5,713 5,171 1,221 1 ,269 -4,421 15,847 [dependency_ratio=28,6] 3,253 5,117 ,404 1 ,525 -6,775 13,282 [dependency_ratio=30,0] -,227 7,851 ,001 1 ,977 -15,614 15,160 [dependency_ratio=33,3] 3,654 5,100 ,513 1 ,474 -6,342 13,650 [dependency_ratio=37,5] 4,026 5,345 ,567 1 ,451 -6,450 14,501 [dependency_ratio=40,0] 3,328 5,111 ,424 1 ,515 -6,689 13,345 [dependency_ratio=42,9] 3,275 5,109 ,411 1 ,521 -6,738 13,288 [dependency_ratio=44,4] 3,064 5,273 ,338 1 ,561 -7,270 13,399 [dependency_ratio=45,5] 9,634 5,831 2,730 1 ,099 -1,795 21,064 [dependency_ratio=50,0] 3,823 5,096 ,563 1 ,453 -6,164 13,811 [dependency_ratio=57,1] 2,988 5,239 ,325 1 ,568 -7,280 13,256 [dependency_ratio=58,3] 4,083 7,373 ,307 1 ,580 -10,367 18,533 [dependency_ratio=60,0] 4,277 5,116 ,699 1 ,403 -5,751 14,304 [dependency_ratio=66,7] 3,945 5,107 ,597 1 ,440 -6,065 13,955 [dependency_ratio=70,0] ,089 5,913 ,000 1 ,988 -11,501 11,678 [dependency_ratio=71,4] 3,712 5,211 ,507 1 ,476 -6,501 13,925 [dependency_ratio=72,7] 4,298 7,986 ,290 1 ,590 -11,355 19,951 [dependency_ratio=75,0] 7,028 5,216 1,815 1 ,178 -3,196 17,251 [dependency_ratio=80,0] 4,094 7,848 ,272 1 ,602 -11,288 19,476 [dependency_ratio=83,3] 0a . . 0 . . . [male_hh=0] ,441 ,464 ,904 1 ,342 -,468 1,350 [male_hh=1] 0a . . 0 . . . [female_hh=0] 0a . . 0 . . . [female_hh=1] 0a . . 0 . . . [qn16e_animal_type=1] -4,366 1,589 7,549 1 ,006 -7,481 -1,252 [qn16e_animal_type=2] -3,718 1,575 5,571 1 ,018 -6,805 -,631 [qn16e_animal_type=3] -3,374 1,608 4,405 1 ,036 -6,525 -,223 [qn16e_animal_type=4] -2,604 1,605 2,631 1 ,105 -5,751 ,543 [qn16e_animal_type=5] -3,663 1,753 4,364 1 ,037 -7,099 -,226 [qn16e_animal_type=6] -3,149 1,828 2,968 1 ,085 -6,733 ,434 [qn16e_animal_type=7] -1,841 1,843 ,999 1 ,318 -5,453 1,770
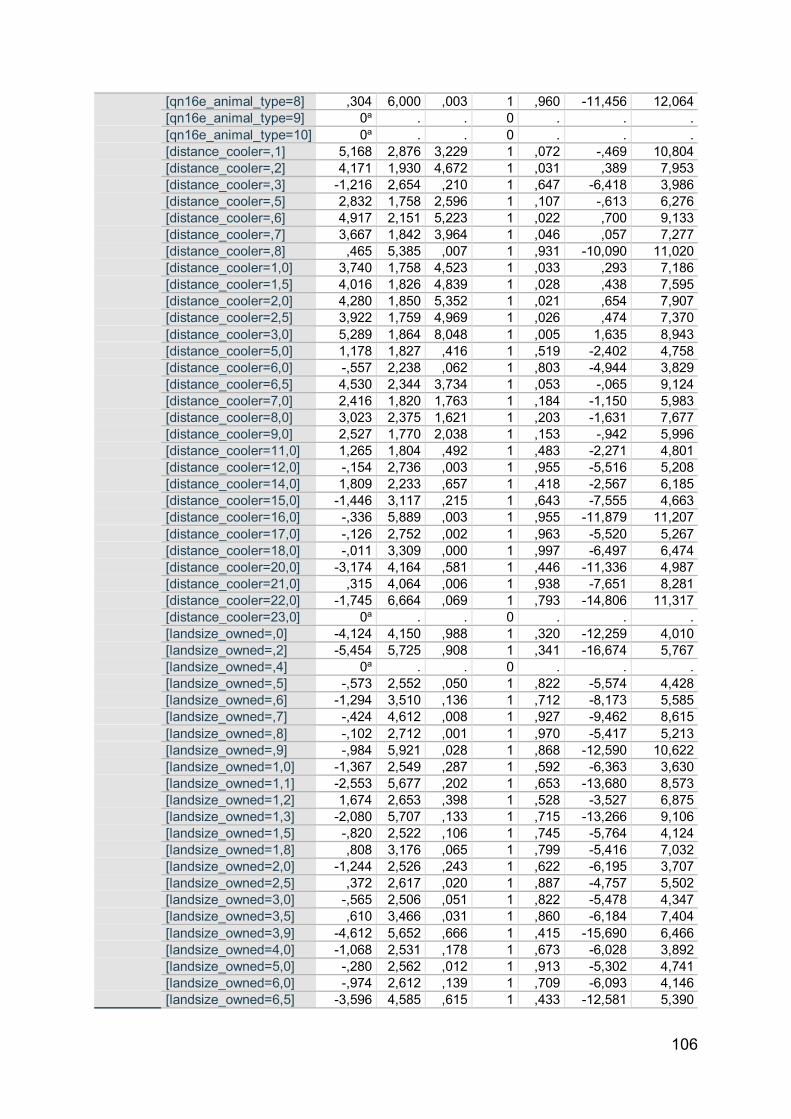
106
[qn16e_animal_type=8] ,304 6,000 ,003 1 ,960 -11,456 12,064 [qn16e_animal_type=9] 0a . . 0 . . . [qn16e_animal_type=10] 0a . . 0 . . . [distance_cooler=,1] 5,168 2,876 3,229 1 ,072 -,469 10,804 [distance_cooler=,2] 4,171 1,930 4,672 1 ,031 ,389 7,953 [distance_cooler=,3] -1,216 2,654 ,210 1 ,647 -6,418 3,986 [distance_cooler=,5] 2,832 1,758 2,596 1 ,107 -,613 6,276 [distance_cooler=,6] 4,917 2,151 5,223 1 ,022 ,700 9,133 [distance_cooler=,7] 3,667 1,842 3,964 1 ,046 ,057 7,277 [distance_cooler=,8] ,465 5,385 ,007 1 ,931 -10,090 11,020 [distance_cooler=1,0] 3,740 1,758 4,523 1 ,033 ,293 7,186 [distance_cooler=1,5] 4,016 1,826 4,839 1 ,028 ,438 7,595 [distance_cooler=2,0] 4,280 1,850 5,352 1 ,021 ,654 7,907 [distance_cooler=2,5] 3,922 1,759 4,969 1 ,026 ,474 7,370 [distance_cooler=3,0] 5,289 1,864 8,048 1 ,005 1,635 8,943 [distance_cooler=5,0] 1,178 1,827 ,416 1 ,519 -2,402 4,758 [distance_cooler=6,0] -,557 2,238 ,062 1 ,803 -4,944 3,829 [distance_cooler=6,5] 4,530 2,344 3,734 1 ,053 -,065 9,124 [distance_cooler=7,0] 2,416 1,820 1,763 1 ,184 -1,150 5,983 [distance_cooler=8,0] 3,023 2,375 1,621 1 ,203 -1,631 7,677 [distance_cooler=9,0] 2,527 1,770 2,038 1 ,153 -,942 5,996 [distance_cooler=11,0] 1,265 1,804 ,492 1 ,483 -2,271 4,801 [distance_cooler=12,0] -,154 2,736 ,003 1 ,955 -5,516 5,208 [distance_cooler=14,0] 1,809 2,233 ,657 1 ,418 -2,567 6,185 [distance_cooler=15,0] -1,446 3,117 ,215 1 ,643 -7,555 4,663 [distance_cooler=16,0] -,336 5,889 ,003 1 ,955 -11,879 11,207 [distance_cooler=17,0] -,126 2,752 ,002 1 ,963 -5,520 5,267 [distance_cooler=18,0] -,011 3,309 ,000 1 ,997 -6,497 6,474 [distance_cooler=20,0] -3,174 4,164 ,581 1 ,446 -11,336 4,987 [distance_cooler=21,0] ,315 4,064 ,006 1 ,938 -7,651 8,281 [distance_cooler=22,0] -1,745 6,664 ,069 1 ,793 -14,806 11,317 [distance_cooler=23,0] 0a . . 0 . . . [landsize_owned=,0] -4,124 4,150 ,988 1 ,320 -12,259 4,010 [landsize_owned=,2] -5,454 5,725 ,908 1 ,341 -16,674 5,767 [landsize_owned=,4] 0a . . 0 . . . [landsize_owned=,5] -,573 2,552 ,050 1 ,822 -5,574 4,428 [landsize_owned=,6] -1,294 3,510 ,136 1 ,712 -8,173 5,585 [landsize_owned=,7] -,424 4,612 ,008 1 ,927 -9,462 8,615 [landsize_owned=,8] -,102 2,712 ,001 1 ,970 -5,417 5,213 [landsize_owned=,9] -,984 5,921 ,028 1 ,868 -12,590 10,622 [landsize_owned=1,0] -1,367 2,549 ,287 1 ,592 -6,363 3,630 [landsize_owned=1,1] -2,553 5,677 ,202 1 ,653 -13,680 8,573 [landsize_owned=1,2] 1,674 2,653 ,398 1 ,528 -3,527 6,875 [landsize_owned=1,3] -2,080 5,707 ,133 1 ,715 -13,266 9,106 [landsize_owned=1,5] -,820 2,522 ,106 1 ,745 -5,764 4,124 [landsize_owned=1,8] ,808 3,176 ,065 1 ,799 -5,416 7,032 [landsize_owned=2,0] -1,244 2,526 ,243 1 ,622 -6,195 3,707 [landsize_owned=2,5] ,372 2,617 ,020 1 ,887 -4,757 5,502 [landsize_owned=3,0] -,565 2,506 ,051 1 ,822 -5,478 4,347 [landsize_owned=3,5] ,610 3,466 ,031 1 ,860 -6,184 7,404 [landsize_owned=3,9] -4,612 5,652 ,666 1 ,415 -15,690 6,466 [landsize_owned=4,0] -1,068 2,531 ,178 1 ,673 -6,028 3,892 [landsize_owned=5,0] -,280 2,562 ,012 1 ,913 -5,302 4,741 [landsize_owned=6,0] -,974 2,612 ,139 1 ,709 -6,093 4,146 [landsize_owned=6,5] -3,596 4,585 ,615 1 ,433 -12,581 5,390

107
[landsize_owned=7,0] -,154 2,964 ,003 1 ,959 -5,963 5,656 [landsize_owned=8,0] -1,260 2,673 ,222 1 ,637 -6,499 3,980 [landsize_owned=9,0] -2,073 2,802 ,548 1 ,459 -7,564 3,418 [landsize_owned=9,5] -,773 6,244 ,015 1 ,902 -13,012 11,466 [landsize_owned=10,0] -1,513 2,616 ,334 1 ,563 -6,640 3,614 [landsize_owned=11,0] 3,143 6,230 ,255 1 ,614 -9,067 15,354 [landsize_owned=12,0] -1,493 2,653 ,317 1 ,574 -6,692 3,707 [landsize_owned=14,0] -1,160 5,726 ,041 1 ,839 -12,383 10,063 [landsize_owned=15,0] -1,731 3,402 ,259 1 ,611 -8,399 4,937 [landsize_owned=17,0] -2,347 3,556 ,436 1 ,509 -9,315 4,622 [landsize_owned=18,0] -2,442 2,859 ,730 1 ,393 -8,046 3,162 [landsize_owned=20,0] -1,846 2,735 ,456 1 ,500 -7,206 3,514 [landsize_owned=23,0] -,978 3,916 ,062 1 ,803 -8,653 6,697 [landsize_owned=25,0] -2,461 4,061 ,367 1 ,544 -10,420 5,498 [landsize_owned=27,0] -5,389 6,755 ,636 1 ,425 -18,628 7,850 [landsize_owned=30,0] 0a . . 0 . . . [onlygrazing_dry=0] -,888 ,700 1,611 1 ,204 -2,260 ,483 [onlygrazing_dry=1] 0a . . 0 . . . [onlygrazing_rain=0] ,598 ,677 ,782 1 ,377 -,728 1,924 [onlygrazing_rain=1] 0a . . 0 . . .
Link function: Probit. a. This parameter is set to zero because it is redundant.
* Significant at the 0.1 level. ** Significant at the 0.05 level. *** Significant at the 0.01 level.
7 Case processing summary and parameter estimates probit sell informal Case Processing Summary
N Marginal
Percentage sell informal no 87 36,9%
yes 145 61,4% 99 4 1,7%
dependency ratio ,0 26 11,0% 12,5 3 1,3% 14,3 4 1,7% 16,7 7 3,0% 20,0 12 5,1% 25,0 5 2,1% 28,6 10 4,2% 30,0 1 0,4% 33,3 30 12,7% 37,5 6 2,5% 40,0 20 8,5% 42,9 13 5,5% 44,4 3 1,3% 45,5 1 0,4% 50,0 42 17,8% 57,1 5 2,1% 58,3 1 0,4% 60,0 22 9,3% 66,7 14 5,9% 70,0 1 0,4% 71,4 3 1,3% 72,7 1 0,4% 75,0 4 1,7%

108
80,0 1 0,4% 83,3 1 0,4%
male household head no 45 19,1% yes 191 80,9%
female household head no 191 80,9% yes 45 19,1%
nr. of cows 1 64 27,1% 2 78 33,1% 3 36 15,3% 4 22 9,3% 5 16 6,8% 6 6 2,5% 7 6 2,5% 8 2 0,8% 9 5 2,1% 10 1 0,4%
distance cooler (km) ,1 1 0,4% ,2 6 2,5% ,3 6 2,5% ,5 16 6,8% ,6 6 2,5% ,7 7 3,0% ,8 3 1,3% 1,0 21 8,9% 1,5 12 5,1% 2,0 13 5,5% 2,5 22 9,3% 3,0 13 5,5% 5,0 9 3,8% 6,0 13 5,5% 6,5 2 0,8% 7,0 7 3,0% 8,0 4 1,7% 9,0 10 4,2% 11,0 18 7,6% 12,0 7 3,0% 14,0 6 2,5% 15,0 8 3,4% 16,0 1 0,4% 17,0 6 2,5% 18,0 3 1,3% 20,0 2 0,8% 21,0 2 0,8% 22,0 1 0,4% 23,0 11 4,7%
owned land size (acres) ,0 2 0,8% ,2 1 0,4% ,4 1 0,4% ,5 8 3,4% ,6 3 1,3% ,7 3 1,3% ,8 4 1,7% ,9 1 0,4% 1,0 17 7,2% 1,1 1 0,4%

109
1,2 4 1,7% 1,3 1 0,4% 1,5 18 7,6% 1,8 2 0,8% 2,0 40 16,9% 2,5 4 1,7% 3,0 32 13,6% 3,5 1 0,4% 3,9 1 0,4% 4,0 17 7,2% 5,0 12 5,1% 6,0 14 5,9% 6,5 2 0,8% 7,0 7 3,0% 8,0 4 1,7% 9,0 4 1,7% 9,5 2 0,8% 10,0 7 3,0% 11,0 1 0,4% 12,0 6 2,5% 14,0 1 0,4% 15,0 1 0,4% 17,0 1 0,4% 18,0 2 0,8% 20,0 6 2,5% 23,0 1 0,4% 25,0 2 0,8% 27,0 1 0,4% 30,0 1 0,4%
only grazing dry 0 174 73,7% 1 62 26,3%
only grazing rain 0 164 69,5% 1 72 30,5%
Valid 236 100,0% Missing 4 Total 240
Parameter estimates
Estimate
Std. Error Wald df Sig.
95% Confidence Interval Lower Bound
Upper Bound
Threshold [sell_informal = 0] -5,421 6,549 ,685 1 ,408 -18,258 7,416 [sell_informal = 1] -,473 6,488 ,005 1 ,942 -13,189 12,244
Location [dependency_ratio=,0] -1,765 3,191 ,306 1 ,580 -8,020 4,489 [dependency_ratio=12,5] -,967 3,412 ,080 1 ,777 -7,656 5,721 [dependency_ratio=14,3] -2,379 3,364 ,500 1 ,480 -8,972 4,215 [dependency_ratio=16,7] -3,378 3,335 1,025 1 ,311 -9,915 3,160 [dependency_ratio=20,0] -2,600 3,238 ,645 1 ,422 -8,946 3,746 [dependency_ratio=25,0] -1,019 3,245 ,099 1 ,753 -7,379 5,341 [dependency_ratio=28,6] -1,737 3,243 ,287 1 ,592 -8,093 4,618 [dependency_ratio=30,0] 3,272 7,152 ,209 1 ,647 -10,746 17,290 [dependency_ratio=33,3] -1,894 3,171 ,357 1 ,550 -8,109 4,321 [dependency_ratio=37,5] -1,943 3,372 ,332 1 ,564 -8,552 4,666 [dependency_ratio=40,0] -1,677 3,187 ,277 1 ,599 -7,924 4,569 [dependency_ratio=42,9] -2,551 3,209 ,632 1 ,427 -8,841 3,739 [dependency_ratio=44,4] -1,076 3,760 ,082 1 ,775 -8,446 6,293 [dependency_ratio=45,5] -1,931 4,511 ,183 1 ,669 -10,771 6,910
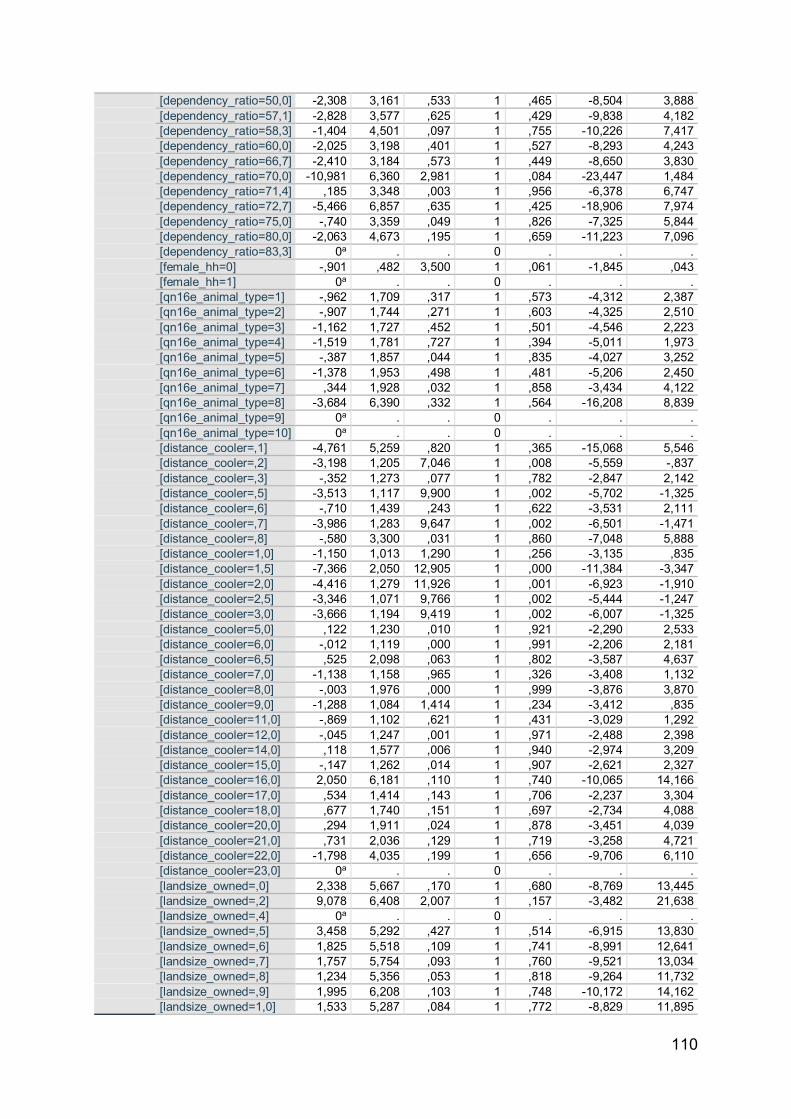
110
[dependency_ratio=50,0] -2,308 3,161 ,533 1 ,465 -8,504 3,888 [dependency_ratio=57,1] -2,828 3,577 ,625 1 ,429 -9,838 4,182 [dependency_ratio=58,3] -1,404 4,501 ,097 1 ,755 -10,226 7,417 [dependency_ratio=60,0] -2,025 3,198 ,401 1 ,527 -8,293 4,243 [dependency_ratio=66,7] -2,410 3,184 ,573 1 ,449 -8,650 3,830 [dependency_ratio=70,0] -10,981 6,360 2,981 1 ,084 -23,447 1,484 [dependency_ratio=71,4] ,185 3,348 ,003 1 ,956 -6,378 6,747 [dependency_ratio=72,7] -5,466 6,857 ,635 1 ,425 -18,906 7,974 [dependency_ratio=75,0] -,740 3,359 ,049 1 ,826 -7,325 5,844 [dependency_ratio=80,0] -2,063 4,673 ,195 1 ,659 -11,223 7,096 [dependency_ratio=83,3] 0a . . 0 . . . [female_hh=0] -,901 ,482 3,500 1 ,061 -1,845 ,043 [female_hh=1] 0a . . 0 . . . [qn16e_animal_type=1] -,962 1,709 ,317 1 ,573 -4,312 2,387 [qn16e_animal_type=2] -,907 1,744 ,271 1 ,603 -4,325 2,510 [qn16e_animal_type=3] -1,162 1,727 ,452 1 ,501 -4,546 2,223 [qn16e_animal_type=4] -1,519 1,781 ,727 1 ,394 -5,011 1,973 [qn16e_animal_type=5] -,387 1,857 ,044 1 ,835 -4,027 3,252 [qn16e_animal_type=6] -1,378 1,953 ,498 1 ,481 -5,206 2,450 [qn16e_animal_type=7] ,344 1,928 ,032 1 ,858 -3,434 4,122 [qn16e_animal_type=8] -3,684 6,390 ,332 1 ,564 -16,208 8,839 [qn16e_animal_type=9] 0a . . 0 . . . [qn16e_animal_type=10] 0a . . 0 . . . [distance_cooler=,1] -4,761 5,259 ,820 1 ,365 -15,068 5,546 [distance_cooler=,2] -3,198 1,205 7,046 1 ,008 -5,559 -,837 [distance_cooler=,3] -,352 1,273 ,077 1 ,782 -2,847 2,142 [distance_cooler=,5] -3,513 1,117 9,900 1 ,002 -5,702 -1,325 [distance_cooler=,6] -,710 1,439 ,243 1 ,622 -3,531 2,111 [distance_cooler=,7] -3,986 1,283 9,647 1 ,002 -6,501 -1,471 [distance_cooler=,8] -,580 3,300 ,031 1 ,860 -7,048 5,888 [distance_cooler=1,0] -1,150 1,013 1,290 1 ,256 -3,135 ,835 [distance_cooler=1,5] -7,366 2,050 12,905 1 ,000 -11,384 -3,347 [distance_cooler=2,0] -4,416 1,279 11,926 1 ,001 -6,923 -1,910 [distance_cooler=2,5] -3,346 1,071 9,766 1 ,002 -5,444 -1,247 [distance_cooler=3,0] -3,666 1,194 9,419 1 ,002 -6,007 -1,325 [distance_cooler=5,0] ,122 1,230 ,010 1 ,921 -2,290 2,533 [distance_cooler=6,0] -,012 1,119 ,000 1 ,991 -2,206 2,181 [distance_cooler=6,5] ,525 2,098 ,063 1 ,802 -3,587 4,637 [distance_cooler=7,0] -1,138 1,158 ,965 1 ,326 -3,408 1,132 [distance_cooler=8,0] -,003 1,976 ,000 1 ,999 -3,876 3,870 [distance_cooler=9,0] -1,288 1,084 1,414 1 ,234 -3,412 ,835 [distance_cooler=11,0] -,869 1,102 ,621 1 ,431 -3,029 1,292 [distance_cooler=12,0] -,045 1,247 ,001 1 ,971 -2,488 2,398 [distance_cooler=14,0] ,118 1,577 ,006 1 ,940 -2,974 3,209 [distance_cooler=15,0] -,147 1,262 ,014 1 ,907 -2,621 2,327 [distance_cooler=16,0] 2,050 6,181 ,110 1 ,740 -10,065 14,166 [distance_cooler=17,0] ,534 1,414 ,143 1 ,706 -2,237 3,304 [distance_cooler=18,0] ,677 1,740 ,151 1 ,697 -2,734 4,088 [distance_cooler=20,0] ,294 1,911 ,024 1 ,878 -3,451 4,039 [distance_cooler=21,0] ,731 2,036 ,129 1 ,719 -3,258 4,721 [distance_cooler=22,0] -1,798 4,035 ,199 1 ,656 -9,706 6,110 [distance_cooler=23,0] 0a . . 0 . . . [landsize_owned=,0] 2,338 5,667 ,170 1 ,680 -8,769 13,445 [landsize_owned=,2] 9,078 6,408 2,007 1 ,157 -3,482 21,638 [landsize_owned=,4] 0a . . 0 . . . [landsize_owned=,5] 3,458 5,292 ,427 1 ,514 -6,915 13,830 [landsize_owned=,6] 1,825 5,518 ,109 1 ,741 -8,991 12,641 [landsize_owned=,7] 1,757 5,754 ,093 1 ,760 -9,521 13,034 [landsize_owned=,8] 1,234 5,356 ,053 1 ,818 -9,264 11,732 [landsize_owned=,9] 1,995 6,208 ,103 1 ,748 -10,172 14,162 [landsize_owned=1,0] 1,533 5,287 ,084 1 ,772 -8,829 11,895

111
[landsize_owned=1,1] 1,420 6,161 ,053 1 ,818 -10,655 13,495 [landsize_owned=1,2] -1,193 5,510 ,047 1 ,829 -11,992 9,606 [landsize_owned=1,3] 2,450 6,175 ,157 1 ,692 -9,653 14,553 [landsize_owned=1,5] 1,685 5,288 ,102 1 ,750 -8,679 12,050 [landsize_owned=1,8] 3,177 5,392 ,347 1 ,556 -7,391 13,746 [landsize_owned=2,0] 1,092 5,285 ,043 1 ,836 -9,266 11,450 [landsize_owned=2,5] 1,977 5,362 ,136 1 ,712 -8,533 12,486 [landsize_owned=3,0] 1,327 5,286 ,063 1 ,802 -9,034 11,688 [landsize_owned=3,5] ,692 7,412 ,009 1 ,926 -13,835 15,219 [landsize_owned=3,9] 3,558 6,139 ,336 1 ,562 -8,475 15,591 [landsize_owned=4,0] 2,061 5,293 ,152 1 ,697 -8,313 12,435 [landsize_owned=5,0] 1,645 5,324 ,095 1 ,757 -8,790 12,080 [landsize_owned=6,0] -,321 5,328 ,004 1 ,952 -10,764 10,122 [landsize_owned=6,5] ,704 5,800 ,015 1 ,903 -10,664 12,071 [landsize_owned=7,0] ,525 5,388 ,009 1 ,922 -10,035 11,085 [landsize_owned=8,0] 2,389 5,357 ,199 1 ,656 -8,110 12,888 [landsize_owned=9,0] 2,420 5,320 ,207 1 ,649 -8,008 12,848 [landsize_owned=9,5] 1,487 6,204 ,057 1 ,811 -10,672 13,647 [landsize_owned=10,0] 2,353 5,318 ,196 1 ,658 -8,071 12,776 [landsize_owned=11,0] 2,158 6,987 ,095 1 ,757 -11,537 15,852 [landsize_owned=12,0] 1,577 5,350 ,087 1 ,768 -8,909 12,063 [landsize_owned=14,0] 2,165 6,198 ,122 1 ,727 -9,982 14,313 [landsize_owned=15,0] 2,055 7,389 ,077 1 ,781 -12,427 16,536 [landsize_owned=17,0] -,260 7,479 ,001 1 ,972 -14,920 14,399 [landsize_owned=18,0] -1,441 6,541 ,049 1 ,826 -14,261 11,378 [landsize_owned=20,0] 3,647 5,460 ,446 1 ,504 -7,055 14,348 [landsize_owned=23,0] ,204 6,425 ,001 1 ,975 -12,389 12,798 [landsize_owned=25,0] -4,610 7,783 ,351 1 ,554 -19,864 10,644 [landsize_owned=27,0] 2,825 9,620 ,086 1 ,769 -16,031 21,680 [landsize_owned=30,0] 0a . . 0 . . . [onlygrazing_dry=0] -,514 ,670 ,589 1 ,443 -1,828 ,799 [onlygrazing_dry=1] 0a . . 0 . . . [onlygrazing_rain=0] -,339 ,669 ,256 1 ,613 -1,651 ,973 [onlygrazing_rain=1] 0a . . 0 . . .
Link function: Probit. a. This parameter is set to zero because it is redundant.