Are Microcredit Participants in Bangladesh Trapped in Poverty and Debt?
Upload
independentCategory
view
1download
0
Colloids and Surfaces A: Physicochem. Eng. Aspects 253 (2005) 83–93
Trapped non-equilibrium states in aqueous solutions of oppositelycharged polyelectrolytes and surfactants: effects of mixing protocol
and salt concentration
A. Naderia,∗, P.M. Claessona,b, M. Bergstromc, A. Dedinaitea,b
a Department of Chemistry, Surface Chemistry, Royal Institute of Technology, Drottning Kristinas v¨ag 51, SE-100 44 Stockholm, Swedenb Institute for Surface Chemistry, P.O. Box 5607, SE-114 86 Stockholm, Sweden
c Department of Pharmacy, Box 580, SE-751 23 Uppsala, Sweden
Received 9 March 2004; accepted 28 October 2004Available online 15 December 2004
Abstract
pecies buta cts can be ofg electrolytem he detailso ted “PTS”a added intot unction oft monstratet ersists forl surfactants to colloidali surfactanta s with excessp©
Kb
1
ctno
omeedions.d bycen-
, for
ture
0d
The very slow equilibration time in oppositely charged systems makes it necessary to control not only the concentration of the slso the details of the mixing process. This has been demonstrated for processes occurring at interfaces where order of addition effereat importance. In this investigation we set out to study the bulk properties of aqueous mixtures of a highly charged cationic polyixed with an anionic surfactant with the aim to learn if long-lived non-equilibrium states were formed also in this case, and thus if tf the mixing procedure would affect the structure of the aggregates formed. For simplicity we chose two mixing protocols, denond “STP”. In the PTS-method the polyelectrolyte is added to the surfactant solution whereas in the STP-method the surfactant is
he polyelectrolyte solution. The properties of the mixtures in aqueous solutions, with different NaCl concentrations and as a fime, were followed by conducting turbidity, electrophoretic mobility and dynamic light scattering measurements. The results dehat the mixing protocol indeed has a great impact on the size of the aggregates initially formed and that this size difference pong times. Hence, trapped non-equilibrium states do play an important role also in the bulk solution. We found that in excessolutions the smaller aggregates formed by the STP-method are more resistant than the larger ones formed by the PTS-methodnstability induced by electrolytes (NaCl). Based on our results we suggest that for producing small and stable polyelectrolyte–ggregates in systems with excess surfactant, the surfactant should be added last, while the opposite should be applied for systemolyelectrolyte.2004 Elsevier B.V. All rights reserved.
eywords:Polyelectrolyte; Surfactant; Polyelectrolyte–surfactant complex; Polyelectrolyte–surfactant aggregate; Polyelectrolyte–surfactant association; Tur-idity; Electrophoretic mobility; Dynamic light scattering; Colloidal stability; Non-equilibrium state; Trapped state; Polydispersity
. Introduction
Polymers and surfactants are used together in many appli-ations such as cleaning, emulsification and rheology controlo mention but a few, which have resulted in significant tech-ical and scientific interest. A subclass is polyelectrolytes andppositely charged surfactants, which associate strongly due
∗ Corresponding author. Tel.: +46 8 790 9912; fax: +46 8 20 89 98.E-mail address:[email protected] (A. Naderi).
to mainly electrostatic and hydrophobic interactions. In scases the complete phase diagram has been determin[1],but most studies focus on relatively dilute aqueous solutThe association pattern in this regime can be influencemoderating the electrostatic attraction by varying salt contration [2], polyelectrolyte charge density[3,4], or by usingmixtures of charged and uncharged surfactants[5]. It can alsobe moderated by controlling the hydrophobic interactioninstance by varying the chain length of the surfactant[6,7]andby introducing non-polar sites in the polyelectrolyte struc
927-7757/$ – see front matter © 2004 Elsevier B.V. All rights reserved.oi:10.1016/j.colsurfa.2004.10.123
84 A. Naderi et al. / Colloids and Surfaces A: Physicochem. Eng. Aspects 253 (2005) 83–93
[8]. The architecture of the polyelectrolyte, e.g. the intrinsicstiffness[9] and branching[10,11], influences the way thepolyelectrolyte can change conformation in order to promotesurfactant self-assembly and is thus also of importance.
As a rule, the association between polyelectrolytes andoppositely charged surfactants starts at very low surfactantconcentrations (typically 1–3 orders of magnitude below thecritical micelle concentration, CMC, of the surfactant). Wecall the entity formed by association between one polyelec-trolyte and surfactants a polyelectrolyte–surfactant complex,whereas the term “aggregate” is used for association struc-tures containing any number of (also one) polyelectrolytechains. When the charge of the polyelectrolyte–surfactant ag-gregate is sufficiently reduced, aggregation will occur read-ily. At this stage the solution becomes noticeably turbid tothe naked eye. However, at still higher surfactant concentra-tions a clear solution is often, but not always, formed again. Ahigher charge density of the polyelectrolyte counteracts theformation of a clear solution in presence of excess surfactant,see for instance[12].
It often takes a very long time to reach true equilibrium instrongly associating polymeric systems. For instance whenconsidering polyelectrolytes adsorbed to oppositely chargedsurfaces, or any polymer showing a high-affinity adsorptionisotherm to a surface, it is found that the desorption kineticsa iblea aseswh rgeds path-w stemo tes.F itiono e ofa ed o onw Sim-i oft inest from1 withi rtantc
elec-t nd toda loyedt pedn dn acesa theyc ntalp ndingh
d ons such
states are formed also in complex solutions of oppo-sitely charged species, e.g. oppositely charged polymersor polyelectrolyte–surfactant mixtures. What is known isthat in certain concentration ranges very stable and surpris-ingly monodisperse polyelectrolyte–surfactant aggregatesare formed[26,27], and that the internal structures of some ofthese aggregates are well defined[18,28–32], e.g. consistingof rod-like surfactant micelles wrapped by polyelectrolyte,with the micelles ordered in hexagonal symmetry.
In this work we have investigated the formation of trappednon-equilibrium states in bulk solutions containing a highlycharged cationic polyelectrolyte mixed with an anionic sur-factant for prolonged times, up to 1000 h. The methodsof choice for our investigations were turbidity and elec-trophoretic mobility measurements combined with dynamiclight scattering studies. The polyelectrolyte concentration hasbeen kept constant at 20 ppm, whereas the surfactant con-centration has been varied up to its CMC-value in pure water(8.3 mM). The salt concentration was also varied to moderatethe electrostatic driving force for association and the repul-sion between polyelectrolyte–surfactant aggregates. We willcompare the results obtained with those for similar mixturesconsisting of poly(vinyl amine), a linear cationic polyelec-trolyte with ionizable groups, and an anionic surfactant[33].
2
2
eo mieM is.T eighto Eachs harge( wayf do-d omB oreb pu-r Thew tema
2
MA( tionso (8.3a erefi ing ap nt orp up-s dded
re extremely slow. This has lead to the notion of “irreversdsorption” even though a more correct term in many could be an extremely slowly reversible adsorption[13]. Theigh affinity between polyelectrolytes and oppositely chaurfaces results in a need for control of the experimentalay in order to obtain reproducible results since the syften becomes trapped in long-lived non-equilibrium staor instance, it has been shown that the order of addf inorganic ions and polyelectrolytes affect the structurdsorbed polyelectrolyte layers[14–16], that is the structuroes not only depend on the bulk composition but alshether the polyelectrolyte or the salt was added first.
larly Chen et al.[17] showed that the order of additionwo oppositely charged polyelectrolyte solutions determhe end net charge of the system, and that deviations:1 stoichiometry in the formed aggregates increases
onic strength of the system. This, of course, has impoonsequences in technical applications.
The state of composite surface layers formed by polyrolytes and oppositely charged surfactants are also fouepend on the experimental pathway[18]. In particular Tiltonnd co-workers have shown how surfactants can be emp
o anchor polymers to solid surfaces in long-lived trapon-equilibrium states[19–24]. Thus, it is clear that trappeon-equilibrium states in complex layers formed on surfre prevalent, and understanding these states and howan be modified by the proper choice of the experimeathway remains a challenge, even though the understaas increased during the past years[25].
The common observation of trapped states formeurfaces naturally leads to the question of whether
. Materials and methods
.1. Materials
The polyelectrolyte used was poly{[2-(propionyloxy)thyl]trimethylammonium chloride} (PCMA), which wasbtained as a gift from Laboratoire de Physico-Chiacromoleculaire, Universite Pierre et Marie Curie, Parhe PCMA sample has a number average molecular wf 1600 kg/mol or about 10,000 segments per molecule.egment of the chain carries one permanent positive cquaternary ammonium group) located 0.6–0.7 nm arom the linear backbone. The anionic surfactant sodiumecyl sulfate (SDS), with >99% purity, was obtained frDH. It was recrystallized two times from ethanol befeing used. The sodium chloride (NaCl), with >99.5%ity, was obtained from Merck and used as received.ater was first pre-treated with a Milli-RO 10 Plus sysnd further purified with a Milli-Q PLUS 185 system.
.2. Mixing procedures
To prepare the samples (30 ml) containing 20 ppm PCca. 0.13 mM charged segments) and different concentraf SDS, stock solutions of PCMA (1000 ppm) and SDSnd 16.4 mM) in solutions with different ionic strength wrst made. The samples were prepared by first creatremix of the aqueous salt solution and either surfactaolymer, which was blended by turning the sample tubeide down a few times. The last ingredient was then a

A. Naderi et al. / Colloids and Surfaces A: Physicochem. Eng. Aspects 253 (2005) 83–93 85
and a final blending was carried out in the same way as de-scribed above. Two different mixing methods were employedfor preparation of blends of PCMA and SDS, in solutions withdifferent concentration of NaCl (0–100 mM). The first pro-cedure involved the mixing of SDS and the aqueous salt solu-tion (which constituted the premix) prior to the addition of asmall amount of the polyelectrolyte stock solution. This wasdone slowly in a drop-wise fashion taking ca. 5 s. This pro-cedure will be referred to as PTS (Polyelectrolyte added Tothe Surfactant). In the second procedure the polyelectrolyteand the aqueous salt solution constituted the premix, to whichan amount of the concentrated surfactant solution was thenadded drop-wise. This process will be referred to as STP(Surfactant added To the Polyelectrolyte).
2.3. Methods of investigation
2.3.1. Turbidity measurementsThe turbidity of PCMA–SDS mixtures containing 20 ppm
PCMA, different NaCl concentrations and various amountsof SDS was measured employing a HACH ratio turbidimeter.The turbidity of each sample was measured before,T1, andafter addition of PCMA or SDS,T2, depending on the mix-ing method. TheT2-values were registered starting 15 minafter the addition of the final ingredient. In this paper wewill present the turbidity results as the turbidity difference( thec unc-t Wen wasa tt ectb
2g-
g n oft ents,U cellZ ZetaP e.
2out
u BI-9 anda W.Tt es-t e-m itiono tter-i e ex-t dw ationa
3. Results and discussion
In this section we will first report and discuss the propertiesof the systems shortly after mixing, and then demonstrate howthey evolve with time.
3.1. Turbidity shortly after mixing
The turbidity of solutions containing mixtures of PCMAand SDS in solutions with different ionic strengths, preparedaccording to the different blending methods, and obtained15 min after their preparation is illustrated inFig. 1a–d. Be-fore commenting on the results we have to stress that eachpoint, in the curves presented in this paper, is an entity thathas been mixed and separately prepared, and therefore is notthe result of the continuous increase of the surfactant con-centration in one particular sample.
We start by using the data obtained with the STP-methodin a salt-free solution,Fig. 1a, to describe the general fea-ture of the curves. It is clear that the turbidity is low atlow surfactant concentrations, reaches a maximum at around0.3 mM SDS, and then decreases again at higher surfactantconcentrations. Dedinaite et al.[35] explained the abovetrend as being due to variations of the net charge of thePCMA–SDS aggregates. We useFig. 2a to illustrate ther ax-i . ex-c itivee thea othera . Att S)t t theP o elec-t gre-g ag-g SDS.T trongr weenp ner asd incor-p ctantt DSm un-c ixingp
lu-t ef-f ntra-t hert lows r tur-b rfac-t re-p t anye be-
�T=T2 −T1) between the PCMA–SDS mixture andorresponding polyelectrolyte/SDS free solution as a fion of the total (bound and free) SDS concentration.oted that the turbidity prior to mixing the componentslways small and that�T is very close toT2. Hence in the tex
he term “turbidity” will be used instead of the more corrut less convenient term “turbidity difference”.
.3.2. Electrophoretic mobility measurementsThe electrophoretic mobility of the PCMA–SDS a
regates was measured, 15 min after the preparatiohe samples, using a Zetasizer 2000, Malvern Instrumnited Kingdom, employing the standard electrophoresisET5104. The instrument was calibrated using Malvernotential transfer standard (code DTS-1050) prior to us
.3.3. Dynamic light scattering measurementsDynamic light scattering measurements were carried
sing a BI-200SM goniometer system connected to a000AT digital correlator from Brookhaven Instrumentswater-cooled Lexel 95-2 laser with maximum power of 2he scattered light was measured at an angle of 90◦ relative
o the incident beam (λ = 514 nm). The samples were invigated at room temperature (20–23◦C), and the measurents were carried out no sooner than 15 min after addf the last component. For the theory behind light sca
ng measurements we refer the interested reader to thensive literature available (e.g.[34]). The Contin methoas employed to perform the inverse Laplace transformnalysis.
easoning. At SDS concentrations below the turbidity mmum, the aggregates carry a net positive charge (i.eess of polyelectrolyte charges), manifested by their poslectrophoretic mobility. Due to electrostatic repulsion,ggregates are prevented from coming close to eachnd form larger aggregates – the turbidity is hence low
he turbidity maximum (which occurs around 0.3 mM SDhe electrophoretic mobility reaches zero showing thaCMA–SDS aggregates are uncharged, thus there are n
rostatic forces present to prevent formation of large agates. Above the turbidity maximum the net charge of theregates is negative, due to the incorporation of excesshe net negative charge, when generating a sufficiently sepulsive double-layer force, prevents association betolyelectrolyte–surfactant aggregates in the same manescribed above. We suggest that the excess SDS isorated due to hydrophobic interactions between surfa
ails, i.e. the same driving force as for formation of free Sicelles and for complexes formed between SDS and
harged polymers. The same reasoning holds for both mrotocols.
Coming back toFig. 1, we notice that the way the soions are prepared has an effect on their turbidity. Thisect is most pronounced at the highest surfactant conceions, where the PTS-method results in significantly higurbidity than the STP-method. On the other hand, aturfactant concentrations the STP-method gives higheidity as compared to the PTS-method, but in this su
ant concentration range the effect is smaller but it iseatedly observed at all ionic strengths. We propose thaffect of the mixing procedure, and thus the differences

86 A. Naderi et al. / Colloids and Surfaces A: Physicochem. Eng. Aspects 253 (2005) 83–93
Fig. 1. Turbidity of solutions containing PCMA and SDS measured 15 min after mixing. The solutions were prepared by the STP-method (�) and the PTS-method (�). The conditions were no added salt (a, top left), 0.1 mM NaCl (b, top right), 10 mM NaCl (c, bottom left) and 100 mM NaCl (d, bottom right). ThePCMA concentration was 20 ppm.
tween the PTS and STP-methods, is due to events occur-ring before the surfactant and polymer have become dis-tributed homogeneously in the whole solution volume. Thus,when one adds a concentrated surfactant solution to a ho-mogeneous polyelectrolyte solution, as in the STP-method,the temporary and locally high surfactant concentration maygive rise to non-equilibrium effects. This is not a problem athigh surfactant concentrations, when colloidally stable ag-gregates with excess surfactants are formed. However, thelocally high surfactant concentration is likely to cause ag-gregation close to the instability boarder at low surfactantconcentrations since locally some charge-neutral stoichio-metric complexes may form and flocculate into larger aggre-gates. This explains the higher turbidity for the STP-methodcompared to the PTS-method at low surfactant concentra-tions. On the other hand, when a concentrated polyelec-trolyte solution is added to a homogeneous surfactant so-lution, the PTS-method, the initial and locally high polymerconcentration may give rise to non-equilibrium effects. Thisis not a problem at low surfactant concentrations where theaggregates formed have positive charge excess. However,at high surfactant concentrations the locally high polymerconcentration may result in the formation of large multi-
chain aggregates during the association process with thesurfactants, i.e. prior to that the aggregates have obtaineda net negative charge. This would explain the high turbid-ity at high surfactant concentrations observed with the PTS-method.
One more point regarding the data presented inFig. 1deserves some comments. First, we recognize that by in-creasing the salt concentration we achieve a broadening ofthe concentration range over which both the STP- and PTS-methods result in high turbidity solutions. This is consistentwith the results obtained for the PVAm–SDS system[33],except for one feature – the broadening of the high turbidityregion achieved by adding salt is higher for the PCMA–SDSsystem. Apparently, the observation that addition of salt re-sults in increased aggregation (as seen by the higher turbidity)is true in both cases. However, the details are dependent onthe structure of the polyelectrolyte and the structure of thecomplexes and aggregates formed.
Finally we note that the extent to which non-equilibriumstates are formed is likely to depend on the time scaleover which the components distribute evenly through-out the whole solution compared to the time scales ofpolyelectrolyte–surfactant complex formation and their sub-

A. Naderi et al. / Colloids and Surfaces A: Physicochem. Eng. Aspects 253 (2005) 83–93 87
Fig. 2. (a) Electrophoretic mobility (�) and turbidity (�) of PCMA–SDSaggregates formed through the STP-method in 10 mM NaCl. For comparisonwe also display the turbidity curve for the PTS-series (�) and the correspond-ing mobility data around the charge neutralization concentration (�). ThePCMA concentration was 20 ppm. (b) The electrophoretic mobility of thePTS aggregates displayed in (a) is shown as a function of time: (♦) 0.25 mM,(�) 0.33 mM, and (�) 0.83 mM.
sequent aggregation. This is discussed in more detail in an-other publication[33].
3.2. Dynamic light scattering measurements shortlyafter mixing
The logarithms of the autocorrelation functions of twoPCMA–SDS systems in 10 mM NaCl and formed throughthe STP-method, measured at different scattering angles, areshown inFig. 3 (similar results were obtained for the PTSprotocol). The results presented are obtained for samples inthe regions where no precipitation was formed during the timespan of our investigations (1000 h). The results indicate thatthe autocorrelation functions are close to single exponentialfunctions and that the same diffusion coefficient is obtainedat each scattering angle.
Fig. 4displays the logarithm of the autocorrelation func-tions as a function ofτq2 (measured at 90◦). It has to bepointed out that the figures also have included systems thatshow high turbidity (which consequently are influenced bymultiple scattering effects) in order to show the effect of theincrease in SDS concentration on the autocorrelation func-tion. Even though the data obtained from these systems can-
not be used for calculating, e.g. the hydrodynamic radius, theconclusion that large aggregates are formed is firm. One fea-ture that is common for all plots is that the relaxation time in-creases dramatically when the SDS concentration is increasedsufficiently to make the solution noticeably turbid. This hap-pens in the vicinity of the charge neutralization concentrationof the systems. However, while the aggregate size in samplesprepared by the STP-method decreases significantly at SDSconcentrations above the charge neutralization concentration,it continues to remain high for samples prepared through thePTS protocol (which is consistent with the results obtainedusing turbidity measurements). We also note the “tailing ef-fect” at largeτq2-values (observed for some curves), whichis a sign of the presence of some larger aggregates. Anotherinteresting feature is the short relaxation times found at highSDS concentrations for samples prepared through the STP-method. This indicates that the aggregates formed are verycompact despite their high excess negative charge.
The hydrodynamic radii (Rh) evaluated from the dynamiclight scattering data for PCMA–SDS aggregates in 10 mMNaCl, obtained through the different mixing methods (andmeasured 15 min after blending) are displayed inFig. 5.Note that data that are corrupted by multiple scattering ef-fects are omitted, but the large hydrodynamic radii close tothe charge neutralization point are indicated by lines goingt n-c rablys th theS r tur-b on-c thats olytec tageo gera red tot val-u ethod( on-t ag-g cen-tN linei lows con-c ue.S t eta fort erf ot eta MN olytec n int fac-t ffer-e ABa the
owards highRh-values. We notice that at low SDS coentrations the sizes of the scattering units are considemaller when the PTS-method is used as compared wiTP-method. Thus, this is the reason behind the higheidity obtained with the STP-method in this low SDS centration interval. These results also support the ideaome aggregates containing more than one polyelectrhain are formed with the STP-method during the initial sf mixing. At high SDS concentrations considerably larggregates are formed by the PTS-method as compa
he STP-method, consistent with the higher turbidityes found at these SDS concentrations with the PTS-mdata for the hydrodynamic radii are not shown). In this cext it is useful to compare the size of the PCMA–SDSregates with that of the collapsed PCMA chain in con
rated salt solution. TheRh-value for 20 ppm PCMA in 1 MaCl was found to be 38 nm (marked with a dashed
n Fig. 5). For samples prepared by the PTS-method aturfactant concentrations and for STP at high surfactantentrations, theRh-value lies reasonably close to this valimilar results have previously been reported by Guillol. [26] for the carboxymethylcellulose-DTAB and by us
he PVAm–SDS system[33] – but the present results diffrom the previous ones in one respect. In their work Guilll. assigned theRh of the investigated polyelectrolyte in 1aCl, as the smallest size that the collapsed polyelectran obtain. However, we observe that further reductiohe polyelectrolyte size is possible by the addition of surant (this effect is most pronounced at 0.08 mM). The dince between carboxymethylcellulose–DTAB/DNA–DTnd PCMA–SDS in this respect is most likely due to

88 A. Naderi et al. / Colloids and Surfaces A: Physicochem. Eng. Aspects 253 (2005) 83–93
Fig. 3. The logarithm of the autocorrelation functions for PCMA–SDS aggregates in 10 mM NaCl obtained at different scattering angles vs.τq2: (a) 0.04 mMSTP and (b) 8.33 mM STP. The PCMA concentration was 20 ppm.
Fig. 4. The logarithm of the autocorrelation functions for some PCMA–SDS compositions (in 10 mM NaCl, investigated 15 min after blending) measured at90◦ and plotted as a function ofτq2. (a) Samples prepared through the STP-method, (b) samples prepared through the PTS-method. The SDS concentrationswere: 0.04 mM ( ), 0.12 mM (�), 0.33 mM (�), 4.15 mM ( ), 8.33 mM (©). (�) Represents the graph for pure PCMA (1 M NaCl). The PCMA concentrationwas 20 ppm.
significantly stiffer structures of carboxymethylcellulose andDNA compared to PCMA. We suggest that the much smallersize of the PCMA–SDS complex at low surfactant concen-trations is due to the extra induction of hydrophobicity bySDS to the complex, which together with a reduction inthe charge density, enable denser packing in the interior ofthe polyelectrolyte–surfactant complex. In fact, SANS andSAXS studies[29,31] have shown that the interior of theaggregates formed close to the charge neutralization pointconsists of cylindrical SDS micelles wrapped by polyelec-trolyte arranged in a hexagonal organization. The water layerthickness, including the surfactant head group and the poly-electrolyte, between these structural units has been estimatedto be 1.6 nm[31].
3.3. Time evolution of the turbidity
The stability of the dispersed polyelectrolyte–surfactantaggregates can be followed by measuring the turbidity as afunction of time. We display our findings inFigs. 6–9, whichshow results obtained with the STP- and PTS-methods insolutions with different ionic strengths. Let us first discussthe data shown inFig. 6a, obtained with the STP-method
for the case with no added salt. It is clear that relativelylow and stable turbidity values are obtained at concentra-tions up to 0.12 mM SDS. In the SDS concentration interval0.17–0.25 mM the turbidity first increases (indicating forma-
Fig. 5. The hydrodynamic radius of PCMA–SDS aggregates formed in10 mM NaCl, and obtained 15 min after the final blending. The samples wereprepared by the STP-method (�) and the PTS-method (�). The PCMA con-centration was 20 ppm. The dashed line corresponds to the hydrodynamicradius of PCMA (20 ppm) in 1 M NaCl.
A. Naderi et al. / Colloids and Surfaces A: Physicochem. Eng. Aspects 253 (2005) 83–93 89
Fig. 6. Turbidity of solutions containing PCMA–SDS aggregates formed in pure water as a function of time. The samples were prepared by the STP-method(a), and the PTS-method (b). The PCMA concentration was 20 ppm. The SDS concentrations were: 0.04 mM (�), 0.08 mM (�), 0.12 mM (�), 0.17 mM ( ),0.25 mM (♦), 0.33 mM (�), 0.83 mM ( ), 4.15 mM ( ), 8.33 mM (©).
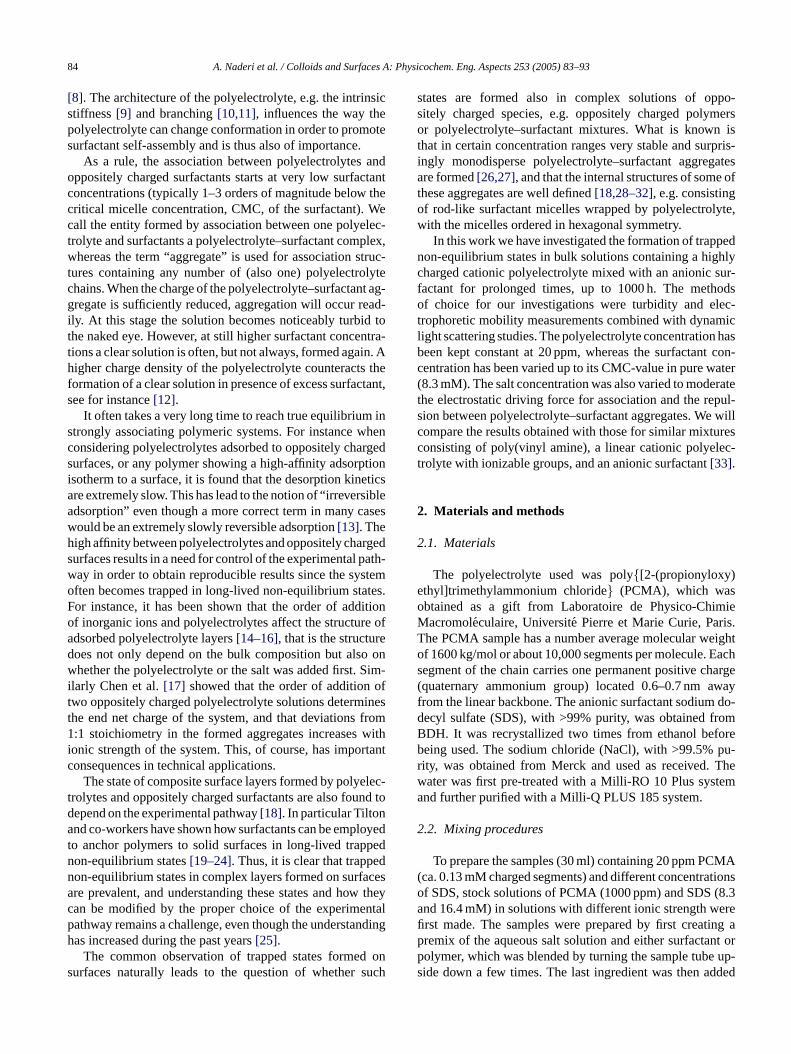
Fig. 7. Turbidity of solutions containing PCMA–SDS aggregates formed in 0.1 mM NaCl as a function of time. The samples were prepared by the STP-method(a), and the PTS-method (b). The PCMA concentration was 20 ppm. The SDS concentrations were: 0.04 mM (�), 0.08 mM (�), 0.12 mM (�), 0.17 mM ( ),0.25 mM (♦), 0.33 mM (�), 0.83 mM ( ), 4.15 mM ( ), 8.33 mM (©).
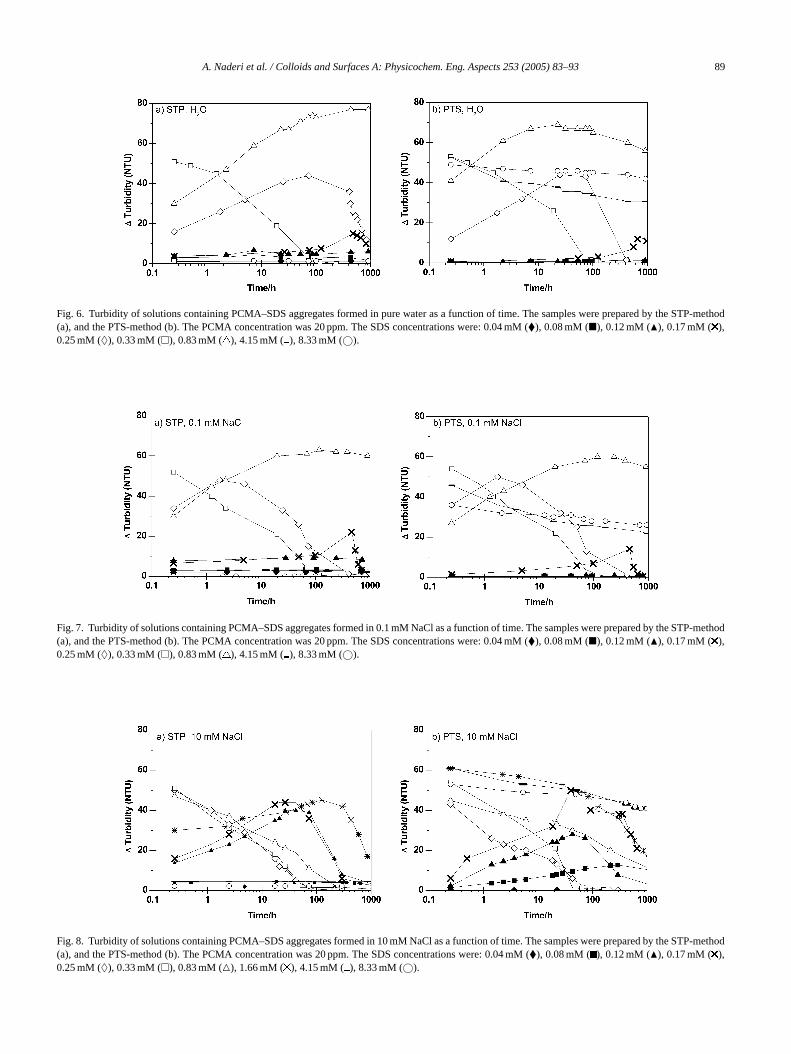
Fig. 8. Turbidity of solutions containing PCMA–SDS aggregates formed in 10 mM NaCl as a function of time. The samples were prepared by the STP-method(a), and the PTS-method (b). The PCMA concentration was 20 ppm. The SDS concentrations were: 0.04 mM (�), 0.08 mM ( ), 0.12 mM (�), 0.17 mM ( ),0.25 mM (♦), 0.33 mM (�), 0.83 mM (�), 1.66 mM ( ), 4.15 mM ( ), 8.33 mM (©).

90 A. Naderi et al. / Colloids and Surfaces A: Physicochem. Eng. Aspects 253 (2005) 83–93
Fig. 9. Turbidity of solutions containing PCMA–SDS aggregates formed in 100 mM NaCl as a function of time. The samples were prepared by the STP-method(a), and the PTS-method (b). The PCMA concentration was 20 ppm. The SDS concentrations were: 0.04 mM (�), 0.08 mM (�), 0.12 mM (�), 0.17 mM (×),0.25 mM (♦), 0.33 mM (�), 0.83 mM ( ), 4.15 mM ( ), 8.33 mM (©).
tion of larger aggregates) and then decreases again with time.At an SDS concentration of 0.33 mM the turbidity decreasesrapidly with time. Visual inspection shows that sedimentis formed and thus a macroscopic phase separation occursrapidly close to the charge neutralization point. A furtherincrease in SDS concentration to 0.8 mM again results in asolution where the turbidity initially is increasing with time.For even longer times than illustrated inFig. 6a, the turbiditystarts to decrease again. For instance after 1000 h the turbidityfor the solution containing 0.8 mM was 77, which decreasedto 70 after 6000 h. Hence, two processes occur; aggregation ofpolyelectrolyte–surfactant complexes followed by sedimen-tation when the aggregates have grown to a sufficient size.Low and stable turbidity values are obtained at even higherSDS concentrations, indicating formation of stable disper-sions of polyelectrolyte–surfactant aggregates. The generalfeatures of the time evolution of the turbidity are mostly thesame when using the PTS- and STP-method. The most no-ticeable difference is found at high surfactant concentrationswhere the high turbidity obtained with the PTS-method de-creases slowly with time.
The binding isotherm for SDS on PCMA is not avail-able but the free SDS concentration at the charge neutral-ization point can be estimated from the SDS concentration(0.33 mM) and the polyelectrolyte segment concentration( o ac ngthd bilityo aliza-t ht r,w neu-t idityw NaClc
ncet alsoat in-
creased as compared to at lower NaCl concentrations. How-ever, stable values for the turbidity are still obtained at thelowest (both STP- and PTS-method) and highest surfactantconcentrations (only the STP-method). A further increase inthe NaCl concentration to 100 mM,Fig. 9, induces instabil-ity also at the highest surfactant concentration independentof the preparation method, whereas the stability remains atlow surfactant concentrations.
The instability region as a function of SDS and NaCl con-centration is displayed inFig. 10. The diagrams show regionswhere sediment has formed within 1000 h after the mixingof PCMA and SDS. The observation that the colloidally un-stable region increases with ionic strength is a clear evidencefor repulsive electrostatic double-layer forces being of im-portance for the stability of the aggregates formed, which arekinetically stabilized by the presence of excess charges. Wenote that for the STP-method the electrolyte concentrationhas a smaller influence on the border between stability andinstability at low surfactant concentrations, where the aggre-gates have a net positive charge, compared to at high surfac-tant concentrations where the surfactants are present in excessin the aggregates. These results indicate that there is an effi-ciency difference between excess polyelectrolyte and surfac-tant in stabilization of the aggregates. Let us rationalize thisby considering the internal structure of the aggregates. Thish[ thodw tureo rgani-z pedb ag-g f SDS( elec-t allys signo essS e toe excessS gates.
0.13 mM) to be about 0.20 mM. Thus, adding NaCl toncentration of 0.1 mM does not change the ionic strerastically, and it is thus not expected to influence the staf the aggregates significantly above the charge neutr
ion point. Comparing the data inFig. 6(no added salt) withe data inFig. 7 (0.1 mM NaCl) confirms this. Howevee note that the sedimentation rate close to the charge
ralization point, as estimated from the decrease in turbith time, is increased in presence of even such a smalloncentration as 0.1 mM.
Adding NaCl to a concentration of 10 mM does influehe ionic strength of the solutions significantly, and thisffects the time evolution of the turbidity. As seen inFig. 8,
he range of the colloidally unstable region has clearly
as previously been determined with SANS[29] and SAXS31] for the PCMA–SDS system prepared by the PTS-meithout added salt. It was shown that the internal strucf the aggregates is characterized by a 2D-hexagonal oation due to packing of cylindrical SDS micelles wrapy the polyelectrolyte. This internal organization of theregates persists both in the sediment and in excess oat least up to a three-fold excess) and in excess of polyrolyte (at least up to a three-fold excess) in the colloidtable regions. The large magnitude and the negativef the mobility of the colloidally stable aggregates in excDS, combined with the stability of the internal structurxcess SDS, give us strong reasons to suggest that theDS is accumulated as a skin on the outside of the aggre

A. Naderi et al. / Colloids and Surfaces A: Physicochem. Eng. Aspects 253 (2005) 83–93 91
Fig. 10. The colloidally unstable/sedimentation region (1000 h after mixing) for solutions containing PCMA–SDS aggregates prepared through the STP-method(a) and the PTS-method (b). The NaCl and the SDS concentrations are both expressed in molar. The unfilled symbols represent the highest SDS concentrationinvestigated. Here a precipitate was formed. Whether a precipitate is formed also at higher SDS concentration is likely but not determined. The points shownat 10−6 M NaCl were in reality determined in pure water (no added salt).
It seems plausible that during a collision event between twoaggregates with excess SDS it is comparatively easy for thesurfactant molecules accumulated at the surface of the ag-gregates to desorb, which would facilitate aggregation. Theincreased ionic strength reduces the energy barrier and makesthese events more likely. On the other hand, at low surfactantconcentrations the increased ionic strength also reduces theenergy barrier during a collision event, but in this case thereis no simple way for the aggregates to get rid of their excesscharges, which are chemically bound to the polyelectrolyte,during a collision event. This can occur by additional surfac-tant adsorption to the aggregates during collision, but this is aslow event in dilute surfactant solutions. A complication maybe that the internal structure of the PCMA–SDS aggregatesis affected by the NaCl concentration. However, no SANS orSAXS data are available at higher NaCl concentrations, andconsequently we cannot discuss this further.
3.4. Time evolution of the electrophoretic mobility
In Fig. 2b the time evolution of the electrophoretic mobil-ity of some PCMA–SDS aggregates (formed through PTS in
10 mM NaCl) around the charge neutralization concentration(CNC) of the system is shown. Clearly, the mobility of the ag-gregates decreases slightly with time, which partly can be ra-tionalized by the continuous aggregation of the PCMA–SDSaggregates. However, we note that the mobility of the aggre-gates actually may change sign, from positive to negative,with time. Hence, it appears that an additional slow incorpo-ration of SDS in the aggregates occurs, a process that is notwell understood at the time of writing.
3.5. Time evaluation of PCMA–SDS solutions bydynamic light scattering
Fig. 11illustrates how theRh-values of PCMA–SDS ag-gregates, in 10 mM NaCl, change with time. Only data forsamples with small aggregates, avoiding complications dueto multiple scattering, are shown. Aggregates with a sizethat does not change with time are formed at low surfac-tant concentrations, up to about 0.08 mM SDS, using theSTP-method (Fig. 11a). This is consistent with the turbid-ity measurements and the notion of formation of colloidallystable aggregates. Apparently once formed these aggregates,
F s form The PCMAc 8 mM
ig. 11. The hydrodynamic radius vs. time of PCMA–SDS aggregateoncentration was 20 ppm. The SDS concentrations were: 0.04 mM (), 0.0
ed by the STP-method (a) and the PTS-method (b) in 10 mM NaCl.( ), 0.17 mM ( ), 4.15 mM ( ), 8.33 mM (©).

92 A. Naderi et al. / Colloids and Surfaces A: Physicochem. Eng. Aspects 253 (2005) 83–93
Table 1Polydispersity of PCMA–SDS aggregates in 10 mM NaCl measured at 0.25 hand ca. 1000 h after mixing
SDS (mM) Polydispersity (0.25 h) Polydispersity (ca. 1000 h)
0.04 STP 0.22 0.190.04 PTS 0.10 0.100.08 STP 0.25 0.260.08 PTS 0.15 0.174.15 STP 0.14 0.158.33 STP 0.17 0.18
which are considerably larger than those formed by the PTS-method remain stable during a period of at least 1000 h.Hence, since the difference in aggregate properties for thetwo methods remains for prolonged times it is clear that weobserve non-equilibrium trapped states (the true equilibriumstate remains unknown). However, when the SDS concen-tration is increased to 0.17 mM the size of the aggregatesincreases with time. Hence, flocculation clearly occurs, andas a consequence the turbidity increases. At high surfactantconcentrations, at and above 4 mM SDS, the size of the ag-gregates is again nearly invariant with time. For samples pre-pared by the PTS-method (Fig. 11b) we notice the same gen-eral trends as for the STP samples.
From an industrial point of view it may be of importanceto produce aggregates not only with controlled size and goodcolloidal stability, but also low polydispersity. InTable 1we present the polydispersity of some systems (in 10 mMNaCl) prepared through the STP and PTS-methods, deter-mined at two different “equilibration” times (0.25 h and ca.1000 h after the final mixing of the ingredients). Two trendsin the results can be distinguished. The first observation isthat both methods give low polydispersity, which remainsmore or less constant with time. Our second observation isthat the STP-method seems to give higher polydispersity thanthe PTS-method in the low SDS concentration region, whichw uslyd
4
fectso poly-e ixingm rfac-t TS”w ur-f hasa ticu-l ctantc tabil-i cedt po-n d witht with
the PTS-method at high surfactant concentrations. The dif-ference between the solutions obtained with the two mixingmethods persists for prolonged times, which demonstrates theexistence of trapped non-equilibrium states. A consequenceof this is that it should be possible to tune the size of theaggregates formed by carefully controlling the mixing pro-cess. It was also shown that the surfactant range over whichcolloidally unstable aggregates are formed increases with in-creasing salt concentration, an observation that is consistentwith an electrostatic stabilization mechanism. In particular,the instability region for the small aggregates formed by theSTP-method increased towards the high surfactant side, anobservation that was rationalized by the charge regulationpossibilities of the aggregates. In excess surfactant the ag-gregates have an outer skin of surfactants that can be dis-placed during a collision event, facilitating their aggrega-tion. No equally effective charge regulation process exists forpositively charged aggregates where the polyelectrolyte pro-vides the excess charges. Dynamic light scattering measure-ments demonstrated that colloidally stable systems indeedwere formed in excess surfactant and excess polyelectrolyte.In some cases the aggregates formed had a remarkably smallpolydispersity. Closer to the charge neutralization point thesize of the aggregates was found to increase with time andultimately a macroscopic phase separation occurred.
A
oun-c
R
106
88
ull.
c-ical
[ uir
[ 00)
[ ac-eries,
[ 500.[ L.
93)
e suggest is due to the non-equilibrium effects previoiscussed.
. Conclusions
In this paper we have addressed order of addition efn the association between a highly charged cationiclectrolyte and an oppositely charged surfactant. The methods investigated were “STP” through which the su
ant was added to the polyelectrolyte solution, and “Phich involved the addition of the polyelectrolyte to the s
actant solution. It was shown that the mixing proceduresignificant effect on the bulk association process, in par
ar at high surfactant concentrations but also at low surfaoncentrations close to the border between colloidal sty and instability. The order of addition effect can be trao the initial non-homogeneous distribution of the coment added last. As a result larger aggregates are forme
he STP-method at low surfactant concentrations and
cknowledgment
This work was supported by the Swedish Research Cil (VR).
eferences
[1] A. Svensson, L. Piculell, B. Cabane, P. Ilekti, J. Phys. Chem. B(2002) 1013–1018.
[2] A. Malovikova, K. Hayakawa, J.C.T. Kwak, J. Phys. Chem.(1984) 930–1933.
[3] I. Satake, T. Takahashi, K. Hayakawa, T. Maeda, M. Aoyagi, BChem. Soc. Jpn. 63 (1990) 926–928.
[4] T. Wallin, P. Linse, J. Phys. Chem. 100 (1996) 17873–17880.[5] Y. Li, P.L. Dubin, in: C.A. Herb, R.K. Prud’homme (Eds.), Stru
ture and Flow in Surfactant Solutions, vol. 578, American ChemSociety, Washington, DC, 1994, pp. 320–336.
[6] H. Okuzaki, Y. Osada, Macromolecules 27 (1994) 502–506.[7] T. Wallin, P. Linse, J. Phys. Chem. 101 (1997) 5506–5513.[8] I. Iliopoulos, Curr. Opin. Colloid Interf. Sci. 3 (1998) 493–498.[9] T. Wallin, P. Linse, Langmuir 12 (1996) 305–314.10] R. Meszaros, L. Thompson, M. Bos, I. Varga, T. Gilanyi, Langm
19 (2003) 609.11] M.A. Winnik, S.M. Bystryak, C. Chassenieux, Langmuir 16 (20
4495–4510.12] P.M. Claesson, U.R.M. Kjellin, in: B. Binks (Ed.), Modern Char
terization Methods of Surfactant Systems, Surfactant Science Svol. 83, pp. 255–333, Marcel M. Langmuir 16 (2000) 1951.
13] S.M.A. Cohen, G.J. Fleer, Ann. Rev. Mater. Sci. 26 (1996) 463–14] M.A.G. Dahlgren, A. Waltermo, E. Blomberg, P.M. Claesson,
Sjostrom, T. Akesson, B. Jonsson, J. Phys. Chem. 97 (1911769–11775.

A. Naderi et al. / Colloids and Surfaces A: Physicochem. Eng. Aspects 253 (2005) 83–93 93
[15] M.A.G. Dahlgren, H.C.M. Hollenberg, P.M. Claesson, Langmuir 11(1995) 4480–4485.
[16] S.A. Sukhishvili, A. Dhinojwala, S. Granick, Langmuir 15 (1999)8474–8482.
[17] J. Chen, J.A. Heitmann, M.A. Hubbe, Colloids Surf. A: Physic-ochem. Eng. Aspects 223 (2003) 215–230.
[18] A. Dedinaite, P.M. Claesson, M. Bergstrom, Langmuir 16 (2000)5257–5266.
[19] E.S. Pagac, D.C. Prieve, R.D. Tilton, Langmuir 14 (1998)2333–2342.
[20] A.D. Braem, D.C. Prieve, R.D. Tilton, Langmuir 17 (2001) 883–890.[21] K.D. Berglund, T.M. Przybycien, R.D. Tilton, Langmuir 19 (2003)
2705.[22] K.D. Berglund, T.M. Przybycien, R.D. Tilton, Langmuir 19 (2003)
2714.[23] S.B. Velegol, R.D. Tilton, Langmuir 17 (2001) 219.[24] S.B. Velegol, R.D. Tilton, J. Colloid Interf. Sci. 249 (2002) 282–289.[25] O.J. Rojas, P.M. Claesson, K.D. Berglund, R.D. Tilton, Langmuir
20 (2004) 3221.
[26] S. Guillot, M. Delsanti, S. Desert, D. Langevin, Langmuir 19 (2003)230–237.
[27] S. Guillot, D. McLoughlin, N. Jain, M. Delsanti, D. Langevin, J.Phys.: Condens. Matter 15 (2003) S219–S224.
[28] M. Antonietti, J. Conrad, A. Thunemann, Macromolecules 27 (1994)6007–6011.
[29] P.M. Claesson, M. Bergstrom, A. Dedinaite, M. Kjellin, J.F.Legrand, I. Grillo, J. Phys. Chem. B 104 (2000) 11689–11694.
[30] S. Zhou, H. Hu, C. Burger, B. Chu, Macromolecules 34 (2001)1772.
[31] M. Bergstrom, U.R.M. Kjellin, P.M. Claesson, J.S. Pedersen, M.M.Nielsen, J. Phys. Chem. B 106 (2002) 11412–11419.
[32] M. Bergstrom, U.R.M. Kjellin, P.M. Claesson, I. Grillo, J. Phys.Chem. B 108 (6) (2004) 1874–1881.
[33] A. Naderi, P.M. Claesson, submitted for publication.[34] W. Brown, Light Scattering Principles and Development, Clarendon
Press, Oxford, 1996.[35] A. Dedinaite, P.M. Claesson, Langmuir 16 (2000) 1951–1959.
Copyright © 2022 FDOKUMEN