Specific Counterion Effects on the Competitive Co-adsorption of Polyelectrolytes and Ionic...
8
Journal of Colloid and Interface Science 249, 282–289 (2002) doi:10.1006/jcis.2002.8273, available online at http://www.idealibrary.com on Specific Counterion Effects on the Competitive Co-adsorption of Polyelectrolytes and Ionic Surfactants Stephanie Butler Velegol 1 and Robert D. Tilton 2 Department of Chemical Engineering, Center for Complex Fluids Engineering, Carnegie Mellon University, Pittsburgh, Pennsylvania 15213 Received September 19, 2001; accepted January 31, 2002; published online April 10, 2002 Counterions affect not only the bulk and interfacial self-assembly of ionic surfactants but also their competitive adsorption with sim- ilarly charged polyelectrolytes. Here, we explore the specific effects of bromide, chloride, and the bulky, somewhat hydrophobic tosy- late counterion on the adsorption of hexadecyltrimethylammonium surfactants (CTA + ), the adsorption of polylysine (PL), and the co- adsorption of CTA + and PL on negatively charged silica surfaces. Similar to bulk self-assembly, increasing the micellar binding affin- ity of the counterion from chloride to bromide to tosylate promoted interfacial self-assembly in the absence of polylysine. During co- adsorption, the presence of the polylysine decreased the adsorbed amount of CTA + in all cases. Polylysine was more effective at hin- dering CTA + adsorption when the surfactant concentration was below the critical micelle concentration. Although these systems were strongly influenced by persistent nonequilibrium states, it was possible to demonstrate that polylysine was able to prevent CTA + admicelle formation below the cmc only when the thermodynamic driving forces for adsorption of the polymer and the surfactant were comparable. Solution compositions where that condition was met depended on the identity of the counterion. Below the bulk cmc, CTAT adsorption displayed the greatest degree of cooperativ- ity, and it also was the most susceptible to hindered adsorption by polylysine. C 2002 Elsevier Science (USA) Key Words: adsorption; surfactant; polyelectrolyte; specific ion effects; silica. INTRODUCTION Multicomponent interactions in mixtures of surfactants and water-soluble polymers provide a powerful lever to tune the mesoscale phenomena that ultimately control the macroscopic characteristics of complex fluid formulations, with common applications arising in technologies as diverse as pharmaceu- tical granulation processes, personal care products, ceramics, and coatings. It is clear that the industrial efficacy of poly- mer/surfactant mixtures relies on the details of their interac- tions in bulk and at interfaces, yet a fundamental understanding of these interactions is lacking, particularly so for interactions 1 Present address: Department of Chemical Engineering, Bucknell University, Lewisburg, PA 17837. 2 To whom correspondence should be addressed. E-mail: tilton@andrew. cmu.edu. Fax: 412-268-7139. at interfaces. Thus, co-adsorption of surfactants and polymers is gaining steadily increasing attention in the recent literature (1–12). The prevalence of nonequilibrium conditions that cause hysteresis, or order-of-addition dependence, in co-adsorbed lay- ers is an especially challenging issue (10–13). The current investigation concerns the co-adsorption of sim- ilarly charged surfactants and polyelectrolytes on oppositely charged surfaces, a topic that has received some attention in the literature (6–8, 10, 11, 13, 14). We previously investigated the co- adsorption mechanism for a cationic surfactant, cetyltrimethyl- ammonium bromide (CTAB), with a cationic polyelectrolyte, poly-L-lysine hydrobromide, and oligolysine hydrobromide, on the negatively charged silica surface. That study included the sensitivity of the mechanism to the total electrolyte concen- tration (11). Although the CTAB/polylysine/silica system was dominated by kinetically trapped, nonequilibrium states, we were able to deduce that increasing concentrations of the 1 : 1 electrolyte KBr shifted the thermodynamic driving force in fa- vor of polylysine adsorption by promoting its ability to disrupt CTAB interfacial self-assembly. Since there are strong specific counterion effects on ionic surfactant micellization and adsorption (15–22), here we con- sider specific counterion effects on the co-adsorption mecha- nism. We consider chloride, bromide, and p-toluene sulfonate (tosylate) counterions that are distinguished by widely differing binding affinities for CTA + micelles. The counterion binding affinity for CTA + micelles increases in the order Cl − < Br − < tosylate (15). Consistent with this ordering, the critical mi- celle concentration (cmc) increases in the order cmc(CTAT) < cmc(CTAB) < cmc(CTAC). Similarly, CTAB adsorption at the silica/water interface displays greater cooperativity below the cmc and a higher adsorption plateau than CTAC adsorption (22). The latter effect is due to the self-assembly of adsorbed aggre- gates that have lower curvature in the plane of adsorption for CTAB as compared to that for CTAC (elongated “ribbons” for CTAB and circular “disks” for CTAC). Here, we also consider tosylate as an extreme example of a high binding affinity counterion (23). We show how the relative counterion binding affinities for the surfactant micelles influence the extent of adsorption for the surfactant and the polyelectro- lyte from the respective single-component solutions as well as the competitive co-adsorption from mixed solutions. 282 0021-9797/02 $35.00 C 2002 Elsevier Science (USA) All rights reserved.
Transcript of Specific Counterion Effects on the Competitive Co-adsorption of Polyelectrolytes and Ionic...

Journal of Colloid and Interface Science 249, 282–289 (2002)doi:10.1006/jcis.2002.8273, available online at http://www.idealibrary.com on
Specific Counterion Effects on the Competitive Co-adsorptionof Polyelectrolytes and Ionic Surfactants
Stephanie Butler Velegol1 and Robert D. Tilton2
Department of Chemical Engineering, Center for Complex Fluids Engineering, Carnegie Mellon University, Pittsburgh, Pennsylvania 15213
Received September 19, 2001; accepted January 31, 2002; published online April 10, 2002
Counterions affect not only the bulk and interfacial self-assemblyof ionic surfactants but also their competitive adsorption with sim-ilarly charged polyelectrolytes. Here, we explore the specific effectsof bromide, chloride, and the bulky, somewhat hydrophobic tosy-late counterion on the adsorption of hexadecyltrimethylammoniumsurfactants (CTA+), the adsorption of polylysine (PL), and the co-adsorption of CTA+ and PL on negatively charged silica surfaces.Similar to bulk self-assembly, increasing the micellar binding affin-ity of the counterion from chloride to bromide to tosylate promotedinterfacial self-assembly in the absence of polylysine. During co-adsorption, the presence of the polylysine decreased the adsorbedamount of CTA+ in all cases. Polylysine was more effective at hin-dering CTA+ adsorption when the surfactant concentration wasbelow the critical micelle concentration. Although these systemswere strongly influenced by persistent nonequilibrium states, it waspossible to demonstrate that polylysine was able to prevent CTA+
admicelle formation below the cmc only when the thermodynamicdriving forces for adsorption of the polymer and the surfactantwere comparable. Solution compositions where that condition wasmet depended on the identity of the counterion. Below the bulkcmc, CTAT adsorption displayed the greatest degree of cooperativ-ity, and it also was the most susceptible to hindered adsorption bypolylysine. C© 2002 Elsevier Science (USA)
Key Words: adsorption; surfactant; polyelectrolyte; specific ioneffects; silica.
wmcatamto
L
c
0C©A
INTRODUCTION
Multicomponent interactions in mixtures of surfactants andater-soluble polymers provide a powerful lever to tune theesoscale phenomena that ultimately control the macroscopic
haracteristics of complex fluid formulations, with commonpplications arising in technologies as diverse as pharmaceu-ical granulation processes, personal care products, ceramics,nd coatings. It is clear that the industrial efficacy of poly-er/surfactant mixtures relies on the details of their interac-
ions in bulk and at interfaces, yet a fundamental understandingf these interactions is lacking, particularly so for interactions
1 Present address: Department of Chemical Engineering, Bucknell University,ewisburg, PA 17837.
2 To whom correspondence should be addressed. E-mail: [email protected]. Fax: 412-268-7139.
28021-9797/02 $35.002002 Elsevier Science (USA)
ll rights reserved.
at interfaces. Thus, co-adsorption of surfactants and polymersis gaining steadily increasing attention in the recent literature(1–12). The prevalence of nonequilibrium conditions that causehysteresis, or order-of-addition dependence, in co-adsorbed lay-ers is an especially challenging issue (10–13).
The current investigation concerns the co-adsorption of sim-ilarly charged surfactants and polyelectrolytes on oppositelycharged surfaces, a topic that has received some attention in theliterature (6–8, 10, 11, 13, 14). We previously investigated the co-adsorption mechanism for a cationic surfactant, cetyltrimethyl-ammonium bromide (CTAB), with a cationic polyelectrolyte,poly-L-lysine hydrobromide, and oligolysine hydrobromide, onthe negatively charged silica surface. That study included thesensitivity of the mechanism to the total electrolyte concen-tration (11). Although the CTAB/polylysine/silica system wasdominated by kinetically trapped, nonequilibrium states, wewere able to deduce that increasing concentrations of the 1 : 1electrolyte KBr shifted the thermodynamic driving force in fa-vor of polylysine adsorption by promoting its ability to disruptCTAB interfacial self-assembly.
Since there are strong specific counterion effects on ionicsurfactant micellization and adsorption (15–22), here we con-sider specific counterion effects on the co-adsorption mecha-nism. We consider chloride, bromide, and p-toluene sulfonate(tosylate) counterions that are distinguished by widely differingbinding affinities for CTA+ micelles. The counterion bindingaffinity for CTA+ micelles increases in the order Cl− < Br− <
tosylate (15). Consistent with this ordering, the critical mi-celle concentration (cmc) increases in the order cmc(CTAT) <
cmc(CTAB) < cmc(CTAC). Similarly, CTAB adsorption at thesilica/water interface displays greater cooperativity below thecmc and a higher adsorption plateau than CTAC adsorption (22).The latter effect is due to the self-assembly of adsorbed aggre-gates that have lower curvature in the plane of adsorption forCTAB as compared to that for CTAC (elongated “ribbons” forCTAB and circular “disks” for CTAC).
Here, we also consider tosylate as an extreme example of ahigh binding affinity counterion (23). We show how the relativecounterion binding affinities for the surfactant micelles influencethe extent of adsorption for the surfactant and the polyelectro-lyte from the respective single-component solutions as well asthe competitive co-adsorption from mixed solutions.
2
S
COUNTERION EFFECTMATERIALS AND METHODS
We purified all water by reverse osmosis and subsequent pas-sage through a MilliQ Plus (Millipore) system of ion exchangeand activated carbon cartridges. We conducted all experimentsin unbuffered water at 25–30◦C. We observed no temperaturedependence for adsorption in this range of temperatures.
We obtained cetyltrimethylammonium bromide, CTAB(>99% pure), and cetyltrimethylammonium p-toluene sul-fonate, CTAT, from Sigma and cetyltrimethylammonium chlo-ride, CTAC (>98% pure), from Fluka. We further purified allsurfactants by washing with acetone three times. The absence ofa minimum in a plot of surface tension versus surfactant concen-tration indicated the absence of significant surface-active impu-rities.
All of the polylysine samples were purchased from Sigmaand used as-received. We purchased three different molecularweight samples of poly-L-lysine hydrobromide (PLBr), hav-ing Mw = 32,000 or Mw = 50,000 as well as poly-L-lysinehydrochloride (PLCl) having Mw = 50,000 from Sigma. (Thetwo PLBr samples behave similarly.) The polylysine con-centration in all experiments was 200 ppm (by weight). Wepurchased potassium bromide (ACS grade) from Fisher Scien-tific, potassium chloride from EM Science, and sodium p-toluene sulfonate (sodium tosylate) from Sigma and used them asreceived.
We prepared silica surfaces by oxidizing polished siliconwafers for 10 to 20 min in 1000◦C air. This procedure yieldsapproximately 30-nm-thick oxide layers that enhance the sensi-tivity of the optical reflectometry technique we use to measureadsorption. In all cases, we measured the oxide layer thicknessby scanning angle reflectometry prior to the start of an exper-iment. The cleaning procedure described previously (10, 12)leaves these surfaces perfectly wetted by water.
To analyze optical reflectometry data, one requires the refrac-tive index increment of the adsorbing species. Using a Brice-Phoenix differential refractometer, we found that the refractiveindex increment (dn/dc) for micellar CTAB and CTAC solu-
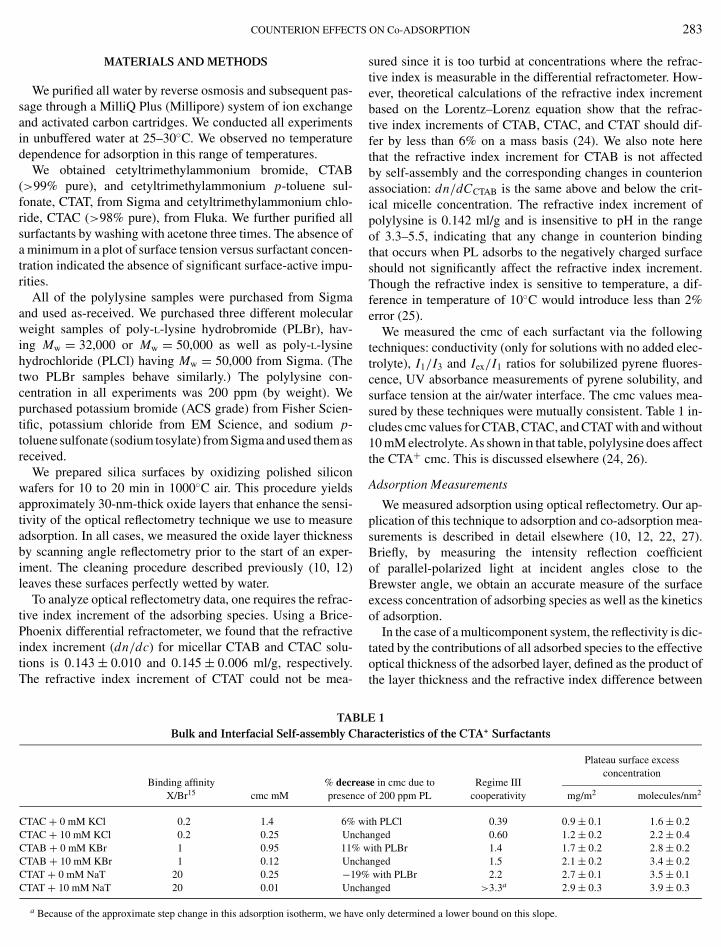
tions is 0.143 ± 0.010 and 0.145 ± 0.006 ml/g, respectively. optical thickness of the adsorbed layer, defined as the product of The refractive index increment of CTAT could not be mea-TABLE 1Bulk and Interfacial Self-assembly Characteristics of the CTA+ Surfactants
Plateau surface excessconcentration
Binding affinity % decrease in cmc due to Regime IIIX/Br15 cmc mM presence of 200 ppm PL cooperativity mg/m2 molecules/nm2
CTAC + 0 mM KCl 0.2 1.4 6% with PLCl 0.39 0.9 ± 0.1 1.6 ± 0.2CTAC + 10 mM KCl 0.2 0.25 Unchanged 0.60 1.2 ± 0.2 2.2 ± 0.4CTAB + 0 mM KBr 1 0.95 11% with PLBr 1.4 1.7 ± 0.2 2.8 ± 0.2CTAB + 10 mM KBr 1 0.12 Unchanged 1.5 2.1 ± 0.2 3.4 ± 0.2CTAT + 0 mM NaT 20 0.25 −19% with PLBr 2.2 2.7 ± 0.1 3.5 ± 0.1CTAT + 10 mM NaT 20 0.01 Unchanged >3.3a 2.9 ± 0.3 3.9 ± 0.3
the layer thickness and the refractive index difference between
a Because of the approximate step change in this adsorption isotherm, we have
ON Co-ADSORPTION 283
sured since it is too turbid at concentrations where the refrac-tive index is measurable in the differential refractometer. How-ever, theoretical calculations of the refractive index incrementbased on the Lorentz–Lorenz equation show that the refrac-tive index increments of CTAB, CTAC, and CTAT should dif-fer by less than 6% on a mass basis (24). We also note herethat the refractive index increment for CTAB is not affectedby self-assembly and the corresponding changes in counterionassociation: dn/dCCTAB is the same above and below the crit-ical micelle concentration. The refractive index increment ofpolylysine is 0.142 ml/g and is insensitive to pH in the rangeof 3.3–5.5, indicating that any change in counterion bindingthat occurs when PL adsorbs to the negatively charged surfaceshould not significantly affect the refractive index increment.Though the refractive index is sensitive to temperature, a dif-ference in temperature of 10◦C would introduce less than 2%error (25).
We measured the cmc of each surfactant via the followingtechniques: conductivity (only for solutions with no added elec-trolyte), I1/I3 and Iex/I1 ratios for solubilized pyrene fluores-cence, UV absorbance measurements of pyrene solubility, andsurface tension at the air/water interface. The cmc values mea-sured by these techniques were mutually consistent. Table 1 in-cludes cmc values for CTAB, CTAC, and CTAT with and without10 mM electrolyte. As shown in that table, polylysine does affectthe CTA+ cmc. This is discussed elsewhere (24, 26).
Adsorption Measurements
We measured adsorption using optical reflectometry. Our ap-plication of this technique to adsorption and co-adsorption mea-surements is described in detail elsewhere (10, 12, 22, 27).Briefly, by measuring the intensity reflection coefficientof parallel-polarized light at incident angles close to theBrewster angle, we obtain an accurate measure of the surfaceexcess concentration of adsorbing species as well as the kineticsof adsorption.
In the case of a multicomponent system, the reflectivity is dic-tated by the contributions of all adsorbed species to the effective
only determined a lower bound on this slope.

N
284 VELEGOL Athe adsorbed layer and the bulk solution,
d(n − n0) =∑
i
�idn
dCi,
where each species i has a refractive index increment dn/dCi
and is present at surface excess concentration �i . In this treat-ment, the interface is resolved into a homogeneous silica film ofknown thickness adjacent to a second homogeneous layer thatcontains the adsorbed material. The effective optical thicknessof the adsorbed layer is readily extracted from the reflectivitydata by applying this two-film optical model.
It is not possible to directly distinguish the relative adsorbedamounts of different species in a mixed layer. To infer the rel-ative amounts, we rely on the irreversibility of the polylysineadsorption. That is, we rinse the mixed layer and attribute theresidual surface excess concentration to the polylysine since theCTA+ surfactant adsorbs reversibly. (See (11) for more detail.)
RESULTS AND DISCUSSION
Adsorption of CTAB, CTAC, and CTAT
Ionic surfactant adsorption to oppositely charged surfacesusually follows four regimes (28). In regime I, the surfactantsadsorb due to Coulombic attraction, specific headgroup/surfaceattraction, and partial removal of hydrophobic tails from water.In regime II, mutual attractions between the hydrophobic sur-factant tails combine with the aforementioned interactions. It isusually during this regime that the surface charge is reversed.In regime III, cooperative adsorption and admicelle formationbegin due to attraction between hydrophobic tails. Finally, theadsorption saturates in regime IV, usually at bulk concentrationsnear the cmc.
Figures 1–3 show the adsorption isotherms for CTAB in 0 and10 mM KBr, for CTAC in 0 and 10 mM KCl, and for CTAT in 0
[CTAB], mM
0.01 0.1 1 10
Γ , m
olec
ules
/nm
2
0.1
1
[CTAB]/cmc
0.1 1 100
1
2
3
4
(a) (b)
FIG. 1. Adsorption isotherm for CTAB in 0 mM KBr (closed circles) and10 mM KBr (open triangles) on a log–log scale (a) and a lin–log scale (b). Thestraight line in (a) represents the slope of regime III. In the lin–log plot (b), the
concentrations are normalized by the respective cmc values and the curves areempirical fits merely provided to guide the eye.D TILTON
[CTAC], mM
0.01 0.1 1 10
Γ , m
olec
ules
/nm
2
0.1
1
[CTAC]/cmc
0.1 1 100
1
2
3
4(a) (b)
FIG. 2. Adsorption isotherm for CTAC in 0 mM KCl (closed circles) and10 mM KCl (open triangles) on a log–log scale (a) and a lin–log scale (b). Thestraight line in (a) represents the slope of regime III. In the lin–log plot (b), theconcentrations are normalized by the respective cmc values and the curves areempirical fits merely provided to guide the eye.
and 10 mM NaT, respectively, on silica. We present both log–log(Figs. 1a, 2a, and 3a) and lin–log isotherm plots (Figs. 1b, 2b,and 3b). In the lin–log plots, we normalize the bulk surfactantconcentrations by the appropriate cmc measured for either 0 or10 mM added electrolyte conditions. Distinct regimes I and IIare not evident in the surfactant concentration ranges includedin these isotherms.
In regime III that just precedes the plateau, the slope of thelog–log isotherm is a measure of the adsorption cooperativity orthe strength of interfacial self-assembly. These slopes are deter-mined by linear regression and are shown by the straight linesin Figs. 1a, 2a, and 3a. Table 1 summarizes important aspectsof both bulk and interfacial self-assembly of CTA+ surfactants,
[CTAT]/cmc
0.1 1 100
1
2
3
4
[CTAT], mM
0.001 0.01 0.1 1 10
Γ, m
olec
ules
/nm
2
0.1
1
(a) (b)
FIG. 3. Adsorption isotherm for CTAT in 0 mM NaT (closed circles) and10 mM NaT (open triangles) on a log–log scale (a) and a lin–log scale (b). Thestraight line in (a) represents the slope of regime III. In the lin–log plot (b), the
concentrations are normalized by the respective cmc values and the curves areempirical fits merely provided to guide the eye.
COUNTERION EFFECT
including cmc values, the regime III cooperativity values, andthe plateau surface excess concentrations (regime IV). Both theregime III adsorption cooperativity and the plateau surface ex-cess concentrations increase in the same order as the counterionbinding affinity, with CTAT displaying the greatest cooperativityand plateau adsorption.
The plateau surface excess concentrations and cooperativityalso increase with the addition of electrolyte (from 0 to 10 mM).The increase in the plateau surface concentration is explained bythe influence of the counterions on the curvature of the adsorbedaggregates. Atomic force microscopy imaging of the adsorbedlayers showed that the increased plateau adsorption is accompa-nied by a decreased curvature of the adsorbed surfactant aggre-gates in the plane of adsorption, with shapes changing from disksto ribbons (22, 24). Aggregates with decreased curvature packmore efficiently on the surface. Furthermore, increasing the elec-trolyte concentration screens electrostatic repulsions betweenneighboring aggregates, thereby decreasing the interaggregatecenter-to-center distance and further increasing the adsorptionplateau. Note that an analysis of the aggregation numbers of theadsorbed aggregates indicates that they are relatively flat. Ag-gregates with circular projections or elongated projections arenot spheres or cylinders; they are better described as disks orribbons (22).
The CTAT adsorption isotherms show the dramatic effect ofthe hydrophobic counterion on interfacial self-assembly. In theabsence of added background electrolyte, the shape of the CTATadsorption isotherm is qualitatively similar to the CTAB andCTAC isotherms. Regime III begins at approximately 0.3 × cmcand saturates very close to the cmc. In contrast, when 10 mMNaT is added to the CTAT system, the adsorption isotherm dif-fers substantially from the CTAC and CTAB isotherms in 10 mMbackground electyrolyte. Regime III for CTAC and CTAB in thepresence of 10 mM KCl or KBr solutions still spans a broad rangeof concentrations and saturates near the cmc. In contrast, regimeIII for CTAT in the presence of 10 mM NaT approximates a step-change at 0.2 × cmc. Below 0.2 × cmc, the adsorption falls be-low the detection limit of our instrument. Just above 0.2 × cmc,adsorption has reached its plateau of 3.9 ± 0.3 molecules/nm2.This extremely high level of cooperativity indicates that excesstosylate promotes interfacial self-assembly far more effectivelythan does excess bromide or chloride. This behavior is mirroredin bulk solution as well. As seen in Table 1, adding 10 mM NaTdecreases the bulk cmc of CTAT far more than the addition of10 mM KBr or KCl decreases the cmc of CTAB or CTAC. Thisis the result of the large binding affinity of the hydrophobic tosy-late ion for CTA+. It enhances self-assembly by more effectivelydecreasing electrostatic repulsions among the quaternary aminesurfactant headgroups.
Effect of Counterions on Polylysine Adsorption to Silicain the Absence of Surfactant
Polylysine adsorbs irreversibly to silica for all molecularweights used here. When no surfactant is present, polylysine
S ON Co-ADSORPTION 285
reverses the charge on silica surfaces at bulk concentrations be-low 1 ppm (11). That charge reversal occurs at a surface cov-erage that is much lower than the saturation coverage producedby the 200 ppm polylysine solutions considered in the currentstudy. The reversal of ζ -potential from negative to positive thatis produced by a saturated polylysine layer on silica is approxi-mately the same as the reversal caused by a CTAB layer adsorbedfrom a micellar solution (24). Thus, most of the polylysine layerforms by diffusing from solution to the surface against a re-pulsive electrostatic barrier. This point will become importantwhen considering order-of-addition co-adsorption experimentsbelow.
In the absence of background electrolyte PLBr adsorbs to0.16 ± 0.09 mg/m2. The extent of adsorption is higher, 0.27 ±0.08 mg/m2, in 10 mM KBr solutions. The increase in polyly-sine adsorption in the presence of 10 mM KBr is explained byscreening of the electrostatic repulsions between adsorbed poly-electrolytes (29).
Prior studies (30–32) have shown that polylysine adsorbsin a flat conformation on silica and on mica and negativelycharged polystyrene. The polylysine surface concentrations re-ported here are consistent with a relatively flat conformation.The two-dimensional radius of gyration, assuming that all seg-ments lie in a plane, is 7.9 nm for Mw = 32,000 (PL32) and9.9 nm for Mw = 50,000 (PL50) (11). If we were to assumethat the chains adsorb as hexagonal close-packed disks of ra-dius Rg(2-D), this would correspond to 0.25 mg/m2 regardless ofthe molecular weight and 212 nm2 per molecule for PL32 and332 nm2 per molecule for PL50. We conclude from the con-sistency of this simple calculation with the experimental datathat polylysine adsorbs in a flat conformation and fills the silicasurface more efficiently in the presence of added electrolyte.
To measure the effect of tosylate counterions on polylysineadsorption in the absence of surfactant, we added 10 mM NaT to200 ppm PLBr solutions. Polylysine adsorbed to 0.55 mg/m2 in10 mM NaT solutions as compared to only 0.27 mg/m2 in 10 mMKBr solutions. In a solution of 200 ppm PLBr and 10 mM NaT,the tosylate concentration is 20 times that of the total Br−. Itis therefore probable that the tosylate counterions replace mostof the bound Br−. If we assume that all the bromide counteri-ons were replaced with tosylate, a surface excess concentrationof 0.55 mg/m2 corresponds to 219 nm2/molecule for PL50. Inthe opposite extreme, if none of the bromides were replaced bytosylate, this surface excess concentration would correspond to151 nm2/molecule for PL50. The difference simply reflects themolecular weight considerations in the calculation, given equalvalues on a mass basis for the refractive index increments inbromide or tosylate solutions. In either case, this is a more com-pact coil than found either experimentally for polylysine in thepresence of 10 mM KBr (307 nm2/molecule) or by assuming theadsorption of a 2-D random coil (332 nm2/molecule). The hy-drophobic interactions between bound tosylate counterions maycondense the polylysine chain to a more compact coil. Having
a smaller molecular footprint, the more compact coils accountfor greater mass per unit area.
N
286 VELEGOL AEffect of Counterion on Simultaneous Co-adsorptionof CTA+ and Polylysine
Each co-adsorption experiment proceeded in three stages. Instage 1, we passed a surfactant solution containing no polyly-sine over the bare silica surface. After adsorption reached steadystate, we completely desorbed the surfactant layer by rinsingwith pure water (or pure electrolyte solution). Then in stage 2,we passed a mixture of surfactant and polylysine over the baresurface until co-adsorption reached steady state. Then, we againflushed the surface with pure water (or pure electrolyte solu-tion) to desorb all reversibly adsorbed material. When the des-orption had reached its maximum extent (typically less than100% due to irreversible polylysine adsorption), we calculatedthe surface concentration of surfactant from the difference inadsorbed amount before and after desorption. We finally pro-ceeded with stage 3 by again passing the original surfactantsolution (containing no polylysine) over the surface to examinehow much surfactant could re-adsorb to the surface contain-ing the adsorbed polylysine remnant. This last step is intendedto reveal qualitatively whether the polylysine layer undergoesstructural relaxations after removal of the surfactant.
The adsorbed amounts of both the CTA+ surfactant and thepolylysine at each stage of these three-stage experiments areplotted in Fig. 4 for CTAB and PLBr. The molecular weightof the polymer was either 32,000 or 50,000 and no differencewas found between them. Data for polylysine with a molecularweight of 200,000 (not shown) also exhibited similar behavior(11). Data for 0 mM KBr and 10 mM KBr are presented inFigs. 4a and 4b, respectively. Similar plots are shown in Fig. 5
[CTAB]/cmc
0.1 1 10
Γ, m
g/m
2
0
1
2
3
[CTAB]/cmc
0.1 1 100
1
2
3(a) (b)
FIG. 4. Co-adsorption isotherms for CTAB with PLBr on silica in 0 mMKBr (a) or 10 mM KBr (b). Bulk CTAB concentrations are normalized by theappropriate cmc (i.e., in solutions containing 0 or 10 mM KBr, 0 or 200 ppmpolylysine). Filled circles: �CTAB adsorbed to bare silica surface in the absence ofpolylysine during stage 1. Unfilled squares: �CTAB co-adsorbed simultaneouslywith polylysine during stage 2. Unfilled triangles: �CTAB adsorbed to a partiallycoated polylysine surface during stage 3. Filled diamonds: �PL co-adsorbed withCTAB during stage 2. Curves are empirical fits to the full CTAB adsorption
isotherms shown in Fig. 1. Regime III in the absence of polylysine is indicatedby the vertical dashed lines.D TILTON
[CTAC]/cmc
0.1 1 10
[CTAC]/cmc
0.1 1 10
Γ, m
g/m
2
0.0
0.5
1.0
1.5 (a) (b)
FIG. 5. Co-adsorption isotherms for CTAC with PLCl on silica in 0 mMKCl (a) or 10 mM KCl (b). Bulk CTAC concentrations are normalized by theappropriate cmc (i.e., in solutions containing 0 or 10 mM KBr, 0 or 200 ppmpolylysine). Filled circles: �CTAC adsorbed to bare silica surface in the absence ofpolylysine during stage 1. Unfilled squares: �CTAC co-adsorbed simultaneouslywith polylysine during stage 2. Unfilled triangles: �CTAC adsorbed to a partiallycoated polylysine surface during stage 3. Filled diamonds: �PL co-adsorbedwith CTAC during stage 2. Curves are empirical fits to the full CTAC adsorptionisotherms shown in Fig. 2. Regime III in the absence of polylysine is indicatedby the vertical dashed lines.
for CTAC and PLCl and Fig. 6 for CTAT and PLBr. The bulksurfactant concentrations are normalized by the appropriate cmcmeasured for each system, i.e., the cmc measured either withor without 200 ppm polylysine and with or without 10 mMbackground electrolyte.
[CTAT]/cmc
0.1 1 10
Γ, m
g/m
2
0.0
0.5
1.0
1.5
2.0
2.5
3.0
3.5(a)
(b)
[CTAT]/cmc
0.1 1 10
(b)
FIG. 6. Co-adsorption isotherms for CTAT with PLBr on silica in 0 mMNaT (a) or 10 mM NaT (b). Bulk CTAT concentrations are normalized by theappropriate cmc (i.e., in solutions containing 0 or 10 mM NaT, 0 or 200 ppmpolylysine). Filled circles: �CTAT adsorbed to bare silica surface in the absence ofpolylysine during stage 1. Unfilled squares: �CTAT co-adsorbed simultaneouslywith polylysine during stage 2. Unfilled triangles: �CTAT adsorbed to a partiallycoated polylysine surface during stage 3. Filled diamonds: �PL co-adsorbedwith CTAT during stage 2. Curves are empirical fits to the full CTAT adsorption
isotherms shown in Fig. 3. Regime III in the absence of polylysine is indicatedby the vertical dashed lines.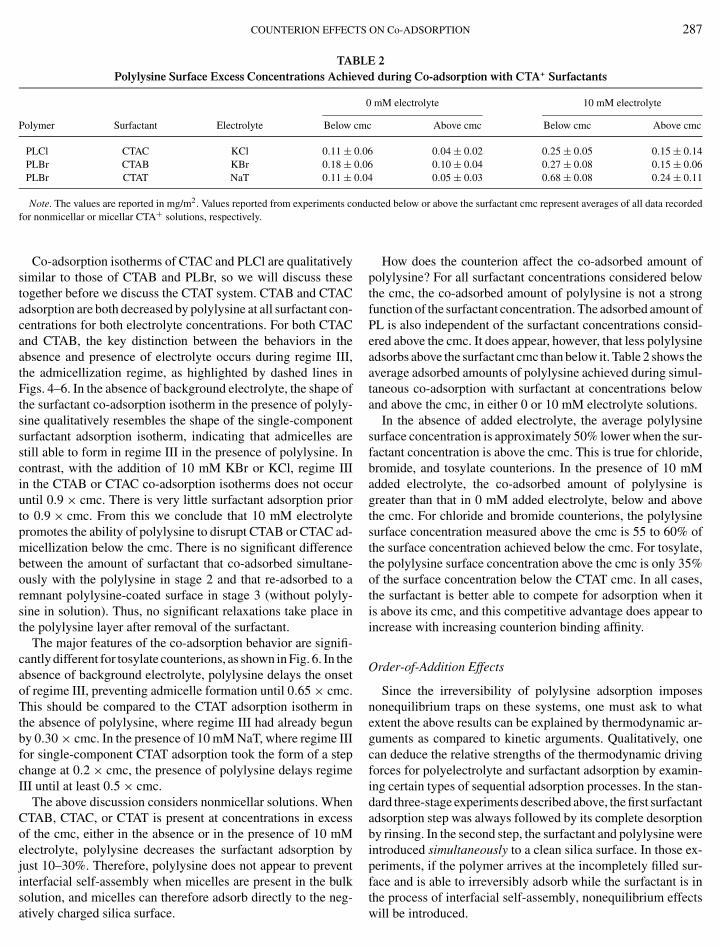
COUNTERION EFFECTS ON Co-ADSORPTION 287
TABLE 2Polylysine Surface Excess Concentrations Achieved during Co-adsorption with CTA+ Surfactants
0 mM electrolyte 10 mM electrolyte
Polymer Surfactant Electrolyte Below cmc Above cmc Below cmc Above cmc
PLCl CTAC KCl 0.11 ± 0.06 0.04 ± 0.02 0.25 ± 0.05 0.15 ± 0.14PLBr CTAB KBr 0.18 ± 0.06 0.10 ± 0.04 0.27 ± 0.08 0.15 ± 0.06PLBr CTAT NaT 0.11 ± 0.04 0.05 ± 0.03 0.68 ± 0.08 0.24 ± 0.11
Note. The values are reported in mg/m2. Values reported from experiments conducted below or above the surfactant cmc represent averages of all data recorded+
for nonmicellar or micellar CTA solutions, respectively.Co-adsorption isotherms of CTAC and PLCl are qualitativelysimilar to those of CTAB and PLBr, so we will discuss thesetogether before we discuss the CTAT system. CTAB and CTACadsorption are both decreased by polylysine at all surfactant con-centrations for both electrolyte concentrations. For both CTACand CTAB, the key distinction between the behaviors in theabsence and presence of electrolyte occurs during regime III,the admicellization regime, as highlighted by dashed lines inFigs. 4–6. In the absence of background electrolyte, the shape ofthe surfactant co-adsorption isotherm in the presence of polyly-sine qualitatively resembles the shape of the single-componentsurfactant adsorption isotherm, indicating that admicelles arestill able to form in regime III in the presence of polylysine. Incontrast, with the addition of 10 mM KBr or KCl, regime IIIin the CTAB or CTAC co-adsorption isotherms does not occuruntil 0.9 × cmc. There is very little surfactant adsorption priorto 0.9 × cmc. From this we conclude that 10 mM electrolytepromotes the ability of polylysine to disrupt CTAB or CTAC ad-micellization below the cmc. There is no significant differencebetween the amount of surfactant that co-adsorbed simultane-ously with the polylysine in stage 2 and that re-adsorbed to aremnant polylysine-coated surface in stage 3 (without polyly-sine in solution). Thus, no significant relaxations take place inthe polylysine layer after removal of the surfactant.
The major features of the co-adsorption behavior are signifi-cantly different for tosylate counterions, as shown in Fig. 6. In theabsence of background electrolyte, polylysine delays the onsetof regime III, preventing admicelle formation until 0.65 × cmc.This should be compared to the CTAT adsorption isotherm inthe absence of polylysine, where regime III had already begunby 0.30 × cmc. In the presence of 10 mM NaT, where regime IIIfor single-component CTAT adsorption took the form of a stepchange at 0.2 × cmc, the presence of polylysine delays regimeIII until at least 0.5 × cmc.
The above discussion considers nonmicellar solutions. WhenCTAB, CTAC, or CTAT is present at concentrations in excessof the cmc, either in the absence or in the presence of 10 mMelectrolyte, polylysine decreases the surfactant adsorption byjust 10–30%. Therefore, polylysine does not appear to preventinterfacial self-assembly when micelles are present in the bulk
solution, and micelles can therefore adsorb directly to the neg-atively charged silica surface.How does the counterion affect the co-adsorbed amount ofpolylysine? For all surfactant concentrations considered belowthe cmc, the co-adsorbed amount of polylysine is not a strongfunction of the surfactant concentration. The adsorbed amount ofPL is also independent of the surfactant concentrations consid-ered above the cmc. It does appear, however, that less polylysineadsorbs above the surfactant cmc than below it. Table 2 shows theaverage adsorbed amounts of polylysine achieved during simul-taneous co-adsorption with surfactant at concentrations belowand above the cmc, in either 0 or 10 mM electrolyte solutions.
In the absence of added electrolyte, the average polylysinesurface concentration is approximately 50% lower when the sur-factant concentration is above the cmc. This is true for chloride,bromide, and tosylate counterions. In the presence of 10 mMadded electrolyte, the co-adsorbed amount of polylysine isgreater than that in 0 mM added electrolyte, below and abovethe cmc. For chloride and bromide counterions, the polylysinesurface concentration measured above the cmc is 55 to 60% ofthe surface concentration achieved below the cmc. For tosylate,the polylysine surface concentration above the cmc is only 35%of the surface concentration below the CTAT cmc. In all cases,the surfactant is better able to compete for adsorption when itis above its cmc, and this competitive advantage does appear toincrease with increasing counterion binding affinity.
Order-of-Addition Effects
Since the irreversibility of polylysine adsorption imposesnonequilibrium traps on these systems, one must ask to whatextent the above results can be explained by thermodynamic ar-guments as compared to kinetic arguments. Qualitatively, onecan deduce the relative strengths of the thermodynamic drivingforces for polyelectrolyte and surfactant adsorption by examin-ing certain types of sequential adsorption processes. In the stan-dard three-stage experiments described above, the first surfactantadsorption step was always followed by its complete desorptionby rinsing. In the second step, the surfactant and polylysine wereintroduced simultaneously to a clean silica surface. In those ex-periments, if the polymer arrives at the incompletely filled sur-face and is able to irreversibly adsorb while the surfactant is in
the process of interfacial self-assembly, nonequilibrium effectswill be introduced.
288 VELEGOL A
Time, min50 100
Γ, m
g/m
2
0
1
2
3
CTAT
CTAT+ 200 ppm PL
Rinse
FIG. 7. Pre-adsorption of CTAT in 0 mM NaT to bare silica surface at0.18 mM (0.7 × cmc), followed immediately (without rinsing) by exposure to amixture of 200 ppm polylysine and 0.18 mM CTAT (0.6 × cmc in the presenceof 200 ppm polylysine with no added electrolyte). Rinsing the layer reveals thatthe resultant layer contains 0.7 mg/m2 of CTAT and 0.26 mg/m2 of polylysine.
We conducted a series of sequential addition experiments asfollows: we first introduced surfactant and allowed it to fullyadsorb. Then, without rinsing, we switched from the single-component surfactant solution to a mixture containing the iden-tical surfactant concentration plus 200 ppm polylysine. Af-ter steady state was obtained, we rinsed the layer to revealwhether any polylysine was able to adsorb to the pre-adsorbedsurfactant layer. Since surfactant adsorption is completely re-versible, the thermodynamic balance between polylysine andthe surfactant adsorption should be reflected in the abilityof polylysine to displace some fraction of the pre-adsorbedsurfactant.
An example of such an experiment is shown in Fig. 7 for CTATat 0.18 mM (0.7 × cmc) in the absence of added electrolyte. Itadsorbs for 40 min until it reaches a surface excess concentra-
tion of 2.0 mg/m2. During the subsequent co-adsorption step, polylysine disrupts CTA admicelle adsorption below the cmc, the total adsorbed amount decreases to 1.0 mg/m2. Rinsing thisTABLE 3Summary Comparison of Sequential Adsorption and Simultaneous Co-adsorption Experiments at 0.8 × cmc
(or 0.7 × cmc in the Case of CTAT)
Does PL prevent Does PLreplaceadmicelle formation in pre-adsorbed CTA+ in
Added Simultaneous co-adsorption Sequential adsorption CTA+ adsorptionelectrolyte experiments? experiments? comparison
CTAC 0 mM KCl No No (no PL adsorption) �CTA+,Sim ∼ �CTA+,SeqCTAB 0 mM KBr No No (no PL adsorption) �CTA+,Sim ∼ �CTA+,SeqCTAT 0 mM NaT Yes Yes (�PL = 0.25 mg/m2) �CTA+,Sim < �CTA+,SeqCTAC 10 mM KCl Yes Yes (�PL = 0.28 mg/m2) �CTA+,Sim < �CTA+,SeqCTAB 10 mM KBr Yes Yes (�PL = 0.29 mg/m2) � + < � +
more CTA+ is contained in the sequentially co-adsorbed layer
Note. For those cases where polylysine was able to replace pre-adsorbed CTA+
ND TILTON
layer reveals that 0.26 mg/m2 of polylysine has adsorbed duringthe co-adsorption step, displacing a large fraction of the pre-adsorbed surfactant This experiment shows that polylysine hasa thermodynamic driving force for adsorption that is at leastcomparable to the surfactant since it is able to replace a signifi-cant fraction of the pre-adsorbed surfactant.
We performed similar experiments for CTAB with PLBr andCTAC with PLCl, both with and without added electrolyte. Wehypothesized that polylysine prevents interfacial self-assemblyduring simultaneous co-adsorption at bulk concentrations belowthe cmc only when the polylysine has at least a comparablethermodynamic driving force for adsorption. In other words, thehindrance of CTA+ adsorption has thermodynamic origins andis not purely a kinetic phenomenon.
The observations summarized in Table 3 confirm this hypoth-esis. For CTAB and CTAC with no added electrolyte, the polyly-sine cannot adsorb at all to a surface covered by a pre-adsorbedsurfactant layer, even though a significant amount of polylysinedoes adsorb in a simultaneous co-adsorption experiment. Thus,polylysine has a weaker thermodynamic driving force for ad-sorption than the surfactant. This is consistent with its inabilityto prevent CTAB or CTAC admicelle formation in regime III inthe absence of added electrolyte. In contrast, for CTAT in 0 mMelectrolyte as well as for CTAB and CTAC in the presence of10 mM electrolyte, the polylysine is able to adsorb and dis-place pre-adsorbed surfactants in the sequential co-adsorptionexperiment, evidence that its thermodynamic driving force foradsorption is comparable to that of the surfactant. Accord-ingly, under these conditions polylysine does hinder admicelleformation during simultaneous coadsorption experiments inregime III.
Under every condition where polylysine disrupts CTA+
admicelle adsorption below the cmc in a simultaneous co-adsorption experiment, it is also able to displace pre-adsorbedCTA+ in a sequential co-adsorption experiment. The con-verse is true as well. Likewise, under every condition where
+
CTA ,Sim CTA ,Seq
, the extent of polylysine adsorption is reported in parentheses.

COUNTERION EFFECT
than in the simultaneously co-adsorbed layer; i.e., CTA+ co-adsorption is path-dependent. Thus, the ability of polylysineto disrupt CTA+ admicelle adsorption does have thermody-namic origins, but kinetic effects dictate the quantitative out-come of the thermodynamic competition between polylysine andCTA+.
Electrostatically hindered diffusion may play a part in theinability of a polyelectrolyte to adsorb to a surface that hasbeen charge-reversed by a pre-adsorbed ionic surfactant layer(13). We do not believe that this is a significant factor here.As noted above, in the absence of CTA+, polylysine reversesthe net charge on a silica surface at low coverage. Most of thesaturated polylysine layer that develops in 200 ppm polylysinesolutions forms by diffusion against a repulsive electrostatic bar-rier that is similar in magnitude to that of the barrier createdby a saturated CTA+ layer. Other observations reported previ-ously for the PLBr/CTAB system support this conclusion as well(11).
CONCLUSIONS
We have examined specific counterion effects on adsorptionand co-adsorption in CTA+/polylysine/silica systems contain-ing chloride, bromide, or tosylate counterions. In the absenceof polylysine, specific counterion effects on CTA+ adsorptionresemble their effects on bulk micellization. In the bulk, eitherincreasing the binding affinity of the counterion or adding morecounterions through the addition of electrolyte decreases boththe cmc and the curvature of micelles. On the silica surface,increasing the binding affinity or electrolyte concentration in-creases the cooperativity of adsorption below the bulk cmc, cor-responding to a stabilization of interfacial self-assembly. Thiseffect on cooperativity is especially prominent for the bulky, hy-drophobic tosylate counterion. Above the cmc, where micellescan adsorb directly, increasing the binding affinity increases thesurface excess concentration due to a decrease in the curvatureof the adsorbed aggregates. Increasing counterion concentrationalso promotes polylysine adsorption. This is especially promi-nent for the tosylate counterion, an effect that we hypothesizemay be caused by a partial collapse of the polyelectrolyte chainaround the hydrophobic counterions.
For co-adsorption, the competition between polylysine andCTA+ is qualitatively similar for chloride and bromide. Polyly-sine is able to disrupt admicelle adsorption below the bulk cmconly in the presence of added background electrolyte. In con-trast, in the presence of tosylate, polylysine significantly dis-rupts admicelle adsorption below the cmc, even in the absenceof added electrolyte. Sequential adsorption experiments revealthat polylysine only disrupts admicelle adsorption below thecmc when its thermodynamic driving force for adsorption isat least comparable to the surfactant. Nevertheless, hysteresisis strong in these systems and kinetic phenomena play a promi-
nent role in dictating the quantitative outcome of the competitiveadsorption.S ON Co-ADSORPTION 289
ACKNOWLEDGMENTS
This material is based on work supported by the National Science Founda-tion under Grant CTS-9623849 and a National Science Foundation DoctoralFellowship for S.B.V.
REFERENCES
1. Braem, A., Prieve, D., and Tilton, R. D., Langmuir 17, 883–890 (2001).2. Claesson, P. M., Malmsten, M., and Lindman, B., Langmuir 7, 1441–1446
(1991).3. Claesson, P. M., Dedinaite, A., Blomberg, E., and Sergeyev, V., Ber. Bunsen-
Ges. Phys. Chem. 100, 1008 (1996).4. Anthony, O., Marques, C. M., and Richetti, P., Langmuir 14, 6086–6095
(1998).5. Neivandt, D. J., Gee, M. L., Tripp, C. P., and Hair, M. L., Langmuir 13,
2519–2526 (1997).6. Somasundaran, P., and Cleverdon, J., Colloids Surf. 13, 73–85 (1985).7. Esumi, K., and Oyama, M., Langmuir 9, 2020–2023 (1993).8. Esumi, K., Masuda, A., and Otsuka, H., Langmuir 9, 284–287 (1993).9. Esumi, K., Takaku, Y., and Otsuka, H., Langmuir 10, 3250–3254 (1994).
10. Pagac, E. S., Prieve, D. C., and Tilton, R. D., Langmuir 14, 2333–2342(1998).
11. Velegol, S. B., and Tilton, R. D., Langmuir 17, 219–227 (2001).12. Furst, E. M., Pagac, E. S., and Tilton, R. D., Ind. Eng. Chem. Res. 35,
1566–1574 (1996).13. Harrison, I. M., Meadows, J., Robb, I. D., and Williams, P. A., J. Chem.
Soc. Faraday Trans. 91, 3919–3923 (1995).14. Ghodbane, J., and Denoyel, R., Colloids Surf. A 127, 97 (1997).15. Bartet, D., Gamboa, C., and Sepulveda, L., J. Phys. Chem. 84, 272–275
(1980).16. Chen, Y. L., Chen, S., Frank, C., and Israelachvili, J., J. Colloid Interface
Sci. 153, 244 (1992).17. Lindman, B., Puyal, M. C., Kamenka, N., Rymden, R., and Stilbs, P.,
J. Phys. Chem. 88, 5048–5057 (1984).18. Lamont, R. E., and Ducker, W. A., J. Am. Chem. Soc. 120, 7602–7607
(1998).19. Ducker, W. A., and Wanless, E. J., Langmuir 15, 160–168 (1999).20. Patrick, H. N., Warr, G. G., Manne, S., and Aksay, I. A., Langmuir 15,
1685–1692 (1999).21. Subramanian, V., and Ducker, W. A., Langmuir 16, 4447–4454 (2000).22. Velegol, S. B., Fleming, B. D., Biggs, S., Wanless, E. J., and Tilton, R. D.,
Langmuir 16, 2548–2556 (2000).23. Koehler, R. D., and Kaler, E. W., in “Structure and flow in surfactant
solutions” (C. A. Herb and R. K. Prud’homme, Eds.), ACS Symp. Ser.,pp. 120–128. Am. Chem. Soc., Washington, D.C., 1994.
24. Velegol, S. B., “Tuning Interfacial and Bulk Self-Assembly of CationicSurfactants via Counterions and Similarly-Charged Polyelectrolytes.”Ph.D. dissertation, Carnegie Mellon University, Pittsburgh, PA, 2000.
25. Beesley, A. H., “Surfactant Micelles under unusual conditions.” Ph.D.dissertation, University of Minnesota, Minneapolis, MN, 1990.
26. Velegol, S. B., White, L., and Tilton, R. D., in preparation.27. Tilton, R. D., in “Colloid–Polymer Interactions: From Fundamentals to
Practice” (R. S. Farinato and P. L. Dubin, Eds.), pp. 331–363. Wiley,New York, 1999.
28. Koopal, L. K., and Goloub, T., in “Surfactant adsorption and surface solu-bilization” (R. Sharma, Ed.). ACS, New York, 1995.
29. Fleer, G. J., Cohen Stuart, M. A., Scheutjens, J. M. H. M., Cosgrove, T.,and Vincent, B., “Polymers at Interfaces.” Chapman & Hall, London, 1993.
30. Furusawa, K., Kanesaka, M., and Yamashita, S., J. Colloid Interface Sci.99, 341–348 (1984).
31. Bonekamp, B. C., and Lyklema, J., J. Colloid Interface Sci. 113, 67–75(1986).
32. Luckham, P. F., and Klein, J., J. Chem. Soc. Faraday Trans. 1 80, 865–878
(1984).