Counterion and composition effects on discotic nematic lyotropic liquid crystals
6
Counterion and composition effects on discotic nematic lyotropic liquid crystals I. Size and order Rodrigo Montecinos a , Hernán Ahumada a , Ramiro Araya-Maturana b , Andrés F. Olea c , Boris E. Weiss-López a,∗ a Universidad de Chile, Facultad de Ciencias, Departamento de Química, Casilla 653, Santiago, Chile b Universidad de Chile, Facultad de Ciencias Químicas y Farmacéuticas, Departamento de Química Orgánica y Fisicoquímica, Casilla 233, Santiago 1, Chile c Universidad Andrés Bello, Facultad de Ecología y Recursos Naturales, Departamento de Ciencias Químicas, República 275, Santiago, Chile Abstract Counterion and composition effects on the size and interface dynamics of discotic nematic lyotropic liquid crystals made of tetradecyltrimethyl- ammonium halide (TTAX)–decanol (DeOH)–water–NaX, with X = Cl − and Br − , were investigated using NMR and fluorescence spectro- scopies. The dynamics of the interface was examined by measuring deuterium quadrupole splittings from HDO (0.1% D 2 O in H 2 O) and 1,1-dideuterodecanol (20% 1,1-dideuterodecanol in DeOH) in 27 samples of each liquid crystal. Aggregation numbers, N D , from 15 samples of each mesophase were obtained using the fluorescence of pyrene quenched by hexadecylpyridinium chloride. N D of TTAB and TTAC are about 230 ± 30 and 300 ± 20, respectively. N D of TTAC increases with increasing concentration of all mesophase components, whereas TTAB shows no correlation between size and composition. The dimension of these aggregates prevents the occurrence of undulations, previously observed in lamellar phases. The quadrupole splitting of decanol-d 2 in TTAC is about 5 kHz smaller than in TTAB, and the splitting of HDO is observed only in TTAB. All results are consistent with a more dynamic TTAC interface. The TTAC aggregate should be more dissociated from counterions and the excess ammonium–ammonium electrostatic repulsions contribute to increase the mobility of the interface components. Keywords: Interface dynamics; Aggregation number and composition; Discotic nematic lyotropic liquid crystal 1. Introduction Amphiphiles dissolved in water at a certain concentration and ionic strength form aggregates of different shape and size [1,2]. It is possible to obtain a wide variety of structures such as spherical and cylindrical micelles, vesicles, lamellar and hexagonal smectic phases, discotic and calamitic nematic mesophases, and others. All these aggregates have in common the existence of at least three different regions: (a) the aque- ous region, which contains dissolved counterions, added salt and a small amount of free amphiphiles, (b) the interface, com- posed of headgroups, ions and water, and (c) the hydropho- * Corresponding author. E-mail address: [email protected] (B.E. Weiss-López). bic core made of linear aliphatic chains. Perhaps the most interesting region is the interface, since most electrostatic in- teractions take place there. Forces among charged and polar headgroups of the amphiphiles with ions and solvent mole- cules, at the interface, play a significant role in the determi- nation of the size and shape of the aggregates [3,4]. In par- ticular, discotic nematic lyotropic liquid crystals (type II [5]) are four-component mesophases made of oblate shaped bilayer aggregates, which form spontaneously in concentrated aque- ous solutions of a charged amphiphile, decanol and salt. These aggregates spontaneously orient in the NMR magnetic field with the symmetry axis of the disk perpendicular to the di- rection of the field [6,7]. A static fluorescence quenching and molecular dynamics study about the size and structure of a dis- cotic nematic aggregate made of tetradecyltrimethylammonium
Transcript of Counterion and composition effects on discotic nematic lyotropic liquid crystals
Counterion and composition effects on discotic nematiclyotropic liquid crystals
I. Size and order
Rodrigo Montecinos a, Hernán Ahumada a, Ramiro Araya-Maturana b, Andrés F. Olea c,Boris E. Weiss-López a,∗
a Universidad de Chile, Facultad de Ciencias, Departamento de Química, Casilla 653, Santiago, Chileb Universidad de Chile, Facultad de Ciencias Químicas y Farmacéuticas, Departamento de Química Orgánica y Fisicoquímica, Casilla 233, Santiago 1, Chile
c Universidad Andrés Bello, Facultad de Ecología y Recursos Naturales, Departamento de Ciencias Químicas, República 275, Santiago, Chile
Abstract
Counterion and composition effects on the size and interface dynamics of discotic nematic lyotropic liquid crystals made of tetradecyltrimethyl-ammonium halide (TTAX)–decanol (DeOH)–water–NaX, with X = Cl− and Br−, were investigated using NMR and fluorescence spectro-scopies. The dynamics of the interface was examined by measuring deuterium quadrupole splittings from HDO (0.1% D2O in H2O) and1,1-dideuterodecanol (20% 1,1-dideuterodecanol in DeOH) in 27 samples of each liquid crystal. Aggregation numbers, ND, from 15 samplesof each mesophase were obtained using the fluorescence of pyrene quenched by hexadecylpyridinium chloride. ND of TTAB and TTAC are about230 ± 30 and 300 ± 20, respectively. ND of TTAC increases with increasing concentration of all mesophase components, whereas TTAB showsno correlation between size and composition. The dimension of these aggregates prevents the occurrence of undulations, previously observed inlamellar phases. The quadrupole splitting of decanol-d2 in TTAC is about 5 kHz smaller than in TTAB, and the splitting of HDO is observed onlyin TTAB. All results are consistent with a more dynamic TTAC interface. The TTAC aggregate should be more dissociated from counterions andthe excess ammonium–ammonium electrostatic repulsions contribute to increase the mobility of the interface components.
Keywords: Interface dynamics; Aggregation number and composition; Discotic nematic lyotropic liquid crystal
1. Introduction
Amphiphiles dissolved in water at a certain concentrationand ionic strength form aggregates of different shape andsize [1,2]. It is possible to obtain a wide variety of structuressuch as spherical and cylindrical micelles, vesicles, lamellarand hexagonal smectic phases, discotic and calamitic nematicmesophases, and others. All these aggregates have in commonthe existence of at least three different regions: (a) the aque-ous region, which contains dissolved counterions, added saltand a small amount of free amphiphiles, (b) the interface, com-posed of headgroups, ions and water, and (c) the hydropho-
* Corresponding author.E-mail address: [email protected] (B.E. Weiss-López).
bic core made of linear aliphatic chains. Perhaps the mostinteresting region is the interface, since most electrostatic in-teractions take place there. Forces among charged and polarheadgroups of the amphiphiles with ions and solvent mole-cules, at the interface, play a significant role in the determi-nation of the size and shape of the aggregates [3,4]. In par-ticular, discotic nematic lyotropic liquid crystals (type II [5])are four-component mesophases made of oblate shaped bilayeraggregates, which form spontaneously in concentrated aque-ous solutions of a charged amphiphile, decanol and salt. Theseaggregates spontaneously orient in the NMR magnetic fieldwith the symmetry axis of the disk perpendicular to the di-rection of the field [6,7]. A static fluorescence quenching andmolecular dynamics study about the size and structure of a dis-cotic nematic aggregate made of tetradecyltrimethylammonium
R. Montecinos et al. / 127
Table 1Composition, 2H and 35Cl quadrupole splittings, and aggregation number (ND)of selected TTAC samples
Sample Composition of mesophasesa Quadrupole splittingsb NDc
TTAC NaCl Decanol H2O Decanol-d235Cl
1 0.611 0.931 0.231 27.8 12448 9125 2802 0.611 0.931 0.241 27.8 14079 11525 3167 0.611 1.034 0.231 27.8 14145 10693 3148 0.611 1.034 0.241 27.8 15192 11398 351
20 0.638 0.931 0.241 27.8 12578 10452 33825 0.638 1.034 0.231 27.8 12339 9370 335
Note. The splitting of HDO was not observed in any sample of this mesophase.The estimated error in the quadrupole splittings are ±30 Hz for decanol andchloride, and the estimated error in the determination of ND is ±20.
a Values in mmol.b Values in Hz.c ND is the aggregation number.
chloride (TTAC)/decanol (DeOH)/sodium chloride/water, con-cluded that the flat micelle is made of 258 amphiphile units(TTAC + DeOH), with an approximate radius of 3.8 nm [8].It is well known that aggregation numbers measured using thestatic fluorescence quenching method, NS, are underestimated;the dynamic fluorescence quenching method gives better re-sults [9]. To re-examine the size of the aggregate in TTAC anda previously reported four components SDS mesophases [10],and to study counterion and composition effects on the size andinterface dynamics of nematic discotic lyotropic liquid crys-tals, we have carried out a comparative study between twomesophases prepared with TTAX–DeOH–H2O–NaX, whereX = Cl− and Br−. The concentrations of all components, ex-cept water, were modified. The size of the aggregates weremeasured using dynamic fluorescence quenching of pyrene byhexadecylpyridinium chloride (HDPC) [11,12]. On the otherhand, the dynamics of the interface was probed by measuring2H NMR quadrupole splittings from 1,1-dideuterodecanol andmonodeuterated water. 35Cl NMR quadrupole splittings weremeasured for the TTAC mesophase.
2. Materials and methods
2.1. NMR samples and spectra
TTAB and HDPC were purchased from Aldrich and TTACfrom Anatrace. They were recrystallized three times from ethylacetate/ethanol solutions before use. SDS was prepared andpurified using a previously reported methodology [13]. Anhy-drous NaCl, NaBr and Na2SO4 were purchased from Aldrichand used without further purification. Decanol from Aldrichwas purified by fractional crystallization and enriched with20% v/v 1,1-dideuterodecanol, previously synthesized by re-duction of decanoic acid with LiAlD4 and purified by vacuumdistillation. The compositions of all samples are listed in Ta-bles 1 and 2. The samples were allowed to equilibrate at least72 h at 300 K before measurements. 2H NMR spectra were ob-tained at 300 K in a Bruker Avance 400 spectrometer, using aBB inverse probe tuned to the 2H frequency (64.1 MHz). A 90◦pulse length of 19 µs and a spectral window of 25 kHz were
Table 2Composition, 2H quadrupole splittings and non-corrected aggregation number(ND) of selected TTAB samples
Sample Composition of mesophasesa Quadrupole splittingsb NDc
TTAB NaBr Decanol H2O Decanol-d2 HDO
29 0.611 0.931 0.231 27.8 19578 32 21930 0.611 0.931 0.241 27.8 20060 32 22635 0.611 1.034 0.231 27.8 20096 34 22736 0.611 1.034 0.241 27.8 20260 37 21048 0.638 0.931 0.241 27.8 19694 33 22653 0.638 1.034 0.231 27.8 19396 33 242
Note. The estimated errors in the quadrupole splittings are ±3 Hz for HDO and±30 Hz for decanol. The associated error in the determination of ND is ±30.
a Values in mmol.b Values in Hz.c ND is the aggregation number without correcting for the quenching by bro-
mide.
used in all 2H NMR spectra. 35Cl NMR spectra were recordedat 71.7 MHz, using the same spectrometer with the same probeand temperature. A 90◦ pulse length of 20 µs and a spectralwindow of 35 kHz were used. More than 4000 transients wereaccumulated and stored in 32 kB files.
2.2. Time-resolved fluorescence quenching
Pyrene 99% was purchased from Aldrich and used asreceived. To investigate the size of the aggregates, experi-ments measuring the dynamic fluorescence quenching of addedpyrene by added HDPC, according to a previously reportedmethod developed for spherical micelles [14–17], were car-ried out in 15 samples of each mesophase. We briefly describenow the employed methodology. If both the fluorescent probe(pyrene) and the quencher (HDPC) are 100% associated to themicelle, and the distribution of quenchers into the aggregatesfollows the Poisson distribution, the time-resolved fluorescencedecay data can be explained in terms of the following equation:
(1)I (t) = I (0) exp[(−k0t) − B
(1 − exp(−kqt)
)],
where I (0) and I (t) denote the fluorescence intensities ofpyrene at times zero and t , following the excitation, and B =[Q]/[Micelles] is the average number of quenchers per micelle,the so-called occupation number. k0 is the decay rate constant ofthe probe in the absence of quencher, and kq is the quenchingrate constant. Therefore, the value of the micelle aggregationnumber ND is obtained from the equation:
(2)ND = B([S] − cmc)
[HDPC] .
Here [S] is the total molar concentration of surfactant mole-cules, [TTAX] + [DeOH]; cmc is the concentration of freeamphiphiles, negligible compared to [S], and [HDPC] is theconcentration of quencher. The aggregation number is obtainedfrom the slope of a plot of B vs [HDPC], multiplied by [S].We used the described methodology to measure the aggrega-tion number of these TTAX and SDS disk shaped micelles. Forthis purpose, 5 µl of a stock solution of pyrene, 4 × 10⁻³ Min acetonitrile, were placed in a 25 ml flask and after evapora-tion of the solvent 5 ml of the corresponding mesophase were
128 R. Montecinos et al. /
(A) (B)
(C) (D)
Fig. 1. Polarized light microscope textures of samples 1 and 27 of the TTAC mesophase (A and B) and samples 28 and 54 of the TTAB mesophase (C and D). Thephotographs were obtained along the direction of the applied magnetic field.
added. The solution was allowed to equilibrate at 300 K for72 h and divided into 6 samples. Small amounts of a 0.2 Mstock solution of HDPC were added to each sample, coveringa concentration range from 9.1 × 10⁻⁴ to 8.2 × 10⁻³ M, andwere allowed to equilibrate for another 72 h at 300 K beforemeasurements. Time-resolved fluorescence decay curves wereobtained at 300 K by exciting the samples with a LSI nitrogenlaser, which provides 4 ns pulses at 337.1 nm, and detectingwith an IP-28 photomultiplier (Hamamatsu) the emission pass-ing through an Oriel 77250 monochromator. The decay wasrecorded in a digital Tektronik TDS 430A oscilloscope. Steadystate fluorescence spectra were recorded with a SLM-AmincoSPF-500C spectrofluorimeter.
3. Results
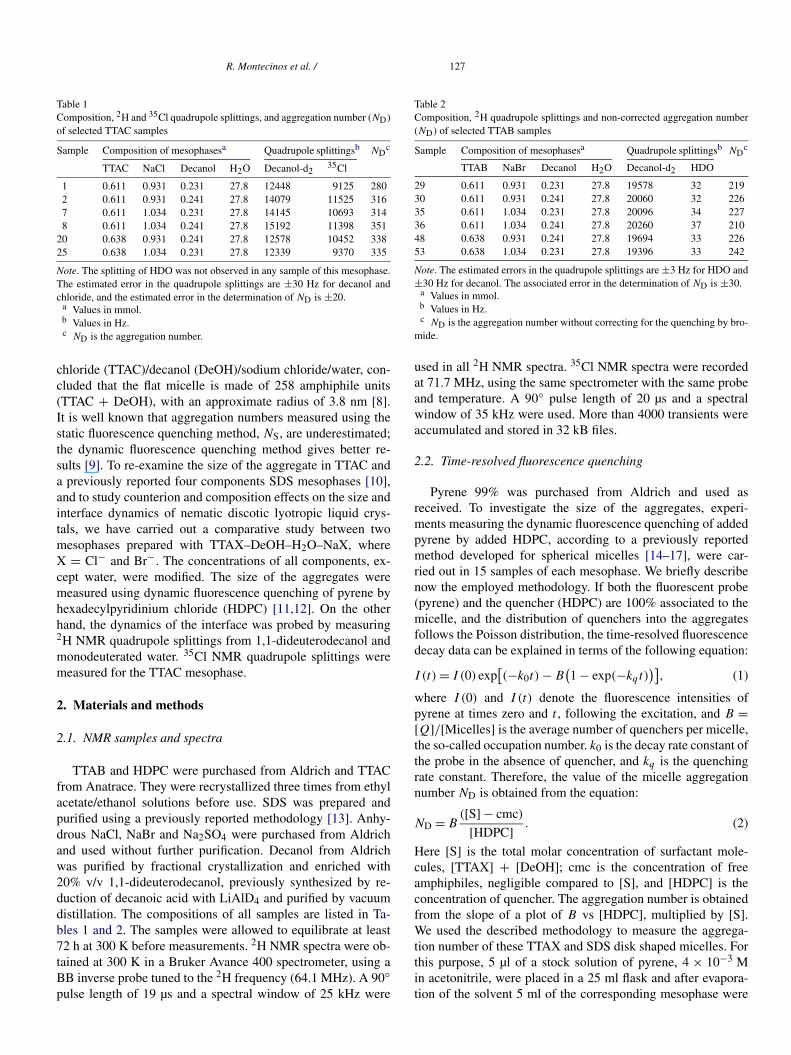
To corroborate that the different solutions correspond tothe same discotic nematic phase, polarized light microscopytextures were obtained using a MOTIC B3 microscope. Pho-tographs of selected magnetic field oriented samples, obtainedin the direction of the field, are shown in Fig. 1 [18]. Figs. 2and 3 are the 2H NMR spectra of TTAC and TTAB fromsamples 14 and 49, respectively. The external doublet is as-signed to the quadrupole splitting of decanol and the internalsignal is assigned to HDO. 35Cl NMR spectrum from sam-ple 14 appears in Fig. 4. All splittings were measured directlyfrom the spectra. Tables 1 and 2 list the 2H quadrupole split-tings of HDO and 1,1-dideuterodecanol from selected sam-
Fig. 2. 2H NMR spectrum from sample 14 of the TTAC mesophase. Thequadrupole splitting of HDO was not observed in any TTAC sample. The insertis an expansion of the signal from HDO.
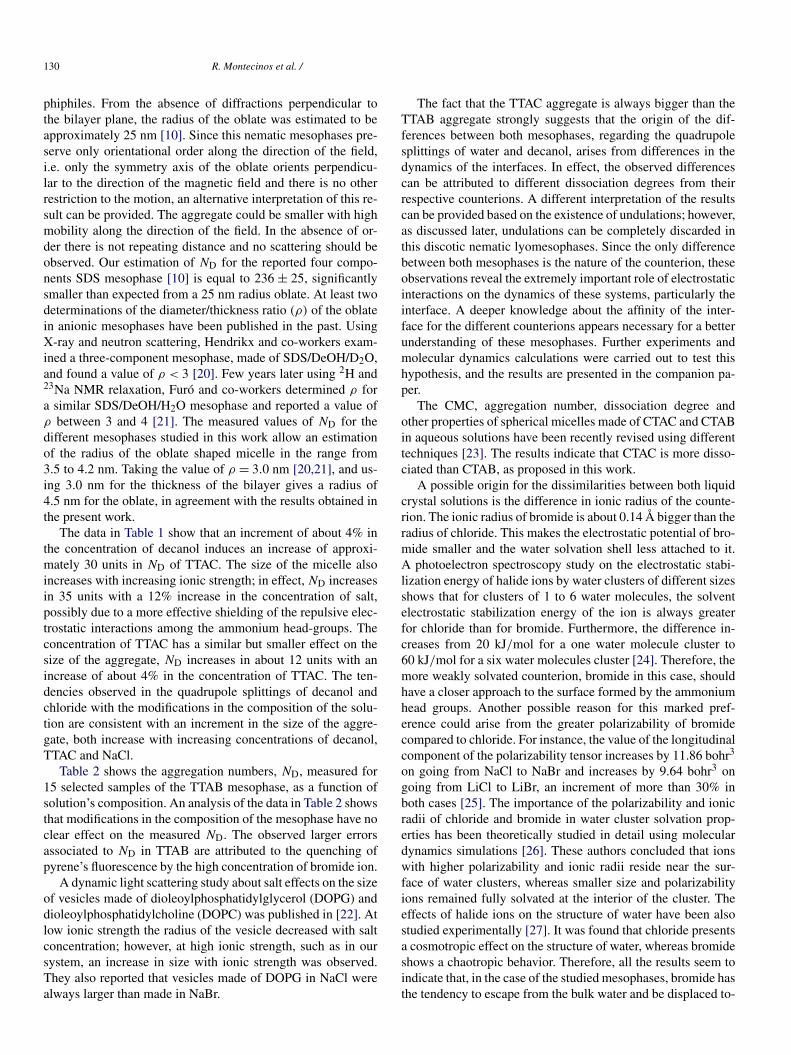
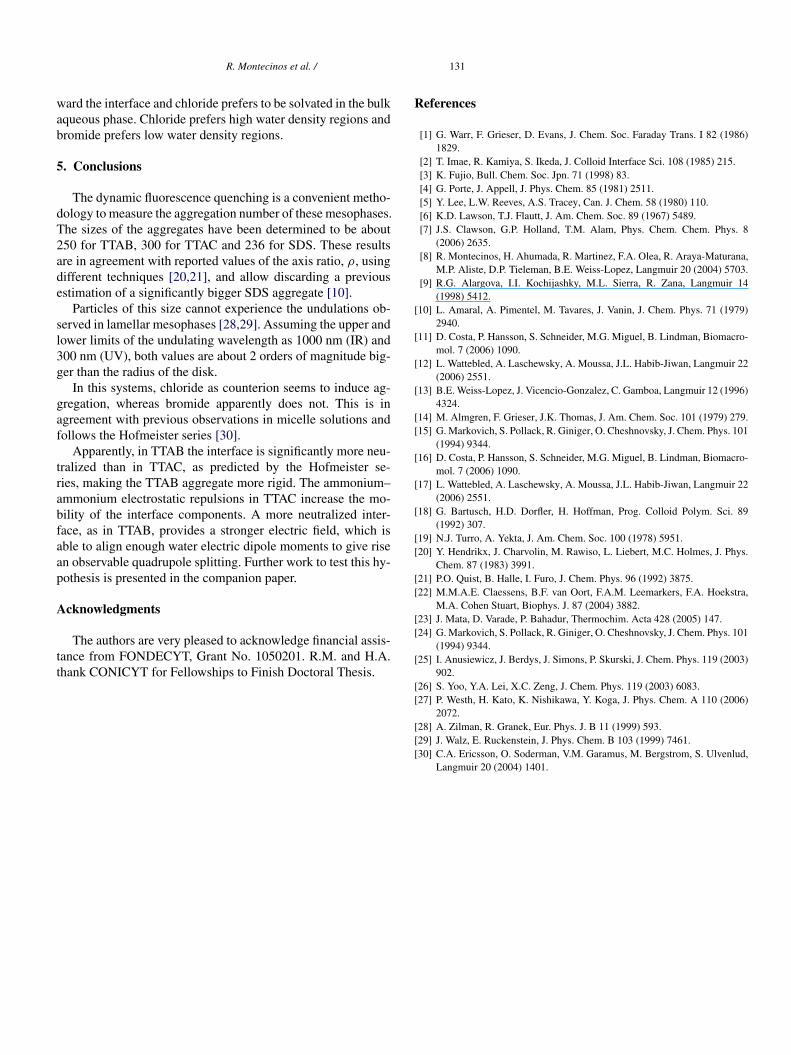
ples of TTAC and TTAB, as well as the quadrupole split-tings of 35Cl from the TTAC mesophase. Fig. 5 shows a typ-ical time-resolved fluorescence decay curve from pyrene andthe best fit to function (1) to obtain the value of B . Fig. 6shows a typical plot of B vs the concentration of HDPC. Inthis case, the figure corresponds to sample 1. Tables 1 and 2also list the values of ND measured in 15 samples of eachmesophase. The complete version of Tables 1 and 2 are pro-vided as supporting material. The aggregate size of a sodiumdecyl sulfate mesophase (SDS/DeOH/Na2SO4/H2O) was pre-viously estimated using small angle diffraction X-ray scattering
R. Montecinos et al. / 129
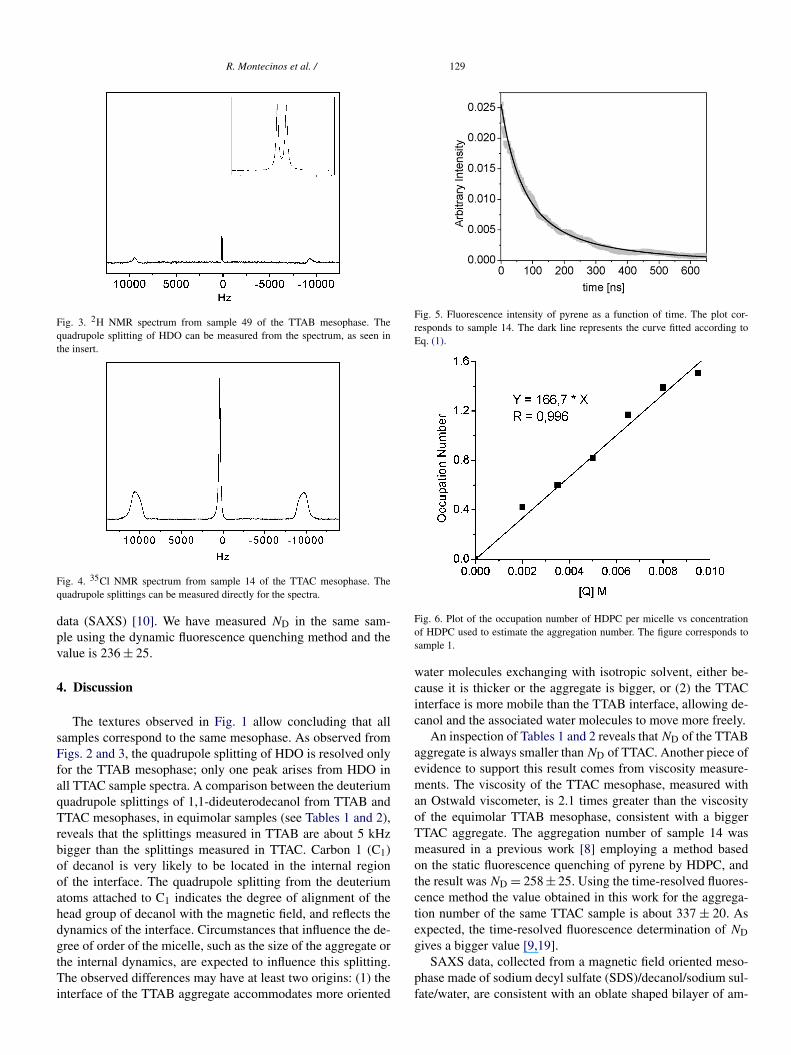
Fig. 3. 2H NMR spectrum from sample 49 of the TTAB mesophase. Thequadrupole splitting of HDO can be measured from the spectrum, as seen inthe insert.
Fig. 4. 35Cl NMR spectrum from sample 14 of the TTAC mesophase. Thequadrupole splittings can be measured directly for the spectra.
data (SAXS) [10]. We have measured ND in the same sam-ple using the dynamic fluorescence quenching method and thevalue is 236 ± 25.
4. Discussion
The textures observed in Fig. 1 allow concluding that allsamples correspond to the same mesophase. As observed fromFigs. 2 and 3, the quadrupole splitting of HDO is resolved onlyfor the TTAB mesophase; only one peak arises from HDO inall TTAC sample spectra. A comparison between the deuteriumquadrupole splittings of 1,1-dideuterodecanol from TTAB andTTAC mesophases, in equimolar samples (see Tables 1 and 2),reveals that the splittings measured in TTAB are about 5 kHzbigger than the splittings measured in TTAC. Carbon 1 (C1)of decanol is very likely to be located in the internal regionof the interface. The quadrupole splitting from the deuteriumatoms attached to C1 indicates the degree of alignment of thehead group of decanol with the magnetic field, and reflects thedynamics of the interface. Circumstances that influence the de-gree of order of the micelle, such as the size of the aggregate orthe internal dynamics, are expected to influence this splitting.The observed differences may have at least two origins: (1) theinterface of the TTAB aggregate accommodates more oriented
Fig. 5. Fluorescence intensity of pyrene as a function of time. The plot cor-responds to sample 14. The dark line represents the curve fitted according toEq. (1).
Fig. 6. Plot of the occupation number of HDPC per micelle vs concentrationof HDPC used to estimate the aggregation number. The figure corresponds tosample 1.
water molecules exchanging with isotropic solvent, either be-cause it is thicker or the aggregate is bigger, or (2) the TTACinterface is more mobile than the TTAB interface, allowing de-canol and the associated water molecules to move more freely.
An inspection of Tables 1 and 2 reveals that ND of the TTABaggregate is always smaller than ND of TTAC. Another piece ofevidence to support this result comes from viscosity measure-ments. The viscosity of the TTAC mesophase, measured withan Ostwald viscometer, is 2.1 times greater than the viscosityof the equimolar TTAB mesophase, consistent with a biggerTTAC aggregate. The aggregation number of sample 14 wasmeasured in a previous work [8] employing a method basedon the static fluorescence quenching of pyrene by HDPC, andthe result was ND = 258 ± 25. Using the time-resolved fluores-cence method the value obtained in this work for the aggrega-tion number of the same TTAC sample is about 337 ± 20. Asexpected, the time-resolved fluorescence determination of ND
gives a bigger value [9,19].SAXS data, collected from a magnetic field oriented meso-
phase made of sodium decyl sulfate (SDS)/decanol/sodium sul-fate/water, are consistent with an oblate shaped bilayer of am-
130 R. Montecinos et al. /
phiphiles. From the absence of diffractions perpendicular tothe bilayer plane, the radius of the oblate was estimated to beapproximately 25 nm [10]. Since this nematic mesophases pre-serve only orientational order along the direction of the field,i.e. only the symmetry axis of the oblate orients perpendicu-lar to the direction of the magnetic field and there is no otherrestriction to the motion, an alternative interpretation of this re-sult can be provided. The aggregate could be smaller with highmobility along the direction of the field. In the absence of or-der there is not repeating distance and no scattering should beobserved. Our estimation of ND for the reported four compo-nents SDS mesophase [10] is equal to 236 ± 25, significantlysmaller than expected from a 25 nm radius oblate. At least twodeterminations of the diameter/thickness ratio (ρ) of the oblatein anionic mesophases have been published in the past. UsingX-ray and neutron scattering, Hendrikx and co-workers exam-ined a three-component mesophase, made of SDS/DeOH/D2O,and found a value of ρ < 3 [20]. Few years later using 2H and23Na NMR relaxation, Furó and co-workers determined ρ fora similar SDS/DeOH/H2O mesophase and reported a value ofρ between 3 and 4 [21]. The measured values of ND for thedifferent mesophases studied in this work allow an estimationof the radius of the oblate shaped micelle in the range from3.5 to 4.2 nm. Taking the value of ρ = 3.0 nm [20,21], and us-ing 3.0 nm for the thickness of the bilayer gives a radius of4.5 nm for the oblate, in agreement with the results obtained inthe present work.
The data in Table 1 show that an increment of about 4% inthe concentration of decanol induces an increase of approxi-mately 30 units in ND of TTAC. The size of the micelle alsoincreases with increasing ionic strength; in effect, ND increasesin 35 units with a 12% increase in the concentration of salt,possibly due to a more effective shielding of the repulsive elec-trostatic interactions among the ammonium head-groups. Theconcentration of TTAC has a similar but smaller effect on thesize of the aggregate, ND increases in about 12 units with anincrease of about 4% in the concentration of TTAC. The ten-dencies observed in the quadrupole splittings of decanol andchloride with the modifications in the composition of the solu-tion are consistent with an increment in the size of the aggre-gate, both increase with increasing concentrations of decanol,TTAC and NaCl.
Table 2 shows the aggregation numbers, ND, measured for15 selected samples of the TTAB mesophase, as a function ofsolution’s composition. An analysis of the data in Table 2 showsthat modifications in the composition of the mesophase have noclear effect on the measured ND. The observed larger errorsassociated to ND in TTAB are attributed to the quenching ofpyrene’s fluorescence by the high concentration of bromide ion.
A dynamic light scattering study about salt effects on the sizeof vesicles made of dioleoylphosphatidylglycerol (DOPG) anddioleoylphosphatidylcholine (DOPC) was published in [22]. Atlow ionic strength the radius of the vesicle decreased with saltconcentration; however, at high ionic strength, such as in oursystem, an increase in size with ionic strength was observed.They also reported that vesicles made of DOPG in NaCl werealways larger than made in NaBr.
The fact that the TTAC aggregate is always bigger than theTTAB aggregate strongly suggests that the origin of the dif-ferences between both mesophases, regarding the quadrupolesplittings of water and decanol, arises from differences in thedynamics of the interfaces. In effect, the observed differencescan be attributed to different dissociation degrees from theirrespective counterions. A different interpretation of the resultscan be provided based on the existence of undulations; however,as discussed later, undulations can be completely discarded inthis discotic nematic lyomesophases. Since the only differencebetween both mesophases is the nature of the counterion, theseobservations reveal the extremely important role of electrostaticinteractions on the dynamics of these systems, particularly theinterface. A deeper knowledge about the affinity of the inter-face for the different counterions appears necessary for a betterunderstanding of these mesophases. Further experiments andmolecular dynamics calculations were carried out to test thishypothesis, and the results are presented in the companion pa-per.
The CMC, aggregation number, dissociation degree andother properties of spherical micelles made of CTAC and CTABin aqueous solutions have been recently revised using differenttechniques [23]. The results indicate that CTAC is more disso-ciated than CTAB, as proposed in this work.
A possible origin for the dissimilarities between both liquidcrystal solutions is the difference in ionic radius of the counte-rion. The ionic radius of bromide is about 0.14 Å bigger than theradius of chloride. This makes the electrostatic potential of bro-mide smaller and the water solvation shell less attached to it.A photoelectron spectroscopy study on the electrostatic stabi-lization energy of halide ions by water clusters of different sizesshows that for clusters of 1 to 6 water molecules, the solventelectrostatic stabilization energy of the ion is always greaterfor chloride than for bromide. Furthermore, the difference in-creases from 20 kJ/mol for a one water molecule cluster to60 kJ/mol for a six water molecules cluster [24]. Therefore, themore weakly solvated counterion, bromide in this case, shouldhave a closer approach to the surface formed by the ammoniumhead groups. Another possible reason for this marked pref-erence could arise from the greater polarizability of bromidecompared to chloride. For instance, the value of the longitudinalcomponent of the polarizability tensor increases by 11.86 bohr3
on going from NaCl to NaBr and increases by 9.64 bohr3 ongoing from LiCl to LiBr, an increment of more than 30% inboth cases [25]. The importance of the polarizability and ionicradii of chloride and bromide in water cluster solvation prop-erties has been theoretically studied in detail using moleculardynamics simulations [26]. These authors concluded that ionswith higher polarizability and ionic radii reside near the sur-face of water clusters, whereas smaller size and polarizabilityions remained fully solvated at the interior of the cluster. Theeffects of halide ions on the structure of water have been alsostudied experimentally [27]. It was found that chloride presentsa cosmotropic effect on the structure of water, whereas bromideshows a chaotropic behavior. Therefore, all the results seem toindicate that, in the case of the studied mesophases, bromide hasthe tendency to escape from the bulk water and be displaced to-
R. Montecinos et al. / 131
ward the interface and chloride prefers to be solvated in the bulkaqueous phase. Chloride prefers high water density regions andbromide prefers low water density regions.
5. Conclusions
The dynamic fluorescence quenching is a convenient metho-dology to measure the aggregation number of these mesophases.The sizes of the aggregates have been determined to be about250 for TTAB, 300 for TTAC and 236 for SDS. These resultsare in agreement with reported values of the axis ratio, ρ, usingdifferent techniques [20,21], and allow discarding a previousestimation of a significantly bigger SDS aggregate [10].
Particles of this size cannot experience the undulations ob-served in lamellar mesophases [28,29]. Assuming the upper andlower limits of the undulating wavelength as 1000 nm (IR) and300 nm (UV), both values are about 2 orders of magnitude big-ger than the radius of the disk.
In this systems, chloride as counterion seems to induce ag-gregation, whereas bromide apparently does not. This is inagreement with previous observations in micelle solutions andfollows the Hofmeister series [30].
Apparently, in TTAB the interface is significantly more neu-tralized than in TTAC, as predicted by the Hofmeister se-ries, making the TTAB aggregate more rigid. The ammonium–ammonium electrostatic repulsions in TTAC increase the mo-bility of the interface components. A more neutralized inter-face, as in TTAB, provides a stronger electric field, which isable to align enough water electric dipole moments to give risean observable quadrupole splitting. Further work to test this hy-pothesis is presented in the companion paper.
Acknowledgments
The authors are very pleased to acknowledge financial assis-tance from FONDECYT, Grant No. 1050201. R.M. and H.A.thank CONICYT for Fellowships to Finish Doctoral Thesis.
References
[1] G. Warr, F. Grieser, D. Evans, J. Chem. Soc. Faraday Trans. I 82 (1986)1829.
[2] T. Imae, R. Kamiya, S. Ikeda, J. Colloid Interface Sci. 108 (1985) 215.[3] K. Fujio, Bull. Chem. Soc. Jpn. 71 (1998) 83.[4] G. Porte, J. Appell, J. Phys. Chem. 85 (1981) 2511.[5] Y. Lee, L.W. Reeves, A.S. Tracey, Can. J. Chem. 58 (1980) 110.[6] K.D. Lawson, T.J. Flautt, J. Am. Chem. Soc. 89 (1967) 5489.[7] J.S. Clawson, G.P. Holland, T.M. Alam, Phys. Chem. Chem. Phys. 8
(2006) 2635.[8] R. Montecinos, H. Ahumada, R. Martinez, F.A. Olea, R. Araya-Maturana,
M.P. Aliste, D.P. Tieleman, B.E. Weiss-Lopez, Langmuir 20 (2004) 5703.[9] R.G. Alargova, I.I. Kochijashky, M.L. Sierra, R. Zana, Langmuir 14
(1998) 5412.[10] L. Amaral, A. Pimentel, M. Tavares, J. Vanin, J. Chem. Phys. 71 (1979)
2940.[11] D. Costa, P. Hansson, S. Schneider, M.G. Miguel, B. Lindman, Biomacro-
mol. 7 (2006) 1090.[12] L. Wattebled, A. Laschewsky, A. Moussa, J.L. Habib-Jiwan, Langmuir 22
(2006) 2551.[13] B.E. Weiss-Lopez, J. Vicencio-Gonzalez, C. Gamboa, Langmuir 12 (1996)
4324.[14] M. Almgren, F. Grieser, J.K. Thomas, J. Am. Chem. Soc. 101 (1979) 279.[15] G. Markovich, S. Pollack, R. Giniger, O. Cheshnovsky, J. Chem. Phys. 101
(1994) 9344.[16] D. Costa, P. Hansson, S. Schneider, M.G. Miguel, B. Lindman, Biomacro-
mol. 7 (2006) 1090.[17] L. Wattebled, A. Laschewsky, A. Moussa, J.L. Habib-Jiwan, Langmuir 22
(2006) 2551.[18] G. Bartusch, H.D. Dorfler, H. Hoffman, Prog. Colloid Polym. Sci. 89
(1992) 307.[19] N.J. Turro, A. Yekta, J. Am. Chem. Soc. 100 (1978) 5951.[20] Y. Hendrikx, J. Charvolin, M. Rawiso, L. Liebert, M.C. Holmes, J. Phys.
Chem. 87 (1983) 3991.[21] P.O. Quist, B. Halle, I. Furo, J. Chem. Phys. 96 (1992) 3875.[22] M.M.A.E. Claessens, B.F. van Oort, F.A.M. Leemarkers, F.A. Hoekstra,
M.A. Cohen Stuart, Biophys. J. 87 (2004) 3882.[23] J. Mata, D. Varade, P. Bahadur, Thermochim. Acta 428 (2005) 147.[24] G. Markovich, S. Pollack, R. Giniger, O. Cheshnovsky, J. Chem. Phys. 101
(1994) 9344.[25] I. Anusiewicz, J. Berdys, J. Simons, P. Skurski, J. Chem. Phys. 119 (2003)
902.[26] S. Yoo, Y.A. Lei, X.C. Zeng, J. Chem. Phys. 119 (2003) 6083.[27] P. Westh, H. Kato, K. Nishikawa, Y. Koga, J. Phys. Chem. A 110 (2006)
2072.[28] A. Zilman, R. Granek, Eur. Phys. J. B 11 (1999) 593.[29] J. Walz, E. Ruckenstein, J. Phys. Chem. B 103 (1999) 7461.[30] C.A. Ericsson, O. Soderman, V.M. Garamus, M. Bergstrom, S. Ulvenlud,
Langmuir 20 (2004) 1401.